EXHIBIT 15.1
BT is one of the world’s leading providers of communications solutions serving customers in Europe, the Americas and Asia Pacific. Its principal activities include networked IT services, local, national and international telecommunications services, and higher-value broadband and internet products and services. In the UK, BT serves over 20 million business and residential customers, as well as providing network services to other operators.
BT Group plc is a public limited company registered in England and Wales, with listings on the London and New York stock exchanges.
This is the annual report for the year ended 31 March 2005. It complies with UK regulations and is the annual report on Form 20-F for the Securities and Exchange Commission to meet US regulations.
This annual report has been sent to shareholders who have elected to receive a copy. A separate annual review and summary financial statement for the year ended 31 March 2005 has been issued to all shareholders.
In this annual report, references to “BT Group”, “BT”, “the group”, “the company”, “we” or “our” are to BT Group plc (which includes the continuing activities of British Telecommunications plc) and its subsidiaries and lines of business, or any of them as the context may require.
References to the “financial year” are to the year ended 31 March of each year, eg the “2005 financial year” refers to the year ended 31 March 2005. Unless otherwise stated, all non-financial statistics are at 31 March 2005.
Please see cautionary statement regarding forward-looking statements on page 128.
BT was incorporated in England and Wales on 30 March 2001 as Newgate Telecommunications Limited with the registered number 4190816. The company changed its name to BT Group plc on 11 September 2001. Following the demerger of O2 in November 2001, the continuing activities of BT were transferred to BT Group.
BT Group’s registered office address is 81 Newgate Street, London EC1A 7AJ.
| BT Group plc Annual Report and Form 20-F 2005 |
Operating and financial review
Business review
| 7 | |
| 8 | |
| 9 | |
| 9 | |
| 10 | |
| 11 | |
| 12 | |
| 13 | |
| 13 | |
| 13 | |
| 13 | |
| 14 | |
| 15 | |
| 15 | |
| 22 | |
| 22 | |
| Please see cautionary statement regarding forward-looking statements on page 128. |
| All customer numbers are given as at 31 March 2005, unless stated otherwise. |
The definition, reconciliation and reasons for disclosing EBITDA (earnings before interest, taxation, depreciation and amortisation) are discussed in the Financial review. |
| 6 BT Group plc Annual Report and Form 20-F 2005 |
Introduction |
Our aim is to increase shareholder value through service excellence, an effective brand, our large-scale networks and our existing customer base, and also through innovation in products, services and solutions. Our principal activities include networked IT services; local, national and international telecommunications services; and higher-value broadband and internet products and services.
In the UK |
Our core portfolio covers traditional telephony products such as calls, analogue/digital lines and private circuits. New wave revenue generation is focused on networked IT services, broadband and mobility.
In the UK wholesale market, we provide network services and solutions to over 600 communications companies, including fixed and mobile network operators, ISPs (internet service providers) and other service providers. We interconnect with more than 180 other operators, as well as carrying transit traffic between telecommunications operators.
Our aim in these markets is to continue to increase profitable revenues from data and advanced broadband and internet services, further reducing our dependence on revenues and profit generated by traditional fixed-line voice services.
In the 2005 financial year, 91% of our revenues were derived from operations within the UK.
Globally |
Our extensive global communications network and strong partnerships enable us to serve customers in the key commercial centres of Europe, North America and the Asia Pacific region. We own operations in the Americas, Africa, the Asia Pacific region, Belgium, France, Germany, Ireland, the Netherlands, Spain, Italy, Scandinavia, Switzerland and Central and Eastern Europe. In a small number of countries we use a combination of direct sales and services capabilities and strategic partners to deliver the services our customers want. We currently have employees in 12 countries in Asia Pacific, and operate multiple sales offices in the Americas.
Our global communications services portfolio includes: desktop and network equipment and software; transport and connectivity; managed LAN (local area network), WAN (wide area network) and IPVPN (internet protocol virtual private network) services; managed mobility; applications hosting; storage and security services; and business transformation and change management services.
Governance |
Corporate social responsibility |
Ofcom’s Strategic Review of Telecommunications |
The Review has found that although the UK telecommunications market has delivered significant benefits for consumers and businesses, the current market situation is not acceptable or desirable going forward. Consequently, Ofcom’s second consultation put forward three options:
 | withdrawal from regulation in favour of reliance on competition law; |
| a market investigation reference to the Competition Commission under the Enterprise Act; or |
| the delivery by BT to other industry participants of ‘real equality of access’. |
Ofcom is currently involved in discussions with BT and others aimed at assessing whether a settlement based on equality of access would be feasible. If it concludes it is not, it will consider adopting the second of the three options outlined above, ie an Enterprise Act reference.
See Regulation, competition and prices for more information on Ofcom’s proposals and BT’s response.
| Operating and financial review | BT Group plc Annual Report and Form 20-F 2005 7 |
Group structure |
Background |
In the 2002 financial year, BT undertook a radical restructuring, including the UK’s largest-ever rights issue (raising £5.9 billion), the demerger of O2 (comprising BT’s wholly-owned mobile assets in Europe), the disposal of significant non-core businesses and assets, the unwind of Concert (BT’s joint venture with AT&T) and the creation of customer-focused lines of business.
Acquisitions and disposals prior to the 2005 financial year |
In the 2004 financial year we sold our stake in Inmarsat, a global mobile satellite communications services company, and monetised our shareholding in LG Telecom, a wireless telecommunications service provider in the Republic of Korea. We also acquired the UK operations of NSB Retail Systems, a supplier of software products and services, and Transcomm, a provider of data-only wireless services in the UK.
Acquisitions and disposals in the 2005 financial year |
The acquisition of Infonet, re-branded BT Infonet, is a significant step forward in our strategy of addressing the networked IT services needs of multi-site organisations. It will significantly extend our global reach and will deepen our presence in North America and the Asia Pacific region. BT Infonet has local operations and/or distributors in 70 countries, remote network access in approximately 180 countries and strong sales and support partnerships around the world.
Also in February 2005, we acquired the 74% of Albacom that we did not already own from our three joint venture partners – ENI, BNL and Mediaset – for a minimum of £80 million. Including acquisition costs, and settlement of BT’s share of Albacom’s bank loan, the total acquisition cost was £131 million. BT has been active in the Italian business communications market since 1995 and Albacom provides data transmission, voice and internet services to more than 170,000 customers in that market. We also signed outsourcing contracts with our former joint venture partners.
In October 2004, there was an IPO (initial public offering) of the Singapore telecommunications and media company, StarHub, in which BT held an 11.9% stake. By November 2004, we had disposed of our entire holding, through the IPO, for £78 million in cash.
Also in October 2004, we acquired BIC Systems Group Limited for a cash consideration of £17 million, consolidating our position in the networked IT services sector in Northern Ireland.
In December 2004, we completed the sale of our 15.8% stake in Eutelsat to GS Capital Partners – an investment partnership affiliated with Goldman Sachs – for £357 million in cash. In January 2005, we completed the sale of our 4% stake in Intelsat to a consortium of private equity investors for £65 million in cash. This followed the sale in June 2004 of our 4.8% stake in New Skies Satellites for £24 million in cash.
In July 2004, we disposed of our 27.7% stake in PayPoint Limited, a bill payment collection network operator, to various institutional investors for £34 million in cash.
Post balance sheet acquisitions |
How BT operates |
BT Retail and BT Wholesale operate almost entirely within the UK, addressing the consumer, business and wholesale markets, and offer a broad spectrum of communications products and services.
BT Global Services addresses the networked IT services needs of multi-site organisations including major companies with significant global requirements and large organisations in target local markets.
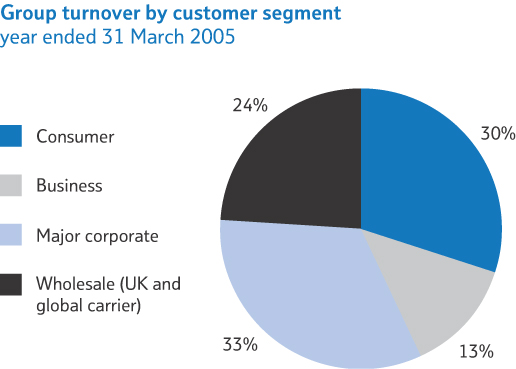
Further analysis of group turnover is provided in the Financial review.
Consumer customers |
| 8 BT Group plc Annual Report and Form 20-F 2005 | Operating and financial review |
In the consumer market, new wave revenues grew by 85% from £223 million in the 2004 financial year to £412 million in the 2005 financial year, driven principally by broadband and mobility. Residential broadband customers increased by 96% in the year to more than 1.3 million and mobility connections increased to 187,000 as at 31 March 2005.
Major corporate and business customers |
In the 2005 financial year, major corporate revenues increased by 4% to £6,101 million. The increase in new wave turnover of 19% to £2,926 million was driven by networked IT services, broadband and by mobility, not only in the UK but also globally.
Our strategy in the major corporate market is to continue to migrate from traditional voice-only services to networked IT services. This enables us to build closer, more integrated, long-term, high-value relationships with our customers, enabling them to manage their communications spend more effectively and gain competitive advantage in their markets. Such relationships will, we believe, deliver long-term, sustainable, predictable and profitable revenues, more than offsetting the decline in our traditional business revenues. As at 31 March 2005, new wave turnover accounted for 48% of our total turnover in the major corporate market.
In the SME market (typically companies with up to 500 employees), our strategy is to provide business customers with tailored communications products and services that enable them to manage their businesses more simply and efficiently. Overall, in the SME market during the 2005 financial year, revenues reduced by 5% to £2,464 million primarily reflecting the impact of CPS and WLR (wholesale line rental).
Wholesale customers |
In the 2005 financial year, turnover from our wholesale activities increased by 9% to £4,396 million.
In the UK, external turnover from BT’s wholesale activities was £3,812 million in the 2005 financial year, compared with £3,473 million in the 2004 financial year.
New wave revenues were £664 million, up 84% on the 2004 financial year. This increase was driven by the success of broadband as well as a strong emphasis on customers as we aim to build innovative solutions that help our wholesale customers grow their businesses.
In our global carrier business, revenues were £584 million in the 2005 financial year, compared with £557 million in the 2004 financial year. Our global carrier business customers include other fixed-line telecommunications operators, mobile operators and selected ISPs.
Report structure |
For financial reporting purposes, we continue to report by line of business (see Financial review).
We are also exploring new ways of doing business and have, for example, set up a number of ventures to deliver new revenue streams by taking an innovative and entrepreneurial approach to our core business.
We have eight strategic imperatives, five of which are focused on generating new wave revenues, defending revenue in traditional markets and operating with maximum efficiency:
| build on our networked IT services capability |
| deliver on broadband |
| create convergent mobility solutions |
| defend our traditional business vigorously |
| drive for cost leadership. |
| keep a relentless focus on improving customer satisfaction |
| transform our network for the twenty-first century |
| motivate our people and live the BT values. |
Networked IT services for major corporate customers |
ICT revenues for the 2005 financial year were £2,753 million, a rise of 18% on the 2004 financial year. We aim to deliver networked IT services globally to large business customers and other organisations (including the public and government sectors), giving them the communications tools they need for productivity and/or business improvement.
In the 2005 financial year, we secured networked IT services orders worth more than £7 billion. Major contracts included:
| Our highest profile success in the global market came in March 2005 when it was announced that BT will be Reuters’ supplier of network services under a contract expected to be worth up to £1.5 billion over eight and a half years. BT will provide and manage secure data networks for Reuters’ products and services worldwide. |
| We also signed a new voice and data communications deal with Barclays plc to provide enhanced communications infrastructure services for Barclays’ |
| Operating and financial review | BT Group plc Annual Report and Form 20-F 2005 9 |
| UK operations. The value of these services, including existing business, is expected to be in excess of £500 million over the seven-year term. | |
| A number of contract wins during the 2005 financial year helped to confirm BT’s European credentials and capability. For example, we signed an outsourcing contract with French company THALES Group, an international electronics and systems group serving the defence, aeronautics, security and services markets. The five-year contract covers the management of fixed-voice and data network services for THALES and its subsidiaries in up to 42 countries. |
| We signed a multi-year managed services agreement with Bristol-Myers Squibb to manage its LAN and WAN infrastructure globally. As part of the agreement, BT will migrate these services to a state-of-the-art, high-speed, IP-based global MPLS (multi-protocol label switching) infrastructure. |
| We were awarded a global network outsourcing contract with South Korea-based CyberLogitec, the IT subsidiary of Hanjin Shipping. With a sales order value of £18 million, this is one of the largest contracts won by BT in the Asia Pacific region. |
| National Air Traffic Service awarded us a £32 million contract to provide a system to carry all communications between its radar, communication and air traffic control centre sites and its IT network. |
| In addition to the range of large deals, we secured more than 300 networked IT services contracts each worth between £1 million and £5 million during the 2005 financial year. |
| In April 2005, we won an extension to 2012 of a contract to deliver essential telecommunications services to the Ministry of Defence (MoD) and the UK’s armed forces. Between April 2005 and July 2012, the Defence Fixed Telecommunications Systems public/private partnership contract between the MoD and BT will be worth up to £1.5 billion, bringing the total value of the contract to more than £2.7 billion. |
| We underlined our position as a global networked IT services company with the launch of a major business-to-business advertising and marketing campaign in September 2004. The campaign ran in multiple languages in international and local media across Europe, the Americas and the Asia Pacific region. |
| Networked IT services for wholesale customers | |
We have a long and successful tradition of delivering network-based connectivity to the carrier and intermediate telecommunications markets throughout the UK, and have developed value-enhancing services and solutions. We have a number of agreements with service providers and mobile operators to upgrade their IP capability. In addition, we have used our expertise and geographic reach to provide ubiquitous, bespoke data housing solutions.
Our plans for our twenty-first century network (21CN) will enable the delivery of further integrated network and communications solutions to our customers and their end-user customers.
We believe that the key issues in today’s broadband markets are speed and price, but that, going forward, applications will increasingly prove to be a competitive differentiator.
Broadband for wholesale customers |
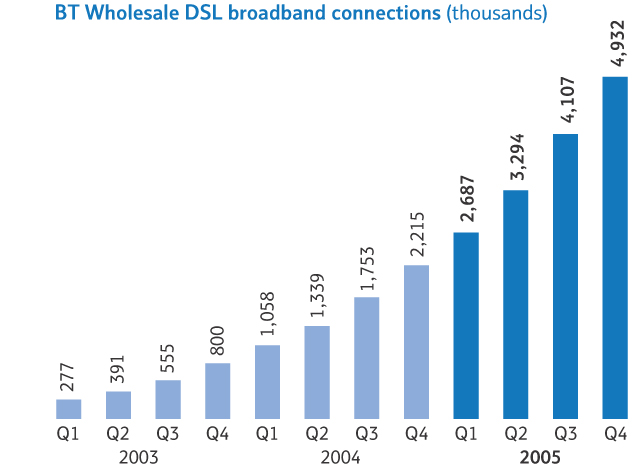
| In February 2005, Northern Ireland became the first UK region outside London to have all its exchanges enabled for broadband. As at 1 March 2005 – as a result of a £10 million partnership between BT and One Northeast, the regional development agency for northeast England – all 181 exchanges in the region had been upgraded. In April 2005, we won the £16.5 million public tender with the Scottish Executive to bring broadband to the most remote communities in the UK. We will enable 378 exchanges to deliver broadband to 51,000 households and 5,400 businesses. |
| During the 2005 financial year, we removed the distance-related limits on our most popular broadband services, bringing around one million more UK homes and businesses within reach of broadband. |
| As the broadband market has matured, new applications, including video and music downloads and videoconferencing, have driven a demand for increasing speed. Since April 2005, we have been testing speeds of between 2Mbit/s and 8Mbit/s with a |
| 10 BT Group plc Annual Report and Form 20-F 2005 | Operating and financial review |
| view to launching higher-speed wholesale services in the second half of 2005. In addition, we are trialling a variant of ADSL (asynchronous digital subscriber line) broadband, known as ADSL2+, which may support speeds of more than 20Mbit/s. | |
| With effect from April 2005, we reduced the wholesale cost to service providers of our BT IPStream and BT DataStream ADSL products by an average of 8% in areas of high demand. |
| We also announced details of the next 500 exchanges to be upgraded to provide SDSL (synchronous digital subscriber line) services. SDSL offers the same rate upstream and downstream and is particularly suitable for the SME market. By April 2006, we aim to SDSL-enable 1,300 exchanges, covering more than two thirds of UK businesses. |
| During the 2005 financial year, we redesigned and reduced the price for our LLU (local loop unbundling) product (see Regulation, competition and prices – Local Loop Unbundling) by up to 70% in a phased series of price cuts which will, we believe, make it easier for LLU operators to invest in broadband infrastructure with confidence. As at 31 March 2005, LLU operators were providing service to 40,000 lines from more than 600 exchanges, many of which were multi-operator sites. |
Broadband for consumers |
BT is the UK’s leading service provider of broadband, offering a family of broadband packages designed to meet the diverse needs of our customers. Key packages include BT Broadband Basic and BT Broadband which offer rapid, always-on internet access; BT Yahoo! Broadband which also provides a fuller range of benefits, including multiple email addresses, virus protection, personalised music, parental controls, protection against unsolicited email and evolving applications and content; and BT Communicator with Yahoo! Messenger.
| We transformed our retail broadband offering, by announcing the transfer of our customers to a new super-fast standard, beginning in February 2005. Most consumer and business customers will have their broadband speed increased to up to 2Mbit/s – up to four times faster than previous speeds – at no extra cost. The introduction of 2Mbit/s as standard will enable customers to get more from their broadband link and paves the way for a range of new services. |
| BT will also use broadband to make new services, such as video on demand and interactive TV, available to customers. |
| In July 2004, we launched BT Communicator with Yahoo! Messenger. This integrated software package, downloadable from the internet, gives customers a truly convergent, multi-media communications experience, enabling them to manage all their home communications – phone calls, emails, texts, instant messaging and webcam – together in one place on their PC. |
Broadband for business customers |
BT Business Broadband remained the leading ISP for SMEs in the UK. At the end of the 2005 financial year, we had over 340,000 BT Business Broadband customers and were adding 250 a day. More than half opt for such value-added services as the Internet Security Pack and the Internet Business Pack.
| In January 2005, we created an online payments business by bringing together BT Click&Buy and our online card payment service, BT Buynet, which currently process almost 17 million transactions a year between them. The new business will offer an extensive range of payment solutions to the rapidly growing online retail market. |
| BT Business Broadband Voice, launched in November 2004, gives small businesses throughout the UK access to VOIP (voice over IP) services and enables them to use their broadband connections to reduce costs for multiple business lines. On average, BT Broadband Voice offers customers savings of more than 60% compared with second line rental. |
Our aim is to offer all our customers the right combination of the quality, reliability, cost advantages and bandwidth associated with fixed-line communications, and the convenience, personalisation and mobility associated with mobile communications.
In the 2005 financial year, we launched BT Mobile as an MVNO (mobile virtual network operator) running over the Vodafone network. Becoming an MVNO is fundamental to building our mobility customer base, driving the wireless broadband market and developing and delivering compelling convergence propositions and one converged customer experience.
Project Bluephone is a converged mobile service, enabling customers to use a single device that can switch seamlessly between fixed and mobile networks. This will provide customers with the convenience of mobile combined with the cost and quality advantages of a fixed-line phone. We plan to launch Project Bluephone shortly.
We believe that a partnership strategy is fundamental to our success and we are working hard through the FMCA (Fixed Mobile Convergence Alliance) to develop open industry standards and through the WBA (Wireless Broadband Alliance) to drive Wi-Fi (public wireless broadband) hotspot proliferation, global roaming and user satisfaction.
Revenue in the mobility market in the 2005 financial year was £205 million, an increase of 107% on the 2004 financial year.
As at 31 March 2005, BT Mobile had over 372,000 business and consumer connections.
Mobility for consumers |
| In January 2005, we launched BT Mobile as an MVNO with Vodafone in the consumer market. BT Mobile is cost-effective for families, offering up to five additional |
| Operating and financial review | BT Group plc Annual Report and Form 20-F 2005 11 |
| handsets. Other benefits include free short calls from a BT Mobile phone to a designated home number and a single consolidated mobile bill. |
Mobility for business customers |
| In November 2004, we launched our BT Mobile MVNO business in the SME and corporate market, offering a range of mobile services including a mobile VPN service (BT Business Circle) and mobile conferencing. |
| We are a leading UK provider of Wi-Fi services. BT Openzone offers customers a high-speed, wireless broadband connection over which they can access the internet, send and receive emails with attachments and connect to a corporate network. As at 31 March 2005, our customers had access to more than 7,500 hotspots throughout the UK and more than 20,000 globally. |
Mobility for wholesale customers |
| For example, we launched Fixed Line Text – a fully managed service that enables the exchange of SMS messages between fixed line and fixed line, fixed line and mobile and mobile and fixed line. |
| In March 2005 we launched a mobile managed bulk SMS, which enables customers to send and receive multiple text messages via the internet to and from their customers’ mobile telephones. |
Total fixed-to-fixed voice call minutes in the UK market as a whole declined by 3% in the 2005 financial year. This was driven by customers making use of alternatives such as mobile calls, email, instant messaging, corporate IPVPNs and VOIP.
However, the measurement of call minutes is less important to BT as customer take-up of pricing packages continues and we actively encourage the migration of customers to new wave services such as broadband.
Traditional services for consumers |
| On 1 July 2004, we abolished the standard rate and switched all existing standard rate customers to BT Together Option 1, offering them better value for money and making it easier for them to compare our prices with those of our competitors. We also reduced the price of Option 1 by £1 a month, offering savings to the five million customers who were already on this option. |
| BT Together Option 2, which offers free UK evening and weekend calls, and BT Together Option 3, which offers free UK daytime, evening and weekend calls, were also significant elements in our revenue defence strategy in the 2005 financial year. |
| In September 2004, we introduced CallMobile, a discount package offering customers up to 40% savings on all fixed-to-mobile calls. |
| During the 2005 financial year, we developed two new products to help customers protect themselves against internet dialler problems. BT Modem Protection is a free software download, which will prevent a customer’s computer dialling high-cost, premium rate or international numbers. We have also developed an early warning alert – in the form of a text or voice message to their mobile or fixed-line phone – for customers whose bill rises significantly above the usual daily pattern. We can then put in place an immediate premium rate bar on the line and/or suggest other barring options. As at 31 March 2005, around one million BT customers had signed up for one or more of these barring services. |
| We manage around 87,000 public payphones, including more than 1,300 multimedia kiosks and more than 1,400 textphones throughout the UK. Although we remain committed to ensuring that public payphones are available in communities throughout the UK, future growth opportunities will focus on maximising returns from existing sites and capabilities, including e-kiosks and content services, as well as hosting CCTV (closed circuit TV) facilities and mobile antennae. |
| Following our re-entry into the printed classified directory market, the Phone Book continued to be successful in the 2005 financial year, with all 171 editions now including a new classified section. A new milestone will be reached in mid-June 2005, from which date all editions will include classified advertising in colour. |
Traditional services for business customers |
| In the 2005 financial year, we made a number of enhancements to our BT Business Plan. In May 2004, in response to EU enlargement, we extended the benefits of BT Business Plan by including ten new entrant countries in the 20 pence cap on calls to Europe lasting less than one hour. In August 2004, we extended BT Business Plan to cover all business customers, irrespective of size or spend. And from September 2004, we cut the cost of fixed-to-mobile calls by 25% to 30% and offered BT Business Plan customers the chance to opt for a 30 pence cap on all fixed-to-mobile calls lasting less than one hour. At 31 March 2005, BT Business Plan had over 440,000 locations, up 67% on the 2004 financial year. |
| Our BT Local Business initiative helped to secure BT’s position as a key player in the SME market. At the end of the 2005 financial year, BT Local Business was active in 83 locations around the country, managing £1.2 billion of annual billed turnover. |
Traditional services for wholesale customers |
| 12 BT Group plc Annual Report and Form 20-F 2005 | Operating and financial review |
| We continued to develop our capability as a supplier of network facilities management. For example, we are providing maintenance support to the physical field and core switching elements of O2’s 3G network. |
| As at 31 March 2005, our wholesale line rental product had over one million end users, with revenues up £51 million in the 2005 financial year. |
| We have also enhanced our data connectivity portfolio with the launch of a range of Ethernet (LAN) products and higher bandwidth circuits. This has enabled us to grow revenues from the provision of infrastructure to other network providers. |
| Product launches in the 2005 financial year included Wholesale Extension Service – a high-speed, point-to-point data circuit providing a secure link between a third party customer site and a communication provider’s networks – and BT Enterprise Ethernet – a low bandwidth variant of the MegaStream Ethernet product, offering many of the characteristics of a traditional private circuit, but with the added benefit of low-cost Ethernet interface. |
We aim to deliver this by focusing on the cost of failure, complexity and duplication and by working smarter. For example, at 31 March 2005 we had 6.2 million on-line relationships with customers through bt.com and almost two million customers receiving e-bills. We continue to benchmark ourselves against the best in the industry and set targets accordingly.
The quality of service we provide to our customers is key to improving customer satisfaction. Much of our training and development activity remains focused on removing any barriers to the delivery of excellent customer service and a high-quality customer experience. Our core people engagement initiative is the my customer programme, which aims to enable all BT people to deliver great customer service through teamwork. Over 3,000 issues have been identified and resolved. More than 4,000 people are members of teams tasked with making further improvements as part of the 2005 my customer Challenge Cup.
Our UK network today |
Our global reach |
As at 31 March 2005, our flagship MPLS product provided coverage and support to 72 countries from over 1,000 points of presence. MPLS revenues grew by 48% during the 2005 financial year.
Global customer service is provided via service and network management centres around the world, 24 hours a day, seven days a week.
Transforming our networks, systems and services for the twenty-first century |
The 21CN programme has three broad goals:
| to enhance the service experience, flexibility and value we provide to all our customers; |
| to accelerate the delivery of innovative new products and services to market; and |
| to reduce costs radically. |
We made significant progress towards completing the detailed technical and architectural designs to support the implementation of 21CN.
In April 2005, we announced the preferred suppliers that we expect will help to build and implement the 21CN. This was the culmination of two years of discussions and negotiations with over 300 potential technology suppliers and is one of the largest procurement programmes ever undertaken in the communications industry. The eight preferred suppliers chosen are: Alcatel, Ciena, Cisco, Ericsson, Fujitsu, Huawei, Lucent and Siemens. We expect to conclude contractual discussions with these preferred suppliers in summer 2005.
A programme of industry consultation – Consult21 – was launched in the 2005 financial year to promote a shared understanding with industry of the 21CN vision and the progress we are making, giving our wholesale customers an opportunity to input and influence its development.
| Operating and financial review | BT Group plc Annual Report and Form 20-F 2005 13 |
Developing leaders |
Engaging and motivating our people |
Among the key results were that 89% of our people have a clear understanding of how their work contributes to BT’s success, and seven out of ten employees are willing to try new ways of doing things.
The survey generates around 5,000 feedback reports for managers and their teams across the business, helping to promote effective team working.
Employees are kept informed about our business through a wide range of communications channels, including our online news service, monthly newspaper, regular email bulletins and senior management web chats and web cast briefings.
In the UK, two main trade unions are recognised by the company. In continental Europe, we work closely with the works councils, both on an operational basis and as strategic stakeholders.
Rewarding and recognising achievement |
We also continued to provide our employees with opportunities to acquire a stake in the company. Under the BT Employee Share Investment Plan (ESIP), BT can provide free shares to employees and, in addition, employees can purchase shares in the company from their pre-tax salaries. In the 2005 financial year, £11 million was allocated to provide free shares to employees under the ESIP. Employees outside the UK receive a cash payment equivalent to the value of the shares. This allocation of profits was linked to the achievement of corporate performance measures determined by the Board. In addition, employees can buy shares at a discount under our savings-related share option plans. Over 98% of eligible employees participate in one or more of these plans.
Pensions |
Health and safety |
In the 2005 financial year, we launched the Health and Wellbeing Forum to promote ways of working that help people balance the demands of their work and personal lives, as well as focusing on specific healthcare issues. We also developed an in-house process to help BT people manage stress.
Learning now and for the future |
To improve the effectiveness and efficiency of our training delivery, we conducted a strategic review of our training suppliers in the 2005 financial year, reducing them to a core group of 36. This will contribute to year-on-year savings of at least £3.4 million.
The development opportunities available to our people range from one-to-one coaching, using a combination of internal and external professional coaches, to the BT-sponsored MBA programme, which has produced 54 graduates in the past three years.
Embedding flexibility and diversity |
During the 2005 financial year, 3,903 (2004 – 2,287) people joined BT, natural attrition was running at 2.6% (2004 – 2.4%) and, in the UK, 2,685 (2004 – 4,814) people left BT under our voluntary paid leaver package.
We are committed to helping our people optimise their work/life balance. At the end of March 2005, for example, more than 8,900 people were working mainly from home.
We continue to create a working environment that actively supports all our employees – regardless of gender, race, sexual orientation, disability or age.
Over the last year, we have transformed our approach to internal and external systems development through the establishment of 90-day design, development and delivery cycles, accelerating our ability to deliver systems which support product development and all our customers to much tighter timescales and much higher levels of ‘right first time’ delivery. We are also developing new high-quality online ways for customers to deal with us, in an intuitive and comprehensive manner.
| 14 BT Group plc Annual Report and Form 20-F 2005 | Operating and financial review |
The work undertaken by GCTO is part of BT’s £257 million investment in research and development in the 2005 financial year. This compares with £334 million and £380 million invested in the 2004 and 2003 financial years, respectively. We continue to focus our innovation work on key areas which support our business and technology strategies, filing 109 new patent applications in the 2005 financial year and maintaining a total patent portfolio of 7,400 patents and applications. Among the awards won by our technology research team was the British Computing Society’s IT Developer of the Year.
BT is a limited partner in the independent corporate venturing partnership, NVP Brightstar, which generates value by launching key innovations as new high-technology businesses.
The majority of these properties are specialised operational buildings. They mainly house exchange equipment and are needed as part of BT’s continuing activities. Other, general purpose, properties consist chiefly of offices, depots and computer centres.
Our property strategy is to continue to reduce costs, at the same time as increasing usage and income generation.
In the 2005 financial year, we sublet an additional 21,000sqm of office space, vacated 158,000sqm of space ready for disposal and successfully disposed of Mondial House in London for £51 million.
Regulation in the UK |
| Ofcom |
Ofcom was set up as a result of the increasing convergence between telecommunications, broadcasting and radio, to provide a single, seamless approach to regulation across the whole converging marketplace. It amalgamated the roles of five former regulatory agencies: the Director General of Telecommunications (Oftel), the Independent Television Commission, the Broadcasting Standards Commission, the Radio Authority and the Radiocommunications Agency.
Ofcom is headed by a board consisting of a chairman, executive and non-executive members. Currently, the chairman is Lord Currie and the chief executive is Stephen Carter.
Ofcom has a wide range of general and specific duties laid down in the Communications Act. Below is a summary of those duties and functions of particular relevance to BT’s activities:
| the principal duty to further the interests of citizens in relation to communications matters and, secondly, to further the interests of consumers, where appropriate, by promoting competition. In doing so, Ofcom must secure, among other things, the availability of a wide range of electronic communications services in the UK; |
| the duty to have regard to the principles under which its regulatory activities should be transparent, accountable, proportionate, consistent and appropriately targeted; |
| the duty to review regulatory burdens on a regular basis and ensure that they do not involve the imposition or maintenance of unnecessary burdens; and |
| the functions of setting conditions of entitlement (see Regulatory conditions), and enforcing those conditions (see Enforcement). Ofcom’s decisions are subject to appeal on the merits (see Appeals). |
| Regulatory conditions |
Regulation is applied through separate sets of conditions made by Ofcom, of which some apply to all relevant communications providers. Others are imposed
| Operating and financial review | BT Group plc Annual Report and Form 20-F 2005 15 |
| Conditions applying to all providers of electronic communications networks or services |
General conditions |
Electronic Communications Code conditions |
Other general obligations |
| the payment of administrative charges (broadly the equivalent of licence fees under the old framework); and |
| the provision of information to Ofcom when required to do so. |
| Conditions applying to BT only |
Universal Service Obligation conditions |
Ofcom is currently reviewing the USO. The review is focused on delivering the current Universal Service arrangements and is being carried out alongside Ofcom’s Strategic Review of Telecommunications (see Other significant changes and issues – Strategic Review of Telecommunications) which looks at longer-term Universal Service issues.
Significant Market Power conditions |
In markets where Ofcom finds that a provider has SMP, it must impose appropriate additional obligations in the form of SMP conditions as specified in the Communications Act. These may include obligations to meet reasonable requests to supply certain services to other communications providers, not to unduly discriminate, and to notify price changes. In some cases, additional obligations relating to, for example, price control and regulatory accounting have also been imposed.
The market reviews relevant to fixed telecommunications that Oftel and Ofcom have conducted are listed below. For each review, the markets in which BT has been determined to have SMP are shown. All references to UK markets, except wholesale trunk segments and broadband conveyance, exclude the Hull area.
| Fixed narrowband retail markets in the UK: residential analogue lines, residential ISDN2 lines, business analogue lines, business ISDN2 lines, ISDN 30 lines, residential local calls, residential national calls, residential calls to mobile, residential operator assistance calls, residential international direct-dialled calls, business local calls, business national calls, business calls to mobile, business operator assistance calls. |
| Fixed narrowband wholesale markets in the UK: residential analogue lines, residential ISDN2 lines, business analogue lines, business ISDN2 lines, ISDN 30 lines, call origination, local-tandem conveyance and transit, inter-tandem conveyance and transit, single transit. |
| Fixed geographic call termination markets in the UK: fixed geographic call termination provided by BT and other members of the BT group of companies. |
| Wholesale international services markets: wholesale international services on 108 country routes. |
| Wholesale unmetered narrowband internet termination markets: BT was not found to have SMP in any market considered in this market review. |
| Retail leased lines, symmetric broadband origination and trunk segments markets: retail traditional interface leased lines at speeds up to and including 8Mbit/s; wholesale traditional interface symmetric broadband origination at speeds up to and including 8Mbit/s; wholesale traditional interface symmetric broadband origination at speeds above 8Mbit/s and up to and including 155Mbit/s; wholesale alternative interface symmetric broadband origination at all bandwidths. Wholesale trunk segments at all bandwidths. |
| Wholesale broadband access markets in the UK: asymmetric broadband origination; broadband conveyance. |
| Wholesale local access markets in the UK: wholesale local access services. |
| 16 BT Group plc Annual Report and Form 20-F 2005 | Operating and financial review |
The Act obliges Ofcom to carry out further analyses of markets which have been reviewed at such intervals as it considers appropriate. In the Phase 2 consultation document in the Strategic Review of Telecommunications, Ofcom has made proposals for a number of market reviews over the coming years. Ofcom is currently carrying out a review of the Number Translation Services (NTS) Call Termination market.
| Enforcement |
The Communications Act contains similar enforcement procedures (though with much smaller penalties) for matters such as non-compliance with a request for information or non-payment of an administrative charge.
| Appeals |
| the making of SMP, SMP apparatus and USO determinations/designations; |
| the setting, modification and revocation of conditions; |
| enforcement actions, including the imposition of a penalty. |
In November 2003, Ofcom issued a notification finding that BT was acting in contravention of the General Conditions by using customer-specific information acquired from other communications providers in connection with the provision of Carrier Pre-Selection (CPS). In May 2004, Ofcom issued a second notification finding that BT was similarly contravening the General Conditions in relation to Wholesale Line Rental (WLR). BT appealed both notifications, and the Tribunal adjourned the WLR appeal pending the outcome of the CPS appeal.
In December 2004, the Tribunal dismissed BT’s CPS appeal and upheld that notification (although this was subject to a clarification of the definition of ‘marketing activity’ as set out in the notification). Subsequently, Ofcom withdrew the contested WLR notification, indicating that it would issue a new notification in light of the CPS decision. The Tribunal has suspended the WLR appeal pending the new notification, which is expected shortly.
Competition |
| The competitive environment |
Although it is some years since the Telecommunications Act 1984 abolished the monopoly of the former statutory corporation, British Telecommunications, obligations placed on BT, including pricing regulation, network access, non-discrimination, the provision of universal service and cost accounting/accounting separation, are generally more onerous than for other providers of electronic communications networks and services.
| Competition and the UK economy |
BT’s share of the residential fixed-voice market, as measured by the volume of fixed-to-fixed voice minutes, declined to an estimated 64% for the 2005 financial year, compared with an estimated 70% and 74% for the 2004 and 2003 financial years, respectively. CPS has been one of the contributors to the loss of share in the fixed-voice market. We estimate that BT had 42% of the market for business fixed-voice calls in the 2005 financial year, compared with an estimated 44% and 47% in the 2004 and 2003 financial years, respectively.
Estimated market shares are based on our actual minutes, market data provided by Ofcom and an extrapolation of the historical market trends.
We also estimate that BT supplied approximately 79% of exchange lines in the UK at the end of the 2005 financial year, compared with 82% and 83% in the 2004 and 2003 financial years, respectively.
The growth in cable operators’ networks in the UK has historically had an adverse effect on BT’s share of the residential market. Current and future wholesale line rental arrangements will allow BT’s fixed-line customers to move PSTN lines to other operators which are expected to be the source of more competition in the future.
Since 2000, we have been required to provide other operators with the use of the lines connecting BT’s local exchanges to our customers and to other operators to install equipment in our exchanges (see Local Loop Unbundling).
| Competition Law |
UK and European Union competition law both prohibit anti-competitive agreements, concerted practices and the abuse of a dominant market position. In the application of UK and EU competition law to electronic communications, Ofcom has concurrent investigatory and enforcement powers with the Office of Fair Trading (OFT). The EC has jurisdiction to apply the EU rules. Breach of the relevant prohibitions in the UK or EU rules could lead to fines of up to 10% of worldwide turnover in a company’s previous financial year and/or result in claims for damages in
| Operating and financial review | BT Group plc Annual Report and Form 20-F 2005 17 |
In July 2005, the Tribunal is due to hear Wanadoo’s appeal against Ofcom’s November 2003 finding that BT had not infringed the prohibition on abuse of a dominant position in relation to the pricing of BT Openworld’s consumer broadband products. Separately, in August 2004, Ofcom claimed that BT had abused a dominant position in relation to its pricing of consumer broadband products. BT has responded, arguing that its pricing does not amount to an abuse of dominance. Ofcom has indicated that it will issue either a new statement of objections or a decision of non-infringement in relation to this case, in June 2005.
| Enterprise Act |
The key provisions of the Enterprise Act, including the new cartel offence and the section on director disqualification, entered into force on 20 June 2003. It is now a criminal offence, punishable by imprisonment or a fine, or both, to engage in cartel activity. In addition, where companies infringe UK or EU competition law, company directors can be disqualified from being concerned in the management of a company for a maximum period of 15 years. The Enterprise Act also gives the OFT power to make a market investigation reference to the UK’s Competition Commission where the OFT has reasonable grounds for suspecting that any feature of a market prevents, restricts or distorts competition in the supply or acquisition of goods or services in the UK. Once the OFT exercises its power to make such a reference, the Competition Commission is required to decide whether any feature of the market prevents, restricts or distorts competition (‘adverse effect’) and, if so, to take action to remedy the adverse effects. Market investigations are intended to address competition issues in markets as a whole and not merely the behaviour of individual players. In relation to electronic communications markets, Ofcom has concurrent powers with the OFT to make a market investigation reference.
Pricing regulation |
| Fixed network |
| Retail price controls |
For services covered by the controls, the weighted average of base prices cannot increase in each year beginning 1 August by more than the annual change in RPI minus X. The current retail price control for public-switched telephony, applying from August 2002 to July 2006, is RPI minus RPI (ie the value of X is RPI and prices cannot increase). It is measured on services used by the lowest 80% of our residential customers classified by bill size. From August 2002, the services covered by the control were extended to include BT’s share of the revenue for calls to all four mobile networks, replacing the previous separate control on BT for calls to Vodafone and O2. The price control formula and our performance against the formula are set out in the table below.
Under the price controls for private circuits that applied from August 1997 to July 2001, prices for domestic analogue and low-speed digital private circuits could not increase by more than the change in the RPI in any year. For all retail analogue private circuits and 8Mbit/s digital private circuits, BT has also given an assurance to adhere to a RPI+0% price cap from 30 June 2003 until 30 June 2006.
As part of the review of price controls in 2002, BT was required to provide a cost-based wholesale line rental product to other service providers at a regulated price and in a way that does not unduly discriminate between BT’s retail business and service providers. This product, Wholesale Access, has been available from BT since 1 September 2002. Further consultation by Ofcom resulted in an enhanced wholesale access product being available from 29 March 2004. When Ofcom notifies BT that it is satisfied in relation to the introduction and provision of Wholesale Access, it may direct that the retail price control be adjusted to RPI+0%.
| Price Control (RPI-X) | Years commencing 1 August | |||||||||||||||
| 2000 | 2001 | 2002 | 2003 | 2004 | ||||||||||||
% RPI movement for the relevant perioda | 3.32 | 1.93 | 1.03 | 2.89 | 3.03 | |||||||||||
X on price control formulaa,b | 4.50 | 4.50 | 1.03 | 2.89 | 3.03 | |||||||||||
% required change in base pricesc,d | (1.09 | ) | (2.45 | ) | 0 | 0 | 0 | |||||||||
| % change in base prices overall | (1.20 | ) | (2.50 | ) | (0.22 | ) | (0.19 | ) | 0.46 | e | ||||||
| a | Annual increase in RPI to previous June |
| b | From 1 August 1997, the RPI formula covers the main switched telephone services provided to the lowest 80% of BT’s residential customers by bill size |
| c | After permitted carry forward of any unused allowance or shortfall from previous years |
| d | From 1 August 2002, the RPI formula covers the change in average prices (including residential discount packages) |
| e | Full year forecast based on price changes implemented up to January 2005 for residential customers. There is an unused allowance of 0.41% carried forward from the previous year which would allow prices to rise by this amount in 2005. Further price changes during this year could eliminate the current variance but if not, the amount may be carried forward. |
| 18 BT Group plc Annual Report and Form 20-F 2005 | Operating and financial review |
| Network Charge Control |
The main network price caps are listed below:
| Basket | X Factor in RPI – X formula | Duration | |||||
| Call termination | 10 | 30 Sept 2005 | |||||
| Call origination | 10 | 30 Sept 2005 | |||||
| Tandem layer | 13 | 30 Sept 2005 | |||||
| Safeguard cap | 0 | 30 Sept 2005 | |||||
| Interconnect specific | 8.25 | 30 Sept 2005 | |||||
| Local exchange FRIACO | 7.5 | 30 Sept 2005 | |||||
BT must publish a notification to Ofcom and other operators if we intend to amend existing charges or to offer new services. Notice periods range from 28 to 90 days for regulated services, depending on the degree to which they are judged to be competitive.
In 2004, Ofcom began a review of the NCC, to determine the controls to apply from 1 October 2005. On 23 March 2005, Ofcom issued a consultation document (‘Review of BT’s Network Charge Controls’) proposing a further four-year NCC regime, with a review of BT’s market power in two specific markets (deregulation being proposed for one of these markets). Ofcom is also proposing some re-definitions of basket services, and consulting on a range of values of X for these services (reflecting the fact that some of the relevant factors in setting X are yet to be resolved). We will respond to Ofcom’s proposals by 1 June; Ofcom is expected to publish a statement by the end of July 2005.
The various services and proposed ranges of X within Ofcom’s 23 March consultation document are listed below:
| Basket | X Factor in RPI – X formula | |||
| Call termination | 2.25 to 6.25 | |||
| Call origination | 0.5 to 4.5 | |||
| Single transit | 11 to 14 | |||
| Local-tandem conveyance | 0 (safeguard) | |||
| Interconnection circuits | 1.5 to 5.5 | |||
| Product management, policy and planning | 2.5 to 6.5 | |||
| Local exchange FRIACO | 7.5 to 11.25 | |||
| Single tandem FRIACO | 8.5 to 12.25 | |||
| Inter-tandem conveyance / transit | No control (propose to de-regulate) | |||
| Number portability |
| Wholesale access charge control |
On 28 November 2003, Oftel published its statement on the fixed narrowband wholesale exchange line market. This statement contained new obligations on BT to provide Wholesale Business ISDN2 Line Rental with cost-oriented prices and to provide residential ISDN2 and ISDN30. We launched the required products but the price level was referred to Ofcom as a dispute by Energis on 25 October 2004. On 2 February 2005, Ofcom determined that BT’s price was set at too high a level and that BT must refund Energis an amount for each line rented during the period from 23 November 2003 to 30 September 2004.
Additionally, during the year a small-scale consultation was carried out which aligned the price control formulae for Wholesale Access, NCC and PPC (Partial Private Circuits) but this did not affect the Wholesale Access control in a material way.
| Partial Private Circuit Charge Control |
The control is a four year RPI-X type control with three separate baskets:
| Low Bandwidth Basket (RPI-4%); |
| High Bandwidth Basket (RPI-6.5%); and |
| Equipment Basket (RPI-8.9%). |
PPCs are also subject to obligations to notify operators and Ofcom if we intend to revise charges or other contractual conditions. The notification periods range
| Operating and financial review | BT Group plc Annual Report and Form 20-F 2005 19 |
Non-UK regulation |
| European Union |
BT will not have universal service obligations outside the UK, although in certain member states we may be required to contribute towards an industry fund to pay for the cost of meeting universal service obligations in those countries. Any findings that BT has SMP in any non-UK market are not expected to have a material impact. We are lobbying the European Commission and other EU bodies with responsibility for electronic communications for consistent and timely implementation of the new directives and associated regulation.
The availability of cost-oriented access products from regulated incumbents remains an important element of our strategy around the world and we continue to press these incumbents, their national regulatory authorities and at the EU level for such access. Availability varies by country.
The European Commission is formally investigating the way the UK Government has set BT’s property rates and those paid by Kingston Communications. The Commission is examining whether the Government has complied with EC Treaty rules on state aid in assessing BT’s rates. BT’s rates were set by the Valuation Office after lengthy discussions based on well established principles in a transparent process. In BT’s view, any allegation of state aid is groundless and BT is confident that the Government will demonstrate the fairness of the UK ratings system. A finding against the UK Government could result in BT having to repay any state aid it may be determined to have received.
| Rest of the world |
Other significant changes and issues |
| Strategic Review of Telecommunications |
The first consultation document focused on five fundamental issues: the key attributes of a well-functioning telecoms market for citizen-consumers; the achievement of sustainable competition; the possibility of a significant reduction in regulation; incentivising efficient and timely investment in next-generation networks; and the relevance of the issue of structural or operational separation of BT.
The second consultation set out three options for the outcome of the Strategic Review. These were as follows:
| Option 1 – full deregulation, with reliance on competition law to address competition concerns; |
| Option 2 – a market investigation reference to the Competition Commission under the Enterprise Act to determine whether any feature of the market prevents or distorts competition in the supply of communications services. One possible result of such an investigation could be enforced separation of BT; and |
| Option 3 – delivery by BT to its competitors of ‘real equality of access’ to its networks, with the onus on BT to bring forward prompt and clear proposals. |
| make significant organisational changes that demonstrated our commitment to transparency and exemplary governance, including the creation within BT of a new Access Services Division based on the assets and people associated with the access network, from the customer’s premises to the main distribution frame in the local exchange; |
| create an Equality of Access Board to monitor the performance of the Access Services Division and to oversee delivery of equality of access by BT; |
| introduce equality of access in a phased and effective manner; |
| ensure that BT’s Wholesale Access product is demonstrably fit for purpose with effective operational performance and an increased margin enabling rapid consumer take-up; |
| 20 BT Group plc Annual Report and Form 20-F 2005 | Operating and financial review |
| keep Local Loop Unbundling (LLU) at the heart of BT’s wholesale broadband portfolio, building on the work already done on industrialising LLU operations and taking forward our previous commitment to cut the price of fully unbundled loops; |
| make sure the rest of BT’s broadband products keep pace so that all service providers have a wide choice of offerings to suit their business models; |
| agree on the enduring economic bottlenecks (assets that are not replicable in the medium term) and work to ensure that regulation is focused around them; and |
| set out the ground rules that underpin the development of BT’s 21st Century Network. |
| commit to rapid, significant and ongoing deregulation in certain key markets; |
| create a stable investment environment, with the Strategic Review and the associated studies concluded successfully, so that investors are able to invest with certainty; and |
| enable BT to compete on a level playing field with other operators in the market. |
| Cost of copper |
| Cost of capital |
| Radio base station backhaul circuits and wholesale extension services |
| RBS (radio base station backhaul circuits) – these are circuits provided by BT to enable a mobile communications provider to connect a radio base station to its mobile switching centre; and |
| WES (wholesale extension services) – these are circuits provided over fibre, typically using Ethernet technology, to enable a telecoms operator to connect a customer site to its own switching site. |
| Local Loop Unbundling |
| a fully unbundled line gives operators the exclusive use of the copper line; and |
| a shared access line only gives operators the use of the high-frequency channel used for broadband and will also be used by the customer’s fixed-line voice provider. |
Ofcom’s latest approach to regulating LLU focused on process and price:
| in July 2004 Ofcom appointed the independent Telecoms Adjudicator to handle process issues; and |
| Ofcom completed its review of LLU prices in December 2004 as part of the wholesale local access market review. |
| Funds for liabilities |
The conditions require the company to provide Ofcom annually with a certificate that, in the company board’s
| Operating and financial review | BT Group plc Annual Report and Form 20-F 2005 21 |
We can, however, be required by law to do certain things and provide certain services for the UK Government. General conditions made under the Communications Act 2003 require all providers of public telephone networks and/or publicly available telephone services, including BT, on the request of and in consultation with the authorities, to make, and if necessary implement, plans for the provision or restoration of services in connection with disasters. Furthermore, the Civil Contingencies Act 2004, contains provisions enabling obligations to be imposed on providers of public electronic communications networks, including BT, in connection with civil contingency planning. In addition, the Secretary of State has statutory powers to require us to take certain actions in the interests of national security and international relations.
Proceedings have been initiated in Italy against 21 defendants, including a former BT employee, in connection with the Italian UMTS auction. Blu, in which BT held a minority interest, participated in that auction process. The hearings are continuing in Rome. If the proceedings are successful, BT could be held liable, with others, for any damages. The company has concluded that it would not be appropriate to make a provision in respect of any such potential claim.
| 22 BT Group plc Annual Report and Form 20-F 2005 | Operating and financial review |
Five-year financial summary
Profit and loss account |
| Years ended 31 March | 2001 £m | a | 2002 £m | a | 2003 £m | a | 2004 £m | a | 2005 £m | |||||||
| Total turnover: | ||||||||||||||||
| Continuing activities | 21,068 | 21,815 | 20,182 | 18,914 | 19,031 | |||||||||||
| Discontinued activities | 8,598 | 2,827 | – | – | – | |||||||||||
| 29,666 | 24,642 | 20,182 | 18,914 | 19,031 | ||||||||||||
| Group’s share of associates’ and joint ventures’ turnover | (9,937 | ) | (4,764 | ) | (1,455 | ) | (395 | ) | (408 | ) | ||||||
| Trading between group and principal joint venture | 698 | 681 | – | – | – | |||||||||||
| Group turnover: | ||||||||||||||||
| Continuing activities | 17,141 | 18,447 | 18,727 | 18,519 | 18,623 | |||||||||||
| Discontinued activities | 3,286 | 2,112 | – | – | – | |||||||||||
| 20,427 | 20,559 | 18,727 | 18,519 | 18,623 | ||||||||||||
| Other operating income | 359 | 362 | 215 | 177 | 171 | |||||||||||
Operating costsbc | (20,764 | ) | (21,387 | ) | (16,366 | ) | (15,826 | ) | (16,005 | ) | ||||||
| Group operating profit (loss): | ||||||||||||||||
| Before goodwill amortisation and exceptional items | 3,252 | 2,593 | 2,794 | 2,889 | 2,864 | |||||||||||
| Goodwill amortisation and exceptional items | (3,230 | ) | (3,059 | ) | (218 | ) | (19 | ) | (75 | ) | ||||||
| 22 | (466 | ) | 2,576 | 2,870 | 2,789 | |||||||||||
Group’s share of operating profit (loss) of associates and joint venturesd | (397 | ) | (1,381 | ) | 329 | (34 | ) | (25 | ) | |||||||
| Total operating profit (loss): | ||||||||||||||||
| Continuing activities | 2,451 | (1,476 | ) | 2,905 | 2,836 | 2,764 | ||||||||||
| Discontinued activities | (2,826 | ) | (371 | ) | – | – | – | |||||||||
| (375 | ) | (1,847 | ) | 2,905 | 2,836 | 2,764 | ||||||||||
| Profit on sale of fixed asset investments and group undertakings | 619 | 4,389 | 1,696 | 36 | 358 | |||||||||||
| Profit on sale of property fixed assets | 34 | 1,089 | 11 | 14 | 22 | |||||||||||
| Amounts written off investments | – | (535 | ) | – | – | – | ||||||||||
Net interest payablee | (1,314 | ) | (1,622 | ) | (1,439 | ) | (941 | ) | (801 | ) | ||||||
| Profit (loss) on ordinary activities before taxation: | ||||||||||||||||
| Before goodwill amortisation and exceptional items | 2,067 | 1,126 | 1,840 | 2,013 | 2,085 | |||||||||||
| Goodwill amortisation and exceptional items | (3,103 | ) | 348 | 1,333 | (68 | ) | 258 | |||||||||
| (1,036 | ) | 1,474 | 3,173 | 1,945 | 2,343 | |||||||||||
Tax on profit (loss) on ordinary activitiesf | (712 | ) | (443 | ) | (459 | ) | (539 | ) | (523 | ) | ||||||
| Profit (loss) on ordinary activities after taxation | (1,748 | ) | 1,031 | 2,714 | 1,406 | 1,820 | ||||||||||
| Minority interests | (127 | ) | (23 | ) | (12 | ) | 8 | 1 | ||||||||
| Profit (loss) for the financial year | (1,875 | ) | 1,008 | 2,702 | 1,414 | 1,821 | ||||||||||
| Average number of shares used in basic earnings per share (millions) | 7,276 | 8,307 | 8,616 | 8,621 | 8,524 | |||||||||||
| Basic earnings (loss) per share | (25.8 | )p | 12.1 | p | 31.4 | p | 16.4 | p | 21.4 | p | ||||||
| Diluted earnings (loss) per share | (25.8 | )p | 12.0 | p | 31.2 | p | 16.3 | p | 21.2 | p | ||||||
| Basic earnings (loss) per share from continuing activities | 20.6 | p | (34.6 | )p | 31.4 | p | 16.4 | p | 21.4 | p | ||||||
| Diluted earnings (loss) per share from continuing activities | 20.3 | p | (34.6 | )p | 31.2 | p | 16.3 | p | 21.2 | p | ||||||
| Dividends per share | 7.8 | p | 2.0 | p | 6.5 | p | 8.5 | p | 10.4 | p | ||||||
Dividends per share, centsg | 14.0 | c | 3.1 | c | 10.3 | c | 15.3 | c | 19.5 | c | ||||||
| Basic earnings per share before goodwill amortisation and exceptional items | 17.5 | p | 6.2 | p | 14.4 | p | 16.9 | p | 18.1 | p | ||||||
| Diluted earnings per share before goodwill amortisation and exceptional items | 17.2 | p | 6.2 | p | 14.3 | p | 16.8 | p | 18.0 | p | ||||||
| Basic earnings per share before goodwill amortisation and exceptional items on continuing activities | 19.2 | p | 9.0 | p | 14.4 | p | 16.9 | p | 18.1 | p | ||||||
a | Restated following adoption of UITF17 and UITF38 (see note 1 on page 81) | ||||||||||||||||
b | Operating costs include net exceptional costs | 2,857 | 2,707 | 198 | 7 | 59 | |||||||||||
c | Includes redundancy and early leaver costs | 118 | 252 | 276 | 202 | 166 | |||||||||||
d | Group’s share of operating profit (loss) of associates and joint ventures includes exceptional costs (release) | 332 | 1,294 | (150 | ) | 26 | 25 | ||||||||||
e | Net interest payable includes exceptional costs (credits) | (25 | ) | 162 | 293 | 55 | – | ||||||||||
f | Includes exceptional tax charge (credit) | 22 | (143 | ) | (139 | ) | (29 | ) | (16 | ) | |||||||
g | Based on actual dividends paid and/or year end exchange rate on proposed dividends |
| Operating and financial review | BT Group plc Annual Report and Form 20-F 2005 23 |
Cash flow statement |
| Years ended 31 March | 2001 £m | 2002 £m | 2003 £m | 2004 £m | 2005 £m | |||||||||||
| Net cash flow from operating activities | 5,887 | 5,257 | 6,023 | 5,389 | 5,898 | |||||||||||
| Dividends from associates and joint ventures | 10 | 2 | 6 | 3 | 2 | |||||||||||
| Returns on investments and servicing of finance | (727 | ) | (1,695 | ) | (1,506 | ) | (527 | ) | (878 | ) | ||||||
| Taxation paid | (669 | ) | (562 | ) | (434 | ) | (317 | ) | (332 | ) | ||||||
| Capital expenditure and financial investment | (8,442 | ) | (1,354 | ) | (2,381 | ) | (2,477 | ) | (2,408 | ) | ||||||
| Acquisitions and disposals | (13,754 | ) | 5,785 | 2,842 | (60 | ) | (418 | ) | ||||||||
| Equity dividends paid | (1,432 | ) | – | (367 | ) | (645 | ) | (784 | ) | |||||||
| Cash (outflow) inflow before management of liquid resources and financing | (19,127 | ) | 7,433 | 4,183 | 1,366 | 1,080 | ||||||||||
| Management of liquid resources | (480 | ) | (1,864 | ) | (1,729 | ) | 1,123 | 587 | ||||||||
| Financing | 19,735 | (5,479 | ) | (2,473 | ) | (2,445 | ) | (1,485 | ) | |||||||
| Increase (decrease) in cash in the year | 128 | 90 | (19 | ) | 44 | 182 | ||||||||||
| (Increase) decrease in net debt in the year resulting from cash flows | (18,942 | ) | 13,930 | 4,225 | 1,222 | 887 | ||||||||||
Balance sheet |
| At 31 March | 2001 £m | a | 2002 £m | a | 2003 £m | a | 2004 £m | a | 2005 £m | |||||||
| Intangible fixed assets | 18,380 | 252 | 218 | 204 | 623 | |||||||||||
| Tangible fixed assets | 21,625 | 16,078 | 15,888 | 15,487 | 15,916 | |||||||||||
| Fixed asset investments | 5,107 | 1,044 | 457 | 324 | 115 | |||||||||||
| Net current assets (liabilities) | (11,111 | ) | 757 | 1,913 | 2,027 | (2,165 | ) | |||||||||
| Total assets less current liabilities | 34,001 | 18,131 | 18,476 | 18,042 | 14,489 | |||||||||||
| Loans and other borrowings falling due after one year | (18,775 | ) | (16,245 | ) | (13,456 | ) | (12,426 | ) | (8,091 | ) | ||||||
| Provisions for liabilities and charges | (2,738 | ) | (2,324 | ) | (2,376 | ) | (2,504 | ) | (2,497 | ) | ||||||
| Minority interests | (499 | ) | (72 | ) | (63 | ) | (46 | ) | (50 | ) | ||||||
| Total assets less liabilities | 11,989 | (510 | ) | 2,581 | 3,066 | 3,851 | ||||||||||
| Called up share capital | 7,573 | 434 | 434 | 432 | 432 | |||||||||||
| Share premium account | – | 2 | 2 | 2 | 3 | |||||||||||
| Capital redemption reserve | – | – | – | 2 | 2 | |||||||||||
| Other reserves | (2,848 | ) | 1,025 | 998 | 998 | 998 | ||||||||||
| Profit and loss account | 7,264 | (1,971 | ) | 1,147 | 1,632 | 2,416 | ||||||||||
| Total equity shareholders’ funds (deficiency) | 11,989 | (510 | ) | 2,581 | 3,066 | 3,851 | ||||||||||
| Total assets | 54,702 | 27,496 | 28,119 | 26,565 | 26,950 | |||||||||||
| a | Restated following adoption of UITF17 and UITF38 (see note 1 on page 81) |
US GAAP |
| Years ended 31 March | 2001 £m | 2002 £m | 2003 £m | 2004 £m | 2005 £m | |||||||||||
| Group operating profit (loss) | (633 | ) | (337 | ) | 2,693 | 2,420 | 2,779 | |||||||||
| Income (loss) before taxes | (1,959 | ) | 1,025 | 3,653 | 1,188 | 1,576 | ||||||||||
| Net income (loss): | ||||||||||||||||
| Continuing activities | 809 | (1,680 | ) | 4,134 | 883 | 1,297 | ||||||||||
| Discontinued activities | (3,166 | ) | 948 | – | – | – | ||||||||||
| (2,357 | ) | (732 | ) | 4,134 | 883 | 1,297 | ||||||||||
| Basic earnings (loss) per ordinary share | (32.4 | )p | (8.8 | )p | 48.0 | p | 10.2 | p | 15.2 | p | ||||||
| Diluted earnings (loss) per ordinary share | (32.4 | )p | (8.8 | )p | 47.7 | p | 10.2 | p | 15.1 | p | ||||||
| Basic earnings (loss) per ordinary share from continuing activities | 11.1 | p | (20.2 | )p | 48.0 | p | 10.2 | p | 15.2 | p | ||||||
| Diluted earnings (loss) per ordinary share from continuing activities | 11.0 | p | (20.2 | )p | 47.7 | p | 10.2 | p | 15.1 | p | ||||||
| Basic (loss) earnings per ordinary share from discontinued activities | (43.5 | )p | 11.4 | p | – | – | – | |||||||||
| Diluted (loss) earnings per ordinary share from discontinued activities | (43.5 | )p | 11.3 | p | – | – | – | |||||||||
| Average number of ADSs used in basic earnings per ADS (millions) | 728 | 831 | 862 | 862 | 852 | |||||||||||
| Basic earnings (loss) per ADS | £(3.24 | ) | £(0.88 | ) | £4.80 | £1.02 | £1.52 | |||||||||
| Diluted earnings (loss) per ADS | £(3.24 | ) | £(0.88 | ) | £4.77 | £1.02 | £1.51 | |||||||||
| Total assets as at 31 March | 55,361 | 30,428 | 31,131 | 28,674 | 29,006 | |||||||||||
| Ordinary shareholders’ equity (deficiency) as at 31 March | 10,231 | (4,247 | ) | (2,258 | ) | (1,455 | ) | (584 | ) | |||||||
| 24 BT Group plc Annual Report and Form 20-F 2005 | Operating and financial review |
Financial review
| The review is divided into the following sections: |
| 26 | |
| 27 | |
| 28 | |
| 30 | |
| 30 | |
| 32 | |
| 33 | |
| 33 | |
| 33 | |
| 34 | |
| 34 | |
| 35 | |
| 35 | |
| 35 | |
| 36 | |
| 36 | |
| 36 | |
| 36 | |
| 36 | |
| 37 | |
| 38 | |
| 38 | |
| 38 | |
| 38 | |
| 39 | |
| 39 | |
| 39 | |
| 39 | |
| 40 | |
| 40 | |
| 40 | |
| 40 | |
| 40 | |
| 40 | |
| 41 | |
| 43 |
| Please see cautionary statement regarding forward-looking statements on page 128. |
| Operating and financial review | BT Group plc Annual Report and Form 20-F 2005 25 |
Introduction |
The 2003 financial year was characterised by a focus on implementing and delivering the strategy announced in April 2002 and further corporate transactions in the continued restructuring of the group and reduction of net debt. The corporate transactions included the unwind of the Concert joint venture on 1 April 2002 and the disposal of our interest in Cegetel for £2.6 billion.
In this Financial review the commentary is focused principally on the trading results of BT Group before goodwill amortisation and exceptional items. Goodwill amortisation and exceptional items, by virtue of their size or nature, are excluded because they predominantly relate to corporate transactions rather than the trading activities of the group. This is also consistent with the way that financial performance is measured by management and we believe allows a meaningful comparison to be made of the trading results of the group during the period under review.
The goodwill amortisation and exceptional items are therefore analysed and discussed separately from the line of business results in this Financial review because they are considered to be a reflection of the corporate activity rather than the trading activity of the lines of business.
The following table shows the summarised profit and loss account which includes a reconciliation of the key performance measures before and after goodwill amortisation and exceptional items and is discussed further in this Financial review. The operating results by line of business are discussed in addition to the overall group results as we believe the activities and markets they serve are distinct and this analysis provides a greater degree of insight to investors.
| 26 BT Group plc Annual Report and Form 20-F 2005 | Operating and financial review |
| Summarised profit and loss account | 2005 | 2004 | 2003 | |||||||
| £m | £m | a | £m | a | ||||||
Total turnover | 19,031 | 18,914 | 20,182 | |||||||
| Group’s share of associates’ and joint ventures’ turnover | (408 | ) | (395 | ) | (1,455 | ) | ||||
Group turnover | 18,623 | 18,519 | 18,727 | |||||||
| Other operating income | 171 | 177 | 215 | |||||||
| Operating costs | (16,005 | ) | (15,826 | ) | (16,366 | ) | ||||
| Group operating profit (loss): | ||||||||||
| Before goodwill amortisation and exceptional items | 2,864 | 2,889 | 2,794 | |||||||
| Goodwill amortisation | (16 | ) | (12 | ) | (20 | ) | ||||
| Exceptional items | (59 | ) | (7 | ) | (198 | ) | ||||
| 2,789 | 2,870 | 2,576 | ||||||||
| Group’s share of operating profit (loss) of associates and joint ventures | (25 | ) | (34 | ) | 329 | |||||
| Total operating profit (loss): | ||||||||||
| Before goodwill amortisation and exceptional items | 2,864 | 2,881 | 2,975 | |||||||
| Goodwill amortisation | (16 | ) | (12 | ) | (22 | ) | ||||
| Exceptional items | (84 | ) | (33 | ) | (48 | ) | ||||
| 2,764 | 2,836 | 2,905 | ||||||||
| Profit on sale of group undertakings and fixed asset investments | 358 | 36 | 1,696 | |||||||
| Profit on sale of property fixed assets | 22 | 14 | 11 | |||||||
| Net interest payable | (801 | ) | (941 | ) | (1,439 | ) | ||||
| Profit (loss) on ordinary activities before taxation: | ||||||||||
| Before goodwill amortisation and exceptional items | 2,085 | 2,013 | 1,840 | |||||||
| Goodwill amortisation | (16 | ) | (12 | ) | (22 | ) | ||||
| Exceptional items | 274 | (56 | ) | 1,355 | ||||||
| 2,343 | 1,945 | 3,173 | ||||||||
| Tax | (523 | ) | (539 | ) | (459 | ) | ||||
Profit after taxation | 1,820 | 1,406 | 2,714 | |||||||
| Minority interests | 1 | 8 | (12 | ) | ||||||
Profit for the financial year | 1,821 | 1,414 | 2,702 | |||||||
| Basic earnings (loss) per share: | ||||||||||
| Before goodwill amortisation and exceptional items | 18.1 | p | 16.9 | p | 14.4 | p | ||||
| Goodwill amortisation | (0.2 | )p | (0.1 | )p | (0.3 | )p | ||||
| Exceptional items | 3.5 | p | (0.4 | )p | 17.3 | p | ||||
| 21.4 | p | 16.4 | p | 31.4 | p | |||||
| a | Restated following adoption of UITF17 and UITF38 (see note 1 on page 81) |
| Operating and financial review | BT Group plc Annual Report and Form 20-F 2005 27 |
Group results |
The pace of our transformation was demonstrated by the 32% growth of new wave turnover to £4,471 million compared to an increase of 30% in the 2004 financial year. New wave turnover represented 24% of group turnover in the 2005 financial year compared to 18% and 14% in the 2004 and 2003 financial years, respectively. New wave turnover is mainly generated from ICT solutions, broadband, mobility and managed services.
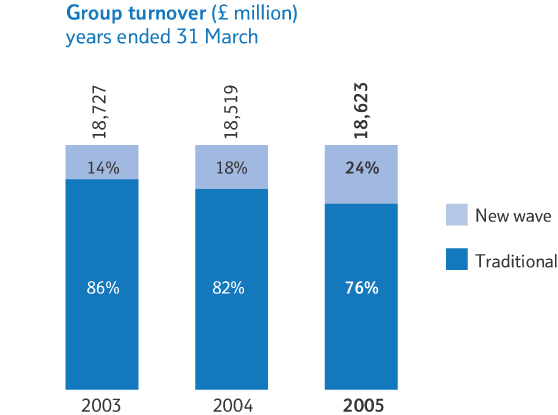
In the 2005 financial year the growth in new wave turnover of 32% more than offset the 7% decline in traditional turnover. The continued decline in traditional turnover reflects regulatory intervention, competition, price reductions and also technological changes that we are using to drive customers from traditional services to new wave services, such as broadband and IPVPN. Turnover of £123 million was generated from acquisitions in the year.
In the 2004 financial year the growth in new wave turnover of 30% was more than offset by a 6% decline in turnover from the group’s traditional businesses.
In the 2005 and 2004 financial years mobile operators were required to reduce their fees for terminating calls and these regulatory reductions were passed on to BT customers resulting in lower revenues but are profit neutral as payments to mobile operators were reduced by the same amount. In the 2005 financial year group turnover was up 3% (2004 – maintained) after excluding the £397 million (2004 – £219 million) impact of these regulatory reductions to mobile termination rates.
The table below analyses the group turnover by customer segment. Consumer includes the external turnover of BT Retail from consumer customers. Business includes the external turnover of BT Retail from SME (smaller and medium sized enterprise) customers. Major corporate includes the external turnover of BT Retail major corporate customers, and the external turnover of BT Global Services, excluding global carrier. Wholesale includes the external turnover of BT Wholesale and BT Global Services’ global carrier business.
| Group turnover by customer segment |
| 2005 £m | 2004 £m | 2003 £m | ||||||||
| Consumer | 5,637 | 5,974 | 6,067 | |||||||
| Business | 2,464 | 2,600 | 2,716 | |||||||
| Major corporate | 6,101 | 5,881 | 5,794 | |||||||
| Wholesale | 4,396 | 4,030 | 4,110 | |||||||
| Other | 25 | 34 | 40 | |||||||
| 18,623 | 18,519 | 18,727 | ||||||||
Consumer turnover in the 2005 financial year was 6% lower (4% excluding the impact of regulatory reductions to mobile termination rates) at £5,637 million. New wave consumer turnover increased by 85% to £412 million, driven by the continuing growth of broadband and mobility. Residential broadband connections almost doubled to 1,330,000 at 31 March 2005 and mobility connections increased by more than four fold to 187,000 at 31 March 2005. BT has introduced several price cuts to its broadband packages throughout the year to ensure it remains a key player in this highly competitive market. In February 2005 we announced that our retail broadband customers would be able to receive broadband at speeds of up to 2Mbit/s (up to four times faster) at no extra cost. Traditional consumer turnover declined by 9% reflecting the impact of CPS (Carrier Pre Selection) and broadband substitution. BT’s estimated residential market share, as measured by the volume of fixed to fixed voice minutes, declined by 6 percentage points to 64% compared to the 2004 financial year. The estimated market share, as measured by the volume of fixed to fixed voice minutes, is based on our actual minutes, market data provided by Ofcom and an extrapolation of the historical market trends.
The proportion of contracted revenues has been increasing, now approaching 63% (2004 – 58%) of total revenues, with the success of the BT Together packages and broadband. There are now 17.6 million BT Together customers and the number of customers on the frequent user packages continues to grow. The underlying 12 months rolling average revenue per customer household (net of mobile termination charges) of £256 in the 2005 financial year was 4% lower than the 2004 financial year. Consumer turnover in the 2004 financial year was 2% lower (1% excluding the impact of regulatory reductions to mobile termination rates) at £5,974 million when compared to the 2003 financial year.
Turnover from smaller and medium sized enterprise customers in the 2005 financial year reduced by 5% to £2,464 million compared to a reduction of 4% in the previous year. This decline reflects the continued penetration of CPS and the impact of customers switching from traditional telephony services to new wave services, including broadband. New wave turnover in this customer segment increased by 34% year on year driven mainly by the 40% growth in Business Broadband customers to 347,000 at 31 March 2005. The expansion of the BT Business Plan portfolio continued during the year with the number of locations increasing by 67% against last year to 445,000. This, together with our 83 BT Local Businesses, defended against some of the decline in traditional turnover.
Major corporate (UK and international) turnover increased by 4% to £6,101 million in the 2005 financial year (2% excluding the effect of acquisitions and the impact of regulatory reductions to mobile termination
| 28 BT Group plc Annual Report and Form 20-F 2005 | Operating and financial review |
In the 2004 financial year major corporate turnover increased by 2% to £5,881 million. This reflects the migration of traditional voice only services to managed ICT solutions contracts from which turnover grew by 19% to £2,546 million in the 2004 financial year.
Wholesale (UK and global carrier) turnover in the 2005 financial year increased by 9% (16% excluding the impact of regulatory reductions to mobile termination rates) to £4,396 million. New wave turnover in the UK wholesale business increased by 84% driven by broadband and managed services after growing by 54% in the 2004 financial year. The global carrier business turnover increased by 5% in the 2005 financial year following a decline of 5% in the 2004 financial year. This reflects the increases in termination revenues in Europe partly offset by the anticipated decline in AT&T revenues. In the 2004 financial year Wholesale turnover fell by 2% (up 1% excluding the impact of regulatory reductions to mobile termination rates) to £4,030 million.
We reached 5 million broadband DSL connections in early April 2005 which is a year ahead of our target and represents an increase of 126% from 31 March 2004.
Group operating costs before goodwill amortisation and exceptional items increased by 1% to £15,930 million in the 2005 financial year. The operating costs from acquisitions were £134 million in the 2005 financial year. Excluding acquisitions, group operating costs before goodwill amortisation and exceptional items were flat. Our cost efficiency programmes achieved savings of about £400 million in the 2005 financial year which enabled us to invest in growing our new wave activities. In the 2004 financial year group operating costs before goodwill amortisation and exceptional items reduced by 2% to £15,807 million when compared to the prior year.
Net staff costs in the 2005 financial year, excluding leaver costs of £166 million, increased by £27 million to £3,563 million due to the additional staff required to service ICT contracts. Net staff costs in the 2004 financial year, excluding leaver costs of £202 million, increased by £145 million to £3,536 million due to the impact of increased pay and national insurance rates and the higher SSAP 24 pension charge, offset by improved efficiency. Payments to other telecommunications operators in the 2005 financial year were £3,725 million, a decrease of 6% mainly reflecting the impact of mobile termination rate reductions offset partly by higher volumes. In the 2004 financial year payments to other telecommunications operators were £3,963 million, an increase of 1% on the 2003 financial year as both UK and overseas payments increased. Other operating costs before goodwill amortisation and exceptional items in the 2005 financial year increased by 9% to £5,636 million. This reflects not only the cost of supporting new ICT contracts, but also investment in new wave activities, including strengthening our networked IT services delivery capabilities outside the UK, higher marketing costs and higher subscriber acquisition costs. Other operating costs before goodwill amortisation and exceptional items reduced by 6% in the 2004 financial year largely due to efficiency cost savings offset by the adverse impact of currency movements.
Group operating profit before goodwill amortisation and exceptional items at £2,864 million for the 2005 financial year was 1% lower than the prior year mainly reflecting the cost of supporting new ICT contracts and investment in new wave activities. Group operating profit before goodwill amortisation and exceptional items at £2,889 million for the 2004 financial year was 3% higher than the prior year. This reflected cost efficiencies achieved during the year, the improved performance of BT Global Services and a £74 million decrease in leaver costs offset by the decline in turnover. Group operating profit margins before goodwill amortisation and exceptional items were relatively steady year on year at 15.4% and 15.6% in the 2005 and 2004 financial years, respectively.
BT’s share of associates’ and joint ventures’ operating results before goodwill amortisation and exceptional items was £nil in the 2005 financial year, compared to losses of £8 million in the 2004 financial year and a £181 million profit in the 2003 financial year. The 2003 financial year includes the results of our interest in Cegetel which was sold in January 2003.
Net interest payable before exceptional items was £801 million for the 2005 financial year, an improvement of £85 million against the 2004 financial year following an improvement of £260 million in the 2004 financial year. This reflects the reduction in net debt in both years.
The above factors resulted in the group achieving a profit before taxation, goodwill amortisation and exceptional items of £2,085 million in the 2005 financial year, an increase of 4% compared to the 2004 financial year. In the 2004 financial year the profit before taxation, goodwill amortisation and exceptional items of £2,013 million was £173 million higher than the 2003 financial year. The improvement in both years reflects the underlying operating performance of the group and lower net interest costs.
The taxation charge for the 2005 financial year was £539 million on the profit before goodwill amortisation and exceptional items, an effective rate of 25.9% compared to 28.2% and 32.5% in the 2004 and 2003 financial years, respectively. The improvement in the effective tax rate reflects the tax efficient investment of surplus cash and continued improvement in the tax efficiency within the group.
Basic earnings per share before goodwill amortisation and exceptional items were 18.1 pence for the 2005 financial year, an increase of 7% from 16.9 pence in the 2004 financial year, and were 14.4 pence in the 2003 financial year.
| Operating and financial review | BT Group plc Annual Report and Form 20-F 2005 29 |
| Line of business summary |
| Group turnover | Group operating profit (loss) | Goodwill amortisation | Exceptional charges (credits) | ||||||||||||||||||||||||||||||||||
| 2005 £m | 2004 £m | 2003 £m | 2005 £m | 2004 £m | a | 2003 £m | a | 2005 £m | 2004 £m | 2003 £m | 2005 £m | 2004 £m | 2003 £m | ||||||||||||||||||||||||
| BT Retail | 12,562 | 12,940 | 13,217 | 1,115 | 1,231 | 1,215 | 5 | 1 | 1 | – | – | – | |||||||||||||||||||||||||
| BT Wholesale | 8,979 | 8,883 | 9,251 | 1,940 | 1,884 | 2,070 | – | – | – | – | (1 | ) | – | ||||||||||||||||||||||||
| BT Global Services | 6,381 | 5,782 | 5,417 | (4 | ) | (116 | ) | (394 | ) | 11 | 11 | 19 | – | – | – | ||||||||||||||||||||||
| Other | 25 | 35 | 41 | (262 | ) | (129 | ) | (315 | ) | – | – | – | 59 | 8 | 198 | ||||||||||||||||||||||
| Intra-group | (9,324 | ) | (9,121 | ) | (9,199 | ) | – | – | – | – | – | – | – | – | – | ||||||||||||||||||||||
| Group totals | 18,623 | 18,519 | 18,727 | 2,789 | 2,870 | 2,576 | 16 | 12 | 20 | 59 | 7 | 198 | |||||||||||||||||||||||||
| a | Restated following adoption of UITF17 and UITF38 (see note 1 on page 81) |
Line of business results |
There is extensive trading between the lines of business and their profitability is dependent on the transfer price levels. The intra-group trading arrangements and operating assets are subject to review and have changed in certain circumstances. Where that is the case the comparative figures have been restated to reflect those changes.
The table below analyses the trading relationships between each of the lines of business for the 2005 financial year. The majority of the internal trading is BT Wholesale selling calls, access lines and other network products to BT Retail. This trading relationship also reflects the pass through of termination charges on other telecom operator networks and the sale of wholesale broadband ISP products. BT Retail also trades with BT Wholesale, selling apparatus, operator assistance and directory enquiries services and conferencing for onward sale to other telecom operators. BT Global Services’ turnover with BT Retail mainly reflects the sales of BT Global Services products in the UK. BT Global Services trades with BT Wholesale mainly for use of the IP/ATM network, International Direct Dial traffic settlements and certain dial IP revenue share arrangements. BT Wholesale’s turnover with BT Global Services reflects the use of the network infrastructure for BT Global Services’ products.
| Internal cost recorded by: | ||||||||||||||||
| Internal turnover recorded by: | BT Retail £m | BT Wholesale £m | BT Global Services £m | Other £m | Total £m | |||||||||||
| BT Retail | – | 230 | 213 | 4 | 447 | |||||||||||
| BT Wholesale | 4,689 | – | 475 | 3 | 5,167 | |||||||||||
| BT Global Services | 3,028 | 663 | – | 19 | 3,710 | |||||||||||
| Total | 7,717 | 893 | 688 | 26 | 9,324 | |||||||||||
The line of business results are presented and discussed before goodwill amortisation and exceptional items, for the reasons set out above, to provide a meaningful comparison of the trading results between the financial years under review. Goodwill amortisation and exceptional items are discussed separately in a group context in this Financial review.
In addition to measuring financial performance of the lines of business based on the operating profit before goodwill amortisation and exceptional items, management also measure the operating financial performance of the lines of business based upon the EBITDA before exceptional items. EBITDA is defined as the group operating profit (loss) before depreciation and amortisation. This may not be directly comparable to the EBITDA of other companies as they may define it differently. EBITDA excludes depreciation and amortisation, both being non cash items, from group operating profit and is a common measure, particularly in the telecommunications sector, used by investors and analysts in evaluating the operating financial performance of companies.
EBITDA before exceptional items is considered to be a good measure of the operating performance because it reflects the underlying operating cash costs, by eliminating depreciation and amortisation, and excludes non-recurring exceptional items that are predominantly related to corporate transactions. EBITDA is not a direct measure of the group’s liquidity, which is shown by the group’s cash flow statement and needs to be considered in the context of the group’s financial commitments. A reconciliation of EBITDA before exceptional items to group operating profits (losses) by line of business and for the group is provided in the table across the page above. Trends in EBITDA before exceptional items are discussed for each line of business in the following commentary.
| a | Before goodwill amortisation and exceptional items |
| 30 BT Group plc Annual Report and Form 20-F 2005 | Operating and financial review |
| Group operating profit (loss) before goodwill amortisation and exceptional items | Depreciation | Amortisation of intangible assets | EBITDA before exceptional items | |||||||||||||||||||||||||||||||||
2005 | 2004 | a | 2003 | a | 2005 | 2004 | 2003 | 2005 | 2004 | 2003 | 2005 | 2004 | a | 2003 | a | |||||||||||||||||||||
£m | £m | £m | £m | £m | £m | £m | £m | £m | £m | £m | £m | |||||||||||||||||||||||||
1,120 | 1,232 | 1,216 | 129 | 162 | 201 | – | – | – | 1,249 | 1,394 | 1,417 | BT Retail | ||||||||||||||||||||||||
1,940 | 1,883 | 2,070 | 1,909 | 1,919 | 1,923 | – | – | – | 3,849 | 3,802 | 3,993 | BT Wholesale | ||||||||||||||||||||||||
7 | (105 | ) | (375 | ) | 567 | 610 | 609 | 6 | 3 | 4 | 580 | 508 | 238 | BT Global Services | ||||||||||||||||||||||
(203 | ) | (121 | ) | (117 | ) | 229 | 230 | 278 | – | – | – | 26 | 109 | 161 | Other | |||||||||||||||||||||
– | – | – | – | – | – | – | – | – | – | – | – | Intra-group | ||||||||||||||||||||||||
2,864 | 2,889 | 2,794 | 2,834 | 2,921 | 3,011 | 6 | 3 | 4 | 5,704 | 5,813 | 5,809 | Group totals | ||||||||||||||||||||||||
base of the traditional business, allowing investment in new wave products and services.
BT Retail’s turnover decreased by 3% in the 2005 financial year to £12,562 million after declining by 2% in the 2004 financial year. The growth in new wave turnover of 28% in the 2005 financial year (2004 – 29%) was more than offset by the decline in traditional turnover driven by the impact of regulation and competition. After adjusting for the regulatory impact of the reduction in mobile termination rates, turnover declined by 2% in the 2005 financial year (2004 – 1%). Turnover for the three years is summarised as follows:
| BT Retail turnover |
| 2005 | 2004 | 2003 | ||||||||
| £m | £m | £m | ||||||||
| Voice services | 8,054 | 8,906 | 9,552 | |||||||
| Intermediate products | 1,728 | 1,868 | 1,982 | |||||||
Traditional | 9,782 | 10,774 | 11,534 | |||||||
| ICT | 1,978 | 1,734 | 1,502 | |||||||
| Broadband | 541 | 307 | 131 | |||||||
| Mobility | 184 | 84 | 42 | |||||||
| Other | 77 | 41 | 8 | |||||||
New wave | 2,780 | 2,166 | 1,683 | |||||||
Total | 12,562 | 12,940 | 13,217 | |||||||
Voice services comprise calls made by customers on the BT fixed line network in the UK, analogue lines, equipment sales, rentals and other business voice products. Overall turnover from voice services was 10% lower in the 2005 financial year (8% excluding the impact of regulatory reductions to mobile termination rates) after a decrease of 7% in the 2004 financial year. The reduction includes the effect of continued migration to broadband with a 25% fall in dial up minutes over the year, a reduction in market share reflecting regulatory and competitive pressure and a decline in the overall fixed to fixed calls market.
Turnover from intermediate products in the 2005 financial year of £1,728 million decreased by 7% after decreasing by 6% in the 2004 financial year. The reduction was mainly driven by the continued decline in private circuits and ISDN as customers migrate to new wave products including broadband, and IPVPN. As a result of regulatory changes, partial private circuits used by UK fixed network operators are no longer provided by BT Retail, but are provided as a BT Wholesale product. Private circuit revenues declined by £68 million in the 2005 financial year and by £88 million in the 2004 financial year.
New wave turnover grew by 28% to £2,780 million in the 2005 financial year compared to growth of 29% in the 2004 financial year. New wave turnover accounted for 22% of BT Retail’s turnover in the 2005 financial year compared to 17% and 13% in the 2004 and 2003 financial years, respectively. ICT solutions are the main component and increased by 14% in the 2005 financial year to £1,978 million after an increase of 15% in the 2004 financial year reflecting the growth in new IP based services and solutions contracts. Broadband turnover grew by 76% to £541 million in the 2005 financial year after an increase of 134% in the 2004 financial year. The growth of broadband continues to accelerate with 1,752,000 BT Retail connections at 31 March 2005, an increase of 81% over last year. BT Retail had net additions of 785,000 broadband customers in the year, a 29% share of the broadband DSL market additions. Turnover from mobility services increased by 119% in the 2005 financial year after doubling in the 2004 financial year. BT Mobile had over 372,000 contract mobile connections at 31 March 2005, an increase of 158% from 31 March 2004. BT Openzone has grown significantly this year with paid minutes across the network almost four times higher and the number of access sites is now over 20,000 worldwide. Other new wave turnover has grown by 88% primarily driven by revenues from BT Phone Books (now covering 171 different regions) increasing to £65 million.
The total number of BT Retail lines, which includes voice, digital and broadband, were flat at 30 million at 31 March 2005, reflecting the continued growth in broadband offset by the declining PSTN lines.
The gross margin percentage decreased by 0.9 percentage points in the 2005 financial year after a decrease of 0.2 percentage points in the 2004 financial year. The decline primarily reflects the change in revenue mix from traditional business to lower margin new wave services. As the broadband and mobility customer base grows, the additional subscriber acquisition costs are written off as incurred. In addition, the creation and development of new value added services resulted in increased development costs.
Gross margin is turnover less costs directly attributable to the provision of the products and services reflected in turnover in the period. Selling, general and administration costs are those costs that are ancillary to the business processes of providing products and services and are the general business operating costs. BT Retail analyses its costs in this manner for management purposes in common with other retail organisations and it has set target savings for selling, general and administration costs.
Cost transformation programmes in the 2005 financial year generated selling, general and administration cost savings of £124 million before leaver costs in the traditional business (£27 million net of new wave investment). The savings in the year were driven by cost
| Operating and financial review | BT Group plc Annual Report and Form 20-F 2005 31 |
The number of employees in BT Retail at 31 March 2005 and 31 March 2004 was 39,500 and 41,500, respectively.
BT Retail’s EBITDA before exceptional items and goodwill amortisation declined by 10% to £1,249 million in the 2005 financial year after showing a decline in the 2004 financial year of 2% to £1,394 million. The increased rate of decline in the 2005 financial year is due to a 9% fall (compared to 7% in 2004 financial year) in traditional turnover coupled with increased investment in new wave activities, particularly in mobility and broadband, that laid the foundations for further growth in new wave activities. In the 2004 financial year, cost savings more than offset the decline in turnover and the impact on margins of the product mix.
Capital expenditure for the 2005 financial year was £154 million, an increase of 31% from the 2004 financial year, mainly due to increased expenditure on software.
| a | Before goodwill amortisation and exceptional items |
BT Wholesale is the line of business within BT that provides network services and solutions within the UK. Its customers include communications companies, fixed and mobile network operators, internet and other service providers. The customer base includes BT’s lines of business, BT Retail and BT Global Services. The majority of BT Wholesale’s turnover is internal (2005 – 58%, 2004 – 61%, 2003 – 62%) and mainly represents trading with BT Retail. External turnover is derived from providing wholesale products and solutions to other operators interconnecting with BT’s UK fixed network.
In the 2005 financial year, turnover totalled £8,979 million, an increase of 1% over the 2004 financial year, after a reduction of 4% to £8,883 million in the 2004 financial year.
External turnover increased by 10% to £3,812 million in the 2005 financial year (an increase of 17% excluding the impact of regulatory reductions to mobile termination rates). This follows a decline of 1% in the 2004 financial year to £3,473 million (an increase of 2% excluding the impact of regulatory reductions to mobile termination rates). The increase in the 2005 financial year reflects particularly strong growth in new wave revenues, mainly broadband. The regulatory price reductions on mobile termination rates have no impact on profitability.
External turnover from traditional products increased by 1% in the 2005 financial year compared to a decline of 5% in the 2004 financial year. Excluding the impact of regulatory reductions to mobile termination rates turnover was up 10% in the 2005 financial year and down 2% in the 2004 financial year. The growth in traditional turnover was mainly driven by growth in private circuits, wholesale access and interconnect traffic. Turnover from partial private circuits of £191 million increased by 26% in the 2005 financial year after an increase of 43% in the 2004 financial year to £152 million. This reflects the continuing trend of customers migrating from lower bandwidth products to less expensive alternatives such as partial private circuits and short haul data services. Substitution to broadband has resulted in the continued declining trend in Flat Rate Internet Access Call Origination revenues with turnover of £57 million in the 2005 financial year (2004 – £78 million, 2003 – £84 million). Wholesale access revenues have increased by £65 million in the 2005 financial year as a result of increased volumes from other service providers. Conveyance and low margin transit revenues of £2,014 million decreased by 2% compared to the 2004 financial year and at £2,054 million decreased by 1% in the 2004 financial year with the impact of regulatory price reductions being offset by increased call volumes.
New wave turnover, including broadband and managed services, at £664 million in the 2005 financial year, showed strong growth of 84% following growth of 54% in the 2004 financial year. Broadband revenues grew by 158% year on year. Wholesale broadband DSL lines more than doubled during the 2005 financial year and reached 5 million DSL lines in the first week of April 2005 which is a year ahead of our target. In the 2004 financial year wholesale DSL lines grew by 177% to over 2.2 million lines.
Internal turnover decreased by 4% to £5,167 million in the 2005 financial year after a decrease of 6% to £5,410 million in the 2004 financial year. The reduction reflects the impact of lower volumes of calls, lines and private circuits, and lower regulatory prices being reflected in internal charges.
Gross variable profit of £6,817 million marginally increased compared to £6,791 million for the 2004 financial year after a decrease of 6% compared to the 2003 financial year reflecting sales volume changes and changes in sales mix.
In the 2005 financial year, network and selling, general and administration costs, excluding leaver costs, decreased by £20 million, following a decrease of £174 million in the 2004 financial year. Activity levels in the network, driven by broadband volumes, have increased in both the 2005 and 2004 financial years. The financial impact of this increased activity has been mitigated by a series of cost reduction programmes focusing on efficiency, discretionary cost management and process improvements.
The number of employees in BT Wholesale at 31 March 2005 and 31 March 2004 was 28,300 and 27,800, respectively.
EBITDA before exceptional items at £3,849 million in the 2005 financial year was 1% higher than in the 2004 financial year following a reduction of 5% to £3,802 million in the 2004 financial year. EBITDA margins before exceptional items were maintained at 43% across all three financial years. Leaver costs were £45 million in the 2005 financial year (2004 – £46 million, 2003 – £131 million).
| 32 BT Group plc Annual Report and Form 20-F 2005 | Operating and financial review |
Operating profit before goodwill amortisation and exceptional items at £1,940 million increased by 3% in the 2005 financial year. This was after a reduction of 9% to £1,883 million in the 2004 financial year. The operating profit margin, before exceptional items, remained broadly flat at 21.6% and 21.2% in the 2005 and 2004 financial years, respectively.
Capital expenditure on plant and equipment at £1,973 million increased by 9% in the 2005 financial year and follows an increase of 10% in the 2004 financial year. This reflects increased expenditure to support the rapid growth in broadband and investment to support the transformation of the group’s network.
| BT Global Services | 2005 | 2004 | 2003 | |||||||
| £m | £m | £m | ||||||||
| Group turnover | 6,381 | 5,782 | 5,417 | |||||||
Group operating profit (loss)a | 7 | (105 | ) | (375 | ) | |||||
EBITDAa | 580 | 508 | 238 | |||||||
| Capital expenditure | 628 | 479 | 445 | |||||||
| a | Before goodwill amortisation and exceptional items |
BT Global Services supplies managed services and solutions to multi-site organisations worldwide – our core target market is 10,000 multi-site organisations including major companies with significant global requirements, together with large organisations in target local markets. We provide them with global reach and a complete range of networked IT services.
Our extensive global communications network and strong strategic partnerships enable us to serve customers in the key commercial centres of Europe, North America and the Asia Pacific region.
Our global communications services portfolio includes: desktop and network equipment and software; transport and connectivity; managed LAN (local area network), WAN (wide area network) and IPVPN (internet protocol virtual private network) services; managed mobility; applications hosting; storage and security services; and business transformation and change management services.
In the 2005 financial year BT Global Services’ turnover was £6,381 million, including £111 million from the Albacom and Infonet businesses acquired in the final quarter of the year. This represents an underlying increase of 8% compared to the 2004 financial year. BT Global Solutions’ turnover grew by 17% in the 2005 financial year to £3,202 million, following growth of 14% in the 2004 financial year, reflecting the conversion of the strong order book. BT Consulting & Systems Integration performed strongly with turnover of £824 million in the 2005 financial year, representing an increase of 14% over the prior year (2004 – 16%). The growth includes the impact of the NHS contracts won in 2004. In the 2005 and 2004 financial years contract wins from managed ICT solutions amounted to more than £7 billion. BT Global Products’ turnover grew by 4% to £1,897 million in the 2005 financial year (2004 – 9%) and continues to reflect the growth of MPLS (Multi Protocol Label Switching). In the 2005 financial year BT Global Carrier turnover increased by 2% to £981 million, reversing the decline of 1% seen in the 2004 financial year. The increase in 2005 reflects the increases in termination revenues in Europe partly offset by the anticipated decline in AT&T revenues.
The increase in turnover, together with lower network and selling, general and administration costs, helped generate improvements in EBITDA before exceptional items in the 2005 financial year of 14% to £580 million, following an improvement of 113% in the 2004 financial year. The 2005, 2004 and 2003 financial years include leaver costs of £33 million, £33 million and £65 million, respectively. Headcount increased by 16% to 24,600 in the 2005 financial year which includes the expected increase in resources associated with strengthening the overseas network centric solutions delivery capabilities and an increase in headcount to service the increased ICT contract base. Headcount increased by 23% to 21,200 in the 2004 financial year.
The 2005 financial year saw Global Services deliver its first ever full year operating profit before goodwill amortisation and exceptional items, at £7 million, an improvement of £112 million over the previous year. The acquisitions contributed an operating loss of £10 million since acquisition in the final quarter of the 2005 financial year.
Capital expenditure for the 2005 financial year was £628 million, an increase of 31% from £479 million in the 2004 financial year, mainly due to expenditure on the NHS contracts won in 2004.
The increase in total costs in the 2005 financial year reflects the cost of supporting new ICT contracts, including strengthening our networked IT services delivery capabilities outside the UK, higher marketing costs and higher subscriber acquisition costs. As a percentage of group turnover, operating costs, excluding goodwill amortisation and exceptional items, were 86% in the 2005 financial year (2004 – 85%, 2003 – 86%). In all three financial years, net exceptional costs were incurred. These amounted to £59 million, £7 million and £198 million in the 2005, 2004 and 2003 financial years, respectively. These exceptional costs are considered separately in the discussion which follows.
| Operating and financial review | BT Group plc Annual Report and Form 20-F 2005 33 |
| Operating costs |
| 2005 | 2004 | 2003 | ||||||||
| £m | £m | a | £m | a | ||||||
| Staff costs | 4,451 | 4,415 | 4,250 | |||||||
| Own work capitalised | (722 | ) | (677 | ) | (583 | ) | ||||
| Depreciation | 2,834 | 2,921 | 3,011 | |||||||
| Goodwill and other intangibles amortisation | 22 | 15 | 24 | |||||||
| Payments to telecommunications operators | 3,725 | 3,963 | 3,940 | |||||||
| Other operating costs | 5,636 | 5,182 | 5,526 | |||||||
| Total operating costs before exceptional costs | 15,946 | 15,819 | 16,168 | |||||||
| Net exceptional costs | 59 | 7 | 198 | |||||||
| Total operating costs | 16,005 | 15,826 | 16,366 | |||||||
| a | Restated – see note 1 |
Staff costs increased by 1% to £4,451 million in the 2005 financial year and by 4% to £4,415 million in the 2004 financial year. In the 2005 financial year, the number of staff employed increased by 2,200 to 102,100 at 31 March 2005 after decreasing by 4,800 in the 2004 financial year. The increase in the 2005 financial year was mainly due to the additional staff required to service ICT contracts and the acquisitions of Albacom and Infonet. The increase in headcount and pay rates was offset by lower early leaver costs. In the 2004 financial year increased pay rates and national insurance and a £141 million increase in the pension charge offset the impact of the lower headcount and leaver costs.
The allocation for the employee profit share scheme, included within staff costs, was £11 million in the 2005 financial year. The allocation for the 2004 and 2003 financial years was £20 million and £36 million, respectively.
Early leaver costs of £166 million were incurred in the 2005 financial year, compared with £202 million and £276 million in the 2004 and 2003 financial years, respectively. This reflects BT’s continued focus on improving operational efficiencies. Leaver costs include the cost of enhanced pension benefits provided to leavers which amounted to £nil, £1 million and £60 million in the 2005, 2004 and 2003 financial years, respectively.
The depreciation charge decreased by 3% in the 2005 financial year to £2,834 million after decreasing by 3% in the 2004 financial year.
Goodwill amortisation in respect of subsidiaries and businesses acquired and amortisation of other intangibles totalled £22 million in the 2005 financial year compared with £15 million in the 2004 financial year and £24 million in the 2003 financial year.
Payments to other telecommunications operators decreased by 6% in the 2005 financial year to £3,725 million after increasing by 1% in the 2004 financial year. The decrease in the 2005 financial year mainly reflects the impact of mobile termination rate reductions offset by higher volumes.
Other operating costs before goodwill amortisation and exceptional items increased by 9% in the 2005 financial year to £5,636 million after reducing by 6% in the 2004 financial year. This reflects not only the cost of supporting new ICT contracts, but also investment in new wave activities, including strengthening our networked IT services delivery capabilities outside the UK, higher marketing costs and higher subscriber acquisition costs. The decrease in the 2004 financial year was largely due to efficiency cost savings offset by the adverse impact of currency movements. Other operating costs include the maintenance and support of the networks, accommodation and marketing costs, the cost of sales of customer premises equipment and non pay related leaver costs.
The exceptional items within operating costs for the 2005, 2004 and 2003 financial years are shown in the table below.
| Exceptional operating costs |
| 2005 | 2004 | 2003 | ||||||||
| £m | £m | £m | ||||||||
| Property rationalisation costs | 59 | – | 198 | |||||||
| Rectification costs | – | 30 | – | |||||||
| BT Wholesale bad debt release | – | (23 | ) | – | ||||||
| Total exceptional operating costs | 59 | 7 | 198 | |||||||
In the 2005 financial year £59 million of exceptional property rationalisation charges were recognised in relation to the group’s provincial office portfolio. This rationalisation programme is expected to continue through next year giving rise to further rationalisation costs. In the 2004 financial year, net exceptional operating costs included the rectification costs relating to a major incident offset by the £23 million release of the surplus exceptional bad debt provisions made in the 2002 financial year. In the 2003 financial year a property rationalisation charge of £198 million was recognised in relation to the group’s London office estate.
Total group operating profit for the 2005 financial year was £2,789 million compared to a profit of £2,870 million in the 2004 financial year and a profit of £2,576 million in the 2003 financial year.
| 2005 £m | 2004 £m | 2003 £m | ||||||||
| Share of turnover | 408 | 395 | 1,455 | |||||||
| Share of operating (loss) profit before goodwill amortisation and exceptional items | – | (8 | ) | 181 | ||||||
The group’s share of associates’ and joint ventures’ turnover was £408 million during the 2005 financial year. In the 2004 financial year the group’s share of associates’ and joint ventures’ turnover was £395 million, a decrease of £1,060 million over the previous year due to the disposal of the group’s interest in Cegetel in the 2003 financial year.
| 34 BT Group plc Annual Report and Form 20-F 2005 | Operating and financial review |
The group’s share of its ventures’ operating profits before goodwill amortisation and exceptional items was £nil in the 2005 financial year. This compares to a loss of £8 million and a profit of £181 million in the 2004 and 2003 financial years, respectively.
The principal contributor to the group’s share of operating profits before goodwill amortisation and exceptional items in the 2003 financial year was Cegetel (£198 million).
Exceptional items within the operating (losses) profits from joint ventures and associates are as follows:
| 2005 £m | 2004 £m | 2003 £m | ||||||||
| Impairment of assets in joint ventures | 25 | – | – | |||||||
| Goodwill impairment | – | 26 | – | |||||||
| Release of exit costs | – | – | (150 | ) | ||||||
| Total exceptional operating costs (credits) | 25 | 26 | (150 | ) | ||||||
In the 2005 financial year BT incurred an exceptional impairment charge of £25 million, being BT’s share of a write down of Albacom’s assets prior to Albacom becoming a subsidiary. In the 2004 financial year, BT charged its share of an exceptional goodwill impairment made by Albacom, amounting to £26 million.
In the 2003 financial year BT completed the exit from its investment in Blu on more favourable terms than anticipated and surplus exit cost provisions of £150 million were released.
Goodwill amortisation was £nil in both the 2005 and 2004 financial year, compared to £2 million in the 2003 financial year.
Total operating profit for the 2005 financial year was £2,764 million, including BT’s share of the operating results of its associates and joint ventures. This compared to £2,836 million for the 2004 financial year and £2,905 million for the 2003 financial year. The reduction in total operating profit reflects the reduction in associates’ and joint ventures’ profits offset by cost efficiency savings, the strong performance of BT Global Services and lower leaver costs.
In the 2004 financial year the consideration for disposals totalled £133 million and the profit before tax from disposals totalled £36 million. This was principally in relation to the disposal of the group’s 7.8% interest in Inmarsat which was sold for £67 million realising a profit on disposal of £32 million.
In the 2003 financial year a number of non-core investments were sold. The consideration for the disposals totalled £3,028 million and the profit before taxation from disposals totalled £1,696 million. This was principally in relation to the disposal of our 26% interest in Cegetel, a French telecommunications operator, on 22 January 2003. The total proceeds were £2,603 million, received in cash, and the profit was £1,509 million before the recognition of an exceptional interest charge of £293 million on closing out fixed interest rate swaps following receipt of the sale proceeds.
The reduction in the net interest charge in the 2005 financial year reflects the continued reduction in the level of net debt. In addition, there were no exceptional interest charges or credits in the 2005 financial year compared to a net exceptional charge of £55 million in the 2004 financial year. The net exceptional charge in the 2004 financial year represents the premium on buying back €1.1 billion of 7.125% bonds due in 2011 and US$195 million of the group’s US dollar bonds, partially offset by a credit from the one off interest recognised on full repayment of loan notes received as part of the original consideration from the disposal of Yell.
The reduction in the net interest charge in the 2004 financial year reflects the reduction in the level of net debt and lower net exceptional charges in the 2004 financial year.
The net interest charge in the 2003 financial year includes the £293 million exceptional cost of terminating fixed interest rate swaps as a consequence of the receipt of the Cegetel sale proceeds.
Interest cover in the 2005 financial year represented 3.6 times total operating profit before goodwill amortisation and exceptional items, and compares with interest cover of 3.3 in the 2004 financial year and 2.6 in the 2003 financial year. The improvement in cover is due to the reduction in the interest charge mainly arising from the reduction in net debt.
| Operating and financial review | BT Group plc Annual Report and Form 20-F 2005 35 |
Profit (loss) before taxation |
The group’s profit before taxation, before goodwill amortisation and exceptional items for the 2005 financial year was £2,085 million, compared with £2,013 million in the 2004 financial year and £1,840 million in the 2003 financial year. The improvement in the underlying profit was due to cost efficiency savings, the strong performance of BT Global Services, lower leaver costs and the lower interest charges explained above.
The tax charge for the 2004 financial year was £539 million and comprises £568 million on the profit before taxation, goodwill amortisation and exceptional items, offset by tax relief of £29 million on certain exceptional charges.
The tax charge for the 2003 financial year was £459 million and comprises £598 million on the profit before taxation, goodwill amortisation and exceptional items, offset by tax relief of £139 million on certain exceptional charges.
| 2005 pence | 2004 pence | a | 2003 pence | a | ||||||
| Basic earnings per share before goodwill amortisation and exceptional items | 18.1 | 16.9 | 14.4 | |||||||
| Exceptional items and goodwill amortisation | 3.3 | (0.5 | ) | 17.0 | ||||||
| Total basic earnings per share | 21.4 | 16.4 | 31.4 | |||||||
| a | Restated – see note 1 |
Basic earnings per share before goodwill amortisation and exceptional items of 18.1 pence for the 2005 financial year compare with an equivalent of 16.9 pence and 14.4 pence for the 2004 and 2003 financial years, respectively.
Diluted earnings per share were not materially different in all three years.
We continue with our progressive dividend policy. The dividend for the 2006 financial year will be at least 60% of underlying earnings: subject to the group’s overall financial position, we expect our pay out ratio to rise to around two-thirds of underlying earnings by the 2008 financial year.
The interim and final dividend in the 2004 financial year was 3.2 pence per share and 5.3 pence per share, respectively. This gave a full dividend for the year of 8.5 pence per share, amounting to £732 million.
The interim and final dividend in the 2003 financial year was 2.25 pence per share and 4.25 pence per share, respectively. This gave a full dividend for the year of 6.5 pence per share, amounting to £560 million.
| Summarised cash flow statement |
| 2005 | 2004 | 2003 | ||||||||
| £m | £m | £m | ||||||||
| Net cash inflow from operating activities | 5,898 | 5,389 | 6,023 | |||||||
| Dividends from associates and joint ventures | 2 | 3 | 6 | |||||||
| Net cash outflow for returns on investments and servicing of finance | (878 | ) | (527 | ) | (1,506 | ) | ||||
| Taxation paid | (332 | ) | (317 | ) | (434 | ) | ||||
| Net cash outflow for capital expenditure and financial investment | (2,408 | ) | (2,477 | ) | (2,381 | ) | ||||
| Net cash (outflow) inflow for acquisitions and disposals | (418 | ) | (60 | ) | 2,842 | |||||
| Equity dividends paid | (784 | ) | (645 | ) | (367 | ) | ||||
| Cash inflow before management of liquid resources and financing | 1,080 | 1,366 | 4,183 | |||||||
| Management of liquid resources | 587 | 1,123 | (1,729 | ) | ||||||
| Net cash outflow from financing | (1,485 | ) | (2,445 | ) | (2,473 | ) | ||||
| Increase (decrease) in cash in the year | 182 | 44 | (19 | ) | ||||||
| Decrease in net debt in the year resulting from cash flows | 887 | 1,222 | 4,225 | |||||||
| 36 BT Group plc Annual Report and Form 20-F 2005 | Operating and financial review |
The net cash outflow for returns on investments and servicing of finance amounted to £878 million, £527 million and £1,506 million in the 2005, 2004 and 2003 financial years, respectively. The increased outflow of £351 million in the 2005 financial year reflects the receipt of £420 million of funds on restructuring part of the group’s swap portfolio in the 2004 financial year. This effect was offset by lower interest payments due to certain bonds maturing during the 2005 financial year. The reduction in the 2004 financial year outflow of £979 million includes the effect of the restructuring of the group’s swap portfolio. In addition, the 2003 financial year included the payment of a £293 million premium on closing out £2.6 billion of fixed interest rate swaps, following receipt of the Cegetel sale proceeds.
Tax paid in the 2005 financial year totalled £332 million compared with £317 million in the 2004 financial year and £434 million paid in the 2003 financial year. The lower tax paid in the 2005 and 2004 financial year reflects the lower current tax charge and the level of payments made on account.
The net cash outflow of £2,408 million for capital expenditure and financial investment in the 2005 financial year included £3,056 million of capital expenditure on property, plant and equipment, offset by £650 million received on the sale of fixed assets. In the 2004 financial year the net cash outflow of £2,477 million for capital expenditure and financial investment included £2,684 million of capital expenditure on property, plant and equipment, offset by £208 million received on the sale of fixed assets. Capital expenditure is higher than the 2004 financial year as a result of expenditure to support the rapid growth in broadband and the transformation of the group’s network. In the 2003 financial year the net cash outflow of £2,381 million for capital expenditure and financial investment included £2,580 million of capital expenditure on plant and equipment, offset by £200 million received on the sale of fixed assets.
The net cash outflow from acquisitions less disposals in the 2005 financial year totalled £418 million. The principal cash outflow for acquisitions was mainly due to the purchase of Infonet Services Corporation and Albacom SpA. The net cash outflow from acquisitions less disposals in the 2004 financial year totalled £60 million. The principal cash outflow for acquisitions was due to the purchase of a controlling interest in BT Expedite Limited (formerly NSB Retail plc) and Transcomm plc. In the 2003 financial year the net cash inflow from disposals less acquisitions totalled £2,842 million. Cash proceeds from disposals amounted to £2,919 million and principally comprised £2,603 million from the sale of the investment in Cegetel.
Equity dividends paid in the 2005 financial year totalled £784 million whilst those paid in the 2004 and 2003 financial years totalled £645 million and £367 million, respectively.
The resulting cash inflow for the 2005 financial year, before management of liquid resources and financing, of £1,080 million, together with inflows from current asset investments, were mainly applied to long term borrowing repayments of £1,297 million. The cash inflow for the 2004 financial year of £1,366 million was mainly applied in repaying long-term borrowings with total borrowings of £3,627 million being repaid. In addition, the group issued new loans of £1,326 million. The new loans included a US$172 million 0.75% exchangeable bond due in 2008, exchangeable into ordinary shares of LG Telecom, BT’s Korean based associate and a sale and leaseback of circuit switches which had no effect on net debt but increased gross debt and cash by around £1 billion. The cash inflow for the 2003 financial year of £4,183 million was applied in repaying short-term borrowings and investing in short-term investments, with total borrowings of £2,535 million being repaid.
The cash inflow for the 2005 financial year resulted in net debt reducing by a further £639 million to £7,786 million having reduced by £1,148 million to £8,425 million in the 2004 financial year.
During the 2005 financial year the group further restructured some of its swaps portfolio to mitigate credit risk to and with certain counterparties. As a result, the group terminated £2.9 billion of cross-currency and sterling interest rate swaps with some swaps being replaced with new swaps which had the same economic hedging effect. This resulted in the group paying £107 million in reducing gross debt and receiving a net £14 million of interest receipts. The group also restructured some of its swap portfolio during the 2004 financial year to mitigate credit risk to certain counterparties. As a result, the group terminated £7 billion of cross-currency interest rate swaps and replaced these with new swaps which had the same economic hedging effect. This resulted in the group paying £445 million in reducing gross debt and receiving £420 million of interest receipts. The interest receipts and payments on restructuring for the 2005 and 2004 financial years have been included within deferred income and other debtors, respectively on the balance sheet and will be amortised to the profit and loss account over the term of the underlying hedged debt.
During the 2005 financial year the share buyback programme continued with the group repurchasing 101 million shares for consideration of £195 million. During the 2004 financial year the group repurchased 81 million shares for consideration of £144 million.
The Board sets the treasury department’s policy and its activities are subject to a set of controls commensurate with the magnitude of the borrowings and investments under its management. Counterparty credit risk is closely monitored and managed within controls set by the Board. Derivative instruments, including forward foreign exchange contracts, are entered into for hedging purposes only.
We have set out further details on this topic and on our capital resources and foreign currency exposure in note 33 to the financial statements in compliance with FRS 13.
| Operating and financial review | BT Group plc Annual Report and Form 20-F 2005 37 |
Off-balance sheet arrangements |
| Operating leases (note 27) |
| Capital commitments and guarantees (note 27) |
| Derivative contracts (note 33) |
The directors have a reasonable expectation that the group has adequate resources to continue in operational existence for the foreseeable future and therefore they continue to adopt the going concern basis in preparing the financial statements.
There has been no significant change in the financial or trading position of the group since 31 March 2005.
The following table sets out the group’s contractual obligations and commitments as they fall due for payment, as at 31 March 2005.
| Payments due by period | ||||||||||||||||
| Contractual obligations and commitments | Total £m | Less than 1 year £m | 1-3 years £m | 3-5 years £m | More than 5 years £m | |||||||||||
| Loans and other borrowings | 11,596 | 4,197 | 1,071 | 352 | 5,976 | |||||||||||
| Finance lease obligations | 993 | 301 | 566 | 21 | 105 | |||||||||||
| Operating lease obligations | 10,457 | 375 | 752 | 743 | 8,587 | |||||||||||
| Capital commitments | 735 | 532 | 105 | 44 | 54 | |||||||||||
| Total | 23,781 | 5,405 | 2,494 | 1,160 | 14,722 | |||||||||||
At 31 March 2005, the group had cash and short-term investments of £4,803 million. At that date, £4,498 million of debt fell due for repayment in the 2006 financial year. The group had unused short-term bank facilities, amounting to approximately £145 million at 31 March 2005. These resources will allow the group to settle its obligations as they fall due.
At 31 March 2004, the group had cash and short-term investments of £5,272 million and unused short-term bank facilities amounting to approximately £145 million.
A 10% strengthening in sterling against major currencies would cause the group’s net assets at 31 March 2005 to fall by less than £150 million, with insignificant effect on the group’s profit. This compares with a fall of less than £120 million and £100 million in the years ended 31 March 2004 and 2003, respectively.
Foreign exchange contracts are entered into as a hedge of sales and purchases, accordingly a change in the fair value of the hedge is offset by a corresponding change in the value of the underlying sale or purchase.
The majority of the group’s long-term borrowings have been, and are, subject to fixed interest rates. The group has entered into interest rate swap agreements with commercial banks and other institutions to vary the amounts and period for which interest rates are fixed. At 31 March 2005, the group had outstanding interest rate swap agreements with notional principal amounts totalling £5,297 million compared to £5,210 million at 31 March 2004.
The long-term debt instruments which BT issued in December 2000 and February 2001 both contained covenants providing that if the BT group credit rating were downgraded below A3 in the case of Moody’s or below A minus in the case of Standard & Poor’s (S&P), additional interest would accrue from the next interest coupon period at the rate of 0.25 percentage points for each ratings category adjustment by each ratings agency. In May 2001, Moody’s downgraded BT’s credit rating to Baa1, which increased BT’s annual interest charge by approximately £32 million. BT’s credit rating from S&P is A minus. Based upon the total amount of debt of £9 billion outstanding on these instruments at 31 March 2005, BT’s annual interest charge would increase by approximately £26 million if BT’s credit rating were to be downgraded by one credit rating category by both agencies below a long-term debt rating of Baa1/ A minus. If BT’s credit rating with Moody’s was to be upgraded by one credit rating category the annual interest charge would be reduced by approximately £13 million.
Based upon the composition of net debt at 31 March 2005, a one percentage point increase in interest rates would increase the group’s annual net interest expense by less than £10 million. This compares with an increase of less than £15 million and less than £10 million in the years ended 31 March 2004 and 2003, respectively.
| 38 BT Group plc Annual Report and Form 20-F 2005 | Operating and financial review |
Contracts placed for ongoing capital expenditure totalled £735 million at 31 March 2005. 21CN is being developed using stringent capital return criteria and a rigorous approach to any investment in the narrowband network. 21CN aims to deliver long term, structural cost reduction, as we progressively migrate onto a simpler, lower cost network architecture. BT expects that future capital expenditure will be funded from net cash inflows from operating activities, and, if required, by external financing.
BT Group plc, the parent company, had reserves of £9,096 million at 31 March 2005 and £9,585 million at 31 March 2004.
BT’s fixed assets totalled £16,654 million at 31 March 2005 of which £15,916 million were tangible assets, principally forming the UK fixed network. At 31 March 2004 fixed assets were £16,015 million and tangible assets were £15,487 million.
The group’s ordinary contribution rate increased to 12.2% of employees’ pensionable pay with effect from April 2003. The contribution rate was 11.6% for the 2003 financial year. In addition, the company agreed to make annual deficiency contributions to the BTPS of £232 million with effect from the 2004 financial year. In the 2005 financial year no deficiency payments were made. This was because in the 2004 financial year total deficiency contributions of £612 million were made, including early payment of £380 million scheduled for payment in the 2005 and 2006 financial years. This compares to the £200 million annual deficiency payments made in the 2003 financial year. The group is also required to pay special contributions to cover costs arising from enhanced pension benefits provided to leavers. The special contributions paid in the 2005, 2004 and 2003 financial years amounted to £6 million, £130 million and £129 million, respectively, in respect of early leavers. The payment expected to be made in the 2006 financial year is £nil in relation to leavers in the calendar year ended 31 December 2004.
The group continues to account for pension costs in accordance with UK Statement of Standard Accounting Practice No. 24 (SSAP 24). The group’s total annual pension charges for the 2005, 2004 and 2003 financial years were £465 million, £404 million and £322 million, respectively. This includes £430 million, £376 million and £306 million, respectively, in relation to the BTPS. The increase in the pension charge in the 2005 financial year reflects the introduction of Smart Pensions, a salary sacrifice scheme, as a result of which there is a switch between wages and salaries and pension charges. The 2005 and 2004 financial years include a £154 million amortisation charge for the pension deficit partly offset by a reduction in the number of active members and the interest credit related to the balance sheet prepayment.
The profit and loss charge for providing incremental pension benefits for leavers amounted to £nil, £1 million and £60 million in the 2005, 2004 and 2003 financial years, respectively.
The pension charge for the 2005 and 2004 financial years is based upon the SSAP 24 valuation as at 31 March 2003. This valuation is based on the December 2002 funding valuation, rolled forward to 31 March 2003, and uses a slightly higher investment return assumption than was used for the trustees’ funding valuation, a lower inflation rate and lower salary increase assumptions. The resulting SSAP 24 deficit amounts to £1.4 billion. The
| Operating and financial review | BT Group plc Annual Report and Form 20-F 2005 39 |
The full FRS 17 disclosures are provided in the notes to the financial statements. At 31 March 2005 the FRS 17 deficit was £3.3 billion, net of tax, being a £0.3 billion reduction from £3.6 billion at 31 March 2004.
The number of retired members and other current beneficiaries in the pension fund has been increasing in recent years and, at 31 December 2004, was approximately 122% higher than the number of active members. Consequently, BT’s future pension costs and contributions will depend on the investment returns of the pension fund and could fluctuate in the medium term.
The BTPS was closed to new entrants on 31 March 2001 and we launched a new defined contribution pension scheme for people joining BT after that date which is to provide benefits based on the employees’ and the employing company’s contributions. This change is in line with the practice increasingly adopted by major UK groups and is designed to be more flexible for employees and enable the group to determine its pension costs more precisely than is the case for defined benefit schemes. The financial impact of this change was not significant in the financial years under review and is not expected to be significant in the next few years but it should reduce pension costs in the longer term.
We, in common with virtually all other companies, need to use estimates in the preparation of our financial statements. The most sensitive estimates affecting our financial statements are in the areas of assessing the level of interconnect income with and payments to other telecommunications operators, providing for doubtful debts, establishing fixed asset lives for depreciation purposes, assessing the stage of completion and likely outcome under long term contracts, making appropriate long-term assumptions in calculating pension liabilities and costs, making appropriate medium-term assumptions on asset impairment reviews and calculating current tax liabilities on our profits.
We are required to interconnect our networks with other telecommunications operators. In certain instances we rely on other operators to measure the traffic flows interconnecting with our networks. We use estimates in these cases to determine the amount of income receivable from or payments we need to make to these other operators. The prices at which these services are charged are often regulated and are subject to retrospective adjustment. We use estimates in assessing the likely effect of these adjustments.
We provide services to over 20 million individuals and businesses, mainly on credit terms. We know that certain debts due to us will not be paid through the default of a small number of our customers. We use estimates, based on our historical experience, in determining the level of debts that we believe will not be collected. These estimates include such factors as the current state of the UK economy and particular industry issues.
The plant and equipment used in our networks is long-lived with cables and switching equipment operating for over ten years and underground ducts being used for decades. The annual depreciation charge is sensitive to the estimated service lives we allocate to each type of asset. We regularly review these asset lives and change them when necessary to reflect current thinking on their remaining lives in light of technological change, prospective economic utilisation and physical condition of the assets concerned.
As part of the property rationalisation programme we have identified a number of properties that are surplus to requirements. Although efforts are being made to sub-let this space it is recognised by management that this may not be possible immediately in the current economic environment. Estimates have been made of the cost of vacant possession and any shortfall arising from the sub lease rental income being lower than the lease costs being borne by BT.
We enter into long term customer contracts which can extend over a number of financial years. During the
| 40 BT Group plc Annual Report and Form 20-F 2005 | Operating and financial review |
We have a commitment, mainly through the BT Pension Scheme, to pay pension benefits to approximately 357,000 people over more than 60 years. The cost of these benefits and the present value of our pension liabilities depend on such factors as the life expectancy of the members, the salary progression of our current employees, the return that the pension fund assets will generate in the time before they are used to fund the pension payments and the discount rate at which the future pension payments are discounted. We use estimates for all these factors in determining the pension costs and liabilities incorporated in our financial statements.
The actual tax we pay on our profits is determined according to complex tax laws and regulations. Where the effect of these laws and regulations is unclear, we use estimates in determining the liability for the tax to be paid on our past profits which we recognise in our financial statements.
The group started its IFRS transition project in 2003. The project team is overseen by the Group Finance Director and regular updates have been provided to the Audit Committee. The project has involved a detailed assessment of the impact of IFRS on BT’s accounting policies and reported results; system changes to capture additional data; training of staff and communications. As part of the transition to IFRS, in March 2005, we presented on our investor relations website our view of the pro forma financial impact of adopting IFRS for the 2004 financial year.
BT continues to report under UK Generally Accepted Accounting Principles (UK GAAP) for the 2005 financial year, but will be presenting financial information in accordance with IFRS for each quarter and the year ending 31 March 2006.
The following provides additional information on the unaudited pro forma impact of IFRS in advance of the publication of the first IFRS results, and the material changes to BT’s accounting policies used to prepare the financial results for 2005 financial year.
Whilst some of the changes required by IFRS will impact BT’s reported profits and net assets this has no impact on the cash flows generated by the business or the cash resources available for investment or distribution to shareholders. Furthermore the adoption of IFRS does not affect BT’s strategy or underlying business performance.
It is important to note that the IFRS position as stated is BT’s current view based on the financial reporting standards currently in issue and changes may arise as new accounting pronouncements are developed and issued. Due to a number of new and revised Standards included within the body of Standards that comprise IFRS, there is not yet a significant body of established practice on which to draw in forming opinions regarding interpretation and application. Accordingly, practice is continuing to evolve. At this stage, therefore, the full financial effect of reporting under IFRS, as it will be applied and reported in the group’s first IFRS financial statements, may be subject to change.
We estimate that the pro forma impact of adopting IFRS on the reported UK GAAP results for the 2005 financial year would have been negligible on the underlying earnings, being the profit before goodwill amortisation, exceptional items and tax and the earnings per share before goodwill amortisation and exceptional items. However, due to the inherent volatilities introduced by IFRS, no such statement can be made in respect of future years. These estimates exclude the mark to market effects of IAS 39 ‘Financial Instruments: Recognition and Measurement’ which we are not required to apply until 1 April 2005.
Pensions |
On adoption of IAS 19 the deficit/surplus of defined benefit pension schemes will be recognised on balance sheet. The amended version of IAS 19, which is subject to EU approval, allows companies to choose to recognise actuarial gains and losses immediately in reserves or alternatively to be held on the balance sheet and released to the income statement over a period of time. BT has elected to early adopt the amended version of IAS 19 and reflect the impact of actuarial gains and losses immediately in reserves.
The income statement charge is split between an operating charge and a net finance charge. The net finance charge relates to the unwinding of the discount applied to the liabilities of the scheme offset by the expected return on the assets of the scheme, based on conditions prevailing at the start of the year.
Under SSAP 24, the asset on the balance sheet represents the timing differences between the pension charge to the profit and loss account and the payments made to the pension scheme. Under IFRS, the liability/asset on the balance sheet represents the deficit/surplus in the pension scheme. The scheme assets are valued at market value and the liabilities are discounted using a high quality corporate bond rate.
Under SSAP 24, a pension charge for the 2005 financial year of £465 million, including a charge for the amortisation of the SSAP 24 deficit in the BT Pension Scheme, and an interest credit relating to the balance sheet prepayment was recognised. Under IFRS the estimated total charge of £342 million is split between an operating charge of £540 million and a net finance interest income of £198 million. Accordingly there is an additional £75 million charge to operating profit and a net finance income of £198 million under IFRS.
| Operating and financial review | BT Group plc Annual Report and Form 20-F 2005 41 |
Share-based payment |
Under IFRS 2 ‘Share-based payment’, an expense is recognised in the income statement for all share-based payments (both awards of options and awards of shares). This expense is based on the fair value at the date of grant of the award, using option pricing models, and is charged over the related vesting period.
The accounting rules of IFRS 2 will result in an estimated operating charge for the 2005 financial year of £39 million, which is offset by the reversal of the UK GAAP charge of £11 million. The majority of this IFRS charge relates to the group’s all employee Save As You Earn schemes. There is a related tax credit of £9 million, offset by the reversal of the UK GAAP tax credit of £3 million. The credit for the share based payments is recognised directly in reserves as the awards are equity settled.
Goodwill and other intangible assets |
IAS 38 ‘Intangible assets’ requires other intangible assets arising on acquisitions after the transition date to be separately identified and amortised over their useful economic life, often a shorter period than for goodwill. As a result, intangible assets such as customer relationships and trademarks, need to be separately valued and recognised on business combinations, and then amortised over their useful economic lives.
The goodwill amortisation charged in 2005 financial year of £16 million under UK GAAP will be reversed. During the year BT has undertaken a number of acquisitions, detailed in note 15 to the accounts.
Events after the balance sheet date |
The final dividend creditor of £551 million for the 2005 financial year will be reversed as it was not declared at 31 March 2005.
Foreign exchange |
In the 2005 financial year a consolidated foreign exchange gain of £4 million, which was taken directly to the profit and loss reserve under UK GAAP, is reversed into operating profit.
Lease accounting |
The profit before tax for the 2005 financial year will be reduced by approximately £3 million, as a result of the recognition of depreciation and finance lease interest charges and the removal of the UK GAAP operating lease charges for the properties reclassified as finance leases. The charge for the 2005 financial year will also reduce by approximately £101 million due to operating lease charges being recognised on a straight line basis.
Other adjustments |
| (i) | Computer software that is not an integral part of hardware is treated as an intangible asset. Under UK GAAP, the group’s policy was to categorise all capitalised software as tangible fixed assets. This will result in a balance sheet reclassification. |
| (ii) | Deferred tax assets and deferred tax liabilities are required to be shown separately on the face of the balance sheet. Under UK GAAP the net deferred tax liability was shown within provisions. This will result in £1,660 million being reclassified to deferred tax assets leaving £1,941 million as deferred tax liabilities. |
| (iii) | Liquid investments with maturities of less than three months at acquisition are included within cash and cash equivalents rather than current asset investments resulting in a reclassification. |
| (iv) | Cash flow statements under IFRS have a different presentational format although the underlying cash flows remain unchanged. |
Financial instruments |
| 42 BT Group plc Annual Report and Form 20-F 2005 | Operating and financial review |
The fair value of derivative financial instruments, existing at 1 April 2005, will be included on the balance sheet at fair value. Future market interest rate and currency movements will give rise to adjustments to these fair values. Where hedge accounting cannot be applied under the prescriptive rules of IAS 39, changes in market values of financial instruments will impact the profit and loss account. We expect group reserves at 1 April 2005 to be approximately £500 million lower under IFRS, than under UK GAAP, as a result of adopting IAS 39.
The group will present a reconciliation between the closing 31 March 2005 UK GAAP equity and opening 1 April 2005 IFRS equity when the first IFRS results are announced for the first quarter to 30 June 2005.
In December 2004, the FASB issued Statement of Financial Accounting Standards No. 123R (SFAS 123R) ‘Share-Based Payment’ which revises SFAS 123 and supersedes APB 25. SFAS 123R requires that the cost of all share-based payment transactions be recognised in the financial statements. SFAS 123R also establishes fair value as the measurement method in accounting for share-based payments to employees. BT adopted SFAS 123R on 1 April 2005 using the modified prospective transition method. BT estimates the application of the expensing provisions of SFAS 123R will result in a pre-tax expense of approximately £45 million in the 2006 financial year subject to additional grants and awards.
In December 2004, the FASB issued Statement of Financial Accounting Standards No. 153 (SFAS 153) ‘Exchanges of Non-monetary Assets – an amendment of APB Opinion No. 29’. SFAS 153 addresses the measurement of exchanges of non-monetary assets. It eliminates the exception from fair value measurement for non-monetary exchanges of similar productive assets in paragraph 21(b) of APB Opinion No. 29 ‘Accounting for Non-monetary Transactions’ and replaces it with an exception for exchanges that do not have commercial substance. A non-monetary exchange has commercial substance if the future cash flows of the entity are expected to change significantly as a result of the exchange. As required by SFAS 153, we will adopt this new accounting standard effective July 1, 2005. The adoption of SFAS 153 is not expected to have a material impact on our financial position, results of operations or cash flows.
In November 2004, the FASB issued Statement of Financial Accounting Standards No. 151 (SFAS 151), ‘Inventory Costs – an amendment of ARB No. 43, Chapter 4’, which clarifies that abnormal amounts of idle facility expense, freight, handling costs, and wasted material (spoilage) should be recognised as a current period expense. In addition, SFAS 151 requires that allocation of fixed production overhead to the costs of conversion be based on the normal capacity of the production facilities. SFAS 151 is effective for fiscal years beginning after June 15, 2005. BT does not believe that the implementation of this standard will have a material impact on its financial position, results of operations or cash flows.
In September 2004, the EITF reached a consensus on EITF Issue No. 02-14 ‘Whether an Investor Should Apply the Equity Method of Accounting to Investments Other Than Common Stock’, in which the Task Force reached the consensus that an investor that has the ability to exercise significant influence over the operating and financial policies of the investee should apply the equity method of accounting when it has an investment in common stock and/or an investment that is in-substance common stock. The consensus of this EITF is to be applied in reporting periods beginning after September 15, 2004. We do not believe the adoption of this standard will have a material impact on our financial position, results of operations or cash flows.
In October 2004, the EITF reached a consensus on Issue No. 04-1 ‘Accounting for Pre-existing Relationships between the Parties to a Business Combination’ (EITF 04-1). EITF 04-1 addresses the accounting treatment of pre-existing relationships between the parties of a business combination. The consensus of EITF 04-1 should be applied to business combinations consummated and goodwill impairment tests performed in reporting periods beginning after the FASB ratified the consensus at its October 13, 2004 meeting. The group will adopt the provisions of EITF 04-1 as of April 1, 2005. If it is determined that assets of an acquired entity are related to a pre-existing contractual relationship, thus requiring accounting separate from the business combination, BT will evaluate whether the acquiring entity of the group should recognise contractual relationships as assets separate from goodwill in that business combination.
In March 2004, the EITF reached a consensus on EITF Issue No. 03-1, ‘The Meaning of Other-Than-Temporary Impairment and Its Application to Certain Investments’ (EITF 03-1). The guidance prescribed a three-step model for determining whether an investment is other-than-temporarily impaired and requires disclosure for unrealized losses on investments. In September 2004, the FASB issued FASB Staff Position EITF 03-1-1 ‘Effective Date of Paragraphs 10-20 of EITF Issue No. 03-1’ (FSP EITF 03-1-1). FSP EITF 03-1-1 delays the effective date for the measurement and recognition guidance contained in paragraphs 10-20 of EITF 03-1. The disclosure requirements of EITF 03-1 remain effective for fiscal years ending after June 15, 2004. No effective date for the measurement and recognition guidance has been established in FSP EITF 03-1-1. During the period of delay, FSP EITF 03-1-1 states that companies should continue to apply current guidance to determine if an impairment is other-than-temporary. The adoption of EITF 03-1, excluding paragraphs 10-20, did not impact the group’s consolidated financial position, results of operations or cash flows. The group will assess the impact of paragraphs 10-20 of EITF 03-1 once the guidance has been finalised.
| Operating and financial review | BT Group plc Annual Report and Form 20-F 2005 43 |
Our commitment to society
Corporate social responsibility (CSR) |
The Dow Jones Sustainability Indexes rank companies for their success in managing social, ethical and environmental factors for competitive advantage. During the 2005 financial year, BT was ranked as the top telecommunications company in the Dow Jones Sustainability Index for the fourth year in a row.
We also hold the Queen’s Award for Enterprise in recognition of our contribution to sustainable development.
This section of the report, together with the broad statement on social, environmental and ethical matters included in the section on Corporate governance, provides information in response to the Association of British Insurers’ disclosure guidelines on social responsibility.
More detailed disclosures on BT’s implementation of social, ethical and environmental policies and procedures are available online in our independently-verified social and environmental report, which has been prepared in accordance with the 2002 Global Reporting Initiative (GRI) sustainability reporting guidelines.
CSR governance |
A Board committee – the Community Support Committee – oversees community, charitable and arts expenditure and the strategy for maximising our contribution to society. The committee, chaired by Sir Christopher Bland, consists of representatives from BT businesses, two non-executive directors and two external independent members, who have a reputation for excellence in this field.
An executive committee, the Corporate Social Responsibility Steering Group (CSRSG), oversees the implementation of our CSR strategy and programme. This includes risk assessment, target and objective setting, ISO 14001 certification – the international standard for environmental management systems – and public accountability.
The CSRSG consists of CSR champions nominated by the lines of business and seven support functions (human resources, corporate governance, health and safety, group property, communications, internal audit and procurement).
The CSRSG is chaired by BT’s CSR champion, Alison Ritchie, Chief Broadband Officer and a member of the Operating Committee. It is supported by advice from an independent panel of CSR experts.
Embedding CSR into BT’s commercial operations is an important part of our CSR strategy, and a key part of our work in the 2005 financial year has been extending our CSR activity into our global operations. We have carried out a number of ‘health checks’ in our commercial operations to identify specific social, economic and environmental impacts (positive and negative) and particular CSR risks and opportunities. A report is then compiled which includes recommended actions.
We have important relationships with a wide range of stakeholders, including employees, customers and suppliers. We engage with these stakeholders in a number of ways, including consumer liaison panels, an annual employee survey and a supplier relationship management programme.
Our CSR team co-ordinates and monitors CSR performance, identifies potential issues and opportunities that might affect the business, and supports BT’s commercial activities.
As part of our CSR performance measurement, we have 12 non-financial KPIs (key performance indicators) which provide a comprehensive overview of BT’s social and environmental performance. Our performance against these is published in our annual Social and Environmental report.
Social, environmental and ethical risks |
In the context of CSR, our most significant risks are:
| supply chain working conditions; |
| health and safety; |
| climate change; |
| diversity; |
| offshoring or the ‘geography of jobs’; |
| breach of the code of business ethics; and |
| privacy. |
CSR business opportunities |
This underlines how important it is not only to protect our reputation through appropriate risk management activities, but also to enhance it through our community activities.
Long-term sustainability trends are creating market opportunities for us, such as the use of teleconferencing and flexible working to reduce the need to travel and provide more flexible lifestyles.
Increasingly, BT has to address social and environmental matters when bidding for business. In the 2005 financial year, bids to the value of £2.2 billion required us to demonstrate expertise in managing these issues.
Environment |
BT is one of the largest consumers of industrial and commercial electricity in the UK, and the growth of broadband has, as expected, increased our electricity use. In the 2005 financial year, our usage increased by 3.1%. However, we also signed the world’s largest green energy contract which means that almost all of BT’s UK electricity needs will be met from environmentally-friendly
| 44 BT Group plc Annual Report and Form 20-F 2005 | Operating and financial review |
CO2 emissions |
| 2005 | 2004 | 2003 | 2002 | ||||||||||
| Total (UK only; million tonnes) | 0.76 | 0.92 | 0.96 | 1.03 | |||||||||
| % below 1996 | 53% | 42% | 40% | 36% | |||||||||
| Tonnes per £1m turnover | 41 | 50 | 51 | 56 | |||||||||
During the 2005 financial year, we received an income of £3 million from our recycling activities, offset against the £7 million we spent managing our waste contracts, recycling our waste and sending waste to landfill.
Waste |
| 2005 | 2004 | 2003 | 2002 | ||||||||||
| Total waste (tonnes) | 110,622 | 107,303 | 117,688 | 114,999 | |||||||||
| Total waste recycled (tonnes) | 37,421 | 27,626 | 27,809 | 24,099 | |||||||||
| % Recycled | 34% | 26% | 24% | 21% | |||||||||
During the 2005 financial year, we reduced our commercial fleet – still one of the largest in the UK – by 2% and our fuel consumption by 3.5%.
Transport |
| 2005 | 2004 | 2003 | 2002 | ||||||||||
| Number of vehicles (UK only) | 31,969 | 32,663 | 33,979 | 37,509 | |||||||||
| Fuel consumption (million litres) | 51.97 | 53.85 | 56.12 | 62.76 | |||||||||
Digital inclusion |
Our involvement in the EverybodyOnline programme, established in partnership with charity campaign group Citizens Online, continues to be a key part of our digital inclusion campaign. The campaign aims to increase skills and access to communications technology in deprived communities and to increase the understanding of the causes and effects of the digital divide and how they can be addressed at a national level.
Community |
The focus of our community programmes is on big issues where better communication can make a real difference to society. For example, more than 10,500 schools and over two million young people have taken part in the BT Education Programme – a drama-based campaign helping children to improve their communication skills. This activity is supported by our volunteering programme which has several thousand registered volunteers working with schools.
ChildLine, a UK charity, answers 2,300 calls every day but many hundreds more go unanswered. We are working with ChildLine on a campaign to ensure that every child’s call for help is answered.
In addition, BT people gave £2 million directly to charities during the 2005 financial year through Give as you Earn, to which BT added a direct contribution of £1 million.
Tsunami response |
Disability services |
For people with hearing or speech impairments, for example, our textphone offers easy access to BT TextDirect – the service that enables users to dial direct to other text or voice users. Customers with visual or mobility impairments benefit from products with large, clear keypads and cordless or hands- free options. During the 2005 financial year, we also launched Relate 3000, an inclusively designed phone and our new BT Text service, which includes a speaking SMS facility.
| Operating and financial review | BT Group plc Annual Report and Form 20-F 2005 45 |
Board of directors and Operating Committee
Board of directors |
Sir Christopher Bland Chairmand,e,f |
He was chairman of the BBC Board of Governors from 1 April 1996 until 30 September 2001. From 1972 to 1979, Sir Christopher was deputy chairman of the Independent Broadcasting Authority and chairman of its Complaints Review Board. In 1982, he became a non-executive director of LWT Holdings and was chairman from 1983 to 1994, when LWT was acquired by Granada Group. From December 1994 to May 2000, he was chairman of NFC. From 1977 to 1985, he was chairman of Sir Joseph Causton & Sons.
Sir Christopher, who was chairman of the Hammersmith and Queen Charlotte’s Hospitals Special Health Authority from 1982 to 1994 and of Hammersmith Hospital’s NHS Trust from 1994 to February 1997, was knighted for his work in the NHS in 1993. He was chairman of the Private Finance Panel from 1995 to 1996 and a member of the Prime Minister’s Advisory Panel on the Citizen’s Charter. He is Senior Adviser at Warburg Pincus and chairman of the Royal Shakespeare Company. Aged 66.
Executive directors |
Ben Verwaayen Chief Executivea |
Ben Verwaayen was formerly vice chairman of the management board of Lucent Technologies in the USA from October 1999. He joined Lucent in September 1997 as executive vice president international and became chief operating officer the following month. Prior to joining Lucent, Ben Verwaayen worked for KPN in the Netherlands for nine years as president and managing director of its telecoms subsidiary, PTT Telecom. From 1975 to 1988, he worked for ITT in Europe. He is a non-executive director of UPS. A Dutch national, he is aged 53.
Hanif Lalani Group Finance Directora,f |
Ian Livingston Chief Executive, BT Retaila |
Andy Green Chief Executive, BT Global Servicesa |
Dr Paul Reynolds Chief Executive, BT Wholesalea |
Non-Executive directors |
Clayton Brendishb,e |
Sir Anthony Greener Deputy Chairmanb,c,d |
Sir Anthony is chairman of the Qualifications and Curriculum Authority. He was formerly chairman of Diageo. Prior to the merger of Guinness and Grand Metropolitan, he was chairman and chief executive of Guinness, having been chief executive of Guinness since 1992. Aged 64.
Louis R Hughesb,c |
Louis Hughes is a non-executive director of AB Electrolux (Sweden) and Sulzer AG and ABB Limited (both Switzerland). From 1993 to 2000, he was a member of the supervisory board of Deutsche Bank. Louis Hughes was granted unpaid leave of absence by the Board from 1 September 2004 to 30 June 2005 to lead the civil reconstruction effort for the US Government in Afghanistan. A US national, he is aged 56.
| 46 BT Group plc Annual Report and Form 20-F 2005 |
The Rt Hon Baroness Jay of Paddington PCc,e |
Baroness Jay has held non-executive positions with Scottish Power, Carlton Television and LBC. She has been a member of the Central Research and Development Committee for the NHS, was a founding director of the National AIDS Trust, a governor of South Bank University and a member of the Meteorological Office Council. She is currently chairman of the Overseas Development Institute, a non-executive director of Independent News & Media and a member of its International Advisory Board, and a member of the Committee on Standards in Public Life. Aged 65.
John Nelsonb,d,f |
Prior to joining CSFB in January 1999, John Nelson spent 13 years with Lazard Brothers. He was appointed vice chairman of Lazard Brothers in 1990. He was also a chairman of Lazard S.p.A. in Italy and a managing director of Lazard Freres, New York.
He was a non-executive director of Woolwich until it was taken over by Barclays Bank in 2000. He is deputy chairman of Kingfisher and a non-executive director of Hammerson, of which he will become chairman in September 2005. Aged 57.
Carl G Symonb,c |
Carl Symon is chairman of a number of private companies and a non-executive director of Rolls-Royce and Rexam. A US national, he is aged 59.
Maarten van den Berghb,c,d,f |
Prior to his retirement in July 2000, Maarten van den Bergh was president of the Royal Dutch Petroleum Company and vice chairman of its committee of managing directors from July 1998, having been appointed a managing director of the Royal Dutch Shell Group of companies in July 1992. A Dutch national, he is aged 63.
Operating Committee |
Ben Verwaayen Chief Executive |
Hanif Lalani Group Finance Director |
Ian Livingston Chief Executive, BT Retail |
Andy Green Chief Executive, BT Global Services |
Dr Paul Reynolds Chief Executive, BT Wholesale |
Alison Ritchiea,e |
Alison Ritchie was appointed Chief Broadband Officer in November 2002. She directs and champions the transformation of BT from a narrowband to a broadband company, and the delivery of high quality broadband services to residential, business and wholesale customers. Alison Ritchie was formerly Chief Executive, BT Openworld. Before joining BT Openworld, she was BT’s Restructuring Project Director, co-ordinating the project teams working on the financial, organisational and managerial restructuring of BT. She is a member of the board of the British Quality Foundation and a non-executive director of Roffey Park Institute. Aged 44.
Company Secretary |
Larry Stonee |
Key to membership of principal Board committees:
| a | Operating |
| b | Audit |
| c | Remuneration |
| d | Nominating |
| e | Community Support |
| f | Pension Scheme Performance Review Group |
| Board of directors and Operating Committee | BT Group plc Annual Report and Form 20-F 2005 47 |
Report of the directors
Directors |
In accordance with the articles of association, Hanif Lalani, having been appointed as a director by the Board, retires at the forthcoming annual general meeting (AGM) and will be proposed for election. Ben Verwaayen, Paul Reynolds, Carl Symon and Baroness Jay retire by rotation and will be proposed for re-election. Details of these directors’ contracts of appointment are included in the Report on directors’ remuneration on pages 56 to 68 and the discussion on Corporate governance on pages 50 to 55.
Substantial shareholdings |
Interest of management in certain transactions |
During and at the end of the 2005 financial year, none of the company’s directors was materially interested in any material transaction in relation to the group’s business and none is materially interested in any presently proposed material transactions.
| 48 BT Group plc Annual Report and Form 20-F 2005 |
Larry Stone
Secretary
18 May 2005
Registered office: 81 Newgate Street, London EC1A 7AJ
Registered in England and Wales No. 4190816
| Report of the directors | BT Group plc Annual Report and Form 20-F 2005 49 |
Corporate governance
The directors consider that BT has, throughout the year, complied with the provisions set out in section 1 of the 2003 Combined Code on Corporate Governance.
The Board |
Composition and role |
The Board’s principal focus is the overall strategic direction, development and control of the group. In support of this the Board approves the group’s values, business practice policies, strategic plans, annual budget, capital expenditure and investments budgets, larger capital expenditure proposals and the group’s overall system of internal controls, governance and compliance authorities. It also has oversight and control of the group’s operating and financial performance. These responsibilities are set out in a formal statement of the Board’s role. The Board has agreed the group’s corporate governance framework, including empowering the company’s key management committee, the Operating Committee, to make decisions on operational and other matters. The roles and powers of this committee are set out later in this report under Principal Board committees. Their powers and the authorities delegated to individual members of the Operating Committee are available to everyone in the group on the group’s intranet site.
Historically the Board has met every month, except in August. Additionally, it meets on an ad hoc basis to consider matters which are time critical. The Board met 14 times during the 2005 financial year. For the 2006 financial year, and going forward, the standard Board cycle will be nine, not 11, meetings each year.
The roles of the Chairman and the Chief Executive are separate. They are set out in written job descriptions, approved by the Nominating Committee. In addition to chairing the Board, the Chairman is responsible for consulting the non-executive directors, particularly the Deputy Chairman, on corporate governance issues, matters considered by the Nominating Committee, which the Chairman chairs, and the individual performances of the non-executive directors. The Chairman and the non-executive directors hold regular dinners at which they discuss matters without the executive directors being present. With the Chief Executive and the Secretary, the Chairman ensures the Board is kept properly informed, is consulted on all issues reserved to it and that its decisions are made in a timely and considered way that enables the directors to fulfil their fiduciary duties. The Chairman ensures that the views of the shareholders are known to the Board and considered appropriately. He represents the company in specified strategic and Government relationships, as agreed with the Chief Executive, and generally acts as the bridge between the Board and the Company’s executive team, particularly on the Group’s broad strategic direction. The Chief Executive has final executive responsibility to the Board for the success of the group. The Chairman’s other current significant commitments are shown in his biography on page 46. During the 2005 financial year the only change has been his appointment as Chairman of the Royal Shakespeare Company.
The Secretary manages the provision of timely, accurate and considered information to the Board for its meetings and, in consultation with the Chairman and Chief Executive, at other appropriate times. He recommends to the Chairman and the Chief Executive, for Board consideration where appropriate, the company’s corporate governance policies and practices and is responsible for their communication and implementation. The appointment and removal of the Secretary is a matter for the whole Board. He advises the Board on appropriate procedures for the management of its meetings and duties (and the meetings of the company’s principal committees), as well as the implementation of corporate governance and compliance within the group.
BT’s non-executive directors |
The non-executive directors provide a strong, independent element on the Board. Between them, they bring experience and independent judgement, gained at the most senior levels, of international business operations and strategy, marketing, technology, communications and political and international affairs.
Sir Anthony Greener, the Deputy Chairman, is the senior independent director. He chairs the Audit and Remuneration committees. In his capacity as the chairman of the Remuneration Committee, he meets with BT’s major institutional shareholders. The Deputy Chairman also continues to be available to discuss matters with institutional shareholders where it would be inappropriate for those discussions to take place with either the Chairman or the Chief Executive. He will also attend, at his discretion and in consultation with the Chairman and the Chief Executive, other meetings with shareholders during the year. The other non-executive directors may attend, at their request, meetings with the company’s major shareholders and others.
Non-executive directors are appointed initially for three years, subject to three months’ termination notice from either BT or the director. At the end of the first three years the appointment may be continued by mutual agreement. Each non-executive director is provided, upon appointment, with a letter setting out the terms of his or her appointment, including membership of Board committees, the fees to be paid and the time commitment expected from the director. The letter also covers such matters as the confidentiality of information and the company’s share dealing code.
| 50 BT Group plc Annual Report and Form 20-F 2005 |
Election and re-election |
Service agreements |
Independent advice |
Training and information |
Guidelines are in place concerning the content, presentation and delivery of papers for each Board meeting, so that the directors have enough information to be properly briefed sufficiently far ahead of each Board meeting and at other appropriate times.
Board evaluation |
Directors’ and officers’ liability insurance and indemnity |
Principal Board committees |
Audit Committee |
The Committee recommends the appointment and reappointment of the company’s external auditors and considers their resignation or dismissal, recommending to the Board appropriate action to appoint new auditors. It ensures that key partners are rotated at appropriate intervals. It discusses with the auditors the scope of their audits before they commence, reviews the results and considers the formal reports of the auditors and reports the results of those reviews to the Board. It reviews the auditors’ performance, including the scope of the audit, and recommends to the Board appropriate remuneration.
| Corporate governance | BT Group plc Annual Report and Form 20-F 2005 51 |
The Audit Committee reviews the company’s published financial results, the Annual Report and Form 20-F and other published information for statutory and regulatory compliance. It reports its views to the Board to assist it in its approval of the results’ announcements and the Annual Report and Form 20-F. The Committee also reviews the disclosure made by the Chief Executive and Group Finance Director during the certification process for the annual report about the design or operation of internal controls or material weaknesses in the controls, including any fraud involving management or other employees who have a significant role in the company’s financial controls. The Board, as required by UK law, takes responsibility for all disclosures in the annual report.
The Audit Committee monitors and reviews the standards of risk management and internal control, the effectiveness of internal control, financial reporting, accounting policies and procedures, and the company’s statements on internal controls before they are agreed by the Board for each year’s annual report. It also reviews the company’s internal audit function and its relationship with the external auditors, including internal audit’s plans and performance. It reviews the arrangements for dealing, in confidence, with complaints from employees about accounting or financial management impropriety, fraud, poor business practices and other matters. At each of its meetings it reviews with the group chief internal auditor and appropriate executives the implementation and effectiveness of key operational and functional change and remedial programmes. The Committee also sets aside time at every meeting to seek the views of the company’s internal and external auditors in the absence of executives.
In addition to carrying out those regular tasks which are within the Committee’s terms of reference and which are described above, it has also carried out its annual consideration of the group’s risk register, as submitted to it by the Operating Committee, and reviewed the company’s system of internal control, its accounting systems, IT security and fraud and related matters. It also considered the effect on the company’s results of the introduction of international financial reporting standards, which have applied to the company’s results from the financial year beginning on 1 April 2005. The Committee has also reviewed at each of its meetings during the 2005 financial year the steps being taken within the group with regard to the application of the Sarbanes-Oxley Act dealing with the internal control over financial reporting. It also specifically evaluated its performance and processes and has reviewed the experience, skills and succession planning within the Group’s finance function.
The Group Finance Director, the Secretary, the group’s chief internal auditor and the company’s external auditors attend the Committee’s meetings. The Committee met four times during the 2005 financial year.
Remuneration Committee |
Nominating Committee |
| 52 BT Group plc Annual Report and Form 20-F 2005 | Corporate governance |
Meetings attendance |
| Board | Audit Committee | Remuneration Committee | Nominating Committee | ||||||||||
| (Attendance is shown only for a committee member) | |||||||||||||
| Number of meetings/ Director | 14 | 4 | 5 | 4 | |||||||||
| Sir Christopher Bland | 14 | 4 | |||||||||||
| Maarten van den Bergh | 12 | 4 | 5 | 4 | |||||||||
| Clay Brendish | 14 | 3 | |||||||||||
Pierre Danona | 11 | ||||||||||||
| Andy Green | 14 | ||||||||||||
| Sir Anthony Greener | 13 | 4 | 5 | 4 | |||||||||
Lou Hughesb | 5 | 2 | 2 | ||||||||||
| Margaret Jay | 12 | 4 | |||||||||||
Hanif Lalanic | 2 | ||||||||||||
| Ian Livingston | 13 | ||||||||||||
| John Nelson | 13 | 3 | 3 | ||||||||||
| Paul Reynolds | 13 | ||||||||||||
| Carl Symon | 14 | 4 | 5 | ||||||||||
| Ben Verwaayen | 14 | ||||||||||||
| a | Resigned as a director on 28 February 2005 |
| b | Granted unpaid leave of absence by the Board from 1 September 2004 to 30 June 2005 to lead the civil reconstruction effort for the US Government in Afghanistan |
| c | Appointed a director from 7 February 2005 |
Operating Committee |
Internal control and risk management |
The Board also takes account of significant social, environmental and ethical matters that relate to BT’s businesses and reviews annually BT’s corporate social responsibility. The company’s workplace practices, specific environmental, social and ethical risks and opportunities and details of underlying governance processes are dealt with in Our people and Our commitment to society.
BT has processes for identifying, evaluating and managing the significant risks faced by the group. These processes have been in place for the whole of the 2005 financial year and have continued up to the date on which this document was approved. The processes are in accordance with the Turnbull guidance for directors published in the UK in September 1999.
Risk assessment and evaluation takes place as an integral part of the group’s annual strategic planning cycle. The group has a detailed risk management process, culminating in a Board review, which identifies the key risks facing the group and each business unit. This information is reviewed by senior management as part of the strategic review. The group’s current key risks are summarised in Risk factors of this document.
The key features of the risk management process comprise the following procedures:
| senior executives, led by the Secretary, review the group’s key risks and have created a group risk register, describing the risks, owners and mitigation strategies. This is reviewed by the Operating Committee before being reviewed and approved by the Board. |
| the lines of business carry out risk assessments of their operations, have created registers relating to those risks, and ensure that the key risks are addressed. |
| senior management report regularly to the Group Finance Director on the operation of internal controls in their area of responsibility. |
| the Chief Executive receives annual reports from senior executives with responsibilities for major group operations with their opinion on the effectiveness of the operation of internal controls during the financial year. |
| the group’s internal auditors carry out continuing assessments of the quality of risk management and control. Internal Audit reports to the management and the Audit Committee on the status of specific areas identified for improvement. Internal audit also promotes effective risk management in the lines of business operations. |
| the Audit Committee, on behalf of the Board, considers the effectiveness of the operation of internal control processes and procedures in the group during the financial year, including the review of reports from the internal auditors and from the external auditors, and reports its conclusions to the Board. The Audit Committee has carried out these actions for the 2005 financial year. |
Material joint ventures and associates, which BT does not control, outside the UK have not been dealt with as part of the group for the purposes of this internal control assessment.
The Board has approved the formal statement of matters which are reserved to it for consideration, approval or oversight. It has also approved the group’s corporate governance framework, which sets out the high level principles by which the group is managed and the responsibilities and powers of the Operating Committee
| Corporate governance | BT Group plc Annual Report and Form 20-F 2005 53 |
Relations with shareholders |
We are continuing our policy that shareholders vote on the annual report at the AGM. Shareholders will also again be asked to vote on the Report on directors’ remuneration.
It is part of our policy to involve shareholders fully in the affairs of the company and to give them the opportunity at the AGM to ask questions about the company’s activities and prospects. We also give the shareholders the opportunity to vote on every substantially different issue by proposing a separate resolution for each issue.
The proxy votes for and against each resolution, as well as abstentions, will be counted before the AGM and the results will be made available at the meeting after the shareholders have voted on each resolution on a show of hands and at the end of the meeting. It is our policy for all directors to attend the AGM if at all possible. Whilst, because of ill health or other pressing reasons, this may not always be possible, in normal circumstances this means that the chairman of the Audit, Nominating and Remuneration committees is at the AGM and is available to answer relevant questions.
The Annual Review and, if requested, the Annual Report and Form 20-F, together with the Notice of the AGM, are sent to shareholders in the most cost-effective fashion, given the large number of shareholders. We aim to give as much notice as possible and at least 21 clear days, as required by the company’s articles of association. In practice, these documents are being sent to shareholders more than 20 working days before the AGM.
Established procedures ensure the timely release of share price sensitive information and the publication of the company’s financial results and regulatory financial statements. All external announcements are also reviewed for accuracy and compliance requirements by a committee of senior, functional executives, the Disclosure Committee, which is chaired by the Secretary.
Statement of business practice |
These high-level principles are supported by a continuing and comprehensive communications programme and online training. A confidential helpline and e-mail facility are also available to employees who have questions about the application of these principles. The helpline number is published externally. We also continue to require our agents and contractors to apply these principles when representing BT.
Pension funds |
Financial statements |
US Sarbanes-Oxley Act of 2002 |
Given the narrow and prescriptive definition under the relevant SEC rules, it is the opinion of the Board that the Audit Committee does not include a member who is an ‘audit committee financial expert’. However, the Board considers that the Committee’s members have broad commercial experience and extensive business leadership, having held various roles in accountancy, financial management and supervision, treasury and corporate finance and that there is a broad and suitable mix of business, financial and IT experience on the Committee. The Board and its committees are keeping the appointment of a financial expert, as defined by US law, under review.
The Chief Executive and Group Finance Director, after evaluating the effectiveness of BT’s disclosure controls and procedures as of the end of the period covered by this Annual Report and Form 20-F, have concluded that, as of such date, BT’s disclosure controls and procedures were effective to ensure that material information relating to BT was made known to them by others within the group. The Chief Executive and Group Finance Director have also
| 54 BT Group plc Annual Report and Form 20-F 2005 | Corporate governance |
There were no changes in BT’s internal control over financial reporting that occurred during the year ended 31 March 2005 that have materially affected, or are reasonably likely to materially affect, BT’s internal control over financial reporting.
The code of ethics for the Chief Executive, Group Finance Director and Director Group Financial Control and Treasury, adopted for the purposes of the Sarbanes-Oxley Act, is posted on the company’s website at www.btplc.com/Thegroup/Companyprofile/Ourcodesofethics/codeofethics.htm
The New York Stock Exchange |
The company has reviewed the NYSE’s new listing standards and believes that its corporate governance practices are consistent with them, with the following exception where the company does not meet the strict requirements set out in the standards. The standards state that companies must have a nominating/corporate governance committee composed entirely of independent directors and with written terms of reference which, in addition to identifying individuals qualified to become board members, develops and recommends to the Board a set of corporate governance principles applicable to the company. BT has a Nominating Committee. It does not develop corporate governance principles for the Board’s approval. The Board approves the group’s overall system of internal controls, governance and compliance authorities. The Board and the Nominating Committee are made up of a majority of independent, non-executive directors.
The Sarbanes-Oxley Act, the SEC and NYSE rules will require the company from 31 July 2005 to comply with certain provisions relating to the Audit Committee. These include the independence of Audit Committee members and procedures for the treatment of complaints regarding accounting or auditing matters. The company is already fully compliant with these requirements.
| Corporate governance | BT Group plc Annual Report and Form 20-F 2005 55 |
Report on directors’ remuneration
| 56 | Remuneration policy (Not audited) | |
| (i) | Constitution and process | |
| (ii) | Packages |
| (iii) | Annual package – financial year 2005/06 |
| (iv) | Other matters |
| Executive share ownership |
| Pensions |
| Other benefits |
| Service agreements |
| Outside appointments |
| Non-executive directors’ letters of appointment |
| Non-executive directors’ remuneration |
| Directors’ service agreements and contracts of appointment |
| Directors’ interests |
| Performance graph |
| 62 | Remuneration review (Audited) |
| Directors’ emoluments |
| Former directors |
| Loans |
| Pensions |
| Share options |
| Share awards under long-term incentive schemes |
| Vesting of outstanding share awards and options |
| Deferred Bonus Plan |
| Share awards under all-employee share ownership plans |
| Operating Committee |
Remuneration policy This part of the Report on directors’ remuneration is not subject to audit. |
| (i) | Constitution and process |
| Maarten van den Bergh |
| Lou Hughes |
| Margaret Jay |
| Carl Symon. |
BT’s executive remuneration policy is to reward employees competitively, taking into account individual line of business and company performance, market comparisons, and the competitive pressures in the information and communications technology industry as BT focuses on growth through transformation. Base
| 56 BT Group plc Annual Report and Form 20-F 2005 |
Remuneration arrangements and performance targets are kept under regular review to achieve this.
| (ii) | Packages |
| Basic salary |
| Performance-related remuneration |
Annual bonus |
For the financial year 2004/05, on-target and maximum (requiring truly exceptional performance) bonus levels for executive directors and OC members, as a percentage of salary, were 75% and 150%, respectively, and for the Chief Executive they were 127.5% and 195%, with one-third of any bonus payable in the form of deferred shares. Under his contract the Chairman is not entitled to a bonus.
Targets, in respect of corporate performance, set at the beginning of the financial year 2004/05 for each objective, to which specific weights were attached, were based on earnings per share, free cash flow and customer satisfaction. Delivery against these operational targets will be a key determinant of success and supports BT’s strategy for transformation and growth. For the three line of business Chief Executives, 75% of the potential bonus was linked to BT’s corporate performance and 25% to the performance of their respective line of business. For all other relevant executives, bonuses were based solely on corporate performance. The Committee retains the flexibility to enhance or reduce bonus awards in exceptional circumstances.
Achievement against corporate targets in the financial year 2004/05: |
| Earnings per share – weighting 40% of target | Free cash flow – weighting 40% of target | Customer satisfaction – weighting 20% of target | Total % of target | |||||||
| 37 | 20 | 18 | 75 | |||||||
| (Note – threshold reflects 50% of target; target is 100% and stretch is 150%) |
The deferred share element of the annual bonus is paid under the Deferred Bonus Plan (DBP). The shares are held in trust and transferred to the executive after three years if still employed by the company. There are no additional performance measures for the vesting of deferred share awards. The Committee considers that deferring a part of the annual bonus in this way also acts as a retention measure and contributes to aligning management with long-term shareholder interest.
These deferred awards for Ben Verwaayen, Andy Green, Hanif Lalani, Ian Livingston and Paul Reynolds at the end of the financial year 2004/05 are contained in the table on page 67. The initial values of the awards are in note f on page 62.
Long-term incentives |
Under his service agreement, the Chairman is not entitled to receive annual grants of long-term incentive awards or options.
Normally, awards vest and options become exercisable only if a predetermined performance target has been achieved. The performance measure for outstanding awards and options is TSR (total shareholder return) compared with a relevant basket of companies. TSR links the reward given to directors with the performance of BT against the shares of other major companies. For grants in the financial years 2001/02, 2002/03 and 2003/04, the comparator group was the FTSE 100 at 1 April in each year and for grants in the financial year 2004/05, TSR was measured against a comparator group of companies from the European Telecom Sector.
At 1 April 2004, the group contained the following companies:
BT Group Cable & Wireless Cosmote Mobile Telecommunications Deutsche Telekom France Telecom Hellenic Telecommunications O2 (formerly mmO2) Portugal Telecom KPN Swisscom | TDC Tele2 Telecom Italia Telecom Italia Mobile Telefonica Telekom Austria Telenor TeliaSonera Vodafone Group |
The base price at the beginning of the performance period is calculated by averaging the share price of BT and other companies in the comparator group over the six months to 31 March prior to the award. However, for the awards granted in the financial year 2002/03, the period was from 19 November 2001 (the date of the O2 demerger) to 31 March 2002. The end price is the average of the share price over the six months to the end of the performance period, adjusted for all capital actions and dividend payments that occur during the performance period.
Share options |
| Report on directors’ remuneration | BT Group plc Annual Report and Form 20-F 2005 57 |
For options granted subject to a TSR measure, BT’s TSR at the end of the three-year period must be in the upper quartile for all of the options to be exercisable. At median, 30% of the options will be exercisable. Below that point, none of the options may be exercised. The proportion of options that are exercisable reduces on a straight-line basis between those points. For options granted in the financial year 2002/03, if the performance measure is not met in full at the first measurement, it may be re-tested against a fixed base in years four and five and for options granted in the financial year 2003/04 may be re-tested in year five. If TSR has not reached the median at the end of the fifth year, previously unexercisable options will lapse. For options granted in the financial year 2002/03, TSR had reached 74th position at the first measurement relative to the FTSE 100 and performance will be re-tested in the financial year 2005/06. For options granted in the financial year 2004/05 there will be no re-testing, and the policy of the Committee going forward is for there to be no re-testing.
The one-off grant of additional options in the financial year 2002/03 to the senior executives most responsible for delivering BT’s strategic plan lapsed on 31 March 2005, as the required 35% compound annual growth in BT’s earnings per share over three years (equivalent to 22 pence per share at the end of the 2005 financial year) was not achieved. The grant was not subject to a re-testing condition.
The option granted to Sir Christopher Bland on 22 June 2001 as part of his recruitment package is not subject to a performance measure as it matched a personal investment in BT shares of £1 million.
The details of the options held by Sir Christopher Bland, Ben Verwaayen, Andy Green, Hanif Lalani, Ian Livingston and Paul Reynolds at the end of the financial year 2004/05 are contained in the table on page 65.
Incentive shares |
The details of incentive share awards held by Ben Verwaayen, Andy Green, Hanif Lalani, Ian Livingston and Paul Reynolds at the end of the financial year 2004/05 are contained in the table on page 66.
Retention shares |
Retention shares are used only in exceptional circumstances and, in the financial year 2004/05, six awards were made for recruitment purposes, none of which was to an executive director or OC member. The Committee has approved the grant of an award of retention shares to Ian Livingston with an initial market value of £1m, to help secure his appointment and long-term retention as Chief Executive, BT Retail. It is expected that these will be granted at the end of May 2005 and will vest in two tranches.
The awards under the RSP held by Sir Christopher Bland, Ben Verwaayen and Ian Livingston at the end of the financial year 2004/05, or which vested during the year, are contained in the table on page 66.
Other share plans |
| (iii) | Annual package – financial year 2005/06 |
Long-term reward |
This involves:
| no further annual grants of options, balanced by; |
| an increase in the maximum award of incentive shares from two-thirds to 100% of base salary; and |
| an increase in annual bonus potential, payable in deferred shares. |
The Committee determined, with advice from Towers Perrin, that the overall value of long-term incentive
| 58 BT Group plc Annual Report and Form 20-F 2005 | Report on directors’ remuneration |
The change in emphasis will increase the proportion of variable reward linked to annual performance targets. Incentive share awards remain a significant part of the package, and together with deferred shares, these modifications further align management with long term shareholder interests.
The changes have the effect of increasing on-target bonus from 75% to 87.5% of base salary of which the cash element continues to be 50% of salary.
Arrangements for BT Group Chief Executive and the Chief Executive BT Global Services |
As a retention measure and given competitive market conditions, the Committee has also decided to introduce an additional special bonus arrangement for Andy Green, Chief Executive BT Global Services, linked to performance targets for that line of business, given the critical importance of its continuing growth and margin improvement to BT’s transformation. This bonus arrangement, payable in retention shares which will vest three years after grant, will be applied to performance in each of the financial years 2005/06, 2006/07 and 2007/08. Awards will be linked to a sliding scale of BT Global Services’ performance, weighted equally around revenue growth, EBIT and cash generation. The target award will be equivalent to 100% of salary, with a maximum of 150% of salary.
Annual bonus plan |
Proportion of fixed and variable remuneration |
| (iv) | Other matters |
Executive share ownership |
Pensions |
The Committee has reviewed the impact of the Lifetime Allowance under tax legislation, as the taxation of approved pension schemes will change from 6 April 2006. As a result, BT will offer to those members affected the option to opt out of the pension scheme and in its place to receive a cash allowance annually. This will be broadly cash neutral for the company. The Committee will keep this policy under review as best practice develops.
Pension provision for all executives is based on salary alone – bonuses, other elements of pay and long-term incentives are excluded.
| Report on directors’ remuneration | BT Group plc Annual Report and Form 20-F 2005 59 |
Other benefits |
Service agreements |
The Committee has reviewed contracts taking into account the joint statement of best practice on executive contracts and severance by the Association of British Insurers and the National Association of Pension Funds, and other relevant guidelines, and believes that contract terms are generally in line with best practice. The clause described above dealing with termination following BT entering into a scheme of arrangement or becoming a subsidiary of another company will be excluded from contracts for new appointments, as was the case for Hanif Lalani.
Outside appointments |
Non-executive directors’ letters of appointment |
Non-executive directors’ remuneration |
The fees paid to non-executive directors were increased with effect from 1 January 2004 to reflect their increasing responsibilities and time commitments. Non-executive directors’ fees were last changed five years previously, on 1 January 1999.
The basic fee for non-executive directors is £40,000 per year. An additional fee for membership of Board committees is £5,000 per year, other than for the Pension Scheme Performance Review Group for which no fee is paid. Sir Anthony Greener, Deputy Chairman and senior non-executive director, who also chairs both the Remuneration Committee and the Audit Committee, receives total fees of £115,000 per year.
To align further the interests of the non-executive directors with those of shareholders, the company’s policy is to encourage these directors to purchase, on a voluntary basis, £5,000 of BT shares each year. The directors are asked to hold these shares until they retire from the Board. This policy is not mandatory.
No element of non-executive remuneration is performance-related. Non-executive directors do not participate in BT’s bonus or employee share plans and are not members of any of the company pension schemes.
| 60 BT Group plc Annual Report and Form 20-F 2005 | Report on directors’ remuneration |
Directors’ service agreements and contracts of appointment |
Chairman and executive directors | Commencement date | Expiry date of current service agreement or letter of appointment | ||||
| Sir Christopher Bland | 1 May 2001 | Sir Christopher Bland entered into a new service agreement on 29 August 2003 which terminates at the conclusion of the 2007 AGM, terminable on 12 months’ notice by either the company or the director before that date. | ||||
| B Verwaayen A Green H Lalani I Livingston Dr P Reynolds P Danon (resigned 28 February 2005) | 14 January 2002 19 November 2001 7 February 2005 8 April 2002 19 November 2001 19 November 2001 | The contract is terminable by the company on 12 months’ notice and by the director on six months’ notice. | ||||
Non-executive directors | ||||||
| Sir Anthony Greener M van den Bergh L R Hughes Baroness Jay J Nelson C G Symon | 1 October 2000 1 September 2000 1 January 2000 14 January 2002 14 January 2002 14 January 2002 | Letters of appointment were for an initial period of three years. Appointments were extended for a further three years and are terminable by the company or the director on three months’ notice. | ||||
| C Brendish | 1 September 2002 |  | Letter of appointment is for an initial period of three years and is terminable by the company or the director on three months’ notice. The appointment is renewable by mutual agreement. | |||
Directors’ interests |
| No. of shares | |||||||
| Beneficial holdings | 2005 | 2004 | |||||
Sir Christopher Blandc | 674,183 | b | 674,062 | ||||
B Verwaayenc | 902,001 | 387,876 | |||||
A Greenc | 120,002 | b | 92,351 | b | |||
H Lalanicd | 5,733 | ab | – | ||||
I Livingstonc | 313,054 | b | 209,637 | ||||
Dr P Reynoldsc | 67,768 | ab | 46,823 | b | |||
| Sir Anthony Greener | 60,007 | 34,607 | |||||
| M van den Bergh | 7,540 | 4,800 | |||||
| C Brendish | 23,920 | 23,920 | |||||
| L R Hughes | 6,800 | 6,800 | |||||
| Baroness Jay | 5,572 | 5,572 | |||||
| J Nelson | 50,000 | 50,000 | |||||
| C G Symon | 10,069 | 10,069 | |||||
| Total | 2,246,649 | 1,546,517 | |||||
| a | During the period from 1 April 2005 to 15 May 2005, Paul Reynolds and Hanif Lalani each purchased 125 shares under the BT Group Employee Share Investment Plan. |
| b | Includes free shares awarded under the Employee Share Investment Plan and/or Employee Share Ownership Scheme. |
| c | At 31 March 2005, Sir Christopher Bland and each of the executive directors, as potential beneficiaries, had a non-beneficial interest in 27,733,138 shares (2004 – 30,463,435) held in trust by Ilford Trustees (Jersey) Limited for allocation to employees under the employee share schemes. They each also had a non-beneficial interest in 139,029 shares (2004 – 141,864) held in trust by Halifax Corporate Trustees Limited for participants in the Employee Share Investment Plan. |
| d | At date of appointment – 7 February 2005. |
| Report on directors’ remuneration | BT Group plc Annual Report and Form 20-F 2005 61 |
Performance graph |

Remuneration Review |
This part of the Report on directors’ remuneration is subject to audit. |
Directors’ emoluments |
| Basic salary and fees | Pension allowance net of pension contributions | a | Total salary and fees | Annual cash bonus | Expenses allowance | Other benefits excluding pension | Total 2005 | Total 2004 | |||||||||||||||||
| £000 | £000 | £000 | £000 | £000 | £000 | £000 | £000 | ||||||||||||||||||
Sir Christopher Blandd | 500 | – | 500 | – | – | 32 | 532 | 532 | |||||||||||||||||
B Verwaayencdf | 700 | 127 | 827 | 448 | 196 | 41 | 1,512 | 1,968 | |||||||||||||||||
A Greendf | 444 | – | 444 | 204 | – | 36 | 684 | 791 | |||||||||||||||||
H Lalanidef | 64 | – | 64 | 136 | – | 7 | 207 | – | |||||||||||||||||
I Livingstonbdf | 469 | 120 | 589 | 198 | 19 | 10 | 816 | 913 | |||||||||||||||||
Dr P Reynoldsbdf | 400 | – | 400 | 213 | 19 | 21 | 653 | 737 | |||||||||||||||||
| Sir Anthony Greener | 115 | – | 115 | – | – | – | 115 | 96 | |||||||||||||||||
| M van den Bergh | 55 | – | 55 | – | – | – | 55 | 44 | |||||||||||||||||
| C Brendish | 50 | – | 50 | – | – | – | 50 | 39 | |||||||||||||||||
| L R Hughes | 21 | – | 21 | – | – | – | 21 | 40 | |||||||||||||||||
| Baroness Jay | 50 | – | 50 | – | – | – | 50 | 39 | |||||||||||||||||
| J Nelson | 50 | – | 50 | – | – | – | 50 | 39 | |||||||||||||||||
| C G Symon | 50 | – | 50 | – | – | – | 50 | 40 | |||||||||||||||||
P Danonbdfh | 413 | – | 413 | 250 | 17 | 21 | 701 | 750 | |||||||||||||||||
| 3,381 | 247 | 3,628 | 1,449 | 251 | 168 | 5,496 | 6,028 | ||||||||||||||||||
| a | Balance or part of the pension allowance for the financial year 2004/05 – see ‘Pensions’ below. |
| b | Ian Livingston, Paul Reynolds and Pierre Danon each received a monthly cash allowance in lieu of a company car equivalent to £18,500 per annum. |
| c | Ben Verwaayen was entitled to a housing allowance of £250,000 per annum until 13 January 2005. In the financial year 2004/05, £196,000 was paid in respect of that year (2004 – £250,000). These amounts are included in the table above under Expenses allowance. |
| d | Other benefits includes some or all of the following: company car, fuel or driver, personal telecommunications facilities and home security, medical and dental cover for the director and immediate family, special life cover, professional subscriptions and personal tax planning and financial counselling. In addition, Paul Reynolds and Pierre Danon had interest free loans – see ‘Loans’ below. |
| e | Hanif Lalani joined the Board on 7 February 2005. |
| f | Deferred annual bonuses payable in shares in three years’ time, were awarded to Ben Verwaayen £224,000 (2004 – £429,500), Andy Green £102,000 (2004 – £168,000), Hanif Lalani £68,000 (2004 – £nil), Ian Livingston £99,000 (2004 – £162,500), Paul Reynolds £106,500 (2004 – £147,500) and Pierre Danon £nil (2004 – £129,500). |
| When added to the amounts paid or payable for the 2004/05 financial year, in the table above, the total emoluments of Ben Verwaayen were £1,736,000 (2004 - £2,397,500), Andy Green £786,000 (2004 – £959,000), Hanif Lalani £275,000 (2004 – £nil), Ian Livingston £915,000 (2004 – £1,075,500), Paul Reynolds £759,500 (2004 – £884,500) and Pierre Danon £701,000 (2004 – £879,500). |
| g | Retirement benefits are accruing to three directors (2004 – three) under defined contribution arrangements and to three directors (2004 – three) and one former director under a defined benefit scheme. |
| h | Pierre Danon resigned from the Board on 28 February 2005. |
| 62 BT Group plc Annual Report and Form 20-F 2005 | Report on directors’ remuneration |
A special retention arrangement was established for Hanif Lalani on 1 July 2004, when he was CFO, BT Wholesale, under which he will receive a lump sum cash payment of £150,000 on 30 June 2006, provided he is still an employee of the company on that date. The award will be forfeited without compensation if Mr Lalani resigns or his employment is terminated by the company with cause before that date.
Pierre Danon’s pro rata bonus in respect of the financial year 2004/05 until he resigned from the Board on 28 February 2005 was based on the achievement of corporate and line of business objectives and on the Committee’s view on his outstanding contribution to BT. All his executive share awards and options lapsed on his resignation. The annual bonus of Hanif Lalani relates to the whole year and is based solely on line of business objectives. Ian Livingston’s annual bonus was based solely on the achievement of corporate objectives.
Annual cash bonus awards in respect of the financial year 2004/05, which are not pensionable, to executive directors ranged from 38% to 64% of current salary (2004 – 58% to 123%).
Former directors |
Sir Peter Bonfield received, under pre-existing arrangements, a pension of £340,000 payable in the financial year 2004/05 (2004 – £331,000).
Loans |
Pensions Sir Christopher Bland is not a member of any of the company pension schemes, but the company matches his contributions, up to 10% of the earnings cap, to a personal pension plan. Company contributions of £10,200 were payable in respect of the financial year 2004/05. The earnings cap is a restriction on the amount of pay which can be used to calculate contributions and benefits due to a tax approved pension scheme. |
Ian Livingston is not a member of any of the company pension schemes, but the company has agreed to pay an annual amount equal to 30% of his salary towards pension provision. The company paid £20,400 into his personal pension plan plus a cash payment of £120,225 representing the balance of the pension allowance for the financial year 2004/05. BT also provides him with a lump sum death in service benefit of four times his salary.
Andy Green is a member of the BT Pension Scheme. From 31 December 1997 the company has been purchasing an additional 203 days of pensionable service each year to bring his pensionable service at age 60 up to 40 years. A two-thirds widow’s pension would be payable on his death.
Hanif Lalani is a member of the BT Pension Scheme. From 7 February 2005, the company has been purchasing an additional 23 days of pensionable service each year to bring his pensionable service at age 60 up to 40 years.
Paul Reynolds is a member of the BT Pension Scheme. From 1 July 1996 the company has been purchasing an additional 109 days of pensionable service each year to bring his pensionable service at age 60 up to 40 years. A two-thirds widow’s pension would be payable on his death.
Pierre Danon resigned as a director on 28 February 2005. His pension accrued at the rate of one-thirtieth of his final salary for each year of service. In addition, a two-thirds widow’s pension would have been payable on his death. He was a member of the BT Pension Scheme, but as he was subject to the earnings cap the company agreed to increase his benefits to the target level by means of a non-approved, unfunded arrangement.
| Report on directors’ remuneration | BT Group plc Annual Report and Form 20-F 2005 63 |
| Accrued pension | Transfer value of accrued benefits | Change in transfer value c-d less directors’ contributions | Additional accrued benefits earned in the year | Transfer value of increase in accrued benefits less directors’ contributions | ||||||||||||||||||
| 2005 | 2004 | 2005 | 2004 | 2005 | 2005 | 2005 | ||||||||||||||||
| £000 | a | £000 | b | £000 | c | £000 | d | £000 | £000 | e | £000 | f | ||||||||||
P Danonh | 66 | 52 | 696 | 519 | 163 | 12 | 113 | |||||||||||||||
| A Green | 131 | 117 | 1,848 | 1,553 | 268 | 10 | 115 | |||||||||||||||
H Lalanii | 73 | 57 | 668 | 494 | 158 | 14 | 109 | |||||||||||||||
| P Reynolds | 123 | 116 | 1,578 | 1,405 | 149 | 3 | 12 | |||||||||||||||
| a-d | As required by the Companies Act 1985 Schedule 7A. |
| a-b | These amounts represent the deferred pension to which the directors would have been entitled had they left the company on 31 March 2004 and 2005, respectively. |
| c | Transfer value of the deferred pension in column (a) as at 31 March 2005 calculated on the basis of actuarial advice in accordance with Actuarial Guidance Note GN11. The transfer value represents a liability of the company rather than any remuneration due to the individual and cannot be meaningfully aggregated with annual remuneration, as it is not money the individual is entitled to receive. |
| d | The equivalent transfer value but calculated as at 31 March 2004 on the assumption that the director left service at that date. |
| e | The increase in pension built up during the year, net of inflation. |
| f | The transfer value of the pension in column (e), less directors’ contributions. |
| g | Directors’ contributions in the financial year 2004/05 were as follows: Pierre Danon, £14,025 (2004 – £14,580); Andy Green, £26,625 (2004 – £25,500); Hanif Lalani £16,300 (2004 – £13,350) and Paul Reynolds, £24,000 (2004 – £24,000). |
| h | Pierre Danon resigned as a director on 28 February 2005. |
| i | Hanif Lalani joined the Board on 7 February 2005. |
| 64 BT Group plc Annual Report and Form 20-F 2005 | Report on directors’ remuneration |
Share options held during the year ended 31 March 2005 |
| Number of shares under option | ||||||||||||||||||||||
| 1 April 2004 (or date of appointment) | Granted | Lapsed | 31 March 2005 | Option price per share | Usual date from which exercisable | Usual expiry date | ||||||||||||||||
| Sir Christopher Bland | 314,244 | a | – | – | 314,244 | 318 | p | 01/05/2004 | 01/05/2011 | |||||||||||||
| B Verwaayen | 1,121,121 | b | – | – | 1,121,121 | 250 | p | 11/02/2005 | 11/02/2012 | |||||||||||||
| 935,830 | c | – | – | 935,830 | 187 | p | 29/07/2005 | 29/07/2012 | ||||||||||||||
| 561,500 | d | – | 561,500 | – | 187 | p | 29/07/2005 | 29/07/2012 | ||||||||||||||
| 1,052,632 | e | – | – | 1,052,632 | 199.5 | p | 24/06/2006 | 24/06/2013 | ||||||||||||||
| – | 546,875 | f | – | 546,875 | 192 | p | 24/06/2007 | 24/06/2014 | ||||||||||||||
| 3,671,083 | 546,875 | 561,500 | 3,656,458 | |||||||||||||||||||
| A Green | 2,905 | g | – | 2,905 | – | 255 | p | 14/08/2005 | 13/02/2006 | |||||||||||||
| 568,190 | c | – | – | 568,190 | 187 | p | 29/07/2005 | 29/07/2012 | ||||||||||||||
| 340,910 | d | – | 340,910 | – | 187 | p | 29/07/2005 | 29/07/2012 | ||||||||||||||
| 639,098 | e | – | – | 639,098 | 199.5 | p | 24/06/2006 | 24/06/2013 | ||||||||||||||
| – | 332,032 | f | – | 332,032 | 192 | p | 24/06/2007 | 24/06/2014 | ||||||||||||||
| – | 5,712 | h | – | 5,712 | 165 | p | 14/08/2007 | 13/02/2008 | ||||||||||||||
| 1,551,103 | 337,744 | 343,815 | 1,545,032 | |||||||||||||||||||
H Lalanil | 5,346 | i | – | – | 5,346 | 173 | p | 14/08/2006 | 13/02/2007 | |||||||||||||
| 177,810 | c | – | – | 177,810 | 187 | p | 29/07/2005 | 29/07/2012 | ||||||||||||||
| 210,527 | e | – | – | 210,527 | 199.5 | p | 24/06/2006 | 24/06/2013 | ||||||||||||||
| 105,264 | j | – | – | 105,264 | 199.5 | p | 24/06/2004 | 24/06/2013 | ||||||||||||||
| 156,250 | f | – | – | 156,250 | 192 | p | 24/06/2007 | 24/06/2014 | ||||||||||||||
| 655,197 | – | – | 655,197 | |||||||||||||||||||
| I Livingston | 7,290 | g | – | – | 7,290 | 227 | p | 14/08/2007 | 13/02/2008 | |||||||||||||
| 601,610 | c | – | – | 601,610 | 187 | p | 29/07/2005 | 29/07/2012 | ||||||||||||||
| 360,970 | d | – | 360,970 | – | 187 | p | 29/07/2005 | 29/07/2012 | ||||||||||||||
| 676,692 | e | – | – | 676,692 | 199.5 | p | 24/06/2006 | 24/06/2013 | ||||||||||||||
| – | 351,563 | f | – | 351,563 | 192 | p | 24/06/2007 | 24/06/2014 | ||||||||||||||
| 1,646,562 | 351,563 | 360,970 | 1,637,155 | |||||||||||||||||||
| Dr P Reynolds | 4,555 | k | – | – | 4,555 | 218 | p | 14/02/2007 | 13/08/2007 | |||||||||||||
| 534,760 | c | – | – | 534,760 | 187 | p | 29/07/2005 | 29/07/2012 | ||||||||||||||
| 320,860 | d | – | 320,860 | – | 187 | p | 29/07/2005 | 29/07/2012 | ||||||||||||||
| 601,504 | e | – | – | 601,504 | 199.5 | p | 24/06/2006 | 24/06/2013 | ||||||||||||||
| – | 312,500 | f | – | 312,500 | 192 | p | 24/06/2007 | 24/06/2014 | ||||||||||||||
| 1,461,679 | 312,500 | 320,860 | 1,453,319 | |||||||||||||||||||
| Former director | ||||||||||||||||||||||
| P Danon | 601,610 | c | – | 601,610 | – | 187 | p | 29/07/2005 | 29/07/2012 | |||||||||||||
| 360,970 | d | – | 360,970 | – | 187 | p | 29/07/2005 | 29/07/2012 | ||||||||||||||
| 676,692 | e | – | 676,692 | – | 199.5 | p | 24/06/2006 | 24/06/2013 | ||||||||||||||
| – | 351,563 | f | 351,563 | – | 192 | p | 24/06/2007 | 24/06/2014 | ||||||||||||||
| 1,639,272 | 351,563 | 1,990,835 | – | |||||||||||||||||||
| Total | 10,939,140 | 1,900,245 | 3,577,980 | 9,261,405 | ||||||||||||||||||
| All of the above options were granted for nil consideration. No options were exercised during the year. |
| a | Options granted under the GSOP on 22 June 2001. The option is not subject to a performance measure. It was a term of Sir Christopher Bland’s initial service contract that (i) he purchased BT shares to the value of at least £1 million; and (ii) as soon as practicable after the purchase of the shares (‘invested shares’), the company would grant a share option over shares to the value of at least £1 million. Sir Christopher Bland was the legal and beneficial owner of the invested shares on 1 May 2004, so the option became exercisable on that date. |
| b | Options granted under the GSOP on 11 February 2002. The exercise of options is subject to a performance measure being met. The performance measure is relative TSR compared with the FTSE 100. BT’s TSR must be in the upper quartile for all of the options to become exercisable. At median, 40% of the options will be exercisable. Below that point, none of the options may be exercised. |
| c | Options granted under the GSOP on 29 July 2002. The exercise of options is subject to a performance measure being met. The performance measure is relative TSR compared with the FTSE 100. BT’s TSR must be in the upper quartile for all of the options to become exercisable. At median, 30% of the options will be exercisable. Below that point, none of the options may be exercised. |
| d | Options granted under the GSOP on 29 July 2002. The vesting of the options was subject to a performance measure being met. The performance measure was earnings per share. The performance measure was not met and as a result, the options have lapsed. |
| e | Options granted under the GSOP on 24 June 2003. The exercise of options is subject to a performance measure being met. The performance measure is relative TSR compared with the FTSE 100 – see note c above. |
| f | Options granted under the GSOP on 24 June 2004. The exercise of options is subject to a performance measure being met. The performance measure is relative TSR compared with a group of companies from the European Telecom Sector. BT’s TSR must be in the upper quartile for all of the options to become exercisable. At median, 30% of the options will be exercisable. Below that point, none of the options may be exercised. |
| g | Options granted on 24 June 2002 under the Employee Sharesave Scheme, in which all employees of the company are eligible to participate. |
| h | Options granted on 25 June 2004 under the Employee Sharesave Scheme, in which all employees of the company are eligible to participate. |
| i | Options granted on 27 June 2003 under the Employee Sharesave Scheme, in which all employees of the company are eligible to participate. |
| j | Options granted under the GSOP (Special Incentive Award) on 24 June 2003, prior to Mr Lalani’s appointment as a director. These options are not subject to a performance measure, as the grant was linked to performance. |
| k | Options granted on 21 December 2001 under the Employee Sharesave Scheme, in which all employees of the company are eligible to participate. |
| l | Date of appointment – 7 February 2005. |
| Report on directors’ remuneration | BT Group plc Annual Report and Form 20-F 2005 65 |
As at 31 March 2005, one third of Hanif Lalani’s GSOP 2003 option (granted under the Special Incentive Award) was exercisable giving an unrealised gain of £2,105. There were no further unrealised gains on the above share options at 31 March 2005 (2004 – nil), based on the share price of the shares at that date.
All of Mr Danon’s options lapsed on his last day of service, 28 February 2005.
Share awards under long-term incentive schemes held during the year ended 31 March 2005 |
| 1 April 2004 (or date of appointment) | Awardeda | Dividends re-invested | Vestedf | Lapsed | Total number of award shares 31 March 2005 | Expected vesting date | Price on grant | Market Price at vesting | Monetary value of vested award £000 | ||||||||||||||||||||||
| Sir Christopher Bland | |||||||||||||||||||||||||||||||
| RSP 2003 | 286,100 | – | 13,653 | – | – | 299,753 | 2007 | 182p | – | – | |||||||||||||||||||||
| B Verwaayen | |||||||||||||||||||||||||||||||
| ISP 2004 | – | 241,284 | 11,514 | – | – | 252,798 | 31/03/07 | 193.42p | – | – | |||||||||||||||||||||
RSP 2001b | 832,869 | – | 39,746 | 872,615 | – | – | – | 257.814p | 207.75p | 1,813 | |||||||||||||||||||||
| A Green | |||||||||||||||||||||||||||||||
| ISP 2004 | – | 146,494 | 6,990 | – | – | 153,484 | 31/03/07 | 193.42p | – | – | |||||||||||||||||||||
H Lalanid | |||||||||||||||||||||||||||||||
| ISP 2004 | 70,912 | – | 1,312 | – | – | 72,224 | 31/03/07 | 193.42p | – | – | |||||||||||||||||||||
| I Livingston | |||||||||||||||||||||||||||||||
| ISP 2004 | – | 155,111 | 7,401 | – | – | 162,512 | 31/03/07 | 193.42p | – | – | |||||||||||||||||||||
RSP 2002c | 350,664 | – | 8,366 | 175,332 | – | 183,698 | 05/04/05 | 273.5p | 181.75p | 319 | |||||||||||||||||||||
| RSP 2002 | 117,691 | – | 5,616 | – | – | 123,307 | 20/05/05 | 202.0p | – | – | |||||||||||||||||||||
| Dr P Reynolds | |||||||||||||||||||||||||||||||
| ISP 2004 | – | 137,877 | 6,579 | – | – | 144,456 | 31/03/07 | 193.42p | – | – | |||||||||||||||||||||
Former director | |||||||||||||||||||||||||||||||
Pierre Danone | |||||||||||||||||||||||||||||||
| ISP 2004 | – | 155,111 | 7,401 | – | 162,512 | – | – | 193.42p | – | – | |||||||||||||||||||||
| The size of awards granted during the financial year 2004/05 was calculated using the average middle market price of a BT share for the three days prior to the grant. |
| a | Awards under the ISP were made on 24 June 2004. The awards will vest subject to a performance condition being met. The performance measure is relative TSR compared with a group of companies from the European Telecom Sector. BT’s TSR must be in the upper quartile for all of the awards to vest. At median, 25% of the awards will vest. Below that point, none of the awards will vest. |
| b | The RSP awards granted on 11 Februray 2002, vested on 11 February 2005. |
| c | The second tranche of the RSP award granted on 30 May 2002 vested on 21 May 2004. |
| d | Date of appointment, 7 February 2005. |
| e | The award granted under the ISP on 24 June 2004 and the subsequent dividends re-invested, lapsed on 28 February 2005 when Pierre Danon resigned as a director. |
| f | Vesting of RSP awards is not subject to a performance condition being met. |
Vesting of outstanding share awards and options |
| 31 March 2005 | 31 March 2004 | |||||||||||||||
| Expected vesting date | TSR position | Percentage of shares vesting | TSR position | Percentage of shares vesting | ||||||||||||
| ISP 2004 | 31/03/07 | 11 | – | – | – | |||||||||||
| GSOP 2002 | 29/07/05 | 74 | – | 77 | – | |||||||||||
| GSOP 2003 | 24/06/06 | 84 | – | 93 | – | |||||||||||
| GSOP 2004 | 24/06/07 | 11 | – | – | – | |||||||||||
Options granted to executive directors under the GSOP during the financial year 2002/03 as an additional incentive, whose exercise was subject to a 35% compound annual growth in earnings per share, before goodwill amortisation and exceptional items, being achieved over three years (equivalent to 22p per share at the end of the financial year 2004/05), are not included in the above table, but are included in the table on page 65. Earnings per share, before goodwill amortisation and exceptional items for the financial year 2004/05 are 18.1p per share (2004 – 16.9p). The compound annual growth in earnings per share over the three years did not meet the target and as a result all of the options have lapsed.
| 66 BT Group plc Annual Report and Form 20-F 2005 | Report on directors’ remuneration |
Deferred Bonus Plan awards held during the year ended 31 March 2005 |
| 1 April 2004 (or at date of appointment) | Awardeda | Vestedb | Dividends re-invested | Lapsed | Total number of award shares 31 March 2005 | Expected vesting date | Price at grant | Market Price at vesting | Monetary value of vested award £000 | ||||||||||||||||||||||
| B Verwaayen | 80,183 | – | – | 3,826 | – | 84,009 | 01/08/05 | 202.0 | p | – | – | ||||||||||||||||||||
| 443,238 | – | – | 21,152 | – | 464,390 | 01/08/06 | 199.5 | p | – | – | |||||||||||||||||||||
| – | 222,030 | – | 10,595 | – | 232,625 | 01/08/07 | 193.42 | p | – | – | |||||||||||||||||||||
| A Green | 46,723 | – | 46,723 | – | – | – | – | 267.912 | p | 187.7897 | p | 88 | |||||||||||||||||||
| 52,751 | – | – | 2,517 | – | 55,268 | 01/08/05 | 202.0 | p | – | – | |||||||||||||||||||||
| 79,983 | – | – | 3,816 | – | 83,799 | 01/08/06 | 199.5 | p | – | – | |||||||||||||||||||||
| – | 86,939 | – | 4,148 | – | 91,087 | 01/08/07 | 193.42 | p | – | – | |||||||||||||||||||||
H Lalanic | 12,750 | – | – | 235 | – | 12,985 | 01/08/05 | 202.0 | p | – | – | ||||||||||||||||||||
| 25,917 | – | – | 479 | – | 26,396 | 01/08/06 | 199.5 | p | – | – | |||||||||||||||||||||
| 26,843 | – | – | 496 | – | 27,339 | 01/08/07 | 193.42 | p | – | – | |||||||||||||||||||||
| I Livingston | 88,088 | – | – | 4,203 | – | 92,291 | 01/08/06 | 199.5 | p | – | – | ||||||||||||||||||||
| – | 83,961 | – | 4,006 | – | 87,967 | 01/08/07 | 193.42 | p | – | – | |||||||||||||||||||||
| Dr P Reynolds | 33,934 | – | 33,934 | – | – | – | – | 267.912 | p | 187.7897 | p | 64 | |||||||||||||||||||
| 47,476 | – | – | 2,264 | – | 49,740 | 01/08/05 | 202.0 | p | – | – | |||||||||||||||||||||
| 75,277 | – | – | 3,591 | – | 78,868 | 01/08/06 | 199.5 | p | – | – | |||||||||||||||||||||
| – | 76,342 | – | 3,643 | – | 79,985 | 01/08/07 | 193.42 | p | – | – | |||||||||||||||||||||
| Former directors | |||||||||||||||||||||||||||||||
P Danond | 23,054 | – | 23,054 | – | – | – | – | 267.912 | p | 187.7897 | p | 43 | |||||||||||||||||||
| 79,129 | – | – | 3,776 | 82,905 | – | 01/08/05 | 202.0 | p | – | – | |||||||||||||||||||||
| 88,088 | – | – | 4,203 | 92,291 | – | 01/08/06 | 199.5 | p | – | – | |||||||||||||||||||||
| – | 66,970 | – | 3,195 | 70,165 | – | 01/08/07 | 193.42 | p | – | – | |||||||||||||||||||||
Sir Peter Bonfielde | 157,718 | – | 157,718 | – | – | – | 01/08/04 | 267.912 | p | 187.7897 | p | 296 | |||||||||||||||||||
| a | Awards granted on 24 June 2004. |
| b | Awards granted on 22 June 2001 vested on 2 August 2004. |
| c | Date of appointment – 7 February 2005. |
| d | All outstanding awards made under the DBP to P Danon lapsed on 28 February 2005 when he resigned as a director. |
| e | Under the terms of his service agreement, awards granted to Sir Peter Bonfield were preserved on his leaving until the normal vesting date. |
| Report on directors’ remuneration | BT Group plc Annual Report and Form 20-F 2005 67 |
Share awards under all-employee share ownership plans held during the year ended 31 March 2005 |
| 1 April 2004 (or at date of appointment) | Awarded | Vested | Total number of award shares 31 March 2005 | Expected vesting date | ||||||||||||
| Sir Christopher Bland | ||||||||||||||||
| ESIP 2003 | 186 | – | – | 186 | 05/08/08 | |||||||||||
| ESIP 2004 | – | 116 | a | – | 116 | 04/08/09 | ||||||||||
| 186 | 116 | – | 302 | |||||||||||||
| A Green | ||||||||||||||||
| ESOS 2001 | 66 | – | 66 | b | – | – | ||||||||||
| ESIP 2002 | 130 | – | – | 130 | 14/08/07 | |||||||||||
| ESIP 2003 | 186 | – | – | 186 | 05/08/08 | |||||||||||
| ESIP 2004 | – | 116 | a | – | 116 | 04/08/09 | ||||||||||
| 382 | 116 | 66 | 432 | |||||||||||||
H Lalanic | ||||||||||||||||
| ESIP 2002 | 130 | – | – | 130 | 14/08/07 | |||||||||||
| ESIP 2003 | 186 | – | – | 186 | 05/08/08 | |||||||||||
| ESIP 2004 | 116 | a | – | – | 116 | 04/08/09 | ||||||||||
| 432 | – | – | 432 | |||||||||||||
| I Livingston | ||||||||||||||||
| ESIP 2004 | – | 116 | a | – | 116 | 04/08/09 | ||||||||||
| – | 116 | – | 116 | |||||||||||||
| P Reynolds | ||||||||||||||||
| ESOS 2001 | 66 | – | 66 | b | – | – | ||||||||||
| ESIP 2002 | 130 | – | – | 130 | 14/08/07 | |||||||||||
| ESIP 2003 | 186 | – | – | 186 | 05/08/08 | |||||||||||
| ESIP 2004 | – | 116 | a | – | 116 | 04/08/09 | ||||||||||
| 382 | 116 | 66 | 432 | |||||||||||||
Former director | ||||||||||||||||
| P Danon | ||||||||||||||||
| ESIP 2002 | 130 | – | – | 130 | 14/08/07 | |||||||||||
| ESIP 2003 | 186 | – | – | 186 | 05/08/08 | |||||||||||
| ESIP 2004 | – | 116 | a | – | 116 | 04/08/09 | ||||||||||
| 316 | 116 | – | 432 | |||||||||||||
| a | Awards granted under the BT Group Employee Share Investment Plan on 4 August 2004. On that date the market price of a BT Group share was 181p. |
| b | Awards granted under the BT Employee Share Ownership Scheme on 30 July 2001 vested on 30 July 2004. On 2 August 2004, the first dealing day after that date, the market price of a BT Group share was 190p. The market price on the date of award was 482p. |
| c | Date of appointment, 7 February 2005. |
Operating Committee
The aggregate remuneration of members of the Operating Committee (OC), other than directors, for services in all capacities during the financial year 2004/05 was as follows:
| 2005 £000 | 2004 £000 | ||||||
| Salaries and benefits | 296 | 296 | |||||
| Annual bonuses | 104 | 198 | |||||
| Provision for long-term incentive awards | 346 | 268 | |||||
| Company pension fund contributions | 34 | 34 | |||||
Total | 780 | 796 | |||||
No options were granted under the BT Group Employee Sharesave Scheme to OC members, other than to directors, during the financial year 2004/05 (2004 – Nil).
The members of the OC beneficially own less than 1% of the company’s outstanding ordinary shares.
By order of the Board
Sir Anthony Greener
Deputy Chairman and Chairman of Remuneration Committee
18 May 2005
| 68 BT Group plc Annual Report and Form 20-F 2005 | Report on directors’ remuneration |
Statement of directors’ responsibility
for preparing the financial statements
The directors consider that, in preparing the financial statements for the year ended 31 March 2005, on pages 71 to 122 the company has used appropriate accounting policies, consistently applied and supported by reasonable and prudent judgements and estimates. The directors also consider that all applicable accounting standards have been followed and confirm that the financial statements have been prepared on the going concern basis.
The directors are responsible for ensuring that the company keeps accounting records which disclose with reasonable accuracy at any time the financial position of the company and which enable them to ensure that the financial statements comply with the Companies Act 1985.
The directors are also responsible for taking such steps that are reasonably open to them to safeguard the assets of the group and to prevent and detect fraud and other irregularities.
The auditors’ responsibilities are stated in their report to the shareholders.
| BT Group plc Annual Report and Form 20-F 2005 69 |
Report of the independent auditors
Report of Independent Registered Public Accounting Firm to the board of directors and shareholders of BT Group plc |
Accounting principles generally accepted in the United Kingdom vary in certain important respects from accounting principles generally accepted in the United States of America. Information relating to the nature and effect of such differences is presented in the United States Generally Accepted Accounting Principles section.
As discussed in Note 1 to the financial statements the company changed its method for accounting for the employee benefit trust in 2005.
PricewaterhouseCoopers LLP
Chartered Accountants and Registered Auditors
London
18 May 2005
| 70 BT Group plc Annual Report and Form 20-F 2005 |
Consolidated financial statements
| The consolidated financial statements are divided into the following sections: | ||
| 72 | ||
| 75 | ||
| 78 | ||
| 79 | ||
| 80 | ||
| 81 | ||
| 81 | ||
| 81 | ||
| 84 | ||
| 84 | ||
| 85 | ||
| 85 | ||
| 85 | ||
| 86 | ||
| 86 | ||
| 87 | ||
| 87 | ||
| 87 | ||
| 88 | ||
| 88 | ||
| 88 | ||
| 91 | ||
| 91 | ||
| 92 | ||
| 93 | ||
| 94 | ||
| 94 | ||
| 94 | ||
| 95 | ||
| 95 | ||
| 96 | ||
| 96 | ||
| 96 | ||
| 97 | ||
| 102 | ||
| 102 | ||
| 102 | ||
| 105 | ||
| 106 | ||
| 110 | ||
| 111 |
| BT Group plc Annual Report and Form 20-F 2005 71 |
Accounting policies
| i | Basis of preparation of the financial statements |
The preparation of financial statements requires management to make estimates and assumptions that affect the reported amounts of assets and liabilities and disclosure of contingent assets and liabilities at the date of the financial statements and the reported amounts of income and expenditure during the reporting period. Actual results could differ from those estimates. Estimates are used principally when accounting for interconnect income, provision for doubtful debts, payments to telecommunication operators, long-term contracts, depreciation, goodwill amortisation and impairment, employee pension schemes, provisions for liabilities and charges and taxes.
| ii | Turnover |
Total turnover is group turnover together with the group’s share of its associates’ and joint ventures’ turnover.
Turnover from calls is recognised in the group profit and loss account at the time the call is made over the group’s networks. Turnover from rentals is recognised evenly over the period to which the charges relate. Turnover from equipment sales is recognised at the point of sale. Prepaid call card sales are deferred until the customer uses the stored value in the card to pay for the relevant calls. Turnover arising from the provision of other services, including maintenance contracts, is recognised evenly over the periods in which the service is provided to the customer. Turnover from installation and connection activities is recognised in the period in which it is earned. Turnover from long term contracts is recognised throughout the duration of the contract, to the extent that the outcome of the contract can be assessed with reasonable certainty and in accordance with the stage of completion of contractual obligations. Turnover from classified directories, mainly comprising advertising revenue, is recognised in the group profit and loss account upon completion of delivery.
| iii | Research and development |
| iv | Leases |
Operating lease rentals are charged against the profit and loss account on a straight-line basis over the lease period except where the contractual payment terms are considered to be a more systematic and appropriate basis.
| v | Interest |
| vi | Foreign currencies |
Exchange differences arising from the retranslation at year end exchange rates of the net investment in foreign undertakings, less exchange differences on borrowings which finance or provide a hedge against those undertakings, are taken to reserves and are reported in the statement of total recognised gains and losses.
All other exchange gains or losses are dealt with through the profit and loss account.
| vii | Intangibles |
| (a) | Goodwill |
Prior to becoming a subsidiary undertaking, Albacom SpA was accounted for as a joint venture. In accordance with FRS 2 ‘Accounting for subsidiary undertakings’, and in order to give a true and fair view, purchased goodwill has been calculated as the sum of goodwill arising on each purchase of shares in Albacom and represents a departure from the statutory method. See note 15 for further information.
For acquisitions completed on or after 1 April 1998, the goodwill arising is capitalised as an intangible asset or, if arising in respect of an associate or joint venture, recorded as part of the related investment. Goodwill is amortised on a straight line basis from the time of acquisition over its useful economic life. The economic life is normally presumed to be a maximum of 20 years.
For acquisitions on or before 31 March 1998, the goodwill is written off on acquisition against group reserves.
If an undertaking is subsequently divested, the appropriate unamortised goodwill or goodwill written off to reserves is dealt with through the profit and loss account in the period of disposal as part of the gain or loss on divestment.
| 72 BT Group plc Annual Report and Form 20-F 2005 |
| (b) | Other intangibles |
| viii | Tangible fixed assets |
| (a) | Cost |
| (b) | Depreciation |
The lives assigned to other significant tangible fixed assets are:
| Freehold buildings – | 40 years | ||
| Leasehold land and buildings – | Unexpired portion of lease or 40 years, whichever is the shorter | ||
| Transmission equipment: | |||
| duct – | 25 years | ||
| cable – | 3 to 25 years | ||
| radio and repeater equipment – | 2 to 25 years | ||
| Exchange equipment – | 2 to 13 years | ||
| Computers and office equipment – | 3 to 6 years | ||
| Payphones, other network equipment, motor vehicles and cableships – | 2 to 20 years | ||
| Software – | 2 to 5 years |
| ix | Fixed asset investments |
Investments in associates and joint ventures are stated in the group balance sheet at the group’s share of their net assets, together with any attributable unamortised goodwill on acquisitions arising on or after 1 April 1998.
The group’s share of profits less losses of associates and joint ventures is included in the group profit and loss account.
Investments in other participating interests and other investments are stated at cost less amounts written off.
| x | Asset impairment |
An impairment loss is recognised to the extent that the carrying amount cannot be recovered either by selling the asset or by the discounted future cash flows from operating the assets.
| xi | Stocks |
Equipment held and consumable items are stated at the lower of cost and estimated net realisable value, after provisions for obsolescence.
Work in progress on long-term contracts is stated at cost, after deducting payments on account, less provisions for any foreseeable losses.
| xii | Debtors |
| xiii | Redundancy costs |
If the estimated cost of providing incremental pension benefits in respect of employees leaving the group exceeds any total accounting surplus based on the latest actuarial valuation of the group’s pension scheme and the amount of the provision for pension liabilities on the balance sheet, then the excess estimated cost is charged against profit in the year in which the employees agree to leave the group, within redundancy or leaver costs.
| xiv | Pension schemes |
The cost of providing pensions is charged against profits over employees’ working lives with the group using the projected unit method. Variations from this regular cost are allocated on a straight-line basis over the average remaining service lives of current employees to the extent that these variations do not relate to the estimated cost of providing incremental pension benefits in the circumstances described in xiii above.
Interest is accounted for on the provision or prepayment in the balance sheet which results from differences between amounts recognised as pension costs and amounts funded. The regular pension cost, variations from the regular pension cost, described above, and interest are all charged within staff costs.
The group also operates defined contribution pension schemes and the profit and loss account is charged with the contributions payable.
| Accounting policies | BT Group plc Annual Report and Form 20-F 2005 73 |
| xv | Taxation |
| xvi | Financial instruments |
| (a) | Debt instruments |
| (b) | Derivative financial instruments |
| Criteria to qualify for hedge accounting |
| Accounting for derivative financial instruments |
Interest differentials, under interest rate swap agreements used to vary the amounts and periods for which interest rates on borrowings are fixed, are recognised by adjustment of interest payable.
The forward exchange contracts used to change the currency mix of net debt are revalued to balance sheet rates with net unrealised gains and losses being shown as part of debtors, creditors, or as part of net debt. The difference between spot and forward rate for these contracts is recognised as part of net interest payable over the term of the contract.
The forward exchange contracts hedging transaction exposures are revalued at the prevailing forward rate on the balance sheet date with net unrealised gains and losses being shown as debtors and creditors.
Instruments that form hedges against future fixed-rate bond issues are marked to market. Gains or losses are deferred until the bond is issued when they are recognised evenly over the term of the bond.
| 74 BT Group plc Annual Report and Form 20-F 2005 | Accounting policies |
Group profit and loss account
for the year ended 31 March 2005
| Notes | Before goodwill amortisation and exceptional items £m | Goodwill amortisation and exceptional items £m | Total £m | ||||||||||
Total turnover | 2 | 19,031 | – | 19,031 | |||||||||
| Group’s share of joint ventures’ turnover | 3 | (355 | ) | – | (355 | ) | |||||||
| Group’s share of associates’ turnover | 3 | (53 | ) | – | (53 | ) | |||||||
Group turnover | 2 | 18,623 | – | 18,623 | |||||||||
| Other operating income | 171 | – | 171 | ||||||||||
| Operating costs | 4 | (15,930 | ) | (75 | ) | (16,005 | ) | ||||||
| Group operating profit (loss) | 2,864 | (75 | ) | 2,789 | |||||||||
| Group’s share of operating loss of joint ventures | 5 | (6 | ) | (25 | ) | (31 | ) | ||||||
| Group’s share of operating profit of associates | 5 | 6 | – | 6 | |||||||||
| Total operating profit (loss) | 2,864 | (100 | ) | 2,764 | |||||||||
| Profit on sale of fixed asset investments | 6 | – | 358 | 358 | |||||||||
| Profit on sale of property fixed assets | 22 | – | 22 | ||||||||||
| Interest receivable | 7 | 265 | – | 265 | |||||||||
| Interest payable | 8 | (1,066 | ) | – | (1,066 | ) | |||||||
Profit on ordinary activities before taxation | 2,085 | 258 | 2,343 | ||||||||||
| Tax on profit on ordinary activities | 9 | (539 | ) | 16 | (523 | ) | |||||||
Profit on ordinary activities after taxation | 1,546 | 274 | 1,820 | ||||||||||
| Minority interests | 10 | 1 | – | 1 | |||||||||
| Profit for the financial year | 1,547 | 274 | 1,821 | ||||||||||
| Dividends | 11 | (883 | ) | ||||||||||
Retained profit for the financial year | 25 | 938 | |||||||||||
Basic earnings per share | 12 | 18.1 | p | 21.4 | p | ||||||||
Diluted earnings per share | 12 | 18.0 | p | 21.2 | p | ||||||||
| BT Group plc Annual Report and Form 20-F 2005 75 |
Group profit and loss account
for the year ended 31 March 2004
| Notes | Before goodwill amortisation and exceptional items £m | Goodwill amortisation and exceptional items £m | Total £m | ||||||||||
Total turnover | 2 | 18,914 | – | 18,914 | |||||||||
| Group’s share of joint ventures’ turnover | 3 | (352 | ) | – | (352 | ) | |||||||
| Group’s share of associates’ turnover | 3 | (43 | ) | – | (43 | ) | |||||||
Group turnover | 2 | 18,519 | – | 18,519 | |||||||||
| Other operating income | 177 | – | 177 | ||||||||||
| Operating costs | 4 | (15,807 | ) | (19 | ) | (15,826 | ) | ||||||
| Group operating profit (loss) | 2,889 | (19 | ) | 2,870 | |||||||||
| Group’s share of operating loss of joint ventures | 5 | (12 | ) | (26 | ) | (38 | ) | ||||||
| Group’s share of operating profit of associates | 5 | 4 | – | 4 | |||||||||
| Total operating profit (loss) | 2,881 | (45 | ) | 2,836 | |||||||||
| Profit on sale of fixed asset investments | 6 | 4 | 34 | 38 | |||||||||
| Loss on sale of group undertakings | 6 | – | (2 | ) | (2 | ) | |||||||
| Profit on sale of property fixed assets | 14 | – | 14 | ||||||||||
| Interest receivable | 7 | 264 | 34 | 298 | |||||||||
| Interest payable | 8 | (1,150 | ) | (89 | ) | (1,239 | ) | ||||||
Profit (loss) on ordinary activities before taxation | 2,013 | (68 | ) | 1,945 | |||||||||
| Tax on profit (loss) on ordinary activities | 9 | (568 | ) | 29 | (539 | ) | |||||||
Profit (loss) on ordinary activities after taxation | 1,445 | (39 | ) | 1,406 | |||||||||
| Minority interests | 10 | 8 | – | 8 | |||||||||
| Profit (loss) for the financial year | 1,453 | (39 | ) | 1,414 | |||||||||
| Dividends | 11 | (732 | ) | ||||||||||
Retained profit for the financial year | 25 | 682 | |||||||||||
Basic earnings per share | 12 | 16.9 | p | 16.4 | p | ||||||||
Diluted earnings per share | 12 | 16.8 | p | 16.3 | p | ||||||||
| Restated following adoption of UITF17 and UITF38 (see note 1) |
| 76 BT Group plc Annual Report and Form 20-F 2005 |
for the year ended 31 March 2003
| Notes | Before goodwill amortisation and exceptional items £m | Goodwill amortisation and exceptional items £m | Total £m | ||||||||||
Total turnover | 2 | 20,182 | – | 20,182 | |||||||||
| Group’s share of joint ventures’ turnover | 3 | (425 | ) | – | (425 | ) | |||||||
| Group’s share of associates’ turnover | 3 | (1,030 | ) | – | (1,030 | ) | |||||||
Group turnover | 2 | 18,727 | – | 18,727 | |||||||||
| Other operating income | 215 | – | 215 | ||||||||||
| Operating costs | 4 | (16,148 | ) | (218 | ) | (16,366 | ) | ||||||
| Group operating profit (loss) | 2,794 | (218 | ) | 2,576 | |||||||||
| Group’s share of operating profit (loss) of joint ventures | 5 | (31 | ) | 150 | 119 | ||||||||
| Group’s share of operating profit (loss) of associates | 5 | 212 | (2 | ) | 210 | ||||||||
| Total operating profit (loss) | 2,975 | (70 | ) | 2,905 | |||||||||
| Profit on sale of fixed asset investments | 6 | – | 1,705 | 1,705 | |||||||||
| Loss on sale of group undertakings | 6 | – | (9 | ) | (9 | ) | |||||||
| Profit on sale of property fixed assets | 11 | – | 11 | ||||||||||
| Interest receivable | 7 | 195 | – | 195 | |||||||||
| Interest payable | 8 | (1,341 | ) | (293 | ) | (1,634 | ) | ||||||
Profit on ordinary activities before taxation | 1,840 | 1,333 | 3,173 | ||||||||||
| Tax on profit on ordinary activities | 9 | (598 | ) | 139 | (459 | ) | |||||||
Profit on ordinary activities after taxation | 1,242 | 1,472 | 2,714 | ||||||||||
| Minority interests | 10 | (5 | ) | (7 | ) | (12 | ) | ||||||
| Profit for the financial year | 1,237 | 1,465 | 2,702 | ||||||||||
| Dividends | 11 | (560 | ) | ||||||||||
Retained profit for the financial year | 25 | 2,142 | |||||||||||
Basic earnings per share | 12 | 14.4 | p | 31.4 | p | ||||||||
Diluted earnings per share | 12 | 14.3 | p | 31.2 | p | ||||||||
| Restated following adoption of UITF17 and UITF38 (see note 1) |
| BT Group plc Annual Report and Form 20-F 2005 77 |
Group statement of total recognised gains and losses
for the year ended 31 March 2005
| 2005 £m | Restated 2004 £m | Restated 2003 £m | ||||||||
| Profit (loss) for the financial year: | ||||||||||
| Group | 1,861 | 1,465 | 2,499 | |||||||
| Joint ventures | (46 | ) | (54 | ) | 103 | |||||
| Associates | 6 | 3 | 100 | |||||||
| Total profit for the financial year | 1,821 | 1,414 | 2,702 | |||||||
| Currency movements arising on consolidation of non-UK: | ||||||||||
| Subsidiaries | 24 | (40 | ) | (18 | ) | |||||
| Joint ventures | 3 | (1 | ) | 5 | ||||||
| Associates | (1 | ) | (1 | ) | 2 | |||||
| Tax on foreign exchange gains taken to reserves | (7 | ) | (47 | ) | 16 | |||||
Total recognised gains and losses for the financial year | 1,840 | 1,325 | 2,707 | |||||||
| Prior year adjustment (note 1) | 21 | |||||||||
| Total recognised gains and losses since last annual report | 1,861 | |||||||||
| 78 BT Group plc Annual Report and Form 20-F 2005 |
Group cash flow statement
for the year ended 31 March 2005
| Notes | 2005 £m | 2004 £m | 2003 £m | ||||||||||
Net cash inflow from operating activities | 13 | 5,898 | 5,389 | 6,023 | |||||||||
Dividends from associates and joint ventures | 2 | 3 | 6 | ||||||||||
Returns on investments and servicing of finance | |||||||||||||
| Interest received | 374 | 673 | 231 | ||||||||||
| Interest paid, including finance costs | (1,252 | ) | (1,200 | ) | (1,737 | ) | |||||||
Net cash outflow for returns on investments and servicing of finance | (878 | ) | (527 | ) | (1,506 | ) | |||||||
Taxation | |||||||||||||
| UK corporation tax paid | (319 | ) | (305 | ) | (425 | ) | |||||||
| Non-UK tax paid | (13 | ) | (12 | ) | (9 | ) | |||||||
Taxation paid | (332 | ) | (317 | ) | (434 | ) | |||||||
Capital expenditure and financial investment | |||||||||||||
| Purchase of tangible fixed assets | (3,056 | ) | (2,684 | ) | (2,580 | ) | |||||||
| Sale of tangible fixed assets | 111 | 76 | 94 | ||||||||||
| Purchase of fixed asset investments | (2 | ) | (1 | ) | (1 | ) | |||||||
| Disposal of fixed asset investments | 539 | 132 | 106 | ||||||||||
Net cash outflow for capital expenditure and financial investment | (2,408 | ) | (2,477 | ) | (2,381 | ) | |||||||
| Free cash flow before acquisitions, disposals and dividends | 2,282 | 2,071 | 1,708 | ||||||||||
Acquisitions and disposals | |||||||||||||
| Purchase of subsidiary undertakings, net of £208m cash acquired (2004 – £1m, 2003 – £13m) | (426 | ) | (32 | ) | 56 | ||||||||
| Investments in joint ventures | (27 | ) | (29 | ) | (133 | ) | |||||||
| Disposal of subsidiary undertakings | – | – | 3 | ||||||||||
| Sale of investments in joint ventures and associates | 35 | 1 | 2,916 | ||||||||||
Net cash (outflow) inflow for acquisitions and disposals | (418 | ) | (60 | ) | 2,842 | ||||||||
Equity dividends paid | (784 | ) | (645 | ) | (367 | ) | |||||||
Cash inflow before management of liquid resources and financing | 1,080 | 1,366 | 4,183 | ||||||||||
Management of liquid resources | 14 | 587 | 1,123 | (1,729 | ) | ||||||||
Financing | |||||||||||||
| Issue of ordinary share capital | – | – | 42 | ||||||||||
| Amounts received in respect of employee share plans | 2 | – | – | ||||||||||
| Repurchase of ordinary share capital | (195 | ) | (144 | ) | – | ||||||||
| New loans | 5 | 1,326 | 20 | ||||||||||
| Repayment of loans | (1,297 | ) | (3,627 | ) | (2,471 | ) | |||||||
| Net decrease in short-term borrowings | – | – | (64 | ) | |||||||||
Net cash outflow from financing | (1,485 | ) | (2,445 | ) | (2,473 | ) | |||||||
Increase (decrease) in cash in the year | 182 | 44 | (19 | ) | |||||||||
Decrease in net debt in the year resulting from cash flows | 16 | 887 | 1,222 | 4,225 | |||||||||
| BT Group plc Annual Report and Form 20-F 2005 79 |
Group balance sheet
as at 31 March 2005
| Notes | 2005 £m | Restated 2004 £m | ||||||||
Fixed assets | ||||||||||
| Intangible assets | 17 | 623 | 204 | |||||||
| Tangible assets | 18 | 15,916 | 15,487 | |||||||
| Investments in joint ventures: | 19 | |||||||||
| Share of gross assets and goodwill | 305 | 496 | ||||||||
| Share of gross liabilities | (225 | ) | (399 | ) | ||||||
| Total investments in joint ventures | 80 | 97 | ||||||||
| Investments in associates | 19 | 28 | 24 | |||||||
| Other investments | 19 | 7 | 203 | |||||||
| Total investments | 19 | 115 | 324 | |||||||
Total fixed assets | 16,654 | 16,015 | ||||||||
Current assets | ||||||||||
| Stocks | 106 | 89 | ||||||||
Debtors: | ||||||||||
| Falling due within one year | 4,269 | 4,017 | ||||||||
| Falling due after more than one year | 1,118 | 1,172 | ||||||||
Total debtors | 20 | 5,387 | 5,189 | |||||||
| Investments | 21 | 4,597 | 5,163 | |||||||
| Cash at bank and in hand | 206 | 109 | ||||||||
Total current assets | 10,296 | 10,550 | ||||||||
Creditors: amounts falling due within one year | ||||||||||
| Loans and other borrowings | 22 | 4,498 | 1,271 | |||||||
| Other creditors | 23 | 7,963 | 7,252 | |||||||
Total creditors: amounts falling due within one year | 12,461 | 8,523 | ||||||||
Net current (liabilities) assets | (2,165 | ) | 2,027 | |||||||
Total assets less current liabilities | 14,489 | 18,042 | ||||||||
Creditors: amounts falling due after more than one year | ||||||||||
| Loans and other borrowings | 22 | 8,091 | 12,426 | |||||||
Provisions for liabilities and charges | ||||||||||
| Deferred taxation | 24 | 2,174 | 2,191 | |||||||
| Other | 24 | 323 | 313 | |||||||
Total provisions for liabilities and charges | 2,497 | 2,504 | ||||||||
Minority interests | 50 | 46 | ||||||||
Capital and reserves | ||||||||||
| Called up share capital | 25, 34 | 432 | 432 | |||||||
| Share premium account | 25 | 3 | 2 | |||||||
| Capital redemption reserve | 25 | 2 | 2 | |||||||
| Other reserves | 25 | 998 | 998 | |||||||
| Profit and loss account | 25 | 2,416 | 1,632 | |||||||
Total equity shareholders’ funds | 25 | 3,851 | 3,066 | |||||||
| 14,489 | 18,042 | |||||||||
| Restated following adoption of UITF17 and UITF38 (see note 1) |
The financial statements on pages 71 to 122 were approved by the board of directors on 18 May 2005 and were signed on its behalf by
Sir Christopher Bland
Chairman
Ben Verwaayen
Chief Executive
Hanif Lalani
Group Finance Director
| 80 BT Group plc Annual Report and Form 20-F 2005 |
Notes to the financial statements
| 1. | Changes in accounting policy and presentation |
An additional charge of £3 million and a credit of £16 million for the 2004 and 2003 financial years, respectively has been made to the group profit and loss account. The effect on the group’s balance sheet at 1 April 2002 has been to reduce fixed assets by £177 million, to reduce other creditors by £25 million and to reduce shareholders’ funds by £152 million. The prior year adjustment in the statement of total recognised gains and losses is £21 million. Had we not adopted this change the charge to the profit and loss account would have been £18 million higher in the 2005 financial year.
A small number of changes in the presentation of the notes to the financial statements have been made and comparative figures have been restated accordingly as explained in the notes where material.
The turnover of each line of business is derived as follows:
| BT Retail derives its turnover from the supply of exchange lines and from the calls made over these lines, the provision of ICT products and services, the leasing of private circuits and other private services, the sale and rental of customer premises equipment to the group’s UK customers and other lines of business and from its narrowband and broadband internet access products. |
| BT Wholesale derives its turnover from providing network services and solutions to communications companies, including fixed and mobile network operators, ISPs (internet service providers) and other service providers, including other BT lines of business, and from carrying transit traffic between telecommunications operators. |
| BT Global Services mainly generates its turnover from the provision of ICT products and services, outsourcing and systems integration work and from the fixed network operations of the group’s European subsidiaries. The business also derives revenues from providing web hosting facilities to end customers and through BT lines of business. |
There is extensive trading between the lines of business and profitability is dependent on the transfer price levels. These intra-group trading arrangements and operating assets are subject to periodic review and have changed in some instances. Comparative figures have been restated for these and other changes and in certain instances have been determined using apportionments and allocations.
| Turnover | Depreciation | Operating profit (loss) of associates | Total | ||||||||||||||||
| External | Internal | Group total | and amortisation | and joint ventures | operating profit (loss) | ||||||||||||||
| Year ended 31 March 2005 | £m | £m | £m | £m | £m | £m | |||||||||||||
| BT Retail | 12,115 | 447 | 12,562 | 134 | 1 | 1,116 | |||||||||||||
| BT Wholesale | 3,812 | 5,167 | 8,979 | 1,909 | – | 1,940 | |||||||||||||
| BT Global Services | 2,671 | 3,710 | 6,381 | 584 | (31 | ) | (35 | ) | |||||||||||
| Other | 25 | – | 25 | 229 | 5 | (257 | ) | ||||||||||||
| Intra-group | – | (9,324 | ) | (9,324 | ) | – | – | – | |||||||||||
Group totals | 18,623 | – | 18,623 | 2,856 | (25 | ) | 2,764 | ||||||||||||
| Turnover | Depreciation | Operating profit (loss) of associates | Total | ||||||||||||||||
| External | Internal | Group total | and amortisation | and joint ventures | operating profit (loss) | ||||||||||||||
| Year ended 31 March 2004 | £m | £m | £m | £m | £m | £m | a | ||||||||||||
| BT Retail | 12,602 | 338 | 12,940 | 163 | 1 | 1,232 | |||||||||||||
| BT Wholesale | 3,473 | 5,410 | 8,883 | 1,919 | – | 1,884 | |||||||||||||
| BT Global Services | �� | 2,410 | 3,372 | 5,782 | 624 | (37 | ) | (153 | ) | ||||||||||
| Other | 34 | 1 | 35 | 230 | 2 | (127 | ) | ||||||||||||
| Intra-group | – | (9,121 | ) | (9,121 | ) | – | – | – | |||||||||||
Group totals | 18,519 | – | 18,519 | 2,936 | (34 | ) | 2,836 | ||||||||||||
| a | Restated – see note 1 |
| BT Group plc Annual Report and Form 20-F 2005 81 |
| 2. | Segmental analysis continued |
| Turnover | Depreciation | Operating profit (loss) of associates | Total | ||||||||||||||||
| External | Internal | Group total | and amortisation | and joint ventures | operating profit (loss) | ||||||||||||||
| Year ended 31 March 2003 | £m | £m | £m | £m | £m | £m | a | ||||||||||||
| BT Retail | 12,979 | 238 | 13,217 | 202 | (3 | ) | 1,212 | ||||||||||||
| BT Wholesale | 3,525 | 5,726 | 9,251 | 1,923 | (1 | ) | 2,069 | ||||||||||||
| BT Global Services | 2,183 | 3,234 | 5,417 | 632 | 180 | (214 | ) | ||||||||||||
| Other | 40 | 1 | 41 | 278 | 153 | (162 | ) | ||||||||||||
| Intra-group | – | (9,199 | ) | (9,199 | ) | – | – | – | |||||||||||
Group totals | 18,727 | – | 18,727 | 3,035 | 329 | 2,905 | |||||||||||||
| a | Restated – see note 1 |
Transactions between divisions are at prices set in accordance with those agreed with Ofcom (and previously Oftel) where the services provided are subject to regulation. Other transactions are at arm’s length.
The following tables show the capital expenditure on plant, equipment and property, the net operating assets or liabilities and the net book value of associates and joint ventures by line of business for the years ended 31 March 2005 and 2004. Net operating assets comprise tangible and intangible fixed assets, stocks, debtors, less creditors (excluding loans and other borrowings) and provisions for liabilities and charges (excluding deferred tax).
| Year ended, or as at, 31 March 2005 | Capital expenditure £m | Net operating assets (liabilities) £m | Interest in associates and joint ventures £m | |||||||
| BT Retail | 154 | (50 | ) | – | ||||||
| BT Wholesale | 1,973 | 11,827 | – | |||||||
| BT Global Services | 628 | 2,147 | 78 | |||||||
| Other | 256 | (178 | ) | 30 | ||||||
Total | 3,011 | 13,746 | 108 | |||||||
| Year ended, or as at, 31 March 2004 | Capital expenditure £m | Net operating assets (liabilities) £m | Interest in associates and joint ventures £m | |||||||
| BT Retail | 118 | (40 | ) | (9 | ) | |||||
| BT Wholesale | 1,809 | 11,940 | – | |||||||
| BT Global Services | 479 | 1,291 | 89 | |||||||
| Other | 267 | 213 | 41 | |||||||
Total | 2,673 | 13,404 | 121 | |||||||
Information about geographic areas:
| 2005 £m | 2004 £m | 2003 £m | ||||||||
Turnover with external customers | ||||||||||
| Attributable to UK | 16,967 | 17,190 | 17,536 | |||||||
Attributable to non-UK countriesa | 1,656 | 1,329 | 1,191 | |||||||
Group turnover | 18,623 | 18,519 | 18,727 | |||||||
| a | Turnover attributable to non-UK countries comprises the external turnover of group companies and branches operating outside the UK. |
| 82 BT Group plc Annual Report and Form 20-F 2005 | Notes to the financial statements |
| 2. | Segmental analysis continued |
| 2005 £m | 2004 £m | a | |||||
Group fixed assets are located | |||||||
| UK | 14,734 | 14,538 | |||||
| Europe, excluding the UK | 1,164 | 1,029 | |||||
| Americas | 633 | 305 | |||||
| Asia and Pacific | 123 | 143 | |||||
Total | 16,654 | 16,015 | |||||
| a | Restated – see note 1 |
Geographical segment analysis in accordance with the requirements of SSAP 25 is as follows:
| 2005 £m | 2004 £m | 2003 £m | ||||||||
Total turnover on basis of origin | ||||||||||
| UK | 16,973 | 17,198 | 17,544 | |||||||
| Europe, excluding the UK | 1,480 | 1,272 | 2,151 | |||||||
| Americas | 206 | 151 | 155 | |||||||
| Asia and Pacific | 372 | 293 | 332 | |||||||
Total | 19,031 | 18,914 | 20,182 | |||||||
| 2005 £m | 2004 £m | 2003 £m | ||||||||
Group turnover on basis of origin | ||||||||||
| UK | 16,967 | 17,190 | 17,536 | |||||||
| Europe, excluding the UK | 1,396 | 1,124 | 978 | |||||||
| Americas | 190 | 151 | 153 | |||||||
| Asia and Pacific | 70 | 54 | 60 | |||||||
Total | 18,623 | 18,519 | 18,727 | |||||||
| 2005 £m | 2004 £m | a | 2003 £m | a | ||||||
Group operating profit (loss) | ||||||||||
| UK | 2,905 | 2,996 | 3,224 | |||||||
| Europe, excluding the UK | (167 | ) | (132 | ) | (627 | ) | ||||
| Americas | 61 | 9 | (28 | ) | ||||||
| Asia and Pacific | (10 | ) | (3 | ) | 7 | |||||
Total | 2,789 | 2,870 | 2,576 | |||||||
| a | Restated – see note 1 |
| 2005 £m | 2004 £m | 2003 £m | ||||||||
Share of operating (losses) profits of associates and joint ventures, including goodwill amortisation | ||||||||||
| UK | – | (1 | ) | (2 | ) | |||||
| Europe, excluding the UK | (43 | ) | (48 | ) | 305 | |||||
| Americas | – | – | (1 | ) | ||||||
| Asia and Pacific | 18 | 15 | 27 | |||||||
Total | (25 | ) | (34 | ) | 329 | |||||
| Notes to the financial statements | BT Group plc Annual Report and Form 20-F 2005 83 |
| 2. | Segmental analysis continued |
| 2005 | 2004 | ||||||||||||||||||
| Net operating assets £m | Interest in associates and joint ventures £m | Total £m | Net operating assets £m | Interest in associates and joint ventures £m | Total £m | ||||||||||||||
| UK | 11,599 | 3 | 11,602 | 11,444 | 7 | 11,451 | |||||||||||||
| Europe, excluding the UK | 1,600 | – | 1,600 | 1,742 | 24 | 1,766 | |||||||||||||
| Americas | 532 | 1 | 533 | 199 | – | 199 | |||||||||||||
| Asia and Pacific | 15 | 104 | 119 | 19 | 90 | 109 | |||||||||||||
Total | 13,746 | 108 | 13,854 | 13,404 | 121 | 13,525 | |||||||||||||
| 3. | Turnover |
| 2005 £m | 2004 £m | 2003 £m | ||||||||
| Joint ventures | 355 | 352 | 425 | |||||||
| Associates | 53 | 43 | 1,030 | |||||||
Total | 408 | 395 | 1,455 | |||||||
| 4. | Operating costs |
| 2005 £m | 2004 £m | a | 2003 £m | a | ||||||
| Staff costs: | ||||||||||
| Wages and salaries | 3,656 | 3,675 | 3,617 | |||||||
| Social security costs | 319 | 316 | 275 | |||||||
Pension costs (note 28) | 465 | 404 | 322 | |||||||
Employee share ownershipb | 11 | 20 | 36 | |||||||
| Total staff costs | 4,451 | 4,415 | 4,250 | |||||||
| Own work capitalised | (722 | ) | (677 | ) | (583 | ) | ||||
Depreciation (note 18) | 2,834 | 2,921 | 3,011 | |||||||
Amortisation and impairment of goodwill and other intangibles (note 17) | 22 | 15 | 24 | |||||||
| Payments to telecommunications operators | 3,725 | 3,963 | 3,940 | |||||||
| Other operating costs | 5,695 | 5,189 | 5,724 | |||||||
Total operating costs | 16,005 | 15,826 | 16,366 | |||||||
| Operating costs included the following: | ||||||||||
| Early leaver costs | 166 | 202 | 276 | |||||||
| Research and development | 257 | 334 | 380 | |||||||
| Rental costs relating to operating leases, including plant and equipment hire of £14 million (2004 – £25 million, 2003 – £34 million) | 326 | 370 | 395 | |||||||
| Foreign currency losses (gains) | 3 | (5 | ) | (12 | ) | |||||
| Amortisation of goodwill and exceptional items comprising: | ||||||||||
| Property rationalisation provision | 59 | – | 198 | |||||||
| Rectification costs | – | 30 | – | |||||||
| BT Wholesale bad debt release | – | (23 | ) | – | ||||||
| Total exceptional items | 59 | 7 | 198 | |||||||
| Goodwill amortisation | 16 | 12 | 20 | |||||||
Total amortisation of goodwill and exceptional items | 75 | 19 | 218 | |||||||
| a | Restated – see note 1 |
| b | Amount set aside for the year for allocation of ordinary shares in the company to eligible employees |
The directors believe that the nature of the group’s business is such that the analysis of operating costs required by the Companies Act 1985 is not appropriate. As required by the Act, the directors have therefore adapted the prescribed format so that operating costs are disclosed in a manner appropriate to the group’s principal activity.
| 84 BT Group plc Annual Report and Form 20-F 2005 | Notes to the financial statements |
| 5. | Group’s share of operating (loss) profit of associates and joint ventures |
| 2005 £m | 2004 £m | 2003 £m | ||||||||
| Joint ventures | (31 | ) | (38 | ) | 119 | |||||
| Associates | 6 | 4 | 210 | |||||||
Group’s share of operating (loss) profit of associates and joint venturesa | (25 | ) | (34 | ) | 329 | |||||
| a | Includes: |
| Exceptional costs relating to impairment of assets in joint ventures | 25 | – | – | ||||||||
| Exceptional costs relating to the impairment of goodwill | – | 26 | – | ||||||||
| Exceptional costs relating to the release of surplus exit costs | – | – | (150 | ) | |||||||
| Amortisation of goodwill arising in joint ventures and associates | – | – | 2 | ||||||||
| 6. | Profit on sale of fixed asset investments and group undertakings |
In December 2004 the group sold its 15.8% interest in Eutelsat SA for net proceeds of £356 million resulting in a profit on disposal of £236 million.
In November 2004 the group completed the sale of its 11.9% shareholding in StarHub Pte Ltd for net proceeds of £77 million resulting in a profit on disposal of £38 million.
Other gains of £38 million were recognised during the year ended 31 March 2005. The net proceeds received in relation to these disposals was £63 million.
In December 2003 the group sold its 7.8% interest in Inmarsat Ventures plc for total cash consideration of US$118 million (£67 million) realising a profit on disposal of £32 million.
Other gains of £6 million and losses of £2 million were recognised during the year ended 31 March 2004. The consideration received in relation to these disposals was £6 million.
In the year ended 31 March 2003, disposals of subsidiary undertakings resulted in losses of £9 million, the consideration received in relation to these disposals was £3 million.
In January 2003, the group sold its 26% interest in Cegetel Groupe SA to Vivendi Universal SA for consideration of €4,000 million (£2,603 million) in cash. The profit on disposal was £1,509 million, before the recognition of an exceptional interest charge of £293 million on closing out fixed interest rate swaps following receipt of the sale proceeds, and includes a write-back of £862 million of goodwill taken directly to reserves before April 1998.
In December 2002, the group sold its interest in Blu SpA for consideration of £29 million. The profit on disposal was £19 million.
In October 2002, the group sold its 2% interest in Mediaset for consideration of £87 million in cash. The profit on disposal was £14 million.
In May 2002 and November 2002, the group sold its remaining holding of shares in BSkyB, received for the exchange of the residual interest in British Interactive Broadcasting, for consideration of £192 million recognising a profit of £131 million.
Other gains of £39 million and losses of £7 million were recognised during the year ended 31 March 2003. These gains and losses included a write-back of £7 million of goodwill taken directly to reserves before April 1998. The consideration received in relation to these disposals was £114 million.
| 7. | Interest receivable |
| 2005 £m | 2004 £m | 2003 £m | ||||||||
| Income from listed investments | 47 | 13 | 2 | |||||||
Other interest receivablea | 209 | 283 | 187 | |||||||
| Group | 256 | 296 | 189 | |||||||
| Joint ventures | 9 | 2 | 1 | |||||||
| Associates | – | – | 5 | |||||||
Total interest receivable | 265 | 298 | 195 | |||||||
| a | Includes an exceptional credit of £34 million in the year ended 31 March 2004 being one off interest recognised on full repayment of loan notes received as part of the original consideration from the disposal of Yell. |
| Notes to the financial statements | BT Group plc Annual Report and Form 20-F 2005 85 |
| 8. | Interest payable |
| 2005 £m | 2004 £m | 2003 £m | ||||||||
| Interest payable and similar charges in respect of: | ||||||||||
| Bank loans and overdrafts | 71 | 87 | 82 | |||||||
| Interest payable on finance leases | 58 | 19 | – | |||||||
Other borrowingsab | 914 | 1,114 | 1,527 | |||||||
| Group | 1,043 | 1,220 | 1,609 | |||||||
| Joint ventures | 23 | 19 | 17 | |||||||
| Associates | – | – | 8 | |||||||
Total interest payable | 1,066 | 1,239 | 1,634 | |||||||
| a | Includes an exceptional charge of £89 million in the year ended 31 March 2004 being the premium on repurchasing £813 million of the group’s issued bonds. |
| b | Includes an exceptional charge of £293 million in the year ended 31 March 2003 on the termination of interest rate swap agreements following the receipt of the Cegetel sale proceeds. |
| 9. | Tax on profit (loss) on ordinary activities |
| 2005 £m | 2004 £m | 2003 £m | ||||||||
| United Kingdom: | ||||||||||
| Corporation tax at 30% | 542 | 328 | 447 | |||||||
| Prior year adjustments | 4 | – | 12 | |||||||
| Non-UK taxation: | ||||||||||
| Current | (4 | ) | 37 | 47 | ||||||
| Taxation on the group’s share of results of associates and joint ventures | 1 | – | 81 | |||||||
| Prior year adjustments | (3 | ) | – | (26 | ) | |||||
Total current taxation | 540 | 365 | 561 | |||||||
| Deferred taxation (credit) charge at 30% | ||||||||||
| Origination and reversal of timing differences | (18 | ) | 184 | (29 | ) | |||||
| Prior year adjustments | 1 | (10 | ) | (73 | ) | |||||
Total deferred taxation | (17 | ) | 174 | (102 | ) | |||||
Total tax on profit (loss) on ordinary activities | 523 | 539 | 459 | |||||||
A tax charge on recognised gains and losses not included in the profit and loss account of £7 million
(2004 – £47 million, 2003 – £16 million) related to exchange movements offset in reserves.
Current tax and total tax on profit on ordinary activities, differs from the amount computed by applying the corporation tax rate to profit on ordinary activities before taxation. The differences were attributable to the following factors:
| 2005 % | 2004 % | 2003 % | ||||||||
| UK corporation tax rate | 30.0 | 30.0 | 30.0 | |||||||
| Non-deductible depreciation, amortisation and impairment | 0.2 | 0.9 | 0.4 | |||||||
| Non-deductible non-UK losses | 1.6 | 1.6 | 3.3 | |||||||
| (Lower) higher taxes on non-UK profits | (0.6 | ) | 0.2 | 0.4 | ||||||
| Excess depreciation over capital allowances | – | 3.2 | 3.4 | |||||||
| Pension provisions and prepayments | 0.7 | (9.9 | ) | (3.2 | ) | |||||
| Other timing differences | 0.1 | (2.8 | ) | 0.7 | ||||||
| Lower effective tax on gain on disposal of fixed asset | ||||||||||
| investments and group undertakings | (4.6 | ) | (1.3 | ) | (16.5 | ) | ||||
| Higher effective tax on gain on disposal of non qualifying assets | – | – | 2.0 | |||||||
| Prior year adjustments | 0.1 | – | (2.0 | ) | ||||||
| Other | (4.4 | ) | (3.2 | ) | (0.8 | ) | ||||
Current tax – effective corporation tax rate | 23.1 | 18.7 | 17.7 | |||||||
| Deferred taxes on excess depreciation over capital allowances | – | (3.2 | ) | (3.4 | ) | |||||
| Pension provisions and prepayments | (0.7 | ) | 9.9 | 3.2 | ||||||
| Other timing differences | (0.1 | ) | 2.8 | (0.7 | ) | |||||
| Prior year adjustments | – | (0.5 | ) | (2.3 | ) | |||||
Total tax – effective corporation tax rate | 22.3 | 27.7 | 14.5 | |||||||
Factors that may affect future tax charges |
As at 31 March 2005, the group had overseas corporate tax losses estimated to be £1 billion which are not recognised as deferred tax assets. In addition, the group has unutilised capital losses estimated to be in excess of £10 billion which were not recognised as deferred tax assets.
| 86 BT Group plc Annual Report and Form 20-F 2005 | Notes to the financial statements |
| 10. | Minority interests |
| 2005 £m | 2004 £m | 2003 £m | ||||||||
| Minority interests in (losses) profits: | ||||||||||
| Group | (1 | ) | (8 | ) | 4 | |||||
| Associates | – | – | 8 | |||||||
Total minority interests | (1 | ) | (8 | ) | 12 | |||||
| 11. | Dividends |
| 2005 pence per share | 2004 pence per share | 2003 pence per share | 2005 £m | 2004 £m | 2003 £m | ||||||||||||||
| Interim dividend paid | 3.90 | 3.20 | 2.25 | 332 | 278 | 194 | |||||||||||||
| Proposed final dividend | 6.50 | 5.30 | 4.25 | 551 | 454 | 366 | |||||||||||||
Total dividends | 10.40 | 8.50 | 6.50 | 883 | 732 | 560 | |||||||||||||
| 12. | Earnings (loss) per share |
In calculating the diluted earnings (loss) per share, share options outstanding and other potential ordinary shares have been taken into account.
The weighted average number of shares in the years were:
| 2005 millions of shares | 2004 millions of shares | 2003 millions of shares | ||||||||
| Basic | 8,524 | 8,621 | 8,616 | |||||||
| Dilutive ordinary shares from share options outstanding and shares held in trust | 57 | 55 | 52 | |||||||
| Total diluted | 8,581 | 8,676 | 8,668 | |||||||
The items in the calculation of earnings (loss) per share before goodwill amortisation and exceptional items were:
| 2005 pence per share | 2004 pence per share | a | 2003 pence per share | a | 2005 £m | 2004 £m | a | 2003 £m | a | ||||||||||
Attributable to exceptional items and goodwill: | |||||||||||||||||||
| Goodwill amortisation | (0.2 | ) | (0.1 | ) | (0.3 | ) | (16 | ) | (12 | ) | (22 | ) | |||||||
| Property rationalisation costs | (0.7 | ) | – | (2.3 | ) | (59 | ) | – | (198 | ) | |||||||||
| Rectification costs | – | (0.3 | ) | – | – | (30 | ) | – | |||||||||||
| BT Wholesale bad debts release | – | 0.2 | – | – | 23 | – | |||||||||||||
| Goodwill impairment in associates and joint ventures | – | (0.3 | ) | – | – | (26 | ) | – | |||||||||||
| Impairment in associates and joint ventures | (0.3 | ) | – | – | (25 | ) | – | – | |||||||||||
| Release of surplus exit costs | – | – | 1.8 | – | – | 150 | |||||||||||||
| Profit on sale of fixed asset investments | 4.3 | 0.4 | 19.8 | 358 | 32 | 1,705 | |||||||||||||
| Loss on sale of group undertakings | – | – | (0.1 | ) | – | – | (9 | ) | |||||||||||
| Finance cost of novating interest rate swaps | – | – | (3.4 | ) | – | – | (293 | ) | |||||||||||
| Interest receivable on Yell loan notes | – | 0.4 | – | – | 34 | – | |||||||||||||
| Premium on repurchasing bonds | – | (1.1 | ) | – | – | (89 | ) | – | |||||||||||
| Tax credit | 0.2 | 0.3 | 1.6 | 16 | 29 | 139 | |||||||||||||
| Minority interest | – | – | (0.1 | ) | – | – | (7 | ) | |||||||||||
Net credit (charge) attributable to exceptional items and goodwill amortisation | 3.3 | (0.5 | ) | 17.0 | 274 | (39 | ) | 1,465 | |||||||||||
Basic earnings per share/profit for the financial year after goodwill amortisation and exceptional items | 21.4 | 16.4 | 31.4 | 1,821 | 1,414 | 2,702 | |||||||||||||
| Less: Basic earnings (loss) per share/profit (loss) for the financial year attributable to exceptional items and goodwill amortisation | 3.3 | (0.5 | ) | 17.0 | 274 | (39 | ) | 1,465 | |||||||||||
Basic earnings per share/profit for the financial year before goodwill amortisation and exceptional items | 18.1 | 16.9 | 14.4 | 1,547 | 1,453 | 1,237 | |||||||||||||
| a | Restated – see note 1 |
| Notes to the financial statements | BT Group plc Annual Report and Form 20-F 2005 87 |
| 13. | Reconciliation of operating profit to operating cash flows |
| 2005 £m | 2004 £m | a | 2003 £m | a | ||||||
| Group operating profit | 2,789 | 2,870 | 2,576 | |||||||
| Depreciation | 2,834 | 2,921 | 3,011 | |||||||
| Amortisation and impairment | 22 | 15 | 24 | |||||||
| (Increase) decrease in stocks | (12 | ) | (6 | ) | 31 | |||||
| Decrease in debtors | 206 | 414 | 764 | |||||||
| Decrease in creditors | (39 | ) | (159 | ) | (306 | ) | ||||
| Decrease (increase) in pension prepayment and increase (decrease) in pension liabilities | 49 | (655 | ) | (314 | ) | |||||
| (Decrease) increase in provisions | (12 | ) | (49 | ) | 171 | |||||
| Other | 61 | 38 | 66 | |||||||
Net cash inflow from operating activities | 5,898 | 5,389 | 6,023 | |||||||
| a | Restated – see note 1 |
| 14. | Management of liquid resources |
| 2005 £m | 2004 £m | 2003 £m | ||||||||
| Purchase of short-term investments and payments into short-term deposits over 3 months | (3,043 | ) | (5,306 | ) | (3,990 | ) | ||||
| Sale of short-term investments and withdrawals from short-term deposits over 3 months | 3,754 | 4,467 | 4,082 | |||||||
| Net movement of short-term investments and short-term deposits under 3 months not repayable on demand | (124 | ) | 1,962 | (1,821 | ) | |||||
Net cash inflow (outflow) from management of liquid resources | 587 | 1,123 | (1,729 | ) | ||||||
| 15. | Acquisitions and disposals |
| Infonet | a | Albacom | b | Other | c | Total | |||||||
| Year ended 31 March 2005 | £m | £m | £m | £m | |||||||||
| Consideration: | |||||||||||||
| Cash | 315 | 93 | 18 | 426 | |||||||||
| Deferred | – | 38 | 1 | 39 | |||||||||
Total | 315 | 131 | 19 | 465 | |||||||||
| Total | d | |||
| Year ended 31 March 2004 | £m | |||
| Consideration: | ||||
| Cash | 33 | |||
| Deferred | 3 | |||
Total | 36 | |||
| Concert | e | Other | f | Total | ||||||
| Year ended 31 March 2003 | £m | £m | £m | |||||||
| Consideration: | ||||||||||
| Cash | – | 13 | 13 | |||||||
| Carrying value of Concert global venture | 338 | – | 338 | |||||||
Total | 338 | 13 | 351 | |||||||
| 88 BT Group plc Annual Report and Form 20-F 2005 | Notes to the financial statements |
| 15. | Acquisitions and disposals continued |
| a | On 25 February 2005 the group acquired Infonet Services Corporation for total consideration of £520 million, including acquisition costs, (£315 million net of cash in the business). This gave rise to goodwill of £264 million. |
| Book value £m | Fair value adjustments £m | Fair value £m | ||||||||
| Fixed assets | 195 | (100 | ) | 95 | ||||||
| Current assets | 93 | (19 | ) | 74 | ||||||
| Current liabilities | (99 | ) | 4 | (95 | ) | |||||
| Provisions for liabilities and charges | (4 | ) | (18 | ) | (22 | ) | ||||
| Minority interest | (1 | ) | – | (1 | ) | |||||
| Group’s share of original book value and fair value of net assets | 184 | (133 | ) | 51 | ||||||
| Goodwill | 264 | |||||||||
Total cost | 315 | |||||||||
Since the acquisition was made towards the end of the year ended 31 March 2005, the fair values of the identifiable assets and liabilities have been determined on a provisional basis. Goodwill arising on acquisition of Infonet is being amortised over 20 years.
In the period from 1 April 2004 to 24 February 2005 Infonet generated operating losses after tax of US$83 million (year to 31 March 2004 – US$66 million losses).
| b | In December 2004 the group agreed to acquire the 74% interest in Albacom SpA not already held, giving BT full ownership for total consideration of £131 million, including deferred consideration of £38 million. The deferred consideration is dependent upon the financial performance of Albacom in the 2009 financial year and the minimum payable is £38 million. The transaction completed 4 February 2005. This gave rise to goodwill of £9 million. Prior to becoming a subsidiary undertaking, Albacom SpA was accounted for as a joint venture undertaking. In accordance with FRS 2 ‘Accounting for Subsidiary Undertakings’, and in order to give a true and fair view, purchased goodwill has been calculated as the sum of the goodwill arising on each purchase of shares in Albacom, being the difference at the date of each purchase between the fair value of the consideration given and the fair value of the identifiable assets and liabilities attributable to the interest purchased. This represents a departure from the statutory method, under which goodwill is calculated as the difference between cost and fair value on the date that Albacom became a subsidiary undertaking. The statutory method would not give a true and fair view because it would result in the group’s share of Albacom’s retained reserves, during the period that it was a joint venture undertaking, being recharacterised as goodwill. The effect of this departure is to reduce retained profits by £313 million, and to reduce purchased goodwill by £313 million. |
| Book value £m | Fair value adjustments £m | Fair value £m | ||||||||
| Fixed assets | 378 | (11 | ) | 367 | ||||||
| Current assets | 211 | – | 211 | |||||||
| Current liabilities | (301 | ) | (14 | ) | (315 | ) | ||||
| Long-term debt | (139 | ) | – | (139 | ) | |||||
| Minority interest | (2 | ) | – | (2 | ) | |||||
| Group’s share of original book value and fair value of net assets | 147 | (25 | ) | 122 | ||||||
| Goodwill | 9 | |||||||||
Total cost | 131 | |||||||||
Since the acquisition was made towards the end of the year ended 31 March 2005, the fair values of the identifiable assets and liabilities have been determined on a provisional basis. Goodwill arising on the acquisition of Albacom is being amortised over 20 years.
In the period from 1 April 2004 to 3 February 2005 Albacom generated operating losses after tax of €195 million (year to 31 March 2004 – €263 million losses).
| Notes to the financial statements | BT Group plc Annual Report and Form 20-F 2005 89 |
| 15. | Acquisitions and disposals continued |
| c | During the year ended 31 March 2005, the acquisition of other subsidiary companies and businesses was principally BIC Systems Group Ltd and the consideration given comprised: |
| Book value and fair value £m | ||||
| Fixed assets | 1 | |||
| Current assets | 4 | |||
| Current liabilities | (2 | ) | ||
| Group’s share of original book value and fair value of net assets | 3 | |||
| Goodwill | 16 | |||
Total cost | 19 | |||
| d | On 5 January 2004 the group acquired the UK trade and assets of BT Expedite Limited (formerly NSB Retail plc) for consideration of £17 million (£2 million deferred). The net liabilities acquired amounted to £1 million giving rise to goodwill of £18 million which is being amortised over a period of 5 years. On 15 March 2004 the group acquired controlling interest in Transcomm plc for consideration of £15 million. The group’s share of the net assets acquired was £2 million giving rise to goodwill of £13 million which is being amortised over a period of 13 years. On 13 January 2004 the group took full control of Siosistemi SpA for consideration of £4 million including deferred consideration of £1 million. Net assets of £1 million were acquired giving rise to goodwill of £4 million which is being amortised over a period of 10 years. |
| e | On completion of the unwind of Concert on 1 April 2002, the former Concert businesses, customer accounts and networks were returned to the two parent companies with BT and AT&T each taking ownership of substantially those parts of the Concert global venture originally contributed by them. As part of the settlement with AT&T for the unwind of the Concert global venture BT received net cash of US$72 million (£56 million). This net settlement included the receipt of US$350 million reflecting the allocation of the businesses and the payment of US$278 million to achieve the equal division of specified working capital and other liability balances. The results of the acquired businesses, both pre and post acquisition, cannot be separately identified and, therefore, cannot be reported. |
| Book value and fair value £m | ||||
| Fixed assets | 398 | |||
| Current assets | 301 | |||
| Current liabilities | (405 | ) | ||
| Provisions for liabilities and charges | (2 | ) | ||
| Long-term debt | (10 | ) | ||
| Group’s share of original book value and fair value of net assets | 282 | |||
| Net receivable from AT&T | 56 | |||
| Total net assets acquired | 338 | |||
| Goodwill | – | |||
Total cost | 338 | |||
| f | During the year ended 31 March 2003, the acquisition of other subsidiary companies and businesses and the consideration given comprised: |
| Book value and fair value £m | ||||
| Fixed assets | 1 | |||
| Current liabilities | (1 | ) | ||
| Group’s share of original book value and fair value of net assets | – | |||
| Goodwill | 13 | |||
Total cost | 13 | |||
Acquisition of associates and joint ventures |
Disposal of subsidiaries |
| 90 BT Group plc Annual Report and Form 20-F 2005 | Notes to the financial statements |
| 16. | Net debt |
| At 1 April 2004 £m | Cash flow £m | Acquisition of subsidiary undertakings £m | Other non-cash changes £m | Currency movement £m | At 31 March 2005 £m | ||||||||||||||
Analysis of net debt | |||||||||||||||||||
| Cash in hand and at bank | 109 | 97 | – | – | – | 206 | |||||||||||||
| Overnight deposits | 292 | 85 | – | – | – | 377 | |||||||||||||
| Bank overdrafts | (2 | ) | – | – | – | – | (2 | ) | |||||||||||
| 399 | 182 | – | – | – | 581 | ||||||||||||||
| Other current asset investments | 4,871 | (587 | ) | – | (64 | ) | – | 4,220 | |||||||||||
Short-term investments and cash, less bank overdrafts | 5,270 | (405 | ) | – | (64 | ) | – | 4,801 | |||||||||||
| Debt due within one year, excluding bank overdrafts | (1,269 | ) | 1,215 | (20 | ) | (4,422 | ) | – | (4,496 | ) | |||||||||
| Debt due after one year | (12,426 | ) | 77 | (139 | ) | 4,399 | (2 | ) | (8,091 | ) | |||||||||
Total debt, excluding bank overdrafts | (13,695 | ) | 1,292 | (159 | ) | (23 | ) | (2 | ) | (12,587 | ) | ||||||||
Net debt | (8,425 | ) | 887 | (159 | ) | (87 | ) | (2 | ) | (7,786 | ) | ||||||||
| 2005 £m | 2004 £m | 2003 £m | ||||||||
Reconciliation of net cash flow to movement in net debt | ||||||||||
| Increase (decrease) in cash in the year | 182 | 44 | (19 | ) | ||||||
| Cash outflow from decrease in debt | 1,292 | 2,301 | 2,515 | |||||||
| Cash (outflow) inflow from increase in liquid resources | (587 | ) | (1,123 | ) | 1,729 | |||||
| Decrease in net debt resulting from cash flows | 887 | 1,222 | 4,225 | |||||||
| Currency and translation movements | (2 | ) | (4 | ) | (67 | ) | ||||
| (Increase) decrease in net debt on acquisition or disposal of subsidiary undertakings | (159 | ) | (1 | ) | 13 | |||||
| Other non-cash movements | (87 | ) | (69 | ) | (43 | ) | ||||
| Decrease in net debt in the year | 639 | 1,148 | 4,128 | |||||||
| Net debt at 1 April | (8,425 | ) | (9,573 | ) | (13,701 | ) | ||||
Net debt at 31 March | (7,786 | ) | (8,425 | ) | (9,573 | ) | ||||
| 17. | Intangible fixed assets |
| Goodwill £m | Telecommunication licences and other £m | Total £m | ||||||||
Cost | ||||||||||
| 1 April 2004 | 2,585 | 9 | 2,594 | |||||||
| Acquisitions | 289 | 192 | 481 | |||||||
| Disposals | (1 | ) | – | (1 | ) | |||||
| Currency movements | (3 | ) | 1 | (2 | ) | |||||
Total cost at 31 March 2005 | 2,870 | 202 | 3,072 | |||||||
Amortisation | ||||||||||
| 1 April 2004 | 2,383 | 7 | 2,390 | |||||||
| Acquisitions | – | 38 | 38 | |||||||
| Charge for the year | 16 | 6 | 22 | |||||||
| Disposals | (1 | ) | – | (1 | ) | |||||
Total amortisation at 31 March 2005 | 2,398 | 51 | 2,449 | |||||||
Net book value at 31 March 2005 | 472 | 151 | 623 | |||||||
| Net book value at 31 March 2004 | 202 | 2 | 204 | |||||||
| Notes to the financial statements | BT Group plc Annual Report and Form 20-F 2005 91 |
| 18. | Tangible fixed assets |
| Land and buildings £m | a | Plant and equipment £m | b | Assets in course of construction £m | Total £m | ||||||||
Cost | �� | ||||||||||||
| 1 April 2004 | 929 | 35,579 | 820 | 37,328 | |||||||||
| Acquisitions of subsidiary undertakings | 96 | 724 | 23 | 843 | |||||||||
Additionsc | 9 | 601 | 2,394 | 3,004 | |||||||||
| Transfers | 49 | 2,218 | (2,267 | ) | – | ||||||||
| Disposals and adjustments | (120 | ) | (1,067 | ) | (15 | ) | (1,202 | ) | |||||
| Currency movements | 2 | 53 | 1 | 56 | |||||||||
Total cost at 31 March 2005 | 965 | 38,108 | 956 | 40,029 | |||||||||
Depreciation | |||||||||||||
| 1 April 2004 | 340 | 21,566 | – | 21,906 | |||||||||
| Acquisitions of subsidiary undertakings | 41 | 489 | – | 530 | |||||||||
| Charge for the year | 45 | 2,789 | – | 2,834 | |||||||||
| Disposals and adjustments | (66 | ) | (1,053 | ) | – | (1,119 | ) | ||||||
| Currency movements | 1 | 33 | – | 34 | |||||||||
Total depreciation at 31 March 2005 | 361 | 23,824 | – | 24,185 | |||||||||
Net book value at 31 March 2005 | 604 | 14,284 | 956 | 15,844 | |||||||||
| Engineering stores | – | – | 72 | 72 | |||||||||
Total tangible fixed assets at 31 March 2005 | 604 | 14,284 | 1,028 | 15,916 | |||||||||
| Net book value at 31 March 2004 | 589 | 14,013 | 820 | 15,422 | |||||||||
| Engineering stores | – | – | 65 | 65 | |||||||||
| Total tangible fixed assets at 31 March 2004 | 589 | 14,013 | 885 | 15,487 | |||||||||
| 2005 £m | 2004 £m | |||||||
a | The net book value of land and buildings comprised: | |||||||
| Freehold | 373 | 363 | ||||||
| Long leases (over 50 years unexpired) | 50 | 13 | ||||||
| Short leases | 181 | 213 | ||||||
Total net book value of land and buildings | 604 | 589 | ||||||
| b | The net book value of assets held under finance leases included within plant and equipment was £503 million at 31 March 2005 (2004 – £620 million). The depreciation charge for the year to 31 March 2005 on those assets was £154 million (2004 – £174 million). |
| 2005 £m | 2004 £m | |||||||
c | Expenditure on tangible fixed assets comprised: | |||||||
| Plant and equipment | ||||||||
| Transmission equipment | 1,488 | 1,324 | ||||||
| Exchange equipment | 143 | 150 | ||||||
| Other network equipment | 648 | 585 | ||||||
| Computers and office equipment | 312 | 205 | ||||||
| Motor vehicles and other | 349 | 316 | ||||||
| Land and buildings | 64 | 73 | ||||||
| 3,004 | 2,653 | |||||||
| Increase in engineering stores | 7 | 20 | ||||||
Total expenditure on tangible fixed assets | 3,011 | 2,673 | ||||||
| 92 BT Group plc Annual Report and Form 20-F 2005 | Notes to the financial statements |
| 19. | Fixed asset investments |
| Interests in associates and joint ventures | b | |||||||||||||||
| Shares £m | Loans £m | Share of post acquisition losses £m | Other investments £m | c | Total £m | |||||||||||
Cost | ||||||||||||||||
| 1 April 2004 as previously stated | 608 | 28 | (302 | ) | 405 | 739 | ||||||||||
Prior period adjustment (note 1) | – | – | – | (53 | ) | (53 | ) | |||||||||
| 1 April 2004 as restated | 608 | 28 | (302 | ) | 352 | 686 | ||||||||||
| Additions | 1 | 28 | – | 2 | 31 | |||||||||||
| Disposals | (6 | ) | – | 4 | (228 | ) | (230 | ) | ||||||||
| Transfer to subsidiaries | (276 | ) | (49 | ) | 310 | – | (15 | ) | ||||||||
| Share of losses for the year | – | – | (31 | ) | – | (31 | ) | |||||||||
| Currency movements | 2 | 1 | – | 1 | 4 | |||||||||||
| Other movements | – | (2 | ) | 1 | – | (1 | ) | |||||||||
Total cost at 31 March 2005 | 329 | 6 | (18 | ) | 127 | 444 | ||||||||||
Provisions and amounts written off | ||||||||||||||||
| 1 April 2004 | 213 | – | – | 149 | 362 | |||||||||||
| Disposals | (4 | ) | – | – | (29 | ) | (33 | ) | ||||||||
Total provisions and amounts written off at 31 March 2005 | 209 | – | – | 120 | 329 | |||||||||||
Net book value at 31 March 2005 | 120 | 6 | (18 | ) | 7 | 115 | ||||||||||
| Net book value at 31 March 2004 | 395 | 28 | (302 | ) | 203 | 324 | ||||||||||
| a | Subsidiary undertakings, associates and joint ventures |
| Details of the principal operating subsidiary undertakings, joint ventures and associates are set out on page 122. | |
| b | Associates and joint ventures |
| 2005 £m | 2004 £m | ||||||
| Associates: | |||||||
| Goodwill | – | 1 | |||||
| Share of other net assets | 28 | 23 | |||||
| Total associates | 28 | 24 | |||||
| Joint ventures: | |||||||
| Loans | 6 | 28 | |||||
| Share of other net assets | 74 | 69 | |||||
| Total joint ventures | 80 | 97 | |||||
Net book value at 31 March | 108 | 121 | |||||
| 2005 £m | 2004 £m | ||||||
| Fixed assets | 219 | 347 | |||||
| Current assets | 118 | 149 | |||||
| Current liabilities | (137 | ) | (217 | ) | |||
| Net current liabilities | (19 | ) | (68 | ) | |||
| Long-term liabilities | (98 | ) | (187 | ) | |||
Share of net assets | 102 | 92 | |||||
| c | Other investments |
| In the group balance sheet at 31 March 2005, listed investments were held with a book value of £nil (2004 – £22 million) and a market value of £nil (2004 – £20 million). | |
| Notes to the financial statements | BT Group plc Annual Report and Form 20-F 2005 93 |
| 20. | Debtors |
| 2005 £m | 2004 £m | ||||||
Trade debtorsa | 1,927 | 2,126 | |||||
| Amounts owed by joint ventures (trading) | 1 | 5 | |||||
| Other debtors | 495 | 327 | |||||
| Accrued income | 1,423 | 1,392 | |||||
Pension fund prepaymentb | 1,118 | 1,172 | |||||
| Other prepayments | 423 | 167 | |||||
Total debtors | 5,387 | 5,189 | |||||
| a | Trade debtors are stated after deducting £338 million (2004 – £345 million) for doubtful debts. The amount charged to the group profit and loss account for doubtful debts for the year ended 31 March 2005 was £150 million (2004 – £136 million net of an exceptional credit of £23 million, 2003 – £264 million). |
| b | Falling due after more than one year. |
| 21. | Current asset investments |
| 2005 £m | 2004 £m | ||||||
| Listed investments | 1,106 | 1,247 | |||||
Other short-term deposits and investmentsa | 3,491 | 3,916 | |||||
Total current asset investments | 4,597 | 5,163 | |||||
| Market value of listed investments | 1,106 | 1,247 | |||||
| a | Included within other short-term deposits and investments in the 2004 financial year is £144 million invested with a swap counterparty. The counterparty had security over this investment in the event of BT defaulting on the swap. |
| 22. | Loans and other borrowings |
| 2005 £m | 2004 £m | ||||||
US dollar 8.875% notes 2030 (minimum 8.625%a) | 1,604 | 1,686 | |||||
| 5.75% bonds 2028 | 596 | 596 | |||||
| 3.5% indexed linked notes 2025 | 278 | 270 | |||||
| 8.625% bonds 2020 | 297 | 297 | |||||
7.75% notes 2016 (minimum 7.5%a) | 692 | 691 | |||||
Euro 7.125% notes 2011 (minimum 6.875%a) | 755 | 734 | |||||
US dollar 8.375% notes 2010 (minimum 8.125%a) | 1,754 | 1,795 | |||||
| US dollar 8.765% bonds 2009 | 123 | 123 | |||||
| Euro 11.875% senior notes 2009 | – | 3 | |||||
| US dollar convertible 2008 (0.75%) | 88 | 97 | |||||
| US dollar 7% notes 2007 | 573 | 596 | |||||
| 12.25% bonds 2006 | 229 | 229 | |||||
7.375% notes 2006 (minimum 7.125%a) | 399 | 398 | |||||
Euro 6.375% notes 2006 (minimum 6.125%a) | 1,923 | 1,861 | |||||
US dollar 7.875% notes 2005 (minimum 7.624%a) | 1,861 | 1,902 | |||||
| US dollar 6.75% bonds 2004 | – | 597 | |||||
| Total listed bonds, debentures and notes | 11,172 | 11,875 | |||||
| Lease finance | 993 | 1,099 | |||||
| Bank loans due 2007-2009 (average effective interest rate 9.7%) | 240 | 480 | |||||
| Floating rate note 2005-2009 (average effective interest rate 3.8%) | 90 | 101 | |||||
| Floating rate loan 2006 (average effective interest rate 5.6%) | 92 | 140 | |||||
| Bank overdrafts and other short-term borrowings | 2 | 2 | |||||
Total loans and other borrowings | 12,589 | 13,697 | |||||
| a | The interest rate payable on these notes will be subject to adjustment from time to time if either Moody’s or Standard and Poor’s (S&P) reduces the rating ascribed to the group’s senior unsecured debt below A3 in the case of Moody’s or below A minus in the case of S&P. In this event, the interest rate payable on the notes and the spread applicable to the floating notes will be increased by 0.25% for each ratings category adjustment by each ratings agency. In addition, if Moody’s or S&P subsequently increase the rating ascribed to the group’s senior unsecured debt, then the interest rate then payable on notes and the spread applicable to the floating notes will be decreased by 0.25% for each rating category upgrade by each rating agency, but in no event will the interest rate be reduced below the minimum interest rate reflected in the table above. |
The interest rates payable on loans and borrowings disclosed above reflect the coupons on the underlying issued loans and borrowings and not the interest rates achieved through applying associated currency and interest rate swaps.
| 94 BT Group plc Annual Report and Form 20-F 2005 | Notes to the financial statements |
| 22. | Loans and other borrowings continued |
| 2005 £m | 2004 £m | ||||||
| Repayments fall due as follows: | |||||||
| Within one year, or on demand | 4,498 | 1,271 | |||||
| Between one and two years | 788 | 4,361 | |||||
| Between two and three years | 849 | 777 | |||||
| Between three and four years | 98 | 854 | |||||
| Between four and five years | 275 | 100 | |||||
| After five years | 6,081 | 6,334 | |||||
| Total due for repayment after more than one year | 8,091 | 12,426 | |||||
Total loans and other borrowings | 12,589 | 13,697 | |||||
| 23. | Other creditors |
| 2005 £m | 2004 £m | a | |||||
| Trade creditors | 2,921 | 2,307 | |||||
| Amounts owed to joint ventures (trading) | 1 | 1 | |||||
| Corporation taxes | 645 | 441 | |||||
| Other taxation and social security | 468 | 448 | |||||
| Other creditors | 1,041 | 1,365 | |||||
| Accrued expenses | 719 | 704 | |||||
| Deferred income | 1,617 | 1,532 | |||||
| Dividends payable | 551 | 454 | |||||
Total other creditors | 7,963 | 7,252 | |||||
| a | Restated – see note 1 |
| 24. | Provisions for liabilities and charges |
| Property provisions | a | Pension provisions | b | Other provisions | c | Total | |||||||
| £m | £m | £m | £m | ||||||||||
| Balances at 1 April 2004 | 193 | 36 | 84 | 313 | |||||||||
| Acquisition of subsidiaries | – | 7 | 15 | 22 | |||||||||
| Charged against profit for the year | 59 | 2 | 6 | 67 | |||||||||
| Unwind of discount | 3 | – | – | 3 | |||||||||
| Utilised in the year | (63 | ) | (1 | ) | (18 | ) | (82 | ) | |||||
Total provisions at 31 March 2005 | 192 | 44 | 87 | 323 | |||||||||
| a | Property provisions comprise amounts provided for obligations to complete nearly finished new properties and remedial work to be undertaken on properties and the onerous lease provision on rationalisation of the group’s London office portfolio. The provisions will be utilised over the remaining lease periods. |
| b | Provision for unfunded pension obligations which will be utilised over the remaining lives of the beneficiaries. |
| c | Other provisions include amounts provided for legal or constructive obligations arising from insurance claims and litigation which will be utilised as the obligations are settled. |
Deferred taxation |
| £m | ||||
| Balance at 1 April 2004 | 2,191 | |||
| Charge against profit for the year | (17 | ) | ||
Total deferred tax provisions at 31 March 2005 | 2,174 | |||
| 2005 £m | 2004 £m | ||||||
| Tax effect of timing differences due to: | |||||||
| Excess capital allowances | 1,941 | 1,960 | |||||
| Pension prepayment | 329 | 335 | |||||
| Other | (96 | ) | (104 | ) | |||
Total provision for deferred taxation | 2,174 | 2,191 | |||||
| Notes to the financial statements | BT Group plc Annual Report and Form 20-F 2005 95 |
| 25. | Reconciliation of movement in shareholders’ funds |
| Share capital £m | Share premium account £m | Capital redemption reserve £m | Other reserves £m | Profit and loss account £m | Total £m | ||||||||||||||
| Balances at 1 April 2002 as previously stated | 434 | 2 | – | 1,025 | (1,819 | ) | (358 | ) | |||||||||||
Prior period adjustment (note 1) | – | – | – | – | (152 | ) | (152 | ) | |||||||||||
| 1 April 2002 as restated | 434 | 2 | – | 1,025 | (1,971 | ) | (510 | ) | |||||||||||
Goodwill, previously written off to reserves, taken back to the profit and loss accounta (note 6) | – | – | – | – | 869 | 869 | |||||||||||||
Employee share option schemes – 0.2 million shares issued (note 31) | – | – | – | – | – | – | |||||||||||||
Transfer between reservesb | – | – | – | (27 | ) | 27 | – | ||||||||||||
Currency movements (including £106 million net movements in respect of foreign currency borrowings)c | – | – | – | – | 5 | 5 | |||||||||||||
| Consideration received on employee share option plans | – | – | – | – | 27 | 27 | |||||||||||||
| Amounts credited in respect of employee share plans | – | – | – | – | 48 | 48 | |||||||||||||
| Profit for the year as restated | – | – | – | – | 2,702 | 2,702 | |||||||||||||
| Dividends (6.5p per ordinary share) | – | – | – | – | (560 | ) | (560 | ) | |||||||||||
| Balances at 1 April 2003 as restated | 434 | 2 | – | 998 | 1,147 | 2,581 | |||||||||||||
Purchase of own shares:d | |||||||||||||||||||
| – shares cancelled | (2 | ) | – | 2 | – | (64 | ) | (64 | ) | ||||||||||
| – shares held as treasury shares | – | – | – | – | (80 | ) | (80 | ) | |||||||||||
Currency movements (including £133 million net movements in respect of foreign currency borrowings)c | – | – | – | – | (89 | ) | (89 | ) | |||||||||||
| Amounts credited in respect of employee share plans | – | – | – | – | 36 | 36 | |||||||||||||
| Profit for the year as restated | – | – | – | – | 1,414 | 1,414 | |||||||||||||
| Dividends (8.5p per ordinary share) | – | – | – | – | (732 | ) | (732 | ) | |||||||||||
| Balances at 1 April 2004 as restated | 432 | 2 | 2 | 998 | 1,632 | 3,066 | |||||||||||||
Purchase of own shares held as treasury sharesd | – | – | – | – | (195 | ) | (195 | ) | |||||||||||
Currency movements (including £27 million net movements in respect of foreign currency borrowings)c | – | – | – | – | 19 | 19 | |||||||||||||
| Arising on share issues | – | 1 | – | – | – | 1 | |||||||||||||
| Amounts credited in respect of employee share plans | – | – | – | – | 22 | 22 | |||||||||||||
| Profit for the year | – | – | – | – | 1,821 | 1,821 | |||||||||||||
| Dividends (10.4p per ordinary share) | – | – | – | – | (883 | ) | (883 | ) | |||||||||||
Balances at 31 March 2005 | 432 | 3 | 2 | 998 | 2,416 | 3,851 | |||||||||||||
| a | Aggregate goodwill at 31 March 2005 in respect of acquisitions completed prior to 1 April 1998 of £385 million (2004 – £385 million, 2003 – £385 million) has been written off against retained earnings in accordance with the group’s accounting policy. The goodwill written off against retained earnings will be charged in the profit and loss account on the subsequent disposal of the business to which it related. |
| b | Release of statutory reserves in subsidiary undertakings on cessation of associated activities. |
| c | The cumulative foreign currency translation adjustment, which increased retained earnings at 31 March 2005, was £152 million (2004 – £133 million, 2003 – £222 million). |
| d | During the year ended 31 March 2005 the company repurchased 101,280,000 (2004 – 80,571,000) of its own shares of 5p each, representing 1% (2004 – 1%) of the called-up share capital, for an aggregate consideration of £195 million (2004 – £144 million). At 31 March 2005 134,497,000 shares (2004 – 44,349,000 shares) with an aggregate nominal value of £7 million are held as treasury shares at cost. Of the total shares repurchased during the year ended 31 March 2004 36,222,000 shares with an aggregate nominal value of £2 million were cancelled immediately. |
| 26. | Related party transactions |
There were a number of transactions during the year between the company and its subsidiary undertakings, which are eliminated on consolidation and therefore not disclosed.
| 27. | Financial commitments and contingent liabilities |
| 2005 £m | 2004 £m | ||||||
| Contracts placed for capital expenditure not provided in the accounts | 735 | 879 | |||||
| Operating lease payments payable within one year of the balance sheet date were in respect of leases expiring: | |||||||
| Within one year | 11 | 8 | |||||
| Between one and five years | 43 | 29 | |||||
| After five years | 321 | 330 | |||||
Total payable within one year | 375 | 367 | |||||
| 96 BT Group plc Annual Report and Form 20-F 2005 | Notes to the financial statements |
| 27. | Financial commitments and contingent liabilities continued |
| 2005 £m | ||||
| Payable in the year ending 31 March: | ||||
| 2006 | 375 | |||
| 2007 | 376 | |||
| 2008 | 376 | |||
| 2009 | 373 | |||
| 2010 | 370 | |||
| Thereafter | 8,587 | |||
Total future minimum operating lease payments | 10,457 | |||
At 31 March 2005, other than disclosed below there were no contingent liabilities or guarantees other than those arising in the ordinary course of the group’s business and on these no material losses are anticipated. The group has insurance cover to certain limits for major risks on property and major claims in connection with legal liabilities arising in the course of its operations. Otherwise, the group generally carries its own risks.
The group has provided guarantees relating to certain leases entered into by O2 UK Limited prior to its demerger with O2 on 19 November 2001. O2 plc has given BT a counterindemnity for these guarantees. The maximum likely exposure is US$76 million (£41 million) as at 31 March 2005, although this could increase by a further US$563 million, (£298 million) in the event of credit default in respect of amounts used to defease future lease obligations. The guarantee lasts until O2 UK Ltd has discharged all its obligations, which is expected to be when the lease ends on 30 January 2017.
The company does not believe there are any pending legal proceedings which would have a material adverse effect on the financial position or results of operations of the group.
Proceedings have been initiated in Italy against 21 defendants, including a former BT employee, in connection with the Italian UMTS auction. Blu, in which BT held a minority interest, participated in that auction process. The hearings are continuing, in Rome. If the proceedings are successful, BT could be held liable, with others, for any damages. The company has concluded that it is not appropriate to make a provision in respect of any such potential claim.
The European Commission is formally investigating the way the UK Government has set BT’s property rates and those paid by Kingston Communications. The Commission is examining whether the Government has complied with EC Treaty rules on state aid in assessing BT’s rates. BT’s rates were set by the Valuation Office after lengthy discussions based on well established principles, in a transparent process. In BT’s view, any allegation of state aid is groundless and BT is confident that the Government will demonstrate the fairness of the UK ratings system. A finding against HM Government could result in BT having to repay any amount of state aid it may be determined to have received. The company has concluded that it is not appropriate to make a provision in respect of any such potential finding.
| 28. | Pension costs |
Background |
The group offers retirement plans to its employees. The group’s main scheme, the BT Pension Scheme (BTPS), is a defined benefit scheme where the benefits are based on employees’ length of service and final pensionable pay. The BTPS is funded through a legally separate trustee administered fund. This scheme has been closed to new entrants since 31 March 2001 and replaced by a defined contribution scheme. Under this defined contribution scheme the profit and loss charge represents the contribution payable by the group based upon a fixed percentage of employees’ pay. The total pension costs of the group expensed within staff costs in the year was £465 million (2004 – £404 million, 2003 – £322 million), of which £430 million (2004 – £376 million, 2003 – £306 million) related to the group’s main defined benefit pension scheme, the BTPS. The increase in the pension cost in the 2005 financial year reflects the introduction of Smart Pensions, a salary sacrifice scheme under which employees elect to stop making employee contributions and for the company to make additional contributions in return for a reduction in gross contractual pay. As a result there has been a switch between wages and salaries and pension costs of £99 million in the year. The increase in the pension cost in the 2004 financial year reflects the amortisation charge for the pension deficit partly offset by a reduction in the number of active members of the BTPS and the interest credit relating to the balance sheet prepayment. This total pension cost includes the cost of providing enhanced pension benefits to leavers, which amounted to £nil (2004 – £1 million, 2003 – £60 million).
The pension cost applicable to the group’s main defined contribution schemes in the year ended 31 March 2005 was £11 million (2004 – £7 million, 2003 – £4 million) and £1.2 million (2004 – £0.7 million, 2003 – £0.4 million) of contributions to the schemes were outstanding at 31 March 2005.
The group occupies four properties owned by the scheme on which an annual rental of £7 million is payable. The BTPS assets are invested in UK and overseas equities, UK and overseas properties, fixed interest and index linked securities, deposits and short-term investments. At 31 March 2005, the UK equities included 17 million (2004 – 33 million, 2003 – 37 million) ordinary shares of the company with a market value of £36 million (2004 – £58 million, 2003 – £58 million).
| Notes to the financial statements | BT Group plc Annual Report and Form 20-F 2005 97 |
| 28. | Pension costs continued |
BT Pension Scheme |
| Funding valuation |
| The valuation basis for funding purposes is broadly as follows: | |
| scheme assets are valued at market value at the valuation date; and |
| scheme liabilities are measured using a projected unit method and discounted at the estimated rate of return reflecting the assets of the scheme. The last three triennial valuations were determined using the following long-term assumptions: |
| Real rates (per annum) | Nominal rates (per annum) | ||||||||||||||||||
| 2002 valuation % | 1999 valuation % | 1996 valuation % | 2002 valuation % | 1999 valuation % | 1996 valuation % | ||||||||||||||
| Return on existing assets, relative to market values | 4.52 | 2.38 | 3.80 | 7.13 | 5.45 | 7.95 | |||||||||||||
| (after allowing for an annual increase in dividends of) | 1.00 | 1.00 | 0.75 | 3.53 | 4.03 | 4.78 | |||||||||||||
| Return on future investments | 4.00 | 4.00 | 4.25 | 6.60 | 7.12 | 8.42 | |||||||||||||
| Average increase in retail price index | – | – | – | 2.50 | 3.00 | 4.00 | |||||||||||||
| Average future increases in wages and salaries | 1.50 | * | 1.75 | 1.75 | 4.04 | * | 4.80 | 5.82 | |||||||||||
| Average increase in pensions | – | – | – | 2.50 | 3.00 | 3.75-4.00 | |||||||||||||
| *There is a short term reduction in the real salary growth assumption to 1.25% for the first three years. |
The mortality assumption reflects improvements in life expectancy since the 1999 valuation and incorporates further future improvements.
The assumed rate of investment return, salary increases and mortality all have a significant effect on the funding valuation. A 0.25 percentage point change in these assumptions would have the following effects on the funding deficit:
| Impact on funding deficit | |||||||
| Increase £bn | Decrease £bn | ||||||
| 0.25 percentage point change in: | |||||||
| Investment return | (0.9 | ) | 0.9 | ||||
| Wage and salary increases | 0.2 | (0.2 | ) | ||||
At 31 December 2002, the assets of the BTPS had a market value of £22.8 billion (1999 – £29.7 billion) and were sufficient to cover 91.6% (1999 – 96.8%) of the benefits accrued by that date, after allowing for expected future increases in wages and salaries but not taking into account the costs of providing incremental pension benefits for employees leaving under release schemes since that date. This represents a funding deficit of £2.1 billion compared to £1.0 billion at 31 December 1999. The funding valuation uses conservative assumptions whereas, had the valuation been based on the actuary’s view of the median estimate basis, the funding deficit would have been reduced to £0.4 billion. Although the market value of equity investments had fallen, the investment income and contributions received by the scheme exceeded the benefits paid by £0.3 billion in the year ended 31 December 2002. As a result of the triennial funding valuation the group agreed to make employer’s contributions at a rate of 12.2% of pensionable pay from April 2003 and annual deficiency payments of £232 million. This compared to the employer’s contribution rate of 11.6% and annual deficiency payments of £200 million that were determined under the 1999 funding valuation. In the year ended 31 March 2005, the group made regular contributions of £376 million (2004 – £284 million, 2003 – £278 million) and additional special contributions for enhanced pension benefits to leavers in the year ended 31 December 2003 of £6 million (2004 – £130 million, 2003 – £129 million) and deficiency contributions of £nil (2004 – £612 million, 2003 – £200 million) as a result of the early payment of £380 million made in the 2004 financial year that was scheduled for payment in subsequent years.
Under the terms of the trust deed that governs the BTPS the group is required to have a funding plan that should address the deficit over a maximum period of 20 years whilst the agreed funding plan addresses the deficit over a period of 15 years. The group will continue to make deficiency payments until the deficit is made good.
The BTPS was closed to new entrants on 31 March 2001 and the age profile of active members will consequently increase. Under the projected unit method, the current service cost, as a proportion of the active members’ pensionable salaries, is expected to increase as the members of the scheme approach retirement. Despite the scheme being closed to new entrants, the projected payment profile extends over more than 60 years.
| 98 BT Group plc Annual Report and Form 20-F 2005 | Notes to the financial statements |
| 28. | Pension costs continued |
| SSAP 24 accounting valuation |
| scheme assets are valued at market value; and |
| scheme liabilities are measured using the projected unit method and discounted at the estimated rate of return reflecting the assets of the scheme. |
The pension costs for the 2005 and 2004 financial years were based upon the SSAP 24 valuation at 31 March 2003. At 31 March 2003 there was a SSAP 24 deficit of £1.4 billion, before taking account of the balance sheet prepayment and the regular cost is 11.3% of pensionable salaries. The SSAP 24 valuation at 31 March 2003 is based on the 31 December 2002 funding valuation rolled forward, and uses the same assumptions as set out above, with the following exceptions:
| return on existing assets is assumed to be a nominal 7.1% per annum, which equates to a real return of 4.7%; |
| average increase in retail price index is assumed to be 2.25% per annum; and |
| the average future increases in wages and salaries is assumed to include a short term reduction in the real salary growth assumption to 0.75% for the first three years, before returning to 1.5%. |
The pension charge to the profit and loss account will also include the amortisation of the combined pension fund position and pension prepayment over the average remaining service lives of scheme members, which amounts to 13 years, and the cost of enhanced pension benefits provided to leavers.
| FRS 17 – Retirement benefits |
| The group continues to account for pensions in accordance with SSAP 24. Full implementation of FRS 17 has been deferred by the Accounting Standards Board and would have applied to the group for the 2006 financial year. However, in the 2006 financial year the group will adopt International Financial Reporting Standards (IFRS). The requirements for disclosure under FRS 17 remain in force between its issue and adoption of IFRS, and the required information is set out below. FRS 17 specifies how key assumptions should be derived and applied. These assumptions are often different to the assumptions adopted by the pension scheme actuary and trustees in determining the funding position of pension schemes. The accounting requirements under FRS 17 are broadly as follows: |
| scheme assets are valued at market value at the balance sheet date; |
| scheme liabilities are measured using a projected unit method and discounted at the current rate of return on high quality corporate bonds of equivalent term to the liability; and |
| movement in the scheme surplus/deficit is split between operating charges and financing items in the profit and loss account and, in the statement of total recognised gains and losses, actuarial gains and losses. |
| The financial assumptions used to calculate the BTPS liabilities under FRS 17 at 31 March 2005 are: |
| Real rates (per annum) | Nominal rates (per annum) | ||||||||||||||||||
| 2005 % | 2004 % | 2003 % | 2005 % | 2004 % | 2003 % | ||||||||||||||
| Average future increases in wages and salaries | 1.00 | * | 1.00 | * | 1.50 | * | 3.73 | * | 3.63 | * | 3.78 | * | |||||||
| Average increase in pensions in payment and deferred pensions | – | – | – | 2.70 | 2.60 | 2.25 | |||||||||||||
| Rate used to discount scheme liabilities | 2.63 | 2.83 | 3.08 | 5.40 | 5.50 | 5.40 | |||||||||||||
| Inflation – average increase in retail price index | – | – | – | 2.70 | 2.60 | 2.25 | |||||||||||||
| *There is a short term reduction in the real salary growth assumption to 0.75% for the first year (2004 – two years, 2003 – three years). | |
| Notes to the financial statements | BT Group plc Annual Report and Form 20-F 2005 99 |
| 28. | Pension costs continued |
| 31 March 2005 | 31 March 2004 | 31 March 2003 | |||||||||||||||||
| Expected long- term rate of return (per annum) | Asset fair value | Expected long- term rate of return (per annum) | Asset fair value | Expected long- term rate of return (per annum) | Asset fair value | ||||||||||||||
| % | £bn | % | % | £bn | % | % | £bn | % | |||||||||||
| UK equities | 8.0 | 9.6 | 32 | 8.2 | 9.2 | 34 | 8.2 | 7.4 | 34 | ||||||||||
| Non-UK equities | 8.0 | 9.0 | 30 | 8.2 | 8.1 | 30 | 8.2 | 6.4 | 30 | ||||||||||
| Fixed-interest securities | 5.4 | 4.6 | 16 | 5.3 | 4.0 | 15 | 5.2 | 3.1 | 14 | ||||||||||
| Index-linked securities | 4.4 | 2.8 | 10 | 4.4 | 2.3 | 9 | 4.3 | 1.7 | 8 | ||||||||||
| Property | 6.8 | 3.6 | 12 | 6.8 | 3.3 | 12 | 7.0 | 3.3 | 15 | ||||||||||
| Cash and other | 4.0 | – | – | 4.0 | – | – | 4.0 | (0.4 | ) | (1 | ) | ||||||||
Total | 7.1 | 29.6 | 100 | 7.3 | 26.9 | 100 | 7.4 | 21.5 | 100 | ||||||||||
The net pension deficit set out below under FRS 17 is as if this standard was fully applied. The fair value of the BTPS assets, the present value of the BTPS liabilities based on the financial assumptions set out above, and the resulting deficit, together with those of unfunded pension liabilities at 31 March 2005 and 31 March 2004 are shown below. The fair value of the BTPS assets is not intended to be realised in the short term and may be subject to significant change before it is realised. The present value of the liabilities is derived from long-term cash flow projections and is thus inherently uncertain.
| 31 March 2005 | 31 March 2004 | ||||||||||||||||||
| Assets £m | Present value of liabilities £m | Deficit £m | Assets £m | Present value of liabilities £m | Deficit £m | ||||||||||||||
| BTPS | 29,550 | 34,270 | 4,720 | 26,900 | 32,000 | 5,100 | |||||||||||||
| Other liabilities | 26 | 87 | 61 | – | 36 | 36 | |||||||||||||
| Total deficit | 4,781 | 5,136 | |||||||||||||||||
| Deferred tax asset at 30% | (1,434 | ) | (1,541 | ) | |||||||||||||||
Net pension liability | 3,347 | 3,595 | |||||||||||||||||
| 2005 £m | 2004 £m | a | |||||
Net assets (deficiency) | |||||||
| Net assets as reported | 3,851 | 3,066 | |||||
| SSAP 24 pension prepayment (net of deferred tax) | (776 | ) | (820 | ) | |||
| SSAP 24 pension provision (net of deferred tax) | 31 | 25 | |||||
| Net pension liability under FRS 17 | (3,347 | ) | (3,595 | ) | |||
Net deficiency including net pension liability | (241 | ) | (1,324 | ) | |||
| 2005 £m | 2004 £m | ||||||
Profit and loss reserve | |||||||
| Profit and loss reserve, as reported | 2,416 | 1,632 | |||||
| SSAP 24 pension prepayment (net of deferred tax) | (776 | ) | (820 | ) | |||
| SSAP 24 pension provision (net of deferred tax) | 31 | 25 | |||||
| Net pension liability under FRS 17 | (3,347 | ) | (3,595 | ) | |||
Profit and loss reserve including net pension liability | (1,676 | ) | (2,758 | ) | |||
| a | Restated – see note 1 |
| 100 BT Group plc Annual Report and Form 20-F 2005 | Notes to the financial statements |
| 28. | Pension costs continued |
| 2005 £m | 2004 £m | ||||||
Analysis of amounts that would be charged to operating profit on an FRS 17 basis | |||||||
| Current service cost | 540 | 438 | |||||
| Past service cost | – | 1 | |||||
Total operating charge | 540 | 439 | |||||
Amount that would be charged (credited) to net interest payable on an FRS 17 basis | |||||||
| Expected return on pension scheme assets | (1,918 | ) | (1,560 | ) | |||
| Interest on pension scheme liabilities | 1,720 | 1,615 | |||||
Net finance (income) expense | (198 | ) | 55 | ||||
Amount that would be charged to profit before taxation on an FRS 17 basis | 342 | 494 | |||||
Analysis of the amount that would be recognised in the consolidated statement of total recognised gains and losses on an FRS 17 basis | |||||||
| Actual return less expected return on pension scheme assets | 1,664 | 4,130 | |||||
| Experience losses arising on pension scheme liabilities | (437 | ) | (290 | ) | |||
| Changes in assumptions underlying the present value of the pension scheme liabilities | (933 | ) | (500 | ) | |||
Actuarial gain recognised | 294 | 3,340 | |||||
The movements in the net pension liability, on an FRS 17 basis, during the year were:
| 2005 £m | 2004 £m | ||||||
| Deficit at 1 April | 5,136 | 9,033 | |||||
| Current service cost | 540 | 438 | |||||
| Contributions | (413 | ) | (1,051 | ) | |||
| Past service costs | – | 1 | |||||
| Other finance (income) expense | (198 | ) | 55 | ||||
| Acquisitions | 10 | – | |||||
| Actuarial gain recognised | (294 | ) | (3,340 | ) | |||
Deficit at 31 March | 4,781 | 5,136 | |||||
Net pension liability, post tax, at 31 March | 3,347 | 3,595 | |||||
| 2005 | 2004 | 2003 | ||||||||
Difference between expected and actual return on scheme assets: | ||||||||||
| Amount (£m) | 1,664 | 4,130 | (6,995 | ) | ||||||
| Percentage of scheme assets | 5.6% | 15.4% | 32.5% | |||||||
Experience gains and losses on scheme liabilities: | ||||||||||
| Amount (£m) | (437 | ) | (290 | ) | 1,056 | |||||
| Percentage of the present value of scheme liabilities | 1.3% | 0.9% | 3.5% | |||||||
Total amount recognised in statement of total recognised gains and losses: | ||||||||||
| Amount (£m) | 294 | 3,340 | (7,599 | ) | ||||||
| Percentage of the present value of scheme liabilities | 0.9% | 10.4% | 24.9% | |||||||
| Notes to the financial statements | BT Group plc Annual Report and Form 20-F 2005 101 |
| 29. | Directors’ emoluments |
| 2005 £000 | 2004 £000 | 2003 £000 | ||||||||
| Salaries | 3,237 | 3,150 | 3,212 | |||||||
| Performance-related and special bonus | 1,449 | 2,074 | 2,309 | |||||||
| Deferred bonus in shares | 600 | 1,037 | 1,484 | |||||||
| Other benefits | 419 | 467 | 644 | |||||||
| 5,705 | 6,728 | 7,649 | ||||||||
| Payments to non-executive directors | 391 | 337 | 294 | |||||||
Total emoluments | 6,096 | 7,065 | 7,943 | |||||||
| Gain on the exercise of share options | – | – | – | |||||||
| Value of shares vested under the Retention Share Plan | 2,132 | 412 | 411 | |||||||
| 30. | People employed |
| 2005 | 2004 | 2003 | |||||||||||||||||
| Year end ’000 | Average ’000 | Year end ’000 | Average ’000 | Year end ’000 | Average ’000 | ||||||||||||||
| Number of employees in the group: | |||||||||||||||||||
| UK | 90.8 | 90.7 | 91.6 | 94.8 | 96.3 | 98.4 | |||||||||||||
| Non-UK | 11.3 | 8.9 | 8.3 | 8.3 | 8.4 | 9.0 | |||||||||||||
Total employees | 102.1 | 99.6 | 99.9 | 103.1 | 104.7 | 107.4 | |||||||||||||
| 31. | Employee share plans |
Share option schemes |
The BT Group Legacy Option Plan was operated on 17 December 2001 following the scheme of arrangement and demerger in November 2001. Replacement unapproved options over BT Group shares were granted to all participants in the executive option plans who had released their options over British Telecommunications plc shares. The value of the replacement options was determined by averaging the combined prices of BT Group plc and O2 plc shares over the 20 dealing days following the demerger on 19 November 2001. This resulted in a factor of 1.3198 being applied to the former option over British Telecommunications plc shares in order to give the number of BT Group shares under the new option. The option prices of the original options were also adjusted to take account of the different number of shares under option.
| 102 BT Group plc Annual Report and Form 20-F 2005 | Notes to the financial statements |
| 31. | Employee share plans continued |
Options outstanding under these share option plans at 31 March 2005 and 2004, together with their exercise prices and dates, were as follows:
| Normal dates of exercise | 2005 Option price per share | 2005 millions | 2004 Option price per share | 2004 millions | |||||||||
BT Group Employee Sharesave plans | |||||||||||||
| 2005 | 218p–255p | 20 | 218p–255p | 26 | |||||||||
| 2006 | 154p–173p | 22 | 154p–173p | 30 | |||||||||
| 2007 | 146p–227p | 57 | 218p–227p | 54 | |||||||||
| 2008 | 154p | 92 | 154p | 123 | |||||||||
| 2009 | 146p | 71 | – | – | |||||||||
| Total | 262 | 233 | |||||||||||
BT Group Legacy Option Plana | |||||||||||||
| 2001-2011 | 318p–602p | 15 | 318p–602p | 16 | |||||||||
| Total | 15 | 16 | |||||||||||
BT Group Global Share Option Plan | |||||||||||||
| 2004-2014 | 176p–199.5p | 59 | 176p–199.5p | 63 | |||||||||
| 2005-2012 | 163p–263p | 51 | 163p–263p | 61 | |||||||||
| 2006-2014 | 176p–199.5p | 51 | 176p–199.5p | 54 | |||||||||
| 2007-2015 | 179p–215p | 30 | – | – | |||||||||
| Total | 191 | 178 | |||||||||||
| Total outstanding options | 468 | 427 | |||||||||||
| a | The option prices of shares under the BT Group Legacy Option Plan were adjusted at the time of the demerger as detailed on page 102. |
The weighted average fair value of share options granted during the year ended 31 March 2005 has been estimated on the date of grant using a binomial option pricing model. The following weighted average assumptions were used in that model: an expected life extending one month later than the first exercise date; estimated annualised dividend yield of approximately 5% (2004 – 5%, 2003 – 5%); risk free interest rates of approximately 5% (2004 – 4%, 2003 – 5%); and expected volatility of approximately 25% (2004 – 25%, 2003 – 40%).
The weighted average fair value of the share options granted in the year ended 31 March 2005 was 41p (2004 – 42p, 2003 – 55p) for Sharesave options exercisable three years after the date of grant and 52p (2004 – 51p, 2003 – 72p) for Sharesave options exercisable five years after the date of grant. The BT Group Global Share Option Plan and the BT Group Incentive Share Plan (an executive share plan) were valued using Monte Carlo simulations. The weighted average fair value of options granted under the BT Group Global Share Option Plan has been estimated as 36p. The weighted average fair value of awards of shares granted under the Incentive Share Plan has been estimated as 98p. The total value of share options granted by BT in the year ended 31 March 2005 was £77 million (2004 – £136 million, 2003 – £41 million).
In accordance with UK accounting practices, no compensation expense is recognised for options granted where the exercise price equals the market price at date of grant, or options granted under approved Sharesave plans. See United States Generally Accepted Accounting Principles – IV Accounting for share options for the treatment under US GAAP.
Options granted, exercised and lapsed under these share option plans during the years ended 31 March 2003, 2004 and 2005 and options exercisable at 31 March 2003, 2004 and 2005 were as follows:
| Savings related schemes millions | Executive option plans millions | Total millions | Exercise price range | Weighted average exercise price | ||||||||||||
| Outstanding, 31 March 2003 | 164 | 85 | 249 | 163p–727p | 231p | |||||||||||
| Granted | 165 | 119 | 284 | 154p–199.5p | 175p | |||||||||||
| Lapsed | (96 | ) | (10 | ) | (106 | ) | 154p–716p | 220p | ||||||||
| Outstanding, 31 March 2004 | 233 | 194 | 427 | 154p–727p | 196p | |||||||||||
| Granted | 91 | 31 | 122 | 146p–215p | 160p | |||||||||||
| Lapsed | (62 | ) | (19 | ) | (81 | ) | 146p–602p | 189p | ||||||||
Outstanding, 31 March 2005 | 262 | 206 | 468 | 146p–602p | 188p | |||||||||||
| Exercisable, 31 March 2003 | – | 11 | 11 | 255p–727p | 491p | |||||||||||
| Exercisable, 31 March 2004 | – | 13 | 13 | 255p–727p | 476p | |||||||||||
Exercisable, 31 March 2005 | 16 | 34 | 50 | 199.5p–602p | 288p | |||||||||||
| Notes to the financial statements | BT Group plc Annual Report and Form 20-F 2005 103 |
| 31. | Employee share plans continued |
Incentive Share Plan and Retention Share Plan |
Deferred Bonus Plan |
At 31 March 2005, 27.8 million shares (2004 – 30.5 million shares) in the company were held in trust for employee share plans, of which 12.7 million shares (2004 – no shares) were held for the ISP, 2.8 million shares (2004 – 3.0 million shares) were held for the RSP and 7.9 million shares (2004 – 6.5 million shares) were held for the DBP. Dividends or dividend equivalents earned on the shares during the conditional periods are reinvested in company shares for the potential benefit of the participants.
Additional information relating to the plans is as follows:
| Year ended 31 March 2005 | ISP £m | RSP £m | DBP £m | Total £m | |||||||||
| Value of range of possible future transfers: nil to | 26.1 | 5.7 | 16.1 | 47.9 | |||||||||
| Provision for the costs of the plans charged to the profit and loss account in year | 3.2 | 2.1 | 5.3 | 10.6 | |||||||||
| Nominal value of shares held in trust | 0.6 | 0.1 | 0.4 | 1.1 | |||||||||
| Market value of shares held in trust | 26.1 | 5.7 | 16.1 | 47.9 | |||||||||
| Year ended 31 March 2004 | ISP £m | RSP £m | DBP £m | Total £m | |||||||||
| Value of range of possible future transfers: nil to | – | 5.3 | 11.4 | 16.7 | |||||||||
| Provision for the costs of the plans charged to the profit and loss account in year | – | 9.3 | 8.2 | 17.5 | |||||||||
| Nominal value of shares held in trust | – | 0.2 | 0.3 | 0.5 | |||||||||
| Market value of shares held in trust | – | 5.3 | 11.4 | 16.7 | |||||||||
The values of possible future transfers of shares under the plans were based on the BT Group plc share price at 31 March 2005 of 205.5p (2004 – 177p). The provisions for the costs of the ISP and RSP were based on best estimates of the company’s performance over the plans’ conditional periods, relating to those portions of the plan conditional periods from commencement up to the financial year end.
| 104 BT Group plc Annual Report and Form 20-F 2005 | Notes to the financial statements |
| 31. | Employee share plans continued |
Employee Share Investment Plan |
Employee Stock Purchase Plan |
| 32. | Auditors |
| 2005 £000 | 2004 £000 | 2003 £000 | ||||||||
Audit services | ||||||||||
| Statutory audit | 4,148 | 3,767 | 2,916 | |||||||
| Regulatory audit | 1,423 | 1,950 | 1,690 | |||||||
| 5,571 | 5,717 | 4,606 | ||||||||
Further assurance services | ||||||||||
| Corporate finance advice | 989 | 462 | 265 | |||||||
| Other | 110 | 82 | 829 | |||||||
| 1,099 | 544 | 1,094 | ||||||||
Tax services | 2,912 | 2,656 | 2,245 | |||||||
Other services | ||||||||||
| Systems advice | – | – | 3,765 | |||||||
| Other | 434 | 110 | 766 | |||||||
| 434 | 110 | 4,531 | ||||||||
Total | 10,016 | 9,027 | 12,476 | |||||||
In order to maintain the independence of the external auditors, the Board has determined policies as to what non audit services can be provided by the company’s external auditors and the approval processes related to them. Under those policies work of a consultancy nature will not be offered to the external auditors unless there are clear efficiencies and value added benefits to the company.
BT’s regulatory obligations require it to publish audited regulatory financial statements. The fees for regulatory work principally reflect the audit fees associated with those regulatory financial statements. The fees for tax services include tax compliance and tax advisory services. The fees for systems advice in the year ended 31 March 2003 related to advisory services provided in connection with the implementation of certain billing systems. These services, which were provided by PwC Consulting, the consulting business of PricewaterhouseCoopers that was sold to IBM in October 2002, commenced in 2002 and were completed in 2003.
| Notes to the financial statements | BT Group plc Annual Report and Form 20-F 2005 105 |
| 33. | Financial instruments and risk management |
The group finances its operations primarily by a mixture of issued share capital, retained profits, deferred taxation, long-term loans and short-term loans, principally by issuing commercial paper and medium-term notes. The group borrows in the major long-term debt markets in major currencies. Typically, but not exclusively, the bond markets provide the most cost-effective means of long-term borrowing. The group uses derivative financial instruments primarily to manage its exposure to market risks from changes in interest and foreign exchange rates. The derivatives used for this purpose are principally interest rate swaps, gilt locks, currency swaps and forward currency contracts.
The types of financial instrument used for investment of short-term funds are prescribed in group treasury policies with limits on the exposure to any one organisation. Short-term investing in financial instruments is undertaken on behalf of the group by substantial external fund managers who are limited to dealing in debt instruments and certain defined derivative instruments and are given strict guidelines on credit, diversification and maturity profiles.
During the year ended 31 March 2005, the group’s net debt reduced from £8.4 billion to £7.8 billion mainly from working capital inflows and proceeds from the sale of investments. During the 2005 financial year, the group restructured some of its swaps portfolio. As a result, the group terminated £2.9 billion of cross-currency and sterling interest rate swaps with some swaps being replaced with new swaps which had the same economic hedging effect. This resulted in the group paying £107 million in reducing gross debt and receiving a net £14 million of interest receipts. The interest receipts and payments on restructuring have been included within deferred income and other debtors respectively and will be amortised to the profit and loss account over the term of the underlying hedged debt. The group’s fixed:floating interest rate profile on net debt is 95:5 at 31 March 2005.
During the year ended 31 March 2004, the group’s net debt reduced from £9.6 billion to £8.4 billion mainly from working capital inflows. During the 2004 financial year, the group restructured some of its swaps portfolio to mitigate credit risk to certain counter parties. As a result, the group terminated £7 billion of cross-currency interest rate swaps and replaced these with new swaps which had the same economic hedging effect. This resulted in the group paying £445 million in reducing gross debt and receiving £420 million of interest. The interest receipt has been included in deferred income and will be amortised to the profit and loss account over the term of the underlying debt. The group’s fixed:floating interest rate profile on net debt was 76:24 at 31 March 2004.
During the year ended 31 March 2003, the group’s net debt reduced from £13.7 billion to £9.6 billion. £2.6 billion was realised from the disposal of the group’s interest in Cegetel Groupe SA in the year, and the group has closed out £2.6 billion of associated fixed interest rate swaps. The group’s fixed:floating interest rate profile on net debt therefore remained at 88:12 at 31 March 2003.
The group uses financial instruments to hedge some of its currency exposures arising from its non-UK assets, liabilities and forward purchase commitments. The group also hedges some of its interest liabilities. The financial instruments used comprise borrowings in foreign currencies, forward foreign currency exchange contracts, gilt locks and interest and currency swaps.
There has been no change in the nature of the group’s risk profile between 31 March 2005 and the date of these financial statements.
The notional amounts of derivatives summarised below do not necessarily represent amounts exchanged by the parties and, thus, are not necessarily a measure of the exposure of the group through its use of derivatives. The amounts exchanged are calculated on the notional amounts and other terms of the derivatives which relate to interest and exchange rates.
| (a) | Interest rate risk management |
At 31 March 2005, the group had outstanding interest rate swap agreements having a total notional principal amount of £5,297 million (2004 – £5,210 million).
| (b) | Foreign exchange risk management |
The purpose of the group’s foreign currency hedging activities is to protect the group from the risk that the eventual net inflows and net outflows will be adversely affected by changes in exchange rates.
At 31 March 2005, the group had outstanding foreign currency swap agreements and forward exchange contracts having a total notional principal amount of £9,819 million (2004 – £11,367 million).
| 106 BT Group plc Annual Report and Form 20-F 2005 | Notes to the financial statements |
| 33. | Financial instruments and risk management continued |
At 31 March 2005, the group had deferred unrealised gains of £2 million (2004 – £nil) and losses of £nil (2004 – £5 million), based on dealer-quoted prices, from hedging purchase and sale commitments, and in addition had deferred realised net losses of £5 million (2004 – £3 million gains). These are included in the profit and loss account as part of the hedged purchase or sale transaction when it is recognised, or as gains or losses when a hedged transaction is no longer expected to occur.
| (c) | Concentrations of credit risk and credit exposures of financial instruments |
The long-term debt instruments issued in December 2000 and February 2001 both contained covenants that if the group credit rating was downgraded below A3 in the case of Moody’s or below A minus in the case of S&P, additional interest would accrue from the next interest coupon period at the rate of 0.25 percentage points for each ratings category adjustment by each ratings agency. In May 2001, Moody’s downgraded BT’s credit rating to Baa1, which increased BT’s interest charge by approximately £32 million per annum. BT’s current credit rating from S&P is A minus. Based upon the total debt of £9 billion outstanding on these instruments at 31 March 2005, BT’s annual interest charge would increase by approximately £26 million if BT’s credit ratings were to be downgraded by one credit rating category by both agencies below a long-term debt rating of Baa1/A minus. If BT’s credit rating with Moody’s was to be upgraded by one credit rating category the annual interest charge would be reduced by approximately £13 million.
| (d) | Fair value of financial instruments |
| Carrying amount | Fair value | ||||||||||||
| 2005 £m | 2004 £m | 2005 £m | 2004 £m | ||||||||||
| Non-derivatives: | |||||||||||||
| Assets | |||||||||||||
| Cash at bank and in hand | 206 | 109 | 206 | 109 | |||||||||
Short-term investmentsa | 4,592 | 5,117 | 4,592 | 5,117 | |||||||||
Fixed asset investmentsb | 13 | 231 | 13 | 229 | |||||||||
| Liabilities | |||||||||||||
| Short-term borrowings | 2 | 2 | 2 | 2 | |||||||||
Long-term borrowings, excluding finance leasesc | 10,904 | 11,800 | 12,246 | 13,506 | |||||||||
Derivatives relating to investments and borrowings (net)d: | |||||||||||||
| Assets | – | – | – | – | |||||||||
| Liabilities | 685 | 748 | 1,435 | 1,182 | |||||||||
| Derivative financial instruments held or issued to hedge the current exposure on expected future transactions (net): | |||||||||||||
| Assets | – | – | – | – | |||||||||
| Liabilities | – | – | 2 | – | |||||||||
| a | The fair values of listed short-term investments were estimated based on quoted market prices for those investments. The carrying amount of the other short-term deposits and investments approximated to their fair values due to the short maturity of the instruments held. |
| b | The fair values of listed fixed asset investments were estimated based on quoted market prices for those investments. |
| c | The fair value of the group’s bonds, debentures, notes and other long-term borrowings has been estimated on the basis of quoted market prices for the same or similar issues with the same maturities where they existed, and on calculations of the present value of future cash flows using the appropriate discount rates in effect at the balance sheet dates, where market prices of similar issues did not exist. |
| d | The fair value of the group’s outstanding foreign currency and interest rate swap agreements was estimated by calculating the present value, using appropriate discount rates in effect at the balance sheet dates, of affected future cash flows translated, where appropriate, into pounds sterling at the market rates in effect at the balance sheet dates. |
| Notes to the financial statements | BT Group plc Annual Report and Form 20-F 2005 107 |
| 33. | Financial instruments and risk management continued |
Financial liabilities |
| 2005 | 2004 | |||||||||||||||||||||||
| Fixed rate financial liabilities | Floating rate financial liabilities | Financial liabilities on which no interest is paid | Total | Fixed rate financial liabilities | Floating rate financial liabilities | Financial liabilities on which no interest is paid | Total | |||||||||||||||||
| Currency: | £m | £m | £m | £m | £m | £m | £m | £m | ||||||||||||||||
Total (Sterling) | 7,488 | 5,101 | – | 12,589 | 7,747 | 5,950 | – | 13,697 | ||||||||||||||||
| 2005 | 2004 | ||||||||||||
| Weighted average interest rate | Weighted average period for which rate is fixed | Weighted average interest rate | Weighted average period for which rate is fixed | ||||||||||
| Currency: | % | Years | % | Years | |||||||||
| Sterling | 8.8 | 11 | 8.7 | 13 | |||||||||
The maturity profile of financial liabilities is as given in note 22.
Financial assets |
| 2005 | 2004 | ||||||||||||||||||||||||
| Fixed rate financial assets | Floating rate Financial assets | Financial assets on which no interest is paid | Fixed rate financial assets | Floating rate financial assets | Financial assets on which no interest is paid | ||||||||||||||||||||
| Total | Total | ||||||||||||||||||||||||
| Currency: | £m | £m | £m | £m | £m | £m | £m | £m | |||||||||||||||||
| Sterling | 106 | 4,697 | 8 | 4,811 | 1,310 | 3,962 | 167 | 5,439 | |||||||||||||||||
| Euro | – | – | 1 | 1 | – | – | 23 | 23 | |||||||||||||||||
| Other | – | – | 4 | 4 | – | – | 41 | 41 | |||||||||||||||||
Total | 106 | 4,697 | 13 | 4,816 | 1,310 | 3,962 | 231 | 5,503 | |||||||||||||||||
The floating rate financial assets bear interest at rates fixed in advance for periods up to one year by reference to LIBOR.
| 108 BT Group plc Annual Report and Form 20-F 2005 | Notes to the financial statements |
| 33. | Financial instruments and risk management continued |
Currency exposures |
| 2005 | 2004 | ||||||||||||||||||||||||||||||
| Sterling £m | US dollar £m | Euro £m | Other £m | Total £m | Sterling £m | US dollar £m | Euro £m | Other £m | Total £m | ||||||||||||||||||||||
| Functional currency of group operation: | |||||||||||||||||||||||||||||||
| Sterling | – | (53 | ) | 6 | (1 | ) | (48 | ) | – | 43 | 7 | 1 | 51 | ||||||||||||||||||
| Euro | 2 | – | – | – | 2 | – | 2 | – | 2 | 4 | |||||||||||||||||||||
Total | 2 | (53 | ) | 6 | (1 | ) | (46 | ) | – | 45 | 7 | 3 | 55 | ||||||||||||||||||
At 31 March 2005, the group also held various forward currency contracts that the group had taken out to hedge expected future foreign currency purchases and sales.
Fair values of financial assets held for trading |
| 2005 £m | 2004 £m | ||||||
| Net gain included in profit and loss account | 18 | 61 | |||||
| Fair value of financial assets held for trading at 31 March | 546 | 785 | |||||
Hedges |
| 2005 | 2004 | ||||||||||||
| Gains £m | Losses £m | Gains £m | Losses £m | ||||||||||
| Gains and losses: | |||||||||||||
recognised in the year but arising in previous yearsa | 124 | 59 | 104 | 106 | |||||||||
| unrecognised at the balance sheet date | 47 | 799 | 306 | 740 | |||||||||
carried forward in the year end balance sheet, pending recognition in the profit and loss accounta | 545 | 165 | 564 | 122 | |||||||||
| expected to be recognised in the following year: | |||||||||||||
| unrecognised at balance sheet date | 36 | 51 | 9 | – | |||||||||
| carried forward in the year end balance sheet, pending recognition in | |||||||||||||
the profit and loss accounta | 136 | 39 | 124 | 59 | |||||||||
| a | Excluding gains and losses on hedges accounted for by adjusting the carrying amount of a fixed asset. |
Unused committed lines of credit |
Notes to the financial statements | BT Group plc Annual Report and Form 20-F 2005 109 |
| 34. | Company balance sheet |
| 2005 £m | 2004 £m | ||||||
Fixed assets | |||||||
| Investment in subsidiary undertaking | 9,971 | 9,971 | |||||
Total fixed assets | 9,971 | 9,971 | |||||
Current assets | |||||||
Debtorsa | 22 | 456 | |||||
Investmentsb | 1 | 2 | |||||
| Cash at bank and in hand | 118 | 62 | |||||
Total current assets | 141 | 520 | |||||
Creditors: amounts falling due within one yearc | 579 | 470 | |||||
Net current (liabilities) assets | (438 | ) | 50 | ||||
Total assets less current liabilities | 9,533 | 10,021 | |||||
Capital and reservesd | |||||||
| Called up share capital | 432 | 432 | |||||
| Share premium account | 3 | 2 | |||||
| Capital redemption reserve | 2 | 2 | |||||
| Profit and loss account | 9,096 | 9,585 | |||||
Total equity shareholders’ funds | 9,533 | 10,021 | |||||
| a | Debtors consists of amounts owed by subsidiary undertakings of £22 million (2004 – £456 million). |
| b | The company invested in a listed investment, with a book value and market value of £1 million (2004 – £1 million), and short term loans to subsidiary undertakings of £nil (2004 – £1 million). |
| c | Creditors consists of dividends payable of £551 million (2004 – £454 million), amounts owed to subsidiary undertakings of £17 million (2004 – £9 million) and other creditors of £11 million (2004 – £7 million). |
| d | Capital and reserves are shown on page 111. |
The financial statements of the company on pages 110 to 111 were approved by the board of directors on 18 May 2005 and were signed on its behalf by
Sir Christopher Bland
Chairman
Ben Verwaayen
Chief Executive
Hanif Lalani
Group Finance Director
| 110 BT Group plc Annual Report and Form 20-F 2005 | Notes to the financial statements |
| 34. | Company balance sheet continued |
| Share capital £m | e | Share premium account £m | f | Capital redemption reserve £m | Profit and loss account £m | Total £m | ||||||||||
| Balances at 1 April 2002 | 434 | 2 | – | 9,537 | 9,973 | |||||||||||
| Profit for the financial year | – | – | – | 560 | 560 | |||||||||||
| Dividends (6.5p per ordinary share) | – | – | – | (560 | ) | (560 | ) | |||||||||
| Balances at 31 March 2003 | 434 | 2 | – | 9,537 | 9,973 | |||||||||||
Purchase of own sharesh | ||||||||||||||||
| – shares cancelled | (2 | ) | – | 2 | (64 | ) | (64 | ) | ||||||||
| – treasury shares | – | – | – | (80 | ) | (80 | ) | |||||||||
Profit for the financial yearg | – | – | – | 924 | 924 | |||||||||||
| Dividends (8.5p per ordinary share) | – | – | – | (732 | ) | (732 | ) | |||||||||
| Balances at 31 March 2004 | 432 | 2 | 2 | 9,585 | 10,021 | |||||||||||
Purchase of own shares held as treasury sharesh | – | – | – | (195 | ) | (195 | ) | |||||||||
| Arising on share issues | – | 1 | – | – | 1 | |||||||||||
| Shares distributed under employee share plans | – | – | – | 19 | 19 | |||||||||||
Profit for the financial yearg | – | – | – | 570 | 570 | |||||||||||
| Dividends (10.4p per ordinary share) | – | – | – | (883 | ) | (883 | ) | |||||||||
Balances at 31 March 2005 | 432 | 3 | 2 | 9,096 | 9,533 | |||||||||||
| e | The authorised share capital of the company throughout the years ended 31 March 2005 and 31 March 2004 was £13,463 million representing 269,260,253,648 ordinary shares of 5p each. |
| The allotted, called up and fully paid ordinary share capital of the company at 31 March 2005 was £432 million (2004 – £432 million), representing 8,634,629,038 ordinary shares of 5p each (2004 – 8,634,629,038). |
| Of the authorised but unissued share capital at 31 March 2005, 26 million ordinary shares (2004 – 26 million) were reserved to meet options granted under employee share option schemes described in note 31. |
| f | The share premium account, representing the premium on allotment of shares is not available for distribution. |
| g | The profit for the financial year, dealt with in the profit and loss account of the company and after taking into account dividends from subsidiary undertakings, was £570 million (2004 – £924 million). As permitted by Section 230 of the Companies Act 1985, no profit and loss account of the company is presented. |
| h | During the year ended 31 March 2005 the company repurchased 101,280,000 (2004 – 80,571,000) of its own shares of 5p each, representing 1% (2004 – 1%) of the called-up share capital, for an aggregate consideration of £195 million (2004 – £144 million). At 31 March 2005 134,497,000 shares (2004 – 44,349,000 shares) with an aggregate nominal value of £7 million are held as treasury shares at cost. Of the total shares repurchased during the year ended 31 March 2004 36,222,000 shares with an aggregate nominal value of £2 million were cancelled immediately. |
| 35. | Post balance sheet events |
| Notes to the financial statements | BT Group plc Annual Report and Form 20-F 2005 111 |
United States Generally Accepted Accounting Principles
| The United States Generally Accepted Accounting Principles are divided into the following sections: |
| 113 |
| 116 |
| 116 |
| 117 |
| 117 |
| 117 |
| 118 |
| 120 |
| 120 |
| 121 |
| 112 BT Group plc Annual Report and Form 20-F 2005 |
The group’s consolidated financial statements are prepared in accordance with accounting principles generally accepted in the UK (UK GAAP), which differ in certain respects from those applicable in the US (US GAAP).
| i | Differences between United Kingdom and United States generally accepted accounting principles |
| (a) | Sale and leaseback of properties |
| (b) | Pension costs |
| (c) | Accounting for redundancies |
Under US GAAP, the associated costs of providing incremental pension benefits are charged against profits in the period in which the termination terms are agreed with the employees. The fair value of termination benefits for employees who are to be retained beyond their minimum contractual retention period is recognised on a straight line basis over the future service period.
| (d) | Capitalisation of interest |
| (e) | Goodwill |
Under US GAAP up to 31 March 2002, goodwill arising on the acquisition of subsidiaries, associates and joint ventures was capitalised as an intangible asset and amortised over its useful life. BT adopted SFAS No. 142 on 1 April 2002 and goodwill is no longer amortised but tested annually for impairment. In connection with the adoption of SFAS No. 142 transitional and annual impairment reviews were performed. There was no transitional impairment charge recorded. As a result of the annual impairment review, no goodwill impairment charge was recognised in the year ended 31 March 2005 (2004 – nil, 2003 – £54 million). Goodwill of £16 million (2004 – £12 million, 2003 – £20 million) amortised under UK GAAP is written back through the income statement.
| (f) | Intangible assets |
| (g) | Financial instruments |
| United States Generally Accepted Accounting Principles | BT Group plc Annual Report and Form 20-F 2005 113 |
| i | Differences between United Kingdom and United States generally accepted accounting principles continued |
| (h) | Employee share plans |
| (i) | Investments in associates |
| (j) | Deferred taxation |
The total valuation allowance recognised for deferred tax assets was as follows:
| 2005 | 2004 | Movement in year | ||||||||
| £m | £m | £m | ||||||||
| Capital losses | 4,436 | 4,843 | (407 | ) | ||||||
| Overseas losses not utilised | 860 | 572 | 288 | |||||||
| Other | 705 | 419 | 286 | |||||||
| 6,001 | 5,834 | 167 | ||||||||
At 31 March 2005 the group had operating losses and capital losses carried forward. The group’s capital losses have no expiry date restrictions. The expiry date of operating losses carried forward is dependent upon the tax law of the various territories in which the losses arise. A summary of expiry dates for losses in territories in which restrictions do apply is set out below:
| Territory | Valuation allowance | Expiry of losses | |||||
| £m | |||||||
Restricted losses: | |||||||
| Americas | 79 | 2015-2025 | |||||
| Europe | 222 | 2006-2020 | |||||
| Total restricted losses | 301 | ||||||
Unrestricted losses: | |||||||
| Operating losses | 559 | No expiry | |||||
| Capital losses | 4,436 | No expiry | |||||
Total unrestricted losses | 4,995 | ||||||
Total | 5,296 | ||||||
| 114 BT Group plc Annual Report and Form 20-F 2005 | United States Generally Accepted Accounting Principles |
| i | Differences between United Kingdom and United States generally accepted accounting principles continued |
| 2005 | 2004 | ||||||||||||
| Deferred tax assets | Deferred tax liabilities | Deferred tax assets | Deferred tax liabilities | ||||||||||
| £m | £m | £m | £m | ||||||||||
| UK GAAP | 106 | 2,280 | 113 | 2,304 | |||||||||
| Tax effect of US GAAP Adjustments: | |||||||||||||
| Pension | 1,566 | – | 1,714 | – | |||||||||
| Property | 438 | 326 | 413 | 337 | |||||||||
| Financial instruments | 111 | – | – | 14 | |||||||||
| Capitalised interest | – | 53 | – | 59 | |||||||||
| Other | – | – | – | 7 | |||||||||
| Rollover relief in respect of re-invested gains | – | 56 | – | 59 | |||||||||
| Deferred tax balances under US GAAP net of related valuation allowance | 2,221 | 2,715 | 2,240 | 2,780 | |||||||||
| (k) | Dividends |
| (l) | Impairment |
US GAAP requires that an entity assess whether impairment has occurred based on the undiscounted future cash flows. An impairment loss exists if the sum of these cash flows is less than the carrying amount of the asset. The impairment loss recognised in the income statement is based on the asset’s fair value, being either market value or the sum of discounted future cash flows. Tangible assets that were not impaired under US GAAP are depreciated over their remaining useful lives.
| (m) | Disposals of businesses |
| (n) | Property rationalisation provision |
| (o) | Revenue |
Under US GAAP revenue of £162 million under these contracts is deferred in the 2005 financial year under SOP 97-2 “Software revenue recognition” and SAB 104, as vendor specific objective evidence to support the fair value of the separate elements to be delivered is unavailable. There was no impact on net income. Total deferred revenue and costs not recorded in UK GAAP at 31 March 2005 was £239 million (2004 – £77 million).
| United States Generally Accepted Accounting Principles | BT Group plc Annual Report and Form 20-F 2005 115 |
| ii | Net income and shareholders’ equity reconciliation statements |
Net income |
| Years ended 31 March | 2005 £m | 2004 £m | 2003 £m | |||||||
| Net income applicable to shareholders under UK GAAP | 1,821 | 1,414 | 2,702 | |||||||
| Restatement under UITF 38 and UITF 17 – See note 1 | – | 3 | (16 | ) | ||||||
| Net income applicable to shareholders under UK GAAP as previously reported | 1,821 | 1,417 | 2,686 | |||||||
| Adjustment for: | ||||||||||
| Sale and leaseback of properties | (83 | ) | (85 | ) | (114 | ) | ||||
| Pension costs | (212 | ) | (428 | ) | (177 | ) | ||||
| Redundancy charges | (20 | ) | 20 | – | ||||||
| Capitalisation of interest, net of related depreciation | (13 | ) | (23 | ) | (17 | ) | ||||
| Goodwill | 16 | 12 | (35 | ) | ||||||
| Intangible asset amortisation | – | – | (26 | ) | ||||||
| Financial instruments | (411 | ) | (82 | ) | 731 | |||||
| Impairment | (24 | ) | (24 | ) | (24 | ) | ||||
| Employee share plans | (15 | ) | (8 | ) | (11 | ) | ||||
| Property rationalisation provision | (5 | ) | (142 | ) | 147 | |||||
| Disposals of businesses | – | – | 130 | |||||||
| Deferred taxation | 3 | 4 | 976 | |||||||
| 1,057 | 661 | 4,266 | ||||||||
| Tax effect of US GAAP adjustments | 240 | 222 | (132 | ) | ||||||
Net income as adjusted for US GAAP | 1,297 | 883 | 4,134 | |||||||
Basic earnings per American Depositary Share as adjusted for US GAAPa | £1.52 | £1.02 | £4.80 | |||||||
Diluted earnings per American Depositary Share as adjusted for US GAAPa | £1.51 | £1.02 | £4.77 | |||||||
| a | Each American Depositary Share is equivalent to ten ordinary shares. |
Shareholders’ equity |
| At 31 March | 2005 £m | 2004 £m | |||||
| Shareholders’ equity under UK GAAP | 3,851 | 3,066 | |||||
| Re-statement under UITF 38 and UITF 17 – see note 1 | – | 28 | |||||
| Shareholders’ equity under UK GAAP as previously reported | 3,851 | 3,094 | |||||
| Adjustment for: | |||||||
| Sale and leaseback of properties | (1,460 | ) | (1,377 | ) | |||
| Pension costs | (5,219 | ) | (5,714 | ) | |||
| Redundancy charges | – | 20 | |||||
| Capitalisation of interest, net of related depreciation | 178 | 195 | |||||
| Goodwill | 51 | 124 | |||||
| Intangible assets | 78 | – | |||||
| Financial instruments | (371 | ) | (8 | ) | |||
| Impairment | 77 | 100 | |||||
| Property rationalisation provision | – | 5 | |||||
| Deferred taxation | (56 | ) | (59 | ) | |||
| Dividend declared after the financial year end | 551 | 454 | |||||
| (2,320 | ) | (3,166 | ) | ||||
| Tax effect of US GAAP adjustments | 1,736 | 1,711 | |||||
Shareholders’ equity as adjusted for US GAAP | (584 | ) | (1,455 | ) | |||
| iii | Minority interests |
| 116 BT Group plc Annual Report and Form 20-F 2005 | United States Generally Accepted Accounting Principles |
| iv | Accounting for share options |
| v | Consolidated statements of cash flows |
Under SFAS No. 95, cash and cash equivalents include cash and short-term investments with maturities of three months or less at the date of purchase. Under FRS 1 cash comprises cash in hand and at bank and overnight deposits, net of bank overdrafts.
Under FRS 1, cash flows are presented for operating activities; returns on investments and servicing of finance; taxation; capital expenditure and financial investments; acquisitions and disposals; dividends paid to the company’s shareholders; management of liquid resources and financing. SFAS No. 95 requires a classification of cash flows as resulting from operating, investing and financing activities.
Cash flows under FRS 1 in respect of interest received, interest paid (net of that capitalised under US GAAP) and taxation would be included within operating activities under SFAS No. 95. Cash flows from purchases, sales and maturities of trading securities, while not separately identified under UK GAAP, would be included within operating activities under US GAAP. Capitalised interest, while not recognised under UK GAAP, is included in investing activities under US GAAP. Dividends paid are included within financing activities under US GAAP.
The following statements summarise the statements of cash flows as if they had been presented in accordance with US GAAP, and include the adjustments which reconcile cash and cash equivalents under US GAAP to cash at bank and in hand reported under UK GAAP.
| 2005 £m | 2004 £m | 2003 £m | ||||||||
| Net cash provided by operating activities | 4,586 | 4,632 | 3,395 | |||||||
| Net cash (used) provided by investing activities | (2,012 | ) | (3,460 | ) | 1,253 | |||||
| Net cash used in financing activities | (2,269 | ) | (3,093 | ) | (2,852 | ) | ||||
| Net (decrease) increase in cash and cash equivalents | 305 | (1,921 | ) | 1,796 | ||||||
| Effect of exchange rate changes on cash | – | (5 | ) | 13 | ||||||
| Cash and cash equivalents under US GAAP at beginning of year | 1,007 | 2,933 | 1,124 | |||||||
| Cash and cash equivalents under US GAAP at end of year | 1,312 | 1,007 | 2,933 | |||||||
| Short-term investments with original maturities of less than three months | (1,106 | ) | (898 | ) | (2,842 | ) | ||||
Cash at bank and in hand under UK GAAP at end of year | 206 | 109 | 91 | |||||||
| vi | Current asset investments |
At 31 March 2005, the group held trading investments (as defined by US GAAP) with fair values totalling £339 million (2004 – £423 million). Held-to-maturity securities at 31 March 2005 and 2004 consisted of the following:
| Amortised cost £m | Estimated fair value £m | ||||||
Commercial paper, medium-term notes and other investments at 31 March 2005 | 2,003 | 2,003 | |||||
| Commercial paper, medium-term notes and other investments at 31 March 2004 | 3,629 | 3,629 | |||||
The contractual maturities of the held-to-maturity debt securities at 31 March 2005 were as follows:
| Amortised cost £m | Estimated fair value £m | ||||||
| Maturing on or before 31 March 2006 | 1,999 | 1,999 | |||||
| Maturing after 1 year through 5 years | 4 | 4 | |||||
Total at 31 March 2005 | 2,003 | 2,003 | |||||
| United States Generally Accepted Accounting Principles | BT Group plc Annual Report and Form 20-F 2005 117 |
| vi | Current asset investments continued |
| Amortised cost £m | Estimated fair value £m | ||||||
Commercial paper, medium-term notes and other investments at 31 March 2005 | 1,149 | 1,149 | |||||
| Commercial paper, medium-term notes and other investments at 31 March 2004 | 214 | 214 | |||||
| Amortised cost £m | Estimated fair value £m | ||||||
| Maturing on or before 31 March 2006 | 1,149 | 1,149 | |||||
| Maturing after 1 year through 5 years | – | – | |||||
Total at 31 March 2005 | 1,149 | 1,149 | |||||
| vii | Pension costs |
The pension cost determined under SFAS No. 87 was calculated by reference to an expected long-term rate of return on scheme assets of 7.27% (2004 – 7.35%, 2003 – 6.90%). The components of the pension cost for the main pension scheme comprised:
| 2005 £m | 2004 £m | 2003 £m | ||||||||
| Service cost | 507 | 388 | 453 | |||||||
| Interest cost | 1,745 | 1,657 | 1,707 | |||||||
| Expected return on scheme assets | (1,897 | ) | (1,646 | ) | (1,813 | ) | ||||
| Amortisation of prior service costs | 24 | 24 | 24 | |||||||
| Amortisation of net obligation at date of limited application of SFAS No. 87 | – | 2 | 52 | |||||||
| Amortisation of loss (gain) | 263 | 378 | (22 | ) | ||||||
| Additional cost of termination benefits | – | 1 | 60 | |||||||
Pension cost for the year under US GAAP | 642 | 804 | 461 | |||||||
The information required to be disclosed in accordance with SFAS No. 132(R) concerning the funded status of the main scheme at 31 March 2004 and 31 March 2005, based on the valuations at 1 January 2004 and 1 January 2005, respectively, is given below.
Minimum liability, intangible asset and other comprehensive income | 2005 £m | 2004 £m | |||||
| Plan assets at fair value | 29,169 | 26,675 | |||||
| Accumulated benefit obligation | 33,160 | 31,137 | |||||
| Minimum liability | 3,991 | 4,462 | |||||
| Net amount recognised at end of year | (2,535 | ) | (2,275 | ) | |||
| Minimum additional liability | 1,456 | 2,187 | |||||
| Intangible asset as at 31 March 2004: | |||||||
| Unrecognised prior service cost | (55 | ) | (79 | ) | |||
Accumulated other comprehensive income | 1,401 | 2,108 | |||||
Changes in benefit obligation | 2005 £m | 2004 £m | |||||
| Benefit obligation at the beginning of the year | 32,448 | 30,277 | |||||
| Service cost | 507 | 388 | |||||
| Interest cost | 1,745 | 1,657 | |||||
| Employees’ contributions | 50 | 148 | |||||
| Additional cost of termination benefits | – | 1 | |||||
| Actuarial movement | 943 | 1,428 | |||||
| Other changes | 7 | 5 | |||||
| Benefits paid or payable | (1,364 | ) | (1,456 | ) | |||
Benefit obligation at the end of the year | 34,336 | 32,448 | |||||
| 118 BT Group plc Annual Report and Form 20-F 2005 | United States Generally Accepted Accounting Principles |
| vii | Pension costs continued |
| 2005 per annum % | 2004 per annum % | 2003 per annum % | ||||||||
| Discount rate | 5.3 | 5.5 | 5.6 | |||||||
| Rate of future pay increases | 3.6 | 3.6 | 3.8 | |||||||
| Rate of future pension increases | 2.6 | 2.6 | 2.25 | |||||||
Estimated future benefit payments are as follows:
| £m | ||||
| Year ending 31 March 2006 | 1,392 | |||
| Year ending 31 March 2007 | 1,432 | |||
| Year ending 31 March 2008 | 1,477 | |||
| Year ending 31 March 2009 | 1,532 | |||
| Year ending 31 March 2010 | 1,598 | |||
| 1 April 2010 to 31 March 2015 | 9,039 | |||
Changes in scheme assets | 2005 | 2004 | |||||
| £m | £m | ||||||
| Fair value of scheme assets at the beginning of the year | 26,675 | 22,757 | |||||
| Actual return on scheme assets | 3,419 | 4,195 | |||||
Employer’s contributionsa | 382 | 1,026 | |||||
| Employees’ contributions | 50 | 148 | |||||
| Other changes | 7 | 5 | |||||
| Benefits paid or payable | (1,364 | ) | (1,456 | ) | |||
Fair value of scheme assets at the end of the year | 29,169 | 26,675 | |||||
Funded status under US GAAP | 2005 | 2004 | |||||
| £m | £m | ||||||
| Projected benefit obligation in excess of scheme assets | (5,167 | ) | (5,773 | ) | |||
Unrecognised prior service costsb | 55 | 79 | |||||
| Other unrecognised net actuarial losses | 2,577 | 3,419 | |||||
Net amount recognised under US GAAP | (2,535 | ) | (2,275 | ) | |||
| a | The employer’s contributions for the year ended 31 March 2005 includes special contributions of £6 million paid in June 2004 (2004 – £362 million paid in December 2003 and £380 million paid in March 2004). |
| b | Unrecognised prior service costs on scheme benefit improvements are being amortised over periods of 15 or 16 years commencing in the years of the introduction of the improvements. |
Asset allocation |
| Year ended 31 December 2004 | ||||||||||
| Fair value £bn | % | Target % | ||||||||
| Equities | 20.2 | 69 | 63 | |||||||
| Fixed interest bonds | 4.4 | 15 | 16 | |||||||
| Index linked securities | 2.7 | 9 | 9 | |||||||
| Property | 1.9 | 7 | 12 | |||||||
| 29.2 | 100 | 100 | ||||||||
| Year ended 31 December 2003 | ||||||||||
| Fair value £bn | % | Target % | ||||||||
| Equities | 17.1 | 65 | 65 | |||||||
| Fixed interest bonds | 3.9 | 15 | 15 | |||||||
| Index linked securities | 2.1 | 8 | 8 | |||||||
| Property | 3.2 | 12 | 12 | |||||||
| 26.3 | 100 | 100 | ||||||||
| United States Generally Accepted Accounting Principles | BT Group plc Annual Report and Form 20-F 2005 119 |
| vii | Pension costs continued |
| viii | Income statement in US GAAP format |
| 2005 £m | 2004 £m | a | 2003 £m | a | ||||||
| Revenue | 18,623 | 18,519 | 18,727 | |||||||
| Operating expenses: | ||||||||||
| Payroll costs | 3,729 | 3,738 | 3,667 | |||||||
| Depreciation and amortisation | 2,856 | 2,936 | 3,035 | |||||||
| Payments to telecommunication operators | 3,725 | 3,963 | 3,940 | |||||||
| Other operating expenses | 5,695 | 5,189 | 5,724 | |||||||
| Total operating expenses | 16,005 | 15,826 | 16,366 | |||||||
| Net operating income | 2,618 | 2,693 | 2,361 | |||||||
| Other income, net | 551 | 227 | 1,922 | |||||||
| Net interest expense | (801 | ) | (941 | ) | (1,439 | ) | ||||
| Income taxes | (523 | ) | (539 | ) | (459 | ) | ||||
| Minority interests | 1 | 8 | (12 | ) | ||||||
| Equity in losses (earnings) of investees | (25 | ) | (34 | ) | 329 | |||||
| Net income | 1,821 | 1,414 | 2,702 | |||||||
| Earnings per share – basic | 21.4 | p | 16.4 | p | 31.4 | p | ||||
| Earnings per share – diluted | 21.2 | p | 16.3 | p | 31.2 | p | ||||
| a | Restated following the adoption of UITF17 and UITF38 (see note 1 on page 81). |
| ix | US GAAP developments |
In December 2004, the FASB issued Statement of Financial Accounting Standards No. 153 (SFAS 153) “Exchanges of Non-monetary Assets – an amendment of APB Opinion No. 29” SFAS 153 addresses the measurement of exchanges of non-monetary assets. It eliminates the exception from fair value measurement for non-monetary exchanges of similar productive assets in paragraph 21(b) of APB Opinion No. 29 “Accounting for Non-monetary Transactions” and replaces it with an exception for exchanges that do not have commercial substance. A non-monetary exchange has commercial substance if the future cash flows of the entity are expected to change significantly as a result of the exchange. As required by SFAS 153, we will adopt this new accounting standard effective 1 July 2005. The adoption of SFAS 153 is not expected to have a material impact on our financial position, results of operations or cash flows.
In November 2004, the FASB issued Statement of Financial Accounting Standards No.151 (SFAS 151), “Inventory Costs – an amendment of ARB No. 43, Chapter 4”, which clarifies that abnormal amounts of idle facility expense, freight, handling costs, and wasted material (spoilage) should be recognised as a current period expense. In addition, SFAS 151 requires that allocation of fixed production overhead to the costs of conversion be based on the normal capacity of the production facilities. SFAS 151 is effective for fiscal years beginning after 15 June 2005. BT does not believe that the implementation of this standard will have a material impact on its financial position, results of operations or cash flows.
| 120 BT Group plc Annual Report and Form 20-F 2005 | United States Generally Accepted Accounting Principles |
| ix | US GAAP developments continued |
In October 2004, the EITF reached a consensus on Issue No. 04-1 ‘Accounting for Pre-existing Relationships between the Parties to a Business Combination’ (EITF 04-1). EITF 04-1 addresses the accounting treatment of pre-existing relationships between the parties of a business combination. The consensus of EITF 04-1 should be applied to business combinations consummated and goodwill impairment tests performed in reporting periods beginning after the FASB ratified the consensus at its October 13, 2004 meeting. The group will adopt the provisions of EITF 04-1 as of April 1, 2005. If it is determined that assets of an acquired entity are related to a pre-existing contractual relationship, thus requiring accounting separate from the business combination, BT will evaluate whether the acquiring entity of the group should recognise contractual relationships as assets separate from goodwill in that business combination.
In March 2004, the EITF reached a consensus on EITF Issue No. 03-1, ‘The Meaning of Other-Than-Temporary Impairment and Its Application to Certain Investments’ (EITF 03-1). The guidance prescribed a three-step model for determining whether an investment is other-than-temporarily impaired and requires disclosure for unrealized losses on investments. In September 2004, the FASB issued FASB Staff Position EITF 03-1-1 ‘Effective Date of Paragraphs 10-20 of EITF Issue No. 03-1’ (FSP EITF 03-1-1). FSP EITF 03-1-1 delays the effective date for the measurement and recognition guidance contained in paragraphs 10-20 of EITF 03-1. The disclosure requirements of EITF 03-1 remain effective for fiscal years ending after June 15, 2004. No effective date for the measurement and recognition guidance has been established in FSP EITF 03-1-1. During the period of delay, FSP EITF 03-1-1 states that companies should continue to apply current guidance to determine if an impairment is other-than-temporary. The adoption of EITF 03-1, excluding paragraphs 10-20, did not impact the group’s consolidated position, results of operations or cash flows. The group will assess the impact of paragraphs 10-20 of EITF 03-1 once the guidance has been finalised.
| x | Supplemental unaudited pro forma information relating to businesses acquired during the year ended 31 March 2005 |
| 2005 £m | 2004 £m | ||||||
| Turnover | 19,069 | 19,262 | |||||
| Profit for the financial year | 1,187 | 698 | |||||
| Earnings per share | 13.9 | p | 8.1 | p | |||
| United States Generally Accepted Accounting Principles | BT Group plc Annual Report and Form 20-F 2005 121 |
Subsidiary undertakings, joint ventures and associates
BT Group plc is the parent company of the group. Brief details of its principal operating subsidiary undertakings, joint ventures and associates at 31 March 2005, other than the company, all of which were unlisted unless otherwise stated, were as follows:
Activity | Group interest in allotted capitalb | Country of operations | c | |||||||
Subsidiary undertakings | ||||||||||
Albacom SpAde | Communication related services and products provider | 100% ordinary | Italy | |||||||
British Telecommunications plcd | Communication related services and products provider | 100% ordinary | UK | |||||||
BT Americas Inc.d | Communication related services and products provider | 100% common | USA | |||||||
BT Australasia Pty Limitedd | Communication related services and products provider | 100% ordinary 100% preference | Australia | |||||||
BT Cableships Limitedd | Cableship owner | 100% ordinary | International | |||||||
BT Centre Nominee 2 Limitedd | Property holding company | 100% ordinary | UK | |||||||
BT Communications Management Limitedd | Telecommunication services provider | 100% ordinary | UK | |||||||
BT ESPANA, Compania de Servicios Globales de Telecommunicaciones, S.A.d | Communication related services and products provider | 100% ordinary | Spain | |||||||
BT Fleet Limitedd | Fleet management company | 100% ordinary | UK | |||||||
BT (Germany) GmbH & Co. oHGd | Communication related services and products provider | 100% ordinary | Germany | |||||||
BT Global Services Limitedd | International telecommunication network systems provider | 100% ordinary | UK | |||||||
BT Holdings Limitedd | Investment holding company | 100% ordinary | UK | |||||||
BT Hong Kong Limitedd | Communication related services and products provider | 100% ordinary 100% preference | Hong Kong | |||||||
BT Limitedd | International telecommunication network systems provider | 100% ordinary | International | |||||||
BT Nederland NVd | Communication related services and products provider | 100% ordinary | Netherlands | |||||||
BT Subsea Cables Limitedd | Cable maintenance and repair | 100% ordinary | UK | |||||||
BT US Investments LLCd | Investment holding company | 100% ordinary | USA | |||||||
Communications Networking Services (UK)d | Communication related services and products provider | 100% ordinary | UK | |||||||
Communications Global Network Services Limitedd | Communication related services and products provider | 100% ordinary | Bermuda | |||||||
Esat Telecommunications Limiteddg | Telecommunication services provider | 100% ordinary | Ireland | |||||||
Farland BVcd | Provider of trans-border fibre network across BT’s partners in Europe | 100% ordinary | International | |||||||
Infonet Services Corporationdf | Global managed network service provider | 100% common | USA | |||||||
Infonet USA Corporationdf | Global managed network service provider | 100% common | USA | |||||||
Syntegra Limitedd | Systems integration and application development | 100% ordinary | UK | |||||||
Syntegra Groep BVd | Systems integration and application development | 100% ordinary | Netherlands | |||||||
Syntegra SAd | Systems integration and application development | 100% ordinary | France | |||||||
Syntegra (USA) Inc.cd | Systems integration and electronic business outsourcing services | 100% common | International | |||||||
| a | The group comprises a large number of companies and it is not practical to include all of them in this list. The list, therefore, only includes those companies that have a more significant impact on the profit or assets of the group. A full list of subsidiaries, joint ventures and associates will be annexed to the company’s next annual return filed with the Registrar of Companies. |
| b | The proportion of voting rights held corresponds to the aggregate interest percentage held by the holding company and subsidiary undertakings. |
| c | All overseas undertakings are incorporated in their country of operations. Subsidiary undertakings operating internationally are all incorporated in England and Wales, except Farland BV and Syntegra (USA) Inc. which are incorporated in the Netherlands and USA, respectively. |
| d | Held through intermediate holding company. |
| e | In February 2005, BT acquired the remaining 74% economic interest in Albacom SpA, and is now 100% owned. |
| f | In February 2005, BT acquired the Infonet group of companies. |
| g | In April 2005, Esat Telecommunications Limited changed its name to BT Communications Ireland Limited. |
| Share capital | |||||||||||||
| bn = billions | Percentage | Country of | |||||||||||
| m = millions | Activity | Issued | a | owned | operations | b | |||||||
Joint Ventures | |||||||||||||
| LG Telecom | Mobile cellular telephone system provider and operator | Won 1,386 | bn | 16.586% | c | Republic of South Korea | |||||||
| a | Issued share capital comprises ordinary or common shares, unless otherwise stated. All investments are held through intermediate holding companies. |
| b | Incorporated in the country of operations. |
| c | Held through intermediate holding company. |
| 122 BT Group plc Annual Report and Form 20-F 2005 |
Quarterly analysis of turnover and profit
Year ended 31 March 2005 | Unaudited | |||||||||||||||
| Quarters | 1st £m | 2nd £m | 3rd £m | 4th £m | Total £m | |||||||||||
Total turnover | 4,622 | 4,768 | 4,692 | 4,949 | 19,031 | |||||||||||
| Group’s share of associates’ and joint ventures’ turnover | (55 | ) | (166 | ) | (108 | ) | (79 | ) | (408 | ) | ||||||
Group turnover | 4,567 | 4,602 | 4,584 | 4,870 | 18,623 | |||||||||||
| Other operating income | 41 | 43 | 48 | 39 | 171 | |||||||||||
| Group operating profit | 622 | 731 | 730 | 706 | 2,789 | |||||||||||
| Group’s share of operating (loss) profit of associates and joint ventures | (5 | ) | 3 | (31 | ) | 8 | (25 | ) | ||||||||
| Total operating profit | 617 | 734 | 699 | 714 | 2,764 | |||||||||||
| Profit on sale of fixed asset investments and group undertakings | 3 | 25 | 284 | 46 | 358 | |||||||||||
| Profit on sale of property fixed assets | – | 15 | 7 | – | 22 | |||||||||||
| Net interest payable | (204 | ) | (207 | ) | (200 | ) | (190 | ) | (801 | ) | ||||||
Profit on ordinary activities before taxation | 416 | 567 | 790 | 570 | 2,343 | |||||||||||
| Tax on profit on ordinary activities | (111 | ) | (140 | ) | (137 | ) | (135 | ) | (523 | ) | ||||||
Profit on ordinary activities after taxation | 305 | 427 | 653 | 435 | 1,820 | |||||||||||
| Minority interests | – | 1 | – | – | 1 | |||||||||||
Profit for the financial period | 305 | 428 | 653 | 435 | 1,821 | |||||||||||
| Basic earnings per share | 3.6 | p | 5.0 | p | 7.7 | p | 5.1 | p | 21.4 | p | ||||||
| Diluted earnings per share | 3.5 | p | 5.0 | p | 7.6 | p | 5.1 | p | 21.2 | p | ||||||
| Profit before goodwill amortisation, exceptional items and taxation | 434 | 549 | 545 | 557 | 2,085 | |||||||||||
| Basic earnings per share before goodwill amortisation and exceptional items | 3.7 | p | 4.8 | p | 4.8 | p | 4.9 | p | 18.1 | p | ||||||
| Diluted earnings per share before goodwill amortisation and exceptional items | 3.7 | p | 4.8 | p | 4.7 | p | 4.8 | p | 18.0 | p | ||||||
| Year ended 31 March 2004 | Unaudited | |||||||||||||||
| 1st | 2nd | 3rd | 4th | Total | a | |||||||||||
| Quarters | £m | £m | £m | £m | £m | |||||||||||
Total turnover | 4,693 | 4,667 | 4,676 | 4,878 | 18,914 | |||||||||||
| Group’s share of associates’ and joint ventures’ turnover | (107 | ) | (99 | ) | (98 | ) | (91 | ) | (395 | ) | ||||||
Group turnover | 4,586 | 4,568 | 4,578 | 4,787 | 18,519 | |||||||||||
| Other operating income | 52 | 44 | 37 | 44 | 177 | |||||||||||
| Group operating profit | 726 | 744 | 739 | 661 | 2,870 | |||||||||||
| Group’s share of operating (loss) profit of associates and joint ventures | (3 | ) | (4 | ) | 5 | (32 | ) | (34 | ) | |||||||
| Total operating profit | 723 | 740 | 744 | 629 | 2,836 | |||||||||||
| Profit (loss) on sale of fixed asset investments and group undertakings | (1 | ) | – | 33 | 4 | 36 | ||||||||||
| Profit on sale of property fixed assets | – | 1 | 1 | 12 | 14 | |||||||||||
| Net interest payable | (225 | ) | (234 | ) | (260 | ) | (222 | ) | (941 | ) | ||||||
Profit on ordinary activities before taxation | 497 | 507 | 518 | 423 | 1,945 | |||||||||||
| Tax on profit on ordinary activities | (153 | ) | (132 | ) | (133 | ) | (121 | ) | (539 | ) | ||||||
Profit on ordinary activities after taxation | 344 | 375 | 385 | 302 | 1,406 | |||||||||||
| Minority interests | 6 | 1 | – | 1 | 8 | |||||||||||
Profit for the financial period | 350 | 376 | 385 | 303 | 1,414 | |||||||||||
| Basic earnings per share | 4.1 | p | 4.3 | p | 4.5 | p | 3.5 | p | 16.4 | p | ||||||
| Diluted earnings per share | 4.0 | p | 4.3 | p | 4.4 | p | 3.5 | p | 16.3 | p | ||||||
| Profit before goodwill amortisation, exceptional items and taxation | 501 | 528 | 525 | 459 | 2,013 | |||||||||||
| Basic earnings per share before goodwill amortisation and exceptional items | 4.1 | p | 4.4 | p | 4.4 | p | 3.9 | p | 16.9 | p | ||||||
| Diluted earnings per share before goodwill amortisation and exceptional items | 4.1 | p | 4.4 | p | 4.4 | p | 3.9 | p | 16.8 | p | ||||||
| a | Restated – see note 1 |
| BT Group plc Annual Report and Form 20-F 2005 123 |
Financial statistics
Years ended 31 March
| 2001 | 2002 | 2003 | 2004 | 2005 | ||||||||||||
Financial ratios | ||||||||||||||||
Basic earnings per share on continuing activities before goodwill amortisation and exceptional items – pencea | 19.2 | 9.0 | 14.4 | 16.9 | 18.1 | |||||||||||
Basic earnings (loss) per share on continuing activities – pencea | 20.6 | (34.6 | ) | 31.4 | 16.4 | 21.4 | ||||||||||
Basic earnings (loss) per share – pencea | (25.8 | ) | 12.1 | 31.4 | 16.4 | 21.4 | ||||||||||
Return on capital employed %bc | 14.9 | 6.6 | 15.5 | 15.1 | d | 15.5 | d | |||||||||
Interest covere | 2.6 | 0.6 | 2.0 | 3.0 | f | 3.5 | f | |||||||||
| a | Restated following adoption of UITF 17 and UITF 38 (see note 1 on page 81). |
| b | The ratio is based on profit before tax, goodwill amortisation and interest on long-term borrowings, to average capital employed. Capital employed is represented by total assets, excluding goodwill, less current liabilities, excluding corporate taxes and dividends payable, and provisions other than those for deferred taxation. Year-end figures are used in the computation of the average, except in the case of short-term investments and borrowings where average daily balances are used in their place. |
| c | Return on capital employed is based upon the continuing activities. |
| d | Return on capital employed before goodwill amortisation and exceptional items was 16.0% (2004 – 15.3%). |
| e | The number of times net interest payable is covered by total operating profit before goodwill amortisation. |
| f | Interest cover before goodwill amortisation and exceptional items was 3.6 times (2004 – 3.3 times). |
| 2001 £m | 2002 £m | 2003 £m | 2004 £m | 2005 £m | ||||||||||||
Expenditure on research and development | ||||||||||||||||
| Total expenditure | 364 | 362 | 380 | 334 | 257 | |||||||||||
| 2001 £m | 2002 £m | 2003 £m | 2004 £m | 2005 £m | ||||||||||||
Expenditure on tangible fixed assets | ||||||||||||||||
| Plant and equipment | ||||||||||||||||
| Transmission equipment | 1,655 | 1,373 | 1,277 | 1,324 | 1,488 | |||||||||||
| Exchange equipment | 478 | 428 | 228 | 150 | 143 | |||||||||||
| Other network equipment | 918 | 694 | 466 | 585 | 648 | |||||||||||
| Computers and office equipment | 407 | 273 | 281 | 205 | 312 | |||||||||||
| Motor vehicles and other | 231 | 189 | 162 | 316 | 349 | |||||||||||
| Land and buildings | 171 | 153 | 40 | 73 | 64 | |||||||||||
| 3,860 | 3,110 | 2,454 | 2,653 | 3,004 | ||||||||||||
| Increase (decrease) in engineering stores | (3 | ) | (10 | ) | (9 | ) | 20 | 7 | ||||||||
Total continuing activities | 3,857 | 3,100 | 2,445 | 2,673 | 3,011 | |||||||||||
Total discontinued activities | 1,129 | 808 | – | – | – | |||||||||||
Total expenditure on tangible fixed assets | 4,986 | 3,908 | 2,445 | 2,673 | 3,011 | |||||||||||
| (Increase) decrease in creditors | (230 | ) | 161 | 135 | 11 | 45 | ||||||||||
Cash outflow on purchase of tangible fixed assets | 4,756 | 4,069 | 2,580 | 2,684 | 3,056 | |||||||||||
| 124 BT Group plc Annual Report and Form 20-F 2005 |
Operational statistics
Years ended 31 March
| 2001 | 2002 | 2003 | 2004 | 2005 | ||||||||||||
Call growth (decline) | ||||||||||||||||
| % growth (decline) in UK fixed-network call volumes (minutes) over the previous year | 18 | 19 | 13 | (2 | ) | (18 | ) | |||||||||
| 2001 | 2002 | 2003 | 2004 | 2005 | ||||||||||||
UK exchange line connections | ||||||||||||||||
| Business (’000) | 8,918 | 9,072 | 9,198 | 9,071 | 8,705 | |||||||||||
| % growth (decline) over previous year | 5.5 | 1.7 | 1.4 | (1.4 | ) | (4.0 | ) | |||||||||
| Residential (’000) | 19,981 | 20,093 | 20,357 | 20,550 | 20,850 | |||||||||||
| % growth (decline) over previous year | (0.3 | ) | 0.6 | 1.3 | 0.9 | 1.5 | ||||||||||
| Service providers (’000) | 67 | 56 | 91 | 377 | 1,012 | |||||||||||
| % growth (decline) over previous year | (29.5 | ) | (16.4 | ) | 62.5 | 314 | 168 | |||||||||
| Total exchange line connections (’000) | 28,966 | 29,221 | 29,646 | 29,998 | 30,567 | |||||||||||
| % growth over previous year | 1.4 | 0.9 | 1.5 | 1.2 | 1.9 | |||||||||||
| Included above: | ||||||||||||||||
| Wholesale DSL connections (’000) | 49 | 170 | 800 | 2,215 | 4,932 | |||||||||||
| % growth over previous year | n/a | 247 | 371 | 177 | 123 | |||||||||||
| 2001 | 2002 | 2003 | 2004 | 2005 | ||||||||||||
People employed | ||||||||||||||||
| Continuing activities (’000) | 116.8 | 108.6 | 104.7 | 99.9 | 102.1 | |||||||||||
| Discontinued activities (’000) | 20.2 | – | – | – | – | |||||||||||
| Total employees (’000) | 137.0 | 108.6 | 104.7 | 99.9 | 102.1 | |||||||||||
| BT Group plc Annual Report and Form 20-F 2005 125 |
Risk factors
The business of BT is affected by a number of factors, not all of which are wholly within BT’s control. Although many of the factors influencing BT’s performance are macro economic and likely to affect the performance of businesses generally, some aspects of BT’s business make it particularly sensitive to certain areas of business risk. This section highlights some of those specific areas. However, it does not purport to be an extensive analysis of the factors affecting the business and some risks may be unknown to us and other risks, currently believed to be immaterial, could turn out to be material. All of these could materially adversely affect our business, turnover, profits, assets, liquidity and capital resources. They should also be considered in connection with the forward looking statements in this document and the cautionary statement regarding forward-looking statements on page 128 of this document.
If BT’s activities are subject to significant price and other regulatory controls, its market share, competitive position and future profitability may be affected |
BT faces strong competition in UK fixed network services |
BT’s business is dependent on the ability to exploit technological advances quickly and successfully |
BT is carrying out a transformation strategy, including the targeting of significant growth in new wave business areas |
BT’s businesses may be adversely affected if they fail to perform on major contracts |
BT’s businesses may be adversely affected if their networks or systems experience any significant failures or interruptions |
Declining investment returns and longer life expectancy may result in the funding cost of the defined benefit pension scheme becoming a significant burden on the financial resources of BT |
| 126 BT Group plc Annual Report and Form 20-F 2005 |
Additional information for shareholders
| 128 |
| 129 |
| 129 |
| 129 |
| 130 |
| 130 |
| 130 |
| 131 |
| 131 |
| 131 |
| 131 |
| 132 |
| 132 |
| 132 |
| 132 |
| 132 |
| 132 |
| 135 | |
| 135 | Taxation (US Holders) Taxation of dividends Taxation of capital gains Passive foreign investment company status US information reporting and backup withholding UK stamp duty UK inheritance and gift taxes in connection with ordinary shares and/or ADSs |
| 138 |
| 138 |
| 138 |
| 138 |
| 139 |
| BT Group plc Annual Report and Form 20-F 2005 127 |
Cautionary statement regarding forward-looking statements |
Due to a number of new and revised Standards included within the body of Standards that comprise IFRS (International Financial Reporting Standards), there is not yet a significant body of established practice on which to draw in forming opinions regarding interpretation and application. Accordingly, practice is continuing to evolve. At this preliminary stage, therefore, the full financial effect of reporting under IFRS as it will be applied and reported on in the group’s first IFRS financial statements cannot be determined with certainty and may be subject to change.
Although BT believes that the expectations reflected in these forward-looking statements are reasonable, it can give no assurance that these expectations will prove to have been correct. Because these statements involve risks and uncertainties, actual results may differ materially from those expressed or implied by these forward-looking statements.
Factors that could cause differences between actual results and those implied by the forward-looking statements include, but are not limited to: material adverse changes in economic conditions in the markets served by BT and its lines of business; future regulatory actions and conditions in its operating areas, including competition from others in the UK and other international communications markets; selection by BT and its lines of business of the appropriate trading and marketing models for its products and services; technological innovations, including the cost of developing new products and the need to increase expenditures for improving the quality of service; the anticipated benefits and advantages of new technologies not being realised; developments in the convergence of technologies; prolonged adverse weather conditions resulting in a material increase in overtime, staff or other costs; the timing of entry and profitability of BT and its lines of business in certain communications markets; significant changes in market shares for BT and its principal products and services; fluctuations in foreign currency exchange rates and interest rates; and general financial market conditions affecting BT’s performance. Certain of these factors are discussed in more detail elsewhere in this annual report including, without limitation, in Risk factors. BT undertakes no obligation to update any forward-looking statements whether as a result of new information, future events or otherwise.
| 128 BT Group plc Annual Report and Form 20-F 2005 | Additional information for shareholders |
| Pence per ordinary share | US$ per ADS | ||||||||||||
| High pence | Low pence | High $ | Low $ | ||||||||||
Years ended 31 March | |||||||||||||
| 2001 | 821.78 | 328.85 | 139.25 | 51.47 | |||||||||
| 2002 | 420.71 | 215.75 | 67.19 | 30.60 | |||||||||
| 2003 | 286.25 | 141.00 | 41.95 | 23.16 | |||||||||
| 2004 | 206.75 | 162.00 | 34.97 | 25.65 | |||||||||
| 2005 | 216.25 | 169.25 | 40.93 | 30.34 | |||||||||
Year ended 31 March 2004 | |||||||||||||
| 1 April – 30 June 2003 | 206.00 | 162.00 | 34.97 | 25.65 | |||||||||
| 1 July – 30 September 2003 | 206.75 | 180.00 | 33.70 | 28.90 | |||||||||
| 1 October – 31 December 2003 | 190.50 | 171.25 | 34.22 | 29.76 | |||||||||
| 1 January – 31 March 2004 | 189.75 | 173.25 | 34.80 | 32.40 | |||||||||
Year ended 31 March 2005 | |||||||||||||
| 1 April – 30 June 2004 | 198.50 | 169.25 | 36.60 | 30.34 | |||||||||
| 1 July – 30 September 2004 | 197.50 | 177.50 | 36.80 | 32.66 | |||||||||
| 1 October – 31 December 2004 | 206.00 | 180.50 | 40.07 | 32.61 | |||||||||
| 1 January – 31 March 2005 | 216.25 | 196.50 | 40.93 | 37.71 | |||||||||
Month | |||||||||||||
| November 2004 | 199.25 | 185.50 | 37.40 | 34.37 | |||||||||
| December 2004 | 206.00 | 196.50 | 40.07 | 38.22 | |||||||||
| January 2005 | 213.75 | 204.25 | 40.00 | 38.57 | |||||||||
| February 2005 | 216.25 | 203.50 | 40.93 | 38.59 | |||||||||
| March 2005 | 210.75 | 196.50 | 40.82 | 37.71 | |||||||||
| April 2005 | 209.50 | 196.50 | 39.51 | 37.85 | |||||||||
| 1 May to 13 May 2005 | 202.25 | 197.25 | 38.75 | 36.83 | |||||||||
| a | The pre-19 November 2001 prices shown have been adjusted for the rights issue and demerger that occurred in the 2002 financial year. |
Fluctuations in the exchange rate between the pound sterling and the US dollar affect the dollar equivalent of the pound sterling price of the company’s ordinary shares on the London Stock Exchange and, as a result, are likely to affect the market price of the ADSs on the New York Stock Exchange.
Rights issue |
Demerger of O2 – capital gains tax calculation |
| Additional information for shareholders | BT Group plc Annual Report and Form 20-F 2005 129 |
Analysis of shareholdings |
| Ordinary shares of 5p each | |||||||||||||
| Range | Number of holdings | Percentage of total | Number of shares held (millions) | Percentage of total | |||||||||
| 1 – 399 | 603,955 | 40.1 | 129 | 1.5 | |||||||||
| 400 – 799 | 441,583 | 29.4 | 245 | 2.8 | |||||||||
| 800 – 1,599 | 275,372 | 18.3 | 307 | 3.5 | |||||||||
| 1,600 – 9,999 | 175,825 | 11.7 | 506 | 5.9 | |||||||||
| 10,000 – 99,999 | 5,539 | 0.4 | 108 | 1.3 | |||||||||
| 100,000 – 999,999 | 940 | 0.1 | 346 | 4.0 | |||||||||
| 1,000,000 – 4,999,999 | 428 | 0.0 | 961 | 11.1 | |||||||||
5,000,000 and abovea,b,c,d | 213 | 0.0 | 6,032 | 69.9 | |||||||||
Total | 1,503,855 | 100.0 | 8,634 | 100.0 | |||||||||
| a | 28 million shares were held in trust by Ilford Trustees (Jersey) Limited for allocation to employees under the employee share plans. |
| b | Under the BT Group Employee Share Investment Plan, 52 million shares were held in trust on behalf of 84,803 participants who were beneficially entitled to the shares. 136 million shares were held in the corporate nominee BT Group EasyShare on behalf of 127,161 beneficial owners. |
| c | 250 million shares were represented by ADSs. Analysis by size of holding is not available for this holding. |
| d | 134 million shares were held as treasury shares. |
| e | 13.7% of the shares were in 1,474,873 individual holdings, of which 124,457 were joint holdings, and 86.3% of the shares were in 28,982 institutional holdings. |
At 13 May 2005, there were 8,634,629,038 ordinary shares outstanding including 134,277,107 shares held as treasury shares. At the same date, approximately 25 million ADSs (equivalent to 250 million ordinary shares, or approximately 2.9% of the total number of ordinary shares outstanding on that date) were outstanding and were held by 2,579 record holders of ADRs. At 31 March 2005, there were 3,593 shareholders with a US address on the register of shareholders.
A final dividend in respect of the year ended 31 March 2004, was paid on 6 September 2004 to shareholders on the register on 6 August 2004, and an interim dividend in respect of the year ended 31 March 2005 was paid on 7 February 2005 to shareholders on the register on 31 December 2004.
The dividends paid or payable on BT shares and ADSs for the last five years are shown in the following table. The dividends on the ordinary shares exclude the associated tax credit. The amounts shown are not those that were actually paid to holders of ADSs. For the tax treatment of dividends paid see Taxation of dividends below. Dividends have been translated from pounds sterling into US dollars using exchange rates prevailing on the date the ordinary dividends were paid.
| Per ordinary share | Per ADS | Per ADS | ||||||||||||||||||||||||||
| Years ended 31 March | Interim pence | Final pence | Total pence | Interim £ | Final £ | Total £ | Interim US$ | Final US$ | Total US$ | |||||||||||||||||||
| 2001 | 8.70 | – | 8.70 | 0.870 | – | 0.870 | 1.397 | – | 1.397 | |||||||||||||||||||
| 2002 | – | 2.00 | 2.00 | – | 0.200 | 0.200 | – | 0.311 | 0.311 | |||||||||||||||||||
| 2003 | 2.25 | 4.25 | 6.50 | 0.225 | 0.425 | 0.650 | 0.366 | 0.673 | 1.039 | |||||||||||||||||||
| 2004 | 3.20 | 5.30 | 8.50 | 0.320 | 0.530 | 0.850 | 0.590 | 0.938 | 1.528 | |||||||||||||||||||
2005 | 3.90 | 6.50 | 10.40 | 0.390 | 0.650 | 1.040 | 0.724 | – | a | – | a | |||||||||||||||||
| a | Qualifying holders of ADSs on record as of 5 August 2005 are entitled to receive the final dividend which will be paid on 12 September 2005, subject to approval at the annual general meeting. The US dollar amount of the final dividend of 65 pence per ADS to be paid to holders of ADSs will be based on the exchange rate in effect on 5 September 2005, the date of payment to holders of ordinary shares. |
| 130 BT Group plc Annual Report and Form 20-F 2005 | Additional information for shareholders |
Dividend investment plan |
Shareholders could elect to receive additional shares in lieu of a cash dividend for the following dividends:
| Date paid | Price per share pence | ||||||
| 2000 final | 18 September 2000 | 809.6 | |||||
| 2001 interim | 12 February 2001 | 621.8 | |||||
| 2002 final | 9 September 2002 | 191.19 | |||||
| 2003 interim | 10 February 2003 | 178.23 | |||||
| 2003 final | 8 September 2003 | 184.41 | |||||
| 2004 interim | 9 February 2004 | 175.98 | |||||
| 2004 final | 6 September 2004 | 183.69 | |||||
2005 interim | 7 February 2005 | 209.95 | |||||
Over the past five years (as shown in the TSR chart below), BT Group’s TSR (as adjusted for the rights issue and demerger) was negative 70% compared to a FTSE 100 TSR of negative 12%. This was primarily due to a fall in BT’s share price which, like many stocks in the telecoms, media and technology (TMT) sector, declined in the first two years of the period.
In the period between the demerger on 19 November 2001 and 31 March 2005, BT’s TSR was negative 17%, almost in line with the FTSEurofirst 300 Telco Index (negative 16%). However, in the last 12 months, BT’s TSR has outperformed both the FTSE 100 and FTSEurofirst 300 Telco Index with a 21.8% return compared to a 15.4% return for each of those indices.
BT’s total shareholder return (TSR) performance vs the FTSE 100 over five financial years to 31 March 2005 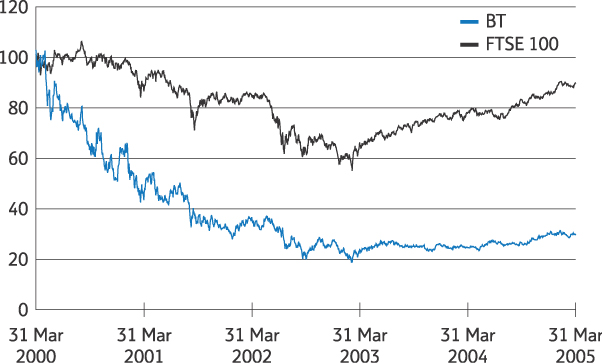 | BT’s TSR performance vs the FTSEurofirst 300 Telco Index since demerger 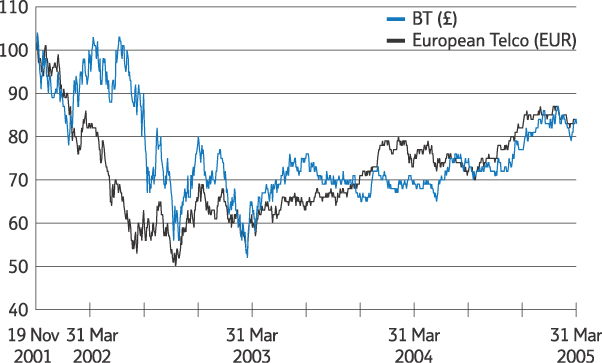 | ||
| 1 April 2000 = 100. Source: Datastream The graph shows the relative TSR performance (adjusted for the rights issue and demerger of our mobile business in the 2002 financial year) of BT and the FTSE 100. | 19 November 2001 = 100. Source: Datastream The graph shows the relative TSR performance of BT and the FTSEurofirst 300 Telco Index since demerger. |
| 1st quarter | 28 July 2005 | |||
| 2nd quarter and half year | 10 November 2005 | |||
| 3rd quarter and nine months | February 2006 | |||
| 4th quarter and full year | May 2006 | |||
| 2006 annual report and accounts published | June 2006 | |||
| Additional information for shareholders | BT Group plc Annual Report and Form 20-F 2005 131 |
Individual savings accounts (ISAs) |
| Years ended 31 March | 2001 | 2002 | 2003 | 2004 | 2005 | |||||||||||
| Period end | 1.42 | 1.43 | 1.57 | 1.84 | 1.89 | |||||||||||
Averagea | 1.47 | 1.43 | 1.55 | 1.71 | 1.85 | |||||||||||
| High | 1.60 | 1.48 | 1.65 | 1.90 | 1.95 | |||||||||||
| Low | 1.40 | 1.37 | 1.43 | 1.55 | 1.75 | |||||||||||
| Month | |||||||||||||||||||
| November 2004 | December 2004 | January 2005 | February 2005 | March 2005 | April 2005 | ||||||||||||||
| High | 1.91 | 1.95 | 1.91 | 1.92 | 1.93 | 1.92 | |||||||||||||
| Low | 1.83 | 1.91 | 1.86 | 1.86 | 1.87 | 1.87 | |||||||||||||
| a | The average of the Noon Buying Rates in effect on the last day of each month during the relevant period. |
| Calendar month | Total number of shares purchased | Average price paid per share (pence – net of dealing costs) | Total number of shares purchased as part of publicly announced plans or programmes | Maximum number of shares that may yet be purchased under the plans or programmes | |||||||||
| April 2004 | Nil | N/A | Nil | 786,429,000 | |||||||||
| May | 4,500,000 | 182.28 | 4,500,000 | 781,929,000 | |||||||||
| June | 12,030,000 | 188.80 | 12,030,000 | 769,899,000 | |||||||||
| July | Nil | N/A | Nil | 859,000,000 | |||||||||
| August | 26,750,000 | 180.61 | 26,750,000 | 832,250,000 | |||||||||
| September | 11,200,000 | 181.65 | 11,200,000 | 821,050,000 | |||||||||
| October | 500,000 | 185.61 | 500,000 | 820,550,000 | |||||||||
| November | 6,200,000 | 195.25 | 6,200,000 | 814,350,000 | |||||||||
| December | 10,800,000 | 201.31 | 10,800,000 | 803,550,000 | |||||||||
| January 2005 | Nil | N/A | Nil | 803,550,000 | |||||||||
| February | 7,750,000 | 208.85 | 7,750,000 | 795,800,000 | |||||||||
| March | 21,550,000 | 202.12 | 21,550,000 | 774,250,000 | |||||||||
| Total | 101,280,000 | 191.64 | 101,280,000 | 774,250,000 | |||||||||
| a | Purchases from April to June 2004 were made in accordance with a resolution passed at the AGM held on 16 July 2003. Purchases from August 2004 to March 2005 were made in accordance with a resolution passed at the AGM on 14 July 2004. |
| b | Authority was given to purchase up to 867 million shares on 16 July 2003 and 859 million shares on 14 July 2004. These authorities expire at the close of the following AGM, or 15 months following the date of approval if earlier. The authority given in July 2003 expired on 14 July 2004. |
| c | There are no plans or programmes BT has determined to terminate prior to expiration, or under which BT does not intend to make further purchases. |
| 132 BT Group plc Annual Report and Form 20-F 2005 | Additional information for shareholders |
Memorandum |
Articles |
| (a) | Voting rights |
Voting at any meeting of shareholders is by a show of hands unless a poll is demanded by the chairman of the meeting or by at least five shareholders at the meeting who are entitled to vote (or their proxies), or by one or more shareholders at the meeting who are entitled to vote (or their proxies) and who have, between them, at least 10% of the total votes of all shareholders who have the right to vote at the meeting.
No person is, unless the Board decide otherwise, entitled to attend or vote at any general meeting or to exercise any other right conferred by being a shareholder if he or any person appearing to be interested in those shares has been sent a notice under section 212 of the Companies Act 1985 (which confers upon public companies the power to require information with respect to interests in their voting shares) and he or any interested person has failed to supply to the company the information requested within 14 days after delivery of that notice. These restrictions end seven days after the earlier of the date the shareholder complies with the request satisfactorily or the company receives notice that there has been an approved transfer of the shares.
| (b) | Variation of rights |
| (i) | with the sanction of an extraordinary resolution passed at a separate meeting of the holders of the shares of that class; or |
| (ii) | with the consent in writing of the holders of at least 75% in nominal value of the issued shares of that class. |
The company can issue new shares and attach any rights and restrictions to them, as long as this is not restricted by special rights previously given to holders of any existing shares. Subject to this, the rights of new shares can take priority over the rights of existing shares, or existing shares can take priority over them, or the new shares and the existing shares can rank equally.
| (c) | Changes in capital |
| (i) | consolidate and divide all or any of its share capital into shares of a larger amount; |
| (ii) | divide all or part of its share capital into shares of a smaller amount; |
| (iii) | cancel any shares which have not, at the date of the ordinary resolution, been taken or agreed to be taken by any person and reduce the amount of its share capital by the amount of the shares cancelled; and |
| (iv) | increase its share capital. |
| (i) | buy back its own shares; and |
| (ii) | by special resolution reduce its share capital, any capital redemption reserve and any share premium account. |
| (d) | Dividends |
The directors can offer ordinary shareholders the right to choose to receive new ordinary shares, which are credited as fully paid, instead of some or all of their cash dividend. Before they can do this, the company’s shareholders must have passed an ordinary resolution authorising the directors to make this offer.
Any dividend which has not been claimed for ten years after it was declared or became due for payment will be forfeited and will belong to the company unless the directors decide otherwise.
| Additional information for shareholders | BT Group plc Annual Report and Form 20-F 2005 133 |
| (e) | Distribution of assets on winding up |
| (f) | Transfer of shares |
The Board may refuse to register any transfer of any share held in certificated form:
| which is in favour of more than four joint holders; or |
| unless the transfer form to be registered is properly stamped to show payment of any applicable stamp duty and delivered to the company’s registered office or any other place the Board decide. The transfer must have with it the share certificate for the shares to be transferred; any other evidence which the Board ask for to prove that the person wanting to make the transfer is entitled to do this; and if the transfer form is executed by another person on behalf of the person making the transfer, evidence of the authority of that person to do so. |
If the Board decide not to register a transfer of a share, the Board must notify the person to whom that share was to be transferred no later than two months after the company receives the transfer or instruction from the operator of the relevant system.
The Board can decide to suspend the registration of transfers, for up to 30 days a year, by closing the register of shareholders. The register must not be closed without the consent of the operator of a relevant system (as defined in the Regulations) in the case of uncertificated shares.
| (g) | Untraced shareholders |
| (h) | General meetings of shareholders |
| (i) | Limitations on rights of non-resident or foreign shareholders |
| (j) | Directors |
| Directors’ remuneration |
The Board can award extra fees to a director who holds an executive position; acts as chairman or deputy chairman; serves on a Board committee at the request of the Board; or performs any other services which the Board consider extend beyond the ordinary duties of a director.
The directors may grant pensions or other benefits to, among others, any director or former director or persons connected with them. However, BT can only provide these benefits to any director or former director who has not been an employee or held any other office or executive position in the company or any of its subsidiary undertakings, or to relations or dependants of, or people connected to, those directors or former directors, if the shareholders approve this by passing an ordinary resolution.
| 134 BT Group plc Annual Report and Form 20-F 2005 | Additional information for shareholders |
| Directors’ votes |
Unless the Articles say otherwise, a director cannot vote on a resolution about a contract in which the director has a material interest (this will also apply to interests of a person connected with the director). The director can vote if the interest is only an interest in BT shares, debentures or other securities. A director can, however, vote and be counted in a quorum in respect of certain matters in which he is interested as set out in the Articles.
Subject to the relevant legislation, the shareholders can by passing an ordinary resolution suspend or relax, among other things, the provisions relating to the interest of a director in any contract or arrangement or relating to a director’s right to vote and be counted in a quorum on resolutions in which he is interested to any extent or ratify any particular contract carried out in breach of those provisions.
| Directors’ interests |
| (i) | have any kind of interest in a contract with or involving BT (or in which BT has an interest or with or involving another company in which BT has an interest); |
| (ii) | have any kind of interest in a company in which BT has an interest (including holding a position in that company or being a shareholder of that company); |
| (iii) | hold a position (other than auditor) in BT or another company in which BT has an interest on terms and conditions decided by the Board; and |
| (iv) | alone (or through some firm with which the director is associated) do paid professional work (other than as auditor) for BT or another company in which BT has an interest on terms and conditions decided by the Board. |
When a director knows that they are interested in a contract with BT they must tell the other directors.
| Retirement of directors |
At every annual general meeting, any director who was elected or last re-elected a director at or before the annual general meeting held in the third year before the current year, shall retire by rotation. Any director appointed by the directors automatically retires at the next following annual general meeting. A retiring director is eligible for re-election.
| Directors’ borrowing powers |
For purposes of this summary, a ‘US Holder’ is a beneficial owner of ordinary shares or ADSs that, for US federal income tax purposes, is: a citizen or individual resident of the United States, a corporation (or other entity taxable as a corporation for US federal income tax purposes) created or organised in or under the laws of the United States or any state thereof, an estate the income of which is subject to US federal income taxation regardless of its source, or a trust if a US court can exercise primary supervision over the administration of the trust and one or more US persons are
| Additional information for shareholders | BT Group plc Annual Report and Form 20-F 2005 135 |
authorised to control all substantial decisions of the trust. If a partnership holds ordinary shares or ADSs, the tax treatment of a partner generally will depend upon the status of the partner and the activities of the partnership. A partner in a partnership that holds ordinary shares or ADSs is urged to consult its own tax advisor regarding the specific tax consequences of owning and disposing of the ordinary shares or ADSs.
In particular, this summary is based on (i) current UK tax law and UK Inland Revenue practice and US law and US Internal Revenue Service (‘IRS’) practice, including the Internal Revenue Code of 1986, as amended, Treasury regulations, rulings, judicial decisions and administrative practice, all as currently in effect, (ii) the United Kingdom–United States Income Tax Convention that entered into force on 25 April 1980 and the protocols thereto in effect until 31 March 2003 (the ‘1980 Convention’), (iii) the United Kingdom–United States Convention relating to estate and gift taxes, and (iv) the new United Kingdom–United States Tax Convention that entered into force on 31 March 2003 and the protocol thereto (the ‘New Convention’), all as in effect on the date of this Annual Report, all of which are subject to change or changes in interpretation, possibly with retroactive effect.
US Holders should be aware that the New Convention generally will have effect in respect of dividends paid in 2004 and all subsequent years. However, a US Holder entitled to benefits under the 1980 Convention could have elected to have the provisions of the 1980 Convention continue until 1 May 2004 if the election to apply the 1980 Convention would have resulted in greater benefits to the Holder. If a US Holder made a valid election in 2003, the discussion below with respect to dividend payments made pursuant to the 1980 Convention would apply to dividends paid by BT prior to 1 May 2004. The discussion below notes instances where the relevant provisions of the New Convention will produce a materially different result for a validly electing US Holder. US Holders should note that certain articles in the New Convention limit or restrict the ability of a US Holder to claim benefits under the New Convention and that similar provisions were not contained in the 1980 Convention.
US Holders should consult their own tax advisors as to the applicability of the Conventions and the consequences under UK, US federal, state and local, and other laws, of the ownership and disposition of ordinary shares or ADSs.
Taxation of dividends |
For US federal income tax purposes, a distribution (including any additional dividend income arising from a foreign tax credit claim as described below) will be treated as ordinary dividend income. The amount of the distribution includible in gross income of a US Holder will be the US dollar value of the distribution calculated by reference to the spot rate in effect on the date the distribution is actually or constructively received by a US Holder of ordinary shares, or by the Depositary, in the case of ADSs. A US Holder who converts the British pounds into US dollars on the date of receipt generally should not recognise any exchange gain or loss. A US Holder who does not convert the British pounds into US dollars on the date of receipt generally will have a tax basis in the British pounds equal to its US dollar value on such date. Foreign currency gain or loss, if any, recognised by the US Holder on a subsequent conversion or other disposition of the British pounds generally will be US source ordinary income or loss. Dividends paid by BT to a corporate US Holder will not be eligible for the US dividends received deduction.
For dividend payments subject to the 1980 Convention as described above, a US Holder of ordinary shares or ADSs who is a resident of the US (and is not a resident of the UK) for the purposes of the 1980 Convention generally is entitled to receive, in addition to any dividend that BT pays, a payment from the UK Inland Revenue in respect of such dividend equal to the tax credit to which an individual resident in the UK for UK tax purposes would have been entitled had that individual received the dividend (which is currently equal to one-ninth of the dividend received) reduced by a UK withholding tax equal to the amount not exceeding 15% of the sum of the dividend paid and the UK tax credit payment. At current rates, the withholding tax entirely eliminates the tax credit payment but no withholding in excess of the tax credit payment will be imposed upon the US Holder. Thus, for example, a US Holder who receives a £90 dividend will also be treated as receiving from the UK Inland Revenue a tax credit payment of £10 (one-ninth of the dividend received) but the entire £10 payment will be eliminated by UK withholding tax, resulting in a net receipt of £90. The effect on each US Holder will depend on circumstances that are particular to that Holder.
The foreign tax deemed paid generally will be available as a US credit or deduction. A US Holder validly electing under the 1980 Convention could elect to receive a foreign tax credit or deduction with respect to any UK withholding tax on IRS Form 8833 (Treaty-Based Return Position Disclosure Under Section 6114 or 7701(b)). For purposes of calculating the foreign tax credit, dividends paid on the ordinary shares or ADSs will be treated as income from sources outside the United States and generally will constitute ‘passive income’ or, for certain Holders, ‘financial services income’. The rules relating to the determination of the foreign tax credit are very complex. US Holders who do not elect to claim a credit with respect to any foreign taxes paid in a given taxable year may instead claim a deduction for foreign taxes paid. A deduction does not reduce US federal income tax on a dollar for dollar basis like a tax credit. The deduction, however, is not subject to the limitations applicable to foreign credits.
There will be no right to any payment from the UK Inland Revenue and no notional UK withholding tax applied to a dividend payment made under the New Convention. Therefore, it will not be possible for US Holders to claim a foreign tax credit in respect of any dividend payment made by BT in 2004 (or from 1 May 2004 in the case of a US Holder who effectively elected to extend the applicability of the 1980 Convention).
US Holders should consult their own tax advisors to determine whether the US Holder is eligible for benefits under the 1980 Convention and the New Convention, and whether, and to what extent, a foreign tax credit will be available with respect to dividends received from BT. The US Treasury has expressed concern that parties to whom ADSs are released may be taking actions that are inconsistent with the claiming of foreign tax credits for US Holders of ADSs. Accordingly, the analysis of the creditability of British withholding taxes in the case of the US Holder who properly elected to apply the 1980 Convention could be affected by future actions that may be taken by the US Treasury.
| 136 BT Group plc Annual Report and Form 20-F 2005 | Additional information for shareholders |
Certain US Holders (including individuals) are eligible for reduced rates of US federal income tax (currently at a maximum rate of 15%) in respect of ‘qualified dividend income’ received in taxable years beginning before 1 January 2009. For this purpose, qualified dividend income generally includes dividends paid by a non-US corporation if, among other things, the US Holders meet certain minimum holding periods and the non-US corporation satisfies certain requirements, including that either (i) the shares (or ADSs) with respect to which the dividend has been paid are readily tradeable on an established securities market in the United States, or (ii) the non-US corporation is eligible for the benefits of a comprehensive US income tax treaty (such as both Conventions) which provides for the exchange of information. BT currently believes that dividends paid with respect to its ordinary shares and ADSs should constitute qualified dividend income for US federal income tax purposes. The US Treasury and the IRS have announced their intention to promulgate rules pursuant to which holders of ADSs or ordinary shares, among others, will be permitted to rely on certifications from issuers to establish that dividends are treated as qualified dividend income. Each individual US Holder of ordinary shares or ADSs is urged to consult his own tax advisor regarding the availability to him of the reduced dividend tax rate in light of his own particular situation and regarding the computations of his foreign tax credit limitation with respect to any qualified dividend income paid by BT to him, as applicable.
Taxation of capital gains |
For US federal income tax purposes, a US Holder generally will recognise capital gain or loss on the sale, exchange or other disposition of ordinary shares or ADSs in an amount equal to the difference between the US dollar value of the amount realised on the disposition and the US Holder’s adjusted tax basis (determined in US dollars) in the ordinary shares or ADSs. Such gain or loss generally will be US source gain or loss, and will be treated as long-term capital gain or loss if the ordinary shares have been held for more than one year at the time of disposition. Capital gains recognised by an individual US Holder generally are subject to US federal income tax at preferential rates if specified holdings periods are met. The deductibility of capital losses is subject to significant limitations.
Passive foreign investment company status |
US information reporting and backup withholding |
Backup withholding is not an additional tax. Amounts withheld as backup withholding may be credited against a Holder’s US federal income tax liability. A Holder may obtain a refund of any excess amounts withheld under the backup withholding rules by timely filing the appropriate claim for refund with the IRS and furnishing any required information.
UK stamp duty |
UK inheritance and gift taxes in connection with ordinary shares and/or ADSs |
| Additional information for shareholders | BT Group plc Annual Report and Form 20-F 2005 137 |
ordinary shares and/or ADSs passing on the death of a US-domiciled shareholder, who is not a UK national, will not generally be subject to UK inheritance tax if the estate is subject to US estate tax. The rules and scope of domicile are complex and action should not be taken without advice specific to the individual’s circumstances.
Document | Publication date | |||
| Annual Review including summary financial statement | June | |||
| Annual Report and Form 20-F | June | |||
| Quarterly results releases | July, November, February and May | |||
| Current Cost Financial Statements for the Businesses and Activities and Statement of Standard Services (as required by Ofcom) | August | |||
| Social and Environment Report | June | |||
| Statement of Business Practice | July 2004 | |||
| 138 BT Group plc Annual Report and Form 20-F 2005 | Additional information for shareholders |
All investors can visit our website at www.bt.com/sharesandperformance for more information about BT. There are direct links from this page to sites providing information particularly tailored for shareholders, institutional investors and analysts, industry analysts and journalists.
An electronic copy of this document is available at www.bt.com/sharesandperformance
Private shareholders |
Lloyds TSB Registrars maintain BT Group’s share register and the separate BT Group EasyShare register. They also provide a Shareholder Helpline service on Freefone 0808 100 4141.
Institutional investors and analysts |
Tel 020 7356 4909
Fax 020 7356 5270
e-mail: investorrelations@bt.com
Industry analysts may contact:
Tel 020 7356 5378
Fax 01332 577434
e-mail: industryenquiry@bt.com
Shareholder Helpline | ||||
| Tel Freefone 0808 100 4141 Fax 01903 833371 Textphone Freefone 0800 169 6907 From outside the UK: Tel +44 121 433 4404 Fax +44 1903 833371 Textphone +44 121 415 7028 e-mail: bt@lloydstsb-registrars.co.uk | ||||
The Registrar | ADR Depositary | |||
| Lloyds TSB Registrars (2450) The Causeway Worthing, West Sussex BN99 6DA United Kingdom Website: www.lloydstsb-registrars.co.uk | JPMorgan Chase Bank JPMorgan Service Centre P.O. Box 43013 Providence, RI 02940-3013 United States Tel 1 800 428 4237 (toll free) or +1 781 575 4328 (from outside the USA) e-mail: adr@jpmorgan.com Website: www.adr.com | |||
| General enquiries BT Group plc BT Centre 81 Newgate Street London EC1A 7AJ United Kingdom Tel (020) 7356 5000 Fax (020) 7356 5520 From overseas: Tel +44 20 7356 5000 Fax +44 20 7356 5520 | ||||
| Additional information for shareholders | BT Group plc Annual Report and Form 20-F 2005 139 |
Glossary of terms and US equivalents
A full list of BT contacts, and an electronic feedback facility, is available at www.bt.com/talk
| Term used in UK annual report | US equivalent or definition | |
| Accounts | Financial statements | |
| Associates | Equity investees | |
| Capital allowances | Tax depreciation | |
| Capital redemption reserve | Other additional capital | |
| Creditors | Accounts payable and accrued liabilities | |
| Creditors: amounts falling due within one year | Current liabilities | |
| Creditors: amounts falling due after more than one year | Long-term liabilities | |
| Debtors: amounts falling due after more than one year | Other non-current assets | |
| Employee share plans | Employee stock benefit plans | |
| Finance lease | Capital lease | |
| Financial year | Fiscal year | |
| Fixed asset investments | Non-current investments | |
| Freehold | Ownership with absolute rights in perpetuity | |
| Gearing | Leverage | |
| Inland calls | Local and long-distance calls | |
| Interests in associates and joint ventures | Securities of equity investees | |
| Investment in own shares | Treasury shares | |
| Loans to associates and joint ventures | Indebtedness of equity investees not current | |
| Net book value | Book value | |
| Operating profit | Net operating income | |
| Other debtors | Other current assets | |
| Own work capitalised | Costs of group’s employees engaged in the construction of plant and equipment for internal use | |
| Profit | Income | |
| Profit and loss account (statement) | Income statement | |
| Profit and loss account | Retained earnings | |
| (under “capital and reserves” in balance sheet) | ||
| Profit for the financial year | Net income | |
| Profit on sale of fixed assets | Gain on disposal of non-current assets | |
| Provision for doubtful debts | Allowance for bad and doubtful accounts receivable | |
| Provisions | Long-term liabilities other than debt and specific accounts payable | |
| Recognised gains and losses (statement) | Comprehensive income | |
| Reserves | Shareholders’ equity other than paid-up capital | |
| Share based payment | Stock compensation | |
| Share premium account | Additional paid-in capital or paid-in surplus (not distributable) | |
| Shareholders’ funds | Shareholders’ equity | |
| Stocks | Inventories | |
| Tangible fixed assets | Property, plant and equipment | |
| Trade debtors | Accounts receivable (net) | |
| Turnover | Revenues |
| 140 BT Group plc Annual Report and Form 20-F 2005 |
Cross reference to Form 20-F
The information in this document that is referred to in the following table shall be deemed to be filed with the Securities and Exchange Commission for all purposes:
| Required Item in Form 20-F | Where information can be found in this Annual Report | |||||||
| Item | Section | Page | ||||||
| 1 | Identity of directors, senior management and advisors | Not applicable | ||||||
| 2 | Offer statistics and expected timetable | Not applicable | ||||||
| 3 | Key information | |||||||
| 3A | Selected financial data | Five-year financial summary | 23 | |||||
| Additional information for shareholders Exchange rates | 132 | |||||||
| 3B | Capitalisation and indebtedness | Not applicable | ||||||
| 3C | Reasons for the offer and use of proceeds | Not applicable | ||||||
| 3D | Risk factors | Risk factors | 126 | |||||
| 4 | Information on the company | |||||||
| 4A | History and development of the company | Contents page Business review | ||||||
| Introduction | 7 | |||||||
| Group structure | ||||||||
| Background | 8 | |||||||
| Acquisitions and disposals prior to the 2005 financial year | 8 | |||||||
| Acquisitions and disposals in the 2005 financial year | 8 | |||||||
| Post-balance sheet acquisitions | 8 | |||||||
| Financial review | ||||||||
| Capital expenditure | 38 | |||||||
| Acquisitions | 39 | |||||||
| 4B | Business overview | Business review | 6 | |||||
| Financial review | ||||||||
| Line of business results | 30 | |||||||
| Geographical information | 40 | |||||||
| Our commitment to society | 44 | |||||||
| Operational statistics | 125 | |||||||
| Additional information for shareholders | ||||||||
| Cautionary statement regarding forward-looking statements | 128 | |||||||
| 4C | Organisational structure | Business review | ||||||
| Introduction | 7 | |||||||
| Subsidiary undertakings, joint ventures and associates | 122 | |||||||
| 4D | Property, plant and equipment | Business review | ||||||
| Property | 15 | |||||||
| Financial statistics | 124 | |||||||
| 5 | Operating and financial review and prospects | |||||||
| 5A | Operating results | Financial review | 25 | |||||
| Consolidated financial statements Accounting policies | 72 | |||||||
| Additional information for shareholders | ||||||||
| Cautionary statement regarding forward-looking statements | 128 | |||||||
| 5B | Liquidity and capital resources | Financial review | 25 | |||||
| Additional information for shareholders | ||||||||
| Cautionary statement regarding forward-looking statements | 128 | |||||||
| Consolidated financial statements | ||||||||
| Notes to the financial statements | ||||||||
| Loans and other borrowings | 94 | |||||||
| Financial commitments and contingent liabilities | 96 | |||||||
| Financial instruments and risk management | 106 | |||||||
| 5C | Research and development, patents and licences | Business review | ||||||
| Group strategy | ||||||||
| Build on our networked IT services capability | 9 | |||||||
| Research and development and IT support | 14 | |||||||
| Financial statistics | 124 | |||||||
| 5D | Trend information | Financial review | 25 | |||||
| Additional information for shareholders | ||||||||
| Cautionary statement regarding forward-looking statements | 128 | |||||||
| 5E | Off-balance sheet arrangements | Financial review | ||||||
| Off-balance sheet arrangements | 38 | |||||||
| 5F | Tabular disclosure of contractual obligations | Financial review | ||||||
| Capital resources | 38 | |||||||
| BT Group plc Annual Report and Form 20-F 2005 141 |
| Required Item in Form 20-F | Where information can be found in this Annual Report | |||||||
| Item | Section | Page | ||||||
| 6 | Directors, senior management and employees | |||||||
| 6A | Directors and senior management | Board of directors and Operating Committee | 46 | |||||
| 6B | Compensation | Report on directors’ remuneration | 56 | |||||
| Consolidated financial statements | ||||||||
| Notes to the financial statements | ||||||||
| Pension costs | 97 | |||||||
| Directors’ emoluments | 102 | |||||||
| Employee share plans | 102 | |||||||
| 6C | Board practices | Board of directors and Operating Committee | 46 | |||||
| Report of the directors | ||||||||
| Directors | 48 | |||||||
| Corporate governance | 50 | |||||||
| Report on directors’ remuneration | 56 | |||||||
| 6D | Employees | Financial review | ||||||
| Group results | 28 | |||||||
| Consolidated financial statements | ||||||||
| Notes to the financial statements | ||||||||
| People employed | 102 | |||||||
| Operational statistics | 125 | |||||||
| 6E | Share ownership | Report on directors’ remuneration | 56 | |||||
| Consolidated financial statements | ||||||||
| Notes to the financial statements | ||||||||
| Employee share plans | 102 | |||||||
| 7 | Major shareholders and related party transactions | |||||||
| 7A | Major shareholders | Report of the directors | ||||||
| Substantial shareholdings | 48 | |||||||
| Additional information for shareholders | ||||||||
| Analysis of shareholdings | 130 | |||||||
| 7B | Related party transactions | Report of the directors | ||||||
| Interest of management in certain transactions | 48 | |||||||
| Report on directors’ remuneration | 56 | |||||||
| Consolidated financial statements | ||||||||
| Notes to the financial statements | ||||||||
| Related party transactions | 96 | |||||||
| 7C | Interests of experts and counsel | Not applicable | ||||||
| 8 | Financial information | |||||||
| 8A | Consolidated statements and other financial information | See Item 18 below. | ||||||
| Business review | ||||||||
| Legal proceedings | 22 | |||||||
| Financial review | ||||||||
| Dividends | 36 | |||||||
| Consolidated financial statements | ||||||||
| Notes to the financial statements | ||||||||
| Financial commitments and contingent liabilities | 96 | |||||||
| Additional information for shareholders | ||||||||
| Dividends | 130 | |||||||
| Dividend investment plan | 131 | |||||||
| Memorandum and Articles of Association | ||||||||
| Articles | ||||||||
| Dividends | 133 | |||||||
| 8B | Significant changes | Financial review | ||||||
| Capital resources | 38 | |||||||
| 9 | The offer and listing | |||||||
| 9A | Offer and listing details | Additional information for shareholders | ||||||
| Share and ADS prices | 129 | |||||||
| 9B | Plan of distribution | Not applicable | ||||||
| 9C | Markets | Additional information for shareholders | ||||||
| Listings | 129 | |||||||
| 9D | Selling shareholders | Not applicable | ||||||
| 9E | Dilution | Not applicable | ||||||
| 9F | Expenses of the issue | Not applicable | ||||||
| 10 | Additional information | |||||||
| 10A | Share capital | Not applicable | ||||||
| 10B | Memorandum and articles of association | Additional information for shareholders | ||||||
| Memorandum and Articles of Association | 132 | |||||||
| 10C | Material contracts | Additional information for shareholders | ||||||
| Material contracts | 135 | |||||||
| 142 BT Group plc Annual Report and Form 20-F 2005 | Cross reference to Form 20-F |
| Required Item in Form 20-F | Where information can be found in this Annual Report | |||||||
| Item | Section | Page | ||||||
| 10D | Exchange controls | Additional information for shareholders | ||||||
| Exchange controls and other limitations affecting security holders | 138 | |||||||
| 10E | Taxation | Additional information for shareholders | ||||||
| Taxation (US Holders) | 135 | |||||||
| 10F | Dividends and paying agents | Not applicable | ||||||
| 10G | Statement by experts | Not applicable | ||||||
| 10H | Documents on display | Additional information for shareholders | ||||||
| Documents on display | 138 | |||||||
| 10I | Subsidiary information | Not applicable | ||||||
| 11 | Quantitative and qualitative | Financial review | ||||||
| disclosures about market risk | Treasury policy | 37 | ||||||
| Foreign currency and interest rate exposure | 38 | |||||||
| Consolidated financial statements | ||||||||
| Notes to the financial statements | ||||||||
| Accounting Policies Financial instruments | 74 | |||||||
| Financial instruments and risk management | 106 | |||||||
| 12 | Description of securities other than equity securities | Not applicable | ||||||
| 13 | Defaults, dividend arrearages and delinquencies | Not applicable | ||||||
| 14 | Material modifications to the rights of security holders and use of proceeds | Not applicable | ||||||
| 15 | Controls and procedures | Corporate governance US Sarbanes-Oxley Act of 2002 | 54 | |||||
| 16A | Audit committee financial expert | Corporate governance US Sarbanes-Oxley Act of 2002 | 54 | |||||
| 16B | Code of ethics | Corporate governance US Sarbanes-Oxley Act of 2002 | 54 | |||||
| 16C | Principal accountants fees and services | Consolidated financial statements | ||||||
| Notes to the financial statements Auditors | 105 | |||||||
| Corporate governance Audit Committee | 51 | |||||||
| 16E | Purchases of equity securities by the issuer and affiliated purchasers | Additional information for shareholders Share buy back | 132 | |||||
| 17 | Financial statements | Not applicable | ||||||
| 18 | Financial statements | Report of the independent auditors | 70 | |||||
| Consolidated financial statements | 71 | |||||||
| United States Generally Accepted Accounting Principles | 112 | |||||||
| Quarterly analysis of turnover and profit | 123 | |||||||
| BT Group plc Annual Report and Form 20-F 2005 143 |
Index
| 21st century network 13, 21, 126 Accounting and presentation changes 81 Accounting policies 40-41, 72-74 Additional information for shareholders 127-139 Auditors’ remuneration 105 Auditors’ report to shareholders 70 Background 8 Balance sheet 24, 39, 80 Broadband 9, 10, 11, 16, 21, 28-33 BT Exact 14 BT Global Services 8, 28-31, 33, 81-82 BT Retail 8, 28, 30-32, 81-82 BT Wholesale 8, 10, 30-33, 81-82, 87 Business practice, statement of 54 Business review 6-22 Call volume growth 125 Capital commitments 96 Capital expenditure 24, 30, 32, 33, 38-39, 79, 82 Capital gains tax 129 Cash flow statement 24, 36, 79, 88 Cautionary statement 128 Community 44-45 Company balance sheet 110-111 Competition and the UK economy 17 Contact details 139 Contingent liabilities 96 Corporate governance 50-55 Creditors 80, 95, 110 Cross reference to Form 20-F 141-143 Customer satisfaction 13, 44 Debtors 73, 80, 94, 110 Depreciation 31, 34, 73, 84, 92 Disposals 8, 24, 35-36, 85, 88-90 Directors Biographies 46-47 Emoluments 102 Interests in shares 61 Remuneration, report on 56-68 Report 48 Responsibility statement 69 Dividend investment plan 131 Dividends 23, 24, 36, 75-77, 79, 87, 95, 96, 111, 115, 130-131, 133 Earnings (loss) per share 23, 27, 36, 75-77, 87, 117, 120, 123, 124 Electronic communication 138 Employee share plans 102-105 Employees 13-14, 102, 125 Environment 40, 44-45 Exchange controls 138 Exchange lines 9, 17, 125 Financial calendar 138 Financial commitments 96-97 Financial instruments 74, 106-109 Financial ratios 124 Financial review 25-43 Financial statistics 124 Financing 36-37 Five-year financial summary 23-24 Foreign currencies 72, 106 Going concern 38, 54, 69 Goodwill 27, 30, 39, 42, 72, 84, 85, 87, 89, 91, 93, 113 Glossary of terms and US equivalents 140-143 ICT 9, 29, 31, 33 | Intangible assets 72-73, 80, 91 Interest 23, 27, 35, 38, 72, 75-77, 79, 85-86, 106, 108 Interest cover 35, 124 Internal control and risk management 53-54 International Financial Reporting Standards 41-43 Investments 8, 35, 73, 80, 85, 93 Joint ventures and associates 34-35, 73, 75-77, 82, 83, 84 Legal proceedings 22, 97 Licence 15, 20, 40, 73, 91 Listings 129 Loans and other borrowings 24, 38, 80, 94-95 Management of liquid resources 88 Material contracts 135 Memorandum and Articles of Association 132-135 Minority interests 75-77, 80, 87, 93, 116 Mobility 7, 9, 11-12, 28, 31 Net debt 24, 36, 38, 91, 106 Networked IT Services 9-10 New wave 9, 28 O2 8, 13, 18, 57, 97, 102, 129 Ofcom 7, 15-22 Other operating income 23, 33, 75-77, 123 Operating and Financial Review 6-43 Operating Committee 47, 53 Operating costs 23, 29, 33-34, 75-77, 84 Operating profit (loss) 34-35, 83, 88 Operational statistics 125 Our commitment to society 44-45 Pensions 14, 39, 59, 63, 73, 97-101 Post balance sheet events 111 Price control 18 Profit (loss) before/after tax 23, 36, 75-77 Provisions for liabilities and charges 80, 95 Publications 138 Purchase of own shares 96, 111, 132 Quarterly analysis of turnover and profit 123 Reconciliation of movement in shareholders’ funds 96 Reconciliation of operating profit to operating cash flows 88 Redundancy costs 23, 29, 34, 73, 84 Regulation 7, 15-22, 40 Research and development 14-15, 72, 84, 124 Restructuring 8, 26 Return on capital employed 39, 124 Rights issue 8, 129 Risk factors 126 Risk management 53, 106-110 Sarbanes-Oxley Act 54-55 Segmental analysis 81-84 Share and ADS prices 129 Share capital 24, 80, 96, 110, 111, 133 Share option schemes 102 Shareholder communication 139 Shareholdings analysis 130 Staff costs 29, 34, 84 Statement of total recognised gains and losses 78 Stocks 73, 80 Strategy 9 Subsidiary undertakings 7, 122 Substantial shareholdings 48 Tangible fixed assets 73, 92, 124 Taxation 36, 74, 75-77, 86 Taxation (US Holders) 135-138 Total shareholder return 57, 62, 131 Treasury policy 37 Turnover 8, 23, 27, 28, 30, 72, 75-77, 81-84, 123 US GAAP 24, 43, 112-121 |
| 144 BT Group plc Annual Report and Form 20-F 2005 |