Table of Contents
UNITED STATES
SECURITIES AND EXCHANGE COMMISSION
Washington, D.C. 20549
FORM N-CSR
CERTIFIED SHAREHOLDER REPORT OF REGISTERED
MANAGEMENT INVESTMENT COMPANIES
Investment Company Act file number | 811-04138
|
Allmerica Investment Trust
(Name of Registrant)
440 Lincoln Street
Worcester, Massachusetts 01653
(Address of principal executive offices) (Zip code)
George M. Boyd, Secretary
Allmerica Financial
440 Lincoln Street
Worcester, MA 01653
(Name and address of agent for service)
Registrant’s telephone number, including area code: (508) 855-1000
Date of fiscal year end: December 31
Date of reporting period: December 31, 2003
Table of Contents
| Item 1. | Reports to Stockholders |
The following are copies of the reports transmitted to stockholders pursuant to Rule 30e-1 under the Investment Company Act of 1940:
Allmerica Investment Trust
Annual Report
December 31, 2003
Allmerica Investment Trust—Money Market Fund
Annual Report
December 31, 2003
Table of Contents
Allmerica Financial
December 31, 2003
[GRAPHIC]
Annual Report
Allmerica Investment Trust
Table of Contents
| 1 | ||
| 2 | ||
| 3 | ||
| 4 | ||
| 5 | ||
| 6 | ||
| 7 | ||
| 8 | ||
| 9 | ||
| 10 | ||
Financials | F-1 | |
For information on ordering additional copies of this report, see Client Notices on page F-54.
One or more Funds may not be available under the variable annuity or variable life insurance policy which you have chosen. Inclusion in this report of a Fund which is not available under your policy is not to be considered a solicitation.
Table of Contents
Dear Client:
We will remember 2003 as a year of broad-based economic recovery and above average investment returns across nearly all asset classes. Outside the United States, economic growth was tempered by growing worries over the decline in value of the U.S. dollar and concern that this could constrain the emerging global recovery. Still, stock markets around the world generally performed well. Japan’s Nikkei Average finished the period up 24.45%, Hong Kong’s Hang Seng Index was higher by 34.92%, Germany’s DAX Index rose 37.08%, England’s FTSE Index gained 13.62% and France’s CAC 40 Index was up 16.12%.
The United States economy displayed impressive strength in 2003. Early in the year, growth was hindered by major fighting in Iraq, a sluggish manufacturing sector and a lack of capital spending by businesses. The Federal Reserve Board cut the target federal funds rate to 1.00% and Congress passed a large tax cut, setting the stage for a rebound in economic activity. During the second half of the year, GDP rose sharply, productivity increased, corporate profits jumped, manufacturing gained strength and unemployment edged down. The consumer remained the primary source of spending, and business investment finally emerged. A full year of solid GDP growth provided the most compelling evidence yet that the growth engine of the world was back on track. U.S. securities markets reacted enthusiastically to the strong economic news. For the year, the S&P 500® Index gained 28.69% and the Nasdaq Composite Index rose 50.01%. Bonds also generated positive returns for the year, evidenced by the Lehman Brothers Aggregate Bond Index, which increased 4.11%.
All of the Allmerica Investment Trust funds achieved positive results for 2003, led by the Select Capital Appreciation and Select Value Opportunity funds, which gained 39.71% and 38.43%, respectively. Each of our equity funds posted returns in excess of 26% for the year. On the fixed income side, fund returns were much lower, primarily due to the prevailing low level of interest rates in the U.S. The Select Investment Grade Income and Government Bond funds gained 3.31% and 1.67%, respectively.
On behalf of the Board of Trustees,

John P. Kavanaugh
Chairman of the Board
Allmerica Investment Trust
1
Table of Contents
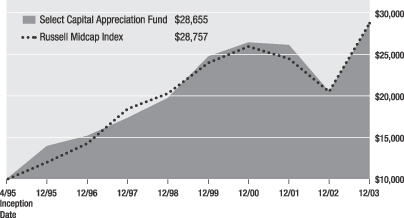
Select Capital Appreciation Fund
The Select Capital Appreciation Fund returned 39.71% for 2003, narrowly underperforming its benchmark, the Russell Midcap Index, which returned 40.08%.
U.S. stocks bounced back from a three-year bear market in 2003, with several major indexes finishing the year at their highest levels in nearly two years. After a dismal first quarter blanketed by concern about a double-dip recession and pending war with Iraq, the market began to climb in late March. A new round of tax cuts and a late-June reduction in the target federal funds rate encouraged investors. The rally accelerated as the year progressed, aided by stronger corporate earnings growth, mounting evidence of a self-sustaining economic recovery, and repeated assurances from Federal Reserve officials that short-term interest rates could remain low “for a considerable period”, due to low inflation. Rising commodity prices were a boon for energy and various industrial and materials companies. Small and mid-cap shares outperformed large-caps by a substantial margin and growth outperformed value for the first time in years, led by technology stocks. Top contributors to fund performance included a pharmacy services business, a wireless communications service provider and a discount consumer electronics company. Detractors included a weight loss services provider, a data processor and insurance wholesaler and a biotechnology company.
The investment sub-adviser thinks that prospects for equities in 2004 are favorable. Mid-cap stocks have outperformed large-cap stocks for nearly five years, and no longer trade at a substantial valuation discount. The investment sub-adviser believes that the current mid-cap outperformance cycle could last three to four more years, but that a pause in the superior performance of mid-caps is possible.
Average Annual Total Returns
| 1 Year | 5 Year | Life of Fund | ||||
Select Capital Appreciation Fund | 39.71% | 7.72% | 12.89% | |||
Russell Midcap Index | 40.08% | 7.23% | 12.94% | |||
Lipper Mid-Cap Growth Funds Average | 36.14% | 0.78% | 8.55% |
Growth of a $10,000 Investment Since 1995
The Select Capital Appreciation Fund is a portfolio of Allmerica Investment Trust. Portfolio composition will vary over time.
Past performance is no guarantee of future results. Investment return and principal value of an investment will fluctuate so that an investor’s shares, when redeemed, may be worth more or less than their original cost.
The Russell Midcap Index measures the performance of the 800 smallest companies in the Russell 1000 Index. The Lipper Mid-Cap Growth Funds Average is a non-weighted average of funds within the mid-cap growth investment objective. Performance numbers are net of all fund operating expenses, but do not include insurance charges. If performance information included the effect of these additional charges, it would have been lower.
Performance prior to 4/1/98 is that of a prior Sub-Adviser.
Investment Sub-Adviser
T. Rowe Price Associates, Inc.
About the Fund
Seeks long-term growth of capital by investing primarily in mid-cap growth stocks selling at reasonable prices.
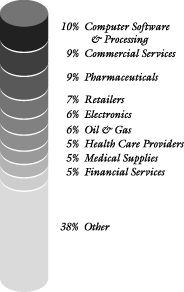
Portfolio Composition
As of December 31, 2003, the sector allocation of net assets was:
2
Table of Contents
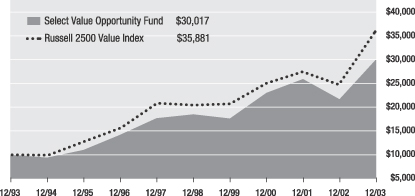
The Select Value Opportunity Fund returned 38.43% for 2003, underperforming its benchmark, the Russell 2500 Value Index, which returned 44.91%.
Contributors to performance included a large software company and a major West Coast energy supplier, as well as a major reinsurance company, a cruise line and a tire manufacturer. Significant detractors from performance included a building products company, a provider of restaurant franchises, a video game business and a large media company. In general, the fund suffered relative to its benchmark due to holdings of securities deemed to be of higher quality than the smaller, more speculative holdings that make up a significant portion of the reconstituted benchmark. The investment sub-adviser is on the alert for anything that could negatively affect the fund in 2004, and feels that consumer spending tops the watch list. Low interest rates have helped to support consumer spending to date. The investment sub-adviser feels that continued improvement in employment will be necessary to maintain this momentum going forward. The yield on the ten year Treasury note is lower than many might have expected given the recent strong GDP figures, the budget deficit and the weakening dollar. The investment sub-adviser is concerned that the Federal Reserve Board may raise interest rates if signs of inflation appear.
The investment sub-adviser believes that the U.S. economy may have a chance to settle into a self-sustaining period, which has been lacking for so long. The investment sub-adviser believes that many corporate management teams finally seem to have returned to making business decisions, after many years of dealing with crises. As a result, the investment sub-adviser sees an abundance of new investment opportunities.
Average Annual Total Returns
| 1 Year | 5 Year | 10 Year | ||||
Select Value Opportunity Fund | 38.43% | 10.16% | 11.62% | |||
Russell 2500 Value Index | 44.91% | 11.92% | 13.63% | |||
Lipper Mid-Cap Value Funds Average | 35.83% | 10.46% | 12.02% |
Growth of a $10,000 Investment Since 1993
The Select Value Opportunity Fund is a portfolio of Allmerica Investment Trust. Portfolio composition will vary over time.
Past performance is no guarantee of future results. Investment return and principal value of an investment will fluctuate so that an investor’s shares, when redeemed, may be worth more or less than their original cost.
The Russell 2500 Value Index is a capitalization weighted index measuring the performance of those Russell 2500 companies with both lower price-to-book ratios and forecasted growth values. The Lipper Mid-Cap Value Funds Average is a non-weighted average of mid-cap value funds. Performance numbers are net of all fund operating expenses, but do not include insurance charges. If performance information included the effect of these additional charges, it would have been lower.
Performance prior to 1/1/97 is that of a prior Sub-Adviser.
Investment Sub-Adviser
Cramer Rosenthal McGlynn, LLC
About the Fund
Seeks long-term growth of capital by investing primarily in small and mid-sized companies believed to be undervalued.
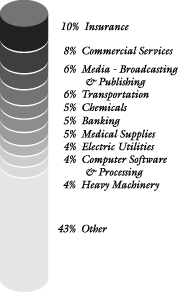
Portfolio Composition
As of December 31, 2003, the sector allocation of net assets was:
3
Table of Contents
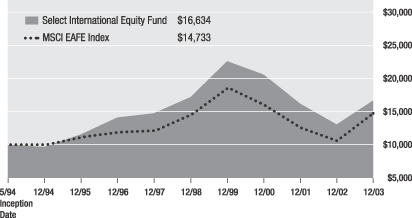
Select International Equity Fund
The Select International Equity Fund returned 27.77% for 2003, underperforming its benchmark, the MSCI EAFE Index, which returned 39.17%.
International equity markets rebounded strongly to record vigorous gains in 2003. Early market volatility had eased considerably by the end of the period. The quicker-than-anticipated collapse of the Iraqi regime served as the catalyst, prompting equity investors back into the market. Brightening economic prospects sustained the stock market bounce as a combination of low interest rates, tax cuts and higher government spending provided an important stimulus.
Positive contributors to fund performance included Europe’s largest electronics company and a major financial services provider. A large consumer goods company, a Dutch supermarket chain and a Swiss re-insurance firm detracted from performance. Overall, the fund’s performance relative to its benchmark was adversely impacted by the smaller, lower quality stocks that dominated the market rally in 2003. The investment sub-adviser’s approach to stock selection continues to emphasize high-quality companies with strong market positions, sound balance sheets and good income and cash generation prospects. While this strategy resulted in underperformance in 2003, the investment sub-adviser remains committed to it.
As we move into 2004, the investment sub-adviser believes the backdrop for the equity markets is considerably more favorable than that presented twelve months ago. The fate of the world economy is intimately intertwined with that of its largest economy, the U.S., and its currency. The investment sub-adviser believes that forces in support of the recovering economy include low interest rates, benign inflation and government tax stimuli in the U.S. and Europe.
Average Annual Total Returns
| 1 Year | 5 Year | Life of Fund | ||||
Select International Equity Fund | 27.77% | (0.62)% | 5.40% | |||
MSCI EAFE Index | 39.17% | 0.26% | 4.09% | |||
Lipper International Funds Average | 35.41% | 1.34% | 5.03% | |||
Growth of a $10,000 Investment Since 1994
The Select International Equity Fund is a portfolio of Allmerica Investment Trust. Portfolio composition will vary over time.
Special risk considerations are associated with investments in non-U.S. companies, including fluctuating foreign exchange rates, foreign governmental regulations and differing degrees of liquidity that may adversely affect the portfolio.
Past performance is no guarantee of future results. Investment return and principal value of an investment will fluctuate so that an investor’s shares, when redeemed, may be worth more or less than their original cost.
The MSCI EAFE Index is an unmanaged index of European, Australian and Far Eastern stocks. The Lipper International Funds Average is a non-weighted average of funds within the international fund category. Performance numbers are net of all fund operating expenses, but do not include insurance charges. If performance information included the effect of these additional charges, it would have been lower.
Investment Sub-Adviser
Bank of Ireland Asset Management (U.S.) Ltd.
About the Fund
Seeks maximum long-term total return by investing in non-U.S. companies based on fundamental value.
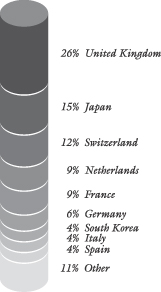
Portfolio Composition
As of December 31, 2003, the country allocation of net assets was:
4
Table of Contents
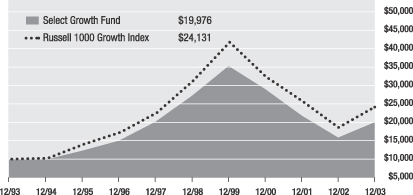
The Select Growth Fund returned 26.30% for 2003, underperforming its benchmark, the Russell 1000 Growth Index, which returned 29.76%.
In the Jennison Associates LLC portion of the fund, information technology, health care, financial services and specific consumer products stocks led returns. Three large semi-conductor corporations, two leading biotechnology concerns and two large pharmaceutical companies performed well, as did two large capital markets firms, a large coffee retailer and an upscale jewelry company. A large manufacturer of motorcycles and a major clothing retailer detracted from performance. The investment sub-adviser believes that the fundamental drivers of healthy economic activity should remain in place, reinforcing a positive economic outlook and an optimistic perspective for equities. The investment sub-adviser believes that acceleration in cash flow, revenue and earnings growth is underway and that profit estimates may be revised upward to reflect stronger revenue growth.
In the Putnam Investment Management, LLC portion of the fund, a major holding in the basic materials sector contributed most to relative performance. Underweighting a major consumer goods company and not holding underperformers in the food area benefited relative returns. Overweighting a large education concern and underweighting the sluggish transportation sector also proved advantageous. Unrewarded stock selection in the technology, consumer cyclicals and health care sectors posed the greatest constraints on relative performance. Positive positions in two large consumer cyclicals companies were offset by negative returns from three leading retailers. Underweighting a major pharmaceutical company also hurt results. The investment sub-advisor believes that the liquidity-driven rally appears to be in the late stages, and expects to see a rotation toward higher-quality stocks, driven by an emphasis on yield, solid balance sheets, and margin growth.
Average Annual Total Returns
| 1 Year | 5 Year | 10 Year | ||||
Select Growth Fund | 26.30% | (5.98)% | 7.17% | |||
Russell 1000 Growth Index | 29.76% | (5.12)% | 9.21% | |||
Lipper Large-Cap Growth Funds Average | 28.37% | (3.22)% | 7.91% |
Growth of a $10,000 Investment Since 1993
The Select Growth Fund is a portfolio of Allmerica Investment Trust. Portfolio composition will vary over time.
Past performance is no guarantee of future results. Investment return and principal value of an investment will fluctuate so that an investor’s shares, when redeemed, may be worth more or less than their original cost.
The Russell 1000 Growth Index measures the performance of those Russell 1000 companies with higher price-to-book ratios and higher forecasted growth values. The Lipper Large-Cap Growth Funds Average is a non-weighted average of funds within the large-cap growth investment objective. Performance numbers are net of all fund operating expenses, but do not include insurance charges. If performance information included the effect of these additional charges, it would have been lower.
Performance prior to 7/1/96 is that of a prior Sub-Adviser.
Jennison Associates LLC became a sub-adviser of the fund effective April 17, 2003.
Investment Sub-Advisers
Jennison Associates LLC
Putnam Investment Management, LLC
About the Fund
Seeks long-term growth of capital by investing in companies believed to have long-term growth potential.
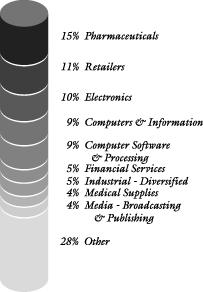
Portfolio Composition
As of December 31, 2003, the sector allocation of net assets was:
5
Table of Contents
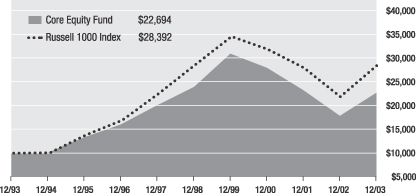
The Core Equity Fund returned 27.67% for 2003, underperforming its benchmark, the Russell 1000 Index, which returned 29.90%.
Broad-based strength was evident across the U.S. equity markets in 2003. The U.S. Government took steps to support the economic rebound and interest rates were pushed to their lowest level in more than 40 years. In the Goldman Sachs Asset Management, L.P. portion of the fund, a wireless communications company contributed positively to performance, as did an overweight position in the technology sector, where two large semiconductor manufacturers performed well. Several companies in the finance area detracted from performance, including a large mortgage lender and a major financial services provider. Consumer stocks also underperformed as investors favored industries such as telecommunications, semiconductors, and networking. Two consumer staples holdings lagged the market, negatively impacting performance. The investment sub-adviser is confident that its in-depth, fundamental research approach may enable it to invest in those businesses that can produce superior growth over the long term.
In the UBS Global Asset Management (Americas) Inc. portion of the fund, overweight positions in the banking, construction and healthcare sectors enhanced performance relative to the benchmark. A leading commercial and consumer finance company, a number of pharmaceutical companies and a manufacturer and installer of building products all contributed positively. A major telecommunications company and a construction materials corporation also aided performance. The greatest detractor from performance was an underweight position in the computer hardware industry, where a lack of semiconductor holdings hurt results. A major household products manufacturer also disappointed. The investment sub-adviser remains committed to a research-based investment approach, searching for opportunities that have the potential to generate superior risk-adjusted returns over the long term.
Average Annual Total Returns
| 1 Year | 5 Year | 10 Year | ||||
Core Equity Fund | 27.67% | (1.00)% | 8.54% | |||
Russell 1000 Index | 29.90% | (0.14)% | 11.00% | |||
Lipper Large-Cap Core Funds Average | 26.43% | (1.22)% | 8.68% | |||
Growth of a $10,000 Investment Since 1993
The Core Equity Fund is a portfolio of Allmerica Investment Trust. Portfolio composition will vary over time.
Past performance is no guarantee of future results. Investment return and principal value of an investment will fluctuate so that an investor’s shares, when redeemed, may be worth more or less than their original cost.
The Russell 1000 Index measures the performance of the 1,000 largest companies in the Russell 3000 Index. The Lipper Large-Cap Core Funds Average is a non-weighted average of funds within the large-cap core investment objective. Performance numbers are net of all fund operating expenses, but do not include insurance charges. If performance information included the effect of these additional charges, it would have been lower.
Investment Sub-Advisers
Goldman Sachs Asset Management, L.P.
UBS Global Asset Management (Americas) Inc.
About the Fund
Seeks long-term growth of capital by investing in stocks that are believed to represent significant underlying value.
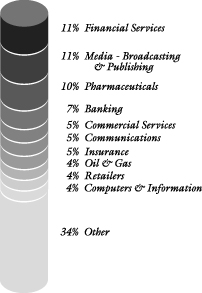
Portfolio Composition
As of December 31, 2003, the sector allocation of net assets was:
6
Table of Contents
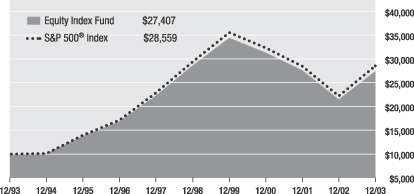
The Equity Index Fund returned 27.83% for 2003, underperforming its benchmark, the S&P 500® Index, which returned 28.69%.
The year got off to a difficult start as investors fretted about the anemic pace of the economic recovery. First quarter total returns were negative, and some began to think that the stock market would end lower for the fourth year in a row. Stimulus came late in the second quarter when the Federal Reserve Board cut the target federal funds rate to 1.00%. The market began to trade higher in the third quarter and real GDP growth came in at 8.2%, the highest in twenty years. Investors’ optimism for stocks was rewarded across nearly all sectors of the equity market, but among the best-performing areas were the gold and natural resources sectors, emerging markets, and the science and technology sector. Utilities stocks did not perform as well. Smaller capitalization issues performed best in 2003.
Looking ahead to 2004, the investment sub-adviser believes that many indicators point to continued global growth. The investment sub-adviser thinks that the U.S. and China may lead the way, but that Europe and Japan may also contribute. The S&P 500® Index is trading at about 24 times projected 2004 earnings, which many analysts consider full valuation. As a result, the investment sub-adviser finds it difficult to envision double-digit gains for the U.S. equity market in 2004. However, with many companies increasing their dividend pay-outs, the investment sub-adviser believes that the higher yield from stocks may become increasingly important to total return.
Average Annual Total Returns
| 1 Year | 5 Year | 10 Year | ||||
Equity Index Fund | 27.83% | (0.85)% | 10.61% | |||
S&P 500® Index | 28.69% | (0.57)% | 11.06% | |||
Lipper S&P 500 Index Objective Funds Average | 28.01% | (0.93)% | 10.69% |
Growth of a $10,000 Investment Since 1993
The Equity Index Fund is a portfolio of Allmerica Investment Trust. Portfolio composition will vary over time.
Past performance is no guarantee of future results. Investment return and principal value of an investment will fluctuate so that an investor’s shares, when redeemed, may be worth more or less than their original cost.
The S&P 500® Index is an unmanaged index of 500 leading stocks. S&P 500® Index is a registered trademark of The McGraw-Hill Companies, Inc. The Lipper S&P 500 Index Objective Funds Average is a non-weighted average of funds within the S&P 500® Index investment objective. Performance numbers are net of all fund operating expenses, but do not include insurance charges. If performance information included the effect of these additional charges, it would have been lower.
Investment Sub-Adviser
Opus Investment Management, Inc.
About the Fund
Seeks to replicate the returns of the S&P 500® Index.
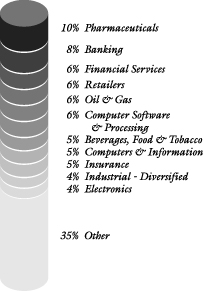
Portfolio Composition
As of December 31, 2003, the sector allocation of net assets was:
7
Table of Contents
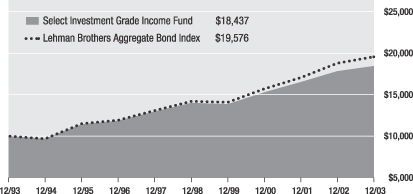
Select Investment Grade Income Fund
The Select Investment Grade Income Fund returned 3.31% for 2003, underperforming its benchmark, the Lehman Brothers Aggregate Bond Index, which returned 4.11%.
The bond market was attempting to interpret the Federal Reserve Board’s signals regarding deflation, when 2003 began, and few expected more cuts in the overnight lending rate. As the stock market crept lower and payroll data showed further weakness, the Federal Reserve Board cut the target federal funds rate to 1.00% and Congress passed a massive tax cut, to aid a flailing economy. This massive stimulus provided a windfall for the U.S. consumer to go out and spend. As a result, third quarter GDP growth came in at a robust 8.2% and a solid fourth quarter marked by employment gains was anticipated.
Bond market returns were more muted this year, owing to the out-sized gains of the last several years as interest rates declined. The underperformance of the fund to its benchmark was a result of the corporate segment of the portfolio generally being positioned higher in quality relative to the benchmark, as a defensive posture. Although the corporate sector overweight was the correct decision, the underweight in the riskier names hurt performance. The lower quality sectors, in particular “Baa”, significantly outperformed the higher quality sectors. The portfolio also suffered from trading costs as a result of the merger of two funds in May, 2003.
The investment sub-adviser believes that the Federal Reserve Board may raise interest rates in the mid to latter half of 2004 and that interest rates may be pressured up modestly, as economic growth accelerates and the risk of inflation increases.
Average Annual Total Returns
| 1 Year | 5 Year | 10 Year | ||||
Select Investment Grade Income Fund | 3.31% | 5.67% | 6.31% | |||
Lehman Brothers Aggregate Bond Index | 4.11% | 6.62% | 6.95% | |||
Lipper Intermediate Investment Grade | 5.14% | 5.83% | 6.56% |
Growth of a $10,000 Investment Since 1993
The Select Investment Grade Income Fund is a portfolio of Allmerica Investment Trust. Portfolio composition will vary over time.
Past performance is no guarantee of future results. Investment return and principal value of an investment will fluctuate so that an investor’s shares, when redeemed, may be worth more or less than their original cost.
The Lehman Brothers Aggregate Bond Index is an unmanaged index of all fixed-rate debt issues with an investment grade rating, at least one year to maturity and an outstanding par value of at least $25 million. The Lipper Intermediate Investment Grade Debt Funds Average tracks the performance of funds investing in intermediate-term corporate and government debt securities. Performance numbers are net of all fund operating expenses, but do not include insurance charges. If performance information included the effect of these additional charges, it would have been lower.
Investment Sub-Adviser
Opus Investment Management, Inc.
About the Fund
Seeks to generate a high level of total return which includes income and capital appreciation.
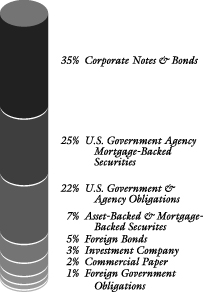
Portfolio Composition
As of December 31, 2003, the sector allocation of net assets was:
8
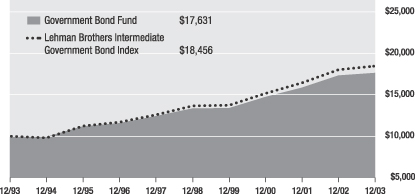
Table of Contents
The Government Bond Fund returned 1.67% for 2003, underperforming its benchmark, the Lehman Brothers Intermediate Government Bond Index, which returned 2.30%.
At the start of 2003, the bond market was still attempting to interpret the Federal Reserve Board’s signals regarding deflation, and few expected more cuts in the overnight lending rate. As the stock market crept lower and payroll data showed further weakness, however, the Federal Reserve Board responded and cut the target federal funds rate to 1.00%. When massive fiscal stimulus in the form of a tax cut also occurred, the U.S. consumer responded by spending strongly throughout the remainder of the year. Third quarter GDP growth came in at 8.2%, the highest in 20 years.
The fund’s overweight to spread product, namely Agency securities, enhanced results in 2003. The sector’s excess coupon over comparable Treasuries was significant to the portfolio’s performance for the period. In certain instances, the fund’s exposure to callable securities, such as collateralized mortgage obligations and callable Agencies, detracted from performance.
The investment sub-adviser believes that economic growth may continue strong into 2004. After substantial cost-cutting over the last three years, the corporate sector may realize significant profit gains and may continue its spending on capital equipment. The consumer sector may also contribute positively to economic growth. The investment sub-adviser expects to maintain the portfolio’s duration underweight relative to the Index, especially given the recent strength in the economy. The investment sub-adviser expects that Agency securities again will play a major role in the portfolio and may add incremental yield in the current low interest rate environment.
Average Annual Total Returns
| 1 Year | 5 Year | 10 Year | ||||
Government Bond Fund | 1.67% | 5.68% | 5.84% | |||
Lehman Brothers Intermediate Government Bond Index | 2.30% | 6.18% | 6.32% | |||
Lipper General U.S. Government Funds Average | 2.32% | 5.65% | 6.20% |
Growth of a $10,000 Investment Since 1993
The Government Bond Fund is a portfolio of Allmerica Investment Trust. Portfolio composition will vary over time.
The Fund is neither insured nor guaranteed by the U.S. Government.
Past performance is no guarantee of future results. Investment return and principal value of an investment will fluctuate so that an investor’s shares, when redeemed, may be worth more or less than their original cost.
The Lehman Brothers Intermediate Government Bond Index is an unmanaged index of U.S. Government and Agency bonds with remaining maturities of one to ten years. The Lipper General U.S. Government Funds Average is the non-weighted average performance of funds investing in general U.S. Government securities. Performance numbers are net of all fund operating expenses, but do not include insurance charges. If performance information included the effect of these additional charges, it would have been lower.
Investment Sub-Adviser
Opus Investment Management, Inc.
About the Fund
Seeks high income, capital preservation and maintenance of liquidity, primarily through investments in debt instruments issued or guaranteed by the U.S. Government or its Agencies.
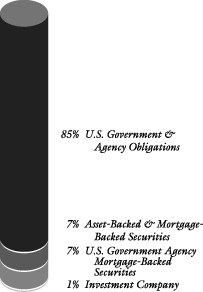
Portfolio Composition
As of December 31, 2003, the sector allocation of net assets was:
9
Table of Contents
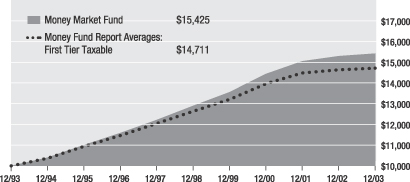
The Money Market Fund returned 0.80% for 2003, outperforming its benchmark, the Money Fund Report Averages: First Tier Taxable, which returned 0.49%.
Bond market returns were more muted this year, compared to the robust gains of the last several years, when interest rates were declining. The Lehman Brothers Aggregate Bond Index returned 4.11% for 2003, which reflects positive coupon return, offset by some modest price depreciation, as interest rates rose. The two year Treasury note ended the year 23 basis points higher in yield at a still-low 1.82%, while the ten year Treasury note rose by 43 basis points to end the year at 4.25%. U.S. equity market returns were quite strong for the full year, as the S&P 500® Index returned 28.69%, while the Nasdaq Composite Index was up an impressive 50.01%.
The fund’s outperformance relative to its benchmark can largely be attributed to a slightly longer average maturity than its peer group and a large concentration in floating-rate notes, which offer incremental yield over straight debt.
The investment sub-adviser believes that there are still real risks that could threaten the U.S. economy’s growth and recovery. Geopolitical uncertainty, the risk of terrorism and the falling dollar are all potential hazards. Should the current weakening dollar begin to free-fall, the investment sub-adviser believes that U.S. interest rates may be forced up dramatically to fund the burgeoning deficits. This could cause stock prices to fall, eroding consumer confidence and squashing capital spending growth plans. While not anticipating this outcome, the investment sub-adviser feels that it is important to acknowledge the risks still present in the economy.
Average Annual Total Returns
| 1 Year | 5 Year | 10 Year | ||||
Money Market Fund | 0.80% | 3.64% | 4.43% | |||
Money Fund Report Averages: First Tier Taxable | 0.49% | 3.08% | 3.94% | |||
Lipper Money Market Funds Average | 0.64% | 3.28% | 4.12% | |||
| Average Yield as of December 31, 2003 | ||||||
Money Market Fund 7-Day Yield |
0.65% | |||||
Growth of a $10,000 Investment Since 1993
The Money Market Fund is a portfolio of Allmerica Investment Trust. Portfolio composition will vary over time.
The Fund is neither insured nor guaranteed by the Federal Deposit Insurance Corporation or any other government agency. Although the Fund seeks to maintain a net asset value of $1.00 per share, it is possible to lose money by investing in the Fund.
Past performance is no guarantee of future results. Investment return and principal value of an investment will fluctuate so that an investor’s shares, when redeemed, may be worth more or less than their original cost.
Money Fund Report Averages: First Tier Taxable is published by iMoneyNet, Inc., an independent firm that tracks 2a-7 regulated money market funds on a yield, shareholder, asset size and portfolio allocation basis. The Lipper Money Market Funds Average is the average investment performance of funds within the money market category. Performance numbers are net of all fund operating expenses, but do not include insurance charges. If performance information included the effect of these additional charges, it would have been lower.
Investment Sub-Adviser
Opus Investment Management, Inc.
About the Fund
Seeks to maximize current income for investors while preserving capital and liquidity.
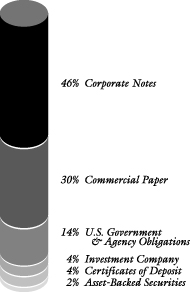
Portfolio Composition
As of December 31, 2003, the sector allocation of net assets was:
10
Table of Contents
Financials
Table of Contents
SELECT CAPITAL APPRECIATION FUND
PORTFOLIO OF INVESTMENTS • December 31, 2003
| Shares | Value (Note 2) | ||||
| COMMON STOCKS - 97.3% | |||||
Advertising - 2.1% | |||||
| 100,000 | Catalina Marketing Corp.* (a) | $ | 2,016,000 | ||
| 67,000 | Lamar Advertising Co.* | 2,500,440 | |||
| 76,000 | Monster Worldwide, Inc. (a) | 1,668,960 | |||
| 6,185,400 | |||||
Aerospace & Defense - 1.1% | |||||
| 56,000 | Alliant Techsystems, Inc.* | 3,234,560 | |||
Airlines - 0.4% | |||||
| 46,000 | JetBlue Airways Corp. (a) | 1,219,920 | |||
Apparel Retailers - 0.9% | |||||
| 104,000 | Ross Stores, Inc. (a) | 2,748,720 | |||
Automotive - 1.8% | |||||
| 38,000 | ITT Industries, Inc. | 2,819,980 | |||
| 49,000 | Oshkosh Truck Corp. | 2,500,470 | |||
| 5,320,450 | |||||
Banking - 0.2% | |||||
| 14,000 | Silicon Valley Bancshares* | 504,980 | |||
Beverages, Food & Tobacco - 1.4% | |||||
| 86,000 | Cott Corp.* | 2,408,860 | |||
| 56,000 | Starbucks Corp.* | 1,851,360 | |||
| 4,260,220 | |||||
Chemicals - 1.1% | |||||
| 38,000 | Potash Corp. of Saskatchewan, Inc.* (a) | 3,286,240 | |||
Commercial Services - 9.4% | |||||
| 18,000 | Apollo Group, Inc.* | 1,224,000 | |||
| 183,000 | BearingPoint, Inc.* | 1,846,470 | |||
| 91,000 | Certegy, Inc. | 2,984,800 | |||
| 107,000 | ChoicePoint, Inc.* | 4,075,630 | |||
| 58,000 | Education Management* | 1,800,320 | |||
| 99,000 | Hewitt Associates, Inc.* | 2,960,100 | |||
| 12,000 | Invitrogen Corp.* | 840,000 | |||
| 64,000 | Iron Mountain, Inc.* | 2,530,560 | |||
| 77,000 | Manpower, Inc.* (a) | 3,625,160 | |||
| 117,000 | Robert Half International, Inc.* | 2,730,780 | |||
| 114,000 | Viad Corp. | 2,850,000 | |||
| 28,000 | WebMD Corp.* | 251,720 | |||
| 27,719,540 | |||||
Communications - 3.1% | |||||
| 18,000 | Advanced Fibre Communications, Inc.* | 362,700 | |||
| 27,000 | L-3 Communications Holdings, Inc.* | 1,386,720 | |||
| 115,000 | Nextel Communications, Inc., Class A* | 3,226,900 | |||
| 8,000 | Research In Motion (a) | 534,640 | |||
| 122,000 | Rockwell Collins, Inc. | 3,663,660 | |||
| 9,174,620 | |||||
Computer Software & Processing - 10.0% | |||||
| 54,000 | Adobe Systems, Inc. | $ | 2,122,200 | ||
| 34,000 | Affiliated Computer Services, Class A (a) | 1,851,640 | |||
| 133,000 | Cadence Design Systems, Inc. (a) | 2,391,340 | |||
| 123,000 | Ceridian Corp.* | 2,575,620 | |||
| 85,000 | DST Systems, Inc. (a) | 3,549,600 | |||
| 61,000 | Fiserv, Inc.* | 2,410,110 | |||
| 46,000 | Intuit, Inc.* | 2,433,860 | |||
| 91,000 | Macromedia, Inc.* | 1,623,440 | |||
| 34,000 | Mercury Interactive Corp. (a) | 1,653,760 | |||
| 187,000 | Network Associates, Inc.* | 2,812,480 | |||
| 45,000 | Red Hat, Inc.* | 844,650 | |||
| 75,000 | Siebel Systems, Inc.* | 1,040,250 | |||
| 50,000 | SunGard Data Systems, Inc.* | 1,385,500 | |||
| 177,000 | VeriSign, Inc.* | 2,885,100 | |||
| 29,579,550 | |||||
Computers & Information - 1.8% | |||||
| 55,800 | 3Com Corp.* | 455,885 | |||
| 40,000 | Diebold Inc. | 2,154,800 | |||
| 21,000 | Lexmark International Group, Inc.* | 1,651,440 | |||
| 52,000 | Seagate Technology* | 982,800 | |||
| 5,244,925 | |||||
Cosmetics & Personal Care - 0.5% | |||||
| 39,000 | Estee Lauder Cos., Inc., Class A | 1,531,140 | |||
Electronics - 6.0% | |||||
| 80,000 | Amis Holdings, Inc.* | 1,462,400 | |||
| 81,000 | ASML Holding NV* | 1,624,050 | |||
| 31,000 | Garmin, Ltd. (a) | 1,688,880 | |||
| 24,700 | Integrated Circuit Systems, Inc.* | 703,703 | |||
| 106,000 | Intersil Corp., Class A* | 2,634,100 | |||
| 56,000 | Jabil Circuit, Inc.* | 1,584,800 | |||
| 91,000 | Microchip Technology, Inc. | 3,035,760 | |||
| 19,000 | Molex Inc., Class A | 557,840 | |||
| 46,000 | Novellus Systems, Inc.* | 1,934,300 | |||
| 19,000 | QLogic Corp.* | 980,400 | |||
| 70,000 | Semtech Corp.* | 1,591,100 | |||
| 17,797,333 | |||||
Financial Services - 4.7% | |||||
| 54,000 | CapitalSource, Inc. (a) | 1,170,720 | |||
| 81,000 | Charles Schwab Corp. | 959,040 | |||
| 60,000 | Eaton Vance Corp. | 2,198,400 | |||
| 9,000 | Franklin Resources, Inc. | 468,540 | |||
| 31,000 | Investors Financial Services Corp. | 1,190,710 | |||
| 23,000 | Legg Mason, Inc.* | 1,775,140 | |||
| 32,000 | Nationwide Financial Services, Inc. | 1,057,920 | |||
| 60,000 | Principal Financial Group, Inc. | 1,984,200 | |||
| 130,000 | Waddell & Reed Financial, Class A | 3,049,800 | |||
| 13,854,470 | |||||
Food Retailers - 1.2% | |||||
| 51,000 | Whole Foods Market, Inc.* (a) | 3,423,630 | |||
See Notes to Financial Statements.
F-1
Table of Contents
SELECT CAPITAL APPRECIATION FUND
PORTFOLIO OF INVESTMENTS, Continued • December 31, 2003
| Shares | Value (Note 2) | ||||
Health Care Providers - 4.9% | |||||
| 44,600 | Davita, Inc.* | $ | 1,739,400 | ||
| 127,000 | Health Management Associates, Inc., Class A | 3,048,000 | |||
| 82,000 | Laboratory Corp. of America Holdings* | 3,029,900 | |||
| 109,000 | Manor Care, Inc.* (a) | 3,768,130 | |||
| 37,000 | Universal Health Services, Inc. (a) | 1,987,640 | |||
| 11,000 | Wellpoint Health Networks, Inc.* | 1,066,890 | |||
| 14,639,960 | |||||
Heavy Machinery - 4.5% | |||||
| 31,000 | American Standard Companies, Inc.* | 3,121,700 | |||
| 49,000 | Cooper Cameron Corp.* | 2,283,400 | |||
| 81,000 | FMC Technologies, Inc.* | 1,887,300 | |||
| 79,000 | Harris Corp., Inc. | 2,998,050 | |||
| 73,000 | Smith International, Inc.* | 3,030,960 | |||
| 13,321,410 | |||||
Insurance - 3.4% | |||||
| 43,000 | Anthem, Inc. (a) | 3,225,000 | |||
| 49,000 | Axis Capital Holdings, Ltd. | 1,434,720 | |||
| 49,000 | Protective Life Corp. | 1,658,160 | |||
| 34,000 | Radian Group, Inc. | 1,657,500 | |||
| 13,000 | Wellchoice, Inc.* | 448,500 | |||
| 52,000 | Willis Group Holdings, Ltd. | 1,771,640 | |||
| 10,195,520 | |||||
Lodging - 0.9% | |||||
| 93,000 | Fairmont Hotels & Resorts, Inc. (a) | 2,524,020 | |||
Media - Broadcasting & Publishing - 4.6% | |||||
| 81,000 | Cablevision Systems Corp. (a) | 1,894,590 | |||
| 94,000 | Citadel Broadcasting Corp.* | 2,102,780 | |||
| 80,000 | Cox Radio, Inc.* | 2,018,400 | |||
| 8,000 | E.W. Scripps Co. | 753,120 | |||
| 18,000 | Entercom Communications Corp.* (a) | 953,280 | |||
| 17,000 | NTL, Inc.* | 1,185,750 | |||
| 97,000 | Rogers Communications, Inc., Class B (a) | 1,600,500 | |||
| 54,000 | Scholastic Corp. (a) | 1,838,160 | |||
| 43,000 | XM Satellite Radio Holdings, Inc. (a) | 1,133,480 | |||
| 13,480,060 | |||||
Medical Supplies - 4.9% | |||||
| 28,000 | Danaher Corp. (a) | 2,569,000 | |||
| 38,000 | Edwards Lifesciences Corp.* | 1,143,040 | |||
| 150,000 | Omnicare, Inc. | 6,058,500 | |||
| 66,000 | Roper Industries, Inc. (a) | 3,251,160 | |||
| 43,000 | Waters Corp.* | 1,425,880 | |||
| 14,447,580 | |||||
Metals - 2.6% | |||||
| 37,000 | International Steel Group, Inc. (a) | 1,441,150 | |||
| 59,000 | Newmont Mining Corp. | 2,867,990 | |||
| 62,000 | Nucor Corp. (a) | 3,472,000 | |||
| 7,781,140 | |||||
Oil & Gas - 5.6% | |||||
| 103,000 | BJ Services Co.* | $ | 3,697,700 | ||
| 12,000 | Devon Energy Corp.* | 687,120 | |||
| 105,000 | Diamond Offshore Drilling, Inc. (a) | 2,153,550 | |||
| 71,000 | EOG Resources, Inc.* | 3,278,070 | |||
| 47,000 | Murphy Oil Corp. | 3,069,570 | |||
| 31,000 | Western Gas Resources, Inc. | 1,464,750 | |||
| 83,000 | XTO Energy, Inc. | 2,348,900 | |||
| 16,699,660 | |||||
Personal Services - 0.3% | |||||
| 27,000 | Weight Watchers International, Inc. (a) | 1,035,990 | |||
Pharmaceuticals - 9.3% | |||||
| 39,000 | Abgenix, Inc.* | 485,940 | |||
| 58,000 | Alkermes, Inc.* | 783,000 | |||
| 48,600 | AmerisourceBergen Corp. (a) | 2,728,890 | |||
| 37,000 | Amylin Pharmaceuticals, Inc.* (a) | 822,140 | |||
| 66,000 | Andrx Corp.* | 1,586,640 | |||
| 26,000 | Barr Laboratories, Inc.* (a) | 2,000,700 | |||
| 42,800 | Biogen Idec, Inc.* | 1,574,184 | |||
| 43,000 | Cephalon, Inc.* (a) | 2,081,630 | |||
| 49,000 | Gilead Sciences, Inc.* | 2,848,860 | |||
| 60,000 | Human Genome Sciences, Inc.* | 795,000 | |||
| 26,000 | ImClone Systems, Inc.* | 1,031,160 | |||
| 112,000 | IVAX Corp.* | 2,674,560 | |||
| 106,000 | Medimmune, Inc.* | 2,692,400 | |||
| 43,000 | Millennium Pharmaceuticals* | 802,810 | |||
| 24,000 | Neurocrine Biosciences, Inc.* (a) | 1,308,960 | |||
| 42,000 | Protein Design Labs, Inc. (a) | 751,800 | |||
| 34,000 | Teva Pharmaceutical Industries, Ltd., Sponsored ADR* | 1,928,140 | |||
| 56,000 | Vertex Pharmaceuticals, Inc.* | 572,880 | |||
| 27,469,694 | |||||
Restaurants - 0.7% | |||||
| 49,000 | The Cheesecake Factory, Inc. (a) | 2,157,470 | |||
| Retailers - 6.7% | |||||
| 21,000 | 99 Cents Only Stores* | 571,830 | |||
| 52,000 | Best Buy Co., Inc.* | 2,716,480 | |||
| 37,000 | CDW Corp. (a) | 2,137,120 | |||
| 79,000 | Dollar Tree Stores, Inc.* | 2,374,740 | |||
| 65,000 | Family Dollar Stores, Inc. | 2,332,200 | |||
| 11,000 | Fastenal Co. (a) | 549,340 | |||
| 27,000 | InterActiveCorp (a) | 916,110 | |||
| 61,000 | O’Reilly Automotive, Inc.* | 2,339,960 | |||
| 95,000 | Petsmart, Inc. | 2,261,000 | |||
| 56,000 | Shoppers Drug Mart Corp.* | 1,299,191 | |||
| 65,000 | Williams-Sonoma, Inc.* (a) | 2,260,050 | |||
| 19,758,021 | |||||
Telephone Systems - 1.7% | |||||
| 145,000 | Crown Castle International Corp.* (a) | 1,599,350 | |||
| 91,000 | Nextel Partners, Inc., Class A (a) | 1,223,950 | |||
| 58,000 | Triton PCS Holdings, Inc.* | 323,640 | |||
| 110,000 | Western Wireless Corp., Class A* | 2,019,600 | |||
| 5,166,540 | |||||
See Notes to Financial Statements.
F-2
Table of Contents
SELECT CAPITAL APPRECIATION FUND
PORTFOLIO OF INVESTMENTS, Continued • December 31, 2003
| Shares | Value (Note 2) | ||||
Transportation - 1.5% | |||||
| 94,000 | Brunswick Corp. | $ | 2,992,020 | ||
| 40,000 | Expeditors International of Washington, Inc. | 1,506,400 | |||
| 4,498,420 | |||||
Total Common Stocks | 288,261,183 | ||||
(Cost $216,722,072) | |||||
| Par Value | |||||
| U.S. GOVERNMENT AND AGENCY OBLIGATIONS (b) - 0.8% | |||||
Fannie Mae - 0.7% | |||||
| $2,062,000 | 0.70%, 01/02/04 | 2,061,960 | |||
| �� | |||||
Freddie Mac - 0.1% | |||||
| 110,000 | 1.08%, 02/04/04 | 109,888 | |||
Total U.S. Government and | |||||
Agency Obligations | 2,171,848 | ||||
(Cost $2,171,848) | |||||
| Total Investments - 98.1% | 290,433,031 | ||||
| (Cost $218,893,920) | |||||
| Net Other Assets and Liabilities - 1.9% | 5,770,901 | ||||
| Total Net Assets - 100.0% | $ | 296,203,932 | |||
| * | Non-income producing security. |
| (a) | All or a portion of this security is out on loan at December 31, 2003; the value of the securities loaned amounted to $69,817,387. The value of collateral amounted to $72,318,713 which consisted of cash equivalents. |
| (b) | Effective yield at time of purchase. |
| ADR | American Depositary Receipt. Shares of a foreign based corporation held in U.S. banks entitling the shareholder to all dividends and capital gains. |
FEDERAL INCOME TAX INFORMATION (SEE NOTE 2)
At December 31, 2003, the aggregate cost of investment securities for tax purposes was $224,072,928. Net unrealized appreciation (depreciation) aggregated $66,360,103, of which $70,870,786 related to appreciated investment securities and $(4,510,683) related to depreciated investment securities.
As of December 31, 2003, the components of distributable earnings (excluding unrealized appreciation disclosed above) on a tax basis consisted of $713,085, $4,819,968 and $20,171,579 of capital loss carryforwards, undistributed short-term capital gains and undistributed long-term capital gains, respectively.
For the period ended December 31, 2003 the Portfolio has elected to defer $6,647 of currency losses attributable to Post-October losses.
At December 31, 2003, the Portfolio had capital loss carryforwards which expire as follows: $713,085 in 2008.
OTHER INFORMATION
For the year ended December 31, 2003, the aggregate cost of purchases and the proceeds of sales, other than from short-term investments, included $131,244,775 and $223,574,570 of non-governmental issuers, respectively.
See Notes to Financial Statements.
F-3
Table of Contents
SELECT VALUE OPPORTUNITY FUND
PORTFOLIO OF INVESTMENTS • December 31, 2003
| Shares | Value (Note 2) | ||||
| COMMON STOCKS - 95.3% | |||||
Advertising - 1.7% | |||||
| 95,250 | ADVO, Inc. | $ | 3,025,140 | ||
| 90,800 | Lamar Advertising Co.* | 3,388,656 | |||
| 6,413,796 | |||||
Aerospace & Defense - 2.2% | |||||
| 267,900 | United Defense Industries, Inc.* | 8,540,652 | |||
Automotive - 2.3% | |||||
| 300,000 | Goodrich (B.F.) Co. | 8,907,000 | |||
Banking - 5.1% | |||||
| 165,600 | Greenpoint Financial Corp. | 5,848,992 | |||
| 153,700 | Hibernia Corp., Class A | 3,613,487 | |||
| 249,350 | North Fork Bancorp., Inc. | 10,091,194 | |||
| 19,553,673 | |||||
Beverages, Food & Tobacco - 1.4% | |||||
| 15,100 | Adolph Coors Co. (a) | 847,110 | |||
| 104,800 | American Italian Pasta Co., Class A (a) | 4,391,120 | |||
| 5,238,230 | |||||
Chemicals - 5.4% | |||||
| 322,700 | Airgas, Inc. | 6,931,596 | |||
| 214,320 | Georgia Gulf Corp. | 6,189,562 | |||
| 211,800 | International Flavors & Fragrances, Inc. (a) | 7,396,056 | |||
| 20,517,214 | |||||
Commercial Services - 8.0% | |||||
| 256,200 | Amdocs, Ltd.* | 5,759,376 | |||
| 171,860 | Aramark Services, Inc., Class B | 4,712,401 | |||
| 502,200 | BISYS Group, Inc.* | 7,472,736 | |||
| 127,110 | Manpower, Inc. (a) | 5,984,339 | |||
| 341,000 | Moore Wallace, Inc.* | 6,386,930 | |||
| 30,315,782 | |||||
Communications - 1.3% | |||||
| 675,300 | Arris Group, Inc. (a) | 4,889,172 | |||
Computer Software & Processing - 4.3% | |||||
| 132,300 | Hyperion Solutions Corp. (a) | 3,987,522 | |||
| 695,100 | Novell, Inc.* | 7,312,452 | |||
| 170,000 | Take-Two Interactive Software, Inc. (a) | 4,897,700 | |||
| 16,197,674 | |||||
Computers & Information - 0.9% | |||||
| 294,700 | IKON Office Solutions, Inc. | 3,495,142 | |||
Containers & Packaging - 1.4% | |||||
| 242,820 | Packaging Corp. of America | 5,308,045 | |||
Electric Utilities - 4.4% | |||||
| 267,500 | PG&E Corp.* | $ | 7,428,475 | ||
| 143,210 | PPL Corp. | 6,265,437 | |||
| 407,400 | Reliant Resources, Inc. (a) | 2,998,464 | |||
| 16,692,376 | |||||
Electrical Equipment - 1.5% | |||||
| 114,300 | Moog, Inc., Class A* | 5,646,420 | |||
Electronics - 2.8% | |||||
| 179,100 | A.O. Smith Corp. | 6,277,455 | |||
| 1,501,100 | Agere Systems, Inc.* | 4,353,190 | |||
| 10,630,645 | |||||
Entertainment & Leisure - 2.2% | |||||
| 139,200 | Alliance Gaming Corp.* | 3,431,280 | |||
| 354,200 | Hollywood Entertainment Corp.* | 4,870,250 | |||
| 8,301,530 | |||||
Financial Services - 1.6% | |||||
| 205,900 | Brascan Corp., Class A (a) | 6,288,186 | |||
Forest Products & Paper - 3.8% | |||||
| 328,200 | Boise Cascade Corp. | 10,784,652 | |||
| 82,600 | Bowater, Inc. | 3,825,206 | |||
| 14,609,858 | |||||
Health Care Providers - 3.7% | |||||
| 124,200 | Kindred Healthcare, Inc.* | 6,455,916 | |||
| 279,200 | Sierra Health Services, Inc.* | 7,664,040 | |||
| 14,119,956 | |||||
Heavy Machinery - 4.2% | |||||
| 253,000 | Stanley Works (a) | 9,581,110 | |||
| 170,600 | York International Corp. | 6,278,080 | |||
| 15,859,190 | |||||
Household Products - 0.8% | |||||
| 77,200 | Church & Dwight Co., Inc. | 3,057,120 | |||
Insurance - 10.4% | |||||
| 108,100 | AMBAC Financial Group, Inc. | 7,501,059 | |||
| 159,790 | Everest Re Group, Ltd. | 13,518,234 | |||
| 133,150 | Oxford Health Plans, Inc.* | 5,792,025 | |||
| 452,200 | The Phoenix Companies, Inc. (a) | 5,444,488 | |||
| 214,200 | Willis Group Holdings, Ltd. | 7,297,794 | |||
| 39,553,600 | |||||
Lodging - 1.9% | |||||
| 394,900 | Intrawest Corp. | 7,301,701 | |||
Media - Broadcasting & Publishing - 6.3% | |||||
| 219,900 | Belo Corp. | 6,231,966 | |||
| 282,386 | Cablevision Systems Corp.* (a) | 6,605,009 | |||
See Notes to Financial Statements.
F-4
Table of Contents
SELECT VALUE OPPORTUNITY FUND
PORTFOLIO OF INVESTMENTS, Continued • December 31, 2003
| Shares | Value (Note 2) | ||||
Media - Broadcasting & Publishing (continued) | |||||
| 92,000 | Entercom Communications Corp.* | $ | 4,872,320 | ||
| 81,800 | Knight-Ridder, Inc. (a) | 6,328,866 | |||
| 24,038,161 | |||||
Medical Supplies - 4.9% | |||||
| 90,340 | C.R. Bard, Inc. | 7,340,125 | |||
| 188,500 | CTI Molecular Imaging, Inc. (a) | 3,187,535 | |||
| 198,500 | Omnicare, Inc. | 8,017,415 | |||
| 18,545,075 | |||||
Metals - 1.1% | |||||
| 193,800 | Watts Industries, Inc., Class A | 4,302,360 | |||
Oil & Gas - 3.5% | |||||
| 399,700 | Pride International Inc. (a) | 7,450,408 | |||
| 159,200 | Weatherford International Ltd.* | 5,731,200 | |||
| 13,181,608 | |||||
Retailers - 2.0% | |||||
| 198,200 | CSK Auto Corp.* | 3,720,214 | |||
| 197,700 | Insight Enterprises, Inc.* | 3,716,760 | |||
| 7,436,974 | |||||
Transportation - 6.2% | |||||
| 123,800 | CNF Transportation, Inc. | 4,196,820 | |||
| 259,900 | Royal Caribbean Cruises, Ltd. (a) | 9,041,921 | |||
| 244,500 | Wabtec Corp. | 4,166,280 | |||
| 176,600 | Yellow Roadway Corp. (a) | 6,387,622 | |||
| 23,792,643 | |||||
Total Common Stocks | 362,733,783 | ||||
(Cost $291,466,949) | |||||
| Total Investments - 95.3% | 362,733,783 | ||||
| (Cost $291,466,949) | |||||
| Net Other Assets and Liabilities - 4.7% | 18,067,212 | ||||
| Total Net Assets - 100.0% | $ | 380,800,995 | |||
| * | Non-income producing security. |
| (a) | All or a portion of this security is out on loan at December 31, 2003; the value of securities loaned amounted to $72,077,037. The value of collateral amounted to $75,000,853 which consisted of cash equivalents. |
FEDERAL INCOME TAX INFORMATION (SEE NOTE 2)
At December 31, 2003, the aggregate cost of investment securities for tax purposes was $293,952,837. Net unrealized appreciation (depreciation) aggregated $68,780,946, of which $70,617,798 related to appreciated investment securities and $(1,836,852) related to depreciated investment securities.
As of December 31, 2003, the components of distributable earnings (excluding unrealized appreciation disclosed above) on a tax basis consisted of $195,527 and $22,153,190 of undistributed ordinary income and of undistributed short term capital gains, respectively.
During the period ended December 31, 2003, the tax character of distributions paid was as follows: ordinary income - $398,315 and long-term capital gains - $966,884
OTHER INFORMATION
For the year ended December 31, 2003, the aggregate cost of purchases and the proceeds of sales, other than from short-term investments, included $379,403,928 and $459,818,920 of non-governmental issuers, respectively.
See Notes to Financial Statements.
F-5
Table of Contents
SELECT INTERNATIONAL EQUITY FUND
PORTFOLIO OF INVESTMENTS, Continued • December 31, 2003
| Shares | Value (Note 2) | ||||
| COMMON STOCKS - 97.4% | |||||
Australia - 2.5% | |||||
| 198,828 | James Hardie Industries NV | $ | 1,030,672 | ||
| 123,789 | National Australia Bank, Ltd. (a) | 2,793,401 | |||
| 315,097 | News Corp., Ltd | 2,846,544 | |||
| 220,755 | Westpac Banking Corp., Ltd. | 2,659,582 | |||
| 9,330,199 | |||||
Canada - 0.5% | |||||
| 37,855 | Royal Bank of Canada | 1,810,361 | |||
China - 0.3% | |||||
| 1,470,000 | China Life Insurance Co.* | 1,202,342 | |||
Finland - 1.3% | |||||
| 281,367 | Nokia Oyj | 4,865,710 | |||
France - 8.8% | |||||
| 134,836 | Aventis | 8,911,950 | |||
| 194,331 | Axa | 4,159,676 | |||
| 100,930 | France Telecom SA* | 2,884,801 | |||
| 42,775 | Lafarge SA | 3,809,170 | |||
| 73,535 | Total SA, Class B | 13,671,847 | |||
| 33,437,444 | |||||
Germany - 6.4% | |||||
| 110,295 | Bayer AG (a) | 3,178,906 | |||
| 148,590 | Bayerische Motoren Werke (BMW) AG (a) | 6,850,347 | |||
| 60,858 | Deutsche Bank AG | 4,882,142 | |||
| 151,624 | Veba AG | 9,583,584 | |||
| 24,494,979 | |||||
Hong Kong - 3.0% | |||||
| 445,000 | Cheung Kong Holdings, Ltd. | 3,539,434 | |||
| 1,063,500 | Johnson Electric Holdings, Ltd. | 1,356,156 | |||
| 948,000 | Li & Fung, Ltd. | 1,624,040 | |||
| 350,000 | Sun Hung Kai Properties, Ltd. | 2,896,530 | |||
| 343,000 | Swire Pacific, Ltd. | 2,116,248 | |||
| 11,532,408 | |||||
Ireland - 0.8% | |||||
| 144,600 | CRH, Plc | 2,963,857 | |||
Italy - 3.6% | |||||
| 411,610 | ENI SpA | 7,766,997 | |||
| 2,059,684 | Telecom Italia SpA* (a) | 6,105,259 | |||
| 13,872,256 | |||||
Japan - 14.6% | |||||
| 32,190 | Acom Co., Ltd. | 1,459,769 | |||
| 271,000 | Canon, Inc. | 12,618,177 | |||
| 46,000 | Fanuc, Ltd. | 2,755,622 | |||
| 177,800 | Honda Motor Co., Ltd. | 7,897,061 | |||
| 52,600 | Hoya Corp. | 4,829,560 | |||
| 347 | Mitsubishi Tokyo Financial Group, Inc. | $ | 2,706,840 | ||
| 1,684 | Nippon Telegraph & Telephone Corp. | 8,123,803 | |||
| 624 | NTT Mobile Communications Network, Inc. | 1,414,874 | |||
| 115,000 | Ricoh Co., Ltd. | 2,269,525 | |||
| 21,700 | Rohm Co., Ltd. | 2,543,174 | |||
| 102,000 | Shin-Etsu Chemical Co., Ltd. | 4,168,704 | |||
| 87,000 | Shionogi & Co., Ltd. | 1,620,342 | |||
| 81,400 | Takeda Chemical Industries, Ltd. | 3,228,049 | |||
| 55,635,500 | |||||
Netherlands - 9.3% | |||||
| 348,737 | ABN-Amro Holdings | 8,159,763 | |||
| 265,487 | Elsevier NV | 3,298,489 | |||
| 44,594 | Heineken NV | 1,698,147 | |||
| 408,180 | ING Groep NV | 9,519,722 | |||
| 241,671 | Koninklijke Ahold NV* | 1,841,186 | |||
| 233,669 | Koninklijke (Royal) Phillips Electronics NV | 6,823,194 | |||
| 99,070 | TNT Post Group NV | 2,320,543 | |||
| 54,793 | VNU NV | 1,731,284 | |||
| 35,392,328 | |||||
Singapore - 0.5% | |||||
| 263,000 | United Overseas Bank, Ltd. | 2,044,162 | |||
South Korea - 4.1% | |||||
| 76,390 | Korea Electric Power Corp. | 1,372,007 | |||
| 51,470 | Korea Telecom Corp. | 1,926,615 | |||
| 23,130 | POSCO | 3,164,238 | |||
| 23,776 | Samsung Electronics Co. | 8,999,560 | |||
| 15,462,420 | |||||
Spain - 3.6% | |||||
| 701,358 | Banco de Santander (a) | 8,306,938 | |||
| 376,328 | Telefonica SA | 5,525,291 | |||
| 13,832,229 | |||||
Switzerland - 12.2% | |||||
| 53,279 | Nestle SA | 13,311,673 | |||
| 172,885 | Novartis AG | 7,849,196 | |||
| 74,019 | Roche Holdings AG | 7,466,238 | |||
| 93,873 | Swiss Reinsurance Co. | 6,337,898 | |||
| 169,311 | UBS AG | 11,595,425 | |||
| 46,560,430 | |||||
United Kingdom - 25.9% | |||||
| 1,009,813 | Barclays, Plc | 9,006,949 | |||
| 280,814 | British American Tobacco Industries, Plc | 3,870,784 | |||
| 541,332 | BT Group, Plc | 1,824,266 | |||
| 472,874 | Cadbury Schweppes, Plc | 3,472,829 | |||
| 598,955 | Centrica, Plc | 2,262,383 | |||
| 521,906 | Compass Group, Plc, Sponsored ADR | 3,550,302 | |||
| 392,306 | Diageo, Plc | 5,161,806 | |||
| 321,822 | GlaxoSmithKline, Plc | 7,374,204 | |||
| 391,998 | HSBC Holdings Plc | 6,161,235 | |||
| 463,621 | Kingfisher Plc | 2,311,414 | |||
See Notes to Financial Statements.
F-6
Table of Contents
SELECT INTERNATIONAL EQUITY FUND
PORTFOLIO OF INVESTMENTS, Continued • December 31, 2003
| Shares | Value (Note 2) | ||||
United Kingdom (continued) | |||||
| 832,199 | Lloyds TSB Group, Plc | $ | 6,674,129 | ||
| 201,288 | Marks & Spencer Group, Plc | 1,041,370 | |||
| 419,479 | Prudential Corp., Plc | 3,546,268 | |||
| 195,246 | Reed Elsevier, Plc | 1,633,130 | |||
| 905,525 | Shell Transportation & Trading, Plc | 6,735,361 | |||
| 307,016 | Smith & Nephew, Plc | 2,579,020 | |||
| 113,625 | Smiths Group, Plc | 1,344,512 | |||
| 1,115,622 | Tesco, Plc | 5,147,604 | |||
| 33,230 | Travis Perkins, Plc | 760,240 | |||
| 782,932 | Unilever, Plc | 7,298,653 | |||
| 4,193,156 | Vodafone Airtouch, Plc | 10,396,334 | |||
| 284,577 | Wolseley, Plc | 4,024,541 | |||
| 230,887 | WPP Group, Plc | 2,267,073 | |||
| 98,444,407 | |||||
Total Common Stocks | 370,881,032 | ||||
(Cost $339,033,466) | |||||
| PREFERRED STOCKS - 0.1% | |||||
France - 0.1% | |||||
| 13,241 | AXA Preferred, Convertible | 267,057 | |||
Total Preferred Stocks | 267,057 | ||||
(Cost $197,489) | |||||
| RIGHTS - 0.0% | |||||
Thailand - 0.0% | |||||
| 100,421 | TelecomAsia Corp., Public Co., Ltd.* (b) | 0 | |||
United Kingdom - 0.0% | |||||
| 332,400 | Ti Automotive, Ltd.* (b) | 0 | |||
Total Rights | 0 | ||||
(Cost $68,642) | |||||
| Total Investments - 97.5% | 371,148,089 | ||||
| (Cost $339,299,597) | |||||
| Net Other Assets and Liabilities - 2.5% | 9,505,093 | ||||
| Total Net Assets - 100.0% | $ | 380,653,182 | |||
| * | Non-income producing security. |
| (a) | All or a portion of this security is out on loan at December 31, 2003; the value of the securities loaned amounted to $15,881,176. The value of collateral amounted to $16,782,106 which consisted of cash equivalents. |
| (b) | Contingent Value Obligation. |
| ADR | American Depositary Receipt. Shares of a foreign based corporation held in U.S. banks entitling the shareholder to all dividends and capital gains. |
FEDERAL INCOME TAX INFORMATION (SEE NOTE 2)
At December 31, 2003, the aggregate cost of investment securities for tax purposes was $353,385,154. Net unrealized appreciation (depreciation) aggregated $17,762,935, of which $39,444,590 related to appreciated investment securities and $(21,681,655) related to depreciated investment securities.
As of December 31, 2003, the components of distributable earnings (excluding unrealized appreciation disclosed above) on a tax basis consisted of $4,285,370 and $116,220,189 of undistributed ordinary income and capital loss carryforwards, respectively.
For the period ended December 31, 2003, the Portfolio has elected to defer $1,391,194 of capital losses attributable to Post-October losses.
During the period ended December 31, 2003, the tax character of distributions paid was as follows: ordinary income - $2,710,560.
At December 31, 2003, the Portfolio had capital loss carryforwards which expire as follows: $10,039,365 in 2008; $2,072,911 in 2009; $68,250,709 in 2010; $35,857,204 in 2011. Approximately $9,683,050, $2,072,911 and $2,072,911 which will expire in 2008, 2009 and 2010, respectively, was acquired in the merger and is available to offset future capital gains of the portfolio.
OTHER INFORMATION
For the year ended December 31, 2003, the aggregate cost of purchases and the proceeds of sales, other than from short-term investments, included $89,451,766 and $170,506,351 of non-governmental issuers, respectively.
FORWARD FOREIGN CURRENCY CONTRACTS SOLD:
Contracts To Deliver | Currency | Settlement Dates | Contracts At Value | In Exchange For U.S. $ | Unrealized Depreciation | |||||||||
524,539 | GBP | 01/05/04 | $ | 938,790 | $ | 929,903 | $ | (8,887 | ) | |||||
149,548 | EUR | 01/02/04 | 188,633 | 185,245 | (3,388 | ) | ||||||||
1,525,884 | EUR | 01/05/04 | 1,924,514 | 1,905,063 | (19,451 | ) | ||||||||
126,229 | EUR | 01/06/04 | 159,202 | 157,597 | (1,605 | ) | ||||||||
300,733 | EUR | 01/07/04 | 379,277 | 375,465 | (3,812 | ) | ||||||||
1,127,368 | CHF | 01/06/04 | 911,645 | 901,462 | (10,183 | ) | ||||||||
| $ | 4,502,061 | $ | 4,454,735 | $ | (47,326 | ) | ||||||||
| CHF | Swiss Franc |
| EUR | Euro Currency |
| GBP | British Pound Sterling |
See Notes to Financial Statements.
F-7
Table of Contents
SELECT INTERNATIONAL EQUITY FUND
PORTFOLIO OF INVESTMENTS, Continued • December 31, 2003
Industry Concentration of Investments as a Percentage of Net Assets (Unaudited): | |||
Advertising | 0.6 | % | |
Automotive | 3.9 | ||
Banking | 18.3 | ||
Beverages, Food & Tobacco | 9.1 | ||
Building Materials | 1.3 | ||
Chemicals | 1.9 | ||
Commercial Services | 0.9 | ||
Communications | 4.2 | ||
Computers & Information | 0.6 | ||
Electric Utilities | 2.9 | ||
Electrical Equipment | 0.9 | ||
Electronics | 9.2 | ||
Financial Services | 1.8 | ||
Food Retailers | 2.8 | ||
Heavy Machinery | 2.0 | ||
Insurance | 4.1 | ||
Media - Broadcasting & Publishing | 2.5 | ||
Medical Supplies | 1.9 | ||
Metals | 0.8 | ||
Miscellaneous | 0.4 | ||
Oil & Gas | 8.0 | ||
Pharmaceuticals | 9.6 | ||
Real Estate | 1.7 | ||
Retailers | 0.9 | ||
Telephone Systems | 7.2 | ||
Net Other Assets and Liabilities | 2.5 | ||
Total | 100.0 | % | |
See Notes to Financial Statements.
F-8
Table of Contents
SELECT GROWTH FUND
PORTFOLIO OF INVESTMENTS, • December 31, 2003
Shares | Value (Note 2) | ||||
COMMON STOCKS - 99.3% | |||||
Advertising - 0.1% | |||||
| 10,300 | Omnicom Group, Inc. (a) | $ | 899,499 | ||
Airlines - 0.0% | |||||
| 18,200 | Southwest Airlines, Inc. | 293,748 | |||
Apparel Retailers - 0.3% | |||||
| 18,100 | Chico’s FAS, Inc.* (a) | 668,795 | |||
| 24,300 | Kohls Corp.* | 1,092,042 | |||
| 5,000 | Timberland Co.* | 260,350 | |||
| 2,021,187 | |||||
Automotive - 0.5% | |||||
| 63,200 | Harley-Davidson, Inc. (a) | 3,003,896 | |||
Banking - 2.1% | |||||
| 71,400 | Capital One Financial Corp. (a) | 4,376,106 | |||
| 240,800 | MBNA Corp. | 5,983,880 | |||
| 32,600 | U.S. Bancorp | 970,828 | |||
| 13,200 | Wells Fargo & Co. | 777,348 | |||
| 12,300 | Zions Bancorp. | 754,359 | |||
| 12,862,521 | |||||
Beverages, Food & Tobacco - 3.3% | |||||
| 54,600 | Altria Group, Inc. | 2,971,332 | |||
| 68,100 | Anheuser-Busch Companies, Inc. | 3,587,508 | |||
| 44,800 | Coca-Cola Enterprises, Inc. | 979,776 | |||
| 106,000 | PepsiCo, Inc. | 4,941,720 | |||
| 5,000 | Performance Food Group Co.* (a) | 180,850 | |||
| 224,200 | Starbucks Corp.* | 7,412,052 | |||
| 14,200 | Sysco Corp. | 528,666 | |||
| 20,601,904 | |||||
Chemicals - 0.1% | |||||
| 7,200 | Sealed Air Corp.* | 389,808 | |||
Commercial Services - 1.4% | |||||
| 35,300 | Accenture, Ltd.* | 929,096 | |||
| 74,300 | Apollo Group, Inc.* | 5,052,400 | |||
| 14,300 | Automatic Data Processing, Inc. | 566,423 | |||
| 9,900 | Convergys Corp.* | 172,854 | |||
| 16,200 | Fair Isaac Corp. | 796,392 | |||
| 8,000 | Getty Images, Inc.* | 401,040 | |||
| 11,000 | Iron Mountain, Inc.* (a) | 434,940 | |||
| 14,800 | Paychex, Inc. | 550,560 | |||
| 8,903,705 | |||||
Communications - 1.7% | |||||
| 42,600 | Avaya, Inc.* | 551,244 | |||
| 44,800 | Ciena Corp.* | 297,472 | |||
| 37,800 | Echostar Communications Corp.* | 1,285,200 | |||
| 10,300 | L-3 Communications Holdings, Inc.* | 529,008 | |||
| 106,400 | Nokia Oyj Corp., Sponsored ADR | 1,808,800 | |||
| 108,200 | Qualcomm, Inc. (a) | 5,835,226 | |||
| 10,306,950 | |||||
Computer Software & Processing - 8.8% | |||||
| 27,400 | Adobe Systems, Inc. | $ | 1,076,820 | ||
| 14,800 | Affiliated Computer Services, Class A* (a) | 806,008 | |||
| 6,800 | Cognizant Technology Solutions Corp.* | 310,352 | |||
| 21,900 | Computer Associates International, Inc. (a) | 598,746 | |||
| 77,500 | Electronic Arts, Inc.* | 3,702,950 | |||
| 24,200 | Fiserv, Inc.* | 956,142 | |||
| 14,800 | GTECH Holdings Corp. | 732,452 | |||
| 13,100 | IMS Health, Inc. (a) | 325,666 | |||
| 16,300 | Macromedia, Inc.* | 290,792 | |||
| 7,100 | Mercury Interactive Corp.* | 345,344 | |||
| 913,600 | Microsoft Corp. | 25,160,544 | |||
| 95,600 | Oracle Corp.* | 1,261,920 | |||
| 113,000 | PeopleSoft, Inc.* | 2,576,400 | |||
| 13,800 | SanDisk Corp.* | 843,732 | |||
| 138,000 | SAP AG, Sponsored ADR | 5,735,280 | |||
| 25,400 | SunGard Data Systems, Inc.* | 703,834 | |||
| 114,000 | Symantec Corp.* (a) | 3,950,100 | |||
| 19,900 | VeriSign, Inc.* | 324,370 | |||
| 8,600 | VERITAS Software Corp.* | 319,576 | |||
| 105,100 | Yahoo!, Inc.* | 4,747,367 | |||
| 54,768,395 | |||||
Computers & Information - 9.4% | |||||
| 926,200 | Cisco Systems, Inc.* | 22,497,398 | |||
| 440,600 | Dell, Inc.* | 14,962,776 | |||
| 367,200 | EMC Corp.* | 4,744,224 | |||
| 138,900 | Hewlett-Packard Co. | 3,190,533 | |||
| 109,700 | International Business Machines Corp. | 10,166,996 | |||
| 5,400 | Lexar Media, Inc.* | 94,122 | |||
| 39,700 | Lexmark International Group, Inc.* | 3,122,008 | |||
| 58,778,057 | |||||
Cosmetics & Personal Care - 1.8% | |||||
| 48,600 | Avon Products, Inc. | 3,280,014 | |||
| 81,600 | Procter & Gamble Co. | 8,150,208 | |||
| 11,430,222 | |||||
Education - 0.4% | |||||
| 54,500 | Career Education Corp.* | 2,183,815 | |||
Electric Utilities - 0.4% | |||||
| 81,500 | Edison International* | 1,787,295 | |||
| 16,500 | Entergy Corp. | 942,645 | |||
| 2,729,940 | |||||
Electrical Equipment - 0.2% | |||||
| 66,900 | Xerox Corp. (a) | 923,220 | |||
Electronics - 10.2% | |||||
| 211,200 | Altera Corp.* (a) | 4,794,240 | |||
| 57,200 | Analog Devices, Inc. | 2,611,180 | |||
| 15,200 | Arrow Electronics, Inc.* | 351,728 | |||
| 914,300 | Intel Corp. | 29,440,460 | |||
| 11,800 | Intersil Corp., Class A* | 293,230 | |||
| 11,400 | Jabil Circuit, Inc.* | 322,620 | |||
See Notes to Financial Statements.
F-9
Table of Contents
SELECT GROWTH FUND
PORTFOLIO OF INVESTMENTS, Continued • December 31, 2003
Shares | Value (Note 2) | ||||
| Electronics (continued) | |||||
| 101,400 | KLA-Tencor Corp.* | $ | 5,949,138 | ||
| 49,100 | Lam Research Corp.* (a) | 1,585,930 | |||
| 17,800 | Linear Technology Corp. | 748,846 | |||
| 32,200 | LSI Logic Corp.* | 285,614 | |||
| 31,900 | Marvell Technology Group, Ltd.* | 1,209,967 | |||
| 50,000 | Motorola, Inc. | 703,500 | |||
| 7,400 | Novellus Systems, Inc.* | 311,170 | |||
| 40,600 | PMC-Sierra, Inc.* (a) | 818,090 | |||
| 35,300 | QLogic Corp.* | 1,821,480 | |||
| 437,200 | Texas Instruments, Inc. | 12,844,936 | |||
| 64,092,129 | |||||
Entertainment & Leisure - 0.3% | |||||
| 21,600 | Harrah’s Entertainment, Inc.* | 1,075,032 | |||
| 11,200 | Mattel, Inc. | 215,824 | |||
| 21,400 | Walt Disney Co. | 499,262 | |||
| 1,790,118 | |||||
Financial Services - 5.4% | |||||
| 181,100 | American Express Co. (a) | 8,734,453 | |||
| 61,000 | Charles Schwab Corp. | 722,240 | |||
| 219,400 | Citigroup, Inc. | 10,649,676 | |||
| 15,750 | Doral Financial Corp. | 508,410 | |||
| 67,100 | Fannie Mae | 5,036,526 | |||
| 29,300 | Freddie Mac | 1,708,776 | |||
| 6,200 | H&R Block, Inc. (a) | 343,294 | |||
| 9,200 | SEI Investment Co. | 280,324 | |||
| 109,600 | State Street Corp. (a) | 5,707,968 | |||
| 33,691,667 | |||||
Food Retailers - 0.7% | |||||
| 33,800 | Kroger Co.* | 625,638 | |||
| 52,800 | Whole Foods Market, Inc.* (a) | 3,544,464 | |||
| 4,170,102 | |||||
Health Care Providers - 1.2% | |||||
| 85,600 | Caremax Rx, Inc.* (a) | 2,168,248 | |||
| 5,900 | Community Health Systems, Inc.* | 156,822 | |||
| 40,000 | Coventry Health Care, Inc.* (a) | 2,579,600 | |||
| 4,100 | Express Scripts, Inc.* | 272,363 | |||
| 22,900 | Health Management Associates, Inc., Class A | 549,600 | |||
| 10,700 | Manor Care, Inc. (a) | 369,899 | |||
| 11,800 | Universal Health Services, Inc.* (a) | 633,896 | |||
| 8,000 | Wellpoint Health Networks, Inc.* | 775,920 | |||
| 7,506,348 | |||||
Heavy Machinery - 1.0% | |||||
| 186,500 | Applied Materials, Inc.* | 4,186,925 | |||
| 12,400 | Harris Corp., Inc. | 470,580 | |||
| 18,900 | United Technologies Corp. | 1,791,153 | |||
| 6,448,658 | |||||
Home Construction, | |||||
Furnishings & | |||||
Appliances - 1.0% | |||||
| 22,000 | D.R. Horton, Inc. | $ | 951,720 | ||
| 10,600 | Harman International Industries, Inc. | 784,188 | |||
| 16,100 | Lennar Corp. (a) | 1,545,600 | |||
| 37,100 | Masco Corp. | 1,016,911 | |||
| 23,900 | Whirlpool Corp. | 1,736,335 | |||
| 6,034,754 | |||||
Industrial - Diversified - 5.0% | |||||
| 92,700 | 3M Co. | 7,882,281 | |||
| 759,600 | General Electric Co. | 23,532,408 | |||
| 31,414,689 | |||||
Insurance - 2.2% | |||||
| 142,200 | American International Group, Inc. | 9,425,016 | |||
| 2,700 | Anthem, Inc.* | 202,500 | |||
| 14,500 | Fidelity National Financial, Inc. | 562,310 | |||
| 21,300 | Medco Health Solutions, Inc.* | 723,987 | |||
| 5,900 | Mid Atlantic Medical Services, Inc.* | 382,320 | |||
| 37,100 | UnitedHealth Group, Inc. | 2,158,478 | |||
| 5,200 | Wellchoice, Inc.* | 179,400 | |||
| 13,634,011 | |||||
Lodging - 0.3% | |||||
| 41,100 | Marriott International, Inc., Class A | 1,898,820 | |||
Media - Broadcasting & | |||||
Publishing - 3.9% | |||||
| 73,500 | Clear Channel Communications, Inc.* | 3,442,005 | |||
| 10,300 | Comcast Corp., Class A* | 338,561 | |||
| 60,300 | Comcast Corp., Special Class A* | 1,886,184 | |||
| 18,200 | Fox Entertainment Group, Class A* | 530,530 | |||
| 126,034 | Hughes Electronics Corp.* | 2,085,863 | |||
| 102,300 | Liberty Media Group, Class A* | 1,216,347 | |||
| 36,300 | Time Warner, Inc.* | 653,037 | |||
| 130,800 | Univision Communications, Inc.* | 5,191,452 | |||
| 205,900 | Viacom, Inc., Class B* | 9,137,842 | |||
| 24,481,821 | |||||
Medical Supplies - 4.0% | |||||
| 212,000 | Agilent Technologies, Inc.* | 6,198,880 | |||
| 69,900 | Allergan, Inc. (a) | 5,369,019 | |||
| 4,800 | Beckman Coulter, Inc. | 243,984 | |||
| 32,400 | Boston Scientific Corp.* | 1,191,024 | |||
| 8,300 | Fisher Scientific International, Inc.* | 343,371 | |||
| 31,300 | Guidant Corp. | 1,884,260 | |||
| 147,700 | Medtronic, Inc. | 7,179,697 | |||
| 12,500 | Patterson Dental Co. (a) | 802,000 | |||
| 11,100 | Schein (Henry), Inc.* | 750,138 | |||
| 5,300 | St. Jude Medical, Inc.* | 325,155 | |||
| 14,100 | Steris Corp.* | 318,660 | |||
| 8,000 | Varian Medical Systems, Inc.* | 552,800 | |||
| 25,158,988 | |||||
See Notes to Financial Statements.
F-10
Table of Contents
SELECT GROWTH FUND
PORTFOLIO OF INVESTMENTS, Continued • December 31, 2003
Shares | Value (Note 2) | ||||
Metals - 0.3% | |||||
| 49,600 | Freeport-McMoRan Copper & Gold, Inc., Class B* (a) | $ | 2,089,648 | ||
| Oil & Gas - 2.7% | |||||
| 85,900 | BJ Services Co.* | 3,083,810 | |||
| 10,400 | Burlington Resources, Inc. | 575,952 | |||
| 16,200 | GlobalSantaFe Corp. (a) | 402,246 | |||
| 121,300 | Schlumberger, Ltd. | 6,637,536 | |||
| 70,100 | Total SA, Sponsored ADR | 6,484,951 | |||
| 17,184,495 | |||||
Pharmaceuticals - 15.0% | |||||
| 89,200 | Abbott Laboratories | 4,156,720 | |||
| 15,800 | Alcon, Inc. | 956,532 | |||
| 16,400 | AmerisourceBergen Corp. (a) | 920,860 | |||
| 240,100 | Amgen, Inc.* | 14,838,180 | |||
| 13,700 | Amylin Pharmaceuticals, Inc. (a) | 304,414 | |||
| 78,800 | AstraZeneca Plc, ADR (a) | 3,812,344 | |||
| 5,600 | Barr Laboratories, Inc.* (a) | 430,920 | |||
| 10,100 | Biogen Idec, Inc.* | 371,478 | |||
| 35,700 | Cardinal Health, Inc. (a) | 2,183,412 | |||
| 57,000 | Forest Laboratories, Inc.* | 3,522,600 | |||
| 78,800 | Genentech, Inc.* | 7,373,316 | |||
| 19,700 | Genzyme Corp.* | 971,998 | |||
| 84,000 | Gilead Sciences, Inc.* | 4,883,760 | |||
| 161,100 | Johnson & Johnson | 8,322,426 | |||
| 4,200 | McKesson Corp. | 135,072 | |||
| 77,700 | Medimmune, Inc.* | 1,973,580 | |||
| 31,400 | Merck & Co., Inc. | 1,450,680 | |||
| 82,800 | Novartis AG, Sponsored ADR | 3,799,692 | |||
| 637,540 | Pfizer, Inc. | 22,524,288 | |||
| 30,200 | Roche Holding AG, Sponsored ADR | 3,046,250 | |||
| 82,400 | Teva Pharmaceutical Industries, Ltd., Sponsored ADR | 4,672,904 | |||
| 74,300 | Wyeth Corp. | 3,154,035 | |||
| 93,805,461 | |||||
Rental and Leasing Services - 0.1% | |||||
| 12,450 | Rent-A-Center, Inc.* | 372,006 | |||
Restaurants - 0.8% | |||||
| 6,200 | CBRL Group, Inc. | 237,212 | |||
| 158,000 | McDonald’s Corp. | 3,923,140 | |||
| 19,000 | Yum! Brands, Inc.* | 653,600 | |||
| 4,813,952 | |||||
Retailers - 11.0% | |||||
| 21,800 | Advanced Auto Parts, Inc.* | 1,774,520 | |||
| 19,600 | AutoZone, Inc.* | 1,670,116 | |||
| 210,900 | Bed Bath & Beyond, Inc.* | 9,142,515 | |||
| 37,900 | Best Buy Co., Inc. | 1,979,896 | |||
| 8,700 | CarMax, Inc.* (a) | 269,091 | |||
| 85,100 | Costco Wholesale Corp.* | 3,164,018 | |||
| 66,300 | eBay, Inc.* | 4,282,317 | |||
| 18,600 | Family Dollar Stores, Inc. | 667,368 | |||
| 10,100 | Federated Department Stores, Inc. | 476,013 | |||
| 138,100 | Home Depot, Inc. | 4,901,169 | |||
| 103,800 | InterActiveCorp* (a) | 3,521,934 | |||
| 165,100 | Lowes Cos., Inc. | $ | 9,144,889 | ||
| 6,600 | Michaels Stores, Inc. | 291,720 | |||
| 12,100 | Petsmart, Inc. | 287,980 | |||
| 86,300 | Staples, Inc.* | 2,355,990 | |||
| 146,600 | Tiffany & Co. | 6,626,320 | |||
| 103,200 | TJX Cos., Inc. | 2,275,560 | |||
| 294,100 | Wal-Mart Stores, Inc. | 15,602,005 | |||
| 11,300 | Williams-Sonoma, Inc.* | 392,901 | |||
| 68,826,322 | |||||
Securities Broker - 2.0% | |||||
| 61,700 | Goldman Sachs and Co. | 6,091,641 | |||
| 110,200 | Merrill Lynch & Co., Inc. | 6,463,230 | |||
| 12,554,871 | |||||
Telephone Systems - 1.1% | |||||
| 31,400 | BellSouth Corp. | 888,620 | |||
| 39,800 | CenturyTel, Inc. | 1,298,276 | |||
| 26,600 | Sprint Corp. | 436,772 | |||
| 175,700 | Vodafone Group, Plc, Sponsored ADR | 4,399,528 | |||
| 7,023,196 | |||||
Textiles, Clothing & Fabrics - 0.2% | |||||
| 10,000 | Liz Claiborne, Inc. | 354,600 | |||
| 26,800 | Reebok International, Ltd.* (a) | 1,053,776 | |||
| 1,408,376 | |||||
Transportation - 0.4% | |||||
| 58,800 | Royal Caribbean Cruises, Ltd. (a) | 2,045,652 | |||
| 8,400 | United Parcel Service, Class B | 626,220 | |||
| 2,671,872 | |||||
Total Common Stocks | 621,169,171 | ||||
(Cost $527,651,432) | |||||
| INVESTMENT COMPANY - 0.0% | |||||
| 10,060 | Marshall Money Market Fund | 10,060 | |||
Total Investment Company | 10,060 | ||||
(Cost $10,060) | |||||
| Total Investments - 99.3% | 621,179,231 | ||||
| (Cost $527,661,492) | |||||
| Net Other Assets and Liabilities - 0.7% | 4,549,289 | ||||
| Total Net Assets - 100.0% | $ | 625,728,520 | |||
| * | Non-income producing security. |
| (a) | All or a portion of this security is out on loan at December 31, 2003; the value of the securities loaned amounted to $43,278,521. The value of collateral amounted to $44,740,809 which consisted of cash equivalents. |
ADR American Depositary Receipt. Shares of a foreign based corporation held in U.S. banks entitling the shareholder to all dividends and capital gains.
See Notes to Financial Statements.
F-11
Table of Contents
SELECT GROWTH FUND
PORTFOLIO OF INVESTMENTS, Continued • December 31, 2003
FEDERAL INCOME TAX INFORMATION (SEE NOTE 2)
At December 31, 2003, the aggregate cost of investment securities for tax purposes was $550,197,376. Net unrealized appreciation (depreciation) aggregated $70,981,855, of which $77,087,262 related to appreciated investment securities and $(6,105,407) related to depreciated investment securities.
As of December 31, 2003, the components of distributable earnings (excluding unrealized appreciation disclosed above) on a tax basis consisted of $359,099,178 of capital loss carryforwards.
For the period ended December 31, 2003, the Portfolio has elected to defer $298,418 of capital losses attributable to Post-October losses.
During the year ended December 31, 2003, the tax character of distributions paid for ordinary income was $247,303.
At December 31, 2003, the Portfolio had capital loss carryforwards which expire as follows: $59,668,098 in 2008; $153,581,116 in 2009; $92,315,074 in 2010; $53,534,890 in 2011. Approximately $59,668,098, $12,676,866 and $12,676,866 which will expire in 2008, 2009 and 2010, respectively, was acquired in the mergers and is available to offset future capital gains of the portfolio.
OTHER INFORMATION
For the year ended December 31, 2003, the aggregate cost of purchases and the proceeds of sales, other than from short-term investments, included $397,035,787 and $563,161,037 of non-governmental issuers, respectively.
Written Options Rollforward
| Puts | Calls | |||||||||||||
Principal Amount of Contracts (000’s omitted) | Premiums | Principal Amount of Contracts (000’s omitted) | Premiums | |||||||||||
Outstanding, beginning of period | $ | — | $ | — | $ | — | $ | — | ||||||
Options written | — | — | 170 | 1,700 | ||||||||||
Options closed | — | — | (170 | ) | (1,700 | ) | ||||||||
Outstanding, end of period | $ | — | $ | — | $ | — | $ | — | ||||||
See Notes to Financial Statements.
F-12
Table of Contents
CORE EQUITY FUND
PORTFOLIO OF INVESTMENTS • December 31, 2003
| Shares | Value (Note 2) | ||||
| COMMON STOCKS - 96.2% | |||||
Advertising - 0.4% | |||||
| 42,500 | Lamar Advertising Co.* | $ | 1,586,100 | ||
Aerospace & Defense - 0.5% | |||||
| 49,100 | Boeing Co. | 2,069,074 | |||
Airlines - 0.2% | |||||
| 73,800 | Delta Air Lines, Inc. (a) | 871,578 | |||
Banking - 6.7% | |||||
| 21,000 | Bank of America Corp. | 1,689,030 | |||
| 44,400 | FleetBoston Financial Corp. (a) | 1,938,060 | |||
| 11,700 | Golden West Financial Corp. | 1,207,323 | |||
| 88,550 | Greenpoint Financial Corp. | 3,127,586 | |||
| 112,300 | MBNA Corp. | 2,790,655 | |||
| 128,300 | Mellon Financial Corp. | 4,119,713 | |||
| 65,100 | PNC Bank Corp. | 3,562,923 | |||
| 142,200 | Wells Fargo & Co. | 8,374,158 | |||
| 26,809,448 | |||||
Beverages, Food & Tobacco - 2.9% | |||||
| 23,500 | Coca-Cola Co. | 1,192,625 | |||
| 140,500 | PepsiCo, Inc. | 6,550,110 | |||
| 65,600 | Wrigley (Wm.) Jr. Co. (a) | 3,687,376 | |||
| 11,430,111 | |||||
Building Materials - 1.0% | |||||
| 81,700 | Martin Marietta Materials, Inc. | 3,837,449 | |||
Commercial Services - 4.9% | |||||
| 241,900 | Cendant Corp.* | 5,387,113 | |||
| 234,500 | First Data Corp. (a) | 9,635,605 | |||
| 33,100 | Moody’s Corp. | 2,004,205 | |||
| 11,600 | Quest Diagnostics, Inc.* | 848,076 | |||
| 52,800 | Valassis Communications, Inc.* (a) | 1,549,680 | |||
| 19,424,679 | |||||
Communications - 4.7% | |||||
| 84,700 | Echostar Communications Corp.* | 2,879,800 | |||
| 320,900 | Nextel Communications, Inc., Class A* | 9,004,454 | |||
| 129,300 | Qualcomm, Inc. (a) | 6,973,149 | |||
| 18,857,403 | |||||
Computer Software & Processing - 3.0% | |||||
| 43,700 | Intuit, Inc.* | 2,312,167 | |||
| 345,400 | Microsoft Corp. | 9,512,316 | |||
| 11,824,483 | |||||
Computers & Information - 4.0% | |||||
| 303,500 | Cisco Systems, Inc.* | 7,372,015 | |||
| 145,900 | Dell, Inc.* | 4,954,764 | |||
| 146,600 | EMC Corp.* | 1,894,072 | |||
| 76,100 | Hewlett-Packard Co. | 1,748,017 | |||
| 15,968,868 | |||||
Cosmetics & Personal Care - 1.4% | |||||
| 17,700 | Avon Products, Inc. | 1,194,573 | |||
| 44,400 | Colgate-Palmolive Co. | 2,222,220 | |||
| 20,200 | Procter & Gamble Co. | 2,017,576 | |||
| 5,434,369 | |||||
Electric Utilities - 3.7% | |||||
| 35,600 | American Electric Power, Inc. | $ | 1,086,156 | ||
| 105,500 | CMS Energy Corp.* (a) | 898,860 | |||
| 49,900 | Exelon Corp. | 3,311,364 | |||
| 108,000 | FirstEnergy Corp. | 3,801,600 | |||
| 44,000 | Progress Energy, Inc. | 1,991,440 | |||
| 80,400 | Sempra Energy | 2,416,824 | |||
| 49,300 | TXU Corp. | 1,169,396 | |||
| 14,675,640 | |||||
Electronics - 3.3% | |||||
| 27,100 | Energizer Holdings, Inc.* | 1,017,876 | |||
| 269,600 | Intel Corp. | 8,681,120 | |||
| 119,100 | Texas Instruments, Inc. | 3,499,158 | |||
| 13,198,154 | |||||
Entertainment & Leisure - 1.0% | |||||
| 62,500 | Harrah’s Entertainment, Inc. | 3,110,625 | |||
| 48,364 | Metro-Goldwyn-Mayer, Inc. (a) | 826,541 | |||
| 3,937,166 | |||||
Financial Services - 11.2% | |||||
| 429,200 | Charles Schwab Corp. | 5,081,728 | |||
| 235,382 | Citigroup, Inc. | 11,425,442 | |||
| 95,800 | Fannie Mae | 7,190,748 | |||
| 219,000 | Freddie Mac | 12,772,080 | |||
| 199,600 | Morgan (J.P.) & Co., Inc. | 7,331,308 | |||
| 21,800 | State Street Corp. | 1,135,344 | |||
| 44,936,650 | |||||
Food Retailers - 0.4% | |||||
| 70,100 | Albertson’s, Inc. (a) | 1,587,765 | |||
Forest Products & Paper - 1.1% | |||||
| 38,400 | Kimberly-Clark Corp. | 2,269,056 | |||
| 68,900 | MeadWestvaco Corp. | 2,049,775 | |||
| 4,318,831 | |||||
Health Care Providers - 0.4% | |||||
| 71,700 | Caremax Rx, Inc.* (a) | 1,816,161 | |||
Heavy Machinery - 1.0% | |||||
| 57,000 | Pentair, Inc. | 2,604,900 | |||
| 15,800 | United Technologies Corp. | 1,497,366 | |||
| 4,102,266 | |||||
Home Construction, Furnishings & Appliances - 1.6% | |||||
| 20,300 | Johnson Controls, Inc. | 2,357,236 | |||
| 146,200 | Masco Corp. | 4,007,342 | |||
| 6,364,578 | |||||
Household Products - 0.1% | |||||
| 25,600 | Newell Rubbermaid, Inc. (a) | 582,912 | |||
Industrial - Diversified - 1.6% | |||||
| 33,100 | General Electric Co. | 1,025,438 | |||
| 65,700 | Illinois Tool Works, Inc. | 5,512,887 | |||
| 6,538,325 | |||||
See Notes to Financial Statements.
F-13
Table of Contents
CORE EQUITY FUND
PORTFOLIO OF INVESTMENTS, Continued • December 31, 2003
| Shares | Value (Note 2) | ||||
Insurance - 4.5% | |||||
| 43,600 | AFLAC, Inc. | $ | 1,577,448 | ||
| 26,900 | AMBAC Financial Group, Inc. | 1,866,591 | |||
| 56,200 | American International Group, Inc. | 3,724,936 | |||
| 21,500 | Anthem, Inc.* (a) | 1,612,500 | |||
| 51,400 | Hartford Financial Services Group, Inc. | 3,034,142 | |||
| 107,100 | UnitedHealth Group, Inc. (a) | 6,231,078 | |||
| 18,046,695 | |||||
Lodging - 0.8% | |||||
| 42,300 | Marriott International, Inc., Class A | 1,954,260 | |||
| 35,700 | Starwood Hotels & Resorts Worldwide, Inc. | 1,284,129 | |||
| 3,238,389 | |||||
Media - Broadcasting & Publishing - 10.8% | |||||
| 121,700 | Clear Channel Communications, Inc. | 5,699,211 | |||
| 44,900 | Cox Communications, Inc.* (a) | 1,546,805 | |||
| 38,700 | Gannett Co., Inc. | 3,450,492 | |||
| 358,300 | Liberty Media Group, Class A* | 4,260,187 | |||
| 82,100 | McGraw-Hill Cos., Inc. | 5,740,432 | |||
| 410,400 | Time Warner, Inc.* | 7,383,096 | |||
| 160,930 | Univision Communications, Inc.* | 6,387,312 | |||
| 199,900 | Viacom, Inc., Class B | 8,871,562 | |||
| 43,339,097 | |||||
Medical Supplies - 0.3% | |||||
| 40,300 | Baxter International, Inc. | 1,229,956 | |||
Oil & Gas - 4.3% | |||||
| 31,200 | Anadarko Petroleum Corp. | 1,591,512 | |||
| 89,256 | ConocoPhillips | 5,852,516 | |||
| 238,100 | Exxon Mobil Corp. | 9,762,100 | |||
| 17,206,128 | |||||
Pharmaceuticals - 9.6% | |||||
| 29,000 | Amgen, Inc.* | 1,792,200 | |||
| 158,900 | Bristol-Myers Squibb Co. | 4,544,540 | |||
| 42,700 | Cephalon, Inc.* (a) | 2,067,107 | |||
| 97,900 | Johnson & Johnson | 5,057,514 | |||
| 70,400 | Lilly (Eli) & Co. | 4,951,232 | |||
| 251,900 | Pfizer, Inc. | 8,899,627 | |||
| 259,300 | Wyeth Corp. | 11,007,285 | |||
| 38,319,505 | |||||
Retailers - 4.1% | |||||
| 55,300 | Costco Wholesale Corp.* (a) | 2,056,054 | |||
| 28,000 | Dollar Tree Stores, Inc.* | 841,680 | |||
| 31,700 | eBay, Inc.* | 2,047,503 | |||
| 85,100 | Family Dollar Stores, Inc. | 3,053,388 | |||
| 30,100 | Lowes Cos., Inc. | 1,667,239 | |||
| 128,300 | Wal-Mart Stores, Inc. | 6,806,315 | |||
| 16,472,179 | |||||
Securities Broker - 2.0% | |||||
| 138,500 | Morgan Stanley Dean Witter & Co. | $ | 8,014,995 | ||
Telephone Systems - 2.3% | |||||
| 101,500 | BellSouth Corp. | 2,872,450 | |||
| 165,600 | Crown Castle International Corp.* (a) | 1,826,568 | |||
| 166,800 | SBC Communications, Inc. | 4,348,476 | |||
| 9,047,494 | |||||
Transportation - 2.4% | |||||
| 106,600 | Burlington Northern Santa Fe Corp. | 3,448,510 | |||
| 172,800 | Norfolk Southern Corp. | 4,086,720 | |||
| 91,800 | Sabre Group Holdings, Inc. (a) | 1,981,962 | |||
| 9,517,192 | |||||
Total Common Stocks | 384,603,640 | ||||
(Cost $352,906,321) | |||||
| EXCHANGE-TRADED FUND - 2.5% | |||||
| 90,600 | SPDR Trust Series 1 | 10,082,874 | |||
Total Exchange-Traded Fund | 10,082,874 | ||||
(Cost $9,699,256) | |||||
| Total Investments - 98.7% | 394,686,514 | ||||
| (Cost $362,605,577) | |||||
| Net Other Assets and Liabilities - 1.3% | 5,330,143 | ||||
| Total Net Assets - 100.0% | $ | 400,016,657 | |||
| * | Non-income producing security. |
| (a) | All or a portion of this security is out on loan at December 31, 2003; the value of the securities loaned amounted to $25,403,868. The value of collateral amounted to $26,531,428 which consisted of cash equivalents. |
See Notes to Financial Statements.
F-14
Table of Contents
CORE EQUITY FUND
PORTFOLIO OF INVESTMENTS, Continued • December 31, 2003
FEDERAL INCOME TAX INFORMATION (SEE NOTE 2)
At December 31, 2003, the aggregate cost of investment securities for tax purposes was $372,984,291. Net unrealized appreciation (depreciation) aggregated $21,702,223, of which $36,755,870 related to appreciated investment securities and $(15,053,647) related to depreciated investment securities.
As of December 31, 2003, the components of distributable earnings (excluding unrealized appreciation disclosed above) on a tax basis consisted of $74,214 and $238,786,571 of undistributed ordinary income and capital loss carryforwards, respectively.
For the period ended December 31, 2003, the Portfolio has elected to defer $1,156,054 of capital losses attributable to Post-October losses.
During the year ended December 31, 2003, the tax character of distributions paid for ordinary income was $3,286,534.
At December 31, 2003, the Portfolio had capital loss carryforwards which expire as follows: $118,562,752 in 2009; $88,482,233 in 2010; $31,741,586 in 2011.
OTHER INFORMATION
For the year ended December 31, 2003, the aggregate cost of purchases and the proceeds of sales, other than from short-term investments, included $103,136,794 and $193,673,492 of non-governmental issuers, respectively.
See Notes to Financial Statements.
F-15
Table of Contents
EQUITY INDEX FUND
PORTFOLIO OF INVESTMENTS • December 31, 2003
| Shares | Value (Note 2) | ||||
| COMMON STOCKS - 98.9% | |||||
Advertising - 0.2% | |||||
| 26,500 | Interpublic Group of Companies, Inc.* (a) | $ | 413,400 | ||
| 7,200 | Monster Worldwide, Inc.* (a) | 158,112 | |||
| 12,200 | Omnicom Group, Inc. | 1,065,426 | |||
| 1,636,938 | |||||
Aerospace & Defense - 1.4% | |||||
| 53,938 | Boeing Co. | 2,272,947 | |||
| 12,700 | General Dynamics Corp. | 1,147,953 | |||
| 55,175 | Honeywell International, Inc. | 1,844,500 | |||
| 28,882 | Lockheed Martin Corp. | 1,484,535 | |||
| 11,746 | Northrop Grumman Corp. (a) | 1,122,918 | |||
| 26,600 | Raytheon Co. | 799,064 | |||
| 8,700 | Textron, Inc. | 496,422 | |||
| 9,168,339 | |||||
Airlines - 0.3% | |||||
| 7,900 | Delta Air Lines, Inc. (a) | 93,299 | |||
| 19,100 | FedEx Corp. | 1,289,250 | |||
| 50,418 | Southwest Airlines, Inc. | 813,747 | |||
| 2,196,296 | |||||
Apparel Retailers - 0.5% | |||||
| 57,350 | Gap, Inc. (a) | 1,331,093 | |||
| 21,800 | Kohls Corp.* | 979,692 | |||
| 33,100 | Limited Brands, Inc. | 596,793 | |||
| 8,800 | Nordstrom, Inc. (a) | 301,840 | |||
| 3,209,418 | |||||
Automotive - 1.2% | |||||
| 17,600 | AutoNation, Inc.* | 323,312 | |||
| 4,700 | Cooper Tire & Rubber Co. | 100,486 | |||
| 9,509 | Dana Corp. | 174,490 | |||
| 35,828 | Delphi Automotive Systems Corp. | 365,804 | |||
| 117,281 | Ford Motor Co. (a) | 1,876,496 | |||
| 35,900 | General Motors Corp. | 1,917,060 | |||
| 11,150 | Genuine Parts Co. | 370,180 | |||
| 7,500 | Goodrich (B.F.) Co. | 222,675 | |||
| 11,200 | Goodyear Tire & Rubber Co.* (a) | 88,032 | |||
| 19,400 | Harley-Davidson, Inc. (a) | 922,082 | |||
| 5,900 | ITT Industries, Inc. | 437,839 | |||
| 4,400 | Navistar International Corp.* (a) | 210,716 | |||
| 7,520 | Paccar, Inc. | 640,102 | |||
| 8,336 | Visteon Corp. | 86,778 | |||
| 7,736,052 | |||||
Banking - 7.7% | |||||
| 22,400 | Amsouth Bancorp | 548,800 | |||
| 71,575 | Banc One Corp. | 3,263,104 | |||
| 95,159 | Bank of America Corp. | 7,653,638 | |||
| 49,500 | Bank of New York Co., Inc. | 1,639,440 | |||
| 35,000 | BB&T Corp. | 1,352,400 | |||
| 14,837 | Capital One Financial Corp. (a) | 909,360 | |||
| 14,275 | Charter One Financial, Inc. | 493,201 | |||
| 11,250 | Comerica, Inc. (a) | $ | 630,675 | ||
| 36,505 | Fifth Third Bancorp | 2,157,445 | |||
| 8,000 | First Tennessee National Corp. (a) | 352,800 | |||
| 67,552 | FleetBoston Financial Corp. | 2,948,645 | |||
| 9,800 | Golden West Financial Corp. | 1,011,262 | |||
| 14,649 | Huntington Bancshares, Inc. | 329,602 | |||
| 26,800 | KeyCorp | 785,776 | |||
| 14,500 | Marshall & Ilsley Corp. | 554,625 | |||
| 81,777 | MBNA Corp. | 2,032,158 | |||
| 27,500 | Mellon Financial Corp. | 883,025 | |||
| 38,900 | National City Corp. | 1,320,266 | |||
| 9,700 | North Fork Bancorp., Inc. | 392,559 | |||
| 14,100 | Northern Trust Corp. | 654,522 | |||
| 17,800 | PNC Bank Corp. | 974,194 | |||
| 14,200 | Regions Financial Corp. | 528,240 | |||
| 21,200 | Southtrust Corp. | 693,876 | |||
| 18,100 | Suntrust Banks, Inc. | 1,294,150 | |||
| 19,300 | Synovus Financial Corp. | 558,156 | |||
| 123,534 | U.S. Bancorp | 3,678,843 | |||
| 12,100 | Union Planters Corp. | 381,029 | |||
| 84,796 | Wachovia Corp. | 3,950,646 | |||
| 57,574 | Washington Mutual, Inc. | 2,309,869 | |||
| 108,430 | Wells Fargo & Co. | 6,385,443 | |||
| 5,800 | Zions Bancorp. | 355,714 | |||
| 51,023,463 | |||||
Beverages, Food & Tobacco - 5.3% | |||||
| 2,300 | Adolph Coors Co. | 129,030 | |||
| 130,100 | Altria Group, Inc. | 7,080,042 | |||
| 52,200 | Anheuser-Busch Companies, Inc. | 2,749,896 | |||
| 41,349 | Archer-Daniels-Midland Co. | 629,332 | |||
| 3,900 | Brown Forman Corp., Class B | 364,455 | |||
| 26,300 | Campbell Soup Co. | 704,840 | |||
| 157,100 | Coca-Cola Co. | 7,972,825 | |||
| 29,100 | Coca-Cola Enterprises, Inc. | 636,417 | |||
| 34,400 | Conagra, Inc. | 907,816 | |||
| 23,900 | General Mills, Inc. (a) | 1,082,670 | |||
| 22,500 | H.J. Heinz Co. | 819,675 | |||
| 7,100 | Hercules, Inc.* | 86,620 | |||
| 8,400 | Hershey Foods Corp. | 646,716 | |||
| 26,100 | Kellogg Co. | 993,888 | |||
| 8,900 | McCormick & Co., Inc. | 267,890 | |||
| 16,800 | Pepsi Bottling Group, Inc. | 406,224 | |||
| 110,010 | PepsiCo, Inc. | 5,128,666 | |||
| 5,400 | R.J. Reynolds Tobacco Holdings, Inc. | 314,010 | |||
| 28,300 | Safeway, Inc.* | 620,053 | |||
| 25,000 | Starbucks Corp.* | 826,500 | |||
| 8,600 | Supervalu, Inc. | 245,874 | |||
| 41,400 | Sysco Corp. | 1,541,322 | |||
| 10,600 | UST, Inc. | 378,314 | |||
| 14,400 | Wrigley (Wm.) Jr. Co. (a) | 809,424 | |||
| 35,342,499 | |||||
Building Materials - 0.1% | |||||
| 6,500 | Vulcan Materials Co. | 309,205 | |||
See Notes to Financial Statements.
F-16
Table of Contents
EQUITY INDEX FUND
PORTFOLIO OF INVESTMENTS, Continued • December 31, 2003
| Shares | Value (Note 2) | ||||
Chemicals - 1.5% | |||||
| 14,600 | Air Products & Chemicals, Inc. | $ | 771,318 | ||
| 7,100 | Avery Dennison Corp. | 397,742 | |||
| 58,977 | Dow Chemical Co. | 2,451,674 | |||
| 63,900 | Du Pont (E.I.) De Nemours and Co. | 2,932,371 | |||
| 4,900 | Eastman Chemical Co. | 193,697 | |||
| 3,200 | Great Lakes Chemical Corp. (a) | 87,008 | |||
| 6,000 | International Flavors & Fragrances, Inc. | 209,520 | |||
| 16,727 | Monsanto Co. | 481,403 | |||
| 10,900 | PPG Industries, Inc. | 697,818 | |||
| 20,800 | Praxair, Inc. | 794,560 | |||
| 14,275 | Rohm & Haas Co. | 609,685 | |||
| 5,408 | Sealed Air Corp.* | 292,789 | |||
| 9,300 | Sherwin Williams Co. | 323,082 | |||
| 10,242,667 | |||||
Commercial Services - 2.0% | |||||
| 20,500 | Allied Waste Industries, Inc.* (a) | 284,540 | |||
| 11,300 | Apollo Group, Inc.* | 768,400 | |||
| 38,100 | Automatic Data Processing, Inc. | 1,509,141 | |||
| 64,833 | Cendant Corp.* | 1,443,831 | |||
| 10,900 | Cintas Corp. (a) | 546,417 | |||
| 29,700 | Concord EFS, Inc.* | 440,748 | |||
| 9,100 | Convergys Corp.* | 158,886 | |||
| 3,200 | Deluxe Corp. (a) | 132,256 | |||
| 16,500 | Ecolab, Inc. | 451,605 | |||
| 8,900 | Equifax, Inc. | 218,050 | |||
| 46,700 | First Data Corp. | 1,918,903 | |||
| 5,200 | Fluor Corp. | 206,128 | |||
| 28,000 | Halliburton Co. | 728,000 | |||
| 3,100 | Millipore Corp.* | 133,455 | |||
| 9,500 | Moody’s Corp. | 575,225 | |||
| 24,150 | Paychex, Inc. | 898,380 | |||
| 8,100 | Perkinelmer, Inc. | 138,267 | |||
| 15,000 | Pitney Bowes, Inc. | 609,300 | |||
| 6,700 | Quest Diagnostics, Inc.* | 489,837 | |||
| 7,300 | R. R. Donnelley & Sons Co. (a) | 220,095 | |||
| 10,900 | Robert Half International, Inc.* | 254,406 | |||
| 37,335 | Waste Management, Inc. | 1,105,116 | |||
| 13,230,986 | |||||
Communications - 1.2% | |||||
| 51,500 | ADC Telecommunications, Inc.* | 152,955 | |||
| 9,800 | Andrew Corp.* | 112,798 | |||
| 26,631 | Avaya, Inc.* | 344,605 | |||
| 30,300 | Ciena Corp.* (a) | 201,192 | |||
| 85,100 | Corning, Inc.* (a) | 887,593 | |||
| 268,582 | Lucent Technologies, Inc.* (a) | 762,773 | |||
| 70,400 | Nextel Communications, Inc., Class A* | 1,975,424 | |||
| 51,300 | Qualcomm, Inc. (a) | 2,766,609 | |||
| 11,300 | Rockwell Collins, Inc. | 339,339 | |||
| 9,700 | Scientific Atlanta, Inc. | 264,810 | |||
| 26,700 | Tellabs, Inc.* | 225,081 | |||
| 8,033,179 | |||||
Computer Software & Processing - 5.6% | |||||
| 15,000 | Adobe Systems, Inc. | 589,499 | |||
| 7,100 | Autodesk, Inc. | $ | 174,518 | ||
| 14,400 | BMC Software, Inc.* | 268,560 | |||
| 10,500 | Citrix Systems, Inc.* | 222,705 | |||
| 37,050 | Computer Associates International, Inc. (a) | 1,012,947 | |||
| 12,000 | Computer Sciences Corp.* | 530,760 | |||
| 24,600 | Compuware Corp.* | 148,584 | |||
| 19,100 | Electronic Arts, Inc.* | 912,598 | |||
| 30,700 | Electronic Data Systems Corp. (a) | 753,378 | |||
| 12,450 | Fiserv, Inc.* | 491,900 | |||
| 15,300 | IMS Health, Inc. | 380,358 | |||
| 12,700 | Intuit, Inc.* | 671,957 | |||
| 5,800 | Mercury Interactive Corp.* (a) | 282,112 | |||
| 692,700 | Microsoft Corp. (a) | 19,076,958 | |||
| 6,100 | NCR Corp.* | 236,680 | |||
| 23,900 | Novell, Inc.* | 251,428 | |||
| 10,300 | NVIDIA Corp.* (a) | 239,475 | |||
| 334,820 | Oracle Corp.* | 4,419,624 | |||
| 17,000 | Parametric Technology Corp.* | 66,980 | |||
| 24,000 | PeopleSoft, Inc.* | 547,200 | |||
| 31,700 | Siebel Systems, Inc.* | 439,679 | |||
| 209,200 | Sun Microsystems, Inc.* | 939,308 | |||
| 18,400 | SunGard Data Systems, Inc.* | 509,864 | |||
| 19,700 | Symantec Corp.* | 682,605 | |||
| 21,100 | Unisys Corp.* | 313,335 | |||
| 27,419 | VERITAS Software Corp.* | 1,018,890 | |||
| 42,100 | Yahoo!, Inc.* | 1,901,657 | |||
| 37,083,559 | |||||
Computers & Information - 5.3% | |||||
| 23,200 | Apple Computer, Inc.* | 495,784 | |||
| 442,200 | Cisco Systems, Inc.* | 10,741,038 | |||
| 12,300 | Comverse Technology, Inc.* | 216,357 | |||
| 164,000 | Dell, Inc.* | 5,569,440 | |||
| 153,900 | EMC Corp.* | 1,988,388 | |||
| 20,760 | Gateway, Inc.* | 95,496 | |||
| 195,298 | Hewlett-Packard Co. | 4,485,995 | |||
| 110,200 | International Business Machines Corp. | 10,213,336 | |||
| 8,300 | Lexmark International Group, Inc.* | 652,712 | |||
| 22,100 | Network Appliance, Inc.* (a) | 453,713 | |||
| 53,500 | Solectron Corp.* | 316,185 | |||
| 14,700 | Symbol Technologies, Inc. | 248,283 | |||
| 35,476,727 | |||||
Consumer Products - Diversified - 0.2% | |||||
| 50,600 | Sara Lee Corp. | 1,098,526 | |||
Containers & Packaging - 0.0% | |||||
| 3,600 | Ball Corp. | 214,452 | |||
Cosmetics & Personal Care - 2.1% | |||||
| 3,800 | Alberto-Culver Co., Class B | 239,704 | |||
| 15,200 | Avon Products, Inc. | 1,025,848 | |||
| 34,400 | Colgate-Palmolive Co. | 1,721,720 | |||
| 64,800 | Gillette Co. | 2,380,104 | |||
| 83,100 | Procter & Gamble Co. | 8,300,028 | |||
| 13,667,404 | |||||
See Notes to Financial Statements.
F-17
Table of Contents
EQUITY INDEX FUND
PORTFOLIO OF INVESTMENTS, Continued • December 31, 2003
| Shares | Value (Note 2) | ||||
Electric Utilities - 2.6% | |||||
| 39,800 | AES Corp.* | $ | 375,712 | ||
| 8,100 | Allegheny Energy, Inc.* (a) | 103,356 | |||
| 10,400 | Ameren Corp. | 478,400 | |||
| 25,240 | American Electric Power, Inc. | 770,072 | |||
| 26,400 | Calpine Corp.* (a) | 126,984 | |||
| 19,598 | CenterPoint Energy, Inc. | 189,905 | |||
| 11,443 | Cinergy Corp. | 444,103 | |||
| 18,200 | Citizens Utilities Co., Class B* | 226,044 | |||
| 10,300 | CMS Energy Corp.* | 87,756 | |||
| 14,400 | Consolidated Edison, Inc. | 619,344 | |||
| 10,750 | Constellation Energy Group, Inc. | 420,970 | |||
| 20,750 | Dominion Resources, Inc. | 1,324,473 | |||
| 10,800 | DTE Energy Co. (a) | 425,520 | |||
| 58,134 | Duke Energy Corp. | 1,188,840 | |||
| 20,800 | Edison International* | 456,144 | |||
| 14,700 | Entergy Corp. | 839,811 | |||
| 20,950 | Exelon Corp. | 1,390,242 | |||
| 21,100 | FirstEnergy Corp. | 742,720 | |||
| 11,800 | Florida Power & Light Group Capital, Inc. | 771,956 | |||
| 10,200 | KeySpan Energy Corp. | 375,360 | |||
| 16,800 | NiSource, Inc. | 368,592 | |||
| 26,500 | PG&E Corp.* (a) | 735,905 | |||
| 5,800 | Pinnacle West Capital Corp. | 232,116 | |||
| 11,400 | PPL Corp. | 498,750 | |||
| 15,677 | Progress Energy, Inc. | 709,541 | |||
| 15,100 | Public Service Enterprise Group, Inc. | 661,380 | |||
| 14,513 | Sempra Energy | 436,261 | |||
| 46,900 | Southern Co. | 1,418,725 | |||
| 12,000 | TECO Energy, Inc. (a) | 172,920 | |||
| 20,740 | TXU Corp. | 491,953 | |||
| 25,510 | Xcel Energy, Inc. | 433,160 | |||
| 17,517,015 | |||||
Electrical Equipment - 0.6% | |||||
| 12,700 | American Power Conversion Corp. | 310,515 | |||
| 6,000 | Cooper Industries, Ltd. | 347,580 | |||
| 18,300 | Eastman Kodak Co. (a) | 469,761 | |||
| 27,000 | Emerson Electric Co. | 1,748,250 | |||
| 11,900 | Rockwell International Corp. | 423,640 | |||
| 3,700 | Thomas & Betts Corp. | 84,693 | |||
| 50,700 | Xerox Corp.* (a) | 699,660 | |||
| 4,084,099 | |||||
Electronics - 4.3% | |||||
| 22,300 | Advanced Micro Devices* (a) | 332,270 | |||
| 24,200 | Altera Corp.* (a) | 549,340 | |||
| 23,500 | Analog Devices, Inc. | 1,072,775 | |||
| 19,600 | Applied Micro Circuits Corp.* | 117,208 | |||
| 19,400 | Broadcom Corp.* | 661,346 | |||
| 418,400 | Intel Corp. | 13,472,480 | |||
| 12,800 | Jabil Circuit, Inc.* | 362,240 | |||
| 12,500 | KLA-Tencor Corp.* (a) | 733,375 | |||
| 20,000 | Linear Technology Corp. | 841,400 | |||
| 24,200 | LSI Logic Corp.* | 214,654 | |||
| 21,100 | Maxim Integrated Products, Inc. | 1,050,780 | |||
| 39,100 | Micron Technology, Inc.* (a) | 526,677 | |||
| 12,225 | Molex, Inc. | $ | 426,530 | ||
| 149,035 | Motorola, Inc. | 2,096,922 | |||
| 11,900 | National Semiconductor Corp.* | 468,979 | |||
| 9,800 | Novellus Systems, Inc.* | 412,090 | |||
| 11,000 | PMC-Sierra, Inc.* (a) | 221,650 | |||
| 5,300 | Power-One, Inc.* | 57,399 | |||
| 6,100 | QLogic Corp.* | 314,760 | |||
| 33,100 | Sanmina Corp.* (a) | 417,391 | |||
| 12,200 | Teradyne, Inc.* | 310,490 | |||
| 110,800 | Texas Instruments, Inc. | 3,255,304 | |||
| 21,900 | Xilinx, Inc.* | 848,406 | |||
| 28,764,466 | |||||
Entertainment & Leisure - 0.7% | |||||
| 7,100 | Harrah’s Entertainment, Inc. | 353,367 | |||
| 11,150 | Hasbro, Inc. | 237,272 | |||
| 22,200 | International Game Technology | 792,540 | |||
| 27,512 | Mattel, Inc. | 530,156 | |||
| 131,029 | Walt Disney Co. | 3,056,907 | |||
| 4,970,242 | |||||
Financial Services - 6.1% | |||||
| 82,400 | American Express Co. | 3,974,152 | |||
| 86,900 | Charles Schwab Corp. | 1,028,896 | |||
| 330,540 | Citigroup, Inc. | 16,044,412 | |||
| 11,833 | Countrywide Financial Corp. | 897,558 | |||
| 62,300 | Fannie Mae | 4,676,238 | |||
| 6,900 | Federated Investors, Inc., Class B | 202,584 | |||
| 16,130 | Franklin Resources, Inc. | 839,728 | |||
| 44,600 | Freddie Mac | 2,601,072 | |||
| 11,400 | H&R Block, Inc. | 631,218 | |||
| 15,400 | Janus Capital Group, Inc. | 252,714 | |||
| 130,718 | Morgan (J.P.) & Co., Inc. | 4,801,272 | |||
| 20,700 | Principal Financial Group, Inc. | 684,549 | |||
| 18,500 | Providian Financial Corp.* | 215,340 | |||
| 34,600 | Prudential Financial, Inc. | 1,445,242 | |||
| 28,871 | SLM Corp. | 1,087,859 | |||
| 21,400 | State Street Corp. | 1,114,512 | |||
| 8,000 | T. Rowe Price Group, Inc. | 379,280 | |||
| 40,876,626 | |||||
Food Retailers - 0.2% | |||||
| 23,442 | Albertson’s, Inc. (a) | 530,961 | |||
| 47,700 | Kroger Co.* | 882,927 | |||
| 9,000 | Winn-Dixie Stores, Inc. (a) | 89,550 | |||
| 1,503,438 | |||||
Forest Products & Paper - 0.9% | |||||
| 3,400 | Bemis Co. | 170,000 | |||
| 5,500 | Boise Cascade Corp. | 180,730 | |||
| 16,302 | Georgia-Pacific Corp. (a) | 499,982 | |||
| 30,740 | International Paper Co. | 1,325,201 | |||
| 32,340 | Kimberly-Clark Corp. | 1,910,971 | |||
| 6,700 | Louisiana Pacific Corp.* | 119,796 | |||
| 12,798 | MeadWestvaco Corp. | 380,741 | |||
See Notes to Financial Statements.
F-18
Table of Contents
EQUITY INDEX FUND
PORTFOLIO OF INVESTMENTS, Continued • December 31, 2003
| Shares | Value (Note 2) | ||||
Forest Products & Paper (continued) | |||||
| 10,000 | Pactiv Corp.* | $ | 239,000 | ||
| 3,500 | Temple Inland, Inc. | 219,345 | |||
| 14,100 | Weyerhaeuser Co. | 902,400 | |||
| 5,948,166 | |||||
Health Care Providers - 0.6% | |||||
| 5,000 | Express Scripts, Inc.* | 332,150 | |||
| 31,700 | HCA - The Healthcare Corporation | 1,361,832 | |||
| 15,300 | Health Management Associates, Inc., Class A (a) | 367,200 | |||
| 5,700 | Manor Care, Inc. (a) | 197,049 | |||
| 29,750 | Tenet Healthcare Corp.* | 477,488 | |||
| 9,800 | Wellpoint Health Networks, Inc.* | 950,502 | |||
| 3,686,221 | |||||
Heavy Machinery - 1.8% | |||||
| 4,700 | American Standard Companies, Inc.* | 473,290 | |||
| 106,500 | Applied Materials, Inc.* | 2,390,925 | |||
| 21,480 | Baker Hughes, Inc. | 690,797 | |||
| 22,300 | Caterpillar, Inc. | 1,851,346 | |||
| 2,700 | Cummins Engine Co., Inc. | 132,138 | |||
| 15,400 | Deere & Co. | 1,001,770 | |||
| 13,000 | Dover Corp. | 516,750 | |||
| 11,100 | Ingersoll-Rand Co. (a) | 753,468 | |||
| 8,000 | Pall Corp. | 214,640 | |||
| 7,575 | Parker-Hannifin Corp. | 450,713 | |||
| 5,200 | Stanley Works | 196,924 | |||
| 30,200 | United Technologies Corp. | 2,862,054 | |||
| 5,800 | W.W. Grainger, Inc. | 274,862 | |||
| 11,809,677 | |||||
Home Construction, Furnishings & Appliances - 0.5% | |||||
| 5,000 | Black & Decker Corp. | 246,600 | |||
| 4,000 | Centex Corp. (a) | 430,600 | |||
| 5,800 | Johnson Controls, Inc. | 673,496 | |||
| 3,000 | KB Home (a) | 217,560 | |||
| 12,200 | Leggett & Platt, Inc. | 263,886 | |||
| 29,600 | Masco Corp. | 811,336 | |||
| 5,000 | Maytag Corp. | 139,250 | |||
| 4,000 | Pulte Corp. | 374,480 | |||
| 4,500 | Whirlpool Corp. | 326,925 | |||
| 3,484,133 | |||||
Household Products - 0.3% | |||||
| 13,500 | Clorox Co. | 655,560 | |||
| 9,400 | Fortune Brands, Inc. | 672,006 | |||
| 17,533 | Newell Rubbermaid, Inc. (a) | 399,226 | |||
| 3,700 | Snap-On, Inc. | 119,288 | |||
| 3,700 | Tupperware Corp. | 64,158 | |||
| 1,910,238 | |||||
Industrial - Diversified - 4.4% | |||||
| 50,300 | 3M Co. | 4,277,009 | |||
| 643,200 | General Electric Co. | 19,926,336 | |||
| 19,800 | Illinois Tool Works, Inc. (a) | 1,661,418 | |||
| 128,037 | Tyco International, Ltd. | 3,392,981 | |||
| 29,257,744 | |||||
Insurance - 5.1% | |||||
| 17,900 | ACE, Ltd. | $ | 741,418 | ||
| 9,798 | Aetna, Inc. | 662,149 | |||
| 32,800 | AFLAC, Inc. | 1,186,704 | |||
| 45,038 | Allstate Corp. | 1,937,535 | |||
| 6,900 | AMBAC Financial Group, Inc. | 478,791 | |||
| 167,079 | American International Group, Inc. | 11,073,996 | |||
| 8,900 | Anthem, Inc.* (a) | 667,500 | |||
| 20,050 | AON Corp. | 479,997 | |||
| 12,000 | Chubb Corp. | 817,200 | |||
| 9,000 | Cigna Corp. | 517,500 | |||
| 10,300 | Cincinnati Financial Corp. | 431,364 | |||
| 18,100 | Hartford Financial Services Group, Inc. | 1,068,443 | |||
| 10,300 | Humana, Inc.* | 235,355 | |||
| 9,000 | Jefferson Pilot Corp. | 455,850 | |||
| 18,500 | John Hancock Financial Services, Inc. | 693,750 | |||
| 11,400 | Lincoln National Corp. | 460,218 | |||
| 11,900 | Loews Corp. | 588,455 | |||
| 34,000 | Marsh & McLennan Cos., Inc. | 1,628,260 | |||
| 9,250 | MBIA, Inc. | 547,878 | |||
| 17,300 | Medco Health Solutions, Inc.* | 588,027 | |||
| 48,700 | Metlife, Inc. | 1,639,729 | |||
| 6,300 | MGIC Investment Corp. | 358,722 | |||
| 13,900 | Progressive Corp. | 1,161,901 | |||
| 8,900 | SAFECO Corp. | 346,477 | |||
| 14,600 | St. Paul Cos. (a) | 578,890 | |||
| 7,300 | Torchmark Corp. | 332,442 | |||
| 64,361 | Travelers Property Casualty Corp., Class B | 1,092,206 | |||
| 37,600 | UnitedHealth Group, Inc. | 2,187,568 | |||
| 18,918 | UnumProvident Corp. (a) | 298,337 | |||
| 8,800 | XL Capital, Ltd., Class A (a) | 682,440 | |||
| 33,939,102 | |||||
Lodging - 0.2% | |||||
| 24,300 | Hilton Hotels Corp. | 416,259 | |||
| 14,800 | Marriott International, Inc., Class A | 683,760 | |||
| 12,900 | Starwood Hotels & Resorts Worldwide, Inc. | 464,013 | |||
| 1,564,032 | |||||
Media - Broadcasting & Publishing - 3.4% | |||||
| 4,200 | American Greetings Corp., Class A* | 91,854 | |||
| 39,400 | Clear Channel Communications, Inc. | 1,845,102 | |||
| 144,178 | Comcast Corp., Class A* | 4,739,131 | |||
| 5,200 | Dow Jones & Company, Inc. | 259,220 | |||
| 17,400 | Gannett Co., Inc. | 1,551,384 | |||
| 5,100 | Knight-Ridder, Inc. | 394,587 | |||
| 12,300 | McGraw-Hill Cos., Inc. | 860,016 | |||
| 3,200 | Meredith Corp. | 156,192 | |||
| 9,500 | New York Times Co., Class A | 454,005 | |||
| 289,598 | Time Warner, Inc.* | 5,209,868 | |||
| 19,987 | Tribune Co. | 1,031,329 | |||
| 20,700 | Univision Communications, Inc.* | 821,583 | |||
| 112,028 | Viacom, Inc., Class B | 4,971,803 | |||
| 22,386,074 | |||||
Medical Supplies - 2.5% | |||||
| 30,424 | Agilent Technologies, Inc.* | 889,598 | |||
See Notes to Financial Statements.
F-19
Table of Contents
EQUITY INDEX FUND
PORTFOLIO OF INVESTMENTS, Continued • December 31, 2003
| Shares | Value (Note 2) | ||||
Medical Supplies (continued) | |||||
| 8,400 | Allergan, Inc. (a) | $ | 645,204 | ||
| 13,300 | Applied Biosystems Group - Applera Corp. | 275,443 | |||
| 3,400 | Bausch & Lomb, Inc. | 176,460 | |||
| 39,100 | Baxter International, Inc. | 1,193,332 | |||
| 16,300 | Becton, Dickinson & Co. | 670,582 | |||
| 16,325 | Biomet, Inc. | 594,393 | |||
| 52,500 | Boston Scientific Corp.* | 1,929,900 | |||
| 3,300 | C.R. Bard, Inc. | 268,125 | |||
| 9,900 | Danaher Corp. (a) | 908,325 | |||
| 4,900 | Eaton Corp. | 529,102 | |||
| 19,900 | Guidant Corp. | 1,197,980 | |||
| 91,900 | JDS Uniphase Corp.* | 335,435 | |||
| 77,700 | Medtronic, Inc. | 3,776,997 | |||
| 11,100 | St. Jude Medical, Inc.* | 680,985 | |||
| 12,800 | Stryker Corp. | 1,088,128 | |||
| 5,400 | Tektronix, Inc. | 170,640 | |||
| 10,400 | Thermo Electron Corp.* | 262,080 | |||
| 7,800 | Waters Corp.* | 258,648 | |||
| 15,470 | Zimmer Holdings, Inc.* | 1,089,088 | |||
| 16,940,445 | |||||
Metals - 0.8% | |||||
| 55,408 | Alcoa, Inc. | 2,105,504 | |||
| 5,151 | Allegheny Technologies, Inc. | 68,096 | |||
| 3,750 | Crane Co. | 115,275 | |||
| 8,050 | Engelhard Corp. | 241,098 | |||
| 11,700 | Freeport-McMoRan Copper & Gold, Inc., Class B (a) | 492,921 | |||
| 27,711 | Newmont Mining Corp. | 1,347,032 | |||
| 5,000 | Nucor Corp. | 280,000 | |||
| 5,700 | Phelps Dodge Corp.* | 433,713 | |||
| 6,620 | United States Steel Corp. (a) | 231,832 | |||
| 5,500 | Worthington Industries, Inc. | 99,165 | |||
| 5,414,636 | |||||
Oil & Gas - 5.7% | |||||
| 5,800 | Amerada Hess Corp. | 308,386 | |||
| 16,079 | Anadarko Petroleum Corp. | 820,190 | |||
| 10,400 | Apache Corp. (a) | 843,440 | |||
| 4,400 | Ashland, Inc. | 193,864 | |||
| 10,100 | BJ Services Co.* | 362,590 | |||
| 12,782 | Burlington Resources, Inc. | 707,867 | |||
| 68,536 | ChevronTexaco Corp. | 5,920,825 | |||
| 43,595 | ConocoPhillips | 2,858,524 | |||
| 14,900 | Devon Energy Corp. | 853,174 | |||
| 24,100 | Dynegy, Inc.* | 103,148 | |||
| 38,930 | El Paso Energy Corp. (a) | 318,837 | |||
| 7,400 | EOG Resources, Inc. | 341,658 | |||
| 423,460 | Exxon Mobil Corp. | 17,361,860 | |||
| 6,481 | Kerr-McGee Corp. | 301,302 | |||
| 7,900 | Kinder Morgan, Inc. | 466,890 | |||
| 19,900 | Marathon Oil Corp. | 658,491 | |||
| 9,400 | Nabors Industries, Ltd.* | 390,100 | |||
| 2,800 | Nicor, Inc. | 95,312 | |||
| 8,600 | Noble Corp.* | 307,708 | |||
| 24,700 | Occidental Petroleum Corp. | 1,043,328 | |||
| 2,400 | Peoples Energy Corp. | 100,896 | |||
| 6,000 | Rowan Cos., Inc.* (a) | $ | 139,020 | ||
| 37,500 | Schlumberger, Ltd. | 2,052,000 | |||
| 5,000 | Sunoco, Inc. | 255,750 | |||
| 20,427 | Transocean Sedco Forex, Inc.* | 490,452 | |||
| 16,600 | Unocal Corp. | 611,378 | |||
| 33,100 | Williams Cos., Inc. | 325,042 | |||
| 38,232,032 | |||||
Pharmaceuticals - 9.7% | |||||
| 100,200 | Abbott Laboratories | 4,669,320 | |||
| 7,200 | AmerisourceBergen Corp. (a) | 404,280 | |||
| 82,608 | Amgen, Inc.* | 5,105,174 | |||
| 20,985 | Biogen Idec, Inc.* | 771,828 | |||
| 124,200 | Bristol-Myers Squibb Co. | 3,552,120 | |||
| 27,800 | Cardinal Health, Inc. (a) | 1,700,248 | |||
| 12,000 | Chiron Corp.* | 683,880 | |||
| 23,400 | Forest Laboratories, Inc.* | 1,446,120 | |||
| 14,400 | Genzyme Corp.* | 710,496 | |||
| 190,160 | Johnson & Johnson | 9,823,666 | |||
| 15,366 | King Pharmaceuticals, Inc.* | 234,485 | |||
| 72,000 | Lilly (Eli) & Co. | 5,063,760 | |||
| 18,614 | McKesson Corp. | 598,626 | |||
| 15,800 | Medimmune, Inc.* | 401,320 | |||
| 142,500 | Merck & Co., Inc. | 6,583,500 | |||
| 488,884 | Pfizer, Inc. | 17,272,272 | |||
| 94,100 | Schering-Plough Corp. | 1,636,399 | |||
| 4,500 | Sigma Aldrich Corp. (a) | 257,310 | |||
| 6,900 | Watson Pharmaceuticals, Inc.* (a) | 317,400 | |||
| 85,300 | Wyeth Corp. | 3,620,985 | |||
| 64,853,189 | |||||
Real Estate Investment Trust - 0.4% | |||||
| 6,000 | Apartment Investment & Management Co., REIT | 207,000 | |||
| 25,600 | Equity Office Properties Trust, REIT | 733,440 | |||
| 17,600 | Equity Residential Properties Trust, REIT | 519,376 | |||
| 11,700 | Plum Creek Timber Co., Inc., REIT | 356,265 | |||
| 11,500 | ProLogis Trust, REIT | 369,035 | |||
| 12,300 | Simon Property Group, Inc., REIT | 569,982 | |||
| 2,755,098 | |||||
Restaurants - 0.5% | |||||
| 10,500 | Darden Restaurants, Inc. (a) | 220,920 | |||
| 81,300 | McDonald’s Corp. | 2,018,679 | |||
| 7,300 | Wendy’s International, Inc. | 286,452 | |||
| 18,820 | Yum! Brands, Inc.* | 647,408 | |||
| 3,173,459 | |||||
Retailers - 6.1% | |||||
| 5,700 | AutoZone, Inc.* | 485,697 | |||
| 19,000 | Bed Bath & Beyond, Inc.* | 823,650 | |||
| 20,700 | Best Buy Co., Inc. | 1,081,368 | |||
| 7,400 | Big Lots, Inc.* | 105,154 | |||
| 13,400 | Circuit City Stores, Inc. | 135,742 | |||
| 29,312 | Costco Wholesale Corp.* | 1,089,820 | |||
| 25,300 | CVS Corp. | 913,836 | |||
See Notes to Financial Statements.
F-20
Table of Contents
EQUITY INDEX FUND
PORTFOLIO OF INVESTMENTS, Continued • December 31, 2003
| Shares | Value (Note 2) | ||||
Retailers (continued) | |||||
| 5,300 | Dillards, Inc., Class A | $ | 87,238 | ||
| 21,587 | Dollar General Corp. | 453,111 | |||
| 41,400 | eBay, Inc.* | 2,674,026 | |||
| 11,000 | Family Dollar Stores, Inc. | 394,680 | |||
| 11,600 | Federated Department Stores, Inc. | 546,708 | |||
| 145,697 | Home Depot, Inc. | 5,170,787 | |||
| 17,500 | J.C. Penney Co., Inc. (a) | 459,900 | |||
| 50,400 | Lowes Cos., Inc. | 2,791,656 | |||
| 18,500 | May Department Stores Co. (a) | 537,795 | |||
| 20,000 | Office Depot, Inc.* (a) | 334,200 | |||
| 10,500 | RadioShack Corp. | 322,140 | |||
| 16,300 | Sears Roebuck & Co. (a) | 741,487 | |||
| 31,700 | Staples, Inc.* (a) | 865,410 | |||
| 58,400 | Target Corp. | 2,242,560 | |||
| 9,400 | Tiffany & Co. | 424,880 | |||
| 32,200 | TJX Cos., Inc. | 710,010 | |||
| 13,600 | Toys “R” Us, Inc.* | 171,904 | |||
| 65,700 | Walgreen Co. | 2,390,166 | |||
| 277,300 | Wal-Mart Stores, Inc. | 14,710,765 | |||
| 40,664,690 | |||||
Securities Broker - 1.9% | |||||
| 6,252 | Bear Stearns Cos., Inc. | 499,847 | |||
| 30,400 | Goldman Sachs and Co. | 3,001,392 | |||
| 17,400 | Lehman Brothers Holdings, Inc. | 1,343,628 | |||
| 60,600 | Merrill Lynch & Co., Inc. | 3,554,190 | |||
| 69,434 | Morgan Stanley Dean Witter & Co. (a) | 4,018,146 | |||
| 12,417,203 | |||||
Telephone Systems - 3.1% | |||||
| 20,000 | Alltel Corp. | 931,600 | |||
| 50,548 | AT&T Corp. (a) | 1,026,124 | |||
| 173,855 | AT&T Wireless Services, Inc.* (a) | 1,389,101 | |||
| 118,400 | BellSouth Corp. | 3,350,720 | |||
| 9,200 | CenturyTel, Inc. | 300,104 | |||
| 113,263 | Qwest Communications International, Inc.* | 489,296 | |||
| 212,098 | SBC Communications, Inc. | 5,529,395 | |||
| 57,900 | Sprint Corp. | 950,718 | |||
| 66,300 | Sprint Corp. (PCS Group)* (a) | 372,606 | |||
| 176,930 | Verizon Communications, Inc. | 6,206,704 | |||
| 20,546,368 | |||||
Textiles, Clothing & Fabrics - 0.3% | |||||
| 8,100 | Jones Apparel Group, Inc. | 285,363 | |||
| 7,000 | Liz Claiborne, Inc. | 248,220 | |||
| 16,800 | Nike, Inc., Class B | 1,150,128 | |||
| 3,800 | Reebok International, Ltd. | 149,416 | |||
| 6,900 | V.F. Corp. (a) | 298,356 | |||
| 2,131,483 | |||||
Transportation - 1.6% | |||||
| 5,800 | Brunswick Corp. | 184,614 | |||
| 23,752 | Burlington Northern Santa Fe Corp. | 768,377 | |||
| 40,300 | Carnival Corp. | 1,601,119 | |||
| 13,700 | CSX Corp. | 492,378 | |||
| 25,000 | Norfolk Southern Corp. | $ | 591,250 | ||
| 4,100 | Ryder System, Inc. | 140,015 | |||
| 9,108 | Sabre Group Holdings, Inc. (a) | 196,642 | |||
| 16,400 | Union Pacific Corp. | 1,139,472 | |||
| 72,000 | United Parcel Service, Class B | 5,367,600 | |||
| 10,481,467 | |||||
Total Common Stocks | 658,981,053 | ||||
(Cost $638,364,361) | |||||
| Par Value | |||||
| U.S. GOVERNMENT OBLIGATIONS - 0.2% | |||||
U.S. Treasury Bill - 0.1% | |||||
| $1,100,000 | 0.98%, 03/18/04 (b) (c) | 1,097,694 | |||
U.S. Treasury Note - 0.1% | |||||
| 475,000 | 3.00%, 02/29/04 | 476,670 | |||
Total U.S. Government Obligations | 1,574,364 | ||||
(Cost $1,574,195) | |||||
| Shares | |||||
| INVESTMENT COMPANY - 0.2% | |||||
| 1,193,679 | Marshall Money Market Fund | 1,193,679 | |||
Total Investment Company | 1,193,679 | ||||
(Cost $1,193,679) | |||||
| Total Investments - 99.3% | 661,749,096 | ||||
| (Cost $641,132,235) | |||||
| Net Other Assets and Liabilities - 0.7% | 4,705,777 | ||||
| Total Net Assets - 100.0% | $ | 666,454,873 | |||
| * | Non-income producing security. |
| (a) | All or a portion of this security is out on loan at December 31, 2003; the value of the securities loaned amounted to $32,368,656. The value of collateral amounted to $33,724,811 which consisted of cash equivalents. |
| (b) | Security has been deposited as initial margin on futures contracts. At December 31, 2003, the Portfolio’s open futures contracts were as follows: |
Number of Contracts Purchased | Contract Type | Expiration Date | Aggregate Cost | Market Value at December 31, 2003 | ||||||
23 | S&P 500 | March-2004 | $ | 6,318,841 | $ | 6,385,951 | ||||
Number of Contracts Sold | Contract Type | Expiration Date | Aggregate Cost | Market Value at December 31, 2003 | ||||||
3 | S&P 500 | March-2004 | $ | 820,477 | $ | 832,950 | ||||
| (c) | Effective yield at time of purchase. |
REIT Real Estate Investment Trust
See Notes to Financial Statements.
F-21
Table of Contents
EQUITY INDEX FUND
PORTFOLIO OF INVESTMENTS, Continued • December 31, 2003
FEDERAL INCOME TAX INFORMATION (SEE NOTE 2)
At December 31, 2003, the aggregate cost of investment securities for tax purposes was $670,269,689. Net unrealized appreciation (depreciation) aggregated $(8,520,593), of which $50,907,281 related to appreciated investment securities and $(59,427,874) related to depreciated investment securities.
As of December 31, 2003 , the components of distributable earnings (excluding unrealized depreciation disclosed above) on a tax basis consisted of $236,944 and $124,004,952 of undistributed ordinary income and capital loss carryforwards, respectively.
At December 31, 2003 there was no unrealized appreciation or depreciation for tax purposes on futures contracts.
For the period ended December 31, 2003, the Portfolio has elected to defer $626,339 and $944 of capital losses and currency losses attributable to Post-October losses, respectively.
During the period ended December 31, 2003, the tax character of distributions paid was as follows: ordinary income - $7,143,778.
At December 31, 2003, the Portfolio had a capital loss carryforward which expire as follows: $13,389,716 in 2007; $62,715,062 in 2008; $13,380,657 in 2009; $17,675,562 in 2010; $16,843,955 in 2011. Approximately $12,936,533, $62,715,062, $13,380,657 and $13,380,657 which will expire in 2007, 2008, 2009 and 2010, respectively, was acquired in the merger and is available to offset future gains of the portfolio.
OTHER INFORMATION
For the year ended December 31, 2003, the aggregate cost of purchases and the proceeds of sales, other than from short-term investments, included $121,770,801 and $227,829,043 of non-governmental issuers, respectively.
See Notes to Financial Statements.
F-22
Table of Contents
SELECT INVESTMENT GRADE INCOME FUND
PORTFOLIO OF INVESTMENTS • December 31, 2003
| Par Value | Moody’s Ratings (Unaudited) | Value (Note 2) | |||||
| U.S. GOVERNMENT AGENCY MORTGAGE-BACKED OBLIGATIONS (j) - 25.2% | |||||||
Fannie Mae - 9.1% | |||||||
| $ 2,213,367 | 5.00%, 05/01/18 | NR | $ | 2,260,322 | |||
| 4,113,260 | 5.50%, 02/01/18 - 05/01/33 | NR | 4,224,649 | ||||
| 10,411,457 | 6.00%, 08/01/13 - 03/01/33 | NR | 10,849,191 | ||||
| 4,500,000 | 6.00%, 02/01/33, TBA (a) | NR | 4,635,000 | ||||
| 13,912,043 | 6.50%, 05/01/08 - 09/01/32 | NR | 14,579,500 | ||||
| 7,005,495 | 7.00%, 08/01/10 - 06/01/32 | NR | 7,439,880 | ||||
| 2,914,857 | 7.50%, 01/01/07 - 09/01/30 | NR | 3,111,494 | ||||
| 857,977 | 8.00%, 04/01/09 - 08/01/32 | NR | 925,190 | ||||
| 88,053 | 8.50%, 07/01/08 - 06/01/30 | NR | 90,789 | ||||
| 307,969 | �� | 9.00%, 02/01/10 - 11/01/25 | NR | 340,840 | |||
| 4,405 | 10.00%, 10/01/20 | NR | 4,912 | ||||
| 48,461,767 | |||||||
Freddie Mac - 12.0% | |||||||
| 1,685,000 | 4.50%, 12/01/18 | NR | 1,686,760 | ||||
| 17,704,271 | 5.00%, 05/01/18 - 10/01/33 | NR | 17,906,237 | ||||
| 6,200,000 | 5.00%, 02/01/19, TBA (a) | NR | 6,296,875 | ||||
| 12,659,454 | 5.50%, 02/01/18 - 12/01/33 | NR | 12,924,946 | ||||
| 15,710,945 | 6.00%, 10/15/07 - 09/01/33 | NR | 16,272,554 | ||||
| 3,194,310 | 6.50%, 08/01/04 - 12/01/31 | NR | 3,352,079 | ||||
| 4,177,579 | 7.00%, 05/01/32 - 12/01/32 | NR | 4,420,169 | ||||
| 777,613 | 7.50%, 06/01/15 - 11/01/30 | NR | 832,867 | ||||
| 123,092 | 9.50%, 08/01/19 - 02/01/21 | NR | 137,449 | ||||
| 63,829,936 | |||||||
Ginnie Mae - 4.1% | |||||||
| 9,530,427 | 5.50%, 06/15/33 - 07/15/33 | NR | 9,698,997 | ||||
| 5,325,243 | 6.00%, 01/15/32 - 11/15/32 | NR | 5,540,164 | ||||
| 2,545,482 | 6.50%, 09/15/08 - 11/15/32 | NR | 2,685,845 | ||||
| 1,896,882 | 7.00%, 03/15/12 - 12/15/31 | NR | 2,028,279 | ||||
| 1,446,298 | 7.50%, 11/15/30 - 10/15/32 | NR | 1,551,897 | ||||
| 63,059 | 9.50%, 02/15/06 | NR | 65,461 | ||||
| 21,570,643 | |||||||
Total U.S. Government Agency | |||||||
Mortgage-Backed Obligations | 133,862,346 | ||||||
(Cost $132,589,124) | |||||||
| U.S. GOVERNMENT AND AGENCY OBLIGATIONS - 22.1% | |||||||
Fannie Mae - 6.6% | |||||||
| 4,925,000 | 2.75%, 10/24/06 | Aaa | 4,958,303 | ||||
| 3,400,000 | 3.00%, 11/01/05 | Aaa | 3,454,961 | ||||
| 8,250,000 | 3.88%, 03/15/05 - 11/17/08 | Aaa | 8,313,568 | ||||
| 2,975,000 | 4.75%, 02/21/13 (b) | Aaa | 2,928,947 | ||||
| 4,323,796 | 6.00%, 02/01/17 - 02/01/29 | NR | 4,509,105 | ||||
| 5,290,000 | 6.25%, 07/19/11 | Aaa | 5,424,599 | ||||
| 2,700,000 | 6.40%, 05/14/09 | Aaa | 2,747,371 | ||||
| 2,065,286 | 6.50%, 05/01/16 - 10/01/29 | NR | 2,185,834 | ||||
| 86,674 | 7.50%, 03/01/28 - 09/01/30 | NR | 92,732 | ||||
| 491,047 | 8.00%, 10/01/29 - 05/01/30 | NR | 531,999 | ||||
| 35,147,419 | |||||||
Federal Home Loan Bank - 1.2% | |||||||
| $ 1,082,000 | 0.99%, 02/11/04 (c) | NR | $ | 1,080,768 | |||
| 2,670,000 | 3.38%, 07/21/08 | Aaa | 2,655,857 | ||||
| 2,670,000 | 4.96%, 06/18/07 | Aaa | 2,717,593 | ||||
| 6,454,218 | |||||||
Freddie Mac - 2.7% | |||||||
| 2,150,000 | 3.00%, 11/17/06 | Aaa | 2,171,182 | ||||
| 2,670,000 | 4.50%, 07/23/07 | Aaa | 2,712,061 | ||||
| 7,775,000 | 5.75%, 03/15/09 | Aaa | 8,548,270 | ||||
| 849,631 | 6.50%, 12/01/31 | NR | 889,933 | ||||
| 14,321,446 | |||||||
Ginnie Mae - 0.3% | |||||||
| 1,650,353 | 7.00%, 02/15/28 - 11/15/28 | NR | 1,761,734 | ||||
| 1,761,734 | |||||||
U.S. Treasury Bond - 1.4% | |||||||
| 1,520,000 | 5.38%, 02/15/31 (b) | NR | 1,585,135 | ||||
| 2,900,000 | 6.00%, 02/15/26 | NR | 3,215,941 | ||||
| 2,100,000 | 6.25%, 08/15/23 (b) | NR | 2,393,591 | ||||
| 7,194,667 | |||||||
U.S. Treasury Inflationary | |||||||
Index - 0.0% | |||||||
| 143,067 | 3.38%, 04/15/32 | NR | 180,332 | ||||
| U.S. Treasury Note - 9.8% | |||||||
| 22,320,000 | 1.88%, 11/30/05 (b) | NR | 22,361,850 | ||||
| 11,800,000 | 2.63%, 11/15/06 (b) | NR | 11,904,170 | ||||
| 14,500,000 | 3.38%, 12/15/08 (b) | NR | 14,598,557 | ||||
| 2,200,000 | 7.50%, 11/15/16 (b) | NR | 2,800,875 | ||||
| 51,665,452 | |||||||
U.S. Treasury Principal Only | |||||||
STRIPS - 0.1% | |||||||
| 660,000 | 5.50%, 08/15/28 (d) | NR | 172,279 | ||||
| 1,390,000 | 6.13%, 11/15/27 (d) | NR | 374,487 | ||||
| 546,766 | |||||||
Total U.S. Government and | |||||||
Agency Obligations | 117,272,034 | ||||||
(Cost $116,115,458) | |||||||
| CORPORATE NOTES AND BONDS - 35.0% | |||||||
Aerospace & Defense - 0.6% | |||||||
| 2,670,000 | Northrop Grumman Corp. | ||||||
7.13%, 02/15/11 | Baa3 | 3,088,087 | |||||
| 144,476 | Systems 2001 Asset Trust (e) | ||||||
6.66%, 09/15/13 | Aaa | 159,675 | |||||
| 3,247,762 | |||||||
Automotive - 1.1% | |||||||
| 1,125,000 | DaimlerChrysler North America | ||||||
Holding Corp. | |||||||
6.90%, 09/01/04 | A3 | 1,160,518 | |||||
See Notes to Financial Statements.
F-23
Table of Contents
SELECT INVESTMENT GRADE INCOME FUND
PORTFOLIO OF INVESTMENTS, Continued • December 31, 2003
| Par Value | Moody’s Ratings (Unaudited) | Value (Note 2) | |||||
Automotive (continued) | |||||||
| $ 19,408 | DaimlerChrysler North America | ||||||
Holding Corp. | |||||||
7.23%, 01/06/05 | Aaa | $ | 19,423 | ||||
| 1,775,000 | DaimlerChrysler North America | ||||||
Holding Corp. | |||||||
8.50%, 01/18/31 | A3 | 2,120,742 | |||||
| 2,335,000 | General Motors Corp. (b) | ||||||
7.20%, 01/15/11 | Baa1 | 2,567,300 | |||||
| 5,867,983 | |||||||
Banking - 5.4% | |||||||
| 325,000 | Bank of America Corp. (f) | ||||||
1.45%, 10/22/04 | Aa2 | 325,752 | |||||
| 2,500,000 | Bank of America Corp. | ||||||
4.88%, 09/15/12 | Aa2 | 2,512,803 | |||||
| 2,650,000 | BB&T Corp. (f) | ||||||
6.38%, 06/30/05 | A2 | 2,820,172 | |||||
| 2,670,000 | Capital One Bank | ||||||
5.75%, 09/15/10 | Baa2 | 2,824,406 | |||||
| 2,700,000 | Fifth Third Bank | ||||||
4.50%, 06/01/18 | Aa3 | 2,506,572 | |||||
| 575,000 | MBNA Corp., MTN | ||||||
7.50%, 03/15/12 | Baa2 | 668,054 | |||||
| 2,700,000 | Regions Bank | ||||||
2.90%, 12/15/06 | Aa3 | 2,740,303 | |||||
| 2,150,000 | U.S. Bancorp, MTN | ||||||
5.10%, 07/15/07 | Aa3 | 2,292,425 | |||||
| 2,700,000 | US Bank National Cincinnati | ||||||
6.50%, 02/01/08 | Aa3 | 3,005,176 | |||||
| 2,650,000 | Wachovia Corp. | ||||||
4.95%, 11/01/06 | Aa3 | 2,813,555 | |||||
| 2,650,000 | Washington Mutual, Inc. | ||||||
4.38%, 01/15/08 | A3 | 2,724,290 | |||||
| 450,000 | Wells Fargo & Co. (f) | ||||||
1.28%, 03/03/06 | Aa1 | 450,735 | |||||
| 2,650,000 | Wells Fargo & Co. | ||||||
5.13%, 02/15/07 | Aa1 | 2,827,174 | |||||
| 28,511,417 | |||||||
Beverages, Food & Tobacco - 3.3% | |||||||
| 2,650,000 | Anheuser-Busch Cos., Inc. | ||||||
4.63%, 02/01/15 | A1 | 2,586,005 | |||||
| 2,530,000 | Bottling Group LLC | ||||||
4.63%, 11/15/12 | A3 | 2,516,242 | |||||
| 2,700,000 | Cadbury Schweppes US Finance LLC (e) | ||||||
3.88%, 10/01/08 | Baa2 | 2,687,739 | |||||
| 2,650,000 | Conagra Foods, Inc. | ||||||
7.50%, 09/15/05 | Baa1 | 2,879,106 | |||||
| 1,500,000 | Diageo, Plc (g) | ||||||
0.00%, 01/06/04 | A | 1,500,000 | |||||
| 2,700,000 | General Mills, Inc. | ||||||
6.00%, 02/15/12 | Baa2 | 2,887,294 | |||||
| 2,670,000 | Unilever Capital Corp. | ||||||
5.90%, 11/15/32 | A1 | 2,676,405 | |||||
| 17,732,791 | |||||||
Chemicals - 1.1% | |||||||
| $ 2,700,000 | Praxair, Inc. | ||||||
6.63%, 10/15/07 | A3 | $ | 3,005,367 | ||||
| 2,600,000 | Sealed Air Corp. (b) (e) | ||||||
5.63%, 07/15/13 | Baa3 | 2,660,557 | |||||
| 5,665,924 | |||||||
Commercial Services - 0.5% | |||||||
| 2,800,000 | Waste Management, Inc. | ||||||
7.00%, 10/01/04 | Baa3 | 2,897,653 | |||||
Electric Utilities - 2.6% | |||||||
| 2,700,000 | Baltimore Gas & Electric Co. | ||||||
5.20%, 06/15/33 | A2 | 2,453,231 | |||||
| 2,700,000 | Dayton Power & Light Co. (e) | ||||||
5.13%, 10/01/13 | Baa1 | 2,694,654 | |||||
| 2,700,000 | Dominion Resources, Inc. | ||||||
5.25%, 08/01/33 | Baa1 | 2,673,837 | |||||
| 1,800,000 | Entergy Gulf States, Inc. (e) | ||||||
3.60%, 06/01/08 | Baa3 | 1,735,052 | |||||
| 2,700,000 | FirstEnergy Corp. | ||||||
6.45%, 11/15/11 | Baa2 | 2,798,410 | |||||
| 1,335,000 | TXU Energy Co. | ||||||
7.00%, 03/15/13 | Baa2 | 1,476,505 | |||||
| 13,831,689 | |||||||
Entertainment & Leisure - 0.6% | |||||||
| 2,700,000 | Harrah’s Operating Co., Inc. | ||||||
7.13%, 06/01/07 | Baa3 | 3,006,696 | |||||
| 15,000 | MGM Mirage, Inc. | ||||||
7.25%, 10/15/06 | Ba1 | 16,163 | |||||
| 4,000 | MGM Mirage, Inc. | ||||||
8.50%, 09/15/10 | Ba1 | 4,590 | |||||
| 11,000 | Park Place Entertainment Corp. | ||||||
8.50%, 11/15/06 | Ba1 | 12,183 | |||||
| 3,039,632 | |||||||
Financial Services - 5.6% | |||||||
| 2,650,000 | American Express Co. | ||||||
3.75%, 11/20/07 | A1 | 2,699,409 | |||||
| 2,650,000 | American Express Credit Corp. | ||||||
3.00%, 05/16/08 | Aa3 | 2,593,483 | |||||
| 248,618 | CVRD Finance Ltd., Series 2A (e) (f) | ||||||
1.80%, 10/15/07 | Aaa | 248,665 | |||||
| 100,000 | Ford Motor Credit Co. | ||||||
5.75%, 02/23/04 | A3 | 100,599 | |||||
| 2,700,000 | Ford Motor Credit Co. (b) | ||||||
6.50%, 01/25/07 | A3 | 2,876,105 | |||||
| 1,345,000 | Ford Motor Credit Co. | ||||||
6.88%, 02/01/06 | A3 | 1,435,529 | |||||
| 1,110,000 | Ford Motor Credit Co. | ||||||
7.25%, 10/25/11 | A3 | 1,203,866 | |||||
| 160,000 | Ford Motor Credit Co. | ||||||
7.38%, 02/01/11 | A3 | 174,390 | |||||
| 2,700,000 | General Electric Capital Corp., MTN | ||||||
4.25%, 01/15/08 | Aaa | 2,792,291 | |||||
See Notes to Financial Statements.
F-24
Table of Contents
SELECT INVESTMENT GRADE INCOME FUND
PORTFOLIO OF INVESTMENTS, Continued • December 31, 2003
| Par Value | Moody’s Ratings (Unaudited) | Value (Note 2) | ||||||
Financial Services (continued) | ||||||||
| $ | 1,670,000 | General Motors Acceptance | ||||||
Corp., MTN (f) | ||||||||
2.41%, 10/20/05 | A3 | $ | 1,682,540 | |||||
| 2,700,000 | Household Finance Corp. | |||||||
8.00%, 07/15/10 | A1 | 3,233,474 | ||||||
| 2,700,000 | International Lease Finance Corp. | |||||||
4.35%, 09/15/08 | A1 | 2,755,415 | ||||||
| 2,600,000 | J. Paul Getty Trust | |||||||
5.88%, 10/01/33 | Aaa | 2,573,579 | ||||||
| 2,650,000 | KFW International Finance, Inc. | |||||||
4.25%, 04/18/05 | Aaa | 2,741,014 | ||||||
| 2,650,000 | Mellon Funding Corp. | |||||||
5.00%, 12/01/14 | A2 | 2,656,683 | ||||||
| 29,767,042 | ||||||||
Food Retailers - 1.1% | ||||||||
| 2,700,000 | Kroger Co. | |||||||
5.50%, 02/01/13 | Baa3 | 2,746,151 | ||||||
| 2,700,000 | Safeway, Inc. | |||||||
6.50%, 03/01/11 | Baa2 | 2,947,388 | ||||||
| 5,693,539 | ||||||||
Forest Products & Paper - 0.5% | ||||||||
| 2,670,000 | International Paper Co. | |||||||
5.30%, 04/01/15 | Baa2 | 2,610,141 | ||||||
Health Care Providers - 0.0% | ||||||||
| 21,000 | Columbia/HCA Healthcare Corp. | |||||||
6.91%, 06/15/05 | Ba1 | 22,121 | ||||||
| 3,000 | HCA, Inc. | |||||||
6.30%, 10/01/12 | Ba1 | 3,093 | ||||||
| 25,214 | ||||||||
Home Construction, Furnishings & Appliances - 0.0% | ||||||||
| 38,000 | Lennar Corp. | |||||||
9.95%, 05/01/10 | Baa3 | 43,653 | ||||||
Insurance - 0.5% | ||||||||
| 2,650,000 | UnitedHealth Group, Inc. | |||||||
7.50%, 11/15/05 | A3 | 2,909,220 | ||||||
Media - Broadcasting & Publishing - 2.9% | ||||||||
| 2,700,000 | Continental Cablevision, Inc., Senior Notes | |||||||
8.30%, 05/15/06 | Baa3 | 3,027,186 | ||||||
| 2,700,000 | Cox Communications, Inc. | |||||||
7.13%, 10/01/12 | Baa2 | 3,114,215 | ||||||
| 1,200,000 | Cox Enterprises, Inc. (e) | |||||||
4.38%, 05/01/08 | Baa1 | 1,219,058 | ||||||
| 2,700,000 | News America Holdings, Inc. | |||||||
7.38%, 10/17/08 | Baa3 | 3,080,495 | ||||||
| 1,430,000 | Viacom, Inc. | |||||||
5.50%, 05/15/33 | A3 | 1,331,725 | ||||||
| 2,695,000 | Viacom, Inc. | |||||||
7.88%, 07/30/30 | A3 | 3,352,391 | ||||||
| 15,125,070 | ||||||||
Metals - 0.0% | ||||||||
| $ | 30,000 | Scotia Pacific Co. LLC | ||||||
7.71%, 01/20/14 | Baa2 | $ | 17,918 | |||||
Oil & Gas - 2.9% | ||||||||
| 2,650,000 | Burlington Resources, Inc. | |||||||
7.40%, 12/01/31 | Baa1 | 3,137,102 | ||||||
| 2,581,000 | Conoco Funding Co. | |||||||
5.45%, 10/15/06 | A3 | 2,769,145 | ||||||
| 310,000 | Conoco, Inc. | |||||||
6.95%, 04/15/29 | A3 | 351,552 | ||||||
| 2,125,000 | Enterprise Products | |||||||
7.50%, 02/01/11 | Baa2 | 2,374,719 | ||||||
| 875,000 | Enterprise Products | |||||||
8.25%, 03/15/05 | Baa2 | 934,843 | ||||||
| 1,350,000 | Marathon Oil Corp. | |||||||
5.38%, 06/01/07 | Baa1 | 1,444,808 | ||||||
| 1,350,000 | Marathon Oil Corp. | |||||||
6.13%, 03/15/12 | Baa1 | 1,459,953 | ||||||
| 2,675,000 | Valero Energy Corp. | |||||||
6.13%, 04/15/07 | Baa3 | 2,904,122 | ||||||
| 15,376,244 | ||||||||
Pharmaceuticals - 1.2% | ||||||||
| 2,700,000 | Lilly (Eli) & Co. | |||||||
7.13%, 06/01/25 | Aa3 | 3,191,711 | ||||||
| 2,680,000 | Zeneca Wilmington | |||||||
7.00%, 11/15/23 | Aa2 | 3,104,780 | ||||||
| 6,296,491 | ||||||||
Retailers - 1.2% | ||||||||
| 2,700,000 | Target Corp. | |||||||
6.35%, 11/01/32 | A2 | 2,836,188 | ||||||
| 2,650,000 | Wal-Mart Stores, Inc. | |||||||
7.55%, 02/15/30 | Aa2 | 3,261,321 | ||||||
| 6,097,509 | ||||||||
Securities Broker - 1.6% | ||||||||
| 2,600,000 | Bear Stearns Cos., Inc. | |||||||
4.00%, 01/31/08 | A1 | 2,648,186 | ||||||
| 2,700,000 | Goldman Sachs Group, Inc. | |||||||
5.70%, 09/01/12 | Aa3 | 2,837,570 | ||||||
| 2,600,000 | Morgan Stanley Dean Witter & Co. | |||||||
6.60%, 04/01/12 | Aa3 | 2,903,781 | ||||||
| 8,389,537 | ||||||||
Telephone Systems - 1.3% | ||||||||
| 2,700,000 | Sprint Capital Corp. | |||||||
6.13%, 11/15/08 | Baa3 | 2,877,865 | ||||||
| 1,400,000 | Sprint Capital Corp. | |||||||
7.90%, 03/15/05 | Baa3 | 1,491,375 | ||||||
| 2,600,000 | Verizon Florida, Inc. | |||||||
6.13%, 01/15/13 | A1 | 2,782,460 | ||||||
| 7,151,700 | ||||||||
See Notes to Financial Statements.
F-25
Table of Contents
SELECT INVESTMENT GRADE INCOME FUND
PORTFOLIO OF INVESTMENTS, Continued • December 31, 2003
| Par Value | Moody’s Ratings (Unaudited) | Value (Note 2) | |||||||
Transportation - 1.0% | |||||||||
| $ | 2,620,000 | Consolidated Rail Corp. | |||||||
9.75%, 06/15/20 | Baa2 | $ | 3,609,878 | ||||||
| 300,000 | Union Pacific Corp. | ||||||||
5.38%, 06/01/33 | Baa2 | 273,458 | |||||||
| 1,430,000 | Union Pacific Corp. | ||||||||
6.63%, 02/01/08 | Baa2 | 1,587,349 | |||||||
| 5,470,685 | |||||||||
Total Corporate Notes and Bonds | 185,768,814 | ||||||||
(Cost $182,574,058) | |||||||||
| ASSET-BACKED AND MORTGAGE-BACKED SECURITIES (j) - 7.4% | |||||||||
| 11,729,307 | Bank of America Mortgage Securities, Inc., | ||||||||
Series 2003-8, Class 1A12 (g) | |||||||||
5.50%, 11/25/33 | AAA | 11,928,176 | |||||||
| 2,700,000 | Bear Stearns Commercial | ||||||||
Mortgage Securities, Inc., | |||||||||
Series 2002-PBW1, Class A2 | |||||||||
4.72%, 11/11/35 | Aaa | 2,716,460 | |||||||
| 2,700,000 | Bear Stearns Mortgage Securities, Inc., | ||||||||
Series 1999-WF2, Class A2, CMO | |||||||||
7.08%, 06/15/09 | Aaa | 3,070,697 | |||||||
| 1,300,000 | Chase Credit Card Master Trust, | ||||||||
Series 1999-3, Class B, | |||||||||
6.95%, 01/15/07 | A2 | 1,347,440 | |||||||
| 1,285,000 | Citibank Credit Card Issuance | ||||||||
Trust, Series 2000-Cl, CMO | |||||||||
6.88%, 11/16/09 | Aaa | 1,463,236 | |||||||
| 1,000,000 | Conseco Finance Corp., | ||||||||
Series 2000-6, Class A4 | |||||||||
6.77%, 09/01/32 | A3 | 1,020,975 | |||||||
| 46,947 | Contimortgage Home Equity | ||||||||
Loan Trust, Series 1999-1, Class A5 | |||||||||
6.37%, 02/25/26 | Aaa | 46,938 | |||||||
| 1,000,000 | DaimlerChrysler Auto Trust, | ||||||||
Series 2002-B, Class A3 | |||||||||
2.93%, 06/06/06 | Aaa | 1,010,214 | |||||||
| 2,700,000 | General Electric Capital Commercial | ||||||||
Mortgage Corp., Series 2002-1A, Class A3 | |||||||||
6.27%, 12/10/35 | Aaa | 2,987,268 | |||||||
| 150,552 | Green Tree Financial Corp., | ||||||||
Series 1999-3, Class A, CMO (g) | |||||||||
6.16%, 02/01/31 | BBB | 154,586 | |||||||
| 880,000 | Green Tree Home Improvement | ||||||||
Loan Trust, Series 1996-D, | |||||||||
Class H, CMO (g) | |||||||||
8.30%, 09/15/27 | AAA | 882,021 | |||||||
| 2,040,000 | GS Mortgage Securities Corp. II, | ||||||||
Series 1997-GL, Class A2D | |||||||||
6.94%, 07/13/30 | Aaa | 2,277,367 | |||||||
| 78,335 | Housing Securities, Inc., | ||||||||
Series 1994-2, Class A-1 | |||||||||
6.50%, 07/25/09 | Aaa | 80,165 | |||||||
| 700,000 | MBNA Master Credit Card Trust, | ||||||||
Series 1995-C, Class A | |||||||||
6.45%, 02/15/08 | Aaa | 746,285 | |||||||
| 2,000,000 | MBNA Master Credit Card Trust, | ||||||||
Series 1999-G, Class B, CMO | |||||||||
6.60%, 12/15/06 | A2 | 2,054,930 | |||||||
| $1,135,000 | Morgan Stanley Dean Witter Capital I, | ||||||||
Series 2002-TOP7, Class B, CMO | |||||||||
6.08%, 01/15/39 | Aa2 | $ | 1,238,245 | ||||||
| 2,700,000 | Morgan Stanley Dean Witter | ||||||||
Capital I, Series 2003-T0P9, | |||||||||
Class A2, CMO (g) | |||||||||
4.74%, 11/13/36 | AAA | 2,704,872 | |||||||
| 937,106 | Toyota Auto Receivables | ||||||||
Grantor Trust, Series 2000-A, | |||||||||
Class A4, CMO | |||||||||
7.21%, 04/15/07 | Aaa | 947,090 | |||||||
| 2,267,622 | Toyota Auto Receivables | ||||||||
Owner Trust, Series 2002-B, Class A3 | |||||||||
3.76%, 06/15/06 | Aaa | 2,296,550 | |||||||
Total Asset-Backed and Mortgage-Backed Securities | 38,973,515 | ||||||||
(Cost $37,893,138) | |||||||||
| FOREIGN GOVERNMENT OBLIGATIONS (k) - 0.9% | |||||||||
| 2,700,000 | Province of British Columbia | ||||||||
5.38%, 10/29/08 | Aa2 | 2,919,243 | |||||||
| 1,600,000 | Province of Quebec | ||||||||
7.00%, 01/30/07 | A1 | 1,795,872 | |||||||
| 30,000 | United Mexican States | ||||||||
8.38%, 01/14/11 | Baa2 | 35,625 | |||||||
Total Foreign Government Obligations | 4,750,740 | ||||||||
(Cost $4,469,354) | |||||||||
| FOREIGN BONDS (k) - 4.7% | |||||||||
| 2,650,000 | Alberta Energy Co., Ltd. | ||||||||
7.38%, 11/01/31 | Baa1 | 3,147,029 | |||||||
| 2,650,000 | British Telecom, Plc (h) | ||||||||
8.13%, 12/15/10 | Baa1 | 3,224,721 | |||||||
| 2,650,000 | Canadian Pacific Railroad | ||||||||
5.75%, 03/15/33 | Baa2 | 2,565,351 | |||||||
| 2,700,000 | Royal Bank of Scotland Group, Plc | ||||||||
4.70%, 07/03/18 | Aa3 | 2,491,136 | |||||||
| 2,670,000 | Sappi Papier Holding AG (e) | ||||||||
6.75%, 06/15/12 | Baa2 | 2,918,678 | |||||||
| 1,665,000 | Stora Enso Oyj | ||||||||
7.38%, 05/15/11 | Baa1 | 1,926,562 | |||||||
| 2,650,000 | Telus Corp. | ||||||||
7.50%, 06/01/07 | Ba1 | 2,965,732 | |||||||
| 10,000 | Tyco International Group S.A. | ||||||||
5.88%, 11/01/04 | Ba2 | 10,275 | |||||||
| 2,700,000 | Tyco International Group S.A. | ||||||||
6.38%, 10/15/11 | Ba2 | 2,885,625 | |||||||
| 10,000 | Tyco International Group S.A. | ||||||||
6.75%, 02/15/11 | Ba2 | 10,925 | |||||||
| 2,700,000 | Vodafone Group, Plc | ||||||||
5.38%, 01/30/15 | A2 | 2,725,013 | |||||||
Total Foreign Bonds | 24,871,047 | ||||||||
| �� | (Cost $23,924,818) | ||||||||
See Notes to Financial Statements.
F-26
Table of Contents
SELECT INVESTMENT GRADE INCOME FUND
PORTFOLIO OF INVESTMENTS, Continued • December 31, 2003
| Par Value | Moody’s Ratings (Unaudited) | Value (Note 2) | ||||||
| COMMERCIAL PAPER (c) - 3.4% | ||||||||
Financial Services - 3.4% | ||||||||
| $11,900,000 | Blue Ridge Asset Funding (e) (i) | |||||||
1.08%, 01/14/04 | NR | $ | 11,895,359 | |||||
| 4,850,000 | Sheffield Receivables Corp. (e) | |||||||
1.09%, 01/06/04 | NR | 4,849,266 | ||||||
| 1,400,000 | Sheffield Receivables Corp. (e) | |||||||
1.09%, 01/08/04 | NR | 1,399,703 | ||||||
Total Commercial Paper | 18,144,328 | |||||||
(Cost $18,144,328) | ||||||||
| Shares | ||||||||
| INVESTMENT COMPANIES - 2.5% | ||||||||
| 12,820,875 | Barclays Prime Money Market Fund | NR | 12,820,875 | |||||
| 270,522 | Marshall Money Market Fund | NR | 270,522 | |||||
Total Investment Companies | 13,091,397 | |||||||
(Cost $13,091,397) | ||||||||
| WARRANTS - 0.0% | ||||||||
Computers & Information - 0.0% | ||||||||
| 500,000 | International Business Machines Corp., 07/10/06 | 27,000 | ||||||
Telephone Systems - 0.0% | ||||||||
| 500,000 | BellSouth Telecom, Inc., 07/12/06 | 13,250 | ||||||
Total Warrants | 40,250 | |||||||
(Cost $16,562) | ||||||||
| Total Investments - 101.2% | 536,774,471 | |||||||
| (Cost $528,818,237) | ||||||||
| Net Other Assets and Liabilities - (1.2)% | (6,575,698 | ) | ||||||
| Total Net Assets - 100.0% | $ | 530,198,773 | ||||||
| (a) | All or part of security is designated as a Forward Commitment. |
| (b) | All or a portion of this security is out on loan at December 31, 2003; the value of the securities loaned amounted to $60,877,929. The value of collateral amounted to $62,259,950 which consisted of cash equivalents. |
| (c) | Effective yield at time of purchase. |
| (d) | No payments of interest are passed through to the “principal only STRIPS” holder. The rate shown is the coupon rate of the original bond. |
| (e) | Security exempt from registration under Rule 144A of the Securities Act of 1933. This security may be resold in transactions exempt from registration, to qualified institutional buyers. At December 31, 2003, these securities amounted to $32,468,406 or 6.1% of net assets. |
| (f) | Variable rate security. The rate shown reflects rate in effect at period end. |
| (g) | Standard & Poor’s (S&P) credit ratings are used in the absence of a rating by Moody’s Investors, Inc. |
| (h) | Debt obligation initially issued in coupon form which converts to a higher coupon form at a specified date and rate. The rate shown is the rate at period end. The maturity date shown is the ultimate maturity. |
| (i) | Designated as Collateral on Forward Commitments. |
| (j) | Pass Through Certificates. |
| (k) | U.S. currency denominated. |
CMO Collateralized Mortgage Obligation
MTN Medium Term Note
NR Not Rated
STRIPS Separate Trading of Registered Interest and Principal of Securities
FEDERAL INCOME TAX INFORMATION (SEE NOTE 2)
At December 31, 2003, the aggregate cost of investment securities for tax purposes was $530,215,190. Net unrealized appreciation (depreciation) aggregated $6,559,281, of which $9,741,565 related to appreciated investment securities and $(3,182,284) related to depreciated investment securities.
As of December 31, 2003, the components of distributable earnings (excluding unrealized appreciation disclosed above) on a tax basis consisted of $3,797,657 and $6,247,354 of undistributed ordinary income and undistributed long term capital gains, respectively.
For the period ended December 31, 2003, the Portfolio has elected to defer $1,339,820 of capital losses attributable to Post-October losses.
During the year ended December 31, 2003, the tax character of distributions paid for ordinary income was $26,622,750.
OTHER INFORMATION
For the year ended December 31, 2003, the aggregate cost of purchases and the proceeds of sales, other than from short-term investments, included $221,255,505 and $262,270,823 of non-governmental issuers, respectively, and $890,760,488 and $1,020,749,995 of U.S. Government and Agency issuers, respectively.
The composition of ratings of both long-term and short-term debt holdings as a percentage of total value of investments in securities is as follows:
Moody’s Rating (Unaudited) | |||
Aaa | 13.6 | % | |
Aa | 8.2 | % | |
A | 12.8 | % | |
Baa | 17.2 | % | |
Ba | 1.1 | % | |
NR (Not Rated) | 43.9 | % | |
| 96.8 | % | ||
S&P Ratings (Unaudited) |
| ||
AAA | 2.9 | % | |
A | 0.3 | % | |
| 3.2 | % | ||
Written Options Rollforward
| Puts | Calls | |||||||||||||||
Principal Amount of Contracts (000’s omitted) | Premiums | Principal Amount of Contracts (000’s omitted) | Premiums | |||||||||||||
Outstanding, beginning of period | $ | — | $ | — | $ | — | $ | — | ||||||||
Options written | 22 | 15,125 | 34 | 32,797 | ||||||||||||
Options closed | (22 | ) | (15,125 | ) | (34 | ) | (32,797 | ) | ||||||||
Outstanding, end of period | $ | — | $ | — | $ | — | $ | — | ||||||||
See Notes to Financial Statements.
F-27
Table of Contents
GOVERNMENT BOND FUND
PORTFOLIO OF INVESTMENTS • December 31, 2003
Par Value | Value (Note 2) | ||||
| U.S. GOVERNMENT AGENCY MORTGAGE-BACKED OBLIGATIONS (b) - 6.7% | |||||
Fannie Mae - 6.5% | |||||
| $13,000,000 | 4.00%, 04/25/22 - 07/25/22 | $ | 12,945,851 | ||
| 2,463 | 7.00%, 05/01/17 | 2,497 | |||
| 108,678 | 7.50%, 03/01/07 | 115,382 | |||
| 3,843 | 8.00%, 04/01/09 | 4,119 | |||
| 52,001 | 8.00%, 09/01/21 | 56,834 | |||
| 13,124,683 | |||||
Freddie Mac - 0.1% | |||||
| 88,076 | 6.50%, 08/01/04 - 06/01/23 | 93,628 | |||
| 38,018 | 7.50%, 02/01/07 | 40,081 | |||
| 23,664 | 8.00%, 09/01/09 - 06/01/19 | 25,565 | |||
| 30,638 | 10.00%, 03/01/21 | 34,166 | |||
| 193,440 | |||||
Ginnie Mae - 0.1% | |||||
| 17,967 | 6.50%, 06/15/09 | 19,192 | |||
| 123,152 | 7.00%, 06/15/12 | 132,231 | |||
| 18,789 | 9.50%, 02/15/06 | 19,505 | |||
| 170,928 | |||||
Total U.S. Government Agency | |||||
Mortgage-Backed Obligations | 13,489,051 | ||||
(Cost $13,745,662) | |||||
| U.S. GOVERNMENT AND AGENCY OBLIGATIONS - 84.5% | |||||
Fannie Mae - 43.8% | |||||
| 9,885,000 | 3.50%, 09/15/04 | 10,039,997 | |||
| 12,205,000 | 3.88%, 11/17/08 | 12,225,748 | |||
| 3,075,000 | 4.38%, 09/15/12 (a) | 3,042,276 | |||
| 19,370,000 | 5.00%, 01/15/07 | 20,676,623 | |||
| 14,595,000 | 5.38%, 11/15/11 | 15,546,083 | |||
| 13,510,000 | 5.50%, 05/02/06 | 14,452,849 | |||
| 6,860,000 | 6.38%, 06/15/09 | 7,757,302 | |||
| 3,480,000 | 6.63%, 11/15/10 | 3,998,436 | |||
| 87,739,314 | |||||
Federal Farm Credit Bank - 8.6% | |||||
| 12,000,000 | 2.63%, 12/15/05 | 12,147,024 | |||
| 5,000,000 | 3.88%, 12/15/04 | 5,121,255 | |||
| 17,268,279 | |||||
Federal Home Loan Bank - 10.5% | |||||
| 3,300,000 | 3.50%, 04/22/08 | 3,285,190 | |||
| 8,200,000 | 3.63%, 10/15/04 | 8,350,142 | |||
| 7,400,000 | 4.00%, 03/18/11 | 7,201,954 | |||
| 2,000,000 | 4.13%, 01/14/05 | 2,056,598 | |||
| 20,893,884 | |||||
Freddie Mac - 15.8% | |||||
| 900,000 | 4.50%, 08/15/04 | 918,124 | |||
| 6,075,000 | 5.13%, 10/15/08 | 6,514,599 | |||
| 3,140,000 | 5.50%, 07/15/06 | 3,383,187 | |||
| 8,715,000 | 5.75%, 04/29/09 - 01/15/12 | 9,228,786 | |||
| $6,405,000 | 6.63%, 09/15/09 | $ | 7,324,572 | ||
| 3,730,000 | 6.88%, 09/15/10 | 4,332,097 | |||
| 31,701,365 | |||||
Sallie Mae - 2.1% | |||||
| 4,000,000 | 5.00%, 06/30/04 | 4,079,552 | |||
U.S. Treasury Bond - 3.7% | |||||
| 5,155,000 | 8.88%, 02/15/19 | 7,370,042 | |||
Total U.S. Government and | |||||
Agency Obligations | 169,052,436 | ||||
(Cost $166,638,025) | |||||
| ASSET-BACKED AND MORTGAGE-BACKED SECURITIES (b) - 6.7% | |||||
| 2,048,224 | Capital Auto Receivables Asset Trust, | ||||
Series 2002-4, Class A2B | |||||
1.74%, 01/17/05 | 2,050,093 | ||||
| 5,500,000 | Citibank Credit Card Issuance Trust, | ||||
Series 2001, Class A8 | |||||
4.10%, 12/07/06 | 5,633,763 | ||||
| 3,500,000 | Ford Credit Auto Owner Trust, | ||||
Series 2003-A, Class A4A | |||||
2.70%, 06/15/07 | 3,525,048 | ||||
| 2,000,000 | MBNA Master Credit Card Trust, | ||||
Series 1999-B, Class A | |||||
5.90%, 08/15/11 | 2,205,427 | ||||
Total Asset-Backed and | |||||
Mortgage-Backed Securities | 13,414,331 | ||||
(Cost $13,236,242) | |||||
Shares | |||||
| INVESTMENT COMPANIES - 1.3% | |||||
| 4,098 | Dreyfus Cash Management Plus | ||||
Money Market Fund | 4,098 | ||||
| 2,681,750 | Marshall Money Market Fund | 2,681,750 | |||
Total Investment Companies | 2,685,848 | ||||
(Cost $2,685,848) | |||||
| Total Investments - 99.2% | 198,641,666 | ||||
| (Cost $196,305,777) | |||||
| Net Other Assets and Liabilities - 0.8% | 1,516,794 | ||||
| Total Net Assets - 100.0% | $ | 200,158,460 | |||
| (a) | All or a portion of this security is out on loan at December 31, 2003; the value of the securities loaned amounted to $3,002,306. The value of collateral amounted to $3,075,000 which consisted of cash equivalents. |
| (b) | Pass Through Certificates. |
See Notes to Financial Statements.
F-28
Table of Contents
GOVERNMENT BOND FUND
PORTFOLIO OF INVESTMENTS, Continued • December 31, 2003
FEDERAL INCOME TAX INFORMATION (SEE NOTE 2)
At December 31, 2003, the aggregate cost of investment securities for tax purposes was $197,776,934. Net unrealized appreciation (depreciation) aggregated $864,732, of which $2,057,249 related to appreciated investment securities and $(1,192,517) related to depreciated investment securities.
As of December 31, 2003, the components of distributable earnings (excluding unrealized appreciation disclosed above) on a tax basis consisted of $81,655 and $273,841 of undistributed ordinary income and undistributed long term capital gains, respectively.
For the period ended December 31, 2003, the Portfolio has elected to defer $318,792 of capital losses attributable to Post-October losses.
During the year ended December 31, 2003, the tax character of distributions paid for ordinary income was $9,748,622.
OTHER INFORMATION
For the year ended December 31, 2003, the aggregate cost of purchases and the proceeds of sales, other than from short-term investments, included $3,499,362 and $5,951,776 of non-governmental issuers, respectively, and $137,856,184 and $194,484,592 of U.S. Government and Agency issuers, respectively.
See Notes to Financial Statements.
F-29
Table of Contents
MONEY MARKET FUND
PORTFOLIO OF INVESTMENTS • December 31, 2003
Par Value | Value (Note 2) | ||||
| U.S. GOVERNMENT AND AGENCY OBLIGATIONS - 14.3% | |||||
Fannie Mae - 9.3% | |||||
| $ 5,000,000 | 1.18%, 07/27/04 | $ | 5,000,000 | ||
| 14,850,000 | 1.19%, 03/05/04 (a) | 14,818,715 | |||
| 10,000,000 | 1.63%, 12/15/04 | 10,000,000 | |||
| 5,000,000 | 6.50%, 08/15/04 | 5,159,936 | |||
| 34,978,651 | |||||
Federal Home Loan Bank - 3.7% | |||||
| 4,000,000 | 1.20%, 08/20/04 | 4,000,000 | |||
| 10,000,000 | 1.50%, 01/07/05 | 10,000,000 | |||
| 14,000,000 | |||||
Freddie Mac - 1.3% | |||||
| 5,000,000 | 1.41%, 11/15/04 | 5,000,000 | |||
Total U.S. Government and | |||||
Agency Obligations | 53,978,651 | ||||
(Cost $53,978,651) | |||||
| CORPORATE NOTES - 46.5% | |||||
Banking - 4.0% | |||||
| 15,000,000 | Marshall & Ilsley Bank | ||||
1.22%, 12/17/04 | 15,000,000 | ||||
Banking - Foreign Banks & Branches - 3.3% | |||||
| 2,450,000 | National Bank of Canada | ||||
8.13%, 08/15/04 | 2,549,100 | ||||
| 10,000,000 | Royal Bank of Canada, MTN (b) | ||||
1.22%, 02/27/04 | 10,001,338 | ||||
| 12,550,438 | |||||
Financial Services - 27.6% | |||||
| 7,864,000 | Caterpillar Financial Services Corp., MTN (b) | ||||
1.25%, 07/09/04 | 7,864,000 | ||||
| 10,000,000 | Caterpillar Financial Services Corp., MTN (b) | ||||
1.31%, 04/02/04 | 10,004,665 | ||||
| 500,000 | Caterpillar Financial Services Corp., MTN (b) | ||||
1.34%, 03/05/04 | 500,154 | ||||
| 15,000,000 | Citigroup, Inc. (b) | ||||
1.32%, 10/22/04 | 15,024,252 | ||||
| 3,050,000 | Citigroup, Inc. | ||||
5.70%, 02/06/04 | �� | 3,062,898 | |||
| 1,750,000 | General Electric Capital Corp. | ||||
7.25%, 05/03/04 | 1,785,571 | ||||
| 2,782,000 | Household Finance Corp. | ||||
6.00%, 05/01/04 | 2,825,454 | ||||
| 5,000,000 | International Lease Finance Corp., MTN | ||||
5.35%, 05/05/04 | 5,069,370 | ||||
| 6,000,000 | J.P. Morgan Chase & Co. | ||||
5.37%, 02/27/04 | 6,038,727 | ||||
| 12,000,000 | J.P. Morgan Chase & Co. | ||||
5.75%, 02/25/04 | 12,077,930 | ||||
| 15,000,000 | Money Market Trust LLC (c) | ||||
1.22%, 12/03/04 | 15,000,000 | ||||
| $20,000,000 | Money Market Trust, Series 2003-A (c) | ||||
1.25%, 02/19/04 | $ | 20,001,879 | |||
| 5,000,000 | Sigma Finance, Inc., MTN (c) | ||||
1.12%, 05/18/04 | 4,999,750 | ||||
| 104,254,650 | |||||
Retailers - 1.8% | |||||
| 5,000,000 | Wal-Mart Stores, Inc. | ||||
6.55%, 08/10/04 | 5,158,029 | ||||
| 1,400,000 | Wal-Mart Stores, Inc. | ||||
7.50%, 05/15/04 | 1,432,191 | ||||
| 6,590,220 | |||||
Securities Broker - 9.8% | |||||
| 4,000,000 | Goldman Sachs Group, Inc. | ||||
1.13%, 01/23/04 | 4,000,000 | ||||
| 10,000,000 | Goldman Sachs Group, Inc. | ||||
1.23%, 07/29/04 | 10,000,000 | ||||
| 10,000,000 | Morgan Stanley | ||||
1.28%, 11/15/04 | 10,000,000 | ||||
| 13,000,000 | Morgan Stanley | ||||
5.63%, 01/20/04 | 13,019,370 | ||||
| 37,019,370 | |||||
Total Corporate Notes | 175,414,678 | ||||
(Cost $175,414,678) | |||||
| ASSET BACKED SECURITIES - 1.6% | |||||
| 6,031,052 | Whole Auto Loan Trust, | ||||
Series 2003-1, Class A1 | |||||
1.10%, 09/15/04 | 6,031,052 | ||||
Total Asset Backed Securities | 6,031,052 | ||||
(Cost $6,031,052) | |||||
| COMMERCIAL PAPER (a) - 30.0% | |||||
Banking - Foreign Banks & Branches - 6.6% | |||||
| 15,000,000 | Den Norske Bank | ||||
1.08%, 01/15/04 | 14,993,700 | ||||
| 10,000,000 | Nieuw Amsterdam Receivables Co. (c) | ||||
1.10%, 01/02/04 | 9,999,695 | ||||
| 24,993,395 | |||||
Financial Services - 23.1% | |||||
| 10,000,000 | Atlantis One Funding (c) | ||||
1.08%, 01/20/04 | 9,994,300 | ||||
| 2,000,000 | General Electric Capital Corp. | ||||
1.09%, 01/15/04 | 1,999,152 | ||||
| 7,416,000 | Hatteras Funding Corp. (c) | ||||
1.09%, 02/25/04 | 7,403,651 | ||||
| 10,000,000 | High Peak Funding LLC (c) | ||||
1.12%, 01/12/04 | 9,996,578 | ||||
| 2,000,000 | High Peak Funding LLC (c) | ||||
1.12%, 01/20/04 | 1,998,818 | ||||
See Notes to Financial Statements.
F-30
Table of Contents
MONEY MARKET FUND
PORTFOLIO OF INVESTMENTS, Continued • December 31, 2003
| Par Value | Value (Note 2) | |||||
Financial Services (continued) | ||||||
| $ 3,200,000 | High Peak Funding LLC (c) | |||||
1.13%, 01/20/04 | $ | 3,198,091 | ||||
| 10,000,000 | Household Finance Corp. | |||||
1.09%, 01/08/04 | 9,997,881 | |||||
| 7,000,000 | Newbury Funding (c) | |||||
1.20%, 01/05/04 | 6,999,066 | |||||
| 10,000,000 | Newbury Funding (c) | |||||
1.20%, 02/02/04 | 9,989,333 | |||||
| 7,000,000 | Sigma Finance, Inc. (c) | |||||
1.11%, 02/05/04 | 6,992,446 | |||||
| 5,000,000 | Sigma Finance, Inc. (c) | |||||
1.14%, 03/22/04 | 4,987,175 | |||||
| 4,050,000 | TransAmerica Asset Funding (c) | |||||
0.95%, 01/02/04 | 4,049,893 | |||||
| 7,000,000 | TransAmerica Asset Funding (c) | |||||
1.09%, 01/06/04 | 6,998,940 | |||||
| 2,600,000 | TransAmerica Asset Funding (c) | |||||
1.10%, 01/06/04 | 2,599,603 | |||||
| 87,204,927 | ||||||
Securities Broker - 0.3% | ||||||
| 1,000,000 | Barton Capital Corp. (c) | |||||
1.10%, 01/02/04 | 999,969 | |||||
Total Commercial Paper | 113,198,291 | |||||
(Cost $113,198,291) | ||||||
| CERTIFICATES OF DEPOSIT - 3.7% | ||||||
| 14,000,000 | Bank One NA Illinois | |||||
1.37%, 05/10/04 | 14,012,621 | |||||
Total Certificates of Deposit | 14,012,621 | |||||
(Cost $14,012,621) | ||||||
| Shares | ||||||
| INVESTMENT COMPANIES - 3.9% | ||||||
| 14,173,232 | Barclays Prime Money Market Fund | 14,173,232 | ||||
| 384,640 | Dreyfus Cash Management Plus Money Market Fund | 384,640 | ||||
| 76,246 | One Group Institutional Prime Money Market Fund | 76,246 | ||||
Total Investment Companies | 14,634,118 | |||||
(Cost $14,634,118) | ||||||
| Total Investments - 100.0% | 377,269,411 | |||||
| (Cost $377,269,411) | ||||||
| Net Other Assets and Liabilities - (0.0)% | (114,884 | ) | ||||
| Total Net Assets - 100.0% | $ | 377,154,527 | ||||
| (a) | Effective yield at time of purchase. |
| (b) | Variable rate security. The rate shown reflects rate in effect at period end. |
| (c) | Security exempt from registration under Rule 144A of the Securities Act of 1933. This security may be resold, in transactions exempt from registration, to qualified institutional buyers. At December 31, 2003, these securities amounted to $126,209,187 or 33.5% of net assets. These securities have been deemed to be liquid in accordance with procedures established by the Board of Trustees. |
MTN Medium Term Note
FEDERAL INCOME TAX INFORMATION (SEE NOTE 2)
At December 31, 2003, the aggregate cost of investment securities for tax purposes was $377,269,411.
As of December 31, 2003, the components of distributable earnings on a tax basis consisted of $76,370 of undistributed short-term capital gains.
During the year ended December 31, 2003, the tax character of distributions paid for ordinary income was $4,324,222.
See Notes to Financial Statements.
F-31
Table of Contents
ALLMERICA INVESTMENT TRUST
STATEMENTS OF ASSETS AND LIABILITIES • December 31, 2003
Select Capital Appreciation | Select Value Fund | ||||||
ASSETS: | |||||||
Investments: | |||||||
Investments at cost | $ | 218,893,920 | $ | 291,466,949 | |||
Net unrealized appreciation | 71,539,111 | 71,266,834 | |||||
Total investments at value† | 290,433,031 | 362,733,783 | |||||
Cash | 6,230 | 8,985,022 | |||||
Short-term investments held as collateral for securities loaned | 72,318,713 | 75,000,853 | |||||
Receivable for investments sold | 9,066,086 | 17,784,408 | |||||
Receivable for shares sold | — | — | |||||
Interest and dividend receivables | 39,564 | 390,295 | |||||
Receivable for variation margin | — | — | |||||
Dividend tax reclaim receivable | 850 | — | |||||
Miscellaneous receivable | — | — | |||||
Total Assets | 371,864,474 | 464,894,361 | |||||
LIABILITIES: | |||||||
Payable for investments purchased | 2,651,555 | 8,626,506 | |||||
Collateral for securities loaned | 72,318,713 | 75,000,853 | |||||
Management fee payable | 238,461 | 277,263 | |||||
Distribution fee payable | 39,684 | 47,948 | |||||
Trustees’ fees and expenses payable | 4,819 | 6,030 | |||||
Unrealized depreciation on forward currency contracts | — | — | |||||
Payable for shares repurchased | 357,451 | 81,558 | |||||
Accrued expenses and other payables | 49,859 | 53,208 | |||||
Total Liabilities | 75,660,542 | 84,093,366 | |||||
NET ASSETS | $ | 296,203,932 | $ | 380,800,995 | |||
NET ASSETS consist of: | |||||||
Paid-in capital | $ | 205,571,973 | $ | 289,671,332 | |||
Undistributed (distribution in excess of) net investment income (loss) | (6,647 | ) | 195,527 | ||||
Accumulated (distribution in excess of) net realized gain (loss) on investments sold, foreign currency transactions, written options transactions and futures contracts | 19,099,452 | 19,667,302 | |||||
Net unrealized appreciation of investments, assets and liabilities in foreign currency, written options contracts and futures contracts | 71,539,154 | 71,266,834 | |||||
TOTAL NET ASSETS | $ | 296,203,932 | $ | 380,800,995 | |||
Shares of beneficial interest outstanding (unlimited authorization, no par value) | 139,402,988 | 185,797,897 | |||||
NET ASSET VALUE, | |||||||
Offering and redemption price per share | |||||||
(Net Assets/Shares Outstanding) | $ | 2.125 | $ | 2.050 | |||
†Total value of securities on loan | $ | 69,817,387 | $ | 72,077,037 | |||
See Notes to Financial Statements.
F-32
Table of Contents
ALLMERICA INVESTMENT TRUST
| Select International Equity Fund | Select Growth Fund | Core Equity Fund | Equity Index Fund | Select Investment Grade Income Fund | Government Bond Fund | Money Market Fund | ||||||||||||||||||
| $ | 339,299,597 | $ | 527,661,492 | $ | 362,605,577 | $ | 641,132,235 | $ | 528,818,237 | $ | 196,305,777 | $ | 377,269,411 | |||||||||||
| 31,848,492 | 93,517,739 | 32,080,937 | 20,616,861 | 7,956,234 | 2,335,889 | — | ||||||||||||||||||
| 371,148,089 | 621,179,231 | 394,686,514 | 661,749,096 | 536,774,471 | 198,641,666 | 377,269,411 | ||||||||||||||||||
| 4,076,234 | 5,947,051 | 5,543,545 | 22,881 | 16,483 | 22,539 | 47,662 | ||||||||||||||||||
| 16,782,106 | 44,740,809 | 26,531,428 | 33,724,811 | 62,259,950 | 3,075,000 | — | ||||||||||||||||||
| 4,986,055 | 4,037,250 | 992,679 | 5,348,589 | 11,002,197 | 601 | — | ||||||||||||||||||
| 320,494 | — | — | — | — | — | — | ||||||||||||||||||
| 410,229 | 765,423 | 420,027 | 951,702 | 4,729,593 | 1,940,173 | 1,416,020 | ||||||||||||||||||
| — | — | — | 14,585 | — | — | — | ||||||||||||||||||
| 253,814 | 437 | — | — | — | — | — | ||||||||||||||||||
| — | — | — | 831 | — | — | — | ||||||||||||||||||
| 397,977,021 | 676,670,201 | 428,174,193 | 701,812,495 | 614,782,694 | 203,679,979 | 378,733,093 | ||||||||||||||||||
| — | 5,356,368 | 1,082,049 | 945,869 | 21,922,328 | — | — | ||||||||||||||||||
| 16,782,106 | 44,740,809 | 26,531,428 | 33,724,811 | 62,259,950 | 3,075,000 | — | ||||||||||||||||||
| 289,150 | 424,683 | 194,425 | 152,269 | 192,407 | 85,345 | 102,557 | ||||||||||||||||||
| 47,529 | 79,241 | 50,657 | 81,329 | 69,873 | 25,194 | 50,014 | ||||||||||||||||||
| 5,659 | 8,527 | 6,085 | 8,516 | 9,825 | 4,228 | 15,551 | ||||||||||||||||||
| 47,326 | — | — | — | — | — | — | ||||||||||||||||||
| 62,388 | 238,051 | 224,125 | 349,462 | 44,378 | 297,825 | 1,332,891 | ||||||||||||||||||
| 89,681 | 94,002 | 68,767 | 95,366 | 85,160 | 33,927 | 77,553 | ||||||||||||||||||
| 17,323,839 | 50,941,681 | 28,157,536 | 35,357,622 | 84,583,921 | 3,521,519 | 1,578,566 | ||||||||||||||||||
| $ | 380,653,182 | $ | 625,728,520 | $ | 400,016,657 | $ | 666,454,873 | $ | 530,198,773 | $ | 200,158,460 | $ | 377,154,527 | |||||||||||
| $ | 476,187,276 | $ | 914,144,261 | $ | 618,182,841 | $ | 799,316,120 | $ | 514,934,301 | $ | 199,257,384 | $ | 377,078,157 | |||||||||||
| 4,246,991 | — | 74,218 | 243,494 | 2,453,484 | (1,380,071 | ) | — | |||||||||||||||||
| (131,658,561 | ) | (381,933,480 | ) | (250,321,339 | ) | (153,776,239 | ) | 4,854,754 | (54,742 | ) | 76,370 | |||||||||||||
| 31,877,476 | 93,517,739 | 32,080,937 | 20,671,498 | 7,956,234 | 2,335,889 | — | ||||||||||||||||||
| $ | 380,653,182 | $ | 625,728,520 | $ | 400,016,657 | $ | 666,454,873 | $ | 530,198,773 | $ | 200,158,460 | $ | 377,154,527 | |||||||||||
| 343,538,181 | 435,022,474 | 255,091,917 | 271,646,433 | 473,647,666 | 181,359,208 | 377,079,783 | ||||||||||||||||||
| $ | 1.108 | $ | 1.438 | $ | 1.568 | $ | 2.453 | $ | 1.119 | $ | 1.104 | $ | 1.000 | |||||||||||
| $ | 15,881,176 | $ | 43,278,521 | $ | 25,403,868 | $ | 32,368,656 | $ | 60,877,929 | $ | 3,002,306 | $ | — | |||||||||||
F-33
Table of Contents
ALLMERICA INVESTMENT TRUST
STATEMENTS OF OPERATIONS • For the Year Ended December 31, 2003
Select Capital Appreciation Fund | Select Value Opportunity Fund | |||||||
INVESTMENT INCOME | ||||||||
Interest | $ | 57,260 | $ | 75,806 | ||||
Dividends | 1,091,450 | 3,550,829 | ||||||
Securities lending income | 62,263 | 61,066 | ||||||
Less net foreign taxes withheld | (14,268 | ) | (11,658 | ) | ||||
Total investment income | 1,196,705 | 3,676,043 | ||||||
EXPENSES | ||||||||
Management fees | 2,664,113 | 2,942,170 | ||||||
Distribution fees | 434,381 | 500,094 | ||||||
Custodian and Fund accounting fees | 102,175 | 102,169 | ||||||
Legal fees | 19,110 | 28,057 | ||||||
Audit fees | 26,244 | 29,580 | ||||||
Trustees’ fees and expenses | 20,790 | 23,967 | ||||||
Reports to shareholders | 7,232 | 9,644 | ||||||
Miscellaneous | 9,285 | 7,749 | ||||||
Total expenses before reductions | 3,283,330 | 3,643,430 | ||||||
Less reductions | (58,743 | ) | (215,019 | ) | ||||
Total expenses net of reductions | 3,224,587 | 3,428,411 | ||||||
NET INVESTMENT INCOME (LOSS) | (2,027,882 | ) | 247,632 | |||||
NET REALIZED AND UNREALIZED GAIN (LOSS) ON INVESTMENTS: | ||||||||
Net realized gain (loss) on investments sold | 32,291,183 | 23,799,027 | ||||||
Net realized gain on futures contracts | — | — | ||||||
Net realized gain (loss) on foreign currency transactions | (6,808 | ) | — | |||||
Net realized gain on written options contracts | — | — | ||||||
Net change in unrealized appreciation (depreciation) of investments | 65,606,143 | 83,321,848 | ||||||
Net change in unrealized appreciation (depreciation) of assets and liabilities in foreign currency | 43 | — | ||||||
NET GAIN (LOSS) ON INVESTMENTS | 97,890,561 | 107,120,875 | ||||||
NET INCREASE IN NET ASSETS RESULTING FROM OPERATIONS | $ | 95,862,679 | $ | 107,368,507 | ||||
See Notes to Financial Statements.
F-34
Table of Contents
ALLMERICA INVESTMENT TRUST
Select International Equity Fund | Select Growth Fund | Core Equity Fund | Equity Index Fund | Select Investment Grade Income Fund | Government Bond Fund | Money Market Fund | |||||||||||||||||||
| $ | 32,956 | $ | 15,742 | $ | 11,072 | $ | 58,591 | $ | 24,446,077 | $ | 9,025,072 | $ | 7,084,963 | ||||||||||||
| 9,859,219 | 5,099,958 | 6,227,519 | 9,752,688 | — | — | — | |||||||||||||||||||
| 124,165 | 50,138 | 26,461 | 30,027 | 51,290 | 51,501 | — | |||||||||||||||||||
| (1,110,389 | ) | (25,216 | ) | — | — | — | — | — | |||||||||||||||||
| 8,905,951 | 5,140,622 | 6,265,052 | 9,841,306 | 24,497,367 | 9,076,573 | 7,084,963 | |||||||||||||||||||
| 3,081,227 | 4,392,642 | 2,211,402 | 1,498,250 | 2,497,160 | 1,286,446 | 1,600,664 | |||||||||||||||||||
| 504,614 | 807,635 | 569,019 | 809,596 | 907,972 | 385,562 | 789,478 | |||||||||||||||||||
| 304,988 | 264,821 | 106,258 | 247,982 | 228,660 | 74,602 | 183,114 | |||||||||||||||||||
| 42,507 | 51,674 | 32,892 | 39,191 | 62,775 | 23,191 | 61,681 | |||||||||||||||||||
| 30,629 | 51,659 | 32,954 | 44,452 | 52,948 | 25,574 | 66,224 | |||||||||||||||||||
| 23,169 | 29,666 | 24,377 | 31,698 | 33,615 | 20,796 | 54,533 | |||||||||||||||||||
| 23,956 | 141,536 | 63,625 | 1,429 | 36,503 | 15,417 | 34,036 | |||||||||||||||||||
| 9,084 | 10,227 | 12,907 | 13,282 | 761 | 2,826 | 8,476 | |||||||||||||||||||
| 4,020,174 | 5,749,860 | 3,053,434 | 2,685,880 | 3,820,394 | 1,834,414 | 2,798,206 | |||||||||||||||||||
| (43,277 | ) | (181,695 | ) | (107,946 | ) | (266,753 | ) | — | — | — | |||||||||||||||
| 3,976,897 | 5,568,165 | 2,945,488 | 2,419,127 | 3,820,394 | 1,834,414 | 2,798,206 | |||||||||||||||||||
| 4,929,054 | (427,543 | ) | 3,319,564 | 7,422,179 | 20,676,973 | 7,242,159 | 4,286,757 | ||||||||||||||||||
| (31,738,395 | ) | (36,540,308 | ) | (25,175,235 | ) | (26,056,158 | ) | 17,769,538 | 3,288,747 | 76,830 | |||||||||||||||
| — | — | — | 963,344 | 138,413 | — | — | |||||||||||||||||||
| (815,252 | ) | (29,740 | ) | — | (944 | ) | 2,646,278 | — | — | ||||||||||||||||
| — | 1,700 | — | — | 18,798 | — | — | |||||||||||||||||||
| 113,020,078 | 171,038,236 | 113,866,094 | 166,019,862 | (18,927,861 | ) | (6,228,693 | ) | — | |||||||||||||||||
| 143,853 | — | — | — | (210,271 | ) | — | — | ||||||||||||||||||
| 80,610,284 | 134,469,888 | 88,690,859 | 140,926,104 | 1,434,895 | (2,939,946 | ) | 76,830 | ||||||||||||||||||
| $ | 85,539,338 | $ | 134,042,345 | $ | 92,010,423 | $ | 148,348,283 | $ | 22,111,868 | $ | 4,302,213 | $ | 4,363,587 | ||||||||||||
F-35
Table of Contents
ALLMERICA INVESTMENT TRUST
STATEMENTS OF CHANGES IN NET ASSETS
Select Capital Appreciation Fund | ||||||||
Years Ended December 31, | ||||||||
| 2003 | 2002 | |||||||
NET ASSETS at beginning of year | $ | 287,593,224 | $ | 435,863,705 | ||||
Increase (decrease) in net assets resulting from operations: | ||||||||
Net investment income (loss) | (2,027,882 | ) | (2,557,333 | ) | ||||
Net realized gain (loss) on investments sold and foreign currency transactions | 32,284,375 | 950,749 | ||||||
Net change in unrealized appreciation (depreciation) of investments, assets and liabilities in foreign currency, written option contracts and futures contracts | 65,606,186 | (92,440,948 | ) | |||||
Net increase (decrease) in net assets resulting from operations | 95,862,679 | (94,047,532 | ) | |||||
Distributions to shareholders from: | ||||||||
Net investment income | — | — | ||||||
Net realized gain on investments | — | — | ||||||
Total distributions | — | — | ||||||
Capital share transactions: | ||||||||
Net proceeds from sales of shares | 8,543,704 | 13,237,382 | ||||||
Value of shares issued in exchange for the net assets of the Select Aggressive Growth Fund (Note 9) | — | — | ||||||
Value of shares issued in exchange for the net assets of the Select Strategic Growth Fund (Note 9) | — | — | ||||||
Value of shares issued in exchange for the net assets of the Select Emerging Markets Fund (Note 9) | — | — | ||||||
Issued to shareholders in reinvestment of distributions | — | — | ||||||
Cost of shares repurchased | (95,795,675 | ) | (67,460,331 | ) | ||||
Net increase (decrease) from capital share transactions | (87,251,971 | ) | (54,222,949 | ) | ||||
Total increase (decrease) in net assets | 8,610,708 | (148,270,481 | ) | |||||
NET ASSETS at end of year | $ | 296,203,932 | $ | 287,593,224 | ||||
Undistributed (distribution in excess of) net investment income (loss) | $ | (6,647 | ) | $ | (2 | ) | ||
OTHER INFORMATION: | ||||||||
Share transactions: | ||||||||
Sold | 4,455,481 | 7,193,851 | ||||||
Issued in exchange for the shares of the Select Aggressive Growth Fund (Note 9) | — | — | ||||||
Issued in exchange for the shares of the Select Strategic Growth Fund (Note 9) | — | — | ||||||
Issued in exchange for the shares of the Select Emerging Markets Fund (Note 9) | — | — | ||||||
Issued to shareholders in reinvestment of distributions | — | — | ||||||
Repurchased | (54,083,864 | ) | (42,804,867 | ) | ||||
Net increase (decrease) in shares outstanding | (49,628,383 | ) | (35,611,016 | ) | ||||
See Notes to Financial Statements.
F-36
Table of Contents
ALLMERICA INVESTMENT TRUST
Select Value Opportunity Fund | Select International Equity Fund | Select Growth Fund | Core Equity Fund | |||||||||||||||||||||||||||
| Years Ended December 31, | Years Ended December 31, | Years Ended December 31, | Years Ended December 31, | |||||||||||||||||||||||||||
| 2003 | 2002 | 2003 | 2002 | 2003 | 2002 | 2003 | 2002 | |||||||||||||||||||||||
| $ | 351,830,989 | $ | 440,335,089 | $ | 335,889,657 | $ | 460,006,450 | $ | 375,958,982 | $ | 660,892,540 | $ | 401,888,470 | $ | 673,752,990 | |||||||||||||||
| 247,632 | 494,004 | 4,929,054 | 4,714,748 | (427,543 | ) | 247,125 | 3,319,564 | 4,104,620 | ||||||||||||||||||||||
| 23,799,027 | (2,962,234 | ) | (32,553,647 | ) | (70,636,155 | ) | (36,568,348 | ) | (102,291,344 | ) | (25,175,235 | ) | (87,239,808 | ) | ||||||||||||||||
| 83,321,848 | (73,857,508 | ) | 113,163,931 | (18,848,771 | ) | 171,038,236 | (73,300,418 | ) | 113,866,094 | (65,291,304 | ) | |||||||||||||||||||
| 107,368,507 | (76,325,738 | ) | 85,539,338 | (84,770,178 | ) | 134,042,345 | (175,344,637 | ) | 92,010,423 | (148,426,492 | ) | |||||||||||||||||||
| (398,223 | ) | (2,569,624 | ) | (2,710,560 | ) | (6,485,063 | ) | (247,303 | ) | (860,385 | ) | (3,286,534 | ) | (4,267,718 | ) | |||||||||||||||
| (966,976 | ) | (37,133,238 | ) | — | (3,713,786 | ) | — | — | — | — | ||||||||||||||||||||
| (1,365,199 | ) | (39,702,862 | ) | (2,710,560 | ) | (10,198,849 | ) | (247,303 | ) | (860,385 | ) | (3,286,534 | ) | (4,267,718 | ) | |||||||||||||||
| 14,815,521 | 67,470,986 | 20,021,820 | 180,993,225 | 1,501,786 | 7,490,096 | 1,552,913 | 1,921,318 | |||||||||||||||||||||||
| — | — | — | — | 259,023,031 | — | — | — | |||||||||||||||||||||||
| — | — | — | — | 17,766,775 | — | — | — | |||||||||||||||||||||||
| — | — | 45,260,073 | — | — | — | — | — | |||||||||||||||||||||||
| 1,365,199 | 39,702,862 | 2,710,560 | 10,198,849 | 247,303 | 860,385 | 3,286,534 | 4,267,718 | |||||||||||||||||||||||
| (93,214,022 | ) | (79,649,348 | ) | (106,057,706 | ) | (220,339,840 | ) | (162,564,399 | ) | (117,079,017 | ) | (95,435,149 | ) | (125,359,346 | ) | |||||||||||||||
| (77,033,302 | ) | 27,524,500 | (38,065,253 | ) | (29,147,766 | ) | 115,974,496 | (108,728,536 | ) | (90,595,702 | ) | (119,170,310 | ) | |||||||||||||||||
| 28,970,006 | (88,504,100 | ) | 44,763,525 | (124,116,793 | ) | 249,769,538 | (284,933,558 | ) | (1,871,813 | ) | (271,864,520 | ) | ||||||||||||||||||
| $ | 380,800,995 | $ | 351,830,989 | $ | 380,653,182 | $ | 335,889,657 | $ | 625,728,520 | $ | 375,958,982 | $ | 400,016,657 | $ | 401,888,470 | |||||||||||||||
| $ | 195,527 | $ | 494,003 | $ | 4,246,991 | $ | 2,909,705 | $ | — | $ | 247,118 | $ | 74,218 | $ | 41,188 | |||||||||||||||
| 9,694,636 | 37,651,169 | 21,677,491 | 182,043,260 | 1,068,140 | 5,062,244 | 1,174,083 | 1,512,659 | |||||||||||||||||||||||
| — | — | — | — | 220,257,679 | — | — | — | |||||||||||||||||||||||
| — | — | — | — | 15,107,801 | — | — | — | |||||||||||||||||||||||
| — | — | 52,384,344 | — | — | — | — | — | |||||||||||||||||||||||
| 789,132 | 25,224,182 | 2,850,221 | 10,525,128 | 188,063 | 674,283 | 2,410,772 | 3,200,648 | |||||||||||||||||||||||
| (61,302,191 | ) | (49,241,628 | ) | (117,523,711 | ) | (221,703,483 | ) | (131,719,570 | ) | (94,889,188 | ) | (72,880,614 | ) | (92,816,807 | ) | |||||||||||||||
| (50,818,423 | ) | 13,633,723 | (40,611,655 | ) | (29,135,095 | ) | 104,902,113 | (89,152,661 | ) | (69,295,759 | ) | (88,103,500 | ) | |||||||||||||||||
F-37
Table of Contents
ALLMERICA INVESTMENT TRUST
STATEMENTS OF CHANGES IN NET ASSETS
Equity Index Fund | ||||||||
Years Ended December 31, | ||||||||
| 2003 | 2002 | |||||||
NET ASSETS at beginning of year | $ | 342,682,878 | $ | 517,315,322 | ||||
Increase (decrease) in net assets resulting from operations: | ||||||||
Net investment income | 7,422,179 | 5,053,941 | ||||||
Net realized gain (loss) on investments sold, foreign currency transactions, written option transactions and futures contracts | (25,093,758 | ) | (8,569,701 | ) | ||||
Net change in unrealized appreciation (depreciation) of investments, assets and liabilities in foreign currency, written option contracts and futures contracts | 166,019,862 | (112,255,534 | ) | |||||
Net increase (decrease) in net assets resulting from operations | 148,348,283 | (115,771,294 | ) | |||||
Distributions to shareholders from: | ||||||||
Net investment income | (7,143,778 | ) | (5,185,015 | ) | ||||
Net realized gain on investments | — | (27,569,023 | ) | |||||
Total distributions | (7,143,778 | ) | (32,754,038 | ) | ||||
Capital share transactions: | ||||||||
Net proceeds from sales of shares | 9,845,737 | 29,174,075 | ||||||
Value of shares issued in exchange for the net assets of the Select Strategic Income Fund (Note 9) | — | — | ||||||
Value of shares issued in exchange for the net assets of the Select Growth and Income Fund (Note 9) | 292,154,078 | — | ||||||
Issued to shareholders in reinvestment of distributions | 7,143,778 | 32,754,038 | ||||||
Cost of shares repurchased | (126,576,103 | ) | (88,035,225 | ) | ||||
Net increase (decrease) from capital share transactions | 182,567,490 | (26,107,112 | ) | |||||
Total increase (decrease) in net assets | 323,771,995 | (174,632,444 | ) | |||||
NET ASSETS at end of year | $ | 666,454,873 | $ | 342,682,878 | ||||
Undistributed (distribution in excess of) net investment income (loss) | $ | 243,494 | $ | 29,655 | ||||
OTHER INFORMATION: | ||||||||
Share transactions: | ||||||||
Sold | 4,812,165 | 11,937,167 | ||||||
Issued in exchange for the shares of the Select Strategic Income Fund (Note 9) | — | — | ||||||
Issued in exchange for the shares of the Select Growth and Income Fund (Note 9) | 147,106,786 | — | ||||||
Issued to shareholders in reinvestment of distributions | 3,254,461 | 15,370,677 | ||||||
Repurchased | (59,805,637 | ) | (41,539,895 | ) | ||||
Net increase (decrease) in shares outstanding | 95,367,775 | (14,232,051 | ) | |||||
See Notes to Financial Statements.
F-38
Table of Contents
ALLMERICA INVESTMENT TRUST
Select Investment Grade Income Fund | Government Bond Fund | Money Market Fund | ||||||||||||||||||||
Years Ended December 31, | Years Ended December 31, | Years Ended December 31, | ||||||||||||||||||||
| 2003 | 2002 | 2003 | 2002 | 2003 | 2002 | |||||||||||||||||
| $ | 620,074,063 | $ | 571,582,104 | $ | 291,995,366 | $ | 116,513,871 | $ | 704,804,637 | $ | 604,656,688 | |||||||||||
| 20,676,973 | 30,020,772 | 7,242,159 | 5,893,003 | 4,286,757 | 10,414,765 | |||||||||||||||||
| 20,573,027 | 2,102,222 | 3,288,747 | 839,254 | 76,830 | 48,471 | |||||||||||||||||
| (19,138,132 | ) | 16,023,439 | (6,228,693 | ) | 7,745,330 | — | — | |||||||||||||||
| 22,111,868 | 48,146,433 | 4,302,213 | 14,477,587 | 4,363,587 | 10,463,236 | |||||||||||||||||
| (26,622,750 | ) | (32,973,670 | ) | (9,748,622 | ) | (7,053,538 | ) | (4,286,757 | ) | (10,414,765 | ) | |||||||||||
| — | — | — | — | (37,465 | ) | — | ||||||||||||||||
| (26,622,750 | ) | (32,973,670 | ) | (9,748,622 | ) | (7,053,538 | ) | (4,324,222 | ) | (10,414,765 | ) | |||||||||||
| 9,154,551 | 92,838,100 | 23,186,088 | 201,562,216 | 181,842,312 | 962,438,922 | |||||||||||||||||
| 142,624,667 | — | — | — | — | — | |||||||||||||||||
| — | — | — | — | — | — | |||||||||||||||||
| 26,622,750 | 32,973,670 | 9,748,622 | 7,053,538 | 4,324,222 | 10,414,765 | |||||||||||||||||
| (263,766,376 | ) | (92,492,574 | ) | (119,325,207 | ) | (40,558,308 | ) | (513,856,009 | ) | (872,754,209 | ) | |||||||||||
| (85,364,408 | ) | 33,319,196 | (86,390,497 | ) | 168,057,446 | (327,689,475 | ) | 100,099,478 | ||||||||||||||
| (89,875,290 | ) | 48,491,959 | (91,836,906 | ) | 175,481,495 | (327,650,110 | ) | 100,147,949 | ||||||||||||||
| $ | 530,198,773 | $ | 620,074,063 | $ | 200,158,460 | $ | 291,995,366 | $ | 377,154,527 | $ | 704,804,637 | |||||||||||
| $ | 2,453,484 | $ | 80,938 | $ | (1,380,071 | ) | $ | (960,067 | ) | $ | — | $ | — | |||||||||
| 10,096,929 | 83,168,665 | 20,555,005 | 180,409,403 | 181,842,312 | 962,438,922 | |||||||||||||||||
| 125,882,319 | — | — | — | — | — | |||||||||||||||||
| — | — | — | — | — | — | |||||||||||||||||
| 23,532,345 | 29,641,576 | 8,674,020 | 6,370,987 | 4,324,222 | 10,414,765 | |||||||||||||||||
| (232,888,459 | ) | (82,522,052 | ) | (106,259,141 | ) | (36,622,170 | ) | (513,856,009 | ) | (872,754,209 | ) | |||||||||||
| (73,376,866 | ) | 30,288,189 | (77,030,116 | ) | 150,158,220 | (327,689,475 | ) | 100,099,478 | ||||||||||||||
F-39
Table of Contents
ALLMERICA INVESTMENT TRUST
FINANCIAL HIGHLIGHTS - For a Share Outstanding Throughout Each Period
| Income from Investment Operations | Less Distributions | ||||||||||||||||||||||||||||||
Year Ended December 31, | Net Asset Value Beginning of Year | Net Investment Income (Loss)(2) | Net Realized and Unrealized Gain (Loss) on Investments | Total from Investment Operations | Dividends from Net Investment Income | Distributions from Net Realized Capital Gains | Total Distributions | Net Increase (Decrease) in Net Asset Value | |||||||||||||||||||||||
Select Capital Appreciation Fund | |||||||||||||||||||||||||||||||
2003 | $ | 1.521 | $ | (0.015 | ) | $ | 0.619 | $ | 0.604 | $ | — | $ | — | $ | — | $ | 0.604 | ||||||||||||||
2002 | 1.940 | (0.014 | ) | (0.405 | ) | (0.419 | ) | — | — | — | (0.419 | ) | |||||||||||||||||||
2001 | 2.122 | (0.010 | ) | (0.019 | ) | (0.029 | ) | — | (0.153 | ) | (0.153 | ) | (0.182 | ) | |||||||||||||||||
2000 | 2.053 | (0.008 | ) | 0.147 | 0.139 | — | (0.070 | ) | (0.070 | ) | 0.069 | ||||||||||||||||||||
1999 | 1.640 | (0.007 | ) | 0.423 | 0.416 | — | (0.003 | ) | (0.003 | ) | 0.413 | ||||||||||||||||||||
Select Value Opportunity Fund | |||||||||||||||||||||||||||||||
2003 | $ | 1.487 | $ | 0.002 | $ | 0.568 | $ | 0.570 | $ | (0.002 | ) | $ | (0.005 | ) | $ | (0.007 | ) | $ | 0.563 | ||||||||||||
2002 | 1.975 | 0.002 | (0.315 | ) | (0.313 | ) | (0.011 | ) | (0.164 | ) | (0.175 | ) | (0.488 | ) | |||||||||||||||||
2001 | 1.958 | 0.012 | 0.225 | 0.237 | (0.012 | ) | (0.208 | ) | (0.220 | ) | 0.017 | ||||||||||||||||||||
2000 | 1.521 | 0.012 | 0.446 | 0.458 | (0.006 | ) | (0.015 | ) | (0.021 | ) | 0.437 | ||||||||||||||||||||
1999 | 1.686 | 0.006 | (0.077 | ) | (0.071 | ) | — | (0.094 | ) | (0.094 | ) | (0.165 | ) | ||||||||||||||||||
Select International Equity Fund | |||||||||||||||||||||||||||||||
2003 | $ | 0.874 | $ | 0.015 | $ | 0.226 | $ | 0.241 | $ | (0.007 | ) | $ | — | $ | (0.007 | ) | $ | 0.234 | |||||||||||||
2002 | 1.113 | 0.013 | (0.226 | ) | (0.213 | ) | (0.017 | ) | (0.009 | ) | (0.026 | ) | (0.239 | ) | |||||||||||||||||
2001 | 1.781 | 0.018 | (0.385 | ) | (0.367 | ) | (0.024 | ) | (0.277 | ) | (0.301 | ) | (0.668 | ) | |||||||||||||||||
2000 | 2.031 | 0.013 | (0.191 | ) | (0.178 | ) | (0.009 | ) | (0.063 | ) | (0.072 | ) | (0.250 | ) | |||||||||||||||||
1999 | 1.542 | 0.012 | 0.477 | 0.489 | — | — | — | 0.489 | |||||||||||||||||||||||
Select Growth Fund(1) | |||||||||||||||||||||||||||||||
2003 | $ | 1.139 | $ | (0.001 | ) | $ | 0.301 | $ | 0.300 | $ | (0.001 | ) | $ | — | $ | (0.001 | ) | $ | 0.299 | ||||||||||||
2002 | 1.576 | 0.001 | (0.436 | ) | (0.435 | ) | (0.002 | ) | — | (0.002 | ) | (0.437 | ) | ||||||||||||||||||
2001 | 2.214 | 0.002 | (0.545 | ) | (0.543 | ) | — | (0.095 | ) | (0.095 | ) | (0.638 | ) | ||||||||||||||||||
2000 | 3.049 | (0.001 | ) | (0.489 | ) | (0.490 | ) | — | (0.345 | ) | (0.345 | ) | (0.835 | ) | |||||||||||||||||
1999 | 2.428 | (0.002 | ) | 0.709 | 0.707 | (0.001 | ) | (0.085 | ) | (0.086 | ) | 0.621 | |||||||||||||||||||
Core Equity Fund(1) | |||||||||||||||||||||||||||||||
2003 | $ | 1.239 | $ | 0.012 | $ | 0.329 | $ | 0.341 | $ | (0.012 | ) | $ | — | $ | (0.012 | ) | $ | 0.329 | |||||||||||||
2002 | 1.633 | 0.011 | (3) | (0.393 | ) | (0.382 | ) | (0.012 | ) | — | (0.012 | ) | (0.394 | ) | |||||||||||||||||
2001 | 2.689 | 0.016 | (0.439 | ) | (0.423 | ) | (0.015 | ) | (0.618 | ) | (0.633 | ) | (1.056 | ) | |||||||||||||||||
2000 | 3.310 | 0.016 | (0.295 | ) | (0.279 | ) | (0.017 | ) | (0.325 | ) | (0.342 | ) | (0.621 | ) | |||||||||||||||||
1999 | 2.825 | 0.020 | 0.779 | 0.799 | (0.020 | ) | (0.294 | ) | (0.314 | ) | 0.485 | ||||||||||||||||||||
| (a) | Including reimbursements, waivers and reductions. |
| (b) | Excluding reductions. Certain Portfolios have entered varying arrangements with brokers who reduced a portion of the Portfolio’s expenses. |
| (c) | Excluding reimbursements and reductions. |
| (1) | The Select Growth Fund added a second sub-advisor on April 18, 2003. The Core Equity Fund changed sub-advisors on May 1, 2002. |
| (2) | Net investment income (loss) per share before reimbursements of fees by the investment adviser or reductions were $0.001 in 2003, $0.000 in 2002, $0.011 in 2001, $0.011 in 2000, and $0.005 in 1999 for Select Value Opportunity Fund; $0.011 in 1999 for Select International Equity Fund; $(0.002) in 2003, $0.000 in 2002, $0.001 in 2001, $(0.002) in 2000, and $(0.003) in 1999 for Select Growth Fund; and $0.014 in 2001, $0.015 in 2000, and $0.019 in 1999 for Core Equity Fund. |
| (3) | Computed using average shares outstanding throughout the period. |
See Notes to Financial Statements.
F-40
Table of Contents
ALLMERICA INVESTMENT TRUST
| Ratios/Supplemental Data | ||||||||||||||||||||||||||||
| Ratios To Average Net Assets | ||||||||||||||||||||||||||||
Net Asset Value End of Period | Total Return | Net Assets End of Period (000’s) | Net Investment Income (Loss) | Operating Expenses | Management Fee | Portfolio Turnover Rate | ||||||||||||||||||||||
| (a) | (b) | (c) | Gross | Net | ||||||||||||||||||||||||
| $ | 2.125 | 39.71 | % | $ | 296,204 | (0.70 | )% | 1.11 | % | 1.13 | % | 1.13 | % | 0.92 | % | 0.92 | % | 46 | % | |||||||||
| 1.521 | (21.60 | )% | 287,593 | (0.70 | )% | 1.05 | % | 1.06 | % | 1.06 | % | 0.90 | % | 0.90 | % | 41 | % | |||||||||||
| 1.940 | (1.14 | )% | 435,864 | (0.51 | )% | 0.93 | % | 0.94 | % | 0.94 | % | 0.88 | % | 0.88 | % | 44 | % | |||||||||||
| 2.122 | 6.81 | % | 510,483 | (0.38 | )% | 0.93 | % | 0.94 | % | 0.94 | % | 0.87 | % | 0.87 | % | 53 | % | |||||||||||
| 2.053 | 25.36 | % | 417,087 | (0.42 | )% | 0.98 | % | 0.98 | % | 0.98 | % | 0.91 | % | 0.91 | % | 61 | % | |||||||||||
| $ | 2.050 | 38.43 | % | $ | 380,801 | 0.07 | % | 1.03 | % | 1.09 | % | 1.09 | % | 0.88 | % | 0.88 | % | 117 | % | |||||||||
| 1.487 | (16.32 | )% | 351,831 | 0.12 | % | 0.96 | % | 1.03 | % | 1.03 | % | 0.87 | % | 0.87 | % | 94 | % | |||||||||||
| 1.975 | 12.70 | % | 440,335 | 0.63 | % | 0.87 | % | 0.92 | % | 0.92 | % | 0.87 | % | 0.87 | % | 97 | % | |||||||||||
| 1.958 | 30.40 | % | 397,541 | 0.71 | % | 0.87 | % | 0.94 | % | 0.94 | % | 0.88 | % | 0.88 | % | 22 | % | |||||||||||
| 1.521 | (4.70 | )% | 308,331 | 0.43 | % | 0.88 | % | 0.97 | % | 0.97 | % | 0.90 | % | 0.90 | % | 98 | % | |||||||||||
| $ | 1.108 | 27.77 | % | $ | 380,653 | 1.46 | % | 1.18 | % | 1.19 | % | 1.19 | % | 0.92 | % | 0.92 | % | 28 | % | |||||||||
| 0.874 | (19.37 | )% | 335,890 | 1.17 | % | 1.13 | % | 1.14 | % | 1.14 | % | 0.91 | % | 0.91 | % | 14 | % | |||||||||||
| 1.113 | (21.43 | )% | 460,006 | 0.97 | % | 0.99 | % | 1.01 | % | 1.01 | % | 0.89 | % | 0.89 | % | 26 | % | |||||||||||
| 1.781 | (9.03 | )% | 679,128 | 0.77 | % | 0.98 | % | 0.99 | % | 0.99 | % | 0.88 | % | 0.88 | % | 24 | % | |||||||||||
| 2.031 | 31.71 | % | 679,341 | 0.69 | % | 1.01 | % | 1.02 | % | 1.02 | % | 0.89 | % | 0.89 | % | 18 | % | |||||||||||
| $ | 1.438 | 26.30 | % | $ | 625,729 | (0.08 | )% | 1.03 | % | 1.07 | % | 1.07 | % | 0.81 | % | 0.81 | % | 75 | % | |||||||||
| 1.139 | (27.60 | )% | 375,959 | 0.05 | % | 0.95 | % | 1.01 | % | 1.01 | % | 0.82 | % | 0.82 | % | 125 | % | |||||||||||
| 1.576 | (24.71 | )% | 660,893 | 0.12 | % | 0.78 | % | 0.85 | % | 0.85 | % | 0.79 | % | 0.79 | % | 91 | % | |||||||||||
| 2.214 | (17.79 | )% | 1,040,237 | (0.05 | )% | 0.80 | % | 0.81 | % | 0.81 | % | 0.76 | % | 0.76 | % | 79 | % | |||||||||||
| 3.049 | 29.80 | % | 1,216,365 | (0.08 | )% | 0.81 | % | 0.83 | % | 0.83 | % | 0.78 | % | 0.78 | % | 84 | % | |||||||||||
| $ | 1.568 | 27.67 | % | $ | 400,017 | 0.88 | % | 0.78 | % | 0.80 | % | 0.80 | % | 0.58 | % | 0.58 | % | 27 | % | |||||||||
| 1.239 | (23.45 | )% | 401,888 | 0.78 | % | 0.70 | % | 0.74 | % | 0.74 | % | 0.57 | % | 0.57 | % | 115 | % | |||||||||||
| 1.633 | (16.90 | )% | 673,753 | 0.75 | % | 0.58 | % | 0.61 | % | 0.61 | % | 0.55 | % | 0.55 | % | 134 | % | |||||||||||
| 2.689 | (9.51 | )% | 924,904 | 0.51 | % | 0.44 | % | 0.50 | % | 0.50 | % | 0.45 | % | 0.45 | % | 190 | % | |||||||||||
| 3.310 | 29.33 | % | 1,076,297 | 0.65 | % | 0.45 | % | 0.48 | % | 0.48 | % | 0.43 | % | 0.43 | % | 116 | % | |||||||||||
F-41
Table of Contents
ALLMERICA INVESTMENT TRUST
FINANCIAL HIGHLIGHTS - For a Share Outstanding Throughout Each Period
| Income from Investment Operations | Less Distributions(d) | ||||||||||||||||||||||||||||||
Year Ended December 31, | Net Asset Value Beginning of Year | Net Investment Income(2) | Net Realized and Unrealized Gain (Loss) on Investments | Total from Investment Operations | Dividends from Net Investment Income | Distributions from Net Realized Capital Gains | Total Distributions | Net (Decrease) in Net Value | |||||||||||||||||||||||
Equity Index Fund | |||||||||||||||||||||||||||||||
2003 | $ | 1.944 | $ | 0.029 | $ | 0.508 | $ | 0.537 | $ | (0.028 | ) | $ | — | $ | (0.028 | ) | $ | 0.509 | |||||||||||||
2002 | 2.715 | 0.027 | (0.616 | ) | (0.589 | ) | (0.028 | ) | (0.154 | ) | (0.182 | ) | (0.771 | ) | |||||||||||||||||
2001 | 3.299 | 0.030 | (0.422 | ) | (0.392 | ) | (0.029 | ) | (0.163 | ) | (0.192 | ) | (0.584 | ) | |||||||||||||||||
2000 | 4.060 | 0.032 | (0.362 | ) | (0.330 | ) | (0.034 | ) | (0.397 | ) | (0.431 | ) | (0.761 | ) | |||||||||||||||||
1999 | 3.408 | 0.036 | 0.656 | 0.692 | (0.035 | ) | (0.005 | ) | (0.040 | ) | 0.652 | ||||||||||||||||||||
Select Investment Grade Income Fund(1) | |||||||||||||||||||||||||||||||
2003 | $ | 1.134 | $ | 0.040 | $ | (0.003 | )(3) | $ | 0.037 | $ | (0.052 | ) | $ | — | $ | (0.052 | ) | $ | (0.015 | ) | |||||||||||
2002 | 1.106 | 0.054 | 0.034 | 0.088 | (0.060 | ) | — | (0.060 | ) | 0.028 | |||||||||||||||||||||
2001 | 1.086 | 0.064 | (4) | 0.021 | 0.085 | (0.065 | ) | — | (0.065 | ) | 0.020 | ||||||||||||||||||||
2000 | 1.051 | 0.070 | 0.035 | 0.105 | (0.070 | ) | — | (0.070 | ) | 0.035 | |||||||||||||||||||||
1999 | 1.132 | 0.068 | (0.079 | ) | (0.011 | ) | (0.069 | ) | (0.001 | ) | (0.070 | ) | (0.081 | ) | |||||||||||||||||
Government Bond Fund(1) | |||||||||||||||||||||||||||||||
2003 | $ | 1.130 | $ | 0.030 | $ | (0.011 | ) | $ | 0.019 | $ | (0.045 | ) | $ | — | $ | (0.045 | ) | $ | (0.026 | ) | |||||||||||
2002 | 1.077 | 0.041 | 0.057 | 0.098 | (0.045 | ) | — | (0.045 | ) | 0.053 | |||||||||||||||||||||
2001 | 1.051 | 0.049 | (4) | 0.030 | 0.079 | (0.053 | ) | — | (0.053 | ) | 0.026 | ||||||||||||||||||||
2000 | 1.011 | 0.058 | 0.040 | 0.098 | (0.058 | ) | — | (0.058 | ) | 0.040 | |||||||||||||||||||||
1999 | 1.068 | 0.058 | (0.056 | ) | 0.002 | (0.059 | ) | — | (0.059 | ) | (0.057 | ) | |||||||||||||||||||
Money Market Fund | |||||||||||||||||||||||||||||||
2003 | $ | 1.000 | $ | 0.008 | $ | — | $ | 0.008 | $ | (0.008 | ) | $ | — | (5) | $ | (0.008 | ) | $ | — | ||||||||||||
2002 | 1.000 | 0.016 | — | 0.016 | (0.016 | ) | — | (0.016 | ) | — | |||||||||||||||||||||
2001 | 1.000 | 0.042 | — | 0.042 | (0.042 | ) | — | (0.042 | ) | — | |||||||||||||||||||||
2000 | 1.000 | 0.062 | — | 0.062 | (0.062 | ) | — | (0.062 | ) | — | |||||||||||||||||||||
1999 | 1.000 | 0.051 | — | 0.051 | (0.051 | ) | — | (0.051 | ) | — | |||||||||||||||||||||
| (a) | Including reimbursements, waivers and reductions. |
| (b) | Excluding reductions. Certain Portfolios have entered into varying arrangements with brokers who reduced a portion of the Portfolio’s expenses. |
| (c) | Excluding reimbursements and reductions. |
| (d) | Certain prior year amounts have been reclassified to conform to current year presentation. |
| (1) | Effective January 1, 2001 the Select Investment Grade Income Fund and Government Bond Fund adopted the provisions of the AICPA Audit and Accounting Guide for Investment Companies and are amortizing premium and discount on debt securities using the daily effective yield method. The effect of this change for the year ended December 31, 2001 was a decrease in net investment income per share by $0.003 for Select Investment Grade Income Fund and a decrease in net investment income per share by $0.007 for Government Bond Fund, an increase in net realized and unrealized gains and losses per share by $0.003 for Select Investment Grade Income Fund and an increase in net realized and unrealized gains and losses per share by $0.007 for Government Bond Fund and a decrease in the ratio of net investment income to average net assets from 6.04% to 5.79% for Select Investment Grade Income Fund and a decrease in the ratio of net investment income to average net assets from 5.16% to 4.52% for Government Bond Fund. Per share data and ratio/supplemental data for periods prior to January 1, 2001 have not been restated to reflect this change in presentation. |
| (2) | Net investment income (loss) per share before reimbursement of fees by the investment advisor was $0.028 in 2003 and $0.029 in 2001 for Equity Index Fund. |
| (3) | The amount shown for a share outstanding does not correspond with the aggregate net gain on investments for the period due to the timing of sales and repurchases of Portfolio shares in relation to the fluctuating market values of the investments of the Portfolio. |
| (4) | Computed using average shares outstanding throughout the period. |
| (5) | Distributions from net realized gains are less than $.0005 |
See Notes to Financial Statements.
F-42
Table of Contents
ALLMERICA INVESTMENT TRUST
| Ratios/Supplemental Data | ||||||||||||||||||||||||||||
| Ratios To Average Net Assets | ||||||||||||||||||||||||||||
| Net Asset Value End of Period | Total Return | Net Assets End of Period (000’s) | Net Investment Income | Operating Expenses | Management Fee | Portfolio Turnover Rate | ||||||||||||||||||||||
| (a) | (b) | (c) | Gross | Net | ||||||||||||||||||||||||
| $ | 2.453 | 27.83 | % | $ | 666,455 | 1.37 | % | 0.45 | % | 0.50 | % | 0.50 | % | 0.28 | % | 0.28 | % | 23 | % | |||||||||
| 1.944 | (22.22 | )% | 342,683 | 1.16 | % | 0.45 | % | 0.47 | % | 0.47 | % | 0.28 | % | 0.28 | % | 10 | % | |||||||||||
| 2.715 | (12.02 | )% | 517,315 | 1.02 | % | 0.32 | % | 0.34 | % | 0.34 | % | 0.28 | % | 0.28 | % | 21 | % | |||||||||||
| 3.299 | (9.03 | )% | 599,266 | 0.87 | % | 0.32 | % | 0.33 | % | 0.33 | % | 0.27 | % | 0.27 | % | 9 | % | |||||||||||
| 4.060 | 20.41 | % | 638,230 | 0.98 | % | 0.35 | % | 0.35 | % | 0.35 | % | 0.28 | % | 0.28 | % | 21 | % | |||||||||||
| $ | 1.119 | 3.31 | % | $ | 530,199 | 3.42 | % | 0.63 | % | 0.63 | % | 0.63 | % | 0.41 | % | 0.41 | % | 192 | % | |||||||||
| 1.134 | 8.14 | % | 620,074 | 4.85 | % | 0.58 | % | 0.58 | % | 0.58 | % | 0.41 | % | 0.41 | % | 130 | % | |||||||||||
| 1.106 | 7.94 | % | 571,582 | 5.79 | % | 0.47 | % | 0.47 | % | 0.47 | % | 0.41 | % | 0.41 | % | 114 | % | |||||||||||
| 1.086 | 10.31 | % | 445,609 | 6.53 | % | 0.49 | % | 0.49 | % | 0.49 | % | 0.42 | % | 0.42 | % | 159 | % | |||||||||||
| 1.051 | (0.97 | )% | 240,541 | 6.22 | % | 0.50 | % | 0.50 | % | 0.50 | % | 0.43 | % | 0.43 | % | 75 | % | |||||||||||
| $ | 1.104 | 1.67 | % | $ | 200,158 | 2.82 | % | 0.71 | % | 0.71 | % | 0.71 | % | 0.50 | % | 0.50 | % | 55 | % | |||||||||
| 1.130 | 9.28 | % | 291,995 | 3.48 | % | 0.68 | % | 0.68 | % | 0.68 | % | 0.50 | % | 0.50 | % | 79 | % | |||||||||||
| 1.077 | 7.63 | % | 116,514 | 4.52 | % | 0.58 | % | 0.58 | % | 0.58 | % | 0.50 | % | 0.50 | % | 190 | % | |||||||||||
| 1.051 | 10.00 | % | 78,531 | 5.58 | % | 0.61 | % | 0.61 | % | 0.61 | % | 0.50 | % | 0.50 | % | 53 | % | |||||||||||
| 1.011 | 0.23 | % | 87,247 | 5.64 | % | 0.62 | % | 0.62 | % | 0.62 | % | 0.50 | % | 0.50 | % | 37 | % | |||||||||||
| $ | 1.000 | 0.80 | % | $ | 377,155 | 0.82 | % | 0.53 | % | 0.53 | % | 0.53 | % | 0.30 | % | 0.30 | % | N/A | ||||||||||
| 1.000 | 1.66 | % | 704,805 | 1.63 | % | 0.45 | % | 0.45 | % | 0.45 | % | 0.30 | % | 0.30 | % | N/A | ||||||||||||
| 1.000 | 4.28 | % | 604,657 | 4.11 | % | 0.36 | % | 0.36 | % | 0.36 | % | 0.31 | % | 0.31 | % | N/A | ||||||||||||
| 1.000 | 6.40 | % | 457,912 | 6.19 | % | 0.31 | % | 0.31 | % | 0.31 | % | 0.26 | % | 0.26 | % | N/A | ||||||||||||
| 1.000 | 5.19 | % | 513,606 | 5.09 | % | 0.29 | % | 0.29 | % | 0.29 | % | 0.24 | % | 0.24 | % | N/A | ||||||||||||
F-43
Table of Contents
ALLMERICA INVESTMENT TRUST
NOTES TO FINANCIAL STATEMENTS
| 1. | ORGANIZATION |
Allmerica Investment Trust (the “Trust”) is registered under the Investment Company Act of 1940 (the “1940 Act”), as amended, as an open-end, diversified management investment company established as a Massachusetts business trust. The Trust is intended to serve as an investment medium for (i) variable life insurance policies and variable annuity contracts offered by insurance companies, (ii) certain qualified pension and retirement plans, as permitted by Treasury Regulations; and (iii) life insurance companies and advisers to the Portfolios and their affiliates. Allmerica Financial Corporation (“AFC”) has ceased all new sales of proprietary variable annuities and life insurance products. The Trust is comprised of nine managed investment portfolios. The accompanying financial statements and financial highlights are those of the Select Capital Appreciation, Select Value Opportunity, Select International Equity, Select Growth, Core Equity, Equity Index, Select Investment Grade Income, Government Bond and Money Market Funds (individually a “Portfolio”, collectively, the “Portfolios”).
| 2. | SIGNIFICANT ACCOUNTING POLICIES |
The preparation of financial statements in conformity with accounting principles generally accepted in the United States of America requires management to make estimates and assumptions at the date of the financial statements. Actual results could differ from those estimates.
The following is a summary of significant accounting policies followed by the Trust in the preparation of its financial statements:
Security Valuation: Equity securities which are traded on a recognized exchange (other than Nasdaq) are valued at the last quoted sales price available at the time of the closing of the New York Stock Exchange or, if there were no sales that day, at the mean of the closing bid and asked price. Securities listed or traded on Nasdaq are valued at the Nasdaq official closing price. Over-the-counter securities are valued at the last available price in the market prior to the time of valuation. Securities that are primarily traded on foreign exchanges generally are valued at the closing values of such securities on their respective exchanges. Corporate debt securities and debt securities of the U.S. Government and its agencies (other than short-term investments) are valued by an independent pricing service approved by the Board of Trustees which utilizes market quotations and transactions, quotations from dealers and various relationships among securities in determining value. If not valued by a pricing service, such securities are valued at prices obtained from independent brokers. Investments with prices that cannot be readily obtained are carried at fair value as determined in good faith under consistently applied procedures established by and under the supervision of the Board of Trustees. Short-term investments that mature in 60 days or less are valued at amortized cost. The investments of the Money Market Fund are valued utilizing the amortized cost valuation method, permitted in accordance with Rule 2a-7 under the 1940 Act. This method involves valuing a portfolio security initially at its cost and thereafter assuming a constant amortization to maturity of any discount or premium.
Forward Foreign Currency Contracts: The Select Capital Appreciation, Select International Equity and Select Growth Funds may enter into forward foreign currency contracts whereby the Portfolios agree to exchange a specific currency at a specific price at a future date in an attempt to hedge against fluctuations in the value of the underlying currency of certain portfolio instruments. Forward foreign currency contracts are valued at the daily forward exchange rate of the underlying currency with any fluctuations recorded as unrealized gains or losses. Gains or losses on the purchase or sale of forward foreign currency contracts having the same settlement date and broker are recognized on the date of offset, otherwise gains and losses are recognized on the settlement date.
The use of forward foreign currency contracts does not eliminate fluctuations in the underlying prices of the Portfolios, but it does establish a rate of exchange that can be achieved in the future. Although forward foreign currency contracts used for hedging purposes limit the risk of loss due to a decline in the value of the hedged currency, they also limit any
F-44
Table of Contents
ALLMERICA INVESTMENT TRUST
NOTES TO FINANCIAL STATEMENTS (Continued)
potential gain that might result should the value of the currency increase. In addition, the Portfolios could be exposed to risks if the counterparties to the contracts are unable to meet the terms of their contracts.
Foreign Currency Translation: Investment valuations, other assets and liabilities denominated in foreign currencies are translated each business day into U.S. dollars based upon current exchange rates. Purchases and sales of foreign investments and income and expenses are translated into U.S. dollars based upon exchange rates prevailing on the respective dates of such transactions. Net realized gains or losses on foreign currency transactions represent net gains or losses on sales and maturities of foreign currency contracts, disposition of foreign currencies, the difference between the amount of net investment income and withholding taxes accrued and the U.S. dollar amount actually received and paid, and gains or losses between the trade and settlement date on the purchases and sales of the securities. That portion of unrealized gains or losses on investments due to fluctuations in foreign currency exchange rates is not separately disclosed.
Security Transactions and Investment Income: Security transactions are recorded as of the trade date. Realized gains and losses from security transactions are determined on the basis of identified cost. Interest income, including amortization of premium and accretion of discount on securities, is accrued daily. Income distributions earned by the Portfolios from investments in certain investment companies are recorded as interest income in the accompanying financial statements. Dividend income is recorded on the ex-dividend date, except that certain dividends from foreign securities are recorded as soon as the Portfolios are informed of the ex-dividend date.
Federal Income Taxes: The Trust treats each Portfolio as a separate entity for Federal income tax purposes. Each Portfolio intends to continue to qualify as a “regulated investment company” under Subchapter M of the Internal Revenue Code of 1986, as amended. By so qualifying, each Portfolio will not be subject to Federal income taxes to the extent it distributes all of its taxable income and net realized gains, if any, for its fiscal year. In addition, by distributing during each calendar year substantially all of its net investment income, capital gains and certain other amounts, if any, each Portfolio will not be subject to Federal excise tax. Therefore, no Federal income tax provision is required. Withholding taxes on foreign dividend income and gains have been paid or provided for in accordance with the applicable country’s tax rules and rates.
Distributions to Shareholders: Dividends from net investment income are declared and reinvested daily for the Money Market Fund, declared and distributed quarterly for the Core Equity, Equity Index, Select Investment Grade Income and Government Bond Funds, and annually for the Select Capital Appreciation, Select Value Opportunity, Select International Equity and Select Growth Funds. All Portfolios declare and distribute all net realized capital gains, if any, at least annually. Distributions to shareholders are recorded on the ex-dividend date. Income and capital gains distributions are determined in accordance with income tax regulations. Differences between book basis and tax basis amounts are primarily due to differing book and tax treatments in the timing of the recognition of gains or losses, including “Post-October Losses”, foreign currency gains and losses, and losses deferred due to wash sales and differing treatments for foreign currency transactions, amortization of premium and market discount, and non-taxable dividends. Permanent book and tax basis differences relating to shareholder distributions will result in reclassifications to paid in capital. Permanent book-tax differences, if any, are not included in ending undistributed net investment income for the purpose of calculating net investment income per share in the Financial Highlights, as applicable.
Futures Contracts: All Portfolios, except the Money Market Fund, may use futures contracts to manage their exposure to the stock and bond markets and to fluctuations in interest rates and currency values. Buying futures tends to increase a Portfolio’s exposure to the underlying instrument, while selling futures tends to decrease a Portfolio’s exposure to the underlying instrument or hedge other portfolio investments. Futures contracts involve, to varying degrees, risk of loss in excess of the futures variation margin, if any, reflected in each applicable Portfolio’s Statement of Assets and Liabilities. The underlying face amount at value of any open futures contracts at period end is shown in each applicable Portfolio’s portfolio of investments. The face amount reflects each contract’s exposure to the underlying instrument at period end. Losses may arise from changes in the value of the underlying instruments or if the counterparties do not perform under the terms of the contracts. Gains and losses are realized upon the expiration or closing of the futures contracts. Futures contracts are valued at the settlement price established each day by the board of trade or exchange on which they are traded.
F-45
Table of Contents
ALLMERICA INVESTMENT TRUST
NOTES TO FINANCIAL STATEMENTS (Continued)
Securities Lending: Each Portfolio, using Investors Bank & Trust Company (“IBT”) as its lending agent, may loan securities to brokers and dealers in exchange for negotiated lenders’ fees. These fees are disclosed as “Securities lending income” in the Statements of Operations. Each applicable Portfolio receives collateral against the loaned securities which must be maintained at not less than 102% of the market value of the loaned securities during the period of the loan. Collateral received is generally cash, and is invested in short term investments. There may be risks of delay in recovery of the securities loaned or even loss of rights in the collateral should the counterparty (borrower) not meet its obligations under the terms of the loan. Information regarding the value of the securities loaned and the value of the collateral at period end is included in a footnote at the end of each applicable Portfolio’s portfolio of investments.
Cash Accounts: From time to time the Portfolios may leave cash overnight in their account. IBT has been contracted on behalf of the Portfolios to sweep these moneys into a demand note account, which will pay interest equal to 75% of that day’s U.S. Treasury Bill rate back to the Portfolios.
Expenses: Expenses directly attributed to a portfolio are charged to the portfolio, while expenses which are attributable to more than one portfolio of the Trust are allocated based upon relative net assets among the respective Portfolios and one other affiliated investment company, Allmerica Securities Trust.
Forward Commitments: The Select Capital Appreciation, Select Investment Grade Income, Government Bond, and Money Market Funds may enter into contracts to purchase securities for a fixed price at a specified future date beyond customary settlement time (“forward commitments”). If the Portfolios do so, they will maintain cash or other liquid obligations having a value in an amount at all times sufficient to meet the purchase price. Forward commitments involve a risk of loss if the value of the security to be purchased declines prior to the settlement date. Although the Portfolios generally will enter into forward commitments with the intention of acquiring securities for their portfolios, they may dispose of a commitment prior to settlement if their Sub-Adviser deems it appropriate to do so.
Options: All Portfolios, except the Money Market Fund, may use options to manage its exposure to the stock and bond markets and to fluctuations in interest rates. Writing puts and buying calls tend to increase a Portfolio’s exposure to the underlying security. Buying puts and writing calls tend to decrease a Portfolio’s exposure to the underlying security. When a Portfolio writes a call or put option, an amount equal to the premium received is recorded as a liability and subsequently marked to market to reflect the current value of the option written. Premiums received from writing options which expire are treated as realized gains. Premiums received from writing options which are exercised or closed are added to the proceeds or offset against the amounts paid on the underlying security to determine the realized gain or loss. Realized gains and losses on written options are included in realized gains and losses on securities. The underlying value of any open options at period end is shown in the portfolio of investments under the caption “Written Options.” This amount reflects each contract’s exposure to the underlying security at period end. Written options involve, to varying degrees, risk of loss in excess of the option value reflected in the Statement of Assets and Liabilities. Losses may arise from changes in the value of the underlying securities, if there is an illiquid secondary market for the contracts, or if the counterparties do not perform under the terms of the contracts. Exchange-traded options are valued using the last sale price or, if there were no sales that day, the last offering price. Options traded over-the-counter are valued using dealer-supplied valuations.
Repurchase Agreements: Each Portfolio may engage in repurchase agreement transactions with institutions that the Sub-Adviser has determined are creditworthy pursuant to guidelines established by the Trust’s Board of Trustees. Each Portfolio requires that the securities purchased in a repurchase agreement transaction be transferred to the Trust’s Custodian in a manner that is intended to enable the Portfolio to obtain those securities in the event of a counterparty default. The Sub-Adviser monitors the value of the securities, including accrued interest, daily to ensure that the value of the collateral equals or exceeds amounts due under the repurchase agreement. Repurchase agreement transactions involve certain risks in the event of default or insolvency of the counterparty, including possible delays or restrictions upon the Portfolio’s ability to dispose of the underlying securities, and a possible decline in the value of the underlying securities during the period while the Portfolio seeks to assert its rights.
F-46
Table of Contents
ALLMERICA INVESTMENT TRUST
NOTES TO FINANCIAL STATEMENTS (Continued)
| 3. | INVESTMENT MANAGEMENT, ADMINISTRATION, AND OTHER RELATED PARTY TRANSACTIONS |
Management Fees: Allmerica Financial Investment Management Services, Inc. (the “Manager”), a wholly-owned subsidiary of Allmerica Financial Life Insurance and Annuity Company (“Allmerica Financial”), serves as investment manager and administrator to the Trust. Allmerica Financial is a wholly-owned subsidiary of AFC. Under the terms of the management agreement, the Portfolios pay a management fee, calculated daily and payable monthly, at an annual rate based upon the following fee schedules:
| Percentage of Average Daily Net Assets | ||||||||||||||||||
Portfolio | First $100,000,000 | Next $150,000,000 | Next $250,000,000 | Next $250,000,000 | Next $250,000,000 | Over $1,000,000,000 | ||||||||||||
Select Capital Appreciation Fund | 1.00 | % | 0.90 | % | 0.80 | % | 0.70 | % | 0.70 | % | 0.65 | % | ||||||
Select Value Opportunity Fund | 1.00 | % | 0.85 | % | 0.80 | % | 0.75 | % | 0.70 | % | 0.70 | % | ||||||
Select International Equity Fund | 1.00 | % | 0.90 | % | 0.85 | % | 0.85 | % | 0.85 | % | 0.85 | % | ||||||
Select Growth Fund | 0.85 | % | 0.85 | % | 0.80 | % | 0.75 | % | 0.70 | % | 0.70 | % | ||||||
Core Equity Fund | 0.60 | % | 0.60 | % | 0.55 | % | 0.50 | % | 0.45 | % | 0.45 | % | ||||||
Government Bond Fund | 0.50 | % | 0.50 | % | 0.50 | % | 0.50 | % | 0.50 | % | 0.50 | % | ||||||
Money Market Fund | 0.35 | % | 0.30 | % | 0.30 | % | 0.25 | % | 0.20 | % | 0.20 | % | ||||||
Portfolio | First $50,000,000 | Next $200,000,000 | Over $250,000,000 | |||||||||||||||
Equity Index Fund | 0.35 | % | 0.30 | % | 0.25 | % | ||||||||||||
Portfolio | First $50,000,000 | Next $50,000,000 | Over $100,000,000 | |||||||||||||||
Select Investment Grade Income Fund | 0.50 | % | 0.45 | % | 0.40 | % | ||||||||||||
The Manager has entered into Sub-Adviser Agreements for the management of the investments of each of the Portfolios. The Manager is solely responsible for the payment of all fees to the Sub-Advisers. The Sub-Advisers for each of the Portfolios are as follows:
Select Capital Appreciation Fund | T. Rowe Price Associates, Inc. (“T. Rowe Price”) | |
Select Value Opportunity Fund | Cramer Rosenthal McGlynn, LLC | |
Select International Equity Fund | Bank of Ireland Asset Management (U.S.) Limited | |
Select Growth Fund | Putnam Investment Management, LLC (“Putnam”) Jennison Associates LLC (“Jennison”) | |
Core Equity Fund | UBS Global Asset Management (Americas) Inc. (“UBS”) Goldman Sachs Asset Management, L.P. (“Goldman”) | |
Equity Index Fund | Opus Investment Management, Inc. (formerly Allmerica Asset Management, Inc.; wholly-owned subsidiary of AFC) | |
Select Investment Grade Income Fund | Opus Investment Management, Inc. | |
Government Bond Fund | Opus Investment Management, Inc. | |
Money Market Fund | Opus Investment Management, Inc. |
T. Rowe Price International Series, Inc., an investment company managed by an affiliate of T. Rowe Price, is currently used as an investment vehicle for certain insurance products sponsored by Allmerica Financial and First Allmerica Financial Life Insurance Company (“First Allmerica”), a wholly-owned subsidiary of Allmerica Financial. In addition, T. Rowe Price currently serves as investment adviser to a corporate investment account of AFC. Effective April 18, 2003, both Putnam and
F-47
Table of Contents
ALLMERICA INVESTMENT TRUST
NOTES TO FINANCIAL STATEMENTS (Continued)
Jennison assumed sub-adviser responsibilities for the Select Growth Fund; prior to April 18, 2003, Putnam was the sole sub-adviser. Putnam and Jennison each independently manages their own portion of the Select Growth Fund. UBS and Goldman each independently manages its own portion of the Core Equity Fund. In addition, through December 12, 2003, UBS and Goldman each independently managed its own portion of certain assets for First Allmerica and its affiliates. Effective February 1, 2003, the name of Allmerica Asset Management, Inc. was changed to Opus Investment Management, Inc.
Plan of distribution and Service: The 12b-1 Plan permits the Portfolios to pay Allmerica Financial and First Allmerica for marketing and distribution expenses to support the sale and distribution of the Portfolios’ shares and the provision of services to maintain and retain accounts. The 12b-1 Plan authorizes payment of a distribution and service fee at an annual rate of up to 0.25% of each Portfolio’s average daily net assets. As directed by the Board of Trustees, each Portfolio pays a distribution fee at an annual rate of 0.15% of each Portfolio’s average daily net assets. For the year ended December 31, 2003, total payments made to Allmerica Financial and First Allmerica by the Portfolios under the 12b-1 Plan amounted to $6,072,170.
Custodian, Fund Accounting, and Administrative Fees: IBT provides portfolio accounting and custody services to the Trust and receives fees and reimbursement of certain out-of-pocket expenses for its services from the Trust. The Manager has entered into an Administrative Services Agreement with IBT, whereby IBT performs certain administrative services for the Portfolios and is entitled to receive an administrative fee and reimbursement of certain out-of-pocket expenses. The Manager is solely responsible for the payment of the administrative fee to IBT. The Trust pays no salaries or compensation to any of its officers. Trustees who are not directors, officers or employees of the Trust or any investment adviser are reimbursed for their travel expenses in attending meetings of the Trustees, and receive quarterly meeting and retainer fees for their services. Such amounts are paid by the Trust.
| 4. | REIMBURSEMENT OF EXPENSES AND WAIVER OF FEES |
In the event normal operating expenses of each Portfolio, excluding taxes, interest, broker commissions, and extraordinary expenses, but including the management fee, exceed certain voluntary expense limitations as a percentage of average net assets, the Manager will voluntarily reimburse fees and any expenses in excess of the expense limitations. The Portfolios’ voluntary expense limitations are as follows:
Select Capital Appreciation Fund | 1.35 | % | |
Select Value Opportunity Fund* | 1.25 | % | |
Select International Equity Fund | 1.50 | % | |
Select Growth Fund | 1.20 | % | |
Core Equity Fund | 1.20 | % | |
Equity Index Fund | 0.60 | % | |
Select Investment Grade Income Fund | 1.00 | % | |
Government Bond Fund | 1.00 | % | |
Money Market Fund | 0.60 | % |
Expense limitations may be removed or revised at any time after a Portfolio’s first fiscal year of operations without prior notice to existing shareholders.
| * | The Manager has also voluntarily agreed to limit its management fees to an annual rate of 0.90% of average daily net assets of the Select Value Opportunity Fund until further notice. |
| 5. | REDUCTION OF EXPENSES |
Certain Portfolios have entered into agreements with brokers whereby the brokers will rebate a portion of brokerage commissions. Such amounts earned by the Portfolios, under such agreements, are presented as a reduction of expenses in the Statements of Operations.
F-48
Table of Contents
ALLMERICA INVESTMENT TRUST
NOTES TO FINANCIAL STATEMENTS (Continued)
| 6. | SHARES OF BENEFICIAL INTEREST |
The Trust’s Declaration of Trust authorizes the Trustees to issue an unlimited number of shares of beneficial interest for the Portfolios, each without a par value.
| 7. | FOREIGN SECURITIES AND EMERGING MARKETS |
All Portfolios except the Government Bond Fund may purchase securities of foreign issuers. The Money Market Fund may invest in only U.S. dollar denominated foreign securities. Investing in foreign securities involves special risks not typically associated with investing in securities of U.S. issuers. The risks include revaluation of currencies and future adverse political and economic developments. Moreover, securities of many foreign issuers and their markets may be less liquid and their prices more volatile than those of securities of comparable U.S. issuers.
Investing in emerging markets may involve special risks and considerations not typically associated with investing in the developed markets. These risks include revaluation of currencies, high rates of inflation, repatriation restrictions on income and capital, and future adverse political and economic developments. Moreover, securities issued in these markets may be less liquid, subject to government ownership controls, subject to delayed settlements, and their prices more volatile than those of comparable securities in the United States.
| 8. | FINANCIAL INSTRUMENTS |
Investing in certain financial instruments including futures and options transactions, and forward foreign currency contracts involves risks other than those reflected in the Statements of Assets and Liabilities. Risks associated with these instruments include the potential for an imperfect correlation between the movements in the price of the instruments and the price of the underlying securities and interest rates, an illiquid secondary market for the instruments or inability of counterparties to perform under terms of the contracts, and changes in the value of foreign currency relative to the U.S. dollar. The Select Capital Appreciation, Select International Equity and Select Growth Funds may enter into these forward contracts primarily to protect the Portfolio from adverse currency movement.
| 9. | REORGANIZATIONS |
Pursuant to separate Agreements and Plans of Reorganization (“Reorganizations”) approved by the Board of Trustees on January 7, 2003 and then approved by shareholders on March 27, 2003, each of the following Acquired Funds of the Trust were reorganized into the respective Acquiring Funds of the Trust after the close of business on the effective date shown. Each Reorganization was accomplished by a tax-free exchange of all of the assets and liabilities of the Acquired Fund for shares of the Acquiring Fund and by the distribution of such shares to the shareholders of the Acquired Fund, in complete liquidation of the Acquired Fund. The reorganizations qualified as tax-free reorganizations for federal income tax purposes with no gain or loss recognized to the Portfolios or the separate account level of shares.
Acquired Fund | Acquiring Fund | Effective Date | ||||
Reorganization #1 | Select Strategic Growth Fund | Select Growth Fund | April 17, 2003 | |||
Reorganization #2 | Select Emerging Markets Fund | Select International Equity Fund | April 30, 2003 | |||
Reorganization #3 | Select Growth and Income Fund | Equity Index Fund | April 25, 2003 | |||
Reorganization #4 | Select Aggressive Growth Fund | Select Growth Fund | April 17, 2003 | |||
Reorganization #5 | Select Strategic Income Fund | Select Investment Grade Income Fund | April 22, 2003 |
Each Reorganization was accomplished as follows:
Reorganization #1: An exchange of 15,107,801 shares of Select Growth Fund for the 67,820,054 shares then outstanding (each valued at $0.262) of Select Strategic Growth Fund; whose net assets, including $8,264,448 of unrealized depreciation
F-49
Table of Contents
ALLMERICA INVESTMENT TRUST
NOTES TO FINANCIAL STATEMENTS (Continued)
were combined with Select Growth Fund for total net assets after the reorganization of $601,471,129 (includes the net assets of Select Aggressive Growth Fund of Reorganization #4).
Reorganization #2: An exchange of 52,384,344 shares of Select International Equity Fund for the 70,465,156 shares then outstanding (each valued at $0.642) of Select Emerging Markets Fund; whose net assets, including $1,690,066 of unrealized appreciation were combined with Select International Equity Fund for total net assets after the reorganization of $344,940,863.
Reorganization #3: An exchange of 147,106,786 shares of Equity Index Fund for the 306,640,159 shares then outstanding (each valued at $0.953) of Select Growth and Income Fund; whose net assets, including $39,999,505 of unrealized depreciation were combined with Equity Index Fund for total net assets after the reorganization of $611,065,810.
Reorganization #4: An exchange of 220,257,679 shares of Select Growth Fund for the 281,013,367 shares then outstanding (each valued at $0.922) of Select Aggressive Growth Fund; whose net assets, including $14,734,409 of unrealized depreciation were combined with Select Growth Fund for total net assets after the reorganization of $601,471,129 (includes the net assets of Select Strategic Growth Fund of Reorganization #1).
Reorganization #5: An exchange of 125,882,319 shares of Select Investment Grade Income Fund for the 131,490,310 shares then outstanding (each valued at $1.085) of Select Strategic Income Fund; whose net assets, including $3,796,669 of unrealized appreciation were combined with Select Investment Grade Income Fund for total net assets after the reorganization of $674,124,396.
F-50
Table of Contents
ALLMERICA INVESTMENT TRUST
REPORT OF INDEPENDENT AUDITORS
To the Board of Trustees and Shareholders of Allmerica Investment Trust
In our opinion, the accompanying statements of assets and liabilities, including the portfolios of investments, and the related statements of operations and of changes in net assets and the financial highlights present fairly, in all material respects, the financial position of the Select Capital Appreciation Fund, Select Value Opportunity Fund, Select International Equity Fund, Select Growth Fund, Core Equity Fund, Equity Index Fund, Select Investment Grade Income Fund, Government Bond Fund and Money Market Fund (constituting the Allmerica Investment Trust, hereafter referred to as the “Trust”) at December 31, 2003, the results of each of their operations, the changes in each of their net assets and the financial highlights for the periods indicated, in conformity with accounting principles generally accepted in the United States of America. These financial statements and financial highlights (hereafter referred to as “financial statements”) are the responsibility of the Trust’s management; our responsibility is to express an opinion on these financial statements based on our audits. We conducted our audits of these financial statements in accordance with auditing standards generally accepted in the United States of America, which require that we plan and perform the audit to obtain reasonable assurance about whether the financial statements are free of material misstatement. An audit includes examining, on a test basis, evidence supporting the amounts and disclosures in the financial statements, assessing the accounting principles used and significant estimates made by management, and evaluating the overall financial statement presentation. We believe that our audits, which included confirmation of securities at December 31, 2003 by correspondence with the custodian and brokers, provide a reasonable basis for our opinion.
PricewaterhouseCoopers LLP
Boston, Massachusetts
February 12, 2004
F-51
Table of Contents
ALLMERICA INVESTMENT TRUST
BOARD OF TRUSTEES (Unaudited)
Name, Address and Age(1) | Position(s) Held with Trust | Term of Office and Length of Time Served | Principal Occupation(s) During Past 5 Years(2) | Number of Portfolios in Fund Complex Overseen by Trustee | Other Directorships Held by Trustee | |||||
| P. Kevin Condron (58) | Trustee, Member of the Audit Committee and Fund Operations Committee | Indefinite Served Since 1998 | President and Chief Executive Officer, The Granite Group (wholesale plumbing and heating), 1997-present. | 10 | Director, Banknorth Group. | |||||
| Jocelyn S. Davis (50) | Trustee, Member of the Audit Committee and Fund Operations Committee | Indefinite Served Since 2001 | President, Nelson Hart, LLC (consulting), 2002-present; Beers & Cutler (professional services), 2001-2002; Chief Financial Officer, AARP (non-profit), 1996-2001. | 10 | None | |||||
| Cynthia A. Hargadon (49) | Trustee, Member of the Fund Operations Committee, Investment Operations Committee and Governance Committee | Indefinite Served Since 1997 | President and Chief Investment Officer, PlanTools, LLC (consulting), 2003-present; Managing Director, McHenry Group, 2003-present; President, Hargadon Associates (asset management consulting), 2002-2003; President, Potomac Asset Management, Inc., 2000-2002; Director of Investments, National Automobile Dealers Association, 1999-2000; President, Stable Value Investment Association (investment trade group), 1996-1999. | 10 | Director, Wilshire Target Funds, 2001-present. | |||||
| T. Britton Harris, IV (45) | Trustee, Member of the Investment Operations Committee, Governance Committee and Fund Operations Committee | Indefinite Served Since 2001 | President, Verizon Investment Management Corporation, 1990-present. | 10 | None | |||||
| Gordon Holmes (65) | Trustee, Chairman of the Audit Committee and Member of the Fund Operations Committee | Indefinite Served Since 1991 | Instructor at Bentley College, 1998-present; Certified Public Accountant; Retired Partner, Tofias, Fleishman, Shapiro & Co., P.C. (Accountants). | 10 | None | |||||
| Attiat F. Ott (68) | Trustee, Chairman of the Fund Operations Committee and Member of the Audit Committee | Indefinite Served Since 1982 | Professor of Economics and Director of the Institute for Economic Studies, Clark University, 940 Main Street, Worcester, MA. | 10 | None | |||||
F-52
Table of Contents
ALLMERICA INVESTMENT TRUST
BOARD OF TRUSTEES (Unaudited)
Name, Address and Age(1) | Position(s) Held with Trust | Term of Office and Length of Time Served | Principal Occupation(s) During Past 5 Years(2) | Number of Portfolios in Fund Complex Overseen by Trustee | Other Directorships Held by Trustee | |||||
| Ranne P. Warner (59) | Trustee, Chairman of the Governance Committee, Member of the Fund Operations Committee and Investment Operations Committee | Indefinite Served Since 1991 | President, Centros Properties, USA; Owner, Ranne P. Warner and Company; Blackstone Exchange LLC (real estate) 2001-present. | 10 | Director, Wainwright Bank & Trust Co. (commercial bank). | |||||
| *Mark A. Hug (46) | Trustee, Member of the Investment Operations Committee | Indefinite Served Since 2003 | President and CEO, First Allmerica Financial Life Insurance Company (“First Allmerica”) and Allmerica Financial Life Insurance and Annuity Company (“Allmerica Financial Life”) 2000-present; Senior Vice President, Equitable Life (product and marketing) prior to 1999. | 10 | None | |||||
| *John P. Kavanaugh (49) | Chairman, Trustee and President, Chairman of the Investment Operations Committee | Indefinite Served Since 1995 | President, Opus Investment Management, Inc.; Vice President, Director, Chief Investment Officer, First Allmerica and Allmerica Financial Life. | 10 | None | |||||
| * | Messrs. Hug and Kavanaugh are “interested persons”, as defined in the Investment Company Act of 1940 as amended, of the Trust and of Allmerica Financial Corporation (“AFC”) because of their affiliations with AFC. |
| (1) | The business address of each person is 440 Lincoln Street, Worcester, Massachusetts 01653. |
| (2) | Except as otherwise noted, each individual has held the office indicated or other offices in the same organization for the last five years. |
The Statement of Additional Information of Allmerica Investment Trust (“SAI”) contains additional information about the Board of Trustees and is available without charge upon request. You may request a copy of the SAI by contacting us at the phone number listed on the back cover of this report.
F-53
Table of Contents
ALLMERICA INVESTMENT TRUST
REGULATORY DISCLOSURES (Unaudited)
The performance data quoted represents past performance and the investment return and principal value of an investment will fluctuate so that an investor’s shares, when redeemed, may be worth more or less than their original cost.
An investment in the Money Market Fund is not insured or guaranteed by the Federal Deposit Insurance Corporation or any other government agency. Although the Portfolio seeks to preserve the value of your investment at a stable net asset value of $1.00 per share, it is possible to lose money by investing in the Portfolio.
Securities issued by some U.S. Government-sponsored entities, such as the Federal Home Loan Mortgage Corporation (Freddie Mac) and the Federal National Mortgage Association (Fannie Mae), are not backed by the full faith and credit of the U.S. Government. No assurances can be given that the U.S. Government would provide financial support to a U.S. Government-sponsored instrumentality if not obligated to do so.
This report and the financial statements contained herein are submitted for the general information of the shareholders of the Portfolios and are not authorized for distribution to prospective investors in the flexible premium variable life insurance or annuity products of Allmerica Financial Life Insurance and Annuity Company or First Allmerica Financial Life Insurance Company unless accompanied or preceded by effective prospectuses for the flexible premium variable life insurance or annuity products of Allmerica Financial Life Insurance and Annuity Company or First Allmerica Financial Life Insurance Company, and Allmerica Investment Trust which include important information related to charges and expenses.
CLIENT NOTICES (Unaudited)
This report includes financial statements for Allmerica Investment Trust. It does not include financial statements for the separate accounts that correspond to the insurance and/or annuity products included in this report.
The SEC has modified mailing requirements for annual reports to allow a single copy of this report to be delivered to customers who share the same last name and address. This will automatically apply to all customers. If you would prefer to receive your own copy, please notify us at the phone number listed on the back cover of this report.
F-54
Table of Contents
[GRAPHIC]
THE ALLMERICA FINANCIAL COMPANIES
The Hanover Insurance Company • Citizens Insurance Company of America • Citizens Management Inc.
Opus Investment Management, Inc. • AMGRO, Inc. • Financial Profiles, Inc.
First Allmerica Financial Life Insurance Company • Allmerica Financial Life Insurance and Annuity Company (all states except NY)
440 Lincoln Street, Worcester, Massachusetts 01653
| 1226NS (12/03) | 04-003 |
Table of Contents
Allmerica Financial
December 31, 2003
[GRAPHIC]
Annual Report
Allmerica Investment Trust
• Money Market Fund
Table of Contents
| 1 | ||
| 2 | ||
Financials | F-1 | |
For information on ordering additional copies of this report, see Client Notices on page F-13.
One or more Funds may not be available under the variable annuity or variable life insurance policy which you have chosen. Inclusion in this report of a Fund which is not available under your policy is not to be considered a solicitation.
Table of Contents
Dear Client:
We will remember 2003 as a year of broad-based economic recovery and above average investment returns across nearly all asset classes. Outside the United States, economic growth was tempered by growing worries over the decline in value of the U.S. dollar and concern that this could constrain the emerging global recovery. Still, stock markets around the world generally performed well. Japan’s Nikkei Average finished the period up 24.45%, Hong Kong’s Hang Seng Index was higher by 34.92%, Germany’s DAX Index rose 37.08%, England’s FTSE Index gained 13.62% and France’s CAC 40 Index was up 16.12%.
The United States economy displayed impressive strength in 2003. Early in the year, growth was hindered by major fighting in Iraq, a sluggish manufacturing sector and a lack of capital spending by businesses. The Federal Reserve Board cut the target federal funds rate to 1.00% and Congress passed a large tax cut, setting the stage for a rebound in economic activity. During the second half of the year, GDP rose sharply, productivity increased, corporate profits jumped, manufacturing gained strength and unemployment edged down. The consumer remained the primary source of spending, and business investment finally emerged. A full year of solid GDP growth provided the most compelling evidence yet that the growth engine of the world was back on track. U.S. securities markets reacted enthusiastically to the strong economic news. For the year, the S&P 500® Index gained 28.69% and the Nasdaq Composite Index rose 50.01%. Bonds also generated positive returns for the year, evidenced by the Lehman Brothers Aggregate Bond Index, which increased 4.11%.
Money market fund returns declined during 2003, as short-term interest rates continued to fall. In June, the Federal Reserve Board reinforced the downward trend in short-term interest rates when it cut the target federal funds rate by 0.25%. The Allmerica Investment Trust Money Market Fund continued its strong relative performance for the year, returning 0.80%, outperforming its benchmark, the Money Fund Report Averages: First Tier Taxable.
On behalf of the Board of Trustees,

John P. Kavanaugh
Chairman of the Board
Allmerica Investment Trust
1
Table of Contents
The Money Market Fund returned 0.80% for 2003, outperforming its benchmark, the Money Fund Report Averages: First Tier Taxable, which returned 0.49%.
Bond market returns were more muted this year, compared to the robust gains of the last several years, when interest rates were declining. The Lehman Brothers Aggregate Bond Index returned 4.11% for 2003, which reflects positive coupon return, offset by some modest price depreciation, as interest rates rose. The two year Treasury note ended the year 23 basis points higher in yield at a still-low 1.82%, while the ten year Treasury note rose by 43 basis points to end the year at 4.25%. U.S. equity market returns were quite strong for the full year, as the S&P 500® Index returned 28.69%, while the Nasdaq Composite Index was up an impressive 50.01%.
The fund’s outperformance relative to its benchmark can largely be attributed to a slightly longer average maturity than its peer group and a large concentration in floating-rate notes, which offer incremental yield over straight debt.
The investment sub-adviser believes that there are still real risks that could threaten the U.S. economy’s growth and recovery. Geopolitical uncertainty, the risk of terrorism and the falling dollar are all potential hazards. Should the current weakening dollar begin to free-fall, the investment sub-adviser believes that U.S. interest rates may be forced up dramatically to fund the burgeoning deficits. This could cause stock prices to fall, eroding consumer confidence and squashing capital spending growth plans. While not anticipating this outcome, the investment sub-adviser feels that it is important to acknowledge the risks still present in the economy.
Average Annual Total Returns
| 1 Year | 5 Year | 10 Year | ||||
Money Market Fund | 0.80% | 3.64% | 4.43% | |||
Money Fund Report Averages: First Tier Taxable | 0.49% | 3.08% | 3.94% | |||
Lipper Money Market Funds Average | 0.64% | 3.28% | 4.12% | |||
| Average Yield as of December 31, 2003 | ||||||
Money Market Fund 7-Day Yield |
0.65% | |||||
Growth of a $10,000 Investment Since 1993

The Money Market Fund is a portfolio of Allmerica Investment Trust. Portfolio composition will vary over time.
The Fund is neither insured nor guaranteed by the Federal Deposit Insurance Corporation or any other government agency. Although the Fund seeks to maintain a net asset value of $1.00 per share, it is possible to lose money by investing in the Fund.
Past performance is no guarantee of future results. Investment return and principal value of an investment will fluctuate so that an investor’s shares, when redeemed, may be worth more or less than their original cost.
Money Fund Report Averages: First Tier Taxable is published by iMoneyNet, Inc., an independent firm that tracks 2a-7 regulated money market funds on a yield, shareholder, asset size and portfolio allocation basis. The Lipper Money Market Funds Average is the average investment performance of funds within the money market category. Performance numbers are net of all fund operating expenses, but do not include insurance charges. If performance information included the effect of these additional charges, it would have been lower.
Investment Sub-Adviser
Opus Investment Management, Inc.
About the Fund
Seeks to maximize current income for investors while preserving capital and liquidity.
Portfolio Composition
As of December 31, 2003, the sector allocation of net assets was:

2
Table of Contents
Financials
Table of Contents
MONEY MARKET FUND
PORTFOLIO OF INVESTMENTS • December 31, 2003
| Par Value | Value (Note 2) | ||||||
| U.S. GOVERNMENT AND AGENCY OBLIGATIONS - 14.3% | |||||||
Fannie Mae - 9.3% | |||||||
| $ | 5,000,000 | 1.18%, 07/27/04 | $ | 5,000,000 | |||
| 14,850,000 | 1.19%, 03/05/04 (a) | 14,818,715 | |||||
| 10,000,000 | 1.63%, 12/15/04 | 10,000,000 | |||||
| 5,000,000 | 6.50%, 08/15/04 | 5,159,936 | |||||
| 34,978,651 | |||||||
Federal Home Loan Bank - 3.7% | |||||||
| 4,000,000 | 1.20%, 08/20/04 | 4,000,000 | |||||
| 10,000,000 | 1.50%, 01/07/05 | 10,000,000 | |||||
| 14,000,000 | |||||||
Freddie Mac - 1.3% | |||||||
| 5,000,000 | 1.41%, 11/15/04 | 5,000,000 | |||||
Total U.S. Government and Agency Obligations | 53,978,651 | ||||||
(Cost $53,978,651) | |||||||
| CORPORATE NOTES - 46.5% | |||||||
Banking - 4.0% | |||||||
| 15,000,000 | Marshall & Ilsley Bank | ||||||
1.22%, 12/17/04 | 15,000,000 | ||||||
Banking - Foreign Banks & Branches - 3.3% | |||||||
| 2,450,000 | National Bank of Canada | ||||||
8.13%, 08/15/04 | 2,549,100 | ||||||
| 10,000,000 | Royal Bank of Canada, MTN (b) | ||||||
1.22%, 02/27/04 | 10,001,338 | ||||||
| 12,550,438 | |||||||
Financial Services - 27.6% | |||||||
| 7,864,000 | Caterpillar Financial Services Corp., MTN (b) | ||||||
1.25%, 07/09/04 | 7,864,000 | ||||||
| 10,000,000 | Caterpillar Financial Services Corp., MTN (b) | ||||||
1.31%, 04/02/04 | 10,004,665 | ||||||
| 500,000 | Caterpillar Financial Services Corp., MTN (b) | ||||||
1.34%, 03/05/04 | 500,154 | ||||||
| 15,000,000 | Citigroup, Inc. (b) | ||||||
1.32%, 10/22/04 | 15,024,252 | ||||||
| 3,050,000 | Citigroup, Inc. | ||||||
5.70%, 02/06/04 | 3,062,898 | ||||||
| 1,750,000 | General Electric Capital Corp. | ||||||
7.25%, 05/03/04 | 1,785,571 | ||||||
| 2,782,000 | Household Finance Corp. | ||||||
6.00%, 05/01/04 | 2,825,454 | ||||||
| 5,000,000 | International Lease Finance Corp., MTN | ||||||
5.35%, 05/05/04 | 5,069,370 | ||||||
| 6,000,000 | J.P. Morgan Chase & Co. | ||||||
5.37%, 02/27/04 | 6,038,727 | ||||||
| 12,000,000 | J.P. Morgan Chase & Co. | ||||||
5.75%, 02/25/04 | 12,077,930 | ||||||
| 15,000,000 | Money Market Trust LLC (c) | ||||||
1.22%, 12/03/04 | 15,000,000 | ||||||
| $ | 20,000,000 | Money Market Trust, Series 2003-A (c) | |||||
1.25%, 02/19/04 | $ | 20,001,879 | |||||
| 5,000,000 | Sigma Finance, Inc., MTN (c) | ||||||
1.12%, 05/18/04 | 4,999,750 | ||||||
| 104,254,650 | |||||||
Retailers - 1.8% | |||||||
| 5,000,000 | Wal-Mart Stores, Inc. | ||||||
6.55%, 08/10/04 | 5,158,029 | ||||||
| 1,400,000 | Wal-Mart Stores, Inc. | ||||||
7.50%, 05/15/04 | 1,432,191 | ||||||
| 6,590,220 | |||||||
Securities Broker - 9.8% | |||||||
| 4,000,000 | Goldman Sachs Group, Inc. | ||||||
1.13%, 01/23/04 | 4,000,000 | ||||||
| 10,000,000 | Goldman Sachs Group, Inc. | ||||||
1.23%, 07/29/04 | 10,000,000 | ||||||
| 10,000,000 | Morgan Stanley | ||||||
1.28%, 11/15/04 | 10,000,000 | ||||||
| 13,000,000 | Morgan Stanley | ||||||
5.63%, 01/20/04 | 13,019,370 | ||||||
| 37,019,370 | |||||||
Total Corporate Notes | 175,414,678 | ||||||
(Cost $175,414,678) | |||||||
| ASSET BACKED SECURITIES - 1.6% | |||||||
| 6,031,052 | Whole Auto Loan Trust, Series 2003-1, Class A1 | ||||||
1.10%, 09/15/04 | 6,031,052 | ||||||
Total Asset Backed Securities | 6,031,052 | ||||||
(Cost $6,031,052) | |||||||
| COMMERCIAL PAPER (a) - 30.0% | |||||||
Banking - Foreign Banks & Branches - 6.6% | |||||||
| 15,000,000 | Den Norske Bank | ||||||
1.08%, 01/15/04 | 14,993,700 | ||||||
| 10,000,000 | Nieuw Amsterdam Receivables Co. (c) | ||||||
1.10%, 01/02/04 | 9,999,695 | ||||||
| 24,993,395 | |||||||
Financial Services - 23.1% | |||||||
| 10,000,000 | Atlantis One Funding (c) | ||||||
1.08%, 01/20/04 | 9,994,300 | ||||||
| 2,000,000 | General Electric Capital Corp. | ||||||
1.09%, 01/15/04 | 1,999,152 | ||||||
| 7,416,000 | Hatteras Funding Corp. (c) | ||||||
1.09%, 02/25/04 | 7,403,651 | ||||||
| 10,000,000 | High Peak Funding LLC (c) | ||||||
1.12%, 01/12/04 | 9,996,578 | ||||||
| 2,000,000 | High Peak Funding LLC (c) | ||||||
1.12%, 01/20/04 | 1,998,818 | ||||||
| 3,200,000 | High Peak Funding LLC (c) | ||||||
1.13%, 01/20/04 | 3,198,091 | ||||||
See Notes to Financial Statements.
F-1
Table of Contents
MONEY MARKET FUND
PORTFOLIO OF INVESTMENTS, Continued • December 31, 2003
| Par Value | Value (Note 2) | |||||
Financial Services (continued) | ||||||
| $10,000,000 | Household Finance Corp. | |||||
1.09%, 01/08/04 | $ | 9,997,881 | ||||
| 7,000,000 | Newbury Funding (c) | |||||
1.20%, 01/05/04 | 6,999,066 | |||||
| 10,000,000 | Newbury Funding (c) | |||||
1.20%, 02/02/04 | 9,989,333 | |||||
| 7,000,000 | Sigma Finance, Inc. (c) | |||||
1.11%, 02/05/04 | 6,992,446 | |||||
| 5,000,000 | Sigma Finance, Inc. (c) | |||||
1.14%, 03/22/04 | 4,987,175 | |||||
| 4,050,000 | TransAmerica Asset Funding (c) | |||||
0.95%, 01/02/04 | 4,049,893 | |||||
| 7,000,000 | TransAmerica Asset Funding (c) | |||||
1.09%, 01/06/04 | 6,998,940 | |||||
| 2,600,000 | TransAmerica Asset Funding (c) | |||||
1.10%, 01/06/04 | 2,599,603 | |||||
| 87,204,927 | ||||||
Securities Broker - 0.3% | ||||||
| 1,000,000 | Barton Capital Corp. (c) | |||||
1.10%, 01/02/04 | 999,969 | |||||
Total Commercial Paper | 113,198,291 | |||||
(Cost $113,198,291) | ||||||
| CERTIFICATES OF DEPOSIT - 3.7% | ||||||
| 14,000,000 | Bank One NA Illinois | |||||
1.37%, 05/10/04 | 14,012,621 | |||||
Total Certificates of Deposit | 14,012,621 | |||||
(Cost $14,012,621) | ||||||
| Shares | Value (Note 2) | |||||
| INVESTMENT COMPANIES - 3.9% | ||||||
| 14,173,232 | Barclays Prime Money Market Fund | $ | 14,173,232 | |||
| 384,640 | Dreyfus Cash Management Plus Money Market Fund | 384,640 | ||||
| 76,246 | One Group Institutional Prime Money Market Fund | 76,246 | ||||
Total Investment Companies | 14,634,118 | |||||
(Cost $14,634,118) | ||||||
| Total Investments - 100.0% | 377,269,411 | |||||
| (Cost $377,269,411) | ||||||
| Net Other Assets and Liabilities - (0.0)% | (114,884 | ) | ||||
| Total Net Assets - 100.0% | $ | 377,154,527 | ||||
| (a) | Effective yield at time of purchase. |
| (b) | Variable rate security. The rate shown reflects rate in effect at period end. |
| (c) | Security exempt from registration under Rule 144A of the Securities Act of 1933. This security may be resold, in transactions exempt from registration, to qualified institutional buyers. At December 31, 2003, these securities amounted to $126,209,187 or 33.5% of net assets. These securities have been deemed to be liquid in accordance with procedures established by the Board of Trustees. |
| MTN Medium | Term Note |
FEDERAL INCOME TAX INFORMATION (SEE NOTE 2)
At December 31, 2003, the aggregate cost of investment securities for tax purposes was $377,269,411.
As of December 31, 2003, the components of distributable earnings on a tax basis consisted of $76,370 of undistributed short-term capital gains.
During the year ended December 31, 2003, the tax character of distributions paid for ordinary income was $4,324,222.
See Notes to Financial Statements.
F-2
Table of Contents
ALLMERICA INVESTMENT TRUST
STATEMENT OF ASSETS AND LIABILITIES • December 31, 2003
| Money Market Fund | |||
ASSETS: | |||
Total investments at value (cost $377,269,411) | $ | 377,269,411 | |
Cash | 47,662 | ||
Interest receivable | 1,416,020 | ||
Total Assets | 378,733,093 | ||
LIABILITIES: | |||
Management fee payable | 102,557 | ||
Distribution fee payable | 50,014 | ||
Trustees’ fees and expenses payable | 15,551 | ||
Payable for shares repurchased | 1,332,891 | ||
Accrued expenses and other payables | 77,553 | ||
Total Liabilities | 1,578,566 | ||
NET ASSETS | $ | 377,154,527 | |
NET ASSETS consist of: | |||
Paid-in capital | $ | 377,078,157 | |
Accumulated net realized gain on investments sold | 76,370 | ||
TOTAL NET ASSETS | $ | 377,154,527 | |
Shares of beneficial interest outstanding (unlimited authorization, no par value) | 377,079,783 | ||
NET ASSET VALUE, | |||
Offering and redemption price per share (Net Assets/Shares Outstanding) | $ | 1.000 | |
See Notes to Financial Statements.
F-3
Table of Contents
ALLMERICA INVESTMENT TRUST
STATEMENT OF OPERATIONS • For the Year Ended December 31, 2003
| Money Market Fund | |||
INVESTMENT INCOME | |||
Interest | $ | 7,084,963 | |
EXPENSES | |||
Management fees | 1,600,664 | ||
Distribution fees | 789,478 | ||
Custodian and Fund accounting fees | 183,114 | ||
Legal fees | 61,681 | ||
Audit fees | 66,224 | ||
Trustees’ fees and expenses | 54,533 | ||
Reports to shareholders | 34,036 | ||
Miscellaneous | 8,476 | ||
Total expenses | 2,798,206 | ||
NET INVESTMENT INCOME | 4,286,757 | ||
NET REALIZED GAIN ON INVESTMENTS | 76,830 | ||
NET INCREASE IN NET ASSETS RESULTING FROM OPERATIONS | $ | 4,363,587 | |
See Notes to Financial Statements.
F-4
Table of Contents
ALLMERICA INVESTMENT TRUST
STATEMENTS OF CHANGES IN NET ASSETS
Money Market Fund | ||||||||
| Years Ended December 31, | ||||||||
| 2003 | 2002 | |||||||
NET ASSETS at beginning of year | $ | 704,804,637 | $ | 604,656,688 | ||||
Increase (decrease) in net assets resulting from operations: | ||||||||
Net investment income | 4,286,757 | 10,414,765 | ||||||
Net realized gain on investments sold | 76,830 | 48,471 | ||||||
Net increase in net assets resulting from operations | 4,363,587 | 10,463,236 | ||||||
Distributions to shareholders from: | ||||||||
Net investment income | (4,286,757 | ) | (10,414,765 | ) | ||||
Net realized gain on investments | (37,465 | ) | — | |||||
Total distributions | (4,324,222 | ) | (10,414,765 | ) | ||||
Capital share transactions: | ||||||||
Net proceeds from sales of shares | 181,842,312 | 962,438,922 | ||||||
Issued to shareholders in reinvestment of distributions | 4,324,222 | 10,414,765 | ||||||
Cost of shares repurchased | (513,856,009 | ) | (872,754,209 | ) | ||||
Net increase (decrease) from capital share transactions | (327,689,475 | ) | 100,099,478 | |||||
Total increase (decrease) in net assets | (327,650,110 | ) | 100,147,949 | |||||
NET ASSETS at end of year | $ | 377,154,527 | $ | 704,804,637 | ||||
OTHER INFORMATION: | ||||||||
Share transactions: | ||||||||
Sold | 181,842,312 | 962,438,922 | ||||||
Issued to shareholders in reinvestment of distributions | 4,324,222 | 10,414,765 | ||||||
Repurchased | (513,856,009 | ) | (872,754,209 | ) | ||||
Net increase (decrease) in shares outstanding | (327,689,475 | ) | 100,099,478 | |||||
See Notes to Financial Statements.
F-5
Table of Contents
ALLMERICA INVESTMENT TRUST
FINANCIAL HIGHLIGHTS - For a Share Outstanding Throughout Each Year
| Ratios/Supplemental Data | ||||||||||||||||||||||||||||||||
| Ratios To Average Net Assets | ||||||||||||||||||||||||||||||||
Year Ended December 31, | Net Asset | Net Investment Income | Dividends from Net Investment Income | Total Distributions | Net Asset Value End of Period | Total Return | Net Assets End of Period (000’s) | Net Investment Income | Operating Expenses | Management Fee | ||||||||||||||||||||||
Money Market Fund | ||||||||||||||||||||||||||||||||
2003 | $ | 1.000 | $ | 0.008 | $ | (0.008 | ) | $ | (0.008 | )(1) | $ | 1.000 | 0.80 | % | $ | 377,155 | 0.82 | % | 0.53 | % | 0.30 | % | ||||||||||
2002 | 1.000 | 0.016 | (0.016 | ) | (0.016 | ) | 1.000 | 1.66 | % | 704,805 | 1.63 | % | 0.45 | % | 0.30 | % | ||||||||||||||||
2001 | 1.000 | 0.042 | (0.042 | ) | (0.042 | ) | 1.000 | 4.28 | % | 604,657 | 4.11 | % | 0.36 | % | 0.31 | % | ||||||||||||||||
2000 | 1.000 | 0.062 | (0.062 | ) | (0.062 | ) | 1.000 | 6.40 | % | 457,912 | 6.19 | % | 0.31 | % | 0.26 | % | ||||||||||||||||
1999 | 1.000 | 0.051 | (0.051 | ) | (0.051 | ) | 1.000 | 5.19 | % | 513,606 | 5.09 | % | 0.29 | % | 0.24 | % | ||||||||||||||||
| (1) | Includes distribution from net realized capital gains of less than $.0005 |
See Notes to Financial Statements.
F-6
Table of Contents
ALLMERICA INVESTMENT TRUST
NOTES TO FINANCIAL STATEMENTS
| 1. | ORGANIZATION |
Allmerica Investment Trust (the “Trust”) is registered under the Investment Company Act of 1940 (“the 1940 Act”), as amended, as an open-end, diversified management investment company established as a Massachusetts business trust. The Trust is intended to serve as an investment medium for (i) variable life insurance policies and variable annuity contracts offered by insurance companies, (ii) certain qualified pension and retirement plans, as permitted by Treasury Regulations; and (iii) life insurance companies and advisers to the Portfolios and their affiliates. Allmerica Financial Corporation (“AFC”) has ceased all new sales of proprietary variable annuities and life insurance products. The Trust is comprised of nine managed investment portfolios (“Portfolios”). The accompanying financial statements and financial highlights are those of the Money Market Fund (the “Portfolio”).
| 2. | SIGNIFICANT ACCOUNTING POLICIES |
The preparation of financial statements in conformity with accounting principles generally accepted in the United States of America requires management to make estimates and assumptions at the date of the financial statements. Actual results could differ from those estimates.
The following is a summary of significant accounting policies followed by the Trust in the preparation of its financial statements:
Security Valuation: Securities of the Portfolio are valued utilizing the amortized cost valuation method, permitted in accordance with Rule 2a-7 under the 1940 Act. This method involves valuing a portfolio security initially at its cost and thereafter assuming a constant amortization to maturity of any discount or premium.
Security Transactions and Investment Income: Security transactions are recorded as of the trade date. Realized gains and losses from security transactions are determined on the basis of identified cost. Interest income, including amortization of premium and accretion of discount on securities, is accrued daily. Income distributions earned by the Portfolio from investments in certain investment companies are recorded as interest income in the accompanying financial statements.
Federal Income Taxes: The Trust treats each portfolio as a separate entity for Federal income tax purposes. The Portfolio intends to continue to qualify as a “regulated investment company” under Subchapter M of the Internal Revenue Code of 1986, as amended. By so qualifying, the Portfolio will not be subject to Federal income taxes to the extent it distributes all of its taxable income and net realized gains, if any, for its fiscal year. In addition, by distributing during each calendar year substantially all of its net investment income, capital gains and certain other amounts, if any, the Portfolio will not be subject to Federal excise tax. Therefore, no Federal income tax provision is required.
Distributions to Shareholders: Dividends from net investment income are declared and reinvested daily for the Portfolio. The Portfolio declares and distributes all net realized capital gains, if any, at least annually. Distributions to shareholders are recorded on the ex-dividend date.
Expenses: Expenses directly attributed to a portfolio are charged to the portfolio, while expenses which are attributable to more than one portfolio of the Trust are allocated based upon relative net assets among the respective Portfolios and one other affiliated investment company, Allmerica Securities Trust.
Forward Commitments: The Portfolio may enter into contracts to purchase securities for a fixed price at a specified future date beyond customary settlement time (“forward commitments”). If the Portfolio does so, it will maintain cash or other liquid obligations having a value in an amount at all times sufficient to meet the purchase price. Forward commitments involve a risk of loss if the value of the security to be purchased declines prior to the settlement date. Although the Portfolio generally will enter into forward commitments with the intention of acquiring securities for its portfolio, it may dispose of a commitment prior to settlement if its Sub-Adviser deems it appropriate to do so.
F-7
Table of Contents
ALLMERICA INVESTMENT TRUST
NOTES TO FINANCIAL STATEMENTS (Continued)
Repurchase Agreements: The Portfolio may engage in repurchase agreement transactions with institutions that the Sub-Adviser has determined are creditworthy pursuant to guidelines established by the Trust’s Board of Trustees. The Portfolio requires that the securities purchased in a repurchase agreement transaction be transferred to the Trust’s Custodian in a manner that is intended to enable the Portfolio to obtain those securities in the event of a counterparty default. The Sub-Adviser monitors the value of the securities, including accrued interest, daily to ensure that the value of the collateral equals or exceeds amounts due under the repurchase agreement. Repurchase agreement transactions involve certain risks in the event of default or insolvency of the counterparty, including possible delays or restrictions upon the Portfolio’s ability to dispose of the underlying securities, and a possible decline in the value of the underlying securities during the period while the Portfolio seeks to assert its rights.
| 3. | INVESTMENT MANAGEMENT, ADMINISTRATION, AND OTHER RELATED PARTY TRANSACTIONS |
Management Fees: Allmerica Financial Investment Management Services, Inc. (the “Manager”), a wholly-owned subsidiary of Allmerica Financial Life Insurance and Annuity Company (“Allmerica Financial”), serves as investment manager and administrator to the Trust. Allmerica Financial is a wholly-owned subsidiary of AFC. Under the terms of the management agreement, the Portfolio pays a management fee, calculated daily and payable monthly at annual rates of 0.35% for the first $100,000,000 in average daily net assets, 0.30% for the next $400,000,000 in average daily net assets, 0.25% for the next $250,000,000 in average daily net assets, and 0.20% for average daily net assets in excess of $750,000,000.
The Manager has entered into Sub-Adviser Agreements for the management of the investments of the Portfolio. The Manager is solely responsible for the payment of all fees to the Sub-Adviser. The Sub-Adviser for the Portfolio is Opus Investment Management, Inc., a wholly-owned subsidiary of AFC. Effective February 1, 2003, the name of Allmerica Asset Management, Inc. was changed to Opus Investment Management, Inc.
Plan of Distribution and Service: The 12b-1 Plan permits the Portfolio to pay Allmerica Financial and First Allmerica Financial Life Insurance Company, a wholly-owned subsidiary of Allmerica Financial, for marketing and distribution expenses to support the sale and distribution of the Portfolio’s shares and the provision of services to maintain and retain accounts. The 12b-1 Plan authorizes payment of a distribution and service fee at an annual rate of up to 0.25% of the Portfolio’s average daily net assets. As directed by the Board of Trustees, the Portfolio pays a distribution fee at an annual rate of 0.15% of the Portfolio’s average daily net assets.
Custodian, Fund Accounting, and Administrative Fees: Investors Bank & Trust Company (“IBT”) provides portfolio accounting and custody services to the Trust and receives fees and reimbursement of certain out-of-pocket expenses for its services from the Trust. The Manager has entered into an Administrative Services Agreement with IBT, whereby IBT performs certain administrative services for the Portfolio and is entitled to receive an administrative fee and reimbursement of certain out-of-pocket expenses. The Manager is solely responsible for the payment of the administrative fee to IBT. The Trust pays no salaries or compensation to any of its officers. Trustees who are not directors, officers or employees of the Trust or any investment adviser are reimbursed for their travel expenses in attending meetings of the Trustees, and receive quarterly meeting and retainer fees for their services. Such amounts are paid by the Trust.
| 4. | REIMBURSEMENT OF EXPENSES AND WAIVER OF FEES |
In the event normal operating expenses, excluding taxes, interest, broker commissions, and extraordinary expenses, but including the management fee, exceed 0.60% of average net assets, the Manager will voluntarily reimburse fees and any expenses in excess of the expense limitation. Expense limitations may be removed or revised at any time after the Portfolio’s first fiscal year of operations without prior notice to existing shareholders.
| 5. | SHARES OF BENEFICIAL INTEREST |
The Trust’s Declaration of Trust authorizes the Trustees to issue an unlimited number of shares of beneficial interest for the Portfolio, each without a par value.
F-8
Table of Contents
ALLMERICA INVESTMENT TRUST
NOTES TO FINANCIAL STATEMENTS (Continued)
| 6. | FOREIGN SECURITIES |
The Portfolio may invest in only U.S. dollar denominated foreign securities. Investing in foreign securities involves special risks not typically associated with investing in securities of U.S. issuers. The risks include future adverse political and economic developments. Moreover, securities of many foreign issuers and their markets may be less liquid and their prices more volatile than those of securities of comparable U.S. issuers.
F-9
Table of Contents
ALLMERICA INVESTMENT TRUST
REPORT OF INDEPENDENT AUDITORS
To the Board of Trustees and Shareholders of Allmerica Investment Trust
In our opinion, the accompanying statement of assets and liabilities, including the portfolio of investments, and the related statements of operations and of changes in net assets and the financial highlights present fairly, in all material respects, the financial position of the Money Market Fund (one of the Portfolios constituting the Allmerica Investment Trust, hereafter referred to as the “Trust”) at December 31, 2003, the results of its operations, the changes in its net assets and the financial highlights for the periods indicated, in conformity with accounting principles generally accepted in the United States of America. These financial statements and financial highlights (hereafter referred to as “financial statements”) are the responsibility of the Trust’s management; our responsibility is to express an opinion on these financial statements based on our audits. We conducted our audits of these financial statements in accordance with auditing standards generally accepted in the United States of America, which require that we plan and perform the audit to obtain reasonable assurance about whether the financial statements are free of material misstatement. An audit includes examining, on a test basis, evidence supporting the amounts and disclosures in the financial statements, assessing the accounting principles used and significant estimates made by management, and evaluating the overall financial statement presentation. We believe that our audits, which included confirmation of securities at December 31, 2003 by correspondence with the custodian and brokers, provide a reasonable basis for our opinion.
PricewaterhouseCoopers LLP
Boston, Massachusetts
February 12, 2004
F-10
Table of Contents
ALLMERICA INVESTMENT TRUST
BOARD OF TRUSTEES (Unaudited)
Name, Address | Position(s) | Term of Office | Principal Occupation(s) | Number of Portfolios in Fund Complex Overseen by Trustee | Other | |||||
| P. Kevin Condron (58) | Trustee, Member of the Audit Committee and Fund Operations Committee | Indefinite
Served Since 1998 | President and Chief Executive Officer, The Granite Group (wholesale plumbing and heating), 1997-present. | 10 | Director, Banknorth Group. | |||||
| Jocelyn S. Davis (50) | Trustee, Member of the Audit Committee and Fund Operations Committee | Indefinite
Served Since 2001 | President, Nelson Hart, LLC (consulting), 2002-present; Beers & Cutler (professional services), 2001-2002; Chief Financial Officer, AARP (non-profit), 1996-2001. | 10 | None | |||||
| Cynthia A. Hargadon(49) | Trustee, Member of the Fund Operations Committee, Investment Operations Committee and Governance Committee | Indefinite
Served Since 1997 | President and Chief Investment Officer, PlanTools, LLC (consulting), 2003-present; Managing Director, McHenry Group, 2003-present; President, Hargadon Associates (asset management consulting), 2002-2003; President, Potomac Asset Management, Inc., 2000-2002; Director of Investments, National Automobile Dealers Association, 1999-2000; President, Stable Value Investment Association (investment trade group), 1996-1999. | 10 | Director, Wilshire Target Funds, 2001-present. | |||||
| T. Britton Harris, IV (45) | Trustee, Member of the Investment Operations Committee, Governance Committee and Fund Operations Committee | Indefinite
Served Since 2001 | President, Verizon Investment Management Corporation, 1990-present. | 10 | None | |||||
| Gordon Holmes (65) | Trustee, Chairman of the Audit Committee and Member of the Fund Operations Committee | Indefinite
Served Since 1991 | Instructor at Bentley College, 1998-present; Certified Public Accountant; Retired Partner, Tofias, Fleishman, Shapiro & Co., P.C. (Accountants). | 10 | None | |||||
| Attiat F. Ott (68) | Trustee, Chairman of the Fund Operations Committee and Member of the Audit Committee | Indefinite
Served Since 1982 | Professor of Economics and Director of the Institute for Economic Studies, Clark University, 940 Main Street, Worcester, MA. | 10 | None | |||||
| Ranne P. Warner (59) | Trustee, Chairman of the Governance Committee, Member of the Fund Operations Committee and Investment Operations Committee | Indefinite
Served Since 1991 | President, Centros Properties, USA; Owner, Ranne P. Warner and Company; Blackstone Exchange LLC (real estate) 2001-present. | 10 | Director, Wainwright Bank & Trust Co. (commercial bank). | |||||
| *Mark A. Hug (46) | Trustee, Member of the Investment Operations Committee | Indefinite
Served Since 2003 | President and CEO, First Allmerica Financial Life Insurance Company (“First Allmerica”) and Allmerica Financial Life Insurance and Annuity Company (“Allmerica Financial Life”) 2000-present; Senior Vice President, Equitable Life (product and marketing) prior to 1999. | 10 | None | |||||
F-11
Table of Contents
ALLMERICA INVESTMENT TRUST
BOARD OF TRUSTEES (Unaudited)
Name, Address | Position(s) | Term of Office | Principal Occupation(s) | Number of Portfolios in Fund Complex Overseen by Trustee | Other Directorships Held by Trustee | |||||
| *John P. Kavanaugh (49) | Chairman, Trustee and President, Chairman of the Investment Operations Committee | Indefinite
Served Since 1995 | President, Opus Investment Management, Inc.; Vice President, Director, Chief Investment Officer, First Allmerica and Allmerica Financial Life. | 10 | None |
| * | Messrs. Hug and Kavanaugh are “interested persons”, as defined in the Investment Company Act of 1940 as amended, of the Trust and of Allmerica Financial Corporation (“AFC”) because of their affiliations with AFC. |
| (1) | The business address of each person is 440 Lincoln Street, Worcester, Massachusetts 01653. |
| (2) | Except as otherwise noted, each individual has held the office indicated or other offices in the same organization for the last five years. |
The Statement of Additional Information of Allmerica Investment Trust (“SAI”) contains additional information about the Board of Trustees and is available without charge upon request. You may request a copy of the SAI by contacting us at the phone number listed on the back cover of this report.
F-12
Table of Contents
ALLMERICA INVESTMENT TRUST
REGULATORY DISCLOSURES (Unaudited)
The performance data quoted represents past performance and the investment return and principal value of an investment will fluctuate so that an investor’s shares, when redeemed, may be worth more or less than their original cost.
An investment in the Money Market Fund is not insured or guaranteed by the Federal Deposit Insurance Corporation or any other government agency. Although the Portfolio seeks to preserve the value of your investment at a stable net asset value of $1.00 per share, it is possible to lose money by investing in the Portfolio.
Securities issued by some U.S. Government-sponsored entities, such as Federal Home Loan Mortgage Corporation (Freddie Mac) and the Federal National Mortgage Association (Fannie Mae), are not backed by the full faith and credit of the U.S. Government. No assurances can be given that the U.S. Government would provide financial support to a U.S. Government-sponsored instrumentality if not obligated to do so.
This report and the financial statements contained herein are submitted for the general information of the shareholders of the Portfolio and are not authorized for distribution to prospective investors in the flexible premium variable life insurance or annuity products of Allmerica Financial Life Insurance and Annuity Company or First Allmerica Financial Life Insurance Company unless accompanied or preceded by effective prospectuses for the flexible premium variable life insurance or annuity products of Allmerica Financial Life Insurance and Annuity Company or First Allmerica Financial Life Insurance Company and Allmerica Investment Trust which include important information related to charges and expenses.
CLIENT NOTICES (Unaudited)
This report includes financial statements for the Money Market Fund of Allmerica Investment Trust. It does not include financial statements for the separate accounts that correspond to the insurance and/or annuity products included in this report.
The SEC has modified mailing requirements for annual reports to allow a single copy of this report to be delivered to customers who share the same last name and address. This will automatically apply to all customers. If you would prefer to receive your own copy, please notify us at the phone number listed on the back cover of this report.
F-13
Table of Contents
Intentionally Left Blank
Table of Contents
[LOGO]
THE ALLMERICA FINANCIAL COMPANIES
The Hanover Insurance Company • Citizens Insurance Company of America • Citizens Management Inc.
Opus Investment Management, Inc. • AMGRO, Inc. • Financial Profiles, Inc.
First Allmerica Financial Life Insurance Company • Allmerica Financial Life Insurance and Annuity Company (all states except NY)
440 Lincoln Street, Worcester, Massachusetts 01653
| 11129NS (12/03) | 04-003 |
Table of Contents
| Item 2. | Code of Ethics |
As of the end of the period covered by this report, the registrant has adopted a code of ethics that applies to the registrant’s principal executive officer and principal financial/principal accounting officer.
| Item 3. | Audit Committee Financial Expert |
The registrant’s Board of Trustees has determined that Gordon Holmes, who is an “independent” Trustee, qualifies as an “audit committee financial expert” (as such term has been defined by SEC regulations).
The SEC has stated that the designation or identification of a person as an audit committee financial expert pursuant to this Item 3 of Form N-CSR does not impose on such person any duties, obligations or liability that are greater than the duties, obligations and liability imposed on such person as a member of the Audit Committee and the Board of Trustees in the absence of such designation or identification.
| Item 4. | Principal Accountant Fees and Services |
Audit Fees | Types of Services | Percentage of Services Approved by the Audit Committee under Pre-approval Policies and Procedures | ||||
2003 | $304,000 | 100% | ||||
2002 | $385,800 | 100% | ||||
Audit-Related Fees | ||||||
2003 | $0 | |||||
2002 | $0 | |||||
Tax Fees | ||||||
2003 | $41,000 | Tax return review | 100% | |||
2002 | $35,300 | 100% | ||||
All Other Fees | ||||||
2003 | $0 | |||||
2002 | $0 | |||||
All fees disclosed above under the captions “Audit-Related Fees,” “Tax Fees,” and “All Other Fees” represent fees billed for services that were required to be pre-approved, and which were so pre-approved, by the registrant’s Audit Committee in accordance with the Audit Committee’s Policy for Pre-Approval of Services Provided by Independent Auditors.
% of the hours expended on the independent accountants’ engagement on behalf of the registrant for the fiscal year ended December 31, 2003, were attributable to work performed by persons other than the independent accountants’ full-time, permanent employees. Not applicable
For the last two fiscal years of the registrant, the independent accountants billed aggregate non-audit fees in the following amounts to the registrant and Allmerica Financial Investment Management Services, Inc. (“AFIMS”), the Trust’s investment adviser:
| 2003 | $0 | |
| 2002 | $0 | |
The registrant’s Audit Committee has determined that the provision by the registrant’s independent accountants of non-audit services that were rendered to AFIMS and that were not pre-approved by the Audit Committee were compatible with maintaining the independence of such accountants.
Table of Contents
The Audit Committee has adopted certain policies and procedures for pre-approval of services provided by the independent accountants. On an annual basis, certain types of recurring audit, audit-related and other services are pre-approved by the Committee, including, among other things, the list of required audits and projects presented by the independent accountants; consultation and advisory services related to accounting/reporting and risk management/control matters provided in the normal course of business; and assistance with SEC and other regulatory filings and tax services incurred in the normal course of business. This pre-approval will occur concurrently with the approval of the annual audit fees and will apply to all individual projects meeting the criteria discussed above and which are expected to result in total fees less than $400,000. For individual projects outside the scope of the fiscal year audits and tax return filings expected to be $25,000 or greater, specific pre-approval will be necessary.
Pre-approvals for all other services will occur if and when the need for any such services arises. This pre-approval will be initiated by AFIMS and will be requested from the Chairman or, in the event the Chairman is unavailable, any other member of the Audit Committee. Any services approved by the Chairman, or other Audit Committee member, at any time other than during an Audit Committee meeting will be reported to the full Audit Committee at the next regularly scheduled meeting. Expenses permitted under Rule 2-01(c)(7)(i)(C) of Regulation S-X (the “De Minimis Exception”) will not require pre-approval.
The percentages of expenses that were approved by the Audit Committee in accordance with the De Minimis Exception were as follows: Not applicable
| 2003 | 2002 | |||
Audit-Related Fees | ||||
Tax Fees | ||||
All Other Fees |
| Item 5. | Audit Committee of Listed Registrants |
Not Applicable
| Item 6. | Reserved. |
| Item 7. | Disclosure of Proxy Voting Policies and Procedures for Closed-End Management Investment Companies. |
Not Applicable
| Item 8. | Reserved. |
| Item 9. | Controls and Procedures |
| (a) | The registrant’s principal executive and principal financial officers have concluded that, based on their evaluation of the effectiveness of the registrant’s disclosure controls and procedures (as defined in Rule 30a-3(c) under the Investment Company Act of 1940) as of the date within 90 days of the filing date of this report on Form N-CSR, such disclosure controls and procedures provide reasonable assurances that material information relating to the registrant is made known to them by the appropriate persons. |
| (b) | Changes to internal control over financial reporting: Not Applicable |
| Item 10. | Exhibits |
| (a) | Code of ethics that applies to the registrant’s principal executive officer and principal financial/principal accounting officer is attached as Exhibit 99.CODE. |
Table of Contents
| (b)(1) | Separate certifications by the registrant’s principal executive officer and principal financial officer, pursuant to Section 302 of the Sarbanes-Oxley Act of 2002 and as required by Rule 30a-2(a) under the Investment Company Act of 1940, are attached hereto as Exhibit 99.CERT. |
| (2) | A certification by the registrant’s principal executive officer and principal financial officer, pursuant to Section 906 of the Sarbanes-Oxley Act of 2002 and as required by Rule 30a-2(b) under the Investment Company Act of 1940 is attached hereto as Exhibit 99.906CERT. |
Table of Contents
Signatures
Pursuant to the requirements of the Securities Exchange Act of 1934 and the Investment Company Act of 1940, the registrant has duly caused this report to be signed on its behalf by the undersigned, thereunto duly authorized.
| Allmerica Investment Trust | ||
| By: | /s/ John P. Kavanaugh | |
John P. Kavanaugh President and Chairman | ||
Date: February 23, 2004
Pursuant to the requirements of the Securities Exchange Act of 1934 and the Investment Company Act of 1940, this report has been signed below by the following persons on behalf of the registrant and in the capacities and on the dates indicated.
| By: | /s/ John P. Kavanaugh | |
John P. Kavanaugh President and Chairman | ||
Date: February 23, 2004
| By: | /s/ Paul T. Kane | |
Paul T. Kane Assistant Vice President and Treasurer (Principal Accounting Officer and Principal Financial Officer) | ||
Date: February 23, 2004