Table of Contents
UNITED STATES
SECURITIES AND EXCHANGE COMMISSION
Washington, D.C. 20549
FORM N-CSR
CERTIFIED SHAREHOLDER REPORT OF REGISTERED
MANAGEMENT INVESTMENT COMPANIES
Investment Company Act file number 811-04138
Allmerica Investment Trust
(Name of Registrant)
440 Lincoln Street
Worcester, Massachusetts 01653
(Address of Principal Executive Offices)
Sheila B. St. Hilaire, Trust Secretary
Allmerica Financial
440 Lincoln Street
Worcester, MA 01653
(Name and Address of Agent for Service)
Registrant’s Telephone Number, including Area Code: (508) 855-1000
Date of Fiscal Year End: December 31
Date of Reporting Period: December 31, 2005
Table of Contents
| Item 1. | Reports to Stockholders |
The following are copies of the report transmitted to stockholders pursuant to Rule 30e-1 under the Investment Company Act of 1940:
Allmerica Investment Trust
Annual Report
December 31, 2005
Table of Contents

Table of Contents
| 1 | ||
| 2 | ||
| 3 | ||
| 4 | ||
| 5 | ||
| 6 | ||
| 7 | ||
| 8 | ||
| 9 | ||
| 10 | ||
Expense Examples | F-1 | |
Financials | F-2 | |
Regulatory Disclosures | F-56 | |
One or more Funds may not be available under the variable annuity or variable life insurance policy which you have chosen. Inclusion in this report of a Fund which is not available under your policy is not to be considered a solicitation.
Table of Contents
Dear Client:
While economies around the world strained to grow during 2005, many global stock markets surged. In Europe, economic growth was sluggish, voters in France and Holland rejected the European Union constitution and there was an election stalemate in Germany. Investors apparently shrugged off these concerns, sending share prices sharply higher. Germany’s Xetra DAX index grew by over 27%, France’s CAC 40 index was up over 23% and London’s FTSE 100 index gained over 16%. Asian economies showed good strength, led by a rebound in Japan. The Nikkei Stock Average gained over 40%, as Prime Minister Koizumi’s election was seen as positive for business. Markets in South Korea, Pakistan and India also rose significantly, as share prices performed well throughout much of Asia. Many had feared that an upward revaluation of the yuan would slow China’s economic growth and impact other countries in the region. However, China’s economy was able to record another strong year after the yuan was raised only about 2% against the U.S. dollar. For the period, the MSCI EAFE Index gained about 14%.
The United States economy turned in another solid performance in 2005, but U.S. stock markets barely budged. GDP grew by an estimated 3.5% for the year and inflation remained well contained. Oil and natural gas prices skyrocketed after hurricanes ripped through refineries and pipelines along the Gulf Coast, threatening economic growth. These prices moved lower when it became apparent that the economy could withstand the effects of these natural disasters. The Federal Reserve Board raised short-term interest rates a full two percentage points during the period, in its continuing effort to combat inflation and maintain price stability. Employment growth continued, although hurricane related losses and layoffs at high-profile companies garnered many of the headlines. Despite a strong economy, U.S. stock markets did not fare as well as some in other parts of the world. For the year, the S&P 500® Index rose over 4%, while the Nasdaq Composite Index gained over 1%. The bond markets provided another year of positive returns, despite the Federal Reserve Board’s tightening moves. The Lehman Brothers Aggregate Bond Index was higher by more than 2%.
On January 9, 2006, each of the Allmerica Investment Trust (AIT) portfolios was reorganized into a corresponding portfolio offered by Goldman Sachs Variable Insurance Trust. These changes are explained on the individual AIT portfolio pages that follow.
On behalf of the Board of Trustees,

John P. Kavanaugh
Chairman of the Board
Allmerica Investment Trust
1
Table of Contents
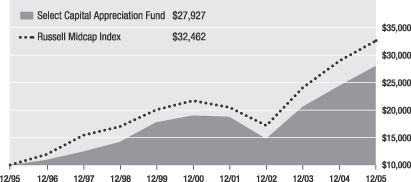
Select Capital Appreciation Fund
The Select Capital Appreciation Fund returned 14.68% for 2005, outperforming its benchmark, the Russell Midcap Index, which returned 12.65%.
The portfolio’s strong performance was primarily driven by stock selection and sector allocation. Holdings in the Information Technology and Telecommunications Services sectors had the largest positive impact, followed by Financial Services and Health Care. Within Information Technology, communications equipment providers Harris Corporation and ADTRAN were two of the best performers. Harris Corporation experienced robust demand in its military and international businesses, while ADTRAN benefited from strength in the digital subscriber line (DSL) market. Other notable contributors were Global Payments and Iron Mountain. Outperformance in Telecommunications Services was driven by the portfolio’s above-benchmark exposure to wireless providers and stock selection among diversified telecommunications companies. For example, Canadian wireline and wireless provider Telus performed extremely well. In Financials, stock selection was the primary source of relative strength. Notable contributors included capital markets companies Ameritrade and E*Trade Financial. Both benefited from higher-than-average trading volumes and acquisitions that investors expected to be accretive to earnings. The portfolio’s lack of exposure to thrifts and mortgage companies boosted performance versus the index. Stocks in this industry fell sharply amid a decline in mortgage activity. Stock selection was also strong among Health Care companies, where many of the portfolio’s biotechnology investments did particularly well. These included Vertex Pharmaceuticals, Gilead Sciences, and Amylin Pharmaceuticals.
While the portfolio outperformed, there were pockets of weakness. Stock selection in the Industrials and Business Services sectors had a mildly negative impact on relative performance. Not owning AMR Corporation was unfavorable since the stock was up sharply on several upgrades from Wall Street analysts.
The comments above are based on information provided by the Investment Sub-Adviser for the period indicated.
| Investment Sub-Adviser* | About the Fund* | |
| T. Rowe Price Associates, Inc. | Seeks long-term growth of capital by investing primarily in medium sized companies whose earnings are expected to grow at a faster rate than those of the average company. | |
Average Annual Total Returns
| 1 Year | 5 Year | 10 Year | ||||
Select Capital Appreciation Fund | 14.68% | 8.06% | 10.82% | |||
Russell Midcap Index | 12.65% | 8.46% | 12.50% | |||
Lipper Mid-Cap Growth Funds Average | 10.61% | (0.49)% | 8.15% | |||
Growth of a $10,000 Investment Since 1995
The Select Capital Appreciation Fund is a portfolio of Allmerica Investment Trust.
The Russell Midcap Index measures the performance of the 800 smallest companies in the Russell 1000 Index. The Lipper Mid-Cap Growth Funds Average is a non-weighted average of funds within the mid-cap growth investment objective.
Performance prior to 4/1/98 is that of a prior Sub-Adviser.
*Effective 1/9/06, the Select Capital Appreciation Fund was reorganized into the Goldman Sachs Growth Opportunities Fund - Service Shares (the Fund). Goldman Sachs Asset Management, L.P. is the investment adviser to the Fund.
The performance data quoted represents past performance. Past performance does not guarantee future results. The investment return and principal value of an investment will fluctuate so that an investor’s shares, when redeemed, may be worth more or less than their original cost. Current performance may be lower or higher than the performance data quoted. For information on the current month end performance of variable annuity and variable life insurance products, please call: (800) 533-7881. The performance data quoted is net of all fund operating expenses, but does not include variable insurance or variable annuity charges. If the performance data included the effect of these additional charges, it would have been lower.
2
Table of Contents
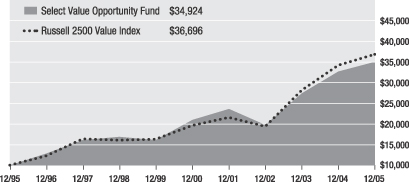
The Select Value Opportunity Fund returned 7.18% for 2005, underperforming its benchmark, the Russell 2500 Value Index, which returned 7.74%.
The U.S. economy was quite resilient in 2005. While it did decelerate from its recent peak in 2004, it was still sufficiently robust to help drive double digit earnings growth. Market returns were narrowly focused on Energy and Utilities, as most other sectors underperformed. Major contributors to performance included Questar Corp., an exploration and production company with new management focusing on the non-regulated side of the business and AnnTaylor Stores, the women’s apparel retailer, where consolidated management began to deliver on the turnaround plan at the core AnnTaylor division. Arris, a telecom equipment company, appreciated as cable companies accelerate their rollout of VOIP telephone services using Arris’s equipment. Goodrich Corporation, one of the leading component suppliers to the commercial and military aerospace markets benefited from an accelerating demand recovery in the commercial aerospace market. E*Trade Financial, an on-line provider of financial services contributed to performance, as the long awaited consolidation of the online brokerage industry began to take shape.
The top detractors included Impax Laboratories, a pharmaceutical company that had trouble filing its financial statements and Brooks Automation, a semiconductor equipment maker, which underperformed as the semiconductor industry failed to gain traction. Apria Healthcare Group Inc., which provides home health care services, suffered as end market demand weakened and management failed to cut expenses quickly enough to offset the earnings impact. Dollar Tree Stores, Inc. an operator of discount variety stores continued to transition to larger, more profitable stores, but the older, smaller locations continued to drag down overall results.
The comments above are based on information provided by the Investment Sub-Adviser for the period indicated.
| Investment Sub-Adviser* | About the Fund* | |
| Cramer Rosenthal McGlynn, LLC | Seeks long-term growth of capital by investing primarily in small and mid-sized companies whose securities may be undervalued. | |
Average Annual Total Returns
| 1 Year | 5 Year | 10 Year | ||||
Select Value Opportunity Fund | 7.18% | 10.80% | 13.32% | |||
Russell 2500 Value Index | 7.74% | 13.42% | 13.89% | |||
Lipper Mid-Cap Value Funds Average | 8.53% | 10.37% | 12.22% | |||
Growth of a $10,000 Investment Since 1995
The Select Value Opportunity Fund is a portfolio of Allmerica Investment Trust.
The Russell 2500 Value Index measures the performance of those Russell 2500 companies with lower price-to-book ratios and lower forecasted growth values. The Lipper Mid-Cap Value Funds Average is a non-weighted average of funds within the mid-cap value investment objective.
Performance prior to 1/1/97 is that of a prior Sub-Adviser.
*Effective 1/9/06, the Select Value Opportunity Fund was reorganized into the Goldman Sachs Mid Cap Value Fund - Service Shares (the Fund). Goldman Sachs Asset Management, L.P. is the investment adviser to the Fund.
The performance data quoted represents past performance. Past performance does not guarantee future results. The investment return and principal value of an investment will fluctuate so that an investor’s shares, when redeemed, may be worth more or less than their original cost. Current performance may be lower or higher than the performance data quoted. For information on the current month end performance of variable annuity and variable life insurance products, please call: (800) 533-7881. The performance data quoted is net of all fund operating expenses, but does not include variable insurance or variable annuity charges. If the performance data included the effect of these additional charges, it would have been lower.
3
Table of Contents
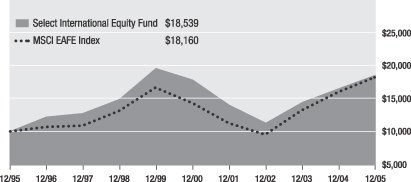
Select International Equity Fund
The Select International Equity Fund returned 12.41% for 2005, underperforming its benchmark, the MSCI EAFE Index, which returned 14.02%.
Global stock markets delivered solid returns in 2005, aided by stronger-than-expected global GDP growth and corporate earnings, increased dividend payouts, share buybacks and acceleration of merger and acquisition activity. In the Grantham, Mayo, Van Otterloo & Co. LLC portion of the fund, sector exposures generally helped performance. Most significant was the underweight to Telecommunications, which was the weakest sector. Momentum proved to be the best method to pick winning stocks, while valuation had mixed results. Canadian Natural Resources and Austrian oil company OMV made the largest individual positive contributions to relative return among the holdings. Holding Dutch financial ABN AMRO and Enel, the Italian utility, proved to be less successful. Overweights to Japan and Austria helped performance, while not holding Korean stocks reduced returns.
In the J.P. Morgan Investment Management Inc. portion of the fund, stock selection was the primary source of performance for the year. At a regional level, emerging market countries contributed positively to performance, while Europe and developed Asia detracted the most. From a sector perspective, Information Technology and Energy aided returns, while the biggest detractors were Consumer Discretionary, Financials and Industrials. Mitsubishi Corp., the Japanese trading company, had a tremendous year, experiencing strong cyclical trends across its major divisions. Companhia Vale do Rio Doce, the Brazilian mining company, also performed extremely well as investors looked to participate in the commodity rally. Holdings that detracted from performance included Kingfisher, the European do-it-yourself retailer that had disappointing results, and Vodafone, the global telecommunications company.
The comments above are based on information provided by the Investment Sub-Advisers for the period indicated.
| Investment Sub-Advisers* | About the Fund* | |
Grantham, Mayo, Van Otterloo & Co. LLC J.P. Morgan Investment Management Inc. | Seeks maximum long-term total return (capital appreciation and income) primarily by investing in common stocks of established non-U.S. companies. | |
Average Annual Total Returns
| 1 Year | 5 Year | 10 Year | ||||
Select International Equity Fund | 12.41% | 0.81% | 6.37% | |||
MSCI EAFE Index | 14.02% | 4.94% | 6.17% | |||
Lipper International Core Funds Average | 14.83% | 3.93% | 6.83% | |||
Growth of a $10,000 Investment Since 1995
The Select International Equity Fund is a portfolio of Allmerica Investment Trust.
Special risk considerations are associated with investments in non-U.S. companies, including fluctuating foreign exchange rates, foreign governmental regulations and differing degrees of liquidity that may adversely affect the portfolio.
The MSCI EAFE Index is an unmanaged capitalization weighted index of European, Australasian and Far Eastern stocks. The Lipper International Core Funds Average is a non-weighted average of funds within the international core investment objective.
Grantham, Mayo, Van Otterloo & Co. LLC and J.P. Morgan Investment Management Inc. became Co-Sub-Advisers of the fund effective October 1, 2004. Performance prior to this date is that of a prior Sub-Adviser.
*Effective 1/9/06, the Select International Equity Fund was reorganized into the Goldman Sachs International Equity Fund - Service Shares (the Fund). Goldman Sachs Asset Management International is the investment adviser to the Fund.
The performance data quoted represents past performance. Past performance does not guarantee future results. The investment return and principal value of an investment will fluctuate so that an investor’s shares, when redeemed, may be worth more or less than their original cost. Current performance may be lower or higher than the performance data quoted. For information on the current month end performance of variable annuity and variable life insurance products, please call: (800) 533-7881. The performance data quoted is net of all fund operating expenses, but does not include variable insurance or variable annuity charges. If the performance data included the effect of these additional charges, it would have been lower.
4
Table of Contents
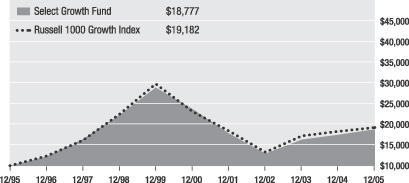
The Select Growth Fund returned 7.38% for 2005 outperforming its benchmark, the Russell 1000 Growth Index, which returned 5.27%.
In the GE Asset Management Incorporated portion of the fund, the sole holding in the Materials sector, Monsanto, contributed positively to performance, as did an overweight position in Energy sector holding Schlumberger. Not owning any Consumer Staples stocks also benefited the portfolio, as the sector underperformed the benchmark. An overweight position in the lagging Consumer Discretionary sector was the single largest detractor from portfolio performance during the period. Underperforming stocks included Liberty Media, Comcast, Bed Bath & Beyond, Carnival and IAC InterActiveCorp. Vodafone, the only Telecommunication Services holding, performed poorly, as well. In the Financials sector, State Street and AFLAC were positive contributors, but could not offset the negative impact of the position in underperforming Fannie Mae.
In the Jennison Associates LLC portion of the fund, Health Care positions had the largest positive impact on total return. Alcon, Amgen, Genentech and Roche all benefited from strong product cycles. United Health Group and Wellpoint also posted above market returns. The performance of the Information Technology holdings was also very strong. Google was the top contributor to returns, while Apple Computer’s stock more than doubled during the year, as it continued to benefit from the tremendous success of its iPod family of products. In the Consumer sectors, Whole Foods and Chico’s were important contributors to performance. The greatest detractor from returns was eBay, with most of the weakness occurring early in the year, on concerns that domestic growth was slowing more than anticipated. In the Industrials sector, holdings UPS and GE underperformed the benchmark.
The comments above are based on information provided by the Investment Sub-Advisers for the period indicated.
| Investment Sub-Advisers* | About the Fund* | |
GE Asset Management Incorporated Jennison Associates LLC | Seeks long-term growth of capital by investing primarily in the common stock of companies believed to have long-term growth potential. | |
Average Annual Total Returns
| 1 Year | 5 Year | 10 Year | ||||
Select Growth Fund | 7.38% | (4.50)% | 6.51% | |||
Russell 1000 Growth Index | 5.27% | (3.58)% | 6.73% | |||
Lipper Large-Cap Growth Funds Average | 7.33% | (3.18)% | 7.24% | |||
Growth of a $10,000 Investment Since 1995
The Select Growth Fund is a portfolio of Allmerica Investment Trust.
The Russell 1000 Growth Index measures the performance of those Russell 1000 companies with higher price-to-book ratios and higher forecasted growth values. The Lipper Large-Cap Growth Funds Average is a non-weighted average of funds within the large-cap growth investment objective.
GE Asset Management Incorporated became a Co-Sub-Adviser of the fund effective April 30, 2004. Jennison Associates LLC became a Co-Sub-Adviser of the fund effective April 18, 2003. Performance prior to these dates is that of prior Sub-Advisers.
*Effective 1/9/06, the Select Growth Fund was reorganized into the Goldman Sachs Capital Growth Fund - Service Shares (the Fund). Goldman Sachs Asset Management, L.P. is the investment adviser to the Fund.
The performance data quoted represents past performance. Past performance does not guarantee future results. The investment return and principal value of an investment will fluctuate so that an investor’s shares, when redeemed, may be worth more or less than their original cost. Current performance may be lower or higher than the performance data quoted. For information on the current month end performance of variable annuity and variable life insurance products, please call: (800) 533-7881. The performance data quoted is net of all fund operating expenses, but does not include variable insurance or variable annuity charges. If the performance data included the effect of these additional charges, it would have been lower.
5
Table of Contents
The Core Equity Fund returned 6.03% for 2005, underperforming its benchmark, the Russell 1000 Index, which returned 6.27%.
In the Goldman Sachs Asset Management, L.P. portion of the fund, the Investment Sub-Adviser pared the number of holdings, reflecting confidence in the remaining companies. Wireless tower companies Crown Castle Corp. and American Tower Corp. contributed to returns, as the tower leasing environment improved significantly in the third and fourth quarters. Health Care business holdings Amgen, Inc., Caremark Rx, Inc. and Medco were top performers over the period. Fannie Mae and Freddie Mac underperformed this year, as potential legislation and accounting restatements weighed on the stocks. Avon Products detracted from performance, after it announced that its third quarter earnings would be below analysts’ expectations. The overweight in Media stocks also weighed on performance, as this was the worst performing sector of the market in 2005.
In the UBS Global Asset Management (Americas) Inc. portion of the fund, the Investment Sub-Adviser underweighted the Energy sector, believing that the price of crude oil and many other commodities was well in excess of equilibrium. Avoiding most Energy stocks detracted from performance during the period. Of the relatively limited holdings in this sector, Marathon Oil was one of the best performers over the year, as the company benefited from increased energy prices. The overweight position in construction and real properties benefited performance, with holding Martin Marietta Materials the top performer. Within Health Care, the Investment Sub-Adviser continued to find attractive opportunities, aiding returns. Avoiding significant exposure to Pfizer, which struggled this year, also helped performance. The portfolio’s grocery store holdings were positive contributors to results, as well.
The comments above are based on information provided by the Investment Sub-Advisers for the period indicated.
| Investment Sub-Advisers* | About the Fund* | |
Goldman Sachs Asset Management, L.P. UBS Global Asset Management (Americas) Inc. | Seeks long-term growth of capital by investing primarily in common stocks that are believed to represent significant underlying value in relation to current market prices. | |
Average Annual Total Returns
| 1 Year | 5 Year | 10 Year | ||||
Core Equity Fund | 6.03% | (1.00)% | 7.16% | |||
Russell 1000 Index | 6.27% | 1.07% | 9.28% | |||
Lipper Large-Cap Core Funds Average | 5.77% | (0.48)% | 7.27% | |||
Growth of a $10,000 Investment Since 1995
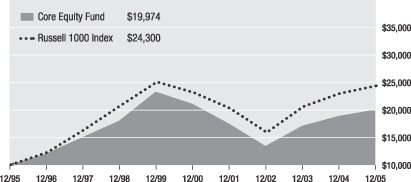
The Core Equity Fund is a portfolio of Allmerica Investment Trust.
The Russell 1000 Index measures the performance of the 1,000 largest companies in the Russell 3000 Index. The Lipper Large-Cap Core Funds Average is a non-weighted average of funds within the large-cap core investment objective.
Performance prior to May 1, 2002 is that of a prior Sub-Adviser.
*Effective 1/9/06, the Core Equity Fund was reorganized into the Goldman Sachs CORE SM U.S. Equity Fund - Service Shares (the Fund). Goldman Sachs Asset Management, L.P. is the investment adviser to the Fund.
The performance data quoted represents past performance. Past performance does not guarantee future results. The investment return and principal value of an investment will fluctuate so that an investor’s shares, when redeemed, may be worth more or less than their original cost. Current performance may be lower or higher than the performance data quoted. For information on the current month end performance of variable annuity and variable life insurance products, please call: (800) 533-7881. The performance data quoted is net of all fund operating expenses, but does not include variable insurance or variable annuity charges. If the performance data included the effect of these additional charges, it would have been lower.
6
Table of Contents
The Equity Index Fund returned 4.38% for 2005, underperforming its benchmark, the S&P 500® Index, which returned 4.89%.
The economy continued to stabilize in 2005 and equity returns reverted to what may be a more sustainable growth rate. The job market improved and household income increased. This resulted in strong consumer spending, which provided a boost to corporate earnings. A relatively accommodative federal funds rate and a booming housing market provided additional stimulus for the economy. Equity returns were held down for most
of the year by high oil prices, which threatened to dampen consumer spending, and the prospects of higher inflation. Although many feared that the hurricanes that hit the Gulf Coast would derail the expansion, the rescue and rebuilding efforts actually accelerated growth during the period. As the economy grew and inflation picked up, investors realized that the Federal Reserve Board (Fed) might have to continue its tightening regimen, in its efforts to curb inflation. The Fed raised the federal funds rate a full two percentage points during the period, to 4.25%.
The Energy and Health Care sectors were among the best performers in 2005. Energy companies saw increasing margins due to the energy shocks during the year. The Health Care sector saw improved earnings due to increased merger activity, which improved the market share of the biggest companies. The Automobile sector was among the worst performing sectors, as rising health care costs and a declining market share pummeled the stocks of the two largest domestic automobile manufacturers. This poor performance trickled down to the Automotive Supply sector, which saw double-digit negative returns for the year.
The comments above are based on information provided by the Investment Sub-Adviser for the period indicated.
| Investment Sub-Adviser* | About the Fund* | |
| Opus Investment Management, Inc. | Seeks to replicate the aggregate price and yield performance of the S&P 500® Index. | |
Average Annual Total Returns
| 1 Year | 5 Year | 10 Year | ||||
Equity Index Fund | 4.38% | 0.15% | 8.65% | |||
S&P 500® Index | 4.89% | 0.54% | 9.07% | |||
Lipper S&P 500 Index Objective Funds Average | 4.52% | 0.16% | 8.74% | |||
Growth of a $10,000 Investment Since 1995
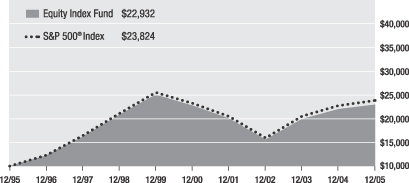
The Equity Index Fund is a portfolio of Allmerica Investment Trust.
The S&P 500® Index is an unmanaged index of 500 leading stocks. S&P 500® Index is a registered trademark of The McGraw-Hill Companies, Inc. The Lipper S&P 500 Index Objective Funds Average is a non-weighted average of funds within the S&P 500® Index investment objective.
*Effective 1/9/06, the Equity Index Fund was reorganized into the Goldman Sachs Equity Index Fund - Service Shares (the Fund). Goldman Sachs Asset Management, L.P. is the investment adviser to the Fund and SSgA Funds Management, Inc. is the investment sub-adviser to the Fund.
The performance data quoted represents past performance. Past performance does not guarantee future results. The investment return and principal value of an investment will fluctuate so that an investor’s shares, when redeemed, may be worth more or less than their original cost. Current performance may be lower or higher than the performance data quoted. For information on the current month end performance of variable annuity and variable life insurance products, please call: (800) 533-7881. The performance data quoted is net of all fund operating expenses, but does not include variable insurance or variable annuity charges. If the performance data included the effect of these additional charges, it would have been lower.
7
Table of Contents
Select Investment Grade Income Fund
The Select Investment Grade Income Fund returned 1.84% for 2005, underperforming its benchmark, the Lehman Brothers Aggregate Bond Index, which returned 2.43%.
The bond market turned in positive returns for the period, despite the Federal Reserve Board’s on-going tightening policy. As short-term interest rates rose, long-term interest rates remained relatively stable, resulting in a flattening of the yield curve. During the year, corporate profit gains were exceptional, but capital spending has been slow. Housing has been touted as a major factor driving consumer spending during this recovery, but prices have escalated dramatically and affordability has plunged, indicating that a slowdown in the Housing sector is possible.
During the period, the Investment Sub-Adviser reduced the portfolio’s overweight to the Credit sector to approximately 30%, with most of the reduction coming from BBB rated securities. During this re-allocation, several names were sold that were believed to have run their course or were becoming concerns in this leveraged buy-out environment. In addition, the Investment Sub-Adviser increased existing positions where conviction remained strong, while adding very few new credits. Some of the specific credits that were sold after reaching fair value included Telus Corp, Devon Energy, United Healthcare, Province of Quebec and Province of British Columbia. All had performed well since their original purchase. Specific credits sold because they may be at risk for shareholder friendly activity included British Sky Broadcasting and Tyco International Group. Exposure to Comcast and Time Warner was reduced for the same reason. Credits that the Investment Sub-Adviser believe have further upside potential based on fundamental analysis, include Safeway, Kroger, Sprint/Nextel and Morgan Stanley.
The comments above are based on information provided by the Investment Sub-Adviser for the period indicated.
| Investment Sub-Adviser* | About the Fund* | |
| Opus Investment Management, Inc. | Seeks as high a level of total return, which includes capital appreciation as well as income, as is consistent with prudent investment management. | |
Average Annual Total Returns
| 1 Year | 5 Year | 10 Year | ||||
Select Investment Grade Income Fund | 1.84% | 5.01% | 5.49% | |||
Lehman Brothers Aggregate Bond Index | 2.43% | 5.87% | 6.16% | |||
Lipper Intermediate Investment Grade Debt Funds Average | 1.99% | 5.60% | 5.62% | |||
Growth of a $10,000 Investment Since 1995
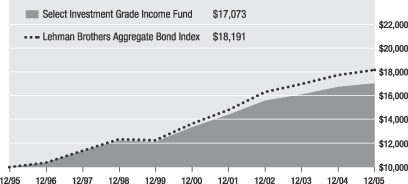
The Select Investment Grade Income Fund is a portfolio of Allmerica Investment Trust.
The Lehman Brothers Aggregate Bond Index is an unmanaged index of all fixed-rate debt issues with an investment grade or higher rating, at least one year to maturity and an outstanding par value of at least $25 million. The Lipper Intermediate Investment Grade Debt Funds Average is a non-weighted average of funds within the intermediate investment grade debt investment objective.
*Effective 1/9/06, the Select Investment Grade Income Fund was reorganized into the Goldman Sachs Core Fixed Income Fund - Service Shares (the Fund). Goldman Sachs Asset Management, L.P. is the investment adviser to the Fund.
The performance data quoted represents past performance. Past performance does not guarantee future results. The investment return and principal value of an investment will fluctuate so that an investor’s shares, when redeemed, may be worth more or less than their original cost. Current performance may be lower or higher than the performance data quoted. For information on the current month end performance of variable annuity and variable life insurance products, please call: (800) 533-7881. The performance data quoted is net of all fund operating expenses, but does not include variable insurance or variable annuity charges. If the performance data included the effect of these additional charges, it would have been lower.
8
Table of Contents
The Government Bond Fund returned 1.55% for 2005, underperforming its benchmark, the Lehman Brothers Intermediate Government Bond Index, which returned 1.70%.
The Lehman Brothers Aggregate Bond Index gained over 2% for the period, low in absolute terms, but remarkable given that this performance occurred during a bear market for bonds. With the federal funds rate now at 4.25%, after thirteen consecutive 25-basis point increases, the Investment Sub-Adviser believes that monetary policy is no longer deemed accommodative and may be nearing neutrality. The looming question now may be whether neutral monetary policy is enough. Should inflation measures show new vigor, the Federal Reserve Board may continue raising interest rates in order to restrain economic growth. Foreign buying has been a key driver of this bond market. If this were to slow or reverse course, the Investment Sub-Adviser believes it could have a major impact on the yield curve.
Within the fund, a consistent overweight to spread sectors, in particular, agencies and mortgage securities, helped performance for the year. The portfolio’s exposure to agency securities, which provided excess return relative to the Treasury sector, was twice that of the benchmark throughout the year. The Investment Sub-Adviser’s approximately 27% allocation to collateralized mortgage obligations proved to be a good decision, in light of the positive index returns. In the mortgage space, the Investment Sub-Adviser’s bias was toward higher coupon bonds offering less extension risk. Most recently, overall returns for the Mortgage-Backed Securities sector were driven by lower volatility, renewed buying from Freddie Mac, a flatter yield curve, higher fixed rate supply, lower overall supply and unattractive rolls.
The comments above are based on information provided by the Investment Sub-Adviser for the period indicated.
| Investment Sub-Adviser* | About the Fund* | |
| Opus Investment Management, Inc. | Seeks high income, preservation of capital and maintenance of liquidity, primarily through investments in debt instruments issued or guaranteed by the U.S. Government or its agencies or instrumentalities. | |
Average Annual Total Returns
| 1 Year | 5 Year | 10 Year | ||||
Government Bond Fund | 1.55% | 4.40% | 5.02% | |||
Lehman Brothers Intermediate Government Bond Index | 1.70% | 4.82% | 5.50% | |||
Lipper General U.S. Government Funds Average | 2.32% | 5.32% | 5.44% | |||
Growth of a $10,000 Investment Since 1995
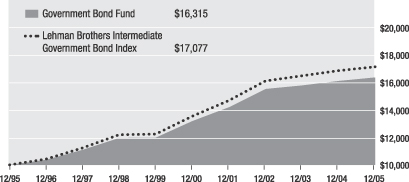
The Government Bond Fund is a portfolio of Allmerica Investment Trust.
The Fund is neither insured nor guaranteed by the U.S. Government.
The Lehman Brothers Intermediate Government Bond Index is an unmanaged index of U.S. Government and agency bonds with remaining maturities of one to ten years. The Lipper General U.S. Government Funds Average is a non-weighted average of funds within the general U.S. Government investment objective.
*Effective 1/9/06, the Government Bond Fund was reorganized into the Goldman Sachs Government Income Fund - Service Shares (the Fund). Goldman Sachs Asset Management, L.P. is the investment adviser to the Fund.
The performance data quoted represents past performance. Past performance does not guarantee future results. The investment return and principal value of an investment will fluctuate so that an investor’s shares, when redeemed, may be worth more or less than their original cost. Current performance may be lower or higher than the performance data quoted. For information on the current month end performance of variable annuity and variable life insurance products, please call: (800) 533-7881. The performance data quoted is net of all fund operating expenses, but does not include variable insurance or variable annuity charges. If the performance data included the effect of these additional charges, it would have been lower.
9
Table of Contents
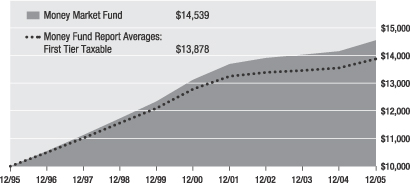
The Money Market Fund returned 2.75% for 2005, outperforming its benchmark, the Money Fund Report Averages: First Tier Taxable, which returned 2.46%.
During the year, the fund maintained a short weighted average maturity in the range of 20 to 40 days. This position enabled the Investment Sub-Adviser to take advantage of rapidly increasing short-term interest rates, as the Federal Reserve Board moved the federal funds rate from 2.25% at the start of the year, to 4.25% by the end of the year. The fund’s performance was aided by its holdings of primarily short-dated, high quality, commercial paper and certificates of deposit. Floating-rate notes and extendible commercial paper were also utilized for their built in reset functions, designed to keep pace with the Federal Reserve Board rate hikes, while adding incremental spread.
The U.S. economy endured several major tests in 2005, each time displaying amazing resilience. The bond market’s reaction to the Federal Reserve Board’s on-going tightening policy has been remarkably tame. Long-term interest rates have remained extraordinarily stable, with the ten year Treasury only 18 basis points higher, and the thirty year Treasury actually 27 basis points lower, than a year ago, resulting in a relatively flat yield curve. Foreign buying has been a key driver of this bond market phenomenon. If this were to slow or reverse course, it could have a major impact on the yield curve. Inflation is another threat, since energy and other commodities show no signs of significant price reversals and gold sits at a 25-year high. With the unemployment rate at 5%, unit labor costs could escalate, especially if productivity gains dissipate and benefit costs continue their upward trend.
The comments above are based on information provided by the Investment Sub-Adviser for the period indicated.
| Investment Sub-Adviser* | About the Fund* | |
| Opus Investment Management, Inc. | Seeks to obtain maximum current income consistent with preservation of capital and liquidity. | |
Average Annual Total Returns
| 1 Year | 5 Year | 10 Year | ||||
Money Market Fund | 2.75% | 2.07% | 3.81% | |||
Money Fund Report Averages: First Tier Taxable | 2.46% | 1.65% | 3.33% | |||
Lipper Money Market Funds Average | 2.69% | 1.85% | 3.55% | |||
Average Yield as of December 31, 2005
Money Market Fund 7-Day Yield | 3.63% | |
Growth of a $10,000 Investment Since 1995
The Money Market Fund is a portfolio of Allmerica Investment Trust.
The Fund is neither insured nor guaranteed by the Federal Deposit Insurance Corporation or any other government agency. Although the Fund seeks to maintain a net asset value of $1.00 per share, it is possible to lose money by investing in the Fund.
Money Fund Report Averages: First Tier Taxable is published by iMoneyNet, Inc., an independent firm that tracks 2a-7 regulated money market funds on a yield, shareholder, asset size and portfolio allocation basis. The Lipper Money Market Funds Average is a non-weighted average of funds within the money market investment objective.
*Effective 1/9/06, the Money Market Fund was reorganized into the Goldman Sachs Money Market Fund - Service Shares (the Fund). Goldman Sachs Asset Management, L.P. is the investment adviser to the Fund.
The performance data quoted represents past performance. Past performance does not guarantee future results. The investment return and principal value of an investment will fluctuate so that an investor’s shares, when redeemed, may be worth more or less than their original cost. Current performance may be lower or higher than the performance data quoted. For information on the current month end performance of variable annuity and variable life insurance products, please call: (800) 533-7881. The performance data quoted is net of all fund operating expenses, but does not include variable insurance or variable annuity charges. If the performance data included the effect of these additional charges, it would have been lower.
10
Table of Contents
ALLMERICA INVESTMENT TRUST
EXPENSE EXAMPLES 12/31/05 (Unaudited)
You do not own shares of any Fund of the Allmerica Investment Trust directly. As a contract/policy owner investing in a Fund, you incur ongoing expenses, such as management fees, distribution and service (12b-1) fees, and other fund expenses. The following table is intended to help you understand your ongoing expenses (in dollars and cents) of investing in a Fund and to compare these expenses with the ongoing expenses of investing in other funds.
The examples are based on an investment of $1,000 invested at the beginning of the period and held for the entire period from July 1, 2005 to December 31, 2005.
Actual Expenses
The first line under each Fund in the table below provides information about the actual account values and actual expenses. You may use the information in this line, together with the amount you invested, to estimate the expenses that you paid over the period. Simply divide your account value by $1,000 (for example, an $8,600 account value divided by $1,000 = 8.6), then multiply the result by the number in the first line for your Fund under the heading entitled “Expenses Paid During Period” to estimate the expenses you paid on your account during this period.
Hypothetical Example for Comparison Purposes
The second line under each Fund in the table below provides information about the hypothetical account values and hypothetical expenses based on each Fund’s actual expense ratio and an assumed rate of return of 5% per year before expenses, which are not the Fund’s actual returns. The hypothetical account values and expenses may not be used to estimate the actual ending account balances or expenses you paid for the period. You may use this information to compare the ongoing expenses of investing in your Fund and other funds. To do so, compare 5% hypothetical example with the 5% hypothetical examples that appear in the shareholder reports of the other funds.
Please note that the expenses shown in the table are meant to highlight your ongoing expenses only and do not reflect any costs or expenses that apply to the subaccount or the contact. Therefore, the second line of the table is useful in comparing ongoing expenses of each Fund only, and will not help you determine the relative total costs of owning different funds underlying various annuity contracts and/or life insurance policies. In addition, if the costs or expenses that apply to the subaccount or the contract were included, your costs would have been higher.
Allmerica Funds | Beginning Account Value 07/01/05 | Ending Account Value 12/31/05 | Annualized Expense Ratio | Expenses Paid During Period* (July 1 to December 31, 2005) | ||||||||
Select Capital Appreciation Fund | ||||||||||||
Actual | $ | 1,000 | $ | 1,128.50 | 1.15 | % | $ | 6.17 | ||||
Hypothetical | 1,000 | 1,031.00 | 1.15 | % | 5.89 | |||||||
Select Value Opportunity Fund | ||||||||||||
Actual | $ | 1,000 | $ | 1,073.70 | 1.11 | % | $ | 5.80 | ||||
Hypothetical | 1,000 | 1,030.80 | 1.11 | % | 5.68 | |||||||
Select International Equity Fund | ||||||||||||
Actual | $ | 1,000 | $ | 1,129.50 | 1.25 | % | $ | 6.71 | ||||
Hypothetical | 1,000 | 1,031.51 | 1.25 | % | 6.40 | |||||||
Select Growth Fund | ||||||||||||
Actual | $ | 1,000 | $ | 1,089.30 | 1.01 | % | $ | 5.32 | ||||
Hypothetical | 1,000 | 1,030.30 | 1.01 | % | 5.17 | |||||||
Core Equity Fund | ||||||||||||
Actual | $ | 1,000 | $ | 1,067.50 | 0.82 | % | $ | 4.27 | ||||
Hypothetical | 1,000 | 1,029.34 | 0.82 | % | 4.19 | |||||||
Equity Index Fund | ||||||||||||
Actual | $ | 1,000 | $ | 1,055.10 | 0.53 | % | $ | 2.75 | ||||
Hypothetical | 1,000 | 1,027.88 | 0.53 | % | 2.71 | |||||||
Select Investment Grade Income Fund | ||||||||||||
Actual | $ | 1,000 | $ | 998.30 | 0.64 | % | $ | 3.22 | ||||
Hypothetical | 1,000 | 1,028.43 | 0.64 | % | 3.27 | |||||||
Government Bond Fund | ||||||||||||
Actual | $ | 1,000 | $ | 998.00 | 0.74 | % | $ | 3.73 | ||||
Hypothetical | 1,000 | 1,028.94 | 0.74 | % | 3.78 | |||||||
Money Market Fund | ||||||||||||
Actual | $ | 1,000 | $ | 1,016.50 | 0.55 | % | $ | 2.80 | ||||
Hypothetical | 1,000 | 1,027.98 | 0.55 | % | 2.81 | |||||||
| * | Expenses are calculated using the Fund’s annualized expense ratio (as disclosed in the table), multiplied by the average account value for the period, multiplied by the number of days in the period (184 days), and divided by the number of days in the year (365 days). |
F-1
Table of Contents
SELECT CAPITAL APPRECIATION FUND
PORTFOLIO OF INVESTMENTS • December 31, 2005
Shares | Value (Note 2) | ||||
COMMON STOCKS - 98.5% | |||||
| Advertising - 1.7% | |||||
| 43,000 | Catalina Marketing Corp. | $ | 1,090,050 | ||
| 26,500 | Clear Channel Outdoor Holdings, Inc. Class A* | 531,325 | |||
| 67,000 | Lamar Advertising Co.* | 3,091,380 | |||
| 4,712,755 | |||||
| Aerospace & Defense - 2.8% | |||||
| 28,000 | Alliant Techsystems, Inc.* | 2,132,760 | |||
| 58,000 | Goodrich Corp. | 2,383,800 | |||
| 69,000 | Rockwell Collins, Inc. | 3,206,430 | |||
| 7,722,990 | |||||
| Airlines - 1.7% | |||||
| 105,000 | JetBlue Airways Corp.* | 1,614,900 | |||
| 178,000 | Southwest Airlines, Inc. | 2,924,540 | |||
| 4,539,440 | |||||
| Auto Manufacturers - 0.8% | |||||
| 52,000 | Oshkosh Truck Corp. | 2,318,680 | |||
| Auto Parts & Equipment - 0.5% | |||||
| 49,000 | TRW Automotive Holdings Corp.* | 1,291,150 | |||
| Banks - 0.3% | |||||
| 8,000 | Investors Financial Services Corp. | 294,640 | |||
| 11,000 | SVB Financial Group* | 515,240 | |||
| 809,880 | |||||
| Beverages - 0.4% | |||||
| 72,000 | Cott Corp.* | 1,058,400 | |||
| Biotechnology - 3.0% | |||||
| 21,000 | Celgene Corp.* | 1,360,800 | |||
| 36,000 | Human Genome Sciences, Inc.* | 308,160 | |||
| 121,000 | Medimmune, Inc.* | 4,237,420 | |||
| 35,000 | Protein Design Labs, Inc.* | 994,700 | |||
| 49,000 | Vertex Pharmaceuticals, Inc.* | 1,355,830 | |||
| 8,256,910 | |||||
| Building Materials - 0.6% | |||||
| 43,000 | American Standard Companies, Inc. | 1,717,850 | |||
| Commercial Services - 7.7% | |||||
| 31,000 | Apollo Group, Inc.* | 1,874,260 | |||
| 53,000 | Certegy, Inc. | 2,149,680 | |||
| 62,000 | ChoicePoint, Inc.* | 2,759,620 | |||
| 42,000 | Education Management* | 1,407,420 | |||
| 9,000 | Getty Images, Inc.* | 803,430 | |||
| 40,000 | Global Payments, Inc. | 1,864,400 | |||
| 67,000 | Iron Mountain, Inc.* | 2,828,740 | |||
| 8,000 | Laureate Education, Inc.* | 420,080 | |||
| 53,000 | Manpower, Inc. | 2,464,500 | |||
| 76,000 | MoneyGram International, Inc. | 1,982,080 | |||
| 36,000 | Robert Half International, Inc. | 1,364,040 | |||
| 20,500 | United Rentals, Inc.* | 479,495 | |||
| 22,000 | Viad Corp. | 645,260 | |||
| 21,043,005 | |||||
| Computers - 2.6% | |||||
| 32,000 | CACI International, Inc., Class A* | 1,836,160 | |||
| 129,000 | Cadence Design Systems, Inc.* | 2,182,680 | |||
| 51,000 | DST Systems, Inc.* | 3,055,410 | |||
| 7,074,250 | |||||
| Diversified Financial Services - 5.5% | |||||
| 149,000 | Ameritrade Holding Corp.* | 3,576,000 | |||
| 48,200 | CapitalSource, Inc.* | 1,079,680 | |||
| 106,000 | E*TRADE Financial Corp.* | 2,211,160 | |||
| 72,000 | Eaton Vance Corp. | 1,969,920 | |||
| 59,000 | Janus Capital Group, Inc. | 1,099,170 | |||
| 21,000 | Legg Mason, Inc. | 2,513,490 | |||
| 36,000 | Nuveen Investments, Inc., Class A | 1,534,320 | |||
| 45,000 | Waddell & Reed Financial, Class A | 943,650 | |||
| 14,927,390 | |||||
| Electrical Components & Equipment - 0.8% | |||||
| 54,600 | AMETEK, Inc. | 2,322,684 | |||
| Electronics - 4.4% | |||||
| 36,000 | Cogent, Inc.* | 816,480 | |||
| 157,000 | Flextronics International, Ltd.* | 1,639,080 | |||
| 59,000 | Flir Systems, Inc.* | 1,317,470 | |||
| 32,000 | Garmin, Ltd. | 2,123,200 | |||
| 117,000 | Gentex Corp. | 2,281,500 | |||
| 71,000 | Jabil Circuit, Inc.* | 2,633,390 | |||
| 31,000 | Waters Corp.* | 1,171,800 | |||
| 11,982,920 | |||||
| Entertainment - 0.5% | |||||
| 35,000 | Dreamworks Animation SKG, Inc., Class A* | 859,600 | |||
| 13,900 | International Game Technology | 427,842 | |||
| 1,287,442 | |||||
| Food - 0.5% | |||||
| 18,000 | Whole Foods Market, Inc. | 1,393,020 | |||
| Health Care-Products - 2.5% | |||||
| 36,000 | Edwards Lifesciences Corp.* | 1,497,960 | |||
| 22,000 | Gen-Probe, Inc.* | 1,073,380 | |||
| 10,000 | INAMED Corp.* | 876,800 | |||
| 31,000 | Kinetic Concepts, Inc.* | 1,232,560 | |||
| 43,000 | Patterson Cos., Inc.* | 1,436,200 | |||
| 16,000 | Varian Medical Systems, Inc.* | 805,440 | |||
| 6,922,340 | |||||
See Notes to Financial Statements.
F-2
Table of Contents
SELECT CAPITAL APPRECIATION FUND
PORTFOLIO OF INVESTMENTS, Continued • December 31, 2005
Shares | Value (Note 2) | ||||
| Health Care - Services - 4.9% | |||||
| 43,000 | Community Health Systems, Inc.* | $ | 1,648,620 | ||
| 18,000 | Coventry Health Care, Inc.* | 1,025,280 | |||
| 18,000 | Davita, Inc.* | 911,520 | |||
| 54,000 | Health Management Associates, Inc., Class A | 1,185,840 | |||
| 26,900 | Humana, Inc.* | 1,461,477 | |||
| 48,000 | Laboratory Corp. of America Holdings* | 2,584,800 | |||
| 71,000 | Manor Care, Inc. | 2,823,670 | |||
| 46,000 | Triad Hospitals, Inc.* | 1,804,580 | |||
| 13,445,787 | |||||
| Home Furnishings - 0.7% | |||||
| 20,000 | Harman International Industries, Inc. | 1,957,000 | |||
| Insurance - 2.8% | |||||
| 71,000 | Assurant, Inc. | 3,087,790 | |||
| 61,000 | Axis Capital Holdings, Ltd. | 1,908,080 | |||
| 22,000 | Principal Financial Group, Inc. | 1,043,460 | |||
| 41,000 | Willis Group Holdings, Ltd. | 1,514,540 | |||
| 7,553,870 | |||||
| Internet - 3.8% | |||||
| 41,000 | Amazon.com, Inc.* | 1,933,150 | |||
| 38,000 | CheckFree Corp.* | 1,744,200 | |||
| 107,000 | CNET Networks, Inc.* | 1,571,830 | |||
| 58,000 | Monster Worldwide, Inc.* | 2,367,560 | |||
| 124,000 | VeriSign, Inc.* | 2,718,080 | |||
| 10,334,820 | |||||
| Leisure Time - 0.8% | |||||
| 57,000 | Brunswick Corp. | 2,317,620 | |||
| Lodging - 2.0% | |||||
| 81,000 | Fairmont Hotels & Resorts, Inc. | 3,435,210 | |||
| 35,000 | Wynn Resorts, Ltd.* | 1,919,750 | |||
| 5,354,960 | |||||
| Manufacturing - Miscellaneous - 3.9% | |||||
| 31,000 | Danaher Corp. | 1,729,180 | |||
| 18,000 | ITT Industries, Inc. | 1,850,760 | |||
| 39,000 | Pentair, Inc. | 1,346,280 | |||
| 96,000 | Roper Industries, Inc. | 3,792,960 | |||
| 32,000 | Teleflex, Inc. | 2,079,360 | |||
| 10,798,540 | |||||
| Media - 3.4% | |||||
| 114,000 | Citadel Broadcasting Corp. | 1,532,160 | |||
| 4,000 | Cox Radio, Inc.* | 56,320 | |||
| 99,300 | Discovery Holding Co., Class A* | 1,504,395 | |||
| 41,000 | Dolby Laboratories, Inc.* | 699,050 | |||
| 80,000 | Rogers Communications, Inc., Class B | 3,380,800 | |||
| 61,000 | Univision Communications, Inc.* | 1,792,790 | |||
| 13,000 | XM Satellite Radio Holdings, Inc.* | 354,640 | |||
| 9,320,155 | |||||
| Mining - 0.7% | |||||
| 35,000 | Newmont Mining Corp. | 1,869,000 | |||
| Oil & Gas - 4.5% | |||||
| 52,000 | EOG Resources, Inc. | 3,815,240 | |||
| 60,000 | Murphy Oil Corp. | 3,239,400 | |||
| 43,000 | Western Gas Resources, Inc. | 2,024,870 | |||
| 76,000 | XTO Energy, Inc. | 3,339,440 | |||
| 12,418,950 | |||||
| Oil & Gas Services - 3.5% | |||||
| 115,000 | BJ Services Co. | 4,217,050 | |||
| 51,000 | FMC Technologies, Inc.* | 2,188,920 | |||
| 82,000 | Smith International, Inc. | 3,043,020 | |||
| 9,448,990 | |||||
| Pharmaceuticals - 7.5% | |||||
| 41,000 | Abgenix, Inc.* | 881,910 | |||
| 62,000 | Alkermes, Inc.* | 1,185,440 | |||
| 34,000 | Amylin Pharmaceuticals, Inc.* | 1,357,280 | |||
| 28,000 | Andrx Corp.* | 461,160 | |||
| 44,000 | Barr Pharmaceuticals* | 2,740,760 | |||
| 48,000 | Cephalon, Inc.* | 3,107,520 | |||
| 132,000 | Elan Corp., Plc, Sponsored ADR* | 1,838,760 | |||
| 48,000 | Gilead Sciences, Inc.* | 2,526,240 | |||
| 24,000 | Neurocrine Biosciences, Inc.* | 1,505,520 | |||
| 35,000 | Omnicare, Inc. | 2,002,700 | |||
| 25,000 | OSI Pharmaceuticals, Inc.* | 701,000 | |||
| 24,000 | Sepracor, Inc.* | 1,238,400 | |||
| 54,000 | Valeant Pharmaceuticals International | 976,320 | |||
| 20,523,010 | |||||
| Retail - 7.0% | |||||
| 49,000 | Best Buy Co., Inc. | 2,130,520 | |||
| 39,000 | CarMax, Inc.* | 1,079,520 | |||
| 32,000 | CDW Corp. | 1,842,240 | |||
| 89,000 | Dollar General Corp. | 1,697,230 | |||
| 45,000 | Family Dollar Stores, Inc. | 1,115,550 | |||
| 10,000 | MSC Industrial Direct Co., Class A | 402,200 | |||
| 56,000 | O’Reilly Automotive, Inc.* | 1,792,560 | |||
| 20,000 | P.F. Chang’s China Bistro, Inc.* | 992,600 | |||
| 86,000 | PETsMART, Inc. | 2,206,760 | |||
| 54,000 | Ross Stores, Inc. | 1,560,600 | |||
| 1,000 | Shoppers Drug Mart Corp. | 37,752 | |||
| 27,000 | Shoppers Drug Mart Corp., Unregistered* | 1,019,323 | |||
| 48,000 | The Cheesecake Factory, Inc.* | 1,794,720 | |||
| 36,000 | Williams-Sonoma, Inc.* | 1,553,400 | |||
| 19,224,975 | |||||
| Semiconductors - 6.5% | |||||
| 112,000 | Altera Corp.* | 2,075,360 | |||
| 33,000 | Amis Holdings, Inc.* | 351,450 | |||
| 94,000 | Intersil Corp., Class A | 2,338,720 | |||
| 74,000 | Linear Technology Corp. | 2,669,180 | |||
| 72,000 | Microchip Technology, Inc. | 2,314,800 | |||
| 52,000 | National Semiconductor Corp. | 1,350,960 | |||
See Notes to Financial Statements
F-3
Table of Contents
SELECT CAPITAL APPRECIATION FUND
PORTFOLIO OF INVESTMENTS, Continued • December 31, 2005
| Shares | Value (Note 2) | ||||
Semiconductors (continued) | |||||
| 72,000 | Novellus Systems, Inc.* | $ | 1,736,640 | ||
| 77,000 | PMC-Sierra, Inc.* | 593,670 | |||
| 42,000 | Semtech Corp.* | 766,920 | |||
| 63,000 | Spansion LLC Class A* | 876,960 | |||
| 107,000 | Xilinx, Inc. | 2,697,470 | |||
| 17,772,130 | |||||
Software - 3.9% | |||||
| 80,666 | Activision, Inc.* | 1,108,351 | |||
| 51,000 | Adobe Systems, Inc. | 1,884,960 | |||
| 12,600 | Avid Technology, Inc.* | 689,976 | |||
| 60,000 | Jack Henry & Associates, Inc. | 1,144,800 | |||
| 52,000 | McAfee, Inc.* | 1,410,760 | |||
| 51,000 | NAVTEQ Corp.* | 2,237,370 | |||
| 76,000 | Red Hat, Inc.* | 2,070,240 | |||
| 10,546,457 | |||||
Telecommunications - 6.1% | |||||
| 37,000 | Adtran, Inc. | 1,100,380 | |||
| 48,000 | Amdocs, Ltd.* | 1,320,000 | |||
| 70,000 | American Tower Corp., Class A* | 1,897,000 | |||
| 36,000 | Comverse Technology, Inc.* | 957,240 | |||
| 111,000 | Crown Castle International Corp.* | 2,987,010 | |||
| 64,000 | Harris Corp., Inc. | 2,752,640 | |||
| 50,000 | Juniper Networks, Inc.* | 1,115,000 | |||
| 101,000 | Nextel Partners, Inc., Class A* | 2,821,940 | |||
| 46,000 | Telus Corp. | 1,889,832 | |||
| 16,841,042 | |||||
Transportation - 0.2% | |||||
| 8,000 | Expeditors International of Washington, Inc. | 540,080 | |||
Total Common Stocks (Cost $188,551,519) | 269,648,492 | ||||
| Total Investments - 98.5% (Cost $188,551,519) | 269,648,492 | ||||
| Net Other Assets and Liabilities - 1.5% | 4,174,537 | ||||
| Total Net Assets - 100.0% | $ | 273,823,029 | |||
| * | Non-income producing security. |
| ADR | American Depositary Receipt. Shares of a foreign based corporation held in U.S. banks entitling the shareholder to all dividends and capital gains. |
Industry/Sector Concentration of Investments
as a Percentage of Net Assets*:
Basic Materials | 0.7 | % | |
Communications | 15.0 | ||
Consumer Cyclical | 14.0 | ||
Consumer Non-Cyclical | 26.5 | ||
Energy | 8.0 | ||
Financial | 8.6 | ||
Industrial | 12.7 | ||
Technology | 13.0 | ||
Net Other Assets and Liabilities | 1.5 | ||
Total | 100.0 | % | |
| * | Not part of the financial statements; therefore not covered by the Report of Independent Registered Public Accounting Firm. |
See Notes to Financial Statements.
F-4
Table of Contents
SELECT VALUE OPPORTUNITY FUND
PORTFOLIO OF INVESTMENTS • December 31, 2005
| Shares | Value (Note 2) | ||||
| COMMON STOCKS - 90.6% | |||||
| Aerospace & Defense - 6.5% | |||||
| 158,100 | Esterline Technologies Corp.* | $ | 5,879,739 | ||
| 167,800 | Goodrich Corp. | 6,896,580 | |||
| 218,325 | Moog, Inc., Class A* | 6,196,063 | |||
| 18,972,382 | |||||
Banks - 3.3% | |||||
| 125,000 | Huntington Bancshares, Inc. | 2,968,750 | |||
| 209,825 | North Fork Bancorp., Inc. | 5,740,812 | |||
| 15,600 | Webster Financial Corp. | 731,640 | |||
| 9,441,202 | |||||
Biotechnology - 3.0% | |||||
| 231,400 | Cambrex Corp. | 4,343,378 | |||
| 66,300 | Millipore Corp.* | 4,378,452 | |||
| 8,721,830 | |||||
Building Materials - 2.3% | |||||
| 96,100 | Carlisle Cos., Inc. | 6,645,315 | |||
Chemicals - 6.8% | |||||
| 199,200 | Airgas, Inc. | 6,553,680 | |||
| 115,400 | Cytec Industries, Inc. | 5,496,502 | |||
| 56,100 | FMC Corp.* | 2,982,837 | |||
| 241,800 | Rockwood Holdings, Inc.* | 4,770,714 | |||
| 19,803,733 | |||||
Commercial Services - 3.5% | |||||
| 175,900 | ACCO Brands Corp.* | 4,309,550 | |||
| 127,710 | Manpower, Inc. | 5,938,515 | |||
| 10,248,065 | |||||
Computers - 2.2% | |||||
| 186,000 | NCR Corp.* | 6,312,840 | |||
Cosmetics & Personal Care - 0.3% | |||||
| 26,100 | Chattem, Inc.* | 949,779 | |||
Distribution & Wholesale - 1.9% | |||||
| 153,900 | Hughes Supply, Inc. | 5,517,315 | |||
Diversified Financial Services - 2.6% | |||||
| 224,400 | E*TRADE Financial Corp.* | 4,680,984 | |||
| 68,700 | Nuveen Investments, Inc., Class A | 2,927,994 | |||
| 7,608,978 | |||||
Electric - 1.1% | |||||
| 1,300 | Northeast Utilities | 25,597 | |||
| 64,800 | NRG Energy, Inc.* | 3,053,376 | |||
| 3,078,973 | |||||
Electronics - 5.7% | |||||
| 140,900 | Amphenol Corp., Class A | 6,236,234 | |||
| 270,500 | Integrated Device Technology, Inc.* | 3,565,190 | |||
| 293,000 | PerkinElmer, Inc. | 6,903,080 | |||
| 16,704,504 | |||||
Engineering & Construction - 1.3% | |||||
| 102,400 | URS Corp.* | 3,851,264 | |||
Entertainment - 1.4% | |||||
| 208,400 | Regal Entertainment Group, Class A | 3,963,768 | |||
Food - 2.5% | |||||
| 102,000 | McCormick & Co., Inc. | 3,153,840 | |||
| 105,600 | Ralcorp Holdings, Inc.* | 4,214,496 | |||
| 7,368,336 | |||||
Health Care - Products - 2.3% | |||||
| 101,300 | C.R. Bard, Inc. | 6,677,696 | |||
Health Care - Services - 1.5% | |||||
| 176,700 | Apria Healthcare Group, Inc.* | 4,260,237 | |||
Insurance - 6.3% | |||||
| 66,000 | AMBAC Financial Group, Inc. | 5,085,960 | |||
| 120,400 | Assurant, Inc. | 5,236,196 | |||
| 46,200 | MBIA, Inc. | 2,779,392 | |||
| 117,400 | Protective Life Corp. | 5,138,598 | |||
| 18,240,146 | |||||
Leisure Time - 2.2% | |||||
| 140,400 | Royal Caribbean Cruises, Ltd. | 6,326,424 | |||
Manufacturing - Miscellaneous - 1.8% | |||||
| 232,500 | Leggett & Platt, Inc. | 5,338,200 | |||
Metal Fabricate & Hardware - 3.5% | |||||
| 139,100 | Kaydon Corp. | 4,470,674 | |||
| 135,200 | NCI Building Systems, Inc.* | 5,743,296 | |||
| 10,213,970 | |||||
Oil & Gas - 3.6% | |||||
| 160,500 | Pride International, Inc.* | 4,935,375 | |||
| 238,065 | Southern Union Co.* | 5,625,476 | |||
| 10,560,851 | |||||
Pipelines - 3.2% | |||||
| 121,100 | Questar Corp. | 9,167,270 | |||
Real Estate - 3.1% | |||||
| 90,300 | Brookfield Asset Management, Inc. Class A | 4,544,799 | |||
| 68,500 | The St. Joe Co. | 4,604,570 | |||
| 9,149,369 | |||||
See Notes to Financial Statements.
F-5
Table of Contents
SELECT VALUE OPPORTUNITY FUND
PORTFOLIO OF INVESTMENTS, Continued • December 31, 2005
| Shares | Value (Note 2) | ||||
| Retail - 9.3% | |||||
| 178,800 | AnnTaylor Stores Corp.* | $ | 6,172,176 | ||
| 162,700 | Claire’s Stores, Inc. | 4,754,094 | |||
| 187,800 | Dollar Tree Stores, Inc.* | 4,495,932 | |||
| 244,800 | Ruby Tuesday, Inc. | 6,337,872 | |||
| 87,600 | Tuesday Morning Corp. | 1,832,592 | |||
| 87,600 | United Auto Group, Inc. | 3,346,320 | |||
| 26,938,986 | |||||
Semiconductors - 1.6% | |||||
| 382,100 | Brooks Automation, Inc.* | 4,787,713 | |||
Software - 2.2% | |||||
| 115,100 | Avid Technology, Inc.* | 6,302,876 | |||
Telecommunications - 3.2% | |||||
| 107,500 | Amdocs, Ltd.* | 2,956,250 | |||
| 380,100 | Avaya, Inc.* | 4,055,667 | |||
| 289,500 | CGI Group, Inc., Class A* | 2,333,370 | |||
| 9,345,287 | |||||
Transportation - 2.4% | |||||
| 137,700 | CSX Corp. | 6,991,029 | |||
Total Common Stocks (Cost $226,311,243) | 263,488,338 | ||||
| Total Investments - 90.6% (Cost $226,311,243) | 263,488,338 | ||||
| Net Other Assets and Liabilities - 9.4% | 27,209,822 | ||||
| Total Net Assets - 100.0% | $ | 290,698,160 | |||
| * | Non-income producing security. |
Industry/Sector Concentration of Investments
as a Percentage of Net Assets*:
Basic Materials | 6.8 | % | |
Communications | 3.2 | ||
Consumer Cyclical | 14.8 | ||
Consumer Non-Cyclical | 13.1 | ||
Energy | 6.8 | ||
Financial | 15.3 | ||
Industrial | 23.5 | ||
Technology | 6.0 | ||
Utilities | 1.1 | ||
Net Other Assets and Liabilities | 9.4 | ||
Total | 100.0 | % | |
| * | Not part of the financial statements; therefore not covered by the Report of Independent Registered Public Accounting Firm. |
See Notes to Financial Statements.
F-6
Table of Contents
SELECT INTERNATIONAL EQUITY FUND
PORTFOLIO OF INVESTMENTS • December 31, 2005
| Shares | Value (Note 2) | ||||
| COMMON STOCKS - 94.9% | |||||
Australia - 1.8% | |||||
| 15,745 | Australia & New Zealand Banking Group, Ltd. | $ | 276,692 | ||
| 101,200 | BHP Billiton, Ltd. | 1,689,313 | |||
| 15,029 | Commonwealth Bank of Australia | 471,427 | |||
| 7,395 | Macquarie Bank, Ltd. | 369,787 | |||
| 3,727 | Metcash, Ltd. | 12,306 | |||
| 23,912 | National Australia Bank, Ltd. | 568,472 | |||
| 3,360 | RHI AG* | 90,658 | |||
| 3,324 | Rio Tinto, Ltd. | 168,290 | |||
| 36,000 | Santos, Ltd. | 323,584 | |||
| 29,435 | Stockland | 140,387 | |||
| 6,527 | Suncorp-Metway, Ltd. | 96,023 | |||
| 205,400 | Telstra Corp. | 592,299 | |||
| 21,567 | Woolworths, Ltd. | 266,648 | |||
| 5,065,886 | |||||
Austria - 0.8% | |||||
| 2,898 | Boehler-Uddeholm | 490,075 | |||
| 4,182 | Flughafen Wien AG | 299,364 | |||
| 16,896 | OMV AG | 989,739 | |||
| 3,870 | Voestalpine AG | 389,966 | |||
| 2,169,144 | |||||
Brazil - 0.6% | |||||
| 43,000 | Cia Vale do Rio Doce, ADR | 1,769,020 | |||
Finland - 2.2% | |||||
| 100 | Finnair Oyj | 1,418 | |||
| 31,900 | Fortum Oyj | 597,967 | |||
| 10,300 | Kesko Oyj, Class B | 291,927 | |||
| 5,700 | Metso Oyj | 155,953 | |||
| 3,050 | Neste Oil Oyj* | 86,192 | |||
| 220,893 | Nokia Oyj | 4,038,704 | |||
| 15,300 | Rautaruukki Oyj | 372,079 | |||
| 28,900 | Sampo Oyj, Class A | 503,428 | |||
| 1,800 | Wartsila Oyj, Class A | 52,912 | |||
| 3,300 | Wartsila Oyj, Class B | 97,630 | |||
| 3,800 | YIT-Yhtyma Oyj | 162,474 | |||
| 6,360,684 | |||||
France - 8.4% | |||||
| 1,238 | Assurances Generales de France | 122,625 | |||
| 74,052 | AXA | 2,388,879 | |||
| 47,220 | BNP Paribas | 3,819,408 | |||
| 1,589 | Bongrain SA | 93,081 | |||
| 1,048 | Christian Dior SA | 93,139 | |||
| 51,706 | Cie de Saint-Gobain | 3,074,741 | |||
| 35 | Fromageries Bel Vache qui Rit | 5,799 | |||
| 16,600 | Imerys SA | 1,200,275 | |||
| 18,400 | Lafarge SA | 1,654,867 | |||
| 6,923 | Michelin, Class B | 388,988 | |||
| 14,871 | PSA Peugeot Citroen | 857,039 | |||
| 2,307 | Renault SA | 188,104 | |||
| 12,279 | Sanofi-Aventis | 1,075,292 | |||
| 1,992 | Schneider Electric SA | 177,625 | |||
| 8,552 | Societe Generale | 1,051,513 | |||
| 31,631 | Total SA, Class B | 7,943,097 | |||
| 3,128 | Veolia Environnement | 141,552 | |||
| 24,276,024 | |||||
Germany - 6.4% | |||||
| 1,466 | Adidas-Salomon AG | 277,578 | |||
| 3,993 | Allianz AG | 604,557 | |||
| 10,475 | Altana AG | 570,221 | |||
| 14,550 | BASF AG | 1,114,207 | |||
| 1,850 | Bayer AG | 77,260 | |||
| 53,572 | Bayerische Motoren Werke (BMW) AG | 2,348,863 | |||
| 6,153 | Commerzbank AG | 189,464 | |||
| 12,753 | DaimlerChrysler AG | 651,065 | |||
| 7,680 | Deutsche Bank AG | 744,349 | |||
| 58,500 | Deutsche Post AG | 1,417,808 | |||
| 19,419 | E.ON AG | 2,008,261 | |||
| 3,709 | Man AG | 197,866 | |||
| 4,598 | Merck KGaA | 380,617 | |||
| 2,619 | Muenchener Rueckversicherungs AG | 354,501 | |||
| 5,033 | RWE AG | 372,551 | |||
| 3,565 | Salzgitter AG | 192,420 | |||
| 7,100 | SAP AG | 1,286,872 | |||
| 30,387 | Schering AG | 2,035,335 | |||
| 892 | Schwarz Pharma AG | 56,611 | |||
| 20,700 | Siemens AG | 1,773,538 | |||
| 9,200 | Suedzucker AG | 215,895 | |||
| 26,044 | ThyssenKrupp AG | 543,057 | |||
| 10,582 | TUI AG | 216,643 | |||
| 16,300 | Volkswagen AG | 860,501 | |||
| 18,490,040 | |||||
Greece - 0.0% | |||||
| 1 | Alpha Bank A.E. | 23 | |||
Hong Kong - 1.2% | |||||
| 29,000 | Cheung Kong Holdings, Ltd. | 297,535 | |||
| 95,500 | CLP Holdings, Ltd. | 554,262 | |||
| 137,500 | Esprit Holdings, Ltd. | 977,133 | |||
| 16,000 | Guoco Group, Ltd. | 177,054 | |||
| 98,000 | Hang Lung Group, Ltd. | 207,918 | |||
| 186,500 | Hong Kong Electric | 923,654 | |||
| 28,000 | Hong Kong Ferry Holdings Co. | 33,946 | |||
| 65,500 | Yue Yuen Industrial Holdings, Ltd. | 182,894 | |||
| 3,354,396 | |||||
Ireland - 0.8% | |||||
| 2,712 | Allied Irish Banks, Plc | 57,929 | |||
| 95,911 | Bank of Ireland | 1,510,699 | |||
| 28,275 | CRH, Plc | 831,497 | |||
| 2,400,125 | |||||
Italy - 5.0% | |||||
| 15,107 | Banca Intesa SpA RNC | 74,639 | |||
| 64,575 | Banca Monte dei Paschi di Siena SpA | 301,660 | |||
See Notes to Financial Statements.
F-7
Table of Contents
SELECT INTERNATIONAL EQUITY FUND
PORTFOLIO OF INVESTMENTS, Continued • December 31, 2005
| Shares | Value (Note 2) | ||||
Italy (continued) | |||||
| 25,082 | Capitalia SpA | $ | 145,145 | ||
| 187,208 | Enel SpA | 1,469,931 | |||
| 302,922 | ENI SpA | 8,399,137 | |||
| 32,801 | Fiat SpA* | 285,691 | |||
| 7,657 | Fiat SpA - RCN* | 59,351 | |||
| 14,418 | FinecoGroup SpA | 138,716 | |||
| 2,401 | Fondiaria-Sai SpA | 79,046 | |||
| 8,307 | IFI-Istituto Finanziario Industriale SpA* | 136,644 | |||
| 11,775 | Italcementi SpA | 149,099 | |||
| 1,079 | Italmobiliare SpA | 73,932 | |||
| 64,800 | Mediaset SpA | 686,325 | |||
| 4,500 | Natuzzi SpA, Sponsored ADR | 31,500 | |||
| 12,821 | Sanpaolo IMI SpA | 200,427 | |||
| 27,700 | SMI-Societa Metallurgica Italiana SpA* | 13,374 | |||
| 91,912 | Telecom Italia SpA | 227,870 | |||
| 273,100 | UniCredito Italiano SpA | 1,880,946 | |||
| 14,353,433 | |||||
Japan - 24.0% | |||||
| 7,300 | Aeon Co., Ltd. | 185,609 | |||
| 10,000 | Aioi Insurance Co., Ltd. | 69,497 | |||
| 6,000 | Alps Electric Co., Ltd. | 83,549 | |||
| 52,200 | Astellas Pharma Inc. | 2,035,088 | |||
| 4,100 | Autobacs Seven Co., Ltd. | 215,094 | |||
| 38,700 | Canon, Inc. | 2,263,158 | |||
| 35,500 | Chubu Electric Power Co., Inc. | 845,453 | |||
| 3,000 | Chugai Pharmaceutical Co., Ltd. | 64,327 | |||
| 10,400 | Chugoku Electric Power Co., Inc. | 201,407 | |||
| 17,000 | Cosmo Oil Co., Ltd. | 85,007 | |||
| 31,500 | Credit Saison Co., Ltd. | 1,572,464 | |||
| 28,000 | Daido Steel Co., Ltd. | 267,446 | |||
| 39,379 | Daiichi Sankyo Co., Ltd.* | 759,272 | |||
| 35,100 | Daikin Industries, Ltd. | 1,026,316 | |||
| 21,000 | Daikyo, Inc.* | 129,748 | |||
| 7,600 | Daito Trust Construction Co., Ltd. | 392,915 | |||
| 5,000 | Daiwa House Industry Co., Ltd. | 78,142 | |||
| 8,000 | Daiwa Kosho Lease Co., Ltd. | 47,258 | |||
| 25,500 | Eisai Co., Ltd. | 1,069,794 | |||
| 15,700 | Fanuc, Ltd. | 1,331,952 | |||
| 14,000 | Fuji Electric Holdings Co., Ltd. | 74,159 | |||
| 101,000 | Fuji Heavy Industries, Ltd. | 547,843 | |||
| 13,000 | Fujikura, Ltd. | 105,331 | |||
| 24,000 | Furukawa Electric Co. (The), Ltd.* | 187,541 | |||
| 72,000 | Haseko Corp.* | 277,651 | |||
| 7,200 | Hirose Electric Co., Ltd. | 959,878 | |||
| 2,200 | Hitachi Chemical Co., Ltd. | 58,174 | |||
| 14,100 | Hokkaido Electric Power Co., Inc. | 286,804 | |||
| 79,300 | Honda Motor Co., Ltd. | 4,523,171 | |||
| 57,600 | Hoya Corp. | 2,069,870 | |||
| 87,000 | Isuzu Motors, Ltd. | 331,808 | |||
| 99,000 | Itochu Corp. | 825,629 | |||
| 2,000 | Itoham Foods, Inc. | 8,136 | |||
| 30 | Japan Tobacco, Inc. | 437,325 | |||
| 72,000 | Kajima Corp. | 413,730 | |||
| 4,000 | Kamigumi Co., Ltd. | 35,494 | |||
| 10,000 | Kandenko Co., Ltd. | 74,667 | |||
| 27,900 | Kansai Electric Power Co. (The), Inc. | 599,428 | |||
| 75,000 | Kao Corp. | 2,008,645 | |||
| 170,000 | Kawasaki Heavy Industries, Ltd. | 619,544 | |||
| 24,000 | Kawasaki Kisen Kaisha, Ltd. | 150,521 | |||
| 18,000 | Keisei Electric Railway Co., Ltd. | 122,807 | |||
| 1,000 | Kikkoman Corp. | 9,704 | |||
| 86,000 | Kobe Steel, Ltd. | 278,430 | |||
| 34,000 | Komatsu, Ltd. | 562,200 | |||
| 5,400 | Konami Corp. | 118,764 | |||
| 14,000 | Kubota Corp. | 117,586 | |||
| 19,000 | Kyushu Electric Power Co., Inc. | 412,238 | |||
| 8,300 | Leopalace21 Corp. | 301,076 | |||
| 23,000 | Maeda Corp. | 151,852 | |||
| 3,400 | Makita Corp. | 83,566 | |||
| 150,000 | Marubeni Corp. | 804,729 | |||
| 61,000 | Matsushita Electric Industrial Co., Ltd. | 1,176,159 | |||
| 129,000 | Mazda Motor Corp. | 590,389 | |||
| 140,800 | Mitsubishi Corp. | 3,114,569 | |||
| 11,000 | Mitsubishi Electric Corp. | 77,846 | |||
| 17,000 | Mitsubishi Heavy Industries, Ltd. | 74,922 | |||
| 77,000 | Mitsubishi Materials Corp. | 393,516 | |||
| 201,000 | Mitsubishi Motors Corp.* | 417,366 | |||
| 23,000 | Mitsubishi Rayon Co., Ltd. | 152,047 | |||
| 252 | Mitsubishi Tokyo Financial Group, Inc. | 3,417,239 | |||
| 32,000 | Mitsui & Co., Ltd. | 410,882 | |||
| 14,000 | Mitsui Chemicals, Inc. | 94,093 | |||
| 11,000 | Mitsui Sumitomo Insurance Co., Ltd. | 134,528 | |||
| 41,000 | Mitsui Trust Holdings, Inc. | 492,042 | |||
| 33 | Mizuho Financial Group, Inc. | 261,785 | |||
| 8,000 | Nagase & Co., Ltd. | 97,907 | |||
| 7,000 | NGK Spark Plug Co., Ltd. | 151,284 | |||
| 12,000 | Nidec Corp. | 1,020,086 | |||
| 124,000 | Nikko Cordial Corp. | 1,963,149 | |||
| 8,000 | Nippo Corp. | 59,734 | |||
| 62,000 | Nippon Light Metal Co., Ltd. | 170,777 | |||
| 32,000 | Nippon Mining Holdings, Inc. | 227,545 | |||
| 90,000 | Nippon Steel Corp. | 320,366 | |||
| 116 | Nippon Telegraph & Telephone Corp. | 526,960 | |||
| 45,000 | Nippon Yusen Kabushiki Kaisha | 308,162 | |||
| 48,000 | Nishimatsu Construction Co., Ltd. | 196,898 | |||
| 65,800 | Nissan Motor Co., Ltd. | 666,421 | |||
| 7,000 | Nisshin Oillio Group, Ltd. | 48,055 | |||
| 10,600 | Nissin Food Products Co., Ltd. | 306,348 | |||
| 22,400 | Nitto Denko Corp. | 1,744,690 | |||
| 7,800 | Nomura Holdings, Inc. | 149,402 | |||
| 12,000 | Olympus Corp. | 315,281 | |||
| 4,800 | Ono Pharmaceutical Co., Ltd. | 216,832 | |||
| 1,500 | ORIX Corp. | 382,024 | |||
| 155,000 | Osaka Gas Co., Ltd. | 534,664 | |||
| 123 | Resona Holdings, Inc.* | 495,169 | |||
| 6,300 | Ryosan Co. | 167,124 | |||
| 20,000 | Secom Co., Ltd. | 1,045,851 | |||
| 61,000 | Shimizu Corp. | 448,233 | |||
| 28,700 | Shin-Etsu Chemical Co., Ltd. | 1,525,121 | |||
| 5,300 | Showa Shell Sekiyu KK | 63,246 | |||
| 9,700 | SMC Corp. | 1,385,244 | |||
| 11,300 | Sojitz Corp.* | 67,040 | |||
| 2,600 | Stanley Electric Co., Ltd. | 42,243 | |||
See Notes to Financial Statements.
F-8
Table of Contents
SELECT INTERNATIONAL EQUITY FUND
PORTFOLIO OF INVESTMENTS, Continued • December 31, 2005
| Shares | Value (Note 2) | ||||
Japan (continued) | |||||
| 206,000 | Sumitomo Corp. | $ | 2,662,514 | ||
| 27,000 | Sumitomo Heavy Industries, Ltd. | 226,545 | |||
| 157,000 | Sumitomo Metal Industries, Ltd. | 604,102 | |||
| 33,000 | Taiheiyo Cement Corp. | 133,969 | |||
| 116,000 | Taisei Corp. | 525,977 | |||
| 23,000 | Taisho Pharmaceutical Co., Ltd. | 430,799 | |||
| 6,000 | Takashimaya Co., Ltd. | 95,805 | |||
| 93,200 | Takeda Pharmaceutical Co., Ltd. | 5,039,546 | |||
| 13,000 | Takefuji Corp. | 882,532 | |||
| 11,000 | Teijin, Ltd. | 69,828 | |||
| 6,000 | Terumo Corp. | 177,473 | |||
| 29,100 | Tohoku Electric Power Co., Inc. | 591,915 | |||
| 8,000 | Tokuyama Corp. | 102,721 | |||
| 17,400 | Tokyo Electric Power Co. (The), Inc. | 422,502 | |||
| 54,000 | Tokyo Gas Co., Ltd. | 239,817 | |||
| 42,000 | TonenGeneral Sekiyu K.K. | 451,360 | |||
| 1,000 | Toshiba TEC Corp. | 5,399 | |||
| 2,000 | Toyo Suisan Kaisha, Ltd. | 32,274 | |||
| 3,000 | Toyota Industries Corp. | 107,806 | |||
| 4,000 | Toyota Tsusho Corp. | 90,855 | |||
| 63,000 | Ube Industries, Ltd. | 170,862 | |||
| 3,000 | Wacoal Corp. | 40,631 | |||
| 7,000 | Yamaha Corp. | 116,340 | |||
| 5,300 | Yamaha Motor Co., Ltd. | 138,351 | |||
| 8,000 | Yamato Transport Co., Ltd. | 132,621 | |||
| 69,227,580 | |||||
Luxembourg - 0.2% | |||||
| 21,707 | Arcelor | 538,165 | |||
Mexico - 0.3% | |||||
| 13,200 | Fomento Economico Mexicano SA de CV, Sponsored ADR | 957,132 | |||
Netherlands - 6.7% | |||||
| 208,000 | ABN-Amro Holdings | 5,437,392 | |||
| 79,217 | Aegon NV | 1,288,999 | |||
| 12,800 | Akzo Nobel NV | 593,025 | |||
| 3,487 | Corio NV | 189,407 | |||
| 10,050 | DSM NV | 410,314 | |||
| 83,200 | Elsevier NV | 1,161,815 | |||
| 700 | Gamma Holding NV | 29,242 | |||
| 11,783 | Heineken NV | 373,420 | |||
| 169,987 | ING Groep NV | 5,894,065 | |||
| 53,100 | Koninklijke (Royal) Phillips Electronics NV | 1,649,512 | |||
| 8,255 | Koninklijke Wessanen NV | 125,140 | |||
| 12,252 | Oce NV | 176,743 | |||
| 2,027 | Unilever NV | 138,768 | |||
| 2,315 | Wereldhave NV | 218,207 | |||
| 77,100 | Wolters Kluwer NV | 1,558,382 | |||
| 19,244,431 | |||||
Norway - 0.6% | |||||
| 2,952 | Aker ASA, Class A | 86,559 | |||
| 11,800 | DnB Nor ASA | 125,818 | |||
| 9,180 | Norsk Hydro ASA | 942,117 | |||
| 4,450 | Orkla ASA | 184,192 | |||
| 13,500 | Statoil ASA | 309,881 | |||
| 4,400 | Yara International ASA | 64,020 | |||
| 1,712,587 | |||||
Singapore - 0.4% | |||||
| 131,000 | ComfortDelgro Corp., Ltd. | 126,041 | |||
| 43,000 | DBS Group Holding, Ltd. | 426,651 | |||
| 25,000 | Fraser & Neave, Ltd. | 278,120 | |||
| 15,000 | Hotel Properties, Ltd. | 13,981 | |||
| 63,000 | Neptune Orient Lines, Ltd. | 127,292 | |||
| 71,020 | SembCorp Industries, Ltd. | 117,018 | |||
| 3,000 | Straits Trading Co., Ltd. | 5,322 | |||
| 1,000 | United Industrial Corp., Ltd. | 704 | |||
| 1,095,129 | |||||
South Korea - 0.6% | |||||
| 4,060 | Samsung Electronics Co., Ltd., GDR (a) | 1,323,411 | |||
| 27,100 | SK Telecom Co., Ltd., ADR | 549,859 | |||
| 1,873,270 | |||||
Spain - 2.5% | |||||
| 1,198 | Acciona SA | 133,903 | |||
| 3,892 | ACS, Actividades de Construccion y Servicios SA | 125,324 | |||
| 29,400 | Altadis SA | 1,333,228 | |||
| 151,600 | Banco Popular Espanol SA | 1,847,855 | |||
| 11,084 | Banco Santander Central Hispano SA | 146,252 | |||
| 36,817 | Endesa SA | 968,108 | |||
| 1,200 | Fomento de Construcciones Y Contratas SA | 68,022 | |||
| 44,864 | Iberdrola SA | 1,225,896 | |||
| 41,700 | Repsol YPF SA | 1,217,410 | |||
| 6,820 | Sacyr Vallehermoso SA | 166,258 | |||
| 7,232,256 | |||||
Sweden - 1.4% | |||||
| 5,400 | Atlas Copco AB, Class A | 120,219 | |||
| 11,800 | Electrolux AB, Class B | 306,484 | |||
| 435,200 | Ericsson AB, Class B | 1,494,366 | |||
| 25,500 | Hennes & Mauritz AB, Class B | 865,983 | |||
| 5,800 | Holmen AB, Class B | 191,497 | |||
| 37,100 | Nordea Bank AB | 384,976 | |||
| 31,200 | Swedish Match AB | 366,920 | |||
| 15,700 | Tele2 AB, Class B | 168,345 | |||
| 3,898,790 | |||||
Switzerland - 6.3% | |||||
| 38,350 | Adecco SA | 1,767,375 | |||
| 6 | Banque Cantonale Vaudoise | 1,725 | |||
| 11,088 | Credit Suisse Group | 564,961 | |||
| 25,000 | Holcim, Ltd. | 1,701,586 | |||
| 9,120 | Nestle SA | 2,725,701 | |||
| 51,800 | Novartis AG | 2,720,096 | |||
| 10,400 | Roche Holdings AG | 1,560,455 | |||
| 1,256 | Swisscom AG | 396,156 | |||
| 34,740 | UBS AG | 3,305,049 | |||
See Notes to Financial Statements.
F-9
Table of Contents
SELECT INTERNATIONAL EQUITY FUND
PORTFOLIO OF INVESTMENTS, Continued • December 31, 2005
| Shares | Value (Note 2) | |||||
Switzerland (continued) | ||||||
| 448 | Valora Holding AG* | $ | 86,793 | |||
| 16,172 | Zurich Financial Services AG* | 3,443,599 | ||||
| 18,273,496 | ||||||
United Kingdom - 24.7% | ||||||
| 12,590 | Arriva, Plc | 126,004 | ||||
| 60,549 | Astrazeneca, Plc | 2,943,073 | ||||
| 42,228 | Aviva, Plc | 511,506 | ||||
| 279,369 | Barclays, Plc | 2,932,787 | ||||
| 34,057 | Barratt Developments, Plc | 576,958 | ||||
| 38,314 | BBA Group, Plc | 216,249 | ||||
| 237,100 | BG Group, Plc | 2,340,360 | ||||
| 69,048 | Boots Group, Plc | 717,741 | ||||
| 24,208 | British American Tobacco Industries, Plc | 540,709 | ||||
| 88,200 | British Land Co., Plc | 1,615,425 | ||||
| 426,547 | BT Group, Plc | 1,632,472 | ||||
| 4,989 | Burberry Group, Plc | 36,838 | ||||
| 35,129 | Cable & Wireless, Plc | 71,976 | ||||
| 43,421 | Cadbury Schweppes, Plc | 409,948 | ||||
| 482,631 | Centrica, Plc | 2,112,470 | ||||
| 84,060 | Cobham, Plc | 244,805 | ||||
| 253,871 | Dixons Group, Plc | 714,259 | ||||
| 27,575 | First Choice Holidays, Plc | 118,445 | ||||
| 17,711 | Friends Provident, Plc | 57,665 | ||||
| 26,451 | Gallaher Group, Plc | 398,796 | ||||
| 453,413 | GlaxoSmithKline, Plc | 11,443,973 | ||||
| 14,069 | GUS, Plc | 249,462 | ||||
| 20,726 | Hanson, Plc | 227,550 | ||||
| 125,434 | HBOS, Plc | 2,140,058 | ||||
| 266,400 | HSBC Holdings, Plc | 4,277,628 | ||||
| 24,532 | Imi, Plc | 212,013 | ||||
| 43,200 | Imperial Tobacco Group, Plc | 1,289,272 | ||||
| 56,200 | J Sainsbury, Plc | 304,405 | ||||
| 407,619 | Kingfisher, Plc | 1,661,582 | ||||
| 157,814 | Lloyds TSB Group, Plc | 1,324,559 | ||||
| 3,276 | Man Group, Plc | 107,507 | ||||
| 675,600 | Morrison WM Supermarkets | 2,246,113 | ||||
| 280,508 | National Grid Transco, Plc (b) | 0 | ||||
| 207,620 | National Grid, Plc | 2,027,966 | ||||
| 25,320 | Next, Plc | 667,780 | ||||
| 82,857 | Northern Foods, Plc | 215,677 | ||||
| 82,480 | Royal & Sun Alliance Insurance Group, Plc | 178,204 | ||||
| 105,362 | Royal Bank of Scotland | 3,177,036 | ||||
| 69,450 | Royal Dutch Shell, Plc, Class A | 2,118,784 | ||||
| 13,005 | Royal Dutch Shell, Plc, Class B | 415,162 | ||||
| 74,540 | Schroders, Plc | 1,216,674 | ||||
| 58,695 | Scottish & Southern Energy, Plc | 1,022,587 | ||||
| 76,441 | Scottish Power, Plc | 713,817 | ||||
| 14,500 | Severn Trent, Plc | 270,059 | ||||
| 166,321 | Smith & Nephew, Plc | 1,530,268 | ||||
| 27,814 | Smith WH, Plc | 207,642 | ||||
| 75,500 | Standard Chartered, Plc | 1,679,878 | ||||
| 41,006 | Taylor Woodrow, Plc | 268,079 | ||||
| 506,000 | Tesco, Plc | 2,882,008 | ||||
| 11,831 | The Berkeley Group Holdings, Plc* | 225,838 | ||||
| 16,458 | Unilever, Plc | 163,019 | ||||
| 16,288 | United Utilities, Plc | 187,781 | ||||
| 1,776,500 | Vodafone Airtouch, Plc | 3,830,628 | ||||
| 45,608 | Wimpey (George), Plc | 376,135 | ||||
| 124,469 | Wolseley, Plc | 2,619,741 | ||||
| 138,720 | WPP Group, Plc | 1,499,170 | ||||
| 71,296,541 | ||||||
Total Common Stocks (Cost $214,041,859) | 273,588,152 | |||||
| Par Value | ||||||
| U.S. GOVERNMENT OBLIGATION - 0.2% | ||||||
U.S. Treasury Bill - 0.2% | ||||||
| $ | 540,000 | 3.65%, 02/23/06 (c) | 537,048 | |||
| 25,000 | 3.66%, 02/23/06 (c) | 24,863 | ||||
| 561,911 | ||||||
Total U.S. Government Obligation (Cost $561,911) | 561,911 | |||||
| Shares | ||||||
| PREFERRED STOCKS - 0.3% | ||||||
Germany - 0.3% | ||||||
| 1,261 | Henkel KGaA Preferred | 126,843 | ||||
| 3,073 | RWE AG Preferred | 197,976 | ||||
| 13,820 | Volkswagen AG Preferred | 531,524 | ||||
| 856,343 | ||||||
Italy - 0.0% | ||||||
| 5,600 | Fiat SpA Preferred* | 39,298 | ||||
Total Preferred Stocks (Cost $647,180) | 895,641 | |||||
| RIGHTS - 0.0% | ||||||
Thailand - 0.0% | ||||||
| 100,421 | TelecomAsia Corp., Public Co., Ltd.* (b) | 0 | ||||
United Kingdom - 0.0% | ||||||
| 332,400 | Ti Automotive, Ltd.* (b) | 0 | ||||
Total Rights (Cost $68,642) | 0 | |||||
| | Total Investments - 95.4% (Cost $215,319,592) | 275,045,704 | ||||
| Net Other Assets and Liabilities - 4.6% | 13,322,329 | |||||
| Total Net Assets - 100.0% | $ | 288,368,033 | ||||
| * | Non-income producing security. |
| (a) | Security exempt from registration under Rule 144A of the Securities Act of 1933. This security may be resold in transactions exempt from registration, to qualified institutional buyers. At December 31, 2005, these securities amounted to $1,323,411 or 0.5% of net assets. |
See Notes to Financial Statements.
F-10
Table of Contents
SELECT INTERNATIONAL EQUITY FUND
PORTFOLIO OF INVESTMENTS, Continued • December 31, 2005
| (b) | Security has no value. | |
| (c) | Effective yield at time of purchase. | |
| ADR | American Depositary Receipt. Shares of a foreign based corporation held in U.S. banks entitling the shareholder to all dividends and capital gains. | |
| GDR | Global Depositary Receipt. A negotiable certificate held in the bank of one country representing a specific number of shares of a stock traded on an exchange of another country. | |
Industry Concentration of Investments
as a Percentage of Net Assets*:
Advertising | 0.5 | % | |
Aerospace & Defense | 0.1 | ||
Agriculture | 1.5 | ||
Apparel | 0.1 | ||
Auto Manufacturers | 4.5 | ||
Auto Parts & Equipment | 0.2 | ||
Banks | 14.4 | ||
Beverages | 0.6 | ||
Building Materials | 2.8 | ||
Chemicals | 2.5 | ||
Commercial Services | 1.3 | ||
Cosmetics & Personal Care | 0.7 | ||
Distribution & Wholesale | 1.4 | ||
Diversified Financial Services | 2.9 | ||
Electric | 5.9 | ||
Electrical Components & Equipment | 0.2 | ||
Electronics | 1.6 | ||
Engineering & Construction | 1.8 | ||
Environmental Control | 0.2 | ||
Food | 4.8 | ||
Gas | 0.1 | ||
Hand & Machine Tools | 0.4 | ||
Health Care - Products | 1.3 | ||
Holding Companies - Diversified | 0.1 | ||
Home Builders | 0.1 | ||
Home Furnishings | 0.8 | ||
Household Products & Wares | 0.2 | ||
Insurance | 5.5 | ||
Iron & Steel | 1.5 | ||
Leisure Time | 0.1 | ||
Machinery - Construction & Mining | 0.2 | ||
Machinery - Diversified | 0.7 | ||
Manufacturing - Miscellaneous | 1.0 | ||
Media | 1.2 | ||
Metal Fabricate & Hardware | 0.4 | ||
Mining | 1.3 | ||
Office & Business Equipment | 0.8 | ||
Oil & Gas | 9.3 | ||
Pharmaceuticals | 11.2 | ||
Real Estate | 1.8 | ||
Retail | 2.3 | ||
Software | 0.5 | ||
Telecommunications | 5.3 | ||
Textiles | 0.1 | ||
Transportation | 1.0 | ||
U.S. Treasury Bill | 0.2 | ||
Net Other Assets and Liabilities | 4.6 | ||
Total | 100.0 | % | |
| * | Not part of the financial statements; therefore not covered by the Report of Independent Registered Public Accounting Firm. |
See Notes to Financial Statements.
F-11
Table of Contents
SELECT GROWTH FUND
PORTFOLIO OF INVESTMENTS • December 31, 2005
| Shares | Value (Note 2) | ||||
| COMMON STOCKS - 95.7% | |||||
Agriculture - 1.7% | |||||
| 94,196 | Monsanto Co. | $ | 7,303,016 | ||
Apparel - 1.5% | |||||
| 92,300 | Coach, Inc.* | 3,077,282 | |||
| 42,400 | NIKE, Inc., Class B | 3,679,896 | |||
| 6,757,178 | |||||
Banks - 2.7% | |||||
| 72,000 | Bank of America Corp. | 3,322,800 | |||
| 157,779 | State Street Corp. | 8,747,268 | |||
| 12,070,068 | |||||
Beverages - 0.6% | |||||
| 46,200 | PepsiCo, Inc. | 2,729,496 | |||
Biotechnology - 3.9% | |||||
| 162,484 | Amgen, Inc.* | 12,813,488 | |||
| 47,800 | Genentech, Inc.* | 4,421,500 | |||
| 17,234,988 | |||||
Commercial Services - 0.7% | |||||
| 6,800 | Getty Images, Inc.* | 607,036 | |||
| 64,760 | Paychex, Inc. | 2,468,651 | |||
| 3,075,687 | |||||
Computers - 3.0% | |||||
| 58,500 | Apple Computer, Inc.* | 4,205,565 | |||
| 233,400 | Dell, Inc.* | 6,999,666 | |||
| 154,700 | EMC Corp.* | 2,107,014 | |||
| 13,312,245 | |||||
Cosmetics & Personal Care - 1.5% | |||||
| 109,917 | Procter & Gamble Co. | 6,361,996 | |||
Diversified Financial Services - 6.3% | |||||
| 106,300 | American Express Co. | 5,470,198 | |||
| 262,100 | Charles Schwab Corp. | 3,845,007 | |||
| 70,647 | Fannie Mae | 3,448,280 | |||
| 57,900 | Merrill Lynch & Co., Inc. | 3,921,567 | |||
| 63,800 | Morgan (J.P.) & Co., Inc. | 2,532,222 | |||
| 150,125 | SLM Corp. | 8,270,386 | |||
| 27,487,660 | |||||
Electrical Components & Equipment - 1.5% | |||||
| 273,758 | Molex Inc., Class A | 6,731,709 | |||
Electronics - 0.4% | |||||
| 55,500 | Agilent Technologies, Inc.* | 1,847,595 | |||
Food - 1.1% | |||||
| 63,000 | Whole Foods Market, Inc. | 4,875,570 | |||
Health Care - Products - 5.8% | |||||
| 28,400 | Alcon, Inc. | 3,680,640 | |||
| 123,633 | Johnson & Johnson | 7,430,343 | |||
| 111,858 | Medtronic, Inc. | 6,439,665 | |||
| 63,100 | St. Jude Medical, Inc.* | 3,167,620 | |||
| 70,647 | Zimmer Holdings, Inc.* | 4,764,434 | |||
| 25,482,702 | |||||
Health Care - Services - 3.5% | |||||
| 97,140 | Lincare Holding, Inc.* | 4,071,137 | |||
| 185,445 | UnitedHealth Group, Inc. | 11,523,552 | |||
| 15,594,689 | |||||
Insurance - 3.9% | |||||
| 156,013 | AFLAC, Inc. | 7,242,124 | |||
| 74,200 | American International Group, Inc. | 5,062,666 | |||
| 16,800 | CIGNA Corp. | 1,876,560 | |||
| 36,200 | Wellpoint, Inc.* | 2,888,398 | |||
| 17,069,748 | |||||
Internet - 7.2% | |||||
| 24,200 | Amazon.com, Inc.* | 1,141,030 | |||
| 275,745 | eBay, Inc.* | 11,925,971 | |||
| 20,900 | Google, Inc., Class A* | 8,670,574 | |||
| 256,784 | Yahoo!, Inc.* | 10,060,797 | |||
| 31,798,372 | |||||
Leisure Time - 1.7% | |||||
| 135,407 | Carnival Corp. | 7,240,212 | |||
Lodging - 0.5% | |||||
| 32,100 | Marriott International, Inc., Class A | 2,149,737 | |||
Manufacturing - Miscellaneous - 3.3% | |||||
| 188,179 | Dover Corp. | 7,619,368 | |||
| 190,900 | General Electric Co. | 6,691,045 | |||
| 14,310,413 | |||||
Media - 4.1% | |||||
| 223,716 | Comcast Corp., Special Class A* | 5,747,264 | |||
| 295,621 | Liberty Global, Inc. Class C* | 6,267,165 | |||
| 788,894 | Liberty Media Group, Class A* | 6,208,596 | |||
| 18,223,025 | |||||
Oil & Gas - 1.1% | |||||
| 29,000 | Occidental Petroleum Corp. | 2,316,520 | |||
| 41,500 | Suncor Energy, Inc. | 2,619,895 | |||
| 4,936,415 | |||||
Oil & Gas Services - 4.6% | |||||
| 79,478 | Baker Hughes, Inc. | 4,830,673 | |||
| 157,640 | Schlumberger, Ltd. | 15,314,726 | |||
| 20,145,399 | |||||
See Notes to Financial Statements.
F-12
Table of Contents
SELECT GROWTH FUND
PORTFOLIO OF INVESTMENTS, Continued • December 31, 2005
| Shares | Value (Note 2) | ||||
| Pharmaceuticals - 5.5% | |||||
| 67,800 | Caremax Rx, Inc.* | $ | 3,511,362 | ||
| 73,300 | Gilead Sciences, Inc.* | 3,857,779 | |||
| 79,300 | Novartis AG, Sponsored ADR | 4,161,664 | |||
| 229,604 | Pfizer, Inc. | 5,354,365 | |||
| 61,300 | Roche Holding AG, Sponsored ADR | 4,588,373 | |||
| 60,800 | Sanofi-Aventis, ADR | 2,669,120 | |||
| 24,142,663 | |||||
| Retail - 6.7% | |||||
| 127,165 | Bed Bath & Beyond, Inc.* | 4,597,015 | |||
| 101,900 | Chico’s FAS, Inc.* | 4,476,467 | |||
| 32,200 | Federated Department Stores, Inc. | 2,135,826 | |||
| 171,908 | Home Depot, Inc. | 6,958,836 | |||
| 48,800 | Lowes Cos., Inc. | 3,253,008 | |||
| 19,900 | Starbucks Corp.* | 597,199 | |||
| 82,700 | Target Corp. | 4,546,019 | |||
| 21,600 | The Cheesecake Factory, Inc.* | 807,624 | |||
| 44,100 | Williams-Sonoma, Inc.* | 1,902,915 | |||
| 29,274,909 | |||||
| Semiconductors - 6.9% | |||||
| 135,407 | Analog Devices, Inc. | 4,857,049 | |||
| 168,400 | Applied Materials, Inc. | 3,021,096 | |||
| 227,414 | Intel Corp. | 5,676,254 | |||
| 60,639 | Linear Technology Corp. | 2,187,249 | |||
| 91,400 | Marvell Technology Group, Ltd.* | 5,126,626 | |||
| 133,400 | Maxim Integrated Products, Inc. | 4,834,416 | |||
| 138,900 | Texas Instruments, Inc. | 4,454,523 | |||
| 30,157,213 | |||||
| Software - 10.3% | |||||
| 141,100 | Adobe Systems, Inc. | 5,215,056 | |||
| 77,100 | Electronic Arts, Inc.* | 4,033,101 | |||
| 203,111 | First Data Corp. | 8,735,804 | |||
| 185,449 | Intuit, Inc.* | 9,884,432 | |||
| 475,713 | Microsoft Corp. | 12,439,895 | |||
| 38,900 | NAVTEQ Corp.* | 1,706,543 | |||
| 77,000 | SAP AG, Sponsored ADR | 3,470,390 | |||
| 45,485,221 | |||||
| Telecommunications - 5.7% | |||||
| 417,820 | Cisco Systems, Inc.* | 7,153,078 | |||
| 158,600 | Nokia Oyj Corp., Sponsored ADR | 2,902,380 | |||
| 143,701 | Qualcomm, Inc. | 6,190,639 | |||
| 130,048 | Sprint Nextel Corp. | 3,037,921 | |||
| 273,758 | Vodafone Group, Plc, Sponsored ADR | 5,877,584 | |||
| 25,161,602 | |||||
Total Common Stocks (Cost $364,044,337) | 420,959,528 | ||||
| Par Value | Value (Note 2) | ||||
| U.S. GOVERNMENT AGENCY OBLIGATIONS - 0.9% | |||||
| Fannie Mae - 0.9% | |||||
| $4,100,000 | 3.25%, 01/03/06 (a) | $ | 4,098,889 | ||
Total U.S. Government Agency Obligations (Cost $4,098,889) | 4,098,889 | ||||
| Total Investments - 96.6% (Cost $368,143,226) | 425,058,417 | ||||
| Net Other Assets and Liabilities - 3.4% | 15,078,645 | ||||
| Total Net Assets - 100.0% | $ | 440,137,062 | |||
| * | Non-income producing security. |
| (a) | Effective yield at time of purchase. |
| ADR | American Depositary Receipt. Shares of a foreign based corporation held in U.S. banks entitling the shareholder to all dividends and capital gains. |
Industry/Sector Concentration of Investments
as a Percentage of Net Assets*:
Communications | 17.0 | % | |
Consumer Cyclical | 10.4 | ||
Consumer Non-Cyclical | 24.3 | ||
Energy | 5.7 | ||
Financial | 12.9 | ||
Industrial | 5.2 | ||
Technology | 20.2 | ||
U.S. Government Agency Obligations | 0.9 | ||
Net Other Assets and Liabilities | 3.4 | ||
Total | 100.0 | % | |
| * | Not part of the financial statements; therefore not covered by the Report of Independent Registered Public Accounting Firm. |
See Notes to Financial Statements.
F-13
Table of Contents
CORE EQUITY FUND
PORTFOLIO OF INVESTMENTS • December 31, 2005
| Value | |||||
| Shares | (Note 2) | ||||
| COMMON STOCKS - 98.1% | |||||
| Advertising - 1.6% | |||||
| 32,800 | Lamar Advertising Co.* | $ | 1,513,392 | ||
| 34,200 | Omnicom Group, Inc. | 2,911,446 | |||
| 4,424,838 | |||||
| Aerospace & Defense - 1.8% | |||||
| 41,200 | Lockheed Martin Corp. | 2,621,556 | |||
| 29,400 | Northrop Grumman Corp. | 1,767,234 | |||
| 12,850 | United Technologies Corp. | 718,443 | |||
| 5,107,233 | |||||
| Auto Parts & Equipment - 1.4% | |||||
| 21,500 | BorgWarner, Inc. | 1,303,545 | |||
| 35,500 | Johnson Controls, Inc. | 2,588,305 | |||
| 3,891,850 | |||||
| Banks - 7.0% | |||||
| 53,356 | Bank of America Corp. | 2,462,379 | |||
| 90,600 | Fifth Third Bancorp | 3,417,432 | |||
| 96,800 | Mellon Financial Corp. | 3,315,400 | |||
| 34,700 | Northern Trust Corp. | 1,798,154 | |||
| 43,600 | PNC Bank Corp. | 2,695,788 | |||
| 93,900 | Wells Fargo & Co. | 5,899,737 | |||
| 19,588,890 | |||||
| Beverages - 2.3% | |||||
| 38,900 | Anheuser-Busch Companies, Inc. | 1,671,144 | |||
| 82,060 | PepsiCo, Inc. | 4,848,105 | |||
| 6,519,249 | |||||
| Biotechnology - 1.1% | |||||
| 40,490 | Amgen, Inc.* | 3,193,041 | |||
| Building Materials - 0.8% | |||||
| 75,300 | Masco Corp. | 2,273,307 | |||
| Commercial Services - 3.0% | |||||
| 60,100 | Accenture, Ltd., Class A | 1,735,087 | |||
| 5,500 | CCE Spinco, Inc.* | 72,050 | |||
| 197,100 | Cendant Corp. | 3,399,975 | |||
| 38,280 | Moody’s Corp. | 2,351,158 | |||
| 31,400 | Valassis Communications, Inc.* | 912,798 | |||
| 8,471,068 | |||||
| Computers - 1.6% | |||||
| 103,220 | Dell, Inc.* | 3,095,568 | |||
| 101,830 | EMC Corp.* | 1,386,925 | |||
| 4,482,493 | |||||
| Cosmetics & Personal Care - 0.5% | |||||
| 24,260 | Procter & Gamble Co. | 1,404,169 | |||
| Diversified Financial Services - 12.6% | |||||
| 13,800 | American Express Co. | 710,148 | |||
| 242,740 | Charles Schwab Corp. | 3,560,996 | |||
| 177,582 | Citigroup, Inc. | 8,618,054 | |||
| 173,580 | Freddie Mac | 11,343,453 | |||
| 135,600 | Morgan (J.P.) & Co., Inc. | 5,381,964 | |||
| 100,500 | Morgan Stanley Dean Witter & Co. | 5,702,370 | |||
| 35,316,985 | |||||
| Electric - 3.6% | |||||
| 72,300 | American Electric Power, Inc. | 2,681,607 | |||
| 65,700 | Exelon Corp. | 3,491,298 | |||
| 35,100 | FirstEnergy Corp. | 1,719,549 | |||
| 36,900 | NiSource, Inc. | 769,734 | |||
| 57,500 | Pepco Holdings, Inc. | 1,286,275 | |||
| 9,948,463 | |||||
| Food - 1.5% | |||||
| 97,300 | Kroger Co.* | 1,837,024 | |||
| 35,860 | Wrigley (Wm.) Jr. Co. | 2,384,331 | |||
| 4,221,355 | |||||
| Gas - 0.5% | |||||
| 31,000 | Sempra Energy | 1,390,040 | |||
| Health Care - Products - 4.1% | |||||
| 41,040 | Fisher Scientific International, Inc.* | 2,538,734 | |||
| 23,000 | Johnson & Johnson | 1,382,300 | |||
| 59,100 | Medtronic, Inc. | 3,402,387 | |||
| 44,560 | Stryker Corp. | 1,979,801 | |||
| 31,250 | Zimmer Holdings, Inc.* | 2,107,500 | |||
| 11,410,722 | |||||
| Health Care - Services - 1.1% | |||||
| 47,800 | UnitedHealth Group, Inc. | 2,970,292 | |||
| Household Products & Wares - 0.6% | |||||
| 23,250 | Fortune Brands, Inc. | 1,813,965 | |||
| Insurance - 3.0% | |||||
| 72,900 | American International Group, Inc. | 4,973,967 | |||
| 30,100 | Hartford Financial Services Group, Inc. | 2,585,289 | |||
| 21,500 | Willis Group Holdings, Ltd. | 794,210 | |||
| 8,353,466 | |||||
| Internet - 2.2% | |||||
| 81,200 | Expedia, Inc.* | 1,945,552 | |||
| 6,640 | Google, Inc., Class A* | 2,754,670 | |||
| 34,570 | Yahoo!, Inc.* | 1,354,453 | |||
| 6,054,675 | |||||
| Leisure Time - 1.4% | |||||
| 51,660 | Carnival Corp. | 2,762,260 | |||
| 21,700 | Harley-Davidson, Inc. | 1,117,333 | |||
| 3,879,593 | |||||
See Notes to Financial Statements.
F-14
Table of Contents
CORE EQUITY FUND
PORTFOLIO OF INVESTMENTS, Continued • December 31, 2005
| Shares | Value (Note 2) | ||||
| Lodging - 1.7% | |||||
| 30,050 | Harrah’s Entertainment, Inc. | $ | 2,142,265 | ||
| 39,100 | Marriott International, Inc., Class A | 2,618,527 | |||
| 4,760,792 | |||||
| Manufacturing - Miscellaneous - 1.1% | |||||
| 34,600 | Illinois Tool Works, Inc. | 3,044,454 | |||
| Media - 7.6% | |||||
| 106,270 | Clear Channel Communications, Inc. | 3,342,192 | |||
| 84,900 | DIRECTV Group (The), Inc.* | 1,198,788 | |||
| 111,940 | McGraw-Hill Cos., Inc. | 5,779,462 | |||
| 135,980 | Time Warner, Inc. | 2,371,491 | |||
| 178,890 | Univision Communications, Inc.* | 5,257,577 | |||
| 101,560 | Viacom, Inc., Class B | 3,310,856 | |||
| 21,260,366 | |||||
| Oil & Gas - 5.2% | |||||
| 88,100 | Exxon Mobil Corp. | 4,948,577 | |||
| 32,800 | GlobalSantaFe Corp. | 1,579,320 | |||
| 75,900 | Marathon Oil Corp. | 4,627,623 | |||
| 55,010 | Suncor Energy, Inc. | 3,472,781 | |||
| 14,628,301 | |||||
| Oil & Gas Services - 2.6% | |||||
| 14,900 | Baker Hughes, Inc. | 905,622 | |||
| 65,890 | Schlumberger, Ltd. | 6,401,214 | |||
| 7,306,836 | |||||
| Pharmaceuticals - 6.9% | |||||
| 54,300 | Bristol-Myers Squibb Co. | 1,247,814 | |||
| 63,730 | Caremax Rx, Inc.* | 3,300,577 | |||
| 28,100 | Cephalon, Inc.* | 1,819,194 | |||
| 23,010 | Lilly (Eli) & Co. | 1,302,136 | |||
| 89,700 | Medco Health Solutions, Inc.* | 5,005,260 | |||
| 48,910 | Pfizer, Inc. | 1,140,581 | |||
| 118,210 | Wyeth Corp. | 5,445,935 | |||
| 19,261,497 | |||||
| Retail - 4.5% | |||||
| 63,000 | Costco Wholesale Corp. | 3,116,610 | |||
| 64,770 | Lowes Cos., Inc. | 4,317,568 | |||
| 31,590 | Target Corp. | 1,736,502 | |||
| 71,160 | Wal-Mart Stores, Inc. | 3,330,288 | |||
| 12,500,968 | |||||
| Savings & Loans - 0.3% | |||||
| 12,680 | Golden West Financial Corp. | 836,880 | |||
| Semiconductors - 1.6% | |||||
| 59,140 | Intel Corp. | 1,476,134 | |||
| 82,970 | Linear Technology Corp. | 2,992,728 | |||
| 4,468,862 | |||||
| Software - 6.3% | |||||
| 55,060 | Electronic Arts, Inc.* | 2,880,189 | |||
| 132,580 | First Data Corp. | 5,702,266 | |||
| 349,940 | Microsoft Corp. | 9,150,931 | |||
| 17,733,386 | |||||
| Telecommunications - 6.7% | |||||
| 59,040 | American Tower Corp., Class A* | 1,599,984 | |||
| 105,600 | AT&T, Inc. | 2,586,144 | |||
| 192,440 | Cisco Systems, Inc.* | 3,294,573 | |||
| 89,310 | Crown Castle International Corp.* | 2,403,332 | |||
| 107,490 | Qualcomm, Inc. | 4,630,669 | |||
| 178,601 | Sprint Nextel Corp. | 4,172,119 | |||
| 18,686,821 | |||||
| Transportation - 1.9% | |||||
| 41,800 | Burlington Northern Santa Fe Corp. | 2,960,276 | |||
| 23,900 | FedEx Corp. | 2,471,021 | |||
| 5,431,297 | |||||
Total Common Stocks (Cost $229,593,643) | 274,636,154 | ||||
| Total Investments - 98.1% (Cost $229,593,643) | 274,636,154 | ||||
| Net Other Assets and Liabilities - 1.9% | 5,243,890 | ||||
| Total Net Assets - 100.0% | $ | 279,880,044 | |||
| * | Non-income producing security. |
Industry/Sector Concentration of Investments
as a Percentage of Net Assets*:
Communications | 18.1 | % | |
Consumer Cyclical | 9.0 | ||
Consumer Non-Cyclical | 21.1 | ||
Energy | 7.8 | ||
Financial | 22.9 | ||
Industrial | 5.6 | ||
Technology | 9.5 | ||
Utilities | 4.1 | ||
Net Other Assets and Liabilities | 1.9 | ||
Total | 100.0 | % | |
| * | Not part of the financial statements; therefore not covered by the Report of Independent Registered Public Accounting Firm. |
See Notes to Financial Statements.
F-15
Table of Contents
EQUITY INDEX FUND
PORTFOLIO OF INVESTMENTS • December 31, 2005
| Shares | Value (Note 2) | ||||
| COMMON STOCKS - 98.4% | |||||
Advertising - 0.2% | |||||
| 18,400 | Interpublic Group of Companies, Inc.* | $ | 177,560 | ||
| 7,700 | Omnicom Group, Inc. | 655,501 | |||
| 833,061 | |||||
Aerospace & Defense - 1.9% | |||||
| 34,538 | Boeing Co. | 2,425,949 | |||
| 8,600 | General Dynamics Corp. | 980,830 | |||
| 5,300 | Goodrich Corp. | 217,830 | |||
| 5,200 | L-3 Communications Holdings, Inc. | 386,620 | |||
| 15,282 | Lockheed Martin Corp. | 972,394 | |||
| 15,192 | Northrop Grumman Corp. | 913,191 | |||
| 19,100 | Raytheon Co. | 766,865 | |||
| 7,400 | Rockwell Collins, Inc. | 343,878 | |||
| 43,600 | United Technologies Corp. | 2,437,676 | |||
| 9,445,233 | |||||
Agriculture - 1.7% | |||||
| 89,200 | Altria Group, Inc. | 6,665,024 | |||
| 11,527 | Monsanto Co. | 893,688 | |||
| 3,700 | Reynolds American, Inc. | 352,721 | |||
| 7,000 | UST, Inc. | 285,810 | |||
| 8,197,243 | |||||
Airlines - 0.1% | |||||
| 29,818 | Southwest Airlines, Inc. | 489,910 | |||
| Apparel - 0.4% | |||||
| 16,200 | Coach, Inc.* | 540,108 | |||
| 5,000 | Jones Apparel Group, Inc. | 153,600 | |||
| 4,500 | Liz Claiborne, Inc. | 161,190 | |||
| 8,200 | NIKE, Inc., Class B | 711,678 | |||
| 2,300 | Reebok International, Ltd. | 133,929 | |||
| 3,800 | V.F. Corp. | 210,292 | |||
| 1,910,797 | |||||
Auto Manufacturers - 0.3% | |||||
| 79,481 | Ford Motor Co. | 613,593 | |||
| 24,200 | General Motors Corp. | 469,964 | |||
| 2,600 | Navistar International Corp.* | 74,412 | |||
| 7,230 | Paccar, Inc. | 500,533 | |||
| 1,658,502 | |||||
Auto Parts & Equipment - 0.2% | |||||
| 2,600 | Cooper Tire & Rubber Co. | 39,832 | |||
| 6,409 | Dana Corp. | 46,017 | |||
| 7,500 | Goodyear Tire & Rubber Co.* | 130,350 | |||
| 8,300 | Johnson Controls, Inc. | 605,153 | |||
| 5,436 | Visteon Corp.* | 34,029 | |||
| 855,381 | |||||
Banks - 6.2% | |||||
| 14,900 | Amsouth Bancorp | 390,529 | |||
| 171,942 | Bank of America Corp. | 7,935,123 | |||
| 32,900 | Bank of New York Co., Inc. | 1,047,865 | |||
| 23,200 | BB&T Corp. | 972,312 | |||
| 7,050 | Comerica, Inc. | 400,158 | |||
| 5,300 | Compass Bancshares, Inc. | 255,937 | |||
| 23,705 | Fifth Third Bancorp | 894,153 | |||
| 5,400 | First Horizon National Corp. | 207,576 | |||
| 9,749 | Huntington Bancshares, Inc. | 231,539 | |||
| 17,400 | KeyCorp | 572,982 | |||
| 3,400 | M & T Bank Corp. | 370,770 | |||
| 8,900 | Marshall & Ilsley Corp. | 383,056 | |||
| 17,900 | Mellon Financial Corp. | 613,075 | |||
| 23,600 | National City Corp. | 792,252 | |||
| 20,350 | North Fork Bancorp., Inc. | 556,776 | |||
| 7,900 | Northern Trust Corp. | 409,378 | |||
| 12,500 | PNC Bank Corp. | 772,875 | |||
| 19,555 | Regions Financial Corp. | 667,999 | |||
| 14,000 | State Street Corp. | 776,160 | |||
| 15,500 | Suntrust Banks, Inc. | 1,127,780 | |||
| 13,300 | Synovus Financial Corp. | 359,233 | |||
| 77,734 | U.S. Bancorp | 2,323,469 | |||
| 66,527 | Wachovia Corp. | 3,516,617 | |||
| 71,630 | Wells Fargo & Co. | 4,500,513 | |||
| 4,500 | Zions Bancorp. | 340,020 | |||
| 30,418,147 | |||||
Beverages - 2.1% | |||||
| 33,200 | Anheuser-Busch Companies, Inc. | 1,426,272 | |||
| 3,600 | Brown Forman Corp., Class B | 249,552 | |||
| 88,600 | Coca-Cola Co. | 3,571,466 | |||
| 12,900 | Coca-Cola Enterprises, Inc. | 247,293 | |||
| 8,400 | Constellation Brands, Inc.* | 220,332 | |||
| 2,400 | Molson Coors Brewing Co., Class A | 160,776 | |||
| 5,800 | Pepsi Bottling Group, Inc. | 165,938 | |||
| 71,010 | PepsiCo, Inc. | 4,195,271 | |||
| 10,236,900 | |||||
Biotechnology - 1.3% | |||||
| 52,808 | Amgen, Inc.* | 4,164,439 | |||
| 8,000 | Applied Biosystems Group - Applera Corp. | 212,480 | |||
| 14,485 | Biogen Idec, Inc.* | 656,605 | |||
| 4,700 | Chiron Corp.* | 208,962 | |||
| 11,100 | Genzyme Corp.* | 785,658 | |||
| 10,500 | Medimmune, Inc.* | 367,710 | |||
| 2,200 | Millipore Corp.* | 145,288 | |||
| 6,541,142 | |||||
Building Materials - 0.2% | |||||
| 7,800 | American Standard Companies, Inc. | 311,610 | |||
| 18,100 | Masco Corp. | 546,439 | |||
| 4,400 | Vulcan Materials Co. | 298,100 | |||
| 1,156,149 | |||||
See Notes to Financial Statements.
F-16
Table of Contents
EQUITY INDEX FUND
PORTFOLIO OF INVESTMENTS, Continued • December 31, 2005
| Shares | Value (Note 2) | ||||
| Chemicals - 1.5% | |||||
| 9,500 | Air Products & Chemicals, Inc. | $ | 562,305 | ||
| 3,100 | Ashland, Inc. | 179,490 | |||
| 4,700 | Avery Dennison Corp. | 259,769 | |||
| 41,277 | Dow Chemical Co. | 1,808,758 | |||
| 39,300 | Du Pont (E.I.) De Nemours and Co. | 1,670,250 | |||
| 3,500 | Eastman Chemical Co. | 180,565 | |||
| 7,900 | Ecolab, Inc. | 286,533 | |||
| 5,150 | Engelhard Corp. | 155,272 | |||
| 4,800 | Hercules, Inc.* | 54,240 | |||
| 3,400 | International Flavors & Fragrances, Inc. | 113,900 | |||
| 7,200 | PPG Industries, Inc. | 416,880 | |||
| 13,800 | Praxair, Inc. | 730,848 | |||
| 6,175 | Rohm & Haas Co. | 298,993 | |||
| 4,800 | Sherwin Williams Co. | 218,016 | |||
| 2,900 | Sigma Aldrich Corp. | 183,541 | |||
| 7,119,360 | |||||
| Commercial Services - 0.9% | |||||
| 6,200 | Apollo Group, Inc.* | 374,852 | |||
| 43,833 | Cendant Corp. | 756,119 | |||
| 5,900 | Convergys Corp.* | 93,515 | |||
| 5,500 | Equifax, Inc. | 209,110 | |||
| 14,000 | H&R Block, Inc. | 343,700 | |||
| 13,214 | McKesson Corp. | 681,710 | |||
| 10,600 | Moody’s Corp. | 651,052 | |||
| 14,250 | Paychex, Inc. | 543,210 | |||
| 9,300 | R. R. Donnelley & Sons Co. | 318,153 | |||
| 7,300 | Robert Half International, Inc. | 276,597 | |||
| 4,248,018 | |||||
| Computers - 3.9% | |||||
| 5,300 | Affiliated Computer Services, Class A* | 313,654 | |||
| 36,100 | Apple Computer, Inc.* | 2,595,229 | |||
| 7,900 | Computer Sciences Corp.* | 400,056 | |||
| 100,700 | Dell, Inc.* | 3,019,993 | |||
| 22,300 | Electronic Data Systems Corp. | 536,092 | |||
| 102,300 | EMC Corp.* | 1,393,326 | |||
| 11,260 | �� | Gateway, Inc.* | 28,263 | ||
| 122,598 | Hewlett-Packard Co. | 3,509,981 | |||
| 67,600 | International Business Machines Corp. | 5,556,720 | |||
| 5,000 | Lexmark International Group, Inc.* | 224,150 | |||
| 7,800 | NCR Corp.* | 264,732 | |||
| 15,900 | Network Appliance, Inc.* | 429,300 | |||
| 146,100 | Sun Microsystems, Inc.* | 612,159 | |||
| 14,600 | Unisys Corp.* | 85,118 | |||
| 18,968,773 | |||||
| Cosmetics & Personal Care - 2.3% | |||||
| 3,250 | Alberto-Culver Co. | 148,687 | |||
| 19,600 | Avon Products, Inc. | 559,580 | |||
| 22,200 | Colgate-Palmolive Co. | 1,217,670 | |||
| 20,040 | Kimberly-Clark Corp. | 1,195,386 | |||
| 143,478 | Procter & Gamble Co. | 8,304,507 | |||
| 11,425,830 | |||||
| Distribution & Wholesale - 0.1% | |||||
| 7,450 | Genuine Parts Co. | 327,204 | |||
| 3,300 | W.W. Grainger, Inc. | 234,630 | |||
| 561,834 | |||||
| Diversified Financial Services - 8.3% | |||||
| 53,200 | American Express Co. | 2,737,672 | |||
| 10,480 | Ameriprise Financial, Inc. | 429,680 | |||
| 4,852 | Bear Stearns Cos., Inc. | 560,552 | |||
| 12,837 | Capital One Financial Corp. | 1,109,117 | |||
| 44,100 | Charles Schwab Corp. | 646,947 | |||
| 8,600 | CIT Group, Inc. | 445,308 | |||
| 216,540 | Citigroup, Inc. | 10,508,686 | |||
| 25,498 | Countrywide Financial Corp. | 871,777 | |||
| 17,500 | E*TRADE Financial Corp.* | 365,050 | |||
| 41,400 | Fannie Mae | 2,020,734 | |||
| 3,600 | Federated Investors, Inc., Class B | 133,344 | |||
| 6,330 | Franklin Resources, Inc. | 595,083 | |||
| 29,600 | Freddie Mac | 1,934,360 | |||
| 19,300 | Goldman Sachs and Co. | 2,464,803 | |||
| 9,200 | Janus Capital Group, Inc. | 171,396 | |||
| 11,500 | Lehman Brothers Holdings, Inc. | 1,473,955 | |||
| 53,677 | MBNA Corp. | 1,457,867 | |||
| 39,300 | Merrill Lynch & Co., Inc. | 2,661,789 | |||
| 149,725 | Morgan (J.P.) & Co., Inc. | 5,942,585 | |||
| 46,134 | Morgan Stanley Dean Witter & Co. | 2,617,643 | |||
| 17,871 | SLM Corp. | 984,513 | |||
| 5,600 | T. Rowe Price Group, Inc. | 403,368 | |||
| 40,536,229 | |||||
| Electric - 3.1% | |||||
| 27,900 | AES Corp.* | 441,657 | |||
| 6,900 | Allegheny Energy, Inc.* | 218,385 | |||
| 8,700 | Ameren Corp. | 445,788 | |||
| 16,840 | American Electric Power, Inc. | 624,596 | |||
| 13,198 | CenterPoint Energy, Inc. | 169,594 | |||
| 8,543 | Cinergy Corp. | 362,736 | |||
| 9,400 | CMS Energy Corp.* | 136,394 | |||
| 10,500 | Consolidated Edison, Inc. | 486,465 | |||
| 7,650 | Constellation Energy Group, Inc. | 440,640 | |||
| 14,850 | Dominion Resources, Inc. | 1,146,420 | |||
| 7,600 | DTE Energy Co. | 328,244 | |||
| 39,634 | Duke Energy Corp. | 1,087,953 | |||
| 13,900 | Edison International | 606,179 | |||
| 8,900 | Entergy Corp. | 610,985 | |||
| 28,600 | Exelon Corp. | 1,519,804 | |||
| 14,100 | FirstEnergy Corp. | 690,759 | |||
| 16,900 | Florida Power & Light Group Capital, Inc. | 702,364 | |||
| 11,600 | NiSource, Inc. | 241,976 | |||
| 14,700 | PG&E Corp. | 545,664 | |||
| 4,200 | Pinnacle West Capital Corp. | 173,670 | |||
| 16,200 | PPL Corp. | 476,280 | |||
| 10,777 | Progress Energy, Inc. | 473,326 | |||
| 10,700 | Public Service Enterprise Group, Inc. | 695,179 | |||
| 31,700 | Southern Co. | 1,094,601 | |||
| 8,900 | TECO Energy, Inc. | 152,902 | |||
| 20,680 | TXU Corp. | 1,037,929 | |||
| 17,210 | Xcel Energy, Inc. | 317,697 | |||
| 15,228,187 | |||||
See Notes to Financial Statements.
F-17
Table of Contents
EQUITY INDEX FUND
PORTFOLIO OF INVESTMENTS, Continued • December 31, 2005
| Shares | Value (Note 2) | ||||
| Electrical Components & Equipment - 0.3% | |||||
| 7,300 | American Power Conversion Corp. | $ | 160,600 | ||
| 17,600 | Emerson Electric Co. | 1,314,720 | |||
| 6,125 | Molex, Inc. | 158,944 | |||
| 1,634,264 | |||||
| Electronics - 0.5% | |||||
| 17,624 | Agilent Technologies, Inc.* | 586,703 | |||
| 17,516 | Freescale Semiconductor, Class B* | 440,878 | |||
| 7,400 | Jabil Circuit, Inc.* | 274,466 | |||
| 5,175 | Parker-Hannifin Corp. | 341,343 | |||
| 5,500 | PerkinElmer, Inc. | 129,580 | |||
| 22,400 | Sanmina Corp.* | 95,424 | |||
| 39,100 | Solectron Corp.* | 143,106 | |||
| 10,716 | Symbol Technologies, Inc. | 137,379 | |||
| 3,500 | Tektronix, Inc. | 98,735 | |||
| 6,900 | Thermo Electron Corp.* | 207,897 | |||
| 4,700 | Waters Corp.* | 177,660 | |||
| 2,633,171 | |||||
| Engineering & Construction - 0.1% | |||||
| 3,700 | Fluor Corp. | 285,862 | |||
| Entertainment - 0.4% | |||||
| 14,400 | International Game Technology | 443,232 | |||
| 104,100 | News Corp. Inc., Class A | 1,618,755 | |||
| 2,061,987 | |||||
| Environmental Control - 0.2% | |||||
| 9,300 | Allied Waste Industries, Inc.* | 81,282 | |||
| 23,635 | Waste Management, Inc. | 717,322 | |||
| 798,604 | |||||
| Food - 1.5% | |||||
| 15,742 | Albertson’s, Inc. | 336,092 | |||
| 27,949 | Archer-Daniels-Midland Co. | 689,222 | |||
| 7,900 | Campbell Soup Co. | 235,183 | |||
| 22,200 | Conagra, Inc. | 450,216 | |||
| 15,200 | General Mills, Inc. | 749,664 | |||
| 14,300 | H.J. Heinz Co. | 482,196 | |||
| 7,800 | Hershey Co.,(The) | 430,950 | |||
| 11,000 | Kellogg Co. | 475,420 | |||
| 31,000 | Kroger Co.* | 585,280 | |||
| 5,700 | McCormick & Co., Inc. | 176,244 | |||
| 19,200 | Safeway, Inc. | 454,272 | |||
| 32,500 | Sara Lee Corp. | 614,250 | |||
| 5,800 | Supervalu, Inc. | 188,384 | |||
| 26,500 | Sysco Corp. | 822,825 | |||
| 10,700 | Tyson Foods, Inc., Class A | 182,970 | |||
| 7,700 | Wrigley (Wm.) Jr. Co. | 511,973 | |||
| 7,385,141 | |||||
| Forest Products & Paper - 0.4% | |||||
| 20,940 | International Paper Co. | 703,793 | |||
| 4,500 | Louisiana Pacific Corp. | 123,615 | |||
| 7,698 | MeadWestvaco Corp. | 215,775 | |||
| 4,800 | Temple Inland, Inc. | 215,280 | |||
| 10,400 | Weyerhaeuser Co. | 689,936 | |||
| 1,948,399 | |||||
| Gas - 0.2% | |||||
| 7,400 | KeySpan Energy Corp. | 264,106 | |||
| 1,900 | Nicor, Inc. | 74,689 | |||
| 1,600 | Peoples Energy Corp. | 56,112 | |||
| 11,013 | Sempra Energy | 493,823 | |||
| 888,730 | |||||
| Hand & Machine Tools - 0.1% | |||||
| 3,400 | Black & Decker Corp. | 295,664 | |||
| 2,500 | Snap-On, Inc. | 93,900 | |||
| 3,100 | Stanley Works | 148,924 | |||
| 538,488 | |||||
| Health Care - Products - 3.5% | |||||
| 2,300 | Bausch & Lomb, Inc. | 156,170 | |||
| 26,700 | Baxter International, Inc. | 1,005,255 | |||
| 10,800 | Becton, Dickinson & Co. | 648,864 | |||
| 10,625 | Biomet, Inc. | 388,556 | |||
| 25,200 | Boston Scientific Corp.* | 617,148 | |||
| 4,500 | C.R. Bard, Inc. | 296,640 | |||
| 5,300 | Fisher Scientific International, Inc.* | 327,858 | |||
| 14,200 | Guidant Corp. | 919,450 | |||
| 127,360 | Johnson & Johnson | 7,654,336 | |||
| 51,800 | Medtronic, Inc. | 2,982,126 | |||
| 5,900 | Patterson Cos., Inc.* | 197,060 | |||
| 15,700 | St. Jude Medical, Inc.* | 788,140 | |||
| 12,500 | Stryker Corp. | 555,375 | |||
| 10,570 | Zimmer Holdings, Inc.* | 712,841 | |||
| 17,249,819 | |||||
| Health Care - Services - 1.6% | |||||
| 12,296 | Aetna, Inc. | 1,159,636 | |||
| 7,000 | Coventry Health Care, Inc.* | 398,720 | |||
| 18,100 | HCA - The Healthcare Corporation | 914,050 | |||
| 10,500 | Health Management Associates, Inc., Class A | 230,580 | |||
| 7,000 | Humana, Inc.* | 380,310 | |||
| 5,700 | Laboratory Corp. of America Holdings* | 306,945 | |||
| 3,400 | Manor Care, Inc. | 135,218 | |||
| 7,100 | Quest Diagnostics, Inc. | 365,508 | |||
| 20,050 | Tenet Healthcare Corp.* | 153,583 | |||
| 58,400 | UnitedHealth Group, Inc. | 3,628,976 | |||
| 7,673,526 | |||||
| Home Builders - 0.4% | |||||
| 5,500 | Centex Corp. | 393,195 | |||
| 11,600 | D.R. Horton, Inc. | 414,468 | |||
| 3,400 | KB Home | 247,044 | |||
| 5,900 | Lennar Corp. | 360,018 | |||
| 9,200 | Pulte Corp. | 362,112 | |||
| 1,776,837 | |||||
See Notes to Financial Statements.
F-18
Table of Contents
EQUITY INDEX FUND
PORTFOLIO OF INVESTMENTS, Continued • December 31, 2005
| Shares | Value (Note 2) | ||||
Home Furnishings - 0.1% | |||||
| 3,400 | Maytag Corp. | $ | 63,988 | ||
| 2,900 | Whirlpool Corp. | 242,904 | |||
| 306,892 | |||||
Household Products & Wares - 0.2% | |||||
| 6,500 | Clorox Co. | 369,785 | |||
| 6,300 | Fortune Brands, Inc. | 491,526 | |||
| 11,733 | Newell Rubbermaid, Inc. | 279,011 | |||
| 1,140,322 | |||||
Insurance - 5.6% | |||||
| 13,800 | ACE, Ltd. | 737,472 | |||
| 21,400 | AFLAC, Inc. | 993,388 | |||
| 27,738 | Allstate Corp. | 1,499,794 | |||
| 4,500 | AMBAC Financial Group, Inc. | 346,770 | |||
| 111,079 | American International Group, Inc. | 7,578,920 | |||
| 13,650 | AON Corp. | 490,717 | |||
| 8,600 | Chubb Corp. | 839,790 | |||
| 5,400 | CIGNA Corp. | 603,180 | |||
| 7,468 | Cincinnati Financial Corp. | 333,670 | |||
| 16,100 | Genworth Financial, Inc., Class A | 556,738 | |||
| 12,900 | Hartford Financial Services Group, Inc. | 1,107,981 | |||
| 5,700 | Jefferson Pilot Corp. | 324,501 | |||
| 7,400 | Lincoln National Corp. | 392,422 | |||
| 5,800 | Loews Corp. | 550,130 | |||
| 23,300 | Marsh & McLennan Cos., Inc. | 740,008 | |||
| 5,750 | MBIA, Inc. | 345,920 | |||
| 32,400 | MetLife, Inc. | 1,587,600 | |||
| 3,900 | MGIC Investment Corp. | 256,698 | |||
| 12,000 | Principal Financial Group, Inc. | 569,160 | |||
| 8,500 | Progressive Corp. | 992,630 | |||
| 21,600 | Prudential Financial, Inc. | 1,580,904 | |||
| 5,300 | SAFECO Corp. | 299,450 | |||
| 29,590 | St. Paul Travelers Cos., Inc. | 1,321,785 | |||
| 4,400 | Torchmark Corp. | 244,640 | |||
| 12,718 | UnumProvident Corp. | 289,334 | |||
| 26,400 | Wellpoint, Inc.* | 2,106,456 | |||
| 7,500 | XL Capital, Ltd., Class A | 505,350 | |||
| 27,195,408 | |||||
Internet - 1.2% | |||||
| 13,100 | Amazon.com, Inc.* | 617,665 | |||
| 48,900 | eBay, Inc.* | 2,114,925 | |||
| 5,300 | Monster Worldwide, Inc.* | 216,346 | |||
| 46,218 | Symantec Corp.* | 808,815 | |||
| 54,000 | Yahoo!, Inc.* | 2,115,720 | |||
| 5,873,471 | |||||
Iron & Steel - 0.2% | |||||
| 3,651 | Allegheny Technologies, Inc. | 131,728 | |||
| 6,700 | Nucor Corp. | 447,024 | |||
| 4,820 | United States Steel Corp. | 231,697 | |||
| 810,449 | |||||
Leisure Time - 0.4% | |||||
| 4,100 | Brunswick Corp. | 166,706 | |||
| 18,500 | Carnival Corp. | 989,195 | |||
| 11,800 | Harley-Davidson, Inc. | 607,582 | |||
| 5,608 | Sabre Group Holdings, Inc. | 135,209 | |||
| 1,898,692 | |||||
Lodging - 0.4% | |||||
| 7,900 | Harrah’s Entertainment, Inc. | 563,191 | |||
| 14,000 | Hilton Hotels Corp. | 337,540 | |||
| 7,100 | Marriott International, Inc., Class A | 475,487 | |||
| 9,400 | Starwood Hotels & Resorts Worldwide, Inc. | 600,284 | |||
| 1,976,502 | |||||
Machinery - Construction & Mining - 0.3% | |||||
| 29,100 | Caterpillar, Inc. | 1,681,107 | |||
Machinery - Diversified - 0.3% | |||||
| 2,000 | Cummins Engine Co., Inc. | 179,460 | |||
| 10,300 | Deere & Co. | 701,533 | |||
| 7,700 | Rockwell International Corp. | 455,532 | |||
| 1,336,525 | |||||
Manufacturing - Miscellaneous - 5.4% | |||||
| 32,500 | 3M Co. | 2,518,750 | |||
| 3,900 | Cooper Industries, Ltd. | 284,700 | |||
| 10,200 | Danaher Corp. | 568,956 | |||
| 8,700 | Dover Corp. | 352,263 | |||
| 12,200 | Eastman Kodak Co. | 285,480 | |||
| 6,300 | Eaton Corp. | 422,667 | |||
| 452,300 | General Electric Co. | 15,853,115 | |||
| 36,075 | Honeywell International, Inc. | 1,343,794 | |||
| 8,800 | Illinois Tool Works, Inc. | 774,312 | |||
| 14,200 | Ingersoll-Rand Co. | 573,254 | |||
| 4,000 | ITT Industries, Inc. | 411,280 | |||
| 7,800 | Leggett & Platt, Inc. | 179,088 | |||
| 5,300 | Pall Corp. | 142,358 | |||
| 5,700 | Textron, Inc. | 438,786 | |||
| 86,137 | Tyco International, Ltd. | 2,485,914 | |||
| 26,634,717 | |||||
Media - 2.8% | |||||
| 23,100 | Clear Channel Communications, Inc. | 726,495 | |||
| 92,878 | Comcast Corp., Class A* | 2,411,113 | |||
| 2,500 | Dow Jones & Company, Inc. | 88,725 | |||
| 3,600 | E.W. Scripps Co. | 172,872 | |||
| 10,300 | Gannett Co., Inc. | 623,871 | |||
| 3,000 | Knight-Ridder, Inc. | 189,900 | |||
| 16,100 | McGraw-Hill Cos., Inc. | 831,243 | |||
| 1,800 | Meredith Corp. | 94,212 | |||
| 6,200 | New York Times Co., Class A* | 163,990 | |||
| 199,498 | Time Warner, Inc. | 3,479,245 | |||
| 11,187 | Tribune Co. | 338,519 | |||
| 9,500 | Univision Communications, Inc.* | 279,205 | |||
| 66,128 | Viacom, Inc., Class B | 2,155,773 | |||
| 82,329 | Walt Disney Co. | 1,973,426 | |||
| 13,528,589 | |||||
See Notes to Financial Statements.
F-19
Table of Contents
EQUITY INDEX FUND
PORTFOLIO OF INVESTMENTS, Continued • December 31, 2005
| Shares | Value (Note 2) | ||||
Mining - 0.6% | |||||
| 37,208 | Alcoa, Inc. | $ | 1,100,241 | ||
| 7,900 | Freeport-McMoRan Copper & Gold, Inc., Class B | 425,020 | |||
| 19,111 | Newmont Mining Corp. | 1,020,527 | |||
| 4,400 | Phelps Dodge Corp. | 633,028 | |||
| 3,178,816 | |||||
Office & Business Equipment - 0.2% | |||||
| 9,800 | Pitney Bowes, Inc. | 414,050 | |||
| 41,100 | Xerox Corp.* | 602,115 | |||
| 1,016,165 | |||||
Oil & Gas - 7.6% | |||||
| 3,500 | Amerada Hess Corp. | 443,870 | |||
| 10,179 | Anadarko Petroleum Corp. | 964,460 | |||
| 14,100 | Apache Corp. | 966,132 | |||
| 16,164 | Burlington Resources, Inc. | 1,393,337 | |||
| 96,053 | Chevron Texaco Corp. | 5,452,929 | |||
| 59,390 | ConocoPhillips | 3,455,310 | |||
| 19,000 | Devon Energy Corp. | 1,188,260 | |||
| 10,400 | EOG Resources, Inc. | 763,048 | |||
| 266,360 | Exxon Mobil Corp. | 14,961,441 | |||
| 4,981 | Kerr-McGee Corp. | 452,574 | |||
| 15,656 | Marathon Oil Corp. | 954,546 | |||
| 7,100 | Murphy Oil Corp. | 383,329 | |||
| 6,800 | Nabors Industries, Ltd.* | 515,100 | |||
| 5,900 | Noble Corp. | 416,186 | |||
| 17,200 | Occidental Petroleum Corp. | 1,373,936 | |||
| 4,700 | Rowan Cos., Inc.* | 167,508 | |||
| 5,800 | Sunoco, Inc. | 454,604 | |||
| 14,127 | Transocean Sedco Forex, Inc.* | 984,511 | |||
| 26,400 | Valero Energy Corp. | 1,362,240 | |||
| 15,500 | XTO Energy, Inc. | 681,070 | |||
| 37,334,391 | |||||
Oil & Gas Services - 1.3% | |||||
| 14,680 | Baker Hughes, Inc. | 892,250 | |||
| 13,800 | BJ Services Co. | 506,046 | |||
| 22,000 | Halliburton Co. | 1,363,120 | |||
| 7,500 | National Oilwell Varco, Inc.* | 470,250 | |||
| 25,200 | Schlumberger, Ltd. | 2,448,180 | |||
| 14,900 | Weatherford International, Ltd.* | 539,380 | |||
| 6,219,226 | |||||
Packaging & Containers - 0.1% | |||||
| 4,400 | Ball Corp. | 174,768 | |||
| 4,500 | Bemis Co. | 125,370 | |||
| 6,100 | Pactiv Corp.* | 134,200 | |||
| 3,508 | Sealed Air Corp.* | 197,044 | |||
| 631,382 | |||||
Pharmaceuticals - 5.8% | |||||
| 66,400 | Abbott Laboratories | 2,618,152 | |||
| 5,700 | Allergan, Inc. | 615,372 | |||
| 9,000 | AmerisourceBergen Corp. | 372,600 | |||
| 83,700 | Bristol-Myers Squibb Co. | 1,923,426 | |||
| 18,300 | Cardinal Health, Inc. | 1,258,125 | |||
| 19,300 | Caremax Rx, Inc.* | 999,547 | |||
| 6,300 | Express Scripts, Inc.* | 527,940 | |||
| 14,400 | Forest Laboratories, Inc.* | 585,792 | |||
| 19,600 | Gilead Sciences, Inc.* | 1,031,548 | |||
| 6,890 | Hospira, Inc.* | 294,754 | |||
| 10,266 | King Pharmaceuticals, Inc.* | 173,701 | |||
| 48,700 | Lilly (Eli) & Co. | 2,755,933 | |||
| 13,200 | Medco Health Solutions, Inc.* | 736,560 | |||
| 93,600 | Merck & Co., Inc. | 2,977,416 | |||
| 9,300 | Mylan Laboratories | 185,628 | |||
| 315,484 | Pfizer, Inc. | 7,357,087 | |||
| 63,200 | Schering-Plough Corp. | 1,317,720 | |||
| 4,300 | Watson Pharmaceuticals, Inc.* | 139,793 | |||
| 57,500 | Wyeth Corp. | 2,649,025 | |||
| 28,520,119 | |||||
Pipelines - 0.3% | |||||
| 12,800 | Dynegy, Inc.* | 61,952 | |||
| 28,130 | El Paso Energy Corp. | 342,061 | |||
| 4,500 | Kinder Morgan, Inc. | 413,775 | |||
| 24,500 | Williams Cos., Inc. | 567,665 | |||
| 1,385,453 | |||||
Real Estate - 0.7% | |||||
| 4,100 | Apartment Investment & Management Co., REIT | 155,267 | |||
| 9,100 | Archstone-Smith Trust, REIT | 381,199 | |||
| 17,400 | Equity Office Properties Trust, REIT | 527,742 | |||
| 12,300 | Equity Residential Properties Trust, REIT | 481,176 | |||
| 7,900 | Plum Creek Timber Co., Inc., REIT | 284,795 | |||
| 10,400 | ProLogis Trust, REIT | 485,888 | |||
| 3,600 | Public Storage, Inc. REIT | 243,792 | |||
| 8,000 | Simon Property Group, Inc., REIT | 613,040 | |||
| 5,100 | Vornado Realty Trust REIT | 425,697 | |||
| 3,598,596 | |||||
Retail - 5.9% | |||||
| 7,700 | AutoNation, Inc.* | 167,321 | |||
| 2,400 | AutoZone, Inc.* | 220,200 | |||
| 12,700 | Bed Bath & Beyond, Inc.* | 459,105 | |||
| 17,450 | Best Buy Co., Inc. | 758,726 | |||
| 4,800 | Big Lots, Inc.* | 57,648 | |||
| 6,700 | Circuit City Stores, Inc. | 151,353 | |||
| 20,212 | Costco Wholesale Corp. | 999,888 | |||
| 34,800 | CVS Corp. | 919,416 | |||
| 5,600 | Darden Restaurants, Inc. | 217,728 | |||
| 2,600 | Dillards, Inc., Class A | 64,532 | |||
| 13,487 | Dollar General Corp. | 257,197 | |||
| 6,600 | Family Dollar Stores, Inc. | 163,614 | |||
| 11,667 | Federated Department Stores, Inc. | 773,872 | |||
| 24,550 | Gap, Inc. | 433,062 | |||
| 90,897 | Home Depot, Inc. | 3,679,511 | |||
| 9,900 | J.C. Penney Co., Inc. | 550,440 | |||
| 14,800 | Kohls Corp.* | 719,280 | |||
| 14,900 | Limited Brands, Inc. | 333,015 | |||
| 33,500 | Lowes Cos., Inc. | 2,233,110 | |||
See Notes to Financial Statements.
F-20
Table of Contents
EQUITY INDEX FUND
PORTFOLIO OF INVESTMENTS, Continued • December 31, 2005
| Shares | Value (Note 2) | ||||
Retail (continued) | |||||
| 53,900 | McDonald’s Corp. | $ | 1,817,508 | ||
| 9,300 | Nordstrom, Inc. | 347,820 | |||
| 13,200 | Office Depot, Inc.* | 414,480 | |||
| 3,000 | OfficeMax, Inc. | 76,080 | |||
| 5,700 | RadioShack Corp. | 119,871 | |||
| 4,300 | Sears Holdings Corp.* | 496,779 | |||
| 31,300 | Staples, Inc. | 710,823 | |||
| 32,900 | Starbucks Corp.* | 987,329 | |||
| 37,600 | Target Corp. | 2,066,872 | |||
| 6,100 | Tiffany & Co. | 233,569 | |||
| 19,700 | TJX Cos., Inc. | 457,631 | |||
| 43,300 | Walgreen Co. | 1,916,458 | |||
| 106,900 | Wal-Mart Stores, Inc. | 5,002,920 | |||
| 5,000 | Wendy’s International, Inc. | 276,300 | |||
| 12,120 | Yum! Brands, Inc. | 568,186 | |||
| 28,651,644 | |||||
Savings & Loans - 0.6% | |||||
| 10,900 | Golden West Financial Corp. | 719,400 | |||
| 15,200 | Sovereign Bancorp, Inc. | 328,624 | |||
| 42,240 | Washington Mutual, Inc. | 1,837,440 | |||
| 2,885,464 | |||||
Semiconductors - 3.1% | |||||
| 17,300 | Advanced Micro Devices* | 529,380 | |||
| 15,500 | Altera Corp.* | 287,215 | |||
| 15,700 | Analog Devices, Inc. | 563,159 | |||
| 69,400 | Applied Materials, Inc. | 1,245,036 | |||
| 12,700 | Applied Micro Circuits Corp.* | 32,639 | |||
| 12,400 | Broadcom Corp.* | 584,660 | |||
| 258,000 | Intel Corp. | 6,439,680 | |||
| 8,500 | KLA-Tencor Corp.* | 419,305 | |||
| 13,000 | Linear Technology Corp. | 468,910 | |||
| 16,700 | LSI Logic Corp.* | 133,600 | |||
| 14,000 | Maxim Integrated Products, Inc. | 507,360 | |||
| 26,400 | Micron Technology, Inc.* | 351,384 | |||
| 14,700 | National Semiconductor Corp. | 381,906 | |||
| 5,700 | Novellus Systems, Inc.* | 137,484 | |||
| 7,300 | NVIDIA Corp.* | 266,888 | |||
| 7,800 | PMC-Sierra, Inc.* | 60,138 | |||
| 3,400 | QLogic Corp.* | 110,534 | |||
| 8,400 | Teradyne, Inc.* | 122,388 | |||
| 69,200 | Texas Instruments, Inc. | 2,219,244 | |||
| 14,900 | Xilinx, Inc. | 375,629 | |||
| 15,236,539 | |||||
Software - 4.0% | |||||
| 25,700 | Adobe Systems, Inc. | 949,872 | |||
| 9,900 | Autodesk, Inc. | 425,205 | |||
| 24,700 | Automatic Data Processing, Inc. | 1,133,483 | |||
| 9,200 | BMC Software, Inc.* | 188,508 | |||
| 7,500 | Citrix Systems, Inc.* | 215,850 | |||
| 19,650 | Computer Associates International, Inc. | 553,933 | |||
| 16,500 | Compuware Corp.* | 148,005 | |||
| 12,900 | Electronic Arts, Inc.* | 674,799 | |||
| 32,649 | First Data Corp. | 1,404,234 | |||
| 7,850 | Fiserv, Inc.* | 339,669 | |||
| 9,900 | IMS Health, Inc. | 246,708 | |||
| 7,600 | Intuit, Inc.* | 405,080 | |||
| 3,700 | Mercury Interactive Corp.* | 102,823 | |||
| 391,800 | Microsoft Corp. | 10,245,570 | |||
| 16,300 | Novell, Inc.* | 143,929 | |||
| 160,920 | Oracle Corp.* | 1,964,833 | |||
| 11,600 | Parametric Technology Corp.* | 70,760 | |||
| 22,600 | Siebel Systems, Inc. | 239,108 | |||
| 19,452,369 | |||||
Telecommunications - 5.6% | |||||
| 4,985 | ADC Telecommunications, Inc.* | 111,365 | |||
| 16,400 | Alltel Corp. | 1,034,840 | |||
| 6,900 | Andrew Corp.* | 74,037 | |||
| 167,182 | AT&T, Inc. | 4,094,287 | |||
| 17,831 | Avaya, Inc.* | 190,257 | |||
| 78,200 | BellSouth Corp. | 2,119,220 | |||
| 5,600 | CenturyTel, Inc. | 185,696 | |||
| 24,700 | Ciena Corp.* | 73,359 | |||
| 262,900 | Cisco Systems, Inc.* | 4,500,848 | |||
| 14,200 | Citizens Communications Co., Class B | 173,666 | |||
| 8,600 | Comverse Technology, Inc.* | 228,674 | |||
| 65,200 | Corning, Inc.* | 1,281,832 | |||
| 70,700 | JDS Uniphase Corp.* | 166,852 | |||
| 190,182 | Lucent Technologies, Inc.* | 505,884 | |||
| 106,535 | Motorola, Inc. | 2,406,626 | |||
| 70,400 | Qualcomm, Inc. | 3,032,832 | |||
| 66,063 | Qwest Communications International, Inc.* | 373,256 | |||
| 6,600 | Scientific Atlanta, Inc. | 284,262 | |||
| 126,410 | Sprint Nextel Corp. | 2,952,938 | |||
| 19,100 | Tellabs, Inc.* | 208,190 | |||
| 118,330 | Verizon Communications, Inc. | 3,564,100 | |||
| 27,563,021 | |||||
Textiles - 0.0% | |||||
| 5,900 | Cintas Corp. | 242,962 | |||
Toys, Games & Hobbies - 0.1% | |||||
| 7,550 | Hasbro, Inc. | 152,359 | |||
| 17,212 | Mattel, Inc. | 272,294 | |||
| 424,653 | |||||
Transportation - 1.7% | |||||
| 15,952 | Burlington Northern Santa Fe Corp. | 1,129,721 | |||
| 9,300 | CSX Corp. | 472,161 | |||
| 13,000 | FedEx Corp. | 1,344,070 | |||
| 17,400 | Norfolk Southern Corp. | 780,042 | |||
| 2,700 | Ryder System, Inc. | 110,754 | |||
| 11,400 | Union Pacific Corp. | 917,814 | |||
| 47,300 | United Parcel Service, Class B | 3,554,595 | |||
| 8,309,157 | |||||
Total Common Stocks (Cost $393,375,513) | 481,738,155 | ||||
See Notes to Financial Statements.
F-21
Table of Contents
EQUITY INDEX FUND
PORTFOLIO OF INVESTMENTS, Continued • December 31, 2005
| Par Value | Value (Note 2) | ||||
| U.S. GOVERNMENT AND AGENCY OBLIGATIONS - 1.5% | |||||
| Fannie Mae - 1.4% | |||||
| $6,650,000 | 3.25%, 01/03/06 (a) | $ | 6,648,199 | ||
| U.S. Treasury Bill - 0.1% | |||||
| 500,000 | 3.63%, 03/16/06 (a) | 496,218 | |||
Total U.S. Government and Agency Obligations (Cost $7,144,417) | 7,144,417 | ||||
| Total Investments - 99.9% (Cost $400,519,930) | 488,882,572 | ||||
| Net Other Assets and Liabilities - 0.1% | 704,521 | ||||
| Total Net Assets - 100.0% | $ | 489,587,093 | |||
| * | Non-income producing security. |
| (a) | Effective yield at time of purchase. |
| REIT | Real Estate Investment Trust |
Industry/Sector Concentration of Investments
as a Percentage of Net Assets*:
Basic Materials | 2.7 | % | |
Communications | 9.8 | ||
Consumer Cyclical | 8.8 | ||
Consumer Non-Cyclical | 20.9 | ||
Energy | 9.2 | ||
Financial | 21.4 | ||
Industrial | 11.1 | ||
Technology | 11.2 | ||
Utilities | 3.3 | ||
U.S. Government and Agency Obligations | 1.5 | ||
Net Other Assets and Liabilities | 0.1 | ||
Total | 100.0 | % | |
| * | Not part of the financial statements; therefore not covered by the Report of Independent Registered Public Accounting Firm. |
See Notes to Financial Statements.
F-22
Table of Contents
SELECT INVESTMENT GRADE INCOME FUND
PORTFOLIO OF INVESTMENTS • December 31, 2005
| Par Value | Moody’s Ratings (Unaudited) | Value (Note 2) | |||||
| U.S. GOVERNMENT AGENCY MORTGAGE-BACKED OBLIGATIONS (e) - 22.4% | |||||||
| Fannie Mae - 11.3% | |||||||
| $7,500,000 | 3.00%, 03/02/07 | NR | $ | 7,350,465 | |||
| 1,542,955 | 5.00%, 05/01/18 | NR | 1,528,665 | ||||
| 4,438,413 | 5.50%, 02/01/18 - 01/01/36 | NR | 4,420,710 | ||||
| 15,307,449 | 6.00%, 08/01/13 - 01/01/36 | NR | 15,488,416 | ||||
| 4,883,447 | 6.50%, 05/01/08 - 08/01/32 | NR | 5,024,583 | ||||
| 2,075,664 | 7.00%, 08/01/10 - 06/01/32 | NR | 2,165,074 | ||||
| 1,114,110 | 7.50%, 01/01/07 - 09/01/30 | NR | 1,166,241 | ||||
| 242,167 | 8.00%, 04/01/09 - 08/01/32 | NR | 258,487 | ||||
| 18,855 | 8.50%, 07/01/08 - 06/01/30 | NR | 19,779 | ||||
| 119,373 | 9.00%, 02/01/10 - 11/01/25 | NR | 129,902 | ||||
| 37,552,322 | |||||||
| Freddie Mac - 7.9% | |||||||
| 1,288,931 | 4.50%, 12/01/18 | NR | 1,257,125 | ||||
| 11,110,788 | 5.00%, 05/01/18 - 03/01/34 | NR | 10,914,020 | ||||
| 2,598,432 | 5.50%, 02/01/18 - 09/01/18 | NR | 2,615,478 | ||||
| 7,643,764 | 6.00%, 10/15/07 - 08/01/34 | NR | 7,718,286 | ||||
| 1,538,336 | 6.50%, 10/01/20 - 04/01/35 | NR | 1,584,108 | ||||
| 1,605,842 | 7.00%, 05/01/32 - 12/01/32 | NR | 1,672,412 | ||||
| 318,757 | 7.50%, 06/01/15 - 11/01/30 | NR | 334,772 | ||||
| 72,622 | 9.50%, 08/01/19 - 02/01/21 | NR | 79,350 | ||||
| 26,175,551 | |||||||
| Ginnie Mae - 3.2% | |||||||
| 2,647,901 | 5.50%, 07/15/33 | NR | 2,668,713 | ||||
| 6,131,666 | 6.00%, 01/15/32 - 08/20/34 | NR | 6,276,874 | ||||
| 873,620 | 6.50%, 09/15/08 - 11/15/32 | NR | 913,500 | ||||
| 681,855 | 7.00%, 03/15/12 - 12/15/31 | NR | 714,973 | ||||
| 160,885 | 7.50%, 11/15/30 - 10/15/32 | NR | 169,183 | ||||
| 10,743,243 | |||||||
Total U.S. Government Agency Mortgage-Backed Obligations (Cost $75,469,673) | 74,471,116 | ||||||
| U.S. GOVERNMENT AND AGENCY OBLIGATIONS - 31.3% | |||||||
| Fannie Mae - 9.1% | |||||||
| 5,250,000 | 3.25%, 01/03/06 (a) | NR | 5,248,578 | ||||
| 6,480,000 | 4.13%, 01/12/06 (a) | NR | 6,471,079 | ||||
| 5,000,000 | 4.50%, 06/01/10 | Aaa | 4,912,200 | ||||
| 625,000 | 5.38%, 11/15/11 | Aaa | 643,348 | ||||
| 8,133,253 | 5.50%, 02/01/34 - 06/01/34 | NR | 8,065,433 | ||||
| 3,021,114 | 6.00%, 02/01/17 - 11/01/32 | NR | 3,069,355 | ||||
| 925,056 | 6.50%, 05/01/16 - 10/01/29 | NR | 951,824 | ||||
| 671,150 | 7.00%, 08/01/32 | NR | 703,538 | ||||
| 39,512 | 7.50%, 03/01/28 - 09/01/30 | NR | 41,430 | ||||
| 174,893 | 8.00%, 10/01/29 - 05/01/30 | NR | 186,946 | ||||
| 30,293,731 | |||||||
| Federal Home Loan Bank - 0.5% | |||||||
| 1,800,000 | 4.00%, 12/30/11 | Aaa | 1,714,144 | ||||
| Freddie Mac - 13.1% | |||||||
| $3,305,000 | 4.25%, 02/28/07 | NR | 3,285,560 | ||||
| 3,800,000 | 4.38%, 01/25/10 | NR | 3,739,006 | ||||
| 3,800,000 | 4.50%, 08/22/07 | NR | 3,777,284 | ||||
| 14,513,979 | 5.00%, 01/01/19 - 08/01/35 | NR | 14,193,754 | ||||
| 15,327,276 | 5.50%, 11/01/33 - 09/01/35 | NR | 15,202,927 | ||||
| 3,183,516 | 6.00%, 05/01/35 - 06/01/35 | NR | 3,215,606 | ||||
| 331,258 | 6.50%, 12/01/31 | NR | 340,161 | ||||
| 43,754,298 | |||||||
| Ginnie Mae - 0.2% | |||||||
| 608,306 | 7.00%, 02/15/28 - 11/15/28 | NR | 639,298 | ||||
| 639,298 | |||||||
| Tennessee Valley Authority - 0.9% | |||||||
| 2,960,000 | 4.88%, 12/15/16 | Aaa | 3,049,152 | ||||
| U.S. Treasury Bond - 3.8% | |||||||
| 3,520,000 | 6.25%, 05/15/30 | NR | 4,371,675 | ||||
| 905,000 | 6.63%, 02/15/27 | NR | 1,148,148 | ||||
| 1,000,000 | 7.25%, 08/15/22 | NR | 1,302,266 | ||||
| 1,200,000 | 7.63%, 02/15/25 | NR | 1,653,469 | ||||
| 1,460,000 | 8.13%, 08/15/21 | NR | 2,025,807 | ||||
| 1,500,000 | 8.50%, 02/15/20 | NR | 2,104,218 | ||||
| 12,605,583 | |||||||
| U.S. Treasury Inflationary Index - 0.1% | |||||||
| 157,095 | 3.38%, 04/15/32 | NR | 204,359 | ||||
| U.S. Treasury Note - 3.6% | |||||||
| 3,310,000 | 3.38%, 02/28/07 | NR | 3,269,658 | ||||
| 1,750,000 | 4.00%, 02/15/15 | NR | 1,696,679 | ||||
| 485,000 | 4.13%, 05/15/15 | NR | 474,372 | ||||
| 395,000 | 4.25%, 08/15/15 | NR | 389,893 | ||||
| 3,795,000 | 5.25%, 11/15/28 | NR | 4,139,218 | ||||
| 2,020,000 | 5.50%, 02/15/08 | NR | 2,065,214 | ||||
| 12,035,034 | |||||||
Total U.S. Government and Agency Obligations (Cost $105,340,549) | 104,295,599 | ||||||
| CORPORATE NOTES AND BONDS - 27.4% | |||||||
| Aerospace & Defense - 0.0% | |||||||
| 117,989 | Systems 2001 Asset Trust (b) | ||||||
| 6.66%, 09/15/13 | Aaa | 125,558 | |||||
| Auto Manufacturers - 0.6% | |||||||
| 1,900,000 | DaimlerChrysler North America Holding Corp. | ||||||
| 6.50%, 11/15/13 | A3 | 1,989,391 | |||||
See Notes to Financial Statements.
F-23
Table of Contents
SELECT INVESTMENT GRADE INCOME FUND
PORTFOLIO OF INVESTMENTS, Continued • December 31, 2005
| Par Value | Moody’s Ratings (Unaudited) | Value (Note 2) | |||||
| Banks - 2.9% | |||||||
| $2,000,000 | PNC Funding Corp. | ||||||
| 5.75%, 08/01/06 | A2 | $ | 2,009,718 | ||||
| 1,800,000 | U.S. Bancorp, MTN | ||||||
| 5.10%, 07/15/07 | Aa2 | 1,807,108 | |||||
| 2,000,000 | Wells Fargo & Co. | ||||||
| 5.13%, 02/15/07 | Aa1 | 2,004,160 | |||||
| 3,800,000 | Zions Bancorporation | ||||||
| 5.65%, 05/15/14 | Baa1 | 3,894,134 | |||||
| 9,715,120 | |||||||
| Chemicals - 0.6% | |||||||
| 1,800,000 | Praxair, Inc. | ||||||
| 6.63%, 10/15/07 | A3 | 1,856,887 | |||||
| Diversified Financial Services - 6.4% | |||||||
| 3,700,000 | CIT Group, Inc., Global Note | ||||||
| 4.25%, 02/01/10 | A2 | 3,599,989 | |||||
| 133,676 | CVRD Finance Ltd., Series 2A (b)(c) | ||||||
| 4.80%, 10/15/07 | Aaa | 133,649 | |||||
| 1,185,000 | Ford Motor Credit Co. | ||||||
| 6.88%, 02/01/06 | Baa3 | 1,182,452 | |||||
| 1,800,000 | Household Finance Corp. | ||||||
| 4.75%, 07/15/13 | A1 | 1,739,128 | |||||
| 780,000 | International Lease Finance Corporation E-Capital Trust I (b)(c) | ||||||
| 5.90%, 12/21/65 | A3 | 783,065 | |||||
| 1,200,000 | J. Paul Getty Trust | ||||||
| 5.88%, 10/01/33 | Aaa | 1,253,443 | |||||
| 3,400,000 | JPMorgan Chase & Co. | ||||||
| 5.25%, 05/01/15 | A1 | 3,381,596 | |||||
| 3,600,000 | MBNA Corp., MTN | ||||||
| 4.63%, 08/03/09 | Baa1 | 3,571,870 | |||||
| 1,800,000 | Merrill Lynch & Co., Inc., MTN | ||||||
| 4.79%, 08/04/10 | Aa3 | 1,779,754 | |||||
| 3,835,000 | Morgan Stanley | ||||||
| 4.75%, 04/01/14 | A1 | 3,678,022 | |||||
| 21,102,968 | |||||||
| Electric - 0.6% | |||||||
| 1,800,000 | Pacific Gas & Electric Co. | ||||||
| 6.05%, 03/01/34 | Baa1 | 1,862,926 | |||||
| Food - 0.6% | |||||||
| 2,000,000 | Unilever Capital Corp. | ||||||
| 5.90%, 11/15/32 | A1 | 2,118,414 | |||||
| Health Care - Services - 0.5% | |||||||
| 3,000 | HCA, Inc. | ||||||
| 6.30%, 10/01/12 | Ba2 | 3,015 | |||||
| 1,800,000 | UnitedHealth Group, Inc. | ||||||
| 5.00%, 08/15/14 | A2 | 1,791,198 | |||||
| 1,794,213 | |||||||
| Lodging - 1.0% | |||||||
| $1,710,000 | Harrah’s Operating Co., Inc. | ||||||
| 5.38%, 12/15/13 | Baa3 | 1,668,567 | |||||
| 1,800,000 | Harrah’s Operating Co., Inc. | ||||||
| 5.75%, 10/01/17 | Baa3 | 1,751,933 | |||||
| 15,000 | MGM Mirage, Inc. | ||||||
| 7.25%, 10/15/06 | Ba2 | 15,206 | |||||
| 4,000 | MGM Mirage, Inc. | ||||||
| 8.50%, 09/15/10 | Ba2 | 4,335 | |||||
| 11,000 | Park Place Entertainment Corp. | ||||||
| 8.50%, 11/15/06 | Baa3 | 11,288 | |||||
| 3,451,329 | |||||||
| Media - 1.6% | |||||||
| 1,820,000 | Comcast Corp. | ||||||
| 4.95%, 06/15/16 | Baa2 | 1,716,891 | |||||
| 1,390,000 | Comcast Corp. | ||||||
| 10.63%, 07/15/12 | Baa3 | 1,725,679 | |||||
| 1,575,000 | Time Warner Cos., Inc. | ||||||
| 9.15%, 02/01/23 | Baa1 | 1,936,941 | |||||
| 5,379,511 | |||||||
| Metal Fabricate & Hardware - 0.6% | |||||||
| 1,900,000 | Precision Castparts Corp. | ||||||
| 5.60%, 12/15/13 | Baa3 | 1,923,144 | |||||
| Oil & Gas - 2.0% | |||||||
| 3,250,000 | Atmos Energy Corp. | ||||||
| 4.00%, 10/15/09 | Baa3 | 3,116,825 | |||||
| 1,700,834 | Caithness Coso Funding Corp. (b) | ||||||
| 5.49%, 06/15/19 | Baa3 | 1,687,636 | |||||
| 1,800,000 | Premcor Refining Group (The), Inc. | ||||||
| 6.75%, 02/01/11 | Baa3 | 1,906,628 | |||||
| 6,711,089 | |||||||
| Packaging & Containers - 1.1% | |||||||
| 3,800,000 | Sealed Air Corp. (b) | ||||||
| 5.63%, 07/15/13 | Baa3 | 3,772,093 | |||||
| Pharmaceuticals - 0.7% | |||||||
| 2,000,000 | Zeneca Wilmington | ||||||
| 7.00%, 11/15/23 | Aa2 | 2,428,556 | |||||
| Retail - 4.7% | |||||||
| 1,800,000 | Kroger Co. (The) | ||||||
| 4.95%, 01/15/15 | Baa2 | 1,687,590 | |||||
| 3,410,000 | Kroger Co. (The) | ||||||
| 6.20%, 06/15/12 | Baa2 | 3,493,518 | |||||
| 2,065,000 | May Department Stores Co. (The) | ||||||
| 6.65%, 07/15/24 | Baa1 | 2,171,143 | |||||
| 2,565,000 | May Department Stores Co. (The) | ||||||
| 7.63%, 08/15/13 | Baa1 | 2,876,547 | |||||
| 1,800,000 | Safeway, Inc. | ||||||
| 4.13%, 11/01/08 | Baa2 | 1,742,976 | |||||
See Notes to Financial Statements.
F-24
Table of Contents
SELECT INVESTMENT GRADE INCOME FUND
PORTFOLIO OF INVESTMENTS, Continued • December 31, 2005
| Par Value | Moody’s Ratings (Unaudited) | Value (Note 2) | |||||
| Retail (continued) | |||||||
| $1,800,000 | Safeway, Inc. | ||||||
| 5.80%, 08/15/12 | Baa2 | $ | 1,809,173 | ||||
| 1,800,000 | Safeway, Inc. | ||||||
| 7.25%, 02/01/31 | Baa2 | 1,942,340 | |||||
| 15,723,287 | |||||||
| Telecommunications - 2.3% | |||||||
| 1,900,000 | Nextel Communications, Inc., Series E | ||||||
| 6.88%, 10/31/13 | Baa2 | 1,982,107 | |||||
| 3,510,000 | SBC Communications, Inc. | ||||||
| 5.10%, 09/15/14 | A2 | 3,428,856 | |||||
| 1,900,000 | Sprint Capital Corp. | ||||||
| 6.88%, 11/15/28 | Baa2 | 2,076,111 | |||||
| 7,487,074 | |||||||
| Transportation - 1.2% | |||||||
| 3,600,000 | Union Pacific Corp. | ||||||
| 6.50%, 04/15/12 | Baa2 | 3,871,998 | |||||
Total Corporate Notes and Bonds (Cost $92,279,073) | 91,313,558 | ||||||
| ASSET-BACKED AND MORTGAGE-BACKED SECURITIES (e) - 17.6% | |||||||
| 6,846,442 | Bank of America Mortgage | ||||||
| Securities, Inc., Series 2003-8, | |||||||
| Class 1A12, CMO (d) | |||||||
| 5.50%, 11/25/33 | AAA | 6,724,490 | |||||
| 1,869,045 | Bank of America Mortgage Securities, | ||||||
| Series 2005-11, Class 1A2 | |||||||
| 5.75%, 12/25/35 | Aa1 | 1,872,121 | |||||
| 2,700,000 | Bear Stearns Commercial Mortgage | ||||||
| Securities, Inc., Series 2002-PBW1, | |||||||
| Class A2, CMO | |||||||
| 4.72%, 11/11/35 | Aaa | 2,646,636 | |||||
| 2,700,000 | Bear Stearns Mortgage Securities, Inc., | ||||||
| Series 1999-WF2, Class A2, CMO | |||||||
| 7.08%, 07/15/31 | Aaa | 2,857,292 | |||||
| 1,191,941 | Chase Mortgage Finance Corp., | ||||||
| Series 2005-S3, Class A6 | |||||||
| 5.50%, 11/25/35 | Aa1 | 1,188,037 | |||||
| 1,285,000 | Citibank Credit Card Issuance Trust, | ||||||
| Series 2000-A3 | |||||||
| 6.88%, 11/16/09 | Aaa | 1,332,500 | |||||
| 190,151 | Conseco Finance Corp., | ||||||
| Series 2000-6, Class A4 | |||||||
| 6.77%, 09/01/32 | Ba1 | 190,747 | |||||
| 2,435,647 | Countrywide Alternative Loan Trust, | ||||||
| Series 2005-1CB, Class 1A7 | |||||||
| 5.00%, 03/25/35 | Aaa | 2,405,998 | |||||
| 1,787,115 | Countrywide Home Loan Mortgage | ||||||
| Pass Through Trust, | |||||||
| Series 2005-J4, Class A2 | |||||||
| 5.50%, 11/25/35 | NR | 1,780,040 | |||||
| $2,658,465 | CS First Boston Mortgage | ||||||
| Securities Corp., Series 2005-10, | |||||||
| Class XA5 | |||||||
| 6.00%, 11/25/35 | Aa1 | 2,693,194 | |||||
| 2,700,000 | General Electric Capital Commercial | ||||||
| Mortgage Corp., Series 2002-1A, | |||||||
| Class A3, CMO | |||||||
| 6.27%, 12/10/35 | Aaa | 2,859,981 | |||||
| 55,232 | Green Tree Financial Corp., | ||||||
| Series 1999-3, Class A, CMO (d) | |||||||
| 6.16%, 02/01/31 | B | 55,511 | |||||
| 218,453 | Green Tree Home Improvement | ||||||
| Loan Trust, Series 1996-D, | |||||||
| Class H, CMO (d) | |||||||
| 8.30%, 09/15/27 | AAA | 218,702 | |||||
| 2,040,000 | GS Mortgage Securities Corp. II, | ||||||
| Series 1997-GL, Class A2D, CMO | |||||||
| 6.94%, 07/13/30 | Aaa | 2,082,433 | |||||
| 3,327,857 | GSR Mortgage Loan Trust, | ||||||
| Series 2005-8F, Class 3A4 (d) | |||||||
| 6.00%, 11/25/35 | AAA | 3,348,714 | |||||
| 2,700,000 | Morgan Stanley Dean Witter Capital I, | ||||||
| Series 2003-T0P9, Class A2, CMO (d) | |||||||
| 4.74%, 11/13/36 | AAA | 2,641,466 | |||||
| 2,100,000 | Morgan Stanley Dean Witter Captial I, | ||||||
| Series 2003-T11, Class A3, CMO | |||||||
| 4.85%, 06/13/41 | Aaa | 2,071,567 | |||||
| 3,700,000 | Petroleum Export, Ltd./Cayman SPV, | ||||||
| Series A2, Note (b) | |||||||
| 4.63%, 06/15/10 | Aaa | 3,663,555 | |||||
| 3,503,140 | Residential Accredit Loans, Inc., | ||||||
| Series 2003-QS19, Class AI | |||||||
| 5.75%, 10/25/33 | Aaa | 3,491,580 | |||||
| 3,817,760 | Residential Accredit Loans, Inc., | ||||||
| Series 2004-QS11, Class A3 (d) | |||||||
| 5.50%, 08/25/34 | AAA | 3,812,325 | |||||
| 3,217,171 | Residential Accredit Loans, Inc., | ||||||
| Series 2005-QS14, Class 3A3 (d) | |||||||
| 6.00%, 09/25/35 | AAA | 3,232,993 | |||||
| 3,966,075 | Residential Asset Securitization Trust, | ||||||
| Series 2005-A7, Class A3 (d) | |||||||
| 5.50%, 06/25/35 | AAA | 3,946,169 | |||||
| 3,408,594 | Wells Fargo Mortgage Backed | ||||||
| Securities Trust, Series 2005-5, | |||||||
| Class 1A1 | |||||||
| 5.00%, 05/25/20 | Aaa | 3,347,880 | |||||
Total Asset-Backed and Mortgage-Backed Securities (Cost $58,805,842) | 58,463,931 | ||||||
| FOREIGN BONDS (f) - 2.8% | |||||||
| 1,800,000 | Alberta Energy Co., Ltd. | ||||||
| 7.38%, 11/01/31 | Baa2 | 2,205,945 | |||||
| 3,465,000 | Kinder Morgan Finance Co. (b) | ||||||
| 5.70%, 01/05/16 | Baa2 | 3,494,955 | |||||
See Notes to Financial Statements.
F-25
Table of Contents
SELECT INVESTMENT GRADE INCOME FUND
PORTFOLIO OF INVESTMENTS, Continued • December 31, 2005
| Par Value | Moody’s Ratings (Unaudited) | Value (Note 2) | ||||||
| FOREIGN BONDS (f) (continued) | ||||||||
| $1,800,000 | Telecom Italia Capital SA | |||||||
| 5.25%, 10/01/15 | Baa2 | $ | 1,748,306 | |||||
| 1,950,000 | West Fraser Timber Co., Ltd. (b) | |||||||
| 5.20%, 10/15/14 | Baa2 | 1,826,342 | ||||||
Total Foreign Bonds (Cost $9,104,562) | 9,275,548 | |||||||
| Shares | ||||||||
| WARRANTS - 0.0% | ||||||||
| Computers - 0.0% | ||||||||
| 500,000 | International Business | |||||||
| Machines Corp., 07/10/06* | NR | 78,200 | ||||||
| Telecommunications - 0.0% | ||||||||
| 500,000 | BellSouth Telecom, Inc., 07/12/06* | NR | 38,300 | |||||
Total Warrants (Cost $16,563) | 116,500 | |||||||
| Total Investments - 101.5% (Cost $341,016,262) | 337,936,252 | |||||||
| Net Other Assets and Liabilities - (1.5)% | (5,075,276 | ) | ||||||
| Total Net Assets - 100.0% | $ | 332,860,976 | ||||||
| * | Non-income producing security. |
| (a) | Effective yield at time of purchase. |
| (b) | Security exempt from registration under Rule 144A of the Securities Act of 1933. This security may be resold, in transactions exempt from registration, to qualified institutional buyers. At December 31, 2005, these securities amounted to $15,486,854 or 4.7% of net assets. |
| (c) | Variable rate security. The rate shown reflects rate in effect at period end. |
| (d) | Standard & Poor’s (S&P) credit ratings are used in the absence of a rating by Moody’s Investors, Inc. |
| (e) | Pass Through Certificates. |
| (f) | U.S. currency denominated. |
| CMO | Collateralized Mortgage Obligation (Pay Through Certificate) |
| MTN | Medium Term Note |
| NR | Not Rated |
OTHER INFORMATION
The composition of ratings of both long-term and short-term debt holdings as a percentage of total value of investments in securities is as follows:
Moody’s Rating (Unaudited) | S&P Ratings (Unaudited) |
| ||||||
Aaa | 11.4 | % | AAA | 7.1 | % | |||
Aa | 4.1 | % | ||||||
A | 7.8 | % | ||||||
Baa | 19.1 | % | ||||||
Ba | 0.1 | % | ||||||
NR (Not Rated) | 50.4 | % | ||||||
| 92.9 | % | |||||||
Major Class Concentration of Investments
as a Percentage of Net Assets*:
U.S. Government And Agency Obligations | 31.3 | % | |
Corporate Notes And Bonds | 27.4 | ||
U.S. Government Agency | |||
Mortgage-Backed Obligation | 22.4 | ||
Asset-Backed And Mortgage-Backed Securities | 17.6 | ||
Foreign Bonds | 2.8 | ||
Net Other Assets and Liabilities | (1.5 | ) | |
Total | 100.0 | % | |
| * | Not part of the financial statements; therefore not covered by the Report of Independent Registered Public Accounting Firm. |
See Notes to Financial Statements.
F-26
Table of Contents
GOVERNMENT BOND FUND
PORTFOLIO OF INVESTMENTS • December 31, 2005
| Par Value | Moody’s Ratings (Unaudited) | Value (Note 2) | |||||
| U.S. GOVERNMENT AGENCY MORTGAGE-BACKED OBLIGATIONS (b) - 17.0% | |||||||
| Fannie Mae - 12.5% | |||||||
| $13,000,000 | 4.00%, 04/25/22 - 07/25/22 | NR | $ | 12,809,615 | |||
| 24,549 | 7.50%, 03/01/07 | NR | 25,009 | ||||
| 33,835 | 8.00%, 04/01/09 - 09/01/21 | NR | 36,040 | ||||
| 12,870,664 | |||||||
| Freddie Mac - 4.5% | |||||||
| 4,580,000 | 5.00%, 06/15/26 | NR | 4,530,797 | ||||
| 37,749 | 6.50%, 06/01/23 | NR | 39,246 | ||||
| 7,775 | 7.50%, 02/01/07 | NR | 7,886 | ||||
| 4,369 | 8.00%, 06/01/19 | NR | 4,441 | ||||
| 18,707 | 10.00%, 03/01/21 | NR | 20,553 | ||||
| 4,602,923 | |||||||
| Ginnie Mae - 0.0% | |||||||
| 5,804 | 6.50%, 06/15/09 | NR | 5,970 | ||||
| 22,147 | 7.00%, 06/15/12 | NR | 23,102 | ||||
| 29,072 | |||||||
Total U.S. Government Agency Mortgage-Backed Obligations (Cost $18,135,882) | 17,502,659 | ||||||
| U.S. GOVERNMENT AND AGENCY OBLIGATIONS - 71.6% | |||||||
| Fannie Mae - 14.0% | |||||||
| 1,700,000 | 3.25%, 01/03/06 (a) | NR | 1,699,540 | ||||
| 4,435,000 | 3.25%, 01/15/08 | Aaa | 4,308,350 | ||||
| 4,000,000 | 4.00%, 02/28/07 | Aaa | 3,965,340 | ||||
| 3,500,000 | 5.00%, 04/06/10 | Aaa | 3,496,965 | ||||
| 855,000 | 5.38%, 11/15/11 | Aaa | 880,100 | ||||
| 14,350,295 | |||||||
| Federal Home Loan Bank - 30.0% | |||||||
| 7,000,000 | 3.50%, 04/06/09 | Aaa | 6,718,250 | ||||
| 21,400,000 | 4.00%, 03/18/11 - 12/30/11 | Aaa | 20,431,330 | ||||
| 3,510,000 | 5.75%, 05/15/12 | Aaa | 3,696,002 | ||||
| 30,845,582 | |||||||
| Freddie Mac - 16.0% | |||||||
| 7,500,000 | 2.75%, 08/15/06 | Aaa | 7,414,372 | ||||
| 5,000,000 | 3.00%, 12/15/06 | Aaa | 4,917,080 | ||||
| 2,680,000 | 5.00%, 07/15/14 | Aaa | 2,716,110 | ||||
| 1,335,000 | 5.75%, 01/15/12 | Aaa | 1,400,698 | ||||
| 16,448,260 | |||||||
| U.S. Treasury Bond - 3.5% | |||||||
| 1,985,000 | 7.50%, 11/15/16 | NR | 2,493,347 | ||||
| 800,000 | 8.88%, 02/15/19 | NR | 1,137,625 | ||||
| 3,630,972 | |||||||
| U.S. Treasury Note - 8.1% | |||||||
| $8,500,000 | 4.00%, 02/15/14 | NR | 8,269,574 | ||||
Total U.S. Government and Agency Obligations (Cost $ 74,167,727) | 73,544,683 | ||||||
| ASSET-BACKED AND MORTGAGE-BACKED SECURITIES (b) - 10.4% | |||||||
| 863,201 | Bank of America Commercial | ||||||
| Mortgage, Inc., Series 2001-PB1, | |||||||
| Class A1, CMO | |||||||
| 4.91%, 05/11/35 | Aaa | 862,323 | |||||
| 10,000,000 | GE Capital Commercial Mortgage | ||||||
| Corp., Series 2003-C2, | |||||||
| Class A2, CMO | |||||||
| 4.17%, 07/10/37 | Aaa | 9,780,805 | |||||
Total Asset-Backed and Mortgage-Backed Securities (Cost $10,879,220) | 10,643,128 | ||||||
| Total Investments - 99.0% (Cost $103,182,829) | 101,690,470 | ||||||
| Net Other Assets and Liabilities - 1.0% | 1,078,240 | ||||||
| Total Net Assets - 100.0% | $ | 102,768,710 | |||||
| (a) | Effective yield at time of purchase. |
| (b) | Pass Through Certificates. |
OTHER INFORMATION
The composition of ratings of both long-term and short-term debt holdings as a percentage of total value of investments in securities is as follows:
Moody’s Rating (Unaudited) | |||
Aaa | 69.4 | % | |
NR (Not Rated) | 30.6 | % | |
| 100.0 | % | ||
Major Class Concentration of Investments
as a Percentage of Net Assets*:
U.S. Government And Agency Obligations | 71.6 | % | |
U.S. Government Agency | |||
Mortgage-Backed Obligation | 17.0 | ||
Asset-Backed And Mortgage-Backed Securities | 10.4 | ||
Net Other Assets and Liabilities | 1.0 | ||
Total | 100.0 | % | |
| * | Not part of the financial statements; therefore not covered by the Report of Independent Registered Public Accounting Firm. |
See Notes to Financial Statements.
F-27
Table of Contents
MONEY MARKET FUND
PORTFOLIO OF INVESTMENTS • December 31, 2005
| Par Value | Value (Note 2) | ||||
| U.S. GOVERNMENT AGENCY OBLIGATIONS - 41.6% | |||||
| Fannie Mae - 18.0% | |||||
| $25,000,000 | 3.25%, 01/03/06 (a) | $ | 24,993,229 | ||
| 5,000,000 | 4.00%, 08/08/06 | 5,000,000 | |||
| 10,000,000 | 4.20%, 05/09/06 (b) | 9,999,300 | |||
| 39,992,529 | |||||
| Federal Home Loan Bank - 15.1% | |||||
| 24,500,000 | 3.30%, 01/03/06 (a) | 24,493,262 | |||
| 2,000,000 | 3.75%, 01/25/06 (b) | 2,000,000 | |||
| 7,000,000 | 4.05%, 06/14/06 (b) | 6,999,482 | |||
| 33,492,744 | |||||
| Freddie Mac - 8.5% | |||||
| 4,000,000 | 3.70%, 06/30/06 | 4,000,000 | |||
| 14,950,000 | 4.00%, 01/03/06 (a) | 14,945,017 | |||
| 18,945,017 | |||||
Total U.S. Government Agency Obligations (Cost $92,430,290) | 92,430,290 | ||||
| CORPORATE NOTES - 17.0% | |||||
| Banking - Domestic - 6.3% | |||||
| 10,000,000 | Marshall & lsley Bank (b) | ||||
| 4.47%, 02/20/06 | 10,000,000 | ||||
| 4,000,000 | Wells Fargo & Co, MTN (b) | ||||
| 4.27%, 01/03/07 | 4,000,000 | ||||
| 14,000,000 | |||||
| Banking - Foreign Banks & Branches - 1.8% | |||||
| 4,000,000 | Nordea Bank AB, Note (b) (c) | ||||
| 4.34%, 01/11/07 | 4,000,000 | ||||
| Computers & Information - 4.5% | |||||
| 10,000,000 | International Business Machines Corp. (b) (c) | ||||
| 4.33%, 11/08/06 | 10,000,000 | ||||
| Heavy Machinery - 3.5% | |||||
| 7,864,000 | Caterpillar Financial Services Corp., Series F, MTN (b) | ||||
| 4.23%, 07/10/06 | 7,864,000 | ||||
| Securities Broker - 0.9% | |||||
| 2,000,000 | Merrill Lynch & Co., Inc., Series C, MTN (b) | ||||
| 4.35%, 12/15/06 | 2,000,000 | ||||
Total Corporate Notes (Cost $37,864,000) | 37,864,000 | ||||
| COMMERCIAL PAPER (a) - 22.6% | |||||
| Asset Backed - 17.2% | |||||
| 8,000,000 | Albis Capital Corp. (c) | ||||
| 4.32%, 01/19/06 | 7,981,760 | ||||
| 8,000,000 | Master Funding LLC (c) | ||||
| 4.25%, 02/07/06 | 7,964,111 | ||||
| $6,000,000 | Park Granada LLC (c) | ||||
| 4.33%, 01/06/06 | 5,995,670 | ||||
| 8,000,000 | Sheffield Receivables Corp. (c) | ||||
| 4.14%, 01/03/06 | 7,997,240 | ||||
| 8,400,000 | Three Pillars Funding Corp. (c) | ||||
| 4.31%, 01/09/06 | 8,390,949 | ||||
| 38,329,730 | |||||
| Diversified Financial Services - 1.8% | |||||
| 3,930,000 | Danske Corp. | ||||
| 4.26%, 02/06/06 | 3,912,793 | ||||
| Insurance - 3.6% | |||||
| 8,000,000 | Prudential Financial Corp. | ||||
| 4.25%, 01/06/06 | 7,994,334 | ||||
Total Commercial Paper (Cost $50,236,857) | 50,236,857 | ||||
| CERTIFICATES OF DEPOSIT - 18.5% | |||||
| 8,000,000 | BNP Paribas (NY Branch) | ||||
| 4.02%, 01/06/06 | 7,999,563 | ||||
| 5,000,000 | Credit Suisse First Boston (NY Branch) (b) | ||||
| 4.30%, 01/06/06 | 5,000,005 | ||||
| 7,000,000 | Deutsche Bank AG (NY Branch) | ||||
| 4.03%, 01/12/06 | 6,999,655 | ||||
| 7,000,000 | Dexia Credit Local SA (NY Branch) | ||||
| 4.28%, 01/30/06 | 7,000,029 | ||||
| 8,000,000 | Natexis Banques Populaires (NY Branch) | ||||
| 4.30%, 02/01/06 | 8,000,000 | ||||
| 6,000,000 | Wilmington Trust Co. | ||||
| 4.33%, 03/03/06 | 6,000,000 | ||||
Total Certificates of Deposit (Cost $40,999,252) | 40,999,252 | ||||
| Total Investments - 99.7% (Cost $ 221,530,399) | 221,530,399 | ||||
| Net Other Assets and Liabilities - 0.3% | 685,336 | ||||
| Total Net Assets - 100.0% | $ | 222,215,735 | |||
| (a) | Effective yield at time of purchase. |
| (b) | Variable rate security. The rate shown reflects rate in effect at period end. |
| (c) | Security exempt from registration under Rule 144A of the Securities Act of 1933. This security may be resold, in transactions exempt from registration, to qualified institutional buyers. At December 31, 2005, these securities amounted to $52,329,730 or 23.5% of net assets. These securities have been deemed to be liquid in accordance with procedures established by the Board of Trustees. |
| MTN | Medium Term Note |
See Notes to Financial Statements.
F-28
Table of Contents
MONEY MARKET FUND
PORTFOLIO OF INVESTMENTS, Continued • December 31, 2005
Major Class Concentration of Investments
as a Percentage of Net Assets*:
U.S. Government Agency Obligations | 41.6 | % | |
Commercial Paper | 22.6 | ||
Certificates Of Deposit | 18.5 | ||
Corporate Notes | 17.0 | ||
Net Other Assets and Liabilities | 0.3 | ||
Total | 100.0 | % | |
| * | Not part of the financial statements; therefore not covered by the Report of Independent Registered Public Accounting Firm. |
See Notes to Financial Statements.
F-29
Table of Contents
ALLMERICA INVESTMENT TRUST
STATEMENTS OF ASSETS AND LIABILITIES • December 31, 2005
Select Capital | Select Value Opportunity | |||||
ASSETS: | ||||||
Investments: | ||||||
Investments at cost | $ | 188,551,519 | $ | 226,311,243 | ||
Net unrealized appreciation (depreciation) | 81,096,973 | 37,177,095 | ||||
Total investments at value | 269,648,492 | 263,488,338 | ||||
Cash | 4,449,761 | 27,382,373 | ||||
Foreign currency* | — | — | ||||
Receivable for investments sold | 8,953 | — | ||||
Receivable for shares sold | — | — | ||||
Interest and dividend receivables | 287,512 | 246,464 | ||||
Dividend tax reclaim receivable | — | — | ||||
Total Assets | 274,394,718 | 291,117,175 | ||||
LIABILITIES: | ||||||
Payable for investments purchased | — | — | ||||
Management fee payable | 213,637 | 221,389 | ||||
Distribution fee payable | 35,125 | 37,594 | ||||
Trustees’ fees and expenses payable | 4,315 | 5,164 | ||||
Payable for shares repurchased | 265,161 | 98,274 | ||||
Accrued expenses and other payables | 53,451 | 56,594 | ||||
Total Liabilities. | 571,689 | 419,015 | ||||
NET ASSETS | $ | 273,823,029 | $ | 290,698,160 | ||
NET ASSETS consist of: | ||||||
Paid-in capital | $ | 188,331,668 | $ | 210,232,666 | ||
Undistributed (distribution in excess of) net investment income (loss) | — | 1,139,288 | ||||
Accumulated (distribution in excess of) net realized gain (loss) on investments sold, foreign currency transactions and futures contracts .. | 4,394,388 | 42,149,111 | ||||
Net unrealized appreciation (depreciation) of investments, assets and liabilities in foreign currency and futures contracts | 81,096,973 | 37,177,095 | ||||
TOTAL NET ASSETS | $ | 273,823,029 | $ | 290,698,160 | ||
Shares of beneficial interest outstanding (unlimited authorization, no par value | 134,805,807 | 153,977,543 | ||||
NET ASSET VALUE, | ||||||
Offering and redemption price per share (Net Assets/Shares Outstanding) | $ | 2.031 | $ | 1.888 | ||
| * | Cost $169,950 for Select International Equity Fund. |
See Notes to Financial Statements.
F-30
Table of Contents
ALLMERICA INVESTMENT TRUST
Select International Equity Fund | Select Growth Fund | Core Equity Fund | Equity Index Fund | Select Investment Fund | Government Bond Fund | Money Market Fund | ||||||||||||||||||
| $215,319,592 | $ | 368,143,226 | $ | 229,593,643 | $ | 400,519,930 | $ | 341,016,262 | $ | 103,182,829 | $ | 221,530,399 | ||||||||||||
| 59,726,112 | 56,915,191 | 45,042,511 | 88,362,642 | (3,080,010 | ) | (1,492,359 | ) | — | ||||||||||||||||
| 275,045,704 | 425,058,417 | 274,636,154 | 488,882,572 | 337,936,252 | 101,690,470 | 221,530,399 | ||||||||||||||||||
| 13,361,901 | 10,667,109 | 4,786,519 | 44,129 | 48,645 | 51,502 | 81,474 | ||||||||||||||||||
| 169,950 | — | — | — | — | — | — | ||||||||||||||||||
| — | 5,028,218 | 703,930 | — | 21,919 | 209 | — | ||||||||||||||||||
| — | — | — | 250,395 | — | 297,157 | 59,221 | ||||||||||||||||||
| 379,378 | 318,448 | 346,100 | 721,136 | 2,933,798 | 815,267 | 690,478 | ||||||||||||||||||
| 39,399 | — | — | — | — | — | — | ||||||||||||||||||
| 288,996,332 | 441,072,192 | 280,472,703 | 489,898,232 | 340,940,614 | 102,854,605 | 222,361,572 | ||||||||||||||||||
| — | — | — | — | 6,479,399 | — | — | ||||||||||||||||||
| 215,765 | 304,747 | 139,611 | 119,167 | 119,944 | 43,670 | 60,445 | ||||||||||||||||||
| 37,034 | 57,648 | 36,428 | 63,856 | 42,590 | 13,101 | 28,099 | ||||||||||||||||||
| 5,106 | 8,330 | 5,320 | 9,154 | 6,998 | 2,323 | 4,700 | ||||||||||||||||||
| 285,633 | 477,253 | 347,005 | 11,958 | 1,362,040 | 958 | — | ||||||||||||||||||
| 84,761 | 87,152 | 64,295 | 107,004 | 68,667 | 25,843 | 52,593 | ||||||||||||||||||
| 628,299 | 935,130 | 592,659 | 311,139 | 8,079,638 | 85,895 | 145,837 | ||||||||||||||||||
| $288,368,033 | $ | 440,137,062 | $ | 279,880,044 | $ | 489,587,093 | $ | 332,860,976 | $ | 102,768,710 | $ | 222,215,735 | ||||||||||||
| $315,882,333 | $ | 674,259,227 | $ | 454,659,488 | $ | 559,746,354 | $ | 340,957,201 | $ | 106,710,666 | $ | 222,217,603 | ||||||||||||
| 2,652,700 | — | 16,974 | 37,406 | (485,359 | ) | 23,840 | — | |||||||||||||||||
| (89,892,691) | (291,037,356 | ) | (219,838,926 | ) | (158,559,309 | ) | (4,530,856 | ) | (2,473,437 | ) | (1,868 | ) | ||||||||||||
| 59,725,691 | 56,915,191 | 45,042,508 | 88,362,642 | (3,080,010 | ) | (1,492,359 | ) | — | ||||||||||||||||
| $288,368,033 | $ | 440,137,062 | $ | 279,880,044 | $ | 489,587,093 | $ | 332,860,976 | $ | 102,768,710 | $ | 222,215,735 | ||||||||||||
| 208,020,546 | 265,987,253 | 155,290,655 | 178,567,106 | 315,265,754 | 96,820,130 | 222,215,735 | ||||||||||||||||||
| $1.386 | $ | 1.655 | $ | 1.802 | $ | 2.742 | $ | 1.056 | $ | 1.061 | $ | 1.000 | ||||||||||||
F-31
Table of Contents
ALLMERICA INVESTMENT TRUST
STATEMENTS OF OPERATIONS • For the Year Ended December 31, 2005
Select Capital | Select Value Opportunity | |||||||
INVESTMENT INCOME | ||||||||
Interest | $ | 207,914 | $ | 255,218 | ||||
Dividends | 1,314,639 | 3,246,152 | ||||||
Special Dividends | 165,000 | 1,033,047 | ||||||
Securities lending income | 98,950 | 68,171 | ||||||
Less net foreign taxes withheld | (11,719 | ) | (50,457 | ) | ||||
Total investment income | 1,774,784 | 4,552,131 | ||||||
EXPENSES | ||||||||
Management fees | 2,551,604 | 2,744,745 | ||||||
Distribution fees | 412,831 | 463,083 | ||||||
Custodian and Fund accounting fees | 112,062 | 109,919 | ||||||
Legal fees | 15,956 | 18,312 | ||||||
Audit fees | 37,352 | 40,984 | ||||||
Trustees’ fees and expenses | 22,065 | 24,689 | ||||||
Miscellaneous | 8,865 | 12,090 | ||||||
Total expenses before waivers | 3,160,735 | 3,413,822 | ||||||
Less expense waivers | — | — | ||||||
Total expenses net of expense waivers | 3,160,735 | 3,413,822 | ||||||
NET INVESTMENT INCOME (LOSS) | (1,385,951 | ) | 1,138,309 | |||||
NET REALIZED AND UNREALIZED GAIN (LOSS) ON INVESTMENTS: | ||||||||
Net realized gain (loss) on investments sold | 40,233,224 | 42,823,905 | ||||||
Net realized gain (loss) on futures contracts | — | — | ||||||
Net realized gain (loss) on foreign currency transactions | (5,871 | ) | 1,078 | |||||
Net change in unrealized appreciation (depreciation) of investments | (2,141,414 | ) | (24,209,649 | ) | ||||
Net change in unrealized appreciation (depreciation) of assets and liabilities in foreign currency | 1,383 | — | ||||||
Net change in unrealized appreciation (depreciation) of futures contracts | — | — | ||||||
NET GAIN (LOSS) ON INVESTMENTS | 38,087,322 | 18,615,334 | ||||||
NET INCREASE IN NET ASSETS RESULTING FROM OPERATIONS | $ | 36,701,371 | $ | 19,753,643 | ||||
See Notes to Financial Statements.
F-32
Table of Contents
ALLMERICA INVESTMENT TRUST
Select International Equity Fund | Select Growth Fund | Core Equity Fund | Equity Index Fund | Select Investment Fund | Government Bond Fund | Money Market Fund | ||||||||||||||||||
| $124,203 | $ | 265,488 | $ | 45,646 | $ | 143,359 | $ | 17,131,138 | $ | 4,487,398 | $ | 7,994,419 | ||||||||||||
| 9,120,705 | 3,748,498 | 4,682,555 | 9,737,399 | — | — | — | ||||||||||||||||||
| — | — | — | — | — | — | — | ||||||||||||||||||
| 167,825 | 40,302 | 17,799 | 48,480 | 10,261 | 3,170 | — | ||||||||||||||||||
| (775,937) | (41,280 | ) | (494 | ) | — | — | — | — | ||||||||||||||||
| 8,636,796 | 4,013,008 | 4,745,506 | 9,929,238 | 17,141,399 | 4,490,568 | 7,994,419 | ||||||||||||||||||
| 2,773,954 | 3,859,129 | 1,766,163 | 1,474,419 | 1,534,985 | 572,969 | 799,991 | ||||||||||||||||||
| 449,879 | 700,476 | 448,931 | 794,761 | 547,639 | 171,969 | 375,164 | ||||||||||||||||||
| 448,808 | 177,753 | 141,344 | 338,810 | 145,698 | 65,753 | 77,234 | ||||||||||||||||||
| 17,596 | 26,181 | 16,987 | 30,619 | 20,624 | 6,522 | 15,967 | ||||||||||||||||||
| 39,982 | 59,867 | 39,513 | 68,338 | 48,097 | 17,414 | 34,314 | ||||||||||||||||||
| 23,923 | 37,378 | 24,060 | 42,945 | 29,860 | 9,037 | 20,142 | ||||||||||||||||||
| 22,849 | 18,116 | 15,914 | 25,424 | 9,606 | 1,893 | 46,349 | ||||||||||||||||||
| 3,776,991 | 4,878,900 | 2,452,912 | 2,775,316 | 2,336,509 | 845,557 | 1,369,161 | ||||||||||||||||||
| — | (163,473 | ) | — | — | — | — | — | |||||||||||||||||
| 3,776,991 | 4,715,427 | 2,452,912 | 2,775,316 | 2,336,509 | 845,557 | 1,369,161 | ||||||||||||||||||
| 4,859,805 | (702,419 | ) | 2,292,594 | 7,153,922 | 14,804,890 | 3,645,011 | 6,625,258 | |||||||||||||||||
| 25,194,445 | 47,687,328 | 16,187,719 | 565,060 | (42,163 | ) | (291,847 | ) | (1,868 | ) | |||||||||||||||
| 796,813 | (9,420 | ) | — | 39,411 | — | — | — | |||||||||||||||||
| (2,197,684) | 419 | (3 | ) | — | — | — | — | |||||||||||||||||
| 5,406,648 | (16,636,225 | ) | (2,591,391 | ) | 13,313,498 | (8,164,069 | ) | (1,607,735 | ) | — | ||||||||||||||
| 66,263 | — | (3 | ) | — | — | — | — | |||||||||||||||||
| 10,187 | — | — | (6,619 | ) | — | — | — | |||||||||||||||||
| 29,276,672 | 31,042,102 | 13,596,322 | 13,911,350 | (8,206,232 | ) | (1,899,582 | ) | (1,868 | ) | |||||||||||||||
| $34,136,477 | $ | 30,339,683 | $ | 15,888,916 | $ | 21,065,272 | $ | 6,598,658 | $ | 1,745,429 | $ | 6,623,390 | ||||||||||||
F-33
Table of Contents
ALLMERICA INVESTMENT TRUST
STATEMENTS OF CHANGES IN NET ASSETS
Select Capital Appeciation Fund | ||||||||
| Years Ended December 31, | ||||||||
| 2005 | 2004 | |||||||
NET ASSETS at beginning of year | $ | 299,355,071 | $ | 296,203,932 | ||||
Increase (decrease) in net assets resulting from operations: | ||||||||
Net investment income (loss) | (1,385,951 | ) | (2,024,733 | ) | ||||
Net realized gain on investments sold, foreign currency transactions, and futures contracts | 40,227,353 | 39,823,753 | ||||||
Net change in unrealized appreciation (depreciation) of investments, assets and liabilities in foreign currency, and futures contracts | (2,140,031 | ) | 11,697,850 | |||||
Net increase in net assets resulting from operations | 36,701,371 | 49,496,870 | ||||||
Distributions to shareholders from: | ||||||||
Net investment income | — | — | ||||||
Net realized gain on investments | (66,125,528 | ) | (25,213,313 | ) | ||||
Total distributions | (66,125,528 | ) | (25,213,313 | ) | ||||
Capital share transactions: | ||||||||
Net proceeds from sales of shares | 1,523,762 | 18,475,189 | ||||||
Issued to shareholders in reinvestment of distributions | 66,125,528 | 25,213,313 | ||||||
Cost of shares repurchased | (63,757,175 | ) | (64,820,920 | ) | ||||
Net increase (decrease) from capital share transactions | 3,892,115 | (21,132,418 | ) | |||||
Total increase (decrease) in net assets | (25,532,042 | ) | 3,151,139 | |||||
NET ASSETS at end of year | $ | 273,823,029 | $ | 299,355,071 | ||||
Undistributed (distribution in excess of) net investment income (loss) | $ | — | $ | (1,462 | ) | |||
OTHER INFORMATION: | ||||||||
Share transactions: | ||||||||
Sold | 668,774 | 8,386,260 | ||||||
Issued to shareholders in reinvestment of distributions | 31,789,823 | 13,118,269 | ||||||
Repurchased | (28,593,655 | ) | (29,966,652 | ) | ||||
Net increase (decrease) in shares outstanding | 3,864,942 | (8,462,123 | ) | |||||
See Notes to Financial Statements.
F-34
Table of Contents
ALLMERICA INVESTMENT TRUST
Select Value Opportunity Fund | Select International Equity Fund | Select Growth Fund | Core Equity Fund | ||||||||||||||||||||||||||
| Years Ended December 31, | Years Ended December31, | Years Ended December 31, | Years Ended December 31, | ||||||||||||||||||||||||||
| 2005 | 2004 | 2005 | 2004 | 2005 | 2004 | 2005 | 2004 | ||||||||||||||||||||||
| $345,750,311 | $ | 380,800,995 | $ | 333,493,513 | $ | 380,653,182 | $ | 528,558,184 | $ | 625,728,520 | $ | 337,127,194 | $ | 400,016,657 | |||||||||||||||
| 1,138,309 | 76,603 | 4,859,805 | 4,551,152 | (702,419 | ) | 1,149,335 | 2,292,594 | 3,624,671 | |||||||||||||||||||||
| 42,824,983 | 70,248,308 | 23,793,574 | 17,603,261 | 47,678,327 | 55,845,736 | 16,187,716 | 14,247,089 | ||||||||||||||||||||||
| (24,209,649 | ) | (9,880,090 | ) | 5,483,098 | 22,365,117 | (16,636,225 | ) | (19,966,323 | ) | (2,591,394 | ) | 15,552,965 | |||||||||||||||||
| 19,753,643 | 60,444,821 | 34,136,477 | 44,519,530 | 30,339,683 | 37,028,748 | 15,888,916 | 33,424,725 | ||||||||||||||||||||||
| (3,016 | ) | (195,555 | ) | (4,270,657 | ) | (4,285,464 | ) | (1,126,019 | ) | — | (2,297,671 | ) | (3,653,589 | ) | |||||||||||||||
| (68,510,770 | ) | (22,153,292 | ) | — | — | — | — | — | — | ||||||||||||||||||||
| (68,513,786 | ) | (22,348,847 | ) | (4,270,657 | ) | (4,285,464 | ) | (1,126,019 | ) | — | (2,297,671 | ) | (3,653,589 | ) | |||||||||||||||
| 2,459,856 | 4,975,103 | 12,782,855 | 22,515,775 | 417,269 | 80,506 | 711,582 | 145,927 | ||||||||||||||||||||||
| 68,513,786 | 22,348,847 | 4,270,657 | 4,285,464 | 1,126,019 | — | 2,297,671 | 3,653,589 | ||||||||||||||||||||||
| (77,265,650 | ) | (100,470,608 | ) | (92,044,812 | ) | (114,194,974 | ) | (119,178,074 | ) | (134,279,590 | ) | (73,847,648 | ) | (96,460,115 | ) | ||||||||||||||
| (6,292,008 | ) | (73,146,658 | ) | (74,991,300 | ) | (87,393,735 | ) | (117,634,786 | ) | (134,199,084 | ) | (70,838,395 | ) | (92,660,599 | ) | ||||||||||||||
| (55,052,151 | ) | (35,050,684 | ) | (45,125,480 | ) | (47,159,669 | ) | (88,421,122 | ) | (97,170,336 | ) | (57,247,150 | ) | (62,889,463 | ) | ||||||||||||||
| $290,698,160 | $ | 345,750,311 | $ | 288,368,033 | $ | 333,493,513 | $ | 440,137,062 | $ | 528,558,184 | $ | 279,880,044 | $ | 337,127,194 | |||||||||||||||
| $1,139,288 | $ | 2,917 | $ | 2,652,700 | $ | 4,188,258 | $ | — | $ | 1,148,373 | $ | 16,974 | $ | 45,241 | |||||||||||||||
| 1,126,291 | 2,354,194 | 9,988,589 | 19,986,173 | 271,836 | 55,897 | 415,449 | 92,981 | ||||||||||||||||||||||
| 37,852,920 | 11,881,364 | 3,287,650 | 3,993,908 | 712,219 | — | 1,333,011 | 2,230,774 | ||||||||||||||||||||||
| (37,294,183 | ) | (47,740,940 | ) | (71,927,804 | ) | (100,846,151 | ) | (77,199,530 | ) | (92,875,643 | ) | (43,206,103 | ) | (60,667,374 | ) | ||||||||||||||
| 1,685,028 | (33,505,382 | ) | (58,651,565 | ) | (76,866,070 | ) | (76,215,475 | ) | (92,819,746 | ) | (41,457,643 | ) | (58,343,619 | ) | |||||||||||||||
F-35
Table of Contents
ALLMERICA INVESTMENT TRUST
STATEMENTS OF CHANGES IN NET ASSETS
Equity Index Fund | ||||||||
| Years Ended December 31, | ||||||||
| 2005 | 2004 | |||||||
NET ASSETS at beginning of year | $ | 595,036,614 | $ | 666,454,873 | ||||
Increase (decrease) in net assets resulting from operations: | ||||||||
Net investment income | 7,153,922 | 9,352,455 | ||||||
Net realized gain (loss) on investments sold, foreign currency transactions, and futures contracts | 604,471 | (5,491,515 | ) | |||||
Net change in unrealized appreciation (depreciation) of investments, assets and liabilities in foreign currency, and futures contracts | 13,306,879 | 54,384,265 | ||||||
Net increase in net assets resulting from operations | 21,065,272 | 58,245,205 | ||||||
Distributions to shareholders from: | ||||||||
Net investment income | (7,221,232 | ) | (9,477,338 | ) | ||||
Net realized gain on investments | — | — | ||||||
Return of capital | — | — | ||||||
Total distributions | (7,221,232 | ) | (9,477,338 | ) | ||||
Capital share transactions: | ||||||||
Net proceeds from sales of shares | 15,944,208 | 9,645,957 | ||||||
Issued to shareholders in reinvestment of distributions | 7,221,232 | 9,477,338 | ||||||
Cost of shares repurchased | (142,459,001 | ) | (139,309,421 | ) | ||||
Net decrease from capital share transactions | (119,293,561 | ) | (120,186,126 | ) | ||||
Total decrease in net assets | (105,449,521 | ) | (71,418,259 | ) | ||||
NET ASSETS at end of year | $ | 489,587,093 | $ | 595,036,614 | ||||
Undistributed (distribution in excess of) net investment income (loss) | $ | 37,406 | $ | 42,335 | ||||
OTHER INFORMATION: | ||||||||
Share transactions: | ||||||||
Sold | 6,111,008 | 3,877,093 | ||||||
Issued to shareholders in reinvestment of distributions | 2,707,229 | 3,711,188 | ||||||
Repurchased | (53,625,297 | ) | (55,860,548 | ) | ||||
Net decrease in shares outstanding | (44,807,060 | ) | (48,272,267 | ) | ||||
See Notes to Financial Statements.
F-36
Table of Contents
ALLMERICA INVESTMENT TRUST
Select Investment Grade Income Fund | Government Bond Fund | Money Market Fund | ||||||||||||||||||
| Years Ended December 31, | Years Ended December 31, | Years Ended December 31, | ||||||||||||||||||
| 2005 | 2004 | 2005 | 2004 | 2005 | 2004 | |||||||||||||||
| $402,218,814 | $ | 530,198,773 | $ | 128,860,335 | $ | 200,158,460 | $ | 264,678,567 | $ | 377,154,527 | ||||||||||
| 14,804,890 | 17,654,294 | 3,645,011 | 4,663,724 | 6,625,258 | 2,804,306 | |||||||||||||||
| (42,163) | 2,735,617 | (291,847 | ) | 884,027 | (1,868 | ) | 4,093 | |||||||||||||
| (8,164,069) | (2,872,175 | ) | (1,607,735 | ) | (2,220,513 | ) | — | — | ||||||||||||
| 6,598,658 | 17,517,736 | 1,745,429 | 3,327,238 | 6,623,390 | 2,808,399 | |||||||||||||||
| (17,062,085) | (24,167,490 | ) | (3,996,071 | ) | (5,646,130 | ) | (6,646,008 | ) | (2,804,306 | ) | ||||||||||
| — | (6,247,516 | ) | — | (273,498 | ) | — | — | |||||||||||||
| — | — | — | — | (56,233 | ) | — | ||||||||||||||
| (17,062,085) | (30,415,006 | ) | (3,996,071 | ) | (5,919,628 | ) | (6,702,241 | ) | (2,804,306 | ) | ||||||||||
| 13,661,274 | 12,499,850 | 3,171,313 | 1,021,637 | 109,105,489 | 105,887,642 | |||||||||||||||
| 17,062,085 | 30,415,006 | 3,996,071 | 5,919,628 | 6,702,241 | 2,804,306 | |||||||||||||||
| (89,617,770) | (157,997,545 | ) | (31,008,367 | ) | (75,647,000 | ) | (158,191,711 | ) | (221,172,001 | ) | ||||||||||
| (58,894,411) | (115,082,689 | ) | (23,840,983 | ) | (68,705,735 | ) | (42,383,981 | ) | (112,480,053 | ) | ||||||||||
| (69,357,838) | (127,979,959 | ) | (26,091,625 | ) | (71,298,125 | ) | (42,462,832 | ) | (112,475,960 | ) | ||||||||||
| $332,860,976 | $ | 402,218,814 | $ | 102,768,710 | $ | 128,860,335 | $ | 222,215,735 | $ | 264,678,567 | ||||||||||
| $(485,359) | $ | (1,229,225 | ) | $ | 23,840 | $ | (564,437 | ) | $ | — | $ | 20,750 | ||||||||
| 12,685,160 | 11,297,435 | 2,946,864 | 921,521 | 109,105,487 | 105,887,642 | |||||||||||||||
| 15,973,918 | 27,670,352 | 3,735,449 | 5,415,831 | 6,702,241 | 2,804,306 | |||||||||||||||
| (83,108,605) | (142,900,172 | ) | (28,811,809 | ) | (68,746,934 | ) | (158,191,711 | ) | (221,172,001 | ) | ||||||||||
| (54,449,527) | (103,932,385 | ) | (22,129,496 | ) | (62,409,582 | ) | (42,383,983 | ) | (112,480,053 | ) | ||||||||||
F-37
Table of Contents
ALLMERICA INVESTMENT TRUST
FINANCIAL HIGHLIGHTS - For a Share Outstanding Throughout Each Period
| Income from Investment Operations | Less Distributions | Net Increase (Decrease) in Net Asset Value | |||||||||||||||||||||||||||||
Year Ended December 31, | Net Asset | Net Investment Income (Loss)(2) | Net Realized and Unrealized Gain (Loss) on Investments | Total from Investment Operations | Dividends from Net Investment Income | Distributions from Net Realized Capital Gains | Total Distributions | ||||||||||||||||||||||||
Select Capital Appreciation Fund(5) | |||||||||||||||||||||||||||||||
2005 | $ | 2.286 | $ | (0.010 | )(3) | $ | 0.322 | $ | 0.312 | $ | — | $ | (0.567 | ) | $ | (0.567 | ) | $ | (0.255 | ) | |||||||||||
2004 | 2.125 | (0.015 | ) | 0.373 | 0.358 | — | (0.197 | ) | (0.197 | ) | 0.161 | ||||||||||||||||||||
2003 | 1.521 | (0.015 | ) | 0.619 | 0.604 | — | — | — | 0.604 | ||||||||||||||||||||||
2002 | 1.940 | (0.014 | ) | (0.405 | ) | (0.419 | ) | — | — | — | (0.419 | ) | |||||||||||||||||||
2001 | 2.122 | (0.010 | ) | (0.019 | ) | (0.029 | ) | — | (0.153 | ) | (0.153 | ) | (0.182 | ) | |||||||||||||||||
Select Value Opportunity Fund(5) | |||||||||||||||||||||||||||||||
2005 | $ | 2.270 | $ | 0.007 | (3) | $ | 0.134 | $ | 0.141 | $ | — | $ | (0.523 | ) | $ | (0.523 | ) | $ | (0.382 | ) | |||||||||||
2004 | 2.050 | 0.001 | 0.365 | 0.366 | (0.001 | ) | (0.145 | ) | (0.146 | ) | 0.220 | ||||||||||||||||||||
2003 | 1.487 | 0.002 | 0.568 | 0.570 | (0.002 | ) | (0.005 | ) | (0.007 | ) | 0.563 | ||||||||||||||||||||
2002 | 1.975 | 0.002 | (0.315 | ) | (0.313 | ) | (0.011 | ) | (0.164 | ) | (0.175 | ) | (0.488 | ) | |||||||||||||||||
2001 | 1.958 | 0.012 | 0.225 | 0.237 | (0.012 | ) | (0.208 | ) | (0.220 | ) | 0.017 | ||||||||||||||||||||
Select International Equity Fund(1)(5) | |||||||||||||||||||||||||||||||
2005 | $ | 1.251 | $ | 0.026 | $ | 0.128 | $ | 0.154 | $ | (0.019 | ) | $ | — | $ | (0.019 | ) | $ | 0.135 | |||||||||||||
2004 | 1.108 | 0.019 | 0.139 | 0.158 | (0.015 | ) | — | (0.015 | ) | 0.143 | |||||||||||||||||||||
2003 | 0.874 | 0.015 | 0.226 | 0.241 | (0.007 | ) | — | (0.007 | ) | 0.234 | |||||||||||||||||||||
2002 | 1.113 | 0.013 | (0.226 | ) | (0.213 | ) | (0.017 | ) | (0.009 | ) | (0.026 | ) | (0.239 | ) | |||||||||||||||||
2001 | 1.781 | 0.018 | (0.385 | ) | (0.367 | ) | (0.024 | ) | (0.277 | ) | (0.301 | ) | (0.668 | ) | |||||||||||||||||
Select Growth Fund(1)(5) | |||||||||||||||||||||||||||||||
2005 | $ | 1.545 | $ | (0.002 | ) | $ | 0.116 | $ | 0.114 | $ | (0.004 | ) | $ | — | $ | (0.004 | ) | $ | 0.110 | ||||||||||||
2004 | 1.438 | 0.003 | (3) | 0.104 | 0.107 | — | — | — | 0.107 | ||||||||||||||||||||||
2003 | 1.139 | (0.001 | ) | 0.301 | 0.300 | (0.001 | ) | — | (0.001 | ) | 0.299 | ||||||||||||||||||||
2002 | 1.576 | 0.001 | (0.436 | ) | (0.435 | ) | (0.002 | ) | — | (0.002 | ) | (0.437 | ) | ||||||||||||||||||
2001 | 2.214 | 0.002 | (0.545 | ) | (0.543 | ) | — | (0.095 | ) | (0.095 | ) | (0.638 | ) | ||||||||||||||||||
Core Equity Fund(1)(5) | |||||||||||||||||||||||||||||||
2005 | $ | 1.713 | $ | 0.014 | $ | 0.089 | $ | 0.103 | $ | (0.014 | ) | $ | — | $ | (0.014 | ) | $ | 0.089 | |||||||||||||
2004 | 1.568 | 0.017 | (3) | 0.145 | 0.162 | (0.017 | ) | — | (0.017 | ) | 0.145 | ||||||||||||||||||||
2003 | 1.239 | 0.012 | 0.329 | 0.341 | (0.012 | ) | — | (0.012 | ) | 0.329 | |||||||||||||||||||||
2002 | 1.633 | 0.011 | (4) | (0.393 | ) | (0.382 | ) | (0.012 | ) | — | (0.012 | ) | (0.394 | ) | |||||||||||||||||
2001 | 2.689 | 0.016 | (0.439 | ) | (0.423 | ) | (0.015 | ) | (0.618 | ) | (0.633 | ) | (1.056 | ) | |||||||||||||||||
| (a) | Including reimbursements, waivers, and reductions. |
| (b) | Excluding reductions. Certain Portfolios have entered varying arrangements with brokers who reduced a portion of the Portfolio’s expenses. |
| (c) | Excluding reimbursements, waivers, and reductions. |
| (1) | The Select International Equity Fund changed sub-advisors and added a second sub-advisor on October 1, 2004. The Select Growth Fund added a second sub-adviser on April 18, 2003 and replaced the first sub-adviser on April 30, 2004. The Core Equity Fund changed sub-advisors and added a second sub-advisor on May 1, 2002. |
| (2) | Net investment income (loss) per share before reimbursements and waivers of fees by the investment advisor or reductions were $(0.003) in 2005 and $(0.016) in 2004 for Select Capital Appreciation Fund; $(0.001) in 2004, $0.001 in 2003, $0.000 in 2002, and $0.011 in 2001 for Select Value Opportunity Fund; $(0.003) in 2005, $(0.002) in 2003, $0.000 in 2002, and $0.001 in 2001 for Select Growth Fund; and $0.014 in 2001 for Core Equity Fund. |
| (3) | Investment income per share reflects a special dividend which amounted to $0.001 and $0.006 for Select Capital Appreciation Fund and Select Value Opportunity Fund in 2005, respectively, and $0.006 and $0.004 for Select Growth Fund and Core Equity Fund in 2004, respectively. |
| (4) | Computed using average shares outstanding throughout the period. |
| (5) | Effective January 1, 2005, brokerage commissions are included with realized gain or loss on investment transactions. Prior to January 1, 2005, these amounts were presented as a reduction of expenses. Prior year amounts have not been restated to reflect this change. (See Note 3). |
See Notes to Financial Statements.
F-38
Table of Contents
ALLMERICA INVESTMENT TRUST
Net Asset End of Period | Ratios/Supplemental Data | Portfolio Turnover Rate | |||||||||||||||||||||||||
| Total Return | Net Assets End of Period (000’s) | Ratios To Average Net Assets | |||||||||||||||||||||||||
| Net Investment Income (Loss) | Operating Expenses | Management Fee | |||||||||||||||||||||||||
| (a) | (c) | Gross | Net | ||||||||||||||||||||||||
| $2.031 | 14.68 | % | $ | 273,823 | (0.50 | )% | 1.15 | % | 1.15 | % | 1.15 | % | 0.93 | % | 0.93 | % | 27 | % | |||||||||
| 2.286 | 18.62 | % | 299,355 | (0.70 | )% | 1.14 | % | 1.15 | %(b) | 1.15 | % | 0.92 | % | 0.92 | % | 38 | % | ||||||||||
| 2.125 | 39.71 | % | 296,204 | (0.70 | )% | 1.11 | % | 1.13 | %(b) | 1.13 | % | 0.92 | % | 0.92 | % | 46 | % | ||||||||||
| 1.521 | (21.60 | )% | 287,593 | (0.70 | )% | 1.05 | % | 1.06 | %(b) | 1.06 | % | 0.90 | % | 0.90 | % | 41 | % | ||||||||||
| 1.940 | (1.14 | )% | 435,864 | (0.51 | )% | 0.93 | % | 0.94 | %(b) | 0.94 | % | 0.88 | % | 0.88 | % | 44 | % | ||||||||||
| $1.888 | 7.18 | % | $ | 290,698 | 0.37 | % | 1.11 | % | 1.11 | % | 1.11 | % | 0.89 | % | 0.89 | % | 89 | % | |||||||||
| 2.270 | 19.35 | % | 345,750 | 0.02 | % | 1.04 | % | 1.10 | %(b) | 1.10 | % | 0.88 | % | 0.88 | % | 99 | % | ||||||||||
| 2.050 | 38.43 | % | 380,801 | 0.07 | % | 1.03 | % | 1.09 | %(b) | 1.09 | % | 0.88 | % | 0.88 | % | 117 | % | ||||||||||
| 1.487 | (16.32 | )% | 351,831 | 0.12 | % | 0.96 | % | 1.03 | %(b) | 1.03 | % | 0.87 | % | 0.87 | % | 94 | % | ||||||||||
| 1.975 | 12.70 | % | 440,335 | 0.63 | % | 0.87 | % | 0.92 | %(b) | 0.92 | % | 0.87 | % | 0.87 | % | 97 | % | ||||||||||
| $1.386 | 12.41 | % | $ | 288,368 | 1.62 | % | 1.26 | % | 1.26 | % | 1.26 | % | 0.93 | % | 0.93 | % | 19 | % | |||||||||
| 1.251 | 14.47 | % | 333,494 | 1.33 | % | 1.21 | % | 1.22 | %(b) | 1.22 | % | 0.92 | % | 0.92 | % | 84 | % | ||||||||||
| 1.108 | 27.77 | % | 380,653 | 1.46 | % | 1.18 | % | 1.19 | %(b) | 1.19 | % | 0.92 | % | 0.92 | % | 28 | % | ||||||||||
| 0.874 | (19.37 | )% | 335,890 | 1.17 | % | 1.13 | % | 1.14 | %(b) | 1.14 | % | 0.91 | % | 0.91 | % | 14 | % | ||||||||||
| 1.113 | (21.43 | )% | 460,006 | 0.97 | % | 0.99 | % | 1.01 | %(b) | 1.01 | % | 0.89 | % | 0.89 | % | 26 | % | ||||||||||
| $1.655 | 7.38 | % | $ | 440,137 | (0.15 | )% | 1.01 | % | 1.01 | % | 1.05 | % | 0.83 | % | 0.79 | % | 42 | % | |||||||||
| 1.545 | 7.44 | % | 528,558 | 0.21 | % | 1.00 | % | 1.02 | %(b) | 1.05 | % | 0.82 | % | 0.79 | % | 95 | % | ||||||||||
| 1.438 | 26.30 | % | 625,729 | (0.08 | )% | 1.03 | % | 1.07 | %(b) | 1.07 | % | 0.81 | % | 0.81 | % | 75 | % | ||||||||||
| 1.139 | (27.60 | )% | 375,959 | 0.05 | % | 0.95 | % | 1.01 | %(b) | 1.01 | % | 0.82 | % | 0.82 | % | 125 | % | ||||||||||
| 1.576 | (24.71 | )% | 660,893 | 0.12 | % | 0.78 | % | 0.85 | %(b) | 0.85 | % | 0.79 | % | 0.79 | % | 91 | % | ||||||||||
| $1.802 | 6.03 | % | $ | 279,880 | 0.77 | % | 0.82 | % | 0.82 | % | 0.82 | % | 0.59 | % | 0.59 | % | 40 | % | |||||||||
| 1.713 | 10.41 | % | 337,127 | 1.02 | % | 0.79 | % | 0.81 | %(b) | 0.81 | % | 0.58 | % | 0.58 | % | 37 | % | ||||||||||
| 1.568 | 27.67 | % | 400,017 | 0.88 | % | 0.78 | % | 0.80 | %(b) | 0.80 | % | 0.58 | % | 0.58 | % | 27 | % | ||||||||||
| 1.239 | (23.45 | )% | 401,888 | 0.78 | % | 0.70 | % | 0.74 | %(b) | 0.74 | % | 0.57 | % | 0.57 | % | 115 | % | ||||||||||
| 1.633 | (16.90 | )% | 673,753 | 0.75 | % | 0.58 | % | 0.61 | %(b) | 0.61 | % | 0.55 | % | 0.55 | % | 134 | % | ||||||||||
F-39
Table of Contents
ALLMERICA INVESTMENT TRUST
FINANCIAL HIGHLIGHTS - For a Share Outstanding Throughout Each Period
| Income from Investment Operations | Less Distributions(d) | Net Increase | |||||||||||||||||||||||||||||
Year Ended December 31, | Net Asset | Net Investment Income(2) | Net Realized and Investments | Total from Investment Operations | Dividends from Net Investment Income | Distributions from Net Realized Capital Gains | Total Distributions | ||||||||||||||||||||||||
Equity Index Fund(7) | |||||||||||||||||||||||||||||||
2005 | $ | 2.664 | $ | 0.037 | $ | 0.079 | $ | 0.116 | $ | (0.038 | ) | $ | — | $ | (0.038 | ) | $ | 0.078 | |||||||||||||
2004 | 2.453 | 0.040 | (6) | 0.211 | 0.251 | (0.040 | ) | — | (0.040 | ) | 0.211 | ||||||||||||||||||||
2004 | 1.944 | 0.029 | 0.508 | 0.537 | (0.028 | ) | — | (0.028 | ) | 0.509 | |||||||||||||||||||||
2002 | 2.715 | 0.027 | (0.616 | ) | (0.589 | ) | (0.028 | ) | (0.154 | ) | (0.182 | ) | (0.771 | ) | |||||||||||||||||
2001 | 3.299 | 0.030 | (0.422 | ) | (0.392 | ) | (0.029 | ) | (0.163 | ) | (0.192 | ) | (0.584 | ) | |||||||||||||||||
Select Investment Grade Income Fund | |||||||||||||||||||||||||||||||
2005 | $ | 1.088 | $ | 0.044 | $ | (0.024 | ) | $ | 0.020 | $ | (0.052 | ) | $ | — | $ | (0.052 | ) | $ | (0.032 | ) | |||||||||||
2004 | 1.119 | 0.043 | — | 0.043 | (0.059 | ) | (0.015 | ) | (0.074 | ) | (0.031 | ) | |||||||||||||||||||
2003 | 1.134 | 0.040 | (0.003 | )(3) | 0.037 | (0.052 | ) | — | (0.052 | ) | (0.015 | ) | |||||||||||||||||||
2002 | 1.106 | 0.054 | 0.034 | 0.088 | (0.060 | ) | — | (0.060 | ) | 0.028 | |||||||||||||||||||||
2001 | 1.086 | 0.064 | (4) | 0.021 | 0.085 | (0.065 | ) | — | (0.065 | ) | 0.020 | ||||||||||||||||||||
Government Bond Fund | |||||||||||||||||||||||||||||||
2005 | $ | 1.083 | $ | 0.034 | $ | (0.017 | ) | $ | 0.017 | $ | (0.039 | ) | $ | — | $ | (0.039 | ) | $ | (0.022 | ) | |||||||||||
2004 | 1.104 | 0.030 | (0.007 | ) | 0.023 | (0.042 | ) | (0.002 | ) | (0.044 | ) | (0.021 | ) | ||||||||||||||||||
2003 | 1.130 | 0.030 | (0.011 | ) | 0.019 | (0.045 | ) | — | (0.045 | ) | (0.026 | ) | |||||||||||||||||||
2002 | 1.077 | 0.041 | 0.057 | 0.098 | (0.045 | ) | — | (0.045 | ) | 0.053 | |||||||||||||||||||||
2001 | 1.051 | 0.049 | (4) | 0.030 | 0.079 | (0.053 | ) | — | (0.053 | ) | 0.026 | ||||||||||||||||||||
Money Market Fund | |||||||||||||||||||||||||||||||
2005 | $ | 1.000 | $ | 0.026 | $ | — | $ | 0.026 | $ | (0.026 | ) | $ | — | (1) | $ | (0.026 | ) | $ | — | ||||||||||||
2004 | 1.000 | 0.009 | — | 0.009 | (0.009 | ) | — | (0.009 | ) | — | |||||||||||||||||||||
2003 | 1.000 | 0.008 | — | (5) | 0.008 | (0.008 | ) | — | (0.008 | ) | — | ||||||||||||||||||||
2002 | 1.000 | 0.016 | — | 0.016 | (0.016 | ) | — | (0.016 | ) | — | |||||||||||||||||||||
2001 | 1.000 | 0.042 | — | 0.042 | (0.042 | ) | — | (0.042 | ) | — | |||||||||||||||||||||
| (a) | Including reimbursements, waivers, and reductions. |
| (b) | Excluding reductions. Certain Portfolios have entered into varying arrangements with brokers who reduced a portion of the Portfolio’s expenses. |
| (c) | Excluding reimbursements, waivers, and reductions. |
| (d) | Certain prior year amounts have been reclassified to conform to current year presentation. |
| (1) | Distribution from net realized gain on investments and return of capital amounted to less than $0.0005. |
| (2) | Net investment income (loss) per share before expense reductions was $0.028 in 2003 and $0.029 in 2001 for Equity Index Fund. |
| (3) | The amount shown for a share outstanding does not correspond with the aggregate net gain on investments for the period due to the timing of sales and repurchases of Portfolio shares in relation to the fluctuating market values of the investments of the Portfolio. |
| (4) | Computed using average shares outstanding throughout the period. |
| (5) | Amount is less than $.0005 or $(.0005). |
| (6) | Investment income per share reflects a special dividend which amounted to $0.008 per share for Equity Index Fund. |
| (7) | Effective January 1, 2005, brokerage commissions are included with realized gain or loss on investment transactions. Prior to January 1, 2005, these amounts were presented as a reduction of expenses. Prior year amounts have not been restated to reflect this change. (See Note 3). |
See Notes to Financial Statements.
F-40
Table of Contents
ALLMERICA INVESTMENT TRUST
| Net Asset Value End of Period | Ratios/Supplemental Data | |||||||||||||||||||||||||||
| Total Return | Net Assets End of Period (000’s) | Ratios To Average Net Assets | Portfolio Turnover Rate | |||||||||||||||||||||||||
| Net Investment Income | Operating Expenses | Management Fee | ||||||||||||||||||||||||||
| (a) | (c) | Gross | Net | |||||||||||||||||||||||||
| $ | 2.742 | 4.38 | % | $ | 489,587 | 1.35 | % | 0.52 | % | 0.52 | % | 0.52 | % | 0.28 | % | 0.28 | % | 7 | % | |||||||||
| 2.664 | 10.32 | % | 595,037 | 1.53 | % | 0.50 | % | 0.52 | %(b) | 0.52 | % | 0.28 | % | 0.28 | % | 4 | % | |||||||||||
| 2.453 | 27.83 | % | 666,455 | 1.37 | % | 0.45 | % | 0.50 | %(b) | 0.50 | % | 0.28 | % | 0.28 | % | 23 | % | |||||||||||
| 1.944 | (22.22 | )% | 342,683 | 1.16 | % | 0.45 | % | 0.47 | %(b) | 0.47 | % | 0.28 | % | 0.28 | % | 10 | % | |||||||||||
| 2.715 | (12.02 | )% | 517,315 | 1.02 | % | 0.32 | % | 0.34 | %(b) | 0.34 | % | 0.28 | % | 0.28 | % | 21 | % | |||||||||||
| $ | 1.056 | 1.84 | % | $ | 332,861 | 4.05 | % | 0.64 | % | 0.64 | % | 0.64 | % | 0.42 | % | 0.42 | % | 110 | % | |||||||||
| 1.088 | 3.98 | % | 402,219 | 3.78 | % | 0.64 | % | 0.64 | % | 0.64 | % | 0.42 | % | 0.42 | % | 113 | % | |||||||||||
| 1.119 | 3.31 | % | 530,199 | 3.42 | % | 0.63 | % | 0.63 | % | 0.63 | % | 0.41 | % | 0.41 | % | 192 | % | |||||||||||
| 1.134 | 8.14 | % | 620,074 | 4.85 | % | 0.58 | % | 0.58 | % | 0.58 | % | 0.41 | % | 0.41 | % | 130 | % | |||||||||||
| 1.106 | 7.94 | % | 571,582 | 5.79 | % | 0.47 | % | 0.47 | % | 0.47 | % | 0.41 | % | 0.41 | % | 114 | % | |||||||||||
| $ | 1.061 | 1.55 | % | $ | 102,769 | 3.18 | % | 0.74 | % | 0.74 | % | 0.74 | % | 0.50 | % | 0.50 | % | 44 | % | |||||||||
| 1.083 | 2.12 | % | 128,860 | 3.02 | % | 0.73 | % | 0.73 | % | 0.73 | % | 0.50 | % | 0.50 | % | 77 | % | |||||||||||
| 1.104 | 1.67 | % | 200,158 | 2.82 | % | 0.71 | % | 0.71 | % | 0.71 | % | 0.50 | % | 0.50 | % | 55 | % | |||||||||||
| 1.130 | 9.28 | % | 291,995 | 3.48 | % | 0.68 | % | 0.68 | % | 0.68 | % | 0.50 | % | 0.50 | % | 79 | % | |||||||||||
| 1.077 | 7.63 | % | 116,514 | 4.52 | % | 0.58 | % | 0.58 | % | 0.58 | % | 0.50 | % | 0.50 | % | 190 | % | |||||||||||
| $ | 1.000 | 2.75 | % | $ | 222,194 | 2.65 | % | 0.55 | % | 0.55 | % | 0.55 | % | 0.32 | % | 0.32 | % | N/A | ||||||||||
| 1.000 | 0.91 | % | 264,679 | 0.88 | % | 0.52 | % | 0.52 | % | 0.52 | % | 0.32 | % | 0.32 | % | N/A | ||||||||||||
| 1.000 | 0.80 | % | 377,155 | 0.82 | % | 0.53 | % | 0.53 | % | 0.53 | % | 0.30 | % | 0.30 | % | N/A | ||||||||||||
| 1.000 | 1.66 | % | 704,805 | 1.63 | % | 0.45 | % | 0.45 | % | 0.45 | % | 0.30 | % | 0.30 | % | N/A | ||||||||||||
| 1.000 | 4.28 | % | 604,657 | 4.11 | % | 0.36 | % | 0.36 | % | 0.36 | % | 0.31 | % | 0.31 | % | N/A | ||||||||||||
F-41
Table of Contents
ALLMERICA INVESTMENT TRUST
NOTES TO FINANCIAL STATEMENTS
| 1. | ORGANIZATION |
Allmerica Investment Trust (the “Trust”) is registered under the Investment Company Act of 1940, as amended (the “1940 Act”), as an open-end, diversified management investment company established as a Massachusetts business trust. The Trust is intended to serve as an investment medium for (i) variable life insurance policies and variable annuity contracts offered by insurance companies; (ii) certain qualified pension and retirement plans, as permitted by Treasury Regulations; and (iii) life insurance companies and advisers to the Portfolios and their affiliates. The Hanover Insurance Group (formerly Allmerica Financial Corporation) (“Hanover”) has ceased all new sales of proprietary variable annuities and life insurance products (See Note 9). The Trust is comprised of nine managed investment portfolios. The accompanying financial statements and financial highlights are those of the Select Capital Appreciation, Select Value Opportunity, Select International Equity, Select Growth, Core Equity, Equity Index, Select Investment Grade Income, Government Bond and Money Market Funds (individually a “Portfolio”, collectively, the “Portfolios”).
| 2. | SIGNIFICANT ACCOUNTING POLICIES |
The preparation of financial statements in conformity with accounting principles generally accepted in the United States of America requires management to make estimates and assumptions at the date of the financial statements. Actual results could differ from those estimates.
The following is a summary of significant accounting policies followed by the Trust in the preparation of its financial statements:
Security Valuation: Equity securities which are traded on a recognized exchange (other than Nasdaq) are valued at the last quoted sales price available at the time of the closing of the New York Stock Exchange or, if there were no sales that day, at the mean of the closing bid and asked price. Securities listed or traded on Nasdaq are valued at the Nasdaq official closing price. Over-the-counter securities for which market quotations are readily available are valued at the last available price in the market prior to the time of valuation. Securities that are primarily traded on foreign exchanges generally are valued at the closing values of such securities on their respective exchanges. Corporate debt securities and debt securities of the U.S. Government and its agencies (other than short-term investments) are valued by an independent pricing service approved by the Board of Trustees which utilizes market quotations and transactions, quotations from dealers and various relationships among securities in determining value. If not valued by a pricing service, such securities are valued at prices obtained from independent brokers. If prices are not readily available or do not accurately reflect fair value for a security, or if a security’s value has been materially affected by events occurring after the close of the exchange or market on which the security is principally traded, that security may be valued by another method that the Board of Trustees believes accurately reflects fair value. A security’s valuation may differ depending on the method used for determining value. Price movements in futures contracts and ADRs, market and trading trends, the bid/ask quotes of brokers and off-exchange institutional trading may be reviewed in the course of making a good faith determination of a security’s fair value. Short-term investments that mature in 60 days or less are valued at amortized cost. The investments of the Money Market Fund are valued utilizing the amortized cost valuation method, permitted in accordance with Rule 2a-7 under the 1940 Act. This method involves valuing a portfolio security initially at its cost and thereafter assuming a constant amortization to maturity of any discount or premium. Investments in other investment companies are valued at net asset value.
Forward Foreign Currency Contracts: The Select Capital Appreciation, Select International Equity and Select Growth Funds may enter into forward foreign currency contracts whereby the Portfolios agree to exchange a specific currency at a specific price at a future date in an attempt to hedge against fluctuations in the value of the underlying currency of certain portfolio instruments. Forward foreign currency contracts are valued at the daily forward exchange rate of the underlying currency with any fluctuations recorded as unrealized gains or losses. Gains or losses on the purchase or sale of forward foreign currency contracts having the same settlement date and broker are realized on the date of offset, otherwise gains and losses are realized on the settlement date.
F-42
Table of Contents
ALLMERICA INVESTMENT TRUST
NOTES TO FINANCIAL STATEMENTS (Continued)
The use of forward foreign currency contracts does not eliminate fluctuations in the underlying prices of the Portfolios, but it does establish a rate of exchange that can be achieved in the future. Although forward foreign currency contracts used for hedging purposes limit the risk of loss due to a decline in the value of the hedged currency, they also limit any potential gain that might result should the value of the currency increase. In addition, the Portfolios could be exposed to risks if the counterparties to the contracts are unable to meet the terms of their contracts. No forward foreign currency contracts were held at December 31, 2005.
Foreign Currency Translation: Investment valuations, other assets and liabilities denominated in foreign currencies are translated each business day into U.S. dollars based upon current exchange rates. Purchases and sales of foreign investments and income and expenses are translated into U.S. dollars based upon exchange rates prevailing on the respective dates of such transactions. Net realized gains or losses on foreign currency transactions represent net gains or losses on sales and maturities of foreign currency contracts, disposition of foreign currencies, the difference between the amount of net investment income and withholding taxes accrued and the U.S. dollar amount actually received and paid, and gains or losses between the trade and settlement date on the purchases and sales of the securities. That portion of unrealized gains or losses on investments due to fluctuations in foreign currency exchange rates is not separately disclosed.
Security Transactions and Investment Income: Security transactions are recorded as of the trade date. Realized gains and losses from security transactions are determined on the basis of identified cost. Interest income, including amortization of premium and accretion of discount on securities, is accrued daily. Income distributions earned by the Portfolios from investments in certain investment companies are recorded as interest income in the accompanying financial statements. Dividend income is recorded on the ex-dividend date, except that certain dividends from foreign securities are recorded as soon as the Portfolios are informed of the ex-dividend date net of non-reclaimable tax withholdings.
For the year ended December 31, 2005, the aggregate cost of purchases and the proceeds of sales, other than from short-term investments, included of non-governmental issuers, for each portfolio are as follows:
| Purchases | Sales | |||||||||||
Portfolio | Government | Non-Government | Government | Non-Government | ||||||||
Select Capital Appreciation Fund | $ | — | $ | 73,354,721 | $ | — | $ | 133,574,611 | ||||
Select Value Opportunity Fund | — | 265,263,174 | — | 355,973,933 | ||||||||
Select International Equity Fund | — | 56,422,712 | — | 142,980,022 | ||||||||
Select Growth Fund | — | 193,549,351 | — | 322,558,378 | ||||||||
Core Equity Fund | — | 117,982,172 | — | 191,090,645 | ||||||||
Equity Index Fund | — | 37,078,470 | — | 160,956,688 | ||||||||
Select Investment Grade Income Fund | 235,149,546 | 145,231,353 | 253,175,861 | 163,322,867 | ||||||||
Government Bond Fund | 47,772,459 | — | 67,949,317 | 4,217,600 | ||||||||
Money Market Fund | — | — | — | — | ||||||||
Federal Income Taxes: The Trust treats each Portfolio as a separate entity for Federal income tax purposes. Each Portfolio intends to continue to qualify as a “regulated investment company” under Subchapter M of the Internal Revenue Code of 1986, as amended. By so qualifying, each Portfolio will not be subject to Federal income taxes to the extent it distributes all of its taxable income and net realized gains, if any, for its fiscal year. In addition, by distributing during each calendar year substantially all of its net investment income, capital gains and certain other amounts, if any, each Portfolio will not be subject to Federal excise tax. Therefore, no Federal income tax provision is required. Withholding taxes on foreign dividend income and gains have been paid or provided for in accordance with the applicable country’s tax rules and rates.
F-43
Table of Contents
ALLMERICA INVESTMENT TRUST
NOTES TO FINANCIAL STATEMENTS (Continued)
For federal income tax purposes, the aggregate cost of investment securities owned at December 31, 2005, the aggregate gross unrealized appreciation (depreciation) and the net unrealized appreciation (depreciation) on investment securities owned at December 31, 2005, for each portfolio are as follows:
Portfolio | Gross Appreciation | Gross Depreciation | Net Unrealized Appreciation (Depreciation) | Cost | ||||||||||
Select Capital Appreciation Fund | $ | 82,578,372 | $ | (4,669,857 | ) | $ | 77,908,515 | $ | 191,739,977 | |||||
Select Value Opportunity Fund | 41,394,108 | (4,461,703 | ) | 36,932,405 | 226,555,933 | |||||||||
Select International Equity Fund | 58,838,539 | (2,041,966 | ) | 56,796,573 | 218,249,131 | |||||||||
Select Growth Fund | 63,391,646 | (10,662,712 | ) | 52,728,934 | 372,329,483 | |||||||||
Core Equity Fund | 46,597,470 | (5,380,929 | ) | 41,216,541 | 233,419,613 | |||||||||
Equity Index Fund | 89,878,253 | (29,938,118 | ) | 59,940,135 | 428,942,437 | |||||||||
Select Investment Grade Income Fund | 2,200,482 | (5,894,745 | ) | (3,694,263 | ) | 341,630,515 | ||||||||
Government Bond Fund | 134,687 | (1,624,950 | ) | (1,490,263 | ) | 103,180,733 | ||||||||
Money Market Fund | — | — | — | 221,530,399 | ||||||||||
As of December 31, 2005, the components of distributable earnings (excluding unrealized appreciation disclosed above) on a tax basis consisted of undistributed long-term capital gains, undistributed short-term capital gains and capital loss carryforwards for each portfolio are as follows:
Portfolio | Undistributed Ordinary Income | Undistributed Long-Term Capital Gains | Undistributed Short-Term Capital Gains | Capital Loss Carryforwards | ||||||||
Select Capital Appreciation Fund | $ | — | $ | 7,370,506 | $ | 640,191 | $ | 427,851 | ||||
Select Value Opportunity Fund | 1,139,288 | 36,596,732 | 5,797,069 | — | ||||||||
Select International Equity Fund | 2,652,270 | — | — | 86,962,722 | ||||||||
Select Growth Fund | — | — | — | 286,851,099 | ||||||||
Core Equity Fund | — | — | — | 215,995,972 | ||||||||
Equity Index Fund | — | — | — | 130,099,396 | ||||||||
Select Investment Grade Income Fund | 123,287 | — | — | 2,130,504 | ||||||||
Government Bond Fund | 21,744 | — | — | 2,378,129 | ||||||||
Money Market Fund | — | — | — | — | ||||||||
For the year ended December 31, 2005, the Portfolio has elected to defer capital losses attributable to Post-October currency losses and capital losses are as follows:
Portfolio | Currency Losses | Capital Losses | ||||
Select Capital Appreciation Fund | $ | — | $ | — | ||
Select Value Opportunity Fund | — | — | ||||
Select International Equity Fund | — | — | ||||
Select Growth Fund | — | — | ||||
Core Equity Fund | 13 | — | ||||
Equity Index Fund | — | — | ||||
Select Investment Grade Income Fund | — | 2,394,745 | ||||
Government Bond Fund | — | 95,308 | ||||
Money Market Fund | — | 1,868 | ||||
F-44
Table of Contents
ALLMERICA INVESTMENT TRUST
NOTES TO FINANCIAL STATEMENTS (Continued)
During the two year ended December 31, 2005 and December 31, 2004, respectively, the tax character of distributions paid for ordinary income, long-term capital gain, and return on capital for each portfolio are as follows:
| December 31, 2005 | December 31, 2004 | |||||||||||||||||
Portfolio | Distributions Paid from Ordinary Income* | Long-Term Capital Gain | Return on Capital | Distributions Paid from Ordinary Income* | Long-Term Capital Gain | Return on Capital | ||||||||||||
Select Capital Appreciation Fund | $ | 4,773,256 | $ | 61,352,272 | $ | — | $ | 4,819,969 | $ | 20,393,344 | $ | — | ||||||
Select Value Opportunity Fund | 37,858,676 | 30,655,110 | — | 22,348,847 | — | — | ||||||||||||
Select International Equity Fund | 4,270,657 | — | — | 4,285,464 | — | — | ||||||||||||
Select Growth Fund | 1,125,794 | — | 225 | — | — | — | ||||||||||||
Core Equity Fund | 2,297,671 | — | — | 3,653,589 | — | — | ||||||||||||
Equity Index Fund | 7,221,232 | — | — | 9,477,338 | — | — | ||||||||||||
Select Investment Grade Income Fund | 17,062,085 | — | — | 24,167,490 | 6,247,354 | — | ||||||||||||
Government Bond Fund | 3,996,071 | — | — | 5,646,147 | 273,481 | — | ||||||||||||
Money Market Fund | 6,646,008 | — | 56,233 | 2,804,306 | — | — | ||||||||||||
| * | Short-term capital gains distributions are treated as ordinary income for tax purposes. |
At December 31, 2005, the Portfolio had capital loss carryforwards which expire as follows:
Portfolio | 2007 | 2008 | �� | 2009 | 2010 | 2011 | 2012 | 2013 | |||||||||||||
Select Capital Appreciation Fund | $ | — | $ | 427,851 | $ | — | $ | — | $ | — | $ | — | $ | — | |||||||
Select Value Opportunity Fund | — | — | — | — | — | — | — | ||||||||||||||
Select International Equity Fund | 152,467 | 6,218,733 | 2,072,911 | 42,661,407 | 35,857,204 | — | — | ||||||||||||||
Select Growth Fund | — | 38,030,598 | 102,979,284 | 92,315,074 | 53,526,143 | — | — | ||||||||||||||
Core Equity Fund | — | — | 95,774,423 | 88,482,233 | 31,739,316 | — | — | ||||||||||||||
Equity Index Fund | 12,212,844 | 62,715,062 | 13,380,657 | 17,675,562 | 16,843,955 | 7,271,316 | — | ||||||||||||||
Select Investment Grade Income Fund | — | — | — | — | — | 1,472,715 | 657,789 | ||||||||||||||
Government Bond Fund | — | — | — | — | — | 1,242,253 | 1,135,876 | ||||||||||||||
Money Market Fund | — | — | — | — | — | — | — | ||||||||||||||
The following capital loss carryforwards were utilized or lost during the year ended December 31, 2005:
Select Capital Appreciation Fund | $ | 142,617 | |
Select International Equity Fund | 25,420,502 | ||
Select Growth Fund | 46,181,655 | ||
Core Equity Fund | 13,165,376 | ||
Equity Index Fund | 1,176,872 |
F-45
Table of Contents
ALLMERICA INVESTMENT TRUST
NOTES TO FINANCIAL STATEMENTS (Continued)
Foreign Capital Gains Taxes: Realized gains in certain countries may be subject to foreign taxes at the fund level, at rates ranging from approximately 10% to 15%. The Select International Equity Fund accrues for such foreign taxes on net realized and unrealized gains at the appropriate rate for each jurisdiction.
Distributions to Shareholders: Dividends from net investment income are declared and reinvested daily for the Money Market Fund, declared, distributed and reinvested quarterly for the Core Equity, Equity Index, Select Investment Grade Income and Government Bond Funds, and annually for the Select Capital Appreciation, Select Value Opportunity, Select International Equity and Select Growth Funds. All Portfolios declare and distribute all net realized capital gains, if any, at least annually. Distributions to shareholders are recorded on the ex-dividend date. Income and capital gains distributions are determined in accordance with income tax regulations. Differences between book basis and tax basis amounts are primarily due to differing book and tax treatments in the timing of the recognition of gains or losses, including “Post-October Losses”, foreign currency gains and losses, gains and losses on futures contracts, and losses deferred due to wash sales and differing treatments for foreign currency transactions, gains and losses on passive foreign investment company holdings, paydown gains/losses on certain securities, capital loss carryforwards, return of capital on real estate investment trust holdings, net operating losses, amortization of premium and market discount, and non-taxable dividends. Permanent book and tax basis differences relating to shareholder distributions will result in reclassifications to paid in capital. Permanent book-tax differences, if any, are not included in ending undistributed net investment income for the purpose of calculating net investment income per share in the Financial Highlights, as applicable.
Futures Contracts: All Portfolios, except the Money Market Fund, may use futures contracts to manage their exposure to the stock and bond markets and to fluctuations in interest rates and currency values. Buying futures tends to increase a Portfolio’s exposure to the underlying instrument, while selling futures tends to decrease a Portfolio’s exposure to the underlying instrument or hedge other portfolio investments. Futures contracts involve, to varying degrees, risk of loss in excess of the futures variation margin, if any, reflected in each applicable Portfolio’s Statement of Assets and Liabilities. Losses may arise from changes in the value of the underlying instruments or if the counterparties do not perform under the terms of the contracts. Gains and losses are realized upon the expiration or closing of the futures contracts. Futures contracts are valued at the settlement price established each day by the board of trade or exchange on which they are traded. No future contracts were held at December 31, 2005.
Securities Lending: Each Portfolio, using Investors Bank & Trust Company (“IBT”) as its lending agent, may loan securities to brokers and dealers in exchange for negotiated lenders’ fees. These fees are disclosed as “Securities lending income” in the Statements of Operations. Each applicable Portfolio receives collateral against the loaned securities which must be maintained at not less than 102% of the market value of the loaned securities during the period of the loan. Collateral received is generally cash, and is invested in short-term investments. Lending portfolio securities involves possible delays in receiving additional collateral or in the recovery of the securities or possible loss of rights in the collateral should the counterparty (borrower) held not meet its obligations under the terms of the loan. No securities were out on loan at December 31, 2005.
Cash Accounts: From time to time the Portfolios may leave cash overnight in their account. IBT has been contracted on behalf of the Portfolios to sweep these monies into a demand note account, which will pay interest equal to 75% of that day’s U.S. Treasury Bill rate back to the Portfolios.
Expenses: Expenses directly attributed to a portfolio are charged to the portfolio, while expenses which are attributable to more than one portfolio of the Trust are allocated based upon relative net assets among the respective Portfolios and one other affiliated investment company, Allmerica Securities Trust.
Forward Commitments: The Select Capital Appreciation, Select Investment Grade Income, Government Bond, and Money Market Funds may enter into contracts to purchase securities for a fixed price at a specified future date beyond customary settlement time (“forward commitments”). If the Portfolios do so, they will maintain cash or other liquid obligations having a value in an amount at all times sufficient to meet the purchase price. Forward commitments involve a
F-46
Table of Contents
ALLMERICA INVESTMENT TRUST
NOTES TO FINANCIAL STATEMENTS (Continued)
risk of loss if the value of the security to be purchased declines prior to the settlement date. Although the Portfolios generally will enter into forward commitments with the intention of acquiring securities for their portfolios, they may dispose of a commitment prior to settlement if their Sub-Adviser deems it appropriate to do so.
Options: All Portfolios, except the Money Market Fund, may use options to manage its exposure to the stock and bond markets and to fluctuations in interest rates. Writing puts and buying calls tend to increase a Portfolio’s exposure to the underlying security. Buying puts and writing calls tend to decrease a Portfolio’s exposure to the underlying security. When a Portfolio writes a call or put option, an amount equal to the premium received is recorded as a liability and subsequently marked to market to reflect the current value of the option written. Premiums received from writing options which expire are treated as realized gains. Premiums received from writing options which are exercised or closed are added to the proceeds or offset against the amounts paid on the underlying security to determine the realized gain or loss. Realized gains and losses on written options are included in realized gains and losses on securities. Losses may arise from changes in the value of the underlying securities, if there is an illiquid secondary market for the contracts, or if the counterparties do not perform under the terms of the contracts. Exchange-traded options are valued using the last sale price or, if there were no sales that day, the last offering price. Options traded over-the-counter are valued using dealer-supplied valuations.
Repurchase Agreements: Each Portfolio may engage in repurchase agreement transactions with institutions that the Sub-Adviser has determined are creditworthy pursuant to guidelines established by the Trust’s Board of Trustees. Each Portfolio requires that the securities purchased in a repurchase agreement transaction be transferred to the Trust’s Custodian in a manner that is intended to enable the Portfolio to obtain those securities in the event of a counterparty default. The Sub-Adviser monitors the value of the securities, including accrued interest, daily to ensure that the value of the collateral equals or exceeds amounts due under the repurchase agreement. Repurchase agreement transactions involve certain risks in the event of default or insolvency of the counterparty, including possible delays or restrictions upon the Portfolio’s ability to dispose of the underlying securities, and a possible decline in the value of the underlying securities during the period while the Portfolio seeks to assert its rights.
| 3. | INVESTMENT MANAGEMENT, ADMINISTRATION, AND OTHER RELATED PARTY TRANSACTIONS |
Management Fees: Allmerica Financial Investment Management Services, Inc. (the “Manager”), a wholly-owned subsidiary of Allmerica Financial Life Insurance and Annuity Company (“Allmerica Financial”), serves as investment manager and administrator to the Trust. Allmerica Financial is a wholly-owned subsidiary of Hanover. Under the terms of the management agreement, the Portfolios pay a management fee, calculated daily and payable monthly, at an annual rate based upon the following fee schedules:
| Percentage of Average Daily Net Assets | ||||||||||||||||||
Portfolio | First $100,000,000 | Next $150,000,000 | Next $250,000,000 | Next $250,000,000 | Next $250,000,000 | Over $1,000,000,000 | ||||||||||||
Select Capital Appreciation Fund | 1.00 | % | 0.90 | % | 0.80 | % | 0.70 | % | 0.70 | % | 0.65 | % | ||||||
Select Value Opportunity Fund | 1.00 | % | 0.85 | % | 0.80 | % | 0.75 | % | 0.70 | % | 0.70 | % | ||||||
Select International Equity Fund | 1.00 | % | 0.90 | % | 0.85 | % | 0.85 | % | 0.85 | % | 0.85 | % | ||||||
Select Growth Fund | 0.85 | % | 0.85 | % | 0.80 | % | 0.75 | % | 0.70 | % | 0.70 | % | ||||||
Core Equity Fund | 0.60 | % | 0.60 | % | 0.55 | % | 0.50 | % | 0.45 | % | 0.45 | % | ||||||
Government Bond Fund | 0.50 | % | 0.50 | % | 0.50 | % | 0.50 | % | 0.50 | % | 0.50 | % | ||||||
Money Market Fund | 0.35 | % | 0.30 | % | 0.30 | % | 0.25 | % | 0.20 | % | 0.20 | % | ||||||
Portfolio | First $50,000,000 | Next $200,000,000 | Over $250,000,000 | ||||||
Equity Index Fund | 0.35 | % | 0.30 | % | 0.25 | % |
F-47
Table of Contents
ALLMERICA INVESTMENT TRUST
NOTES TO FINANCIAL STATEMENTS (Continued)
Portfolio | First $50,000,000 | Next $50,000,000 | Over $100,000,000 | ||||||
Select Investment Grade Income Fund | 0.50 | % | 0.45 | % | 0.40 | % |
The Manager has entered into Sub-Adviser Agreements for the management of the investments of each of the Portfolios. The Manager is solely responsible for the payment of all fees to the Sub-Advisers. The Sub-Advisers for each of the Portfolios are as follows:
| Select Capital Appreciation Fund | T. Rowe Price Associates, Inc. (“T. Rowe Price”) | |
| Select Value Opportunity Fund | Cramer Rosenthal McGlynn, LLC | |
| Select International Equity Fund | Grantham, Mayo, Van Otterloo & Co., LLC (“GMO”) J.P. Morgan Investment Management Inc. (“J.P. Morgan”) | |
| Select Growth Fund | GE Asset Management Incorporated (“GEAM”) | |
| Jennison Associates LLC (“Jennison”) | ||
| Core Equity Fund | UBS Global Asset Management (Americas) Inc. (“UBS”) Goldman Sachs Asset Management, L.P. (“Goldman”) | |
| Equity Index Fund | Opus Investment Management, Inc. (wholly-owned subsidiary of Hanover) | |
| Select Investment Grade Income Fund | Opus Investment Management, Inc. | |
| Government Bond Fund | Opus Investment Management, Inc. | |
| Money Market Fund | Opus Investment Management, Inc. |
T. Rowe Price International Series, Inc., an investment company managed by an affiliate of T. Rowe Price, is currently used as an investment vehicle for certain insurance products sponsored by Allmerica Financial and First Allmerica Financial Life Insurance Company (“First Allmerica”), a wholly-owned subsidiary of Allmerica Financial. GMO and J.P. Morgan each independently manages its own portion of the Select International Equity Fund. GEAM and Jennison each independently manages its own portion of the Select Growth Fund. UBS and Goldman each independently manages its own portion of the Core Equity Fund.
Brokerage Commissions: The Select Capital Appreciation, Select Value Opportunity, Select International Equity, Select Growth, Core Equity, and Equity Index Funds have entered into agreements with certain brokers whereby the brokers will rebate, in cash, a portion of brokerage commissions. Effective January 1, 2005, amounts earned by the Funds under such agreements are included with realized gain or loss on investment transactions presented in the statement of operations. Prior to January 1, 2005, amounts earned by the Funds under such agreements were presented as a reduction of expenses. Prior year amounts have not been restated to reflect this change due to immateriality. For the year ended December 31, 2005, brokerage commissions under these agreements were as follows:
| Commissions | |||
Select Capital Appreciation Fund | $ | 21,556 | |
Select Value Opportunity Fund | 169,068 | ||
Select International Equity Fund | 14,901 | ||
Select Growth Fund | 102,572 | ||
Core Equity Fund | 47,266 | ||
Equity Index Fund | 94,346 | ||
Plan of Distribution and Service: The 12b-1 Plan permits the Portfolios to pay Allmerica Financial and First Allmerica for marketing and distribution expenses to support the sale and distribution of the Portfolios’ shares and the provision of services to maintain and retain accounts. The 12b-1 Plan authorizes payment of a distribution and service fee at an annual rate of up to 0.25% of each Portfolio’s average daily net assets. As directed by the Board of Trustees, each Portfolio pays a distribution fee at an annual rate of 0.15% of each Portfolio’s average daily net assets. For the year ended December 31, 2005, total payments made to Allmerica Financial and First Allmerica by the Portfolios under the 12b-1 Plan amounted to $4,364,733.
F-48
Table of Contents
ALLMERICA INVESTMENT TRUST
NOTES TO FINANCIAL STATEMENTS (Continued)
Custodian, Fund Accounting, and Administrative Fees: IBT provides portfolio accounting and custody services to the Trust and receives fees and reimbursement of certain out-of-pocket expenses for its services from the Trust. The Manager has entered into an Administrative Services Agreement with IBT, whereby IBT performs certain administrative services for the Portfolios and is entitled to receive an administrative fee and reimbursement of certain out-of-pocket expenses. The Manager is solely responsible for the payment of the administrative fee to IBT. The Trust pays no salaries or compensation to any of its officers. Trustees who are not directors, officers or employees of the Trust or any investment adviser are reimbursed for their travel expenses in attending meetings of the Trustees, and receive quarterly meeting and retainer fees for their services. Such amounts are paid by the Trust.
| 4. | REIMBURSEMENT OF EXPENSES AND WAIVER OF FEES |
In the event normal operating expenses of each Portfolio, excluding taxes, interest, broker commissions, and extraordinary expenses, but including the management fee, exceed certain voluntary expense limitations as a percentage of average net assets, the Manager will voluntarily reimburse fees and any expenses in excess of the expense limitations. The Portfolios��� voluntary expense limitations are as follows:
Select Capital Appreciation Fund | 1.35 | % | |
Select Value Opportunity Fund* | 1.25 | % | |
Select International Equity Fund | 1.50 | % | |
Select Growth Fund** | 1.20 | % | |
Core Equity Fund | 1.20 | % | |
Equity Index Fund | 0.60 | % | |
Select Investment Grade Income Fund | 1.00 | % | |
Government Bond Fund | 1.00 | % | |
Money Market Fund | 0.60 | % |
Expense limitations may be removed or revised at any time after a Portfolio’s first fiscal year of operations without prior notice to existing shareholders.
| * | The Manager has also voluntarily agreed to limit its management fees to an annual rate of 0.90% of average daily net assets of the Select Value Opportunity Fund until further notice. |
| ** | Prior to January 1, 2005, GEAM assumed sub-adviser responsibilities from Putnam Investment Management, LLC (“Putnam”) for that portion of the Select Growth Fund that was independently managed by Putnam. The Manager has voluntarily agreed to waive that portion of the management fee of the Select Growth Fund to the extent that the amount of the sub-adviser fee paid to GEAM is less than the amount that would have been paid to Putnam. For the year ended December 31, 2005, this management fee waiver amounted to $163,473. |
| 5. | SHARES OF BENEFICIAL INTEREST |
The Trust’s Declaration of Trust authorizes the Trustees to issue an unlimited number of shares of beneficial interest for the Portfolios, each without a par value.
| 6. | FOREIGN SECURITIES, CONCENTRATION OF RISK, AND EMERGING MARKETS |
All Portfolios except the Government Bond Fund may purchase securities of foreign issuers. The Money Market Fund may invest in only U.S. dollar denominated foreign securities. Investing in foreign securities involves special risks not typically associated with investing in securities of U.S. issuers. The risks include revaluation of currencies and future adverse political and economic developments. Moreover, securities of many foreign issuers and their markets may be less liquid and their prices more volatile than those of securities of comparable U.S. issuers.
F-49
Table of Contents
ALLMERICA INVESTMENT TRUST
NOTES TO FINANCIAL STATEMENTS (Continued)
The Select International Equity Fund has over 25.2% and 25.9% of its total investments on December 31, 2005 invested in securities of companies located in Japan and the United Kingdom, respectively. The Select International Equity Fund is more susceptible to economic and political factors adversely affecting Japan or the United Kingdom than are international equity funds that are not concentrated to the same extent in these countries.
Total cash positions of Select Value Opportunity Fund, Select International Equity Fund, and Select Growth Fund at December 31, 2005 amounted to 9.4%, 4.6%, and 2.4%, respectively, of the Portfolio’s net assets. IBT, as provider of custody services to the Portfolios, holds these cash positions for the benefit of each Portfolio (See Note 2). Such cash amounts held at one financial institution may increase the Portfolios’ exposure to the possible risk of default or insolvency of that financial institution.
Investing in emerging markets may involve special risks and considerations not typically associated with investing in the developed markets. These risks include revaluation of currencies, high rates of inflation, repatriation restrictions on income and capital, and future adverse political and economic developments. Moreover, securities issued in these markets may be less liquid, subject to government ownership controls, subject to delayed settlements, and their prices more volatile than those of comparable securities in the United States.
| 7. | FINANCIAL INSTRUMENTS |
Investing in certain financial instruments including futures and options transactions, and forward foreign currency contracts involves risks other than those reflected in the Statements of Assets and Liabilities. Risks associated with these instruments include the potential for an imperfect correlation between the movements in the price of the instruments and the price of the underlying securities and interest rates, an illiquid secondary market for the instruments or inability of counterparties to perform under terms of the contracts, and changes in the value of foreign currency relative to the U.S. dollar. The Select Capital Appreciation, Select International Equity and Select Growth Funds may enter into these forward contracts primarily to protect the Portfolio from adverse currency movement.
| 8. | OTHER |
The Trust’s organizational documents provide former and current trustees and officers with a limited indemnification against liabilities arising in connection with the performance of their duties to the Trust. In the normal course of business, the Trust may also enter into contracts that provide general indemnifications. The Trust’s maximum exposure under these arrangements is unknown as this would be dependent on future claims that may be made against the Trust. The risk of material loss from such claims is considered remote.
| 9. | SUBSEQUENT EVENTS |
On August 22, 2005, Hanover announced that it had entered into a definitive agreement to sell Allmerica Financial and its closed block of variable annuity and variable life business (the “Transaction”) to The Goldman Sachs Group, Inc. (“Goldman Sachs”). In addition, as part of the Transaction, Goldman Sachs will purchase AFIMS. The Transaction closed on December 30, 2005.
In connection with the Transaction, the Board of Trustees of the Trust has approved an Agreement and Plan of Reorganization Agreement (the “Reorganization Agreement”) on behalf of each Portfolio of the Trust (each, an “AIT Fund”). The Reorganization Agreement is among the Trust, on behalf of each AIT Fund, Goldman Sachs Variable Insurance Trust (“GSVIT”), on behalf of each investment fund of GSVIT listed below (each, a “GSVIT Fund”), Hanover, AFIMS, Goldman Sachs
F-50
Table of Contents
ALLMERICA INVESTMENT TRUST
NOTES TO FINANCIAL STATEMENTS (Continued)
Asset Management, L.P. and Goldman Sachs Asset Management International. Pursuant to the Reorganization Agreement, each AIT Fund will be reorganized into a corresponding GSVIT Fund, as noted below (each, a “Fund Reorganization”):
AIT Fund | GSVIT Fund | |||
Reorganization #1 | Select International Equity Fund | International Equity Fund | ||
Reorganization #2 | Core Equity Fund | CORESM U.S. Equity Fund | ||
Reorganization #3 | Select Growth Fund | Capital Growth Fund | ||
Reorganization #4 | Select Capital Appreciation Fund | Growth Opportunities Fund | ||
Reorganization #5 | Equity Index Fund | Equity Index Fund | ||
Reorganization #6 | Select Value Opportunity Fund | Mid Cap Value Fund | ||
Reorganization #7 | Government Bond Fund | Government Income Fund | ||
Reorganization #8 | Select Investment Grade Income Fund | Core Fixed Income Fund | ||
Reorganization #9 | Money Market Fund | Money Market Fund |
A Special Meeting of Shareholders of the Trust was held on December 9, 2005, at which shareholders of each AIT Fund approved the Fund Reorganization relating to such AIT Fund. Although separate accounts of Allmerica Financial and First Allmerica were the only shareholders of the AIT Funds, owners of variable annuity contracts or variable life insurance contracts with allocations in the separate accounts that invest in the AIT Funds had the right to instruct Allmerica Financial or First Allmerica as to how to vote on the shares of the AIT Fund(s) attributable to their variable contracts. Each Fund Reorganization was effective at the opening of business on January 9, 2006.
No AIT Fund or any GSVIT Fund bore any fees, expenses or explicit brokerage commissions in connection with entering into and carrying out the Fund Reorganization Expenses (“Reorganization Expenses”). The responsibility for payment of all of the Reorganization Expenses were allocated between Hanover and Goldman Sachs. The portion of the Reorganization Expense that were allocated to Hanover amounted to $795,966.
F-51
Table of Contents
ALLMERICA INVESTMENT TRUST
REPORT OF INDEPENDENT REGISTERED PUBLIC ACCOUNTING FIRM
To the Board of Trustees and Shareholders of Allmerica Investment Trust
In our opinion, the accompanying statements of assets and liabilities, including the portfolios of investments (except for Moody’s and S&P Ratings and Concentration of Investments tables), and the related statements of operations and of changes in net assets and the financial highlights present fairly, in all material respects, the financial position of the Select Capital Appreciation Fund, Select Value Opportunity Fund, Select International Equity Fund, Select Growth Fund, Core Equity Fund, Equity Index Fund, Select Investment Grade Income Fund, Government Bond Fund, and Money Market Fund (constituting the Allmerica Investment Trust, hereafter referred to as the “Trust”) at December 31, 2005, the results of each of their operations, the changes in each of their net assets, and the financial highlights for each of the periods indicated, in conformity with accounting principles generally accepted in the United States of America. These financial statements and financial highlights (hereafter referred to as “financial statements”) are the responsibility of the Trust’s management; our responsibility is to express an opinion on these financial statements based on our audits. We conducted our audits of these financial statements in accordance with the standards of the Public Company Accounting Oversight Board (United States). Those standards require that we plan and perform the audit to obtain reasonable assurance about whether the financial statements are free of material misstatement. An audit includes examining, on a test basis, evidence supporting the amounts and disclosures in the financial statements, assessing the accounting principles used and significant estimates made by management, and evaluating the overall financial statement presentation. We believe that our audits, which included confirmation of securities at December 31, 2005 by correspondence with the custodian and brokers, provide a reasonable basis for our opinion.
As discussed in Note 9 to the financial statements, pursuant to the Reorganization Agreement described, each portfolio of the Trust (each, an “AIT Fund”) was reorganized into a corresponding GSVIT Fund, effective January 9, 2006.
PricewaterhouseCoopers LLP
Boston, Massachusetts
February 17, 2006
F-52
Table of Contents
ALLMERICA INVESTMENT TRUST
OTHER INFORMATION
SHAREHOLDER VOTING RESULTS: (Unaudited)
A special meeting of the shareholders of the funds of Allmerica Investment Trust (“AIT”) consisting of Select International Equity Fund, Core Equity Fund, Select Growth Fund, Select Capital Appreciation Fund, Equity Index Fund, Select Value Opportunity Fund, Government Bond Fund, Select Investment Grade Income Fund, and Money Market Fund (each an “AIT Fund”, and collectively, the “AIT Funds”) was held on December 9, 2005 to approve the following proposal:
To approve an Agreement and Plan of Reorganization (the “Reorganization Agreement”) providing for the acquisition of all the assets, and the assumption of substantially all of the liabilities, of the AIT Fund by a corresponding investment portfolio (a “GVSIT Fund”) of Goldman Sachs Variable Insurance Trust (“GSVIT”) in exchange for Service Shares of the corresponding GSVIT Fund, followed by the distribution of those shares to the shareholders of the AIT Fund and the subsequent liquidation of the AIT Fund.
Under the terms of the Reorganization Agreement, each of the following AIT Funds would be acquired by the corresponding GSVIT Fund listed opposite its name:
AIT Funds | GSVIT Funds | |
Select International Equity Fund | Goldman Sachs International Equity Fund | |
Core Equity Fund | Goldman Sachs CORESM U.S. Equity Fund | |
Select Growth Fund | Goldman Sachs Capital Growth Fund | |
Select Capital Appreciation Fund | Goldman Sachs Growth Opportunities Fund | |
Equity Index Fund | Goldman Sachs Equity Index Fund | |
Select Value Opportunity Fund | Goldman Sachs Mid Cap Value Fund | |
Government Bond Fund | Goldman Sachs Government Income Fund | |
Select Investment Grade Income Fund | Goldman Sachs Core Fixed Income Fund | |
Money Market Fund | Goldman Sachs Money Market Fund |
The voting results were as follows:
Shares For | Shares Against | Shares Abstaining | Total | |||||||||||
Select International Equity Fund: | Number of Votes Cast: | 194,735,008 | 10,378,513 | 14,432,425 | 219,545,946 | |||||||||
| Percentage of Votes Cast: | 88.70 | % | 4.73 | % | 6.57 | % | 100.00 | % | ||||||
Core Equity Fund: | Number of Votes Cast: | 149,078,574 | 7,659,817 | 7,448,138 | 164,186,529 | |||||||||
| Percentage of Votes Cast: | 90.80 | % | 4.66 | % | 4.54 | % | 100.00 | % | ||||||
Select Growth Fund: | Number of Votes Cast: | 251,570,053 | 10,983,809 | 18,553,557 | 281,107,419 | |||||||||
| Percentage of Votes Cast: | 89.49 | % | 3.91 | % | 6.60 | % | 100.00 | % | ||||||
Select Capital Appreciation Fund: | Number of Votes Cast: | 111,816,888 | 5,686,589 | 8,318,556 | 125,822,033 | |||||||||
| Percentage of Votes Cast: | 88.87 | % | 4.52 | % | 6.61 | % | 100.00 | % | ||||||
Equity Index Fund: | Number of Votes Cast: | 166,275,880 | 8,224,824 | 12,249,957 | 186,750,661 | |||||||||
| Percentage of Votes Cast: | 89.04 | % | 4.40 | % | 6.56 | % | 100.00 | % | ||||||
Select Value Opportunity Fund: | Number of Votes Cast: | 144,758,643 | 5,870,748 | 11,598,914 | 162,228,305 | |||||||||
| Percentage of Votes Cast: | 89.23 | % | 3.62 | % | 7.15 | % | 100.00 | % | ||||||
Government Bond Fund: | Number of Votes Cast: | 90,416,110 | 3,672,219 | 6,026,908 | 100,115,237 | |||||||||
| Percentage of Votes Cast: | 90.31 | % | 3.67 | % | 6.02 | % | 100.00 | % | ||||||
Select Investment Grade Income | Number of Votes Cast: | 291,462,379 | 9,929,7073 | 24,864,202 | 326,256,288 | |||||||||
Fund: | Percentage of Votes Cast: | 89.34 | % | 3.04 | % | 7.62 | % | 100.00 | % | |||||
Money Market Fund: | Number of Votes Cast: | 215,890,584 | 12,548,073 | 26,181,615 | 254,620,272 | |||||||||
| Percentage of Votes Cast: | 84.79 | % | 4.93 | % | 10.28 | % | 100.00 | % |
F-53
Table of Contents
ALLMERICA INVESTMENT TRUST
BOARD OF TRUSTEES At December 31, 2005 (Unaudited)
Name, Address and Age(1) | Position(s) Held With Trust | Term of Office | Principal Occupation(s) During Past 5 Years(2) | Number of Portfolios in Fund Complex Overseen by Trustee | Other Directorships Held by Trustee | |||||
P. Kevin Condron (60) | Trustee, Member of the Audit Committee, Fund Operations Committee, Governance Committee and Investment Operations Committee | Indefinite Served Since 1997 | President and Chief Executive Officer, The Granite Group (wholesale plumbing and heating), 1997-present. | 11 | Director, Banknorth Group. | |||||
Jocelyn S. Davis (52) | Trustee, Member of the Audit Committee, Fund Operations Committee, Governance Committee and Investment Operations Committee | Indefinite Served Since 2001 | President, Nelson Hart, LLC (consulting), 2002-present; Beers & Cutler (professional services), 2001-2002; Chief Financial Officer, AARP (non-profit), 1996-2001. | 11 | None | |||||
Cynthia A. Hargadon (50) | Trustee, Chairperson of the Fund Operations Committee, Member of the Audit Committee, Investment Operations Committee and Governance Committee | Indefinite Served Since 1997 | Chief Investment Officer, North Point Advisors LLC (consulting), 2003-present; President, Hargadon Associates (asset management consulting), 2002-2003; President, Potomac Asset Management, Inc., 2000-2002; Director of Investments, National Automobile Dealers Association, 1999-2000. | 11 | Director, Wilshire Target Funds, 2001-present, Wilshire VIT Funds, 2004-present.* | |||||
Gordon Holmes (67) | Trustee, Chairman of the Audit Committee and Member of the Fund Operations Committee, Investment Operations Committee and Governance Committee | Indefinite Served Since 1991 | Instructor at Bentley College, 1998-present; Certified Public Accountant; Retired Partner, Tofias, Fleishman, Shapiro & Co., P.C. (Accountants). | 11 | None | |||||
Ranne P. Warner (60) | Trustee, Chairman of the Governance Committee, Member of the Fund Operations Committee, Investment Operations Committee and Governance Committee | Indefinite Served Since 1991 | President, Centros Properties, USA; Owner, Ranne P. Warner and Company; Blackston Exchange LLC (real estate) 2001-present. | 11 | Director, Wainwright Bank & Trust Co. (commercial bank). | |||||
| * | The number of funds overseen by Ms. Hargadon at Wilshire Target Funds and Wilshire VIT Funds is five (5) and seven (7), respectively. |
F-54
Table of Contents
ALLMERICA INVESTMENT TRUST
BOARD OF TRUSTEES At December 31, 2005 (Unaudited) (continued)
Name, Address and Age(1) | Position(s) Held With Trust | Term of Office and Length of Time Served | Principal Occupation(s) | Number of Portfolios in Fund Complex Overseen by Trustee | Other Directorships Held by Trustee | |||||
*John P. Kavanaugh (51) | Chairman, Trustee and President, Chairman of the Investment Operations Committee | 1 Year Term Indefinite Term as Trustee Served Since 1995 | President, Opus Investment Management, Inc.. (“OIM”); Vice President, Director, Chief Investment Officer, First Allmerica Financial Life Insurance Company (“First Allmerica”) and Allmerica Financial Life Insurance and Annuity Company (“Allmerica Financial Life”). | 11 | None | |||||
*Edward J. Parry, III (46) | Trustee, Member of the Investment Operations Committee | 1 Year Term Served Since 2004 | Executive Vice President, Director, Chief Financial Officer, Allmerica Financial Corporation, First Allmerica and Allmerica Financial Life. | 11 | None | |||||
| * | Messrs. Kavanaugh and Parry are “interested persons”, as defined in the Investment Company Act of 1940 as amended (the “1940 Act”), of the Trust and of The Hanover Insurance Group (“Hanover”) because of their affiliations with Hanover. |
| (1) | The business address of each person is 440 Lincoln Street, Worcester, Massachusetts 01653. |
| (2) | Except as otherwise noted, each individual has held the office indicated or other offices in the same organization for the last five years. |
The Statement of Additional Information of Allmerica Investment Trust (“SAI”) contains additional information about the Board of Trustees and is available without charge upon request. You may request a copy of the SAI by contacting us at the phone number listed on the back cover of this report.
F-55
Table of Contents
ALLMERICA INVESTMENT TRUST
REGULATORY DISCLOSURES (Unaudited)
The performance data quoted represents past performance and the investment return and principal value of an investment will fluctuate so that an investor’s shares, when redeemed, may be worth more or less than their original cost.
An investment in the Money Market Fund (the “Portfolio”) is not insured or guaranteed by the Federal Deposit Insurance Corporation or any other government agency. Although the Portfolio seeks to preserve the value of your investment at a stable net asset value of $1.00 per share, it is possible to lose money by investing in the Portfolio.
Securities issued by some U.S. Government-sponsored entities, such as the Federal Home Loan Mortgage Corporation (Freddie Mac) and the Federal National Mortgage Association (Fannie Mae), are not backed by the full faith and credit of the U.S. Government. No assurances can be given that the U.S. Government would provide financial support to a U.S. Government-sponsored instrumentality if not obligated to do so.
This report and the financial statements contained herein are submitted for the general information of the shareholders of the Portfolios of Allmerica Investment Trust (the “Trust”) and are not authorized for distribution to prospective investors in the flexible premium variable life insurance or annuity products of Allmerica Financial Life Insurance and Annuity Company (“Allmerica Financial”) or First Allmerica Financial Life Insurance Company (“First Allmerica”) unless accompanied or preceded by effective prospectuses for the flexible premium variable life insurance or annuity products of Allmerica Financial or First Allmerica, and the Trust which include important information related to charges and expenses.
The Trust files complete schedules of portfolio holdings of the Portfolios of the Trust with the Securities and Exchange Commission for the first and third quarters of each fiscal year on Form N-Q. The Trust’s Forms N-Q are available on the SEC’s website at http://www.sec.gov. The Trust’s Forms N-Q may be reviewed and copied at the SEC’s Public Reference Room in Washington, DC. Information regarding the operation of the Public Reference Room may be obtained by calling the Commission at 1-800-SEC-0330.
Descriptions of the policies and procedures that the Portfolios of the Trust use to determine how to vote proxies relating to portfolio securities are available via the following methods:
| (i) | Without charge, upon request, by calling 1-800-533-7881; |
| (ii) | On each of the following websites: |
http://www.allmerica.com/afs/account/index.htm
http://www.allmerica.com/select/index.htm
http://www.allmerica.com/afs/abs/index.htm;
| (iii) | On the Securities and Exchange Commission website at http://www.sec.gov. |
Information regarding how the Portfolios of the Trust voted proxies relating to portfolio securities during the most recent 12-month period ended June 30 is available via the methods noted above.
This report includes financial statements for Allmerica Investment Trust. It does not include financial statements for the separate accounts that correspond to the insurance and/or annuity products included in this report.
The SEC has modified mailing requirements for annual and semi-annual reports to allow a single copy of this report to be delivered to customers who share the same last name and address. This will automatically apply to all customers. If you would prefer to receive your own copy, please notify us at the phone number listed on the back cover of this report.
F-56
Table of Contents

440 Lincoln Street, Worcester, MA 01653, Phone 508-855-1000, Fax 508-853-6332, www.allmerica.com
THE ALLMERICA COMPANIES
The Hanover Insurance Company Ÿ Citizens Insurance Company of America Ÿ Citizens Management Inc.
Opus Investment Management, Inc. Ÿ AMGRO, Inc. Ÿ Financial Profiles, Inc. Ÿ VeraVest Investments, Inc.
Allmerica Financial Life Insurance and Annuity Company Ÿ First Allmerica Financial Life Insurance Company
05-0141
Table of Contents
| Item 2. | Code of Ethics |
As of the end of the period covered by this report, the registrant has adopted a code of ethics that applies to the registrant’s principal executive officer and principal financial/principal accounting officer.
| Item 3. | Audit Committee Financial Expert |
The registrant’s Board of Trustees has determined that Gordon Holmes, who is an “independent” Trustee (as such term is defined by the Securities and Exchange Commission (“SEC”) in regulations implementing Section 407 of the Sarbanes-Oxley Act of 2002 (the “Regulations”)), qualifies as an “audit committee financial expert” (as such term has been defined in the SEC Regulations).
The SEC has stated that the designation or identification of a person as an audit financial expert pursuant to this Item 3 of Form N-CSR does not impose on such person any duties, obligations or liability that are greater than the duties, obligations and liability imposed on such person as a member of the Audit Committee and the Board of Trustees in the absence of such designation or identification.
| Item 4. | Principal Accountant Fees and Services |
| Audit Fees | Types of Services | Percentage of Services Approved by the Audit Committee under the De Minimus Exception (defined below) | ||||||
| 2005 | $ | 351,000 | — | |||||
| 2004 | $ | 328,000 | — | |||||
| Audit-Related Fees | ||||||||
| 2004 | $ | 0 | 0 | % | ||||
| 2003 | $ | 0 | 0 | % | ||||
| Tax Fees | ||||||||
| 2005 | $ | 27,400 | Tax return review | 0 | % | |||
| 2004 | $ | 36,400 | Tax return review | 0 | % | |||
| All Other Fees | ||||||||
| 2004 | $ | 0 | 0 | % | ||||
| 2003 | $ | 0 | 0 | % | ||||
All fees disclosed above under the captions “Audit-Related Fees,” “Tax Fees,” and “All Other Fees” represent fees billed for services that were required to be pre-approved, and which were so pre-approved, by the registrant’s Audit Committee in accordance with the Audit Committee’s Policy for Pre-Approval of Services Provided by Independent Auditors.
For the last two fiscal years of the registrant, the independent accountants billed aggregate non-audit fees in the following amounts to the registrant and Allmerica Financial Investment Management Services, Inc. (“AFIMS”), the Trust’s investment adviser:
| 2005 | $ | 27,400 | |||||
| 2004 | $ | 36,400 |
The registrant’s Audit Committee has determined that the provision by the registrant’s independent accountants of non-audit services that were rendered to AFIMS and that were not pre-approved by the Audit Committee were compatible with maintaining the independence of such accountants.
Table of Contents
The following table presents fees billed by the registrant’s independent accountants for services required to be approved pursuant to paragraph (c)(7)(ii) of Rule 2-01 of Regulation S-X.
| Audit-Related Fees | Tax Fees | All Other Fees | Total Non-Audit Fees | Percentages of services approved by Audit Committee | ||||||||||
| 2004 | $ | 0 | $ | 0 | $ | 0 | $ | 0 | — | |||||
| 2003 | $ | 0 | $ | 0 | $ | 0 | $ | 0 | — | |||||
The Audit Committee has adopted certain policies and procedures for pre-approval of services provided by the independent accountants. On an annual basis, certain types of recurring audit, audit-related and other services are pre-approved by the Committee, including, among other things, the list of required audits and projects presented by the independent accountants; consultation and advisory services related to accounting/reporting and risk management/control matters provided in the normal course of business; and assistance with SEC and other regulatory filings and tax services incurred in the normal course of business. This pre-approval will occur concurrently with the approval of the annual audit fees and will apply to all individual projects meeting the criteria discussed above and which are expected to result in total fees less than $400,000. For individual projects outside the scope of the fiscal year audits and tax return filings expected to be $25,000 or greater, specific pre-approval will be necessary.
Pre-approvals for all other services will occur if and when the need for any such services arises. This pre-approval will be initiated by AFIMS and will be requested from the Chairman or, in the event the Chairman is unavailable, any other member of the Audit Committee. Any services approved by the Chairman, or other Audit Committee member, at any time other than during an Audit Committee meeting will be reported to the full Audit Committee at the next regularly scheduled meeting. Expenses permitted under Rule 2-01(c)(7)(i)(C) of Regulation S-X (the “De Minimis Exception”) will not require pre-approval.
| Item 5. | Audit Committee of Listed Registrants |
Not Applicable
| Item 6. | Schedule of Investments |
The Schedule referenced in this Item 6 of Form N-CSR is included as part of the report to shareholders filed under Item 1 of the Form N-CSR.
| Item 7. | Disclosure of Proxy Voting Policies and Procedures for Closed-End Management Investment Companies |
Not Applicable
| Item 8. | Portfolio Managers of Closed-End Management Investment Companies |
Not Applicable
| Item 9. | Purchases of Equity Securities by Closed-End Management Investment Company and Affiliated Purchasers |
Not Applicable
| Item 10. | Submission of Matters to a Vote of Security Holders |
Material changes to the procedures by which shareholders may recommend nominees to the Board of Trustees: Not Applicable
Table of Contents
| Item 11. | Controls and Procedures |
| (a) | The registrant’s principal executive and principal financial officers have concluded that, based on their evaluation of the effectiveness of the registrant’s disclosure controls and procedures (as defined in Rule 30a-3(c) under the Investment Company Act of 1940) as of a date within 90 days of the filing date of this report on Form N-CSR, such disclosure controls and procedures provide reasonable assurances that material information relating to the registrant is made known to them by the appropriate persons. |
| (b) | Changes to internal control over financial reporting: Not Applicable |
| Item 12. | Exhibits |
| (a) (1) | Code of Ethics that applies to the registrant’s principal executive officer and principal financial/ principal accounting officer is attached as Exhibit 99.CODE. |
| (2) | Separate certifications by the registrant’s principal executive officer and principal financial officer, pursuant to Section 302 of the Sarbanes-Oxley Act of 2002 and as required by Rule 30a-2(a) under the Investment Company Act of 1940, are attached hereto as Exhibit 99.CERT. |
| (b) | A certification by the registrant’s principal executive officer and principal financial officer, pursuant to Section 906 of the Sarbanes-Oxley Act of 2002 and as required by Rule 30a-2(b) under the Investment Company Act of 1940 is attached hereto as Exhibit 99.CERTB. |
Table of Contents
Signatures
Pursuant to the requirements of the Securities Exchange Act of 1934 and the Investment Company Act of 1940, the registrant has duly caused this report to be signed on its behalf by the undersigned, thereunto duly authorized.
| Allmerica Investment Trust | ||||||||
Date: February 28, 2006 | By: | /s/ John P. Kavanaugh | ||||||
John P. Kavanaugh | ||||||||
President and Chairman | ||||||||
Pursuant to the requirements of the Securities Exchange Act of 1934 and the Investment Company Act of 1940, this report has been signed below by the following persons on behalf of the registrant and in the capacities and on the dates indicated.
Date: February 28, 2006 | By: | /s/ John P. Kavanaugh | ||||||
John P. Kavanaugh | ||||||||
President and Chairman | ||||||||
Date: February 28, 2006 | By: | /s/ Paul S. Bellany | ||||||
Paul S. Bellany | ||||||||
Assistant Vice President and Treasurer | ||||||||
(Principal Accounting Officer and Principal Financial Officer) | ||||||||