Table of Contents
UNITED STATES
SECURITIES AND EXCHANGE COMMISSION
Washington, D.C. 20549
FORM N-CSR
CERTIFIED SHAREHOLDER REPORT OF REGISTERED MANAGEMENT
INVESTMENT COMPANIES
Investment Company Act file number 811-04138
Allmerica Investment Trust
(Name of Registrant)
440 Lincoln Street
Worcester, Massachusetts 01653
(Address of Principal Executive Offices)
George M. Boyd, Trust Secretary
Allmerica Financial
440 Lincoln Street
Worcester, MA 01653
(Name and Address of Agent for Service)
Registrant’s Telephone Number, including Area Code: (508) 855-1000
Date of Fiscal Year End: December 31
Date of Reporting Period: June 30, 2004
Table of Contents
| Item 1. | Reports to Stockholders |
The following is a copy of the report transmitted to stockholders pursuant to Rule 30e-1 under the Investment Company Act of 1940:
Allmerica Investment Trust
Semi-Annual Report
June 30, 2004
Allmerica Investment Trust – Money Market Fund
Semi-Annual Report
June 30, 2004
Table of Contents
| Allmerica Financial | Semi-Annual Report | |
| June 30, 2004 | ||
| Allmerica Investment Trust | ||
| [GRAPHIC] | 2004 | |
[GRAPHIC]
Table of Contents
Table of Contents
A Letter from the Chairman | 1 | |
Select Capital Appreciation Fund | 2 | |
Select Value Opportunity Fund | 3 | |
Select International Equity Fund | 4 | |
Select Growth Fund | 5 | |
Core Equity Fund | 6 | |
Equity Index Fund | 7 | |
Select Investment Grade Income Fund | 8 | |
Government Bond Fund | 9 | |
Money Market Fund | 10 | |
Financials | F-1 | |
For information on ordering additional copies of this report, see Client Notices on page F-47.
One or more Funds may not be available under the variable annuity or variable life insurance policy which you have chosen. Inclusion in this report of a Fund which is not available under your policy is not to be considered a solicitation.
Table of Contents
A Letter from the Chairman
Dear Client:
The first half of 2004 brought mixed news for the global economy. In the United Kingdom, consumer and mortgage credit continued to grow at a brisk pace with minimal signs of inflation, as the jobless rate dropped further. Unemployment remained high in France and Germany, as signs of recovery were muted in mainland Europe. Fueled by exploding growth in China and India, many Asian economies performed well, led by Thailand, Singapore and Malaysia. Domestic oriented companies helped stimulate stronger than expected growth in Japan. European stock markets held up relatively well as Germany’s DAX Index rose 2.21%, England’s FTSE Index gained 1.85% and France’s CAC 40 Index was up 7.25%. Asian stock markets were mixed, as Japan’s Nikkei Average finished the period up 11.58%, while Hong Kong’s Hang Seng Index was lower by 0.29%.
The United States economy turned in a solid performance during the first six months of 2004. First quarter GDP came in at 3.9% and growth for the full period is expected to be in the same range. The long-awaited growth in jobs finally began to occur during the first half of the year. After starting slowly, non-farm payroll gains averaged over 200,000 per month in the second quarter, persuading many that a traditional economic recovery was under way. Consumer spending remained strong, industrial production ramped up and business investment increased, while core producer prices came in slightly higher than expected. Core inflation also edged higher during the period, partially as a result of the voracious demand for raw materials from China and other recovering economies. These and other strong economic statistics caused many analysts to conclude that the Federal Reserve Board would need to raise interest rates sooner, rather than later, in order to head off a rapid rise in inflation. In late June, these concerns were realized, as the Federal Reserve Board raised its target for the federal funds rate by 0.25%, to 1.25%. Gas prices at the pump climbed to over $2.00 a gallon, as oil prices rose significantly in the first quarter, then fell back slightly during the second quarter. Several analysts expressed concern that higher oil prices might dampen the surging domestic economy. U.S. securities markets finished the first six months of 2004 with small gains. The S&P 500® Index rose 3.44% and the Nasdaq Composite Index was higher by 2.22%. Bonds struggled as interest rates ticked higher. For the period, the Lehman Brothers Aggregate Bond Index managed a gain of only 0.15%.
All of the Allmerica Investment Trust equity funds achieved positive results for the first half of 2004, led by the Select Capital Appreciation and Select Value Opportunity funds, which each gained more than 7%. On the fixed income side, higher interest rates adversely affected returns. The Select Investment Grade Income and Government Bond funds each reported slight declines.
On behalf of the Board of Trustees,

John P. Kavanaugh
Chairman of the Board
Allmerica Investment Trust
1
Table of Contents
Select Capital Appreciation Fund
The Select Capital Appreciation Fund returned 7.86% for the first half of 2004, outperforming its benchmark, the Russell Midcap Index, which returned 6.67%.
U.S. stocks extended last year’s rally during the first half of the year, although gains were more modest. Most indexes closed below their highest levels of the year, as positive investor sentiment was tempered by concerns about inflation, high oil prices, and rising interest rates. Mid-cap stocks outperformed their larger peers, and value stocks surpassed growth. Information technology, industrials and business services, energy, and telecommunications contributed positively, while the consumer discretionary and materials sectors weighed on performance. Information technology was the best relative performer, although a more modest absolute gainer for the fund. Strength among communications equipment and software holdings aided relative performance. Continued economic strength benefited industrials and business services holdings and the fund’s education holdings also performed well. The energy sector was the second-best performer in the index, behind consumer staples. Strong commodity prices continued to benefit the sector and drilling activity is increasing. A continued overweight in this sector and effective stock selection bolstered relative performance. Media stocks hampered relative performance in the consumer discretionary sector, as a slower-than-expected recovery in radio advertising spending hurt holdings. Retail stocks, especially discounters, were weak over concerns about consumer spending in a rising interest rate environment. The materials sector was a relative detractor due to the fund’s metals and mining holdings.
Despite some risks, the economy and corporate profits appear strong, providing a moderately positive backdrop for stocks. The investment sub-adviser continues to see opportunities in the marketplace and believes that the portfolio is well-positioned for the current environment.
The performance data quoted represents past performance. Past performance does not guarantee future results. The investment return and principal value of an investment will fluctuate so that an investor’s shares, when redeemed, may be worth more or less than their original cost. Current performance may be lower or higher than the performance data quoted. For information on the current month end performance of variable annuity and variable life insurance products, please call: (800) 533-7881. The performance data quoted is net of all fund operating expenses, but does not include variable insurance or variable annuity charges. If the performance data included the effect of these additional charges, it would have been lower.
Average Annual Total Returns
| 1 Year | 5 Year | Life of Fund | ||||
Select Capital Appreciation Fund | 26.77% | 6.90% | 13.08% | |||
Russell Midcap Index | 29.40% | 6.51% | 12.98% | |||
Lipper Mid-Cap Growth Funds Average | 24.45% | 1.08% | 8.97% | |||
Growth of a $10,000 Investment Since 1995

The Select Capital Appreciation Fund is a portfolio of Allmerica Investment Trust. Portfolio composition will vary over time.
The Russell Midcap Index measures the performance of the 800 smallest companies in the Russell 1000 Index. The Lipper Mid-Cap Growth Funds Average is a non-weighted average of funds within the mid-cap growth investment objective.
Performance prior to 4/1/98 is that of a prior Sub-Adviser.
Investment Sub-Adviser
T. Rowe Price Associates, Inc.
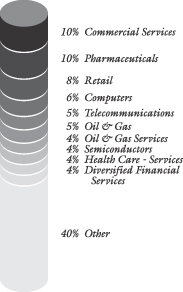
About the Fund
Seeks long-term growth of capital by investing primarily in mid-cap growth stocks selling at reasonable prices.
Portfolio Composition
As of June 30, 2004, the sector allocation of net assets was:
2
Table of Contents
Select Value Opportunity Fund
The Select Value Opportunity Fund returned 7.07% for the first half of 2004, outperforming its benchmark, the Russell 2500 Value Index, which returned 6.71%.
Major contributors to performance during the period included the dominant managed care company in the Las Vegas market, a manager of real estate, energy and alternative financial assets, a major cruise line with rising earnings estimates and a software company focused mainly on business performance management applications. Detractors included an operator of radio stations, a pasta maker whose sales volume was hurt by greater than expected acceptance of low carbohydrate diets in the United States, a major disk drive supplier impacted by weakness in the disk drive end market and a video game provider hit by slow expansion and continued lackluster results in the video rental business. Additions to the fund during the first half of the year included the leading producer of methanol, a leading provider of mechanic’s tools, a diversified insurance holding company that was recently divested by its European parent, a petrochemical producer with expanding margins, a manufacturer of fire, garbage, cement and military trucks and a high- end niche retailer. Sales during the last two quarters included several companies that had reached established price targets and a financial firm whose management had hired investment bankers to explore a sale of the company.
The investment sub-adviser believes that company-specific execution remains the overriding driver of individual stock performance. As is often the case when investing in companies undergoing strategic change, the investment sub-adviser believes that patience, combined with a process to differentiate between fundamental deterioration and temporary operating setbacks, remains critical to long-term investing success.
The performance data quoted represents past performance. Past performance does not guarantee future results. The investment return and principal value of an investment will fluctuate so that an investor’s shares, when redeemed, may be worth more or less than their original cost. Current performance may be lower or higher than the performance data quoted. For information on the current month end performance of variable annuity and variable life insurance products, please call: (800) 533-7881. The performance data quoted is net of all fund operating expenses, but does not include variable insurance or variable annuity charges. If the performance data included the effect of these additional charges, it would have been lower.
Average Annual Total Returns
| 1 Year | 5 Year | 10 Year | ||||
Select Value Opportunity Fund | 31.43% | 10.48% | 13.07% | |||
Russell 2500 Value Index | 33.90% | 11.92% | 14.66% | |||
Lipper Mid-Cap Value Funds Average | 31.33% | 9.27% | 13.19% | |||
Growth of a $10,000 Investment Since 1994
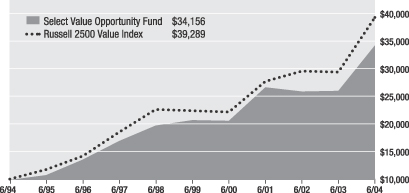
The Select Value Opportunity Fund is a portfolio of Allmerica Investment Trust. Portfolio composition will vary over time.
The Russell 2500 Value Index is a capitalization weighted index measuring the performance of those Russell 2500 companies with lower price-to-book ratios and lower forecasted growth values. The Lipper Mid-Cap Value Funds Average is a non-weighted average of mid-cap value funds.
Performance prior to 1/1/97 is that of a prior Sub-Adviser.
Investment Sub-Adviser
Cramer Rosenthal McGlynn, LLC
About the Fund
Seeks long-term growth of capital by investing primarily in small and mid-sized companies believed to be undervalued.
Portfolio Composition
As of June 30, 2004, the sector allocation of net assets was:

3
Table of Contents
Select International Equity Fund
The Select International Equity Fund returned 1.99% for the first half of 2004, underperforming its benchmark, the MSCI EAFE Index, which returned 4.86%.
Equity markets posted moderate gains for the first six months of 2004 against a backdrop of improved economic conditions. The U.S.A., Japan and China produced much of the economic vigor that buoyed corporate earnings prospects and underpinned equity market advances. European markets were supported by low domestic interest rates and demand for their exports. Although the rate of growth has not been at a pace with that witnessed in much of the world, there is evidence of momentum building in parts of the Eurozone economy. German companies bolstered fund performance during the period, as a large luxury auto maker reported record American sales and Europe’s second-largest utility posted significant growth in its core energy business. Several consumer staples stocks aided fund performance, as did a large South Korean consumer-electronics manufacturer. The fund’s relative underweight exposure to the hot energy sector weighed somewhat on overall returns. The fund’s overweight position in the poorly performing information technology sector also detracted from performance, as did the negative results turned in by some stocks in the telecommunication services sector.
The investment sub-adviser feels that the assumed pace of expansion in the U.S. economy may be optimistic, but does not anticipate higher interest rates in Europe or Japan any time soon. The investment sub-adviser believes that equities continue to offer good value relative to other asset classes, but feels that terrorism, a disruption in oil supplies or a sharper-than-intended slowdown in China’s economy are factors that could upset this upbeat outlook.
The performance data quoted represents past performance. Past performance does not guarantee future results. The investment return and principal value of an investment will fluctuate so that an investor’s shares, when redeemed, may be worth more or less than their original cost. Current performance may be lower or higher than the performance data quoted. For information on the current month end performance of variable annuity and variable life insurance products, please call: (800) 533-7881. The performance data quoted is net of all fund operating expenses, but does not include variable insurance or variable annuity charges. If the performance data included the effect of these additional charges, it would have been lower.
Average Annual Total Returns
| 1 Year | 5 Year | 10 Year | ||||
Select International Equity Fund | 22.59% | (1.56)% | 5.84% | |||
MSCI EAFE Index | 32.85% | 0.40% | 4.38% | |||
Lipper International Core Funds Average | 28.48% | 0.38% | 5.13% | |||
Growth of a $10,000 Investment Since 1994
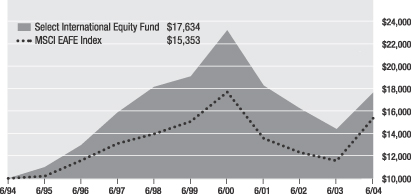
The Select International Equity Fund is a portfolio of Allmerica Investment Trust. Portfolio composition will vary over time.
Special risk considerations are associated with investments in non-U.S. companies, including fluctuating foreign exchange rates, foreign governmental regulations and differing degrees of liquidity that may adversely affect the portfolio.
The MSCI EAFE Index is an unmanaged index of European, Australian and Far Eastern stocks. The Lipper International Core Funds Average is a non-weighted average of funds within the international core fund category.
Investment Sub-Adviser
Bank of Ireland Asset Management (U.S.) Ltd.
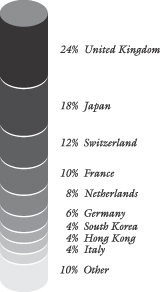
About the Fund
Seeks maximum long-term total return by investing in non-U.S. companies based on fundamental value.
Portfolio Composition
As of June 30, 2004, the country allocation of net assets was:
4
Table of Contents
Select Growth Fund
The Select Growth Fund returned 1.60% for the first half of 2004, underperforming its benchmark, the Russell 1000 Growth Index, which returned 2.74%.
In the Jennison Associates LLC portion of the fund, consumer staples, information technology, energy and health care were the best performing sectors. A high-quality organic food retailer, a large internet portal, a major producer of electronic games, a prominent biotechnology firm and a large oil services company were among the fund’s top performers. The consumer discretionary and financials sectors were the main detractors from performance. Specialty retailers and media companies were hurt by concerns about consumer spending and weakness in advertising spending, respectively. The fund’s capital market holdings were negatively affected by the anticipation of rising interest rates. The investment sub-adviser feels that its holdings trade at an appropriate premium to the market relative to projected earnings growth for the next two years.
GE Asset Management Inc. replaced Putnam Investment Management, LLC as co-sub-adviser of the fund effective April 30, 2004. During the period that Putnam Investment Management, LLC managed its portion of the fund, performance was hampered by an overweight exposure to the technology sector. Stock selection in the consumer staples, financial and consumer cyclical sectors benefited performance. During the period that GE Asset Management Inc. managed its portion of the fund, the consumer staples sector contributed most to performance, while the underweighted industrials sector adversely affected performance. The fund’s primary holding in the telecommunications sector detracted from performance as did the fund’s information technology holdings. The investment sub-adviser feels that the portfolio remains well positioned for good relative performance and that its investment philosophy should continue to drive long-term outperformance.
The performance data quoted represents past performance. Past performance does not guarantee future results. The investment return and principal value of an investment will fluctuate so that an investor’s shares, when redeemed, may be worth more or less than their original cost. Current performance may be lower or higher than the performance data quoted. For information on the current month end performance of variable annuity and variable life insurance products, please call: (800) 533-7881. The performance data quoted is net of all fund operating expenses, but does not include variable insurance or variable annuity charges. If the performance data included the effect of these additional charges, it would have been lower.
Average Annual Total Returns
| 1 Year | 5 Year | 10 Year | ||||
Select Growth Fund | 16.00% | (7.36)% | 8.05% | |||
Russell 1000 Growth Index | 17.89% | (6.48)% | 10.12% | |||
Lipper Large-Cap Growth Funds Average | 16.68% | (4.99)% | 9.21% | |||
Growth of a $10,000 Investment Since 1994
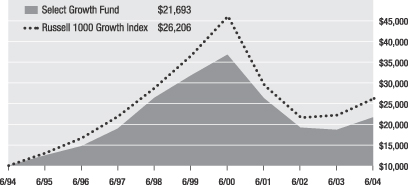
The Select Growth Fund is a portfolio of Allmerica Investment Trust. Portfolio composition will vary over time.
The Russell 1000 Growth Index measures the performance of those Russell 1000 companies with higher price-to-book ratios and higher forecasted growth values. The Lipper Large-Cap Growth Funds Average is a non-weighted average of funds within the large-cap growth investment objective.
GE Asset Management Inc. became a Co-Sub-Adviser of the fund effective April 30, 2004.
Jennison Associates LLC became a Co-Sub-Adviser of the fund effective April 18, 2003.
Performance prior to these dates is that of prior Sub-Advisers.
Investment Sub-Advisers
GE Asset Management Inc.
Jennison Associates LLC
About the Fund
Seeks long-term growth of capital by investing in companies believed to have long-term growth potential.
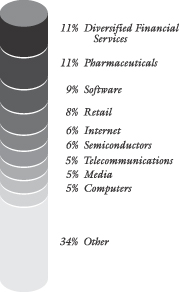
Portfolio Composition
As of June 30, 2004, the sector allocation of net assets was:
5
Table of Contents
Core Equity Fund
The Core Equity Fund returned 2.44% for the first half of 2004, underperforming its benchmark, the Russell 1000 Index, which returned 3.32%.
In the Goldman Sachs Asset Management, L.P. portion of the fund, specific technology holdings benefited performance. A large cellular telephone manufacturer, a major internet portal and the premier on-line auction site were strong, as their growth prospects were supported by long-term secular trends. The investment sub-adviser recently boosted the fund’s allocation to the consumer staples sector, which also aided performance. Companies exposed to radio advertising detracted from performance, while some other media holdings performed well. Two large health care companies hurt performance as legal and product issues caused investor concern. The investment sub-adviser believes that its continued focus on businesses with strong franchises, favorable long-term prospects, and excellent management, should generate superior returns over the long term.
In the UBS Global Asset Management (Americas) Inc. portion of the fund, risk exposure was neutral to slightly lower than that of the benchmark. Benefiting performance were a significant overweight position in the top performing wireless communications sector and an underweight position in the poor performing media sector. The fund’s bias toward the health care and utilities sectors was a slight drag on relative performance. The potential impact of drug re-importation programs hampered pharmaceuticals, while rising interest rates made investors wary of utilities. Underweighting the energy sector also detracted from results, as skyrocketing oil prices drove shares higher. In order to produce attractive risk-adjusted returns, the investment sub-adviser intends to utilize its disciplined, bottom-up stock selection process to invest in stocks trading below their perceived intrinsic value.
The performance data quoted represents past performance. Past performance does not guarantee future results. The investment return and principal value of an investment will fluctuate so that an investor’s shares, when redeemed, may be worth more or less than their original cost. Current performance may be lower or higher than the performance data quoted. For information on the current month end performance of variable annuity and variable life insurance products, please call: (800) 533-7881. The performance data quoted is net of all fund operating expenses, but does not include variable insurance or variable annuity charges. If the performance data included the effect of these additional charges, it would have been lower.
Average Annual Total Returns
| 1 Year | 5 Year | 10 Year | ||||
Core Equity Fund | 17.04% | (3.87)% | 9.18% | |||
Russell 1000 Index | 19.47% | (1.65)% | 11.83% | |||
Lipper Large-Cap Core Funds Average | 16.87% | (2.84)% | 9.15% | |||
Growth of a $10,000 Investment Since 1994
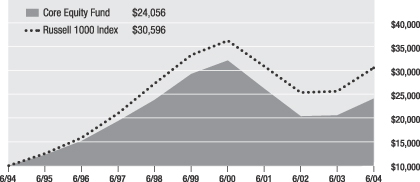
The Core Equity Fund is a portfolio of Allmerica Investment Trust. Portfolio composition will vary over time.
The Russell 1000 Index measures the performance of the 1,000 largest companies in the Russell 3000 Index. The Lipper Large-Cap Core Funds Average is a non-weighted average of funds within the large-cap core investment objective.
Performance prior to May 1, 2002 is that of a prior Sub-Adviser.
Investment Sub-Advisers
Goldman Sachs Asset Management, L.P.
UBS Global Asset Management (Americas) Inc.
About the Fund
Seeks long-term growth of capital by investing in stocks that are believed to represent significant underlying value.
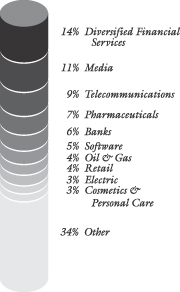
Portfolio Composition
As of June 30, 2004, the sector allocation of net assets was:
6
Table of Contents
Equity Index Fund
The Equity Index Fund returned 3.17% for the first half of 2004, underperforming its benchmark, the S&P 500® Index, which returned 3.44%.
With the economic recovery gaining steam at the end of 2003, the outlook for the equity market in 2004 was positive. Fiscal and monetary stimuli caused the business sector to finally begin spending and low interest rates brought about a refinancing boom in the housing market. Gross domestic product and key manufacturing reports were strong, indicating to many that the recovery was here to stay. But, looming inflation and high oil prices worried investors, offsetting the positive economic data and causing the equity markets to remain relatively flat for the period. Within the fund, the best performers were the energy, casino and gaming, and wireless telecommunication sectors. Amid higher oil prices, the energy sector showed strong gains, and the casino and gaming sector benefited from an increase in demand. Bringing down performance were the auto manufacturing, railroad, and media sectors. U.S. auto manufacturers lost additional market share to foreign automakers and fears of lower SUV sales due to increasing oil prices forced automakers to increase rebates, hurting profits. The railroad sector suffered from increasing train delays, poor earnings reports, and escalating terrorism fears.
The investment sub-adviser feels that equities are positioned for a rally in the second half of 2004. Third and fourth quarter GDP is projected to show solid growth and many firms plan to increase employment over the next six months. The investment sub-adviser thinks that this bullish outlook should directly benefit consumer spending, as more jobs may be created to meet the higher expected demand.
The performance data quoted represents past performance. Past performance does not guarantee future results. The investment return and principal value of an investment will fluctuate so that an investor’s shares, when redeemed, may be worth more or less than their original cost. Current performance may be lower or higher than the performance data quoted. For information on the current month end performance of variable annuity and variable life insurance products, please call: (800) 533-7881. The performance data quoted is net of all fund operating expenses, but does not include variable insurance or variable annuity charges. If the performance data included the effect of these additional charges, it would have been lower.
Average Annual Total Returns
| 1 Year | 5 Year | 10 Year | ||||
Equity Index Fund | 18.46% | (2.49)% | 11.35% | |||
S&P 500® Index | 19.10% | (2.21)% | 11.83% | |||
Lipper S&P 500 Index Objective Funds Average | 18.54% | (2.54)% | 11.44% | |||
Growth of a $10,000 Investment Since 1994
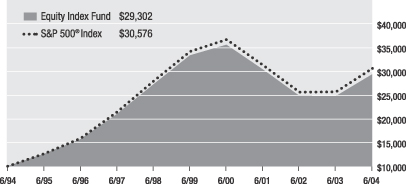
The Equity Index Fund is a portfolio of Allmerica Investment Trust. Portfolio composition will vary over time.
The S&P 500® Index is an unmanaged index of 500 leading stocks. S&P 500® Index is a registered trademark of The McGraw-Hill Companies, Inc. The Lipper S&P 500 Index Objective Funds Average is a non-weighted average of funds within the S&P 500® Index investment objective.
Investment Sub-Adviser
Opus Investment Management, Inc.
About the Fund
Seeks to replicate the return of the S&P 500® Index.
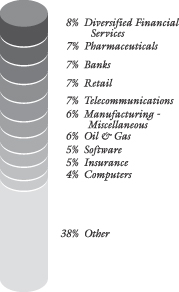
Portfolio Composition
As of June 30, 2004, the sector allocation of net assets was:
7
Table of Contents
Select Investment Grade Income Fund
The Select Investment Grade Income Fund returned (0.08)% for the first half of 2004, underperforming its benchmark, the Lehman Brothers Aggregate Bond Index, which returned 0.15%.
Performance from the spread sectors was varied for the first six months of 2004. The asset-backed securities sector did best with an excess return of 53 basis points over U.S. Treasury Securities. The mortgaged-backed securities sector had excess return of 36 basis points, while the Agency sector had an excess return of 10 basis points. The corporate sector underperformed U.S. Treasury securities for the period, primarily as a result of a weak second quarter. Based on strong technical factors and fundamentals that continue to support the sector, the portfolio had a 50% overweight to the corporate bond sector. During the second quarter, the investment sub-adviser reduced the portfolio overweight to the corporate sector by half, in anticipation of spread volatility associated with the beginning of an interest rate tightening cycle. The reduction was primarily in those sectors that would be more negatively affected by rising interest rates: banks; finance and utilities.
The fund began the year with a neutral weighting to the mortgage-backed securities sector. As volatility hit low levels and fundamentals suggested that the sector was becoming fully valued, the investment sub-adviser reduced exposure to mortgage-backed securities to a slight underweight. This strategy was helpful until June when the sector posted large excess returns. Although recent economic data have generally been softer than expected, the investment sub-adviser feels that there have been no disruptions to threaten the scenario that the Federal Reserve Board has so carefully laid out – one of a “measured” reversal of policy accommodation.
The performance data quoted represents past performance. Past performance does not guarantee future results. The investment return and principal value of an investment will fluctuate so that an investor’s shares, when redeemed, may be worth more or less than their original cost. Current performance may be lower or higher than the performance data quoted. For information on the current month end performance of variable annuity and variable life insurance products, please call: (800) 533-7881. The performance data quoted is net of all fund operating expenses, but does not include variable insurance or variable annuity charges. If the performance data included the effect of these additional charges, it would have been lower.
Average Annual Total Returns
| 1 Year | 5 Year | 10 Year | ||||
Select Investment Grade Income Fund | (0.25)% | 6.01% | 6.72% | |||
Lehman Brothers Aggregate Bond Index | 0.33% | 6.95% | 7.39% | |||
Lipper Intermediate Investment Grade | 0.29% | 6.25% | 6.89% | |||
Growth of a $10,000 Investment Since 1994
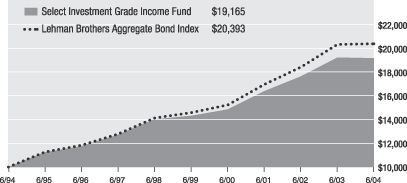
The Select Investment Grade Income Fund is a portfolio of Allmerica Investment Trust. Portfolio composition will vary over time.
The Lehman Brothers Aggregate Bond Index is an unmanaged index of all fixed-rate debt issues with an investment grade rating, at least one year to maturity and an outstanding par value of at least $25 million. The Lipper Intermediate Investment Grade Debt Funds Average tracks the performance of funds investing in intermediate-term corporate and government debt securities.
Investment Sub-Adviser
Opus Investment Management, Inc.
About the Fund
Seeks to generate a high level of total return which includes income and capital appreciation.
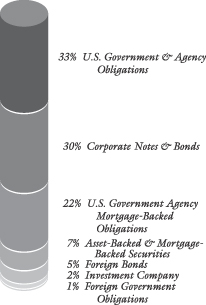
Portfolio Composition
As of June 30, 2004, the sector allocation of net assets was:
8
Table of Contents
Government Bond Fund
The Government Bond Fund returned (0.47)% for the first half of 2004, underperforming its benchmark, the Lehman Brothers Intermediate Government Bond Index, which returned (0.15)%.
During the first quarter, the bond market was skeptical of the strength of the economic recovery, citing the lack of job creation. During the second quarter, after two impressive showings in monthly payroll growth and evidence of early inflationary pressure, market sentiment reversed itself, opining that the economy was too strong and that the Federal Reserve Board was potentially behind the inflation curve. This change in sentiment brought about a volatile first half for the bond market.
Performance from the spread sectors was strong in the first quarter but dismal during the second quarter. In Q1, investors’ craving for additional yield over U.S. Treasury securities helped Agencies post 28 basis points of excess return. In Q2, the transition to a Federal Reserve Board tightening cycle provided investors with many reasons to question valuations and reduce overall exposures. Evidence suggests that leveraged investors did just that, while retail-oriented mutual funds were forced to sell to meet redemptions. Intermediate maturity Agencies underperformed U.S. Treasury securities by 19 basis points, while asset-backed securities registered 15 basis points of negative excess return. The fund’s overweight to spread product, such as Agency securities, was the primary reason for outperformance in Q1 and underperformance in Q2 and the full period. Looking ahead, the investment sub-adviser plans to continue to overweight spread product as a source of outperformance for the fund, while intending to maintain a slightly shorter duration relative to the index during this Federal Reserve Board tightening cycle.
The performance data quoted represents past performance. Past performance does not guarantee future results. The investment return and principal value of an investment will fluctuate so that an investor’s shares, when redeemed, may be worth more or less than their original cost. Current performance may be lower or higher than the performance data quoted. For information on the current month end performance of variable annuity and variable life insurance products, please call: (800) 533-7881. The performance data quoted is net of all fund operating expenses, but does not include variable insurance or variable annuity charges. If the performance data included the effect of these additional charges, it would have been lower.
Average Annual Total Returns
| 1 Year | 5 Year | 10 Year | ||||
Government Bond Fund | (1.58)% | 5.73% | 5.96% | |||
Lehman Brothers Intermediate Government Bond Index | (0.48)% | 6.25% | 6.56% | |||
Lipper General U.S. Government Funds Average | (0.68)% | 6.21% | 6.63% | |||
Growth of a $10,000 Investment Since 1994
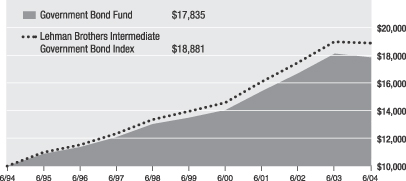
The Government Bond Fund is a portfolio of Allmerica Investment Trust. Portfolio composition will vary over time.
The Fund is neither insured nor guaranteed by the U.S. Government.
The Lehman Brothers Intermediate Government Bond Index is an unmanaged index of U.S. Government and Agency bonds with remaining maturities of one to ten years. The Lipper General U.S. Government Funds Average is the non-weighted average performance of funds investing in general U.S. Government securities.
Investment Sub-Adviser
Opus Investment Management, Inc.
About the Fund
Seeks high income, capital preservation and maintenance of liquidity, primarily through investments in debt instruments issued or guaranteed by the U.S. Government or its Agencies.
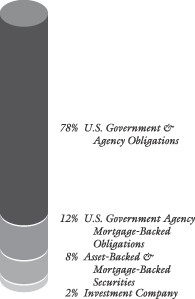
Portfolio Composition
As of June 30, 2004, the sector allocation of net assets was:
9
Table of Contents
Money Market Fund
The Money Market Fund returned 0.32% for the first half of 2004, outperforming its benchmark, the Money Fund Report Averages: First Tier Taxable, which returned 0.19%.
The year started with mixed to weak economic data, heightened questions about job growth, and overhanging concerns about Iraq and terrorism. Things changed in April when the March non-farm payrolls number showed that an impressive 308,000 jobs were created. At its May meeting, the Federal Reserve Board signaled that it would likely raise the 1.00% federal funds rate by 25 basis points in the near future. Subsequently, economic data remained strong and inflation started to become a concern. At its June meeting, as expected, the Federal Reserve Board raised the federal funds rate to 1.25%. While reaction to the move was muted, the rate hike was confirmation that the Federal Reserve Board believed that the U.S. economy was headed back on the right track.
Within the fund, the investment sub-adviser continued to emphasize investments in floating-rate notes during the period. In anticipation of the Federal Reserve Board’s rate hike, the investment sub-adviser shortened average maturities from 70 days, on average, to the mid 50 day range, in order to better take advantage of a rising rate environment. The investment sub-adviser believes that the U.S. economy is back on solid footing. Expectations are that the Federal Reserve Board will stick to its measured pace of interest rate hikes and that the federal funds rate may climb to about 2.00% by year end. The investment sub-adviser plans to maintain a mid-range average maturity in the coming months to take advantage of these upcoming interest rate hikes.
The performance data quoted represents past performance. Past performance does not guarantee future results. The investment return and principal value of an investment will fluctuate so that an investor’s shares, when redeemed, may be worth more or less than their original cost. Current performance may be lower or higher than the performance data quoted. For information on the current month end performance of variable annuity and variable life insurance products, please call: (800) 533-7881. The performance data quoted is net of all fund operating expenses, but does not include variable insurance or variable annuity charges. If the performance data included the effect of these additional charges, it would have been lower.
Average Annual Total Returns
| 1 Year | 5 Year | 10 Year | ||||
Money Market Fund | 0.64% | 3.21% | 4.29% | |||
Money Fund Report Averages: First Tier Taxable | 0.39% | 2.69% | 3.80% | |||
Lipper Money Market Funds Average | 0.53% | 2.88% | 3.99% | |||
Average Yield as of June 30, 2004
Money Market Fund 7-Day Yield | 0.70% |
Growth of a $10,000 Investment Since 1994
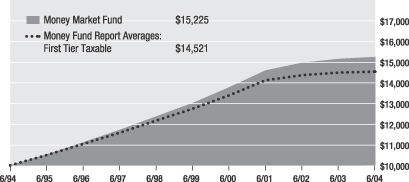
The Money Market Fund is a portfolio of Allmerica Investment Trust. Portfolio composition will vary over time.
The Fund is neither insured nor guaranteed by the Federal Deposit Insurance Corporation or any other government agency. Although the Fund seeks to maintain a net asset value of $1.00 per share, it is possible to lose money by investing in the Fund.
Money Fund Report Averages: First Tier Taxable is published by iMoneyNet, Inc., an independent firm that tracks 2a-7 regulated money market funds on a yield, shareholder, asset size and portfolio allocation basis. The Lipper Money Market Funds Average is the average investment performance of funds within the money market category.
Investment Sub-Adviser
Opus Investment Management, Inc.
About the Fund
Seeks to maximize current income for investors while preserving capital and liquidity.
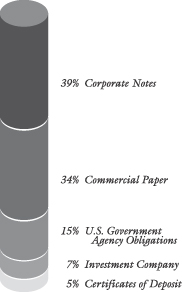
Portfolio Composition
As of June 30, 2004, the sector allocation of net assets was:
10
Table of Contents
Financials
Table of Contents
SELECT CAPITAL APPRECIATION FUND
PORTFOLIO OF INVESTMENTS • June 30, 2004 (Unaudited)
Shares | Value (Note 2) | ||||
COMMON STOCKS - 97.2% | |||||
| Advertising - 0.8% | |||||
88,000 | Catalina Marketing Corp. (a)* | $ | 1,609,520 | ||
16,000 | Lamar Advertising Co.* | 693,600 | |||
| 2,303,120 | |||||
| Aerospace & Defense - 2.3% | |||||
53,000 | Alliant Techsystems, Inc. (a)* | 3,357,020 | |||
111,000 | Rockwell Collins, Inc. | 3,698,520 | |||
| 7,055,540 | |||||
| Airlines - 0.6% | |||||
59,000 | JetBlue Airways Corp. (a)* | 1,733,420 | |||
| Auto Manufacturers - 0.8% | |||||
43,000 | Oshkosh Truck Corp. | 2,464,330 | |||
| Banks - 0.6% | |||||
29,000 | Investors Financial Services Corp. | 1,263,820 | |||
16,000 | Silicon Valley Bancshares* | 634,400 | |||
| 1,898,220 | |||||
| Beverages - 0.8% | |||||
80,000 | Cott Corp.* | 2,592,000 | |||
| Biotechnology - 2.9% | |||||
15,000 | Celgene Corp.* | 858,900 | |||
61,000 | Human Genome Sciences, Inc.* | 709,430 | |||
23,000 | Invitrogen Corp.* | 1,655,770 | |||
177,000 | Medimmune, Inc.* | 4,141,800 | |||
40,000 | Protein Design Labs, Inc.* | 765,200 | |||
58,000 | Vertex Pharmaceuticals, Inc.* | 628,720 | |||
| 8,759,820 | |||||
| Building Materials - 0.9% | |||||
66,000 | American Standard Companies, Inc.* | 2,660,460 | |||
| Chemicals - 1.0% | |||||
33,000 | Potash Corp. of Saskatchewan, Inc. (a) | 3,197,700 | |||
| Commercial Services - 9.9% | |||||
16,000 | Apollo Group, Inc.* | 1,412,640 | |||
131,000 | BearingPoint, Inc.* | 1,161,970 | |||
94,000 | Certegy, Inc. | 3,647,200 | |||
107,000 | ChoicePoint, Inc.* | 4,885,620 | |||
61,000 | Education Management* | 2,004,460 | |||
34,000 | Fair Isaac Corp. | 1,134,920 | |||
7,000 | Getty Images, Inc. (a)* | 420,000 | |||
27,000 | Global Payments, Inc. | 1,215,540 | |||
78,000 | Hewitt Associates, Inc.* | 2,145,000 | |||
57,000 | Iron Mountain, Inc.* | 2,750,820 | |||
72,000 | Manpower, Inc. | 3,655,440 | |||
89,000 | Robert Half International, Inc. | 2,649,530 | |||
101,000 | Viad Corp. | 2,728,010 | |||
| 29,811,150 | |||||
| Computers - 5.6% | |||||
23,000 | CACI International, Inc., Class A* | $ | 930,120 | ||
133,000 | Cadence Design Systems, Inc. (a)* | 1,945,790 | |||
127,000 | Ceridian Corp. (a)* | 2,857,500 | |||
46,000 | Diebold Inc. | 2,432,020 | |||
78,000 | DST Systems, Inc.* | 3,751,020 | |||
16,000 | Lexmark International Group, Inc.* | 1,544,480 | |||
31,000 | Research In Motion* | 2,121,640 | |||
48,000 | SunGard Data Systems, Inc.* | 1,248,000 | |||
| 16,830,570 | |||||
| Diversified Financial Services - 3.7% | |||||
137,000 | Ameritrade Holding Corp.* | 1,554,950 | |||
83,000 | CapitalSource, Inc. (a)* | 2,029,350 | |||
54,000 | Eaton Vance Corp. | 2,063,340 | |||
35,000 | Federated Investors, Inc., Class B | 1,061,900 | |||
20,000 | Legg Mason, Inc. | 1,820,200 | |||
116,000 | Waddell & Reed Financial, Class A | 2,564,760 | |||
| 11,094,500 | |||||
| Electronics - 2.1% | |||||
35,000 | Flir Systems, Inc. (a)* | 1,921,500 | |||
45,000 | Garmin, Ltd. (a) | 1,666,800 | |||
49,000 | Jabil Circuit, Inc.* | 1,233,820 | |||
35,000 | Waters Corp.* | 1,672,300 | |||
| 6,494,420 | |||||
| Food - 1.1% | |||||
35,000 | Whole Foods Market, Inc. (a) | 3,340,750 | |||
| Health Care - Products - 1.4% | |||||
46,000 | Edwards Lifesciences Corp.* | 1,603,100 | |||
55,000 | Kinetic Concepts, Inc.* | 2,744,500 | |||
| 4,347,600 | |||||
| Health Care - Services - 4.2% | |||||
3,000 | Anthem, Inc. (a)* | 268,680 | |||
37,000 | Community Health Systems, Inc.* | 990,490 | |||
26,000 | Coventry Health Care, Inc.* | 1,271,400 | |||
39,000 | Davita, Inc.* | 1,202,370 | |||
129,000 | Health Management Associates, Inc., Class A (a) | 2,892,180 | |||
69,000 | Laboratory Corp. of America Holdings* | 2,739,300 | |||
99,000 | Manor Care, Inc. | 3,235,320 | |||
| 12,599,740 | |||||
| Insurance - 3.7% | |||||
50,000 | Assurant, Inc. | 1,319,000 | |||
43,000 | Axis Capital Holdings, Ltd. | 1,204,000 | |||
53,000 | Genworth Financial, Inc., Class A (a)* | 1,216,350 | |||
53,000 | Principal Financial Group, Inc. | 1,843,340 | |||
42,000 | Protective Life Corp. | 1,624,140 | |||
35,000 | Radian Group, Inc. | 1,676,500 | |||
60,000 | Willis Group Holdings, Ltd. | 2,247,000 | |||
| 11,130,330 | |||||
See Notes to Financial Statements.
F-1
Table of Contents
SELECT CAPITAL APPRECIATION FUND
PORTFOLIO OF INVESTMENTS, Continued • June 30, 2004 (Unaudited)
Shares | Value (Note 2) | ||||
| Internet - 3.5% | |||||
32,000 | CheckFree Corp. (a)* | $ | 960,000 | ||
39,000 | CNET Networks, Inc. (a)* | 431,730 | |||
23,000 | InterActiveCorp (a)* | 693,220 | |||
67,000 | Monster Worldwide, Inc.* | 1,723,240 | |||
177,000 | Network Associates, Inc.* | 3,209,010 | |||
160,000 | VeriSign, Inc.* | 3,184,000 | |||
29,000 | WebMD Corp.* | 270,280 | |||
| 10,471,480 | |||||
| Iron & Steel - 1.4% | |||||
40,000 | International Steel Group, Inc. (a)* | 1,190,000 | |||
41,000 | Nucor Corp. | 3,147,160 | |||
| 4,337,160 | |||||
| Leisure Time - 1.2% | |||||
86,000 | Brunswick Corp. (a) | 3,508,800 | |||
| Lodging - 0.9% | |||||
98,000 | Fairmont Hotels & Resorts, Inc. | 2,641,100 | |||
| Manufacturing - Miscellaneous - 2.9% | |||||
50,000 | Danaher Corp. | 2,592,500 | |||
33,000 | ITT Industries, Inc. | 2,739,000 | |||
59,000 | Roper Industries, Inc. | 3,357,100 | |||
| 8,688,600 | |||||
| Media - 3.6% | |||||
66,000 | Cablevision Systems Corp.* | 1,296,900 | |||
169,000 | Citadel Broadcasting Corp. (a)* | 2,462,330 | |||
70,000 | Cox Radio, Inc.* | 1,216,600 | |||
25,000 | Entercom Communications Corp.* | 932,500 | |||
83,000 | Rogers Communications, Inc., Class B (a) | 1,504,790 | |||
51,000 | Scholastic Corp. (a)* | 1,527,450 | |||
67,000 | XM Satellite Radio Holdings, Inc. (a)* | 1,828,430 | |||
| 10,769,000 | |||||
| Mining - 0.7% | |||||
53,000 | Newmont Mining Corp. | 2,054,280 | |||
| Oil & Gas - 4.6% | |||||
96,000 | Diamond Offshore Drilling, Inc. (a) | 2,287,680 | |||
54,000 | EOG Resources, Inc. | 3,224,340 | |||
47,000 | Murphy Oil Corp. | 3,463,900 | |||
68,000 | Western Gas Resources, Inc. | 2,208,640 | |||
87,000 | XTO Energy, Inc. | 2,591,730 | |||
| 13,776,290 | |||||
| Oil & Gas Services - 4.3% | |||||
99,000 | BJ Services Co.* | 4,538,160 | |||
48,000 | Cooper Cameron Corp.* | 2,337,600 | |||
72,000 | FMC Technologies, Inc.* | 2,073,600 | |||
71,000 | Smith International, Inc.* | 3,958,960 | |||
| 12,908,320 | |||||
| Pharmaceuticals - 9.8% | |||||
54,000 | Abgenix, Inc. (a)* | $ | 632,880 | ||
56,000 | Alkermes, Inc. (a)* | 761,600 | |||
45,000 | AmerisourceBergen Corp. | 2,690,100 | |||
38,000 | Amylin Pharmaceuticals, Inc. (a)* | 866,400 | |||
57,000 | Andrx Corp. (a)* | 1,592,010 | |||
35,000 | Barr Pharmaceuticals* | 1,179,500 | |||
39,000 | Cephalon, Inc. (a)* | 2,106,000 | |||
44,000 | Gilead Sciences, Inc.* | 2,948,000 | |||
25,000 | ICOS Corp. (a)* | 746,000 | |||
27,000 | ImClone Systems, Inc. (a)* | 2,316,330 | |||
115,000 | IVAX Corp. (a)* | 2,758,850 | |||
22,000 | Neurocrine Biosciences, Inc.* | 1,140,700 | |||
135,000 | Omnicare, Inc. (a) | 5,779,350 | |||
7,000 | Sepracor, Inc. (a)* | 370,300 | |||
35,800 | Taro Pharmaceuticals Industries (a)* | 1,557,300 | |||
42,200 | Valeant Pharmaceuticals International | 844,000 | |||
48,000 | Watson Pharmaceuticals, Inc. (a)* | 1,291,200 | |||
| 29,580,520 | |||||
| Retail - 7.5% | |||||
46,000 | Best Buy Co., Inc. | 2,334,040 | |||
33,000 | CDW Corp. | 2,104,080 | |||
66,000 | Dollar Tree Stores, Inc.* | 1,810,380 | |||
96,000 | Family Dollar Stores, Inc. | 2,920,320 | |||
11,000 | MSC Industrial Direct Co., Class A (a) | 361,240 | |||
41,000 | O’Reilly Automotive, Inc.* | 1,853,200 | |||
26,000 | P.F. Chang’s China Bistro, Inc. (a)* | 1,069,900 | |||
104,000 | Petsmart, Inc. (a) | 3,374,800 | |||
76,000 | Ross Stores, Inc. | 2,033,760 | |||
43,000 | Shoppers Drug Mart Corp. | 1,071,191 | |||
48,000 | The Cheesecake Factory, Inc. (a)* | 1,909,920 | |||
59,000 | Williams-Sonoma, Inc. (a)* | 1,944,640 | |||
| 22,787,471 | |||||
| Semiconductors - 4.3% | |||||
237,000 | Agere Systems, Inc.* | 509,550 | |||
180,000 | Agere Systems, Inc., Class A (a)* | 414,000 | |||
74,000 | Amis Holdings, Inc.* | 1,252,080 | |||
61,000 | Integrated Circuit Systems, Inc.* | 1,656,760 | |||
108,000 | Intersil Corp., Class A | 2,339,280 | |||
78,000 | Microchip Technology, Inc. | 2,460,120 | |||
49,000 | Novellus Systems, Inc.* | 1,540,560 | |||
52,000 | QLogic Corp.* | 1,382,680 | |||
61,000 | Semtech Corp.* | 1,435,940 | |||
| 12,990,970 | |||||
| Software - 3.7% | |||||
49,000 | Adobe Systems, Inc. | 2,278,500 | |||
29,000 | Citrix Systems, Inc.* | 590,440 | |||
15,000 | Cognos, Inc.* | 542,400 | |||
53,000 | Fiserv, Inc.* | 2,061,170 | |||
43,000 | Intuit, Inc.* | 1,658,940 | |||
51,000 | Jack Henry & Associates, Inc. | 1,025,100 | |||
36,000 | Mercury Interactive Corp. (a)* | 1,793,880 | |||
60,000 | Red Hat, Inc. (a)* | 1,378,200 | |||
| 11,328,630 | |||||
See Notes to Financial Statements.
F-2
Table of Contents
SELECT CAPITAL APPRECIATION FUND
PORTFOLIO OF INVESTMENTS, Continued • June 30, 2004 (Unaudited)
Shares | Value (Note 2) | ||||
| Telecommunications - 5.2% | |||||
51,000 | Comverse Technology, Inc.* | $ | 1,016,940 | ||
155,000 | Crown Castle International Corp.* | 2,286,250 | |||
73,000 | Harris Corp., Inc. | 3,704,750 | |||
58,000 | Juniper Networks, Inc.* | 1,425,060 | |||
47,000 | Nextel Communications, Inc., Class A* | 1,253,020 | |||
124,000 | Nextel Partners, Inc., Class A* | 1,974,080 | |||
41,000 | Triton PCS Holdings, Inc.* | 178,760 | |||
131,000 | Western Wireless Corp., Class A (a)* | 3,787,210 | |||
| 15,626,070 | |||||
| �� | |||||
| Transportation - 1.2% | |||||
41,000 | C.H. Robinson Worldwide, Inc. | 1,879,440 | |||
35,000 | Expeditors International of Washington, Inc. | 1,729,350 | |||
| 3,608,790 | |||||
Total Common Stocks (Cost $222,568,017) | 293,391,151 | ||||
Par Value | |||||
U.S. GOVERNMENT AGENCY OBLIGATIONS (b) - 2.8% | |||||
| Fannie Mae - 1.7% | |||||
$5,000,000 | 1.27%, 08/11/04 | 4,992,768 | |||
| Federal Home Loan Bank - 1.1% | |||||
3,185,000 | 1.20%, 07/01/04 | 3,185,000 | |||
| Freddie Mac - 0.0% | |||||
124,000 | 1.22%, 07/07/04 | 123,975 | |||
Total U.S. Government Agency Obligations (Cost $8,301,743) | 8,301,743 | ||||
Total Investments - 100.0% (Cost $230,869,760) | 301,692,894 | ||||
Net Other Assets and Liabilities - 0.0% | 92,184 | ||||
Total Net Assets - 100.0% | $ | 301,785,078 | |||
| * | Non-income producing security. |
| (a) | All or a portion of this security is out on loan at June 30, 2004; the value of the securities loaned amounted to $60,259,083. The value of collateral amounted to $62,987,027 which consisted of cash equivalents. |
| (b) | Effective yield at time of purchase. |
FEDERAL INCOME TAX INFORMATION (SEE NOTE 2)
At June 30, 2004, the aggregate cost of investment securities for tax purposes was $236,311,845. Net unrealized appreciation (depreciation) aggregated $65,381,049, of which $71,986,374 related to appreciated investment securities and $(6,605,325) related to depreciated investment securities.
OTHER INFORMATION
For the six months ended June 30, 2004, the aggregate cost of purchases and the proceeds of sales, other than from short-term investments, included $69,352,301 and $87,557,989 of non-governmental issuers, respectively.
See Notes to Financial Statements.
F-3
Table of Contents
SELECT VALUE OPPORTUNITY FUND
PORTFOLIO OF INVESTMENTS • June 30, 2004 (Unaudited)
Shares | Value (Note 2) | ||||
COMMON STOCKS - 96.8% | |||||
| Aerospace & Defense - 6.8% | |||||
223,400 | Goodrich (B.F.) Co. | $ | 7,222,522 | ||
208,050 | Moog, Inc., Class A* | 7,720,735 | |||
238,400 | United Defense Industries, Inc.* | 8,344,000 | |||
| 23,287,257 | |||||
| Auto Manufacturers - 1.8% | |||||
108,100 | Oshkosh Truck Corp. | 6,195,211 | |||
| Auto Parts & Equipment - 0.0% | |||||
267,700 | Mascotech, Inc. (a) | 0 | |||
| Banks - 3.6% | |||||
183,300 | Hibernia Corp., Class A | 4,454,190 | |||
210,350 | North Fork Bancorp., Inc. | 8,003,818 | |||
| 12,458,008 | |||||
| Beverages - 1.3% | |||||
118,200 | Constellation Brands, Inc.* | 4,388,766 | |||
| Building Materials - 1.7% | |||||
142,900 | York International Corp. | 5,868,903 | |||
| Chemicals - 10.8% | |||||
400,000 | Airgas, Inc. | 9,564,000 | |||
129,120 | Georgia Gulf Corp. | 4,630,243 | |||
159,800 | International Flavors & Fragrances, Inc. | 5,976,520 | |||
473,500 | Lyondell Chemical Co. (b) | 8,234,165 | |||
662,700 | Methanex Corp. | 8,761,557 | |||
| 37,166,485 | |||||
| Commercial Services - 6.1% | |||||
144,060 | Aramark Services, Inc., Class B | 4,143,166 | |||
420,500 | BISYS Group, Inc. (b)* | 5,912,230 | |||
106,610 | Manpower, Inc. (b) | 5,412,590 | |||
168,212 | R. R. Donnelley & Sons Co. | 5,554,360 | |||
| 21,022,346 | |||||
| Diversified Financial Services - 0.8% | |||||
233,300 | E*TRADE Financial Corp.* | 2,601,295 | |||
| Electric - 1.8% | |||||
225,300 | PG&E Corp.* | 6,294,882 | |||
| Entertainment - 2.8% | |||||
201,700 | Alliance Gaming Corp.* | 3,461,172 | |||
377,200 | Intrawest Corp. (b) | 6,016,340 | |||
| 9,477,512 | |||||
| Environmental Control - 2.9% | |||||
364,500 | Watts Industries, Inc., Class A | 9,823,275 | |||
| Forest Products & Paper - 1.1% | |||||
96,800 | Boise Cascade Corp. | $ | 3,643,552 | ||
| Hand & Machine Tools - 3.2% | |||||
107,800 | Snap-On, Inc. | 3,616,690 | |||
160,200 | Stanley Works (b) | 7,301,916 | |||
| 10,918,606 | |||||
| Health Care - Products - 1.6% | |||||
94,280 | C.R. Bard, Inc. | 5,340,962 | |||
| Health Care - Services - 1.3% | |||||
176,600 | Kindred Healthcare, Inc.* | 4,653,410 | |||
| Holding Companies - Diversified - 2.7% | |||||
324,300 | Brascan Corp., Class A (b) | 9,158,232 | |||
| Home Builders - 1.8% | |||||
180,700 | Thor Industries, Inc. (b) | 6,046,222 | |||
| Insurance - 10.5% | |||||
90,400 | AMBAC Financial Group, Inc. | 6,638,976 | |||
241,000 | Assurant, Inc. | 6,357,580 | |||
144,090 | Everest Re Group, Ltd. | 11,579,072 | |||
149,000 | Fidelity National Financial, Inc. | 5,563,660 | |||
161,300 | Willis Group Holdings, Ltd. | 6,040,685 | |||
| 36,179,973 | |||||
| Leisure Time - 1.7% | |||||
134,700 | Royal Caribbean Cruises, Ltd. (b) | 5,847,327 | |||
| Machinery - Diversified - 1.5% | |||||
247,700 | UNOVA, Inc. (b)* | 5,015,925 | |||
| Manufacturing - Miscellaneous - 1.2% | |||||
133,600 | A.O. Smith Corp. | 4,247,144 | |||
| Media - 6.8% | |||||
215,500 | Belo Corp. | 5,786,175 | |||
249,686 | Cablevision Systems Corp.* | 4,906,330 | |||
207,700 | Entercom Communications Corp.* | 7,747,210 | |||
68,800 | Knight-Ridder, Inc. (b) | 4,953,600 | |||
| 23,393,315 | |||||
| Metal Fabricate & Hardware - 1.6% | |||||
183,000 | Kaydon Corp. | 5,660,190 | |||
| Oil & Gas - 2.0% | |||||
399,600 | Pride International, Inc. (b)* | 6,837,156 | |||
| Oil & Gas Services - 1.5% | |||||
114,100 | Weatherford International, Ltd.* | 5,132,218 | |||
See Notes to Financial Statements.
F-4
Table of Contents
SELECT VALUE OPPORTUNITY FUND
PORTFOLIO OF INVESTMENTS, Continued • June 30, 2004 (Unaudited)
Shares | Value (Note 2) | ||||
| Pharmaceuticals - 1.4% | |||||
114,200 | Omnicare, Inc. (b) | $ | 4,888,902 | ||
| Real Estate - 0.5% | |||||
43,200 | The St. Joe Co. (b) | 1,715,040 | |||
| Retail - 6.4% | |||||
290,400 | CSK Auto Corp.* | 4,977,456 | |||
265,700 | Dollar Tree Stores, Inc.* | 7,288,151 | |||
211,600 | Insight Enterprises, Inc.* | 3,758,016 | |||
201,100 | Tuesday Morning Corp.* | 5,831,900 | |||
| 21,855,523 | |||||
| Semiconductors - 1.6% | |||||
1,269,900 | Conexant Systems, Inc.* | 5,498,667 | |||
| Software - 3.5% | |||||
172,500 | Hyperion Solutions Corp.* | 7,541,700 | |||
192,300 | NDCHealth Corp. (b) | 4,461,360 | |||
| 12,003,060 | |||||
| Telecommunications - 2.7% | |||||
154,200 | Amdocs, Ltd.* | 3,612,906 | |||
958,300 | Arris Group, Inc. (b)* | 5,692,302 | |||
| 9,305,208 | |||||
| Transportation - 1.8% | |||||
194,200 | CSX Corp. | 6,363,934 | |||
Total Common Stocks (Cost $284,653,927) | 332,288,506 | ||||
Total Investments - 96.8% (Cost $284,653,927) | 332,288,506 | ||||
Net Other Assets and Liabilities - 3.2% | 10,991,741 | ||||
Total Net Assets - 100.0% | $ | 343,280,247 | |||
| * | Non-income producing security. |
| (a) | Contingent Value Obligation. |
| (b) | All or a portion of this security is out on loan at June 30, 2004; the value of the securities loaned amounted to $45,788,751. The value of collateral amounted to $47,855,415 which consisted of cash equivalents. |
FEDERAL INCOME TAX INFORMATION (SEE NOTE 2)
At June 30, 2004, the aggregate cost of investment securities for tax purposes was $285,444,209. Net unrealized appreciation (depreciation) aggregated $46,844,297, of which $50,974,567 related to appreciated investment securities and $(4,130,270) related to depreciated investment securities.
OTHER INFORMATION
For the six months ended June 30, 2004, the aggregate cost of purchases and the proceeds of sales, other than from short-term investments, included $174,094,426 and $229,590,061 of non-governmental issuers, respectively.
See Notes to Financial Statements.
F-5
Table of Contents
SELECT INTERNATIONAL EQUITY FUND
PORTFOLIO OF INVESTMENTS • June 30, 2004 (Unaudited)
Shares | Value (Note 2) | ||||
COMMON STOCKS - 97.8% | |||||
| Australia - 2.1% | |||||
171,597 | James Hardie Industries NV | $ | 715,714 | ||
105,363 | National Australia Bank, Ltd. | 2,185,574 | |||
273,727 | News Corp., Ltd. | 2,412,767 | |||
159,561 | Westpac Banking Corp., Ltd. | 1,952,171 | |||
| 7,266,226 | |||||
| Canada - 0.4% | |||||
32,793 | Royal Bank of Canada (a) | 1,446,243 | |||
| Finland - 1.0% | |||||
240,806 | Nokia Oyj | 3,478,701 | |||
| France - 9.8% | |||||
96,747 | Aventis (a) | 7,312,138 | |||
168,609 | Axa | 3,717,273 | |||
73,288 | BNP Paribas (a) | 4,512,520 | |||
113,058 | France Telecom SA | 2,949,755 | |||
38,799 | Lafarge SA | 3,464,094 | |||
60,697 | Total SA, Class B | 11,585,141 | |||
| 33,540,921 | |||||
| Germany - 6.0% | |||||
96,753 | Bayer AG | 2,793,045 | |||
130,740 | Bayerische Motoren Werke (BMW) AG | 5,791,844 | |||
45,229 | Deutsche Bank AG (a) | 3,557,789 | |||
115,537 | Veba AG | 8,345,280 | |||
| 20,487,958 | |||||
| Hong Kong - 3.6% | |||||
272,000 | Cheung Kong Holdings, Ltd. | 2,005,218 | |||
271,000 | Esprit Holdings, Ltd. | 1,212,606 | |||
186,400 | Hang Seng Bank, Ltd. | 2,389,851 | |||
950,000 | Johnson Electric Holdings, Ltd. | 968,313 | |||
814,000 | Li & Fung, Ltd. | 1,189,746 | |||
305,000 | Sun Hung Kai Properties, Ltd. | 2,502,676 | |||
291,000 | Swire Pacific, Ltd. | 1,884,123 | |||
| 12,152,533 | |||||
| Ireland - 0.9% | |||||
148,082 | CRH, Plc | 3,138,460 | |||
| Italy - 3.6% | |||||
362,165 | ENI SpA (a) | 7,199,324 | |||
1,622,383 | Telecom Italia SpA | 5,049,047 | |||
| 12,248,371 | |||||
| Japan - 17.5% | |||||
6,630 | Acom Co., Ltd. | 430,011 | |||
196,900 | Canon, Inc. | 10,356,996 | |||
39,800 | Fanuc, Ltd. | 2,370,196 | |||
135,400 | Honda Motor Co., Ltd. | 6,515,153 | |||
41,400 | Hoya Corp. | 4,325,006 | |||
353 | Japan Tobacco, Inc. | 2,738,362 | |||
164 | Millea Holdings, Inc. | 2,430,408 | |||
337 | Mitsubishi Tokyo Financial Group, Inc. | 3,113,662 | |||
227,000 | Mitsui Sumitomo Insurance Co., Ltd. | 2,128,482 | |||
1,423 | Nippon Telegraph & Telephone Corp. | 7,589,160 | |||
1,260 | NTT Mobile Communcations Network, Inc. | 2,247,633 | |||
94,000 | Ricoh Co., Ltd. | 1,994,969 | |||
19,400 | Rohm Co., Ltd. | 2,317,742 | |||
88,300 | Shin-Etsu Chemical Co., Ltd. | 3,150,254 | |||
130,000 | Shionogi & Co., Ltd. | 2,230,984 | |||
443 | Sumitomo Mitsui Financial Group, Inc. (a) | 3,031,277 | |||
59,000 | Takeda Chemical Industries, Ltd. | 2,585,281 | |||
| 59,555,576 | |||||
| Netherlands - 8.4% | |||||
306,845 | ABN-Amro Holdings | 6,720,071 | |||
209,354 | Elsevier NV | 2,942,742 | |||
37,667 | Heineken NV | 1,239,227 | |||
354,589 | ING Groep NV | 8,378,998 | |||
65,760 | Koninklijke Ahold NV* | 516,638 | |||
212,243 | Koninklijke (Royal) Phillips Electronics NV | 5,721,105 | |||
82,277 | TNT Post Group NV | 1,882,085 | |||
47,253 | VNU NV | 1,373,874 | |||
| 28,774,740 | |||||
| Singapore - 0.6% | |||||
262,000 | United Overseas Bank, Ltd. | 2,039,621 | |||
| South Korea - 4.2% | |||||
35,670 | Hyundai Motor Co., Ltd. | 1,372,160 | |||
99,060 | Korea Electric Power Corp. | 1,594,562 | |||
43,330 | Korea Telecom Corp. | 1,449,333 | |||
19,950 | POSCO | 2,572,523 | |||
17,826 | Samsung Electronics Co. | 7,358,721 | |||
| 14,347,299 | |||||
| Spain - 3.0% | |||||
517,053 | Banco de Santander | 5,372,163 | |||
331,122 | Telefonica SA | 4,900,376 | |||
| 10,272,539 | |||||
| Switzerland - 12.2% | |||||
46,858 | Nestle SA | 12,500,956 | |||
167,488 | Novartis AG | 7,391,439 | |||
65,127 | Roche Holdings AG | 6,450,536 | |||
82,596 | Swiss Reinsurance Co. | 5,366,975 | |||
139,765 | UBS AG | 9,852,040 | |||
| 41,561,946 | |||||
| Taiwan - 0.6% | |||||
229,814 | Taiwan Semiconductor Manufacturing Co., ADR (a) | 1,909,752 | |||
| United Kingdom - 23.9% | |||||
708,946 | Barclays, Plc | 6,036,288 | |||
224,344 | British American Tobacco Industries, Plc | 3,474,694 | |||
See Notes to Financial Statements.
F-6
Table of Contents
SELECT INTERNATIONAL EQUITY FUND
PORTFOLIO OF INVESTMENTS, Continued • June 30, 2004 (Unaudited)
Shares | Value (Note 2) | ||||
| United Kingdom (continued) | |||||
470,649 | BT Group, Plc | $ | 1,693,354 | ||
361,131 | Cadbury Schweppes, Plc | 3,114,107 | |||
501,865 | Centrica, Plc | 2,042,176 | |||
449,238 | Compass Group, Plc, Sponsored ADR | 2,740,006 | |||
300,015 | Diageo, Plc | 4,043,095 | |||
90,695 | Enterprise Inns Plc | 945,238 | |||
236,625 | GlaxoSmithKline, Plc | 4,786,464 | |||
60,820 | GUS, Plc | 932,073 | |||
517,760 | HSBC Holdings, Plc | 7,695,420 | |||
461,821 | Kingfisher, Plc | 2,396,123 | |||
139,394 | Marks & Spencer Group, Plc | 916,519 | |||
300,485 | Prudential Corp., Plc | 2,584,336 | |||
165,137 | Reed Elsevier, Plc | 1,604,350 | |||
164,187 | Royal Bank of Scotland | 4,725,843 | |||
319,821 | Smith & Nephew, Plc | 3,440,469 | |||
95,292 | Smiths Group, Plc | 1,289,366 | |||
1,188,725 | Tesco, Plc | 5,736,685 | |||
246,487 | Tomkins, Plc | 1,226,384 | |||
38,099 | Travis Perkins, Plc | 948,144 | |||
531,355 | Unilever, Plc | 5,210,412 | |||
3,219,151 | Vodafone Airtouch, Plc | 7,045,608 | |||
60,509 | Whitbread, Plc | 902,082 | |||
253,186 | Wolseley, Plc | 3,923,700 | |||
195,734 | WPP Group, Plc | 1,986,755 | |||
| 81,439,691 | |||||
Total Common Stocks (Cost $302,872,459) | 333,660,577 | ||||
PREFERRED STOCKS - 0.1% | |||||
| France - 0.1% | |||||
13,241 | AXA Preferred, Convertible | 296,114 | |||
Total Preferred Stocks (Cost $197,489) | 296,114 | ||||
RIGHTS - 0.0% | |||||
| Thailand - 0.0% | |||||
100,421 | TelecomAsia Corp., Public Co., Ltd. (b)* | 0 | |||
| United Kingdom - 0.0% | |||||
332,400 | Ti Automotive, Ltd. (b)* | 0 | |||
Total Rights (Cost $68,642) | 0 | ||||
Total Investments - 97.9% (Cost $303,138,590) | 333,956,691 | ||||
Net Other Assets and Liabilities - 2.1% | 7,039,334 | ||||
Total Net Assets - 100.0% | $ | 340,996,025 | |||
| * | Non-income producing security. |
| (a) | All or a portion of this security is out on loan at June 30, 2004; the value of the securities loaned amounted to $21,471,927. The value of collateral amounted to $22,723,493 which consisted of cash equivalents. |
| (b) | Contingent Value Obligation. |
| ADR | American Depositary Receipt. Shares of a foreign based corporation held in U.S. banks entitling the shareholder to all dividends and capital gains. |
FEDERAL INCOME TAX INFORMATION (SEE NOTE 2)
At June 30, 2004, the aggregate cost of investment securities for tax purposes was $312,421,255. Net unrealized appreciation (depreciation) aggregated $21,535,436, of which $40,944,750 related to appreciated investment securities and $(19,409,314) related to depreciated investment securities.
OTHER INFORMATION
For the six months ended June 30, 2004, the aggregate cost of purchases and the proceeds of sales, other than from short-term investments, included $42,588,530 and $84,148,458 of non-governmental issuers, respectively.
FORWARD FOREIGN CURRENCY CONTRACTS SOLD:
Contracts To Deliver | Currency | Settlement Date | Contracts At Value | In Exchange For U.S. $ | Unrealized Depreciation | |||||||||
32,132,988 | JPY | 07/01/04 | $ | 97,983 | $ | 97,901 | $ | (82 | ) | |||||
| JPY | Japanese Yen |
Industry Concentration of Investments
as a Percentage of Net Assets:
Advertising | 0.6 | % | |
Agriculture | 1.8 | ||
Auto Manufacturers | 4.0 | ||
Banks | 17.6 | ||
Beverages | 1.6 | ||
Building Materials | 2.4 | ||
Chemicals | 1.7 | ||
Distribution & Wholesale | 1.9 | ||
Diversified Financial Services | 0.1 | ||
Electric | 2.9 | ||
Electrical Components & Equipment | 2.4 | ||
Electronics | 2.9 | ||
Food | 7.9 | ||
Food Service | 0.8 | ||
Gas | 0.6 | ||
Health Care-Products | 2.3 | ||
Holding Companies - Diversified | 0.9 | ||
Home Furnishings | 1.4 | ||
Insurance | 7.3 | ||
Iron & Steel | 0.8 | ||
Manufacturing - Miscellaneous | 0.4 | ||
Media | 2.4 | ||
Office & Business Equipment | 3.6 | ||
Oil & Gas | 5.5 | ||
Pharmaceuticals | 9.0 | ||
Real Estate | 1.3 | ||
Retail | 1.8 | ||
Semiconductors | 0.7 | ||
Telecommunications | 10.7 | ||
Transportation | 0.6 | ||
Net Other Assets and Liabilities | 2.1 | ||
Total | 100.0 | % | |
See Notes to Financial Statements.
F-7
Table of Contents
SELECT GROWTH FUND
PORTFOLIO OF INVESTMENTS • June 30, 2004 (Unaudited)
Shares | Value (Note 2) | ||||
COMMON STOCKS - 98.1% | |||||
| Banks - 2.4% | |||||
276,215 | State Street Corp. (a) | $ | 13,545,584 | ||
| Biotechnology - 2.1% | |||||
80,600 | Amgen, Inc.* | 4,398,342 | |||
95,100 | Genentech, Inc.* | 5,344,620 | |||
81,800 | Medimmune, Inc.* | 1,914,120 | |||
| 11,657,082 | |||||
| Commercial Services - 2.8% | |||||
51,900 | Apollo Group, Inc.* | 4,582,251 | |||
150,225 | Certegy, Inc. | 5,828,730 | |||
155,442 | Paychex, Inc. | 5,266,375 | |||
| 15,677,356 | |||||
| Computers - 4.7% | |||||
116,900 | Apple Computer, Inc.* | 3,803,926 | |||
435,782 | Dell, Inc.* | 15,609,711 | |||
60,400 | International Business Machines Corp. | 5,324,260 | |||
14,500 | Lexmark International Group, Inc.* | 1,399,685 | |||
| 26,137,582 | |||||
| Cosmetics & Personal Care - 2.0% | |||||
92,400 | Avon Products, Inc. | 4,263,336 | |||
23,900 | Estee Lauder Cos., Inc., Class A | 1,165,842 | |||
67,205 | Gillette Co. | 2,849,492 | |||
52,800 | Procter & Gamble Co. | 2,874,432 | |||
| 11,153,102 | |||||
| Diversified Financial Services - 10.7% | |||||
254,045 | American Express Co. | 13,052,832 | |||
328,703 | Citigroup, Inc. | 15,284,689 | |||
150,224 | Fannie Mae | 10,719,985 | |||
35,700 | Goldman Sachs and Co. | 3,361,512 | |||
57,200 | Merrill Lynch & Co., Inc. | 3,087,656 | |||
183,100 | Morgan (J.P.) & Co., Inc. (a) | 7,098,787 | |||
185,804 | SLM Corp. | 7,515,772 | |||
| 60,121,233 | |||||
| Electrical Components & Equipment - 1.6% | |||||
332,074 | Molex Inc., Class A | 9,058,979 | |||
| Electronics - 1.0% | |||||
199,700 | Agilent Technologies, Inc.* | 5,847,216 | |||
| Food - 1.4% | |||||
115,500 | Kroger Co. (a)* | 2,102,100 | |||
58,400 | Whole Foods Market, Inc. (a) | 5,574,280 | |||
| 7,676,380 | |||||
| Health Care - Products - 4.5% | |||||
23,400 | Alcon, Inc. | 1,840,410 | |||
98,830 | Dentsply International, Inc. | 5,149,043 | |||
53,200 | Guidant Corp. | $ | 2,972,816 | ||
142,317 | Johnson & Johnson | 7,927,057 | |||
93,945 | Medtronic, Inc. | 4,577,000 | |||
31,626 | Zimmer Holdings, Inc.* | 2,789,413 | |||
| 25,255,739 | |||||
| Health Care - Services - 2.3% | |||||
162,084 | Lincare Holding, Inc. (a)* | 5,326,080 | |||
122,550 | UnitedHealth Group, Inc. | 7,628,737 | |||
| 12,954,817 | |||||
| Home Furnishings - 0.4% | |||||
26,900 | Harman International Industries, Inc. | 2,447,900 | |||
| Insurance - 3.8% | |||||
199,007 | AFLAC, Inc. | 8,121,476 | |||
187,083 | American International Group, Inc. | 13,335,276 | |||
| 21,456,752 | |||||
| Internet - 6.1% | |||||
90,100 | eBay, Inc.* | 8,284,695 | |||
319,082 | InterActiveCorp (a)* | 9,617,131 | |||
63,500 | Symantec Corp.* | 2,780,030 | |||
366,710 | Yahoo!, Inc.* | 13,322,574 | |||
| 34,004,430 | |||||
| Leisure Time - 1.9% | |||||
225,336 | Carnival Corp. | 10,590,792 | |||
| Manufacturing - Miscellaneous - 3.2% | |||||
221,382 | Dover Corp. | 9,320,182 | |||
272,400 | General Electric Co. | 8,825,760 | |||
| 18,145,942 | |||||
| Media - 5.0% | |||||
284,635 | Comcast Corp., Special Class A* | 7,858,772 | |||
159,600 | DIRECTV Group (The), Inc.* | 2,729,160 | |||
996,221 | Liberty Media Group, Class A | 8,956,027 | |||
67,205 | Liberty Media International, Inc., Class A* | 2,493,306 | |||
140,000 | Univision Communications, Inc. (a)* | 4,470,200 | |||
47,200 | Viacom, Inc., Class B | 1,685,984 | |||
| 28,193,449 | |||||
| Oil & Gas - 0.8% | |||||
48,700 | Total SA, Sponsored ADR | 4,679,096 | |||
| Oil & Gas Services - 3.1% | |||||
102,400 | BJ Services Co.* | 4,694,016 | |||
194,478 | Schlumberger, Ltd. | 12,351,298 | |||
9,500 | Smith International, Inc.* | 529,720 | |||
700 | Weatherford International, Ltd.* | 31,486 | |||
| 17,606,520 | |||||
See Notes to Financial Statements.
F-8
Table of Contents
SELECT GROWTH FUND
PORTFOLIO OF INVESTMENTS, Continued • June 30, 2004 (Unaudited)
Shares | Value (Note 2) | ||||
| Pharmaceuticals - 10.5% | |||||
47,500 | Allergan, Inc. | $ | 4,252,200 | ||
73,800 | AstraZeneca Plc, ADR (a) | 3,368,232 | |||
122,552 | Cardinal Health, Inc. (a) | 8,584,768 | |||
133,900 | Caremax Rx, Inc.* | 4,410,666 | |||
65,900 | Gilead Sciences, Inc.* | 4,415,300 | |||
41,000 | IVAX Corp. (a)* | 983,590 | |||
68,900 | Lilly (Eli) & Co. | 4,816,799 | |||
77,900 | Novartis AG, Sponsored ADR | 3,466,550 | |||
447,075 | Pfizer, Inc. | 15,325,731 | |||
28,400 | Roche Holding AG, Sponsored ADR | 2,811,881 | |||
186,594 | Wyeth Corp. | 6,747,239 | |||
| 59,182,956 | |||||
| Retail - 7.5% | |||||
159,800 | Bed Bath & Beyond, Inc.* | 6,144,310 | |||
92,400 | Chico’s FAS, Inc. (a)* | 4,172,784 | |||
80,100 | Costco Wholesale Corp. | 3,289,707 | |||
205,569 | Home Depot, Inc. | 7,236,029 | |||
26,400 | Kohls Corp. (a)* | 1,116,192 | |||
74,800 | Lowes Cos., Inc. | 3,930,740 | |||
173,700 | Starbucks Corp.* | 7,552,476 | |||
91,400 | Target Corp. | 3,881,758 | |||
125,700 | Tiffany & Co. | 4,632,045 | |||
| 41,956,041 | |||||
| Semiconductors - 6.1% | |||||
633,568 | Intel Corp. | 17,486,477 | |||
154,600 | Marvell Technology Group, Ltd. (a)* | 4,127,820 | |||
65,500 | Maxim Integrated Products, Inc. | 3,433,510 | |||
121,600 | National Semiconductor Corp.* | 2,673,984 | |||
264,700 | Texas Instruments, Inc. | 6,400,446 | |||
| 34,122,237 | |||||
| Software - 9.0% | |||||
108,300 | Electronic Arts, Inc.* | 5,907,765 | |||
237,196 | First Data Corp. | 10,559,966 | |||
154,177 | Intuit, Inc.* | 5,948,149 | |||
51,300 | Mercury Interactive Corp. (a)* | 2,556,279 | |||
661,126 | Microsoft Corp. | 18,881,759 | |||
152,900 | SAP AG, Sponsored ADR (a) | 6,392,749 | |||
| 50,246,667 | |||||
| Telecommunications - 5.2% | |||||
48,900 | Amdocs, Ltd.* | 1,145,727 | |||
770,133 | Cisco Systems, Inc.* | 18,252,152 | |||
445,358 | Vodafone Group, Plc, Sponsored ADR (a) | 9,842,412 | |||
| 29,240,291 | |||||
Total Common Stocks (Cost $495,054,012) | 550,958,143 | ||||
INVESTMENT COMPANY - 1.6% | |||||
8,979,988 | Marshall Money Market Fund | $ | 8,979,988 | ||
Total Investment Company (Cost $8,979,988) | 8,979,988 | ||||
Total Investments - 99.7% (Cost $504,034,000) | 559,938,131 | ||||
Net Other Assets and Liabilities - 0.3% | 1,757,978 | ||||
Total Net Assets - 100.0% | $ | 561,696,109 | |||
| * | Non-income producing security. |
| (a) | All or a portion of this security is out on loan at June 30, 2004; the value of the securities loaned amounted to $53,584,751. The value of collateral amounted to $58,115,843 which consisted of cash equivalents. |
| ADR | American Depositary Receipt. Shares of a foreign based corporation held in U.S. banks entitling the shareholder to all dividends and capital gains. |
FEDERAL INCOME TAX INFORMATION (SEE NOTE 2)
At June 30, 2004, the aggregate cost of investment securities for tax purposes was $516,876,242. Net unrealized appreciation (depreciation) aggregated $43,061,889, of which $52,019,231 related to appreciated investment securities and $(8,957,342) related to depreciated investment securities.
OTHER INFORMATION
For the six months ended June 30, 2004, the aggregate cost of purchases and the proceeds of sales, other than from short-term investments, included $395,298,774 and $475,409,200 of non-governmental issuers, respectively.
See Notes to Financial Statements.
F-9
Table of Contents
CORE EQUITY FUND
PORTFOLIO OF INVESTMENTS • June 30, 2004 (Unaudited)
Shares | Value (Note 2) | ||||
COMMON STOCKS - 98.4% | |||||
| Advertising - 1.0% | |||||
139,100 | Interpublic Group of Companies, Inc.* | $ | 1,909,843 | ||
39,700 | Lamar Advertising Co.* | 1,720,995 | |||
| 3,630,838 | |||||
| Aerospace & Defense - 1.6% | |||||
43,200 | Boeing Co. | 2,207,088 | |||
37,400 | Northrop Grumman Corp. | 2,008,380 | |||
13,900 | United Technologies Corp. | 1,271,572 | |||
| 5,487,040 | |||||
| Airlines - 0.2% | |||||
82,000 | Delta Air Lines, Inc.* (a) | 583,840 | |||
| Auto Parts & Equipment - 0.7% | |||||
43,100 | Johnson Controls, Inc. | 2,300,678 | |||
| Banks - 6.0% | |||||
40,178 | Bank of America Corp. | 3,399,862 | |||
145,700 | Mellon Financial Corp. | 4,273,381 | |||
41,800 | Northern Trust Corp. | 1,767,304 | |||
65,700 | PNC Bank Corp. | 3,487,356 | |||
17,300 | State Street Corp. | 848,392 | |||
131,200 | Wells Fargo & Co. | 7,508,576 | |||
| 21,284,871 | |||||
| Beverages - 2.0% | |||||
128,000 | PepsiCo, Inc. | 6,896,640 | |||
| Biotechnology - 0.4% | |||||
26,100 | Amgen, Inc.* | 1,424,277 | |||
| Building Materials - 2.0% | |||||
71,900 | Martin Marietta Materials, Inc. (a) | 3,187,327 | |||
128,700 | Masco Corp. | 4,012,866 | |||
| 7,200,193 | |||||
| Commercial Services - 2.7% | |||||
206,100 | Cendant Corp. | 5,045,328 | |||
40,700 | Equifax, Inc. (a) | 1,007,325 | |||
34,200 | Moody’s Corp. | 2,211,372 | |||
47,000 | Valassis Communications, Inc.* | 1,432,090 | |||
| 9,696,115 | |||||
| Computers - 1.7% | |||||
136,900 | Dell, Inc.* | 4,903,758 | |||
82,000 | EMC Corp.* | 934,800 | |||
| 5,838,558 | |||||
| Cosmetics & Personal Care - 3.1% | |||||
63,600 | Avon Products, Inc. | 2,934,504 | |||
67,600 | Colgate-Palmolive Co. | 3,951,220 | |||
33,800 | Kimberly-Clark Corp. | 2,226,744 | |||
35,800 | Procter & Gamble Co. | $ | 1,948,952 | ||
| 11,061,420 | |||||
| Diversified Financial Services - 13.7% | |||||
381,700 | Charles Schwab Corp. | 3,668,137 | |||
227,982 | Citigroup, Inc. | 10,601,163 | |||
82,900 | Fannie Mae | 5,915,744 | |||
191,900 | Freddie Mac | 12,147,270 | |||
96,600 | MBNA Corp. (a) | 2,491,314 | |||
188,100 | Morgan (J.P.) & Co., Inc. | 7,292,637 | |||
123,300 | Morgan Stanley Dean Witter & Co. | 6,506,541 | |||
| 48,622,806 | |||||
| Electric - 3.4% | |||||
108,700 | American Electric Power, Inc. (a) | 3,478,400 | |||
92,700 | CMS Energy Corp.* (a) | 846,351 | |||
87,900 | Exelon Corp. | 2,926,191 | |||
95,100 | FirstEnergy Corp. | 3,557,691 | |||
68,200 | Pepco Holdings, Inc. | 1,246,696 | |||
| 12,055,329 | |||||
| Food - 1.7% | |||||
91,400 | Albertson’s, Inc. (a) | 2,425,756 | |||
58,200 | Wrigley (Wm.) Jr. Co. | 3,669,510 | |||
| 6,095,266 | |||||
| Forest Products & Paper - 0.5% | |||||
60,700 | MeadWestvaco Corp. | 1,783,973 | |||
| Gas - 0.7% | |||||
70,800 | Sempra Energy | 2,437,644 | |||
| Health Care - Products - 1.8% | |||||
35,100 | Guidant Corp. | 1,961,388 | |||
45,600 | Johnson & Johnson | 2,539,920 | |||
35,000 | Medtronic, Inc. | 1,705,200 | |||
| 6,206,508 | |||||
| Health Care - Services - 1.9% | |||||
9,900 | Quest Diagnostics, Inc. | 841,005 | |||
94,300 | UnitedHealth Group, Inc. | 5,870,175 | |||
| 6,711,180 | |||||
| Household Products & Wares - 0.3% | |||||
23,800 | Energizer Holdings, Inc.* | 1,071,000 | |||
| Insurance - 3.0% | |||||
53,300 | AFLAC, Inc. | 2,175,173 | |||
13,400 | AMBAC Financial Group, Inc. | 984,096 | |||
49,400 | American International Group, Inc. | 3,521,232 | |||
45,200 | Hartford Financial Services Group, Inc. | 3,107,048 | |||
24,900 | Willis Group Holdings, Ltd. | 932,505 | |||
| 10,720,054 | |||||
See Notes to Financial Statements.
F-10
Table of Contents
CORE EQUITY FUND
PORTFOLIO OF INVESTMENTS, Continued • June 30, 2004 (Unaudited)
| Shares | Value (Note 2) | ||||
| Internet - 1.5% | |||||
| 28,000 | eBay, Inc.* | $ | 2,574,600 | ||
| 77,800 | Yahoo!, Inc.* | 2,826,474 | |||
| 5,401,074 | |||||
| Leisure Time - 0.6% | |||||
| 78,300 | Sabre Group Holdings, Inc. (a) | 2,169,693 | |||
| Lodging - 1.7% | |||||
| 52,600 | Harrah’s Entertainment, Inc. | 2,845,660 | |||
| 39,300 | Marriott International, Inc., Class A | 1,960,284 | |||
| 30,700 | Starwood Hotels & Resorts Worldwide, Inc. | 1,376,895 | |||
| 6,182,839 | |||||
| Manufacturing - Miscellaneous - 1.6% | |||||
| 57,900 | Illinois Tool Works, Inc. | 5,552,031 | |||
| Media - 11.2% | |||||
| 107,400 | Clear Channel Communications, Inc. | 3,968,430 | |||
| 52,200 | Comcast Corp., Special Class A* | 1,441,242 | |||
| 40,300 | Cox Communications, Inc.* | 1,119,937 | |||
| 59,400 | Echostar Communications Corp.* | 1,826,550 | |||
| 32,700 | Gannett Co., Inc. | 2,774,595 | |||
| 247,300 | Liberty Media Group, Class A | 2,223,227 | |||
| 57,500 | McGraw-Hill Cos., Inc. | 4,402,775 | |||
| 439,100 | Time Warner, Inc.* | 7,719,378 | |||
| 140,130 | Univision Communications, Inc.* (a) | 4,474,351 | |||
| 268,100 | Viacom, Inc., Class B | 9,576,532 | |||
| 39,527,017 | |||||
| Oil & Gas - 4.1% | |||||
| 66,856 | ConocoPhillips | 5,100,444 | |||
| 207,900 | Exxon Mobil Corp. | 9,232,839 | |||
| 14,333,283 | |||||
| Pharmaceuticals - 6.9% | |||||
| 81,600 | Bristol-Myers Squibb Co. | 1,999,200 | |||
| 78,400 | Caremax Rx, Inc.* | 2,582,496 | |||
| 37,600 | Cephalon, Inc.* (a) | 2,030,400 | |||
| 24,900 | Lilly (Eli) & Co. | 1,740,759 | |||
| 236,800 | Pfizer, Inc. | 8,117,504 | |||
| 224,000 | Wyeth Corp. | 8,099,840 | |||
| 24,570,199 | |||||
| Retail - 4.1% | |||||
| 43,000 | CarMax, Inc.* (a) | 940,410 | |||
| 76,200 | Costco Wholesale Corp. | 3,129,534 | |||
| 30,300 | Dollar Tree Stores, Inc.* | 831,129 | |||
| 72,000 | Family Dollar Stores, Inc. | 2,190,240 | |||
| 26,100 | Lowes Cos., Inc. | 1,371,555 | |||
| 115,700 | Wal-Mart Stores, Inc. | 6,104,332 | |||
| 14,567,200 | |||||
| Savings & Loans - 0.3% | |||||
| 10,000 | Golden West Financial Corp. | 1,063,500 | |||
| Semiconductors - 2.3% | |||||
| 234,200 | Intel Corp. | 6,463,920 | |||
| 45,400 | Linear Technology Corp. | 1,791,938 | |||
| 8,255,858 | |||||
| Software - 5.0% | |||||
| 182,800 | First Data Corp. | 8,138,256 | |||
| 22,200 | Intuit, Inc.* | 856,476 | |||
| 307,800 | Microsoft Corp. | 8,790,768 | |||
| 17,785,500 | |||||
| Telecommunications - 8.7% | |||||
| 89,300 | BellSouth Corp. | 2,341,446 | |||
| 261,000 | Cisco Systems, Inc.* | 6,185,700 | |||
| 149,600 | Crown Castle International Corp.* | 2,206,600 | |||
| 283,200 | Nextel Communications, Inc., Class A* | 7,550,112 | |||
| 122,600 | Qualcomm, Inc. | 8,947,348 | |||
| 146,900 | SBC Communications, Inc. | 3,562,325 | |||
| 30,793,531 | |||||
| Transportation - 2.0% | |||||
| 93,900 | Burlington Northern Santa Fe Corp. | 3,293,073 | |||
| 117,600 | CSX Corp. | 3,853,752 | |||
| 7,146,825 | |||||
Total Common Stocks (Cost $314,668,053) | 348,456,780 | ||||
| Total Investments - 98.4% (Cost $314,668,053) | 348,456,780 | ||||
| Net Other Assets and Liabilities - 1.6% | 5,654,177 | ||||
| Total Net Assets - 100.0% | $ | 354,110,957 | |||
| * | Non-income producing security. |
| (a) | All or a portion of this security is out on loan at June 30, 2004; the value of the securities loaned amounted to $16,334,026. The value of collateral amounted to $17,050,990 which consisted of cash equivalents. |
FEDERAL INCOME TAX INFORMATION (SEE NOTE 2)
At June 30, 2004, the aggregate cost of investment securities for tax purposes was $325,478,593. Net unrealized appreciation (depreciation) aggregated $22,978,187 of which $37,838,169 related to appreciated investment securities and $(14,859,982) related to depreciated investment securities.
OTHER INFORMATION
For the six months ended June 30, 2004, the aggregate cost of purchases and the proceeds of sales, other than from short-term investments, included $65,533,410 and $119,368,745 of non-governmental issuers, respectively.
See Notes to Financial Statements.
F-11
Table of Contents
EQUITY INDEX FUND
PORTFOLIO OF INVESTMENTS • June 30, 2004 (Unaudited)
| Shares | Value (Note 2) | ||||
| COMMON STOCKS - 99.1% | |||||
| Advertising - 0.2% | |||||
| 24,000 | Interpublic Group of Companies, Inc.* | $ | 329,520 | ||
| 10,900 | Omnicom Group, Inc. (a) | 827,201 | |||
| 1,156,721 | |||||
| Aerospace & Defense - 1.7% | |||||
| 48,438 | Boeing Co. | 2,474,697 | |||
| 11,500 | General Dynamics Corp. | 1,141,950 | |||
| 6,700 | Goodrich (B.F.) Co. | 216,611 | |||
| 25,782 | Lockheed Martin Corp. | 1,342,727 | |||
| 20,692 | Northrop Grumman Corp. | 1,111,160 | |||
| 25,700 | Raytheon Co. | 919,289 | |||
| 10,200 | Rockwell Collins, Inc. | 339,864 | |||
| 29,600 | United Technologies Corp. | 2,707,808 | |||
| 10,254,106 | |||||
| Agriculture - 1.2% | |||||
| 117,900 | Altria Group, Inc. | 5,900,895 | |||
| 15,227 | Monsanto Co. | 586,239 | |||
| 4,900 | R.J. Reynolds Tobacco Holdings, Inc. (a) | 331,191 | |||
| 9,500 | UST, Inc. | 342,000 | |||
| 7,160,325 | |||||
| Airlines - 0.1% | |||||
| 7,100 | Delta Air Lines, Inc. (a)* | 50,552 | |||
| 45,418 | Southwest Airlines, Inc. | 761,660 | |||
| 812,212 | |||||
| Apparel - 0.3% | |||||
| 7,200 | Jones Apparel Group, Inc. | 284,256 | |||
| 6,400 | Liz Claiborne, Inc. | 230,272 | |||
| 15,200 | Nike, Inc., Class B | 1,151,400 | |||
| 3,400 | Reebok International, Ltd. (a) | 122,332 | |||
| 6,300 | V.F. Corp. (a) | 306,810 | |||
| 2,095,070 | |||||
| Auto Manufacturers - 0.6% | |||||
| 105,181 | Ford Motor Co. (a) | 1,646,083 | |||
| 32,500 | General Motors Corp. (a) | 1,514,175 | |||
| 4,000 | Navistar International Corp. (a)* | 155,040 | |||
| 10,130 | Paccar, Inc. | 587,439 | |||
| 3,902,737 | |||||
| Auto Parts & Equipment - 0.2% | |||||
| 4,200 | Cooper Tire & Rubber Co. | 96,600 | |||
| 8,509 | Dana Corp. | 166,776 | |||
| 32,128 | Delphi Automotive Systems Corp. | 343,127 | |||
| 10,000 | Goodyear Tire & Rubber Co. (a)* | 90,900 | |||
| 10,900 | Johnson Controls, Inc. | 581,842 | |||
| 7,436 | Visteon Corp. | 86,778 | |||
| 1,366,023 | |||||
| Banks - 6.7% | |||||
| 20,200 | Amsouth Bancorp | $ | 514,494 | ||
| 64,475 | Banc One Corp. | 3,288,225 | |||
| 117,171 | Bank of America Corp. | 9,915,010 | |||
| 44,700 | Bank of New York Co., Inc. | 1,317,756 | |||
| 32,200 | BB&T Corp. | 1,190,434 | |||
| 12,875 | Charter One Financial, Inc. | 568,946 | |||
| 9,950 | Comerica, Inc. | 546,056 | |||
| 32,405 | Fifth Third Bancorp | 1,742,741 | |||
| 7,100 | First Horizon National Corp. | 322,837 | |||
| 13,149 | Huntington Bancshares, Inc. (a) | 301,112 | |||
| 23,600 | KeyCorp | 705,404 | |||
| 6,800 | M & T Bank Corp. | 593,640 | |||
| 12,800 | Marshall & Ilsley Corp. | 500,352 | |||
| 24,400 | Mellon Financial Corp. | 715,652 | |||
| 35,700 | National City Corp. | 1,249,857 | |||
| 9,900 | North Fork Bancorp., Inc. | 376,695 | |||
| 12,700 | Northern Trust Corp. | 536,956 | |||
| 16,200 | PNC Bank Corp. | 859,896 | |||
| 12,600 | Regions Financial Corp. (a) | 460,530 | |||
| 19,000 | Southtrust Corp. | 737,390 | |||
| 19,300 | State Street Corp. | 946,472 | |||
| 16,300 | Suntrust Banks, Inc. (a) | 1,059,337 | |||
| 17,500 | Synovus Financial Corp. | 443,100 | |||
| 108,934 | U.S. Bancorp | 3,002,221 | |||
| 10,900 | Union Planters Corp. | 324,929 | |||
| 75,596 | Wachovia Corp. | 3,364,022 | |||
| 97,030 | Wells Fargo & Co. | 5,553,027 | |||
| 5,200 | Zions Bancorp. | 319,540 | |||
| 41,456,631 | |||||
| Beverages - 2.7% | |||||
| 2,200 | Adolph Coors Co. (a) | 159,148 | |||
| 46,200 | Anheuser-Busch Companies, Inc. | 2,494,800 | |||
| 7,000 | Brown Forman Corp., Class B | 337,890 | |||
| 140,000 | Coca-Cola Co. | 7,067,200 | |||
| 27,000 | Coca-Cola Enterprises, Inc. | 782,730 | |||
| 14,800 | Pepsi Bottling Group, Inc. | 451,992 | |||
| 98,110 | PepsiCo, Inc. | 5,286,167 | |||
| 16,579,927 | |||||
| Biotechnology - 1.1% | |||||
| 73,108 | Amgen, Inc.* | 3,989,504 | |||
| 11,600 | Applied Biosystems Group - Applera Corp. | 252,300 | |||
| 19,585 | Biogen Idec, Inc.* | 1,238,751 | |||
| 10,900 | Chiron Corp. (a)* | 486,576 | |||
| 13,000 | Genzyme Corp.* | 615,290 | |||
| 14,300 | Medimmune, Inc.* | 334,620 | |||
| 2,800 | Millipore Corp.* | 157,836 | |||
| 7,074,877 | |||||
| Building Materials - 0.3% | |||||
| 12,400 | American Standard Companies, Inc.* | 499,844 | |||
| 25,200 | Masco Corp. | 785,736 | |||
| 5,900 | Vulcan Materials Co. (a) | 280,545 | |||
| 1,566,125 | |||||
See Notes to Financial Statements.
F-12
Table of Contents
EQUITY INDEX FUND
PORTFOLIO OF INVESTMENTS, Continued • June 30, 2004 (Unaudited)
| Shares | Value (Note 2) | ||||
| Chemicals - 1.6% | |||||
| 13,100 | Air Products & Chemicals, Inc. | $ | 687,095 | ||
| 4,100 | Ashland, Inc. | 216,521 | |||
| 6,400 | Avery Dennison Corp. | 409,664 | |||
| 53,777 | Dow Chemical Co. | 2,188,724 | |||
| 57,500 | Du Pont (E.I.) De Nemours and Co. | 2,554,150 | |||
| 4,500 | Eastman Chemical Co. (a) | 208,035 | |||
| 14,700 | Ecolab, Inc. (a) | 465,990 | |||
| 7,150 | Engelhard Corp. | 231,016 | |||
| 2,900 | Great Lakes Chemical Corp. | 78,474 | |||
| 6,300 | Hercules, Inc.* | 76,797 | |||
| 5,400 | International Flavors & Fragrances, Inc. | 201,960 | |||
| 9,900 | PPG Industries, Inc. | 618,651 | |||
| 18,700 | Praxair, Inc. | 746,317 | |||
| 12,875 | Rohm & Haas Co. | 535,342 | |||
| 8,200 | Sherwin Williams Co. | 340,710 | |||
| 4,000 | Sigma Aldrich Corp. (a) | 238,440 | |||
| 9,797,886 | |||||
| Commercial Services - 0.9% | |||||
| 10,200 | Apollo Group, Inc.* | 900,558 | |||
| 58,633 | Cendant Corp. | 1,435,336 | |||
| 8,200 | Convergys Corp.* | 126,280 | |||
| 2,900 | Deluxe Corp. | 126,150 | |||
| 7,800 | Equifax, Inc. | 193,050 | |||
| 10,100 | H&R Block, Inc. (a) | 481,568 | |||
| 16,814 | McKesson Corp. | 577,225 | |||
| 8,600 | Moody’s Corp. | 556,076 | |||
| 21,650 | Paychex, Inc. | 733,502 | |||
| 12,500 | R. R. Donnelley & Sons Co. | 412,750 | |||
| 9,800 | Robert Half International, Inc. | 291,746 | |||
| 5,834,241 | |||||
| Computers - 3.9% | |||||
| 7,800 | Affiliated Computer Services, Class A (a)* | 412,932 | |||
| 21,800 | Apple Computer, Inc.* | 709,372 | |||
| 10,800 | Computer Sciences Corp.* | 501,444 | |||
| 145,000 | Dell, Inc.* | 5,193,900 | |||
| 27,800 | Electronic Data Systems Corp. (a) | 532,370 | |||
| 140,400 | EMC Corp.* | 1,600,560 | |||
| 21,360 | Gateway, Inc.* | 96,120 | |||
| 175,198 | Hewlett-Packard Co. | 3,696,678 | |||
| 96,900 | International Business Machines Corp. | 8,541,735 | |||
| 7,500 | Lexmark International Group, Inc.* | 723,975 | |||
| 5,400 | NCR Corp.* | 267,786 | |||
| 19,900 | Network Appliance, Inc.* | 428,447 | |||
| 191,100 | Sun Microsystems, Inc.* | 829,374 | |||
| 16,600 | SunGard Data Systems, Inc.* | 431,600 | |||
| 19,100 | Unisys Corp.* | 265,108 | |||
| �� | 24,231,401 | ||||
| Cosmetics & Personal Care - 2.5% | |||||
| 5,250 | Alberto-Culver Co. | 263,235 | |||
| 27,100 | Avon Products, Inc. | 1,250,394 | |||
| 30,600 | Colgate-Palmolive Co. | 1,788,570 | |||
| 57,700 | Gillette Co. | 2,446,480 | |||
| 28,840 | Kimberly-Clark Corp. | 1,899,979 | |||
| 147,800 | Procter & Gamble Co. | 8,046,232 | |||
| 15,694,890 | |||||
| Distribution & Wholesale - 0.1% | |||||
| 10,050 | Genuine Parts Co. | 398,784 | |||
| 5,200 | W.W. Grainger, Inc. | 299,000 | |||
| 697,784 | |||||
| Diversified Financial Services - 7.6% | |||||
| 73,500 | American Express Co. | 3,776,430 | |||
| 6,052 | Bear Stearns Cos., Inc. (a) | 510,244 | |||
| 13,837 | Capital One Financial Corp. | 946,174 | |||
| 78,400 | Charles Schwab Corp. | 753,424 | |||
| 297,240 | Citigroup, Inc. | 13,821,660 | |||
| 16,099 | Countrywide Financial Corp. | 1,130,955 | |||
| 21,000 | E*TRADE Financial Corp.* | 234,150 | |||
| 55,700 | Fannie Mae | 3,974,752 | |||
| 6,200 | Federated Investors, Inc., Class B | 188,108 | |||
| 14,330 | Franklin Resources, Inc. | 717,646 | |||
| 39,600 | Freddie Mac | 2,506,680 | |||
| 27,800 | Goldman Sachs and Co. | 2,617,648 | |||
| 13,700 | Janus Capital Group, Inc. (a) | 225,913 | |||
| 15,900 | Lehman Brothers Holdings, Inc. | 1,196,475 | |||
| 73,377 | MBNA Corp. | 1,892,393 | |||
| 55,200 | Merrill Lynch & Co., Inc. | 2,979,696 | |||
| 119,718 | Morgan (J.P.) & Co., Inc. (a) | 4,641,467 | |||
| 63,234 | Morgan Stanley Dean Witter & Co. | 3,336,858 | |||
| 16,700 | Providian Financial Corp.* | 244,989 | |||
| 25,271 | SLM Corp. | 1,022,212 | |||
| 7,300 | T. Rowe Price Group, Inc. | 367,920 | |||
| 47,085,794 | |||||
| Electric - 2.5% | |||||
| 36,600 | AES Corp.* | 363,438 | |||
| 7,200 | Allegheny Energy, Inc. (a)* | 110,952 | |||
| 10,500 | Ameren Corp. (a) | 451,080 | |||
| 22,740 | American Electric Power, Inc. (a) | 727,680 | |||
| 23,900 | Calpine Corp. (a)* | 103,248 | |||
| 17,598 | CenterPoint Energy, Inc. (a) | 202,377 | |||
| 10,343 | Cinergy Corp. (a) | 393,034 | |||
| 9,400 | CMS Energy Corp. (a)* | 85,822 | |||
| 13,800 | Consolidated Edison, Inc. (a) | 548,688 | |||
| 9,650 | Constellation Energy Group, Inc. | 365,735 | |||
| 18,750 | Dominion Resources, Inc. | 1,182,750 | |||
| 10,000 | DTE Energy Co. | 405,400 | |||
| 52,534 | Duke Energy Corp. | 1,065,915 | |||
| 18,700 | Edison International | 478,159 | |||
| 13,200 | Entergy Corp. | 739,332 | |||
| 38,000 | Exelon Corp. | 1,265,020 | |||
| 19,000 | FirstEnergy Corp. | 710,790 | |||
| 10,600 | Florida Power & Light Group Capital, Inc. | 677,870 | |||
| 15,100 | NiSource, Inc. | 311,362 | |||
| 24,100 | PG&E Corp.* | 673,354 | |||
| 5,200 | Pinnacle West Capital Corp. | 210,028 | |||
| 10,200 | PPL Corp. | 468,180 | |||
| 14,177 | Progress Energy, Inc. (a) | 624,497 | |||
See Notes to Financial Statements.
F-13
Table of Contents
EQUITY INDEX FUND
PORTFOLIO OF INVESTMENTS, Continued • June 30, 2004 (Unaudited)
| Shares | Value (Note 2) | ||||
| Electric (continued) | |||||
| 13,600 | Public Service Enterprise Group, Inc. (a) | $ | 544,408 | ||
| 42,400 | Southern Co. (a) | 1,235,960 | |||
| 10,800 | TECO Energy, Inc. (a) | 129,492 | |||
| 18,640 | TXU Corp. | 755,106 | |||
| 22,910 | Xcel Energy, Inc. (a) | 382,826 | |||
| 15,212,503 | |||||
| Electrical Components & Equipment - 0.4% | |||||
| 11,500 | American Power Conversion Corp. | 225,975 | |||
| 24,300 | Emerson Electric Co. | 1,544,265 | |||
| 10,925 | Molex, Inc. (a) | 350,474 | |||
| 4,800 | Power-One, Inc.* | 52,704 | |||
| 2,173,418 | |||||
| Electronics - 0.5% | |||||
| 27,624 | Agilent Technologies, Inc.* | 808,831 | |||
| 11,500 | Jabil Circuit, Inc.* | 289,570 | |||
| 6,875 | Parker-Hannifin Corp. | 408,787 | |||
| 7,300 | Perkinelmer, Inc. | 146,292 | |||
| 29,900 | Sanmina Corp. (a)* | 272,090 | |||
| 55,200 | Solectron Corp.* | 357,144 | |||
| 13,400 | Symbol Technologies, Inc. | 197,516 | |||
| 4,800 | Tektronix, Inc. | 163,296 | |||
| 9,500 | Thermo Electron Corp.* | 292,030 | |||
| 3,300 | Thomas & Betts Corp. | 89,859 | |||
| 6,900 | Waters Corp.* | 329,682 | |||
| 3,355,097 | |||||
| Engineering & Construction - 0.0% | |||||
| 4,800 | Fluor Corp. | 228,816 | |||
| Entertainment - 0.1% | |||||
| 20,000 | International Game Technology | 772,000 | |||
| Environmental Control - 0.2% | |||||
| 18,200 | Allied Waste Industries, Inc.* | 239,876 | |||
| 33,335 | Waste Management, Inc. | 1,021,718 | |||
| 1,261,594 | |||||
| Food - 1.8% | |||||
| 21,142 | Albertson’s, Inc. (a) | 561,109 | |||
| 37,349 | Archer-Daniels-Midland Co. | 626,716 | |||
| 23,600 | Campbell Soup Co. | 634,368 | |||
| 30,300 | Conagra, Inc. | 820,524 | |||
| 21,700 | General Mills, Inc. (a) | 1,031,401 | |||
| 20,200 | H.J. Heinz Co. | 791,840 | |||
| 14,900 | Hershey Foods Corp. | 689,423 | |||
| 23,600 | Kellogg Co. | 987,660 | |||
| 42,600 | Kroger Co.* | 775,320 | |||
| 7,900 | McCormick & Co., Inc. | 268,600 | |||
| 25,600 | Safeway, Inc. (a)* | 648,704 | |||
| 45,400 | Sara Lee Corp. | 1,043,746 | |||
| 7,700 | Supervalu, Inc. | 235,697 | |||
| 36,700 | Sysco Corp. | 1,316,429 | |||
| 8,100 | Winn-Dixie Stores, Inc. (a) | 58,320 | |||
| 12,900 | Wrigley (Wm.) Jr. Co. | $ | 813,345 | ||
| 11,303,202 | |||||
| Forest Products & Paper - 0.6% | |||||
| 5,000 | Boise Cascade Corp. | 188,200 | |||
| 14,602 | Georgia-Pacific Corp. | 539,982 | |||
| 27,940 | International Paper Co. | 1,248,918 | |||
| 6,200 | Louisiana Pacific Corp. | 146,630 | |||
| 11,598 | MeadWestvaco Corp. | 340,865 | |||
| 3,200 | Temple Inland, Inc. | 221,600 | |||
| 13,900 | Weyerhaeuser Co. | 877,368 | |||
| 3,563,563 | |||||
| Gas - 0.2% | |||||
| 9,200 | KeySpan Energy Corp. | 337,640 | |||
| 2,500 | Nicor, Inc. | 84,925 | |||
| 2,200 | Peoples Energy Corp. | 92,730 | |||
| 13,213 | Sempra Energy | 454,924 | |||
| 970,219 | |||||
| Hand & Machine Tools - 0.1% | |||||
| 4,600 | Black & Decker Corp. (a) | 285,798 | |||
| 3,300 | Snap-On, Inc. | 110,715 | |||
| 4,700 | Stanley Works (a) | 214,226 | |||
| 610,739 | |||||
| Health Care - Products - 3.6% | |||||
| 3,100 | Bausch & Lomb, Inc. | 201,717 | |||
| 35,200 | Baxter International, Inc. | 1,214,752 | |||
| 14,600 | Becton, Dickinson & Co. (a) | 756,280 | |||
| 14,625 | Biomet, Inc. | 649,935 | |||
| 48,000 | Boston Scientific Corp.* | 2,054,400 | |||
| 6,000 | C.R. Bard, Inc. | 339,900 | |||
| 18,000 | Guidant Corp. | 1,005,840 | |||
| 170,660 | Johnson & Johnson | 9,505,762 | |||
| 69,700 | Medtronic, Inc. | 3,395,784 | |||
| 10,100 | St. Jude Medical, Inc.* | 764,065 | |||
| 23,000 | Stryker Corp. | 1,265,000 | |||
| 14,070 | Zimmer Holdings, Inc.* | 1,240,974 | |||
| 22,394,409 | |||||
| Health Care - Services - 1.2% | |||||
| 8,798 | Aetna, Inc. | 747,830 | |||
| 8,000 | Anthem, Inc. (a)* | 716,480 | |||
| 27,900 | HCA - The Healthcare Corporation | 1,160,361 | |||
| 13,900 | Health Management Associates, Inc., Class A | 311,638 | |||
| 9,200 | Humana, Inc.* | 155,480 | |||
| 5,100 | Manor Care, Inc. | 166,668 | |||
| 6,000 | Quest Diagnostics, Inc. | 509,700 | |||
| 26,750 | Tenet Healthcare Corp. (a)* | 358,717 | |||
| 35,400 | UnitedHealth Group, Inc. | 2,203,650 | |||
| 9,000 | Wellpoint Health Networks, Inc.* | 1,008,090 | |||
| 7,338,614 | |||||
See Notes to Financial Statements.
F-14
Table of Contents
EQUITY INDEX FUND
PORTFOLIO OF INVESTMENTS, Continued • June 30, 2004 (Unaudited)
| Shares | Value (Note 2) | ||||
| Home Builders - 0.1% | |||||
| 7,100 | Centex Corp. | $ | 324,825 | ||
| 2,700 | KB Home (a) | 185,301 | |||
| 7,300 | Pulte Corp. | 379,819 | |||
| 889,945 | |||||
| Home Furnishings - 0.1% | |||||
| 11,000 | Leggett & Platt, Inc. | 293,810 | |||
| 4,500 | Maytag Corp. | 110,295 | |||
| 4,000 | Whirlpool Corp. (a) | 274,400 | |||
| 678,505 | |||||
| Household Products & Wares - 0.3% | |||||
| 12,200 | Clorox Co. | 656,116 | |||
| 8,400 | Fortune Brands, Inc. | 633,612 | |||
| 15,733 | Newell Rubbermaid, Inc. (a) | 369,726 | |||
| 1,659,454 | |||||
| Insurance - 4.9% | |||||
| 16,300 | ACE, Ltd. | 689,164 | |||
| 29,200 | AFLAC, Inc. | 1,191,652 | |||
| 40,438 | Allstate Corp. | 1,882,389 | |||
| 6,300 | AMBAC Financial Group, Inc. | 462,672 | |||
| 149,979 | American International Group, Inc. | 10,690,503 | |||
| 18,050 | AON Corp. | 513,884 | |||
| 10,900 | Chubb Corp. | 743,162 | |||
| 8,100 | Cigna Corp. | 557,361 | |||
| 9,675 | Cincinnati Financial Corp. | 421,056 | |||
| 16,800 | Hartford Financial Services Group, Inc. | 1,154,832 | |||
| 8,000 | Jefferson Pilot Corp. (a) | 406,400 | |||
| 10,300 | Lincoln National Corp. | 486,675 | |||
| 10,700 | Loews Corp. | 641,572 | |||
| 30,100 | Marsh & McLennan Cos., Inc. (a) | 1,365,938 | |||
| 8,350 | MBIA, Inc. | 476,952 | |||
| 43,400 | Metlife, Inc. | 1,555,890 | |||
| 5,700 | MGIC Investment Corp. | 432,402 | |||
| 18,300 | Principal Financial Group, Inc. | 636,474 | |||
| 12,500 | Progressive Corp. | 1,066,250 | |||
| 30,200 | Prudential Financial, Inc. | 1,403,394 | |||
| 8,000 | SAFECO Corp. | 352,000 | |||
| 38,390 | St. Paul Travelers Cos., Inc. | 1,556,331 | |||
| 6,400 | Torchmark Corp. | 344,320 | |||
| 17,018 | UnumProvident Corp. (a) | 270,586 | |||
| 8,000 | XL Capital, Ltd., Class A | 603,680 | |||
| 29,905,539 | |||||
| Internet - 1.2% | |||||
| 37,800 | eBay, Inc.* | 3,475,710 | |||
| 6,700 | Monster Worldwide, Inc. (a)* | 172,324 | |||
| 17,900 | Symantec Corp.* | 783,662 | |||
| 77,400 | Yahoo!, Inc.* | 2,811,942 | |||
| 7,243,638 | |||||
| Iron & Steel - 0.1% | |||||
| 4,651 | Allegheny Technologies, Inc. | 83,951 | |||
| 4,600 | Nucor Corp. | 353,096 | |||
| 6,520 | United States Steel Corp. (a) | $ | 228,982 | ||
| 666,029 | |||||
| Leisure Time - 0.5% | |||||
| 5,400 | Brunswick Corp. | 220,320 | |||
| 36,400 | Carnival Corp. | 1,710,800 | |||
| 17,000 | Harley-Davidson, Inc. (a) | 1,052,980 | |||
| 8,008 | Sabre Group Holdings, Inc. | 221,902 | |||
| 3,206,002 | |||||
| Lodging - 0.3% | |||||
| 6,500 | Harrah’s Entertainment, Inc. | 351,650 | |||
| 22,000 | Hilton Hotels Corp. | 410,520 | |||
| 13,000 | Marriott International, Inc., Class A (a) | 648,440 | |||
| 11,900 | Starwood Hotels & Resorts Worldwide, Inc. | 533,715 | |||
| 1,944,325 | |||||
| Machinery - Construction & Mining - 0.3% | |||||
| 19,700 | Caterpillar, Inc. | 1,564,968 | |||
| Machinery - Diversified - 0.3% | |||||
| 2,500 | Cummins Engine Co., Inc. | 156,250 | |||
| 14,300 | Deere & Co. | 1,003,002 | |||
| 10,700 | Rockwell International Corp. | 401,357 | |||
| 1,560,609 | |||||
| Manufacturing - Miscellaneous - 5.8% | |||||
| 45,000 | 3M Co. | 4,050,450 | |||
| 5,300 | Cooper Industries, Ltd. | 314,873 | |||
| 3,450 | Crane Co. | 108,296 | |||
| 17,700 | Danaher Corp. | 917,745 | |||
| 11,700 | Dover Corp. | 492,570 | |||
| 16,400 | Eastman Kodak Co. (a) | 442,472 | |||
| 8,700 | Eaton Corp. | 563,238 | |||
| 606,700 | General Electric Co. | 19,657,080 | |||
| 49,375 | Honeywell International, Inc. | 1,808,606 | |||
| 17,800 | Illinois Tool Works, Inc. | 1,706,842 | |||
| 10,000 | Ingersoll-Rand Co. | 683,100 | |||
| 5,300 | ITT Industries, Inc. | 439,900 | |||
| 7,200 | Pall Corp. | 188,568 | |||
| 7,900 | Textron, Inc. | 468,865 | |||
| 115,237 | Tyco International, Ltd. (a) | 3,818,954 | |||
| 35,661,559 | |||||
| Media - 3.4% | |||||
| 35,300 | Clear Channel Communications, Inc. | 1,304,335 | |||
| 128,878 | Comcast Corp., Class A* | 3,612,450 | |||
| 4,700 | Dow Jones & Company, Inc. (a) | 211,970 | |||
| 15,700 | Gannett Co., Inc. | 1,332,145 | |||
| 4,500 | Knight-Ridder, Inc. | 324,000 | |||
| 11,000 | McGraw-Hill Cos., Inc. | 842,270 | |||
| 2,900 | Meredith Corp. | 159,384 | |||
| 8,500 | New York Times Co., Class A | 380,035 | |||
| 261,998 | Time Warner, Inc.* | 4,605,925 | |||
| 18,787 | Tribune Co. | 855,560 | |||
See Notes to Financial Statements.
F-15
Table of Contents
EQUITY INDEX FUND
PORTFOLIO OF INVESTMENTS, Continued • June 30, 2004 (Unaudited)
| Shares | Value (Note 2) | ||||
| Media (continued) | |||||
| 18,600 | Univision Communications, Inc.* | $ | 593,898 | ||
| 99,628 | Viacom, Inc., Class B | 3,558,712 | |||
| 117,929 | Walt Disney Co. | 3,006,010 | |||
| 20,786,694 | |||||
| Metal Fabricate & Hardware - 0.0% | |||||
| 4,900 | Worthington Industries, Inc. | 100,597 | |||
| Mining - 0.6% | |||||
| 50,008 | Alcoa, Inc. | 1,651,764 | |||
| 10,200 | Freeport-McMoRan Copper & Gold, Inc., Class B (a) | 338,130 | |||
| 25,511 | Newmont Mining Corp. | 988,806 | |||
| 5,400 | Phelps Dodge Corp.* | 418,554 | |||
| 3,397,254 | |||||
| Office & Business Equipment - 0.2% | |||||
| 13,300 | Pitney Bowes, Inc. | 588,525 | |||
| 46,000 | Xerox Corp.* | 667,000 | |||
| 1,255,525 | |||||
| Oil & Gas - 5.6% | |||||
| 5,200 | Amerada Hess Corp. | 411,788 | |||
| 14,479 | Anadarko Petroleum Corp. | 848,469 | |||
| 18,700 | Apache Corp. | 814,385 | |||
| 22,764 | Burlington Resources, Inc. | 823,602 | |||
| 61,536 | ChevronTexaco Corp. | 5,791,153 | |||
| 39,395 | ConocoPhillips | 3,005,445 | |||
| 13,800 | Devon Energy Corp. | 910,800 | |||
| 6,700 | EOG Resources, Inc. | 400,057 | |||
| 375,960 | Exxon Mobil Corp. | 16,696,384 | |||
| 8,581 | Kerr-McGee Corp. | 461,400 | |||
| 19,800 | Marathon Oil Corp. | 749,232 | |||
| 8,500 | Nabors Industries, Ltd.* | 384,370 | |||
| 7,700 | Noble Corp.* | 291,753 | |||
| 22,500 | Occidental Petroleum Corp. | 1,089,225 | |||
| 6,000 | Rowan Cos., Inc.* | 145,980 | |||
| 4,400 | Sunoco, Inc. | 279,928 | |||
| 18,427 | Transocean Sedco Forex, Inc.* | 533,277 | |||
| 15,100 | Unocal Corp. | 573,800 | |||
| 7,400 | Valero Energy Corp. | 545,824 | |||
| 34,756,872 | |||||
| Oil & Gas Services - 0.7% | |||||
| 19,180 | Baker Hughes, Inc. | 722,127 | |||
| 9,200 | BJ Services Co.* | 421,728 | |||
| 25,300 | Halliburton Co. | 765,578 | |||
| 33,900 | Schlumberger, Ltd. | 2,152,989 | |||
| 4,062,422 | |||||
| Packaging & Containers - 0.1% | |||||
| 3,300 | Ball Corp. | 237,765 | |||
| 6,100 | Bemis Co. (a) | 172,325 | |||
| 8,800 | Pactiv Corp.* | 219,472 | |||
| 4,808 | Sealed Air Corp.* | 256,122 | |||
| 885,684 | |||||
| Pharmaceuticals - 7.0% | |||||
| 89,700 | Abbott Laboratories | $ | 3,656,172 | ||
| 7,600 | Allergan, Inc. | 680,352 | |||
| 6,500 | AmerisourceBergen Corp. | 388,570 | |||
| 111,700 | Bristol-Myers Squibb Co. | 2,736,650 | |||
| 24,800 | Cardinal Health, Inc. (a) | 1,737,240 | |||
| 26,300 | Caremax Rx, Inc.* | 866,322 | |||
| 4,500 | Express Scripts, Inc.* | 356,535 | |||
| 21,300 | Forest Laboratories, Inc.* | 1,206,219 | |||
| 8,990 | Hospira, Inc.* | 248,124 | |||
| 13,866 | King Pharmaceuticals, Inc.* | 158,766 | |||
| 64,900 | Lilly (Eli) & Co. | 4,537,159 | |||
| 15,600 | Medco Health Solutions, Inc.* | 585,000 | |||
| 127,700 | Merck & Co., Inc. | 6,065,750 | |||
| 15,400 | Mylan Laboratories | 311,850 | |||
| 438,584 | Pfizer, Inc. | 15,034,660 | |||
| 84,600 | Schering-Plough Corp. | 1,563,408 | |||
| 6,200 | Watson Pharmaceuticals, Inc.* | 166,780 | |||
| 76,600 | Wyeth Corp. | 2,769,856 | |||
| 43,069,413 | |||||
| Pipelines - 0.2% | |||||
| 21,700 | Dynegy, Inc.* | 92,442 | |||
| 36,830 | El Paso Energy Corp. (a) | 290,220 | |||
| 7,100 | Kinder Morgan, Inc. | 420,959 | |||
| 29,800 | Williams Cos., Inc. | 354,620 | |||
| 1,158,241 | |||||
| Real Estate - 0.4% | |||||
| 5,400 | Apartment Investment & Management Co., REIT (a) | 168,102 | |||
| 23,200 | Equity Office Properties Trust, REIT | 631,040 | |||
| 16,100 | Equity Residential Properties Trust, REIT | 478,653 | |||
| 10,500 | Plum Creek Timber Co., Inc., REIT | 342,090 | |||
| 10,400 | ProLogis Trust, REIT | 342,368 | |||
| 12,000 | Simon Property Group, Inc., REIT (a) | 617,040 | |||
| 2,579,293 | |||||
| Retail - 6.7% | |||||
| 15,300 | AutoNation, Inc.* | 261,630 | |||
| 4,800 | AutoZone, Inc. (a)* | 384,480 | |||
| 17,300 | Bed Bath & Beyond, Inc.* | 665,185 | |||
| 18,700 | Best Buy Co., Inc. | 948,838 | |||
| 6,600 | Big Lots, Inc.* | 95,436 | |||
| 11,400 | Circuit City Stores, Inc. (a) | 147,630 | |||
| 26,412 | Costco Wholesale Corp. | 1,084,741 | |||
| 22,800 | CVS Corp. | 958,056 | |||
| 9,200 | Darden Restaurants, Inc. | 189,060 | |||
| 4,800 | Dillards, Inc., Class A | 107,040 | |||
| 18,887 | Dollar General Corp. | 369,430 | |||
| 9,800 | Family Dollar Stores, Inc. (a) | 298,116 | |||
| 10,300 | Federated Department Stores, Inc. | 505,730 | |||
| 51,750 | Gap, Inc. (a) | 1,254,938 | |||
| 127,797 | Home Depot, Inc. | 4,498,454 | |||
| 16,200 | J.C. Penney Co., Inc. (a) | 611,712 | |||
| 19,600 | Kohls Corp. (a)* | 828,688 | |||
| 27,000 | Limited Brands, Inc. | 504,900 | |||
| 45,200 | Lowes Cos., Inc. | 2,375,260 | |||
See Notes to Financial Statements.
F-16
Table of Contents
EQUITY INDEX FUND
PORTFOLIO OF INVESTMENTS, Continued • June 30, 2004 (Unaudited)
| Shares | Value (Note 2) | ||||
| Retail (continued) | |||||
| 16,700 | May Department Stores Co. (a) | $ | 459,083 | ||
| 72,300 | McDonald’s Corp. | 1,879,800 | |||
| 8,000 | Nordstrom, Inc. | 340,880 | |||
| 17,900 | Office Depot, Inc.* | 320,589 | |||
| 9,200 | RadioShack Corp. | 263,396 | |||
| 12,200 | Sears Roebuck & Co. (a) | 460,672 | |||
| 28,600 | Staples, Inc. | 838,266 | |||
| 22,800 | Starbucks Corp.* | 991,344 | |||
| 52,500 | Target Corp. | 2,229,675 | |||
| 8,400 | Tiffany & Co. | 309,540 | |||
| 28,400 | TJX Cos., Inc. | 685,576 | |||
| 12,200 | Toys “R” Us, Inc.* | 194,956 | |||
| 58,900 | Walgreen Co. | 2,132,769 | |||
| 246,500 | Wal-Mart Stores, Inc. | 13,005,340 | |||
| 6,500 | Wendy’s International, Inc. | 226,460 | |||
| 16,620 | Yum! Brands, Inc.* | 618,596 | |||
| 41,046,266 | |||||
| Savings & Loans - 0.5% | |||||
| 8,800 | Golden West Financial Corp. | 935,880 | |||
| 49,674 | Washington Mutual, Inc. | 1,919,403 | |||
| 2,855,283 | |||||
| Semiconductors - 3.6% | |||||
| 20,300 | Advanced Micro Devices (a)* | 322,770 | |||
| 21,500 | Altera Corp. (a)* | 477,730 | |||
| 21,600 | Analog Devices, Inc. | 1,016,928 | |||
| 96,900 | Applied Materials, Inc.* | 1,901,178 | |||
| 17,900 | Applied Micro Circuits Corp.* | 95,228 | |||
| 18,100 | Broadcom Corp.* | 846,537 | |||
| 371,800 | Intel Corp. | 10,261,680 | |||
| 11,300 | KLA-Tencor Corp. (a)* | 557,994 | |||
| 17,800 | Linear Technology Corp. | 702,566 | |||
| 21,900 | LSI Logic Corp.* | 166,878 | |||
| 18,500 | Maxim Integrated Products, Inc. | 969,770 | |||
| 35,000 | Micron Technology, Inc. (a)* | 535,850 | |||
| 20,600 | National Semiconductor Corp.* | 452,994 | |||
| 8,500 | Novellus Systems, Inc.* | 267,240 | |||
| 9,500 | NVIDIA Corp.* | 194,750 | |||
| 10,100 | PMC-Sierra, Inc. (a)* | 144,935 | |||
| 5,300 | QLogic Corp.* | 140,927 | |||
| 11,100 | Teradyne, Inc. (a)* | 251,970 | |||
| 99,500 | Texas Instruments, Inc. | 2,405,910 | |||
| 19,900 | Xilinx, Inc. | 662,869 | |||
| 22,376,704 | |||||
| Software - 5.1% | |||||
| 13,700 | Adobe Systems, Inc. | 637,050 | |||
| 6,500 | Autodesk, Inc. | 278,265 | |||
| 33,900 | Automatic Data Processing, Inc. | 1,419,732 | |||
| 12,800 | BMC Software, Inc.* | 236,800 | |||
| 9,700 | Citrix Systems, Inc.* | 197,492 | |||
| 33,550 | Computer Associates International, Inc. | 941,413 | |||
| 22,100 | Compuware Corp.* | 145,860 | |||
| 17,400 | Electronic Arts, Inc.* | 949,170 | |||
| 50,149 | First Data Corp. | $ | 2,232,633 | ||
| 11,150 | Fiserv, Inc.* | 433,624 | |||
| 13,500 | IMS Health, Inc. | 316,440 | |||
| 11,000 | Intuit, Inc.* | 424,380 | |||
| 5,300 | Mercury Interactive Corp.* | 264,099 | |||
| 620,500 | Microsoft Corp. | 17,721,480 | |||
| 22,200 | Novell, Inc.* | 186,258 | |||
| 298,620 | Oracle Corp.* | 3,562,537 | |||
| 15,400 | Parametric Technology Corp.* | 77,000 | |||
| 20,900 | PeopleSoft, Inc.* | 386,650 | |||
| 28,800 | Siebel Systems, Inc.* | 307,584 | |||
| 24,819 | VERITAS Software Corp.* | 687,486 | |||
| 31,405,953 | |||||
| Telecommunications- 6.5% | |||||
| 46,400 | ADC Telecommunications, Inc.* | 131,776 | |||
| 17,700 | Alltel Corp. | 895,974 | |||
| 9,200 | Andrew Corp. (a)* | 184,092 | |||
| 45,548 | AT&T Corp. (a) | 666,367 | |||
| 156,755 | AT&T Wireless Services, Inc.* | 2,244,732 | |||
| 25,431 | Avaya, Inc.* | 401,555 | |||
| 105,400 | BellSouth Corp. | 2,763,588 | |||
| 8,000 | CenturyTel, Inc. | 240,320 | |||
| 32,600 | Ciena Corp.* | 121,272 | |||
| 388,600 | Cisco Systems, Inc.* | 9,209,820 | |||
| 16,500 | Citizens Communications Co., Class B* | 199,650 | |||
| 11,200 | Comverse Technology, Inc.* | 223,328 | |||
| 78,800 | Corning, Inc. (a)* | 1,029,128 | |||
| 82,700 | JDS Uniphase Corp.* | 313,433 | |||
| 246,282 | Lucent Technologies, Inc. (a)* | 930,946 | |||
| 134,735 | Motorola, Inc. | 2,458,914 | |||
| 63,800 | Nextel Communications, Inc., Class A* | 1,700,908 | |||
| 46,600 | Qualcomm, Inc. | 3,400,868 | |||
| 102,563 | Qwest Communications International, Inc. (a)* | 368,201 | |||
| 190,298 | SBC Communications, Inc. | 4,614,727 | |||
| 8,800 | Scientific Atlanta, Inc. (a) | 303,600 | |||
| 81,900 | Sprint Corp. (a) | 1,441,440 | |||
| 23,900 | Tellabs, Inc. (a)* | 208,886 | |||
| 159,230 | Verizon Communications, Inc. | 5,762,534 | |||
| 39,816,059 | |||||
| Textiles - 0.1% | |||||
| 9,800 | Cintas Corp. (a) | 467,166 | |||
| Toys, Games & Hobbies - 0.1% | |||||
| 10,050 | Hasbro, Inc. | 190,950 | |||
| 24,212 | Mattel, Inc. | 441,869 | |||
| 632,819 | |||||
| Transportation - 1.5% | |||||
| 21,352 | Burlington Northern Santa Fe Corp. | 748,815 | |||
| 12,300 | CSX Corp. | 403,071 | |||
| 17,200 | FedEx Corp. (a) | 1,405,068 | |||
| 22,500 | Norfolk Southern Corp. | 596,700 | |||
| 3,800 | Ryder System, Inc. | 152,266 | |||
See Notes to Financial Statements.
F-17
Table of Contents
EQUITY INDEX FUND
PORTFOLIO OF INVESTMENTS, Continued • June 30, 2004 (Unaudited)
| Shares | Value (Note 2) | |||||
| Transportation (continued) | ||||||
| 14,900 | Union Pacific Corp. | $ | 885,805 | |||
| 64,800 | United Parcel Service, Class B | 4,871,016 | ||||
| 9,062,741 | ||||||
Total Common Stocks (Cost $571,519,872) | 610,646,483 | |||||
| Par Value | ||||||
| U.S. GOVERNMENT OBLIGATION - 0.1% | ||||||
| U.S. Treasury Bill - 0.1% | ||||||
| $ | 500,000 | 0.99%, 09/16/04 (b) (c) | 498,952 | |||
Total U.S. Government Obligation (Cost $498,952) | 498,952 | |||||
| Shares | ||||||
| INVESTMENT COMPANY - 0.6% | ||||||
| 3,915,090 | Marshall Money Market Fund | 3,915,090 | ||||
Total Investment Company (Cost $3,915,090) | 3,915,090 | |||||
| | Total Investments - 99.8% (Cost $575,933,914) | 615,060,525 | ||||
| Net Other Assets and Liabilities - 0.2% | 1,115,492 | |||||
| Total Net Assets - 100.0% | $ | 616,176,017 | ||||
| * | Non-income producing security. |
| (a) | All or a portion of this security is out on loan at June 30, 2004; the value of the securities loaned amounted to $39,224,292. The value of collateral amounted to $40,727,010 which consisted of cash equivalents. |
| (b) | Effective yield at time of purchase. |
| (c) | Security has been deposited as initial margin on futures contracts. At June 30, 2004, the Portfolio’s open futures contracts were as follows: |
| Number of Contracts Purchased | Contract Type | Expiration Date | Aggregate Cost | Market Value at June 30, 2004 | ||||||
| 3 | S&P 500 | March-2004 | $ | 863,400 | $ | 840,136 | ||||
| 17 | S&P 500 | September-2004 | 4,819,412 | 4,846,700 | ||||||
| $ | 5,682,812 | $ | 5,686,836 | |||||||
| Number of Contracts Sold | Contract Type | Expiration Date | Aggregate Cost | Market Value at June 30, 2004 | ||||||
| 3 | S&P 500 | March-2004 | $ | 820,477 | $ | 840,135 | ||||
| REIT | Real Estate Investment Trust |
FEDERAL INCOME TAX INFORMATION (SEE NOTE 2)
At June 30, 2004, the aggregate cost of investment securities for tax purposes was $603,803,264. Net unrealized appreciation (depreciation) aggregated $11,257,261, of which $62,310,227 related to appreciated investment securities and $(51,052,966) related to depreciated investment securities.
OTHER INFORMATION
For the six months ended June 30, 2004, the aggregate cost of purchases and the proceeds of sales, other than from short-term investments, included $7,448,491 and $72,226,018 of non-governmental issuers, respectively.
See Notes to Financial Statements.
F-18
Table of Contents
SELECT INVESTMENT GRADE INCOME FUND
PORTFOLIO OF INVESTMENTS • June 30, 2004 (Unaudited)
| Par Value | Moody’s Ratings | Value (Note 2) | ||||||
| U.S. GOVERNMENT AGENCY MORTGAGE-BACKED OBLIGATIONS (i) - 22.3% | ||||||||
| Fannie Mae - 7.0% | ||||||||
| $ | 2,028,273 | 5.00%, 05/01/18 | NR | $ | 2,035,492 | |||
| 3,873,290 | 5.50%, 02/01/18 - 05/01/33 | NR | 3,924,751 | |||||
| 7,927,341 | 6.00%, 08/01/13 - 03/01/33 | NR | 8,191,659 | |||||
| 10,088,304 | 6.50%, 05/01/08 - 09/01/32 | NR | 10,540,528 | |||||
| 3,756,003 | 7.00%, 08/01/10 - 06/01/32 | NR | 3,977,671 | |||||
| 2,263,352 | 7.50%, 01/01/07 - 09/01/30 | NR | 2,406,945 | |||||
| 611,555 | 8.00%, 04/01/09 - 08/01/32 | NR | 661,294 | |||||
| 58,766 | 8.50%, 07/01/08 - 06/01/30 | NR | 60,621 | |||||
| 253,281 | 9.00%, 02/01/10 - 11/01/25 | NR | 281,826 | |||||
| 4,350 | 10.00%, 10/01/20 | NR | 4,835 | |||||
| 32,085,622 | ||||||||
| Freddie Mac - 11.4% | ||||||||
| 1,593,911 | 4.50%, 12/01/18 | NR | 1,561,062 | |||||
| 3,000,000 | 5.00%, 07/01/34, TBA (a) | NR | 2,895,000 | |||||
| 27,565,884 | 5.00%, 05/01/18 - 05/01/34 | NR | 27,077,439 | |||||
| 3,827,860 | 5.50%, 02/01/18 - 12/01/33 | NR | 3,920,814 | |||||
| 10,009,326 | 6.00%, 10/15/07 - 09/01/33 | NR | 10,264,015 | |||||
| 2,256,626 | 6.50%, 10/01/20 - 12/01/31 | NR | 2,362,248 | |||||
| 3,096,785 | 7.00%, 05/01/32 - 12/01/32 | NR | 3,268,566 | |||||
| 578,512 | 7.50%, 06/01/15 - 11/01/30 | NR | 619,601 | |||||
| 95,967 | 9.50%, 08/01/19 - 02/01/21 | NR | 107,688 | |||||
| 52,076,433 | ||||||||
| Ginnie Mae - 3.9% | ||||||||
| 6,102,559 | 5.50%, 06/15/33 - 07/15/33 | NR | 6,108,444 | |||||
| 4,235,826 | 6.00%, 01/15/32 - 11/15/32 | NR | 4,349,430 | |||||
| 3,150,000 | 6.00%, 07/01/34, TBA (a) | NR | 3,224,813 | |||||
| 1,713,931 | 6.50%, 09/15/08 - 11/15/32 | NR | 1,794,104 | |||||
| 1,446,521 | 7.00%, 03/15/12 - 12/15/31 | NR | 1,541,746 | |||||
| 671,178 | 7.50%, 11/15/30 - 10/15/32 | NR | 723,452 | |||||
| 36,852 | 9.50%, 02/15/06 | NR | 37,412 | |||||
| 17,779,401 | ||||||||
Total U.S. Government Agency Mortgage-Backed Obligations (Cost $101,986,802) | 101,941,456 | |||||||
| U.S. GOVERNMENT AND AGENCY OBLIGATIONS - 33.3% | ||||||||
| Fannie Mae - 9.4% | ||||||||
| 2,900,000 | 1.13%, 07/22/04 (b) (c) | NR | 2,898,089 | |||||
| 10,000,000 | 2.50%, 06/15/06 (d) | Aaa | 9,904,350 | |||||
| 3,400,000 | 3.00%, 11/01/05 | Aaa | 3,409,095 | |||||
| 7,150,000 | 3.88%, 03/15/05 - 11/17/08 | Aaa | 7,099,243 | |||||
| 6,733,592 | 5.50%, 02/01/34 - 03/01/34 | NR | 6,715,652 | |||||
| 4,316,519 | 6.00%, 02/01/17 - 05/01/29 | NR | 4,458,879 | |||||
| 5,290,000 | 6.25%, 07/19/11 | Aaa | 5,302,495 | |||||
| 1,593,646 | 6.50%, 05/01/16 - 10/01/29 | NR | 1,680,741 | |||||
| 1,170,416 | 7.00%, 08/01/32 | NR | 1,246,251 | |||||
| 66,232 | 7.50%, 03/01/28 - 09/01/30 | NR | 71,084 | |||||
| 359,586 | 8.00%, 10/01/29 - 05/01/30 | NR | 391,834 | |||||
| 43,177,713 | ||||||||
| Federal Home Loan Bank - 0.1% | ||||||||
| $300,000 | 1.13%, 07/14/04 (b) (c) | NR | $ | 299,878 | ||||
| Freddie Mac - 8.5% | ||||||||
| 2,870,000 | 1.16%, 07/13/04 (b) (c) | NR | 2,868,886 | |||||
| 2,670,000 | 1.70%, 12/14/04 (b) | NR | 2,649,070 | |||||
| 15,121,686 | 5.00%, 01/01/19 - 03/01/34 | NR | 14,910,044 | |||||
| 12,351,611 | 5.50%, 11/01/33 - 01/01/34 | NR | 12,325,482 | |||||
| 5,275,000 | 5.75%, 03/15/09 (d) | Aaa | 5,626,816 | |||||
| 604,975 | 6.50%, 12/01/31 | NR | 631,518 | |||||
| 39,011,816 | ||||||||
| Ginnie Mae - 0.3% | ||||||||
| 1,148,397 | 7.00%, 02/15/28 - 11/15/28 | NR | 1,222,207 | |||||
| 1,222,207 | ||||||||
| U.S. Treasury Bond - 4.0% | ||||||||
| 2,970,000 | 5.38%, 02/15/31 (d) | NR | 2,995,408 | |||||
| 5,300,000 | 6.00%, 02/15/26 (d) | NR | 5,710,957 | |||||
| 3,500,000 | 6.25%, 08/15/23 (d) | NR | 3,875,704 | |||||
| 2,325,000 | 7.25%, 08/15/22 | NR | 2,848,850 | |||||
| 1,900,000 | 8.75%, 08/15/20 | NR | 2,631,722 | |||||
| 18,062,641 | ||||||||
| U.S. Treasury Inflationary Index - 0.0% | ||||||||
| 143,067 | 3.38%, 04/15/32 | NR | 180,432 | |||||
| U.S. Treasury Note - 11.0% | ||||||||
| 31,960,000 | 2.13%, 08/31/04 | NR | 32,006,182 | |||||
| 2,400,000 | 3.25%, 08/15/08 | NR | 2,370,281 | |||||
| 2,550,000 | 3.38%, 12/15/08 | NR | 2,517,528 | |||||
| 3,785,000 | 4.38%, 05/15/07 - 08/15/12 (d) | NR | 3,861,100 | |||||
| 6,950,000 | 5.00%, 02/15/11 | NR | 7,274,697 | |||||
| 1,830,000 | 8.13%, 05/15/21 | NR | 2,418,030 | |||||
| 50,447,818 | ||||||||
Total U.S. Government and Agency Obligations (Cost $153,396,715) | 152,402,505 | |||||||
| CORPORATE NOTES AND BONDS - 30.3% | ||||||||
| Aerospace & Defense - 0.0% | ||||||||
| 136,584 | Systems 2001 Asset Trust (e) | |||||||
| 6.66%, 09/15/13 | Aaa | 147,302 | ||||||
| Auto Manufacturers - 1.5% | ||||||||
| 1,125,000 | DaimlerChrysler North America Holding Corp. 6.90%, 09/01/04 | A3 | 1,132,767 | |||||
| 1,775,000 | DaimlerChrysler North America Holding Corp. 8.50%, 01/18/31 | A3 | 2,039,345 | |||||
| 2,335,000 | General Motors Corp. (d) 7.20%, 01/15/11 | Baa1 | 2,446,601 | |||||
| 1,295,000 | General Motors Corp. 8.38%, 07/15/33 | Baa1 | 1,370,747 | |||||
| 6,989,460 | ||||||||
See Notes to Financial Statements.
F-19
Table of Contents
SELECT INVESTMENT GRADE INCOME FUND
PORTFOLIO OF INVESTMENTS, Continued • June 30, 2004 (Unaudited)
| Par Value | Moody’s Ratings | Value (Note 2) | ||||||
| Banks - 4.8% | ||||||||
| $ | 325,000 | Bank of America Corp. (f) | ||||||
| 1.43%, 10/22/04 | Aa2 | $ | 325,239 | |||||
| 2,345,000 | HSBC Bank USA, Inc. | |||||||
| 4.63%, 04/01/14 | A1 | 2,182,848 | ||||||
| 2,300,000 | PNC Funding Corp. | |||||||
| 5.25%, 11/15/15 | A3 | 2,216,011 | ||||||
| 2,300,000 | PNC Funding Corp. | |||||||
| 5.75%, 08/01/06 | A2 | 2,417,031 | ||||||
| 2,425,000 | U.S. Bancorp, MTN | |||||||
| 5.10%, 07/15/07 | Aa3 | 2,527,733 | ||||||
| 2,400,000 | US Bank National Cincinnati | |||||||
| 6.50%, 02/01/08 | Aa3 | 2,611,896 | ||||||
| 2,400,000 | Wachovia Corp. | |||||||
| 4.95%, 11/01/06 | Aa3 | 2,486,052 | ||||||
| 2,400,000 | Wells Fargo & Co. | |||||||
| 5.13%, 02/15/07 | Aa1 | 2,501,066 | ||||||
| 4,800,000 | Zions Bancorporation | |||||||
| 5.65%, 05/15/14 | Baa1 | 4,745,208 | ||||||
| 22,013,084 | ||||||||
| Beverages - 0.5% | ||||||||
| 2,530,000 | Bottling Group LLC | |||||||
| 4.63%, 11/15/12 | Aa3 | 2,458,950 | ||||||
| Chemicals - 0.6% | ||||||||
| 2,400,000 | Praxair, Inc. | |||||||
| 6.63%, 10/15/07 | A3 | 2,612,806 | ||||||
| Diversified Financial Services - 6.2% | ||||||||
| 70,000 | Bear Stearns Cos., Inc. | |||||||
| 4.00%, 01/31/08 | A1 | 69,763 | ||||||
| 900,000 | Capital One Bank | |||||||
| 5.00%, 06/15/09 | Baa2 | 902,576 | ||||||
| 4,600,000 | Capital One Bank | |||||||
| 5.75%, 09/15/10 | Baa2 | 4,727,346 | ||||||
| 221,474 | CVRD Finance Ltd., Series 2A (e) (f) | |||||||
| 1.79%, 10/15/07 | Aaa | 220,309 | ||||||
| 1,345,000 | Ford Motor Credit Co. | |||||||
| 6.88%, 02/01/06 | A3 | 1,410,766 | ||||||
| 1,110,000 | Ford Motor Credit Co. | |||||||
| 7.25%, 10/25/11 | A3 | 1,159,163 | ||||||
| 3,315,000 | Ford Motor Credit Co. | |||||||
| 7.38%, 10/28/09 | A3 | 3,537,854 | ||||||
| 2,450,000 | General Electric Capital Corp., MTN | |||||||
| 4.25%, 01/15/08 | Aaa | 2,480,681 | ||||||
| 1,325,000 | General Motors Acceptance Corp., | |||||||
| MTN (f) | ||||||||
| 2.40%, 10/20/05 | A3 | 1,335,756 | ||||||
| 2,560,000 | Goldman Sachs Group, Inc. | |||||||
| 3.88%, 01/15/09 | Aa3 | 2,496,358 | ||||||
| 2,450,000 | Goldman Sachs Group, Inc. | |||||||
| 5.70%, 09/01/12 | Aa3 | 2,485,246 | ||||||
| 2,450,000 | Household Finance Corp. | |||||||
| 8.00%, 07/15/10 | A1 | 2,842,965 | ||||||
| 2,600,000 | J. Paul Getty Trust | |||||||
| 5.88%, 10/01/33 | Aaa | 2,543,765 | ||||||
| $2,300,000 | Morgan Stanley | |||||||
| 4.75%, 04/01/14 | A1 | $ | 2,122,028 | |||||
| 28,334,576 | ||||||||
| Electric - 1.1% | ||||||||
| 1,800,000 | Entergy Gulf States, Inc. | |||||||
| 3.60%, 06/01/08 | Baa3 | 1,736,748 | ||||||
| 800,000 | Pacific Gas & Electric Co. | |||||||
| 3.60%, 03/01/09 | Baa2 | 770,074 | ||||||
| 2,520,000 | Pacific Gas & Electric Co. | |||||||
| 6.05%, 03/01/34 | Baa2 | 2,370,201 | ||||||
| 4,877,023 | ||||||||
| Environmental Control - 0.6% | ||||||||
| 2,800,000 | Waste Management, Inc. | |||||||
| 7.00%, 10/01/04 | Baa3 | 2,829,641 | ||||||
| Food - 1.7% | ||||||||
| 2,400,000 | Kroger Co. (d) | |||||||
| 5.50%, 02/01/13 | Baa2 | 2,393,412 | ||||||
| 2,400,000 | Kroger Co. | |||||||
| 6.75%, 04/15/12 | Baa2 | 2,599,994 | ||||||
| 2,670,000 | Unilever Capital Corp. | |||||||
| 5.90%, 11/15/32 | A1 | 2,596,746 | ||||||
| 7,590,152 | ||||||||
| Forest Products & Paper - 1.0% | ||||||||
| 2,400,000 | International Paper Co. | |||||||
| 5.30%, 04/01/15 | Baa2 | 2,284,603 | ||||||
| 2,450,000 | International Paper Co. | |||||||
| 5.50%, 01/15/14 | Baa2 | 2,398,474 | ||||||
| 4,683,077 | ||||||||
| Health Care-Services - 0.6% | ||||||||
| 21,000 | Columbia/HCA Healthcare Corp. | |||||||
| 6.91%, 06/15/05 | Ba1 | 21,623 | ||||||
| 3,000 | HCA, Inc. | |||||||
| 6.30%, 10/01/12 | Ba1 | 3,002 | ||||||
| 2,650,000 | UnitedHealth Group, Inc. | |||||||
| 7.50%, 11/15/05 | A3 | 2,811,907 | ||||||
| 2,836,532 | ||||||||
| Home Builders - 0.0% | ||||||||
| 38,000 | Lennar Corp. | |||||||
| 9.95%, 05/01/10 | Baa3 | 42,267 | ||||||
| Lodging - 0.6% | ||||||||
| 2,450,000 | Harrah’s Operating Co., Inc. | |||||||
| 7.13%, 06/01/07 | Baa3 | 2,638,189 | ||||||
| 15,000 | MGM Mirage, Inc. | |||||||
| 7.25%, 10/15/06 | Ba1 | 15,638 | ||||||
| 4,000 | MGM Mirage, Inc. | |||||||
| 8.50%, 09/15/10 | Ba1 | 4,320 | ||||||
See Notes to Financial Statements.
F-20
Table of Contents
SELECT INVESTMENT GRADE INCOME FUND
PORTFOLIO OF INVESTMENTS, Continued • June 30, 2004 (Unaudited)
| Par Value | Moody’s Ratings | Value (Note 2) | ||||||
| Lodging (continued) | ||||||||
| $ | 11,000 | Park Place Entertainment Corp. (d) | ||||||
| 8.50%, 11/15/06 | Ba1 | $ | 11,935 | |||||
| 2,670,082 | ||||||||
| Media - 2.6% | ||||||||
| 2,450,000 | AOL Time Warner, Inc. | |||||||
| 6.88%, 05/01/12 | Baa1 | 2,647,453 | ||||||
| 2,300,000 | Continental Cablevision, Inc. | |||||||
| 8.30%, 05/15/06 | Baa3 | 2,496,887 | ||||||
| 2,450,000 | Cox Communications, Inc. | |||||||
| 7.13%, 10/01/12 | Baa2 | 2,685,080 | ||||||
| 1,430,000 | Viacom, Inc. | |||||||
| 5.50%, 05/15/33 | A3 | 1,280,343 | ||||||
| 2,400,000 | Viacom, Inc. | |||||||
| 7.88%, 07/30/30 | A3 | 2,841,907 | ||||||
| 11,951,670 | ||||||||
| Metal Fabricate & Hardware - 0.6% | ||||||||
| 2,550,000 | Precision Castparts Corp. | |||||||
| 5.60%, 12/15/13 | Baa3 | 2,482,540 | ||||||
| Oil & Gas - 3.0% | ||||||||
| 2,300,000 | Conoco Funding Co. | |||||||
| 7.25%, 10/15/31 | A3 | 2,625,535 | ||||||
| 4,675,000 | Devon Financing Corp. | |||||||
| 6.88%, 09/30/11 | Baa2 | 5,089,472 | ||||||
| 875,000 | Enterprise Products | |||||||
| 8.25%, 03/15/05 | Baa3 | 904,415 | ||||||
| 2,400,000 | Valero Energy Corp. | |||||||
| 6.13%, 04/15/07 | Baa3 | 2,543,107 | ||||||
| 2,500,000 | Valero Energy Corp. | |||||||
| 6.88%, 04/15/12 | Baa3 | 2,718,433 | ||||||
| 13,880,962 | ||||||||
| Packaging & Containers - 1.0% | ||||||||
| 4,600,000 | Sealed Air Corp. (e) | |||||||
| 5.63%, 07/15/13 | Baa3 | 4,543,963 | ||||||
| Pharmaceuticals - 0.7% | ||||||||
| 2,680,000 | Zeneca Wilmington | |||||||
| 7.00%, 11/15/23 | Aa2 | 2,961,293 | ||||||
| Retail - 0.6% | ||||||||
| 2,400,000 | Wal-Mart Stores, Inc. | |||||||
| 7.55%, 02/15/30 | Aa2 | 2,879,755 | ||||||
| Telecommunications - 1.1% | ||||||||
| 2,450,000 | Sprint Capital Corp. | |||||||
| 6.13%, 11/15/08 | Baa3 | 2,575,242 | ||||||
| 2,500,000 | Sprint Capital Corp. | |||||||
| 6.88%, 11/15/28 | Baa3 | 2,403,118 | ||||||
| 4,978,360 | ||||||||
| Transportation - 1.5% | ||||||||
| $ | 4,800,000 | CSX Corp. | ||||||
| 6.30%, 03/15/12 | Baa2 | $ | 5,045,702 | |||||
| 300,000 | Union Pacific Corp. | |||||||
| 5.38%, 06/01/33 | Baa2 | 258,660 | ||||||
| 1,430,000 | Union Pacific Corp. | |||||||
| 6.63%, 02/01/08 | Baa2 | 1,554,862 | ||||||
| 6,859,224 | ||||||||
Total Corporate Notes and Bonds (Cost $140,691,304) | 138,622,719 | |||||||
| ASSET-BACKED AND MORTGAGE-BACKED SECURITIES (i) - 6.8% | ||||||||
| 9,502,676 | Bank of America Mortgage | |||||||
| Securities, Inc., Series 2003-8, | ||||||||
| Class 1A12 (g) | ||||||||
| 5.50%, 11/25/33 | AAA | 9,348,970 | ||||||
| 2,700,000 | Bear Stearns Commercial Mortgage | |||||||
| Securities, Inc., Series 2002-PBW1, | ||||||||
| Class A2 | ||||||||
| 4.72%, 11/11/35 | Aaa | 2,628,200 | ||||||
| 2,700,000 | Bear Stearns Mortgage | |||||||
| Securities, Inc., Series 1999-WF2, | ||||||||
| Class A2, CMO | ||||||||
| 7.08%, 06/15/09 | Aaa | 2,998,709 | ||||||
| 1,300,000 | Chase Credit Card Master Trust, | |||||||
| Series 1999-3, Class B, | ||||||||
| 6.95%, 01/15/07 | A2 | 1,316,773 | ||||||
| 1,285,000 | Citibank Credit Card Issuance | |||||||
| Trust, Series 2000-Cl, CMO | ||||||||
| 6.88%, 11/16/09 | Aaa | 1,409,497 | ||||||
| 904,457 | Conseco Finance Corp., | |||||||
| Series 2000-6, Class A4 | ||||||||
| 6.77%, 09/01/32 | A3 | 928,851 | ||||||
| 717,712 | DaimlerChrysler Auto Trust, | |||||||
| Series 2002-B, Class A3 | ||||||||
| 2.93%, 06/06/06 | Aaa | 720,401 | ||||||
| 2,700,000 | General Electric Capital | |||||||
| Commercial Mortgage Corp., | ||||||||
| Series 2002-1A, Class A3 | ||||||||
| 6.27%, 12/10/35 | Aaa | 2,896,644 | ||||||
| 123,933 | Green Tree Financial Corp., | |||||||
| Series 1999-3, Class A, CMO (g) | ||||||||
| 6.16%, 02/01/31 | BBB | 126,752 | ||||||
| 828,783 | Green Tree Home Improvement | |||||||
| Loan Trust, Series 1996-D, | ||||||||
| Class H, CMO (g) | ||||||||
| 8.30%, 09/15/27 | AAA | 830,788 | ||||||
| 2,040,000 | GS Mortgage Securities Corp. II, | |||||||
| Series 1997-GL, Class A2D | ||||||||
| 6.94%, 07/13/30 | Aaa | 2,203,017 | ||||||
| 59,906 | Housing Securities, Inc., | |||||||
| Series 1994-2, Class A-1 | ||||||||
| 6.50%, 07/25/09 | Aaa | 60,381 | ||||||
See Notes to Financial Statements.
F-21
Table of Contents
SELECT INVESTMENT GRADE INCOME FUND
PORTFOLIO OF INVESTMENTS, Continued • June 30, 2004 (Unaudited)
| Par Value | Moody’s Ratings | Value (Note 2) | |||||||
| ASSET-BACKED AND MORTGAGE-BACKED SECURITIES (i) (continued) | |||||||||
| $ | 700,000 | MBNA Master Credit Card Trust, | |||||||
| Series 1995-C, Class A | |||||||||
| 6.45%, 02/15/08 | Aaa | $ | 727,170 | ||||||
| 1,135,000 | Morgan Stanley Dean Witter | ||||||||
| Capital I, Series 2002-TOP7, | |||||||||
| Class B, CMO | |||||||||
| 6.08%, 01/15/39 | Aa2 | 1,201,113 | |||||||
| 2,700,000 | Morgan Stanley Dean Witter | ||||||||
| Capital I, Series 2003-T0P9, | |||||||||
| Class A2, CMO (g) | |||||||||
| 4.74%, 11/13/36 | AAA | 2,621,368 | |||||||
| 1,179,923 | Toyota Auto Receivables Owner | ||||||||
| Trust, Series 2002-B, Class A3 | |||||||||
| 3.76%, 06/15/06 | Aaa | 1,187,532 | |||||||
Total Asset-Backed and Mortgage-Backed Securities (Cost $31,176,421) | 31,206,166 | ||||||||
| FOREIGN GOVERNMENT OBLIGATIONS (j) - 1.1% | |||||||||
| 2,400,000 | Province of British Columbia | ||||||||
| 5.38%, 10/29/08 | Aa2 | 2,526,602 | |||||||
| 2,400,000 | Province of Quebec | ||||||||
| 7.00%, 01/30/07 | A1 | 2,610,322 | |||||||
Total Foreign Government Obligations (Cost $5,000,336) | 5,136,924 | ||||||||
| FOREIGN BONDS (j) - 4.7% | |||||||||
| 2,350,000 | Alberta Energy Co., Ltd. | ||||||||
| 7.38%, 11/01/31 | Baa1 | 2,616,115 | |||||||
| 2,350,000 | British Sky Broadcasting Group, Plc | ||||||||
| 6.88%, 02/23/09 | Baa3 | 2,566,534 | |||||||
| 2,400,000 | British Telecom, Plc (h) | ||||||||
| 8.38%, 12/15/10 | Baa1 | 2,802,756 | |||||||
| 3,650,000 | Domtar, Inc. | ||||||||
| 5.38%, 12/01/13 | Baa3 | 3,470,785 | |||||||
| 2,000,000 | KFW International Finance, Inc. (d) | ||||||||
| 4.25%, 04/18/05 | Aaa | 2,030,996 | |||||||
| 2,400,000 | Telus Corp. | ||||||||
| 7.50%, 06/01/07 | Baa3 | 2,613,910 | |||||||
| 10,000 | Tyco International Group S.A. | ||||||||
| 5.88%, 11/01/04 | Baa3 | 10,116 | |||||||
| 2,500,000 | Tyco International Group S.A. (d) | ||||||||
| 6.00%, 11/15/13 | Baa3 | 2,570,030 | |||||||
| 2,400,000 | Tyco International Group S.A. | ||||||||
| 6.38%, 10/15/11 | Baa3 | 2,553,074 | |||||||
| 10,000 | Tyco International Group S.A. | ||||||||
| 6.75%, 02/15/11 | Baa3 | 10,866 | |||||||
Total Foreign Bonds (Cost $20,926,830) | 21,245,182 | ||||||||
| INVESTMENT COMPANIES - 1.8% | |||||||||
| 8,102,924 | Barclays Prime Money Market Fund | NR | $ | 8,102,924 | |||||
| 277,525 | Marshall Money Market Fund | NR | 277,525 | ||||||
Total Investment Companies (Cost $8,380,449) | 8,380,449 | ||||||||
| WARRANTS - 0.0% | |||||||||
| Computers - 0.0% | |||||||||
| 500,000 | International Business | ||||||||
| Machines Corp., 07/10/06 | NR | 17,700 | |||||||
| Telecommunications - 0.0% | |||||||||
| 500,000 | BellSouth Telecom, Inc., 07/12/06 | NR | 8,000 | ||||||
Total Warrants (Cost $16,563) | 25,700 | ||||||||
| | Total Investments - 100.3% (Cost $461,575,420) | 458,961,101 | |||||||
| Net Other Assets and Liabilities - (0.3)% | (1,337,466 | ) | |||||||
| Total Net Assets- 100.0% | $ | 457,623,635 | |||||||
| (a) | All or part of security is designated as a Forward Commitment. |
| (b) | Effective yield at time of purchase. |
| (c) | Designated as Collateral on Forward Commitments. |
| (d) | All or a portion of this security is out on loan at June 30, 2004; the value of the securities loaned amounted to $31,361,706. The value of collateral amounted to $32,251,770 which consisted of cash equivalents. |
| (e) | Security exempt from registration under Rule 144A of the Securities Act of 1933. This security may be resold in transactions exempt from registration, to qualified institutional buyers. At June 30, 2004, these securities amounted to $4,911,574 or 1.1% of net assets. |
| (f) | Variable rate security. The rate shown reflects rate in effect at period end. |
| (g) | Standard & Poor’s (S&P) credit ratings are used in the absence of a rating by Moody’s Investors, Inc. |
| (h) | Debt obligation initially issued in coupon form which converts to a higher coupon form at a specified date and rate. The rate shown is the rate at period end. The maturity date shown is the ultimate maturity. |
| (i) | Pass Through Certificates. |
| (j) | U.S. currency denominated. |
| CMO | Collateralized Mortgage Obligation |
| MTN | Medium Term Note |
| NR | Not Rated |
See Notes to Financial Statements.
F-22
Table of Contents
SELECT INVESTMENT GRADE INCOME FUND
PORTFOLIO OF INVESTMENTS, Continued • June 30, 2004 (Unaudited)
FEDERAL INCOME TAX INFORMATION (SEE NOTE 2)
At June 30, 2004, the aggregate cost of investment securities for tax purposes was $461,662,297. Net unrealized appreciation (depreciation) aggregated $(2,701,196), of which $4,001,927 related to appreciated investment securities and $(6,703,123) related to depreciated investment securities.
OTHER INFORMATION
For the six months ended June 30, 2004, the aggregate cost of purchases and the proceeds of sales, other than from short-term investments, included $96,221,651 and $147,246,847 of non-governmental issuers, respectively, and $265,622,352 and $266,282,764 of U.S. Government and Agency issuers, respectively.
The composition of ratings of both long-term and short-term debt holdings as a percentage of total value of investments in securities is as follows:
Moody’s Rating
Aaa | 11.7 | % | |
Aa | 6.0 | % | |
A | 9.1 | % | |
Baa | 20.0 | % | |
NR (Not Rated) | 50.4 | % | |
| 97.2 | % | ||
S&P Ratings
| AAA | 2.8 | % |
See Notes to Financial Statements.
F-23
Table of Contents
GOVERNMENT BOND FUND
PORTFOLIO OF INVESTMENTS • June 30, 2004 (Unaudited)
| Par Value | Moody’s Ratings | Value (Note 2) | |||||
| U.S. GOVERNMENT AGENCY MORTGAGE-BACKED OBLIGATIONS (b) -12.0% | |||||||
| Fannie Mae - 8.7% | |||||||
| $13,000,000 | 4.00%, 04/25/22 - 07/25/22 | NR | $ | 12,944,410 | |||
| 1,709 | 7.00%, 05/01/17 | NR | 1,722 | ||||
| 79,778 | 7.50%, 03/01/07 | NR | 83,264 | ||||
| 48,448 | 8.00%, 04/01/09 - 09/01/21 | NR | 52,991 | ||||
| 13,082,387 | |||||||
| Freddie Mac - 3.2% | |||||||
| 4,580,000 | 5.00%, 06/15/26 | NR | 4,621,118 | ||||
| 60,314 | 6.50%, 06/01/23 | Aaa | 63,866 | ||||
| 27,712 | 7.50%, 02/01/07 | NR | 28,692 | ||||
| 10,482 | 8.00%, 09/01/09 - 06/01/19 | NR | 11,371 | ||||
| 27,125 | 10.00%, 03/01/21 | NR | 30,152 | ||||
| 4,755,199 | |||||||
| Ginnie Mae - 0.1% | |||||||
| 14,469 | 6.50%, 06/15/09 | NR | 15,372 | ||||
| 56,242 | 7.00%, 06/15/12 | NR | 59,972 | ||||
| 10,980 | 9.50%, 02/15/06 | NR | 11,147 | ||||
| 86,491 | |||||||
Total U.S. Government Agency Mortgage-Backed Obligations (Cost $18,320,855) | 17,924,077 | ||||||
| U.S. GOVERNMENT AND AGENCY OBLIGATIONS - 78.3% | |||||||
| Fannie Mae - 21.0% | |||||||
| 10,000,000 | 4.00%, 12/15/08 (a) | Aaa | 9,892,930 | ||||
| 9,525,000 | 5.38%, 11/15/11 (a) | Aaa | 9,846,097 | ||||
| 11,210,000 | 5.50%, 05/02/06 | Aa2 | 11,703,890 | ||||
| 31,442,917 | |||||||
| Federal Farm Credit Bank - 8.0% | |||||||
| 12,000,000 | 2.63%, 12/15/05 | Aaa | 12,001,212 | ||||
| Federal Home Loan Bank - 10.4% | |||||||
| 3,300,000 | 3.50%, 04/22/08 | Aaa | 3,231,373 | ||||
| 3,200,000 | 3.63%, 10/15/04 | Aaa | 3,220,109 | ||||
| 7,400,000 | 4.00%, 03/18/11 | Aaa | 7,066,556 | ||||
| 2,000,000 | 4.13%, 01/14/05 | Aaa | 2,025,380 | ||||
| 15,543,418 | |||||||
| Freddie Mac - 10.4% | |||||||
| 5,000,000 | 3.00%, 12/15/06 | Aaa | 4,917,085 | ||||
| 900,000 | 4.50%, 08/15/04 | Aaa | 903,344 | ||||
| 5,215,000 | 5.75%, 01/15/12 | Aaa | 5,501,762 | ||||
| 3,730,000 | 6.88%, 09/15/10 | Aaa | 4,183,747 | ||||
| 15,505,938 | |||||||
| U.S. Treasry Bond - 4.7% | |||||||
| 4,110,000 | 7.50%, 11/15/16 (a) | NR | 5,066,697 | ||||
| 1,485,000 | 8.88%, 02/15/19 | NR | 2,056,029 | ||||
| 7,122,726 | |||||||
| U.S. Treasury Note - 23.8% | |||||||
| $11,020,000 | 1.50%, 02/28/05 | NR | $ | 10,998,048 | |||
| 1,850,000 | 3.00%, 11/15/07 | NR | 1,832,512 | ||||
| 6,280,000 | 4.00%, 02/15/14 (a) | NR | 5,985,135 | ||||
| 3,035,000 | 5.00%, 08/15/11 (a) | NR | 3,168,373 | ||||
| 6,250,000 | 6.00%, 08/15/09 (a) | NR | 6,867,919 | ||||
| 6,500,000 | 6.50%, 05/15/05 (a) | NR | 6,748,827 | ||||
| 35,600,814 | |||||||
Total U.S. Government and Agency Obligations (Cost $117,813,013) | 117,217,025 | ||||||
| ASSET-BACKED AND MORTGAGE-BACKED SECURITIES (b) - 7.5% | |||||||
| 5,500,000 | Citibank Credit Card Issuance | ||||||
| Trust, Series 2001, Class A8 | |||||||
| 4.10%, 12/07/06 | Aaa | 5,553,868 | |||||
| 3,500,000 | Ford Credit Auto Owner Trust, | ||||||
| Series 2003-A, Class A4A | |||||||
| 2.70%, 06/15/07 | Aaa | 3,491,358 | |||||
| 2,000,000 | MBNA Master Credit Card Trust, | ||||||
| Series 1999-B, Class A | |||||||
| 5.90%, 08/15/11 | Aaa | 2,143,031 | |||||
Total Asset-Backed and Mortgage-Backed Securities (Cost $11,188,113) | 11,188,257 | ||||||
| Shares | |||||||
| INVESTMENT COMPANIES - 1.5% | |||||||
| 4,115 | Dreyfus Cash Management Plus | ||||||
| Money Market Fund | NR | 4,115 | |||||
| 2,299,565 | Marshall Money Market Fund | NR | 2,299,565 | ||||
Total Investment Companies (Cost $2,303,680) | 2,303,680 | ||||||
| Total Investments - 99.3% (Cost $149,625,661) | 148,633,039 | ||||||
| Net Other Assets and Liabilities - 0.7% | 1,052,673 | ||||||
| Total Net Assets - 100.0% | $ | 149,685,712 | |||||
| (a) | All or a portion of this security is out on loan at June 30, 2004; the value of the securities loaned amounted to $25,207,477. The value of collateral amounted to $25,785,444 which consisted of cash equivalents. |
| (b) | Pass Through Certificates. |
See Notes to Financial Statements.
F-24
Table of Contents
GOVERNMENT BOND FUND
PORTFOLIO OF INVESTMENTS, Continued • June 30, 2004 (Unaudited)
FEDERAL INCOME TAX INFORMATION (SEE NOTE 2)
At June 30, 2004, the aggregate cost of investment securities for tax purposes was $149,625,661. Net unrealized appreciation (depreciation) aggregated $(992,622), of which $666,073 related to appreciated investment securities and $(1,658,695) related to depreciated investment securities.
OTHER INFORMATION
For the six months ended June 30, 2004, the aggregate cost of purchases and the proceeds of sales, other than from short-term investments, included $0 and $2,048,224 of non-governmental issuers, respectively, and $77,983,656 and $122,077,412 of U.S. Government and Agency issuers, respectively.
The composition of ratings of both long-term and short-term debt holdings as a percentage of total value of investments in securities is as follows:
Moody’s Rating
Aaa | 49.8 | % | |
Aa | 7.9 | % | |
NR (Not Rated) | 42.3 | % | |
| 100.0 | % | ||
See Notes to Financial Statements.
F-25
Table of Contents
MONEY MARKET FUND
PORTFOLIO OF INVESTMENTS • June 30, 2004 (Unaudited)
| Par Value | Value (Note 2) | |||||
| U.S. GOVERNMENT AGENCY OBLIGATIONS - 14.7% | ||||||
| Fannie Mae - 7.2% | ||||||
| $ | 12,000,000 | 1.27%, 04/25/05 | $ | 11,995,170 | ||
| 5,000,000 | 1.36%, 05/03/05 | 4,995,304 | ||||
| 5,000,000 | 6.50%, 08/15/04 | 5,031,706 | ||||
| 22,022,180 | ||||||
| Federal Home Loan Bank - 7.5% | ||||||
| 6,000,000 | 1.25%, 03/29/05 | 6,000,000 | ||||
| 7,000,000 | 1.35%, 03/23/05 | 7,000,000 | ||||
| 10,000,000 | 1.50%, 01/07/05 | 10,000,000 | ||||
| 23,000,000 | ||||||
Total U.S. Government Agency Obligations (Cost $45,022,180) | 45,022,180 | |||||
| CORPORATE NOTES - 39.3% | ||||||
| Banks - 4.9% | ||||||
| 15,000,000 | Marshall & Ilsley Bank (a) | |||||
| 1.38%, 12/17/04 | 15,000,000 | |||||
| Banks - Foreign Banks & Branches - 4.4% | ||||||
| 11,000,000 | ABN Amro Bank NV (a) | |||||
| 1.27%, 12/30/04 | 10,999,235 | |||||
| 2,450,000 | National Bank of Canada | |||||
| 8.13%, 08/15/04 | 2,469,965 | |||||
| 13,469,200 | ||||||
| Diversified Financial Services - 28.4% | ||||||
| 4,000,000 | American Honda Finance Corp., MTN (a) | |||||
| 1.13%, 05/06/05 | 4,000,000 | |||||
| 7,864,000 | Caterpillar Financial Services Corp., MTN (a) | |||||
| 1.24%, 07/09/04 | 7,864,000 | |||||
| 4,180,000 | CIT Group, Inc. | |||||
| 7.13%, 10/15/04 | 4,252,072 | |||||
| 15,000,000 | Citigroup, Inc. (a) | |||||
| 1.30%, 10/22/04 | 15,009,524 | |||||
| 10,000,000 | Goldman Sachs Group, Inc. (a) | |||||
| 1.44%, 07/29/04 | 10,000,000 | |||||
| 12,000,000 | Merrill Lynch & Co., Inc., Series C, MTN (a) | |||||
| 1.19%, 02/17/05 | 12,000,000 | |||||
| 15,000,000 | Money Market Trust LLC (a) | |||||
| 1.18%, 06/03/05 | 15,000,000 | |||||
| 10,000,000 | Morgan Stanley (a) | |||||
| 1.36%, 11/15/04 | 10,000,000 | |||||
| 9,000,000 | National Rural Utilities Cooperative Finance | |||||
| Colonial Trust (a) | ||||||
| 1.53%, 02/07/05 | 9,023,330 | |||||
| 87,148,926 | ||||||
| Retail - 1.6% | ||||||
| $ | 5,000,000 | Wal-Mart Stores, Inc. | ||||
| 6.55%, 08/10/04 | $ | 5,028,475 | ||||
Total Corporate Notes (Cost $120,646,601) | 120,646,601 | |||||
| COMMERCIAL PAPER (c) - 34.0% | ||||||
| Banks - 4.2% | ||||||
| 13,000,000 | Abbey National North America | |||||
| 1.21%, 10/20/04 | 12,951,499 | |||||
| Banks - Foreign Banks & Branches - 4.2% | ||||||
| 7,000,000 | Alliance & Leicester PLC (b) | |||||
| 1.25%, 10/21/04 | 6,972,778 | |||||
| 6,000,000 | Lloyds TSB Bank PLC | |||||
| 1.22%, 10/13/04 | 5,978,853 | |||||
| 12,951,631 | ||||||
| Diversified Financial Services - 23.5% | ||||||
| 12,088,000 | Barton Capital Corp. (b) | |||||
| 1.15%, 07/06/04 | 12,086,069 | |||||
| 7,000,000 | Blue Ridge Asset Funding (b) | |||||
| 1.07%, 07/02/04 | 6,999,792 | |||||
| 5,000,000 | High Peak Funding LLC (b) | |||||
| 1.12%, 07/13/04 | 4,998,133 | |||||
| 10,000,000 | High Peak Funding LLC (b) | |||||
| 1.13%, 07/06/04 | 9,998,431 | |||||
| 9,051,000 | Ivory Funding Corp. (b) | |||||
| 1.23%, 07/15/04 | 9,046,670 | |||||
| 10,000,000 | Newbury Funding (b) | |||||
| 1.10%, 07/13/04 | 9,996,334 | |||||
| 4,000,000 | Receivables Capital Corp. (b) | |||||
| 1.05%, 07/15/04 | 3,998,366 | |||||
| 15,000,000 | TransAmerica Asset Funding (b) | |||||
| 1.12%, 07/06/04 | 14,997,667 | |||||
| 72,121,462 | ||||||
| Electric - 2.1% | ||||||
| 6,500,000 | Boston Edison Co. | |||||
| 1.45%, 07/01/04 | 6,500,000 | |||||
Total Commercial Paper (Cost $104,524,592) | 104,524,592 | |||||
| CERTIFICATES OF DEPOSIT - 4.9% | ||||||
| 15,000,000 | Wells Fargo Bank NA | |||||
| 1.12%, 07/12/04 | 15,000,000 | |||||
Total Certificates of Deposit (Cost $15,000,000) | 15,000,000 | |||||
See Notes to Financial Statements.
F-26
Table of Contents
MONEY MARKET FUND
PORTFOLIO OF INVESTMENTS, Continued • June 30, 2004 (Unaudited)
| Shares | Value (Note 2) | ||||
| INVESTMENT COMPANIES - 6.8% | |||||
| 10,157,086 | Barclays Prime Money Market Fund | $ | 10,157,086 | ||
| 45,204 | Dreyfus Cash Management Plus Money Market Fund | 45,204 | |||
| 10,744,316 | One Group Institutional Prime Money Market Fund | 10,744,316 | |||
Total Investment Companies (Cost $20,946,606) | 20,946,606 | ||||
| Total Investments - 99.7% (Cost $306,139,979) | 306,139,979 | ||||
| Net Other Assets and Liabilities - 0.3% | 1,052,711 | ||||
| Total Net Assets - 100.0% | $ | 307,192,690 | |||
| (a) | Variable rate security. The rate shown reflects rate in effect at period end. |
| (b) | Security exempt from registration under Rule 144A of the Securities Act of 1933. This security may be resold, in transactions exempt from registration, to qualified institutional buyers. At June 30, 2004, these securities amounted to $79,094,240 or 25.7% of net assets. These securities have been deemed to be liquid in accordance with procedures established by the Board of Trustees. |
| (c) | Effective yield at time of purchase. |
| MTN | Medium Term Note |
FEDERAL INCOME TAX INFORMATION (SEE NOTE 2)
At June 30, 2004, the aggregate cost of investment securities for tax purposes was $306,139,979.
See Notes to Financial Statements.
F-27
Table of Contents
ALLMERICA INVESTMENT TRUST
STATEMENTS OF ASSETS AND LIABILITIES • June 30, 2004 (Unaudited)
Select Capital | Select Value Opportunity | Select International Equity Fund | Select Growth Fund | ||||||||||||
ASSETS: | |||||||||||||||
Investments: | |||||||||||||||
Investments at cost | $ | 230,869,760 | $ | 284,653,927 | $ | 303,138,590 | $ | 504,034,000 | |||||||
Net unrealized appreciation (depreciation) | 70,823,134 | 47,634,579 | 30,818,101 | 55,904,131 | |||||||||||
Total investments at value† | 301,692,894 | 332,288,506 | 333,956,691 | 559,938,131 | |||||||||||
Cash and foreign currency* | 96 | 11,576,721 | 6,948,027 | 327,070 | |||||||||||
Short-term investments held as collateral for securities loaned | 62,987,027 | 47,855,415 | 22,723,493 | 58,115,843 | |||||||||||
Receivable for investments sold | 829,055 | 2,394,140 | 6,905,288 | 2,220,327 | |||||||||||
Receivable for shares sold | — | — | — | — | |||||||||||
Interest and dividend receivables | 41,919 | 293,737 | 885,156 | 650,007 | |||||||||||
Receivable for variation margin | — | — | — | — | |||||||||||
Dividend tax reclaim receivable | 795 | 4,047 | 207,036 | 2,525 | |||||||||||
Miscellaneous receivable | — | — | — | — | |||||||||||
Total Assets | 365,551,786 | 394,412,566 | 371,625,691 | 621,253,903 | |||||||||||
LIABILITIES: | |||||||||||||||
Payable for investments purchased | 287,957 | 2,717,517 | 7,066,133 | 561,161 | |||||||||||
Collateral for securities loaned | 62,987,027 | 47,855,415 | 22,723,493 | 58,115,843 | |||||||||||
Management fee payable | 224,579 | 244,218 | 260,846 | 345,835 | |||||||||||
Distribution fee payable | 37,267 | 42,072 | 42,781 | 70,216 | |||||||||||
Trustees’ fees and expenses payable | 4,378 | 5,676 | 5,631 | 9,181 | |||||||||||
Unrealized depreciation on forward currency contracts | — | — | 82 | — | |||||||||||
Payable for shares repurchased | 166,394 | 202,074 | 415,166 | 335,174 | |||||||||||
Accrued expenses and other payables | 59,106 | 65,347 | 115,534 | 120,384 | |||||||||||
Total Liabilities | 63,766,708 | 51,132,319 | 30,629,666 | 59,557,794 | |||||||||||
NET ASSETS | $ | 301,785,078 | $ | 343,280,247 | $ | 340,996,025 | $ | 561,696,109 | |||||||
NET ASSETS consist of: | |||||||||||||||
Paid-in capital | $ | 188,724,749 | $ | 227,081,039 | $ | 428,809,877 | $ | 840,754,377 | |||||||
Undistributed (distribution in excess of) net investment income (loss) | (1,066,117 | ) | 209,590 | 7,951,004 | (251,176 | ) | |||||||||
Accumulated (distribution in excess of) net realized gain (loss) on investments sold, foreign currency transactions, written options transactions and futures contracts | 43,303,278 | 68,355,039 | (126,592,327 | ) | (334,711,223 | ) | |||||||||
Net unrealized appreciation (depreciation) of investments, assets and liabilities in foreign currency, written options contracts and futures contracts | 70,823,168 | 47,634,579 | 30,827,471 | 55,904,131 | |||||||||||
TOTAL NET ASSETS | $ | 301,785,078$ | 343,280,247 | $ | 340,996,025 | $ | 561,696,109 | ||||||||
Shares of beneficial interest outstanding (unlimited authorization, no par value) | 131,689,925 | 156,397,897 | 301,756,535 | 384,580,552 | |||||||||||
NET ASSET VALUE, | |||||||||||||||
Offering and redemption price per share (Net Assets/Shares Outstanding) | $ | 2.292 | $ | 2.195 | $ | 1.130 | $ | 1.461 | |||||||
†Total value of securities on loan | $ | 60,259,083 | $ | 45,788,751 | $ | 21,471,927 | $ | 53,584,751 | |||||||
| * | Cost $6,948,027 for Select International Equity Fund. |
See Notes to Financial Statements.
F-28
Table of Contents
ALLMERICA INVESTMENT TRUST
Core Equity Fund | Equity Index Fund | Select Fund | Government Bond Fund | Money Market Fund | |||||||||||||||
ASSETS: | |||||||||||||||||||
Investments: | |||||||||||||||||||
Investments at cost | $ | 314,668,053 | $ | 575,933,914 | $ | 461,575,420 | $ | 149,625,661 | $ | 306,139,979 | |||||||||
Net unrealized appreciation (depreciation) | 33,788,727 | 39,126,611 | (2,614,319 | ) | (992,622 | ) | — | ||||||||||||
Total investments at value† | 348,456,780 | 615,060,525 | 458,961,101 | 148,633,039 | 306,139,979 | ||||||||||||||
Cash and foreign currency* | 2,383,650 | 11,199 | 7,918 | 15,365 | 38,819 | ||||||||||||||
Short-term investments held as collateral for securities loaned | 17,050,990 | 40,727,010 | 32,251,770 | 25,785,444 | — | ||||||||||||||
Receivable for investments sold | 3,597,364 | 1,186,449 | 2,005,939 | 281 | — | ||||||||||||||
Receivable for shares sold | — | — | — | — | 486,327 | ||||||||||||||
Interest and dividend receivables | 315,495 | 774,972 | 4,496,665 | 1,204,966 | 715,081 | ||||||||||||||
Receivable for variation margin | — | 19,985 | — | — | — | ||||||||||||||
Dividend tax reclaim receivable | — | — | — | — | — | ||||||||||||||
Miscellaneous receivable | — | 831 | — | — | — | ||||||||||||||
Total Assets | 371,804,279 | 657,780,971 | 497,723,393 | 175,639,095 | 307,380,206 | ||||||||||||||
LIABILITIES: | |||||||||||||||||||
Payable for investments purchased | — | 145,584 | 6,061,249 | — | — | ||||||||||||||
Collateral for securities loaned | 17,050,990 | 40,727,010 | 32,251,770 | 25,785,444 | — | ||||||||||||||
Management fee payable | 171,195 | 138,903 | 157,396 | 62,056 | 82,383 | ||||||||||||||
Distribution fee payable | 44,404 | 73,788 | 57,100 | 18,402 | 40,273 | ||||||||||||||
Trustees’ fees and expenses payable | 5,828 | 9,756 | 7,617 | 3,049 | 9,689 | ||||||||||||||
Unrealized depreciation on forward currency contracts | — | — | — | — | — | ||||||||||||||
Payable for shares repurchased | 339,036 | 383,012 | 1,475,558 | 51,266 | 725 | ||||||||||||||
Accrued expenses and other payables | 81,869 | 126,901 | 89,068 | 33,166 | 54,446 | ||||||||||||||
Total Liabilities | 17,693,322 | 41,604,954 | 40,099,758 | 25,953,383 | 187,516 | ||||||||||||||
NET ASSETS | $ | 354,110,957 | $ | 616,176,017 | $ | 457,623,635 | $ | 149,685,712 | $ | 307,192,690 | |||||||||
NET ASSETS consist of: | |||||||||||||||||||
Paid-in capital | $ | 564,710,177 | $ | 732,731,189 | $ | 457,086,486 | $ | 152,364,690 | $ | 307,116,360 | |||||||||
Undistributed (distribution in excess of) net investment income (loss) | 35,579 | 67,007 | (1,691,142 | ) | (2,005,389 | ) | — | ||||||||||||
Accumulated (distribution in excess of) net realized gain (loss) on investments sold, foreign currency transactions, written options transactions and futures contracts | (244,423,526 | ) | (155,733,156 | ) | 4,842,610 | 319,033 | 76,330 | ||||||||||||
Net unrealized appreciation (depreciation) of investments, assets and liabilities in foreign currency, written options contracts and futures contracts | 33,788,727 | 39,110,977 | (2,614,319 | ) | (992,622 | ) | — | ||||||||||||
TOTAL NET ASSETS | $ | 354,110,957 | $ | 616,176,017 | $ | 457,623,635 | $ | 149,685,712 | $ | 307,192,690 | |||||||||
Shares of beneficial interest outstanding (unlimited authorization, no par value) | 221,340,218 | 244,961,099 | 421,790,863 | 138,934,588 | 307,117,986 | ||||||||||||||
NET ASSET VALUE, | |||||||||||||||||||
Offering and redemption price per share (Net Assets/Shares Outstanding) | $ | 1.600 | $ | 2.515 | $ | 1.085 | $ | 1.077 | $ | 1.000 | |||||||||
†Total value of securities on loan | $ | 16,334,026 | $ | 39,224,292 | $ | 31,361,706 | $ | 25,207,477 | $ | — | |||||||||
F-29
Table of Contents
ALLMERICA INVESTMENT TRUST
STATEMENTS OF OPERATIONS • For the Six Months Ended June 30, 2004 (Unaudited)
Select Capital | Select Value Opportunity | Select International Equity Fund | Select Growth Fund | |||||||||||||
INVESTMENT INCOME | ||||||||||||||||
Interest | $ | 78,186 | $ | 25,785 | $ | — | $ | 247,882 | ||||||||
Dividends | 492,202 | 1,865,312 | 6,560,491 | 2,535,769 | ||||||||||||
Securities lending income | 34,372 | 41,805 | 140,947 | 35,608 | ||||||||||||
Less net foreign taxes withheld | (5,639 | ) | (43,306 | ) | (853,567 | ) | (67,735 | ) | ||||||||
Total investment income | 599,121 | 1,889,596 | 5,847,871 | 2,751,524 | ||||||||||||
EXPENSES | ||||||||||||||||
Management fees | 1,352,895 | 1,598,720 | 1,650,278 | 2,412,040 | ||||||||||||
Distribution fees | 221,026 | 274,442 | 271,610 | 445,113 | ||||||||||||
Custodian and Fund accounting fees | 61,648 | 69,923 | 197,363 | 142,210 | ||||||||||||
Legal fees | 10,959 | 14,262 | 2,596 | 22,658 | ||||||||||||
Audit fees | 14,287 | 17,865 | 17,538 | 28,408 | ||||||||||||
Trustees’ fees and expenses | 10,427 | 13,128 | 13,277 | 22,821 | ||||||||||||
Reports to shareholders | 12,462 | 11,728 | 17,758 | 25,519 | ||||||||||||
Miscellaneous | 2,768 | 4,111 | 3,538 | 6,368 | ||||||||||||
Total expenses before waiver and reductions | 1,686,472 | 2,004,179 | 2,173,958 | 3,105,137 | ||||||||||||
Less reductions | (27,881 | ) | (128,646 | ) | (30,100 | ) | (69,827 | ) | ||||||||
Less expense waiver | — | — | — | (32,610 | ) | |||||||||||
Total expenses net of expense waiver and reductions | 1,658,591 | 1,875,533 | 2,143,858 | 3,002,700 | ||||||||||||
NET INVESTMENT INCOME (LOSS) | (1,059,470 | ) | 14,063 | 3,704,013 | (251,176 | ) | ||||||||||
NET REALIZED AND UNREALIZED GAIN (LOSS) ON INVESTMENTS: | ||||||||||||||||
Net realized gain (loss) on investments sold | 24,203,562 | 48,682,880 | 5,394,882 | 47,223,669 | ||||||||||||
Net realized gain on futures contracts | — | — | — | — | ||||||||||||
Net realized gain (loss) on foreign currency transactions | 264 | 4,857 | (328,648 | ) | (1,412 | ) | ||||||||||
Net change in unrealized appreciation (depreciation) of investments | (715,977 | ) | (23,632,255 | ) | (1,030,391 | ) | (37,613,608 | ) | ||||||||
Net change in unrealized depreciation of assets and liabilities in foreign currency | (9 | ) | — | (19,614 | ) | — | ||||||||||
NET GAIN (LOSS) ON INVESTMENTS | 23,487,840 | 25,055,482 | 4,016,229 | 9,608,649 | ||||||||||||
NET INCREASE (DECREASE) IN NET ASSETS RESULTING FROM OPERATIONS | $ | 22,428,370 | $ | 25,069,545 | $ | 7,720,242 | $ | 9,357,473 | ||||||||
See Notes to Financial Statements.
F-30
Table of Contents
ALLMERICA INVESTMENT TRUST
Core Equity Fund | Equity Index Fund | Select Fund | Government Fund | Money Market Fund | ||||||||||||||||
INVESTMENT INCOME | ||||||||||||||||||||
Interest | $ | 4,848 | $ | 102,479 | $ | 11,967,488 | $ | 3,208,959 | $ | 1,988,349 | ||||||||||
Dividends | 2,847,646 | 5,196,949 | — | — | — | |||||||||||||||
Securities lending income | 14,453 | 16,973 | 31,400 | 8,764 | — | |||||||||||||||
Less net foreign taxes withheld | — | — | — | — | — | |||||||||||||||
Total investment income | 2,866,947 | 5,316,401 | 11,998,888 | 3,217,723 | 1,988,349 | |||||||||||||||
EXPENSES | ||||||||||||||||||||
Management fees | 1,099,326 | 871,547 | 1,025,800 | 426,697 | 535,096 | |||||||||||||||
Distribution fees | 282,845 | 478,386 | 370,962 | 128,205 | 255,388 | |||||||||||||||
Custodian and Fund accounting fees | 68,386 | 184,105 | 95,283 | 31,945 | 49,633 | |||||||||||||||
Legal fees | 13,983 | 25,777 | 18,351 | 6,669 | 12,328 | |||||||||||||||
Audit fees | 18,575 | 30,043 | 24,133 | 9,868 | 15,987 | |||||||||||||||
Trustees’ fees and expenses | 13,770 | 24,742 | 17,146 | 5,759 | 7,630 | |||||||||||||||
Reports to shareholders | 21,497 | 9,555 | 15,662 | 5,150 | 12,210 | |||||||||||||||
Miscellaneous | 3,757 | 12,498 | 6,945 | 2,528 | 5,948 | |||||||||||||||
Total expenses before waiver and reductions | 1,522,139 | 1,636,653 | 1,574,282 | 616,821 | 894,220 | |||||||||||||||
Less reductions | (44,265 | ) | (43,262 | ) | — | — | — | |||||||||||||
Less expense waiver | — | — | — | — | — | |||||||||||||||
Total expenses net of expense waiver and reductions | 1,477,874 | 1,593,391 | 1,574,282 | 616,821 | 894,220 | |||||||||||||||
NET INVESTMENT INCOME (LOSS) | 1,389,073 | 3,723,010 | 10,424,606 | 2,600,902 | 1,094,129 | |||||||||||||||
NET REALIZED AND UNREALIZED GAIN (LOSS) ON INVESTMENTS: | ||||||||||||||||||||
Net realized gain (loss) on investments sold | 5,897,813 | (2,066,962 | ) | (12,144 | ) | 373,775 | (40 | ) | ||||||||||||
Net realized gain on futures contracts | — | 110,045 | — | — | — | |||||||||||||||
Net realized gain (loss) on foreign currency transactions | — | — | — | — | — | |||||||||||||||
Net change in unrealized appreciation (depreciation) of investments | 1,707,790 | 18,439,479 | (10,570,553 | ) | (3,328,511 | ) | — | |||||||||||||
Net change in unrealized depreciation of assets and liabilities in foreign currency | — | — | — | — | — | |||||||||||||||
NET GAIN (LOSS) ON INVESTMENTS | 7,605,603 | 16,482,562 | (10,582,697 | ) | (2,954,736 | ) | (40 | ) | ||||||||||||
NET INCREASE (DECREASE) IN NET ASSETS RESULTING FROM OPERATIONS | $ | 8,994,676 | $ | 20,205,572 | $ | (158,091 | ) | $ | (353,834 | ) | $ | 1,094,089 | ||||||||
F-31
Table of Contents
ALLMERICA INVESTMENT TRUST
STATEMENTS OF CHANGES IN NET ASSETS
Select Capital Appreciation Fund | Select Value Opportunity Fund | |||||||||||||||
Six Months Ended June 30, 2004 | Year Ended December 31, 2003 | Six Months Ended June 30, 2004 | Year Ended December 31, 2003 | |||||||||||||
NET ASSETS at beginning of period | $ | 296,203,932 | $ | 287,593,224 | $ | 380,800,995 | $ | 351,830,989 | ||||||||
Increase (decrease) in net assets resulting from operations: | ||||||||||||||||
Net investment income (loss) | (1,059,470 | ) | (2,027,882 | ) | 14,063 | 247,632 | ||||||||||
Net realized gain (loss) on investments sold and foreign currency transactions | 24,203,826 | 32,284,375 | 48,687,737 | 23,799,027 | ||||||||||||
Net change in unrealized appreciation (depreciation) of investments, assets and liabilities in foreign currency, written option contracts and futures contracts | (715,986 | ) | 65,606,186 | (23,632,255 | ) | 83,321,848 | ||||||||||
Net increase in net assets resulting from operations | 22,428,370 | 95,862,679 | 25,069,545 | 107,368,507 | ||||||||||||
Distributions to shareholders from: | ||||||||||||||||
Net investment income | — | — | — | (398,223 | ) | |||||||||||
Net realized gain on investments | — | — | — | (966,976 | ) | |||||||||||
Total distributions | — | — | — | (1,365,199 | ) | |||||||||||
Capital share transactions: | ||||||||||||||||
Net proceeds from sales of shares | 16,105,577 | 8,543,704 | 985,052 | 14,815,521 | ||||||||||||
Value of shares issued in exchange for the net assets of the Select Aggressive Growth Fund (Note 9) | — | — | — | — | ||||||||||||
Value of shares issued in exchange for the net assets of the Select Strategic Growth Fund (Note 9) | — | — | — | — | ||||||||||||
Value of shares issued in exchange for the net assets of the Select Emerging Markets Fund (Note 9) | — | — | — | — | ||||||||||||
Issued to shareholders in reinvestment of distributions | — | — | — | 1,365,199 | ||||||||||||
Cost of shares repurchased | (32,952,801 | ) | (95,795,675 | ) | (63,575,345 | ) | (93,214,022 | ) | ||||||||
Net increase (decrease) from capital share transactions | (16,847,224 | ) | (87,251,971 | ) | (62,590,293 | ) | (77,033,302 | ) | ||||||||
Total increase (decrease) in net assets | 5,581,146 | 8,610,708 | (37,520,748 | ) | 28,970,006 | |||||||||||
NET ASSETS at end of period | $ | 301,785,078 | $ | 296,203,932 | $ | 343,280,247 | $ | 380,800,995 | ||||||||
Undistributed (distribution in excess of) net investment income (loss) | $ | (1,066,117 | ) | $ | (6,647 | ) | $ | 209,590 | $ | 195,527 | ||||||
OTHER INFORMATION: | ||||||||||||||||
Share transactions: | ||||||||||||||||
Sold | 7,266,502 | 4,455,481 | 461,316 | 9,694,636 | ||||||||||||
Issued in exchange for the shares of the Select Aggressive Growth Fund (Note 9) | — | — | — | — | ||||||||||||
Issued in exchange for the shares of the Select Strategic Growth Fund (Note 9) | — | — | — | — | ||||||||||||
Issued in exchange for the shares of the Select Emerging Markets Fund (Note 9) | — | — | — | — | ||||||||||||
Issued to shareholders in reinvestment of distributions | — | — | — | 789,132 | ||||||||||||
Repurchased | (14,979,565 | ) | (54,083,864 | ) | (29,861,316 | ) | (61,302,191 | ) | ||||||||
Net increase (decrease) in shares outstanding | (7,713,063 | ) | (49,628,383 | ) | (29,400,000 | ) | (50,818,423 | ) | ||||||||
See Notes to Financial Statements.
F-32
Table of Contents
ALLMERICA INVESTMENT TRUST
Select International Equity Fund | Select Growth Fund | Core Equity Fund | ||||||||||||||||||||||
| Six Months Ended June 30, 2004 (Unaudited) | Year Ended December 31, 2003 | Six Months Ended June 30, 2004 (Unaudited) | Year Ended December 31, 2003 | Six Months Ended June 30, 2004 (Unaudited) | Year Ended December 31, 2003 | |||||||||||||||||||
NET ASSETS at beginning of period | $ | 380,653,182 | $ | 335,889,657 | $ | 625,728,520 | $ | 375,958,982 | $ | 400,016,657 | $ | 401,888,470 | ||||||||||||
Increase (decrease) in net assets resulting from operations: | ||||||||||||||||||||||||
Net investment income (loss) | 3,704,013 | 4,929,054 | (251,176 | ) | (427,543 | ) | 1,389,073 | 3,319,564 | ||||||||||||||||
Net realized gain (loss) on investments sold and foreign currency transactions | 5,066,234 | (32,553,647 | ) | 47,222,257 | (36,568,348 | ) | 5,897,813 | (25,175,235 | ) | |||||||||||||||
Net change in unrealized appreciation (depreciation) of investments, assets and liabilities in foreign currency, written option contracts and futures contracts | (1,050,005 | ) | 113,163,931 | (37,613,608 | ) | 171,038,236 | 1,707,790 | 113,866,094 | ||||||||||||||||
Net increase in net assets resulting from operations | 7,720,242 | 85,539,338 | 9,357,473 | 134,042,345 | 8,994,676 | 92,010,423 | ||||||||||||||||||
Distributions to shareholders from: | ||||||||||||||||||||||||
Net investment income | — | (2,710,560 | ) | — | (247,303 | ) | (1,427,712 | ) | (3,286,534 | ) | ||||||||||||||
Net realized gain on investments | — | — | — | — | — | — | ||||||||||||||||||
Total distributions | — | (2,710,560 | ) | — | (247,303 | ) | (1,427,712 | ) | (3,286,534 | ) | ||||||||||||||
Capital share transactions: | ||||||||||||||||||||||||
Net proceeds from sales of shares | 14,270,509 | 20,021,820 | 47,412 | 1,501,786 | 24,386 | 1,552,913 | ||||||||||||||||||
Value of shares issued in exchange for the net assets of the Select Aggressive Growth Fund (Note 9) | — | — | — | 259,023,031 | — | — | ||||||||||||||||||
Value of shares issued in exchange for the net assets of the Select Strategic Growth Fund (Note 9) | — | — | — | 17,766,775 | — | — | ||||||||||||||||||
Value of shares issued in exchange for the net assets of the Select Emerging Markets Fund (Note 9) | — | 45,260,073 | — | — | — | — | ||||||||||||||||||
Issued to shareholders in reinvestment of distributions | — | 2,710,560 | — | 247,303 | 1,427,712 | 3,286,534 | ||||||||||||||||||
Cost of shares repurchased | (61,647,908 | ) | (106,057,706 | ) | (73,437,296 | ) | (162,564,399 | ) | (54,924,762 | ) | (95,435,149 | ) | ||||||||||||
Net increase (decrease) from capital share transactions | (47,377,399 | ) | (38,065,253 | ) | (73,389,884 | ) | 115,974,496 | (53,472,664 | ) | (90,595,702 | ) | |||||||||||||
Total increase (decrease) in net assets | (39,657,157 | ) | 44,763,525 | (64,032,411 | ) | 249,769,538 | (45,905,700 | ) | (1,871,813 | ) | ||||||||||||||
NET ASSETS at end of period | $ | 340,996,025 | $ | 380,653,182 | $ | 561,696,109 | $ | 625,728,520 | $ | 354,110,957 | $ | 400,016,657 | ||||||||||||
Undistributed (distribution in excess of) net investment income (loss) | $ | 7,951,004 | $ | 4,246,991 | $ | (251,176 | ) | $ | — | $ | 35,579 | $ | 74,218 | |||||||||||
OTHER INFORMATION: | ||||||||||||||||||||||||
Share transactions: | ||||||||||||||||||||||||
Sold | 12,687,041 | 21,677,491 | 32,248 | 1,068,140 | 15,307 | 1,174,083 | ||||||||||||||||||
Issued in exchange for the shares of the Select Aggressive Growth Fund (Note 9) | — | — | — | 220,257,679 | — | — | ||||||||||||||||||
Issued in exchange for the shares of the Select Strategic Growth Fund (Note 9) | — | — | — | 15,107,801 | — | — | ||||||||||||||||||
Issued in exchange for the shares of the Select Emerging Markets Fund (Note 9) | — | 52,384,344 | — | — | — | — | ||||||||||||||||||
Issued to shareholders in reinvestment of distributions | — | 2,850,221 | — | 188,063 | 896,606 | 2,410,772 | ||||||||||||||||||
Repurchased | (54,468,687 | ) | (117,523,711 | ) | (50,474,170 | ) | (131,719,570 | ) | (34,663,612 | ) | (72,880,614 | ) | ||||||||||||
Net increase (decrease) in shares outstanding | (41,781,646 | ) | (40,611,655 | ) | (50,441,922 | ) | 104,902,113 | (33,751,699 | ) | (69,295,759 | ) | |||||||||||||
F-33
Table of Contents
ALLMERICA INVESTMENT TRUST
STATEMENTS OF CHANGES IN NET ASSETS
Equity Index Fund | Select Investment Grade Income Fund | |||||||||||||||
Six Months Ended June 30, 2004 | Year Ended December 31, 2003 | Six Months Ended June 30, 2004 | Year Ended December 31, 2003 | |||||||||||||
NET ASSETS at beginning of period | $ | 666,454,873 | $ | 342,682,878 | $ | 530,198,773 | $ | 620,074,063 | ||||||||
Increase (decrease) in net assets resulting from operations: | ||||||||||||||||
Net investment income | 3,723,010 | 7,422,179 | 10,424,606 | 20,676,973 | ||||||||||||
Net realized gain (loss) on investments sold, foreign currency transactions, written option transactions and futures contracts | (1,956,917 | ) | (25,093,758 | ) | (12,144 | ) | 20,573,027 | |||||||||
Net change in unrealized appreciation (depreciation) of investments, assets and liabilities in foreign currency, written option contracts and futures contracts | 18,439,479 | 166,019,862 | (10,570,553 | ) | (19,138,132 | ) | ||||||||||
Net increase (decrease) in net assets resulting from operations | 20,205,572 | 148,348,283 | (158,091 | ) | 22,111,868 | |||||||||||
Distributions to shareholders from: | ||||||||||||||||
Net investment income | (3,899,497 | ) | (7,143,778 | ) | (14,569,232 | ) | (26,622,750 | ) | ||||||||
Net realized gain on investments | — | — | — | — | ||||||||||||
Total distributions | (3,899,497 | ) | (7,143,778 | ) | (14,569,232 | ) | (26,622,750 | ) | ||||||||
Capital share transactions: | ||||||||||||||||
Net proceeds from sales of shares | 4,403,984 | 9,845,737 | 7,302,090 | 9,154,551 | ||||||||||||
Value of shares issued in exchange for the net assets of the Select Strategic Income Fund (Note 9) | — | — | — | 142,624,667 | ||||||||||||
Value of shares issued in exchange for the net assets of the Select Growth and Income Fund (Note 9) | — | 292,154,078 | — | — | ||||||||||||
Issued to shareholders in reinvestment of distributions | 3,899,497 | 7,143,778 | 14,569,232 | 26,622,750 | ||||||||||||
Cost of shares repurchased | (74,888,412 | ) | (126,576,103 | ) | (79,719,137 | ) | (263,766,376 | ) | ||||||||
Net increase (decrease) from capital share transactions | (66,584,931 | ) | 182,567,490 | (57,847,815 | ) | (85,364,408 | ) | |||||||||
Total increase (decrease) in net assets | (50,278,856 | ) | 323,771,995 | (72,575,138 | ) | (89,875,290 | ) | |||||||||
NET ASSETS at end of period | $ | 616,176,017 | $ | 666,454,873 | $ | 457,623,635 | $ | 530,198,773 | ||||||||
Undistributed (distribution in excess of) net investment income (loss) | $ | 67,007 | $ | 243,494 | $ | (1,691,142 | ) | $ | 2,453,484 | |||||||
OTHER INFORMATION: | ||||||||||||||||
Share transactions: | ||||||||||||||||
Sold | 1,775,390 | 4,812,165 | 6,550,441 | 10,096,929 | ||||||||||||
Issued in exchange for the shares of the Select Strategic Income Fund (Note 9) | — | — | — | 125,882,319 | ||||||||||||
Issued in exchange for the shares of the Select Growth and Income Fund (Note 9) | — | 147,106,786 | — | — | ||||||||||||
Issued to shareholders in reinvestment of distributions | 1,560,544 | 3,254,461 | 13,122,438 | 23,532,345 | ||||||||||||
Repurchased | (30,021,268 | ) | (59,805,637 | ) | (71,529,682 | ) | (232,888,459 | ) | ||||||||
Net increase (decrease) in shares outstanding | (26,685,334 | ) | 95,367,775 | (51,856,803 | ) | (73,376,866 | ) | |||||||||
See Notes to Financial Statements.
F-34
Table of Contents
ALLMERICA INVESTMENT TRUST
Government Bond Fund | Money Market Fund | |||||||||||||||
Six Months Ended June 30, 2004 | Year Ended 2003 | Six Months Ended June 30, 2004 | Year Ended December 31, 2003 | |||||||||||||
NET ASSETS at beginning of period | $ | 200,158,460 | $ | 291,995,366 | $ | 377,154,527 | $ | 704,804,637 | ||||||||
Increase (decrease) in net assets resulting from operations: | ||||||||||||||||
Net investment income | 2,600,902 | 7,242,159 | 1,094,129 | 4,286,757 | ||||||||||||
Net realized gain (loss) on investments sold, foreign currency transactions, written option transactions and futures contracts | 373,775 | 3,288,747 | (40 | ) | 76,830 | |||||||||||
Net change in unrealized appreciation (depreciation) of investments, assets and liabilities in foreign currency, written option contracts and futures contracts | (3,328,511 | ) | (6,228,693 | ) | — | — | ||||||||||
Net increase (decrease) in net assets resulting from operations | (353,834 | ) | 4,302,213 | 1,094,089 | 4,363,587 | |||||||||||
Distributions to shareholders from: | ||||||||||||||||
Net investment income | (3,226,220 | ) | (9,748,622 | ) | (1,094,129 | ) | (4,286,757 | ) | ||||||||
Net realized gain on investments | — | — | — | (37,465 | ) | |||||||||||
Total distributions | (3,226,220 | ) | (9,748,622 | ) | (1,094,129 | ) | (4,324,222 | ) | ||||||||
Capital share transactions: | ||||||||||||||||
Net proceeds from sales of shares | 775,907 | 23,186,088 | 65,919,107 | 181,842,312 | ||||||||||||
Value of shares issued in exchange for the net assets of the Select Strategic Income Fund (Note 9) | — | — | — | — | ||||||||||||
Value of shares issued in exchange for the net assets of the Select Growth and Income Fund (Note 9) | — | — | — | — | ||||||||||||
Issued to shareholders in reinvestment of distributions | 3,226,220 | 9,748,622 | 1,094,129 | 4,324,222 | ||||||||||||
Cost of shares repurchased | (50,894,821 | ) | (119,325,207 | ) | (136,975,033 | ) | (513,856,009 | ) | ||||||||
Net increase (decrease) from capital share transactions | (46,892,694 | ) | (86,390,497 | ) | (69,961,797 | ) | (327,689,475 | ) | ||||||||
Total increase (decrease) in net assets | (50,472,748 | ) | (91,836,906 | ) | (69,961,837 | ) | (327,650,110 | ) | ||||||||
NET ASSETS at end of period | $ | 149,685,712 | $ | 200,158,460 | $ | 307,192,690 | $ | 377,154,527 | ||||||||
Undistributed (distribution in excess of) net investment income (loss) | $ | (2,005,389 | ) | $ | (1,380,071 | ) | $ | — | $ | — | ||||||
OTHER INFORMATION: | ||||||||||||||||
Share transactions: | ||||||||||||||||
Sold | 696,596 | 20,555,005 | 65,919,107 | 181,842,312 | ||||||||||||
Issued in exchange for the shares of the Select Strategic Income Fund (Note 9) | — | — | — | — | ||||||||||||
Issued in exchange for the shares of the Select Growth and Income Fund (Note 9) | — | — | — | — | ||||||||||||
Issued to shareholders in reinvestment of distributions | 2,936,711 | 8,674,020 | 1,094,129 | 4,324,222 | ||||||||||||
Repurchased | (46,057,927 | ) | (106,259,141 | ) | (136,975,033 | ) | (513,856,009 | ) | ||||||||
Net increase (decrease) in shares outstanding | (42,424,620 | ) | (77,030,116 | ) | (69,961,797 | ) | (327,689,475 | ) | ||||||||
F-35
Table of Contents
ALLMERICA INVESTMENT TRUST
FINANCIAL HIGHLIGHTS - For a Share Outstanding Throughout Each Period
| Income from Investment Operations | Less Distributions | Net | |||||||||||||||||||||||||||||
Year Ended December 31, | Net Asset | Net Investment Income (Loss)(2) | Net Realized and Unrealized Gain (Loss) on Investments | Total from Investment Operations | Dividends from Net Investment Income | Distributions from Net Realized Capital Gains | Total Distributions | ||||||||||||||||||||||||
Select Capital Appreciation Fund | |||||||||||||||||||||||||||||||
2004(d) | $ | 2.125 | $ | (0.008 | ) | $ | 0.175 | $ | 0.167 | $ | — | $ | — | $ | — | $ | 0.167 | ||||||||||||||
2003 | 1.521 | (0.015 | ) | 0.619 | 0.604 | — | — | — | 0.604 | ||||||||||||||||||||||
2002 | 1.940 | (0.014 | ) | (0.405 | ) | (0.419 | ) | — | — | — | (0.419 | ) | |||||||||||||||||||
2001 | 2.122 | (0.010 | ) | (0.019 | ) | (0.029 | ) | — | (0.153 | ) | (0.153 | ) | (0.182 | ) | |||||||||||||||||
2000 | 2.053 | (0.008 | ) | 0.147 | 0.139 | — | (0.070 | ) | (0.070 | ) | 0.069 | ||||||||||||||||||||
1999 | 1.640 | (0.007 | ) | 0.423 | 0.416 | — | (0.003 | ) | (0.003 | ) | 0.413 | ||||||||||||||||||||
Select Value Opportunity Fund | |||||||||||||||||||||||||||||||
2004(d) | $ | 2.050 | $ | — | $ | 0.145 | $ | 0.145 | $ | — | $ | — | $ | — | $ | 0.145 | |||||||||||||||
2003 | 1.487 | 0.002 | 0.568 | 0.570 | (0.002 | ) | (0.005 | ) | (0.007 | ) | 0.563 | ||||||||||||||||||||
2002 | 1.975 | 0.002 | (0.315 | ) | (0.313 | ) | (0.011 | ) | (0.164 | ) | (0.175 | ) | (0.488 | ) | |||||||||||||||||
2001 | 1.958 | 0.012 | 0.225 | 0.237 | (0.012 | ) | (0.208 | ) | (0.220 | ) | 0.017 | ||||||||||||||||||||
2000 | 1.521 | 0.012 | 0.446 | 0.458 | (0.006 | ) | (0.015 | ) | (0.021 | ) | 0.437 | ||||||||||||||||||||
1999 | 1.686 | 0.006 | (0.077 | ) | (0.071 | ) | — | (0.094 | ) | (0.094 | ) | (0.165 | ) | ||||||||||||||||||
Select International Equity Fund | |||||||||||||||||||||||||||||||
2004(d) | $ | 1.108 | $ | 0.014 | $ | 0.008 | $ | 0.022 | $ | — | $ | — | $ | — | $ | 0.022 | |||||||||||||||
2003 | 0.874 | 0.015 | 0.226 | 0.241 | (0.007 | ) | — | (0.007 | ) | 0.234 | |||||||||||||||||||||
2002 | 1.113 | 0.013 | (0.226 | ) | (0.213 | ) | (0.017 | ) | (0.009 | ) | (0.026 | ) | (0.239 | ) | |||||||||||||||||
2001 | 1.781 | 0.018 | (0.385 | ) | (0.367 | ) | (0.024 | ) | (0.277 | ) | (0.301 | ) | (0.668 | ) | |||||||||||||||||
2000 | 2.031 | 0.013 | (0.191 | ) | (0.178 | ) | (0.009 | ) | (0.063 | ) | (0.072 | ) | (0.250 | ) | |||||||||||||||||
1999 | 1.542 | 0.012 | 0.477 | 0.489 | — | — | — | 0.489 | |||||||||||||||||||||||
| Select Growth Fund(1) | |||||||||||||||||||||||||||||||
2004(d) | $ | 1.438 | $ | (0.001 | ) | $ | 0.024 | $ | 0.023 | $ | $ | — | $ | — | $ | 0.023 | |||||||||||||||
2003 | 1.139 | (0.001 | ) | 0.301 | 0.300 | (0.001 | ) | — | (0.001 | ) | 0.299 | ||||||||||||||||||||
2002 | 1.576 | 0.001 | (0.436 | ) | (0.435 | ) | (0.002 | ) | — | (0.002 | ) | (0.437 | ) | ||||||||||||||||||
2001 | 2.214 | 0.002 | (0.545 | ) | (0.543 | ) | — | (0.095 | ) | (0.095 | ) | (0.638 | ) | ||||||||||||||||||
2000 | 3.049 | (0.001 | ) | (0.489 | ) | (0.490 | ) | — | (0.345 | ) | (0.345 | ) | (0.835 | ) | |||||||||||||||||
1999 | 2.428 | (0.002 | ) | 0.709 | 0.707 | (0.001 | ) | (0.085 | ) | (0.086 | ) | 0.621 | |||||||||||||||||||
| Core Equity Fund(1) | |||||||||||||||||||||||||||||||
2004(d) | $ | 1.568 | $ | 0.006 | $ | 0.032 | $ | 0.038 | $ | (0.006 | ) | $ | — | $ | (0.006 | ) | $ | 0.032 | |||||||||||||
2003 | 1.239 | 0.012 | 0.329 | 0.341 | (0.012 | ) | — | (0.012 | ) | 0.329 | |||||||||||||||||||||
2002 | 1.633 | 0.011 | (3) | (0.393 | ) | (0.382 | ) | (0.012 | ) | — | (0.012 | ) | (0.394 | ) | |||||||||||||||||
2001 | 2.689 | 0.016 | (0.439 | ) | (0.423 | ) | (0.015 | ) | (0.618 | ) | (0.633 | ) | (1.056 | ) | |||||||||||||||||
2000 | 3.310 | 0.016 | (0.295 | ) | (0.279 | ) | (0.017 | ) | (0.325 | ) | (0.342 | ) | (0.621 | ) | |||||||||||||||||
1999 | 2.825 | 0.020 | 0.779 | 0.799 | (0.020 | ) | (0.294 | ) | (0.314 | ) | 0.485 | ||||||||||||||||||||
| * | Annualized. |
| ** | Not Annualized. |
| (a) | Including reimbursements, waivers, and reductions. |
| (b) | Excluding reductions. Certain Portfolios have entered varying arrangements with brokers who reduced a portion of the Portfolio’s expenses. |
| (c) | Excluding reimbursements, waivers, and reductions. |
| (d) | For the six months ended June 30, 2004 (Unaudited). |
| (1) | The Select Growth Fund added a second sub-adviser on April 18, 2003 and replaced the first sub-adviser on April 30, 2004. The Core Equity Fund changed sub-advisers and added a second sub-adviser on May 1, 2002. |
| (2) | Net investment income (loss) per share before reimbursements and waivers of fees by the investment advisor or reductions were $(0.001) for the six months ended June 30, 2004, $0.001 in 2003, $0.000 in 2002, $0.011 in 2001, $0.011 in 2000, and $0.005 in 1999 for Select Value Opportunity Fund; $0.011 in 1999 for Select International Equity Fund; $(0.002) in 2003, $0.000 in 2002, $0.001 in 2001, $(0.002) in 2000, and $(0.003) in 1999 for Select Growth Fund; and $0.014 in 2001, $0.015 in 2000, and $0.019 in 1999 for Core Equity Fund. |
| (3) | Computed using average shares outstanding throughout the period. |
See Notes to Financial Statements.
F-36
Table of Contents
ALLMERICA INVESTMENT TRUST
| Ratios/Supplemental Data | ||||||||||||||||||||||||||||||
Net Asset | Total | Net Assets | Ratios To Average Net Assets | Portfolio | ||||||||||||||||||||||||||
Net | Operating Expenses | Management Fee | ||||||||||||||||||||||||||||
Year Ended December 31, | (a) | (b) | (c) | Gross | Net | |||||||||||||||||||||||||
Select Capital Appreciation Fund | ||||||||||||||||||||||||||||||
2004(d) | $ | 2.292 | 7.86 | %** | $ | 301,785 | (0.72 | )%* | 1.13 | %* | 1.14 | %* | 1.14 | %* | 0.92 | %* | 0.92 | %* | 24 | %** | ||||||||||
2003 | 2.125 | 39.71 | % | 296,204 | (0.70 | )% | 1.11 | % | 1.13 | % | 1.13 | % | 0.92 | % | 0.92 | % | 46 | % | ||||||||||||
2002 | 1.521 | (21.60 | )% | 287,593 | (0.70 | )% | 1.05 | % | 1.06 | % | 1.06 | % | 0.90 | % | 0.90 | % | 41 | % | ||||||||||||
2001 | 1.940 | (1.14 | )% | 435,864 | (0.51 | )% | 0.93 | % | 0.94 | % | 0.94 | % | 0.88 | % | 0.88 | % | 44 | % | ||||||||||||
2000 | 2.122 | 6.81 | % | 510,483 | (0.38 | )% | 0.93 | % | 0.94 | % | 0.94 | % | 0.87 | % | 0.87 | % | 53 | % | ||||||||||||
1999 | 2.053 | 25.36 | % | 417,087 | (0.42 | )% | 0.98 | % | 0.98 | % | 0.98 | % | 0.91 | % | 0.91 | % | 61 | % | ||||||||||||
Select Value Opportunity Fund | ||||||||||||||||||||||||||||||
2004(d) | $ | 2.195 | 7.07 | %** | $ | 343,280 | 0.01 | %* | 1.03 | %* | 1.10 | %* | 1.10 | %* | 0.87 | %* | 0.87 | %* | 50 | %** | ||||||||||
2003 | 2.050 | 38.43 | % | 380,801 | 0.07 | % | 1.03 | % | 1.09 | % | 1.09 | % | 0.88 | % | 0.88 | % | 117 | % | ||||||||||||
2002 | 1.487 | (16.32 | )% | 351,831 | 0.12 | % | 0.96 | % | 1.03 | % | 1.03 | % | 0.87 | % | 0.87 | % | 94 | % | ||||||||||||
2001 | 1.975 | 12.70 | % | 440,335 | 0.63 | % | 0.87 | % | 0.92 | % | 0.92 | % | 0.87 | % | 0.87 | % | 97 | % | ||||||||||||
2000 | 1.958 | 30.40 | % | 397,541 | 0.71 | % | 0.87 | % | 0.94 | % | 0.94 | % | 0.88 | % | 0.88 | % | 22 | % | ||||||||||||
1999 | 1.521 | (4.70 | )% | 308,331 | 0.43 | % | 0.88 | % | 0.97 | % | 0.97 | % | 0.90 | % | 0.90 | % | 98 | % | ||||||||||||
Select International Equity Fund | ||||||||||||||||||||||||||||||
2004(d) | $ | 1.130 | 1.99 | %** | $ | 340,996 | 2.05 | %* | 1.18 | %* | 1.20 | %* | 1.20 | %* | 0.91 | %* | 0.91 | %* | 12 | %** | ||||||||||
2003 | 1.108 | 27.77 | % | 380,653 | 1.46 | % | 1.18 | % | 1.19 | % | 1.19 | % | 0.92 | % | 0.92 | % | 28 | % | ||||||||||||
2002 | 0.874 | (19.37 | )% | 335,890 | 1.17 | % | 1.13 | % | 1.14 | % | 1.14 | % | 0.91 | % | 0.91 | % | 14 | % | ||||||||||||
2001 | 1.113 | (21.43 | )% | 460,006 | 0.97 | % | 0.99 | % | 1.01 | % | 1.01 | % | 0.89 | % | 0.89 | % | 26 | % | ||||||||||||
2000 | 1.781 | (9.03 | )% | 679,128 | 0.77 | % | 0.98 | % | 0.99 | % | 0.99 | % | 0.88 | % | 0.88 | % | 24 | % | ||||||||||||
1999 | 2.031 | 31.71 | % | 679,341 | 0.69 | % | 1.01 | % | 1.02 | % | 1.02 | % | 0.89 | % | 0.89 | % | 18 | % | ||||||||||||
| Select Growth Fund(1) | ||||||||||||||||||||||||||||||
2004(d) | $ | 1.461 | 1.60 | %** | $ | 561,696 | (0.08 | )%* | 1.01 | %* | 1.04 | %* | 1.05 | %* | 0.81 | %* | 0.80 | %* | 67 | %** | ||||||||||
2003 | 1.438 | 26.30 | % | 625,729 | (0.08 | )% | 1.03 | % | 1.07 | % | 1.07 | % | 0.81 | % | 0.81 | % | 75 | % | ||||||||||||
2002 | 1.139 | (27.60 | )% | 375,959 | 0.05 | % | 0.95 | % | 1.01 | % | 1.01 | % | 0.82 | % | 0.82 | % | 125 | % | ||||||||||||
2001 | 1.576 | (24.71 | )% | 660,893 | 0.12 | % | 0.78 | % | 0.85 | % | 0.85 | % | 0.79 | % | 0.79 | % | 91 | % | ||||||||||||
2000 | 2.214 | (17.79 | )% | 1,040,237 | (0.05 | )% | 0.80 | % | 0.81 | % | 0.81 | % | 0.76 | % | 0.76 | % | 79 | % | ||||||||||||
1999 | 3.049 | 29.80 | % | 1,216,365 | (0.08 | )% | 0.81 | % | 0.83 | % | 0.83 | % | 0.78 | % | 0.78 | % | 84 | % | ||||||||||||
| Core Equity Fund(1) | ||||||||||||||||||||||||||||||
2004(d) | $ | 1.600 | 2.44 | %** | $ | 354,111 | 0.74 | %* | 0.78 | %* | 0.81 | %* | 0.81 | %* | 0.58 | %* | 0.58 | %* | 18 | %** | ||||||||||
2003 | 1.568 | 27.67 | % | 400,017 | 0.88 | % | 0.78 | % | 0.80 | % | 0.80 | % | 0.58 | % | 0.58 | % | 27 | % | ||||||||||||
2002 | 1.239 | (23.45 | )% | 401,888 | 0.78 | % | 0.70 | % | 0.74 | % | 0.74 | % | 0.57 | % | 0.57 | % | 115 | % | ||||||||||||
2001 | 1.633 | (16.90 | )% | 673,753 | 0.75 | % | 0.58 | % | 0.61 | % | 0.61 | % | 0.55 | % | 0.55 | % | 134 | % | ||||||||||||
2000 | 2.689 | (9.51 | )% | 924,904 | 0.51 | % | 0.44 | % | 0.50 | % | 0.50 | % | 0.45 | % | 0.45 | % | 190 | % | ||||||||||||
1999 | 3.310 | 29.33 | % | 1,076,297 | 0.65 | % | 0.45 | % | 0.48 | % | 0.48 | % | 0.43 | % | 0.43 | % | 116 | % | ||||||||||||
F-37
Table of Contents
ALLMERICA INVESTMENT TRUST
FINANCIAL HIGHLIGHTS - For a Share Outstanding Throughout Each Period
| Income from Investment Operations | Less Distributions(e) | ||||||||||||||||||||||||||||||
Year Ended December 31, | Net Asset | Net Investment Income(2) | Net Realized and Unrealized Gain (Loss) on Investments | Total from Investment Operations | Dividends from Net Investment Income | Distributions from Net Realized Capital Gains | Total Distributions | Net Increase (Decrease) in Net Asset Value | |||||||||||||||||||||||
Equity Index Fund | |||||||||||||||||||||||||||||||
2004(d) | $ | 2.453 | $ | 0.015 | $ | 0.063 | $ | 0.078 | $ | (0.016 | ) | $ | — | $ | (0.016 | ) | $ | 0.062 | |||||||||||||
2003 | 1.944 | 0.029 | 0.508 | 0.537 | (0.028 | ) | — | (0.028 | ) | 0.509 | |||||||||||||||||||||
2002 | 2.715 | 0.027 | (0.616 | ) | (0.589 | ) | (0.028 | ) | (0.154 | ) | (0.182 | ) | (0.771 | ) | |||||||||||||||||
2001 | 3.299 | 0.030 | (0.422 | ) | (0.392 | ) | (0.029 | ) | (0.163 | ) | (0.192 | ) | (0.584 | ) | |||||||||||||||||
2000 | 4.060 | 0.032 | (0.362 | ) | (0.330 | ) | (0.034 | ) | (0.397 | ) | (0.431 | ) | (0.761 | ) | |||||||||||||||||
1999 | 3.408 | 0.036 | 0.656 | 0.692 | (0.035 | ) | (0.005 | ) | (0.040 | ) | 0.652 | ||||||||||||||||||||
Select Investment Grade Income Fund(1) | |||||||||||||||||||||||||||||||
2004(d) | $ | 1.119 | $ | 0.024 | $ | (0.024 | ) | $ | — | $ | (0.034 | ) | $ | — | $ | (0.034 | ) | $ | (0.034 | ) | |||||||||||
2003 | 1.134 | 0.040 | (0.003 | )(3) | 0.037 | (0.052 | ) | — | (0.052 | ) | (0.015 | ) | |||||||||||||||||||
2002 | 1.106 | 0.054 | 0.034 | 0.088 | (0.060 | ) | — | (0.060 | ) | 0.028 | |||||||||||||||||||||
2001 | �� | 1.086 | 0.064 | (4) | 0.021 | 0.085 | (0.065 | ) | — | (0.065 | ) | 0.020 | |||||||||||||||||||
2000 | 1.051 | 0.070 | 0.035 | 0.105 | (0.070 | ) | — | (0.070 | ) | 0.035 | |||||||||||||||||||||
1999 | 1.132 | 0.068 | (0.079 | ) | (0.011 | ) | (0.069 | ) | (0.001 | ) | (0.070 | ) | (0.081 | ) | |||||||||||||||||
Government Bond Fund(1) | |||||||||||||||||||||||||||||||
2004(d) | $ | 1.104 | $ | 0.015 | $ | (0.020 | ) | $ | (0.005 | ) | $ | (0.022 | ) | $ | — | $ | (0.022 | ) | $ | (0.027 | ) | ||||||||||
2003 | 1.130 | 0.030 | (0.011 | ) | 0.019 | (0.045 | ) | — | (0.045 | ) | (0.026 | ) | |||||||||||||||||||
2002 | 1.077 | 0.041 | 0.057 | 0.098 | (0.045 | ) | — | (0.045 | ) | 0.053 | |||||||||||||||||||||
2001 | 1.051 | 0.049 | (4) | 0.030 | 0.079 | (0.053 | ) | — | (0.053 | ) | 0.026 | ||||||||||||||||||||
2000 | 1.011 | 0.058 | 0.040 | 0.098 | (0.058 | ) | — | (0.058 | ) | 0.040 | |||||||||||||||||||||
1999 | 1.068 | 0.058 | (0.056 | ) | 0.002 | (0.059 | ) | — | (0.059 | ) | (0.057 | ) | |||||||||||||||||||
Money Market Fund | |||||||||||||||||||||||||||||||
2004(d) | $ | 1.000 | $ | 0.003 | $ | — | $ | 0.003 | $ | (0.003 | ) | $ | — | $ | (0.003 | ) | $ | — | |||||||||||||
2003 | 1.000 | 0.008 | — | 0.008 | (0.008 | ) | — | (5) | (0.008 | ) | — | ||||||||||||||||||||
2002 | 1.000 | 0.016 | — | 0.016 | (0.016 | ) | — | (0.016 | ) | — | |||||||||||||||||||||
2001 | 1.000 | 0.042 | — | 0.042 | (0.042 | ) | — | (0.042 | ) | — | |||||||||||||||||||||
2000 | 1.000 | 0.062 | — | 0.062 | (0.062 | ) | — | (0.062 | ) | — | |||||||||||||||||||||
1999 | 1.000 | 0.051 | — | 0.051 | (0.051 | ) | — | (0.051 | ) | — | |||||||||||||||||||||
| * | Annualized. |
| ** | Not Annualized. |
| (a) | Including reimbursements, waivers, and reductions. |
| (b) | Excluding reductions. Certain Portfolios have entered into varying arrangements with brokers who reduced a portion of the Portfolio’s expenses. |
| (c) | Excluding reimbursements, waivers, and reductions. |
| (d) | For the six months ended June 30, 2004 (Unaudited). |
| (e) | Certain prior year amounts have been reclassified to conform to current year presentation. |
| (1) | Effective January 1, 2001 the Select Investment Grade Income Fund and Government Bond Fund adopted the provisions of the AICPA Audit and Accounting Guide for Investment Companies and are amortizing premium and discount on debt securities using the daily effective yield method. The effect of this change for the year ended December 31, 2001 was a decrease in net investment income per share by $0.003 for Select Investment Grade Income Fund and a decrease in net investment income per share by $0.007 for Government Bond Fund, an increase in net realized and unrealized gains and losses per share by $0.003 for Select Investment Grade Income Fund and an increase in net realized and unrealized gains and losses per share by $0.007 for Government Bond Fund and a decrease in the ratio of net investment income to average net assets from 6.04% to 5.79% for Select Investment Grade Income Fund and a decrease in the ratio of net investment income to average net assets from 5.16% to 4.52% for Government Bond Fund. Per share data and ratio/supplemental data for periods prior to January 1, 2001 have not been restated to reflect this change in presentation. |
| (2) | Net investment income (loss) per share before reimbursement of fees by the investment advisor was $0.028 in 2003 and $0.029 in 2001 for Equity Index Fund. |
| (3) | The amount shown for a share outstanding does not correspond with the aggregate net gain on investments for the period due to the timing of sales and repurchases of Portfolio shares in relation to the fluctuating market values of the investments of the Portfolio. |
| (4) | Computed using average shares outstanding throughout the period. |
| (5) | Distributions from net realized gains are less than $.0005. |
See Notes to Financial Statements.
F-38
Table of Contents
ALLMERICA INVESTMENT TRUST
| Ratios/Supplemental Data | ||||||||||||||||||||||||||||||
| Ratios To Average Net Assets | ||||||||||||||||||||||||||||||
Year Ended December 31, | Net Asset Value End of Period | Total Return | Net Assets End of Period (000’s) | Net Investment Income | Operating Expenses | Management Fee | Portfolio Turnover Rate | |||||||||||||||||||||||
| (a) | (b) | (c) | Gross | Net | ||||||||||||||||||||||||||
Equity Index Fund | ||||||||||||||||||||||||||||||
2004(d) | $ | 2.515 | 3.17 | %** | $ | 616,176 | 1.17 | %* | 0.50 | %* | 0.51 | %* | 0.51 | %* | 0.27 | %* | 0.27 | %* | 1 | %** | ||||||||||
2003 | 2.453 | 27.83 | % | 666,455 | 1.37 | % | 0.45 | % | 0.50 | % | 0.50 | % | 0.28 | % | 0.28 | % | 23 | % | ||||||||||||
2002 | 1.944 | (22.22 | )% | 342,683 | 1.16 | % | 0.45 | % | 0.47 | % | 0.47 | % | 0.28 | % | 0.28 | % | 10 | % | ||||||||||||
2001 | 2.715 | (12.02 | )% | 517,315 | 1.02 | % | 0.32 | % | 0.34 | % | 0.34 | % | 0.28 | % | 0.28 | % | 21 | % | ||||||||||||
2000 | 3.299 | (9.03 | )% | 599,266 | 0.87 | % | 0.32 | % | 0.33 | % | 0.33 | % | 0.27 | % | 0.27 | % | 9 | % | ||||||||||||
1999 | 4.060 | 20.41 | % | 638,230 | 0.98 | % | 0.35 | % | 0.35 | % | 0.35 | % | 0.28 | % | 0.28 | % | 21 | % | ||||||||||||
Select Investment Grade Income Fund(1) | ||||||||||||||||||||||||||||||
2004(d) | $ | 1.085 | (0.08 | )%** | $ | 457,624 | 4.22 | %* | 0.64 | %* | 0.64 | %* | 0.64 | %* | 0.42 | %* | 0.42 | %* | 75 | %** | ||||||||||
2003 | 1.119 | 3.31 | % | 530,199 | 3.42 | % | 0.63 | % | 0.63 | % | 0.63 | % | 0.41 | % | 0.41 | % | 192 | % | ||||||||||||
2002 | 1.134 | 8.14 | % | 620,074 | 4.85 | % | 0.58 | % | 0.58 | % | 0.58 | % | 0.41 | % | 0.41 | % | 130 | % | ||||||||||||
2001 | 1.106 | 7.94 | % | 571,582 | 5.79 | % | 0.47 | % | 0.47 | % | 0.47 | % | 0.41 | % | 0.41 | % | 114 | % | ||||||||||||
2000 | 1.086 | 10.31 | % | 445,609 | 6.53 | % | 0.49 | % | 0.49 | % | 0.49 | % | 0.42 | % | 0.42 | % | 159 | % | ||||||||||||
1999 | 1.051 | (0.97 | )% | 240,541 | 6.22 | % | 0.50 | % | 0.50 | % | 0.50 | % | 0.43 | % | 0.43 | % | 75 | % | ||||||||||||
Government Bond Fund(1) | ||||||||||||||||||||||||||||||
2004(d) | $ | 1.077 | (0.47 | )%** | $ | 149,686 | 3.05 | %* | 0.72 | %* | 0.72 | %* | 0.72 | %* | 0.50 | %* | 0.50 | %* | 46 | %** | ||||||||||
2003 | 1.104 | 1.67 | % | 200,158 | 2.82 | % | 0.71 | % | 0.71 | % | 0.71 | % | 0.50 | % | 0.50 | % | 55 | % | ||||||||||||
2002 | 1.130 | 9.28 | % | 291,995 | 3.48 | % | 0.68 | % | 0.68 | % | 0.68 | % | 0.50 | % | 0.50 | % | 79 | % | ||||||||||||
2001 | 1.077 | 7.63 | % | 116,514 | 4.52 | % | 0.58 | % | 0.58 | % | 0.58 | % | 0.50 | % | 0.50 | % | 190 | % | ||||||||||||
2000 | 1.051 | 10.00 | % | 78,531 | 5.58 | % | 0.61 | % | 0.61 | % | 0.61 | % | 0.50 | % | 0.50 | % | 53 | % | ||||||||||||
1999 | 1.011 | 0.23 | % | 87,247 | 5.64 | % | 0.62 | % | 0.62 | % | 0.62 | % | 0.50 | % | 0.50 | % | 37 | % | ||||||||||||
| Money Market Fund | ||||||||||||||||||||||||||||||
2004(d) | $ | 1.000 | 0.32 | %** | $ | 307,193 | 0.64 | %* | 0.53 | %* | 0.53 | %* | 0.53 | %* | 0.31 | %* | 0.31 | %* | N/A | |||||||||||
2003 | 1.000 | 0.80 | % | 377,155 | 0.82 | % | 0.53 | % | 0.53 | % | 0.53 | % | 0.30 | % | 0.30 | % | N/A | |||||||||||||
2002 | 1.000 | 1.66 | % | 704,805 | 1.63 | % | 0.45 | % | 0.45 | % | 0.45 | % | 0.30 | % | 0.30 | % | N/A | |||||||||||||
2001 | 1.000 | 4.28 | % | 604,657 | 4.11 | % | 0.36 | % | 0.36 | % | 0.36 | % | 0.31 | % | 0.31 | % | N/A | |||||||||||||
2000 | 1.000 | 6.40 | % | 457,912 | 6.19 | % | 0.31 | % | 0.31 | % | 0.31 | % | 0.26 | % | 0.26 | % | N/A | |||||||||||||
1999 | 1.000 | 5.19 | % | 513,606 | 5.09 | % | 0.29 | % | 0.29 | % | 0.29 | % | 0.24 | % | 0.24 | % | N/A | |||||||||||||
F-39
Table of Contents
ALLMERICA INVESTMENT TRUST
NOTES TO FINANCIAL STATEMENTS (Unaudited)
1. ORGANIZATION
Allmerica Investment Trust (the “Trust”) is registered under the Investment Company Act of 1940, as amended (the “1940 Act”), as an open-end, diversified management investment company established as a Massachusetts business trust. The Trust is intended to serve as an investment medium for (i) variable life insurance policies and variable annuity contracts offered by insurance companies, (ii) certain qualified pension and retirement plans, as permitted by Treasury Regulations; and (iii) life insurance companies and advisers to the Portfolios and their affiliates. Allmerica Financial Corporation (“AFC”) has ceased all new sales of proprietary variable annuities and life insurance products. The Trust is comprised of nine managed investment portfolios. The accompanying financial statements and financial highlights are those of the Select Capital Appreciation, Select Value Opportunity, Select International Equity, Select Growth, Core Equity, Equity Index, Select Investment Grade Income, Government Bond and Money Market Funds (individually a “Portfolio”, collectively, the “Portfolios”).
2. SIGNIFICANT ACCOUNTING POLICIES
The preparation of financial statements in conformity with accounting principles generally accepted in the United States of America requires management to make estimates and assumptions at the date of the financial statements. Actual results could differ from those estimates.
The following is a summary of significant accounting policies followed by the Trust in the preparation of its financial statements:
Security Valuation: Equity securities which are traded on a recognized exchange (other than Nasdaq) are valued at the last quoted sales price available at the time of the closing of the New York Stock Exchange or, if there were no sales that day, at the mean of the closing bid and asked price. Securities listed or traded on Nasdaq are valued at the Nasdaq official closing price. Over-the-counter securities are valued at the last available price in the market prior to the time of valuation. Securities that are primarily traded on foreign exchanges generally are valued at the closing values of such securities on their respective exchanges. Corporate debt securities and debt securities of the U.S. Government and its agencies (other than short-term investments) are valued by an independent pricing service approved by the Board of Trustees which utilizes market quotations and transactions, quotations from dealers and various relationships among securities in determining value. If not valued by a pricing service, such securities are valued at prices obtained from independent brokers. Investments with prices that cannot be readily obtained are carried at fair value as determined in good faith under consistently applied procedures established by and under the supervision of the Board of Trustees. Short-term investments that mature in 60 days or less are valued at amortized cost. The investments of the Money Market Fund are valued utilizing the amortized cost valuation method, permitted in accordance with Rule 2a-7 under the 1940 Act. This method involves valuing a portfolio security initially at its cost and thereafter assuming a constant amortization to maturity of any discount or premium.
Forward Foreign Currency Contracts: The Select Capital Appreciation, Select International Equity and Select Growth Funds may enter into forward foreign currency contracts whereby the Portfolios agree to exchange a specific currency at a specific price at a future date in an attempt to hedge against fluctuations in the value of the underlying currency of certain portfolio instruments. Forward foreign currency contracts are valued at the daily forward exchange rate of the underlying currency with any fluctuations recorded as unrealized gains or losses. Gains or losses on the purchase or sale of forward foreign currency contracts having the same settlement date and broker are recognized on the date of offset, otherwise gains and losses are recognized on the settlement date.
The use of forward foreign currency contracts does not eliminate fluctuations in the underlying prices of the Portfolios, but it does establish a rate of exchange that can be achieved in the future. Although forward foreign currency contracts used for hedging purposes limit the risk of loss due to a decline in the value of the hedged currency, they also limit any potential gain that might result should the value of the currency increase. In addition, the Portfolios could be exposed to risks if the counterparties to the contracts are unable to meet the terms of their contracts.
F-40
Table of Contents
ALLMERICA INVESTMENT TRUST
NOTES TO FINANCIAL STATEMENTS (Unaudited) (Continued)
Foreign Currency Translation: Investment valuations, other assets and liabilities denominated in foreign currencies are translated each business day into U.S. dollars based upon current exchange rates. Purchases and sales of foreign investments and income and expenses are translated into U.S. dollars based upon exchange rates prevailing on the respective dates of such transactions. Net realized gains or losses on foreign currency transactions represent net gains or losses on sales and maturities of foreign currency contracts, disposition of foreign currencies, the difference between the amount of net investment income and withholding taxes accrued and the U.S. dollar amount actually received and paid, and gains or losses between the trade and settlement date on the purchases and sales of the securities. That portion of unrealized gains or losses on investments due to fluctuations in foreign currency exchange rates is not separately disclosed.
Security Transactions and Investment Income: Security transactions are recorded as of the trade date. Realized gains and losses from security transactions are determined on the basis of identified cost. Interest income, including amortization of premium and accretion of discount on securities, is accrued daily. Income distributions earned by the Portfolios from investments in certain investment companies are recorded as interest income in the accompanying financial statements. Dividend income is recorded on the ex-dividend date, except that certain dividends from foreign securities are recorded as soon as the Portfolios are informed of the ex-dividend date.
Federal Income Taxes: The Trust treats each Portfolio as a separate entity for Federal income tax purposes. Each Portfolio intends to continue to qualify as a “regulated investment company” under Subchapter M of the Internal Revenue Code of 1986, as amended. By so qualifying, each Portfolio will not be subject to Federal income taxes to the extent it distributes all of its taxable income and net realized gains, if any, for its fiscal year. In addition, by distributing during each calendar year substantially all of its net investment income, capital gains and certain other amounts, if any, each Portfolio will not be subject to Federal excise tax. Therefore, no Federal income tax provision is required. Withholding taxes on foreign dividend income and gains have been paid or provided for in accordance with the applicable country’s tax rules and rates.
Distributions to Shareholders: Dividends from net investment income are declared and reinvested daily for the Money Market Fund, declared and distributed quarterly for the Core Equity, Equity Index, Select Investment Grade Income and Government Bond Funds, and annually for the Select Capital Appreciation, Select Value Opportunity, Select International Equity and Select Growth Funds. All Portfolios declare and distribute all net realized capital gains, if any, at least annually. Distributions to shareholders are recorded on the ex-dividend date. Income and capital gains distributions are determined in accordance with income tax regulations. Differences between book basis and tax basis amounts are primarily due to differing book and tax treatments in the timing of the recognition of gains or losses, including “Post-OctoberLosses”, foreign currency gains and losses, and losses deferred due to wash sales and differing treatments for foreign currency transactions, amortization of premium and market discount, and non-taxable dividends. Permanent book and tax basis differences relating to shareholder distributions will result in reclassifications to paid in capital. Permanent book-tax differences, if any, are not included in ending undistributed net investment income for the purpose of calculating net investment income per share in the Financial Highlights, as applicable.
Futures Contracts: All Portfolios, except the Money Market Fund, may use futures contracts to manage their exposure to the stock and bond markets and to fluctuations in interest rates and currency values. Buying futures tends to increase a Portfolio’s exposure to the underlying instrument, while selling futures tends to decrease a Portfolio’s exposure to the underlying instrument or hedge other portfolio investments. Futures contracts involve, to varying degrees, risk of loss in excess of the futures variation margin, if any, reflected in each applicable Portfolio’s Statement of Assets and Liabilities. The underlying face amount at value of any open futures contracts at period end is shown in each applicable Portfolio’s portfolio of investments. The face amount reflects each contract’s exposure to the underlying instrument at period end. Losses may arise from changes in the value of the underlying instruments or if the counterparties do not perform under the terms of the contracts. Gains and losses are realized upon the expiration or closing of the futures contracts. Futures contracts are valued at the settlement price established each day by the board of trade or exchange on which they are traded.
Securities Lending: Each Portfolio, using Investors Bank & Trust Company (“IBT”) as its lending agent, may loan securities to brokers and dealers in exchange for negotiated lenders’ fees. These fees are disclosed as “Securities lending income” in the
F-41
Table of Contents
ALLMERICA INVESTMENT TRUST
NOTES TO FINANCIAL STATEMENTS (Unaudited) (Continued)
Statements of Operations. Each applicable Portfolio receives collateral against the loaned securities which must be maintained at not less than 102% of the market value of the loaned securities during the period of the loan. Collateral received is generally cash, and is invested in short term investments. Lending portfolio securities involves possible delays in receiving additional collateral or in the recovery of the securities or possible loss of rights in the collateral should the counterparty (borrower) not meet its obligations under the terms of the loan. Information regarding the value of the securities loaned and the value of the collateral at period end is included in a footnote at the end of each applicable Portfolio’s portfolio of investments.
Cash Accounts: From time to time the Portfolios may leave cash overnight in their account. IBT has been contracted on behalf of the Portfolios to sweep these moneys into a demand note account, which will pay interest equal to 75% of that day’s U.S. Treasury Bill rate back to the Portfolios.
Expenses: Expenses directly attributed to a portfolio are charged to the portfolio, while expenses which are attributable to more than one portfolio of the Trust are allocated based upon relative net assets among the respective Portfolios and one other affiliated investment company, Allmerica Securities Trust.
Forward Commitments: The Select Capital Appreciation, Select Investment Grade Income, Government Bond, and Money Market Funds may enter into contracts to purchase securities for a fixed price at a specified future date beyond customary settlement time (“forward commitments”). If the Portfolios do so, they will maintain cash or other liquid obligations having a value in an amount at all times sufficient to meet the purchase price. Forward commitments involve a risk of loss if the value of the security to be purchased declines prior to the settlement date. Although the Portfolios generally will enter into forward commitments with the intention of acquiring securities for their portfolios, they may dispose of a commitment prior to settlement if their Sub-Adviser deems it appropriate to do so.
Options: All Portfolios, except the Money Market Fund, may use options to manage its exposure to the stock and bond markets and to fluctuations in interest rates. Writing puts and buying calls tend to increase a Portfolio’s exposure to the underlying security. Buying puts and writing calls tend to decrease a Portfolio’s exposure to the underlying security. When a Portfolio writes a call or put option, an amount equal to the premium received is recorded as a liability and subsequently marked to market to reflect the current value of the option written. Premiums received from writing options which expire are treated as realized gains. Premiums received from writing options which are exercised or closed are added to the proceeds or offset against the amounts paid on the underlying security to determine the realized gain or loss. Realized gains and losses on written options are included in realized gains and losses on securities. Losses may arise from changes in the value of the underlying securities, if there is an illiquid secondary market for the contracts, or if the counterparties do not perform under the terms of the contracts. Exchange-traded options are valued using the last sale price or, if there were no sales that day, the last offering price. Options traded over-the-counter are valued using dealer-supplied valuations.
Repurchase Agreements: Each Portfolio may engage in repurchase agreement transactions with institutions that the Sub-Adviser has determined are creditworthy pursuant to guidelines established by the Trust’s Board of Trustees. Each Portfolio requires that the securities purchased in a repurchase agreement transaction be transferred to the Trust’s Custodian in a manner that is intended to enable the Portfolio to obtain those securities in the event of a counterparty default. The Sub-Adviser monitors the value of the securities, including accrued interest, daily to ensure that the value of the collateral equals or exceeds amounts due under the repurchase agreement. Repurchase agreement transactions involve certain risks in the event of default or insolvency of the counterparty, including possible delays or restrictions upon the Portfolio’s ability to dispose of the underlying securities, and a possible decline in the value of the underlying securities during the period while the Portfolio seeks to assert its rights.
F-42
Table of Contents
ALLMERICA INVESTMENT TRUST
NOTES TO FINANCIAL STATEMENTS (Unaudited) (Continued)
3. INVESTMENT MANAGEMENT, ADMINISTRATION, AND OTHER RELATED PARTY TRANSACTIONS
Management Fees: Allmerica Financial Investment Management Services, Inc. (the “Manager”), a wholly-owned subsidiary of Allmerica Financial Life Insurance and Annuity Company (“Allmerica Financial”), serves as investment manager and administrator to the Trust. Allmerica Financial is a wholly-owned subsidiary of AFC. Under the terms of the management agreement, the Portfolios pay a management fee, calculated daily and payable monthly, at an annual rate based upon the following fee schedules:
| Percentage of Average Daily Net Assets | ||||||||||||||||||
Portfolio | First $100,000,000 | Next $150,000,000 | Next $250,000,000 | Next $250,000,000 | Next $250,000,000 | Over $1,000,000,000 | ||||||||||||
Select Capital Appreciation Fund | 1.00 | % | 0.90 | % | 0.80 | % | 0.70 | % | 0.70 | % | 0.65 | % | ||||||
Select Value Opportunity Fund | 1.00 | % | 0.85 | % | 0.80 | % | 0.75 | % | 0.70 | % | 0.70 | % | ||||||
Select International Equity Fund | 1.00 | % | 0.90 | % | 0.85 | % | 0.85 | % | 0.85 | % | 0.85 | % | ||||||
Select Growth Fund | 0.85 | % | 0.85 | % | 0.80 | % | 0.75 | % | 0.70 | % | 0.70 | % | ||||||
Core Equity Fund | 0.60 | % | 0.60 | % | 0.55 | % | 0.50 | % | 0.45 | % | 0.45 | % | ||||||
Government Bond Fund | 0.50 | % | 0.50 | % | 0.50 | % | 0.50 | % | 0.50 | % | 0.50 | % | ||||||
Money Market Fund | 0.35 | % | 0.30 | % | 0.30 | % | 0.25 | % | 0.20 | % | 0.20 | % | ||||||
Portfolio | First $50,000,000 | Next $200,000,000 | Over $250,000,000 | ||||||
Equity Index Fund | 0.35 | % | 0.30 | % | 0.25 | % |
Portfolio | First $50,000,000 | Next $50,000,000 | Over $100,000,000 | ||||||
Select Investment Grade Income Fund | 0.50 | % | 0.45 | % | 0.40 | % |
The Manager has entered into Sub-Adviser Agreements for the management of the investments of each of the Portfolios. The Manager is solely responsible for the payment of all fees to the Sub-Advisers. The Sub-Advisers for each of the Portfolios are as follows:
Select Capital Appreciation Fund | T. Rowe Price Associates, Inc. (“T. Rowe Price”) | |
Select Value Opportunity Fund | Cramer Rosenthal McGlynn, LLC | |
Select International Equity Fund | Bank of Ireland Asset Management (U.S.) Limited | |
Select Growth Fund | GE Asset Management Incorporated (“GEAM”) | |
| Jennison Associates LLC (“Jennison”) | ||
Core Equity Fund | UBS Global Asset Management (Americas) Inc. (“UBS”) | |
| Goldman Sachs Asset Management, L.P. (“Goldman”) | ||
Equity Index Fund | Opus Investment Management, Inc. (wholly-owned subsidiary of AFC) | |
Select Investment Grade Income Fund | Opus Investment Management, Inc. | |
Government Bond Fund | Opus Investment Management, Inc. | |
Money Market Fund | Opus Investment Management, Inc. |
T. Rowe Price International Series, Inc., an investment company managed by an affiliate of T. Rowe Price, is currently used as an investment vehicle for certain insurance products sponsored by Allmerica Financial and First Allmerica Financial Life Insurance Company (“First Allmerica”), a wholly-owned subsidiary of Allmerica Financial. Effective April 30, 2004, GEAM assumed sub-adviser responsibilities from Putnam Investment Management, LLC (“Putnam”) for that portion of the Select Growth Fund that was independently managed by Putnam. GEAM and Jennison each independently manages its
F-43
Table of Contents
ALLMERICA INVESTMENT TRUST
NOTES TO FINANCIAL STATEMENTS (Unaudited) (Continued)
own portion of the Select Growth Fund. UBS and Goldman each independently manages its own portion of the Core Equity Fund.
Plan of Distribution and Service: The 12b-1 Plan permits the Portfolios to pay Allmerica Financial and First Allmerica for marketing and distribution expenses to support the sale and distribution of the Portfolios’ shares and the provision of services to maintain and retain accounts. The 12b-1 Plan authorizes payment of a distribution and service fee at an annual rate of up to 0.25% of each Portfolio’s average daily net assets. As directed by the Board of Trustees, each Portfolio pays a distribution fee at an annual rate of 0.15% of each Portfolio’s average daily net assets. For the six months ended June 30, 2004, total payments made to Allmerica Financial and First Allmerica by the Portfolios under the 12b-1 Plan amounted to $2,727,977.
Custodian, Fund Accounting, and Administrative Fees: IBT provides portfolio accounting and custody services to the Trust and receives fees and reimbursement of certain out-of-pocket expenses for its services from the Trust. The Manager has entered into an Administrative Services Agreement with IBT, whereby IBT performs certain administrative services for the Portfolios and is entitled to receive an administrative fee and reimbursement of certain out-of-pocket expenses. The Manager is solely responsible for the payment of the administrative fee to IBT. The Trust pays no salaries or compensation to any of its officers. Trustees who are not directors, officers or employees of the Trust or any investment adviser are reimbursed for their travel expenses in attending meetings of the Trustees, and receive quarterly meeting and retainer fees for their services. Such amounts are paid by the Trust.
4. REIMBURSEMENT OF EXPENSES AND WAIVER OF FEES
In the event normal operating expenses of each Portfolio, excluding taxes, interest, broker commissions, and extraordinary expenses, but including the management fee, exceed certain voluntary expense limitations as a percentage of average net assets, the Manager will voluntarily reimburse fees and any expenses in excess of the expense limitations. The Portfolios’ voluntary expense limitations are as follows:
Select Capital Appreciation Fund | 1.35 | % | |
Select Value Opportunity Fund* | 1.25 | % | |
Select International Equity Fund | 1.50 | % | |
Select Growth Fund** | 1.20 | % | |
Core Equity Fund | 1.20 | % | |
Equity Index Fund | 0.60 | % | |
Select Investment Grade Income Fund | 1.00 | % | |
Government Bond Fund | 1.00 | % | |
Money Market Fund | 0.60 | % |
Expense limitations may be removed or revised at any time after a Portfolio’s first fiscal year of operations without prior notice to existing shareholders.
| * | The Manager has also voluntarily agreed to limit its management fees to an annual rate of 0.90% of average daily net assets of the Select Value Opportunity Fund through December 31, 2004. |
| ** | The Manager has voluntarily agreed to waive that portion of the management fee of Select Growth Fund to the extent that the amount of the sub-adviser fee paid to GEAM is less than the amount that would have been paid to Putnam. For the period April 30, 2004 through June 30, 2004, this management fee waiver amounted to $32,610. |
5. REDUCTION OF EXPENSES
Certain Portfolios have entered into agreements with brokers whereby the brokers will rebate a portion of brokerage commissions. Such amounts earned by the Portfolios, under such agreements, are presented as a reduction of expenses in the Statements of Operations.
F-44
Table of Contents
ALLMERICA INVESTMENT TRUST
NOTES TO FINANCIAL STATEMENTS (Unaudited) (Continued)
6. SHARES OF BENEFICIAL INTEREST
The Trust’s Declaration of Trust authorizes the Trustees to issue an unlimited number of shares of beneficial interest for the Portfolios, each without a par value.
7. FOREIGN SECURITIES AND EMERGING MARKETS
All Portfolios except the Government Bond Fund may purchase securities of foreign issuers. The Money Market Fund may invest in only U.S. dollar denominated foreign securities. Investing in foreign securities involves special risks not typically associated with investing in securities of U.S. issuers. The risks include revaluation of currencies and future adverse political and economic developments. Moreover, securities of many foreign issuers and their markets may be less liquid and their prices more volatile than those of securities of comparable U.S. issuers.
Investing in emerging markets may involve special risks and considerations not typically associated with investing in the developed markets. These risks include revaluation of currencies, high rates of inflation, repatriation restrictions on income and capital, and future adverse political and economic developments. Moreover, securities issued in these markets may be less liquid, subject to government ownership controls, subject to delayed settlements, and their prices more volatile than those of comparable securities in the United States.
8. FINANCIAL INSTRUMENTS
Investing in certain financial instruments including futures and options transactions, and forward foreign currency contracts involves risks other than those reflected in the Statements of Assets and Liabilities. Risks associated with these instruments include the potential for an imperfect correlation between the movements in the price of the instruments and the price of the underlying securities and interest rates, an illiquid secondary market for the instruments or inability of counterparties to perform under terms of the contracts, and changes in the value of foreign currency relative to the U.S. dollar. The Select Capital Appreciation, Select International Equity and Select Growth Funds may enter into these forward contracts primarily to protect the Portfolio from adverse currency movement.
9. REORGANIZATIONS
Pursuant to separate Agreements and Plans of Reorganization (“Reorganizations”) approved by the Board of Trustees on January 7, 2003 and then approved by shareholders on March 27, 2003, each of the following Acquired Funds of the Trust were reorganized into the respective Acquiring Funds of the Trust after the close of business on the effective date shown. Each Reorganization was accomplished by a tax-free exchange of all of the assets and liabilities of the Acquired Fund for shares of the Acquiring Fund and by the distribution of such shares to the shareholders of the Acquired Fund, in complete liquidation of the Acquired Fund. The reorganizations qualified as tax-free reorganizations for federal income tax purposes with no gain or loss recognized to the Portfolios or the separate account level of shares.
Acquired Fund | Acquiring Fund | Effective Date | ||||
Reorganization #1 | Select Strategic Growth Fund | Select Growth Fund | April 17, 2003 | |||
Reorganization #2 | Select Emerging Markets Fund | Select International Equity Fund | April 30, 2003 | |||
Reorganization #3 | Select Growth and Income Fund | Equity Index Fund | April 25, 2003 | |||
Reorganization #4 | Select Aggressive Growth Fund | Select Growth Fund | April 17, 2003 | |||
Reorganization #5 | Select Strategic Income Fund | Select Investment Grade Income Fund | April 22, 2003 |
F-45
Table of Contents
ALLMERICA INVESTMENT TRUST
NOTES TO FINANCIAL STATEMENTS (Unaudited) (Continued)
Each Reorganization was accomplished as follows:
Reorganization #1: An exchange of 15,107,801 shares of Select Growth Fund for the 67,820,054 shares then outstanding (each valued at $0.262) of Select Strategic Growth Fund; whose net assets, including $8,264,448 of unrealized depreciation were combined with Select Growth Fund for total net assets after the reorganization of $601,471,129 (includes the net assets of Select Aggressive Growth Fund of Reorganization #4).
Reorganization #2: An exchange of 52,384,344 shares of Select International Equity Fund for the 70,465,156 shares then outstanding (each valued at $0.642) of Select Emerging Markets Fund; whose net assets, including $1,690,066 of unrealized appreciation were combined with Select International Equity Fund for total net assets after the reorganization of $344,940,863.
Reorganization #3: An exchange of 147,106,786 shares of Equity Index Fund for the 306,640,159 shares then outstanding (each valued at $0.953) of Select Growth and Income Fund; whose net assets, including $39,999,505 of unrealized depreciation were combined with Equity Index Fund for total net assets after the reorganization of $611,065,810.
Reorganization #4: An exchange of 220,257,679 shares of Select Growth Fund for the 281,013,367 shares then outstanding (each valued at $0.922) of Select Aggressive Growth Fund; whose net assets, including $14,734,409 of unrealized depreciation were combined with Select Growth Fund for total net assets after the reorganization of $601,471,129 (includes the net assets of Select Strategic Growth Fund of Reorganization #1).
Reorganization #5: An exchange of 125,882,319 shares of Select Investment Grade Income Fund for the 131,490,310 shares then outstanding (each valued at $1.085) of Select Strategic Income Fund; whose net assets, including $3,796,669 of unrealized appreciation were combined with Select Investment Grade Income Fund for total net assets after the reorganization of $674,124,396.
F-46
Table of Contents
ALLMERICA INVESTMENT TRUST
REGULATORY DISCLOSURES (Unaudited)
The performance data quoted represents past performance and the investment return and principal value of an investment will fluctuate so that an investor’s shares, when redeemed, may be worth more or less than their original cost.
An investment in the Money Market Fund is not insured or guaranteed by the Federal Deposit Insurance Corporation or any other government agency. Although the Portfolio seeks to preserve the value of your investment at a stable net asset value of $1.00 per share, it is possible to lose money by investing in the Portfolio.
Securities issued by some U.S. Government-sponsored entities, such as the Federal Home Loan Mortgage Corporation (Freddie Mac) and the Federal National Mortgage Association (Fannie Mae), are not backed by the full faith and credit of the U.S. Government. No assurances can be given that the U.S. Government would provide financial support to a U.S. Government-sponsored instrumentality if not obligated to do so.
This report and the financial statements contained herein are submitted for the general information of the shareholders of the Portfolios and are not authorized for distribution to prospective investors in the flexible premium variable life insurance or annuity products of Allmerica Financial Life Insurance and Annuity Company or First Allmerica Financial Life Insurance Company unless accompanied or preceded by effective prospectuses for the flexible premium variable life insurance or annuity products of Allmerica Financial Life Insurance and Annuity Company or First Allmerica Financial Life Insurance Company, and Allmerica Investment Trust which include important information related to charges and expenses.
Descriptions of the policies and procedures that the funds of Allmerica Investment Trust use to determine how to vote proxies relating to portfolio securities are available via the following methods:
| (i) | Without charge, upon request, by calling 1-800-533-7881; |
| (ii) | On each of the following websites: |
http://www.allmerica.com/afs/account/index.htm
http://www.allmerica.com/select/index.htm
http://www.allmerica.com/afs/asb/index.htm;
| (iii) | On the Securities and Exchange Commission website at http://www.sec.gov. |
Information regarding how the funds of Allmerica Investment Trust voted proxies relating to portfolio securities during the most recent 12-month period ended June 30 is available via the methods noted above.
CLIENT NOTICES (Unaudited)
This report includes financial statements for Allmerica Investment Trust. It does not include financial statements for the separate accounts that correspond to the insurance and/or annuity products included in this report.
The SEC has modified mailing requirements for annual reports to allow a single copy of this report to be delivered to customers who share the same last name and address. This will automatically apply to all customers. If you would prefer to receive your own copy, please notify us at the phone number listed on the back cover of this report.
F-47
Table of Contents
[GRAPHIC]
THE ALLMERICA FINANCIAL COMPANIES
The Hanover Insurance Company • Citizens Insurance Company of America • Citizens Management Inc.
Allmerica Financial Alliance Insurance Company • Allmerica Financial Benefit Insurance Company • AMGRO, Inc.
Financial Profiles, Inc. • VeraVest Investments, Inc. • VeraVest Investment Advisors, Inc. • Opus Investment Management, Inc.
First Allmerica Financial Life Insurance Company • Allmerica Financial Life Insurance and Annuity Company (all states except NY)
440 Lincoln Street, Worcester, Massachusetts 01653
www.allmerica.com
12260SAR (6/04) | 04-0081 |
Table of Contents
| Allmerica Financial | Semi-Annual Report | |
| June 30, 2004 | ||
| Allmerica Investment Trust | ||
• Money Market Fund | ||
| [GRAPHIC] | 2004 | |
[GRAPHIC]
Table of Contents
| 1 | ||
| 2 | ||
Financials | F-1 | |
For information on ordering additional copies of this report, see Client Notices on page F-10.
One or more Funds may not be available under the variable annuity or variable life insurance policy which you have chosen. Inclusion in this report of a Fund which is not available under your policy is not to be considered a solicitation.
Table of Contents
Dear Client:
The first half of 2004 brought mixed news for the global economy. In the United Kingdom, consumer and mortgage credit continued to grow at a brisk pace with minimal signs of inflation, as the jobless rate dropped further. Unemployment remained high in France and Germany, as signs of recovery were muted in mainland Europe. Fueled by exploding growth in China and India, many Asian economies performed well, led by Thailand, Singapore and Malaysia. Domestic oriented companies helped stimulate stronger than expected growth in Japan. European stock markets held up relatively well as Germany’s DAX Index rose 2.21%, England’s FTSE Index gained 1.85% and France’s CAC 40 Index was up 7.25%. Asian stock markets were mixed, as Japan’s Nikkei Average finished the period up 11.58%, while Hong Kong’s Hang Seng Index was lower by 0.29%.
The United States economy turned in a solid performance during the first six months of 2004. First quarter GDP came in at 3.9% and growth for the full period is expected to be in the same range. The long-awaited growth in jobs finally began to occur during the first half of the year. After starting slowly, non-farm payroll gains averaged over 200,000 per month in the second quarter, persuading many that a traditional economic recovery was under way. Consumer spending remained strong, industrial production ramped up and business investment increased, while core producer prices came in slightly higher than expected. Core inflation also edged higher during the period, partially as a result of the voracious demand for raw materials from China and other recovering economies. These and other strong economic statistics caused many analysts to conclude that the Federal Reserve Board would need to raise interest rates sooner, rather than later, in order to head off a rapid rise in inflation. In late June, these concerns were realized, as the Federal Reserve Board raised its target for the federal funds rate by 0.25%, to 1.25%. Gas prices at the pump climbed to over $2.00 a gallon, as oil prices rose significantly in the first quarter, then fell back slightly during the second quarter. Several analysts expressed concern that higher oil prices might dampen the surging domestic economy. U.S. securities markets finished the first six months of 2004 with small gains. The S&P 500® Index rose 3.44% and the Nasdaq Composite Index was higher by 2.22%. Bonds struggled as interest rates ticked higher. For the period, the Lehman Brothers Aggregate Bond Index managed a gain of only 0.15%.
Money market fund returns rose slightly during the first half of 2004, as short-term interest rates reacted to the Federal Reserve Board’s move. The Allmerica Investment Trust Money Market Fund continued its strong relative performance during the period, returning 0.32%, outperforming its benchmark, the Money Fund Report Averages: First Tier Taxable.
On behalf of the Board of Trustees,

John P. Kavanaugh
Chairman of the Board
Allmerica Investment Trust
1
Table of Contents
The Money Market Fund returned 0.32% for the first half of 2004, outperforming its benchmark, the Money Fund Report Averages: First Tier Taxable, which returned 0.19%.
The year started with mixed to weak economic data, heightened questions about job growth, and overhanging concerns about Iraq and terrorism. Things changed in April when the March non-farm payrolls number showed that an impressive 308,000 jobs were created. At its May meeting, the Federal Reserve Board signaled that it would likely raise the 1.00% federal funds rate by 25 basis points in the near future. Subsequently, economic data remained strong and inflation started to become a concern. At its June meeting, as expected, the Federal Reserve Board raised the federal funds rate to 1.25%. While reaction to the move was muted, the rate hike was confirmation that the Federal Reserve Board believed that the U.S. economy was headed back on the right track.
Within the fund, the investment sub-adviser continued to emphasize investments in floating-rate notes during the period. In anticipation of the Federal Reserve Board’s rate hike, the investment sub-adviser shortened average maturities from 70 days, on average, to the mid 50 day range, in order to better take advantage of a rising rate environment. The investment sub-adviser believes that the U.S. economy is back on solid footing. Expectations are that the Federal Reserve Board will stick to its measured pace of interest rate hikes and that the federal funds rate may climb to about 2.00% by year end. The investment sub-adviser plans to maintain a mid-range average maturity in the coming months to take advantage of these upcoming interest rate hikes.
The performance data quoted represents past performance. Past performance does not guarantee future results. The investment return and principal value of an investment will fluctuate so that an investor’s shares, when redeemed, may be worth more or less than their original cost. Current performance may be lower or higher than the performance data quoted. For information on the current month end performance of variable annuity and variable life insurance products, please call: (800) 533-7881. The performance data quoted is net of all fund operating expenses, but does not include variable insurance or variable annuity charges. If the performance data included the effect of these additional charges, it would have been lower.
Average Annual Total Returns
| 1 Year | 5 Year | 10 Year | ||||
Money Market Fund | 0.64% | 3.21% | 4.29% | |||
Money Fund Report Averages: First Tier Taxable | 0.39% | 2.69% | 3.80% | |||
Lipper Money Market Funds Average | 0.53% | 2.88% | 3.99% | |||
Average Yield as of June 30, 2004
Money Market Fund 7-Day Yield | 0.70% |
Growth of a $10,000 Investment Since 1994

The Money Market Fund is a portfolio of Allmerica Investment Trust. Portfolio composition will vary over time.
The Fund is neither insured nor guaranteed by the Federal Deposit Insurance Corporation or any other government agency. Although the Fund seeks to maintain a net asset value of $1.00 per share, it is possible to lose money by investing in the Fund.
Money Fund Report Averages: First Tier Taxable is published by iMoneyNet, Inc., an independent firm that tracks 2a-7 regulated money market funds on a yield, shareholder, asset size and portfolio allocation basis. The Lipper Money Market Funds Average is the average investment performance of funds within the money market category.
Investment Sub-Adviser
Opus Investment Management, Inc.
About the Fund
Seeks to maximize current income for investors while preserving capital and liquidity.
Portfolio Composition
As of June 30, 2004, the sector allocation of net assets was:
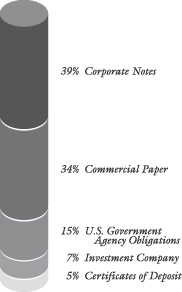
2
Table of Contents
Financials
Table of Contents
MONEY MARKET FUND
PORTFOLIO OF INVESTMENTS • June 30, 2004 (Unaudited)
| Par Value | Value (Note 2) | |||||
| U.S. GOVERNMENT AGENCY OBLIGATIONS - 14.7% | ||||||
| Fannie Mae - 7.2% | ||||||
| $ | 12,000,000 | 1.27%, 04/25/05 | $ | 11,995,170 | ||
| 5,000,000 | 1.36%, 05/03/05 | 4,995,304 | ||||
| 5,000,000 | 6.50%, 08/15/04 | 5,031,706 | ||||
| 22,022,180 | ||||||
| Federal Home Loan Bank - 7.5% | ||||||
| 6,000,000 | 1.25%, 03/29/05 | 6,000,000 | ||||
| 7,000,000 | 1.35%, 03/23/05 | 7,000,000 | ||||
| 10,000,000 | 1.50%, 01/07/05 | 10,000,000 | ||||
| 23,000,000 | ||||||
| Total U.S. Government Agency Obligations | 45,022,180 | |||||
| (Cost $45,022,180) | ||||||
| CORPORATE NOTES - 39.3% | ||||||
| Banks - 4.9% | ||||||
| 15,000,000 | Marshall & Ilsley Bank (a) | |||||
| 1.38%, 12/17/04 | 15,000,000 | |||||
| Banks - Foreign Banks & Branches - 4.4% | ||||||
| 11,000,000 | ABN Amro Bank NV (a) | |||||
| 1.27%, 12/30/04 | 10,999,235 | |||||
| 2,450,000 | National Bank of Canada | |||||
| 8.13%, 08/15/04 | 2,469,965 | |||||
| 13,469,200 | ||||||
| Diversified Financial Services - 28.4% | ||||||
| 4,000,000 | American Honda Finance Corp., MTN (a) | |||||
| 1.13%, 05/06/05 | 4,000,000 | |||||
| 7,864,000 | Caterpillar Financial Services Corp., MTN (a) | |||||
| 1.24%, 07/09/04 | 7,864,000 | |||||
| 4,180,000 | CIT Group, Inc. | |||||
| 7.13%, 10/15/04 | 4,252,072 | |||||
| 15,000,000 | Citigroup, Inc. (a) | |||||
| 1.30%, 10/22/04 | 15,009,524 | |||||
| 10,000,000 | Goldman Sachs Group, Inc. (a) | |||||
| 1.44%, 07/29/04 | 10,000,000 | |||||
| 12,000,000 | Merrill Lynch & Co., Inc., Series C, MTN (a) | |||||
| 1.19%, 02/17/05 | 12,000,000 | |||||
| 15,000,000 | Money Market Trust LLC (a) | |||||
| 1.18%, 06/03/05 | 15,000,000 | |||||
| 10,000,000 | Morgan Stanley (a) | |||||
| 1.36%, 11/15/04 | 10,000,000 | |||||
| 9,000,000 | National Rural Utilities Cooperative Finance Colonial Trust (a) | |||||
| 1.53%, 02/07/05 | 9,023,330 | |||||
| 87,148,926 | ||||||
| Retail - 1.6% | ||||||
| $ | 5,000,000 | Wal-Mart Stores, Inc. | ||||
| 6.55%, 08/10/04 | $ | 5,028,475 | ||||
| Total Corporate Notes | 120,646,601 | |||||
| (Cost $120,646,601) | ||||||
| COMMERCIAL PAPER (c) - 34.0% | ||||||
| Banks - 4.2% | ||||||
| 13,000,000 | Abbey National North America | |||||
| 1.21%, 10/20/04 | 12,951,499 | |||||
| Banks - Foreign Banks & Branches - 4.2% | ||||||
| 7,000,000 | Alliance & Leicester PLC (b) | |||||
| 1.25%, 10/21/04 | 6,972,778 | |||||
| 6,000,000 | Lloyds TSB Bank PLC | |||||
| 1.22%, 10/13/04 | 5,978,853 | |||||
| 12,951,631 | ||||||
| Diversified Financial Services - 23.5% | ||||||
| 12,088,000 | Barton Capital Corp. (b) | |||||
| 1.15%, 07/06/04 | 12,086,069 | |||||
| 7,000,000 | Blue Ridge Asset Funding (b) | |||||
| 1.07%, 07/02/04 | 6,999,792 | |||||
| 5,000,000 | High Peak Funding LLC (b) | |||||
| 1.12%, 07/13/04 | 4,998,133 | |||||
| 10,000,000 | High Peak Funding LLC (b) | |||||
| 1.13%, 07/06/04 | 9,998,431 | |||||
| 9,051,000 | Ivory Funding Corp. (b) | |||||
| 1.23%, 07/15/04 | 9,046,670 | |||||
| 10,000,000 | Newbury Funding (b) | |||||
| 1.10%, 07/13/04 | 9,996,334 | |||||
| 4,000,000 | Receivables Capital Corp. (b) | |||||
| 1.05%, 07/15/04 | 3,998,366 | |||||
| 15,000,000 | TransAmerica Asset Funding (b) | |||||
| 1.12%, 07/06/04 | 14,997,667 | |||||
| 72,121,462 | ||||||
| Electric - 2.1% | ||||||
| 6,500,000 | Boston Edison Co. | |||||
| 1.45%, 07/01/04 | 6,500,000 | |||||
| Total Commercial Paper | 104,524,592 | |||||
| (Cost $104,524,592) | ||||||
| CERTIFICATES OF DEPOSIT - 4.9% | ||||||
| 15,000,000 | Wells Fargo Bank NA | |||||
| 1.12%, 07/12/04 | 15,000,000 | |||||
| Total Certificates of Deposit | 15,000,000 | |||||
| (Cost $15,000,000) | ||||||
See Notes to Financial Statements.
F-1
Table of Contents
MONEY MARKET FUND
PORTFOLIO OF INVESTMENTS, Continued • June 30, 2004 (Unaudited)
| Shares | Value (Note 2) | ||||
| INVESTMENT COMPANIES - 6.8% | |||||
| 10,157,086 | Barclays Prime Money Market Fund | $ | 10,157,086 | ||
| 45,204 | Dreyfus Cash Management Plus Money Market Fund | 45,204 | |||
| 10,744,316 | One Group Institutional Prime Money Market Fund | 10,744,316 | |||
| Total Investment Companies | 20,946,606 | ||||
| (Cost $20,946,606) | |||||
| Total Investments - 99.7% | 306,139,979 | ||||
| (Cost $306,139,979) | |||||
| Net Other Assets and Liabilities - 0.3% | 1,052,711 | ||||
| Total Net Assets - 100.0% | $ | 307,192,690 | |||
| (a) | Variable rate security. The rate shown reflects rate in effect at period end. |
| (b) | Security exempt from registration under Rule 144A of the Securities Act of 1933. This security may be resold, in transactions exempt from registration, to qualified institutional buyers. At June 30, 2004, these securities amounted to $79,094,240 or 25.7% of net assets. These securities have been deemed to be liquid in accordance with procedures established by the Board of Trustees. |
| (c) | Effective yield at time of purchase. |
| MTN | Medium Term Note |
FEDERAL INCOME TAX INFORMATION (SEE NOTE 2)
At June 30, 2004, the aggregate cost of investment securities for tax purposes was $306,139,979.
See Notes to Financial Statements.
F-2
Table of Contents
ALLMERICA INVESTMENT TRUST
STATEMENT OF ASSETS AND LIABILITIES • June 30, 2004 (Unaudited)
| Money Market Fund | |||
ASSETS: | |||
Total investments at value (cost $306,139,979) | $ | 306,139,979 | |
Cash | 38,819 | ||
Receivable for shares sold | 486,327 | ||
Interest receivable | 715,081 | ||
Total Assets | 307,380,206 | ||
LIABILITIES: | |||
Management fee payable | 82,383 | ||
Distribution fee payable | 40,273 | ||
Trustees’ fees and expenses payable | 9,689 | ||
Payable for shares repurchased | 725 | ||
Accrued expenses and other payables | 54,446 | ||
Total Liabilities | 187,516 | ||
NET ASSETS | $ | 307,192,690 | |
NET ASSETS consist of: | |||
Paid-in capital | $ | 307,116,360 | |
Accumulated net realized gain on investments sold | 76,330 | ||
TOTAL NET ASSETS | $ | 307,192,690 | |
Shares of beneficial interest outstanding (unlimited authorization, no par value) | 307,117,986 | ||
NET ASSET VALUE, | |||
Offering and redemption price per share (Net Assets/Shares Outstanding) | $ | 1.000 | |
See Notes to Financial Statements.
F-3
Table of Contents
ALLMERICA INVESTMENT TRUST
STATEMENT OF OPERATIONS • For the Six Months Ended June 30, 2004 (Unaudited)
| Money Market Fund | ||||
INVESTMENT INCOME | ||||
Interest | $ | 1,988,349 | ||
EXPENSES | ||||
Management fees | 535,096 | |||
Distribution fees | 255,388 | |||
Custodian and Fund accounting fees | 49,633 | |||
Legal fees | 12,328 | |||
Audit fees | 15,987 | |||
Trustees’ fees and expenses | 7,630 | |||
Reports to shareholders | 12,210 | |||
Miscellaneous | 5,948 | |||
Total expenses | 894,220 | |||
NET INVESTMENT INCOME | 1,094,129 | |||
NET REALIZED LOSS ON INVESTMENTS | (40 | ) | ||
NET INCREASE IN NET ASSETS RESULTING FROM OPERATIONS | $ | 1,094,089 | ||
See Notes to Financial Statements.
F-4
Table of Contents
ALLMERICA INVESTMENT TRUST
STATEMENT OF CHANGES IN NET ASSETS
Money Market Fund | ||||||||
| Six Months Ended June 30, 2004 (Unaudited) | Year Ended December 31, 2003 | |||||||
NET ASSETS at beginning of period | $ | 377,154,527 | $ | 704,804,637 | ||||
INCREASE (DECREASE) IN NET ASSETS RESULTING FROM OPERATIONS: | ||||||||
Net investment income | 1,094,129 | 4,286,757 | ||||||
Net realized gain (loss) on investments sold | (40 | ) | 76,830 | |||||
Net increase in net assets resulting from operations | 1,094,089 | 4,363,587 | ||||||
DISTRIBUTIONS TO SHAREHOLDERS FROM: | ||||||||
Net investment income | (1,094,129 | ) | (4,286,757 | ) | ||||
Net realized gain on investments | — | (37,465 | ) | |||||
Total distributions | (1,094,129 | ) | (4,324,222 | ) | ||||
CAPITAL SHARE TRANSACTIONS: | ||||||||
Net proceeds from sales of shares | 65,919,107 | 181,842,312 | ||||||
Issued to shareholders in reinvestment of distributions | 1,094,129 | 4,324,222 | ||||||
Cost of shares repurchased | (136,975,033 | ) | (513,856,009 | ) | ||||
Net decrease from capital share transactions | (69,961,797 | ) | (327,689,475 | ) | ||||
Total decrease in net assets | (69,961,837 | ) | (327,650,110 | ) | ||||
NET ASSETS at end of period | $ | 307,192,690 | $ | 377,154,527 | ||||
OTHER INFORMATION: | ||||||||
Share transactions: | ||||||||
Sold | 65,919,107 | 181,842,312 | ||||||
Issued to shareholders in reinvestment of distributions | 1,094,129 | 4,324,222 | ||||||
Repurchased | (136,975,033 | ) | (513,856,009 | ) | ||||
Net decrease in shares outstanding | (69,961,797 | ) | (327,689,475 | ) | ||||
See Notes to Financial Statements.
F-5
Table of Contents
ALLMERICA INVESTMENT TRUST
FINANCIAL HIGHLIGHTS - For a Share Outstanding Throughout Each Period
Year Ended December 31, | Net Asset | Net | Dividends | Total | Net Asset | Ratios/Supplemental Data | ||||||||||||||||||||||||||
Total | Net | Ratios To Average Net Assets | ||||||||||||||||||||||||||||||
| Net Investment Income | Operating Expenses | Management Fee | ||||||||||||||||||||||||||||||
Money Market Fund | ||||||||||||||||||||||||||||||||
2004(4) | $ | 1.000 | $ | 0.003 | $ | (0.003 | ) | $ | (0.003 | ) | $ | 1.000 | 0.32 | %(2) | $ | 307,193 | 0.64 | %(1) | 0.53 | %(1) | 0.31 | %(1) | ||||||||||
2003 | 1.000 | 0.008 | (0.008 | ) | (0.008 | )(3) | 1.000 | 0.80 | % | 377,155 | 0.82 | % | 0.53 | % | 0.30 | % | ||||||||||||||||
2002 | 1.000 | 0.016 | (0.016 | ) | (0.016 | ) | 1.000 | 1.66 | % | 704,805 | 1.63 | % | 0.45 | % | 0.30 | % | ||||||||||||||||
2001 | 1.000 | 0.042 | (0.042 | ) | (0.042 | ) | 1.000 | 4.28 | % | 604,657 | 4.11 | % | 0.36 | % | 0.31 | % | ||||||||||||||||
2000 | 1.000 | 0.062 | (0.062 | ) | (0.062 | ) | 1.000 | 6.40 | % | 457,912 | 6.19 | % | 0.31 | % | 0.26 | % | ||||||||||||||||
1999 | 1.000 | 0.051 | (0.051 | ) | (0.051 | ) | 1.000 | 5.19 | % | 513,606 | 5.09 | % | 0.29 | % | 0.24 | % | ||||||||||||||||
| (1) | Annualized. |
| (2) | Not Annualized. |
| (3) | Includes distribution from net realized capital gains of less than $.0005. |
| (4) | For the six months ended June 30, 2004 (Unaudited). |
See Notes to Financial Statements.
F-6
Table of Contents
ALLMERICA INVESTMENT TRUST
NOTES TO FINANCIAL STATEMENTS (Unaudited)
1. ORGANIZATION
Allmerica Investment Trust (the “Trust”) is registered under the Investment Company Act of 1940, as amended (the “1940 Act”), as an open-end, diversified management investment company established as a Massachusetts business trust. The Trust is intended to serve as an investment medium for (i) variable life insurance policies and variable annuity contracts offered by insurance companies, (ii) certain qualified pension and retirement plans, as permitted by Treasury Regulations; and (iii) life insurance companies and advisers to the Portfolios and their affiliates. Allmerica Financial Corporation (“AFC”) has ceased all new sales of proprietary variable annuities and life insurance products. The Trust is comprised of nine managed investment portfolios (“Portfolios”). The accompanying financial statements and financial highlights are those of the Money Market Fund (the “Portfolio”).
2. SIGNIFICANT ACCOUNTING POLICIES
The preparation of financial statements in conformity with accounting principles generally accepted in the United States of America requires management to make estimates and assumptions at the date of the financial statements. Actual results could differ from those estimates.
The following is a summary of significant accounting policies followed by the Trust in the preparation of its financial statements:
Security Valuation: Securities of the Portfolio are valued utilizing the amortized cost valuation method, permitted in accordance with Rule 2a-7 under the 1940 Act. This method involves valuing a portfolio security initially at its cost and thereafter assuming a constant amortization to maturity of any discount or premium.
Security Transactions and Investment Income: Security transactions are recorded as of the trade date. Realized gains and losses from security transactions are determined on the basis of identified cost. Interest income, including amortization of premium and accretion of discount on securities, is accrued daily. Income distributions earned by the Portfolio from investments in certain investment companies are recorded as interest income in the accompanying financial statements.
Federal Income Taxes: The Trust treats each Portfolio as a separate entity for Federal income tax purposes. The Portfolio intends to continue to qualify as a “regulated investment company” under Subchapter M of the Internal Revenue Code of 1986, as amended. By so qualifying, the Portfolio will not be subject to Federal income taxes to the extent it distributes all of its taxable income and net realized gains, if any, for its fiscal year. In addition, by distributing during each calendar year substantially all of its net investment income, capital gains and certain other amounts, if any, the Portfolio will not be subject to Federal excise tax. Therefore, no Federal income tax provision is required.
Distributions to Shareholders: Dividends from net investment income are declared and reinvested daily for the Portfolio. The Portfolio declares and distributes all net realized capital gains, if any, at least annually. Distributions to shareholders are recorded on the ex-dividend date.
Expenses: Expenses directly attributed to a portfolio are charged to the portfolio, while expenses which are attributable to more than one portfolio of the Trust are allocated based upon relative net assets among the respective Portfolios and one other affiliated investment company, Allmerica Securities Trust.
Forward Commitments: The Portfolio may enter into contracts to purchase securities for a fixed price at a specified future date beyond customary settlement time (“forward commitments”). If the Portfolio does so, it will maintain cash or other liquid obligations having a value in an amount at all times sufficient to meet the purchase price. Forward commitments involve a risk of loss if the value of the security to be purchased declines prior to the settlement date. Although the Portfolio generally will enter into forward commitments with the intention of acquiring securities for its portfolio, it may dispose of a commitment prior to settlement if its Sub-Adviser deems it appropriate to do so.
F-7
Table of Contents
ALLMERICA INVESTMENT TRUST
NOTES TO FINANCIAL STATEMENTS (Unaudited) (Continued)
Repurchase Agreements: The Portfolio may engage in repurchase agreement transactions with institutions that the Sub-Adviser has determined are creditworthy pursuant to guidelines established by the Trust’s Board of Trustees. The Portfolio requires that the securities purchased in a repurchase agreement transaction be transferred to the Trust’s Custodian in a manner that is intended to enable the Portfolio to obtain those securities in the event of a counterparty default. The Sub-Adviser monitors the value of the securities, including accrued interest, daily to ensure that the value of the collateral equals or exceeds amounts due under the repurchase agreement. Repurchase agreement transactions involve certain risks in the event of default or insolvency of the counterparty, including possible delays or restrictions upon the Portfolio’s ability to dispose of the underlying securities, and a possible decline in the value of the underlying securities during the period while the Portfolio seeks to assert its rights.
3. INVESTMENT MANAGEMENT, ADMINISTRATION, AND OTHER RELATED PARTY TRANSACTIONS
Management Fees: Allmerica Financial Investment Management Services, Inc. (the “Manager”), a wholly-owned subsidiary of Allmerica Financial Life Insurance and Annuity Company (“Allmerica Financial”), serves as investment manager and administrator to the Trust. Allmerica Financial is a wholly-owned subsidiary of AFC. Under the terms of the management agreement, the Portfolio pays a management fee, calculated daily and payable monthly, at annual rates of 0.35% for the first $100,000,000 in average daily net assets, 0.30% for the next $400,000,000 in average daily net assets, 0.25% for the next $250,000,000 in average daily net assets, and 0.20% for average daily net assets in excess of $750,000,000.
The Manager has entered into a Sub-Adviser Agreement for the management of the investments of the Portfolio. The Manager is solely responsible for the payment of all fees to the Sub-Adviser. The Sub-Adviser for the Portfolio is Opus Investment Management, Inc., a wholly-owned subsidiary of AFC.
Plan of Distribution and Service: The 12b-1 Plan permits the Portfolio to pay Allmerica Financial and First Allmerica Financial Life Insurance Company, a wholly-owned subsidiary of Allmerica Financial, for marketing and distribution expenses to support the sale and distribution of the Portfolio’s shares and the provision of services to maintain and retain accounts. The 12b-1 Plan authorizes payment of a distribution and service fee at an annual rate of up to 0.25% of the Portfolio’s average daily net assets. As directed by the Board of Trustees, the Portfolio pays a distribution fee at an annual rate of 0.15% of the Portfolio’s average daily net assets.
Custodian, Fund Accounting, and Administrative Fees: Investors Bank & Trust Company (“IBT”) provides portfolio accounting and custody services to the Trust and receives fees and reimbursement of certain out-of-pocket expenses for its services from the Trust. The Manager has entered into an Administrative Services Agreement with IBT, whereby IBT performs certain administrative services for the Portfolio and is entitled to receive an administrative fee and reimbursement of certain out-of-pocket expenses. The Manager is solely responsible for the payment of the administrative fee to IBT. The Trust pays no salaries or compensation to any of its officers. Trustees who are not directors, officers or employees of the Trust or any investment adviser are reimbursed for their travel expenses in attending meetings of the Trustees, and receive quarterly meeting and retainer fees for their services. Such amounts are paid by the Trust.
4. REIMBURSEMENT OF EXPENSES AND WAIVER OF FEES
In the event normal operating expenses, excluding taxes, interest, broker commissions, and extraordinary expenses, but including the management fee, exceed 0.60% of average net assets, the Manager will voluntarily reimburse fees and any expenses in excess of the expense limitation. Expense limitations may be removed or revised at any time after the Portfolio’s first fiscal year of operations without prior notice to existing shareholders.
5. SHARES OF BENEFICIAL INTEREST
The Trust’s Declaration of Trust authorizes the Trustees to issue an unlimited number of shares of beneficial interest for the Portfolio, each without a par value.
F-8
Table of Contents
ALLMERICA INVESTMENT TRUST
NOTES TO FINANCIAL STATEMENTS (Unaudited) (Continued)
6. FOREIGN SECURITIES
The Portfolio may invest in only U.S. dollar denominated foreign securities. Investing in foreign securities involves special risks not typically associated with investing in securities of U.S. issuers. The risks include future adverse political and economic developments. Moreover, securities of many foreign issuers and their markets may be less liquid and their prices more volatile than those of securities of comparable U.S. issuers.
F-9
Table of Contents
ALLMERICA INVESTMENT TRUST
REGULATORY DISCLOSURES (Unaudited)
The performance data quoted represents past performance and the investment return and principal value of an investment will fluctuate so that an investor’s shares, when redeemed, may be worth more or less than their original cost.
An investment in the Money Market Fund is not insured or guaranteed by the Federal Deposit Insurance Corporation or any other government agency. Although the Portfolio seeks to preserve the value of your investment at a stable net asset value of $1.00 per share, it is possible to lose money by investing in the Portfolio.
Securities issued by some U.S. Government-sponsored entities, such as the Federal Home Loan Mortgage Corporation (Freddie Mac) and the Federal National Mortgage Association (Fannie Mae), are not backed by the full faith and credit of the U.S. Government. No assurances can be given that the U.S. Government would provide financial support to a U.S. Government-sponsored instrumentality if not obligated to do so.
This report and the financial statements contained herein are submitted for the general information of the shareholders of the Portfolio and are not authorized for distribution to prospective investors in the flexible premium variable life insurance or annuity products of Allmerica Financial Life Insurance and Annuity Company or First Allmerica Financial Life Insurance Company unless accompanied or preceded by effective prospectuses for the flexible premium variable life insurance or annuity products of Allmerica Financial Life Insurance and Annuity Company or First Allmerica Financial Life Insurance Company and Allmerica Investment Trust which include important information related to charges and expenses.
During the most recent 12-month period ended June 30, the Money Market Fund did not vote proxies relating to its portfolio securities because the Portfolio invests exclusively in non-voting securities.
CLIENT NOTICES (Unaudited)
This report includes financial statements for the Money Market Fund of Allmerica Investment Trust. It does not include financial statements for the separate accounts that correspond to the insurance and/or annuity products included in this report.
The SEC has modified mailing requirements for annual reports to allow a single copy of this report to be delivered to customers who share the same last name and address. This will automatically apply to all customers. If you would prefer to receive your own copy, please notify us at the phone number listed on the back cover of this report.
F-10
Table of Contents
[GRAPHIC]
THE ALLMERICA FINANCIAL COMPANIES
The Hanover Insurance Company • Citizens Insurance Company of America • Citizens Management Inc.
Allmerica Financial Alliance Insurance Company • Allmerica Financial Benefit Insurance Company • AMGRO, Inc.
Financial Profiles, Inc. • VeraVest Investments, Inc. • VeraVest Investment Advisors, Inc. • Opus Investment Management, Inc.
First Allmerica Financial Life Insurance Company • Allmerica Financial Life Insurance and Annuity Company (all states except NY)
440 Lincoln Street, Worcester, Massachusetts 01653
www.allmerica.com
11129SAR (6/04) | 04-0081 |
Table of Contents
| Item 2. | Code of Ethics |
Not Applicable
| Item 3. | Audit Committee Financial Expert |
Not Applicable
| Item 4. | Principal Accountant Fees and Services |
Not Applicable
| Item 5. | Audit Committee of Listed Registrants |
Not Applicable
| Item 6. | Schedule of Investments |
Not Applicable
| Item 7. | Disclosure of Proxy Voting Policies and Procedures for Closed-End Management Investment Companies |
Not Applicable
| Item 8. | Purchases of Equity Securities by Closed-End Management Investment Company and Affiliated Purchasers |
Not Applicable
| Item 9. | Submission of Matters to a Vote of Security Holders |
Below are procedures by which shareholders may recommend nominees to the Board of Trustees.
Procedures for Shareholders to Submit Nominee Candidates for
Allmerica Investment Trust and Allmerica Securities Trust
(As of February 12, 2004)
A Trust shareholder must follow the following procedures in order to properly submit a nominee recommendation for the Committee’s consideration.
| 1. | The shareholder must submit any such recommendation (a “Shareholder Recommendation”) in writing to: Governance Committee Chair, [insert name of Trust], c/o Secretary, 440 Lincoln Street, Mail Stop N440, Worcester, MA 01653. |
| 2. | With respect to Allmerica Securities Trust, the Shareholder Recommendation must be delivered to or mailed and received at the address above not less than forty-five (45) calendar days nor more than seventy-five (75) calendar days prior to the date of the Board or shareholder meeting at which the nominee would be elected. |
| 3. | The Shareholder Recommendation must include: (i) a statement in writing setting forth (A) the name, age, date of birth, business address, residence address and nationality of the person recommended by the shareholder (the “candidate”); (B) the class or series and |
Table of Contents
number of all shares of the Trust or series thereof owned of record or beneficially by the candidate, as reported to such shareholder by the candidate; (C) any other information regarding the candidate called for with respect to director nominees by paragraphs (a), (d), (e) and (f) of Item 401 of Regulation S-K or paragraph (b) of Item 22 of Rule 14a-101 (Schedule 14A) under the Securities Exchange Act of 1934, as amended (the “Exchange Act”), adopted by the Securities and Exchange Commission (or the corresponding provisions of any regulation or rule subsequently adopted by the Securities and Exchange Commission or any successor agency applicable to the Trust); (D) any other information regarding the candidate that would be required to be disclosed if the candidate were a nominee in a proxy statement or other filing required to be made in connection with solicitation of proxies for election of Trustees or directors pursuant to Section 14 of the Exchange Act and the rules and regulations promulgated thereunder; and (E) whether the recommending shareholder believes that the candidate is or will be an “interested person” of the Trust (as defined in the Investment Company Act of 1940, as amended) and, if not an “interested person,” information regarding the candidate that will be sufficient for the Trust to make such determination; (ii) the written and signed consent of the candidate to be named as a nominee and to serve as a Trustee if elected; (iii) the recommending shareholder’s name as it appears on the Trust’s books; (iv) the class or series and number of all shares of the Trust or series thereof owned beneficially and of record by the recommending shareholder; and (v) a description of all arrangements or understandings between the recommending shareholder and the candidate and any other person or persons (including their names) pursuant to which the recommendation is being made by the recommending shareholder. In addition, the Committee may require the candidate to furnish such other information as it may reasonably require or deem necessary to determine the eligibility of such candidate to serve on the Board. |
Originally Adopted: May 12, 1998
Revised: February 12, 2004
| Item 10. | Controls and Procedures |
| (a) | The registrant’s principal executive and principal financial officers have concluded that, based on their evaluation of the effectiveness of the registrant’s disclosure controls and procedures (as defined in Rule 30a-3(c) under the Investment Company Act of 1940) as of a date within 90 days of the filing date of this report on Form N-CSR, such disclosure controls and procedures provide reasonable assurances that material information relating to the registrant is made known to them by the appropriate persons. |
| (b) | Changes to internal control over financial reporting: Not Applicable |
| Item 11. | Exhibits |
| (a) | (1) Not Applicable |
| (2) | Separate certifications by the registrant’s principal executive officer and principal financial officer, pursuant to Section 302 of the Sarbanes-Oxley Act of 2002 and as required by Rule 30a-2(a) under the Investment Company Act of 1940, are attached hereto as Exhibit A2. |
| (3) | Not Applicable |
| (b) | A certification by the registrant’s principal executive officer and principal financial officer, pursuant to Section 906 of the Sarbanes-Oxley Act of 2002 and as required by Rule 30a-2(b) under the Investment Company Act of 1940 is attached hereto as Exhibit B. |
Table of Contents
Signatures
Pursuant to the requirements of the Securities Exchange Act of 1934 and the Investment Company Act of 1940, the registrant has duly caused this report to be signed on its behalf by the undersigned, thereunto duly authorized.
| Allmerica Investment Trust | ||
By: | /s/ John P. Kavanaugh | |
John P. Kavanaugh President and Chairman | ||
Date: August 19, 2004
Pursuant to the requirements of the Securities Exchange Act of 1934 and the Investment Company Act of 1940, this report has been signed below by the following persons on behalf of the registrant and in the capacities and on the dates indicated.
By: | /s/ John P. Kavanaugh | |
John P. Kavanaugh President and Chairman | ||
Date: August 19, 2004
By: | /s/ Paul T. Kane | |
Paul T. Kane Assistant Vice President and Treasurer (Principal Accounting Officer and | ||
Date: August 19, 2004