Table of Contents
UNITED STATES
SECURITIES AND EXCHANGE COMMISSION
Washington, D.C. 20549
FORM N-CSR
CERTIFIED SHAREHOLDER REPORT OF REGISTERED
MANAGEMENT INVESTMENT COMPANIES
Investment Company Act file number 811-04138
Allmerica Investment Trust
(Name of Registrant)
440 Lincoln Street
Worcester, Massachusetts 01653
(Address of Principal Executive Offices)
Sheila B. St. Hilaire, Trust Secretary
Allmerica Financial
440 Lincoln Street
Worcester, MA 01653
(Name and Address of Agent for Service)
Registrant’s Telephone Number, including Area Code: (508) 855-1000
Date of Fiscal Year End: December 31
Date of Reporting Period: June 30, 2005
Table of Contents
| Item 1. | Reports to Stockholders |
The following is a copy of the report transmitted to stockholders pursuant to Rule 30e-1 under the Investment Company Act of 1940:
Allmerica Investment Trust
Semi-Annual Report
June 30, 2005
Allmerica Investment Trust - Money Market Fund
Semi-Annual Report
June 30, 2005
Table of Contents

Table of Contents
| 1 | ||
| 2 | ||
| 3 | ||
| 4 | ||
| 5 | ||
| 6 | ||
| 7 | ||
| 8 | ||
| 9 | ||
| 10 | ||
Expense Examples | F-1 | |
Financials | F-2 | |
Regulatory Disclosures | F-57 | |
One or more Funds may not be available under the variable annuity or variable life insurance policy which you have chosen. Inclusion in this report of a Fund which is not available under your policy is not to be considered a solicitation.
Table of Contents
Dear Client:
Global economies generally struggled to advance during the first half of 2005. During the period, the Paris-based Organization for Economic Cooperation and Development (OECD) lowered its forecast for 2005 global economic growth to 2.6% from 2.9%. Unemployment remained high in much of the European Union, especially in France and Germany. The OECD reduced its 2005 growth forecast for Europe to 1.2% from an already low 1.9%. Still, the major European stock markets appeared to ignore the economic news as France’s CAC 40 index gained more than 10.0%, Germany’s Xetra DAX index rose almost 8.0% and Britain’s FTSE 100 index was higher by over 6.0%. Japan’s economy also strained to expand, as slowing exports and high oil prices took their toll. The Nikkei Stock Average managed a gain of about 1.0% for the first half of the year, while the OECD reduced Japan’s forecast for full year economic growth to 1.5% from 1.9%. China’s economy continued to expand during the first half of 2005, solidifying its position as an emerging engine of global economic growth. For the period, the MSCI EAFE Index was down 0.85%.
The United States economy continued to perform well during the first half of 2005. GDP grew at an annualized rate of 3.8% in the first quarter and the OECD forecast for full year economic growth was raised to 3.6% from 3.3%. Job creation was sporadic, but high enough to sustain moderate economic growth. Oil prices surged and labor costs edged higher, but many economists continued to view longer-term inflationary pressures as well contained. Consumer confidence reached a three year high, as income and spending continued to improve. The Federal Reserve Board increased interest rates nine times over the last twelve months, moving the target federal funds rate from 1.00% to 3.25%, as of the end of June. Long-term interest rates have stubbornly refused to follow short-term rates higher, however, implying uncertainty about the direction of the economy. Low mortgage rates continued to drive the housing market in most parts of the country. Still, low financing rates were not enough to spur domestic auto sales, as U.S. automakers continued to lose ground to foreign manufacturers. U.S. stock markets were lower during the period, as the S&P 500® Index moved down almost 1.0% and the Nasdaq Composite Index lost over 5.0%. The bond market proved more resilient, as the Lehman Brothers Aggregate Bond Index gained about 2.5%.
In a challenging market for both domestic and international stocks, the S&P 500® Index and the MSCI EAFE Index were negative for the first half of 2005, while the Allmerica Investment Trust stock funds had mixed results. The Select Capital Appreciation Fund gained about 1.6%, while the remaining stock funds had negative returns. The Select Growth Fund and the Select International Equity Fund performed better than their benchmarks. All three fixed income portfolios had positive returns, with the Government Bond Fund and the Money Market Fund each exceeding its benchmark.
On behalf of the Board of Trustees,

John P. Kavanaugh
Chairman of the Board
Allmerica Investment Trust
1
Table of Contents
Select Capital Appreciation Fund
The Select Capital Appreciation Fund returned 1.62% for the first half of 2005, underperforming its benchmark, the Russell Midcap Index, which returned 3.90%.
Most major U.S. stock indexes struggled in the first half of 2005, but mid-cap stocks generated a modest gain. Stock selection and the impact of sector weightings were generally favorable, but the fund’s Consumer Discretionary and Health Care holdings detracted. The Information Technology, Energy and Telecommunications Services sectors aided returns. Strong stock selection in Communications and Electronic Equipment companies were the primary drivers of relative performance. High oil prices provided a tailwind for Energy stocks. As oil companies spent at higher levels, demand for equipment and services increased. Good stock selection and an overweight in oil and gas producers boosted relative performance. Wireless Services were the source of relative strength in the Telecom sector as continued subscriber growth and industry consolidation benefited the fund’s holdings.
The Consumer Discretionary sector lagged due to weakness in household durables, retail and hotels, restaurant and leisure positions. High gas prices continued to hurt lower income consumers, the target of some of the fund’s retail holdings. Most notably, Family Dollar struggled on margin pressure and tough competition from other discount retailers. Health Care positions weighed on relative performance, primarily due to stock selection in pharmaceuticals. Earnings misses led to weakness in the fund’s generic pharmaceutical holdings, and safety concerns over Elan’s multiple sclerosis drug caused the stock to be the largest detractor in the period. An underweight in the strong Health Care Services industry also hampered relative results.
The Investment Sub-Adviser expects companies with consistent earnings and cash flow growth to be rewarded as the economic recovery matures.
The comments above are based on information provided by the Investment Sub-Adviser for the period indicated.
| Investment Sub-Adviser | About the Fund | |
| T. Rowe Price Associates, Inc. | Seeks long-term growth of capital by investing primarily in medium sized companies whose earnings are expected to grow at a faster rate than that of the average company. | |
Average Annual Total Returns
| 1 Year | 5 Year | 10 Year | ||||
Select Capital Appreciation Fund | 11.76% | 5.68% | 11.78% | |||
Russell Midcap Index | 17.11% | 7.34% | 12.90% | |||
Lipper Mid-Cap Growth Funds Average | 8.59% | (5.24)% | 8.59% | |||
Growth of a $10,000 Investment Since 1995
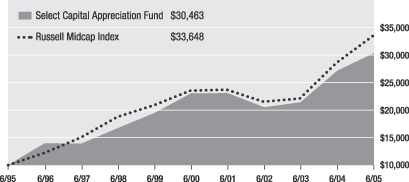
The Select Capital Appreciation Fund is a portfolio of Allmerica Investment Trust.
The Russell Midcap Index measures the performance of the 800 smallest companies in the Russell 1000 Index. The Lipper Mid-Cap Growth Funds Average is a non-weighted average of funds within the mid-cap growth investment objective.
Performance prior to 4/1/98 is that of a prior Sub-Adviser.
The performance data quoted represents past performance. Past performance does not guarantee future results. The investment return and principal value of an investment will fluctuate so that an investor’s shares, when redeemed, may be worth more or less than their original cost. Current performance may be lower or higher than the performance data quoted. For information on the current month end performance of variable annuity and variable life insurance products, please call: (800) 533-7881. The performance data quoted is net of all fund operating expenses, but does not include variable insurance or variable annuity charges. If the performance data included the effect of these additional charges, it would have been lower.
2
Table of Contents
The Select Value Opportunity Fund returned (0.18)% for the first half of 2005, underperforming its benchmark, the Russell 2500 Value Index, which returned 3.09%.
Major contributors to performance during the period included Goodrich Corporation, Arris Group, Questar Corporation and St. Joe Company. Shares of Goodrich have benefited from an accelerating demand recovery in the commercial aerospace market, driven by aircraft orders from developing economies such as India and China. Shares of telecom equipment company Arris appreciated significantly, as cable companies accelerated their rollout of VOIP telephone services using Arris’s equipment. Wall Street began to recognize the value in Questar’s exploration and production assets in 2005, as new management focused on the non-regulated side of the business. Shares of The St. Joe Company rose over 20% in the second quarter as the largest landowner in the state of Florida continued to execute its strategy of increasing the value of its landholdings through innovative residential community development.
Detractors from performance included Cytec Industries, Dollar Tree Stores, Acuity Brands, and Manpower. The temporary soft patch in the economy resulted in the underperformance of many cyclical stocks, including Cytec Industries. The older, smaller locations of Dollar Tree Stores dragged down overall results. Acuity Brands, a leading manufacturer of commercial and industrial lighting fixtures and specialty chemicals products, announced an earnings disappointment and a significant acceleration in its restructuring program under the leadership of its new CEO. Manpower was hurt somewhat by mid-cycle deceleration in worldwide economic growth and concerns over currency translation.
Going forward, the Investment Sub-Adviser intends to remain focused on identifying companies who may be skillful stewards of the fund’s capital.
The comments above are based on information provided by the Investment Sub-Adviser for the period indicated.
| Investment Sub-Adviser | About the Fund | |
| Cramer Rosenthal McGlynn, LLC | Seeks long-term growth of capital by investing primarily in small and mid-sized companies whose securities may be undervalued. | |
Average Annual Total Returns
| 1 Year | 5 Year | 10 Year | ||||
Select Value Opportunity Fund | 11.27% | 13.02% | 13.38% | |||
Russell 2500 Value Index | 17.44% | 15.83% | 14.69% | |||
Lipper Mid-Cap Value Funds Average | 12.77% | 13.10% | 12.68% | |||
Growth of a $10,000 Investment Since 1995
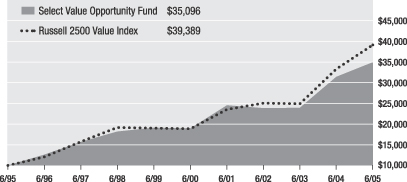
The Select Value Opportunity Fund is a portfolio of Allmerica Investment Trust.
The Russell 2500 Value Index measures the performance of those Russell 2500 companies with lower price-to-book ratios and lower forecasted growth values. The Lipper Mid-Cap Value Funds Average is a non-weighted average of funds within the mid-cap value investment objective.
Performance prior to 1/1/97 is that of a prior Sub-Adviser.
The performance data quoted represents past performance. Past performance does not guarantee future results. The investment return and principal value of an investment will fluctuate so that an investor’s shares, when redeemed, may be worth more or less than their original cost. Current performance may be lower or higher than the performance data quoted. For information on the current month end performance of variable annuity and variable life insurance products, please call: (800) 533-7881. The performance data quoted is net of all fund operating expenses, but does not include variable insurance or variable annuity charges. If the performance data included the effect of these additional charges, it would have been lower.
3
Table of Contents
Select International Equity Fund
The Select International Equity Fund returned (0.48)% for the first half of 2005, outperforming its benchmark, the MSCI EAFE Index, which returned (0.85)%.
In the Grantham, Mayo, Van Otterloo & Co. LLC portion of the fund, sector selection was positive, largely due to the portfolio’s overweights to the Utilities, Energy and Health Care sectors, and an underweight to the weak Telecommunications sector. Country allocation had a small positive impact. The portfolio benefited from exposure to the Netherlands, Austria and Norway, but was hurt by underweights to France and Switzerland, and an overweight to Japan. Stock selection was strong, particularly in Europe and Japan. Owning shares of European oil companies such as OMV and ENI added value. Canadian Natural Resources, GlaxoSmithKline and Norsk Hydro were positive contributors. On the negative side, positions in Schering, Swisscom and Next hurt performance, as these stocks all suffered in the period.
The advance of the dollar against most major currencies eroded international equity returns during the period. In the J.P. Morgan Investment Management, Inc. portion of the fund, holdings in the United Kingdom underperformed due to their exposure to falling consumer spending. These included retailers, such as Kingfisher, as well as retail banks such as Royal Bank of Scotland. In Hong Kong, an overweight position in HSBC Holdings performed poorly. By contrast, there was strong performance in Italy, where oil company ENI benefited from higher oil prices. Japan also contributed positively due to overweight positions in well-run companies such as Mitsubishi and Nitto Denko.
The Investment Sub-Advisers believe that potential interest rate cuts may prove helpful, but that significant outperformance may rely on good, individual stock selection.
The comments above are based on information provided by the Investment Sub-Advisers for the period indicated.
| Investment Sub-Advisers | About the Fund | |
Grantham, Mayo, Van Otterloo & Co. LLC J.P. Morgan Investment Management Inc. | Seeks maximum long-term total return (capital appreciation and income) primarily by investing in common stocks of established non-U.S. companies. | |
Average Annual Total Returns
| 1 Year | 5 Year | 10 Year | ||||
Select International Equity Fund | 11.70% | (3.21)% | 6.01% | |||
MSCI EAFE Index | 14.13% | (0.17)% | 5.56% | |||
Lipper International Core Funds Average | 13.41% | (1.66)% | 6.11% | |||
Growth of a $10,000 Investment Since 1995
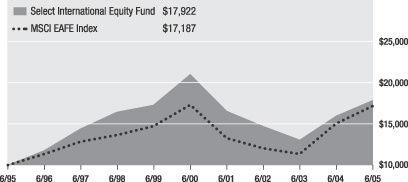
The Select International Equity Fund is a portfolio of Allmerica Investment Trust.
Special risk considerations are associated with investments in non-U.S. companies, including fluctuating foreign exchange rates, foreign governmental regulations and differing degrees of liquidity that may adversely affect the portfolio.
The MSCI EAFE Index is an unmanaged capitalization weighted index of European, Australasian and Far Eastern stocks. The Lipper International Core Funds Average is a non-weighted average of funds within the international core investment objective.
Grantham, Mayo, Van Otterloo & Co. LLC and J.P. Morgan Investment Management Inc. became Co-Sub-Advisers of the fund effective October 1, 2004. Performance prior to this date is that of a prior Sub-Adviser.
The performance data quoted represents past performance. Past performance does not guarantee future results. The investment return and principal value of an investment will fluctuate so that an investor’s shares, when redeemed, may be worth more or less than their original cost. Current performance may be lower or higher than the performance data quoted. For information on the current month end performance of variable annuity and variable life insurance products, please call: (800) 533-7881. The performance data quoted is net of all fund operating expenses, but does not include variable insurance or variable annuity charges. If the performance data included the effect of these additional charges, it would have been lower.
4
Table of Contents
The Select Growth Fund returned (1.42)% for the first half of 2005, outperforming its benchmark, the Russell 1000 Growth Index, which returned (1.72)%.
In the GE Asset Management Incorporated portion of the fund, the primary positive contributors to performance were the Information Technology, Materials, and Energy sectors. Intel, Certegy and Intuit aided performance, as did the fund’s sole Materials holding, Monsanto. In the Energy sector, overweighting the fund’s sole holding, Schlumberger, positively impacted performance. The primary negative contributor to performance was the Consumer Discretionary sector. Interactive Corp reported weaker than expected numbers in their travel business, particularly in Hotels.com, which saw negative year-over-year bookings in the first quarter. Home Depot was weak, while Comcast also negatively impacted performance. In Telecommunications, the fund’s sole holding, Vodafone, lagged the sector return. In the Health Care sector, Amgen, Zimmer, Lincare and Dentsply all negatively impacted performance.
In the Jennison Associates LLC portion of the fund, an overweight to Energy contributed to positive relative returns. Information Technology was the weakest sector in the benchmark, but fund holdings did very well, led by Google and Apple. These positions were offset somewhat by weakness in Communication Equipment companies Qualcomm and Research in Motion. Within Health Care, Genentech, UnitedHealth Group and Wellpoint aided performance, offsetting negative results from some Pharmaceuticals companies. The Consumer Discretionary sector detracted from relative returns, driven by negative returns in eBay. Favorable stock selection in the Financials sector, including Lehman Brothers, aided performance.
The Investment Sub-advisers expect to maintain their growth strategy going forward, continuing to focus on fundamental research and bottom-up stock selection. They believe the aggregate portfolio is well positioned for good performance in this market environment.
The comments above are based on information provided by the Investment Sub-Advisers for the period indicated.
| Investment Sub-Advisers | About the Fund | |
GE Asset Management Incorporated Jennison Associates LLC | Seeks long-term growth of capital by investing primarily in the common stock of companies believed to have long-term growth potential. | |
Average Annual Total Returns
| 1 Year | 5 Year | 10 Year | ||||
Select Growth Fund | 4.24% | (9.27)% | 6.12% | |||
Russell 1000 Growth Index | 1.70% | (10.35)% | 7.40% | |||
Lipper Large-Cap Growth Funds Average | 4.12% | (8.18)% | 7.62% | |||
Growth of a $10,000 Investment Since 1995
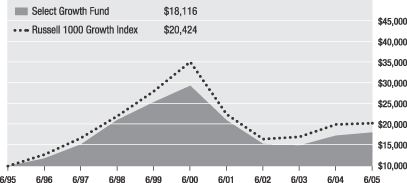
The Select Growth Fund is a portfolio of Allmerica Investment Trust.
The Russell 1000 Growth Index measures the performance of those Russell 1000 companies with higher price-to-book ratios and higher forecasted growth values. The Lipper Large-Cap Growth Funds Average is a non-weighted average of funds within the large-cap growth investment objective.
GE Asset Management Inc. became a Co-Sub-Adviser of the fund effective April 30, 2004. Jennison Associates LLC became a Co-Sub-Adviser of the fund effective April 18, 2003. Performance prior to these dates is that of prior Sub-Advisers.
The performance data quoted represents past performance. Past performance does not guarantee future results. The investment return and principal value of an investment will fluctuate so that an investor’s shares, when redeemed, may be worth more or less than their original cost. Current performance may be lower or higher than the performance data quoted. For information on the current month end performance of variable annuity and variable life insurance products, please call: (800) 533-7881. The performance data quoted is net of all fund operating expenses, but does not include variable insurance or variable annuity charges. If the performance data included the effect of these additional charges, it would have been lower.
5
Table of Contents
The Core Equity Fund returned (0.68)% for the first half of 2005, underperforming its benchmark, the Russell 1000 Index, which returned 0.11%.
In the Goldman Sachs Asset Management, L.P. portion of the fund, Fannie Mae and Freddie Mac detracted from performance due to increased political issues surrounding legislation that Congress is considering, which would strengthen the powers of their regulator. The Energy sector was up strongly during the period, but an underweight to the sector hurt performance. Crown Castle International Corp., a wireless telecommunications tower company, was up during the period, after increasing free cash flow by refinancing its balance sheet. Because the Investment Sub-Adviser believes that the nature of the tower industry ensures transparency in revenue and earnings growth since these businesses are often able to lock their wireless telephony and broadcast customers into long-term contracts, it increased its exposure to the industry with the purchase of American Tower Corp.
Within the UBS Global Asset Management (Americas) Inc. portion of the fund, performance was helped by overweights to medical services, construction & real property and electric utilities. Holding Marathon Oil, Martin Marietta, First Energy and Exelon also aided performance, as did not owning IBM and Verizon. Conversely, performance was hindered by an overweight to railroads and underweights to oil refining, and energy reserves. Holdings in Illinois Tool Works, Costco, Albertsons, Freddie Mac and Masco also detracted from performance, as did not owning Altria. The Investment Sub-Adviser believes that many U.S. companies were provided with an additional earnings boost the last few years on a weak dollar and significant overseas sales, but does not expect that to continue this year.
The comments above are based on information provided by the Investment Sub-Advisers for the period indicated.
| Investment Sub-Advisers | About the Fund | |
Goldman Sachs Asset Management, L.P. UBS Global Asset Management (Americas) Inc. | Seeks long-term growth of capital by investing primarily in common stocks that are believed to represent significant underlying value in relation to current market prices. | |
Average Annual Total Returns
| 1 Year | 5 Year | 10 Year | ||||
Core Equity Fund | 7.05% | (4.33)% | 7.72% | |||
Russell 1000 Index | 7.92% | (1.89)% | 10.16% | |||
Lipper Large-Cap Core Funds Average | 5.53% | (3.12)% | 7.70% | |||
Growth of a $10,000 Investment Since 1995
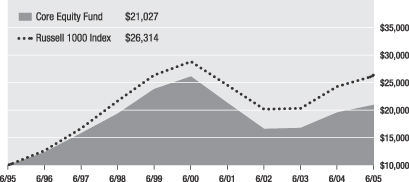
The Core Equity Fund is a portfolio of Allmerica Investment Trust.
The Russell 1000 Index measures the performance of the 1,000 largest companies in the Russell 3000 Index. The Lipper Large-Cap Core Funds Average is a non-weighted average of funds within the large-cap core investment objective.
Performance prior to May 1, 2002 is that of a prior Sub-Adviser.
The performance data quoted represents past performance. Past performance does not guarantee future results. The investment return and principal value of an investment will fluctuate so that an investor’s shares, when redeemed, may be worth more or less than their original cost. Current performance may be lower or higher than the performance data quoted. For information on the current month end performance of variable annuity and variable life insurance products, please call: (800) 533-7881. The performance data quoted is net of all fund operating expenses, but does not include variable insurance or variable annuity charges. If the performance data included the effect of these additional charges, it would have been lower.
6
Table of Contents
The Equity Index Fund returned (1.07)% for the first half of 2005, underperforming its benchmark, the S&P 500® Index, which returned (0.82)%.
After two years of double digit returns in the equity markets, many investors had high expectations going into 2005. Unfortunately, the momentum from 2004 did not last and equities ended the period in the red. The Energy and Health Care sectors were among the best performers. All aspects of the oil industry, including exploration, drilling, and refining had solid double digit gains. The Health Care sector had improved earnings due to increased merger activity over the last five years, improving the market share of companies like UnitedHealth, Wellpoint and Aetna. Among the declining sectors this period were Autos and Airlines. Due to rocketing health care costs and a declining market share, automotive manufacturers Ford and General Motors lost value in the first half of 2005. This poor performance trickled down to the automotive supply sector which had similar year-to-date returns. Airlines also underperformed, as investors grew concerned that spiking oil prices may cause increased operating costs.
Although U.S. economic growth appears to be moderating, the Investment Sub-Adviser believes that there is reason for optimism as we enter the last half of 2005. Annualized GDP came in at a solid 3.8% for the first quarter and consumer spending has been strong and may be improving. Retail sales and employment figures have been healthy, while inflation appears to be well-contained. Barring a major terrorist attack or a collapse in the housing market, the Investment Sub-Adviser believes that the economic expansion, while moderating, should continue, and that equities may move higher.
The comments above are based on information provided by the Investment Sub-Adviser for the period indicated.
| Investment Sub-Adviser | About the Fund | |
| Opus Investment Management, Inc. | Seeks to replicate the aggregate price and yield performance of the S&P 500® Index. | |
Average Annual Total Returns
| 1 Year | 5 Year | 10 Year | ||||
Equity Index Fund | 5.79% | (2.69)% | 9.49% | |||
S&P 500® Index | 6.30% | (2.38)% | 9.94% | |||
Lipper S&P 500 Index Objective Funds Average | 5.95% | (2.70)% | 9.60% | |||
Growth of a $10,000 Investment Since 1995
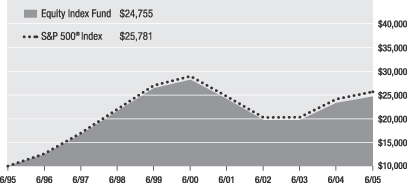
The Equity Index Fund is a portfolio of Allmerica Investment Trust.
The S&P 500® Index is an unmanaged index of 500 leading stocks. S&P 500® Index is a registered trademark of The McGraw-Hill Companies, Inc. The Lipper S&P 500 Index Objective Funds Average is a non-weighted average of funds within the S&P 500® Index investment objective.
The performance data quoted represents past performance. Past performance does not guarantee future results. The investment return and principal value of an investment will fluctuate so that an investor’s shares, when redeemed, may be worth more or less than their original cost. Current performance may be lower or higher than the performance data quoted. For information on the current month end performance of variable annuity and variable life insurance products, please call: (800) 533-7881. The performance data quoted is net of all fund operating expenses, but does not include variable insurance or variable annuity charges. If the performance data included the effect of these additional charges, it would have been lower.
7
Table of Contents
Select Investment Grade Income Fund
The Select Investment Grade Income Fund returned 2.02% for the first half of 2005, underperforming its benchmark, the Lehman Brothers Aggregate Bond Index, which returned 2.52%.
The first and second quarters of 2005 produced very different results. The first quarter was disappointing, primarily due to rapidly escalating commodity prices, punctuated by oil. Fixed income indices posted solid results in the second quarter, bringing year-to-date returns back into positive territory. Most spread sectors, with the exception of the corporate sector, performed well. Agencies, CMBS, and ABS provided excess returns, as spreads improved on lower implied volatility and investors stretched for yield within higher quality sectors. The exception was the credit sector, which turned in a negative excess return for the first half. The portfolio had an approximately 60% overweight to the corporate sector during the period. This positioning was the primary driver of portfolio underperformance relative to the benchmark. Individual security selection resulted in outperformance of the portfolio during the first quarter and detracted from performance in the second quarter. The sale of auto securities, Ford in particular, detracted from performance. The portfolio’s slight underweight to the MBS sector hurt results. The fund’s mortgage holdings benefited the portfolio during the first quarter, but proved to be a drag on performance during the second quarter, as a result of the direction of interest rates.
Looking ahead, the Investment Sub-Adviser does not see any indication that the Federal Reserve Board will take a breather in its “measured march” toward a neutral monetary policy. As a result, the Investment Sub-Adviser plans to maintain a neutral duration policy and an overweight to corporate spread product.
The comments above are based on information provided by the Investment Sub-Adviser for the period indicated.
| Investment Sub-Adviser | About the Fund | |
| Opus Investment Management, Inc. | Seeks as high a level of total return, which includes capital appreciation as well as income, as is consistent with prudent investment management. | |
Average Annual Total Returns
| 1 Year | 5 Year | 10 Year | ||||
Select Investment Grade Income Fund | 6.16% | 6.49% | 6.12% | |||
Lehman Brothers Aggregate Bond Index | 6.81% | 7.41% | 6.83% | |||
Lipper Intermediate Investment Grade Debt Funds Average | 6.46% | 6.90% | 6.32% | |||
Growth of a $10,000 Investment Since 1995
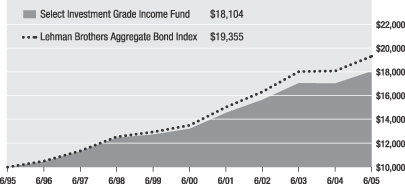
The Select Investment Grade Income Fund is a portfolio of Allmerica Investment Trust.
The Lehman Brothers Aggregate Bond Index is an unmanaged index of all fixed-rate debt issues with an investment grade or higher rating, at least one year to maturity and an outstanding par value of at least $25 million. The Lipper Intermediate Investment Grade Debt Funds Average is a non-weighted average of funds within the intermediate investment grade debt investment objective.
The performance data quoted represents past performance. Past performance does not guarantee future results. The investment return and principal value of an investment will fluctuate so that an investor’s shares, when redeemed, may be worth more or less than their original cost. Current performance may be lower or higher than the performance data quoted. For information on the current month end performance of variable annuity and variable life insurance products, please call: (800) 533-7881. The performance data quoted is net of all fund operating expenses, but does not include variable insurance or variable annuity charges. If the performance data included the effect of these additional charges, it would have been lower.
8
Table of Contents
The Government Bond Fund returned 1.75% for the first half of 2005, outperforming its benchmark, the Lehman Brothers Intermediate Government Bond Index, which returned 1.62%.
Year-to-date performance for many bond funds has been lackluster, as the Federal Reserve Board continued to hike short-term interest rates. Rising inflation expectations in the first quarter edged rates higher and spreads wider, damping returns for most indices. However, returns improved in the second quarter, as higher inflation expectations failed to materialize. Most spread sectors produced positive excess returns versus Treasuries and this certainly helped the fund, which was overweight to spread sectors. Intermediate agencies, CMBS, and ABS all provided significant excess returns. In general, spreads improved on lower implied volatility and demand from investors stretching for yield within higher quality sectors. The fund’s exposure to the mortgage-backed sector through CMOs also enhanced returns. Mortgage-backed securities saw favorable returns, primarily due to robust institutional buying. Both foreign and domestic banks have become increasingly comfortable with the asset class. In addition, index aware managers continued to add mortgage product in lockstep with the growth in prominence of the asset classes in various indices.
Looking ahead, the Investment Sub-Adviser does not see any indication that the Federal Reserve Board will take a breather in its “measured march” toward neutral monetary policy. Although inflation seems well contained, crude oil futures recently breached the $60 mark and could prove inflationary if these lofty levels are enduring. The Investment Sub-Adviser plans to maintain a slight duration underweight relative to the benchmark and may continue to look to spread product to enhance returns in this low-rate environment.
The comments above are based on information provided by the Investment Sub-Adviser for the period indicated.
| Investment Sub-Adviser | About the Fund | |
| Opus Investment Management, Inc. | Seeks high income, preservation of capital and maintenance of liquidity, primarily through investments in debt instruments issued or guaranteed by the U.S. Government or its agencies or instrumentalities. | |
Average Annual Total Returns
| 1 Year | 5 Year | 10 Year | ||||
Government Bond Fund | 4.40% | 5.82% | 5.53% | |||
Lehman Brothers Intermediate Government Bond Index | 4.13% | 6.18% | 6.00% | |||
Lipper General U.S. Government Funds Average | 7.07% | 7.01% | 6.09% | |||
Growth of a $10,000 Investment Since 1995
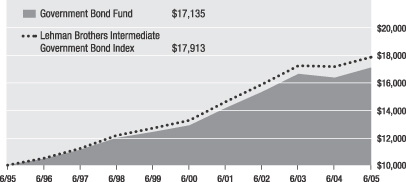
The Government Bond Fund is a portfolio of Allmerica Investment Trust.
The Fund is neither insured nor guaranteed by the U.S. Government.
The Lehman Brothers Intermediate Government Bond Index is an unmanaged index of U.S. Government and Agency bonds with remaining maturities of one to ten years. The Lipper General U.S. Government Funds Average is a non-weighted average of funds within the general U.S. Government investment objective.
The performance data quoted represents past performance. Past performance does not guarantee future results. The investment return and principal value of an investment will fluctuate so that an investor’s shares, when redeemed, may be worth more or less than their original cost. Current performance may be lower or higher than the performance data quoted. For information on the current month end performance of variable annuity and variable life insurance products, please call: (800) 533-7881. The performance data quoted is net of all fund operating expenses, but does not include variable insurance or variable annuity charges. If the performance data included the effect of these additional charges, it would have been lower.
9
Table of Contents
The Money Market Fund returned 1.08% for the first half of 2005, outperforming its benchmark, the Money Fund Report Averages: First Tier Taxable, which returned 0.96%.
During the period, the Money Market Fund maintained a relatively short weighted average maturity, in the range of 20 to 25 days. This position enabled the fund to take advantage of a rapidly increasing interest rate environment, as the Federal Reserve Board moved the federal funds rate from 2.25% to 3.25% during the period. The fund benefited from its investments in short dated, high quality, commercial paper and certificates of deposit. Floating-rate notes and extendible put option enabled paper were also successfully utilized. These securities aided performance through their built in reset functions, designed to keep pace with the Federal Reserve Board’s interest rate hikes and their inherent incremental spread.
The Investment Sub-Adviser believes that inflation is the biggest concern facing the economy. Continued increases in commodity and energy prices could hurt the consumer’s ability to support the economy. A consumer with less disposable income may mean fewer retail sales and weaker demand for goods and services, which may impact companies, job growth, and the economy. Alternatively, if inflation rises from an overheated economy, the cost to companies of raw materials for producing goods and services may outpace the consumer’s willingness to pay for them. This may result in fewer goods and services purchased and an economic slowdown. If the economy maintains its moderate expansion, the Investment Sub-Adviser expects the Federal Reserve Board to continue to move short-term interest rates higher. This may bode well for the fund, as higher interest rates should translate into higher yields.
The comments above are based on information provided by the Investment Sub-Adviser for the period indicated.
| Investment Sub-Adviser | About the Fund | |
| Opus Investment Management, Inc. | Seeks to obtain maximum current income consistent with preservation of capital and liquidity. | |
Average Annual Total Returns
| 1 Year | 5 Year | 10 Year | ||||
Money Market Fund | 1.68% | 2.40% | 3.94% | |||
Money Fund Report Averages: First Tier Taxable | 1.43% | 1.95% | 3.45% | |||
Lipper Money Market Funds Average | 1.64% | 2.14% | 3.65% | |||
Average Yield as of June 30, 2005
Money Market Fund 7-Day Yield | 2.61% | |
Growth of a $10,000 Investment Since 1995
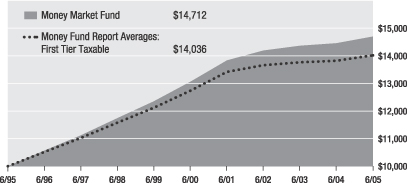
The Money Market Fund is a portfolio of Allmerica Investment Trust.
The Fund is neither insured nor guaranteed by the Federal Deposit Insurance Corporation or any other government agency. Although the Fund seeks to maintain a net asset value of $1.00 per share, it is possible to lose money by investing in the Fund.
Money Fund Report Averages: First Tier Taxable is published by iMoneyNet, Inc., an independent firm that tracks 2a-7 regulated money market funds on a yield, shareholder, asset size and portfolio allocation basis. The Lipper Money Market Funds Average is a non-weighted average of funds within the money market investment objective.
The performance data quoted represents past performance. Past performance does not guarantee future results. The investment return and principal value of an investment will fluctuate so that an investor’s shares, when redeemed, may be worth more or less than their original cost. Current performance may be lower or higher than the performance data quoted. For information on the current month end performance of variable annuity and variable life insurance products, please call: (800) 533-7881. The performance data quoted is net of all fund operating expenses, but does not include variable insurance or variable annuity charges. If the performance data included the effect of these additional charges, it would have been lower.
10
Table of Contents
ALLMERICA INVESTMENT TRUST
EXPENSE EXAMPLES 06/30/05 (Unaudited)
You do not own shares of any Fund of the Allmerica Investment Trust directly. As a contract/policy owner investing in a Fund, you incur ongoing expenses, such as management fees, distribution and service (12b-1) fees, and other fund expenses. The following table is intended to help you understand your ongoing expenses (in dollars and cents) of investing in a Fund and to compare these expenses with the ongoing expenses of investing in other funds.
The examples are based on an investment of $1,000 invested at the beginning of the period and held for the entire period from January 1, 2005 to June 30, 2005.
Actual Expenses
The first line under each Fund in the table below provides information about the actual account values and actual expenses. You may use the information in this line, together with the amount you invested, to estimate the expenses that you paid over the period. Simply divide your account value by $1,000 (for example, an $8,600 account value divided by $1,000 = 8.6), then multiply the result by the number in the first line for your Fund under the heading entitled “Expenses Paid During Period” to estimate the expenses you paid on your account during this period.
Hypothetical Example for Comparison Purposes
The second line under each Fund in the table below provides information about the hypothetical account values and hypothetical expenses based on each Fund’s actual expense ratio and an assumed rate of return of 5% per year before expenses, which are not the Fund’s actual returns. The hypothetical account values and expenses may not be used to estimate the actual ending account balances or expenses you paid for the period. You may use this information to compare the ongoing expenses of investing in your Fund and other funds. To do so, compare 5% hypothetical example with the 5% hypothetical examples that appear in the shareholder reports of the other funds.
Please note that the expenses shown in the table are meant to highlight your ongoing expenses only and do not reflect any costs or expenses that apply to the subaccount or the contact. Therefore, the second line of the table is useful in comparing ongoing expenses of each Fund only, and will not help you determine the relative total costs of owning different funds underlying various annuity contracts and/or life insurance policies. In addition, if the costs or expenses that apply to the subaccount or the contract were included, your costs would have been higher.
| Beginning Account Value 01/01/05 | Ending Account Value 06/30/05 | Annualized Expense Ratio | Expenses Paid During Period* (January 1 to June 30, 2005) | |||||||||
Select Capital Appreciation Fund | ||||||||||||
Actual | $ | 1,000.00 | $ | 1,016.20 | 1.15 | % | $ | 5.75 | ||||
Hypothetical | 1,000.00 | 1,019.09 | 1.15 | % | 5.76 | |||||||
Select Value Opportunity Fund | ||||||||||||
Actual | $ | 1,000.00 | $ | 998.20 | 1.10 | % | $ | 5.45 | ||||
Hypothetical | 1,000.00 | 1,019.34 | 1.10 | % | 5.51 | |||||||
Select International Equity Fund | ||||||||||||
Actual | $ | 1,000.00 | $ | 995.20 | 1.27 | % | $ | 6.28 | ||||
Hypothetical | 1,000.00 | 1,018.50 | 1.27 | % | 6.36 | |||||||
Select Growth Fund | ||||||||||||
Actual | $ | 1,000.00 | $ | 985.80 | 1.01 | % | $ | 4.97 | ||||
Hypothetical | 1,000.00 | 1,019.79 | 1.01 | % | 5.06 | |||||||
Core Equity Fund | ||||||||||||
Actual | $ | 1,000.00 | $ | 993.20 | 0.82 | % | $ | 4.05 | ||||
Hypothetical | 1,000.00 | 1,020.73 | 0.82 | % | 4.11 | |||||||
Equity Index Fund | ||||||||||||
Actual | $ | 1,000.00 | $ | 989.30 | 0.52 | % | $ | 2.56 | ||||
Hypothetical | 1,000.00 | 1,022.22 | 0.52 | % | 2.61 | |||||||
Select Investment Grade Income Fund | ||||||||||||
Actual | $ | 1,000.00 | $ | 1,020.20 | 0.64 | % | $ | 3.21 | ||||
Hypothetical | 1,000.00 | 1,021.62 | 0.64 | % | 3.21 | |||||||
Government Bond Fund | ||||||||||||
Actual | $ | 1,000.00 | $ | 1,017.50 | 0.74 | % | $ | 3.70 | ||||
Hypothetical | 1,000.00 | 1,021.12 | 0.74 | % | 3.71 | |||||||
Money Market Fund | ||||||||||||
Actual | $ | 1,000.00 | $ | 1,010.80 | 0.54 | % | $ | 2.69 | ||||
Hypothetical | 1,000.00 | 1,022.12 | 0.54 | % | 2.71 | |||||||
| * | Expenses are calculated using the Fund’s annualized expense ratio (as disclosed in the table), multiplied by the average account value for the period, multiplied by the number of days in the period (181 days), and divided by the number of days in the year (365 days). |
F-1
Table of Contents
SELECT CAPITAL APPRECIATION FUND
PORTFOLIO OF INVESTMENTS • June 30, 2005 (Unaudited)
| Shares | Value (Note 2) | ||||
| COMMON STOCKS - 98.8% | |||||
Advertising - 0.6% | |||||
| 59,000 | Catalina Marketing Corp. (a) | $ | 1,499,190 | ||
Aerospace & Defense - 3.3% | |||||
| 47,000 | Alliant Techsystems, Inc.* | 3,318,200 | |||
| 34,000 | Goodrich Corp. | 1,392,640 | |||
| 88,000 | Rockwell Collins, Inc. | 4,195,840 | |||
| 8,906,680 | |||||
Airlines - 1.4% | |||||
| 68,000 | JetBlue Airways Corp.* (a) | 1,389,920 | |||
| 165,000 | Southwest Airlines, Inc. | 2,298,450 | |||
| 3,688,370 | |||||
Auto Manufacturers - 0.9% | |||||
| 33,000 | Oshkosh Truck Corp. | 2,583,240 | |||
Auto Parts & Equipment - 0.6% | |||||
| 71,000 | TRW Automotive Holdings Corp.* | 1,740,210 | |||
Banks - 0.4% | |||||
| 12,000 | Investors Financial Services Corp. | 453,840 | |||
| 11,000 | SVB Financial Group* | 526,900 | |||
| 980,740 | |||||
Beverages - 0.7% | |||||
| 82,000 | Cott Corp.* (a) | 1,790,060 | |||
Biotechnology - 2.6% | |||||
| 27,000 | Celgene Corp.* | 1,100,790 | |||
| 48,000 | Human Genome Sciences, Inc.* (a) | 555,840 | |||
| 145,000 | Medimmune, Inc.* | 3,874,400 | |||
| 35,000 | Protein Design Labs, Inc.* | 707,350 | |||
| 51,000 | Vertex Pharmaceuticals, Inc.* | 858,840 | |||
| 7,097,220 | |||||
Building Materials - 0.8% | |||||
| 50,000 | American Standard Companies, Inc. | 2,096,000 | |||
Commercial Services - 7.4% | |||||
| 16,000 | Apollo Group, Inc.* | 1,251,520 | |||
| 82,000 | Certegy, Inc. | 3,134,040 | |||
| 76,000 | ChoicePoint, Inc.* | 3,043,800 | |||
| 48,000 | Education Management* | 1,619,040 | |||
| 11,000 | Getty Images, Inc.* (a) | 816,860 | |||
| 27,000 | Global Payments, Inc. (a) | 1,830,600 | |||
| 81,000 | Iron Mountain, Inc.* | 2,512,620 | |||
| 63,000 | Manpower, Inc. | 2,506,140 | |||
| 87,000 | MoneyGram International, Inc. | 1,663,440 | |||
| 42,000 | Robert Half International, Inc. (a) | 1,048,740 | |||
| 26,000 | Viad Corp. | 736,840 | |||
| 20,163,640 | |||||
Computers - 3.9% | |||||
| 34,000 | CACI International, Inc., Class A* | $ | 2,147,440 | ||
| 156,000 | Cadence Design Systems, Inc.* | 2,130,960 | |||
| 34,000 | Diebold, Inc. | 1,533,740 | |||
| 60,000 | DST Systems, Inc.* | 2,808,000 | |||
| 11,000 | Research In Motion* | 811,250 | |||
| 34,000 | SunGard Data Systems, Inc.* | 1,195,780 | |||
| 10,627,170 | |||||
Diversified Financial Services - 5.5% | |||||
| 175,000 | Ameritrade Holding Corp.* | 3,253,250 | |||
| 78,000 | CapitalSource, Inc.* (a) | 1,531,140 | |||
| 119,000 | E*TRADE Financial Corp.* | 1,664,810 | |||
| 82,000 | Eaton Vance Corp. | 1,960,620 | |||
| 28,000 | Federated Investors, Inc., Class B | 840,280 | |||
| 24,000 | Legg Mason, Inc. | 2,498,640 | |||
| 43,000 | Nuveen Investments, Inc., Class A (a) | 1,617,660 | |||
| 87,000 | Waddell & Reed Financial, Class A | 1,609,500 | |||
| 14,975,900 | |||||
Electronics - 4.7% | |||||
| 20,500 | Cogent, Inc.* | 585,275 | |||
| 181,000 | Flextronics International, Ltd.* | 2,391,010 | |||
| 63,000 | Flir Systems, Inc.* (a) | 1,879,920 | |||
| 39,000 | Garmin, Ltd. (a) | 1,667,250 | |||
| 136,000 | Gentex Corp. (a) | 2,475,200 | |||
| 83,000 | Jabil Circuit, Inc.* | 2,550,590 | |||
| 31,000 | Waters Corp.* | 1,152,270 | |||
| 12,701,515 | |||||
Entertainment - 0.3% | |||||
| 36,000 | Dreamworks Animation SKG, Inc., Class A* | 943,200 | |||
Food - 0.4% | |||||
| 10,000 | Whole Foods Market, Inc. | 1,183,000 | |||
Health Care - Products - 2.5% | |||||
| 11,000 | Bausch & Lomb, Inc. | 913,000 | |||
| 41,000 | Edwards Lifesciences Corp.* (a) | 1,763,820 | |||
| 25,000 | Gen-Probe, Inc.* | 905,750 | |||
| 10,000 | INAMED Corp.* | 669,700 | |||
| 31,000 | Kinetic Concepts, Inc.* | 1,860,000 | |||
| 21,000 | Varian Medical Systems, Inc.* (a) | 783,930 | |||
| 6,896,200 | |||||
Health Care - Services - 4.7% | |||||
| 47,000 | Community Health Systems, Inc.* | 1,776,130 | |||
| 22,000 | Coventry Health Care, Inc.* | 1,556,500 | |||
| 21,000 | Davita, Inc.* | 955,080 | |||
| 93,000 | Health Management Associates, Inc., Class A (a) | 2,434,740 | |||
| 56,000 | Laboratory Corp. of America Holdings* | 2,794,400 | |||
| 84,000 | Manor Care, Inc. | 3,337,320 | |||
| 12,854,170 | |||||
Home Furnishings - 0.7% | |||||
| 23,000 | Harman International Industries, Inc. | 1,871,280 | |||
See Notes to Financial Statements.
F-2
Table of Contents
SELECT CAPITAL APPRECIATION FUND
PORTFOLIO OF INVESTMENTS, Continued • June 30, 2005 (Unaudited)
| Shares | Value (Note 2) | ||||
Insurance - 3.1% | |||||
| 83,000 | Assurant, Inc. | $ | 2,996,300 | ||
| 40,000 | Axis Capital Holdings, Ltd. | 1,132,000 | |||
| 44,000 | Principal Financial Group, Inc. | 1,843,600 | |||
| 21,000 | Protective Life Corp. | 886,620 | |||
| 45,000 | Willis Group Holdings, Ltd. | 1,472,400 | |||
| 8,330,920 | |||||
Internet - 3.4% | |||||
| 44,000 | Amazon.Com, Inc.* (a) | 1,455,520 | |||
| 44,000 | CheckFree Corp.* (a) | 1,498,640 | |||
| 126,000 | CNET Networks, Inc.* (a) | 1,479,240 | |||
| 60,000 | Monster Worldwide, Inc.* | 1,720,800 | |||
| 111,000 | VeriSign, Inc.* | 3,192,360 | |||
| 9,346,560 | |||||
Leisure Time - 1.1% | |||||
| 67,000 | Brunswick Corp. | 2,902,440 | |||
Lodging - 1.2% | |||||
| 94,000 | Fairmont Hotels & Resorts, Inc. (a) | 3,274,020 | |||
Manufacturing - Miscellaneous - 3.9% | |||||
| 36,000 | Danaher Corp. (a) | 1,884,240 | |||
| 26,000 | ITT Industries, Inc. | 2,538,380 | |||
| 56,000 | Roper Industries, Inc. | 3,996,720 | |||
| 36,000 | Teleflex, Inc. | 2,137,320 | |||
| 10,556,660 | |||||
Media - 4.2% | |||||
| 162,000 | Citadel Broadcasting Corp.* (a) | 1,854,900 | |||
| 55,500 | Cox Radio, Inc.* | 874,125 | |||
| 50,000 | Dolby Laboratories, Inc.* | 1,103,000 | |||
| 18,000 | Entercom Communications Corp.* (a) | 599,220 | |||
| 94,000 | Rogers Communications, Inc., Class B (a) | 3,090,720 | |||
| 23,000 | Scholastic Corp.* | 886,650 | |||
| 72,000 | Univision Communications, Inc.* (a) | 1,983,600 | |||
| 30,000 | XM Satellite Radio Holdings, Inc.* (a) | 1,009,800 | |||
| 11,402,015 | |||||
Mining - 0.6% | |||||
| 40,000 | Newmont Mining Corp. | 1,561,200 | |||
Oil & Gas - 4.4% | |||||
| 62,000 | EOG Resources, Inc. (a) | 3,521,600 | |||
| 70,000 | Murphy Oil Corp. (a) | 3,656,100 | |||
| 48,000 | Western Gas Resources, Inc. | 1,675,200 | |||
| 88,000 | XTO Energy, Inc. | 2,991,120 | |||
| 11,844,020 | |||||
Oil & Gas Services - 3.1% | |||||
| 68,000 | BJ Services Co. (a) | 3,568,640 | |||
| 57,000 | FMC Technologies, Inc.* | 1,822,290 | |||
| 47,000 | Smith International, Inc. (a) | 2,993,900 | |||
| 8,384,830 | |||||
Pharmaceuticals - 8.5% | |||||
| 54,000 | Abgenix, Inc.* (a) | $ | 463,320 | ||
| 66,000 | Alkermes, Inc.* (a) | 872,520 | |||
| 34,000 | Amylin Pharmaceuticals, Inc.* (a) | 711,620 | |||
| 47,000 | Andrx Corp.* (a) | 954,570 | |||
| 54,000 | Barr Pharmaceuticals* | 2,631,960 | |||
| 48,000 | Cephalon, Inc.* (a) | 1,910,880 | |||
| 133,000 | Elan Corp., Plc, Sponsored ADR* (a) | 907,060 | |||
| 67,000 | Gilead Sciences, Inc.* | 2,947,330 | |||
| 125,000 | IVAX Corp.* | 2,687,500 | |||
| 29,000 | Neurocrine Biosciences, Inc.* | 1,219,740 | |||
| 104,000 | Omnicare, Inc. | 4,412,720 | |||
| 10,000 | OSI Pharmaceuticals, Inc.* | 408,700 | |||
| 25,000 | Sepracor, Inc.* (a) | 1,500,250 | |||
| 23,000 | Taro Pharmaceuticals Industries* (a) | 668,610 | |||
| 38,000 | Valeant Pharmaceuticals International | 669,940 | |||
| 22,966,720 | |||||
Retail - 8.4% | |||||
| 52,000 | Best Buy Co., Inc. | 3,564,600 | |||
| 37,000 | CarMax, Inc.* | 986,050 | |||
| 35,000 | CDW Corp. | 1,998,150 | |||
| 70,000 | Dollar General Corp. | 1,425,200 | |||
| 81,000 | Family Dollar Stores, Inc. (a) | 2,114,100 | |||
| 11,000 | MSC Industrial Direct Co., Class A | 371,250 | |||
| 64,000 | O’Reilly Automotive, Inc.* | 1,907,840 | |||
| 22,000 | P.F. Chang’s China Bistro, Inc.* (a) | 1,297,560 | |||
| 81,000 | PETsMART, Inc. (a) | 2,458,350 | |||
| 60,000 | Ross Stores, Inc. | 1,734,600 | |||
| 8,000 | Shoppers Drug Mart Corp. | 277,415 | |||
| 27,000 | Shoppers Drug Mart Corp., Unregistered* | 936,276 | |||
| 56,000 | The Cheesecake Factory, Inc.* (a) | 1,944,880 | |||
| 44,000 | Williams-Sonoma, Inc.* | 1,741,080 | |||
| 22,757,351 | |||||
Semiconductors - 4.7% | |||||
| 64,000 | Amis Holdings, Inc.* | 853,760 | |||
| 54,000 | Integrated Circuit Systems, Inc.* | 1,114,560 | |||
| 120,000 | Intersil Corp., Class A | 2,252,400 | |||
| 13,000 | Marvell Technology Group, Ltd.* | 494,520 | |||
| 84,000 | Microchip Technology, Inc. (a) | 2,488,080 | |||
| 82,000 | Novellus Systems, Inc. | 2,026,220 | |||
| 95,000 | PMC-Sierra, Inc.* (a) | 886,350 | |||
| 42,000 | Semtech Corp.* | 699,300 | |||
| 75,000 | Xilinx, Inc. | 1,912,500 | |||
| 12,727,690 | |||||
Software - 4.4% | |||||
| 72,000 | Activision, Inc.* | 1,189,440 | |||
| 40,000 | Adobe Systems, Inc. | 1,144,799 | |||
| 17,000 | Intuit, Inc.* | 766,870 | |||
| 62,000 | Jack Henry & Associates, Inc. | 1,135,220 | |||
| 15,000 | Macromedia, Inc.* | 573,300 | |||
| 102,000 | McAfee, Inc.* (a) | 2,670,360 | |||
| 37,000 | Mercury Interactive Corp.* | 1,419,320 | |||
| 56,000 | NAVTEQ Corp.* | 2,082,080 | |||
| 84,000 | Red Hat, Inc.* (a) | 1,100,400 | |||
| 12,081,789 | |||||
See Notes to Financial Statements.
F-3
Table of Contents
SELECT CAPITAL APPRECIATION FUND
PORTFOLIO OF INVESTMENTS, Continued • June 30, 2005 (Unaudited)
| Shares | Value (Note 2) | ||||||
Telecommunications - 5.7% | |||||||
| 81,000 | Adtran, Inc. | $ | 2,007,990 | ||||
| 8,300 | American Tower Corp., Class A* (a) | 174,466 | |||||
| 38,000 | Comverse Technology, Inc.* | 898,700 | |||||
| 129,000 | Crown Castle International Corp.* | 2,621,280 | |||||
| 115,000 | Harris Corp., Inc. | 3,589,150 | |||||
| 48,000 | Juniper Networks, Inc.* (a) | 1,208,640 | |||||
| 116,000 | Nextel Partners, Inc., Class A* (a) | 2,919,720 | |||||
| 54,000 | Telus Corp. | 1,897,226 | |||||
| 3,000 | Telus Corp., Non Voting | 105,402 | |||||
| 15,422,574 | |||||||
Transportation - 0.7% | |||||||
| 26,000 | C.H. Robinson Worldwide, Inc. | 1,513,200 | |||||
| 8,000 | Expeditors International of Washington, Inc. | 398,480 | |||||
| 1,911,680 | |||||||
Total Common Stocks (Cost $199,051,772) | 268,068,254 | ||||||
| Par Value | |||||||
| U.S. GOVERNMENT AGENCY OBLIGATIONS - 1.6% | |||||||
Federal Home Loan Bank - 1.1% | |||||||
| $ | 3,000,000 | 3.02%, 07/08/05 (b) | 2,998,238 | ||||
Federal Home Loan Mortgage - 0.5% | |||||||
| 1,366,000 | 2.50%, 07/01/05 (b) | 1,366,000 | |||||
Total U.S. Government Agency Obligations (Cost $4,364,239) | 4,364,238 | ||||||
| SHORT TERM INVESTMENTS (b) (c) - 22.6% | |||||||
| 1,143,999 | Bank of America | ||||||
3.27%, 07/18/05 | 1,143,999 | ||||||
| 915,199 | Barclays | ||||||
3.16%, 07/14/05 | 915,199 | ||||||
| 1,236,760 | Barclays | ||||||
3.25%, 07/26/05 | 1,236,760 | ||||||
| 2,287,997 | Calyon | ||||||
3.25%, 08/04/05 | 2,287,997 | ||||||
| 1,143,999 | Clipper Receivables Corp. | ||||||
3.19%, 07/14/05 | 1,143,999 | ||||||
| 1,143,999 | Compass Securitization | ||||||
3.16%, 07/11/05 | 1,143,999 | ||||||
| 2,287,997 | Credit Suisse First Boston Corporation | ||||||
3.15%, 09/09/05 | 2,287,997 | ||||||
| 1,882,346 | Credit Suisse First Boston Corporation | ||||||
3.20%, 07/18/05 | 1,882,346 | ||||||
| 9,151,988 | Credit Suisse First Boston Corporation Repurchase Agreement dated June 30, 2005, at 3.48%, due July 1, 2005 with a maturity amount of $9,152,872, collateralized by various corporate obligations with aggregate market value of $8,584,894. | 9,151,988 | |||||
| 1,372,798 | Dexia Group | ||||||
3.24%, 07/21/05 | 1,372,798 | ||||||
| $ | 1,143,999 | First Tennessee National Corporation | |||||
3.22%, 08/09/05 | $ | 1,143,999 | |||||
| 1,143,999 | Fortis Bank | ||||||
3.11%, 07/05/05 | 1,143,999 | ||||||
| 1,169,219 | Goldman Sachs Group, Inc. | ||||||
3.32%, 12/28/05 | 1,169,219 | ||||||
| 1,143,998 | Goldman Sachs Group, Inc. | ||||||
3.33%, 08/05/05 | 1,143,998 | ||||||
| 13,245,302 | Goldman Sachs Group, Inc. Repurchase Agreement dated June 30, 2005, at 3.48%, due July 1, 2005 with a maturity amount of $13,246,581, collateralized by various corporate obligations with aggregate market value of $13,490,915. | 13,245,302 | |||||
| 1,143,999 | Grampian Funding LLC | ||||||
3.28%, 07/13/05 | 1,143,999 | ||||||
| 831,870 | Greyhawk Funding | ||||||
3.31%, 08/09/05 | 831,870 | ||||||
| 1,143,998 | HBOS Halifax Bank of Scotland | ||||||
3.15%, 08/08/05 | 1,143,998 | ||||||
| 1,143,998 | HSBC Banking/Holdings Plc | ||||||
3.25%, 08/05/05 | 1,143,998 | ||||||
| 1,143,998 | JP Morgan Chase & Co. | ||||||
3.20%, 07/20/05 | 1,143,998 | ||||||
| 2,287,997 | Jupiter Securitization Corp. | ||||||
3.21%, 07/15/05 | 2,287,997 | ||||||
| 2,304,574 | Lehman Brothers, Inc. Repurchase Agreement dated June 30, 2005, at 3.48%, due July 1, 2005 with a maturity amount of $2,304,797, collateralized by various corporate obligations with aggregate market value of $2,350,690. | 2,304,574 | |||||
| 1,143,998 | Merrill Lynch & Co. Repurchase Agreement dated June 30, 2005, at 3.48%, due July 1, 2005 with a maturity amount of $1,144,109, collateralized by various corporate obligations with aggregate market value of $1,172,501. | 1,143,998 | |||||
| 1,143,998 | Nordea Bank of Finland Plc (NY Branch) | ||||||
3.17%, 08/09/05 | 1,143,998 | ||||||
| 1,369,565 | Park Avenue Receivables Corp. | ||||||
3.30%, 07/14/05 | 1,369,565 | ||||||
| 1,477,646 | Prefco | ||||||
3.28%, 07/08/05 | 1,477,646 | ||||||
| 1,372,798 | Rabobank Nederland | ||||||
3.25%, 08/08/05 | 1,372,798 | ||||||
| 1,143,998 | Societe Generale | ||||||
3.24%, 08/09/05 | 1,143,998 | ||||||
| 944,448 | The Bank of the West | ||||||
3.27%, 07/27/05 | 944,448 | ||||||
| 1,015,531 | Toronto Dominion Bank | ||||||
3.25%, 08/02/05 | 1,015,531 | ||||||
| 1,348,670 | Wells Fargo | ||||||
3.27%, 08/01/05 | 1,348,670 | ||||||
Total Short Term Investments (Cost $61,374,685) | 61,374,685 | ||||||
| | Total Investments - 123.0% (Cost $264,790,696) | 333,807,177 | |||||
| Net Other Assets and Liabilities - (23.0)% | (62,331,364 | ) | |||||
| Total Net Assets - 100.0% | $ | 271,475,813 | |||||
| * | Non-income producing security. |
| (a) | All or a portion of this security is out on loan at period end. |
| (b) | Effective yield at time of purchase, excluding repurchase agreements. |
| (c) | Investments made with cash collateral received from securities on loan. |
| ADR | American Depositary Receipt. Shares of a foreign based corporation held in U.S. banks entitling the shareholder to all dividends and capital gains. |
See Notes to Financial Statements.
F-4
Table of Contents
SELECT CAPITAL APPRECIATION FUND
PORTFOLIO OF INVESTMENTS, Continued • June 30, 2005 (Unaudited)
FEDERAL INCOME TAX INFORMATION (SEE NOTE 2)
At June 30, 2005, the aggregate cost of investment securities for tax purposes was $268,146,008. Net unrealized appreciation (depreciation) aggregated $65,661,169, of which $72,654,942 related to appreciated investment securities and $(6,993,773) related to depreciated investment securities.
OTHER INFORMATION
For the six months ended June 30, 2005, the aggregate cost of purchases and the proceeds of sales, other than from short-term investments, included $32,134,678 and $60,144,881 of non-governmental issuers, respectively.
Industry/Sector Concentration of Investments
as a Percentage of Net Assets:
Basic Materials | 0.6 | % | |
Communications | 13.9 | ||
Consumer Cyclical | 14.6 | ||
Consumer Non-Cyclical | 26.8 | ||
Energy | 7.5 | ||
Financial | 10.6 | ||
Industrial | 13.4 | ||
Technology | 13.0 | ||
Short-Term Investments | 22.6 | ||
Net Other Assets and Liabilities | (23.0 | ) | |
Total | 100.0 | % | |
See Notes to Financial Statements.
F-5
Table of Contents
SELECT VALUE OPPORTUNITY FUND
PORTFOLIO OF INVESTMENTS • June 30, 2005 (Unaudited)
| Shares | Value (Note 2) | ||||
| COMMON STOCKS - 96.7% | |||||
Aerospace & Defense - 5.5% | |||||
| 160,800 | Esterline Technologies Corp.* | $ | 6,444,864 | ||
| 138,700 | Goodrich Corp. | 5,681,152 | |||
| 149,525 | Moog, Inc., Class A* | 4,708,542 | |||
| 16,834,558 | |||||
Auto Manufacturers - 0.7% | |||||
| 28,100 | Oshkosh Truck Corp. | 2,199,668 | |||
Auto Parts & Equipment - 0.0% | |||||
| 267,700 | Mascotech, Inc. (a) | 0 | |||
Banks - 4.1% | |||||
| 146,400 | First Horizon National Corp. (b) | 6,178,080 | |||
| 233,525 | North Fork Bancorp., Inc. | 6,559,717 | |||
| 12,737,797 | |||||
Biotechnology - 1.8% | |||||
| 95,200 | Millipore Corp.* | 5,400,696 | |||
Building Materials - 2.3% | |||||
| 104,900 | Carlisle Cos., Inc. (b) | 7,199,287 | |||
Chemicals - 8.9% | |||||
| 279,700 | Airgas, Inc. (b) | 6,900,199 | |||
| 75,000 | Cytec Industries, Inc. | 2,985,000 | |||
| 112,100 | International Flavors & Fragrances, Inc. | 4,060,262 | |||
| 146,200 | Lyondell Chemical Co. (b) | 3,862,604 | |||
| 256,200 | Methanex Corp. | 4,219,614 | |||
| 211,400 | OM Group, Inc.* | 5,219,466 | |||
| 27,247,145 | |||||
Commercial Services - 3.4% | |||||
| 141,410 | Manpower, Inc. | 5,625,290 | |||
| 132,900 | Valassis Communications, Inc.* | 4,923,945 | |||
| 10,549,235 | |||||
Diversified Financial Services - 4.6% | |||||
| 674,900 | E*TRADE Financial Corp.* | 9,441,851 | |||
| 127,900 | Nuveen Investments, Inc., Class A (b) | 4,811,598 | |||
| 14,253,449 | |||||
Electric - 1.1% | |||||
| 201,500 | TransAlta Corp. (b) | 3,356,990 | |||
Electronics - 2.4% | |||||
| 121,400 | Amphenol Corp., Class A | 4,876,638 | |||
| 124,500 | PerkinElmer, Inc. | 2,353,050 | |||
| 7,229,688 | |||||
Engineering & Construction - 1.3% | |||||
| 109,900 | URS Corp.* | 4,104,765 | |||
Environmental Control - 0.9% | |||||
| 86,100 | Watts Industries, Inc., Class A | $ | 2,883,489 | ||
Food - 1.0% | |||||
| 75,500 | Ralcorp Holdings, Inc. | 3,106,825 | |||
Hand & Machine Tools - 1.0% | |||||
| 67,300 | Stanley Works | 3,064,842 | |||
Health Care - Services - 1.6% | |||||
| 145,500 | Apria Healthcare Group Inc.* (b) | 5,040,120 | |||
Holding Companies - Diversified - 2.1% | |||||
| 171,700 | Brascan Corp., Class A (b) | 6,552,072 | |||
Home Builders - 2.0% | |||||
| 197,000 | Thor Industries, Inc. | 6,191,710 | |||
Insurance - 9.0% | |||||
| 75,200 | AMBAC Financial Group, Inc. | 5,245,952 | |||
| 130,100 | Assurant, Inc. | 4,696,610 | |||
| 42,290 | Everest Re Group, Ltd. | 3,932,970 | |||
| 61,200 | MBIA, Inc. (b) | 3,629,772 | |||
| 129,900 | Protective Life Corp. | 5,484,378 | |||
| 98,000 | Reinsurance Group of America, Inc. | 4,557,980 | |||
| 27,547,662 | |||||
Leisure Time - 1.7% | |||||
| 110,800 | Royal Caribbean Cruises, Ltd. (b) | 5,358,288 | |||
Lodging - 1.1% | |||||
| 265,026 | Intercontinental Hotels Group PLC, ADR | 3,352,579 | |||
Machinery - Diversified - 1.4% | |||||
| 156,400 | UNOVA, Inc.* | 4,164,932 | |||
Manufacturing - Miscellaneous - 2.9% | |||||
| 167,800 | Acuity Brands, Inc. | 4,310,782 | |||
| 131,900 | Briggs & Stratton Corp. (b) | 4,566,378 | |||
| 8,877,160 | |||||
Media - 1.4% | |||||
| 70,200 | Knight-Ridder, Inc. (b) | 4,306,068 | |||
Metal Fabricate & Hardware - 3.0% | |||||
| 140,200 | Kaydon Corp. (b) | 3,904,570 | |||
| 157,800 | NCI Building Systems, Inc.* | 5,175,840 | |||
| 9,080,410 | |||||
Oil & Gas - 4.5% | |||||
| 47,800 | Equitable Resources, Inc. | 3,250,400 | |||
| 178,500 | Pride International, Inc.* | 4,587,450 | |||
| 248,500 | Southern Union Co.* | 6,100,675 | |||
| 13,938,525 | |||||
See Notes to Financial Statements.
F-6
Table of Contents
SELECT VALUE OPPORTUNITY FUND
PORTFOLIO OF INVESTMENTS, Continued • June 30, 2005 (Unaudited)
| Shares | Value (Note 2) | |||||
Pharmaceuticals - 1.4% | ||||||
| 279,300 | Impax Laboratories, Inc.* (b) | $ | 4,385,010 | |||
Pipelines - 2.3% | ||||||
| 106,700 | Questar Corp. | 7,031,530 | ||||
Real Estate - 2.1% | ||||||
| 78,100 | The St. Joe Co. | 6,368,274 | ||||
Retail - 12.6% | ||||||
| 138,200 | AnnTaylor Stores Corp.* (b) | 3,355,496 | ||||
| 78,400 | CDW Corp. (b) | 4,475,856 | ||||
| 307,900 | Claire’s Stores, Inc. | 7,404,995 | ||||
| 245,100 | Dollar Tree Stores, Inc.* | 5,882,400 | ||||
| 279,300 | Ruby Tuesday, Inc. (b) | 7,233,870 | ||||
| 222,000 | Tuesday Morning Corp. (b) | 6,997,440 | ||||
| 118,600 | United Auto Group, Inc. | 3,534,280 | ||||
| 38,884,337 | ||||||
Software - 2.5% | ||||||
| 189,300 | IMS Health, Inc. | 4,688,961 | ||||
| 258,450 | RSA Security, Inc.* | 2,967,006 | ||||
| 7,655,967 | ||||||
Telecommunications - 4.0% | ||||||
| 115,800 | Amdocs, Ltd.* | 3,060,594 | ||||
| 617,700 | Arris Group, Inc.* | 5,380,167 | ||||
| 622,100 | CGI Group, Inc., Class A* | 3,751,263 | ||||
| 12,192,024 | ||||||
Transportation - 2.1% | ||||||
| 149,400 | CSX Corp. | 6,373,404 | ||||
Total Common Stocks (Cost $262,693,923) | 297,468,506 | |||||
| Par Value | ||||||
| SHORT TERM INVESTMENTS (c) (d) - 21.1% | ||||||
| $ | 1,210,950 | Bank of America | ||||
3.27%, 07/18/05 | 1,210,950 | |||||
| 968,760 | Barclays | |||||
3.16%, 07/14/05 | 968,760 | |||||
| 1,309,141 | Barclays | |||||
3.25%, 07/26/05 | 1,309,141 | |||||
| 2,421,901 | Calyon | |||||
3.25%, 08/04/05 | 2,421,901 | |||||
| 1,210,950 | Clipper Receivables Corp. | |||||
3.19%, 07/14/05 | 1,210,950 | |||||
| 1,210,950 | Compass Securitization | |||||
3.16%, 07/11/05 | 1,210,950 | |||||
| 2,421,901 | Credit Suisse First Boston Corporation | |||||
3.15%, 09/09/05 | 2,421,901 | |||||
| 1,992,510 | Credit Suisse First Boston Corporation | |||||
3.20%, 07/18/05 | 1,992,510 | |||||
| $ | 9,687,602 | Credit Suisse First Boston Corporation Repurchase Agreement dated June 30, 2005, at 3.48%, due July 1, 2005 with a maturity amount of $9,688,538, collateralized by various corporate obligations with aggregate market value of $9,087,320. | $ | 9,687,602 | ||
| 1,453,140 | Dexia Group | |||||
3.24%, 07/21/05 | 1,453,140 | |||||
| 1,210,950 | First Tennessee National Corporation | |||||
3.22%, 08/09/05 | 1,210,950 | |||||
| 1,210,950 | Fortis Bank | |||||
3.11%, 07/05/05 | 1,210,950 | |||||
| 1,237,646 | Goldman Sachs Group, Inc. | |||||
3.32%, 12/28/05 | 1,237,646 | |||||
| 1,210,950 | Goldman Sachs Group, Inc. | |||||
3.33%, 08/05/05 | 1,210,950 | |||||
| 14,020,475 | Goldman Sachs Group, Inc. Repurchase Agreement dated June 30, 2005, at 3.48%, due July 1, 2005 with a maturity amount of $14,021,829, collateralized by various corporate obligations with aggregate market value of $14,280,462. | 14,020,475 | ||||
| 1,210,950 | Grampian Funding LLC | |||||
3.28%, 07/13/05 | 1,210,950 | |||||
| 880,555 | Greyhawk Funding | |||||
3.31%, 08/09/05 | 880,555 | |||||
| 1,210,950 | HBOS Halifax Bank of Scotland | |||||
3.15%, 08/08/05 | 1,210,950 | |||||
| 1,210,950 | HSBC Banking/Holdings Plc | |||||
3.25%, 08/05/05 | 1,210,950 | |||||
| 1,210,950 | JP Morgan Chase & Co. | |||||
3.20%, 07/20/05 | 1,210,950 | |||||
| 2,421,900 | Jupiter Securitization Corp. | |||||
3.21%, 07/15/05 | 2,421,900 | |||||
| 2,439,448 | Lehman Brothers, Inc. Repurchase Agreement dated June 30, 2005, at 3.48%, due July 1, 2005 with a maturity amount of $2,439,684, collateralized by various corporate obligations with aggregate market value of $2,488,263. | 2,439,448 | ||||
| 1,210,950 | Merrill Lynch & Co. Repurchase Agreement dated June 30, 2005, at 3.48%, due July 1, 2005 with a maturity amount of $1,211,067, collateralized by various corporate obligations with aggregate market value of $1,241,121. | 1,210,950 | ||||
| 1,210,950 | Nordea Bank of Finland Plc (NY Branch) | |||||
3.17%, 08/09/05 | 1,210,950 | |||||
| 1,449,718 | Park Avenue Receivables Corp. | |||||
3.30%, 07/14/05 | 1,449,718 | |||||
| 1,564,125 | Prefco | |||||
3.28%, 07/08/05 | 1,564,125 | |||||
| 1,453,140 | Rabobank Nederland | |||||
3.25%, 08/08/05 | 1,453,140 | |||||
| 1,210,950 | Societe Generale | |||||
3.24%, 08/09/05 | 1,210,950 | |||||
| 999,721 | The Bank of the West | |||||
3.27%, 07/27/05 | 999,721 | |||||
| 1,074,964 | Toronto Dominion Bank | |||||
3.25%, 08/02/05 | 1,074,964 | |||||
See Notes to Financial Statements.
F-7
Table of Contents
SELECT VALUE OPPORTUNITY FUND
PORTFOLIO OF INVESTMENTS, Continued • June 30, 2005 (Unaudited)
| Par Value | Value (Note 2) | |||||
| SHORT TERM INVESTMENTS (c) (d) (continued) | ||||||
| $1,427,601 | Wells Fargo | |||||
3.27%, 08/01/05 | $ | 1,427,601 | ||||
Total Short Term Investments (Cost $64,966,598) | 64,966,598 | |||||
| Total Investments - 117.8% (Cost $327,660,521) | 362,435,104 | |||||
| Net Other Assets and Liabilities - (17.8)% | (54,870,165 | ) | ||||
| Total Net Assets - 100.0% | $ | 307,564,939 | ||||
| * | Non-income producing security. |
| (a) | Contingent Value Obligation. |
| (b) | All or a portion of this security is out on loan at period end. |
| (c) | Investments made with cash collateral received from securities on loan. |
| (d) | Effective yield at time of purchase, excluding repurchase agreements. |
| ADR | American Depositary Receipt. Shares of a foreign based corporation held in U.S. banks entitling the shareholder to all dividends and capital gains. |
FEDERAL INCOME TAX INFORMATION (SEE NOTE 2)
At June 30, 2005, the aggregate cost of investment securities for tax purposes was $327,988,000. Net unrealized appreciation (depreciation) aggregated $34,447,104, of which $41,154,889 related to appreciated investment securities and $(6,707,785) related to depreciated investment securities.
OTHER INFORMATION
For the six months ended June 30, 2005, the aggregate cost of purchases and the proceeds of sales, other than from short-term investments, included $136,030,559 and $171,514,697 of non-governmental issuers, respectively.
Industry/Sector Concentration of Investments
as a Percentage of Net Assets:
Basic Materials | 8.9 | % | |
Communications | 5.4 | ||
Consumer Cyclical | 18.1 | ||
Consumer Non-Cyclical | 9.2 | ||
Diversified | 2.1 | ||
Energy | 6.8 | ||
Financial | 19.8 | ||
Industrial | 22.8 | ||
Technology | 2.5 | ||
Utilities | 1.1 | ||
Short-Term Investments | 21.1 | ||
Net Other Assets and Liabilities | (17.8 | ) | |
Total | 100.0 | % | |
See Notes to Financial Statements.
F-8
Table of Contents
SELECT INTERNATIONAL EQUITY FUND
PORTFOLIO OF INVESTMENTS • June 30, 2005 (Unaudited)
| Shares | Value (Note 2) | ||||
| COMMON STOCKS - 97.7% | |||||
Australia - 1.8% | |||||
| 15,745 | Australia & New Zealand Banking Group, Ltd.* | $ | 260,796 | ||
| 126,600 | BHP Billiton, Ltd. | 1,749,882 | |||
| 4,985 | Macquarie Bank, Ltd. | 226,830 | |||
| 44,581 | National Australia Bank, Ltd. | 1,044,322 | |||
| 22,530 | Oil Search, Ltd. | 52,674 | |||
| 5,601 | RHI AG* | 152,566 | |||
| 9,163 | Rinker Group, Ltd. | 97,693 | |||
| 36,000 | Santos, Ltd. | 310,347 | |||
| 29,435 | Stockland | 123,738 | |||
| 9,757 | Suncorp-Metway, Ltd. | 149,426 | |||
| 205,400 | Telstra Corp. | 791,497 | |||
| 20,320 | Woolworths, Ltd. | 255,487 | |||
| 5,215,258 | |||||
Austria - 1.1% | |||||
| 2,392 | Bank Austria Creditanstalt AG | 249,513 | |||
| 4,287 | Boehler-Uddeholm | 567,276 | |||
| 4,400 | Flughafen Wien AG | 285,260 | |||
| 3,310 | OMV AG | 1,441,260 | |||
| 7,509 | Voestalpine AG (a) | 525,877 | |||
| 1,254 | Wienerberger AG | 58,199 | |||
| 3,127,385 | |||||
Belgium - 2.7% | |||||
| 1,753 | AGFA-Gevaert NV | 48,450 | |||
| 5,076 | Belgacom SA | 173,446 | |||
| 700 | Colruyt SA | 95,421 | |||
| 6,700 | Delhaize Group | 401,958 | |||
| 116,829 | Dexia | 2,573,265 | |||
| 421 | Electrabel SA | 183,880 | |||
| 53,200 | Fortis (a) | 1,476,788 | |||
| 45,300 | Fortis (Netherlands) | 1,256,395 | |||
| 8,155 | KBC Group | 644,111 | |||
| 2,076 | Solvay SA | 213,312 | |||
| 13,700 | UCB SA | 665,982 | |||
| 7,733,008 | |||||
Brazil - 0.5% | |||||
| 46,000 | Cia Vale do Rio Doce, ADR (a) | 1,346,881 | |||
Canada - 1.1% | |||||
| 6,700 | Canadian National Railway Co. | 386,387 | |||
| 25,600 | Canadian Natural Resources, Ltd. | 927,415 | |||
| 2,300 | Canadian Pacific Railway, Ltd. | 79,550 | |||
| 13,600 | EnCana Corp. (a) | 536,299 | |||
| 2,600 | Magna International, Inc., Class A | 182,569 | |||
| 6,500 | National Bank of Canada | 288,565 | |||
| 4,200 | Petro-Canada | 273,295 | |||
| 2,200 | Quebecor, Inc., Class B | 52,990 | |||
| 4,200 | Royal Bank of Canada | 260,101 | |||
| 2,600 | Telus Corp. | 88,654 | |||
| 1,300 | Telus Corp., Non Voting | 45,674 | |||
| 3,121,499 | |||||
Denmark - 0.1% | |||||
| 9 | AP Moller - Maersk A/S, Class A | $ | 85,315 | ||
| 13 | AP Moller - Maersk A/S, Class B | 124,077 | |||
| 1,500 | Tele Danmark | 64,278 | |||
| 273,670 | |||||
Finland - 1.4% | |||||
| 100 | Finnair Oyj | 858 | |||
| 31,900 | Fortum Oyj | 511,247 | |||
| 11,700 | Kesko Oyj, Class B | 293,507 | |||
| 2,800 | Metso Oyj | 61,029 | |||
| 150,700 | Nokia Oyj* | 2,524,567 | |||
| 11,700 | Rautaruukki Oyj | 174,774 | |||
| 28,900 | Sampo Oyj, Class A | 450,233 | |||
| 1,800 | Wartsila Oyj, Class A | 50,946 | |||
| 1,200 | Wartsila Oyj, Class B | 34,632 | |||
| 4,101,793 | |||||
France - 8.3% | |||||
| 80,600 | AXA | 2,015,113 | |||
| 50,330 | BNP Paribas | 3,451,706 | |||
| 1,589 | Bongrain SA | 101,865 | |||
| 53,298 | Cie de Saint-Gobain | 2,958,372 | |||
| 24,900 | Dassault Systemes SA (a) | 1,206,218 | |||
| 9,041 | France Telecom SA | 264,203 | |||
| 200 | Fromageries Bel Vache qui Rit | 33,867 | |||
| 19,600 | Imerys SA | 1,350,124 | |||
| 15,100 | Lafarge SA | 1,376,208 | |||
| 6,923 | Michelin, Class B | 421,617 | |||
| 14,871 | PSA Peugeot Citroen | 881,014 | |||
| 9,285 | Sanofi-Aventis | 762,563 | |||
| 56,039 | Scor SA | 112,518 | |||
| 8,552 | Societe Generale | 870,454 | |||
| 5,577 | Suez SA | 151,305 | |||
| 33,546 | Total SA, Class B | 7,883,832 | |||
| 4,798 | Vinci SA | 399,275 | |||
| 24,240,254 | |||||
Germany - 6.2% | |||||
| 1,914 | Adidas-Salomon AG | 320,662 | |||
| 587 | Allianz AG | 67,429 | |||
| 10,475 | Altana AG | 599,673 | |||
| 29,184 | BASF AG | 1,941,473 | |||
| 55,649 | Bayerische Motoren Werke (BMW) AG | 2,539,616 | |||
| 268 | Celesio AG | 21,067 | |||
| 1,750 | Continental AG | 126,135 | |||
| 8,269 | DaimlerChrysler AG | 335,859 | |||
| 2,299 | Deutsche Bank AG | 179,943 | |||
| 63,500 | Deutsche Post AG | 1,483,900 | |||
| 25,185 | E.ON AG | 2,244,478 | |||
| 914 | HeidelbergCement AG | 65,768 | |||
| 3,586 | HypoVereinsbank* | 93,298 | |||
| 3,709 | Man AG | 154,012 | |||
| 6,619 | Merck KGaA | 527,356 | |||
| 9,414 | RWE AG | 607,822 | |||
| 7,100 | SAP AG | 1,236,730 | |||
| 33,420 | Schering AG | 2,056,730 | |||
See Notes to Financial Statements.
F-9
Table of Contents
SELECT INTERNATIONAL EQUITY FUND
PORTFOLIO OF INVESTMENTS, Continued • June 30, 2005 (Unaudited)
| Shares | Value (Note 2) | ||||
Germany (continued) | |||||
| 2,300 | Schwarz Pharma AG | $ | 104,324 | ||
| 26,100 | Siemens AG | 1,904,889 | |||
| 9,200 | Suedzucker AG | 184,166 | |||
| 17,926 | ThyssenKrupp AG | 312,010 | |||
| 10,582 | TUI AG (a) | 262,261 | |||
| 16,300 | Volkswagen AG | 745,646 | |||
| 18,115,247 | |||||
Greece - 0.0% | |||||
| 2,411 | Alpha Credit Bank SA | 64,268 | |||
Hong Kong - 1.1% | |||||
| 9,000 | Cheung Kong Holdings, Ltd. | 87,717 | |||
| 18,000 | Chueng Kong Infrastucture | 53,614 | |||
| 118,500 | CLP Holdings, Ltd. | 680,005 | |||
| 100,000 | Esprit Holdings, Ltd. | 723,738 | |||
| 16,000 | Guoco Group, Ltd. | 164,691 | |||
| 113,000 | Hang Lung Group, Ltd. | 200,639 | |||
| 213,000 | Hong Kong Electric | 972,897 | |||
| 28,000 | Hong Kong Ferry Holdings Co. | 33,864 | |||
| 82,000 | Yue Yuen Industrial Holdings, Ltd. | 251,102 | |||
| 3,168,267 | |||||
Ireland - 1.0% | |||||
| 18,785 | Allied Irish Banks PLC | 402,169 | |||
| 112,075 | Bank of Ireland | 1,819,219 | |||
| 30,735 | CRH, Plc | 816,003 | |||
| 3,037,391 | |||||
Italy - 5.0% | |||||
| 59,632 | Banca Intesa SpA | 273,004 | |||
| 38,204 | Banca Intesa SpA RNC | 163,351 | |||
| 53,746 | Banca Monte dei Paschi di Siena SpA (a) | 189,662 | |||
| 10,101 | Banca Popolare di Milano | 99,635 | |||
| 3,338 | Banche Popolari Unite Scrl | 66,215 | |||
| 44,110 | Capitalia SpA | 247,026 | |||
| 187,208 | Enel SpA (a) | 1,630,350 | |||
| 360,918 | ENI SpA (a) | 9,302,846 | |||
| 32,801 | Fiat SpA* | 238,443 | |||
| 5,900 | Fiat SpA - RCN* | 39,535 | |||
| 4,408 | FinecoGroup SpA | 39,508 | |||
| 66,944 | Finmeccanica SpA | 62,551 | |||
| 9,200 | IFI-Istituto Finanziario Industriale SpA* | 129,751 | |||
| 13,400 | Italcementi SpA | 147,817 | |||
| 1,300 | Italmobiliare SpA | 82,111 | |||
| 64,800 | Mediaset SpA | 763,410 | |||
| 4,500 | Natuzzi SpA, Sponsored ADR | 36,630 | |||
| 12,821 | Sanpaolo IMI SpA (a) | 176,167 | |||
| 27,700 | SMI-Societa Metallurgica Italiana SpA* | 21,744 | |||
| 7,538 | Snam Rete Gas SpA | 40,345 | |||
| 303,840 | Telecom Italia SpA | 788,308 | |||
| 14,538,409 | |||||
Japan - 20.8% | |||||
| 3,580 | Acom Co., Ltd. | 229,500 | |||
| 2,350 | Aiful Corp. | $ | 175,228 | ||
| 6,700 | Aisin Seiki Co., Ltd. | 145,284 | |||
| 6,000 | Alps Electric Co., Ltd. | 91,858 | |||
| 10,000 | Asahi Kasei Corp | 47,606 | |||
| 52,200 | Astellas Pharma Inc. | 1,783,771 | |||
| 5,800 | Autobacs Seven Co., Ltd. | 195,059 | |||
| 3,000 | Canon Sales Co., Inc. | 50,582 | |||
| 47,200 | Canon, Inc. | 2,485,330 | |||
| 35,500 | Chubu Electric Power Co., Inc. (a) | 851,411 | |||
| 58,500 | Chugai Pharmaceutical Co., Ltd. | 903,002 | |||
| 10,400 | Chugoku Electric Power Co., Inc. | 203,011 | |||
| 24,000 | Cosmo Oil Co., Ltd. | 101,704 | |||
| 26,800 | Credit Saison Co., Ltd. | 891,642 | |||
| 28,000 | Daido Steel Co., Ltd. | 126,228 | |||
| 19,400 | Daiichi Pharmaceutical Co., Ltd. | 429,420 | |||
| 53,100 | Daikin Industries, Ltd. | 1,328,577 | |||
| 8,900 | Daito Trust Construction Co., Ltd. | 333,018 | |||
| 16,000 | Daiwa Kosho Lease Co., Ltd. | 86,557 | |||
| 25,500 | Eisai Co., Ltd. | 857,587 | |||
| 2,400 | Electric Power Development Co. | 69,462 | |||
| 18,700 | Fanuc, Ltd. | 1,188,666 | |||
| 101,000 | Fuji Heavy Industries, Ltd. | 420,719 | |||
| 51,000 | Furukawa Electric Co. (The), Ltd.* | 197,728 | |||
| 7,200 | Hirose Electric Co., Ltd. | 792,643 | |||
| 17,000 | Hokkaido Electric Power Co., Inc. | 347,940 | |||
| 89,300 | Honda Motor Co., Ltd. | 4,404,211 | |||
| 14,400 | Hoya Corp. | 1,661,888 | |||
| 87,000 | Isuzu Motors, Ltd. | 233,757 | |||
| 99,000 | Itochu Corp. | 500,757 | |||
| 2,000 | Itoham Foods, Inc. | 8,584 | |||
| 2,000 | Japan Airport Terminal, Co., Ltd. | 18,538 | |||
| 30 | Japan Tobacco, Inc. | 400,325 | |||
| 5,800 | JFE Holdings, Inc. | 143,287 | |||
| 109,000 | Kajima Corp. | 402,939 | |||
| 25,000 | Kamigumi Co., Ltd. | 192,949 | |||
| 16,000 | Kandenko Co., Ltd. | 96,799 | |||
| 27,900 | Kansai Electric Power Co. (The), Inc. | 560,968 | |||
| 83,000 | Kao Corp. | 1,956,947 | |||
| 170,000 | Kawasaki Heavy Industries, Ltd. (a) | 326,481 | |||
| 24,000 | Kawasaki Kisen Kaisha, Ltd. | 142,386 | |||
| 8,000 | Kikkoman Corp. | 70,760 | |||
| 63,000 | Kobe Steel, Ltd. | 118,718 | |||
| 34,000 | Komatsu, Ltd. | 263,944 | |||
| 5,400 | Konami Corp. | 113,930 | |||
| 19,000 | Kyushu Electric Power Co., Inc. | 412,857 | |||
| 12,500 | Leopalace21 Corp. | 207,713 | |||
| 28,000 | Maeda Corp. | 150,464 | |||
| 7,000 | Makita Corp. | 137,589 | |||
| 150,000 | Marubeni Corp. | 515,283 | |||
| 6,000 | Maruichi Steel Tube, Ltd. | 128,753 | |||
| 77,000 | Matsushita Electric Industrial Co., Ltd. | 1,168,434 | |||
| 129,000 | Mazda Motor Corp. (a) | 485,015 | |||
| 65,000 | Mitsubishi Chemical Corp. | 190,470 | |||
| 158,800 | Mitsubishi Corp. | 2,159,142 | |||
| 77,000 | Mitsubishi Materials Corp. | 181,895 | |||
| 262 | Mitsubishi Tokyo Financial Group, Inc. | 2,222,901 | |||
| 21,000 | Mitsui & Co., Ltd. | 198,810 | |||
See Notes to Financial Statements.
F-10
Table of Contents
SELECT INTERNATIONAL EQUITY FUND
PORTFOLIO OF INVESTMENTS, Continued • June 30, 2005 (Unaudited)
| Shares | Value (Note 2) | ||||
Japan (continued) | |||||
| 27,000 | Mitsui Chemicals, Inc. | $ | 158,480 | ||
| 28,000 | Mitsui O.S.K. Lines, Ltd. | 172,933 | |||
| 41,000 | Mitsui Trust Holdings, Inc. | 421,423 | |||
| 33 | Mizuho Financial Group, Inc. | 149,364 | |||
| 9,000 | Nagase & Co., Ltd. | 91,858 | |||
| 236,000 | Nikko Cordial Corp. | 1,038,391 | |||
| 7,900 | Nintendo Co., Ltd. | 826,256 | |||
| 8,000 | Nippo Corp. | 55,396 | |||
| 62,000 | Nippon Light Metal Co., Ltd. | 147,020 | |||
| 38,500 | Nippon Mining Holdings, Inc. | 218,344 | |||
| 23,000 | Nippon Oil Corp. | 156,154 | |||
| 156,000 | Nippon Steel Corp. | 362,889 | |||
| 9,000 | Nippon Suisan Kaisha, Ltd. | 33,919 | |||
| 45,000 | Nippon Yusen Kabushiki Kaisha | 258,859 | |||
| 48,000 | Nishimatsu Construction Co., Ltd. (a) | 173,113 | |||
| 28,600 | Nissan Motor Co., Ltd. | 283,138 | |||
| 7,000 | Nisshin Oillio Group, Ltd. | 39,320 | |||
| 13,300 | Nissin Food Products Co., Ltd. | 341,164 | |||
| 27,900 | Nitto Denko Corp. | 1,599,892 | |||
| 27,000 | Obayashi Corp. | 145,334 | |||
| 7,000 | Olympus Corp. | 134,433 | |||
| 9,100 | Ono Pharmaceutical Co., Ltd. | 431,575 | |||
| 155,000 | Osaka Gas Co., Ltd. | 487,738 | |||
| 4,600 | Promise Co., Ltd. | 294,888 | |||
| 38,000 | Resona Holdings, Inc.* | 70,922 | |||
| 6,900 | Ryosan Co. | 164,863 | |||
| 29,400 | Sankyo Co., Ltd. | 564,620 | |||
| 30,500 | Secom Co., Ltd. | 1,311,739 | |||
| 69,000 | Shimizu Corp. | 321,639 | |||
| 32,700 | Shin-Etsu Chemical Co., Ltd. | 1,241,250 | |||
| 9,000 | Shizuoka Bank (The), Ltd. | 77,333 | |||
| 11,500 | SMC Corp. | 1,254,621 | |||
| 3,000 | Stanley Electric Co., Ltd. | 48,688 | |||
| 39,000 | Sumitomo Chemical Co., Ltd. | 179,335 | |||
| 217,000 | Sumitomo Corp. | 1,739,365 | |||
| 3,000 | Sumitomo Electric Industries, Ltd. | 30,728 | |||
| 18,000 | Sumitomo Heavy Industries, Ltd. | 86,503 | |||
| 157,000 | Sumitomo Metal Industries, Ltd. | 268,957 | |||
| 9,000 | Sumitomo Metal Mining Co., Ltd. | 61,753 | |||
| 33,000 | Taiheiyo Cement Corp. | 88,071 | |||
| 116,000 | Taisei Corp. | 391,164 | |||
| 33,000 | Taisho Pharmaceutical Co., Ltd. | 642,683 | |||
| 114,500 | Takeda Pharmaceutical Co., Ltd. | 5,678,027 | |||
| 15,780 | Takefuji Corp. | 1,067,081 | |||
| 29,000 | Teijin, Ltd. | 134,659 | |||
| 12,500 | Terumo Corp. | 360,653 | |||
| 29,100 | Tohoku Electric Power Co., Inc. | 620,517 | |||
| 20,300 | Tokyo Electric Power Co. (The), Inc. | 484,118 | |||
| 45,000 | Tokyo Gas Co., Ltd. | 168,380 | |||
| 42,000 | TonenGeneral Sekiyu K.K. | 454,422 | |||
| 1,000 | Toshiba TEC Corp. | 4,436 | |||
| 15,000 | Tosoh Corp. | 62,348 | |||
| 15,200 | Toyota Motor Corp. | 544,081 | |||
| 1,000 | Wacoal Corp. | 12,659 | |||
| 2,300 | Yamada Denki Co., Ltd. | 132,305 | |||
| 8,000 | Yamato Transport Co., Ltd. | 111,081 | |||
| 60,511,909 | |||||
Luxembourg - 0.1% | |||||
| 11,410 | Arcelor | $ | 223,852 | ||
Mexico - 0.4% | |||||
| 17,400 | Fomento Economico Mexicano SA de CV, Sponsored ADR | 1,036,518 | |||
Netherlands - 7.7% | |||||
| 252,119 | ABN-Amro Holdings | 6,205,743 | |||
| 79,217 | Aegon NV | 1,026,199 | |||
| 12,800 | Akzo Nobel NV | 504,411 | |||
| 5,101 | Corio NV | 284,865 | |||
| 5,025 | DSM NV | 344,014 | |||
| 83,200 | Elsevier NV | 1,159,310 | |||
| 700 | Gamma Holding NV | 29,592 | |||
| 11,783 | Heineken NV | 363,999 | |||
| 220,524 | ING Groep NV | 6,233,592 | |||
| 65,300 | Koninklijke (Royal) Phillips Electronics NV | 1,650,758 | |||
| 26,338 | Koninklijke Ahold NV* | 216,628 | |||
| 11,086 | Koninklijke Wessanen NV | 156,886 | |||
| 13,242 | Oce NV | 195,085 | |||
| 31,950 | Royal Dutch Petroleum Co. | 2,086,837 | |||
| 2,900 | Wereldhave NV | 309,203 | |||
| 77,100 | Wolters Kluwer NV | 1,475,315 | |||
| 22,242,437 | |||||
Norway - 0.7% | |||||
| 51,600 | DnB Nor ASA | 538,441 | |||
| 3,500 | Kvaerner ASA* | 69,700 | |||
| 13,100 | Norsk Hydro ASA | 1,201,734 | |||
| 5,300 | Orkla ASA | 195,289 | |||
| 7,800 | Yara International ASA | 124,026 | |||
| 2,129,190 | |||||
Singapore - 0.5% | |||||
| 94,000 | Capitaland, Ltd. | 132,610 | |||
| 249,000 | ComfortDelgro Corp., Ltd. | 249,435 | |||
| 43,000 | DBS Group Holding, Ltd. | 364,482 | |||
| 31,000 | Fraser & Neave, Ltd. | 288,492 | |||
| 15,000 | Hotel Properties, Ltd. | 11,114 | |||
| 16,000 | Keppel Corp., Ltd. | 118,550 | |||
| 20,000 | Neptune Orient Lines, Ltd. | 44,812 | |||
| 23,020 | SembCorp Industries, Ltd. | 36,432 | |||
| 43,000 | Straits Trading Co., Ltd. | 57,858 | |||
| 46,000 | United Industrial Corp., Ltd. | 27,130 | |||
| 1,330,915 | |||||
South Korea - 0.6% | |||||
| 4,560 | Samsung Electronics Co., Ltd., GDR (a) (b) | 1,089,811 | |||
| 32,100 | SK Telecom Co., Ltd., ADR (a) | 654,840 | |||
| 1,744,651 | |||||
Spain - 2.8% | |||||
| 629 | Acciona SA | 62,386 | |||
| 5,840 | ACS, Actividades de Construccion y Servicios SA | 163,456 | |||
| 32,200 | Altadis SA | 1,350,310 | |||
See Notes to Financial Statements.
F-11
Table of Contents
SELECT INTERNATIONAL EQUITY FUND
PORTFOLIO OF INVESTMENTS, Continued • June 30, 2005 (Unaudited)
| Shares | Value (Note 2) | |||||
Spain (continued) | ||||||
| 179,000 | Banco Popular Espanol SA | $ | 2,162,929 | |||
| 71,911 | Endesa SA | 1,688,281 | ||||
| 1,200 | Fomento de Construcciones Y Contratas SA | 67,624 | ||||
| 47,716 | Iberdrola SA | 1,259,339 | ||||
| 41,700 | Repsol YPF SA | 1,067,273 | ||||
| 9,984 | Sacyr Vallehermoso SA | 235,364 | ||||
| 8,056,962 | ||||||
Sweden - 1.7% | ||||||
| 5,400 | Atlas Copco AB - Class A | 85,796 | ||||
| 11,800 | Electrolux AB, Class B | 251,738 | ||||
| 525,200 | Ericsson AB, Class B | 1,689,081 | ||||
| 25,500 | Hennes & Mauritz AB, Class B | 898,514 | ||||
| 7,000 | Holmen AB, Class B | 189,249 | ||||
| 90,600 | Nordea Bank AB* | 824,212 | ||||
| 18,400 | Skanska AB, Class B* | 227,508 | ||||
| 4,400 | SKF AB, Class B | 45,102 | ||||
| 37,400 | Swedish Match AB | 425,297 | ||||
| 46,500 | TeliaSonera AB | 222,236 | ||||
| 4,858,733 | ||||||
Switzerland - 6.5% | ||||||
| 38,350 | Adecco SA | 1,745,832 | ||||
| 6 | Banque Cantonale Vaudoise | 1,442 | ||||
| 11,088 | Credit Suisse Group | 436,917 | ||||
| 32,400 | Holcim, Ltd. | 1,969,989 | ||||
| 10,700 | Nestle SA | 2,735,784 | ||||
| 59,300 | Novartis AG | 2,822,049 | ||||
| 21,900 | Roche Holdings AG | 2,768,975 | ||||
| 2,173 | Swisscom AG | 708,044 | ||||
| 39,140 | UBS AG | 3,051,019 | ||||
| 527 | Valora Holding AG* | 119,236 | ||||
| 15,533 | Zurich Financial Services AG* | 2,673,490 | ||||
| 19,032,777 | ||||||
United Kingdom - 25.6% | ||||||
| 17,100 | Allied Domecq, Plc | 206,940 | ||||
| 12,590 | Arriva, Plc | 123,017 | ||||
| 31,280 | Astrazeneca, Plc | 1,296,017 | ||||
| 76,226 | Aviva, Plc | 850,036 | ||||
| 367,513 | Barclays, Plc | 3,660,166 | ||||
| 34,057 | Barratt Developments, Plc | 437,488 | ||||
| 38,314 | BBA Group, Plc | 211,912 | ||||
| 318,900 | BG Group, Plc | 2,624,286 | ||||
| 83,354 | Boots Group, Plc | 910,097 | ||||
| 109,722 | BP Amoco Capital, Plc | 1,142,915 | ||||
| 99,600 | British Land Co., Plc | 1,564,254 | ||||
| 426,547 | BT Group, Plc | 1,758,890 | ||||
| 43,421 | Cadbury Schweppes, Plc | 414,926 | ||||
| 517,631 | Centrica, Plc | 2,150,720 | ||||
| 8,406 | Cobham, Plc | 213,250 | ||||
| 23,300 | Diageo, Plc | 343,795 | ||||
| 253,871 | Dixons Group, Plc | 714,590 | ||||
| 17,973 | Gallaher Group Plc | 267,128 | ||||
| 502,236 | GlaxoSmithKline, Plc | 12,164,861 | ||||
| 16,360 | GUS, Plc | 258,260 | ||||
| 13,001 | Hanson Plc | $ | 125,052 | |||
| 133,083 | HBOS, Plc | 2,053,135 | ||||
| 306,400 | HSBC Holdings, Plc | 4,927,851 | ||||
| 24,532 | Imi, Plc | 183,406 | ||||
| 43,200 | Imperial Tobacco Group, Plc | 1,164,090 | ||||
| 56,200 | J Sainsbury, Plc | 287,413 | ||||
| 391,444 | Kingfisher, Plc | 1,726,429 | ||||
| 313,682 | Lloyds TSB Group, Plc | 2,660,080 | ||||
| 675,600 | Morrison WM Supermarkets | 2,252,924 | ||||
| 292,918 | National Grid Transco, Plc | 2,841,105 | ||||
| 25,320 | Next, Plc | 685,010 | ||||
| 92,055 | Northern Foods, Plc | 260,764 | ||||
| 539 | Persimmon, Plc | 7,547 | ||||
| 92,300 | Royal Bank of Scotland | 2,789,994 | ||||
| 82,540 | Schroders, Plc | 1,120,223 | ||||
| 78,614 | Scottish & Southern Energy, Plc | 1,427,754 | ||||
| 76,441 | Scottish Power, Plc | 680,440 | ||||
| 14,500 | Severn Trent, Plc | 264,383 | ||||
| 181,453 | Shell Transportation & Trading Co., Plc | 1,765,663 | ||||
| 152,621 | Smith & Nephew, Plc | 1,507,682 | ||||
| 27,814 | Smith WH, Plc | 182,012 | ||||
| 92,000 | Standard Chartered, Plc | 1,682,410 | ||||
| 12,158 | Tate & Lyle, Plc | 103,974 | ||||
| 41,006 | Taylor Woodrow, Plc | 248,306 | ||||
| 490,000 | Tesco, Plc | 2,800,208 | ||||
| 13,200 | The Berkeley Group Holdings, Plc | 216,540 | ||||
| 1,918,800 | Vodafone Airtouch, Plc | 4,678,564 | ||||
| 45,608 | Wimpey (George), Plc | 358,963 | ||||
| 142,424 | Wolseley, Plc | 2,997,749 | ||||
| 102,808 | WPP Group, Plc | 1,058,914 | ||||
| 74,372,133 | ||||||
Total Common Stocks (Cost $246,064,852) | 283,623,407 | |||||
| Par Value | ||||||
| U.S. GOVERNMENT OBLIGATION - 0.2% | ||||||
U.S. Treasury Bill - 0.2% | ||||||
| $ | 520,000 | 2.83%, 08/25/05 (c) (d) | 517,752 | |||
| 20,000 | 2.90%, 08/25/05 (c) (d) | 19,911 | ||||
| 537,663 | ||||||
Total U.S. Government Obligation (Cost $537,663) | 537,663 | |||||
| Shares | ||||||
| PREFERRED STOCKS - 0.3% | ||||||
Germany - 0.3% | ||||||
| 3,869 | RWE AG Preferred | 221,258 | ||||
| 15,200 | Volkswagen AG Preferred | 539,053 | ||||
| 760,311 | ||||||
See Notes to Financial Statements.
F-12
Table of Contents
SELECT INTERNATIONAL EQUITY FUND
PORTFOLIO OF INVESTMENTS, Continued • June 30, 2005 (Unaudited)
| Shares | Value (Note 2) | ||||||
| Italy - 0.0% | |||||||
| 5,600 | Fiat SpA Preferred* | $ | 36,103 | ||||
Total Preferred Stocks (Cost $594,491) | 796,414 | ||||||
| RIGHTS - 0.0% | |||||||
| Spain - 0.0% | |||||||
| 9,984 | Sacyr Vallehermoso SA* | 7,367 | |||||
| Thailand - 0.0% | |||||||
| 100,421 | TelecomAsia Corp., Public Co., Ltd.* (e) | 0 | |||||
| United Kingdom - 0.0% | |||||||
| 332,400 | Ti Automotive, Ltd.* (e) | 0 | |||||
Total Rights (Cost $68,642) | 7,367 | ||||||
| Par Value | |||||||
| SHORT TERM INVESTMENTS (c) (f) - 6.0% | |||||||
| $ | 326,464 | Bank of America | |||||
3.27%, 07/18/05 | 326,464 | ||||||
| 261,171 | Barclays | ||||||
3.16%, 07/14/05 | 261,171 | ||||||
| 352,935 | Barclays | ||||||
3.25%, 07/26/05 | 352,935 | ||||||
| 652,927 | Calyon | ||||||
3.25%, 08/04/05 | 652,927 | ||||||
| 326,464 | Clipper Receivables Corp. | ||||||
3.19%, 07/14/05 | 326,464 | ||||||
| 326,464 | Compass Securitization | ||||||
3.16%, 07/11/05 | 326,464 | ||||||
| 652,927 | Credit Suisse First Boston Corporation | ||||||
3.15%, 09/09/05 | 652,927 | ||||||
| 537,166 | Credit Suisse First Boston Corporation | ||||||
3.20%, 07/18/05 | 537,166 | ||||||
| 2,611,707 | Credit Suisse First Boston Corporation Repurchase Agreement dated June 30, 2005, at 3.48%, due July 1, 2005 with a maturity amount of $2,611,956, collateralized by various corporate obligations with aggregate market value of $2,449,875. | 2,611,707 | |||||
| 391,756 | Dexia Group | ||||||
3.24%, 07/21/05 | 391,756 | ||||||
| 326,463 | First Tennessee National Corporation | ||||||
3.22%, 08/09/05 | 326,463 | ||||||
| 326,463 | Fortis Bank | ||||||
3.11%, 07/05/05 | 326,463 | ||||||
| 326,463 | Goldman Sachs Group, Inc. | ||||||
3.33%, 08/05/05 | 326,463 | ||||||
| 333,660 | Goldman Sachs Group, Inc. | ||||||
3.32%, 12/28/05 | 333,660 | ||||||
| 3,779,818 | Goldman Sachs Group, Inc. Repurchase Agreement dated June 30, 2005, at 3.48%, due July 1, 2005 with a maturity amount of $3,780,178, collateralized by various corporate obligations with aggregate market value of $3,849,909. | 3,779,818 | |||||
| $ | 326,463 | Grampian Funding LLC | |||||
3.28%, 07/13/05 | $ | 326,463 | |||||
| 237,391 | Greyhawk Funding | ||||||
3.31%, 08/09/05 | 237,391 | ||||||
| 326,463 | HBOS Halifax Bank of Scotland | ||||||
3.15%, 08/08/05 | 326,463 | ||||||
| 326,463 | HSBC Banking/Holdings Plc | ||||||
3.25%, 08/05/05 | 326,463 | ||||||
| 326,463 | JP Morgan Chase & Co. | ||||||
3.20%, 07/20/05 | 326,463 | ||||||
| 652,927 | Jupiter Securitization Corp. | ||||||
3.21%, 07/15/05 | 652,927 | ||||||
| 657,658 | Lehman Brothers, Inc. Repurchase Agreement dated June 30, 2005, at 3.48%, due July 1, 2005 with a maturity amount of $657,658, collateralized by various corporate obligations with aggregate market value of $670,817. | 657,658 | |||||
| 326,463 | Merrill Lynch & Co. Repurchase Agreement dated June 30, 2005, at 3.48%, due July 1, 2005 with a maturity amount of $326,463, collateralized by various corporate obligations with aggregate market value of $334,598. | 326,463 | |||||
| 326,463 | Nordea Bank of Finland Plc (NY Branch) | ||||||
3.17%, 08/09/05 | 326,463 | ||||||
| 390,834 | Park Avenue Receivables Corp. | ||||||
3.30%, 07/14/05 | 390,834 | ||||||
| 421,677 | Prefco | ||||||
3.28%, 07/08/05 | 421,677 | ||||||
| 391,756 | Rabobank Nederland | ||||||
3.25%, 08/08/05 | 391,756 | ||||||
| 326,463 | Societe Generale | ||||||
3.24%, 08/09/05 | 326,463 | ||||||
| 269,518 | The Bank of the West | ||||||
3.27%, 07/27/05 | 269,518 | ||||||
| 289,803 | Toronto Dominion Bank | ||||||
3.25%, 08/02/05 | 289,803 | ||||||
| 384,871 | Wells Fargo | ||||||
3.27%, 08/01/05 | 384,871 | ||||||
Total Short Term Investments (Cost $17,514,524) | 17,514,524 | ||||||
| | Total Investments - 104.2% (Cost $264,780,172) | 302,479,375 | |||||
| Net Other Assets and Liabilities - (4.2)% | (12,213,835 | ) | |||||
| Total Net Assets - 100.0% | $ | 290,265,540 | |||||
| * | Non-income producing security. |
| (a) | All or a portion of this security is out on loan at period end. |
| (b) | Security exempt from registration under Rule 144A of the Securities Act of 1933. This security may be resold in transactions exempt from registration, to qualified institutional buyers. At June 30, 2005, these securities amounted to $1,089,811 or 0.4% of net assets. |
| (c) | Effective yield at time of purchase, except repurchase agreements. |
See Notes to Financial Statements.
F-13
Table of Contents
SELECT INTERNATIONAL EQUITY FUND
PORTFOLIO OF INVESTMENTS, Continued • June 30, 2005 (Unaudited)
| (d) | Security has been deposited as initial margin on futures contracts. At June 30, 2005, the Portfolio’s open futures contracts were as follows: |
| Number of Contracts Purchased | Contract Type | Expiration Date | Aggregate Cost | Market Value at June 30, 2005 | ||||||
| 14 | DAX Index | September-2005 | $ | 1,960,509 | $ | 1,956,901 | ||||
| 48 | MSCI SING Index | July-2005 | 1,504,118 | 1,498,853 | ||||||
| 22 | TOPIX Index | September-2005 | 2,386,159 | 2,329,727 | ||||||
| 7 | SP/MIB Index | September-2005 | 1,375,100 | 1,372,265 | ||||||
| $ | 7,225,886 | $ | 7,157,746 | |||||||
| Number of Contracts Sold | Contract Type | Expiration Date | Aggregate Cost | Market Value at June 30, 2005 | ||||||
| 23 | S&P/TSE 60 Index | September-2005 | $ | 2,103,260 | $ | 2,087,190 | ||||
| 15 | FTSE 100 Index | September-2005 | 1,395,521 | 1,377,312 | ||||||
| $ | 3,498,781 | $ | 3,464,502 | |||||||
| (e) | Security has no value. |
| (f) | Investments made with cash collateral received from securities on loan. |
| ADR | American Depositary Receipt. Shares of a foreign based corporation held in U.S. banks entitling the shareholder to all dividends and capital gains. |
| GDR | Global Depositary Receipt. A negotiable certificate held in the bank of one country representing a specific number of shares of a stock traded on an exchange of another country. |
FEDERAL INCOME TAX INFORMATION (SEE NOTE 2)
At June 30, 2005, the aggregate cost of investment securities for tax purposes was $267,895,848. Net unrealized appreciation (depreciation) aggregated $34,583,527, of which $37,214,563 related to appreciated investment securities and $(2,631,036) related to depreciated investment securities.
OTHER INFORMATION
For the six months ended June 30, 2005, the aggregate cost of purchases and the proceeds of sales, other than from short-term investments, included $31,994,522 and $74,007,073 of non-governmental issuers, respectively.
FORWARD FOREIGN CURRENCY CONTRACTS PURCHASED:
Contracts To Receive | Currency | Settlement Dates | Contracts At Value | In Exchange For U.S. $ | Unrealized Appreciation (Depreciation) | |||||||||
| 1,945,810 | CAD | 08/26/05 | $ | 1,589,717 | $ | 1,550,436 | $ | 39,281 | ||||||
| 580,000 | EUR | 08/26/05 | 702,846 | 713,436 | (10,590 | ) | ||||||||
| 1,000,598,640 | JPY | 08/26/05 | 9,066,146 | 9,379,106 | (312,960 | ) | ||||||||
| 27,379,090 | NOK | 08/26/05 | 4,194,078 | 4,259,762 | (65,684 | ) | ||||||||
| 36,732,588 | SEK | 08/26/05 | 4,719,264 | 5,030,129 | (310,865 | ) | ||||||||
| 13,063,650 | CHF | 08/26/05 | 10,222,566 | 10,684,933 | (462,367 | ) | ||||||||
| $ | 30,494,617 | $ | 31,617,802 | $ | (1,123,185 | ) | ||||||||
FORWARD FOREIGN CURRENCY CONTRACTS SOLD:
| Contracts To Deliver | Currency | Settlement Dates | Contracts At Value | In Exchange For U.S. $ | Unrealized Appreciation (Depreciation) | |||||||||
| 901,481 | AUD | 08/26/05 | $ | 685,038 | $ | 679,735 | $ | (5,303 | ) | |||||
| 3,555,273 | GBP | 08/26/05 | 6,362,848 | 6,479,861 | 117,013 | |||||||||
| 785,540 | CAD | 08/26/05 | 641,782 | 631,782 | (10,000 | ) | ||||||||
| 267,716 | DKK | 08/26/05 | 43,536 | 45,314 | 1,778 | |||||||||
| 13,189,576 | EUR | 08/26/05 | 15,983,181 | 16,588,257 | 605,076 | |||||||||
| 13,266,616 | HKD | 08/26/05 | 1,707,104 | 1,704,421 | (2,683 | ) | ||||||||
| 96,411,000 | JPY | 08/26/05 | 873,553 | 912,394 | 38,841 | |||||||||
| $ | 26,297,042 | $ | 27,041,764 | $ | 744,722 | |||||||||
AUD | Australian Dollar | |
CAD | Canadian Dollar | |
CHF | Swiss Franc | |
DKK | Danish Krone | |
EUR | Euro Currency | |
GBP | British Pound Sterling | |
HKD | Hong Kong Dollar | |
JPY | Japanese Yen | |
NOK | Norwegian Krone | |
SEK | Swedish Krona |
Industry Concentration of Investments
as a Percentage of Net Assets:
Agriculture | 1.2 | % | |
Apparel | 0.1 | ||
Auto Manufacturers | 4.1 | ||
Auto Parts & Equipment | 0.2 | ||
Banks | 16.5 | ||
Beverages | 0.8 | ||
Building Materials | 2.7 | ||
Chemicals | 2.8 | ||
Commercial Services | 1.4 | ||
Cosmetics & Personal Care | 0.7 | ||
Distribution & Wholesale | 1.3 | ||
Diversified Financial Services | 2.5 | ||
Electric | 6.9 | ||
Electrical Components & Equipment | 0.1 | ||
Electronics | 1.5 | ||
Engineering & Construction | 2.1 | ||
Entertainment | 0.3 | ||
Environmental Control | 0.1 | ||
Food | 4.3 | ||
Gas | 0.1 | ||
Health Care - Products | 1.2 | ||
Holding Companies - Diversified | 0.1 | ||
Home Furnishings | 0.8 | ||
Household Products & Wares | 0.1 | ||
Insurance | 4.7 | ||
Iron & Steel | 1.3 | ||
Machinery - Construction & Mining | 0.1 | ||
Machinery - Diversified | 0.5 | ||
Manufacturing - Miscellaneous | 1.1 | ||
Media | 1.2 | ||
Metal Fabricate & Hardware | 0.2 | ||
Mining | 1.2 | ||
Office & Business Equipment | 0.9 | ||
Oil & Gas | 10.9 | ||
Pharmaceuticals | 12.1 | ||
Real Estate | 1.7 | ||
Retail | 2.4 | ||
Software | 0.5 | ||
Telecommunications | 6.0 | ||
Transportation | 1.3 | ||
U.S. Treasury Bills | 0.2 | ||
Short-Term Investments | 6.0 | ||
Net Other Assets and Liabilities | (4.2 | ) | |
Total | 100.0 | % | |
See Notes to Financial Statements.
F-14
Table of Contents
SELECT GROWTH FUND
PORTFOLIO OF INVESTMENTS • June 30, 2005 (Unaudited)
Shares | Value (Note 2) | ||||
COMMON STOCKS - 98.5% | |||||
| Agriculture - 1.0% | |||||
| 74,379 | Monsanto Co. | $ | 4,676,208 | ||
| Apparel - 1.2% | |||||
| 98,800 | Coach, Inc.* | 3,316,716 | |||
| 25,800 | NIKE, Inc., Class B | 2,234,280 | |||
| 5,550,996 | |||||
| Banks - 1.9% | |||||
| 179,804 | State Street Corp. (a) | 8,675,543 | |||
| Beverages - 1.4% | |||||
| 78,200 | Cadbury Schweppes, Plc, Sponsored ADR (a) | 2,997,406 | |||
| 58,500 | PepsiCo, Inc. | 3,154,905 | |||
| 6,152,311 | |||||
| Biotechnology - 4.7% | |||||
| 217,957 | Amgen, Inc.* | 13,177,680 | |||
| 105,000 | Genentech, Inc.* | 8,429,400 | |||
| 21,607,080 | |||||
| Commercial Services - 2.1% | |||||
| 74,379 | Certegy, Inc. | 2,842,765 | |||
| 200,501 | Paychex, Inc. | 6,524,303 | |||
| 9,367,068 | |||||
| Computers - 3.8% | |||||
| 95,200 | Apple Computer, Inc.* | 3,504,312 | |||
| 282,094 | Dell, Inc.* | 11,145,534 | |||
| 39,000 | Research In Motion* | 2,876,250 | |||
| 17,526,096 | |||||
| Cosmetics & Personal Care - 1.8% | |||||
| 62,100 | Estee Lauder Cos., Inc., Class A | 2,429,973 | |||
| 47,600 | Gillette Co. | 2,409,988 | |||
| 65,000 | Procter & Gamble Co. | 3,428,750 | |||
| 8,268,711 | |||||
| Diversified Financial Services - 8.4% | |||||
| 171,381 | American Express Co. | 9,122,611 | |||
| 296,900 | Charles Schwab Corp. | 3,349,032 | |||
| 93,782 | Citigroup, Inc. | 4,335,542 | |||
| 77,613 | Fannie Mae | 4,532,599 | |||
| 24,900 | Goldman Sachs and Co. | 2,540,298 | |||
| 62,400 | Merrill Lynch & Co., Inc. | 3,432,624 | |||
| 100,000 | Morgan (J.P.) & Co., Inc. | 3,532,000 | |||
| 151,993 | SLM Corp. | 7,721,244 | |||
| 38,565,950 | |||||
| Electrical Components & Equipment - 1.5% | |||||
| 300,751 | Molex Inc., Class A | 7,061,633 | |||
| Electronics - 0.4% | |||||
| 80,300 | Agilent Technologies, Inc.* (a) | $ | 1,848,506 | ||
| Food - 1.2% | |||||
| 45,900 | Whole Foods Market, Inc. | 5,429,970 | |||
| Health Care - Products - 5.5% | |||||
| 34,700 | Alcon, Inc. | 3,794,445 | |||
| 119,654 | Johnson & Johnson | 7,777,510 | |||
| 95,076 | Medtronic, Inc. | 4,923,986 | |||
| 75,000 | St. Jude Medical, Inc.* | 3,270,750 | |||
| 69,852 | Zimmer Holdings, Inc.* | 5,320,627 | |||
| 25,087,318 | |||||
| Health Care - Services - 3.6% | |||||
| 106,718 | Lincare Holding, Inc.* (a) | 4,358,363 | |||
| 235,491 | UnitedHealth Group, Inc. | 12,278,501 | |||
| 16,636,864 | |||||
| Insurance - 3.1% | |||||
| 168,162 | AFLAC, Inc. | 7,278,051 | |||
| 29,500 | CIGNA Corp. | 3,157,385 | |||
| 56,800 | Wellpoint, Inc.* | 3,955,552 | |||
| 14,390,988 | |||||
| Internet - 7.1% | |||||
| 245,481 | eBay, Inc.* | 8,103,328 | |||
| 30,300 | Google, Inc., Class A* (a) | 8,912,745 | |||
| 168,162 | InterActiveCorp* (a) | 4,044,296 | |||
| 327,752 | Yahoo!, Inc.* | 11,356,607 | |||
| 32,416,976 | |||||
| Leisure Time - 1.7% | |||||
| 145,525 | Carnival Corp. (a) | 7,938,389 | |||
| Manufacturing - Miscellaneous - 3.3% | |||||
| 206,969 | Dover Corp. | 7,529,532 | |||
| 224,300 | General Electric Co. | 7,771,995 | |||
| 15,301,527 | |||||
| Media - 4.8% | |||||
| 232,840 | Comcast Corp., Special Class A* | 6,973,558 | |||
| 139,057 | Liberty Global, Inc. Class A* | 6,489,790 | |||
| 840,810 | Liberty Media Group, Class A* | 8,567,854 | |||
| 22,031,202 | |||||
| Oil & Gas - 0.6% | |||||
| 59,000 | Suncor Energy, Inc. (a) | 2,791,880 | |||
| Oil & Gas Services - 3.6% | |||||
| 216,622 | Schlumberger, Ltd. (a) | 16,450,275 | |||
| Pharmaceuticals - 7.3% | |||||
| 81,500 | Caremax Rx, Inc.* | 3,628,380 | |||
See Notes to Financial Statements.
F-15
Table of Contents
SELECT GROWTH FUND
PORTFOLIO OF INVESTMENTS, Continued • June 30, 2005 (Unaudited)
| Shares | Value (Note 2) | ||||
Pharmaceuticals (continued) | |||||
| 62,100 | Gilead Sciences, Inc.* | $ | 2,731,779 | ||
| 69,200 | Lilly (Eli) & Co. | 3,855,132 | |||
| 92,700 | Novartis AG, Sponsored ADR | 4,397,688 | |||
| 380,941 | Pfizer, Inc. | 10,506,353 | |||
| 93,100 | Roche Holding AG, Sponsored ADR | 5,893,696 | |||
| 56,100 | Sanofi-Aventis, ADR | 2,299,539 | |||
| 33,312,567 | |||||
Retail - 6.8% | |||||
| 162,300 | Chico’s FAS, Inc.* (a) | 5,563,644 | |||
| 40,600 | Federated Department Stores, Inc. (a) | 2,975,168 | |||
| 187,565 | Home Depot, Inc. | 7,296,279 | |||
| 53,100 | Lowes Cos., Inc. (a) | 3,091,482 | |||
| 36,900 | PETsMART, Inc. | 1,119,915 | |||
| 65,400 | Starbucks Corp.* | 3,378,564 | |||
| 108,900 | Target Corp. | 5,925,249 | |||
| 43,800 | Williams-Sonoma, Inc.* | 1,733,166 | |||
| 31,083,467 | |||||
Semiconductors - 5.3% | |||||
| 68,558 | Analog Devices, Inc. (a) | 2,557,899 | |||
| 164,100 | Applied Materials, Inc. | 2,655,138 | |||
| 334,118 | Intel Corp. | 8,707,115 | |||
| 96,000 | Marvell Technology Group, Ltd.* | 3,651,840 | |||
| 88,300 | Maxim Integrated Products, Inc. | 3,373,943 | |||
| 119,500 | Texas Instruments, Inc. | 3,354,365 | |||
| 24,300,300 | |||||
Software - 10.2% | |||||
| 150,700 | Adobe Systems, Inc. (a) | 4,313,034 | |||
| 86,500 | Electronic Arts, Inc.* (a) | 4,896,765 | |||
| 236,074 | First Data Corp. | 9,476,010 | |||
| 214,730 | Intuit, Inc.* (a) | 9,686,470 | |||
| 59,400 | Mercury Interactive Corp.* | 2,278,584 | |||
| 451,355 | Microsoft Corp. | 11,211,658 | |||
| 50,600 | NAVTEQ Corp.* | 1,881,308 | |||
| 66,500 | SAP AG, Sponsored ADR (a) | 2,879,450 | |||
| 46,623,279 | |||||
Telecommunications - 6.2% | |||||
| 489,250 | Cisco Systems, Inc.* | 9,349,568 | |||
| 126,300 | Nextel Communications, Inc., Class A* (a) | 4,080,753 | |||
| 197,220 | Qualcomm, Inc. | 6,510,232 | |||
| 349,260 | Vodafone Group, Plc, Sponsored ADR | 8,494,003 | |||
| 28,434,556 | |||||
Total Common Stocks (Cost $404,635,381) | 451,529,660 | ||||
| INVESTMENT COMPANY - 1.5% | |||||
| 6,709,720 | Marshall Money Market Fund | 6,709,720 | |||
Total Investment Company (Cost $6,709,720) | 6,709,720 | ||||
| Par Value | Value (Note 2) | ||||
| SHORT TERM INVESTMENTS (b) (c) - 11.1% | |||||
| $946,737 | Bank of America | ||||
3.27%, 07/18/05 | $ | 946,737 | |||
| 757,390 | Barclays | ||||
3.16%, 07/14/05 | 757,390 | ||||
| 1,023,503 | Barclays | ||||
3.25%, 07/26/05 | 1,023,503 | ||||
| 1,893,474 | Calyon | ||||
3.25%, 08/04/05 | 1,893,474 | ||||
| 946,737 | Clipper Receivables Corp. | ||||
3.19%, 07/14/05 | 946,737 | ||||
| 946,737 | Compass Securitization | ||||
3.16%, 07/11/05 | 946,737 | ||||
| 1,893,474 | Credit Suisse First Boston Corporation | ||||
3.15%, 09/09/05 | 1,893,474 | ||||
| 1,557,770 | Credit Suisse First Boston Corporation | ||||
3.20%, 07/18/05 | 1,557,770 | ||||
| 7,573,894 | Credit Suisse First Boston Corporation Repurchase Agreement dated June 30, 2005, at 3.48%, due July 1, 2005 with a maturity amount of $7,574,626, collateralized by various corporate obligations with aggregate market value of $7,104,586. | 7,573,894 | |||
| 1,136,084 | Dexia Group | ||||
3.24%, 07/21/05 | 1,136,084 | ||||
| 946,737 | First Tennessee National Corporation | ||||
3.22%, 08/09/05 | 946,737 | ||||
| 946,737 | Fortis Bank | ||||
3.11%, 07/05/05 | 946,737 | ||||
| 967,608 | Goldman Sachs Group, Inc. | ||||
3.32%, 12/28/05 | 967,608 | ||||
| 946,737 | Goldman Sachs Group, Inc. | ||||
3.33%, 08/05/05 | 946,737 | ||||
| 10,961,391 | Goldman Sachs Group, Inc. Repurchase Agreement dated June 30, 2005, at 3.48%, due July 1, 2005 with a maturity amount of $10,962,450, collateralized by various corporate obligations with aggregate market value of $11,164,652. | 10,961,391 | |||
| 946,737 | Grampian Funding LLC | ||||
3.28%, 07/13/05 | 946,737 | ||||
| 688,429 | Greyhawk Funding | ||||
3.31%, 08/09/05 | 688,429 | ||||
| 946,736 | HBOS Halifax Bank of Scotland | ||||
3.15%, 08/08/05 | 946,736 | ||||
| 946,736 | HSBC Banking/Holdings Plc | ||||
3.25%, 08/05/05 | 946,736 | ||||
| 946,736 | JP Morgan Chase & Co. | ||||
3.20%, 07/20/05 | 946,736 | ||||
| 1,893,474 | Jupiter Securitization Corp. | ||||
3.21%, 07/15/05 | 1,893,474 | ||||
| 1,907,193 | Lehman Brothers, Inc. Repurchase Agreement dated June 30, 2005, at 3.48%, due July 1, 2005 with a maturity amount of $1,907,377, collateralized by various corporate obligations with aggregate market value of $1,945,357. | 1,907,193 | |||
| 946,736 | Merrill Lynch & Co. Repurchase Agreement dated June 30, 2005, at 3.48%, due July 1, 2005 with a maturity amount of $946,827, collateralized by various corporate obligations with aggregate market value of $970,325. | 946,736 | |||
See Notes to Financial Statements.
F-16
Table of Contents
SELECT GROWTH FUND
PORTFOLIO OF INVESTMENTS, Continued • June 30, 2005 (Unaudited)
| Par Value | Value (Note 2) | ||||||
| SHORT TERM INVESTMENTS (b) (c) (continued) | |||||||
| $ | 946,736 | Nordea Bank of Finland Plc (NY Branch) | |||||
3.17%, 08/09/05 | $ | 946,736 | |||||
| 1,133,409 | Park Avenue Receivables Corp. | ||||||
3.30%, 07/14/05 | 1,133,409 | ||||||
| 1,222,853 | Prefco | ||||||
3.28%, 07/08/05 | 1,222,853 | ||||||
| 1,136,084 | Rabobank Nederland | ||||||
3.25%, 08/08/05 | 1,136,084 | ||||||
| 946,736 | Societe Generale | ||||||
3.24%, 08/09/05 | 946,736 | ||||||
| 781,595 | The Bank of the West | ||||||
3.27%, 07/27/05 | 781,595 | ||||||
| 840,421 | Toronto Dominion Bank | ||||||
3.25%, 08/02/05 | 840,421 | ||||||
| 1,116,117 | Wells Fargo | ||||||
3.27%, 08/01/05 | 1,116,117 | ||||||
Total Short Term Investments (Cost $50,791,738) | 50,791,738 | ||||||
| | Total Investments - 111.1% (Cost $462,136,839) | 509,031,118 | |||||
| Net Other Assets and Liabilities - (11.1)% | (50,831,248 | ) | |||||
| Total Net Assets - 100.0% | $ | 458,199,870 | |||||
| * | Non-income producing security. |
| (a) | All or a portion of this security is out on loan at period end. |
| (b) | Investments made with cash collateral received from securities on loan. |
| (c) | Effective yield at time of purchase, except repurchase agreements. |
| ADR | American Depositary Receipt. Shares of a foreign based corporation held in U.S. banks entitling the shareholder to all dividends and capital gains. |
FEDERAL INCOME TAX INFORMATION (SEE NOTE 2)
At June 30, 2005, the aggregate cost of investment securities for tax purposes was $466,796,628. Net unrealized appreciation (depreciation) aggregated $42,234,490, of which $55,433,956 related to appreciated investment securities and $(13,199,466) related to depreciated investment securities.
OTHER INFORMATION
For the six months ended June 30, 2005, the aggregate cost of purchases and the proceeds of sales, other than from short-term investments, included $101,288,756 and $156,629,745 of non-governmental issuers, respectively.
Industry/Sector Concentration of Investments
as a Percentage of Net Assets:
Communications | 18.1 | % | |
Consumer Cyclical | 9.7 | ||
Consumer Non-Cyclical | 28.6 | ||
Energy | 4.2 | ||
Financial | 14.9 | ||
Industrial | 5.2 | ||
Technology | 19.3 | ||
Short-Term Investments | 11.1 | ||
Net Other Assets and Liabilities | (11.1 | ) | |
Total | 100.0 | % | |
See Notes to Financial Statements.
F-17
Table of Contents
CORE EQUITY FUND
PORTFOLIO OF INVESTMENTS • June 30, 2005 (Unaudited)
| Shares | Value (Note 2) | ||||
| COMMON STOCKS - 97.3% | |||||
Advertising - 1.1% | |||||
| 32,400 | Lamar Advertising Co.* | $ | 1,385,748 | ||
| 24,900 | Omnicom Group, Inc. | 1,988,514 | |||
| 3,374,262 | |||||
Aerospace & Defense - 1.6% | |||||
| 45,100 | Lockheed Martin Corp. | 2,925,637 | |||
| 32,200 | Northrop Grumman Corp. | 1,779,050 | |||
| 4,704,687 | |||||
Auto Parts & Equipment - 0.7% | |||||
| 3,700 | BorgWarner, Inc. | 198,579 | |||
| 31,400 | Johnson Controls, Inc. | 1,768,762 | |||
| 1,967,341 | |||||
Banks - 6.1% | |||||
| 58,556 | Bank of America Corp. | 2,670,739 | |||
| 49,400 | Fifth Third Bancorp | 2,035,774 | |||
| 106,100 | Mellon Financial Corp. | 3,044,009 | |||
| 38,000 | Northern Trust Corp. | 1,732,420 | |||
| 47,800 | PNC Bank Corp. | 2,603,188 | |||
| 95,500 | Wells Fargo & Co. | 5,880,890 | |||
| 17,967,020 | |||||
Beverages - 1.7% | |||||
| 95,920 | PepsiCo, Inc. | 5,172,966 | |||
Biotechnology - 1.1% | |||||
| 53,240 | Amgen, Inc.* | 3,218,890 | |||
Building Materials - 2.0% | |||||
| 49,800 | Martin Marietta Materials, Inc. | 3,442,176 | |||
| 82,500 | Masco Corp. (a) | 2,620,200 | |||
| 6,062,376 | |||||
Commercial Services - 3.1% | |||||
| 247,700 | Cendant Corp. | 5,541,049 | |||
| 49,600 | Moody’s Corp. | 2,230,016 | |||
| 37,000 | Valassis Communications, Inc.* | 1,370,850 | |||
| 9,141,915 | |||||
Computers - 2.5% | |||||
| 114,090 | Dell, Inc.* | 4,507,696 | |||
| 79,450 | EMC Corp.* | 1,089,259 | |||
| 78,300 | Hewlett-Packard Co. | 1,840,833 | |||
| 7,437,788 | |||||
Cosmetics & Personal Care - 1.6% | |||||
| 45,040 | Avon Products, Inc. | 1,704,764 | |||
| 24,600 | Kimberly-Clark Corp. | 1,539,714 | |||
| 26,800 | Procter & Gamble Co. (a) | 1,413,700 | |||
| 4,658,178 | |||||
Diversified Financial Services - 13.4% | |||||
| 296,770 | Charles Schwab Corp. | $ | 3,347,566 | ||
| 194,482 | Citigroup, Inc. | 8,990,903 | |||
| 53,290 | Fannie Mae | 3,112,136 | |||
| 166,460 | Freddie Mac | 10,858,186 | |||
| 124,060 | MBNA Corp. | 3,245,410 | |||
| 148,500 | Morgan (J.P.) & Co., Inc. | 5,245,020 | |||
| 94,800 | Morgan Stanley Dean Witter & Co. | 4,974,156 | |||
| 39,773,377 | |||||
Electric - 4.0% | |||||
| 79,200 | American Electric Power, Inc. | 2,920,104 | |||
| 64,000 | Exelon Corp. (a) | 3,285,120 | |||
| 69,200 | FirstEnergy Corp. | 3,329,212 | |||
| 30,600 | NiSource, Inc. | 756,738 | |||
| 63,000 | Pepco Holdings, Inc. | 1,508,220 | |||
| 11,799,394 | |||||
Food - 2.4% | |||||
| 104,400 | Albertson’s, Inc. (a) | 2,158,992 | |||
| 106,700 | Kroger Co.* (a) | 2,030,501 | |||
| 40,810 | Wrigley (Wm.) Jr. Co. | 2,809,360 | |||
| 6,998,853 | |||||
Gas - 0.5% | |||||
| 33,900 | Sempra Energy | 1,400,409 | |||
Health Care - Products - 3.5% | |||||
| 10,830 | Fisher Scientific International, Inc.* | 702,867 | |||
| 38,900 | Johnson & Johnson | 2,528,500 | |||
| 60,560 | Medtronic, Inc. | 3,136,402 | |||
| 45,140 | Stryker Corp. | 2,146,858 | |||
| 23,600 | Zimmer Holdings, Inc.* | 1,797,612 | |||
| 10,312,239 | |||||
Health Care - Services - 1.4% | |||||
| 80,000 | UnitedHealth Group, Inc. | 4,171,200 | |||
Insurance - 3.3% | |||||
| 38,800 | AFLAC, Inc. | 1,679,264 | |||
| 44,100 | Allstate Corp. | 2,634,975 | |||
| 35,000 | American International Group, Inc. | 2,033,500 | |||
| 32,900 | Hartford Financial Services Group, Inc. | 2,460,262 | |||
| 27,810 | Willis Group Holdings, Ltd. | 909,943 | |||
| 9,717,944 | |||||
Internet - 1.5% | |||||
| 5,040 | Google, Inc., Class A* (a) | 1,482,516 | |||
| 69,800 | InterActiveCorp* (a) | 1,678,690 | |||
| 40,570 | Yahoo!, Inc.* | 1,405,750 | |||
| 4,566,956 | |||||
Leisure Time - 0.9% | |||||
| 50,600 | Carnival Corp. | 2,760,230 | |||
See Notes to Financial Statements.
F-18
Table of Contents
CORE EQUITY FUND
PORTFOLIO OF INVESTMENTS, Continued · June 30, 2005 (Unaudited)
| Shares | Value (Note 2) | |||||
| Lodging - 2.5% | ||||||
| 42,640 | Harrah’s Entertainment, Inc. (a) | $ | 3,073,065 | |||
| 43,900 | Marriott International, Inc., Class A | 2,994,858 | ||||
| 23,300 | Starwood Hotels & Resorts Worldwide, Inc. | 1,364,681 | ||||
| 7,432,604 | ||||||
| Manufacturing - Miscellaneous - 1.7% | ||||||
| 37,900 | Illinois Tool Works, Inc. | 3,019,872 | ||||
| 66,210 | Tyco International, Ltd. | 1,933,332 | ||||
| 4,953,204 | ||||||
| Media - 8.0% | ||||||
| 72,270 | Clear Channel Communications, Inc. | 2,235,311 | ||||
| 42,700 | Comcast Corp., Special Class A* | 1,278,865 | ||||
| 40,900 | DIRECTV Group (The), Inc.* | 633,950 | ||||
| 26,810 | Echostar Communications Corp. | 808,321 | ||||
| 106,760 | McGraw-Hill Cos., Inc. | 4,724,130 | ||||
| 338,580 | Time Warner, Inc.* | 5,657,672 | ||||
| 164,430 | Univision Communications, Inc.* (a) | 4,530,047 | ||||
| 117,920 | Viacom, Inc., Class B | 3,775,798 | ||||
| 23,644,094 | ||||||
| Oil & Gas - 3.9% | ||||||
| 125,000 | Exxon Mobil Corp. | 7,183,750 | ||||
| 83,100 | Marathon Oil Corp. | 4,435,047 | ||||
| 11,618,797 | ||||||
| Oil & Gas Services - 1.3% | ||||||
| 17,100 | Baker Hughes, Inc. | 874,836 | ||||
| 37,780 | Schlumberger, Ltd. | 2,869,013 | ||||
| 3,743,849 | ||||||
| Pharmaceuticals - 6.6% | ||||||
| 59,500 | Bristol-Myers Squibb Co. | 1,486,310 | ||||
| 89,700 | Caremax Rx, Inc.* | 3,993,444 | ||||
| 27,400 | Cephalon, Inc.* (a) | 1,090,794 | ||||
| 26,210 | Lilly (Eli) & Co. | 1,460,159 | ||||
| 79,880 | Medco Health Solutions, Inc.* | 4,262,397 | ||||
| 79,140 | Pfizer, Inc. | 2,182,681 | ||||
| 114,110 | Wyeth Corp. | 5,077,895 | ||||
| 19,553,680 | ||||||
| Retail - 4.9% | ||||||
| 55,400 | Costco Wholesale Corp. | 2,483,028 | ||||
| 68,080 | Lowes Cos., Inc. (a) | 3,963,618 | ||||
| 44,000 | Office Depot, Inc.* | 1,004,960 | ||||
| 29,130 | Target Corp. | 1,584,963 | ||||
| 111,990 | Wal-Mart Stores, Inc. | 5,397,918 | ||||
| 14,434,487 | ||||||
| Savings & Loans - 0.3% | ||||||
| 16,070 | Golden West Financial Corp. | 1,034,587 | ||||
| Semiconductors - 1.6% | ||||||
| 67,900 | Intel Corp. | 1,769,474 | ||||
| 78,150 | Linear Technology Corp. | 2,867,324 | ||||
| 4,636,798 | ||||||
| Software - 6.1% | ||||||
| 48,360 | Electronic Arts, Inc.* | $ | 2,737,660 | |||
| 149,990 | First Data Corp. | 6,020,599 | ||||
| 376,100 | Microsoft Corp. | 9,342,324 | ||||
| 18,100,583 | ||||||
| Telecommunications - 6.8% | ||||||
| 41,320 | American Tower Corp., Class A* (a) | 868,546 | ||||
| 214,440 | Cisco Systems, Inc.* | 4,097,948 | ||||
| 97,880 | Crown Castle International Corp.* | 1,988,922 | ||||
| 154,400 | Nextel Communications, Inc., Class A* (a) | 4,988,664 | ||||
| 165,150 | Qualcomm, Inc. | 5,451,602 | ||||
| 115,700 | SBC Communications, Inc. | 2,747,875 | ||||
| 20,143,557 | ||||||
| Transportation - 1.2% | ||||||
| 45,800 | Burlington Northern Santa Fe Corp. | 2,156,264 | ||||
| 17,400 | FedEx Corp. | 1,409,574 | ||||
| 3,565,838 | ||||||
Total Common Stocks (Cost $249,491,119) | 288,068,103 | |||||
| EXCHANGE-TRADED FUND - 1.5% | ||||||
| 37,100 | SPDR Trust Series 1 (a) | 4,419,352 | ||||
Total Exchange-Traded Fund (Cost $4,510,885) | 4,419,352 | |||||
| Par Value | ||||||
| SHORT TERM INVESTMENTS (b) (c) - 9.2% | ||||||
| $ | 508,618 | Bank of America | ||||
3.27%, 07/18/05 | 508,618 | |||||
| 406,894 | Barclays | |||||
3.16%, 07/14/05 | 406,894 | |||||
| 549,859 | Barclays | |||||
3.25%, 07/26/05 | 549,859 | |||||
| 1,017,236 | Calyon | |||||
3.25%, 08/04/05 | 1,017,236 | |||||
| 508,618 | Clipper Receivables Corp. | |||||
3.19%, 07/14/05 | 508,618 | |||||
| 508,618 | Compass Securitization | |||||
3.16%, 07/11/05 | 508,618 | |||||
| 1,017,236 | Credit Suisse First Boston Corporation | |||||
3.15%, 09/09/05 | 1,017,236 | |||||
| 836,885 | Credit Suisse First Boston Corporation | |||||
3.20%, 07/18/05 | 836,885 | |||||
| 4,068,943 | Credit Suisse First Boston Corporation Repurchase Agreement dated June 30, 2005, at 3.48%, due July 1, 2005 with a maturity amount of $4,069,331, collateralized by various corporate obligations with aggregate market value of $3,816,816. | 4,068,943 | ||||
| 610,342 | Dexia Group | |||||
3.24%, 07/21/05 | 610,342 | |||||
| 508,618 | First Tennessee National Corporation | |||||
3.22%, 08/09/05 | 508,618 | |||||
See Notes to Financial Statements.
F-19
Table of Contents
CORE EQUITY FUND
PORTFOLIO OF INVESTMENTS, Continued · June 30, 2005 (Unaudited)
| Par Value | Value (Note 2) | ||||||
| SHORT TERM INVESTMENTS (b) (c) (continued) | |||||||
| $ | 508,618 | Fortis Bank | |||||
3.11%, 07/05/05 | $ | 508,618 | |||||
| 519,830 | Goldman Sachs Group, Inc | ||||||
3.32%, 12/28/05 | 519,830 | ||||||
| 508,618 | Goldman Sachs Group, Inc. | ||||||
3.33%, 08/05/05 | 508,618 | ||||||
| 5,888,817 | Goldman Sachs Group, Inc. Repurchase Agreement dated June 30, 2005, at 3.48%, due July 1, 2005 with a maturity amount of $5,889,378, collateralized by various corporate obligations with aggregate market value of $5,998,016. | 5,888,817 | |||||
| 508,618 | Grampian Funding LLC | ||||||
3.28%, 07/13/05 | 508,618 | ||||||
| 369,847 | Greyhawk Funding | ||||||
3.31%, 08/09/05 | 369,847 | ||||||
| 508,618 | HBOS Halifax Bank of Scotland | ||||||
3.15%, 08/08/05 | 508,618 | ||||||
| 508,618 | HSBC Banking/Holdings Plc | ||||||
3.25%, 08/05/05 | 508,618 | ||||||
| 508,618 | JP Morgan Chase & Co. | ||||||
3.20%, 07/20/05 | 508,618 | ||||||
| 1,017,236 | Jupiter Securitization Corp. | ||||||
3.21%, 07/15/05 | 1,017,236 | ||||||
| 1,024,606 | Lehman Brothers, Inc. Repurchase Agreement dated June 30, 2005, at 3.48%, due July 1, 2005 with a maturity amount of $1,024,704, collateralized by various corporate obligations with aggregate market value of $1,045,109. | 1,024,606 | |||||
| 508,618 | Merrill Lynch & Co. Repurchase Agreement dated June 30, 2005, at 3.48%, due July 1, 2005 with a maturity amount of $508,666, collateralized by various corporate obligations with aggregate market value of $521,290. | 508,618 | |||||
| 508,618 | Nordea Bank of Finland Plc (NY Branch) | ||||||
3.17%, 08/09/05 | 508,618 | ||||||
| 608,904 | Park Avenue Receivables Corp. | ||||||
3.30%, 07/14/05 | 608,904 | ||||||
| 656,957 | Prefco | ||||||
3.28%, 07/08/05 | 656,957 | ||||||
| 610,342 | Rabobank Nederland | ||||||
3.25%, 08/08/05 | 610,342 | ||||||
| 508,618 | Societe Generale | ||||||
3.24%, 08/09/05 | 508,618 | ||||||
| 419,898 | The Bank of the West | ||||||
3.27%, 07/27/05 | 419,898 | ||||||
| 451,502 | Toronto Dominion Bank | ||||||
3.25%, 08/02/05 | 451,502 | ||||||
| 599,614 | Wells Fargo | ||||||
3.27%, 08/01/05 | 599,614 | ||||||
Total Short Term Investments (Cost $27,286,982) | 27,286,982 | ||||||
| | Total Investments - 108.0% (Cost $281,288,986) | 319,774,437 | |||||
| Net Other Assets and Liabilities - (8.0)% | (23,567,351 | ) | |||||
| Total Net Assets - 100.0% | $ | 296,207,086 | |||||
| * | Non-income producing security. | |
| (a) | All or a portion of this security is out on loan at period end. | |
| (b) | Investments made with cash collateral received from securities on loan. | |
| (c) | Effective yield at time of purchase, except repurchase agreements. | |
FEDERAL INCOME TAX INFORMATION (SEE NOTE 2)
At June 30, 2005, the aggregate cost of investment securities for tax purposes was $287,208,320. Net unrealized appreciation (depreciation) aggregated $32,566,117, of which $41,994,216 related to appreciated investment securities and $(9,428,099) related to depreciated investment securities.
OTHER INFORMATION
For the six months ended June 30, 2005, the aggregate cost of purchases and the proceeds of sales, other than from short-term investments, included $61,668,915 and $98,153,903 of non-governmental issuers, respectively
Industry/Sector Concentration of Investments
as a Percentage of Net Assets:
Communications | 17.4 | % | |
Consumer Cyclical | 9.0 | ||
Consumer Non-Cyclical | 21.4 | ||
Energy | 5.2 | ||
Financial | 24.6 | ||
Industrial | 6.5 | ||
Technology | 10.2 | ||
Utilities | 4.5 | ||
Short-Term Investments | 9.2 | ||
Net Other Assets and Liabilities | (8.0 | ) | |
Total | 100.0 | % | |
See Notes to Financial Statements.
F-20
Table of Contents
EQUITY INDEX FUND
PORTFOLIO OF INVESTMENTS · June 30, 2005 (Unaudited)
| Shares | Value (Note 2) | ||||
| COMMON STOCKS - 99.0% | |||||
| Advertising - 0.2% | |||||
| 20,000 | Interpublic Group of Companies, Inc.* | $ | 243,600 | ||
| 8,700 | Omnicom Group, Inc. | 694,782 | |||
| 938,382 | |||||
| Aerospace & Defense - 2.0% | |||||
| 39,138 | Boeing Co. | 2,583,108 | |||
| 9,500 | General Dynamics Corp. | 1,040,630 | |||
| 5,700 | Goodrich Corp. | 233,472 | |||
| 5,600 | L-3 Communications Holdings, Inc. | 428,848 | |||
| 19,182 | Lockheed Martin Corp. | 1,244,336 | |||
| 16,992 | Northrop Grumman Corp. | 938,808 | |||
| 21,400 | Raytheon Co. | 837,168 | |||
| 8,400 | Rockwell Collins, Inc. | 400,512 | |||
| 48,500 | United Technologies Corp. | 2,490,475 | |||
| 10,197,357 | |||||
| Agriculture - 1.5% | |||||
| 98,100 | Altria Group, Inc. | 6,343,146 | |||
| 12,727 | Monsanto Co. | 800,146 | |||
| 5,500 | Reynolds American, Inc. (a) | 433,400 | |||
| 7,800 | UST, Inc. | 356,148 | |||
| 7,932,840 | |||||
| Airlines - 0.1% | |||||
| 6,800 | Delta Air Lines, Inc.* (a) | 25,568 | |||
| 34,918 | Southwest Airlines, Inc. | 486,408 | |||
| 511,976 | |||||
| Apparel - 0.4% | |||||
| 17,800 | Coach, Inc.* | 597,546 | |||
| 5,700 | Jones Apparel Group, Inc. | 176,928 | |||
| 5,100 | Liz Claiborne, Inc. | 202,776 | |||
| 10,800 | NIKE, Inc., Class B | 935,280 | |||
| 2,700 | Reebok International, Ltd. | 112,941 | |||
| 4,700 | V.F. Corp. | 268,934 | |||
| 2,294,405 | |||||
| Auto Manufacturers - 0.5% | |||||
| 87,181 | Ford Motor Co. (a) | 892,733 | |||
| 26,800 | General Motors Corp. (a) | 911,200 | |||
| 3,100 | Navistar International Corp.* | 99,200 | |||
| 8,230 | Paccar, Inc. | 559,640 | |||
| 2,462,773 | |||||
| Auto Parts & Equipment - 0.2% | |||||
| 3,000 | Cooper Tire & Rubber Co. (a) | 55,710 | |||
| 7,109 | Dana Corp. | 106,706 | |||
| 26,528 | Delphi Automotive Systems Corp. | 123,355 | |||
| 8,300 | Goodyear Tire & Rubber Co.* (a) | 123,670 | |||
| 9,100 | Johnson Controls, Inc. | 512,603 | |||
| 6,036 | Visteon Corp. (a) | 36,397 | |||
| 958,441 | |||||
| Banks - 6.3% | |||||
| 16,700 | Amsouth Bancorp | $ | 434,200 | ||
| 190,542 | Bank of America Corp. | 8,690,621 | |||
| 36,900 | Bank of New York Co., Inc. | 1,061,982 | |||
| 25,900 | BB&T Corp. (a) | 1,035,223 | |||
| 8,050 | Comerica, Inc. | 465,290 | |||
| 5,900 | Compass Bancshares, Inc. | 265,500 | |||
| 24,705 | Fifth Third Bancorp (a) | 1,018,093 | |||
| 5,900 | First Horizon National Corp. | 248,980 | |||
| 10,949 | Huntington Bancshares, Inc. (a) | 264,309 | |||
| 19,300 | KeyCorp | 639,795 | |||
| 4,700 | M & T Bank Corp. (a) | 494,252 | |||
| 10,100 | Marshall & Ilsley Corp. | 448,945 | |||
| 20,000 | Mellon Financial Corp. | 573,800 | |||
| 28,100 | National City Corp. | 958,772 | |||
| 22,550 | North Fork Bancorp., Inc. | 633,429 | |||
| 9,600 | Northern Trust Corp. | 437,664 | |||
| 13,400 | PNC Bank Corp. | 729,764 | |||
| 21,955 | Regions Financial Corp. | 743,835 | |||
| 15,700 | State Street Corp. | 757,525 | |||
| 16,100 | Suntrust Banks, Inc. (a) | 1,163,064 | |||
| 14,700 | Synovus Financial Corp. (a) | 421,449 | |||
| 86,834 | U.S. Bancorp | 2,535,553 | |||
| 74,727 | Wachovia Corp. | 3,706,459 | |||
| 79,930 | Wells Fargo & Co. | 4,922,089 | |||
| 4,300 | Zions Bancorp. | 316,179 | |||
| 32,966,772 | |||||
| Beverages - 2.2% | |||||
| 36,800 | Anheuser-Busch Companies, Inc. | 1,683,600 | |||
| 4,300 | Brown Forman Corp., Class B | 259,978 | |||
| 107,200 | Coca-Cola Co. | 4,475,600 | |||
| 16,700 | Coca-Cola Enterprises, Inc. | 367,567 | |||
| 3,700 | Molson Coors Brewing Co., Class B | 229,400 | |||
| 9,300 | Pepsi Bottling Group, Inc. | 266,073 | |||
| 79,310 | PepsiCo, Inc. | 4,277,188 | |||
| 11,559,406 | |||||
| Biotechnology - 1.1% | |||||
| 58,608 | Amgen, Inc.* | 3,543,440 | |||
| 9,300 | Applied Biosystems Group - Applera Corp. | 182,931 | |||
| 16,285 | Biogen Idec, Inc.* (a) | 561,018 | |||
| 7,000 | Chiron Corp.* | 244,230 | |||
| 12,000 | Genzyme Corp.* | 721,080 | |||
| 11,700 | Medimmune, Inc.* | 312,624 | |||
| 2,400 | Millipore Corp.* | 136,152 | |||
| 5,701,475 | |||||
| Building Materials - 0.3% | |||||
| 8,500 | American Standard Companies, Inc. | 356,320 | |||
| 20,500 | Masco Corp. | 651,080 | |||
| 4,900 | Vulcan Materials Co. | 318,451 | |||
| 1,325,851 | |||||
| Chemicals - 1.6% | |||||
| 10,900 | Air Products & Chemicals, Inc. | 657,270 | |||
See Notes to Financial Statements.
F-21
Table of Contents
EQUITY INDEX FUND
PORTFOLIO OF INVESTMENTS, Continued · June 30, 2005 (Unaudited)
| Shares | Value (Note 2) | ||||
Chemicals (continued) | |||||
| 3,200 | Ashland, Inc. | $ | 229,984 | ||
| 4,800 | Avery Dennison Corp. | 254,208 | |||
| 45,577 | Dow Chemical Co. | 2,029,544 | |||
| 47,200 | Du Pont (E.I.) De Nemours and Co. | 2,030,072 | |||
| 3,800 | Eastman Chemical Co. | 209,570 | |||
| 10,400 | Ecolab, Inc. (a) | 336,544 | |||
| 5,650 | Engelhard Corp. | 161,307 | |||
| 2,400 | Great Lakes Chemical Corp. | 75,528 | |||
| 5,300 | Hercules, Inc.* | 74,995 | |||
| 4,200 | International Flavors & Fragrances, Inc. | 152,124 | |||
| 8,100 | PPG Industries, Inc. | 508,356 | |||
| 15,300 | Praxair, Inc. | 712,980 | |||
| 9,175 | Rohm & Haas Co. | 425,169 | |||
| 5,900 | Sherwin Williams Co. | 277,831 | |||
| 3,300 | Sigma Aldrich Corp. | 184,932 | |||
| 8,320,414 | |||||
Commercial Services - 0.9% | |||||
| 7,800 | Apollo Group, Inc.* | 610,116 | |||
| 49,733 | Cendant Corp. | 1,112,527 | |||
| 6,700 | Convergys Corp.* | 95,274 | |||
| 6,100 | Equifax, Inc. | 217,831 | |||
| 7,800 | H&R Block, Inc. | 455,130 | |||
| 14,014 | McKesson Corp. | 627,687 | |||
| 13,100 | Moody’s Corp. | 588,976 | |||
| 16,850 | Paychex, Inc. | 548,299 | |||
| 10,100 | R. R. Donnelley & Sons Co. | 348,551 | |||
| 7,500 | Robert Half International, Inc. | 187,275 | |||
| 4,791,666 | |||||
Computers - 3.8% | |||||
| 6,000 | Affiliated Computer Services, Class A* | 306,600 | |||
| 39,000 | Apple Computer, Inc.* | 1,435,590 | |||
| 8,700 | Computer Sciences Corp.* | 380,190 | |||
| 114,700 | Dell, Inc.* | 4,531,797 | |||
| 24,500 | Electronic Data Systems Corp. | 471,625 | |||
| 113,800 | EMC Corp.* | 1,560,198 | |||
| 14,060 | Gateway, Inc.* | 46,398 | |||
| 136,698 | Hewlett-Packard Co. | 3,213,770 | |||
| 76,500 | International Business Machines Corp. | 5,676,300 | |||
| 6,000 | Lexmark International Group, Inc.* | 388,980 | |||
| 8,800 | NCR Corp.* | 309,056 | |||
| 17,300 | Network Appliance, Inc.* (a) | 489,071 | |||
| 161,300 | Sun Microsystems, Inc.* | 601,649 | |||
| 13,700 | SunGard Data Systems, Inc.* | 481,829 | |||
| 16,000 | Unisys Corp.* | 101,280 | |||
| 19,994,333 | |||||
Cosmetics & Personal Care - 2.4% | |||||
| 4,050 | Alberto-Culver Co. | 175,486 | |||
| 22,400 | Avon Products, Inc. | 847,840 | |||
| 24,800 | Colgate-Palmolive Co. | 1,237,768 | |||
| 47,300 | Gillette Co. | 2,394,799 | |||
| 22,640 | Kimberly-Clark Corp. | 1,417,038 | |||
| 117,300 | Procter & Gamble Co. | 6,187,575 | |||
| 12,260,506 | |||||
Distribution & Wholesale - 0.1% | |||||
| 8,250 | Genuine Parts Co. | $ | 338,992 | ||
| 4,000 | W.W. Grainger, Inc. | 219,160 | |||
| 558,152 | |||||
Diversified Financial Services - 8.0% | |||||
| 55,500 | American Express Co. | 2,954,265 | |||
| 5,452 | Bear Stearns Cos., Inc. | 566,681 | |||
| 11,937 | Capital One Financial Corp. (a) | 955,079 | |||
| 53,900 | Charles Schwab Corp. | 607,992 | |||
| 10,000 | CIT Group, Inc. | 429,700 | |||
| 246,440 | Citigroup, Inc. | 11,392,921 | |||
| 27,798 | Countrywide Financial Corp. | 1,073,281 | |||
| 17,400 | E*TRADE Financial Corp.* | 243,426 | |||
| 45,900 | Fannie Mae | 2,680,560 | |||
| 4,500 | Federated Investors, Inc., Class B | 135,045 | |||
| 9,430 | Franklin Resources, Inc. | 725,921 | |||
| 32,700 | Freddie Mac | 2,133,021 | |||
| 21,000 | Goldman Sachs and Co. | 2,142,420 | |||
| 10,700 | Janus Capital Group, Inc. (a) | 160,928 | |||
| 13,100 | Lehman Brothers Holdings, Inc. | 1,300,568 | |||
| 59,977 | MBNA Corp. | 1,568,998 | |||
| 44,800 | Merrill Lynch & Co., Inc. | 2,464,448 | |||
| 166,725 | Morgan (J.P.) & Co., Inc. | 5,888,727 | |||
| 51,934 | Morgan Stanley Dean Witter & Co. | 2,724,977 | |||
| 13,900 | Providian Financial Corp.* | 245,057 | |||
| 19,871 | SLM Corp. | 1,009,447 | |||
| 5,900 | T. Rowe Price Group, Inc. | 369,340 | |||
| 41,772,802 | |||||
Electric - 3.2% | |||||
| 30,900 | AES Corp.* | 506,142 | |||
| 7,700 | Allegheny Energy, Inc.* | 194,194 | |||
| 9,600 | Ameren Corp. | 530,880 | |||
| 18,140 | American Electric Power, Inc. | 668,822 | |||
| 25,400 | Calpine Corp.* (a) | 86,360 | |||
| 13,698 | CenterPoint Energy, Inc. | 180,951 | |||
| 9,443 | Cinergy Corp. | 423,235 | |||
| 10,300 | CMS Energy Corp.* (a) | 155,118 | |||
| 11,500 | Consolidated Edison, Inc. | 538,660 | |||
| 8,450 | Constellation Energy Group, Inc. | 487,480 | |||
| 16,150 | Dominion Resources, Inc. | 1,185,248 | |||
| 8,300 | DTE Energy Co. (a) | 388,191 | |||
| 43,834 | Duke Energy Corp. (a) | 1,303,185 | |||
| 15,400 | Edison International | 624,470 | |||
| 10,100 | Entergy Corp. | 763,055 | |||
| 31,700 | Exelon Corp. | 1,627,161 | |||
| 15,600 | FirstEnergy Corp. | 750,516 | |||
| 18,600 | Florida Power & Light Group Capital, Inc. | 782,316 | |||
| 12,800 | NiSource, Inc. | 316,544 | |||
| 17,500 | PG&E Corp. | 656,950 | |||
| 4,700 | Pinnacle West Capital Corp. | 208,915 | |||
| 9,000 | PPL Corp. | 534,420 | |||
| 11,777 | Progress Energy, Inc. | 532,791 | |||
| 11,300 | Public Service Enterprise Group, Inc. | 687,266 | |||
| 35,300 | Southern Co. | 1,223,851 | |||
| 9,800 | TECO Energy, Inc. | 185,318 | |||
See Notes to Financial Statements.
F-22
Table of Contents
EQUITY INDEX FUND
PORTFOLIO OF INVESTMENTS, Continued · June 30, 2005 (Unaudited)
| Shares | Value (Note 2) | ||||
Electric (continued) | |||||
| 11,340 | TXU Corp. | $ | 942,241 | ||
| 19,010 | Xcel Energy, Inc. (a) | 371,075 | |||
| 16,855,355 | |||||
Electrical Components & Equipment - 0.3% | |||||
| 8,600 | American Power Conversion Corp. | 202,874 | |||
| 19,800 | Emerson Electric Co. | 1,240,074 | |||
| 7,925 | Molex, Inc. (a) | 206,367 | |||
| 1,649,315 | |||||
Electronics - 0.5% | |||||
| 20,424 | Agilent Technologies, Inc.* | 470,160 | |||
| 19,016 | Freescale Semiconductor, Class B* | 402,759 | |||
| 8,700 | Jabil Circuit, Inc.* | 267,351 | |||
| 5,675 | Parker-Hannifin Corp. | 351,907 | |||
| 6,100 | PerkinElmer, Inc. | 115,290 | |||
| 24,900 | Sanmina Corp.* | 136,203 | |||
| 46,000 | Solectron Corp.* | 174,340 | |||
| 11,500 | Symbol Technologies, Inc. | 113,505 | |||
| 4,200 | Tektronix, Inc. | 97,734 | |||
| 7,600 | Thermo Electron Corp.* | 204,212 | |||
| 5,600 | Waters Corp.* | 208,152 | |||
| 2,541,613 | |||||
Engineering & Construction - 0.0% | |||||
| 4,100 | Fluor Corp. | 236,119 | |||
Entertainment - 0.5% | |||||
| 16,300 | International Game Technology | 458,845 | |||
| 136,600 | News Corp. Inc., Class A | 2,210,188 | |||
| 2,669,033 | |||||
Environmental Control - 0.2% | |||||
| 12,800 | Allied Waste Industries, Inc.* (a) | 101,504 | |||
| 26,935 | Waste Management, Inc. | 763,338 | |||
| 864,842 | |||||
Food - 1.7% | |||||
| 17,442 | Albertson’s, Inc. (a) | 360,701 | |||
| 29,549 | Archer-Daniels-Midland Co. | 631,758 | |||
| 15,400 | Campbell Soup Co. | 473,858 | |||
| 24,500 | Conagra, Inc. | 567,420 | |||
| 17,500 | General Mills, Inc. | 818,825 | |||
| 16,600 | H.J. Heinz Co. | 587,972 | |||
| 10,300 | Hershey Co., (The) | 639,630 | |||
| 16,600 | Kellogg Co. | 737,704 | |||
| 34,500 | Kroger Co.* | 656,535 | |||
| 6,400 | McCormick & Co., Inc. | 209,152 | |||
| 21,200 | Safeway, Inc. (a) | 478,908 | |||
| 37,300 | Sara Lee Corp. | 738,913 | |||
| 6,400 | Supervalu, Inc. | 208,704 | |||
| 30,000 | Sysco Corp. | 1,085,700 | |||
| 9,300 | Wrigley (Wm.) Jr. Co. | 640,212 | |||
| 8,835,992 | |||||
Forest Products & Paper - 0.5% | |||||
| 12,302 | Georgia-Pacific Corp. | $ | 391,204 | ||
| 23,240 | International Paper Co. | 702,080 | |||
| 5,200 | Louisiana Pacific Corp. (a) | 127,816 | |||
| 8,798 | MeadWestvaco Corp. | 246,696 | |||
| 5,900 | Temple Inland, Inc. | 219,185 | |||
| 11,600 | Weyerhaeuser Co. | 738,340 | |||
| 2,425,321 | |||||
Gas - 0.2% | |||||
| 8,200 | KeySpan Energy Corp. (a) | 333,740 | |||
| 2,100 | Nicor, Inc. (a) | 86,457 | |||
| 1,800 | Peoples Energy Corp. | 78,228 | |||
| 11,313 | Sempra Energy | 467,340 | |||
| 965,765 | |||||
Hand & Machine Tools - 0.1% | |||||
| 3,800 | Black & Decker Corp. (a) | 341,430 | |||
| 2,700 | Snap-On, Inc. | 92,610 | |||
| 3,600 | Stanley Works | 163,944 | |||
| 597,984 | |||||
Health Care - Products - 3.8% | |||||
| 2,600 | Bausch & Lomb, Inc. | 215,800 | |||
| 29,400 | Baxter International, Inc. | 1,090,740 | |||
| 12,000 | Becton, Dickinson & Co. | 629,640 | |||
| 11,925 | Biomet, Inc. | 413,082 | |||
| 35,500 | Boston Scientific Corp.* | 958,500 | |||
| 5,000 | C.R. Bard, Inc. | 332,550 | |||
| 5,700 | Fisher Scientific International, Inc.* | 369,930 | |||
| 15,400 | Guidant Corp. | 1,036,420 | |||
| 140,860 | Johnson & Johnson | 9,155,900 | |||
| 57,300 | Medtronic, Inc. | 2,967,567 | |||
| 17,200 | St. Jude Medical, Inc.* | 750,092 | |||
| 17,800 | Stryker Corp. | 846,568 | |||
| 11,770 | Zimmer Holdings, Inc.* | 896,521 | |||
| 19,663,310 | |||||
Health Care - Services - 1.4% | |||||
| 13,796 | Aetna, Inc. | 1,142,585 | |||
| 19,900 | HCA - The Healthcare Corporation | 1,127,733 | |||
| 11,600 | Health Management Associates, Inc., Class A (a) | 303,688 | |||
| 7,700 | Humana, Inc.* (a) | 305,998 | |||
| 6,400 | Laboratory Corp. of America Holdings* | 319,360 | |||
| 4,100 | Manor Care, Inc. | 162,893 | |||
| 8,600 | Quest Diagnostics, Inc. | 458,122 | |||
| 22,150 | Tenet Healthcare Corp.* (a) | 271,116 | |||
| 60,000 | UnitedHealth Group, Inc. | 3,128,400 | |||
| 7,219,895 | |||||
Home Builders - 0.2% | |||||
| 6,100 | Centex Corp. | 431,087 | |||
| 4,000 | KB Home (a) | 304,920 | |||
| 5,600 | Pulte Corp. | 471,800 | |||
| 1,207,807 | |||||
See Notes to Financial Statements.
F-23
Table of Contents
EQUITY INDEX FUND
PORTFOLIO OF INVESTMENTS, Continued · June 30, 2005 (Unaudited)
| Shares | Value (Note 2) | ||||
Home Furnishings - 0.1% | |||||
| 3,700 | Maytag Corp. (a) | $ | 57,942 | ||
| 3,200 | Whirlpool Corp. (a) | 224,352 | |||
| 282,294 | |||||
Household Products & Wares - 0.3% | |||||
| 7,300 | Clorox Co. | 406,756 | |||
| 6,900 | Fortune Brands, Inc. | 612,720 | |||
| 13,033 | Newell Rubbermaid, Inc. | 310,707 | |||
| 1,330,183 | |||||
Insurance - 5.0% | |||||
| 13,600 | ACE, Ltd. | 609,960 | |||
| 23,800 | AFLAC, Inc. | 1,030,064 | |||
| 31,638 | Allstate Corp. | 1,890,370 | |||
| 5,100 | AMBAC Financial Group, Inc. | 355,776 | |||
| 122,979 | American International Group, Inc. | 7,145,080 | |||
| 15,050 | AON Corp. (a) | 376,852 | |||
| 9,300 | Chubb Corp. | 796,173 | |||
| 6,200 | CIGNA Corp. | 663,586 | |||
| 7,868 | Cincinnati Financial Corp. | 311,258 | |||
| 14,100 | Hartford Financial Services Group, Inc. | 1,054,398 | |||
| 6,400 | Jefferson Pilot Corp. | 322,688 | |||
| 8,200 | Lincoln National Corp. | 384,744 | |||
| 7,600 | Loews Corp. | 589,000 | |||
| 25,200 | Marsh & McLennan Cos., Inc. | 698,040 | |||
| 6,450 | MBIA, Inc. (a) | 382,550 | |||
| 34,700 | MetLife, Inc. | 1,559,418 | |||
| 4,500 | MGIC Investment Corp. | 293,490 | |||
| 13,900 | Principal Financial Group, Inc. | 582,410 | |||
| 9,400 | Progressive Corp. | 928,814 | |||
| 24,700 | Prudential Financial, Inc. | 1,621,802 | |||
| 6,000 | SAFECO Corp. | 326,040 | |||
| 31,890 | St. Paul Travelers Cos., Inc. | 1,260,612 | |||
| 4,900 | Torchmark Corp. | 255,780 | |||
| 14,018 | UnumProvident Corp. (a) | 256,810 | |||
| 29,000 | Wellpoint, Inc.* | 2,019,560 | |||
| 6,700 | XL Capital, Ltd., Class A (a) | 498,614 | |||
| 26,213,889 | |||||
Internet - 0.9% | |||||
| 57,500 | eBay, Inc.* | 1,898,075 | |||
| 5,700 | Monster Worldwide, Inc.* | 163,476 | |||
| 33,700 | Symantec Corp.* | 732,638 | |||
| 62,200 | Yahoo!, Inc.* | 2,155,230 | |||
| 4,949,419 | |||||
Iron & Steel - 0.1% | |||||
| 4,251 | Allegheny Technologies, Inc. | 93,777 | |||
| 7,600 | Nucor Corp. | 346,712 | |||
| 5,420 | United States Steel Corp. | 186,285 | |||
| 626,774 | |||||
Leisure Time - 0.5% | |||||
| 4,600 | Brunswick Corp. | 199,272 | |||
| 25,000 | Carnival Corp. | 1,363,750 | |||
| 13,500 | Harley-Davidson, Inc. | $ | 669,600 | ||
| 6,208 | Sabre Group Holdings, Inc. | 123,850 | |||
| 2,356,472 | |||||
Lodging - 0.4% | |||||
| 8,600 | Harrah’s Entertainment, Inc. | 619,802 | |||
| 18,000 | Hilton Hotels Corp. | 429,300 | |||
| 9,400 | Marriott International, Inc., Class A | 641,268 | |||
| 10,300 | Starwood Hotels & Resorts Worldwide, Inc. | 603,271 | |||
| 2,293,641 | |||||
Machinery - Construction & Mining - 0.3% | |||||
| 16,200 | Caterpillar, Inc. | 1,544,022 | |||
Machinery - Diversified - 0.3% | |||||
| 2,100 | Cummins Engine Co., Inc. (a) | 156,681 | |||
| 11,700 | Deere & Co. | 766,233 | |||
| 8,300 | Rockwell International Corp. | 404,293 | |||
| 1,327,207 | |||||
Manufacturing - Miscellaneous - 5.6% | |||||
| 36,500 | 3M Co. | 2,638,950 | |||
| 4,400 | Cooper Industries, Ltd. | 281,160 | |||
| 13,000 | Danaher Corp. (a) | 680,420 | |||
| 9,600 | Dover Corp. | 349,248 | |||
| 13,600 | Eastman Kodak Co. (a) | 365,160 | |||
| 7,200 | Eaton Corp. | 431,280 | |||
| 502,500 | General Electric Co. | 17,411,625 | |||
| 40,375 | Honeywell International, Inc. | 1,478,936 | |||
| 13,000 | Illinois Tool Works, Inc. (a) | 1,035,840 | |||
| 8,000 | Ingersoll-Rand Co. | 570,800 | |||
| 4,400 | ITT Industries, Inc. | 429,572 | |||
| 9,000 | Leggett & Platt, Inc. | 239,220 | |||
| 5,900 | Pall Corp. | 179,124 | |||
| 6,400 | Textron, Inc. | 485,440 | |||
| 95,637 | Tyco International, Ltd. | 2,792,600 | |||
| 29,369,375 | |||||
Media - 3.0% | |||||
| 24,100 | Clear Channel Communications, Inc. | 745,413 | |||
| 104,478 | Comcast Corp., Class A* | 3,207,475 | |||
| 3,300 | Dow Jones & Company, Inc. | 116,985 | |||
| 11,800 | Gannett Co., Inc. | 839,334 | |||
| 3,500 | Knight-Ridder, Inc. | 214,690 | |||
| 17,700 | McGraw-Hill Cos., Inc. | 783,225 | |||
| 2,100 | Meredith Corp. | 103,026 | |||
| 6,900 | New York Times Co., Class A* | 214,935 | |||
| 221,998 | Time Warner, Inc.* | 3,709,587 | |||
| 14,087 | Tribune Co. | 495,581 | |||
| 13,700 | Univision Communications, Inc.* | 377,435 | |||
| 76,328 | Viacom, Inc., Class B | 2,444,023 | |||
| 96,729 | Walt Disney Co. | 2,435,636 | |||
| 15,687,345 | |||||
See Notes to Financial Statements.
F-24
Table of Contents
EQUITY INDEX FUND
PORTFOLIO OF INVESTMENTS, Continued • June 30, 2005 (Unaudited)
| Shares | Value (Note 2) | ||||
Mining - 0.5% | |||||
| 41,308 | Alcoa, Inc. | $ | 1,079,378 | ||
| 8,500 | Freeport-McMoRan Copper & Gold, Inc., Class B | 318,240 | |||
| 21,111 | Newmont Mining Corp. | 823,962 | |||
| 4,600 | Phelps Dodge Corp. (a) | 425,500 | |||
| 2,647,080 | |||||
Office & Business Equipment - 0.2% | |||||
| 10,900 | Pitney Bowes, Inc. | 474,695 | |||
| 45,300 | Xerox Corp.* | 624,687 | |||
| 1,099,382 | |||||
Oil & Gas - 7.5% | |||||
| 4,100 | Amerada Hess Corp. (a) | 436,691 | |||
| 11,179 | Anadarko Petroleum Corp. | 918,355 | |||
| 15,600 | Apache Corp. | 1,007,760 | |||
| 18,264 | Burlington Resources, Inc. | 1,008,903 | |||
| 99,472 | Chevron Texaco Corp. | 5,562,474 | |||
| 65,990 | ConocoPhillips | 3,793,765 | |||
| 22,500 | Devon Energy Corp. | 1,140,300 | |||
| 11,300 | EOG Resources, Inc. (a) | 641,840 | |||
| 301,660 | Exxon Mobil Corp. | 17,336,400 | |||
| 5,581 | Kerr-McGee Corp. | 425,886 | |||
| 16,500 | Marathon Oil Corp. | 880,605 | |||
| 7,100 | Nabors Industries, Ltd.* | 430,402 | |||
| 6,500 | Noble Corp. | 399,815 | |||
| 18,900 | Occidental Petroleum Corp. | 1,453,977 | |||
| 5,100 | Rowan Cos., Inc.* | 151,521 | |||
| 3,300 | Sunoco, Inc. | 375,144 | |||
| 15,427 | Transocean Sedco Forex, Inc.* | 832,595 | |||
| 12,900 | Unocal Corp. (a) | 839,145 | |||
| 12,200 | Valero Energy Corp. | 965,142 | |||
| 17,100 | XTO Energy, Inc. | 581,229 | |||
| 39,181,949 | |||||
Oil & Gas Services - 0.9% | |||||
| 16,080 | Baker Hughes, Inc. | 822,653 | |||
| 7,700 | BJ Services Co. | 404,096 | |||
| 24,000 | Halliburton Co. | 1,147,680 | |||
| 8,200 | National Oilwell Varco, Inc.* | 389,828 | |||
| 27,900 | Schlumberger, Ltd. | 2,118,726 | |||
| 4,882,983 | |||||
Packaging & Containers - 0.1% | |||||
| 5,200 | Ball Corp. | 186,992 | |||
| 5,000 | Bemis Co. | 132,700 | |||
| 7,000 | Pactiv Corp.* | 151,060 | |||
| 4,008 | Sealed Air Corp.* | 199,558 | |||
| 670,310 | |||||
Pharmaceuticals - 6.2% | |||||
| 73,500 | Abbott Laboratories | 3,602,235 | |||
| 6,200 | Allergan, Inc. | 528,488 | |||
| 5,000 | AmerisourceBergen Corp. | 345,750 | |||
| 92,600 | Bristol-Myers Squibb Co. (a) | 2,313,148 | |||
| 20,300 | Cardinal Health, Inc. | 1,168,874 | |||
| 21,500 | Caremax Rx, Inc.* | $ | 957,180 | ||
| 7,000 | Express Scripts, Inc.* (a) | 349,860 | |||
| 16,100 | Forest Laboratories, Inc.* | 625,485 | |||
| 21,400 | Gilead Sciences, Inc.* | 941,386 | |||
| 7,490 | Hospira, Inc.* | 292,110 | |||
| 11,366 | King Pharmaceuticals, Inc.* | 118,434 | |||
| 53,700 | Lilly (Eli) & Co. | 2,991,627 | |||
| 13,100 | Medco Health Solutions, Inc.* | 699,016 | |||
| 104,400 | Merck & Co., Inc. | 3,215,520 | |||
| 12,700 | Mylan Laboratories (a) | 244,348 | |||
| 352,284 | Pfizer, Inc. | 9,715,993 | |||
| 69,800 | Schering-Plough Corp. | 1,330,388 | |||
| 5,200 | Watson Pharmaceuticals, Inc.* | 153,712 | |||
| 63,400 | Wyeth Corp. | 2,821,300 | |||
| 32,414,854 | |||||
Pipelines - 0.3% | |||||
| 15,700 | Dynegy, Inc.* | 76,302 | |||
| 30,530 | El Paso Energy Corp. (a) | 351,706 | |||
| 5,200 | Kinder Morgan, Inc. | 432,640 | |||
| 27,000 | Williams Cos., Inc. | 513,000 | |||
| 1,373,648 | |||||
Real Estate - 0.6% | |||||
| 4,500 | Apartment Investment & Management Co., REIT (a) | 184,140 | |||
| 9,400 | Archstone-Smith Trust, REIT | 363,028 | |||
| 19,300 | Equity Office Properties Trust, REIT | 638,830 | |||
| 13,600 | Equity Residential Properties Trust, REIT | 500,752 | |||
| 8,700 | Plum Creek Timber Co., Inc., REIT | 315,810 | |||
| 8,800 | ProLogis Trust, REIT | 354,112 | |||
| 10,400 | Simon Property Group, Inc., REIT (a) | 753,896 | |||
| 3,110,568 | |||||
Retail - 6.6% | |||||
| 10,500 | AutoNation, Inc.* | 215,460 | |||
| 3,100 | AutoZone, Inc.* | 286,626 | |||
| 14,000 | Bed Bath & Beyond, Inc.* | 584,920 | |||
| 14,200 | Best Buy Co., Inc. | 973,410 | |||
| 5,300 | Big Lots, Inc.* (a) | 70,172 | |||
| 9,000 | Circuit City Stores, Inc. | 155,610 | |||
| 22,612 | Costco Wholesale Corp. | 1,013,470 | |||
| 38,400 | CVS Corp. | 1,116,288 | |||
| 6,900 | Darden Restaurants, Inc. | 227,562 | |||
| 3,300 | Dillards, Inc., Class A | 77,286 | |||
| 14,287 | Dollar General Corp. | 290,883 | |||
| 7,900 | Family Dollar Stores, Inc. | 206,190 | |||
| 8,100 | Federated Department Stores, Inc. | 593,568 | |||
| 35,850 | Gap, Inc. | 708,038 | |||
| 101,697 | Home Depot, Inc. | 3,956,013 | |||
| 12,500 | J.C. Penney Co., Inc. | 657,250 | |||
| 15,500 | Kohls Corp.* | 866,605 | |||
| 18,000 | Limited Brands, Inc. (a) | 385,560 | |||
| 36,600 | Lowes Cos., Inc. (a) | 2,130,852 | |||
| 14,200 | May Department Stores Co. | 570,272 | |||
| 60,000 | McDonald’s Corp. | 1,665,000 | |||
| 5,800 | Nordstrom, Inc. | 394,226 | |||
See Notes to Financial Statements.
F-25
Table of Contents
EQUITY INDEX FUND
PORTFOLIO OF INVESTMENTS, Continued • June 30, 2005 (Unaudited)
| Shares | Value (Note 2) | ||||
Retail (continued) | |||||
| 14,900 | Office Depot, Inc.* | $ | 340,316 | ||
| 3,300 | OfficeMax, Inc. | 98,241 | |||
| 7,300 | RadioShack Corp. (a) | 169,141 | |||
| 4,900 | Sears Holdings Corp.* (a) | 734,363 | |||
| 34,900 | Staples, Inc. | 744,068 | |||
| 18,500 | Starbucks Corp.* | 955,710 | |||
| 41,900 | Target Corp. | 2,279,779 | |||
| 6,800 | Tiffany & Co. | 222,768 | |||
| 22,200 | TJX Cos., Inc. | 540,570 | |||
| 10,500 | Toys “R” Us, Inc.* | 278,040 | |||
| 48,400 | Walgreen Co. | 2,225,916 | |||
| 158,500 | Wal-Mart Stores, Inc. | 7,639,700 | |||
| 5,400 | Wendy’s International, Inc. | 257,310 | |||
| 13,720 | Yum! Brands, Inc. | 714,538 | |||
| 34,345,721 | |||||
Savings & Loans - 0.6% | |||||
| 13,400 | Golden West Financial Corp. | 862,692 | |||
| 17,200 | Sovereign Bancorp, Inc. (a) | 384,248 | |||
| 41,574 | Washington Mutual, Inc. (a) | 1,691,646 | |||
| 2,938,586 | |||||
Semiconductors - 3.1% | |||||
| 18,700 | Advanced Micro Devices* | 324,258 | |||
| 17,600 | Altera Corp.* | 348,832 | |||
| 17,500 | Analog Devices, Inc. (a) | 652,925 | |||
| 77,800 | Applied Materials, Inc. | 1,258,804 | |||
| 14,500 | Applied Micro Circuits Corp.* | 37,120 | |||
| 13,900 | Broadcom Corp.* | 493,589 | |||
| 292,400 | Intel Corp. (a) | 7,619,944 | |||
| 9,300 | KLA-Tencor Corp.* | 406,410 | |||
| 14,500 | Linear Technology Corp. | 532,005 | |||
| 18,300 | LSI Logic Corp.* | 155,367 | |||
| 15,500 | Maxim Integrated Products, Inc. | 592,255 | |||
| 29,100 | Micron Technology, Inc.* (a) | 297,111 | |||
| 16,500 | National Semiconductor Corp. | 363,495 | |||
| 6,500 | Novellus Systems, Inc. | 160,615 | |||
| 8,000 | NVIDIA Corp.* (a) | 213,760 | |||
| 8,500 | PMC-Sierra, Inc.* | 79,305 | |||
| 4,300 | QLogic Corp.* | 132,741 | |||
| 9,200 | Teradyne, Inc.* | 110,124 | |||
| 78,700 | Texas Instruments, Inc. | 2,209,109 | |||
| 16,600 | Xilinx, Inc. | 423,300 | |||
| 16,411,069 | |||||
Software - 4.3% | |||||
| 23,100 | Adobe Systems, Inc. (a) | 661,122 | |||
| 10,800 | Autodesk, Inc. | 371,196 | |||
| 27,600 | Automatic Data Processing, Inc. | 1,158,372 | |||
| 10,400 | BMC Software, Inc.* | 186,680 | |||
| 8,000 | Citrix Systems, Inc.* | 173,280 | |||
| 25,150 | Computer Associates International, Inc. | 691,122 | |||
| 18,400 | Compuware Corp.* | 132,296 | |||
| 14,500 | Electronic Arts, Inc.* (a) | 820,845 | |||
| 36,849 | First Data Corp. | 1,479,119 | |||
| 9,050 | Fiserv, Inc.* | 388,698 | |||
| 10,700 | IMS Health, Inc. | $ | 265,039 | ||
| 8,800 | Intuit, Inc.* | 396,968 | |||
| 4,100 | Mercury Interactive Corp.* | 157,276 | |||
| 476,000 | Microsoft Corp. | 11,823,840 | |||
| 18,000 | Novell, Inc.* (a) | 111,600 | |||
| 209,420 | Oracle Corp.* (a) | 2,764,344 | |||
| 12,800 | Parametric Technology Corp.* | 81,664 | |||
| 24,400 | Siebel Systems, Inc. | 217,160 | |||
| 20,219 | VERITAS Software Corp.* | 493,344 | |||
| 22,373,965 | |||||
Telecommunications - 5.7% | |||||
| 5,485 | ADC Telecommunications, Inc.* | 119,408 | |||
| 15,500 | Alltel Corp. (a) | 965,340 | |||
| 7,600 | Andrew Corp.* | 96,976 | |||
| 37,948 | AT&T Corp. | 722,530 | |||
| 22,531 | Avaya, Inc.* | 187,458 | |||
| 86,700 | BellSouth Corp. (a) | 2,303,619 | |||
| 6,200 | CenturyTel, Inc. | 214,706 | |||
| 27,300 | Ciena Corp.* | 57,057 | |||
| 302,700 | Cisco Systems, Inc.* | 5,784,597 | |||
| 16,100 | Citizens Communications Co., Class B | 216,384 | |||
| 9,400 | Comverse Technology, Inc.* | 222,310 | |||
| 68,600 | Corning, Inc.* | 1,140,132 | |||
| 68,600 | JDS Uniphase Corp.* | 104,272 | |||
| 209,882 | Lucent Technologies, Inc.* (a) | 610,757 | |||
| 116,135 | Motorola, Inc. | 2,120,625 | |||
| 53,300 | Nextel Communications, Inc., Class A* | 1,722,123 | |||
| 77,400 | Qualcomm, Inc. | 2,554,974 | |||
| 79,163 | Qwest Communications International, Inc.* (a) | 293,695 | |||
| 156,498 | SBC Communications, Inc. | 3,716,828 | |||
| 7,200 | Scientific Atlanta, Inc. | 239,544 | |||
| 70,100 | Sprint Corp. (a) | 1,758,809 | |||
| 21,200 | Tellabs, Inc.* | 184,440 | |||
| 131,130 | Verizon Communications, Inc. | 4,530,542 | |||
| 29,867,126 | |||||
Textiles - 0.1% | |||||
| 7,100 | Cintas Corp. (a) | 274,060 | |||
Toys, Games & Hobbies - 0.1% | |||||
| 7,850 | Hasbro, Inc. | 163,202 | |||
| 19,412 | Mattel, Inc. | 355,240 | |||
| 518,442 | |||||
Transportation - 1.5% | |||||
| 17,852 | Burlington Northern Santa Fe Corp. | 840,472 | |||
| 10,300 | CSX Corp. | 439,398 | |||
| 14,300 | FedEx Corp. | 1,158,443 | |||
| 19,100 | Norfolk Southern Corp. | 591,336 | |||
| 3,000 | Ryder System, Inc. | 109,800 | |||
| 12,500 | Union Pacific Corp. | 810,000 | |||
| 52,800 | United Parcel Service, Class B | 3,651,648 | |||
| 7,601,097 | |||||
Total Common Stocks (Cost $446,360,525) | 515,971,363 | ||||
See Notes to Financial Statements.
F-26
Table of Contents
EQUITY INDEX FUND
PORTFOLIO OF INVESTMENTS, Continued • June 30, 2005 (Unaudited)
| Par Value | Value (Note 2) | ||||||
| U.S. GOVERNMENT OBLIGATION - 0.1% | |||||||
U.S. Treasury Bill - 0.1% | |||||||
| $ | 500,000 | 2.99%, 09/15/05 (b) (c) | $ | 496,846 | |||
Total U.S. Government Obligation (Cost $496,846) | 496,846 | ||||||
| Shares | |||||||
| INVESTMENT COMPANY - 0.9% | |||||||
| 4,602,706 | Marshall Money Market Fund | 4,602,706 | |||||
Total Investment Company (Cost $4,602,706) | 4,602,706 | ||||||
| Par Value | |||||||
| SHORT TERM INVESTMENTS (b) (d) - 7.0% | |||||||
| $ | 677,175 | Bank of America | |||||
3.27%, 07/18/05 | 677,175 | ||||||
| 541,740 | Barclays | ||||||
3.16%, 07/14/05 | 541,740 | ||||||
| 732,084 | Barclays | ||||||
3.25%, 07/26/05 | 732,084 | ||||||
| 1,354,350 | Calyon | ||||||
3.25%, 08/04/05 | 1,354,350 | ||||||
| 677,175 | Clipper Receivables Corp. | ||||||
3.19%, 07/14/05 | 677,175 | ||||||
| 677,175 | Compass Securitization | ||||||
3.16%, 07/11/05 | 677,175 | ||||||
| 1,354,350 | Credit Suisse First Boston Corporation | ||||||
3.15%, 09/09/05 | 1,354,350 | ||||||
| 1,114,230 | Credit Suisse First Boston Corporation | ||||||
3.20%, 07/18/05 | 1,114,230 | ||||||
| 5,417,400 | Credit Suisse First Boston Corporation Repurchase Agreement dated June 30, 2005, at 3.48%, due July 1, 2005 with a maturity amount of $5,417,923, collateralized by various corporate obligations with aggregate market value of $5,081,716. | 5,417,400 | |||||
| 812,610 | Dexia Group | ||||||
3.24%, 07/21/05 | 812,610 | ||||||
| 677,175 | First Tennessee National Corporation | ||||||
3.22%, 08/09/05 | 677,175 | ||||||
| 677,175 | Fortis Bank | ||||||
3.11%, 07/05/05 | 677,175 | ||||||
| 692,103 | Goldman Sachs Group, Inc. | ||||||
3.32%, 12/28/05 | 692,103 | ||||||
| 677,175 | Goldman Sachs Group, Inc. | ||||||
3.33%, 08/05/05 | 677,175 | ||||||
| 7,840,384 | Goldman Sachs Group, Inc. Repurchase Agreement dated June 30, 2005, at 3.48%, due July 1, 2005 with a maturity amount of $7,841,141, collateralized by various corporate obligations with aggregate market value of $7,985,771. | 7,840,384 | |||||
| 677,175 | Grampian Funding LLC | ||||||
3.28%, 07/13/05 | 677,175 | ||||||
| $ | 492,415 | Greyhawk Funding | |||||
3.31%, 08/09/05 | $ | 492,415 | |||||
| 677,175 | HBOS Halifax Bank of Scotland | ||||||
3.15%, 08/08/05 | 677,175 | ||||||
| 677,175 | HSBC Banking/Holdings Plc | ||||||
3.25%, 08/05/05 | 677,175 | ||||||
| 677,175 | JP Morgan Chase & Co. | ||||||
3.20%, 07/20/05 | 677,175 | ||||||
| 1,354,350 | Jupiter Securitization Corp. | ||||||
3.21%, 07/15/05 | 1,354,350 | ||||||
| 1,364,163 | Lehman Brothers, Inc. Repurchase Agreement dated June 30, 2005, at 3.48%, due July 1, 2005 with a maturity amount of $1,364,295, collateralized by various corporate obligations with aggregate market value of $1,391,460. | 1,364,163 | |||||
| 677,175 | Merrill Lynch & Co. Repurchase Agreement dated June 30, 2005, at 3.48%, due July 1, 2005 with a maturity amount of $677,240, collateralized by various corporate obligations with aggregate market value of $674,047. | 677,175 | |||||
| 677,175 | Nordea Bank of Finland Plc (NY Branch) | ||||||
3.17%, 08/09/05 | 677,175 | ||||||
| 810,696 | Park Avenue Receivables Corp. | ||||||
3.30%, 07/14/05 | 810,696 | ||||||
| 874,673 | Prefco | ||||||
3.28%, 07/08/05 | 874,673 | ||||||
| 812,610 | Rabobank Nederland | ||||||
3.25%, 08/08/05 | 812,610 | ||||||
| 677,175 | Societe Generale | ||||||
3.24%, 08/09/05 | 677,175 | ||||||
| 559,053 | The Bank of the West | ||||||
3.27%, 07/27/05 | 559,053 | ||||||
| 601,130 | Toronto Dominion Bank | ||||||
3.25%, 08/02/05 | 601,130 | ||||||
| 798,328 | Wells Fargo | ||||||
3.27%, 08/01/05 | 798,328 | ||||||
Total Short Term Investments (Cost $36,329,944) | 36,329,944 | ||||||
| | Total Investments - 107.0% (Cost $487,790,021) | 557,400,859 | |||||
| Net Other Assets and Liabilities - (7.0)% | (36,526,730 | ) | |||||
| Total Net Assets - 100.0% | $ | 520,874,129 | |||||
| * | Non-income producing security. |
| (a) | All or a portion of this security is out on loan at period end. |
| (b) | Effective yield at time of purchase, except repurchase agreements. |
| (c) | Security has been deposited as initial margin on futures contracts. At June 30, 2005, the Portfolio’s open futures contracts were as follows: |
| Number of Contracts Purchased | Contract Type | Expiration Date | Aggregate Cost | Market Value at June 30, 2005 | ||||||
| 15 | S&P 500 | September-2005 | $ | 4,483,125 | $ | 4,524,283 | ||||
| (d) | Investments made with cash collateral received from securities on loan. |
| REIT | Real Estate Investment Trust |
See Notes to Financial Statements.
F-27
Table of Contents
EQUITY INDEX FUND
PORTFOLIO OF INVESTMENTS, Continued • June 30, 2005 (Unaudited)
FEDERAL INCOME TAX INFORMATION (SEE NOTE 2)
At June 30, 2005, the aggregate cost of investment securities for tax purposes was $516,071,175. Net unrealized appreciation (depreciation) aggregated $41,329,684, of which $80,136,394 related to appreciated investment securities and $(38,806,710) related to depreciated investment securities.
OTHER INFORMATION
For the six months ended June 30, 2005, the aggregate cost of purchases and the proceeds of sales, other than from short-term investments, included $17,167,635 and $81,409,974 of non-governmental issuers, respectively.
Industry/Sector Concentration of Investments
as a Percentage of Net Assets:
Basic Materials | 2.7 | % | |
Communications | 9.8 | ||
Consumer Cyclical | 9.8 | ||
Consumer Non-Cyclical | 21.5 | ||
Energy | 8.7 | ||
Financial | 21.5 | ||
Industrial | 11.2 | ||
Technology | 11.4 | ||
Utilities | 3.4 | ||
Short-Term Investments | 7.0 | ||
Net Other Assets and Liabilities | (7.0 | ) | |
Total | 100.0 | % | |
See Notes to Financial Statements.
F-28
Table of Contents
SELECT INVESTMENT GRADE INCOME FUND
PORTFOLIO OF INVESTMENTS • June 30, 2005 (Unaudited)
| Par Value | Moody’s Ratings | Value (Note 2) | ||||||
| U.S. GOVERNMENT AGENCY MORTGAGE-BACKED OBLIGATIONS (i) - 26.5% | ||||||||
Fannie Mae - 11.5% | ||||||||
| $ | 10,000,000 | 3.00%, 03/02/07 | NR | $ | 9,869,350 | |||
| 1,688,207 | 5.00%, 05/01/18 | NR | 1,708,443 | |||||
| 7,134,479 | 5.50%, 02/01/18 - 07/01/35 | NR | 7,255,359 | |||||
| 12,369,091 | 6.00%, 08/01/13 - 05/01/35 | NR | 12,712,891 | |||||
| 5,878,082 | 6.50%, 05/01/08 - 08/01/32 | NR | 6,101,976 | |||||
| 2,531,199 | 7.00%, 08/01/10 - 06/01/32 | NR | 2,667,094 | |||||
| 1,487,839 | 7.50%, 01/01/07 - 09/01/30 | NR | 1,570,447 | |||||
| 321,930 | 8.00%, 04/01/09 - 08/01/32 | NR | 346,060 | |||||
| 28,925 | 8.50%, 07/01/08 - 06/01/30 | NR | 30,293 | |||||
| 150,238 | 9.00%, 02/01/10 - 11/01/25 | NR | 164,337 | |||||
| 42,426,250 | ||||||||
Freddie Mac - 11.5% | ||||||||
| 4,660,000 | 5.00%, 07/01/34, TBA (a) | NR | 4,660,000 | |||||
| 135,014 | 5.00%, 05/15/21 | NR | 135,682 | |||||
| 1,403,435 | 4.50%, 12/01/18 | NR | 1,398,222 | |||||
| 12,225,653 | 5.00%, 05/01/18 - 03/01/34 | NR | 12,328,284 | |||||
| 5,799,406 | 5.50%, 02/01/18 - 09/01/34 | NR | 5,920,582 | |||||
| 9,172,795 | 6.00%, 10/15/07 - 08/01/34 | NR | 9,398,963 | |||||
| 1,931,028 | 6.50%, 10/01/20 - 04/01/35 | NR | 2,005,348 | |||||
| 1,959,612 | 7.00%, 05/01/32 - 12/01/32 | NR | 2,063,426 | |||||
| 380,599 | 7.50%, 06/01/15 - 11/01/30 | NR | 404,803 | |||||
| 77,605 | 9.50%, 08/01/19 - 02/01/21 | NR | 85,232 | |||||
| 3,750,000 | 5.00%, 08/01/34 TBA | NR | 3,741,795 | |||||
| 42,142,337 | ||||||||
Ginnie Mae - 3.5% | ||||||||
| 3,041,088 | 5.50%, 07/15/33 | NR | 3,109,075 | |||||
| 7,337,386 | 6.00%, 01/15/32 - 08/20/34 | NR | 7,568,708 | |||||
| 1,102,758 | 6.50%, 09/15/08 - 11/15/32 | NR | 1,153,472 | |||||
| 868,746 | 7.00%, 03/15/12 - 12/15/31 | NR | 918,781 | |||||
| 261,068 | 7.50%, 11/15/30 - 10/15/32 | NR | 279,772 | |||||
| 5,370 | 9.50%, 02/15/06 | NR | 5,392 | |||||
| 13,035,200 | ||||||||
Total U.S. Government Agency Mortgage-Backed Obligations (Cost $97,604,296) | 97,603,787 | |||||||
| U.S. GOVERNMENT AND AGENCY OBLIGATIONS - 26.5% | ||||||||
Fannie Mae - 4.9% | ||||||||
| 5,650,932 | 5.50%, 02/01/34 - 03/01/34 | NR | 5,732,530 | |||||
| 3,122,091 | 6.00%, 02/01/17 - 05/01/29 | NR | 3,217,055 | |||||
| 1,075,953 | 6.50%, 05/01/16 - 10/01/29 | NR | 1,119,906 | |||||
| 791,202 | 7.00%, 08/01/32 | NR | 838,018 | |||||
| 47,069 | 7.50%, 03/01/28 - 09/01/30 | NR | 50,330 | |||||
| 216,274 | 8.00%, 10/01/29 - 05/01/30 | NR | 232,858 | |||||
| 7,000,000 | 2.98%, 07/13/05 (b) (k) | NR | 6,993,046 | |||||
| 18,183,743 | ||||||||
Federal Home Loan Bank - 1.3% | ||||||||
| 1,075,000 | 3.09%, 07/13/05 (b) | NR | 1,073,893 | |||||
| 3,730,000 | 3.12%, 08/10/05 (b) (k) | NR | 3,717,069 | |||||
| 4,790,962 | ||||||||
Freddie Mac - 9.3% | ||||||||
| $ | 9,000,000 | 2.25%, 08/30/05 (b) | NR | $ | 8,981,928 | |||
| 3,800,000 | 4.38%, 01/25/10 | NR | 3,789,531 | |||||
| 6,987,727 | 5.00%, 01/01/19 - 02/01/19 | NR | 7,069,911 | |||||
| 9,988,375 | 5.50%, 11/01/33 - 01/01/34 | NR | 10,135,522 | |||||
| 3,700,000 | 5.75%, 04/15/08 | NR | 3,884,053 | |||||
| 400,048 | 6.50%, 12/01/31 | NR | 415,007 | |||||
| 34,275,952 | ||||||||
Ginnie Mae - 0.2% | ||||||||
| 736,263 | 7.00%, 02/15/28 - 11/15/28 | NR | 780,622 | |||||
| 780,622 | ||||||||
U.S. Treasury Bond - 4.7% | ||||||||
| 610,000 | 5.38%, 02/15/31 | NR | 719,800 | |||||
| 3,650,000 | 6.25%, 08/15/23 | NR | 4,548,670 | |||||
| 1,000,000 | 7.25%, 08/15/22 | NR | 1,360,781 | |||||
| 2,400,000 | 7.50%, 11/15/16 | NR | 3,145,594 | |||||
| 1,900,000 | 8.13%, 05/15/21 | NR | 2,750,919 | |||||
| 1,900,000 | 8.75%, 08/15/20 | NR | 2,858,907 | |||||
| 1,200,000 | 7.63%, 02/15/25 | NR | 1,728,844 | |||||
| 17,113,515 | ||||||||
U.S. Treasury Inflationary Index - 0.1% | ||||||||
| 153,453 | 3.38%, 04/15/32 | NR | 208,749 | |||||
U.S. Treasury Note - 6.0% | ||||||||
| 1,900,000 | 3.00%, 02/15/08 (c) | NR | 1,869,199 | |||||
| 11,400,000 | 3.38%, 02/28/07 | NR | 11,350,125 | |||||
| 4,000,000 | 3.63%, 07/15/09 | NR | 3,986,720 | |||||
| 3,700,000 | 3.75%, 05/15/08 | NR | 3,708,096 | |||||
| 965,000 | 5.00%, 02/15/11 (c) | NR | 1,025,275 | |||||
| 21,939,415 | ||||||||
Total U.S. Government and Agency Obligations (Cost $96,399,186) | 97,292,958 | |||||||
| CORPORATE NOTES AND BONDS - 36.0% | ||||||||
Aerospace & Defense - 0.0% | ||||||||
| 118,639 | Systems 2001 Asset Trust (d) | |||||||
6.66%, 09/15/13 | Aaa | 129,393 | ||||||
Auto Manufacturers - 1.1% | ||||||||
| 1,900,000 | DaimlerChrysler North America Holding Corp. | |||||||
6.50%, 11/15/13 | A3 | 2,056,195 | ||||||
| 1,900,000 | DaimlerChrysler North America Holding Corp. | |||||||
7.30%, 01/15/12 | A3 | 2,123,125 | ||||||
| 4,179,320 | ||||||||
Banks - 5.4% | ||||||||
| 1,850,000 | Capital One Bank, MTN | |||||||
5.13%, 02/15/14 | Baa2 | 1,871,845 | ||||||
See Notes to Financial Statements.
F-29
Table of Contents
SELECT INVESTMENT GRADE INCOME FUND
PORTFOLIO OF INVESTMENTS, Continued • June 30, 2005 (Unaudited)
| Par Value | Moody’s | Value (Note 2) | ||||||
Banks (continued) | ||||||||
| $ | 1,900,000 | HSBC Bank USA, Inc. | ||||||
4.63%, 04/01/14 | Aa3 | $ | 1,896,766 | |||||
| 1,940,000 | PNC Funding Corp. | |||||||
4.50%, 03/10/10 | A2 | 1,950,459 | ||||||
| 2,000,000 | PNC Funding Corp. | |||||||
5.75%, 08/01/06 | A2 | 2,029,960 | ||||||
| 2,000,000 | U.S. Bancorp, MTN | |||||||
5.10%, 07/15/07 | Aa2 | 2,039,434 | ||||||
| 2,000,000 | U.S. Bank National Association Cincinnati | |||||||
6.50%, 02/01/08 | Aa2 | 2,109,772 | ||||||
| 2,000,000 | Wachovia Corp. | |||||||
4.95%, 11/01/06 | Aa3 | 2,021,406 | ||||||
| 2,000,000 | Wells Fargo & Co. | |||||||
5.13%, 02/15/07 | Aa1 | 2,033,066 | ||||||
| 3,800,000 | Zions Bancorporation | |||||||
5.65%, 05/15/14 | Baa1 | 4,023,942 | ||||||
| 19,976,650 | ||||||||
Beverages - 0.5% | ||||||||
| 1,900,000 | Bottling Group LLC | |||||||
4.63%, 11/15/12 | Aa3 | 1,928,559 | ||||||
Chemicals - 0.6% | ||||||||
| 2,000,000 | Praxair, Inc. | |||||||
6.63%, 10/15/07 | A3 | 2,105,318 | ||||||
Diversified Financial Services - 7.1% | ||||||||
| 1,900,000 | American General Finance Corp., MTN | |||||||
5.38%, 10/01/12 | A1 | 1,961,309 | ||||||
| 3,700,000 | CIT Group, Inc., Global Note | |||||||
4.25%, 02/01/10 | A2 | 3,672,472 | ||||||
| 164,000 | CVRD Finance Ltd., Series 2A (d) (e) | |||||||
3.79%, 10/15/07 | Aaa | 163,968 | ||||||
| 1,185,000 | Ford Motor Credit Co. | |||||||
6.88%, 02/01/06 | Baa2 | 1,196,844 | ||||||
| 1,900,000 | General Electric Capital Corp., MTN | |||||||
4.25%, 01/15/08 | Aaa | 1,907,342 | ||||||
| 2,000,000 | Goldman Sachs Group, Inc. | |||||||
3.88%, 01/15/09 | Aa3 | 1,973,210 | ||||||
| 1,825,000 | Goldman Sachs Group, Inc. | |||||||
5.70%, 09/01/12 | Aa3 | 1,941,838 | ||||||
| 3,800,000 | Household Finance Corp. | |||||||
8.00%, 07/15/10 | A1 | 4,384,683 | ||||||
| 1,200,000 | J. Paul Getty Trust | |||||||
5.88%, 10/01/33 | Aaa | 1,353,370 | ||||||
| 3,800,000 | MBNA Corp., MTN | |||||||
4.63%, 08/03/09 | Baa1 | 3,854,108 | ||||||
| 2,000,000 | Merrill Lynch & Co., Inc., MTN | |||||||
4.25%, 02/08/10 | Aa3 | 1,995,036 | ||||||
| 1,900,000 | Morgan Stanley | |||||||
4.75%, 04/01/14 | A1 | 1,871,821 | ||||||
| 26,276,001 | ||||||||
Electric - 1.3% | ||||||||
| $ | 2,000,000 | Entergy Gulf States, Inc. | ||||||
3.60%, 06/01/08 | Baa3 | $ | 1,957,878 | |||||
| 800,000 | Pacific Gas & Electric Co. | |||||||
3.60%, 03/01/09 | Baa1 | 781,434 | ||||||
| 2,000,000 | Pacific Gas & Electric Co. | |||||||
6.05%, 03/01/34 | Baa1 | 2,204,178 | ||||||
| 4,943,490 | ||||||||
Food - 0.6% | ||||||||
| 2,000,000 | Unilever Capital Corp. | |||||||
5.90%, 11/15/32 | A1 | 2,228,440 | ||||||
Health Care - Services - 0.4% | ||||||||
| 3,000 | HCA, Inc. | |||||||
6.30%, 10/01/12 | Ba2 | 3,079 | ||||||
| 1,320,000 | UnitedHealth Group, Inc. | |||||||
7.50%, 11/15/05 | A2 | 1,334,921 | ||||||
| 1,338,000 | ||||||||
Lodging - 0.6% | ||||||||
| 2,000,000 | Harrah’s Operating Co., Inc. | |||||||
7.13%, 06/01/07 | Baa3 | 2,098,938 | ||||||
| 15,000 | MGM Mirage, Inc. | |||||||
7.25%, 10/15/06 | Ba2 | 15,431 | ||||||
| 4,000 | MGM Mirage, Inc. | |||||||
8.50%, 09/15/10 | Ba2 | 4,440 | ||||||
| 11,000 | Park Place Entertainment Corp. | |||||||
8.50%, 11/15/06 | Baa3 | 11,591 | ||||||
| 2,130,400 | ||||||||
Media - 3.6% | ||||||||
| 3,700,000 | AOL Time Warner, Inc. | |||||||
6.15%, 05/01/07 | Baa1 | 3,828,464 | ||||||
| 3,800,000 | Clear Channel Communications, Inc. | |||||||
5.50%, 12/15/16 | Baa3 | 3,512,587 | ||||||
| 2,000,000 | Comcast Corp. | |||||||
5.85%, 01/15/10 | Baa2 | 2,115,102 | ||||||
| 1,820,000 | Comcast Corp., | |||||||
4.95%, 06/15/16 | Baa2 | 1,811,739 | ||||||
| 2,000,000 | Continental Cablevision, Inc. | |||||||
8.30%, 05/15/06 | Baa2 | 2,073,210 | ||||||
| 13,341,102 | ||||||||
Metal Fabricate & Hardware - 0.5% | ||||||||
| 1,900,000 | Precision Castparts Corp. | |||||||
5.60%, 12/15/13 | Baa3 | 1,972,360 | ||||||
Oil & Gas - 5.6% | ||||||||
| 1,405,000 | Anderson Exploration, Ltd., | |||||||
6.75%, 03/15/11 | Baa3 | 1,537,119 | ||||||
| 3,800,000 | Atmos Energy Corp. | |||||||
4.00%, 10/15/09 | Baa3 | 3,717,688 | ||||||
| 2,050,000 | Conoco Funding Co. | |||||||
7.25%, 10/15/31 | A3 | 2,691,086 | ||||||
See Notes to Financial Statements.
F-30
Table of Contents
SELECT INVESTMENT GRADE INCOME FUND
PORTFOLIO OF INVESTMENTS, Continued • June 30, 2005 (Unaudited)
| Par Value | Moody’s Ratings | Value (Note 2) | |||||
| Oil & Gas (continued) | |||||||
| $2,395,000 | Devon Financing Corp. | ||||||
| 6.88%, 09/30/11 | Baa2 | $ | 2,679,926 | ||||
| 3,900,000 | Pioneer Natural Resources Co. | ||||||
| 5.88%, 07/15/16 | Baa3 | 3,932,986 | |||||
| 3,800,000 | Valero Energy Corp. | ||||||
| 4.75%, 06/15/13 | Baa3 | 3,762,319 | |||||
| 1,900,000 | Valero Energy Corp. | ||||||
| 6.88%, 04/15/12 | Baa3 | 2,120,784 | |||||
| 20,441,908 | |||||||
| Packaging & Containers - 1.1% | |||||||
| 3,800,000 | Sealed Air Corp. (d) | ||||||
| 5.63%, 07/15/13 | Baa3 | 3,904,804 | |||||
| Pharmaceuticals - 0.7% | |||||||
| 2,000,000 | Zeneca Wilmington | ||||||
| 7.00%, 11/15/23 | Aa2 | 2,527,082 | |||||
| Retail - 1.9% | |||||||
| 3,800,000 | Kroger Co. (The) | ||||||
| 6.20%, 06/15/12 | Baa2 | 4,090,369 | |||||
| 2,000,000 | Wal-Mart Stores, Inc. | ||||||
| 7.55%, 02/15/30 | Aa2 | 2,728,138 | |||||
| 6,818,507 | |||||||
| Telecommunications - 2.2% | |||||||
| 3,800,000 | SBC Communications, Inc. | ||||||
| 5.10%, 09/15/14 | A2 | 3,885,356 | |||||
| 1,900,000 | Sprint Capital Corp. | ||||||
| 6.13%, 11/15/08 | Baa3 | 2,001,650 | |||||
| 1,900,000 | Sprint Capital Corp. | ||||||
| 6.88%, 11/15/28 | Baa3 | 2,180,976 | |||||
| 8,067,982 | |||||||
| Transportation - 2.8% | |||||||
| 3,800,000 | CSX Transportation, Inc. | ||||||
| 6.30%, 03/15/12 | Baa2 | 4,162,341 | |||||
| 300,000 | Union Pacific Corp. | ||||||
| 5.38%, 06/01/33 | Baa2 | 302,805 | |||||
| 3,800,000 | Union Pacific Corp. | ||||||
| 6.50%, 04/15/12 | Baa2 | 4,213,216 | |||||
| 1,430,000 | Union Pacific Corp. | ||||||
| 6.63%, 02/01/08 | Baa2 | 1,511,040 | |||||
| 10,189,402 | |||||||
Total Corporate Notes and Bonds (Cost $130,104,581) | 132,498,718 | ||||||
| ASSET-BACKED AND MORTGAGE-BACKED SECURITIES (i) - 7.9% | |||||||
| 1,800,000 | AmeriCredit Automobile Receivables Trust, Series 2004-CA, Class A3 | ||||||
| 3.00%, 03/06/09 | Aaa | 1,780,399 | |||||
| $1,900,000 | Capital One Auto Finance Trust, Series 2003-A, Class A4A | ||||||
| 2.47%, 01/15/10 | Aaa | $ | 1,868,448 | ||||
| 2,700,000 | Bear Stearns Commercial Mortgage Securities, Inc., Series 2002-PBW1, Class A2 | ||||||
| 4.72%, 11/11/35 | Aaa | 2,742,463 | |||||
| 2,700,000 | Bear Stearns Mortgage Securities, Inc., Series 1999-WF2, Class A2, CMO | ||||||
| 7.08%, 07/15/31 | Aaa | 2,955,429 | |||||
| 2,700,000 | General Electric Capital Commercial Mortgage Corp., Series 2002-1A, Class A3, CMO | ||||||
| 6.27%, 12/10/35 | Aaa | 2,980,694 | |||||
| 2,040,000 | GS Mortgage Securities Corp. II, Series 1997-GL, Class A2D, CMO | ||||||
| 6.94%, 07/13/30 | Aaa | 2,136,733 | |||||
| 2,700,000 | Morgan Stanley Dean Witter Capital I, Series 2003-T0P9, Class A2, CMO (f) | ||||||
| 4.74%, 11/13/36 | AAA | 2,745,851 | |||||
| 2,100,000 | Morgan Stanley Dean Witter Captial I, Series 2003-T11, Class A3, CMO | ||||||
| 4.85%, 06/13/41 | Aaa | 2,145,693 | |||||
| 1,285,000 | Citibank Credit Card Issuance Trust, Series 2000-A3, CMO | ||||||
| 6.88%, 11/16/09 | Aaa | 1,369,145 | |||||
| 380,909 | Green Tree Home Improvement Loan Trust, Series 1996-D, Class H, CMO (f) | ||||||
| 8.30%, 09/15/27 | AAA | 381,506 | |||||
| 405,506 | Conseco Finance Corp., Series 2000-6, Class A4 | ||||||
| 6.77%, 09/01/32 | Ba1 | 410,168 | |||||
| 77,324 | Green Tree Financial Corp., Series 1999-3, Class A, CMO (f) | ||||||
| 6.16%, 02/01/31 | B | 78,462 | |||||
| 7,590,682 | Bank of America Mortgage Securities, Inc., Series 2003-8, Class 1A12 (f) | ||||||
| 5.50%, 11/25/33 | AAA | 7,605,484 | |||||
Total Asset-Backed and Mortgage-Backed Securities (Cost $28,946,400) | 29,200,475 | ||||||
| FOREIGN GOVERNMENT OBLIGATIONS (j) - 1.2% | |||||||
| 2,000,000 | Province of British Columbia | ||||||
| 5.38%, 10/29/08 | Aa1 | 2,095,702 | |||||
| 2,000,000 | Province of Quebec | ||||||
| 7.00%, 01/30/07 | A1 | 2,092,274 | |||||
Total Foreign Government Obligations (Cost $4,129,084) | 4,187,976 | ||||||
See Notes to Financial Statements.
F-31
Table of Contents
SELECT INVESTMENT GRADE INCOME FUND
PORTFOLIO OF INVESTMENTS, Continued • June 30, 2005 (Unaudited)
| Par Value | Moody’s Ratings | Value (Note 2) | ||||||
| FOREIGN BONDS (j) - 4.2% | ||||||||
| $ | 1,950,000 | West Fraser Timber Co., Ltd. (d) | ||||||
| 5.20%, 10/15/14 | Baa2 | $ | 1,972,158 | |||||
| 2,000,000 | Tyco International Group S.A. | |||||||
| 6.75%, 02/15/11 | Baa3 | 2,220,204 | ||||||
| 2,000,000 | Tyco International Group S.A. | |||||||
| 6.88%, 01/15/29 | Baa3 | 2,387,274 | ||||||
| 1,900,000 | British Sky Broadcasting | |||||||
| Group, Plc | ||||||||
| 6.88%, 02/23/09 | Baa2 | 2,044,062 | ||||||
| 2,000,000 | Alberta Energy Co., Ltd. | |||||||
| 7.38%, 11/01/31 | Baa2 | 2,518,428 | ||||||
| 1,900,000 | British Telecom, Plc (g) | |||||||
| 8.38%, 12/15/10 | Baa1 | 2,249,573 | ||||||
| 2,000,000 | Telus Corp. | |||||||
| 7.50%, 06/01/07 | Baa2 | 2,115,802 | ||||||
Total Foreign Bonds (Cost $14,785,696) | 15,507,501 | |||||||
| Shares | ||||||||
| INVESTMENT COMPANIES - 0.0% | ||||||||
| 3,317 | Barclays Prime Money Market Fund | NR | 3,317 | |||||
| 80,796 | Marshall Money Market Fund | NR | 80,796 | |||||
Total Investment Companies (Cost $84,113) | 84,113 | |||||||
| Par Value | ||||||||
| SHORT TERM INVESTMENTS (b) (h) - 0.6% | ||||||||
| $ | 36,902 | Bank of America | ||||||
| 3.27%, 07/18/05 | NR | 36,902 | ||||||
| 29,521 | Barclays | |||||||
| 3.16%, 07/14/05 | NR | 29,521 | ||||||
| 39,894 | Barclays | |||||||
| 3.25%, 07/26/05 | NR | 39,894 | ||||||
| 73,803 | Calyon | |||||||
| 3.25%, 08/04/05 | NR | 73,803 | ||||||
| 36,901 | Clipper Receivables Corp. | |||||||
| 3.19%, 07/14/05 | NR | 36,901 | ||||||
| 36,901 | Compass Securitization | |||||||
| 3.16%, 07/11/05 | NR | 36,901 | ||||||
| 73,803 | Credit Suisse First Boston Corporation | |||||||
| 3.15%, 09/09/05 | NR | 73,803 | ||||||
| 60,718 | Credit Suisse First Boston Corporation | |||||||
| 3.20%, 07/18/05 | NR | 60,718 | ||||||
| 295,213 | Credit Suisse First Boston Corporation Repurchase Agreement dated June 30, 2005, at 3.48%, due July 1, 2005 with a maturity amount of $295,242, collateralized by various corporate obligations with aggregate market value of $276,920. | NR | 295,213 | |||||
| $ | 44,282 | Dexia Group | ||||||
| 3.24%, 07/21/05 | NR | $ | 44,282 | |||||
| 36,901 | First Tennessee National Corporation | |||||||
| 3.22%, 08/09/05 | NR | 36,901 | ||||||
| 36,901 | Fortis Bank | |||||||
| 3.11%, 07/05/05 | NR | 36,901 | ||||||
| 37,715 | Goldman Sachs Group, Inc. | |||||||
| 3.32%, 12/28/05 | NR | 37,715 | ||||||
| 36,901 | Goldman Sachs Group, Inc. | |||||||
| 3.33%, 08/05/05 | NR | 36,901 | ||||||
| 427,250 | Goldman Sachs Group, Inc. Repurchase Agreement dated June 30, 2005, at 3.48%, due July 1, 2005 with a maturity amount of $427,291, collateralized by various corporate obligations with aggregate market value of $435,172. | NR | 427,250 | |||||
| 36,902 | Grampian Funding LLC | |||||||
| 3.28%, 07/13/05 | NR | 36,902 | ||||||
| 26,833 | Greyhawk Funding | |||||||
| 3.31%, 08/09/05 | NR | 26,833 | ||||||
| 36,902 | HBOS Halifax Bank of Scotland | |||||||
| 3.15%, 08/08/05 | NR | 36,902 | ||||||
| 36,902 | HSBC Banking/Holdings Plc | |||||||
| 3.25%, 08/05/05 | NR | 36,902 | ||||||
| 36,902 | JP Morgan Chase & Co. | |||||||
| 3.20%, 07/20/05 | NR | 36,902 | ||||||
| 73,803 | Jupiter Securitization Corp. | |||||||
| 3.21%, 07/15/05 | NR | 73,803 | ||||||
| 74,338 | Lehman Brothers, Inc. Repurchase Agreement dated June 30, 2005, at 3.48%, due July 1, 2005 with a maturity amount of $74,345, collateralized by various corporate obligations with aggregate market value of $75,825. | NR | 74,338 | |||||
| 36,902 | Merrill Lynch & Co. Repurchase Agreement dated June 30, 2005, at 3.48%, due July 1, 2005 with a maturity amount of $36,906, collateralized by various corporate obligations with aggregate market value of $37,821. | NR | 36,902 | |||||
| 36,902 | Nordea Bank of Finland Plc (NY Branch) | |||||||
| 3.17%, 08/09/05 | NR | 36,902 | ||||||
| 44,178 | Park Avenue Receivables Corp. | |||||||
| 3.30%, 07/14/05 | NR | 44,178 | ||||||
| 47,664 | Prefco | |||||||
| 3.28%, 07/08/05 | NR | 47,664 | ||||||
| 44,282 | Rabobank Nederland | |||||||
| 3.25%, 08/08/05 | NR | 44,282 | ||||||
| 36,902 | Societe Generale | |||||||
| 3.24%, 08/09/05 | NR | 36,902 | ||||||
| 30,465 | The Bank of the West | |||||||
| 3.27%, 07/27/05 | NR | 30,465 | ||||||
See Notes to Financial Statements.
F-32
Table of Contents
SELECT INVESTMENT GRADE INCOME FUND
PORTFOLIO OF INVESTMENTS, Continued • June 30, 2005 (Unaudited)
| Par Value | Moody’s Ratings | Value (Note 2) | ||||||
| SHORT TERM INVESTMENTS (b) (h) (continued) | ||||||||
| $32,758 | Toronto Dominion Bank | |||||||
| 3.25%, 08/02/05 | NR | $ | 32,758 | |||||
| 43,503 | Wells Fargo | |||||||
| 3.27%, 08/01/05 | NR | 43,503 | ||||||
Total Short Term Investments (Cost $1,979,744) | 1,979,744 | |||||||
| Shares | ||||||||
| WARRANTS - 0.0% | ||||||||
| Computers - 0.0% | ||||||||
| 500,000 | International Business | |||||||
| Machines Corp., 07/10/06* | NR | 78,750 | ||||||
| Telecommunications - 0.0% | ||||||||
| 500,000 | BellSouth Telecom, Inc., 07/12/06* | NR | 61,250 | |||||
Total Warrants (Cost $16,563) | 140,000 | |||||||
| Total Investments - 102.9% (Cost $374,049,663) | 378,495,272 | |||||||
| Net Other Assets and Liabilities - (2.9)% | (10,584,005 | ) | ||||||
| Total Net Assets - 100.0% | $ | 367,911,267 | ||||||
| * | Non-income producing security. |
| (a) | All or part of security is designated as a Forward Commitment. |
| (b) | Effective yield at time of purchase, except repurchase agreements. |
| (c) | All or a portion of this security is out on loan at period end. |
| (d) | Security exempt from registration under Rule 144A of the Securities Act of 1933. This security may be resold in transactions exempt from registration, to qualified institutional buyers. At June 30, 2005, these securities amounted to $6,170,322 or 1.68% of net assets. |
| (e) | Variable rate security. The rate shown reflects rate in effect at period end. |
| (f) | Standard & Poor’s (S&P) credit ratings are used in the absence of a rating by Moody’s Investors, Inc. |
| (g) | Debt obligation initially issued in coupon form which converts to a higher coupon form at a specified date and rate. The rate shown is the rate at period end. The maturity date shown is the ultimate maturity. |
| (h) | Investments made with cash collateral received from securities on loan. |
| (i) | Pass Through Certificates. |
| (j) | U.S. currency denominated. |
| (k) | Designated as collateral on Forward Commitments. |
| CMO | Collateralized Mortgage Obligation (Pay Through Certificate) |
| MTN | Medium Term Note |
| NR | Not Rated |
FEDERAL INCOME TAX INFORMATION (SEE NOTE 2)
At June 30, 2005, the aggregate cost of investment securities for tax purposes was $375,655,196. Net unrealized appreciation (depreciation) aggregated $2,840,076, of which $4,819,553 related to appreciated investment securities and $(1,979,477) related to depreciated investment securities
OTHER INFORMATION
For the six months ended June 30, 2005, the aggregate cost of purchases and the proceeds of sales, other than from short-term investments, included $55,916,572 and $53,363,966 of non-governmental issuers, respectively, and $116,514,763 and $107,514,776 of U.S. Government and Agency issuers, respectively.
The composition of ratings of both long-term and short-term debt holdings as a percentage of total value of investments in securities is as follows:
Moody’s Ratings | |||
Aaa | 5.7 | % | |
Aa | 6.7 | % | |
A | 9.1 | % | |
Baa | 23.5 | % | |
Baa | 0.1 | % | |
NR (Not Rated) | 52.0 | % | |
| 97.1 | % | ||
S&P Ratings | |||
| AAA | 2.9 | % | |
Major Class Concentration of Investments
as a Percentage of Net Assets:
Corporate Notes And Bonds | 36.0 | % | |
U.S. Government Agency Mortgage-Backed | |||
Obligation | 26.5 | ||
U.S. Government And Agency Obligations | 26.5 | ||
Asset-Backed And Mortgage-Backed Securities | 7.9 | ||
Foreign Bonds | 4.2 | ||
Foreign Government Obligations | 1.2 | ||
Short Term Investments | 0.6 | ||
Net Other Assets and Liabilities | (2.9 | ) | |
Total | 100.0 | % | |
See Notes to Financial Statements.
F-33
Table of Contents
GOVERNMENT BOND FUND
PORTFOLIO OF INVESTMENTS · June 30, 2005 (Unaudited)
| Par Value | Moody’s Ratings | Value (Note 2) | ||||||
| U.S. GOVERNMENT AGENCY MORTGAGE-BACKED OBLIGATIONS (c) - 15.2% | ||||||||
Fannie Mae - 11.2% | ||||||||
| $ | 13,000,000 | 4.00%, 04/25/22 - 07/25/22 | NR | $ | 12,903,895 | |||
| 174 | 7.00%, 05/01/17 | NR | 175 | |||||
| 38,822 | 7.50%, 03/01/07 | NR | 39,985 | |||||
| 39,177 | 8.00%, 04/01/09 - 09/01/21 | NR | 42,120 | |||||
| 12,986,175 | ||||||||
Freddie Mac - 4.0% | ||||||||
| 4,580,000 | 5.00%, 06/15/26 | NR | 4,616,140 | |||||
| 38,782 | 6.50%, 06/01/23 | NR | 40,761 | |||||
| 12,795 | 7.50%, 02/01/07 | NR | 13,039 | |||||
| 5,600 | 8.00%, 06/01/19 | NR | 5,961 | |||||
| 21,397 | 10.00%, 03/01/21 | NR | 23,865 | |||||
| 4,699,766 | ||||||||
Ginnie Mae - 0.0% | ||||||||
| 8,246 | 6.50%, 06/15/09 | NR | 8,516 | |||||
| 36,348 | 7.00%, 06/15/12 | NR | 38,140 | |||||
| 1,600 | 9.50%, 02/15/06 | NR | 1,607 | |||||
| 48,263 | ||||||||
Total U.S. Government Agency Mortgage-Backed Obligations (Cost $18,184,588) | 17,734,204 | |||||||
| U.S. GOVERNMENT AND AGENCY OBLIGATIONS - 70.4% | ||||||||
Fannie Mae - 20.6% | ||||||||
| 7,915,000 | 5.38%, 11/15/11 | Aaa | 8,482,347 | |||||
| 7,500,000 | 3.25%, 01/15/08 - 08/15/08 | Aaa | 7,389,519 | |||||
| 4,000,000 | 3.88%, 05/15/07 | Aaa | 4,009,004 | |||||
| 4,000,000 | 5.00%, 04/06/10 | Aaa | 4,034,916 | |||||
| 23,915,786 | ||||||||
Federal Farm Credit Bank - 3.3% | ||||||||
| 3,880,000 | 2.63%, 12/15/05 | Aaa | 3,863,153 | |||||
Federal Home Loan Bank - 9.4% | ||||||||
| 500,000 | 2.88%, 08/15/06 | Aaa | 495,007 | |||||
| 3,180,000 | 3.00%, 04/15/09 | Aaa | 3,073,540 | |||||
| 7,400,000 | 4.00%, 03/18/11 | Aaa | 7,294,224 | |||||
| 10,862,771 | ||||||||
Freddie Mac - 23.6% | ||||||||
| 11,875,000 | 2.75%, 08/15/06 | Aaa | 11,740,908 | |||||
| 5,000,000 | 3.00%, 12/15/06 | Aaa | 4,936,975 | |||||
| 2,680,000 | 5.00%, 07/15/14 | Aaa | 2,826,947 | |||||
| 5,215,000 | 5.75%, 01/15/12 | Aaa | 5,705,231 | |||||
| 1,990,000 | 6.88%, 09/15/10 | Aaa | 2,252,264 | |||||
| 27,462,325 | ||||||||
U.S. Treasury Bond - 4.4% | ||||||||
| 200,000 | 7.13%, 02/15/23 | NR | 270,281 | |||||
| 1,985,000 | 7.50%, 11/15/16 | NR | 2,601,668 | |||||
| 1,485,000 | 8.88%, 02/15/19 | NR | 2,207,604 | |||||
| 5,079,553 | ||||||||
U.S. Treasury Note - 9.1% | ||||||||
| $ | 9,095,000 | 4.00%, 02/15/14 (a) | NR | $ | 9,149,716 | |||
| 1,380,000 | 5.00%, 08/15/11 (a) | NR | 1,471,264 | |||||
| 10,620,980 | ||||||||
Total U.S. Government and Agency Obligations (Cost $80,860,347) | 81,804,568 | |||||||
| ASSET-BACKED AND MORTGAGE-BACKED SECURITIES (c) - 10.9% | ||||||||
| 2,650,403 | Bank of America Commercial Mortgage, Inc., | |||||||
4.91%, 05/11/35 | Aaa | 2,672,037 | ||||||
| 10,000,000 | GE Capital Commercial Mortgage Corp., | |||||||
4.17%, 07/10/37 | Aaa | 9,983,962 | ||||||
Total Asset-Backed and Mortgage-Backed Securities (Cost $12,730,789) | 12,655,999 | |||||||
| Shares | ||||||||
| INVESTMENT COMPANIES - 2.6% | ||||||||
| 4,190 | Dreyfus Cash Management Plus Money Market Fund | NR | 4,190 | |||||
| 3,005,631 | Marshall Money Market Fund | NR | 3,005,631 | |||||
Total Investment Companies (Cost $3,009,821) | 3,009,821 | |||||||
| Par Value | ||||||||
| SHORT TERM INVESTMENTS (b) (d) - 6.0% | ||||||||
| $ | 129,291 | Bank of America | ||||||
3.27%, 07/18/05 | NR | 129,291 | ||||||
| 103,432 | Barclays | |||||||
3.16%, 07/14/05 | NR | 103,432 | ||||||
| 139,774 | Barclays | |||||||
3.25%, 07/26/05 | NR | 139,774 | ||||||
| 258,581 | Calyon | |||||||
3.25%, 08/04/05 | NR | 258,581 | ||||||
| 129,290 | Clipper Receivables Corp. | |||||||
3.19%, 07/14/05 | NR | 129,290 | ||||||
| 129,290 | Compass Securitization | |||||||
3.16%, 07/11/05 | NR | 129,290 | ||||||
| 258,581 | Credit Suisse First Boston Corporation | |||||||
3.15%, 09/09/05 | NR | 258,581 | ||||||
| 212,736 | Credit Suisse First Boston Corporation | |||||||
3.20%, 07/18/05 | NR | 212,736 | ||||||
See Notes to Financial Statements.
F-34
Table of Contents
GOVERNMENT BOND FUND
PORTFOLIO OF INVESTMENTS, Continued • June 30, 2005 (Unaudited)
| Par Value | Moody’s Ratings | Value (Note 2) | |||||||
| SHORT TERM INVESTMENTS (b) (d) (continued) | |||||||||
| $ | 1,034,325 | Credit Suisse First Boston Corporation Repurchase Agreement dated June 30, 2005, at 3.48%, due July 1, 2005 with a maturity amount of $1,034,425, collateralized by various corporate obligations with aggregate market value of $970,234. | NR | $ | 1,034,325 | ||||
| 155,149 | Dexia Group | ||||||||
3.24%, 07/21/05 | NR | 155,149 | |||||||
| 129,291 | First Tennessee National Corporation | ||||||||
3.22%, 08/09/05 | NR | 129,291 | |||||||
| 129,291 | Fortis Bank | ||||||||
3.11%, 07/05/05 | NR | 129,291 | |||||||
| 132,141 | Goldman Sachs Group, Inc. | ||||||||
3.32%, 12/28/05 | NR | 132,141 | |||||||
| 129,291 | Goldman Sachs Group, Inc. | ||||||||
3.33%, 08/05/05 | NR | 129,291 | |||||||
| 1,496,937 | Goldman Sachs Group, Inc. | ||||||||
Repurchase Agreement dated June 30, 2005, at 3.48%, due July 1, 2005 with a maturity amount of $1,497,082, collateralized by various corporate obligations with aggregate market value of $1,524,696. | NR | 1,496,937 | |||||||
| 129,291 | Grampian Funding LLC | ||||||||
3.28%, 07/13/05 | NR | 129,291 | |||||||
| 94,015 | Greyhawk Funding | ||||||||
3.31%, 08/09/05 | NR | 94,015 | |||||||
| 129,291 | HBOS Halifax Bank of Scotland | ||||||||
3.15%, 08/08/05 | NR | 129,291 | |||||||
| 129,291 | HSBC Banking/Holdings Plc | ||||||||
3.25%, 08/05/05 | NR | 129,291 | |||||||
| 129,291 | JP Morgan Chase & Co. | ||||||||
3.20%, 07/20/05 | NR | 129,291 | |||||||
| 258,581 | Jupiter Securitization Corp. | ||||||||
3.21%, 07/15/05 | NR | 258,581 | |||||||
| 260,455 | Lehman Brothers, Inc. Repurchase | ||||||||
Agreement dated June 30, 2005, at 3.48%, due July 1, 2005 with a maturity amount of $260,480, collateralized by various corporate obligations with aggregate market value of $265,667. | NR | 260,455 | |||||||
| 129,291 | Merrill Lynch & Co. Repurchase | ||||||||
Agreement dated June 30, 2005, at 3.48%, due July 1, 2005 with a maturity amount of $129,303, collateralized by various corporate obligations with aggregate market value of $132,512. | NR | 129,291 | |||||||
| 129,291 | Nordea Bank of Finland Plc (NY Branch) | ||||||||
3.17%, 08/09/05 | NR | 129,291 | |||||||
| 154,783 | Park Avenue Receivables Corp. | ||||||||
3.30%, 07/14/05 | NR | 154,783 | |||||||
| 166,998 | Prefco | ||||||||
3.28%, 07/08/05 | NR | 166,998 | |||||||
| $ | 155,149 | Rabobank Nederland | |||||||
3.25%, 08/08/05 | NR | $ | 155,149 | ||||||
| 129,291 | Societe Generale | ||||||||
3.24%, 08/09/05 | NR | 129,291 | |||||||
| 106,738 | The Bank of the West | ||||||||
3.27%, 07/27/05 | NR | 106,738 | |||||||
| 114,772 | Toronto Dominion Bank | ||||||||
3.25%, 08/02/05 | NR | 114,772 | |||||||
| 152,422 | Wells Fargo | ||||||||
3.27%, 08/01/05 | NR | 152,422 | |||||||
Total Short Term Investments (Cost $6,936,350) | 6,936,350 | ||||||||
| | Total Investments - 105.1% (Cost $121,721,895) | 122,140,942 | |||||||
| Net Other Assets and Liabilities - (5.1)% | (5,903,389 | ) | |||||||
| Total Net Assets - 100.0% | $ | 116,237,553 | |||||||
| (a) | All or a portion of this security is out on loan at period end. |
| (b) | Investments made with cash collateral received from securities on loan. |
| (c) | Pass Through Certificates. |
| (d) | Effective yield at time of purchase, except repurchase agreements. |
FEDERAL INCOME TAX INFORMATION (SEE NOTE 2)
At June 30, 2005, the aggregate cost of investment securities for tax purposes was $122,325,712. Net unrealized appreciation (depreciation) aggregated $184,770, of which $632,471 related to appreciated investment securities and $(817,241) related to depreciated investment securities.
OTHER INFORMATION
For the six months ended June 30, 2005, the aggregate cost of purchases and the proceeds of sales, other than from short-term investments, included $19,399,266 and $16,981,976 of U.S. Government and Agency issuers, respectively.
The composition of ratings of both long-term and short-term debt holdings as a percentage of total value of investments in securities is as follows:
Moody’s Rating | |||
Aaa | 64.5 | % | |
NR (Not Rated) | 35.5 | % | |
| 100.0 | % | ||
Major Class Concentration of Investments
as a Percentage of Net Assets:
U.S. Government And Agency Obligations | 70.4 | % | |
U.S. Government Agency Mortgage-Backed Obligation | 15.2 | ||
Asset-Backed And Mortgage-Backed Securities | 10.9 | ||
Short Term Investments | 6.0 | ||
Investment Companies | 2.6 | ||
Net Other Assets and Liabilities | (5.1 | ) | |
Total | 100.0 | % | |
See Notes to Financial Statements.
F-35
Table of Contents
MONEY MARKET FUND
PORTFOLIO OF INVESTMENTS • June 30, 2005 (Unaudited)
| Par Value | Value (Note 2) | |||||
| U.S. GOVERNMENT AGENCY OBLIGATIONS - 11.5% | ||||||
| Fannie Mae - 6.3% | ||||||
| $ | 6,000,000 | 2.32%, 09/12/05 | $ | 6,000,000 | ||
| 10,000,000 | 3.22%, 05/09/06 | 9,998,304 | ||||
| 15,998,304 | ||||||
| Federal Home Loan Bank - 3.6% | ||||||
| 2,000,000 | 3.03%, 04/25/06 | 2,000,000 | ||||
| 7,000,000 | 3.20%, 06/14/06 | 6,998,910 | ||||
| 8,998,910 | ||||||
| Freddie Mac - 1.6% | ||||||
| 4,000,000 | 3.70%, 06/30/06 | 4,000,000 | ||||
Total U.S. Government Agency Obligations (Cost $28,997,214) | 28,997,214 | |||||
| CORPORATE NOTES - 17.5% | ||||||
| Banking - Domestic - 6.4% | ||||||
| 10,000,000 | Marshall & Isley Bank | |||||
| 3.36%, 12/20/05 | 10,000,000 | |||||
| 2,000,000 | Wachovia Corp. | |||||
| 6.88%, 09/15/05 | 2,014,432 | |||||
| 4,000,000 | Wells Fargo & Co. | |||||
| 3.14%, 07/03/06 | 4,000,000 | |||||
| 16,014,432 | ||||||
| Computers & Information - 4.0% | ||||||
| 10,000,000 | International Business Machines Corp. (a) | |||||
| 3.14%, 12/08/05 | 10,000,000 | |||||
| Heavy Machinery - 3.1% | ||||||
| 7,864,000 | Caterpillar Financial Services Corp., Series F, MTN | |||||
| 3.25%, 07/09/05 | 7,864,000 | |||||
| Securities Broker - 4.0% | ||||||
| 10,000,000 | Morgan Stanley (b) | |||||
| 3.34%, 08/15/05 | 10,000,000 | |||||
Total Corporate Notes (Cost $43,878,432) | 43,878,432 | |||||
| COMMERCIAL PAPER (c) - 45.2% | ||||||
| Asset Backed - 14.3% | ||||||
| 8,000,000 | Albis Capital Corp., (a) | |||||
| 3.27%, 07/20/05 | 7,986,194 | |||||
| 6,000,000 | Ivory Funding Corp. (a) | |||||
| 3.30%, 07/25/05 | 5,986,800 | |||||
| 8,000,000 | Master Funding LLC, (a) | |||||
| 3.24%, 07/12/05 | 7,992,080 | |||||
| 8,000,000 | Steamboat Funding Corp. (a) | |||||
| 3.35%, 07/08/05 | 7,994,789 | |||||
| 6,000,000 | TransAmerica Asset Funding, (a) | |||||
| 3.30%, 07/15/05 | 5,992,300 | |||||
| 35,952,163 | ||||||
| Banking - Domestic - 2.4% | ||||||
| $ | 6,000,000 | CIT Group, Inc. | ||||
| 3.06%, 07/05/05 | $ | 5,997,960 | ||||
| Banking - Foreign Banks & Branches - 13.6% | ||||||
| 7,500,000 | Dexia Delaware LLC | |||||
| 3.28%, 09/06/05 | 7,454,286 | |||||
| 8,000,000 | Lloyds Bank Plc | |||||
| 3.13%, 07/01/05 | 8,000,000 | |||||
| 9,600,000 | Rabobank USA Financial Corp. | |||||
| 3.35%, 07/01/05 | 9,600,000 | |||||
| 9,000,000 | UBS Finance Delaware | |||||
| 3.39%, 07/01/05 | 9,000,000 | |||||
| 34,054,286 | ||||||
| Financial Services - 5.7% | ||||||
| 7,000,000 | International Lease Finance Corp. | |||||
| 3.29%, 09/07/05 | 6,956,499 | |||||
| 7,500,000 | National Rural Utilities Cooperative Finance Corp. | |||||
| 3.31%, 08/09/05 | 7,473,106 | |||||
| 14,429,605 | ||||||
| Insurance - 2.4% | ||||||
| 6,000,000 | Prudential Financial Corp. | |||||
| 3.01%, 07/06/05 | 5,997,493 | |||||
| Securities Broker - 2.8% | ||||||
| 7,000,000 | Goldman Sachs Group, Inc. | |||||
| 3.09%, 07/08/05 | 6,995,794 | |||||
| Telephone Systems - 3.2% | ||||||
| 8,000,000 | SBC Communications, Inc. (a) | |||||
| 3.11%, 07/11/05 | 7,993,089 | |||||
| Transportation - 0.8% | ||||||
| 2,045,000 | NetJets, Inc. (a) | |||||
| 3.06%, 07/07/05 | 2,043,957 | |||||
Total Commercial Paper (Cost $113,464,347) | 113,464,347 | |||||
| CERTIFICATES OF DEPOSIT - 23.7% | ||||||
| 8,000,000 | American Express Centurion Bank | |||||
| 3.11%, 07/11/05 | 8,000,000 | |||||
| 8,000,000 | Barclays Bank | |||||
| 3.11%, 07/11/05 | 8,000,006 | |||||
| 8,000,000 | BNP Paribas (NY Branch) | |||||
| 3.31%, 09/09/05 | 8,000,154 | |||||
| 5,000,000 | Credit Suisse First Boston (NY Branch) | |||||
| 3.13%, 01/06/06 | 5,000,192 | |||||
| 8,000,000 | HBOS Treasury Services | |||||
| 3.05%, 07/01/05 | 8,000,000 | |||||
| 8,000,000 | Toronto-Dominion Bank, Ltd. | |||||
| 2.84%, 07/20/05 | 7,998,061 | |||||
| 7,000,000 | Washington Mutual Bank | |||||
| 3.10%, 07/08/05 | 7,000,000 | |||||
See Notes to Financial Statements.
F-36
Table of Contents
MONEY MARKET FUND
PORTFOLIO OF INVESTMENTS, Continued • June 30, 2005 (Unaudited)
| Par Value | Value (Note 2) | |||||
| CERTIFICATES OF DEPOSIT (continued) | ||||||
| $ | 7,500,000 | Wilmington Trust Co | ||||
3.06%, 07/01/05 | $ | 7,500,000 | ||||
Total Certificates of Deposit (Cost $59,498,413) | 59,498,413 | |||||
| Shares | ||||||
| INVESTMENT COMPANIES - 2.0% | ||||||
| 4,821,563 | Barclays Prime Money Market Fund | 4,821,563 | ||||
| 46,032 | Dreyfus Cash Management Plus | |||||
Money Market Fund | 46,032 | |||||
| 212,458 | One Group Institutional Prime | |||||
Money Market Fund | 212,458 | |||||
Total Investment Companies (Cost $5,080,053) | 5,080,053 | |||||
| | Total Investments - 99.9% (Cost $250,918,459) | 250,918,459 | ||||
| Net Other Assets and Liabilities - 0.1% | 309,509 | |||||
| Total Net Assets - 100.0% | $ | 251,227,968 | ||||
| (a) | Security exempt from registration under Rule 144A of the Securities Act of 1933. This security may be resold in transactions exempt from registration, to qualified institutional buyers. At June 30, 2005, these securities amounted to $55,989,208 or 22.3% of net assets. These securities have been deemed to be liquid in accordance with procedures established by the Board of Trustees. |
| (b) | Variable rate security. The rate shown reflects rate in effect at period end. |
| (c) | Effective yield at time of purchase. |
| MTN | Medium Term Note |
FEDERAL INCOME TAX INFORMATION (SEE NOTE 2)
At June 30, 2005, the aggregate cost of investment securities for tax purposes was $250,918,459.
Major Class Concentration of Investments
as a Percentage of Net Assets:
Commercial Paper | 45.2 | % | |
Certificates Of Deposit | 23.7 | ||
Corporate Notes | 17.5 | ||
U.S. Government Agency Obligations | 11.5 | ||
Investment Companies | 2.0 | ||
Net Other Assets and Liabilities | 0.1 | ||
Total | 100.0 | % | |
See Notes to Financial Statements.
F-37
Table of Contents
ALLMERICA INVESTMENT TRUST
STATEMENTS OF ASSETS AND LIABILITIES • June 30, 2005 (Unaudited)
Select Capital | Select Value Opportunity | ||||||
ASSETS: | |||||||
Investments: | |||||||
Investments at cost | $ | 264,790,696 | $ | 327,660,521 | |||
Net unrealized appreciation | 69,016,481 | 34,774,583 | |||||
Total investments at value† | 333,807,177 | 362,435,104 | |||||
Cash | 11,200 | 10,560,133 | |||||
Foreign currency* | — | — | |||||
Receivable for investments sold | 200,424 | 2,356,945 | |||||
Receivable for shares sold | — | — | |||||
Interest and dividend receivables | 112,850 | 1,392,757 | |||||
Receivable for variation margin | — | — | |||||
Unrealized appreciation on forward currency contracts | — | — | |||||
Dividend tax reclaim receivable | 1,919 | 6,589 | |||||
Miscellaneous receivable | — | — | |||||
Total Assets | 334,133,570 | 376,751,528 | |||||
LIABILITIES: | |||||||
Payable for investments purchased | 714,142 | 3,574,067 | |||||
Collateral for securities loaned | 61,374,685 | 64,966,598 | |||||
Management fee payable | 208,349 | 225,603 | |||||
Distribution fee payable | 33,673 | 38,056 | |||||
Trustees’ fees and expenses payable | 4,044 | 5,858 | |||||
Unrealized depreciation on forward currency contracts | — | — | |||||
Payable for shares repurchased | 267,371 | 319,766 | |||||
Payable for variation margin | — | — | |||||
Accrued expenses and other payables | 55,493 | 56,641 | |||||
Total Liabilities | 62,657,757 | 69,186,589 | |||||
NET ASSETS | $ | 271,475,813 | $ | 307,564,939 | |||
NET ASSETS consist of: | |||||||
Paid-in capital | $ | 153,055,679 | $ | 179,976,116 | |||
Undistributed (distribution in excess of) net investment income (loss) | (761,315 | ) | 1,229,694 | ||||
Accumulated (distribution in excess of) net realized gain (loss) on investments sold, foreign currency transactions and futures contracts | 50,164,968 | 91,584,546 | |||||
Net unrealized appreciation of investments, assets and liabilities in foreign currency and futures contracts | 69,016,481 | 34,774,583 | |||||
TOTAL NET ASSETS | $ | 271,475,813 | $ | 307,564,939 | |||
Shares of beneficial interest outstanding (unlimited authorization, no par value) | 116,842,392 | 135,757,004 | |||||
NET ASSET VALUE, | |||||||
Offering and redemption price per share (Net Assets/Shares Outstanding) | $ | 2.323 | $ | 2.266 | |||
†Total value of securities on loan | $ | 59,326,029 | $ | 62,440,926 | |||
| * | Cost $661,436 for Select International Equity Fund. |
See Notes to Financial Statements.
F-38
Table of Contents
ALLMERICA INVESTMENT TRUST
| Select International Equity Fund | Select Growth Fund | Core Equity Fund | Equity Index Fund | Select Investment Grade Income Fund | Government Bond Fund | Money Market Fund | |||||||||||||||||||
| $ | 264,780,172 | $ | 462,136,839 | $ | 281,288,986 | $ | 487,790,021 | $ | 374,049,663 | $ | 121,721,895 | $ | 250,918,459 | ||||||||||||
| 37,699,203 | 46,894,279 | 38,485,451 | 69,610,838 | 4,445,609 | 419,047 | — | |||||||||||||||||||
| 302,479,375 | 509,031,118 | 319,774,437 | 557,400,859 | 378,495,272 | 122,140,942 | 250,918,459 | |||||||||||||||||||
| 4,466,015 | 313,967 | 3,560,257 | 21,075 | 18,387 | 12,447 | 15,445 | |||||||||||||||||||
| 644,933 | — | — | — | — | — | — | |||||||||||||||||||
| — | 1,371,307 | 1,112,673 | — | 3,741,319 | 200 | — | |||||||||||||||||||
| — | — | — | — | — | 52,248 | — | |||||||||||||||||||
| 1,059,849 | 390,066 | 342,117 | 726,815 | 3,650,056 | 1,066,298 | 623,514 | |||||||||||||||||||
| 44,507 | — | — | — | — | — | — | |||||||||||||||||||
| 801,990 | — | — | — | — | — | — | |||||||||||||||||||
| 138,778 | 9,703 | — | — | — | — | — | |||||||||||||||||||
| — | — | — | 831 | — | — | — | |||||||||||||||||||
| 309,635,447 | 511,116,161 | 324,789,484 | 558,149,580 | 385,905,034 | 123,272,135 | 251,557,418 | |||||||||||||||||||
| — | 1,078,910 | 568,265 | — | 15,543,037 | — | — | |||||||||||||||||||
| 17,514,524 | 50,791,738 | 27,286,982 | 36,329,944 | 1,979,744 | 6,936,350 | — | |||||||||||||||||||
| 226,948 | 309,456 | 146,310 | 122,397 | 128,829 | 48,240 | 66,609 | |||||||||||||||||||
| 36,204 | 58,050 | 37,007 | 65,656 | 45,853 | 14,395 | 31,081 | |||||||||||||||||||
| 5,978 | 10,531 | 6,587 | 10,317 | 9,375 | 3,766 | 5,366 | |||||||||||||||||||
| 1,180,453 | — | — | — | — | — | — | |||||||||||||||||||
| 289,784 | 573,236 | 463,307 | 607,448 | 210,934 | 742 | 195,678 | |||||||||||||||||||
| — | — | — | 26,933 | — | — | — | |||||||||||||||||||
| 116,016 | 94,370 | 73,940 | 112,756 | 75,995 | 31,089 | 30,716 | |||||||||||||||||||
| 19,369,907 | 52,916,291 | 28,582,398 | 37,275,451 | 17,993,767 | 7,034,582 | 329,450 | |||||||||||||||||||
| $ | 290,265,540 | $ | 458,199,870 | $ | 296,207,086 | $ | 520,874,129 | $ | 367,911,267 | $ | 116,237,553 | $ | 251,227,968 | ||||||||||||
| $ | 346,822,403 | $ | 718,253,105 | $ | 488,784,717 | $ | 615,079,115 | $ | 366,762,774 | $ | 118,044,956 | $ | 251,207,218 | ||||||||||||
| 7,931,183 | 1,014,316 | 131,211 | 197,245 | (2,432,548 | ) | (857,857 | ) | 20,750 | |||||||||||||||||
| (101,818,442 | ) | (307,961,830 | ) | (231,194,293 | ) | (163,971,911 | ) | (864,568 | ) | (1,368,593 | ) | — | |||||||||||||
| 37,330,396 | 46,894,279 | 38,485,451 | 69,569,680 | 4,445,609 | 419,047 | — | |||||||||||||||||||
| $ | 290,265,540 | $ | 458,199,870 | $ | 296,207,086 | $ | 520,874,129 | $ | 367,911,267 | $ | 116,237,553 | $ | 251,227,968 | ||||||||||||
| 233,057,714 | 300,785,072 | 174,712,347 | 198,932,353 | 339,348,239 | 107,389,283 | 251,149,131 | |||||||||||||||||||
| $ | 1.245 | $ | 1.523 | $ | 1.695 | $ | 2.618 | $ | 1.084 | $ | 1.082 | $ | 1.000 | ||||||||||||
| $ | 16,714,053 | $ | 49,050,190 | $ | 26,439,647 | $ | 34,997,547 | $ | 1,910,685 | $ | 6,702,547 | $ | — | ||||||||||||
F-39
Table of Contents
ALLMERICA INVESTMENT TRUST
STATEMENTS OF OPERATIONS • For the Six Months Ended June 30, 2005 (Unaudited)
| Select capital Appreciation fund | Select Value Opportunity Fund | |||||||
INVESTMENT INCOME | ||||||||
Interest | $ | 126,839 | $ | 92,223 | ||||
Dividends | 632,607 | 2,861,288 | ||||||
Securities lending income | 57,322 | 40,344 | ||||||
Less net foreign taxes withheld | (6,487 | ) | (26,536 | ) | ||||
Total investment income | 810,281 | 2,967,319 | ||||||
EXPENSES | ||||||||
Management fees | 1,270,173 | 1,399,474 | ||||||
Distribution fees | 205,615 | 236,832 | ||||||
Custodian and Fund accounting fees | 53,505 | 57,312 | ||||||
Legal fees | 9,463 | 11,320 | ||||||
Audit fees | 18,773 | 20,828 | ||||||
Trustees’ fees and expenses | 10,187 | 12,305 | ||||||
Reports to shareholders | 1,902 | 1,842 | ||||||
Miscellaneous | 516 | 629 | ||||||
Total expenses before waivers | 1,570,134 | 1,740,542 | ||||||
Less expense waivers | — | — | ||||||
Total expenses net of expense waivers | 1,570,134 | 1,740,542 | ||||||
NET INVESTMENT INCOME (LOSS) | (759,853 | ) | 1,226,777 | |||||
NET REALIZED AND UNREALIZED GAIN (LOSS) ON INVESTMENTS: | ||||||||
Net realized gain (loss) on investments sold | 18,489,152 | 23,748,760 | ||||||
Net realized gain (loss) on futures contracts | — | — | ||||||
Net realized gain (loss) on foreign currency transactions | (4,160 | ) | (190 | ) | ||||
Net change in unrealized appreciation (depreciation) of investments | (14,221,906 | ) | (26,612,161 | ) | ||||
Net change in unrealized appreciation (depreciation) of assets and liabilities in foreign currency | 1,383 | — | ||||||
Net change in unrealized appreciation (depreciation) of futures contracts | — | — | ||||||
NET GAIN (LOSS) ON INVESTMENTS | 4,264,469 | (2,863,591 | ) | |||||
NET INCREASE (DECREASE) IN NET ASSETS RESULTING FROM OPERATIONS | $ | 3,504,616 | $ | (1,636,814 | ) | |||
See Notes to Financial Statements.
F-40
Table of Contents
ALLMERICA INVESTMENT TRUST
| Select International Equity Fund | Select Growth Fund | Core Equity Fund | Equity Index Fund | Select Investment Grade Income Fund | Government Bond Fund | Money Market Fund | |||||||||||||||||||
| $ | 59,045 | $ | 166,183 | $ | 1,229 | $ | 155,367 | $ | 8,747,194 | $ | 2,286,902 | $ | 3,467,536 | ||||||||||||
| 6,174,667 | 2,108,402 | 2,448,266 | 4,928,324 | — | — | — | |||||||||||||||||||
| 137,870 | 31,748 | 13,690 | 35,065 | 8,798 | 4,572 | — | |||||||||||||||||||
| (686,161 | ) | (39,586 | ) | — | — | — | — | — | |||||||||||||||||
| 5,685,421 | 2,266,747 | 2,463,185 | 5,118,756 | 8,755,992 | 2,291,474 | 3,467,536 | |||||||||||||||||||
| 1,416,699 | 1,962,654 | 905,241 | 756,496 | 794,958 | 299,970 | 409,788 | |||||||||||||||||||
| 230,316 | 356,448 | 229,979 | 409,267 | 284,162 | 89,991 | 192,497 | |||||||||||||||||||
| 241,771 | 94,127 | 70,416 | 171,904 | 75,436 | 33,937 | 39,076 | |||||||||||||||||||
| 11,021 | 16,115 | 10,431 | 18,712 | 12,794 | 4,130 | 12,181 | |||||||||||||||||||
| 20,587 | 30,532 | 20,115 | 35,430 | 24,792 | 8,392 | 16,804 | |||||||||||||||||||
| 12,183 | 19,821 | 12,647 | 21,627 | 16,590 | 5,568 | 9,913 | |||||||||||||||||||
| 9,295 | 4,341 | 3,299 | 3,119 | 2,395 | 893 | 15,091 | |||||||||||||||||||
| 624 | 1,030 | 656 | 1,174 | 910 | 323 | 963 | |||||||||||||||||||
| 1,942,496 | 2,485,068 | 1,252,784 | 1,417,729 | 1,212,037 | 443,204 | 696,313 | |||||||||||||||||||
| — | (84,264 | ) | — | — | — | — | — | ||||||||||||||||||
| 1,942,496 | 2,400,804 | 1,252,784 | 1,417,729 | 1,212,037 | 443,204 | 696,313 | |||||||||||||||||||
| 3,742,925 | (134,057 | ) | 1,210,401 | 3,701,027 | 7,543,955 | 1,848,270 | 2,771,223 | ||||||||||||||||||
| 12,590,420 | 18,086,047 | 4,854,872 | (4,670,745 | ) | 623,063 | (126,340 | ) | — | |||||||||||||||||
| 71,786 | — | — | (105,998 | ) | — | — | — | ||||||||||||||||||
| (749,767 | ) | 375 | — | — | — | — | — | ||||||||||||||||||
| (16,620,261 | ) | (26,657,137 | ) | (9,148,451 | ) | (5,438,306 | ) | (638,450 | ) | 303,671 | — | ||||||||||||||
| (335,984 | ) | — | — | — | — | — | — | ||||||||||||||||||
| 44,048 | — | — | (47,777 | ) | — | — | — | ||||||||||||||||||
| (4,999,758 | ) | (8,570,715 | ) | (4,293,579 | ) | (10,262,826 | ) | (15,387 | ) | 177,331 | — | ||||||||||||||
| $ | (1,256,833 | ) | $ | (8,704,772 | ) | $ | (3,083,178 | ) | $ | (6,561,799 | ) | $ | 7,528,568 | $ | 2,025,601 | $ | 2,771,223 | ||||||||
F-41
Table of Contents
ALLMERICA INVESTMENT TRUST
STATEMENTS OF CHANGES IN NET ASSETS
| Select Capital Appreciation Fund | ||||||||
| Six Months Ended June 30, 2005 (Unaudited) | Year Ended December 31, 2004 | |||||||
NET ASSETS at beginning of period | $ | 299,355,071 | $ | 296,203,932 | ||||
Increase (decrease) in net assets resulting from operations: | ||||||||
Net investment income (loss) | (759,853 | ) | (2,024,733 | ) | ||||
Net realized gain on investments sold, foreign currency transactions, and futures contracts | 18,484,992 | 39,823,753 | ||||||
Net change in unrealized appreciation (depreciation) of investments, assets and liabilities in foreign currency, and futures contracts | (14,220,523 | ) | 11,697,850 | |||||
Net increase (decrease) in net assets resulting from operations | 3,504,616 | 49,496,870 | ||||||
Distributions to shareholders from: | ||||||||
Net investment income | — | — | ||||||
Net realized gain on investments | — | (25,213,313 | ) | |||||
Total distributions | — | (25,213,313 | ) | |||||
Capital share transactions: | ||||||||
Net proceeds from sales of shares | 1,156,734 | 18,475,189 | ||||||
Issued to shareholders in reinvestment of distributions | — | 25,213,313 | ||||||
Cost of shares repurchased | (32,540,608 | ) | (64,820,920 | ) | ||||
Net decrease from capital share transactions | (31,383,874 | ) | (21,132,418 | ) | ||||
Total increase (decrease) in net assets | (27,879,258 | ) | 3,151,139 | |||||
NET ASSETS at end of period | $ | 271,475,813 | $ | 299,355,071 | ||||
Undistributed (distribution in excess of) net investment income (loss) | $ | (761,315 | ) | $ | (1,462 | ) | ||
OTHER INFORMATION: | ||||||||
Share transactions: | ||||||||
Sold | 510,551 | 8,386,260 | ||||||
Issued to shareholders in reinvestment of distributions | — | 13,118,269 | ||||||
Repurchased | (14,609,024 | ) | (29,966,652 | ) | ||||
Net decrease in shares outstanding | (14,098,473 | ) | (8,462,123 | ) | ||||
See Notes to Financial Statements.
F-42
Table of Contents
ALLMERICA INVESTMENT TRUST
| Select Value Opportunity Fund | Select International Equity Fund | Select Growth Fund | Core Equity Fund | |||||||||||||||||||||||||||
| Six Months Ended June 30, 2005 (Unaudited) | Year Ended December 31, 2004 | Six Months Ended June 30, 2005 (Unaudited) | Year Ended December 31, 2004 | Six Months Ended June 30, 2005 (Unaudited) | Year Ended December 31, 2004 | Six Months Ended June 30, 2005 (Unaudited) | Year Ended December 31, 2004 | |||||||||||||||||||||||
| $ | 345,750,311 | $ | 380,800,995 | $ | 333,493,513 | $ | 380,653,182 | $ | 528,558,184 | $ | 625,728,520 | $ | 337,127,194 | $ | 400,016,657 | |||||||||||||||
| 1,226,777 | 76,603 | 3,742,925 | 4,551,152 | (134,057 | ) | 1,149,335 | 1,210,401 | 3,624,671 | ||||||||||||||||||||||
| 23,748,570 | 70,248,308 | 11,912,439 | 17,603,261 | 18,086,422 | 55,845,736 | 4,854,872 | 14,247,089 | |||||||||||||||||||||||
| (26,612,161 | ) | (9,880,090 | ) | (16,912,197 | ) | 22,365,117 | (26,657,137 | ) | (19,966,323 | ) | (9,148,451 | ) | 15,552,965 | |||||||||||||||||
| (1,636,814 | ) | 60,444,821 | (1,256,833 | ) | 44,519,530 | (8,704,772 | ) | 37,028,748 | (3,083,178 | ) | 33,424,725 | |||||||||||||||||||
| — | (195,555 | ) | — | (4,285,464 | ) | — | — | (1,124,431 | ) | (3,653,589 | ) | |||||||||||||||||||
| — | (22,153,292 | ) | — | — | — | — | — | — | ||||||||||||||||||||||
| — | (22,348,847 | ) | — | (4,285,464 | ) | — | — | (1,124,431 | ) | (3,653,589 | ) | |||||||||||||||||||
| 1,781,635 | 4,975,103 | 5,483,899 | 22,515,775 | 320,754 | 80,506 | 450,779 | 145,927 | |||||||||||||||||||||||
| — | 22,348,847 | — | 4,285,464 | — | — | 1,124,431 | 3,653,589 | |||||||||||||||||||||||
| (38,330,193 | ) | (100,470,608 | ) | (47,455,039 | ) | (114,194,974 | ) | (61,974,296 | ) | (134,279,590 | ) | (38,287,709 | ) | (96,460,115 | ) | |||||||||||||||
| (36,548,558 | ) | (73,146,658 | ) | (41,971,140 | ) | (87,393,735 | ) | (61,653,542 | ) | (134,199,084 | ) | (36,712,499 | ) | (92,660,599 | ) | |||||||||||||||
| (38,185,372 | ) | (35,050,684 | ) | (43,227,973 | ) | (47,159,669 | ) | (70,358,314 | ) | (97,170,336 | ) | (40,920,108 | ) | (62,889,463 | ) | |||||||||||||||
| $ | 307,564,939 | $ | 345,750,311 | $ | 290,265,540 | $ | 333,493,513 | $ | 458,199,870 | $ | 528,558,184 | $ | 296,207,086 | $ | 337,127,194 | |||||||||||||||
| $ | 1,229,694 | $ | 2,917 | $ | 7,931,183 | $ | 4,188,258 | $ | 1,014,316 | $ | 1,148,373 | $ | 131,211 | $ | 45,241 | |||||||||||||||
| 802,335 | 2,354,194 | 4,416,603 | 19,986,173 | 211,231 | 55,897 | 268,022 | 92,981 | |||||||||||||||||||||||
| — | 11,881,364 | — | 3,993,908 | — | — | 672,853 | 2,230,774 | |||||||||||||||||||||||
| (17,337,846 | ) | (47,740,940 | ) | (38,031,000 | ) | (100,846,151 | ) | (41,628,887 | ) | (92,875,643 | ) | (22,976,826 | ) | (60,667,374 | ) | |||||||||||||||
| (16,535,511 | ) | (33,505,382 | ) | (33,614,397 | ) | (76,866,070 | ) | (41,417,656 | ) | (92,819,746 | ) | (22,035,951 | ) | (58,343,619 | ) | |||||||||||||||
F-43
Table of Contents
ALLMERICA INVESTMENT TRUST
STATEMENTS OF CHANGES IN NET ASSETS
Equity Index Fund | ||||||||
| Six Months Ended June 30, 2005 (Unaudited) | Year Ended December 31, 2004 | |||||||
NET ASSETS at beginning of period | $ | 595,036,614 | $ | 666,454,873 | ||||
Increase (decrease) in net assets resulting from operations: | ||||||||
Net investment income | 3,701,027 | 9,352,455 | ||||||
Net realized gain (loss) on investments sold, foreign currency transactions, and futures contracts | (4,776,743 | ) | (5,491,515 | ) | ||||
Net change in unrealized appreciation (depreciation) of investments, assets and liabilities in foreign currency, and futures contracts | (5,486,083 | ) | 54,384,265 | |||||
Net increase (decrease) in net assets resulting from operations | (6,561,799 | ) | 58,245,205 | |||||
Distributions to shareholders from: | ||||||||
Net investment income | (3,546,117 | ) | (9,477,338 | ) | ||||
Net realized gain on investments | — | — | ||||||
Total distributions | (3,546,117 | ) | (9,477,338 | ) | ||||
Capital share transactions: | ||||||||
Net proceeds from sales of shares | 9,732,270 | 9,645,957 | ||||||
Issued to shareholders in reinvestment of distributions | 3,546,117 | 9,477,338 | ||||||
Cost of shares repurchased | (77,332,956 | ) | (139,309,421 | ) | ||||
Net decrease from capital share transactions | (64,054,569 | ) | (120,186,126 | ) | ||||
Total decrease in net assets | (74,162,485 | ) | (71,418,259 | ) | ||||
NET ASSETS at end of period | $ | 520,874,129 | $ | 595,036,614 | ||||
Undistributed (distribution in excess of) net investment income (loss) | $ | 197,245 | $ | 42,335 | ||||
OTHER INFORMATION: | ||||||||
Share transactions: | ||||||||
Sold | 3,765,752 | 3,877,093 | ||||||
Issued to shareholders in reinvestment of distributions | 1,360,379 | 3,711,188 | ||||||
Repurchased | (29,567,944 | ) | (55,860,548 | ) | ||||
Net decrease in shares outstanding | (24,441,813 | ) | (48,272,267 | ) | ||||
See Notes to Financial Statements.
F-44
Table of Contents
ALLMERICA INVESTMENT TRUST
| Select Investment Grade Income Fund | Government Bond Fund | Money Market Fund | ||||||||||||||||||||
| Six Months Ended June 30, 2005 (Unaudited) | Year Ended December 31, 2004 | Six Months Ended June 30, 2005 (Unaudited) | Year Ended December 31, 2004 | Six Months Ended June 30, 2005 (Unaudited) | Year Ended December 31, 2004 | |||||||||||||||||
| $ | 402,218,814 | $ | 530,198,773 | $ | 128,860,335 | $ | 200,158,460 | $ | 264,678,567 | $ | 377,154,527 | |||||||||||
| 7,543,955 | 17,654,294 | 1,848,270 | 4,663,724 | 2,771,223 | 2,804,306 | |||||||||||||||||
| 623,063 | 2,735,617 | (126,340 | ) | 884,027 | — | 4,093 | ||||||||||||||||
| (638,450 | ) | (2,872,175 | ) | 303,671 | (2,220,513 | ) | — | — | ||||||||||||||
| 7,528,568 | 17,517,736 | 2,025,601 | 3,327,238 | 2,771,223 | 2,808,399 | |||||||||||||||||
| (8,747,278 | ) | (24,167,490 | ) | (2,141,690 | ) | (5,646,130 | ) | (2,771,223 | ) | (2,804,306 | ) | |||||||||||
| — | (6,247,516 | ) | — | (273,498 | ) | — | — | |||||||||||||||
| (8,747,278 | ) | (30,415,006 | ) | (2,141,690 | ) | (5,919,628 | ) | (2,771,223 | ) | (2,804,306 | ) | |||||||||||
| 6,025,196 | 12,499,850 | 2,204,061 | 1,021,637 | 70,774,053 | 105,887,642 | |||||||||||||||||
| 8,747,278 | 30,415,006 | 2,141,690 | 5,919,628 | 2,771,223 | 2,804,306 | |||||||||||||||||
| (47,861,311 | ) | (157,997,545 | ) | (16,852,444 | ) | (75,647,000 | ) | (86,995,875 | ) | (221,172,001 | ) | |||||||||||
| (33,088,837 | ) | (115,082,689 | ) | (12,506,693 | ) | (68,705,735 | ) | (13,450,599 | ) | (112,480,053 | ) | |||||||||||
| (34,307,547 | ) | (127,979,959 | ) | (12,622,782 | ) | (71,298,125 | ) | (13,450,599 | ) | (112,475,960 | ) | |||||||||||
| $ | 367,911,267 | $ | 402,218,814 | $ | 116,237,553 | $ | 128,860,335 | $ | 251,227,968 | $ | 264,678,567 | |||||||||||
| $ | (2,432,548 | ) | $ | (1,229,225 | ) | $ | (857,857 | ) | $ | (564,437 | ) | $ | 20,750 | $ | 20,750 | |||||||
| 5,557,793 | 11,297,435 | 2,042,785 | 921,521 | 70,774,053 | 105,887,642 | |||||||||||||||||
| 8,133,420 | 27,670,352 | 1,993,502 | 5,415,831 | 2,771,223 | 2,804,306 | |||||||||||||||||
| (44,058,255 | ) | (142,900,172 | ) | (15,596,630 | ) | (68,746,934 | ) | (86,995,875 | ) | (221,172,001 | ) | |||||||||||
| (30,367,042 | ) | (103,932,385 | ) | (11,560,343 | ) | (62,409,582 | ) | (13,450,599 | ) | (112,480,053 | ) | |||||||||||
F-45
Table of Contents
ALLMERICA INVESTMENT TRUST
FINANCIAL HIGHLIGHTS - For a Share Outstanding Throughout Each Period
| Income from Investment Operations | Less Distributions | ||||||||||||||||||||||||||||||
| Year Ended December 31, | Net Asset Value Beginning of Period | Net Investment Income (Loss)(2) | Net Realized and Unrealized Gain (Loss) on Investments | Total from Investment Operations | Dividends from Net Investment Income | Distributions from Net Realized Capital Gains | Total Distributions | Net Increase (Decrease) in Net Asset Value | |||||||||||||||||||||||
| Select Capital Appreciation Fund(6) | |||||||||||||||||||||||||||||||
2005(d) | $ | 2.286 | $ | (0.007 | ) | $ | 0.044 | $ | 0.037 | $ | — | $ | — | $ | — | $ | 0.037 | ||||||||||||||
| 2004 | 2.125 | (0.015 | ) | 0.373 | 0.358 | — | (0.197 | ) | (0.197 | ) | 0.161 | ||||||||||||||||||||
| 2003 | 1.521 | (0.015 | ) | 0.619 | 0.604 | — | — | — | 0.604 | ||||||||||||||||||||||
| 2002 | 1.940 | (0.014 | ) | (0.405 | ) | (0.419 | ) | — | — | — | (0.419 | ) | |||||||||||||||||||
| 2001 | 2.122 | (0.010 | ) | (0.019 | ) | (0.029 | ) | — | (0.153 | ) | (0.153 | ) | (0.182 | ) | |||||||||||||||||
| 2000 | 2.053 | (0.008 | ) | 0.147 | 0.139 | — | (0.070 | ) | (0.070 | ) | 0.069 | ||||||||||||||||||||
| Select Value Opportunity Fund(6) | |||||||||||||||||||||||||||||||
| 2005(d) | $ | 2.270 | $ | 0.009 | $ | (0.013 | ) | $ | (0.004 | ) | $ | — | $ | — | $ | — | $ | (0.004 | ) | ||||||||||||
| 2004 | 2.050 | 0.001 | 0.365 | 0.366 | (0.001 | ) | (0.145 | ) | (0.146 | ) | 0.220 | ||||||||||||||||||||
| 2003 | 1.487 | 0.002 | 0.568 | 0.570 | (0.002 | ) | (0.005 | ) | (0.007 | ) | 0.563 | ||||||||||||||||||||
| 2002 | 1.975 | 0.002 | (0.315 | ) | (0.313 | ) | (0.011 | ) | (0.164 | ) | (0.175 | ) | (0.488 | ) | |||||||||||||||||
| 2001 | 1.958 | 0.012 | 0.225 | 0.237 | (0.012 | ) | (0.208 | ) | (0.220 | ) | 0.017 | ||||||||||||||||||||
| 2000 | 1.521 | 0.012 | 0.446 | 0.458 | (0.006 | ) | (0.015 | ) | (0.021 | ) | 0.437 | ||||||||||||||||||||
| Select International Equity Fund(1)(6) | |||||||||||||||||||||||||||||||
| 2005(d) | $ | 1.251 | $ | 0.018 | $ | (0.024 | ) | $ | (0.006 | ) | $ | — | $ | — | $ | — | $ | (0.006 | ) | ||||||||||||
| 2004 | 1.108 | 0.019 | 0.139 | 0.158 | (0.015 | ) | — | (0.015 | ) | 0.143 | |||||||||||||||||||||
| 2003 | 0.874 | 0.015 | 0.226 | 0.241 | (0.007 | ) | — | (0.007 | ) | 0.234 | |||||||||||||||||||||
| 2002 | 1.113 | 0.013 | (0.226 | ) | (0.213 | ) | (0.017 | ) | (0.009 | ) | (0.026 | ) | (0.239 | ) | |||||||||||||||||
| 2001 | 1.781 | 0.018 | (0.385 | ) | (0.367 | ) | (0.024 | ) | (0.277 | ) | (0.301 | ) | (0.668 | ) | |||||||||||||||||
| 2000 | 2.031 | 0.013 | (0.191 | ) | (0.178 | ) | (0.009 | ) | (0.063 | ) | (0.072 | ) | (0.250 | ) | |||||||||||||||||
| Select Growth Fund(1)(6) | |||||||||||||||||||||||||||||||
| 2005(d) | $ | 1.545 | $ | — | (5) | $ | (0.022 | ) | $ | (0.022 | ) | $ | — | $ | — | $ | — | $ | (0.022 | ) | |||||||||||
| 2004 | 1.438 | 0.003 | (3) | 0.104 | 0.107 | — | — | — | 0.107 | ||||||||||||||||||||||
| 2003 | 1.139 | (0.001 | ) | 0.301 | 0.300 | (0.001 | ) | — | (0.001 | ) | 0.299 | ||||||||||||||||||||
| 2002 | 1.576 | 0.001 | (0.436 | ) | (0.435 | ) | (0.002 | ) | — | (0.002 | ) | (0.437 | ) | ||||||||||||||||||
| 2001 | 2.214 | 0.002 | (0.545 | ) | (0.543 | ) | — | (0.095 | ) | (0.095 | ) | (0.638 | ) | ||||||||||||||||||
| 2000 | 3.049 | (0.001 | ) | (0.489 | ) | (0.490 | ) | — | (0.345 | ) | (0.345 | ) | (0.835 | ) | |||||||||||||||||
| Core Equity Fund(1)(6) | |||||||||||||||||||||||||||||||
| 2005(d) | $ | 1.713 | $ | 0.007 | $ | (0.019 | ) | $ | (0.012 | ) | $ | (0.006 | ) | $ | — | $ | (0.006 | ) | $ | (0.018 | ) | ||||||||||
| 2004 | 1.568 | 0.017 | (3) | 0.145 | 0.162 | (0.017 | ) | — | (0.017 | ) | 0.145 | ||||||||||||||||||||
| 2003 | 1.239 | 0.012 | 0.329 | 0.341 | (0.012 | ) | — | (0.012 | ) | 0.329 | |||||||||||||||||||||
| 2002 | 1.633 | 0.011 | (4) | (0.393 | ) | (0.382 | ) | (0.012 | ) | — | (0.012 | ) | (0.394 | ) | |||||||||||||||||
| 2001 | 2.689 | 0.016 | (0.439 | ) | (0.423 | ) | (0.015 | ) | (0.618 | ) | (0.633 | ) | (1.056 | ) | |||||||||||||||||
| 2000 | 3.310 | 0.016 | (0.295 | ) | (0.279 | ) | (0.017 | ) | (0.325 | ) | (0.342 | ) | (0.621 | ) | |||||||||||||||||
| * | Annualized. |
| ** | Not Annualized. |
| (a) | Including reimbursements, waivers, and reductions. |
| (b) | Excluding reductions. Certain Portfolios have entered varying arrangements with brokers who reduced a portion of the Portfolio’s expenses. |
| (c) | Excluding reimbursements, waivers, and reductions. |
| (d) | For the six months ended June 30, 2005 (Unaudited). |
| (1) | The Select International Equity Fund changed sub-advisors and added a second sub-advisor on October 1, 2004. The Select Growth Fund added a second sub-adviser on April 18, 2003 and replaced the first sub-adviser on April 30, 2004. The Core Equity Fund changed sub-advisers and added a second sub-adviser on May 1, 2002. |
| (2) | Net investment income (loss) per share before reimbursements and waivers of fees by the investment advisor or reductions were $(0.016) in 2004 for Select Capital Appreciation Fund; $(0.001) in 2004, $0.001 in 2003, $0.000 in 2002, $0.011 in 2001, and $0.011 in 2000 for Select Value Opportunity Fund; $(0.002) in 2003, $0.000 in 2002, $0.001 in 2001, and $(0.002) in 2000 for Select Growth Fund; and $0.014 in 2001 and $0.015 in 2000 for Core Equity Fund. |
| (3) | Investment income per share reflects a special dividend which amounted to $0.006 and $0.004 for Select Growth Fund and Core Equity Fund, respectively. |
| (4) | Computed using average shares outstanding throughout the period. |
| (5) | Net investment loss is less than $0.0005. |
| (6) | Effective January 1, 2005, brokerage commissions are included with realized gain or loss on investment transactions. Prior to January 1, 2005, these amounts were presented as a reduction of expenses. Prior year amounts have not been restated to reflect this change. (See Note 3). |
See Notes to Financial Statements.
F-46
Table of Contents
ALLMERICA INVESTMENT TRUST
| Ratios/Supplemental Data | |||||||||||||||||||||||||||
| Ratios To Average Net Assets | |||||||||||||||||||||||||||
| Net Asset Value End of Period | Total Return | Net Assets End of Period (000’s) | Net Investment Income (Loss) | Operating Expenses | Management Fee | Portfolio | |||||||||||||||||||||
| (a) | (b) | (c) | Gross | Net | |||||||||||||||||||||||
| $2.323 | 1.62 | %** | $ | 271,476 | (0.55 | )%* | 1.15 | %* | 1.15 | %* | 1.15 | %* | 0.93 | %* | 0.93 | %* | 12 | %** | |||||||||
| 2.286 | 18.62 | % | 299,355 | (0.70 | )% | 1.14 | % | 1.15 | % | 1.15 | % | 0.92 | % | 0.92 | % | 38 | % | ||||||||||
| 2.125 | 39.71 | % | 296,204 | (0.70 | )% | 1.11 | % | 1.13 | % | 1.13 | % | 0.92 | % | 0.92 | % | 46 | % | ||||||||||
| 1.521 | (21.60 | )% | 287,593 | (0.70 | )% | 1.05 | % | 1.06 | % | 1.06 | % | 0.90 | % | 0.90 | % | 41 | % | ||||||||||
| 1.940 | (1.14 | )% | 435,864 | (0.51 | )% | 0.93 | % | 0.94 | % | 0.94 | % | 0.88 | % | 0.88 | % | 44 | % | ||||||||||
| 2.122 | 6.81 | % | 510,483 | (0.38 | )% | 0.93 | % | 0.94 | % | 0.94 | % | 0.87 | % | 0.87 | % | 53 | % | ||||||||||
| $2.266 | (0.18 | )%** | $ | 307,565 | 0.78 | %* | 1.10 | %* | 1.10 | %* | 1.10 | %* | 0.89 | %* | 0.89 | %* | 44 | %** | |||||||||
| 2.270 | 19.35 | % | 345,750 | 0.02 | % | 1.04 | % | 1.10 | % | 1.10 | % | 0.88 | % | 0.88 | % | 99 | % | ||||||||||
| 2.050 | 38.43 | % | 380,801 | 0.07 | % | 1.03 | % | 1.09 | % | 1.09 | % | 0.88 | % | 0.88 | % | 117 | % | ||||||||||
| 1.487 | (16.32 | )% | 351,831 | 0.12 | % | 0.96 | % | 1.03 | % | 1.03 | % | 0.87 | % | 0.87 | % | 94 | % | ||||||||||
| 1.975 | 12.70 | % | 440,335 | 0.63 | % | 0.87 | % | 0.92 | % | 0.92 | % | 0.87 | % | 0.87 | % | 97 | % | ||||||||||
| 1.958 | 30.40 | % | 397,541 | 0.71 | % | 0.87 | % | 0.94 | % | 0.94 | % | 0.88 | % | 0.88 | % | 22 | % | ||||||||||
| $1.245 | (0.48 | )%** | $ | 290,266 | 2.44 | %* | 1.27 | %* | 1.27 | %* | 1.27 | %* | 0.92 | %* | 0.92 | %* | 11 | %** | |||||||||
| 1.251 | 14.47 | % | 333,494 | 1.33 | % | 1.21 | % | 1.22 | % | 1.22 | % | 0.92 | % | 0.92 | % | 84 | % | ||||||||||
| 1.108 | 27.77 | % | 380,653 | 1.46 | % | 1.18 | % | 1.19 | % | 1.19 | % | 0.92 | % | 0.92 | % | 28 | % | ||||||||||
| 0.874 | (19.37 | )% | 335,890 | 1.17 | % | 1.13 | % | 1.14 | % | 1.14 | % | 0.91 | % | 0.91 | % | 14 | % | ||||||||||
| 1.113 | (21.43 | )% | 460,006 | 0.97 | % | 0.99 | % | 1.01 | % | 1.01 | % | 0.89 | % | 0.89 | % | 26 | % | ||||||||||
| 1.781 | (9.03 | )% | 679,128 | 0.77 | % | 0.98 | % | 0.99 | % | 0.99 | % | 0.88 | % | 0.88 | % | 24 | % | ||||||||||
| $1.523 | (1.42 | )%** | $ | 458,200 | (0.06 | )%* | 1.01 | %* | 1.01 | %* | 1.05 | %* | 0.83 | %* | 0.79 | %* | 21 | %** | |||||||||
| 1.545 | 7.44 | % | 528,558 | 0.21 | % | 1.00 | % | 1.02 | % | 1.05 | % | 0.82 | % | 0.79 | % | 95 | % | ||||||||||
| 1.438 | 26.30 | % | 625,729 | (0.08 | )% | 1.03 | % | 1.07 | % | 1.07 | % | 0.81 | % | 0.81 | % | 75 | % | ||||||||||
| 1.139 | (27.60 | )% | 375,959 | 0.05 | % | 0.95 | % | 1.01 | % | 1.01 | % | 0.82 | % | 0.82 | % | 125 | % | ||||||||||
| 1.576 | (24.71 | )% | 660,893 | 0.12 | % | 0.78 | % | 0.85 | % | 0.85 | % | 0.79 | % | 0.79 | % | 91 | % | ||||||||||
| 2.214 | (17.79 | )% | 1,040,237 | (0.05 | )% | 0.80 | % | 0.81 | % | 0.81 | % | 0.76 | % | 0.76 | % | 79 | % | ||||||||||
| $1.695 | (0.68 | )%** | $ | 296,207 | 0.79 | %* | 0.82 | %* | 0.82 | %* | 0.82 | %* | 0.59 | %* | 0.59 | %* | 20 | %** | |||||||||
| 1.713 | 10.41 | % | 337,127 | 1.02 | % | 0.79 | % | 0.81 | % | 0.81 | % | 0.58 | % | 0.58 | % | 37 | % | ||||||||||
| 1.568 | 27.67 | % | 400,017 | 0.88 | % | 0.78 | % | 0.80 | % | 0.80 | % | 0.58 | % | 0.58 | % | 27 | % | ||||||||||
| 1.239 | (23.45 | )% | 401,888 | 0.78 | % | 0.70 | % | 0.74 | % | 0.74 | % | 0.57 | % | 0.57 | % | 115 | % | ||||||||||
| 1.633 | (16.90 | )% | 673,753 | 0.75 | % | 0.58 | % | 0.61 | % | 0.61 | % | 0.55 | % | 0.55 | % | 134 | % | ||||||||||
| 2.689 | (9.51 | )% | 924,904 | 0.51 | % | 0.44 | % | 0.50 | % | 0.50 | % | 0.45 | % | 0.45 | % | 190 | % | ||||||||||
F-47
Table of Contents
ALLMERICA INVESTMENT TRUST
FINANCIAL HIGHLIGHTS - For a Share Outstanding Throughout Each Period
| Income from Investment Operations | Less Distributions(e) | ||||||||||||||||||||||||||||||
Year Ended December 31, | Net Asset Value Beginning of Period | Net Investment Income(2) | Net Realized and Unrealized Gain (Loss) on Investments | Total from Investment Operations | Dividends from Net Investment Income | Distributions from Net Realized Capital Gains | Total Distributions | Net Increase (Decrease in Net) Asset Value | |||||||||||||||||||||||
| Equity Index Fund(7) | |||||||||||||||||||||||||||||||
| 2005(d) | $ | 2.664 | $ | 0.018 | $ | (0.047 | ) | $ | (0.029 | ) | $ | (0.017 | ) | $ | — | $ | (0.017 | ) | $ | (0.046 | ) | ||||||||||
| 2004 | 2.453 | 0.040 | (6) | 0.211 | 0.251 | (0.040 | ) | — | (0.040 | ) | 0.211 | ||||||||||||||||||||
| 2003 | 1.944 | 0.029 | 0.508 | 0.537 | (0.028 | ) | — | (0.028 | ) | 0.509 | |||||||||||||||||||||
| 2002 | 2.715 | 0.027 | (0.616 | ) | (0.589 | ) | (0.028 | ) | (0.154 | ) | (0.182 | ) | (0.771 | ) | |||||||||||||||||
| 2001 | 3.299 | 0.030 | (0.422 | ) | (0.392 | ) | (0.029 | ) | (0.163 | ) | (0.192 | ) | (0.584 | ) | |||||||||||||||||
| 2000 | 4.060 | 0.032 | (0.362 | ) | (0.330 | ) | (0.034 | ) | (0.397 | ) | (0.431 | ) | (0.761 | ) | |||||||||||||||||
| Select Investment Grade Income Fund(1) | |||||||||||||||||||||||||||||||
| 2005(d) | $ | 1.088 | $ | 0.022 | $ | — | (5) | $ | 0.022 | $ | (0.026 | ) | $ | — | $ | (0.026 | ) | $ | (0.004 | ) | |||||||||||
| 2004 | 1.119 | 0.043 | — | 0.043 | (0.059 | ) | (0.015 | ) | (0.074 | ) | (0.031 | ) | |||||||||||||||||||
| 2003 | 1.134 | 0.040 | (0.003 | )(3) | 0.037 | (0.052 | ) | — | (0.052 | ) | (0.015 | ) | |||||||||||||||||||
| 2002 | 1.106 | 0.054 | 0.034 | 0.088 | (0.060 | ) | — | (0.060 | ) | 0.028 | |||||||||||||||||||||
| 2001 | 1.086 | 0.064 | (4) | 0.021 | 0.085 | (0.065 | ) | — | (0.065 | ) | 0.020 | ||||||||||||||||||||
| 2000 | 1.051 | 0.070 | 0.035 | 0.105 | (0.070 | ) | — | (0.070 | ) | 0.035 | |||||||||||||||||||||
| Government | |||||||||||||||||||||||||||||||
| Bond Fund(1) | |||||||||||||||||||||||||||||||
| 2005(d) | $ | 1.083 | $ | 0.017 | $ | 0.002 | $ | 0.019 | $ | (0.020 | ) | $ | — | $ | (0.020 | ) | $ | (0.001 | ) | ||||||||||||
| 2004 | 1.104 | 0.030 | (0.007 | ) | 0.023 | (0.042 | ) | (0.002 | ) | (0.044 | ) | (0.021 | ) | ||||||||||||||||||
| 2003 | 1.130 | 0.030 | (0.011 | ) | 0.019 | (0.045 | ) | — | (0.045 | ) | (0.026 | ) | |||||||||||||||||||
| 2002 | 1.077 | 0.041 | 0.057 | 0.098 | (0.045 | ) | — | (0.045 | ) | 0.053 | |||||||||||||||||||||
| 2001 | 1.051 | 0.049 | (4) | 0.030 | 0.079 | (0.053 | ) | — | (0.053 | ) | 0.026 | ||||||||||||||||||||
| 2000 | 1.011 | 0.058 | 0.040 | 0.098 | (0.058 | ) | — | (0.058 | ) | 0.040 | |||||||||||||||||||||
| Money Market Fund | |||||||||||||||||||||||||||||||
| 2005(d) | $ | 1.000 | $ | 0.011 | $ | — | $ | 0.011 | $ | (0.011 | ) | $ | — | $ | (0.011 | ) | $ | — | |||||||||||||
| 2004 | 1.000 | 0.009 | — | 0.009 | (0.009 | ) | — | (0.009 | ) | — | |||||||||||||||||||||
| 2003 | 1.000 | 0.008 | — | 0.008 | (0.008 | ) | — | (5) | (0.008 | ) | — | ||||||||||||||||||||
| 2002 | 1.000 | 0.016 | — | 0.016 | (0.016 | ) | — | (0.016 | ) | — | |||||||||||||||||||||
| 2001 | 1.000 | 0.042 | — | 0.042 | (0.042 | ) | — | (0.042 | ) | — | |||||||||||||||||||||
| 2000 | 1.000 | 0.062 | — | 0.062 | (0.062 | ) | — | (0.062 | ) | — | |||||||||||||||||||||
| * | Annualized. |
| ** | Not Annualized. |
| (a) | Including reimbursements, waivers, and reductions. |
| (b) | Excluding reductions. Certain Portfolios have entered into varying arrangements with brokers who reduced a portion of the Portfolio’s expenses. |
| (c) | Excluding reimbursements, waivers, and reductions. |
| (d) | For the six months ended June 30, 2005 (Unaudited). |
| (e) | Certain prior year amounts have been reclassified to conform to current year presentation. |
| (1) | Effective January 1, 2001 the Select Investment Grade Income Fund and Government Bond Fund adopted the provisions of the AICPA Audit and Accounting Guide for Investment Companies and are amortizing premium and discount on debt securitites using the daily effective yield method. The effect of this change for the year ended December 31, 2001 was a decrease in net investment income per share by $0.003 for Select Investment Grade Income Fund and a decrease in net investment income per share by $0.007 for Government Bond Fund, an increase in net realized and unrealized gains and losses per share by $0.003 for Select Investment Grade Income Fund and an increase in net realized and unrealized gains and losses per share by $0.007 for Government Bond Fund and a decrease in the ratio of net investment income to average net assets from 6.04% to 5.79% for Select Investment Grade Income Fund and a decrease in the ratio of net investment income to average net assets from 5.16% to 4.52% for Government Bond Fund. Per share data and ratio/supplemental data for periods prior to January 1, 2001 have not been restated to reflect this change in presentation. |
| (2) | Net investment income (loss) per share before expense reductions was $0.028 in 2003 and $0.029 in 2001 for Equity Index Fund. |
| (3) | The amount shown for a share outstanding does not correspond with the aggregate net gain on investments for the period due to the timing of sales and repurchases of Portfolio shares in relation to the fluctuating market values of the investments of the Portfolio. |
| (4) | Computed using average shares outstanding throughout the period. |
| (5) | Amount is less than $.0005 or $(.0005). |
| (6) | Investment income per share reflects a special dividend which amounted to $0.008 per share for Equity Index Fund. |
| (7) | Effective January 1, 2005, brokerage commissions are included with realized gain or loss on investment transactions. Prior to January 1, 2005, these amounts were presented as a reduction of expenses. Prior year amounts have not been restated to reflect this change. (See Note 3). |
See Notes to Financial Statements.
F-48
Table of Contents
ALLMERICA INVESTMENT TRUST
| Net Asset Value End of Period | Ratios/Supplemental Data | Portfolio Rate | ||||||||||||||||||||||||||
| Total Return | Net Assets End of Period (000’s) | Ratios To Average Net Assets | ||||||||||||||||||||||||||
| Net Investment Income | Operating Expenses | Management Fee | ||||||||||||||||||||||||||
| (a) | (b) | (c) | Gross | Net | ||||||||||||||||||||||||
| $ | 2.618 | (1.07 | )%** | $ | 520,874 | 1.36 | %* | 0.52 | %* | 0.52 | %* | 0.52 | %* | 0.28 | %* | 0.28 | %* | 3 | %** | |||||||||
| 2.664 | 10.32 | % | 595,037 | 1.53 | % | 0.50 | % | 0.52 | % | 0.52 | % | 0.28 | % | 0.28 | % | 4 | % | |||||||||||
| 2.453 | 27.83 | % | 666,455 | 1.37 | % | 0.45 | % | 0.50 | % | 0.50 | % | 0.28 | % | 0.28 | % | 23 | % | |||||||||||
| 1.944 | (22.22 | )% | 342,683 | 1.16 | % | 0.45 | % | 0.47 | % | 0.47 | % | 0.28 | % | 0.28 | % | 10 | % | |||||||||||
| 2.715 | (12.02 | )% | 517,315 | 1.02 | % | 0.32 | % | 0.34 | % | 0.34 | % | 0.28 | % | 0.28 | % | 21 | % | |||||||||||
| 3.299 | (9.03 | )% | 599,266 | 0.87 | % | 0.32 | % | 0.33 | % | 0.33 | % | 0.27 | % | 0.27 | % | 9 | % | |||||||||||
| $ | 1.084 | 2.02 | %** | $ | 367,911 | 3.98 | %* | 0.64 | %* | 0.64 | %* | 0.64 | %* | 0.42 | %* | 0.42 | %* | 44 | %** | |||||||||
| 1.088 | 3.98 | % | 402,219 | 3.78 | % | 0.64 | % | 0.64 | % | 0.64 | % | 0.42 | % | 0.42 | % | 113 | % | |||||||||||
| 1.119 | 3.31 | % | 530,199 | 3.42 | % | 0.63 | % | 0.63 | % | 0.63 | % | 0.41 | % | 0.41 | % | 192 | % | |||||||||||
| 1.134 | 8.14 | % | 620,074 | 4.85 | % | 0.58 | % | 0.58 | % | 0.58 | % | 0.41 | % | 0.41 | % | 130 | % | |||||||||||
| 1.106 | 7.94 | % | 571,582 | 5.79 | % | 0.47 | % | 0.47 | % | 0.47 | % | 0.41 | % | 0.41 | % | 114 | % | |||||||||||
| 1.086 | 10.31 | % | 445,609 | 6.53 | % | 0.49 | % | 0.49 | % | 0.49 | % | 0.42 | % | 0.42 | % | 159 | % | |||||||||||
| $ | 1.082 | 1.75 | %** | $ | 116,238 | 3.08 | %* | 0.74 | %* | 0.74 | %* | 0.74 | %* | 0.50 | %* | 0.50 | %* | 15 | %** | |||||||||
| 1.083 | 2.12 | % | 128,860 | 3.02 | % | 0.73 | % | 0.73 | % | 0.73 | % | 0.50 | % | 0.50 | % | 77 | % | |||||||||||
| 1.104 | 1.67 | % | 200,158 | 2.82 | % | 0.71 | % | 0.71 | % | 0.71 | % | 0.50 | % | 0.50 | % | 55 | % | |||||||||||
| 1.130 | 9.28 | % | 291,995 | 3.48 | % | 0.68 | % | 0.68 | % | 0.68 | % | 0.50 | % | 0.50 | % | 79 | % | |||||||||||
| 1.077 | 7.63 | % | 116,514 | 4.52 | % | 0.58 | % | 0.58 | % | 0.58 | % | 0.50 | % | 0.50 | % | 190 | % | |||||||||||
| 1.051 | 10.00 | % | 78,531 | 5.58 | % | 0.61 | % | 0.61 | % | 0.61 | % | 0.50 | % | 0.50 | % | 53 | % | |||||||||||
| $ | 1.000 | 1.08 | %** | $ | 251,228 | 2.16 | %* | 0.54 | %* | 0.54 | %* | 0.54 | %* | 0.32 | %* | 0.32 | %* | N/A | ||||||||||
| 1.000 | 0.91 | % | 264,679 | 0.88 | % | 0.52 | % | 0.52 | % | 0.52 | % | 0.32 | % | 0.32 | % | N/A | ||||||||||||
| 1.000 | 0.80 | % | 377,155 | 0.82 | % | 0.53 | % | 0.53 | % | 0.53 | % | 0.30 | % | 0.30 | % | N/A | ||||||||||||
| 1.000 | 1.66 | % | 704,805 | 1.63 | % | 0.45 | % | 0.45 | % | 0.45 | % | 0.30 | % | 0.30 | % | N/A | ||||||||||||
| 1.000 | 4.28 | % | 604,657 | 4.11 | % | 0.36 | % | 0.36 | % | 0.36 | % | 0.31 | % | 0.31 | % | N/A | ||||||||||||
| 1.000 | 6.40 | % | 457,912 | 6.19 | % | 0.31 | % | 0.31 | % | 0.31 | % | 0.26 | % | 0.26 | % | N/A | ||||||||||||
F-49
Table of Contents
ALLMERICA INVESTMENT TRUST
NOTES TO FINANCIAL STATEMENTS (Unaudited)
| 1. | ORGANIZATION |
Allmerica Investment Trust (the “Trust”) is registered under the Investment Company Act of 1940, as amended (the “1940 Act”), as an open-end, diversified management investment company established as a Massachusetts business trust. The Trust is intended to serve as an investment medium for (i) variable life insurance policies and variable annuity contracts offered by insurance companies; (ii) certain qualified pension and retirement plans, as permitted by Treasury Regulations; and (iii) life insurance companies and advisers to the Portfolios and their affiliates. Allmerica Financial Corporation (“AFC”) has ceased all new sales of proprietary variable annuities and life insurance products (see Note 8). The Trust is comprised of nine managed investment portfolios. The accompanying financial statements and financial highlights are those of the Select Capital Appreciation, Select Value Opportunity, Select International Equity, Select Growth, Core Equity, Equity Index, Select Investment Grade Income, Government Bond and Money Market Funds (individually a “Portfolio”, collectively, the “Portfolios”).
In the opinion of management, the unaudited financial statements reflect all adjustments, which consist of normal and recurring adjustments, necessary to present fairly the financial positions of the Portfolios at June 30, 2005, the results of their operations, the changes in their net assets, and the financial highlights for the six month period ending June 30, 2005.
| 2. | SIGNIFICANT ACCOUNTING POLICIES |
The preparation of financial statements in conformity with accounting principles generally accepted in the United States of America requires management to make estimates and assumptions at the date of the financial statements. Actual results could differ from those estimates.
The following is a summary of significant accounting policies followed by the Trust in the preparation of its financial statements:
Security Valuation: Equity securities which are traded on a recognized exchange (other than Nasdaq) are valued at the last quoted sales price available at the time of the closing of the New York Stock Exchange or, if there were no sales that day, at the mean of the closing bid and asked price. Securities listed or traded on Nasdaq are valued at the Nasdaq official closing price. Over-the-counter securities for which market quotations are readily available are valued at the last available price in the market prior to the time of valuation. Securities that are primarily traded on foreign exchanges generally are valued at the closing values of such securities on their respective exchanges. Corporate debt securities and debt securities of the U.S. Government and its agencies (other than short-term investments) are valued by an independent pricing service approved by the Board of Trustees which utilizes market quotations and transactions, quotations from dealers and various relationships among securities in determining value. If not valued by a pricing service, such securities are valued at prices obtained from independent brokers. If prices are not readily available or do not accurately reflect fair value for a security, or if a security’s value has been materially affected by events occurring after the close of the exchange or market on which the security is principally traded, that security may be valued by another method that the Board of Trustees believes accurately reflects fair value. A security’s valuation may differ depending on the method used for determining value. Price movements in futures contracts and ADRs, market and trading trends, the bid/ask quotes of brokers and off-exchange institutional trading may be reviewed in the course of making a good faith determination of a security’s fair value. Short-term investments that mature in 60 days or less are valued at amortized cost. The investments of the Money Market Fund are valued utilizing the amortized cost valuation method, permitted in accordance with Rule 2a-7 under the 1940 Act. This method involves valuing a portfolio security initially at its cost and thereafter assuming a constant amortization to maturity of any discount or premium. Investments in other investment companies are valued at net asset value.
Forward Foreign Currency Contracts: The Select Capital Appreciation, Select International Equity and Select Growth Funds may enter into forward foreign currency contracts whereby the Portfolios agree to exchange a specific currency at a specific price at a future date in an attempt to hedge against fluctuations in the value of the underlying currency of certain portfolio instruments. Forward foreign currency contracts are valued at the daily forward exchange rate of the underlying currency with any fluctuations recorded as unrealized gains or losses. Gains or losses on the purchase or sale of forward foreign currency contracts having the same settlement date and broker are realized on the date of offset, otherwise gains and losses are realized on the settlement date.
F-50
Table of Contents
ALLMERICA INVESTMENT TRUST
NOTES TO FINANCIAL STATEMENTS (Unaudited) (Continued)
The use of forward foreign currency contracts does not eliminate fluctuations in the underlying prices of the Portfolios, but it does establish a rate of exchange that can be achieved in the future. Although forward foreign currency contracts used for hedging purposes limit the risk of loss due to a decline in the value of the hedged currency, they also limit any potential gain that might result should the value of the currency increase. In addition, the Portfolios could be exposed to risks if the counterparties to the contracts are unable to meet the terms of their contracts.
Foreign Currency Translation: Investment valuations, other assets and liabilities denominated in foreign currencies are translated each business day into U.S. dollars based upon current exchange rates. Purchases and sales of foreign investments and income and expenses are translated into U.S. dollars based upon exchange rates prevailing on the respective dates of such transactions. Net realized gains or losses on foreign currency transactions represent net gains or losses on sales and maturities of foreign currency contracts, disposition of foreign currencies, the difference between the amount of net investment income and withholding taxes accrued and the U.S. dollar amount actually received and paid, and gains or losses between the trade and settlement date on the purchases and sales of the securities. That portion of unrealized gains or losses on investments due to fluctuations in foreign currency exchange rates is not separately disclosed.
Security Transactions and Investment Income: Security transactions are recorded as of the trade date. Realized gains and losses from security transactions are determined on the basis of identified cost. Interest income, including amortization of premium and accretion of discount on securities, is accrued daily. Income distributions earned by the Portfolios from investments in certain investment companies are recorded as interest income in the accompanying financial statements. Dividend income is recorded on the ex-dividend date, except that certain dividends from foreign securities are recorded as soon as the Portfolios are informed of the ex-dividend date.
Federal Income Taxes: The Trust treats each Portfolio as a separate entity for Federal income tax purposes. Each Portfolio intends to continue to qualify as a “regulated investment company” under Subchapter M of the Internal Revenue Code of 1986, as amended. By so qualifying, each Portfolio will not be subject to Federal income taxes to the extent it distributes all of its taxable income and net realized gains, if any, for its fiscal year. In addition, by distributing during each calendar year substantially all of its net investment income, capital gains and certain other amounts, if any, each Portfolio will not be subject to Federal excise tax. Therefore, no Federal income tax provision is required. Withholding taxes on foreign dividend income and gains have been paid or provided for in accordance with the applicable country’s tax rules and rates.
Distributions to Shareholders: Dividends from net investment income are declared and reinvested daily for the Money Market Fund, declared, distributed and reinvested quarterly for the Core Equity, Equity Index, Select Investment Grade Income and Government Bond Funds, and annually for the Select Capital Appreciation, Select Value Opportunity, Select International Equity and Select Growth Funds. All Portfolios declare and distribute all net realized capital gains, if any, at least annually. Distributions to shareholders are recorded on the ex-dividend date. Income and capital gains distributions are determined in accordance with income tax regulations. Differences between book basis and tax basis amounts are primarily due to differing book and tax treatments in the timing of the recognition of gains or losses, including “Post-October Losses”, foreign currency gains and losses, gains and losses on futures contracts, and losses deferred due to wash sales and differing treatments for foreign currency transactions, paydown gains/losses on certain securities, capital loss carryforwards, return of capital on real estate investment trust holdings, net operating losses, amortization of premium and market discount, and non-taxable dividends. Permanent book and tax basis differences relating to shareholder distributions will result in reclassifications to paid in capital. Permanent book-tax differences, if any, are not included in ending undistributed net investment income for the purpose of calculating net investment income per share in the Financial Highlights, as applicable.
Futures Contracts: All Portfolios, except the Money Market Fund, may use futures contracts to manage their exposure to the stock and bond markets and to fluctuations in interest rates and currency values. Buying futures tends to increase a Portfolio’s exposure to the underlying instrument, while selling futures tends to decrease a Portfolio’s exposure to the underlying instrument or hedge other portfolio investments. Futures contracts involve, to varying degrees, risk of loss in excess of the futures variation margin, if any, reflected in each applicable Portfolio’s Statement of Assets and Liabilities. The underlying face amount at value of any open futures contracts at period end is shown in each applicable Portfolio’s portfolio
F-51
Table of Contents
ALLMERICA INVESTMENT TRUST
NOTES TO FINANCIAL STATEMENTS (Unaudited) (Continued)
of investments. The face amount reflects each contract’s exposure to the underlying instrument at period end. Losses may arise from changes in the value of the underlying instruments or if the counterparties do not perform under the terms of the contracts. Gains and losses are realized upon the expiration or closing of the futures contracts. Futures contracts are valued at the settlement price established each day by the board of trade or exchange on which they are traded.
Securities Lending: Each Portfolio, using Investors Bank & Trust Company (“IBT”) as its lending agent, may loan securities to brokers and dealers in exchange for negotiated lenders’ fees. These fees are disclosed as “Securities lending income” in the Statements of Operations. Each applicable Portfolio receives collateral against the loaned securities which must be maintained at not less than 102% of the market value of the loaned securities during the period of the loan. Collateral received is generally cash, and is invested in short-term investments. Lending portfolio securities involves possible delays in receiving additional collateral or in the recovery of the securities or possible loss of rights in the collateral should the counterparty (borrower) held not meet its obligations under the terms of the loan. Information regarding the securities loaned and the collateral held at period end is included in a footnote at the end of each applicable Portfolio’s portfolio of investments.
Cash Accounts: From time to time the Portfolios may leave cash overnight in their account. IBT has been contracted on behalf of the Portfolios to sweep these monies into a demand note account, which will pay interest equal to 75% of that day’s U.S. Treasury Bill rate back to the Portfolios.
Expenses: Expenses directly attributed to a portfolio are charged to the portfolio, while expenses which are attributable to more than one portfolio of the Trust are allocated based upon relative net assets among the respective Portfolios and one other affiliated investment company, Allmerica Securities Trust.
Forward Commitments: The Select Capital Appreciation, Select Investment Grade Income, Government Bond, and Money Market Funds may enter into contracts to purchase securities for a fixed price at a specified future date beyond customary settlement time (“forward commitments”). If the Portfolios do so, they will maintain cash or other liquid obligations having a value in an amount at all times sufficient to meet the purchase price. Forward commitments involve a risk of loss if the value of the security to be purchased declines prior to the settlement date. Although the Portfolios generally will enter into forward commitments with the intention of acquiring securities for their portfolios, they may dispose of a commitment prior to settlement if their Sub-Adviser deems it appropriate to do so.
Options: All Portfolios, except the Money Market Fund, may use options to manage its exposure to the stock and bond markets and to fluctuations in interest rates. Writing puts and buying calls tend to increase a Portfolio’s exposure to the underlying security. Buying puts and writing calls tend to decrease a Portfolio’s exposure to the underlying security. When a Portfolio writes a call or put option, an amount equal to the premium received is recorded as a liability and subsequently marked to market to reflect the current value of the option written. Premiums received from writing options which expire are treated as realized gains. Premiums received from writing options which are exercised or closed are added to the proceeds or offset against the amounts paid on the underlying security to determine the realized gain or loss. Realized gains and losses on written options are included in realized gains and losses on securities. Losses may arise from changes in the value of the underlying securities, if there is an illiquid secondary market for the contracts, or if the counterparties do not perform under the terms of the contracts. Exchange-traded options are valued using the last sale price or, if there were no sales that day, the last offering price. Options traded over-the-counter are valued using dealer-supplied valuations.
Repurchase Agreements: Each Portfolio may engage in repurchase agreement transactions with institutions that the Sub-Adviser has determined are creditworthy pursuant to guidelines established by the Trust’s Board of Trustees. Each Portfolio requires that the securities purchased in a repurchase agreement transaction be transferred to the Trust’s Custodian in a manner that is intended to enable the Portfolio to obtain those securities in the event of a counterparty default. The Sub-Adviser monitors the value of the securities, including accrued interest, daily to ensure that the value of the collateral equals or exceeds amounts due under the repurchase agreement. Repurchase agreement transactions involve certain risks in the event of default or insolvency of the counterparty, including possible delays or restrictions upon the Portfolio’s ability to dispose of the underlying securities, and a possible decline in the value of the underlying securities during the period while the Portfolio seeks to assert its rights.
F-52
Table of Contents
ALLMERICA INVESTMENT TRUST
NOTES TO FINANCIAL STATEMENTS (Unaudited) (Continued)
| 3. | INVESTMENT MANAGEMENT, ADMINISTRATION, AND OTHER RELATED PARTY TRANSACTIONS |
Management Fees: Allmerica Financial Investment Management Services, Inc. (“AFIMS”), a wholly-owned subsidiary of Allmerica Financial Life Insurance and Annuity Company (“Allmerica Financial”), serves as investment manager and administrator to the Trust. Allmerica Financial is a wholly-owned subsidiary of AFC. Under the terms of the management agreement, the Portfolios pay a management fee, calculated daily and payable monthly, at an annual rate based upon the following fee schedules:
| Percentage of Average Daily Net Assets | ||||||||||||||||||
Portfolio | First $100,000,000 | Next $150,000,000 | Next $250,000,000 | Next $250,000,000 | Next $250,000,000 | Over $1,000,000,000 | ||||||||||||
Select Capital Appreciation Fund | 1.00 | % | 0.90 | % | 0.80 | % | 0.70 | % | 0.70 | % | 0.65 | % | ||||||
Select Value Opportunity Fund | 1.00 | % | 0.85 | % | 0.80 | % | 0.75 | % | 0.70 | % | 0.70 | % | ||||||
Select International Equity Fund | 1.00 | % | 0.90 | % | 0.85 | % | 0.85 | % | 0.85 | % | 0.85 | % | ||||||
Select Growth Fund | 0.85 | % | 0.85 | % | 0.80 | % | 0.75 | % | 0.70 | % | 0.70 | % | ||||||
Core Equity Fund | 0.60 | % | 0.60 | % | 0.55 | % | 0.50 | % | 0.45 | % | 0.45 | % | ||||||
Government Bond Fund | 0.50 | % | 0.50 | % | 0.50 | % | 0.50 | % | 0.50 | % | 0.50 | % | ||||||
Money Market Fund | 0.35 | % | 0.30 | % | 0.30 | % | 0.25 | % | 0.20 | % | 0.20 | % | ||||||
Portfolio | First $50,000,000 | Next $200,000,000 | Over $250,000,000 | ||||||
Equity Index Fund | 0.35 | % | 0.30 | % | 0.25 | % | |||
Portfolio | First $50,000,000 | Next $50,000,000 | Over $100,000,000 | ||||||
Select Investment Grade Income Fund | 0.50 | % | 0.45 | % | 0.40 | % | |||
AFIMS has entered into Sub-Adviser Agreements for the management of the investments of each of the Portfolios. AFIMS is solely responsible for the payment of all fees to the Sub-Advisers. The Sub-Advisers for each of the Portfolios are as follows:
| Select Capital Appreciation Fund | T. Rowe Price Associates, Inc. (“T. Rowe Price”) | |
| Select Value Opportunity Fund | Cramer Rosenthal McGlynn, LLC | |
| Select International Equity Fund | Grantham, Mayo, Van Otterloo & Co., LLC (“GMO”) J.P. Morgan Investment Management Inc. (“J.P. Morgan”) | |
| Select Growth Fund | GE Asset Management Incorporated (“GEAM”) | |
| Jennison Associates LLC (“Jennison”) | ||
| Core Equity Fund | UBS Global Asset Management (Americas) Inc. (“UBS”) Goldman Sachs Asset Management, L.P. (“Goldman”) | |
| Equity Index Fund | Opus Investment Management, Inc. (wholly-owned subsidiary of AFC) | |
| Select Investment Grade Income Fund | Opus Investment Management, Inc. | |
| Government Bond Fund | Opus Investment Management, Inc. | |
| Money Market Fund | Opus Investment Management, Inc. | |
T. Rowe Price International Series, Inc., an investment company managed by an affiliate of T. Rowe Price, is currently used as an investment vehicle for certain insurance products sponsored by Allmerica Financial and First Allmerica Financial Life Insurance Company (“First Allmerica”), a wholly-owned subsidiary of Allmerica Financial. GMO and J.P. Morgan each independently manages its own portion of the Select International Equity Fund. GEAM and Jennison each independently manages its own portion of the Select Growth Fund. UBS and Goldman each independently manages its own portion of the Core Equity Fund.
F-53
Table of Contents
ALLMERICA INVESTMENT TRUST
NOTES TO FINANCIAL STATEMENTS (Unaudited) (Continued)
Brokerage Commissions: The Select Capital Appreciation, Select Value Opportunity, Select International Equity, Select Growth, Core Equity, and Equity Index Funds have entered into agreements with certain brokers whereby the brokers will rebate, in cash, a portion of brokerage commissions. Effective January 1, 2005, amounts earned by the Funds under such agreements are included with realized gain or loss on investment transactions presented in the statement of operations. Prior to January 1, 2005, amounts earned by the Funds under such agreements were presented as a reduction of expenses. Prior year amounts have not been restated to reflect this change due to immateriality. For the six months ended June 30, 2005, brokerage commissions under these agreements were as follows:
| Commissions | |||
Select Capital Appreciation Fund | $ | 8,663 | |
Select Value Opportunity Fund | 53,479 | ||
Select International Equity Fund | 1,283 | ||
Select Growth Fund | 49,976 | ||
Core Equity Fund | 25,996 | ||
Equity Index Fund | 50,851 | ||
Plan of Distribution and Service: The 12b-1 Plan permits the Portfolios to pay Allmerica Financial and First Allmerica for marketing and distribution expenses to support the sale and distribution of the Portfolios’ shares and the provision of services to maintain and retain accounts. The 12b-1 Plan authorizes payment of a distribution and service fee at an annual rate of up to 0.25% of each Portfolio’s average daily net assets. As directed by the Board of Trustees, each Portfolio pays a distribution fee at an annual rate of 0.15% of each Portfolio’s average daily net assets. For the six months ended June 30, 2005, total payments made to Allmerica Financial and First Allmerica by the Portfolios under the 12b-1 Plan amounted to $2,235,107.
Custodian, Fund Accounting, and Administrative Fees: IBT provides portfolio accounting and custody services to the Trust and receives fees and reimbursement of certain out-of-pocket expenses for its services from the Trust. AFIMS has entered into an Administrative Services Agreement with IBT, whereby IBT performs certain administrative services for the Portfolios and is entitled to receive an administrative fee and reimbursement of certain out-of-pocket expenses. AFIMS is solely responsible for the payment of the administrative fee to IBT. The Trust pays no salaries or compensation to any of its officers. Trustees who are not directors, officers or employees of the Trust or any investment adviser are reimbursed for their travel expenses in attending meetings of the Trustees, and receive quarterly meeting and retainer fees for their services. Such amounts are paid by the Trust.
| 4. | REIMBURSEMENT OF EXPENSES AND WAIVER OF FEES |
In the event normal operating expenses of each Portfolio, excluding taxes, interest, broker commissions, and extraordinary expenses, but including the management fee, exceed certain voluntary expense limitations as a percentage of average net assets, AFIMS will voluntarily reimburse fees and any expenses in excess of the expense limitations. The Portfolios’ voluntary expense limitations are as follows:
Select Capital Appreciation Fund | 1.35 | % | |
Select Value Opportunity Fund* | 1.25 | % | |
Select International Equity Fund | 1.50 | % | |
Select Growth Fund** | 1.20 | % | |
Core Equity Fund | 1.20 | % | |
Equity Index Fund | 0.60 | % | |
Select Investment Grade Income Fund | 1.00 | % | |
Government Bond Fund | 1.00 | % | |
Money Market Fund | 0.60 | % |
Expense limitations may be removed or revised at any time after a Portfolio’s first fiscal year of operations without prior notice to existing shareholders.
F-54
Table of Contents
ALLMERICA INVESTMENT TRUST
NOTES TO FINANCIAL STATEMENTS (Unaudited) (Continued)
| * | AFIMS has also voluntarily agreed to limit its management fees to an annual rate of 0.90% of average daily net assets of the Select Value Opportunity Fund until further notice. |
| ** | Effective April 30, 2004, GEAM assumed sub-adviser responsibilities from Putnam Investment Management, LLC (“Putnam”) for that portion of the Select Growth Fund that was independently managed by Putnam. AFIMS has voluntarily agreed to waive that portion of the management fee of the Select Growth Fund to the extent that the amount of the sub-adviser fee paid to GEAM is less than the amount that would have been paid to Putnam. For the six months ended June 30, 2005, this management fee waiver amounted to $84,264. |
| 5. | SHARES OF BENEFICIAL INTEREST |
The Trust’s Declaration of Trust authorizes the Trustees to issue an unlimited number of shares beneficial interest for the Portfolios, each without a par value.
| 6. | FOREIGN SECURITIES AND EMERGING MARKETS |
All Portfolios except the Government Bond Fund may purchase securities of foreign issuers. The Money Market Fund may invest in only U.S. dollar denominated foreign securities. Investing in foreign securities involves special risks not typically associated with investing in securities of U.S. issuers. The risks include revaluation of currencies and future adverse political and economic developments. Moreover, securities of many foreign issuers and their markets may be less liquid and their prices more volatile than those of securities of comparable U.S. issuers.
Investing in emerging markets may involve special risks and considerations not typically associated with investing in the developed markets. These risks include revaluation of currencies, high rates of inflation, repatriation restrictions on income and capital, and future adverse political and economic developments. Moreover, securities issued in these markets may be less liquid, subject to government ownership controls, subject to delayed settlements, and their prices more volatile than those of comparable securities in the United States.
| 7. | FINANCIAL INSTRUMENTS |
Investing in certain financial instruments including futures and options transactions, and forward foreign currency contracts involves risks other than those reflected in the Statements of Assets and Liabilities. Risks associated with these instruments include the potential for an imperfect correlation between the movements in the price of the instruments and the price of the underlying securities and interest rates, an illiquid secondary market for the instruments or inability of counterparties to perform under terms of the contracts, and changes in the value of foreign currency relative to the U.S. dollar. The Select Capital Appreciation, Select International Equity and Select Growth Funds may enter into these forward contracts primarily to protect the Portfolio from adverse currency movement.
| 8. | SUBSEQUENT EVENTS |
On August 22, 2005, AFC announced that it had entered into a definitive agreement to sell Allmerica Financial and its closed block of variable annuity and variable life business (the “Transaction”) to The Goldman Sachs Group, Inc. (“Goldman Sachs”). In addition, as part of the Transaction, Goldman Sachs will purchase AFIMS. The Transaction is expected to close on or about November 30, 2005.
In connection with the Transaction, the Board of Trustees of the Trust has approved an Agreement and Plan of Reorganization (the “Reorganization Agreement”) on behalf of each Portfolio of the Trust (each, an “AIT Fund”). The Reorganization Agreement is among the Trust, on behalf of each AIT Fund, Goldman Sachs Variable Insurance Trust (“GSVIT”), on behalf of each investment fund of GSVIT listed below (each, a “GSVIT Fund”), AFC, AFIMS, Goldman Sachs
F-55
Table of Contents
ALLMERICA INVESTMENT TRUST
NOTES TO FINANCIAL STATEMENTS (Unaudited) (Continued)
Asset Management, L.P. and Goldman Sachs Asset Management International. Pursuant to the Reorganization Agreement, each AIT Fund will be reorganized into a corresponding GSVIT Fund, as noted below (each, a “Fund Reorganization”):
AIT Fund | GSVIT Fund | |
| Select International Equity Fund | International Equity Fund | |
| Core Equity Fund | CORESM U.S. Equity Fund | |
| Select Growth Fund | Capital Growth Fund | |
| Select Capital Appreciation Fund | Growth Opportunities Fund | |
| Equity Index Fund | Equity Index Fund | |
| Select Value Opportunity Fund | Mid Cap Value Fund | |
| Government Bond Fund | Government Income Fund | |
| Select Investment Grade Income Fund | Core Fixed Income Fund | |
| Money Market Fund | Money Market Fund |
A Special Meeting of Shareholders of the Trust is expected to be held in November 2005, at which shareholders of each AIT Fund will be asked to approve the Fund Reorganization relating to such AIT Fund. Although separate accounts of Allmerica Financial and First Allmerica are the only shareholders of the AIT Funds, owners of variable annuity contracts or variable life insurance contracts with allocations in the separate accounts that invest in the AIT Funds will have the right to instruct Allmerica Financial or First Allmerica as to how to vote on the shares of the AIT Fund(s) attributable to their variable contracts. If approved at the Special Meeting of Shareholders, each Fund Reorganization will take place shortly thereafter. The proposed Fund Reorganizations are not conditioned on each other.
If the Reorganization Agreement is approved with respect to an AIT Fund, the AIT Fund will reorganize into the corresponding GSVIT Fund. The AIT Fund will transfer all of its assets and liabilities attributable to its shares to the corresponding GSVIT Fund in exchange for shares of such GSVIT Fund and the assumption by the GSVIT Fund of the liabilities of the AIT Fund. Each AIT Fund Reorganization will be effected on the basis of the relative net asset values of the relevant AIT Fund and GSVIT Fund. Each AIT Fund Reorganization will be followed immediately by the distribution of the shares of the corresponding GSVIT Fund to the separate account shareholders of such AIT Fund in complete liquidation of the AIT Fund. As a result, if a Fund Reorganization occurs, each affected separate account will be invested in shares of the relevant corresponding GSVIT Fund.
F-56
Table of Contents
ALLMERICA INVESTMENT TRUST
REGULATORY DISCLOSURES (Unaudited)
The performance data quoted represents past performance and the investment return and principal value of an investment will fluctuate so that an investor’s shares, when redeemed, may be worth more or less than their original cost.
An investment in the Money Market Fund (the “Portfolio”) is not insured or guaranteed by the Federal Deposit Insurance Corporation or any other government agency. Although the Portfolio seeks to preserve the value of your investment at a stable net asset value of $1.00 per share, it is possible to lose money by investing in the Portfolio.
Securities issued by some U.S. Government-sponsored entities, such as the Federal Home Loan Mortgage Corporation (Freddie Mac) and the Federal National Mortgage Association (Fannie Mae), are not backed by the full faith and credit of the U.S. Government. No assurances can be given that the U.S. Government would provide financial support to a U.S. Government-sponsored instrumentality if not obligated to do so.
This report and the financial statements contained herein are submitted for the general information of the shareholders of the Portfolios of Allmerica Investment Trust (the “Trust”) and are not authorized for distribution to prospective investors in the flexible premium variable life insurance or annuity products of Allmerica Financial Life Insurance and Annuity Company (“Allmerica Financial”) or First Allmerica Financial Life Insurance Company (“First Allmerica”) unless accompanied or preceded by effective prospectuses for the flexible premium variable life insurance or annuity products of Allmerica Financial or First Allmerica, and the Trust which include important information related to charges and expenses.
The Trust files complete schedules of portfolio holdings of the Portfolios of the Trust with the Securities and Exchange Commission for the first and third quarters of each fiscal year on Form N-Q. The Trust’s Forms N-Q are available on the Commission’s website at http://www.sec.gov. The Trust’s Forms N-Q may be reviewed and copied at the Commission’s Public Reference Room in Washington, DC. Information regarding the operation of the Public Reference Room may be obtained by calling the Commission at 1-800-SEC-0330.
Descriptions of the policies and procedures that the Portfolios of the Trust use to determine how to vote proxies relating to portfolio securities are available via the following methods:
| (i) | Without charge, upon request, by calling 1-800-533-7881; |
| (ii) | On each of the following websites: |
http://www.allmerica.com/afs/account/index.htm
http://www.allmerica.com/select/index.htm
http://www.allmerica.com/afs/abs/index.htm;
| (iii) | On the Securities and Exchange Commission website at http:/www.sec.gov. |
Information regarding how the Portfolios of the Trust voted proxies relating to portfolio securities during the most recent 12-month period ended June 30 is available via the methods noted above.
This report includes financial statements for Allmerica Investment Trust. It does not include financial statements for the separate accounts that correspond to the insurance and/or annuity products included in this report.
The SEC has modified mailing requirements for annual and semiannual reports to allow a single copy of this report to be delivered to customers who share the same last name and address. This will automatically apply to all customers. If you would prefer to receive your own copy, please notify us at the phone number listed on the back cover of this report.
F-57
Table of Contents
ALLMERICA INVESTMENT TRUST
BOARD REVIEW OF ADVISORY ARRANGEMENTS (Unaudited)
The Investment Company Act of 1940 requires that both the full Board of Trustees and a majority of the non-interested (“independent”) Trustees of Allmerica Investment Trust (“AIT”), voting separately, annually approve the continuation of your fund’s management agreement with Allmerica Financial Investment Management Services, Inc. (“AFIMS”) and of the subadviser agreement with your fund’s sub-adviser (the “Sub-Adviser”) (each fund of AIT is referred to as a “Fund” and collectively, the “Funds”). The Trustees consider matters bearing on each Fund and its advisory arrangements at their meetings throughout the year, including a review of performance data at each regular meeting. The Trustees are also assisted in evaluating the performance of the Sub-Advisers of the Funds by CRA RogersCasey, LLC, a pension consulting firm. In addition, AIT’s Fund Operations Committee, which is composed entirely of independent Trustees, met on April 7, 2005, and the full Board of Trustees met on May 10, 2005, for the specific purpose of considering whether to approve the continuation of each Fund’s management agreement and sub-adviser agreement. The independent Trustees were assisted in their evaluation by independent legal counsel, from whom they received separate legal advice and with whom they met separately from AFIMS during the contract review meetings.
In connection with their deliberations regarding the continuation of the Funds’ advisory arrangements, the Trustees, including the independent Trustees, considered such information and factors as they believed, in light of the legal advice furnished to them and their own business judgment, to be relevant. The management agreement and sub-adviser agreement for each Fund was considered separately, although the Trustees also took into account the common interests of all AIT Funds in their review. As described below, the Trustees considered the nature, quality, and extent of the various investment advisory and administrative services performed by AFIMS, its affiliates and the Funds’ Sub-Advisers under the existing advisory and other arrangements with your Fund.
In connection with their contract review meetings, the Trustees received and relied upon materials which included, among other items: (i) information on the investment performance of each Fund for various time periods ended December 31, 2004, and March 31, 2005; (ii) information provided by Lipper Inc. on the investment performance of a select group of funds with substantially similar investment classifications and objectives as each Fund, as well as the investment performance of a select group of funds identified by objective criteria suggested by AFIMS; (iii) information provided by Lipper Inc. on the Fund’s management fees and total expenses and the management fees and total expenses of comparable funds in your Fund’s Lipper peer group; (iv) background information on personnel involved in the investment management and operations of each Fund; (v) the fall-out benefits, if any, that AFIMS and each Fund’s Sub-Adviser may receive as a result of their work on behalf of the Funds; (vi) information as to whether and to what extent applicable expense waivers, reimbursements or fee “breakpoints” are observed for each Fund, (vii) information regarding AFIMS’s and the Sub-Advisers’ financial results and financial conditions, including their profitability from services performed for the Funds; and (viii) descriptions of various functions performed by AFIMS and the Sub-Advisers for the Funds, such as compliance monitoring and portfolio trading practices. The comparative performance, fee and expense information prepared and provided by Lipper Inc. was not independently verified, and the independent Trustees did not independently verify any information provided to them by AFIMS or the Sub-Advisers.
The Trustees’ conclusion as to the continuation of the advisory arrangements was based on a comprehensive consideration of all information provided to the Trustees and not the result of any single factor. Some of the factors that figured particularly in the Trustees’ deliberations are described below, although individual Trustees may have evaluated the information presented differently from one another, giving different weights to various factors. It is also important to recognize that the fee arrangements for the Funds are the result of years of review and discussion between the independent Trustees and AFIMS, that certain aspects of such arrangements may receive greater scrutiny in some years than others, and that the Trustees’ conclusions may be based, in part, on their consideration of these same arrangements during the course of the year and in prior years.
Based on information provided by Lipper Inc. and AFIMS, the Trustees reviewed the Fund’s total return investment performance as well as the performance of its Lipper Insurance Universe peer group of funds over the various time periods noted below:
| Average Annual Total Returns (Period ending December 31, 2004) | |||||||
| One-year (%) | Three-years (%) | Five-years (%) | |||||
Select International Equity Fund | 14.47 | 5.65 | (3.37 | ) | |||
Lipper International Core Funds category average* | 17.99 | 10.16 | (2.24 | ) | |||
Select Capital Appreciation Fund | 18.62 | 9.12 | 6.53 | ||||
Lipper Mid-Cap Growth Funds category average* | 14.74 | 3.56 | (3.08 | ) | |||
F-58
Table of Contents
ALLMERICA INVESTMENT TRUST
BOARD REVIEW OF ADVISORY ARRANGEMENTS (Unaudited) (Continued)
| Average Annual Total Returns (Period ending December 31, 2004) | ||||||||
| One-year (%) | Three-years (%) | Five-years (%) | ||||||
Select Value Opportunity Fund | 19.35 | 11.40 | 15.23 | |||||
Lipper Mid-Cap Value Funds category average* | 18.92 | 12.36 | 13.10 | |||||
Select Growth Fund | 7.44 | (0.59 | ) | (9.47 | ) | |||
Lipper Large-Cap Growth Funds category average* | 8.00 | (0.13 | ) | (7.56 | ) | |||
Core Equity Fund | 10.41 | 2.57 | (4.09 | ) | ||||
Lipper Large-Cap Core Funds category average* | 8.60 | 1.93 | (2.89 | ) | ||||
Equity Index Fund | 10.32 | 3.13 | (2.57 | ) | ||||
Lipper S&P 500® Index Objective Funds category average* | 10.42 | 3.18 | (2.64 | ) | ||||
Select Investment Grade Income Fund | 3.98 | 5.12 | 6.70 | |||||
Lipper Intermediate Investment Grade Debt Funds category average* | 4.13 | 5.96 | 6.99 | |||||
Government Bond Fund | 2.12 | 4.30 | 6.08 | |||||
Lipper General U.S. Government Funds category average* | 4.07 | 5.66 | 7.05 | |||||
Money Market Fund | 0.91 | 1.12 | 2.79 | |||||
Lipper Money Market Funds category average* | 0.83 | 0.93 | 2.49 | |||||
| * | Lipper Insurance Universe peer group category average excludes the performance of the relevant AIT Fund. |
For the Select International Equity Fund, the Trustees analyzed the fund’s underperformance relative to the Lipper category shown above and determined that it was primarily attributed to the management of the fund by the fund’s former sub-adviser. As a result of that underperformance and in an effort to improve the fund’s investment performance, AFIMS recommended, and the Trustees approved, a change in the fund’s sub-advisers, effective October 1, 2004.
For the Government Bond Fund, the underperformance of the fund relative to the Lipper category shown above was considered by the Trustees in the context of the universe of funds included by Lipper Inc. in this category. The varying objectives and policies with respect to the average maturity and duration of the funds in the Lipper category make a direct comparison of peer performance for this fund more difficult. In addition, the Trustees noted that the investment performance of the Government Bond Fund on a gross basis (i.e., gross of any fees or expenses paid by the fund) exceeded the performance of its benchmark, the Lehman Brothers Intermediate Government Bond Index.
In the course of their deliberations, the Trustees took into account information provided by AFIMS in connection with the contract review meetings, as well as during investment review meetings conducted during the course of the year, as to the efforts of AFIMS and the Sub-Advisers relating to the Funds’ performance. After reviewing these and related factors, the Trustees concluded, within the context of their overall conclusions regarding the Funds’ advisory agreements, that they were satisfied with AFIMS’s and the Sub-Advisers’ responses and efforts relating to investment performance.
In assessing the reasonableness of each Fund’s advisory fee, the Trustees considered, among other information, each Fund’s management fee and the total expense ratio as a percentage of average net assets and the management fee and total expense ratios of peer groups of funds based on information provided by Lipper Inc. and AFIMS.
The Trustees also considered whether each Fund is likely to benefit from any economies of scale in the management of the Fund in the event of growth in assets of the Fund. They noted that certain of the Funds’ management fee rate schedules are currently subject to breakpoints. The Trustees also considered information prepared by AFIMS relating to its costs and profits with respect to the Funds, as well as the methodologies used to determine and allocate its costs to the Funds and other accounts and products for purposes of estimating profitability.
F-59
Table of Contents
ALLMERICA INVESTMENT TRUST
BOARD REVIEW OF ADVISORY ARRANGEMENTS (Unaudited) (Continued)
After reviewing these and other factors described herein, the Trustees concluded, within the context of their overall conclusions regarding the advisory arrangements, that the management fees charged to each Fund represent reasonable compensation in light of the nature and quality of the services being provided by AFIMS and the Sub-Advisers to the Funds.
In addition, the Trustees considered AFIMS and the Sub-Adviser’s resources and motivate capable personnel to serve each Fund. The Trustees also considered the financial resources of AFIMS and its parent, Allmerica Financial Corporation.
The Trustees also considered the nature, quality, cost, and extent of administrative and distribution services provided to the Fund by AFIMS and its affiliates under agreements and plans other than the investment advisory agreement, including the 12b-1 fees the Fund pays to First Allmerica Financial Life Insurance Company and Allmerica Financial Life Insurance and Annuity Company, affiliates of AFIMS. The Trustees also considered the nature, extent and quality of certain other services AFIMS performs or arranges for on the Funds’ behalf, including securities lending programs and AFIMS’s interaction with third-party service providers, principally the Funds’ custodian and sub-custodians. The Trustees concluded that the various non-advisory services provided by AFIMS and its affiliates on behalf of the Funds were satisfactory.
The Trustees also considered benefits to the Sub-Advisers from the use of the Funds’ portfolio brokerage commission to pay for research and other similar services, and various other factors. The Trustees noted that AIT maintains a directed brokerage program which allows shareholders of the Funds to receive additional benefit from commissions expended by the Funds and gives the Funds the ability to receive credit for brokerage activity and apply those credits toward reducing transaction costs.
Based on their evaluation of factors that they deemed to be material, including those factors described above, the Board of Trustees, including a majority of the independent Trustees, concluded that the Funds’ and the Sub-Advisers should be continued for an additional one-year period, effective May 30, 2005.
F-60
Table of Contents

THE ALLMERICA FINANCIAL COMPANIES
The Hanover Insurance Company • Citizens Insurance Company of America • Citizens Management Inc.
Allmerica Financial Alliance Insurance Company • Allmerica Financial Benefit Insurance Company • AMGRO, Inc.
Financial Profiles, Inc. • VeraVest Investments, Inc. • VeraVest Investment Advisors, Inc. • Opus Investment Management, Inc.
First Allmerica Financial Life Insurance Company • Allmerica Financial Life Insurance and Annuity Company (all states except NY)
440 Lincoln Street, Worcester, Massachusetts 01653
www.allmerica.com
05-0038
Table of Contents
Table of Contents
| 1 | ||
| 2 | ||
Expense Example | F-1 | |
Financials | F-2 | |
Regulatory Disclosures | F-11 | |
One or more Funds may not be available under the variable annuity or variable life insurance policy which you have chosen. Inclusion in this report of a Fund which is not available under your policy is not to be considered a solicitation.
Table of Contents
A Letter from the Chairman
Dear Client:
Global economies generally struggled to advance during the first half of 2005. During the period, the Paris-based Organization for Economic Cooperation and Development (OECD) lowered its forecast for 2005 global economic growth to 2.6% from 2.9%. Unemployment remained high in much of the European Union, especially in France and Germany. The OECD reduced its 2005 growth forecast for Europe to 1.2% from an already low 1.9%. Still, the major European stock markets appeared to ignore the economic news as France’s CAC 40 index gained more than 10.0%, Germany’s Xetra DAX index rose almost 8.0% and Britain’s FTSE 100 index was higher by over 6.0%. Japan’s economy also strained to expand, as slowing exports and high oil prices took their toll. The Nikkei Stock Average managed a gain of about 1.0% for the first half of the year, while the OECD reduced Japan’s forecast for full year economic growth to 1.5% from 1.9%. China’s economy continued to expand during the first half of 2005, solidifying its position as an emerging engine of global economic growth. For the period, the MSCI EAFE Index was down 0.85%.
The United States economy continued to perform well during the first half of 2005. GDP grew at an annualized rate of 3.8% in the first quarter and the OECD forecast for full year economic growth was raised to 3.6% from 3.3%. Job creation was sporadic, but high enough to sustain moderate economic growth. Oil prices surged and labor costs edged higher, but many economists continued to view longer-term inflationary pressures as well contained. Consumer confidence reached a three year high, as income and spending continued to improve. The Federal Reserve Board increased interest rates nine times over the last twelve months, moving the target federal funds rate from 1.00% to 3.25%, as of the end of June. Long-term interest rates have stubbornly refused to follow short-term rates higher, however, implying uncertainty about the direction of the economy. Low mortgage rates continued to drive the housing market in most parts of the country. Still, low financing rates were not enough to spur domestic auto sales, as U.S. automakers continued to lose ground to foreign manufacturers. U.S. stock markets were lower during the period, as the S&P 500® Index moved down almost 1.0% and the Nasdaq Composite Index lost over 5.0%. The bond market proved more resilient, as the Lehman Brothers Aggregate Bond Index gained about 2.5%.
Money market fund returns improved during the first half of 2005, as the Federal Reserve Board continued to raise short-term interest rates. The Allmerica Investment Trust Money Market Fund continued its strong relative performance during the period, returning 1.08%, outperforming its benchmark, the Money Fund Report Averages: First Tier Taxable.
On behalf of the Board of Trustees,

John P. Kavanaugh
Chairman of the Board
Allmerica Investment Trust
1
Table of Contents
Money Market Fund
The Money Market Fund returned 1.08% for the first half of 2005, outperforming its benchmark, the Money Fund Report Averages: First Tier Taxable, which returned 0.96%.
During the period, the Money Market Fund maintained a relatively short weighted average maturity, in the range of 20 to 25 days. This position enabled the fund to take advantage of a rapidly increasing interest rate environment, as the Federal Reserve Board moved the federal funds rate from 2.25% to 3.25% during the period. The fund benefited from its investments in short dated, high quality, commercial paper and certificates of deposit. Floating-rate notes and extendible put option enabled paper were also successfully utilized. These securities aided performance through their built in reset functions, designed to keep pace with the Federal Reserve Board’s interest rate hikes and their inherent incremental spread.
The Investment Sub-Adviser believes that inflation is the biggest concern facing the economy. Continued increases in commodity and energy prices could hurt the consumer’s ability to support the economy. A consumer with less disposable income may mean fewer retail sales and weaker demand for goods and services, which may impact companies, job growth, and the economy. Alternatively, if inflation rises from an overheated economy, the cost to companies of raw materials for producing goods and services may outpace the consumer’s willingness to pay for them. This may result in fewer goods and services purchased and an economic slowdown. If the economy maintains its moderate expansion, the Investment Sub-Adviser expects the Federal Reserve Board to continue to move short-term interest rates higher. This may bode well for the fund, as higher interest rates should translate into higher yields.
The comments above are based on information provided by the Investment Sub-Adviser for the period indicated.
| Investment Sub-Adviser | About the Fund | |
| Opus Investment Management, Inc. | Seeks to obtain maximum current income consistent with preservation of capital and liquidity. | |
Average Annual Total Returns
| 1 Year | 5 Year | 10 Year | ||||
Money Market Fund | 1.68% | 2.40% | 3.94% | |||
Money Fund Report Averages: First Tier Taxable | 1.43% | 1.95% | 3.45% | |||
Lipper Money Market Funds Average | 1.64% | 2.14% | 3.65% | |||
Average Yield as of June 30, 2005
Money Market Fund 7-Day Yield | 2.61% | |
Growth of a $10,000 Investment Since 1995

The Money Market Fund is a portfolio of Allmerica Investment Trust.
The Fund is neither insured nor guaranteed by the Federal Deposit Insurance Corporation or any other government agency. Although the Fund seeks to maintain a net asset value of $1.00 per share, it is possible to lose money by investing in the Fund.
Money Fund Report Averages: First Tier Taxable is published by iMoneyNet, Inc., an independent firm that tracks 2a-7 regulated money market funds on a yield, shareholder, asset size and portfolio allocation basis. The Lipper Money Market Funds Average is a non-weighted average of funds within the money market investment objective.
The performance data quoted represents past performance. Past performance does not guarantee future results. The investment return and principal value of an investment will fluctuate so that an investor’s shares, when redeemed, may be worth more or less than their original cost. Current performance may be lower or higher than the performance data quoted. For information on the current month end performance of variable annuity and variable life insurance products, please call: (800) 533-7881. The performance data quoted is net of all fund operating expenses, but does not include variable insurance or variable annuity charges. If the performance data included the effect of these additional charges, it would have been lower.
2
Table of Contents
ALLMERICA INVESTMENT TRUST
EXPENSE EXAMPLE 06/30/05 (Unaudited)
You do not own shares of the Money Market Fund of the Allmerica Investment Trust directly. As a contract/policy owner investing in the Fund, you incur ongoing expenses, such as management fees, distribution and service (12b-1) fees, and other fund expenses. The following table is intended to help you understand your ongoing expenses (in dollars and cents) of investing in the Fund and to compare these expenses with the ongoing expenses of investing in other funds.
The example is based on an investment of $1,000 invested at the beginning of the period and held for the entire period from January 1, 2005 to June 30, 2005.
Actual Expenses
The first line in the table below provides information about the actual account values and actual expenses. You may use the information in this line, together with the amount you invested, to estimate the expenses that you paid over the period. Simply divide your account value by $1,000 (for example, an $8,600 account value divided by $1,000 = 8.6), then multiply the result by the number in the first line for the Fund under the heading entitled “Expenses Paid During Period” to estimate the expenses you paid on your account during this period.
Hypothetical Example for Comparison Purposes
The second line in the table below provides information about hypothetical account values and hypothetical expenses based on the Fund’s actual expense ratio and an assumed rate of return of 5% per year before expenses, which is not the Fund’s actual return. The hypothetical account values and expenses may not be used to estimate the actual ending account balance or expenses you paid for the period. You may use this information to compare the ongoing expenses of investing in the Fund and other funds. To do so, compare this 5% hypothetical example with the 5% hypothetical examples that appear in the shareholder reports of the other funds.
Please note that the expenses shown in the table are meant to highlight your ongoing expenses only and do not reflect any costs or expenses that apply to the subaccount or the contract. Therefore, the second line of the table is useful in comparing ongoing expenses of the Fund only, and will not help you determine the relative total costs of owning different funds underlying various annuity contracts and/or life insurance policies. In addition, if the costs or expenses that apply to the subaccount or the contract were included, your costs would have been higher.
Beginning Account Value 01/01/05 | Ending Account Value 06/30/05 | Annualized Expense Ratio | Expenses Paid During Period* (January 1 to June 30, 2005) | |||||||||
Money Market Fund | ||||||||||||
Actual | $ | 1,000.00 | $ | 1,010.80 | 0.54 | % | $ | 2.69 | ||||
Hypothetical | 1,000.00 | 1,022.12 | 0.54 | % | 2.71 | |||||||
| * | Expenses are calculated using the Fund’s annualized expense ratio (as disclosed in the table), multiplied by the average account value for the period, multiplied by the number of days in the period (181 days), and divided by the number of days in the year (365 days). |
F-1
Table of Contents
MONEY MARKET FUND
PORTFOLIO OF INVESTMENTS • June 30, 2005 (Unaudited)
| Par Value | Value (Note 2) | |||||
| U.S. GOVERNMENT AGENCY OBLIGATIONS - 11.5% | ||||||
Fannie Mae - 6.3% | ||||||
| $ | 6,000,000 | 2.32%, 09/12/05 | $ | 6,000,000 | ||
| 10,000,000 | 3.22%, 05/09/06 | 9,998,304 | ||||
| 15,998,304 | ||||||
Federal Home Loan Bank - 3.6% | ||||||
| 2,000,000 | 3.03%, 04/25/06 | 2,000,000 | ||||
| 7,000,000 | 3.20%, 06/14/06 | 6,998,910 | ||||
| 8,998,910 | ||||||
Freddie Mac - 1.6% | ||||||
| 4,000,000 | 3.70%, 06/30/06 | 4,000,000 | ||||
Total U.S. Government Agency Obligations (Cost $28,997,214) | 28,997,214 | |||||
| CORPORATE NOTES - 17.5% | ||||||
Banking - Domestic - 6.4% | ||||||
| 10,000,000 | Marshall & Isley Bank | |||||
3.36%, 12/20/05 | 10,000,000 | |||||
| 2,000,000 | Wachovia Corp. | |||||
6.88%, 09/15/05 | 2,014,432 | |||||
| 4,000,000 | Wells Fargo & Co. | |||||
3.14%, 07/03/06 | 4,000,000 | |||||
| 16,014,432 | ||||||
Computers & Information - 4.0% | ||||||
| 10,000,000 | International Business Machines Corp. (a) | |||||
3.14%, 12/08/05 | 10,000,000 | |||||
Heavy Machinery - 3.1% | ||||||
| 7,864,000 | Caterpillar Financial Services Corp., Series F, MTN | |||||
3.25%, 07/09/05 | 7,864,000 | |||||
Securities Broker - 4.0% | ||||||
| 10,000,000 | Morgan Stanley (b) | |||||
3.34%, 08/15/05 | 10,000,000 | |||||
Total Corporate Notes (Cost $43,878,432) | 43,878,432 | |||||
| COMMERCIAL PAPER (c) - 45.2% | ||||||
Asset Backed - 14.3% | ||||||
| 8,000,000 | Albis Capital Corp., (a) | |||||
3.27%, 07/20/05 | 7,986,193 | |||||
| 6,000,000 | Ivory Funding Corp. (a) | |||||
3.30%, 07/25/05 | 5,986,800 | |||||
| 8,000,000 | Master Funding LLC, (a) | |||||
3.24%, 07/12/05 | 7,992,080 | |||||
| 8,000,000 | Steamboat Funding Corp. (a) | |||||
3.35%, 07/08/05 | 7,994,789 | |||||
| 6,000,000 | TransAmerica Asset Funding, (a) | |||||
3.30%, 07/15/05 | 5,992,300 | |||||
| 35,952,162 | ||||||
Banking - Domestic - 2.4% | ||||||
| $ | 6,000,000 | CIT Group, Inc. | ||||
3.06%, 07/05/05 | $ | 5,997,960 | ||||
Banking - Foreign Banks & Branches - 13.6% | ||||||
| 7,500,000 | Dexia Delaware LLC | |||||
3.28%, 09/06/05 | 7,454,287 | |||||
| 8,000,000 | Lloyds Bank Plc | |||||
3.13%, 07/01/05 | 8,000,000 | |||||
| 9,600,000 | Rabobank USA Financial Corp. | |||||
3.35%, 07/01/05 | 9,600,000 | |||||
| 9,000,000 | UBS Finance Delaware | |||||
3.39%, 07/01/05 | 9,000,000 | |||||
| 34,054,287 | ||||||
Financial Services - 5.7% | ||||||
| 7,000,000 | International Lease Finance Corp. | |||||
3.29%, 09/07/05 | 6,956,499 | |||||
| 7,500,000 | National Rural Utilities Cooperative Finance Corp. | |||||
3.31%, 08/09/05 | 7,473,106 | |||||
| 14,429,605 | ||||||
Insurance - 2.4% | ||||||
| 6,000,000 | Prudential Financial Corp. | |||||
3.01%, 07/06/05 | 5,997,493 | |||||
Securities Broker - 2.8% | ||||||
| 7,000,000 | Goldman Sachs Group, Inc. | |||||
3.09%, 07/08/05 | 6,995,794 | |||||
Telephone Systems - 3.2% | ||||||
| 8,000,000 | SBC Communications, Inc. (a) | |||||
3.11%, 07/11/05 | 7,993,089 | |||||
Transportation - 0.8% | ||||||
| 2,045,000 | NetJets, Inc. (a) | |||||
3.06%, 07/07/05 | 2,043,957 | |||||
Total Commercial Paper (Cost $113,464,347) | 113,464,347 | |||||
| CERTIFICATES OF DEPOSIT - 23.7% | ||||||
| 8,000,000 | American Express Centurion Bank | |||||
3.11%, 07/11/05 | 8,000,000 | |||||
| 8,000,000 | Barclays Bank | |||||
3.11%, 07/11/05 | 8,000,006 | |||||
| 8,000,000 | BNP Paribas (NY Branch) | |||||
3.31%, 09/09/05 | 8,000,154 | |||||
| 5,000,000 | Credit Suisse First Boston (NY Branch) | |||||
3.13%, 01/06/06 | 5,000,192 | |||||
| 8,000,000 | HBOS Treasury Services | |||||
3.05%, 07/01/05 | 8,000,000 | |||||
| 8,000,000 | Toronto-Dominion Bank, Ltd. | |||||
2.84%, 07/20/05 | 7,998,061 | |||||
See Notes to Financial Statements.
F-2
Table of Contents
MONEY MARKET FUND
PORTFOLIO OF INVESTMENTS, Continued • June 30, 2005 (Unaudited)
| Par Value | Value (Note 2) | |||||
| CERTIFICATES OF DEPOSIT (continued) | ||||||
| $ | 7,000,000 | Washington Mutual Bank | ||||
3.10%, 07/08/05 | $ | 7,000,000 | ||||
| 7,500,000 | Wilmington Trust Co. | |||||
3.06%, 07/01/05 | 7,500,000 | |||||
Total Certificates of Deposit (Cost $59,498,413) | 59,498,413 | |||||
| Shares | ||||||
| INVESTMENT COMPANIES - 2.0% | ||||||
| 4,821,563 | Barclays Prime Money Market Fund | 4,821,563 | ||||
| 46,032 | Dreyfus Cash Management Plus Money Market Fund | 46,032 | ||||
| 212,458 | One Group Institutional Prime Money Market Fund | 212,458 | ||||
Total Investment Companies (Cost $5,080,053) | 5,080,053 | |||||
| | Total Investments - 99.9% (Cost $250,918,459) | 250,918,459 | ||||
| Net Other Assets and Liabilities - 0.1% | 309,509 | |||||
| Total Net Assets - 100.0% | $ | 251,227,968 | ||||
| (a) | Security exempt from registration under Rule 144A of the Securities Act of 1933. This security may be resold in transactions exempt from registration, to qualified institutional buyers. At June 30, 2005, these securities amounted to $55,989,208 or 22.3% of net assets. These securities have been deemed to be liquid in accordance with procedures established by the Board of Trustees. |
| (b) | Variable rate security. The rate shown reflects rate in effect at period end. |
| (c) | Effective yield at time of purchase. |
| MTN | Medium Term Note |
FEDERAL INCOME TAX INFORMATION (SEE NOTE 2)
At June 30, 2005, the aggregate cost of investment securities for tax
purposes was $250,918,459.
Major Class Concentration of Investments as a Percentage of Net Assets: | |||
Commercial Paper | 45.2 | % | |
Certificates Of Deposit | 23.7 | ||
Corporate Notes | 17.5 | ||
U.S. Government Agency Obligations | 11.5 | ||
Investment Companies | 2.0 | ||
Net Other Assets and Liabilities | 0.1 | ||
Total | 100.0 | % | |
See Notes to Financial Statements.
F-3
Table of Contents
ALLMERICA INVESTMENT TRUST
STATEMENT OF ASSETS AND LIABILITIES • June 30, 2005 (Unaudited)
| Money Market Fund | |||
ASSETS: | |||
Total investments at value (cost $250,918,459) | $ | 250,918,459 | |
Cash | 15,445 | ||
Interest receivable | 623,514 | ||
Total Assets | 251,557,418 | ||
LIABILITIES: | |||
Management fee payable | 66,609 | ||
Distribution fee payable | 31,081 | ||
Trustees’ fees and expenses payable | 5,366 | ||
Payable for shares repurchased | 195,678 | ||
Accrued expenses and other payables | 30,716 | ||
Total Liabilities | 329,450 | ||
| NET ASSETS | $ | 251,227,968 | |
NET ASSETS consist of: | |||
Paid-in capital | $ | 251,207,218 | |
Undistributed net investment income | 20,750 | ||
| TOTAL NET ASSETS | $ | 251,227,968 | |
| Shares of beneficial interest outstanding (unlimited authorization, no par value) | 251,149,131 | ||
| NET ASSET VALUE, | |||
Offering and redemption price per share (Net Assets/Shares Outstanding) | $ | 1.000 | |
See Notes to Financial Statements.
F-4
Table of Contents
ALLMERICA INVESTMENT TRUST
STATEMENT OF OPERATIONS • For the Six Months Ended June 30, 2005 (Unaudited)
| Money Market Fund | |||
INVESTMENT INCOME | |||
Interest | $ | 3,467,536 | |
EXPENSES | |||
Management fees | 409,788 | ||
Distribution fees | 192,497 | ||
Custodian and Fund accounting fees | 39,076 | ||
Legal fees | 12,181 | ||
Audit fees | 16,804 | ||
Trustees’ fees and expenses | 9,913 | ||
Reports to shareholders | 15,091 | ||
Miscellaneous | 963 | ||
Total expenses | 696,313 | ||
| NET INVESTMENT INCOME | 2,771,223 | ||
| NET INCREASE IN NET ASSETS RESULTING FROM OPERATIONS | $ | 2,771,223 | |
See Notes to Financial Statements.
F-5
Table of Contents
ALLMERICA INVESTMENT TRUST
STATEMENTS OF CHANGES IN NET ASSETS
Money Market Fund | ||||||||
Six Months Ended 2005 (Unaudited) | Year Ended 2004 | |||||||
| NET ASSETS at beginning of period | $ | 264,678,567 | $ | 377,154,527 | ||||
Increase (decrease) in net assets resulting from operations: | ||||||||
Net investment income | 2,771,223 | 2,804,306 | ||||||
Net realized gain on investments sold | — | 4,093 | ||||||
Net increase in net assets resulting from operations | 2,771,223 | 2,808,399 | ||||||
Distributions to shareholders from: | ||||||||
Net investment income | (2,771,223 | ) | (2,804,306 | ) | ||||
Total distributions | (2,771,223 | ) | (2,804,306 | ) | ||||
Capital share transactions: | ||||||||
Net proceeds from sales of shares | 70,774,053 | 105,887,642 | ||||||
Issued to shareholders in reinvestment of distributions | 2,771,223 | 2,804,306 | ||||||
Cost of shares repurchased | (86,995,875 | ) | (221,172,001 | ) | ||||
Net decrease from capital share transactions | (13,450,599 | ) | (112,480,053 | ) | ||||
Total decrease in net assets | (13,450,599 | ) | (112,475,960 | ) | ||||
| NET ASSETS at end of period | $ | 251,227,968 | $ | 264,678,567 | ||||
OTHER INFORMATION: | ||||||||
Share transactions: | ||||||||
Sold | 70,774,053 | 105,887,642 | ||||||
Issued to shareholders in reinvestment of distributions | 2,771,223 | 2,804,306 | ||||||
Repurchased | (86,995,875 | ) | (221,172,001 | ) | ||||
Net decrease in shares outstanding | (13,450,599 | ) | (112,480,053 | ) | ||||
See Notes to Financial Statements.
F-6
Table of Contents
ALLMERICA INVESTMENT TRUST
FINANCIAL HIGHLIGHTS - For a Share Outstanding Throughout Each Period
| Ratios/Supplemental Data | ||||||||||||||||||||||||||||||||
| Ratios To Average Net Assets | ||||||||||||||||||||||||||||||||
Year Ended | Net Asset | Net Investment Income | Dividends from Net Investment Income | Total Distributions | Net Asset Value End of Period | Total Return | Net Assets End of Period (000’s) | Net Income | Operating Expenses | Management Fee | ||||||||||||||||||||||
Money Market Fund | ||||||||||||||||||||||||||||||||
2005(a) | $ | 1.000 | $ | 0.011 | $ | (0.011 | ) | $ | (0.011 | ) | $ | 1.000 | 1.08 | %** | $ | 251,228 | 2.16 | %* | 0.54 | %* | 0.32 | %* | ||||||||||
2004 | 1.000 | 0.009 | (0.009 | ) | (0.009 | ) | 1.000 | 0.91 | % | 264,679 | 0.88 | % | 0.52 | % | 0.32 | % | ||||||||||||||||
2003 | 1.000 | 0.008 | (0.008 | ) | (0.008 | )(1) | 1.000 | 0.80 | % | 377,155 | 0.82 | % | 0.53 | % | 0.30 | % | ||||||||||||||||
2002 | 1.000 | 0.016 | (0.016 | ) | (0.016 | ) | 1.000 | 1.66 | % | 704,805 | 1.63 | % | 0.45 | % | 0.30 | % | ||||||||||||||||
2001 | 1.000 | 0.042 | (0.042 | ) | (0.042 | ) | 1.000 | 4.28 | % | 604,657 | 4.11 | % | 0.36 | % | 0.31 | % | ||||||||||||||||
2000 | 1.000 | 0.062 | (0.062 | ) | (0.062 | ) | 1.000 | 6.40 | % | 457,912 | 6.19 | % | 0.31 | % | 0.26 | % | ||||||||||||||||
| * | Annualized |
| ** | Not Annualized |
| (a) | For the six months ended June 30, 2005 (Unaudited) |
| (1) | Includes distribution from net realized capital gains of less than $.0005. |
See Notes to Financial Statements.
F-7
Table of Contents
ALLMERICA INVESTMENT TRUST
NOTES TO FINANCIAL STATEMENTS
1. ORGANIZATION
Allmerica Investment Trust (the “Trust”) is registered under the Investment Company Act of 1940, as amended (the “1940 Act”), as an open-end, diversified management investment company established as a Massachusetts business trust. The Trust is intended to serve as an investment medium for (i) variable life insurance policies and variable annuity contracts offered by insurance companies, (ii) certain qualified pension and retirement plans, as permitted by Treasury Regulations; and (iii) life insurance companies and advisers to the Portfolios and their affiliates. Allmerica Financial Corporation (“AFC”) has ceased all new sales of proprietary variable annuities and life insurance products. The Trust is comprised of nine managed investment portfolios (“Portfolios”). The accompanying financial statements and financial highlights are those of the Money Market Fund (the “Portfolio”).
In the opinion of management, the unaudited financial statements reflect all adjustments, which consist of normal and recurring adjustments, necessary to present fairly the financial position of the Portfolio at June 30, 2005, the results of its operations, the changes in its net assets, and the financial highlights for the six month period ending June 30, 2005.
2. SIGNIFICANT ACCOUNTING POLICIES
The preparation of financial statements in conformity with accounting principles generally accepted in the United States of America requires management to make estimates and assumptions at the date of the financial statements. Actual results could differ from those estimates.
The following is a summary of significant accounting policies followed by the Trust in the preparation of its financial statements:
Security Valuation: Securities of the Portfolio are valued utilizing the amortized cost valuation method, permitted in accordance with Rule 2a-7 under the 1940 Act. This method involves valuing a portfolio security initially at its cost and thereafter assuming a constant amortization to maturity of any discount or premium. Investments in other investment companies are valued at net asset value.
Security Transactions and Investment Income: Security transactions are recorded as of the trade date. Realized gains and losses from security transactions are determined on the basis of identified cost. Interest income, including amortization of premium and accretion of discount on securities, is accrued daily. Income distributions earned by the Portfolio from investments in certain investment companies are recorded as interest income in the accompanying financial statements.
Federal Income Taxes: The Trust treats each Portfolio as a separate entity for Federal income tax purposes. The Portfolio intends to continue to qualify as a “regulated investment company” under Subchapter M of the Internal Revenue Code of 1986, as amended. By so qualifying, the Portfolio will not be subject to Federal income taxes to the extent it distributes all of its taxable income and net realized gains, if any, for its fiscal year. In addition, by distributing during each calendar year substantially all of its net investment income, capital gains and certain other amounts, if any, the Portfolio will not be subject to Federal excise tax. Therefore, no Federal income tax provision is required.
Distributions to Shareholders: Dividends from net investment income are declared and reinvested daily for the Portfolio. The Portfolio declares and distributes all net realized capital gains, if any, at least annually. Distributions to shareholders are recorded on the ex-dividend date. Income and capital gains distributions are determined in accordance with income tax regulations.
Expenses: Expenses directly attributed to a portfolio are charged to the portfolio, while expenses which are attributable to more than one portfolio of the Trust are allocated based upon relative net assets among the respective Portfolios and one other affiliated investment company, Allmerica Securities Trust.
Forward Commitments: The Portfolio may enter into contracts to purchase securities for a fixed price at a specified future date beyond customary settlement time (“forward commitments”). If the Portfolio does so, it will maintain cash or
F-8
Table of Contents
ALLMERICA INVESTMENT TRUST
NOTES TO FINANCIAL STATEMENTS (Continued)
other liquid obligations having a value in an amount at all times sufficient to meet the purchase price. Forward commitments involve a risk of loss if the value of the security to be purchased declines prior to the settlement date. Although the Portfolio generally will enter into forward commitments with the intention of acquiring securities for its portfolio, it may dispose of a commitment prior to settlement if its Sub-Adviser deems it appropriate to do so.
Repurchase Agreements: The Portfolio may engage in repurchase agreement transactions with institutions that the Sub-Adviser has determined are creditworthy pursuant to guidelines established by the Trust’s Board of Trustees. The Portfolio requires that the securities purchased in a repurchase agreement transaction be transferred to the Trust’s Custodian in a manner that is intended to enable the Portfolio to obtain those securities in the event of a counterparty default. The Sub-Adviser monitors the value of the securities, including accrued interest, daily to ensure that the value of the collateral equals or exceeds amounts due under the repurchase agreement. Repurchase agreement transactions involve certain risks in the event of default or insolvency of the counterparty, including possible delays or restrictions upon the Portfolio’s ability to dispose of the underlying securities, and a possible decline in the value of the underlying securities during the period while the Portfolio seeks to assert its rights.
3. INVESTMENT MANAGEMENT, ADMINISTRATION, AND OTHER RELATED PARTY TRANSACTIONS
Management Fees: Allmerica Financial Investment Management Services, Inc. (the “Manager”), a wholly-owned subsidiary of Allmerica Financial Life Insurance and Annuity Company (“Allmerica Financial”), serves as investment manager and administrator to the Trust. Allmerica Financial is a wholly-owned subsidiary of AFC. Under the terms of the management agreement, the Portfolio pays a management fee, calculated daily and payable monthly, at annual rates of 0.35% for the first $100,000,000 in average daily net assets, 0.30% for the next $400,000,000 in average daily net assets, 0.25% for the next $250,000,000 in average daily net assets, and 0.20% for average daily net assets in excess of $750,000,000.
The Manager has entered into a Sub-Adviser Agreement for the management of the investments of the Portfolio. The Manager is solely responsible for the payment of all fees to the Sub-Adviser. The Sub-Adviser for the Portfolio is Opus Investment Management, Inc., a wholly-owned subsidiary of AFC.
Plan of Distribution and Service: The 12b-1 Plan permits the Portfolio to pay Allmerica Financial and First Allmerica Financial Life Insurance Company, a wholly-owned subsidiary of Allmerica Financial, for marketing and distribution expenses to support the sale and distribution of the Portfolio’s shares and the provision of services to maintain and retain accounts. The 12b-1 Plan authorizes payment of a distribution and service fee at an annual rate of up to 0.25% of the Portfolio’s average daily net assets. As directed by the Board of Trustees, the Portfolio pays a distribution fee at an annual rate of 0.15% of the Portfolio’s average daily net assets.
Custodian, Fund Accounting, and Administrative Fees: Investors Bank & Trust Company (“IBT”) provides portfolio accounting and custody services to the Trust and receives fees and reimbursement of certain out-of-pocket expenses for its services from the Trust. The Manager has entered into an Administrative Services Agreement with IBT, whereby IBT performs certain administrative services for the Portfolio and is entitled to receive an administrative fee and reimbursement of certain out-of-pocket expenses. The Manager is solely responsible for the payment of the administrative fee to IBT. The Trust pays no salaries or compensation to any of its officers. Trustees who are not directors, officers or employees of the Trust or any investment adviser are reimbursed for their travel expenses in attending meetings of the Trustees, and receive quarterly meeting and retainer fees for their services. Such amounts are paid by the Trust.
4. REIMBURSEMENT OF EXPENSES AND WAIVER OF FEES
In the event normal operating expenses, excluding taxes, interest, broker commissions, and extraordinary expenses, but including the management fee, exceed 0.60% of average net assets, the Manager will voluntarily reimburse fees and any expenses in excess of the expense limitation. Expense limitations may be removed or revised at any time after the Portfolio’s first fiscal year of operations without prior notice to existing shareholders.
F-9
Table of Contents
ALLMERICA INVESTMENT TRUST
NOTES TO FINANCIAL STATEMENTS (Continued)
5. SHARES OF BENEFICIAL INTEREST
The Trust’s Declaration of Trust authorizes the Trustees to issue an unlimited number of shares of beneficial interest for the Portfolio, each without a par value.
6. FOREIGN SECURITIES
The Portfolio may invest in only U.S. dollar denominated foreign securities. Investing in foreign securities involves special risks not typically associated with investing in securities of U.S. issuers. The risks include future adverse political and economic developments. Moreover, securities of many foreign issuers and their markets may be less liquid and their prices more volatile than those of securities of comparable U.S. issuers.
7. SUBSEQUENT EVENTS
On August 22, 2005, AFC announced that it had entered into a definitive agreement to sell Allmerica Financial and its closed block of variable annuity and variable life business (the “Transaction”) to The Goldman Sachs Group, Inc. (“Goldman Sachs”). In addition, as part of the Transaction, Goldman Sachs will purchase AFIMS. The Transaction is expected to close on or about November 30, 2005.
In connection with the Transaction, the Board of Trustees of the Trust has approved an Agreement and Plan of Reorganization (the “Reorganization Agreement”) on behalf of each Portfolio of the Trust (each, an “AIT Fund”). The Reorganization Agreement is among the Trust, on behalf of each AIT Fund, Goldman Sachs Variable Insurance Trust (“GSVIT”), on behalf of each investment fund of GSVIT listed below (each, a “GSVIT Fund”), AFC, AFIMS, Goldman Sachs Asset Management, L.P. and Goldman Sachs Asset Management International. Pursuant to the Reorganization Agreement, each AIT Fund will be reorganized into a corresponding GSVIT Fund, as noted below (each, a “Fund Reorganization”):
AIT Fund | GSVIT Fund | |
Select International Equity Fund | International Equity Fund | |
Core Equity Fund | CORESM U.S. Equity Fund | |
Select Growth Fund | Capital Growth Fund | |
Select Capital Appreciation Fund | Growth Opportunities Fund | |
Equity Index Fund | Equity Index Fund | |
Select Value Opportunity Fund | Mid Cap Value Fund | |
Government Bond Fund | Government Income Fund | |
Select Investment Grade Income Fund | Core Fixed Income Fund | |
Money Market Fund | Money Market Fund |
A Special Meeting of Shareholders of the Trust is expected to be held in November 2005, at which shareholders of each AIT Fund will be asked to approve the Fund Reorganization relating to such AIT Fund. Although separate accounts of Allmerica Financial and First Allmerica are the only shareholders of the AIT Funds, owners of variable annuity contracts or variable life insurance contracts with allocations in the separate accounts that invest in the AIT Funds will have the right to instruct Allmerica Financial or First Allmerica as to how to vote on the shares of the AIT Fund(s) attributable to their variable contracts. If approved at the Special Meeting of Shareholders, each Fund Reorganization will take place shortly thereafter. The proposed Fund Reorganizations are not conditioned on each other.
If the Reorganization Agreement is approved with respect to an AIT Fund, the AIT Fund will reorganize into the corresponding GSVIT Fund. The AIT Fund will transfer all of its assets and liabilities attributable to its shares to the corresponding GSVIT Fund in exchange for shares of such GSVIT Fund and the assumption by the GSVIT Fund of the liabilities of the AIT Fund. Each AIT Fund Reorganization will be effected on the basis of the relative net asset values of the relevant AIT Fund and GSVIT Fund. Each AIT Fund Reorganization will be followed immediately by the distribution of the shares of the corresponding GSVIT Fund to the separate account shareholders of such AIT Fund in complete liquidation of the AIT Fund. As a result, if a Fund Reorganization occurs, each affected separate account will be invested in shares of the relevant corresponding GSVIT Fund.
F-10
Table of Contents
ALLMERICA INVESTMENT TRUST
REGULATORY DISCLOSURES (Unaudited)
The performance data quoted represents past performance and the investment return and principal value of an investment will fluctuate so that an investor’s shares, when redeemed, may be worth more or less than their original cost.
An investment in the Money Market Fund (the “Portfolio”) is not insured or guaranteed by the Federal Deposit Insurance Corporation or any other government agency. Although the Portfolio seeks to preserve the value of your investment at a stable net asset value of $1.00 per share, it is possible to lose money by investing in the Portfolio.
Securities issued by some U.S. Government-sponsored entities, such as the Federal Home Loan Mortgage Corporation (Freddie Mac) and the Federal National Mortgage Association (Fannie Mae), are not backed by the full faith and credit of the U.S. Government. No assurances can be given that the U.S. Government would provide financial support to a U.S. Government-sponsored instrumentality if not obligated to do so.
This report and the financial statements contained herein are submitted for the general information of the shareholders of the Portfolio of Allmerica Investment Trust (the “Trust”) and are not authorized for distribution to prospective investors in the flexible premium variable life insurance or annuity products of Allmerica Financial Life Insurance and Annuity Company (“Allmerica Financial”) or First Allmerica Financial Life Insurance Company (“First Allmerica”) unless accompanied or preceded by effective prospectuses for the flexible premium variable life insurance or annuity products of Allmerica Financial or First Allmerica and the Trust which include important information related to charges and expenses.
The Trust files complete schedules of portfolio holdings of the Portfolios of the Trust with the Securities and Exchange Commission for the first and third quarters of each fiscal year on Form N-Q. The Trust’s Forms N-Q are available on the Commission’s website at http://www.sec.gov. The Trust’s Forms N-Q may be reviewed and copied at the Commission’s Public Reference Room in Washington, DC. Information regarding the operation of the Public Reference Room may be obtained by calling the Commission at 1-800-SEC-0330.
During the most recent 12-month period ended June 30, the Portfolio did not vote proxies relating to its portfolio securities because the Portfolio invests exclusively in non-voting securities.
This report includes financial statements for the Money Market Fund of Allmerica Investment Trust. It does not include financial statements for the separate accounts that correspond to the insurance and/or annuity products included in this report.
The SEC has modified mailing requirements for annual and semiannual reports to allow a single copy of this report to be delivered to customers who share the same last name and address. This will automatically apply to all customers. If you would prefer to receive your own copy, please notify us at the phone number listed on the back cover of this report.
F-11
Table of Contents
ALLMERICA INVESTMENT TRUST
BOARD REVIEW OF ADVISORY ARRANGEMENTS (Unaudited)
The Investment Company Act of 1940 requires that both the full Board of Trustees and a majority of the non-interested (“independent”) Trustees of Allmerica Investment Trust (“AIT”), voting separately, annually approve the continuation of your fund’s management agreement with Allmerica Financial Investment Management Services, Inc. (“AFIMS”) and of the sub-adviser agreement with your fund’s sub-adviser, Opus Investment Management, Inc. (the “Sub-Adviser”). The Trustees consider matters bearing on the Money Market Fund (the “Fund”) and its advisory arrangements at their meetings throughout the year, including a review of performance data at each regular meeting. The Trustees are also assisted in evaluating the performance of the Sub-Adviser by CRA RogersCasey, LLC, a pension consulting firm. In addition, AIT’s Fund Operations Committee, which is composed entirely of independent Trustees, met on April 7, 2005, and the full Board of Trustees met on May 10, 2005, for the specific purpose of considering whether to approve the continuation of the Fund’s management agreement and sub-adviser agreement. The independent Trustees were assisted in their evaluation by independent legal counsel, from whom they received separate legal advice and with whom they met separately from AFIMS during the contract review meetings.
In connection with their deliberations regarding the continuation of the Fund’s advisory arrangements, the Trustees, including the independent Trustees, considered such information and factors as they believed, in light of the legal advice furnished to them and their own business judgment, to be relevant. The management agreement and sub-adviser agreement for the Fund were considered separately, although the Trustees also took into account the common interests of all AIT Funds in their review. As described below, the Trustees considered the nature, quality, and extent of the various investment advisory and administrative services performed by AFIMS, its affiliates and the Funds’ Sub-Advisers under the existing advisory and other arrangements with the Fund.
In connection with their contract review meetings, the Trustees received and relied upon materials which included, among other items: (i) information on the investment performance of the Fund for various time periods ended December 31, 2004, and March 31, 2005; (ii) information provided by Lipper Inc. on the investment performance of a select group of funds with substantially similar investment classifications and objectives as the Fund, as well as the investment performance of a select group of funds identified by objective criteria suggested by AFIMS; (iii) information provided by Lipper Inc. on the Fund’s management fees and total expenses and the management fees and total expenses of comparable funds in the Fund’s Lipper peer group; (iv) background information on personnel involved in the investment management and operations of the Fund; (v) the fall-out benefits, if any, that AFIMS and the Sub-Adviser may receive as a result of their work on behalf of the Fund; (vi) information as to whether and to what extent applicable expense waivers, reimbursements or fee “breakpoints” are observed for the Fund, (vii) information regarding AFIMS’s and the Sub-Advisor’s financial results and financial conditions, including their profitability from services performed for the Fund; and (viii) descriptions of various functions performed by AFIMS and the Sub-Adviser for the Fund, such as compliance monitoring and portfolio trading practices. The comparative performance, fee and expense information prepared and provided by Lipper Inc. was not independently verified, and the independent Trustees did not independently verify any information provided to them by AFIMS or the Sub-Adviser.
The Trustees’ conclusion as to the continuation of the advisory arrangements was based on a comprehensive consideration of all information provided to the Trustees and not the result of any single factor. Some of the factors that figured particularly in the Trustees’ deliberations are described below, although individual Trustees may have evaluated the information presented differently from one another, giving different weights to various factors. It is also important to recognize that the fee arrangements for the Fund are the result of years of review and discussion between the independent Trustees and AFIMS, that certain aspects of such arrangements may receive greater scrutiny in some years than others, and that the Trustees’ conclusions may be based, in part, on their consideration of these same arrangements during the course of the year and in prior years.
F-12
Table of Contents
ALLMERICA INVESTMENT TRUST
BOARD REVIEW OF ADVISORY ARRANGEMENTS (Continued) (Unaudited)
Based on information provided by Lipper Inc. and AFIMS, the Trustees reviewed the Fund’s total return investment performance as well as the performance of its Lipper Insurance Universe peer group of funds over the various time periods noted below:
| Average Annual Total Returns (Period Ending December 31, 2004) | ||||||
| One-year (%) | Three-years (%) | Five-years (%) | ||||
Money Market Fund | 0.91 | 1.12 | 2.79 | |||
Lipper Money Market Funds category average* | 0.83 | 0.93 | 2.49 | |||
| * | Lipper Insurance Universe peer group category average excludes the performance of the Fund. |
In the course of their deliberations, the Trustees took into account information provided by AFIMS in connection with the contract review meetings, as well as during investment review meetings conducted during the course of the year, as to the efforts of AFIMS and the Sub-Adviser relating to the Fund’s performance. After reviewing these and related factors, the Trustees concluded, within the context of their overall conclusions regarding the Fund’s advisory agreements, that they were satisfied with AFIMS’s and the Sub-Adviser’s responses and efforts relating to investment performance.
In assessing the reasonableness of the Fund’s advisory fee, the Trustees considered, among other information, the Fund’s management fee and the total expense ratio as a percentage of average net assets and the management fee and total expense ratios of peer groups of funds based on information provided by Lipper Inc. and AFIMS.
The Trustees also considered whether the Fund is likely to benefit from any economies of scale in the management of the Fund in the event of growth in assets of the Fund. They noted that the Fund’s management fee rate schedule is currently subject to breakpoints. The Trustees also considered information prepared by AFIMS relating to its costs and profits with respect to the Fund, as well as the methodologies used to determine and allocate its costs to the Fund and other accounts and products for purposes of estimating profitability.
After reviewing these factors and others described herein, the Trustees concluded, within the context of their overall conclusions regarding the advisory arrangements, that the management fees charged to the Fund represent reasonable compensation in light of the nature and quality of the services being provided by AFIMS and the Sub-Adviser to the Fund.
In addition, the Trustees considered AFIMS’s and the Sub-Adviser’s resources and related efforts to continue to retain, attract and motivate capable personnel to serve the Fund. The Trustees also considered the financial resources of AFIMS and its parent, Allmerica Financial Corporation.
The Trustees also considered the nature, quality, cost, and extent of administrative and distribution services provided to the Fund by AFIMS and its affiliates under agreements and plans other than the investment advisory agreement, including the 12b-1 fees the Fund pays to First Allmerica Financial Life Insurance Company and Allmerica Financial Life Insurance and Annuity Company, affiliates of AFIMS. The Trustees also considered the nature, extent and quality of certain other services AFIMS performs or arranges for on the Fund’s behalf, including AFIMS’s interaction with third-party service providers, principally the Fund’s custodian. The Trustees concluded that the various non-advisory services provided by AFIMS and its affiliates on behalf of the Fund were satisfactory.
Based on their evaluation of factors that they deemed to be material, including those factors described above, the Board of Trustees, including a majority of the independent Trustees, concluded that the Fund’s advisory arrangements with AFIMS and the Sub-Adviser should be continued for an additional one-year period, effective May 30, 2005.
F-13
Table of Contents

THE ALLMERICA FINANCIAL COMPANIES
The Hanover Insurance Company • Citizens Insurance Company of America • Citizens Management Inc.
Allmerica Financial Alliance Insurance Company • Allmerica Financial Benefit Insurance Company • AMGRO, Inc.
Financial Profiles, Inc. • VeraVest Investments, Inc. • VeraVest Investment Advisors, Inc. • Opus Investment Management, Inc.
First Allmerica Financial Life Insurance Company • Allmerica Financial Life Insurance and Annuity Company (all states except NY)
440 Lincoln Street, Worcester, Massachusetts 01653
www.allmerica.com
05-0038
Table of Contents
| Item 2. | Code of Ethics |
Not required for a semi-annual period.
| Item 3. | Audit Committee Financial Expert |
Not required for a semi-annual period.
| Item 4. | Principal Accountant Fees and Services |
Not required for a semi-annual period.
| Item 5. | Audit Committee of Listed Registrants |
Not required for a semi-annual period.
| Item 6. | Schedule of Investments |
The Schedule of Investments is included as a part of the report to shareholders filed under Item 1 of this Form.
| Item 7. | Disclosure of Proxy Voting Policies and Procedures for Closed-End Management Investment Companies |
Not Applicable
| Item 8. | Portfolio Managers of Closed-End Management Investment Companies |
Not Applicable
| Item 9. | Purchases of Equity Securities by Closed-End Management Investment Company and Affiliated Purchasers |
Not Applicable
| Item 10. | Submission of Matters to a Vote of Security Holders |
Material changes to the procedures by which shareholders may recommend nominees to the Board of Trustees: Not Applicable
| Item 11. | Controls and Procedures |
| (a) | The registrant’s principal executive and principal financial officers have concluded that, based on their evaluation of the effectiveness of the registrant’s disclosure controls and procedures (as defined in Rule 30a-3(c) under the Investment Company Act of 1940) as of a date within 90 days of the filing date of this report on Form N-CSR, such disclosure controls and procedures provide reasonable assurances that material information relating to the registrant is made known to them by the appropriate persons. | |||
| (b) | Changes to internal control over financial reporting: Not Applicable | |||
| Item 12. | Exhibits |
| (a) | (1) | Code of Ethics that applies to the registrant’s principal executive officer and principal financial/ principal accounting officer is attached as Exhibit 99.CODE. | ||
| (2) | Separate certifications by the registrant’s principal executive officer and principal financial officer, pursuant to Section 302 of the Sarbanes-Oxley Act of 2002 and as required by Rule 30a-2(a) under the Investment Company Act of 1940, are attached hereto as Exhibit 99.CERT. | |||
Table of Contents
| (b) | A certification by the registrant’s principal executive officer and principal financial officer, pursuant to Section 906 of the Sarbanes-Oxley Act of 2002 and as required by Rule 30a-2(b) under the Investment Company Act of 1940 is attached hereto as Exhibit 99.CERTB. |
Table of Contents
Signatures
Pursuant to the requirements of the Securities Exchange Act of 1934 and the Investment Company Act of 1940, the registrant has duly caused this report to be signed on its behalf by the undersigned, thereunto duly authorized.
| Allmerica Investment Trust | ||
| By: | /s/ JOHN P. KAVANAUGH | |
| John P. Kavanaugh | ||
| President and Chairman | ||
Date: August 22, 2005
Pursuant to the requirements of the Securities Exchange Act of 1934 and the Investment Company Act of 1940, this report has been signed below by the following persons on behalf of the registrant and in the capacities and on the dates indicated.
| By: | /s/ JOHN P. KAVANAUGH | |
| John P. Kavanaugh | ||
| President and Chairman | ||
| (Principal Executive Officer) | ||
Date: August 22, 2005
| By: | /s/ PAUL S. BELLANY | |
| Paul S. Bellany | ||
| Assistant Vice President and Treasurer | ||
| (Principal Financial Officer) | ||
Date: August 22, 2005