Barrick 2020 Q1 Report Toronto, May 6, 2020 — Barrick Gold Corporation (NYSE:GOLD)(TSX:ABX) built on the solid foundation it laid last year with a robust first quarter performance from all operations in the face of the challenges presented by the global Covid-19 pandemic. Q1 gold production and costs were consistent with full year guidance; debt net of cash was reduced by a further 17% from the end of Q4 to $1.85 billion with no significant maturities until 2033; operating cash flow increased to $889 million and free cash flow1 to $438 million from Q4; net earnings per share was 22 cents; adjusted net earnings per share2 was 16 cents; and the quarterly dividend of 7 cents per share was maintained. President and CEO Mark Bristow said operational and financial delivery were on plan despite the fact that the group’s prime focus during the latter part of the quarter had been on ensuring the safety of Barrick’s people, communities and business in the face of the novel coronavirus pandemic, while also coping with the restrictive conditions imposed by governments. “Our sustainability and regional teams have done a great job in taking timely action to introduce comprehensive and carefully considered measures at all our sites and offices to manage and mitigate any impacts of Covid-19 on our employees and contractors. A key focus of this plan is on prevention, and all sites are working actively to head off an outbreak,” he said. Q1Report 2020 4 6 8 CLEAN ENERGY CURBS COSTS EXPLORATION DRIVE EXTENDS ASSET BASE PEERLESS RECORD OF STRATEGIC DELIVERY CONTINUED ON PAGE 2 ALL AMOUNTS EXPRESSED IN US DOLLARS STEPPING UP COVID-19 RESPONSE 3 QUARTERLY $0.07 DIVIDEND MAINTAINED PER SHARE MASSAWA SALE CREATES VALUE FOR ALL STAKEHOLDERS OPERATING CASH FLOW $889MILLION FREE CASH FLOW $438MILLION DEBT %* NET OF CASH TO $1.85 BILLION h17 * QUARTER ON QUARTER BARRICK MAKES SOLID START TO YEAR Prompt and Effective Actions Shield People and Business from Pandemic 1
Key Performance Indicators
Financial and Operating Highlights
Financial Results
| Q1 2020 | Q4 2019 | Q1 2019 | |||||||||
Realized gold price3,4 ($ per ounce) | 1,589 | 1,483 | 1,307 | |||||||||
Net earnings5 ($ millions) | 400 | 1,387 | 111 | |||||||||
Adjusted net earnings2 ($ millions) | 285 | 300 | 184 | |||||||||
Net cash provided by operating activities($ millions) | 889 | 875 | 520 | |||||||||
Free cash flow1 ($ millions) | 438 | 429 | 146 | |||||||||
Net earnings per share ($) | 0.22 | 0.78 | 0.06 | |||||||||
Adjusted net earnings per share2($) | 0.16 | 0.17 | 0.11 | |||||||||
Total attributable capital expenditures6($ millions) | 364 | 393 | 361 | |||||||||
Operating Results | Q1 2020 | Q4 2019 | Q1 2019 | |||||||||
Gold | ||||||||||||
Production4 (000s of ounces) | 1,250 | 1,439 | 1,367 | |||||||||
Cost of sales (Barrick’s share)4,7 ($ per ounce) | 1,020 | 1,046 | 947 | |||||||||
Total cash costs4,8 ($ per ounce) | 692 | 692 | 631 | |||||||||
All-in sustaining costs4,8 ($ per ounce) | 954 | 923 | 825 | |||||||||
Copper | ||||||||||||
Production9 (millions of pounds) | 115 | 117 | 106 | |||||||||
Cost of sales (Barrick’s share)9,10 ($ per pound) | 1.96 | 2.26 | 2.21 | |||||||||
C1 cash costs9,11 ($ per pound) | 1.55 | 1.90 | 1.66 | |||||||||
All-in sustaining costs9,11 ($ per pound) | 2.04 | 2.82 | 2.46 | |||||||||
| ◾ | Solid start to the year from all operations |
| ◾ | Gold production and costs were consistent with full year guidance |
| ◾ | Debt, net of cash, down a further 17% to $1.85 billion with no significant maturities until 2033 |
| ◾ | Operating Cash Flow increased to $889 million and Free Cash Flow1 to $438 million from Q4 |
| ◾ | Net earnings per share of 22 cents and adjusted net earnings per share2 of 16 cents for the quarter |
| ◾ | Copper costs per pound significantly lower demonstrating resilience of business |
| ◾ | Successful completion of Massawa sale creates value for all stakeholders |
| ◾ | Signing of framework agreement in Tanzania paves way for exporting concentrate |
| ◾ | Continued focus on safety delivers improvements in injury rates |
| ◾ | 2019 Annual Report highlightsten-year plan as Barrick looks to next phase of value creation |
| ◾ | Proactive engagement with all stakeholders ensures protection of our people and supports sustainability of the business duringCovid-19 pandemic |
| ◾ | Barrick’s sustainability vision demonstrated by publication of industry-first ESG scorecard |
| ◾ | Brownfields exploration success points to life of mine extensions |
| ◾ | Global exploration portfolio expanded with new projects and targets |
| ◾ | Barrick declares $0.07 quarterly dividend per share |
CONTINUED FROM PAGE 1
“In Barrick’s spirit of partnership, we have extendedCovid-19 support to our local communities and our host countries and are working closely with their health authorities. To date we have donated more than $20 million to our host countries, many of whom have limited healthcare facilities, to fund the purchase of medical equipment and PPE.”
Highlights of the quarter included the closing of the sale of the Massawa project, which has created immediate value for all stakeholders, including Barrick. In Tanzania, the signing of the
framework agreement with the government paved the way for the resumption of concentrate exports.
Brownfields exploration continues to replenish reserves depleted by mining while Barrick’s generative exploration programs are identifying new projects and targets, and expanding its global reach. Among other things, Barrick has formed an alliance with Japan Gold, holder of the largest exploration property portfolio in Japan.
Since the end of the quarter, the government of Papua New Guinea has announced that it will not renew Barrick Niugini Limited’s20-year Special Mining Lease for the Porgera gold
BARRICK FIRST QUARTER 2020 | 2 | PRESS RELEASE |
mine. Barrick has said it will contest the move, which it regards as tantamount to nationalization without due process. In the meantime, BNL has placed Porgera on temporary care and maintenance. In addition, due to the uncertainty related to the timing and scope of future developments on the mine’s operating outlook, we are withdrawing our full year 2020 guidance for Porgera at this time. As this is a rapidly evolving situation, we will reassess on an ongoing basis and provide further updates in due course, while maintaining operational readiness.
Bristow said regardless of new discoveries, organic growth from its existing asset base — which includes six Tier One gold mines — would sustain Barrick’s recently publishedten-year plan that projects annual production of around five million ounces of gold (subject to adjustment based on the outcome of the process with the Government of Papua New Guinea with respect to the Porgera Special Mining Lease extension). A Tier One gold mine is one which has a life of at least 10 years and produces more than 500,000 ounces of gold per annum in the lower half of the industry cost range.
Barrick has also published an industry-first ESG scorecard to transparently report on its performance in terms of health and
safety; social and economic development; human rights; the environment; and governance.
“Overall we scored a B grade, which we believe accurately reflects our improvement in sustainability performance over the year but also acknowledges that there is still some work to be done,” Bristow said.
Conference Call and Webinar
Please join us for an interactive webinar today at 11:00 EDT/ 15:00 UTC to discuss the results.
Webinar
US and Canada, 1 800 319 4610
UK, 0808 101 2791
International, +1 416 915 3239
The webinar will remain on the website for later viewing and the conference call will be available for replay by telephone at 1 855 669 9658 (US and Canada toll-free) and +1 604 674 8052 (international toll), access code 4363.
PRO-ACTIVE PREPARATION, RAPID RESPONSE BUFFER
COVID-19 IMPACT
Barrick’s deeply embedded health and safety culture, combined with its flat organizational structure and agile management style, cushioned the initial impact of the coronavirus pandemic on its people, communities and business.
President and CEO Mark Bristow says while crises of one kind or another are endemic in big mining organizations,Covid-19 is a true Black Swan event.
“Fortunately, Barrick had the management capacity to take immediate and effective action based on well-established health and safety resources and procedures. The streamlined corporate structure we introduced last year, the strong regional executive teams we established, and the transfer of greater authority to the operations all contributed to fast decision-making and prompt execution. We could also draw on the experience Randgold gained in dealing with two Ebola outbreaks in Africa,” he says.
BARRICK FIRST QUARTER 2020 | 3 | PRESS RELEASE |
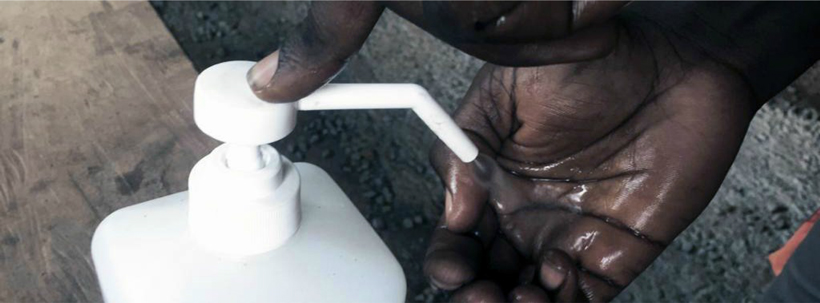
Group sustainability executive Grant Beringer says Barrick is employing a ‘4 P’ strategy to protect its employees, contractors and communities. The four Ps areProactive Response,Preparedness,Prevention andPerspective.
Among many other things, these headings cover updating Emergency Response Plans at each site, introducing a Trigger/Threat Action Response Plan and the establishment of Outbreak Control Teams for all mines. Temperature screening is carried out at all access points to the sites and offices, rapid antibody test kits are being rolled out across the group, and social distancing and hygiene protocols have been put in place.
“We believe that education and communication are key components of an effectiveCovid-19 campaign. Our workforce is regularly updated on the latest developments and our plans. Fact sheets with specific information on symptoms, hygiene and social distancing, designed to prevent scaremongering or self-medication with potentially hazardous substances, have been distributed to everybody at Barrick. Daily situation reports from each region are circulated throughout the organization.”
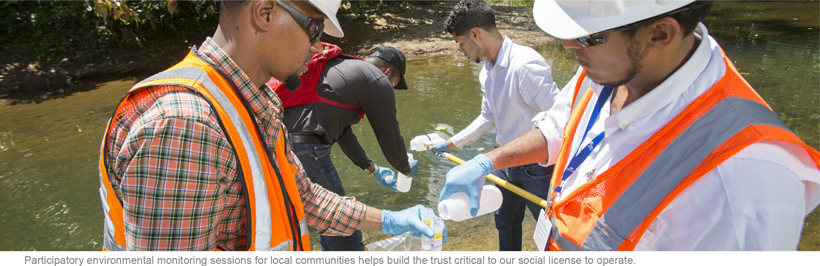
Beringer says Barrick is also engaging closely with its host authorities and communities to support them in their fight
against the pandemic. To date, Barrick has provided host governments with funding of more than $20 million, mainly to acquire specialized medical equipment. In addition, the company’s operations and subsidiaries have also been individually involved in a number of diverse but effective local charitable initiatives where the need for intervention has been identified.
Barrick has also taken steps to ensure that its operations continue to enjoy an uninterrupted supply chain, proactively engaging with key suppliers to mitigate volatility and uncertainty. With an integrated supply chain stretching over multiple continents, dedicated international logistics partners and strong relationships with key suppliers, Barrick has been afforded the flexibility to deal with the challenges in an agile manner.
“Not only have we focused on remaining active in ensuring we have alternate procurement and logistic arrangements in place, we have also increased the stocks of consumables and other fast moving items at our mines. At the same time, the team has been there to assist in procuring those often scarce PPE and other medical supplies needed by our host countries,” says Barrick’s group supply chain and commercial executive Riaan Grobler.
CLEARING THE AIR, CURBING THE COST
Barrick’s clean energy strategy is playing a significant and growing part in reducing the impact of its operations on the environment. At the same time, it is also steadily reducing their cost profile.
Metallurgy, engineering and capital projects executive John Steele says the company is investing in cleaner energy projects across all its operations with the aim of cutting more than 1.5 million tonnes of CO2 per year from their GHG emissions. This marks a major advance in a journey that has taken Barrick and legacy company Randgold from diesel and
BARRICK FIRST QUARTER 2020 | 4 | PRESS RELEASE |
coal through heavy fuel oil and then to natural gas, hydro electric and solar power.
The group’s second solar power plant is currently being installed at Loulo in Mali. When the 20MW station is commissioned in September this year, it is expected to reduce diesel consumption by 10 million litres and CO2 emissions by 27,000 tonnes per year.
Kibali in the DRC relies mainly on the hydropower generated by its three stations, but in a move to further reduce diesel consumption, a 9MW battery has been installed to provide power surge capacity which is currently supplied by generators. This will reduce the need for thermal powertop-ups at an estimated saving of 4.5 million litres of diesel and 8,000 tonnes of CO2 per year. Despite its remote location, the inclusion of seasonal hydro power allows Kibali to deliver power at an annual average of 10 cents per kWh.
Nevada Gold Mines (NGM) has two power generation facilities in northern Nevada with the TS Power Plant in Dunphy and the Western 102 Power Plant outside of Reno. The TS Power Plant began operations in 2008 and has a capacity of 215MW power generation from its original coal-fired process. The Western 102 Power Plant has a capacity of 115MW, supplying power from natural gas fired generators, and a 1MW Solar Facility.
NGM has embarked on a project to replace the last of its coal-powered stations with natural gas to achieve an estimated
annual CO2 saving of 650,000 tonnes. Permit approval is expected in the fourth quarter of this year. NGM has also started a permitting process for a 200MW solar plant. The 100MW first phase of the project is expected to save 130,000 tonnes of CO2 annually.
“Nevada Gold Mines is committed to providing its operationslow-cost, secure power generation through northeastern Nevada’s power grid now and into the future. The conversion of NGM’s TS Power Plant and the potential for an additional solar power facility illustrates this commitment while reducing the mines’ carbon emissions,” said Greg Walker, executive managing director, NGM.
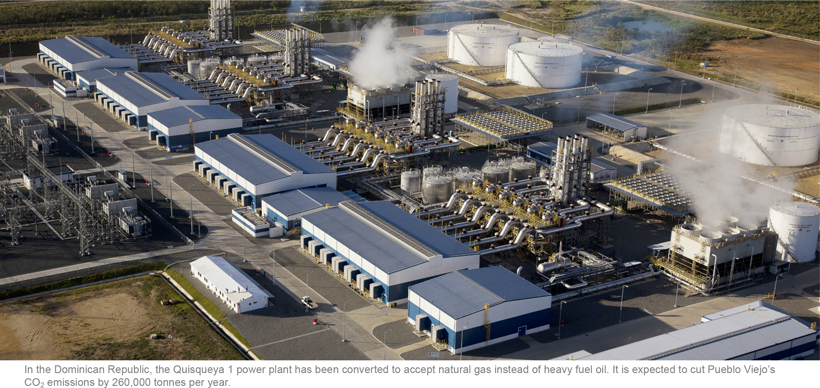
In the Dominican Republic, the Quisqueya 1 power plant has been converted to accept natural gas instead of heavy fuel oil. It is expected to cut Pueblo Viejo’s CO2 emissions by 260,000 tonnes per year.
In Latin America, construction of the 23 kilometre cross-Andes powerline, which will link Veladero in Argentina with the Chilean grid, is underway. Sustainable power from the Chilean grid — which globally has the largest percentage of renewable energy in its supply — will replace 25MW of diesel-fired generation on site. This is expected to save 32 million litres of fuel per year, as well as the considerable cost of trucking it up the Andes, and cut CO2 emissions by 83,000 tonnes.
BARRICK PUBLISHES INDUSTRY-FIRST ESG SCORECARD
Long before ESG became a metric, its principles were embedded in every aspect of Barrick’s and Randgold’s businesses, helping management to make better decisions,de-risk projects, discover new opportunities, maintain a social license and deliver real value to stakeholders.
Following the very comprehensive post-merger Sustainability Report Barrick published last year, this year’s even more detailed report features the mining industry’s first ESG
scorecard. Developed with the assistance of independent sustainability consultants, it rates Barrick’s performance against its peers on social and economic development; health and safety; the environment and human rights; and governance.
Group sustainability executive Grant Beringer says Barrick is committed to transparently measuring and reporting its performance.
BARRICK FIRST QUARTER 2020 | 5 | PRESS RELEASE |
“The 2019 scorecard gave Barrick a B grade, which reflects the improvements in sustainability performance we have made across the group through the year; however, we have not yet met all the high standards we have set for ourselves, and there is still work to be done,” he says.
“We are committed to improving our performance and our grade, and will be tracking our progress on a monthly basis. An updated scorecard will be published at the end of Q2 this year.”
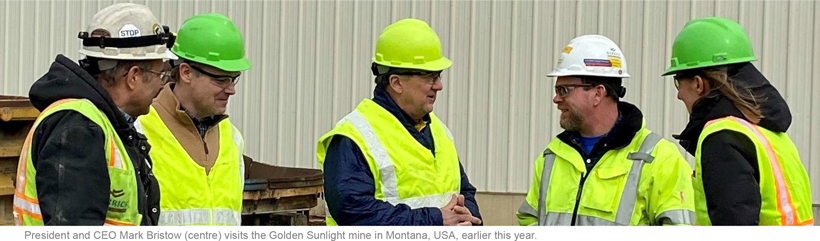
GOLDEN SUNLIGHT CLOSURE SOLUTION SECURES
SULPHIDE FEEDSTOCK FOR NGM
Conventional closure methods would have left Barrick’s Golden Sunlight mine in Montana with the burden of water treatment in perpetuity.
Barrick engineers worked out, however, that the tailings were a significant sulphide resource (as well as containing some gold) that could be used to produce a sulphide concentrate through flotation. This would remove a potential ground water pollutant, minimizing its post-closure water treatment needs and reducing the mine’s overall environmental liability.
In addition, in a uniquewin-win deal, Nevada Gold Mines has agreed to purchase the concentrate from Golden Sunlight. Golden Sunlight will receive a stable long-term price for its concentrate while NGM has secured a new fuel supply (with a gold price upside) for its refractory process plants for at least the next five years.
NEW EXPLORATION DRIVE EXTENDS ASSET BASE,
BRINGS NEXT TIER ONE DISCOVERY CLOSER
Since geology was reinstated as the flywheel of the Barrick engine, the group’s exploration teams have made significant advances in replenishing the company’s
reserves as well as stepping up the search for the next big discovery.
BARRICK FIRST QUARTER 2020 | 6 | PRESS RELEASE |
“As a geology centric organization, we understand that major discoveries are increasingly rare,” says executive VP exploration and growth Rob Krcmarov. “What is required now is a much deeper geological insight at both the orebody and district level.”
During the past quarter, significant advances have been made on three projects. At Turquoise Ridge in Nevada, upgrading the geological understanding has already identified multiple targets, including open-ended mineralization and untested structural intersections in favorable host rock below the mine. In the DRC, new trends that have emerged in the central and northern parts of the Kibali permit have shown the potential for high grade mineralization. In Tanzania, a full relog and remodel of the Gokona/Nyabigena deposit has materially changed the understanding of the controls on mineralization, leading to the identification of multiple open targets with the potential to grow the resources beyond depletion for the foreseeable future.
President and CEO Mark Bristow says in order for Barrick to be a global leader it needs a global presence.
“We’re already on the ground in all of the world’s major gold destinations aside from Russia and East Europe. We’re looking at a future built around our existing big operations in Central, East and West Africa, in Nevada, the world’s most prolific goldfield, in the massively underexplored Dominican Republic, and along the Andean trend. But we’re also looking at new frontiers such as Japan, where we’ve formed an alliance with the holder of the largest exploration portfolio in the country. What’s particularly interesting to us is that while Japan hosts one of the world’s highest-grade gold mines, it has seen no modern exploration,” he says.
REVITALIZED VELADERO POISED FOR NEW FUTURE
The life of the Veladero gold mine in Argentina has been extended to at least 10 years following a comprehensive review of its strategy and business plan, says Barrick president and CEO Mark Bristow.
Bristow was briefing an Argentinian audience of local media, government authorities and local business and community leaders on the mine’s progress from Barrick’s offices in Chile, via a video conference to comply with theCovid-19 related travel restrictions imposed by Argentina.
“Our review included the reinterpretation of the mine’s geology and an ongoing infill drilling campaign. We established exploration and resource management teams to identify satellite orebodies with the potential to deliver an increase in resources and reserves. Our aim is to extend Veladero’s life of mine beyond 2030 and elevate it to a Tier One mine,” he said. Barrick defines a Tier One mine as one that will produce at least 500,000 ounces per annum, has a life of more than
ten years and total cash costs per ounce8 at the lower half of the industry range.
Bristow said the next step in Veladero’s transformation would be to connect the mine to cleaner, cheaper power from the grid in neighboring Chile. Once commissioned in the second half of this year, this could halve the mine’s carbon footprint and potentially reduce itscut-off grade, creating an opportunity to further increase the mineable reserves.
Projects related to revitalizing Veladero, such as the leach pad expansion, have created new employment opportunities, with the number of direct employees and contractors rising by 1,400 to almost 5,000 since January 2019, and the number of local suppliers increasing almost threefold12. In line with Barrick’s local employment policy, 99% of Barrick’s workforce at Veladero are Argentinian.
Since 2005, Veladero has contributed some $9.5 billion to the Argentinian economy through taxes, royalties, salaries and
BARRICK FIRST QUARTER 2020 | 7 | PRESS RELEASE |
payments to local suppliers. The mine has established a new community fund which, depending on production, is expected to generate more than $88 million for local infrastructure development over the next decade.
“Argentina has the potential to rebuild its economy for its people and Veladero can make a significant contribution to
that process. Realizing that potential requires the government and the industry to work together towards long-term goals and to guard against short-term fiscal measures which could destroy this opportunity,” Bristow said.
A PEERLESS RECORD OF STRATEGIC DELIVERY
In the 15 months since the Randgold merger, Barrick’s Strategic Matters Group has driven the historic Nevada Gold Mines joint venture transaction, and the successful sales of Kalgoorlie in Western Australia and the Massawa project in Senegal. It also worked with Barrick’s Africa and Middle East team to secure the Acacia minorities buyout, create a new joint venture with the government of Tanzania and settle all outstanding disputes.
The group is led by senior executive vice-president Kevin Thomson, who describes it as a small team of highly experienced people, based in the Toronto corporate office, with a deep industry knowledge and uniquely specialized, diversified and complementary skillsets that enable it to go well beyond a typical corporate development function.
“It operates on a tightly integrated basis with the rest of the organization, and interacts constantly with Barrick’s technical, exploration, tax, financial and legal teams across the globe, as well as leading banks and law firms,” he says.
“The group has an unparalleled record of success in executing and delivering major strategic initiatives. Among other things, it has achieved some of the highest transaction multiples in the industry through the divestment ofnon-core assets over the past five years.”
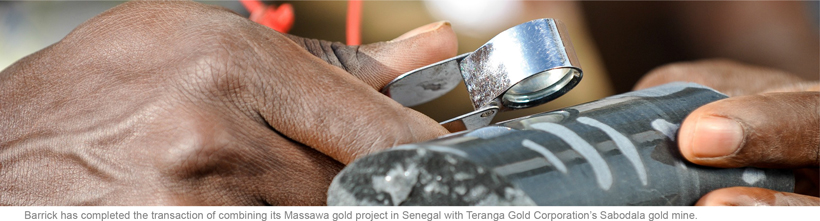
Barrick Completes Massawa Transaction
In line with its strategy of focusing on Tier One assets, Barrick has completed the transaction of combining its Massawa gold project in Senegal with Teranga Gold Corporation’s Sabodala gold mine. Barrick and its Senegalese partner previously held a 90% interest in the Massawa project.
Mark Bristow said Massawa was one of the largest unexploited gold deposits in West Africa and its legacy company, Randgold Resources, had developed this over a period of years to the point where its value could now be optimally realized for the benefit of all its stakeholders which includes the Senegal Government.
“Teranga is best placed to achieve this as it already owns the nearby Sabodala mine and Sabodala’s combination with Massawa is expected to deliver significant synergies. Barrick will participate in the upside of the combined asset through the 11% interest it acquired in Teranga through this transaction,” he said.
BARRICK FIRST QUARTER 2020 | 8 | PRESS RELEASE |
THE LONG GAME WINS
In another first for the gold mining industry, Barrick has published itsten-year plans in its 2019 annual report which appeared in March.
They show that the company’s strong asset foundation will support its targeted production for at least the next ten years through organic growth. Only capital related to our current operating assets, sustaining projects in progress as well as existing exploration and mineral resource management initiatives will be required, which will be funded by cash flows at a $1,200/oz average gold price. The plans will be rolled on an annual basis.
Theten-year mine plans are based on reserves and geologically understood resource extensions. A $1,200/oz long-term gold price is currently used to allocate capital.
President and CEO Mark Bristow says Barrick is making its plans public to provide investor confidence in its sustainability and to demonstrate that it’s the“go-to” gold company for gearing on the high gold price.
“Barrick has been able to make this confident statement of intent thanks to the work we’ve done to strengthen the geology function and introduce mineral resource management across the organization. At the same time, we’ve transferred ownership of and responsibility for the orebodies to the mines. Geological updates are regularly used to update mine plans and real Life of Mine optimization is based on high-confidence geological models as well as operating plans, ounce profiles, and operating and capital cost forecasts,” he says.
“Our long-term strategy prizes quality above quantity, hence its focus on Tier One assets. We define a Tier One mine as one that will produce at least 500,000 ounces per annum, has a life of more than ten years and total cash costs per ounce8 at the lower half of the industry range. The fact that we have six of these mines in our portfolio is the surest guarantor of ourten-year production forecast.”
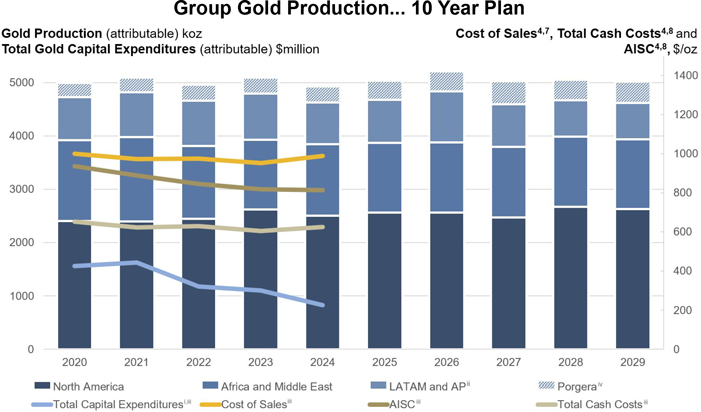
i Gold capital expenditures includes project and sustaining capital expenditures across all gold operations but does not include capital expenditure related to the copper operations.
ii Excludes Porgera.
iii Costs per ounce and total capital expenditures are stated prior to any adjustment related to Porgera.
iv Production attributable to Porgera is based on the assumption that the mine’s current care and maintenance status will be temporary, and that the suspension of operations will not have a significant impact on Barrick’s future production.
Barrick’sten-year gold production profile is based on its current operating asset portfolio, sustaining projects in progress and exploration/mineral resource management initiatives in execution (subject to adjustment based on the outcome of the process with the Government of Papua New Guinea with respect to the Porgera Special Mining Lease extension). Additional asset optimization, further exploration growth, new project initiatives and divestitures are not included. Thisten-year outlook is subject to change and is based on the same assumptions as the current five-year outlook detailed in endnote 25 for the initial five years. The subsequent five years is also subject to change and assumes attributable production from Fourmile (starting in 2028) as well as exploration and mineral resource management projects in execution at Nevada Gold Mines, Hemlo and Porgera.
Barrick is closely monitoring the globalCovid-19 pandemic and Barrick’s guidance may be impacted if the operation or development of our mines and projects is disrupted due to efforts to slow the spread of the virus.
BARRICK FIRST QUARTER 2020 | 9 | PRESS RELEASE |
PUEBLO VIEJO’S EXPANSION TO BOOST DOMINICAN ECONOMY FOR DECADES TO COME
The proposed expansion of the Pueblo Viejo gold mine will extend its life as well as its significant contribution to the Dominican Republic’s economy until 2040 and beyond, says Mark Bristow, president and CEO of operator Barrick.
Speaking to local media and businessmen, Bristow said the project would require an initial investment of $1.3 billion to expand the process plant and the tailings facility14. Extending its life would unlock the mine’s potential to increase exports by $22 billion and generate more than $4 billion in taxes at a gold price of $1,500 per ounce. The mine’s workforce (which is 97% Dominican) is expected to grow as the project develops and it will increase opportunities for women (currently 12% of the workforce). It will also further promote the development of the local economy based on the mine’s suppliers and contractors.
“Our aim is to continue contributing to the social and economic development of the Dominican Republic by applying our sustainability philosophy to create long-term value for all our stakeholders, especially the governments and people of our host countries. Without this project, mining at Pueblo Viejo would have ceased in the next two years,” he said.
The expansion will enable the mine to exploit the lower grades in the orebody and is not intended to process ore from outside the current concession area.
In the meantime, Bristow noted, the conversion of the mine’s Quisqueya 1 power plant to natural gas had successfully been commissioned. This will cut greenhouse gases by an estimated 30% and nitrogen oxide by 85%, further reducing
Pueblo Viejo’s impact on the environment. An agribusiness project is also planned as an additional benefit for the communities impacted by the expansion.
Pueblo Viejo pays another $185 million in taxes, bringing its total cash distribution to the Dominican Government to +$2 billion
In the first four months of 2020, the Pueblo Viejo gold mine paid $185 million in direct taxes and $9 million in indirect taxes to the Dominican Government. These payments include advances of income taxes, net profit interest and royalties on the sales of gold and silver paid in the first quarter of 2020, as well as the final settlement of the 2019 fiscal year.
In an early payment in April to help contribute to the stability of the Dominican economy and aid the country in combating and containing the spread of theCovid-19 pandemic, Pueblo Viejo paid $113 million to the Internal Tax Collector, despite the Dominican Government extending its deadline for certain tax declarations. This brings Pueblo Viejo’s total tax payments to the Government to more than $2 billion since 2013.
Pueblo Viejo’s exports in the first quarter of this year represented 37% of the country’s total exports of national goods, with a value of $399 million of a total of $1,081 million15.
Pueblo Viejo has also committed nearly $1 million in supporting actions to mitigate the impact ofCovid-19 in the Dominican Republic and the communities near its operations.
BARRICK FIRST QUARTER 2020 | 10 | PRESS RELEASE |
MODERNIZING AND STREAMLINING OPERATIONS AT HEMLO
Hemlo has moved to an underground contracting mining model in order to secure the mine’s future viability and to extend its Life of Mine.
Barminco, a leader in modern underground mining skills, won the tender and will be providing contract mining services, with the objective of improving productivity through industry-leading technology and more efficient mining methods at the underground operation.
Barminco’s scope includes undertaking mine development, production and haulage, and utilizing mining equipment
provided by Barrick. The Barminco plan includes employing more than 300 local people at the operation.
Having recognized the importance of changing the way the mine operates and committing to a more modern mining methodology to ensure Hemlo’s future profitability, Barrick, together with contractor Barminco, consulted closely with employees, the Biigtigong Nishnaabeg and Netmizaagamig Nishnaabeg First Nations groups, as well as representatives of the Marathon, Manitouwadge and White River communities, before signing the letter of intent for contract mining services.
BARRICK FIRST QUARTER 2020 | 11 | PRESS RELEASE |
Appendix 1
2020 Operating and Capital Expenditure Guidance
| GOLD PRODUCTION AND COSTS | ||||||||
| 2020 forecast attributable production (000s ozs) | 2020 forecast cost of sales16 ($/oz) | 2020 forecast total cash costs8 ($/oz) | 2020 forecast all-in sustaining costs8 ($/oz) | |||||
Carlin (61.5%)17 | 1,000 - 1,050 | 920 - 970 | 760 - 810 | 1,000 - 1,050 | ||||
Cortez (61.5%) | 450 - 480 | 980 - 1,030 | 640 - 690 | 910 - 960 | ||||
Turquoise Ridge (61.5%) | 430 - 460 | 900 - 950 | 540 - 590 | 690 - 740 | ||||
Phoenix (61.5%) | 100 - 120 | 1,850 - 1,900 | 700 - 750 | 920 - 970 | ||||
Long Canyon (61.5%) | 130 - 150 | 910 - 960 | 240 - 290 | 450 - 500 | ||||
Nevada Gold Mines (61.5%) | 2,100 - 2,250 | 970 - 1,020 | 660 - 710 | 880 - 930 | ||||
Hemlo | 200 - 220 | 960 - 1,010 | 800 - 850 | 1,200 - 1,250 | ||||
North America | 2,300 - 2,450 | 970 - 1,020 | 660 - 710 | 900 - 950 | ||||
Pueblo Viejo (60%) | 530 - 580 | 840 - 890 | 520 - 570 | 720 - 770 | ||||
Veladero (50%) | 240 - 270 | 1,220 - 1,270 | 670 - 720 | 1,250 - 1,300 | ||||
Porgera (47.5%)18 | ||||||||
Latin America & Asia Pacific | 800 - 900 | 930 - 980 | 610 - 660 | 890 - 940 | ||||
Loulo-Gounkoto (80%) | 500 - 540 | 1,050 - 1,100 | 620 - 670 | 970 - 1,020 | ||||
Kibali (45%) | 340 - 370 | 1,030 - 1,080 | 600 - 650 | 790 - 840 | ||||
North Mara (84%)19 | 240 - 270 | 750 - 800 | 570 - 620 | 830 - 880 | ||||
Tongon (89.7%) | 240 - 260 | 1,390 - 1,440 | 680 - 730 | 740 - 790 | ||||
Bulyanhulu (84%)19 | 30 - 50 | 1,210 - 1,260 | 790 - 840 | 1,110 - 1,160 | ||||
Buzwagi (84%)19 | 80 - 100 | 850 - 900 | 820 - 870 | 850 - 900 | ||||
Africa & Middle East | 1,450 - 1,600 | 1,040 - 1,090 | 640 - 690 | 870 - 920 | ||||
Total Attributable to Barrick20,21,22 | 4,600 - 5,000 | 980 - 1,030 | 650 - 700 | 920 - 970 | ||||
| COPPER PRODUCTION AND COSTS | ||||||||
| 2020 forecast attributable production (M lbs) | 2020 forecast cost of sales16 ($/lb) | 2020 forecast C1 cash costs11 ($/lb) | 2020 forecastall-in sustaining costs11 ($/lb) | |||||
Lumwana | 250 - 280 | 2.20 - 2.40 | 1.50 - 1.70 | 2.30 - 2.60 | ||||
Zaldívar (50%) | 120 - 135 | 2.40 - 2.70 | 1.65 -1.85 | 2.30 - 2.60 | ||||
Jabal Sayid (50%) | 60 - 70 | 1.75 - 2.00 | 1.40 -1.60 | 1.50 - 1.70 | ||||
Total Copper | 440 - 500 | 2.10 - 2.40 | 1.50 - 1.80 | 2.20 - 2.50 | ||||
ATTRIBUTABLE CAPITAL EXPENDITURES | ||||
| ($ millions) | ||||
Attributable minesite sustaining | 1,300 - 1,500 | |||
Attributable project | 300 - 400 | |||
Total attributable capital expenditures23 | 1,600 - 1,900 | |||
2020 Outlook Assumptions and Economic Sensitivity Analysis
| 2020 Guidance Assumption | Hypothetical Change | Impact on EBITDA (millions)24 | Impact on AISC8,11 | |||||
Gold revenue, net of royalties13 | $1,350/oz | +/- $100/oz | +/- $339 | +/- $3/oz | ||||
Copper revenue, net of royalties | $2.75/lb | +/- $0.50/lb | +/- $169 | +/- $0.02/lb | ||||
BARRICK FIRST QUARTER 2020 | 12 | PRESS RELEASE |
Appendix 2
Production and Cost Summary - Gold
| For the three months ended | ||||||||||||||||||||
| 3/31/20 | 12/31/19 | % Change | 3/31/19 | % Change | ||||||||||||||||
Nevada Gold Mines LLC (61.5%)a | ||||||||||||||||||||
Gold produced (000s oz attributable basis) | 526 | 585 | (10)% | 572 | (8)% | |||||||||||||||
Gold produced (000s oz 100% basis) | 855 | 951 | (10)% | 598 | 43 % | |||||||||||||||
Cost of sales ($/oz) | 995 | 1,038 | (4)% | 780 | 28 % | |||||||||||||||
Total cash costs ($/oz)b | 690 | 711 | (3)% | 542 | 27 % | |||||||||||||||
All-in sustaining costs ($/oz)b | 952 | 944 | 1 % | 678 | 40 % | |||||||||||||||
Carlin (61.5%)c | ||||||||||||||||||||
Gold produced (000s oz attributable basis) | 253 | 276 | (8)% | 233 | 9 % | |||||||||||||||
Gold produced (000s oz 100% basis) | 411 | 449 | (8)% | 233 | 76 % | |||||||||||||||
Cost of sales ($/oz) | 970 | 975 | (1)% | 947 | 2 % | |||||||||||||||
Total cash costs ($/oz)b | 776 | 766 | 1 % | 671 | 16 % | |||||||||||||||
All-in sustaining costs ($/oz)b | 1,007 | 965 | 4 % | 891 | 13 % | |||||||||||||||
Cortez (61.5%)d | ||||||||||||||||||||
Gold produced (000s oz attributable basis) | 128 | 133 | (4)% | 262 | (51)% | |||||||||||||||
Gold produced (000s oz 100% basis) | 208 | 216 | (4)% | 262 | (21)% | |||||||||||||||
Cost of sales ($/oz) | 876 | 945 | (7)% | 682 | 28 % | |||||||||||||||
Total cash costs ($/oz)b | 614 | 681 | (10)% | 433 | 42 % | |||||||||||||||
All-in sustaining costs ($/oz)b | 1,009 | 1,012 | 0 % | 506 | 99 % | |||||||||||||||
Turquoise Ridge (61.5%)e | ||||||||||||||||||||
Gold produced (000s oz attributable basis) | 84 | 111 | (24)% | 77 | 9 % | |||||||||||||||
Gold produced (000s oz 100% basis)
| 137 | 181 | (24)% | 103 | 33 % | |||||||||||||||
Cost of sales ($/oz) | 1,032 | 971 | 6 % | 592 | 74 % | |||||||||||||||
Total cash costs ($/oz)b | 668 | 625 | 7 % | 506 | 32 % | |||||||||||||||
All-in sustaining costs ($/oz)b | 806 | 800 | 1 % | 592 | 36 % | |||||||||||||||
Phoenix (61.5%)f | ||||||||||||||||||||
Gold produced (000s oz attributable basis) | 35 | 31 | 13 % | |||||||||||||||||
Gold produced (000s oz 100% basis) | 57 | 50 | 13 % | |||||||||||||||||
Cost of sales ($/oz) | 1,583 | 2,025 | (22)% | |||||||||||||||||
Total cash costs ($/oz)b | 737 | 902 | (18)% | |||||||||||||||||
All-in sustaining costs ($/oz)b | 914 | 1,034 | (12)% | |||||||||||||||||
Long Canyon (61.5%)f | ||||||||||||||||||||
Gold produced (000s oz attributable basis) | 26 | 34 | (24)% | |||||||||||||||||
Gold produced (000s oz 100% basis) | 42 | 55 | (24)% | |||||||||||||||||
Cost of sales ($/oz) | 1,025 | 1,026 | 0 % | |||||||||||||||||
Total cash costs ($/oz)b | 345 | 317 | 9 % | |||||||||||||||||
All-in sustaining costs ($/oz)b | 561 | 657 | (15)% | |||||||||||||||||
Pueblo Viejo (60%) | ||||||||||||||||||||
Gold produced (000s oz attributable basis) | 143 | 179 | (20)% | 148 | (3)% | |||||||||||||||
Gold produced (000s oz 100% basis) | 238 | 298 | (20)% | 247 | (3)% | |||||||||||||||
Cost of sales ($/oz) | 767 | 660 | 16 % | 696 | 10 % | |||||||||||||||
Total cash costs ($/oz)b | 502 | 422 | 19 % | 421 | 19 % | |||||||||||||||
All-in sustaining costs ($/oz)b | 626 | 517 | 21 % | 543 | 15 % | |||||||||||||||
BARRICK FIRST QUARTER 2020 | 13 | PRESS RELEASE |
Production and Cost Summary - Gold (continued)
| For the three months ended | ||||||||||||||||||||
| 3/31/20 | 12/31/19 | % Change | 3/31/19 | % Change | ||||||||||||||||
Loulo-Gounkoto (80%) | ||||||||||||||||||||
Gold produced (000s oz attributable basis) | 141 | 144 | (2)% | 128 | 10 % | |||||||||||||||
Gold produced (000s oz 100% basis) | 177 | 180 | (2)% | 160 | 10 % | |||||||||||||||
Cost of sales ($/oz) | 1,002 | 1,037 | (3)% | 1,052 | (5)% | |||||||||||||||
Total cash costs ($/oz)b | 614 | 631 | (3)% | 684 | (10)% | |||||||||||||||
All-in sustaining costs ($/oz)b | 891 | 917 | (3)% | 840 | 6 % | |||||||||||||||
Kibali (45%) | ||||||||||||||||||||
Gold produced (000s oz attributable basis) | 91 | 87 | 5 % | 93 | (2)% | |||||||||||||||
Gold produced (000s oz 100% basis) | 201 | 193 | 5 % | 207 | (2)% | |||||||||||||||
Cost of sales ($/oz) | 1,045 | 1,205 | (13)% | 1,202 | (13)% | |||||||||||||||
Total cash costs ($/oz)b | 582 | 608 | (4)% | 573 | 2 % | |||||||||||||||
All-in sustaining costs ($/oz)b | 773 | 740 | 4 % | 673 | 15 % | |||||||||||||||
Veladero (50%) | ||||||||||||||||||||
Gold produced (000s oz attributable basis) | 75 | 71 | 6 % | 70 | 7 % | |||||||||||||||
Gold produced (000s oz 100% basis) | 150 | 142 | 6 % | 140 | 7 % | |||||||||||||||
Cost of sales ($/oz) | 1,182 | 1,138 | 4 % | 1,195 | (1)% | |||||||||||||||
Total cash costs ($/oz)b | 788 | 710 | 11 % | 713 | 11 % | |||||||||||||||
All-in sustaining costs ($/oz)b | 1,266 | 1,142 | 11 % | 1,100 | 15 % | |||||||||||||||
Porgera (47.5%) | ||||||||||||||||||||
Gold produced (000s oz attributable basis) | 62 | 82 | (24)% | 66 | (6)% | |||||||||||||||
Gold produced (000s oz 100% basis) | 131 | 172 | (24)% | 139 | (6)% | |||||||||||||||
Cost of sales ($/oz) | 1,097 | 909 | 21 % | 1,031 | 6 % | |||||||||||||||
Total cash costs ($/oz)b | 941 | 757 | 24 % | 854 | 10 % | |||||||||||||||
All-in sustaining costs ($/oz)b | 1,089 | 894 | 22 % | 978 | 11 % | |||||||||||||||
Tongon (89.7%) | ||||||||||||||||||||
Gold produced (000s oz attributable basis) | 61 | 61 | 0 % | 61 | 0 % | |||||||||||||||
Gold produced (000s oz 100% basis) | 68 | 68 | 0 % | 68 | 0 % | |||||||||||||||
Cost of sales ($/oz) | 1,368 | 1,476 | (7)% | 1,451 | (6)% | |||||||||||||||
Total cash costs ($/oz)b | 762 | 803 | (5)% | 799 | (5)% | |||||||||||||||
All-in sustaining costs ($/oz)b | 788 | 867 | (9)% | 836 | (6)% | |||||||||||||||
Hemlo | ||||||||||||||||||||
Gold produced (000s oz) | 57 | 54 | 6 % | 55 | 4 % | |||||||||||||||
Cost of sales ($/oz) | 1,119 | 1,632 | (31)% | 906 | 24 % | |||||||||||||||
Total cash costs ($/oz)b | 945 | 1,091 | (13)% | 769 | 23 % | |||||||||||||||
All-in sustaining costs ($/oz)b | 1,281 | 1,380 | (7)% | 915 | 40 % | |||||||||||||||
North Marag | ||||||||||||||||||||
Gold produced (000s oz attributable basis) | 65 | 103 | (37)% | 42 | 55 % | |||||||||||||||
Gold produced (000s oz 100% basis) | 77 | 103 | (25)% | 66 | 17 % | |||||||||||||||
Cost of sales ($/oz) | 959 | 1,021 | (6)% | 1,064 | (10)% | |||||||||||||||
Total cash costs ($/oz)b | 646 | 675 | (4)% | 755 | (14)% | |||||||||||||||
All-in sustaining costs ($/oz)b | 816 | 830 | (2)% | 944 | (14)% | |||||||||||||||
Buzwagig | ||||||||||||||||||||
Gold produced (000s oz attributable basis) | 22 | 28 | (21)% | 18 | 22 % | |||||||||||||||
Gold produced (000s oz 100% basis) | 27 | 28 | (4)% | 28 | (4)% | |||||||||||||||
Cost of sales ($/oz) | 1,373 | 1,235 | 11 % | 1,243 | 10 % | |||||||||||||||
Total cash costs ($/oz)b | 1,275 | 1,144 | 11 % | 1,164 | 10 % | |||||||||||||||
All-in sustaining costs ($/oz)b | 1,288 | 1,169 | 10 % | 1,228 | 5 % | |||||||||||||||
BARRICK FIRST QUARTER 2020 | 14 | PRESS RELEASE |
Production and Cost Summary - Gold (continued)
| For the three months ended | ||||||||||||||||||||
| 3/31/20 | 12/31/19 | % Change | 3/31/19 | % Change | ||||||||||||||||
Bulyanhulug | ||||||||||||||||||||
Gold produced (000s oz attributable basis) | 7 | 9 | (22)% | 6 | 17 % | |||||||||||||||
Gold produced (000s oz 100% basis) | 9 | 9 | 0 % | 9 | 0 % | |||||||||||||||
Cost of sales ($/oz) | 1,685 | 1,293 | 30 % | 1,008 | 67 % | |||||||||||||||
Total cash costs ($/oz)b | 686 | 752 | (9)% | 622 | 10 % | |||||||||||||||
All-in sustaining costs ($/oz)b | 906 | 909 | 0 % | 757 | 20 % | |||||||||||||||
Kalgoorlie (50%)h | ||||||||||||||||||||
Gold produced (000s oz attributable basis) | 36 | (100)% | 55 | (100)% | ||||||||||||||||
Gold produced (000s oz 100% basis) | 72 | (100)% | 110 | (100)% | ||||||||||||||||
Cost of sales ($/oz) | 1,127 | (100)% | 1,064 | (100)% | ||||||||||||||||
Total cash costs ($/oz)b | 940 | (100)% | 870 | (100)% | ||||||||||||||||
All-in sustaining costs ($/oz)b | 1,172 | (100)% | 1,185 | (100)% | ||||||||||||||||
Total Attributable to Barricki | ||||||||||||||||||||
Gold produced (000s oz) | 1,250 | 1,439 | (13)% | 1,367 | (9)% | |||||||||||||||
Cost of sales ($/oz)j | 1,020 | 1,046 | (2)% | 947 | 8 % | |||||||||||||||
Total cash costs ($/oz)b | 692 | 692 | 0 % | 631 | 10 % | |||||||||||||||
All-in sustaining costs ($/oz)b | 954 | 923 | 3 % | 825 | 16 % | |||||||||||||||
| a. | Represents the combined results of Cortez, Goldstrike (including our 60% share of South Arturo) and our 75% interest in Turquoise Ridge until June 30, 2019. Commencing July 1, 2019, the date Nevada Gold Mines was established, the results represent our 61.5% interest in Cortez, Carlin (including Goldstrike and 60% of South Arturo), Turquoise Ridge (including Twin Creeks), Phoenix and Long Canyon. |
| b. | These arenon-GAAP financial performance measures with no standardized meaning under IFRS and therefore may not be comparable to similar measures presented by other issuers. For further information and a detailed reconciliation of eachnon-GAAP measure used to the most directly comparable IFRS measure, please see pages 79 to 95 of our first quarter MD&A. |
| c. | On July 1, 2019, Barrick’s Goldstrike and Newmont’s Carlin were contributed to Nevada Gold Mines and are now referred to as Carlin. As a result, the amounts presented represent Goldstrike on a 100% basis (including our 60% share of South Arturo) up until June 30, 2019, and the combined results of Carlin and Goldstrike (including NGM’s 60% share of South Arturo) on a 61.5% basis thereafter. |
| d. | On July 1, 2019, Cortez was contributed to Nevada Gold Mines, a joint venture with Newmont. As a result, the amounts presented are on an 100% basis up until June 30, 2019, and on a 61.5% basis thereafter. |
| e. | Barrick owned 75% of Turquoise Ridge through the end of the second quarter of 2019, with our joint venture partner, Newmont, owning the remaining 25%. Turquoise Ridge was proportionately consolidated on the basis that the joint venture partners that have joint control have rights to the assets and obligations for the liabilities relating to the arrangement. The figures presented in this table are based on our 75% interest in Turquoise Ridge until June 30, 2019. On July 1, 2019, Barrick’s 75% interest in Turquoise Ridge and Newmont’s Twin Creeks and 25% interest in Turquoise Ridge were contributed to Nevada Gold Mines. Starting July 1, 2019, the results represent our 61.5% share of Turquoise Ridge and Twin Creeks, now referred to as Turquoise Ridge. |
| f. | A 61.5% interest in these sites was acquired as a result of the formation of Nevada Gold Mines on July 1, 2019. |
| g. | Formerly known as Acacia Mining plc. On September 17, 2019, Barrick acquired all of the shares of Acacia it did not own. Operating results are included at 100% from October 1, 2019 to December 31, 2019 (notwithstanding the completion of the Acacia transaction on September 17, 2019, we consolidated our interest in Acacia and recorded anon-controlling interest of 36.1% in the income statement for the entirety of the third quarter of 2019 as a matter of convenience), and on an 84% basis thereafter as the GoT’s 16% free-carried interest was made effective from January 1, 2020. |
| h. | On November 28, 2019, we completed the sale of our 50% interest in Kalgoorlie in Western Australia to Saracen Mineral Holdings Limited for total cash consideration of $750 million. Accordingly, these represent our 50% interest until November 28, 2019. |
| i. | Excludes Pierina; Lagunas Norte starting in the fourth quarter of 2019; and Golden Sunlight and Morila (40%) starting in the third quarter of 2019 which are mining incidental ounces as it enters closure. |
| j. | Cost of sales per ounce (Barrick’s share) is calculated as cost of sales - gold on an attributable basis (excluding sites in care and maintenance) divided by gold equity ounces sold. |
BARRICK FIRST QUARTER 2020 | 15 | PRESS RELEASE |
Production and Cost Summary - Copper
| For the three months ended | ||||||||||||||||||||
| 3/31/20 | 12/31/19 | % Change | 3/31/19 | % Change | ||||||||||||||||
Lumwana | ||||||||||||||||||||
Copper production (millions lbs) | 64 | 63 | 2 % | 61 | 5 % | |||||||||||||||
Cost of sales ($/lb) | 1.94 | 2.22 | (13)% | 2.16 | (10)% | |||||||||||||||
C1 cash costs ($/lb)a | 1.63 | 2.10 | (22)% | 1.67 | (2)% | |||||||||||||||
All-in sustaining costs ($/lb)a | 2.26 | 3.41 | (34)% | 2.79 | (19)% | |||||||||||||||
Zaldívar (50%) | ||||||||||||||||||||
Copper production (millions lbs attributable basis) | 31 | 36 | (14)% | 28 | 11 % | |||||||||||||||
Copper production (millions lbs 100% basis) | 62 | 72 | (14)% | 56 | 11 % | |||||||||||||||
Cost of sales ($/lb) | 2.39 | 2.59 | (8)% | 2.68 | (11)% | |||||||||||||||
C1 cash costs ($/lb)a | 1.71 | 1.95 | (12)% | 1.91 | (10)% | |||||||||||||||
All-in sustaining costs ($/lb)a | 1.99 | 2.56 | (22)% | 2.12 | (6)% | |||||||||||||||
Jabal Sayid (50%) | ||||||||||||||||||||
Copper production (millions lbs attributable basis) | 20 | 18 | 11 % | 17 | 18 % | |||||||||||||||
Copper production (millions lbs 100% basis) | 40 | 36 | 11 % | 34 | 18 % | |||||||||||||||
Cost of sales ($/lb) | 1.28 | 1.47 | (13)% | 1.55 | (17)% | |||||||||||||||
C1 cash costs ($/lb)a | 0.97 | 1.29 | (25)% | 1.10 | (12)% | |||||||||||||||
All-in sustaining costs ($/lb)a | 1.11 | 1.78 | (38)% | 1.30 | (15)% | |||||||||||||||
Total Copper | ||||||||||||||||||||
Copper production (millions lbs attributable basis) | 115 | 117 | (2)% | 106 | 8 % | |||||||||||||||
Cost of sales ($/lb)b | 1.96 | 2.26 | (13)% | 2.21 | (11)% | |||||||||||||||
C1 cash costs ($/lb)a | 1.55 | 1.90 | (18)% | 1.66 | (7)% | |||||||||||||||
All-in sustaining costs ($/lb)a | 2.04 | 2.82 | (28)% | 2.46 | (17)% | |||||||||||||||
| a. | These arenon-GAAP financial performance measures with no standardized meaning under IFRS and therefore may not be comparable to similar measures presented by other issuers. For further information and a detailed reconciliation of eachnon-GAAP measure used to the most directly comparable IFRS measure, please see pages 79 to 95 of our first quarter MD&A. |
| b. | Cost of sales per pound (Barrick’s share) is calculated as cost of sales - copper plus our equity share of cost of sales attributable to Zaldívar and Jabal Sayid divided by copper pounds sold. |
BARRICK FIRST QUARTER 2020 | 16 | PRESS RELEASE |
Technical Information
The scientific and technical information contained in this press release has been reviewed and approved by Steven Yopps, MMSA, Director - Metallurgy, North America; Craig Fiddes, Manager of Growth Projects, Nevada Gold Mines; Chad Yuhasz, P.Geo, Mineral Resource Manager, Latin America and Australia Pacific; Simon Bottoms, CGeol, MGeol, FGS, FAusIMM, Mineral Resources Manager: Africa and Middle East; Rodney Quick, MSc, Pr. Sci.Nat, Mineral Resource Management and Evaluation Executive; John Steele, CIM, Metallurgy, Engineering and Capital Projects Executive; and Rob Krcmarov, FAusIMM, Executive Vice President, Exploration and Growth — each a “Qualified Person” as defined in National Instrument43-101 -Standards of Disclosure for Mineral Projects.
All mineral reserve and mineral resource estimates are estimated in accordance with National Instrument43-101 -Standards of Disclosure for Mineral Projects. Unless otherwise noted, such mineral reserve and mineral resource estimates are as of December 31, 2019.
Endnotes
Endnote 1
“Free cash flow” is anon-GAAP financial performance measure which deducts capital expenditures from net cash provided by operating activities. Barrick believes this to be a useful indicator of our ability to operate without reliance on additional borrowing or usage of existing cash. Free cash flow is intended to provide additional information only and does not have any standardized meaning under IFRS and may not be comparable to similar measures of performance presented by other companies. Free cash flow should not be considered in isolation or as a substitute for measures of performance prepared in accordance with IFRS. Further details on thisnon-GAAP measure are provided in the MD&A accompanying Barrick’s financial statements filed from time to time on SEDAR at www.sedar.com and on EDGAR at www.sec.gov.
Reconciliation of Net Cash Provided by Operating Activities to Free Cash Flow
| ($ millions) | For the three months ended | |||||||||||
| 3/31/20 | 12/31/19 | 3/31/19 | ||||||||||
Net cash provided by operating activities | 889 | 875 | 520 | |||||||||
Capital expenditures | (451 | ) | (446 | ) | (374 | ) | ||||||
Free cash flow | 438 | 429 | 146 | |||||||||
Endnote 2
“Adjusted net earnings” and “adjusted net earnings per share” arenon-GAAP financial performance measures. Adjusted net earnings excludes the following from net earnings: certain impairment charges (reversals) related to intangibles, goodwill, property, plant and equipment, and investments; gains (losses) and otherone-time costs relating to acquisitions or dispositions; foreign currency translation gains (losses); significant tax adjustments not related to current period earnings; unrealized gains (losses) onnon-hedge derivative instruments; and the tax effect andnon-controlling interest of these items. The Company uses this measure internally to evaluate our underlying operating performance for the reporting periods presented and to assist with the planning and forecasting of future operating results. Barrick believes that adjusted net earnings is a useful measure of our performance because these adjusting items do not reflect the underlying operating performance of our core mining business and are not necessarily indicative of future operating results. Adjusted net earnings and adjusted net earnings per share are intended to provide additional information only and do not have any standardized meaning under IFRS and may not be comparable to similar measures of performance presented by other companies. They should not be considered in isolation or as a substitute for measures of performance prepared in accordance with IFRS. Further details on thesenon-GAAP measures are provided in the MD&A accompanying Barrick’s financial statements filed from time to time on SEDAR at www.sedar.com and on EDGAR at www.sec.gov.
Reconciliation of Net Earnings to Net Earnings per Share, Adjusted Net Earnings and Adjusted Net Earnings per Share
| ($ millions, except per share amounts in dollars) | For the three months ended | |||||||||||
| 3/31/20 | 12/31/19 | 3/31/19 | ||||||||||
Net earnings (loss) attributable to equity holders of the Company | 400 | 1,387 | 111 | |||||||||
Impairment charges (reversals) related to intangibles, goodwill, property, plant and equipment, and investmentsa | (336 | ) | (566 | ) | 3 | |||||||
Acquisition/disposition (gains) lossesb | (60 | ) | (414 | ) | 0 | |||||||
(Gain) loss on currency translation | 16 | 53 | 22 | |||||||||
Significant tax adjustmentsc | (44 | ) | 74 | 8 | ||||||||
Other expense adjustmentsd | 98 | (845 | ) | 46 | ||||||||
Tax effect andnon-controlling intereste | 211 | 611 | (6 | ) | ||||||||
Adjusted net earnings | 285 | 300 | 184 | |||||||||
BARRICK FIRST QUARTER 2020 | 17 | PRESS RELEASE |
Net earnings per sharef | 0.22 | 0.78 | 0.06 | |||||||||
Adjusted net earnings per sharef | 0.16 | 0.17 | 0.11 |
| a. | Net impairment reversals for the three month period ended March 31, 2020 primarily relate tonon-current asset reversals at Bulyanhulu, offset by losses at Buzwagi and North Mara. For the three month period ended December 31, 2019, net impairment reversals primarily relate tonon-current asset impairments at Pueblo Viejo, partially offset by impairment charges at Pascua-Lama. |
| b. | Acquisition/disposition gains for the three month period ended March 31, 2020 primarily relate to the gain on the sale of Massawa. For the three month period ended December 31, 2019, acquisition/disposition gains mainly relate to the gain on the sale of our 50% interest in Kalgoorlie. |
| c. | Significant tax adjustments for the three month period ended March 31, 2020 primarily relate to deferred tax recoveries as a result of tax reform measures in Argentina and adjustments made in recognition of the net settlement of all outstanding disputes with the Government of Tanzania. Refer to Note 10 to the Financial Statements for more information. |
| d. | Other expense adjustments for the three month period ended March 31, 2020 primarily relate to the impact of changes in the discount rate assumptions on our closed mine rehabilitation provision and losses on debt extinguishment. For the three month period ended December 31, 2019, other expense adjustments primarily relate to the gain on thede-recognition of the deferred revenue liability relating to our silver sale agreement with Wheaton Precious Metals Corp. and the gain on a settlement of customs duty and indirect taxes at Lumwana. |
| e. | Tax effect andnon-controlling interest for the three month periods ended March 31, 2020 and December 31, 2019 primarily relates to the net impairment reversals related to long-lived assets. |
| f. | Calculated using weighted average number of shares outstanding under the basic method of earnings per share. |
Endnote 3
“Realized price” is anon-GAAP financial measure which excludes from sales: unrealized gains and losses onnon-hedge derivative contracts; unrealizedmark-to-market gains and losses on provisional pricing from copper and gold sales contracts; sales attributable to ore purchase arrangements; treatment and refining charges; export duties; and cumulativecatch-up adjustments to revenue relating to our streaming arrangements. This measure is intended to enable Management to better understand the price realized in each reporting period for gold and copper sales because unrealizedmark-to-market values ofnon-hedge gold and copper derivatives are subject to change each period due to changes in market factors such as market and forward gold and copper prices, so that prices ultimately realized may differ from those recorded. The exclusion of such unrealizedmark-to-market gains and losses from the presentation of this performance measure enables investors to understand performance based on the realized proceeds of selling gold and copper production. The realized price measure is intended to provide additional information and does not have any standardized definition under IFRS and should not be considered in isolation or as a substitute for measures of performance prepared in accordance with IFRS. Further details on thesenon-GAAP measures are provided in the MD&A accompanying Barrick’s financial statements filed from time to time on SEDAR at www.sedar.com and on EDGAR at www.sec.gov.
Reconciliation of Sales to Realized Price per ounce/pound
| ($ millions, except per ounce/pound information in dollars) | Gold | Copper | ||||||||||||||||||||||
| For the three months ended | ||||||||||||||||||||||||
| 3/31/20 | 12/31/19 | 3/31/19 | 3/31/20 | 12/31/19 | 3/31/19 | |||||||||||||||||||
Sales | 2,593 | 2,758 | 1,906 | 99 | 82 | 163 | ||||||||||||||||||
Sales applicable tonon-controlling interests | (770 | ) | (769 | ) | (224 | ) | 0 | 0 | 0 | |||||||||||||||
Sales applicable to equity method investmentsa,b | 147 | 139 | 129 | 107 | 147 | 121 | ||||||||||||||||||
Realizednon-hedge gold/copper derivative (losses) gains | 0 | 0 | 0 | 0 | 0 | 0 | ||||||||||||||||||
Sales applicable to sites in care and maintenancec | (46 | ) | (56 | ) | (26 | ) | 0 | 0 | 0 | |||||||||||||||
Treatment and refinement charges | 0 | 0 | 0 | 39 | 25 | 31 | ||||||||||||||||||
Otherd | 15 | 22 | 0 | 0 | 0 | 0 | ||||||||||||||||||
Revenues – as adjusted | 1,939 | 2,094 | 1,785 | 245 | 254 | 315 | ||||||||||||||||||
Ounces/pounds sold (000s ounces/millions pounds)c | 1,220 | 1,413 | 1,365 | 110 | 91 | 103 | ||||||||||||||||||
Realized gold/copper price per ounce/pounde | 1,589 | 1,483 | 1,307 | 2.23 | 2.76 | 3.07 | ||||||||||||||||||
| a. | Represents sales of $140 million for the three month periods ended March 31, 2020 (December 31, 2019: $130 million and March 31, 2019: $117 million) applicable to our 45% equity method investment in Kibali and $nil (December 31, 2019: $9 million and March 31, 2019: $12 million) applicable to our 40% equity method investment in Morila for gold. Represents sales of $72 million for the three months ended March 31, 2020 (December 31, 2019: $110 million and March 31, 2019: $81 million) applicable to our 50% equity method investment in Zaldívar and $40 million (December 31, 2019: $43 million and March 31, 2019: $44 million) applicable to our 50% equity method investment in Jabal Sayid for copper. |
| b. | Sales applicable to equity method investments are net of treatment and refinement charges. |
| c. | Figures exclude Pierina; Golden Sunlight and Morila starting in the third quarter of 2019; and Lagunas Norte starting in the fourth quarter of 2019, from the calculation of realized price per ounce as the mine is mining incidental ounces as it enters closure. |
| d. | Represents cumulativecatch-up adjustment to revenue relating to our streaming arrangements. Refer to note 2f of the 2019 Annual Financial Statements for more information. |
| e. | Realized price per ounce/pound may not calculate based on amounts presented in this table due to rounding. |
Endnote 4
Includes North Mara, Bulyanhulu and Buzwagi on a 84% basis starting January 1, 2020 (and on a 63.9% basis from January 1, 2019 to September 30, 2019; notwithstanding the completion of the Acacia transaction on September 17, 2019, we consolidated our interest in Acacia and recorded anon-controlling interest of 36.1% in the income statement for the entirety of the third quarter of 2019 as a matter of convenience, and on a 100% basis from October 1, 2019 to December 31, 2019), Pueblo Viejo on a 60% basis, South Arturo
BARRICK FIRST QUARTER 2020 | 18 | PRESS RELEASE |
on a 36.9% basis from July 1, 2019 onwards as a result of its contribution to Nevada Gold Mines (and on a 60% basis from January 1, 2019 to June 30, 2019), Veladero on a 50% basis, Loulo-Gounkoto on an 80% basis, Kibali on a 45% basis, Tongon on an 89.7% basis, and Morila on a 40% basis until the second quarter of 2019, which reflects our equity share of production and sales. Also removes thenon-controlling interest of 38.5% Nevada Gold Mines from July 1, 2019 onwards.
Endnote 5
Net earnings (loss) represents net earnings (loss) attributable to the equity holders of the Company.
Endnote 6
These amounts are presented on the same basis as our guidance and include our 60% share of Pueblo Viejo, 80% share of Loulo-Gounkoto, 89.7% share of Tongon, 45% share of Kibali, 40% share of Morila and 60% share of South Arturo (36.9% of South Arturo from July 1, 2019 onwards as a result of its contribution to Nevada Gold Mines), our 84% share of Tanzania starting January 1, 2020 (63.9% share from January 1, 2019 to September 30, 2019; notwithstanding the completion of the Acacia transaction on September 17, 2019, we consolidated our interest in Acacia and recorded anon-controlling interest of 36.1% in the income statement for the entirety of the third quarter of 2019 as a matter of convenience, and 100% share from October 1, 2019 to December 31, 2019) and our 50% share of Zaldívar and Jabal Sayid. Starting July 1, 2019, it also includes our 61.5% share of Nevada Gold Mines.
Endnote 7
Gold cost of sales (Barrick’s share) is calculated as cost of sales—gold on an attributable basis (excluding sites in care and maintenance) divided by ounces sold.
Endnote 8
“Total cash costs” per ounce,“All-in sustaining costs” per ounce and“All-in costs” per ounce arenon-GAAP financial performance measures. “Total cash costs” per ounce starts with cost of sales related to gold production but removes depreciation, the noncontrolling interest of cost of sales, and includes by product credits.“All-in sustaining costs” per ounce begin with “Total cash costs” per ounce and add further costs which reflect the expenditures made to maintain current production levels, primarily sustaining capital expenditures, sustaining leases, general & administrative costs, minesite exploration and evaluation costs, and reclamation cost accretion and amortization.“All-in costs” per ounce starts with“All-in sustaining costs” per ounce and adds additional costs that reflect the varying costs of producing gold over the life-cycle of a mine, including: project capital expenditures and other nonsustaining costs. Barrick believes that the use of “total cash costs” per ounce,“all-in sustaining costs” per ounce and“All-in costs” per ounce will assist investors, analysts and other stakeholders in understanding the costs associated with producing gold, understanding the economics of gold mining, assessing our operating performance and also our ability to generate free cash flow from current operations and to generate free cash flow on an overall Company basis. “Total cash costs” per ounce,“All-in sustaining costs” per ounce and“All-in costs” per ounce are intended to provide additional information only and do not have any standardized meaning under IFRS. Although a standardized definition ofall-in sustaining costs was published in 2013 by the World Gold Council (a market development organization for the gold industry comprised of and funded by 25 gold mining companies from around the world, including Barrick), it is not a regulatory organization, and other companies may calculate this measure differently. Starting from the first quarter of 2019, we have renamed “cash costs” to “total cash costs” when referring to our gold operations. The calculation of total cash costs is identical to our previous calculation of cash costs with only a change in the naming convention of thisnon-GAAP measure. These measures should not be considered in isolation or as a substitute for measures prepared in accordance with IFRS. Further details on thesenon-GAAP measures are provided in the MD&A accompanying Barrick’s financial statements filed from time to time on SEDAR at www.sedar.com and on EDGAR at www.sec.gov.
Reconciliation of Gold Cost of Sales to Total cash costs,All-in sustaining costs andAll-in costs, including on a per ounce basis
| ($ millions, except per ounce information in dollars) | For the three months ended | |||||||||||||||
| Footnote | 3/31/20 | 12/31/19 | 3/31/19 | |||||||||||||
Cost of sales applicable to gold production | 1,643 | 1,896 | 1,350 | |||||||||||||
Depreciation | (474 | ) | (549 | ) | (384 | ) | ||||||||||
Cash cost of sales applicable to equity method investments | 52 | 57 | 62 | |||||||||||||
By-product credits | (29 | ) | (43 | ) | (24 | ) | ||||||||||
Realized (gains) losses on hedge andnon-hedge derivatives | a | 0 | 1 | 0 | ||||||||||||
Non-recurring items | b | 0 | (22 | ) | (20 | ) | ||||||||||
Other | c | (27 | ) | (37 | ) | (20 | ) | |||||||||
Non-controlling interests | d | (316 | ) | (326 | ) | (101 | ) | |||||||||
Total cash costs | 849 | 977 | 863 | |||||||||||||
General & administrative costs | 40 | 31 | 54 | |||||||||||||
Minesite exploration and evaluation costs | e | 15 | 24 | 11 | ||||||||||||
Minesite sustaining capital expenditures | f | 370 | 394 | 253 | ||||||||||||
BARRICK FIRST QUARTER 2020 | 19 | PRESS RELEASE |
Sustaining leases | 0 | 4 | 10 | |||||||||||
Rehabilitation - accretion and amortization (operating sites) | g | 14 | 7 | 14 | ||||||||||
Non-controlling interest, copper operations and other | h | (125 | ) | (135 | ) | (75 | ) | |||||||
All-in sustaining costs | 1,163 | 1,302 | 1,130 | |||||||||||
Project exploration and evaluation and project costs | e | 56 | 60 | 63 | ||||||||||
Community relations costs not related to current operations | 1 | 0 | 1 | |||||||||||
Project capital expenditures | f | 76 | 46 | 120 | ||||||||||
Rehabilitation - accretion and amortization(non-operating sites) | g | 2 | 3 | 7 | ||||||||||
Non-controlling interest and copper operations and other | h | (33 | ) | (28 | ) | (3 | ) | |||||||
All-in costs | 1,265 | 1,383 | 1,318 | |||||||||||
Ounces sold - equity basis (000s ounces) | i | 1,220 | 1,413 | 1,365 | ||||||||||
Cost of sales per ounce | j,k | 1,020 | 1,046 | 947 | ||||||||||
Total cash costs per ounce | k | 692 | 692 | 631 | ||||||||||
Total cash costs per ounce (on aco-product basis) | k,l | 705 | 712 | 644 | ||||||||||
All-in sustaining costs per ounce | k | 954 | 923 | 825 | ||||||||||
All-in sustaining costs per ounce (on aco-product basis) | k,l | 967 | 943 | 838 | ||||||||||
All-in costs per ounce | k | 1,035 | 976 | 964 | ||||||||||
All-in costs per ounce (on aco-product basis) | k,l | 1,048 | 996 | 977 | ||||||||||
| a. | Realized (gains) losses on hedge andnon-hedge derivatives |
Includes realized hedge losses of $nil for the three month periods ended March 31, 2020 (December 31, 2019: $nil and March 31, 2019: $nil), and realizednon-hedge losses of $nil for the three month periods ended March 31, 2020 (December 31, 2019: $1 million and March 31, 2019: $nil). Refer to note 5 to the Financial Statements for further information.
| b. | Non-recurring items |
Non-recurring items in 2019 relate to organizational restructuring. These costs are not indicative of our cost of production and have been excluded from the calculation of total cash costs.
| c. | Other |
Other adjustments for the three month period ended March 31, 2020 include the removal of total cash costs andby-product credits associated with our Pierina mine; Golden Sunlight and Morila starting in the third quarter of 2019; and Lagunas Norte starting in the fourth quarter of 2019, which all are mining incidental ounces as they enter closure of $25 million (December 31, 2019: $35 million; March 31, 2019: $18 million relating to Pierina only).
| d. | Non-controlling interests |
Non-controlling interests includenon-controlling interests related to gold production of $466 million for the three month periods ended March 31, 2020 (December 31, 2019: $477 million and March 31, 2019: $152 million).Non-controlling interests include Pueblo Viejo, Loulo-Gounkoto, Tongon, North Mara, Bulyanhulu, Buzwagi (notwithstanding the completion of the Acacia transaction on September 17, 2019, we consolidated our interest in Acacia and recorded anon-controlling interest of 36.1% in the income statement for the entirety of the third quarter of 2019 as a matter of convenience) and Nevada Gold Mines starting July 1, 2019. Refer to note 5 to the Financial Statements for further information.
| e. | Exploration and evaluation costs |
Exploration, evaluation and project expenses are presented as minesite sustaining if it supports current mine operations and project if it relates to future projects. Refer to page 72 of this MD&A.
| f. | Capital expenditures |
Capital expenditures are related to our gold sites only and are split between minesite sustaining and project capital expenditures. Project capital expenditures are distinct projects designed to increase the net present value of the mine and are not related to current production. Significant projects in the current year are stripping at Rangefront declines, the Goldrush exploration declines, and construction of the third shaft at Turquoise Ridge. Refer to page 71 of this MD&A.
| g. | Rehabilitation - accretion and amortization |
Includes depreciation on the assets related to rehabilitation provisions of our gold operations and accretion on the rehabilitation provision of our gold operations, split between operating andnon-operating sites.
| h. | Non-controlling interest and copper operations |
Removes general & administrative costs related tonon-controlling interests and copper based on a percentage allocation of revenue. Also removes exploration, evaluation and project expenses, rehabilitation costs and capital expenditures incurred by our copper sites and thenon-controlling interest of North Mara, Bulyanhulu and Buzwagi (notwithstanding the completion of the Acacia transaction on September 17, 2019, we consolidated our interest in Acacia and recorded anon-controlling interest of 36.1% in the income statement for the entirety of the third quarter of 2019 as a matter of convenience), Pueblo Viejo, Loulo-Gounkoto and Tongon operating segments and South Arturo (63.1% of South Arturo from July 1, 2019 onwards as a result of its contribution to Nevada Gold Mines). Also removes thenon-controlling interest of Nevada Gold Mines starting July 1, 2019. It also includes capital expenditures applicable to equity method investments. Figures remove the impact of Pierina; Golden Sunlight and Morila starting in the third quarter of 2019; and Lagunas Norte starting in the fourth quarter of 2019.
The impact is summarized as the following:
| ($ millions) | For the three months ended | |||||||||||
| Non-controlling interest, copper operations and other | 3/31/20 | 12/31/19 | 3/31/19 | |||||||||
General & administrative costs | (6 | ) | (3 | ) | (10 | ) | ||||||
Minesite exploration and evaluation expenses | (3 | ) | (6 | ) | (1 | ) | ||||||
Rehabilitation - accretion and amortization (operating sites) | (4 | ) | (1 | ) | (1 | ) | ||||||
Minesite sustaining capital expenditures | (112 | ) | (125 | ) | (63 | ) | ||||||
All-in sustaining costs total | (125 | ) | (135 | ) | (75 | ) | ||||||
Project exploration and evaluation and project costs | (19 | ) | (14 | ) | (2 | ) | ||||||
Project capital expenditures | (14 | ) | (14 | ) | (1 | ) | ||||||
BARRICK FIRST QUARTER 2020 | 20 | PRESS RELEASE |
All-in costs total | (33 | ) | (28 | ) | (3 | ) |
| i. | Ounces sold - equity basis |
Figures remove the impact of Pierina; Golden Sunlight and Morila starting in the third quarter of 2019; and Lagunas Norte starting in the fourth quarter of 2019, which are mining incidental ounces as the sites enter closure.
| j. | Cost of sales per ounce |
Figures remove the cost of sales impact of Pierina of $6 million for the three month periods ended March 31, 2020 (December 31, 2019: $14 million and March 31, 2019: $27 million); starting in the third quarter of 2019, Golden Sunlight of $nil for the three month periods ended March 31, 2020 (December 31, 2019: $nil and March 31, 2019: $nil) and Morila of $6 million for the three month periods ended March 31, 2020 (December 31, 2019: $13 million and March 31, 2019: $nil); and starting in the fourth quarter of 2019, Lagunas Norte of $21 million for the three month periods ended March 31, 2020 (December 31, 2019: $26 million and March 31, 2019: $nil), which are mining incidental ounces as these sites enter closure. Cost of sales per ounce excludesnon-controlling interest related to gold production. Cost of sales applicable to gold per ounce is calculated using cost of sales on an attributable basis (removing thenon-controlling interest of 40% Pueblo Viejo, 20% of Loulo-Gounkoto, 10.3% of Tongon, 16% North Mara, Bulyanhulu and Buzwagi starting January 1, 2020, the effective date of the GoT’s free carried interest (36.1% up until September 30, 2019; notwithstanding the completion of the Acacia transaction on September 17, 2019, we consolidated our interest in Acacia and recorded anon-controlling interest of 36.1% in the income statement for the entirety of the third quarter of 2019 as a matter of convenience) and 40% South Arturo from cost of sales (63.1% of South Arturo from July 1, 2019 onwards as a result of its contribution to Nevada Gold Mines)), divided by attributable gold ounces. Thenon-controlling interest of 38.5% Nevada Gold Mines is also removed from cost of sales from July 1, 2019 onwards.
| k. | Per ounce figures |
Cost of sales per ounce, total cash costs per ounce,all-in sustaining costs per ounce andall-in costs per ounce may not calculate based on amounts presented in this table due to rounding.
| l. | Co-product costs per ounce |
Total cash costs per ounce,all-in sustaining costs per ounce andall-in costs per ounce presented on aco-product basis removes the impact ofby-product credits of our gold production (net ofnon-controlling interest) calculated as:
| ($ millions) | For the three months ended | |||||||||||
| 3/31/20 | 12/31/19 | 3/31/19 | ||||||||||
By-product credits | 29 | 43 | 24 | |||||||||
Non-controlling interest | (15 | ) | (17 | ) | (8 | ) | ||||||
By-product credits (net ofnon-controlling interest) | 14 | 26 | 16 | |||||||||
Endnote 9
Amounts reflect production and sales from Jabal Sayid and Zaldívar on a 50% basis, which reflects our equity share of production, and Lumwana.
Endnote 10
Copper cost of sales (Barrick’s share) is calculated as cost of sales - copper plus our equity share of cost of sales attributable to Zaldívar and Jabal Sayid divided by pounds sold.
Endnote 11
"C1 cash costs" per pound and“All-in sustaining costs” per pound arenon-GAAP financial performance measures. “C1 cash costs” per pound is based on cost of sales but excludes the impact of depreciation and royalties and production taxes and includes treatment and refinement charges.“All-in sustaining costs” per pound begins with “C1 cash costs” per pound and adds further costs which reflect the additional costs of operating a mine, primarily sustaining capital expenditures, general & administrative costs and royalties and production taxes. Barrick believes that the use of “C1 cash costs” per pound and“all-in sustaining costs” per pound will assist investors, analysts, and other stakeholders in understanding the costs associated with producing copper, understanding the economics of copper mining, assessing our operating performance, and also our ability to generate free cash flow from current operations and to generate free cash flow on an overall Company basis. “C1 cash costs” per pound and“All-in sustaining costs” per pound are intended to provide additional information only, do not have any standardized meaning under IFRS, and may not be comparable to similar measures of performance presented by other companies. These measures should not be considered in isolation or as a substitute for measures of performance prepared in accordance with IFRS. Further details on thesenon-GAAP measures are provided in the MD&A accompanying Barrick’s financial statements filed from time to time on SEDAR at www.sedar.com and on EDGAR at www.sec.gov.
Reconciliation of Copper Cost of Sales to C1 cash costs andAll-in sustaining costs, including on a per pound basis
| ($ millions, except per pound information in dollars) | For the three months ended | |||||||||||
| 3/31/20 | 12/31/19 | 3/31/19 | ||||||||||
Cost of sales | 124 | 80 | 131 | |||||||||
Depreciation/amortization | (43 | ) | (17 | ) | (42 | ) | ||||||
Treatment and refinement charges | 39 | 25 | 31 | |||||||||
Cash cost of sales applicable to equity method investments | 66 | 94 | 66 | |||||||||
Less: royalties and production taxesa | (11 | ) | (9 | ) | (12 | ) | ||||||
By-product credits | (3 | ) | (1 | ) | (3 | ) | ||||||
C1 cash cost of sales | 172 | 172 | 171 | |||||||||
General & administrative costs | 3 | 3 | 5 | |||||||||
Rehabilitation - accretion and amortization | 3 | 7 | 3 | |||||||||
Royalties and production taxesa | 11 | 9 | 12 | |||||||||
BARRICK FIRST QUARTER 2020 | 21 | PRESS RELEASE |
Minesite exploration and evaluation costs | 1 | 2 | 2 | |||||||||
Minesite sustaining capital expenditures | 32 | 60 | 59 | |||||||||
Sustaining leases | 3 | 3 | 1 | |||||||||
All-in sustaining costs | 225 | 256 | 253 | |||||||||
Pounds sold - consolidated basis (millions pounds) | 110 | 91 | 103 | |||||||||
Cost of sales per poundb,c | 1.96 | 2.26 | 2.21 | |||||||||
C1 cash cost per poundb | 1.55 | 1.90 | 1.66 | |||||||||
All-in sustaining costs per poundb | 2.04 | 2.82 | 2.46 | |||||||||
| a. | For the three month period ended March 31, 2020, royalties and production taxes include royalties of $11 million (December 31, 2019: $8 million and March 31, 2019: $12 million). |
| b. | Cost of sales per pound, C1 cash costs per pound andall-in sustaining costs per pound may not calculate based on amounts presented in this table due to rounding. |
| c. | Cost of sales applicable to copper per pound is calculated using cost of sales including our proportionate share of cost of sales attributable to equity method investments (Zaldívar and Jabal Sayid), divided by consolidated copper pounds (including our proportionate share of copper pounds from our equity method investments). |
Endnote 12
The number of local suppliers participating in Veladero’s supply chain tendering processes has increased by 279%, as reported by the San Juan Chamber of Mining Services.
Endnote 13
Due to our hedging activities, which are reflected in these sensitivities, we are partially protected against changes in these factors.
Endnote 14
On a 100% basis. For additional detail regarding Pueblo Viejo, see the Technical Report on the Pueblo Viejo mine, Sanchez Ramirez Province, Dominican Republic, dated March 19, 2018, and filed on SEDAR at www.sedar.com and EDGAR at www.sec.gov on March 23, 2018.
Endnote 15
According to the March export report issued by the Export and Investment Center of the Dominican Republic(CEI-RD, in Spanish).
Endnote 16
Cost of sales applicable to gold per ounce is calculated using cost of sales applicable to gold on an attributable basis (removing thenon-controlling interest of 38.5% of Nevada Gold Mines (including 63.1% of South Arturo), 40% Pueblo Viejo, 20% of Loulo-Gounkoto, 10.3% of Tongon, and 16% of North Mara, Bulyanhulu and Buzwagi from cost of sales and including our proportionate share of cost of sales attributable to our equity method investments in Kibali and Morila), divided by attributable gold ounces sold. Cost of sales applicable to copper per pound is calculated using cost of sales applicable to copper including our proportionate share of cost of sales attributable to our equity method investments in Zaldívar and Jabal Sayid, divided by consolidated copper pounds sold (including our proportionate share of copper pounds sold from our equity method investments).
Endnote 17
Includes our 36.9% share of South Arturo.
Endnote 18
Based on the communication we received from the Government of Papua New Guinea that the SML will not be extended, Porgera was placed on temporary care and maintenance on April 25, 2020 to ensure the safety and security of our employees and communities. Due to the uncertainty related to the timing and scope of future developments on the mine’s operating outlook, our full year 2020 guidance for Porgera has been withdrawn.
Endnote 19
Amounts are on an 84% basis as the GoT’s 16% free-carried interest was made effective from January 1, 2020.
Endnote 20
Total cash costs andall-in sustaining costs per ounce include the impact of hedges and/or costs allocated tonon-operating sites.
Endnote 21
Operating unit guidance ranges reflect expectations at each individual operating unit, and may not add up to the company-wide guidance range total. Guidance ranges exclude Pierina, Lagunas Norte, Golden Sunlight and Morila (40%) which are mining incidental ounces as it enters closure.
Endnote 22
Includes corporate administration costs.
Endnote 23
BARRICK FIRST QUARTER 2020 | 22 | PRESS RELEASE |
2020 Guidance includes our 61.5% share of Nevada Gold Mines, our 60% share of Pueblo Viejo, our 80% share of Loulo-Gounkoto, our 89.7% share of Tongon, our 84% share of North Mara, Bulyanhulu and Buzwagi, our 50% share of Zaldívar and Jabal Sayid, and our 45% of Kibali, and our share of joint operations.
Endnote 24
EBITDA is anon-GAAP financial measure, which excludes the following from net earnings: income tax expense; finance costs; finance income; and depreciation. Management believes that EBITDA is a valuable indicator of our ability to generate liquidity by producing operating cash flow to fund working capital needs, service debt obligations, and fund capital expenditures. Management uses EBITDA for this purpose. Adjusted EBITDA removes the effect of impairment charges; acquisition/disposition gains/losses; foreign currency translation gains/losses; other expense adjustments; unrealized gains onnon-hedge derivative instruments; and the impact of the income tax expense, finance costs, finance income and depreciation incurred in our equity method accounted investments. We believe these items provide a greater level of consistency with the adjusting items included in our Adjusted Net Earnings reconciliation, with the exception that these amounts are adjusted to remove any impact on finance costs/income, income tax expense and/or depreciation as they do not affect EBITDA. We believe this additional information will assist analysts, investors and other stakeholders of Barrick in better understanding our ability to generate liquidity from our full business, including equity method investments, by excluding these amounts from the calculation as they are not indicative of the performance of our core mining business and not necessarily reflective of the underlying operating results for the periods presented. EBITDA and adjusted EBITDA are intended to provide additional information only and do not have any standardized meaning under IFRS and may not be comparable to similar measures of performance presented by other companies. They should not be considered in isolation or as a substitute for measures of performance prepared in accordance with IFRS. Further details on thesenon-GAAP measures are provided in the MD&A accompanying Barrick’s financial statements filed from time to time on SEDAR at www.sedar.com and on EDGAR at www.sec.gov.
Reconciliation of Net Earnings to EBITDA and Adjusted EBITDA
| ($ millions) | For the three months ended | |||||||||||
| 3/31/20 | 12/31/19 | 3/31/19 | ||||||||||
Net earnings (loss) | 663 | 1,776 | 140 | |||||||||
Income tax expense | 386 | 784 | 167 | |||||||||
Finance costs, neta | 88 | 90 | 100 | |||||||||
Depreciation | 524 | 572 | 435 | |||||||||
EBITDA | 1,661 | 3,222 | 842 | |||||||||
Impairment charges (reversals) of long-lived assetsb | (336 | ) | (566 | ) | 3 | |||||||
Acquisition/disposition (gains) lossesc | (60 | ) | (414 | ) | 0 | |||||||
Loss on currency translation | 16 | 53 | 22 | |||||||||
Other expense (income) adjustmentsd | 98 | (845 | ) | 46 | ||||||||
Income tax expense, net finance costs, and depreciation from equity investees | 87 | 112 | 89 | |||||||||
Adjusted EBITDA | 1,467 | 1,562 | 1,002 | |||||||||
| a. | Finance costs exclude accretion. |
| b. | Net impairment reversals for the three month period ended March 31, 2020 primarily relate tonon-current asset reversals at Bulyanhulu, offset by losses at Buzwagi and North Mara. For the three month period ended December 31, 2019, net impairment reversals primarily relate tonon-current asset impairments at Pueblo Viejo, partially offset by impairment charges at Pascua-Lama. |
| c. | Acquisition/disposition gains for the three month period ended March 31, 2020 primarily relate to the gain on the sale of Massawa. For the three month period ended December 31, 2019, acquisition/disposition gains mainly relate to the gain on the sale of our 50% interest in Kalgoorlie. |
| d. | Other expense adjustments for the three month period ended March 31, 2020 primarily relate to the impact of changes in the discount rate assumptions on our closed mine rehabilitation provision and losses on debt extinguishment. For the three month period ended December 31, 2019, other expense adjustments primarily relate to the gain on thede-recognition of the deferred revenue liability relating to our silver sale agreement with Wheaton Precious Metals Corp. and the gain on a settlement of customs duty and indirect taxes at Lumwana. |
Endnote 25
| ||||||||||
| Key Assumptions | 2020 | 2021+ | ||||||||
Gold Price ($/oz) | 1,350 | 1,200 | ||||||||
Copper Price ($/lb) | 2.75 | 2.75 | ||||||||
Oil Price (WTI) ($/barrel) | 65 | 65 | ||||||||
AUD Exchange Rate (AUD:USD) | 0.70 | 0.75 | ||||||||
ARS Exchange Rate (USD:ARS) | 65.00 | 75.00 | ||||||||
CAD Exchange Rate (USD:CAD) | 1.30 | 1.30 | ||||||||
CLP Exchange Rate (USD:CLP) | 725 | 680 | ||||||||
EUR Exchange Rate (EUR:USD) | 1.20 | 1.20 | ||||||||
Barrick’s five-year indicative outlook is based on our current operating asset portfolio, sustaining projects in progress and exploration/ mineral resource management initiatives in execution. Additional asset optimization, further exploration growth, new project initiatives
BARRICK FIRST QUARTER 2020 | 23 | PRESS RELEASE |
and divestitures are not included. For the group gold and copper segments, and where applicable for a specific region, this indicative outlook is subject to change and assumes the following:
| • | The inclusion of synergies identified for Nevada Gold Mines; |
| • | Production from Cortez Deep South by 2020,in-line with guidance; |
| • | Productionramping-up from the third shaft at Turquoise Ridge by 2022,in-line with guidance; |
| • | Production from Goldrush commencing in 2021,in-line with guidance; |
| • | Production from the proposed Pueblo Viejo plant expansion and tailings project by 2023,in-line with guidance. Our assumptions are subject to change following the combined feasibility study for the plant expansion and tailings project; |
| • | An 84% ownership interest in North Mara, Bulyanhulu and Buzwagi. At this time, we assume that Buzwagi will enter care and maintenance in 2021; |
| • | A restart of mining operations at Bulyanhulu by the end of 2020; |
| • | Tongon will enter care and maintenance during the 2022 year; |
| • | A sale of stockpiled concentrate related to the Tanzania assets and Lumwana by the end of 2020; |
| • | Production from the Zaldívar CuproChlor® Chloride Leach Project by 2022. Antofagasta is the operator of Zaldívar. |
| • | Production attributable to Porgera is based on the assumption that the mine’s current care and maintenance status will be temporary, and that the suspension of operations will not have a significant impact on Barrick’s future production. |
This five-year indicative outlook excludes:
| • | Production from Fourmile; |
| • | Production from assets currently in care and maintenance including Pierina, Lagunas Norte, Morila and Golden Sunlight; |
| • | Production from long-term greenfield optionality from Donlin, Pascua-Lama, Norte Abierto or Alturas. |
Barrick’sten-year gold production profile is also based on its current operating asset portfolio, sustaining projects in progress and exploration/mineral resource management initiatives in execution. Additional asset optimization, further exploration growth, new project initiatives and divestitures are not included. Thisten-year outlook is subject to change and is based on the same assumptions as the current five-year outlook detailed above for the initial five years. The subsequent five years is also subject to change and assumes attributable production from Fourmile (starting in 2028) as well as exploration and mineral resource management projects in execution at Nevada Gold Mines, Hemlo and Porgera.
BARRICK FIRST QUARTER 2020 | 24 | PRESS RELEASE |
| Corporate Office | Enquiries | |||
| Barrick Gold Corporation | President and CEO | |||
161 Bay Street, Suite 3700 | Mark Bristow | |||
Toronto, Ontario M5J 2S1 | +1 647 205 7694 | |||
Canada | +44 788 071 1386 | |||
| Senior EVP and CFO | ||||
Telephone: +1 416861-9911 | Graham Shuttleworth | |||
Email: investor@barrick.com | +1 647 262 2095 | |||
Website: www.barrick.com | +44 779 771 1338 | |||
+44 1534 735 333 | ||||
| Shares Listed | Investor and Media Relations | |||
Kathy du Plessis | ||||
| GOLD | The New York Stock Exchange | +44 20 7557 7738 | ||
| ABX | The Toronto Stock Exchange | Email: barrick@dpapr.com | ||
| Transfer Agents and Registrars | ||||
| AST Trust Company (Canada) | ||||
P.O. Box 700, Postal Station B | ||||
Montreal, Quebec H3B 3K3 | ||||
or | ||||
| American Stock Transfer & Trust Company, LLC | ||||
6201 – 15 Avenue | ||||
Brooklyn, New York 11219 | ||||
Telephone:1-800-387-0825 | ||||
Fax:1-888-249-6189 | ||||
Email: inquiries@astfinancial.com | ||||
Website: www.astfinancial.com | ||||
Cautionary Statement on Forward-Looking Information
Certain information contained or incorporated by reference in this press release, including any information as to our strategy, projects, plans or future financial or operating performance, constitutes “forward-looking statements”. All statements, other than statements of historical fact, are forward-looking statements. The words “deliver”, “points to”, “plan”, “progresses”, “upside”, “opportunities”, “objective”, “expected”, “potential”, “strategy”, “will”, “proposed”, “aim”, “continues” and similar expressions identify forward-looking statements. In particular, this press release contains forward-looking statements including, without limitation, with respect to: Barrick’s forward-looking production guidance and estimates of future costs; cash flow forecasts; projected capital, operating and exploration expenditures, including with respect to Barrick’s10-year production profile; Barrick’s engagement with local communities to manage theCovid-19 pandemic; Barrick’s response to the government of Papua New Guinea’s decision not to extend Porgera’s Special Mining Lease; the duration of the temporary suspension of operations at Porgera; potential mineralization, and potential discoveries of new Tier One mines; potential extensions to life of mine, including at Veladero; potential exploration targets and mineral resource potential, including reserve
replenishment; opportunities to deliver value for Barrick’s owners and stakeholders; Barrick’s energy and sustainability strategies, including potential reductions to Barrick’s carbon footprint and costs and improvements in Barrick’s sustainability performance including the timing of Barrick’s updated ESG scorecard; future investments in community projects and contributions to local economies; expected benefits of the proposed closure solution at Golden Sunlight; and expectations regarding future price assumptions, financial performance and other outlook or guidance.
Forward-looking statements are necessarily based upon a number of estimates and assumptions including material estimates and assumptions related to the factors set forth below that, while considered reasonable by the Company as at the date of this press release in light of management’s experience and perception of current conditions and expected developments, are inherently subject to significant business, economic and competitive uncertainties and contingencies. Known and unknown factors could cause actual results to differ materially from those projected in the forward-looking statements and undue reliance should not be placed on such statements and information. Such factors include, but are not
limited to: fluctuations in the spot and forward price of gold, copper or certain other commodities (such as silver, diesel fuel, natural gas and electricity); the speculative nature of mineral exploration and development; changes in mineral production performance, exploitation and exploration successes; risks associated with projects in the early stages of evaluation and for which additional engineering and other analysis is required; the benefits expected from recent transactions being realized, including Nevada Gold Mines; diminishing quantities or grades of reserves; increased costs, delays, suspensions and technical challenges associated with the construction of capital projects; operating or technical difficulties in connection with mining or development activities, including geotechnical challenges and disruptions in the maintenance or provision of required infrastructure and information technology systems; failure to comply with environmental and health and safety laws and regulations;non-renewal of key licenses by governmental authorities, includingnon-renewal of Porgera’s Special Mining Lease; timing of receipt of, or failure to comply with, necessary permits and approvals; uncertainty whether some or all of Barrick’s targeted investments and projects will meet the Company’s capital allocation objectives and internal hurdle rate; the impact of global liquidity and credit availability on the timing of cash flows and the values of assets and liabilities based on projected future cash flows; adverse changes in our credit ratings; the impact of inflation; fluctuations in the currency markets; changes in U.S. dollar interest rates; risks arising from holding derivative instruments; changes in national and local government legislation, taxation, controls or regulations and/or changes in the administration of laws, policies and practices, expropriation or nationalization of property and political or economic developments in Canada, the United States and other jurisdictions in which the Company or its affiliates do or may carry on business in the future; lack of certainty with respect to foreign legal systems, corruption and other factors that are inconsistent with the rule of law; risks associated with illegal and artisanal mining; risks associated with new diseases, epidemics and pandemics, including the effects and potential effects of the globalCovid-19 pandemic; disruption of supply routes which may cause delays in construction and mining activities; damage to the Company’s reputation due to the actual or perceived occurrence of any number of events, including negative publicity with respect to the Company’s handling of environmental matters or dealings with community groups, whether true or not; the possibility that future exploration results will not be consistent with the Company’s expectations; risks that exploration data may be incomplete and considerable additional work may be required to complete further evaluation, including but not limited to drilling, engineering and socioeconomic studies and investment; risk of loss due to acts of war, terrorism, sabotage and civil disturbances; litigation and legal and administrative proceedings; contests over title to properties, particularly title to undeveloped properties, or over access to water, power and other required infrastructure; business opportunities that may be presented to, or pursued by, the Company; our ability to successfully integrate acquisitions or complete divestitures, including our ability to successfully reintegrate Acacia’s operations; risks associated with working with partners in jointly controlled assets; employee relations including loss of key employees; increased costs and physical risks, including extreme weather events and resource shortages, related to climate change; and availability and increased costs
associated with mining inputs and labor. Barrick also cautions that its 2020 guidance and five and ten year plan may be impacted by the unprecedented business and social disruption caused by the spread ofCovid-19. In addition, there are risks and hazards associated with the business of mineral exploration, development and mining, including environmental hazards, industrial accidents, unusual or unexpected formations, pressures,cave-ins, flooding and gold bullion, copper cathode or gold or copper concentrate losses (and the risk of inadequate insurance, or inability to obtain insurance, to cover these risks).
Many of these uncertainties and contingencies can affect our actual results and could cause actual results to differ materially from those expressed or implied in any forward-looking statements made by, or on behalf of, us. Readers are cautioned that forward-looking statements are not guarantees of future performance. All of the forward-looking statements made in this press release are qualified by these cautionary statements. Specific reference is made to the most recent Form40-F/Annual Information Form on file with the SEC and Canadian provincial securities regulatory authorities for a more detailed discussion of some of the factors underlying forward-looking statements and the risks that may affect Barrick’s ability to achieve the expectations set forth in the forward-looking statements contained in this press release. We disclaim any intention or obligation to update or revise any forward-looking statements whether as a result of new information, future events or otherwise, except as required by applicable law.