MANAGEMENT’S DISCUSSION AND ANALYSIS (“MD&A”)
QUARTERLY REPORT ON THE FIRST QUARTER OF 2020
This portion of the Quarterly Report provides management’s discussion and analysis (“MD&A”) of the financial condition and results of operations, to enable a reader to assess material changes in financial condition and results of operations as at, and for the three month periods ended March 31, 2020, in comparison to the corresponding prior year periods. The MD&A is intended to help the reader understand Barrick Gold Corporation (“Barrick”, “we”, “our” or the “Company”), our operations, financial performance and present and future business environment. This MD&A, which has been prepared as of May 5, 2020, is intended to supplement and complement the condensed unaudited interim consolidated financial statements and notes thereto, prepared in accordance with International Accounting Standard 34 Interim Financial Reporting (“IAS 34”) as issued by the International Accounting Standards Board (“IASB”), for the three month periods ended March 31, 2020 (collectively, the “Financial Statements”), which are included in this Quarterly Report on pages 101 to 115. You are encouraged to review the Financial Statements in conjunction with your review of this MD&A. This MD&A should be read in conjunction with both the annual audited consolidated financial statements for the two years ended December 31, 2019, the
related annual MD&A included in the 2019 Annual Report, and the most recent Form 40–F/Annual Information Form on file with the U.S. Securities and Exchange Commission (“SEC”) and Canadian provincial securities regulatory authorities. These documents and additional information relating to the Company are available on SEDAR at www.sedar.com and EDGAR at www.sec.gov. Certain notes to the Financial Statements are specifically referred to in this MD&A and such notes are incorporated by reference herein. All dollar amounts in this MD&A are in millions of United States dollars (“$” or “US$”), unless otherwise specified.
For the purposes of preparing our MD&A, we consider the materiality of information. Information is considered material if: (i) such information results in, or would reasonably be expected to result in, a significant change in the market price or value of our shares; or (ii) there is a substantial likelihood that a reasonable investor would consider it important in making an investment decision; or (iii) it would significantly alter the total mix of information available to investors. We evaluate materiality with reference to all relevant circumstances, including potential market sensitivity.
CAUTIONARY STATEMENT ON FORWARD-LOOKING INFORMATION
Certain information contained or incorporated by reference in this MD&A, including any information as to our strategy, projects, plans or future financial or operating performance, constitutes “forward-looking statements”. All statements, other than statements of historical fact, are forward-looking statements. The words “believe”, “expect”, “anticipate”, “target”, “plan”, “objective”, “assume”, “intend”, “project”, “pursue”, “goal”, “continue”, “budget”, “estimate”, “potential”, “may”, “will”, “can”, “could”, “would”, “should” and similar expressions identify forward-looking statements. In particular, this MD&A contains forward-looking statements including, without limitation, with respect to: Barrick’s forward-looking production guidance; estimates of future cost of sales per ounce for gold and per pound for copper, total cash costs per ounce and C1 cash costs per pound, andall-in-sustaining costs per ounce/pound; cash flow forecasts; projected capital, operating and exploration expenditures; mine life and production rates; Barrick’s engagement with local communities to manage theCovid-19 pandemic; estimated timing for construction of, and production from, new projects, including the Goldrush twin exploration declines; timing of completion of a final feasibility study for Goldrush and approval of the plan of operations; the potential for plant expansion at Pueblo Viejo to increase throughput; potential benefits of the chloride leach project at Zaldívar and the power transmission project at Veladero; the new partnership between Barrick and the Government of Tanzania (“GoT”) and the agreement to resolve all outstanding disputes between Acacia and the GoT; Barrick and Barrick Niugini Limited’s (“BNL”) response to the government of Papua New Guinea’s decision not to extend Porgera’s special mining lease and to the Internal Revenue Commission’s proposed tax adjustments; the duration of the temporary suspension of operations at Porgera; our pipeline of high confidence projects
at or near existing operations; potential mineralization and metal or mineral recoveries; our ability to convert resources into reserves; asset sales, joint ventures and partnerships; Barrick’s strategy and plans in respect of environmental and social governance issues; and expectations regarding future price assumptions, financial performance and other outlook or guidance.
Forward-looking statements are necessarily based upon a number of estimates and assumptions including material estimates and assumptions related to the factors set forth below that, while considered reasonable by the Company as at the date of this MD&A in light of management’s experience and perception of current conditions and expected developments, are inherently subject to significant business, economic and competitive uncertainties and contingencies. Known and unknown factors could cause actual results to differ materially from those projected in the forward-looking statements and undue reliance should not be placed on such statements and information. Such factors include, but are not limited to: fluctuations in the spot and forward price of gold, copper or certain other commodities (such as silver, diesel fuel, natural gas and electricity); the speculative nature of mineral exploration and development; changes in mineral production performance, exploitation and exploration successes; risks associated with projects in the early stages of evaluation and for which additional engineering and other analysis is required; the benefits expected from recent transactions being realized, including Nevada Gold Mines; diminishing quantities or grades of reserves; increased costs, delays, suspensions and technical challenges associated with the construction of capital projects; operating or technical difficulties in connection with mining or development activities, including geotechnical challenges and disruptions in the
| BARRICK FIRST QUARTER 2020 | 25 | MANAGEMENT’S DISCUSSION AND ANALYSIS |
maintenance or provision of required infrastructure and information technology systems; failure to comply with environmental and health and safety laws and regulations;non-renewal of key licenses by governmental authorities, includingnon-renewal of Porgera’s Special Mining Lease; timing of receipt of, or failure to comply with, necessary permits and approvals; uncertainty whether some or all of Barrick’s targeted investments and projects will meet the Company’s capital allocation objectives and internal hurdle rate; the impact of global liquidity and credit availability on the timing of cash flows and the values of assets and liabilities based on projected future cash flows; adverse changes in our credit ratings; the impact of inflation; fluctuations in the currency markets; changes in U.S. dollar interest rates; risks arising from holding derivative instruments; changes in national and local government legislation, taxation, controls or regulations and/or changes in the administration of laws, policies and practices, expropriation or nationalization of property and political or economic developments in Canada, the United States and other jurisdictions in which the Company or its affiliates do or may carry on business in the future; lack of certainty with respect to foreign legal systems, corruption and other factors that are inconsistent with the rule of law; risks associated with illegal and artisanal mining; risks associated with new diseases, epidemics and pandemics, including the effects and potential effects of the globalCovid-19 pandemic; disruption of supply routes which may cause delays in construction and mining activities; damage to the Company’s reputation due to the actual or perceived occurrence of any number of events, including negative publicity with respect to the Company’s handling of environmental matters or dealings with community groups, whether true or not; the possibility that future exploration results will not be consistent with the Company’s expectations; risks that exploration data may be incomplete and considerable additional work may be required to complete further evaluation, including but not limited to drilling, engineering and socioeconomic studies and investment; risk of loss due to acts of war, terrorism, sabotage and civil disturbances; litigation and legal and administrative proceedings; contests over title to properties, particularly title
to undeveloped properties, or over access to water, power and other required infrastructure; business opportunities that may be presented to, or pursued by, the Company; our ability to successfully integrate acquisitions or complete divestitures, including our ability to successfully reintegrate Acacia’s operations; risks associated with working with partners in jointly controlled assets; employee relations including loss of key employees; increased costs and physical risks, including extreme weather events and resource shortages, related to climate change; and availability and increased costs associated with mining inputs and labor. Barrick also cautions that its 2020 guidance and five year outlook may be impacted by the unprecedented business and social disruption caused by the spread ofCovid-19. In addition, there are risks and hazards associated with the business of mineral exploration, development and mining, including environmental hazards, industrial accidents, unusual or unexpected formations, pressures,cave-ins, flooding and gold bullion, copper cathode or gold or copper concentrate losses (and the risk of inadequate insurance, or inability to obtain insurance, to cover these risks).
Many of these uncertainties and contingencies can affect our actual results and could cause actual results to differ materially from those expressed or implied in any forward-looking statements made by, or on behalf of, us. Readers are cautioned that forward-looking statements are not guarantees of future performance. All of the forward-looking statements made in this MD&A are qualified by these cautionary statements. Specific reference is made to the most recent Form40-F/Annual Information Form on file with the SEC and Canadian provincial securities regulatory authorities for a more detailed discussion of some of the factors underlying forward-looking statements and the risks that may affect Barrick’s ability to achieve the expectations set forth in the forward-looking statements contained in this MD&A. We disclaim any intention or obligation to update or revise any forward-looking statements whether as a result of new information, future events or otherwise, except as required by applicable law.
| BARRICK FIRST QUARTER 2020 | 26 | MANAGEMENT’S DISCUSSION AND ANALYSIS |
USE OFNON-GAAP FINANCIAL PERFORMANCE MEASURES
We use the followingnon-GAAP financial performance measures in our MD&A:
| • | “adjusted net earnings” |
| • | “free cash flow” |
| • | “EBITDA” |
| • | “adjusted EBITDA” |
| • | “total cash costs per ounce” |
| • | “C1 cash costs per pound” |
| • | “all-in sustaining costs per ounce/pound” |
| • | “all-in costs per ounce” and |
| • | “realized price” |
For a detailed description of each of thenon-GAAP financial performance measures used in this MD&A and a detailed reconciliation to the most directly comparable measure under International Financial Reporting Standards (“IFRS”), please refer to theNon-GAAP Financial Performance Measures section of this MD&A on pages 79 to 95. Eachnon-GAAP financial performance measure has been annotated with a reference to an endnote on page 96. Thenon-GAAP financial performance measures set out in this MD&A are intended to provide additional information to investors and do not have any standardized meaning under IFRS, and therefore may not be comparable to other issuers, and should not be considered in isolation or as a substitute for measures of performance prepared in accordance with IFRS.
INDEX |
page | |
Overview | ||
Financial and Operating Highlights | 28 | |
Key Business Developments | 32 | |
Environmental and Social Governance | 34 | |
Outlook | 37 | |
Production and Cost Summary | 39 | |
Operating Divisions Performance | 41 | |
Nevada Gold Mines LLC | 42 | |
Carlin | 43 | |
Cortez | 45 | |
Turquoise Ridge | 47 | |
Other Mines - Nevada Gold Mines | 49 | |
Pueblo Viejo | 50 | |
Loulo-Gounkoto | 52 | |
Kibali | 54 | |
Veladero | 56 | |
Porgera | 58 | |
North Mara | 60 | |
Other Mines - Gold | 62 | |
Other Mines - Copper | 63 | |
Growth Projects | 64 | |
Exploration and Mineral Resource Management | 65 | |
Review of Financial Results | 69 | |
Revenue | 69 | |
Production Costs | 70 | |
Capital Expenditures | 71 | |
General and Administrative Expenses | 72 | |
Exploration, Evaluation and Project Expenses | 72 | |
Finance Costs, Net | 72 | |
Additional Significant Statement of Income Items | 73 | |
Income Tax Expense | 73 | |
Financial Condition Review | 75 | |
Balance Sheet Review | 75 | |
Shareholders’ Equity | 75 | |
Financial Position and Liquidity | 75 | |
Summary of Cash Inflow (Outflow) | 76 | |
| Commitments and Contingencies | 77 | |
| Review of Quarterly Results | 78 | |
| Internal Control over Financial Reporting and Disclosure Controls and Procedures | 78 | |
| IFRS Critical Accounting Policies and Accounting Estimates | 79 | |
| Non-GAAP Financial Performance Measures | 79 | |
| Technical Information | 96 | |
| Endnotes | 96 | |
| Financial Statements | 101 | |
Notes to Consolidated Financial Statements
| 106
| |
| BARRICK FIRST QUARTER 2020 | 27 | MANAGEMENT’S DISCUSSION AND ANALYSIS |
OVERVIEW
Financial and Operating Highlights
| For the three months ended | ||||||||||||||||||||
| 3/31/20 | 12/31/19 | % Change | 3/31/19 | % Change | ||||||||||||||||
Financial Results($ millions) | ||||||||||||||||||||
Revenues | 2,721 | 2,883 | (6)% | 2,093 | 30 % | |||||||||||||||
Cost of sales | 1,776 | 1,987 | (11)% | 1,490 | 19 % | |||||||||||||||
Net earningsa | 400 | 1,387 | (71)% | 111 | 260 % | |||||||||||||||
Adjusted net earningsb | 285 | 300 | (5)% | 184 | 55 % | |||||||||||||||
Adjusted EBITDAb | 1,467 | 1,562 | (6)% | 1,002 | 46 % | |||||||||||||||
Adjusted EBITDA marginc | 54 | % | 54 | % | 0 % | 48 | % | 13 % | ||||||||||||
Minesite sustaining capital expendituresd | 370 | 394 | (6)% | 253 | 46 % | |||||||||||||||
Project capital expendituresd | 76 | 46 | 65% | 120 | (37)% | |||||||||||||||
Total consolidated capital expendituresd,e | 451 | 446 | 1 % | 374 | 21 % | |||||||||||||||
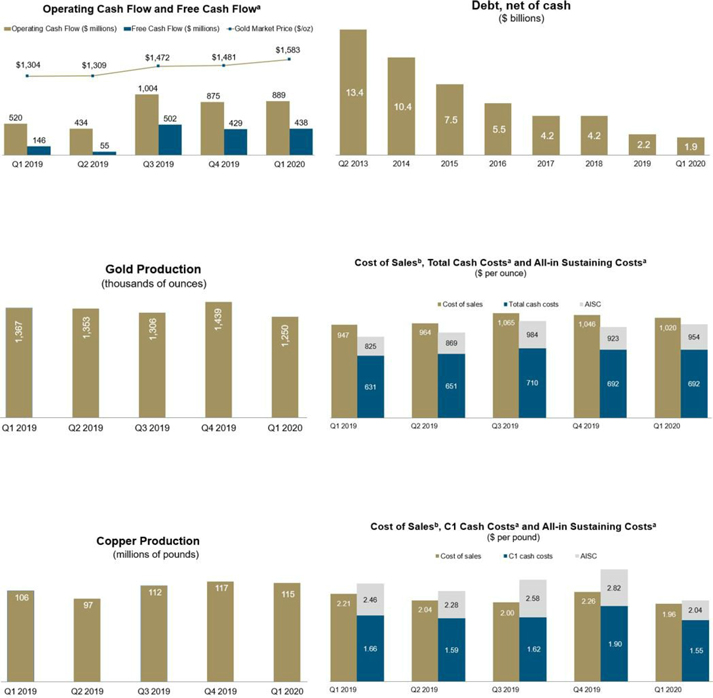
Net cash provided by operating activities | 889 | 875 | 2 % | 520 | 71 % | |||||||||||||||
Net cash provided by operating activities marginf | 33 | % | 30 | % | 10 % | 25 | % | 32 % | ||||||||||||
Free cash flowb | 438 | 429 | 2 % | 146 | 200 % | |||||||||||||||
Net earnings per share (basic and diluted) | 0.22 | 0.78 | (72)% | 0.06 | 267 % | |||||||||||||||
Adjusted net earnings (basic)bper share | 0.16 | 0.17 | (6)% | 0.11 | 45 % | |||||||||||||||
Weighted average diluted common shares (millions of shares) | 1,778 | 1,778 | 0 % | 1,746 | 2 % | |||||||||||||||
Operating Results | ||||||||||||||||||||
Gold production (thousands of ounces)g | 1,250 | 1,439 | (13)% | 1,367 | (9)% | |||||||||||||||
Gold sold (thousands of ounces)g | 1,220 | 1,413 | (14)% | 1,365 | (11)% | |||||||||||||||
Market gold price ($/oz) | 1,583 | 1,481 | 7 % | 1,304 | 21 % | |||||||||||||||
Realized gold priceb,g($/oz) | 1,589 | 1,483 | 7 % | 1,307 | 22 % | |||||||||||||||
Gold cost of sales (Barrick’s share)g,h($/oz) | 1,020 | 1,046 | (2)% | 947 | 8 % | |||||||||||||||
Gold total cash costsb,g($/oz) | 692 | 692 | 0 % | 631 | 10 % | |||||||||||||||
Goldall-in sustaining costsb,g($/oz) | 954 | 923 | 3 % | 825 | 16 % | |||||||||||||||
Copper production (millions of pounds)i | 115 | 117 | (2)% | 106 | 8 % | |||||||||||||||
Copper sold (millions of pounds)i | 110 | 91 | 21 % | 103 | 7 % | |||||||||||||||
Market copper price ($/lb) | 2.56 | 2.67 | (4)% | 2.82 | (9)% | |||||||||||||||
Realized copper priceb,i($/lb) | 2.23 | 2.76 | (19)% | 3.07 | (27)% | |||||||||||||||
Copper cost of sales (Barrick’s share)i,j($/lb) | 1.96 | 2.26 | (13)% | 2.21 | (11)% | |||||||||||||||
Copper C1 cash costsb,i($/lb) | 1.55 | 1.90 | (18)% | 1.66 | (7)% | |||||||||||||||
Copperall-in sustaining costsb,i($/lb) | 2.04 | 2.82 | (28)% | 2.46 | (17)% | |||||||||||||||
| As at 3/31/20 | As at 12/31/19 | % Change | As at 3/31/19 | % Change | ||||||||||||||||
Financial Position($ millions) | ||||||||||||||||||||
Debt (current and long-term) | 5,179 | 5,536 | (6)% | 5,807 | (11)% | |||||||||||||||
Cash and equivalents | 3,327 | 3,314 | 0 % | 2,153 | 55 % | |||||||||||||||
Debt, net of cash | 1,852 | 2,222 | (17)% | 3,654 | (49)% | |||||||||||||||
| a. | Net earnings represents net earnings attributable to the equity holders of the Company. |
| b. | Adjusted net earnings, adjusted EBITDA, free cash flow, adjusted net earnings per share, realized gold price,all-in sustaining costs, total cash costs, C1 cash costs and realized copper price arenon-GAAP financial performance measures with no standardized meaning under IFRS and therefore may not be comparable to similar measures presented by other issuers. For further information and a detailed reconciliation of eachnon-GAAP measure to the most directly comparable IFRS measure, please see pages 79 to 95 of this MD&A. |
| c. | Represents adjusted EBITDA divided by revenue. |
| d. | Amounts presented on a consolidated cash basis. Project capital expenditures are included in our calculation ofall-in costs, but not included in our calculation ofall-in sustaining costs. |
| e. | Total consolidated capital expenditures also includes capitalized interest. |
| f. | Represents net cash provided by operating activities divided by revenue. |
| g. | Includes North Mara, Bulyanhulu and Buzwagi on a 84% basis starting January 1, 2020 (and on a 63.9% basis from January 1, 2019 to September 30, 2019; notwithstanding the completion of the Acacia transaction on September 17, 2019, we consolidated our interest in Acacia and recorded anon-controlling interest of 36.1% in the income statement for the entirety of the third quarter of 2019 as a matter of convenience, and on a 100% basis from October 1, 2019 to December 31, 2019), Pueblo Viejo on a 60% basis, South Arturo on a 36.9% basis from July 1, 2019 onwards as a result of its contribution to Nevada Gold Mines (and on a 60% basis from January 1, 2019 to June 30, 2019), Veladero on a 50% basis, Loulo-Gounkoto on an 80% basis, Kibali on a 45% basis, Tongon on an 89.7% basis, and Morila on a 40% basis until the second quarter of 2019, which reflects our equity share of production and sales. Also removes thenon-controlling interest of 38.5% Nevada Gold Mines from July 1, 2019 onwards. |
| h. | Gold cost of sales (Barrick’s share) is calculated as cost of sales - gold on an attributable basis (excluding sites in care and maintenance) divided by ounces sold. |
| i. | Amounts reflect production and sales from Jabal Sayid and Zaldívar on a 50% basis, which reflects our equity share of production, and Lumwana. |
| j. | Copper cost of sales (Barrick’s share) is calculated as cost of sales - copper plus our equity share of cost of sales attributable to Zaldívar and Jabal Sayid divided by pounds sold. |
| BARRICK FIRST QUARTER 2020 | 28 | MANAGEMENT’S DISCUSSION AND ANALYSIS |
| a. | These arenon-GAAP financial performance measures with no standardized meaning under IFRS and therefore may not be comparable to similar measures presented by other issuers. For further information and a detailed reconciliation of eachnon-GAAP measure to the most directly comparable IFRS measure, please see pages 79 to 95 of this MD&A. |
| b. | Cost of sales applicable to gold per ounce is calculated using cost of sales applicable to gold on an attributable basis (removing thenon-controlling interest of 40% Pueblo Viejo; 20% Loulo-Gounkoto; 10.3% Tongon; 16% North Mara, Bulyanhulu and Buzwagi starting January 1, 2020, the date the GoT’s 16% free carried interest was made effective (36.1% from January 1, 2019 to September 30, 2019; notwithstanding the completion of the Acacia transaction on September 17, 2019, we consolidated our interest in Acacia and recorded anon-controlling interest of 36.1% in the income statement for the entirety of the third quarter of 2019 as a matter of convenience); 63.1% South Arturo from cost of sales from July 1, 2019 onwards as a result of its contribution to Nevada Gold Mines (and on a 40% basis from January 1, 2019 to June 30, 2019); and our proportionate share of cost of sales attributable to equity method investments (Kibali, and Morila until the second quarter of 2019), divided by attributable gold ounces. Also removes thenon-controlling interest of 38.5% Nevada Gold Mines from cost of sales from July 1, 2019 onwards. Cost of sales applicable to copper per pound is calculated using cost of sales applicable to copper including our proportionate share of cost of sales attributable to equity method investments (Zaldívar and Jabal Sayid), divided by consolidated copper pounds (including our proportionate share of copper pounds from our equity method investments). |
| BARRICK FIRST QUARTER 2020 | 29 | MANAGEMENT’S DISCUSSION AND ANALYSIS |
Factors affecting net earnings and adjusted net earnings1 - three months ended March 31, 2020 versus December 31, 2019
Net earnings attributable to equity holders of Barrick (“net earnings”) for the three months ended March 31, 2020 were $400 million compared to $1,387 million in the prior quarter. The significant decrease was primarily due to items occurring in the prior quarter, including:
| • | a $628 million gain (no tax impact) on thede-recognition of the deferred revenue liability relating to our silver sale agreement on Pascua-Lama with Wheaton Precious Metals Corp.; |
| • | a gain of $408 million (no tax impact) resulting from the sale of our 50% interest in Kalgoorlie; |
| • | a gain of $216 million (no tax impact) on a settlement of customs duty and indirect taxes at Lumwana; and |
| • | net impairment charges of $22 million ($566 million net reversal before tax andnon-controlling interest) relating to an impairment reversal at Pueblo Viejo and an impairment charge at Pascua-Lama. |
In the current quarter, net earnings was impacted by a net impairment reversal of $115 million ($336 million before tax) resulting from the agreement with the GoT being signed and made effective in the quarter. In addition, there was a $54 million gain (no tax impact) on the sale of Massawa.
After adjusting for items that are not indicative of future operating earnings, adjusted net earnings1 of $285 million for the three months ended March 31, 2020 were 5% lower than the prior quarter. The decrease in adjusted net earnings1 was mainly from lower gold sales volumes primarily due to lower grades at North Mara, Pueblo Viejo, Turquoise Ridge and Porgera, combined with a decrease in our attributable production at North Mara, Bulyanhulu and Buzwagi from 100% to 84%, as well as the sale of our 50% interest in Kalgoorlie. This was partially offset by higher realized gold prices1 of $1,589 per ounce in the three months ended March 31, 2020 compared to $1,483 per ounce in the prior quarter.
Factors affecting net earnings and adjusted net earnings1 - three months ended March 31, 2020 versus March 31, 2019
Net earnings for the first quarter of 2020 were $400 million compared to $111 million in the same prior year period. The increase was primarily due to the higher realized gold price1 of $1,589 per ounce in the three months ended March 31, 2020 compared to $1,307 per ounce in the same prior year period. This was partially offset by lower gold sales at Cortez due to lower grades processed and the sale of our 50% interest in Kalgoorlie on November 28, 2019. Other items occurring in the current quarter include:
| • | $91 million in other expense adjustments ($98 million before tax), primarily related to the impact of changes in the discount rate assumptions on our closed mine rehabilitation provision; |
| • | a net impairment reversal of $115 million ($336 million before tax) resulting from the agreement with the GoT being signed and made effective in the quarter; and |
| • | a $54 million gain (no tax impact) on the sale of Massawa. |
After adjusting for items that are not indicative of future operating earnings, adjusted net earnings1 of $285 million in the first quarter of 2020 were $101 million higher than the same prior year period. The increase in adjusted net earnings1 was primarily due to the higher realized gold price1 partially offset by lower gold sales as explained in the section above.
Refer to page 80 for a full list of reconciling items between net earnings and adjusted net earnings1 for the current and previous periods.
* Numerical annotations throughout the text of this document refer to the endnotes found on page 96.
| BARRICK FIRST QUARTER 2020 | 30 | MANAGEMENT’S DISCUSSION AND ANALYSIS |
Factors affecting Operating Cash Flow and Free Cash Flow1 - three months ended March 31, 2020 versus December 31, 2019
In the three months ended March 31, 2020, we generated $889 million in operating cash flow, compared to $875 million in the prior quarter. The increase of $14 million was primarily due to lower income taxes and cash interest paid, combined with higher realized gold prices1 of $1,589 per ounce in the three months ended March 31, 2020 compared to $1,483 per ounce in the prior quarter, partially offset by lower gold sales volume. Operating cash flow was further impacted by an unfavorable movement in working capital, mainly in other current assets and liabilities, partially offset by a favorable movement resulting from the timing of payments and receivables.
Free cash flow1 for the three months ended March 31, 2020 was $438 million, compared to $429 million in the prior quarter, reflecting higher operating cash flows, while capital expenditures of $451 million for the three months ended March 31, 2020 remained relatively consistent with the prior quarter of $446 million. In the first quarter of 2020, project capital expenditures increased primarily as a result of the funding of a power transmission line in Argentina, which was offset by lower minesite sustaining capital expenditures resulting from lower capitalized stripping at Turquoise Ridge and Porgera.
Factors affecting Operating Cash Flow and Free Cash Flow1 - three months ended March 31, 2020 versus March 31, 2019
In the first quarter of 2020, we generated $889 million in operating cash flow, compared to $520 million in the same prior year period. The increase of $369 million was primarily due to higher realized gold prices1 of $1,589 per ounce in the three months ended March 31, 2020 compared to $1,307 per ounce in the same prior year period, partially offset by lower gold sales volume.
In the first quarter of 2020, we generated free cash flow1 of $438 million compared to $146 million in the same prior year period. The increase primarily reflects higher operating cash flows, partially offset by higher capital expenditures. In the first quarter of 2020, capital expenditures on a cash basis were $451 million compared to $374 million in the first quarter of 2019. The increase in capital expenditures of $77 million was primarily due to the impact of the sites acquired as part of the formation of Nevada Gold Mines, which commenced on July 1, 2019, and is consolidated and included at 100%.
| BARRICK FIRST QUARTER 2020 | 31 | MANAGEMENT’S DISCUSSION AND ANALYSIS |
Key Business Developments
Covid-19 pandemic
Barrick continues to work closely with our local communities on managing the impacts of theCovid-19 pandemic on our people and our business. Barrick has a strong culture of caring for the welfare of its employees and communities. Our well-established prevention practices and procedures, and the experience we gained from dealing with two Ebola outbreaks around our African operations, will assist us as we face this new and unprecedented challenge. We have been actively working to support government responses to the coronavirus pandemic, both financially and using our supply chain to secure key supplies for the benefit of the community.
Although we have adjusted some of our operating procedures, to date our operations have not been significantly impacted byCovid-19. Our preference for employing nationals in the countries where we operate rather than expatriates, means that we are not dependent upon a workforce traveling to a site on a regular basis from other parts of the globe.
Early and considered actions by management including social distancing and testing measures have been implemented at all our sites. This has allowed our sites to continue to produce and sell their production and keep our people and local communities safe at the same time. These actions have minimized the impacts of the pandemic at our operations and facilitated the delivery of strong operating cash flow in the first quarter. Our focus on strengthening our balance sheet in recent years has given us the financial strength to endure any short-term impacts to our operations. We have $3.3 billion in cash, an undrawn $3 billion credit facility and no significant debt repayments due until 2033, providing us with sufficient liquidity to execute on our strategic goals.
We also recognize the situation remains dynamic and as such we continue to monitor developments around the world and we believe we have positioned Barrick as best we can to weather the storm.
Sale of Massawa
On March 4, 2020, Barrick and our Senegalese joint venture partner completed the sale of our aggregate 90% interest in the Massawa project (“Massawa”) in Senegal to Teranga Gold Corporation (“Teranga”) for total consideration fair valued at $440 million on the date of closing. Barrick received 92.5% of the consideration for its interest in the Massawa project, with the balance received by Barrick’s local Senegalese partner. Barrick received a net of $256 million in cash and 19,164,403 Teranga common shares (worth $104 million at the date of closing) plus a contingent payment of up to $50 million based on the three year average gold price, which was valued at $28 million at the date of closing. The cash consideration received was net of $25 million that Barrick provided through its participation in the $225 million syndicated debt financing facility secured by Teranga in connection with the transaction. The facility has a final repayment date of December 31, 2022. The difference between the fair value of consideration received and the carrying value of the assets on closing was $54 million and has been recognized as a gain in the first quarter of 2020.
Refer to note 4 to the Financial Statements for more information.
Tanzania
On January 24, 2020, Barrick announced that the Company had ratified the creation of Twiga Minerals Corporation (“Twiga”) at a signing ceremony with the President of Tanzania, formalizing the establishment of a joint venture between Barrick and the Government of Tanzania (“GoT”) and resolution of all outstanding disputes between Barrick and the GoT, including the lifting of the previous concentrate export ban, effective immediately. Effective January 1, 2020, the GoT received a free carried shareholding of 16% in each of the Tanzania mines (Bulyanhulu, Buzwagi and North Mara), a 16% interest in the shareholder loans owed by the operating companies and will receive half of the economic benefits from the Tanzanian operations from taxes, royalties, clearing fees and participation in all cash distributions made by the mines and Twiga, after the recoupment of capital investments. Twiga will provide management services to the mines. Refer to note 13 to the Financial Statements for further information.
The terms of the signed agreement are consistent with those previously announced, including the payment of $300 million to settle all outstanding tax and other disputes (the “Settlement Payment”); the lifting of the concentrate export ban; the sharing of future economic benefits from the mines on a 50/50 basis; and a dispute resolution mechanism that provides for binding international arbitration. The 50/50 division of economic benefits will be maintained through an annualtrue-up mechanism, which is exclusive of the Settlement Payment.
Barrick and the GoT continue efforts to fulfill their respective obligations to satisfy all conditions of the signed agreement, primarily with respect to the execution and delivery of formal termination documents for the settlement of all outstanding disputes between the two parties. In the second quarter of 2020, exports of the concentrate stockpiled in Tanzania commenced and we expect to start recognizing these sales in revenue and cost of sales. We also expect to make a payment of $100 million to the GoT representing the first installment of the Settlement Payment in the second quarter of 2020, reducing the previously recorded Settlement Payment liability of $300 million on the balance sheet.
Operating results are included at 84% from January 1, 2020. In the first quarter of 2020, we recognized a net impairment reversal of $115 million ($336 million before tax) resulting from the agreement with the GoT being signed and made effective in the quarter. Refer to note 13 to the Financial Statements for more information.
Porgera Special Mining Lease Extension
Porgera’s current Special Mining Lease (“SML”) terminated on August 16, 2019. The Company applied for a20-year extension of the SML in June 2017 and has been engaging with the government on this matter since then. On August 2, 2019, the National Court of Papua New Guinea ruled that the provisions of the country’s 1992 Mining Act applied to the Porgera gold mine, thus allowing it to continue operating while the application to extend its Special Mining Lease was being considered. Also in 2019, in response to a request from Papua New Guinea Prime Minister Marape, the Company proposed a benefit-sharing arrangement that would deliver more than half the economic benefits from the Porgera mine
| BARRICK FIRST QUARTER 2020 | 32 | MANAGEMENT’S DISCUSSION AND ANALYSIS |
to Papua New Guinea stakeholders, including the Government, for 20 years.
On April 24, 2020, Barrick Niugini Limited (“BNL”), the majority owner and operator of the Porgera joint venture, received a communication from the Government of Papua New Guinea that the SML will not be extended. The Company believes the Government’s decision not to extend the SML is tantamount to nationalization without due process and in violation of the Government’s legal obligations to BNL. The Company remains willing to discuss the issue with Prime Minister Marape and his government in light of the potentially catastrophic impact of this decision for the communities at Porgera and in the Enga Province, and for the country as a whole. BNL will pursue all legal avenues to challenge the Government’s decision and to recover any damages that BNL may suffer as a result of the Government’s decision. The Company will not discuss transitional arrangements for the management of the Porgera mine, as proposed by the Government, as this is not consistent with BNL’s rights, which were confirmed by the National Court’s decision in August 2019. Based on the communication we received from the Government of Papua New Guinea that the SML will not be extended, Porgera was placed on temporary care and maintenance on April 25, 2020 to ensure the safety and security of our employees and communities.
On April 28, 2020, BNL filed a Judicial Review action against the Government of Papua New Guinea in the Papua New Guinea National Court of Justice. Judicial review is a proceeding that challenges the procedural and constitutional adequacy of government administrative actions. The Judicial Review action seeks to quash the decision not to extend the SML on the grounds that the Government did not comply with the applicable legal standards and processes. BNL asked the National Court for a stay of the decision not to extend the SML to enable BNL to stay in possession of the mine to put it on temporary care and maintenance and to protect the mine’s assets. After a hearing on April 30, 2020, the National Court ordered that BNL could stay in possession of the Porgera mine “to ensure that the environment, the integrity of the mine and
the rights of the landowners are not compromised” and ordered the Government of Papua New Guinea to cooperate with that objective. The National Court also ordered the parties to engage in substantive negotiations regarding the issues in the case and to return to the Court to report on progress on May 8, 2020.
Our priority remains the health and safety of all our employees and community stakeholders. Due to the uncertainty related to the timing and scope of future developments on the mine’s operating outlook, we are withdrawing our full year 2020 guidance for Porgera at this time. As this is a rapidly evolving situation, we will reassess on an ongoing basis and provide further updates in due course, while maintaining operational readiness.
Porgera Tax Audits
On April 9, 2020, BNL received a position paper from the Internal Revenue Commission (“IRC”) in Papua New Guinea asserting various proposed adjustments and other taxes amounting to $191 million (not including potential penalties) arising from tax audits of BNL conducted for 2006 through 2015. The IRC provided BNL with an opportunity to respond to the position paper by June 30, 2020 and BNL intends to respond by that date. The Company has reviewed the IRC position paper and concluded that there is no merit to the proposed adjustments, except for certain immaterial items for which a provision had already been made. The Company intends to defend its position vigorously and has not recorded any additional estimated amounts for the potential liability arising from the IRC position paper.
Debt Management
On January 31, 2020, Barrick paid $356 million, including $4 million of accrued and unpaid interest, to complete a make-whole repurchase of the $337 million of outstanding principal on our 3.85% Notes due April 2022. A loss on debt extinguishment of $15 million was recorded in the first quarter of 2020. The debt repayment is expected to result in an annualized interest savings of $13 million.
| BARRICK FIRST QUARTER 2020 | 33 | MANAGEMENT’S DISCUSSION AND ANALYSIS |
Environmental and Social Governance
At Barrick, the focus on Environmental and Social Governance (“ESG”) is something we have been doing since we began. It is a part of our daily business and entrenched in our DNA. It is enshrined in our sustainability vision and mission as well as in our principles. We track our sustainability performance because it helps us make better decisions, helps tode-risk projects, discover new opportunities and deliver real value for our business. Sustainable development is truly at the heart of Barrick and our sustainability vision is embedded in every aspect of what we do.
To reinforce our belief in transparently disclosing our ESG performance and to better understand our performance relative to our industry peers, we developed and published our inaugural Sustainability Scorecard with the publication of our 2019 Sustainability Report released in April 2020. The scorecard ranks us against our peers, where applicable, and against our own internal metrics and aggregates that performance into an overall score. It compares our performance across our priority ESG areas: Health and Safety, Social and Economic Development, Human Rights, the Environment and Governance. After reviewing the published performance metrics from our peers, we were able to quantify our score. Overall, we scored a B grade (on a scale where A represents high performance and E represents poor performance), which we believe accurately reflected our improvements in sustainability performance through 2019.
Our sustainability vision puts four key ambitions at the center of our business: creating economic benefits; protecting health and safety; respecting human rights; and minimizing our environmental impact.
Safety
Our safety vision is “Every person going home safe and healthy every day.” In 2019, we operated with zero fatalities. However, our Total Reportable Injury Frequency Rate (“TRIFR”) increased 5%, from 2.12 to 2.24, compared to the previous year. In analyzing the incidents and frequencies, we note that the combination of assets into Nevada Gold Mines in the North America region had an impact on our performance. Specific action is being implemented at Nevada Gold Mines to improve the safety performance. The Africa and Middle East region improvedyear-on-year in both Lost Time Injuries (“LTI”) and TRIFR.
Barrick is fully committed to the safety, health and well-being of our people, their families and the communities in which we operate. We review safety performance and incidents, share lessons learned and communicate best practices across our business during weekly Executive Committee meetings which is the main forum for senior management to review our current safety performance. Safety performance is also reported as part of our quarterly Environmental and Social (“E&S”) Oversight Committee meetings and to the Board’s Corporate Governance & Nominating Committee.
While our group level commitments are the same, how these are translated on the ground varies, and each site has its own site-specific safety procedures, management plans and systems in place, informed by its operating context. All site systems, plans and procedures align with international best practice. Our goal is for the safety management systems at
all operational mines to be certified to the internationally recognized ISO 45001 standard by the end of 2021.
During 2019, our renewed focus on safety and reaffirmed commitment to prevent fatalities led to the company-wide roll out of new controls including our ten Fatality Prevention Commitments to help eliminate fatalities and serious injuries. Our Fatality Prevention Commitments align with the International Council on Mining and Metal’s Life Saving Controls, which are based upon lessons learned from fatal incidents within the mining industry, including Barrick’s experience. Our Commitments and Unacceptable Behaviors guideline has also been implemented, which reaffirms ourzero-tolerance policy for behavior such as working on site under the influence of drugs or alcohol.
Theon-going focus on safety has helped drive safety performance improvements across the group in the first quarter of 2020. The group recorded four fewer LTIs and five fewer Total Recordable Injuries (“TRI”) compared to the previous quarter. Accordingly, the related frequency rates also decreased quarter on quarter. For the first quarter of 2020, our group Lost Time Injury Frequency Rate (“LTIFR”) was 0.32 and the TRIFR was 1.64.
Environment
Barrick continues to rebuild its reputation for environmental excellence and aims to become the world’s most valued gold mining business by delivering sustainable returns for our owners and partners, including the host communities and countries in which we operate.
We have set a corporate goal for all sites to have their Environmental Management System (“EMS”) certified to the ISO 14001:2015 standard by the end of 2020. Currently, all operations, except the Jabal Sayid mine in Saudi Arabia and the three Tanzanian mines, are certified to this standard.
In 2019, we introduced a new Environmental Incident Reporting and Investigation Standard to better define the classification, reporting, responsibility and investigation of environmental incidents at Barrick sites. As defined by our new system, we had zero Class 1 (High Significance)3 environmental incidents.
During the first quarter of 2020, we maintained this performance and did not record any Class 1 environmental incidents.
Climate
Climate change, including shifts in temperature and precipitation and more frequent severe weather events, could affect the mining industry in a range of possible ways. For example, volatile climatic conditions can affect the stability and effectiveness of infrastructure and equipment; potentially impact environmental protection and site closure practices; lead to changes in the regulatory environment, including increased carbon tax regimes; and potentially impact the stability and cost of water as well as energy supplies. We therefore view climate change as a company, community, and global concern. In 2019, following our merger with Randgold (the “Merger”) and the formation of Nevada Gold Mines, we
| BARRICK FIRST QUARTER 2020 | 34 | MANAGEMENT’S DISCUSSION AND ANALYSIS |
reviewed and updated the climate change strategy developed in 2017.
Barrick’s climate change strategy has three pillars: identify, understand and mitigate the risks associated with climate change; measure and reduce our impacts on climate change; and improve our disclosure on climate change. Action taken on each pillar in 2019 is described below.
Identify, understand and mitigate the risks associated with climate change
We continue to take steps to identify and manage risks and build resilience to climate change, as well as to position ourselves for new opportunities. In 2019, climate change- related factors continued to be incorporated into Barrick’s formal risk assessment process (for example, consideration is given to the availability of and access to water and the impact of increased precipitation, drought, or severe storms on operations as well as on communities near our operations). We have identified several climate-related risks and opportunities for our business: physical impacts of climate change, such as an increase in extended duration extreme precipitation events; an increase in regulations that seek to address climate change; and increased global investment in innovation andlow-carbon technologies.
Measure and reduce the Company’s impact on climate change
Mining is an energy-intensive business, and we understand the important link between energy use and greenhouse gas (“GHG”) emissions. By effectively measuring and managing our energy use, we can reduce our draw from local energy grids, reduce our GHG emissions, achieve more efficient production, and reduce our costs. In 2019, we progressed the conversion of the Quisqueya I power generation facility in the Dominican Republic from heavy fuel oil to natural gas and we received the first liquefied natural gas deliveries in the first quarter of 2020. The conversion will help reduce the mine site’s power generation costs and is expected to reduce GHG emissions by 30%. We also advanced a power transmission project at Veladero to connect the mine to grid power and started construction of a solar plant at Loulo-Gounkoto. Each of these projects is expected to reduce the need for diesel generators, thereby reducing our emissions and power generation costs.
Additionally, at Zaldívar, our electricity supply will be from 100 percent renewable energy sources such as hydro, solar or wind starting in July 2020, which will be verified by an external party. Zaldívar is expected to be the first Chilean mine to use 100 percent renewable energy to produce copper.
Improve our disclosure on climate change
In 2019, one of our first reporting activities as a merged Company was to complete the CDP (formerly known as the Carbon Disclosure Project) emissions questionnaire which makes investor-relevant climate data widely available. Barrick received a grade of B minus on the CDP Climate Change Questionnaire. This grade places Barrick in the management scoring band with a rank higher than our sector and regional peers. Approximately 32% of companies assessed are ranked in the ‘management scoring band’. We are working to improve our performance in 2020.
Throughout 2019, the Board’s Corporate Governance and Nominating Committee, which met quarterly, was responsible
for overseeing Barrick’s policies, programs, and performance relating to the environment, including climate change. The Audit and Risk Committee assisted the Board in overseeing the Company’s management of enterprise risks as well as the implementation of policies and standards for monitoring and mitigating such risks. Climate change is built into our formal risk management process, outputs of which were reviewed by the Audit and Risk Committee throughout 2019. In addition, the Audit and Risk Committee reviewed the Company’s approach to climate change in the context of Barrick’s public disclosures.
As detailed in our 2019 Sustainability Report, Barrick has updated its GHG emissions reduction target to achieve a reduction of at least 10% by 2030 while maintaining a steady ounce production profile. The basis of this reduction is against a 2018 baseline that combines legacy Barrick and Randgold data as well as 2018 emissions from the assets over which we assumed operational control in 2019 including Nevada Gold Mines and the Tanzanian mines. Barrick’s actions to achieve this target include increasing the proportion of renewable energy sources in the company’s energy mix and switching to cleaner energy sources.
We expect our climate change activities to continue through 2020 and beyond. Site-level climate-related risks and mitigation plans will continue to be reviewed in the context of the company-wide risk assessment, and site-level plans to reduce energy and GHG emissions will be strengthened. We also expect to continue providing our climate-related disclosure. We continue to align our disclosures with the Taskforce on Climate-related Financial Disclosures (TCFD) and in 2020 will work to incorporate scenario analysis into our disclosure. Overall, based on the work completed, Barrick continues to build resilience to withstand the potential impacts of climate change and leverage potential opportunities as the global economy transitions to alow-carbon future.
Water
Our aim is to deliver enough water for the effective operation of our mines, while at the same time protecting the quality and quantity of water available to host communities and other users in our watersheds. Our commitment to responsible water use is codified in our Environmental Policy, which compels us to minimize our use of water, control and manage our impacts on water quality, and engage with stakeholders including local communities to maintain sustainable management of water resources for the benefit of all local users.
Each mine has its own site-specific water management plan, which considers: 1) the different water sources available; 2) the local climate conditions; and 3) the needs of local users and the needs of the mine. This information is supplemented by a range of international frameworks and tools such as the WWF Water Risk Filter to evaluate water risks.
We include each mine’s water risks in its operational risk register. These risks are then aggregated and incorporated into the corporate risk register. Our identified water related risks include: 1) Managing excess water in regions with high rainfall; 2) Maintaining access to water in arid areas and regions prone to water scarcity; and 3) Regulatory risks related to permitting limits as well as municipal and national regulations for water use.
| BARRICK FIRST QUARTER 2020 | 35 | MANAGEMENT’S DISCUSSION AND ANALYSIS |
During the first quarter, our water recycling and reuse rate was 77%, which is above our annual target of 75%.
Tailings
We are committed to ensuring our tailings storage facilities (TSFs) meet global best practices for safety. Our TSFs are carefully engineered and regularly inspected, particularly those in regions with high rainfall and seismic activities.
Barrick currently manages 70 TSFs, of which 22 (31%) are operating, 47 (67%) are closed, and one is inactive. A riverine tailings disposal system is operated at the Porgera Joint Venture in Papua New Guinea. In 2020, independent reviews will be conducted at our Pueblo Viejo, Turquoise Ridge, Phoenix, Carlin, Hemlo, Loulo-Gounkoto and Tongon mines, and at the Giant Nickel and Nickel Plate closure sites.
During the first quarter of 2020, a third party review was undertaken at the Llagal TSF at Pueblo Viejo and a review of the first draft of the 2020 site investigation campaign was carried out at the Nickel Plate closure site.
Social
We regard our host communities and countries as important partners in our business, and we are committed to contributing to their social and economic development. Our sustainability policies also commit us to be transparent in our relationships with host communities, government authorities, the public and other key stakeholders as well as to conduct our business with integrity through our absolute opposition to corruption, and through requiring our suppliers to operate ethically and responsibly as a condition of doing business with us.
Community and economic development
Our commitment to social and economic development is set out in our overarching Sustainable Development Policy and our Social Performance Policy.
| • | Paying our fair share of taxes - The taxes, royalties and dividends we pay provide significant income for our host countries as well as help to fund vital services and infrastructure. We report all payments to government and taxes paid transparently, primarily through the Canadian Extractive Sector Transparency Measures Act (“ESTMA”) reporting. |
| • | Prioritizing local hiring- The jobs we create provide valuable training and employment in regions where opportunities are often scarce, while the priority we place on buying goods and services from local communities and host countries leverages our supply chain and multiplies the economic benefits of our presence. 97% of our workers and 76% of senior management are nationals from our host countries. We have a target of 80% of senior management from host country nationals by the end of 2020. |
| • | Prioritizing local buying - Our procurement processes prioritize local companies, followed by those from the larger region or host country. In 2019, we procured over $4.4 billion of goods and services from suppliers based in our host countries. |
| • | Investing incommunity-led development initiatives - We believe that no one knows the needs of local communities better than the communities themselves. That is why we have set a target for all our sites to have community development committees (“CDC”). The role of the CDC is |
to allocate the community investment budget to those projects and initiatives most needed and desired by the local communities. Each CDC is elected and is made up of a mix of local leaders, community members and representatives from local women and youth groups. In the first quarter of 2020, we spent $4.2 million on community development across the group. |
Human rights
Respect for human rights is a central part of our sustainability vision. We have zero tolerance for human rights violations wherever we operate. We avoid causing or contributing to human rights violations and we facilitate access to remedies. Our commitment to respect human rights is codified in our standalone Human Rights Policy and informed by the expectations of the UN Guiding Principles on Business and Human Rights, the Voluntary Principles on Security and Human Rights, and the OECD Guidelines for Multinational Enterprises.
Our commitments to respect human rights is operationalized on the ground via our Human Rights Program, the fundamental principles of which include:
| • | Monitoring and reporting |
| • | Due diligence |
| • | Training |
| • | Disciplinary action and remedy |
We also expect the same standards from those we work with including suppliers as our supplier Code of Ethics includes human rights provisions.
Responsibility for the oversight and implementation of our human rights compliance program sits with our Group Sustainability Executive, with support from our Senior Vice President Business Assurance and Risk, and our Human Resources Executive.
Governance
At the management level, in furtherance of its commitment to sustainability, Barrick established the E&S Committee in 2019. The E&S Committee is chaired by the President and Chief Executive Officer, and includes each of the regional Chief Operating Officers, Mine General Managers and health, safety, and environment and closure leads, as well as the Group Sustainability Executive and an independent sustainability consultant. The E&S Committee meets each quarter to review the Company’s sustainability performance and compliance with its sustainability policies, as well as to identify concerns and opportunities at the Company’s operations at an early stage. The President and Chief Executive Officer reviews the reports of the E&S Committee with the Board’s Corporate Governance and Nominating Committee on a quarterly basis as part of the Committee’s mandate to oversee the policies and performance of Barrick’s environmental, safety and health, corporate social responsibility, and human rights programs.
Further to the specific focus of the E&S Committee, weekly Executive Committee review meetings allow for the discussion of opportunities and risks that may help or hinder the Company from achieving its objectives, including climate-related risks.
| BARRICK FIRST QUARTER 2020 | 36 | MANAGEMENT’S DISCUSSION AND ANALYSIS |
Full Year 2020 Outlook
Our priority remains the health and safety of all our employees and community stakeholders. Based on the communication we received from the Government of Papua New Guinea that the SML will not be extended, Porgera was placed on temporary care and maintenance on April 25, 2020 to ensure the safety and security of our employees and communities. Due to the uncertainty related to the timing and scope of future developments on the mine’s operating outlook, we are withdrawing our full year 2020 guidance for Porgera at this time. As this is a rapidly evolving situation, we will reassess on an ongoing basis and provide further updates in due course, while maintaining operational readiness.
Exclusively due to this development at Porgera, we are adjusting our 2020 gold production guidance for the group to be 4.6 to 5.0 million ounces from 4.8 to 5.2 million ounces. Group 2020 cost guidance remains unchanged, including cost of sales of$980 - $1,030 per ounce2, total cash costs of $650 - $700 per ounce1 andall-in sustaining costs of $920 - $970 per ounce1. We continue to expect gold production in the second half of 2020 to be slightly higher than the first half. Consequently, we anticipate gold production in the second quarter to be lower than the first quarter based on mine sequencing and planned maintenance shutdowns.
Additionally, we are continuing to monitor the impact of the coronavirus pandemic. Our 2020 guidance may be further impacted if the operation or development of our mines and/ or projects are disrupted due to efforts to slow the spread of the virus.
Notwithstanding the additional risks from the coronavirus pandemic, at this stage, all remaining guidance metrics are unchanged.
| Company Outlook ($ millions, except per ounce/pound data) | 2020 Estimate | |||
Gold production (millions of ounces) | 4.60 - 5.00 | |||
Gold unit production costs | ||||
Cost of sales - gold ($/oz) | 980 - 1,030 | |||
Total cash costs ($/oz)a | 650 - 700 | |||
Depreciation ($/oz) | 300 - 330 | |||
All-in sustaining costs ($/oz)a | 920 - 970 | |||
Copper production (millions of pounds) | 440 - 500 | |||
Copper unit production costs | ||||
Cost of sales - copper ($/lb) | 2.10 - 2.40 | |||
C1 cash costs ($/lb)a | 1.50 - 1.80 | |||
Depreciation ($/lb) | 0.60 - 0.70 | |||
All-in sustaining costs ($/lb)a | 2.20 - 2.50 | |||
Exploration and project expenses | 280 - 320 | |||
Exploration and evaluation | 210 - 230 | |||
Project expenses | 70 - 90 | |||
General and administrative expenses | ~170 | |||
Corporate administration | ~130 | |||
Share-based compensationb | ~40 | |||
Other expense | 80 - 100 | |||
Finance costs, net | 400 - 450 | |||
Attributable capital expenditures: | ||||
Attributable minesite sustaining | 1,300 - 1,500 | |||
Attributable project | 300 - 400 | |||
Total attributable capital expendituresc | 1,600 - 1,900 | |||
Effective income tax rated | 30% - 35% | |||
Key assumptions (used for guidance) | ||||
Gold Price ($/oz) | 1,350 | |||
Copper Price ($/lb) | 2.75 | |||
Oil Price (WTI) ($/barrel) | 65 | |||
AUD Exchange Rate (AUD:USD) | 0.70 | |||
ARS Exchange Rate (USD:ARS) | 65 | |||
CAD Exchange Rate (USD:CAD) | 1.30 | |||
CLP Exchange Rate (USD:CLP) | 725 | |||
EUR Exchange Rate (EUR:USD) | 1.20 | |||
| a. | Total cash costs, C1 cash costs andall-in sustaining costs arenon-GAAP financial performance measures with no standardized meaning under IFRS and therefore may not be comparable to similar measures of performance presented by other issuers. For further information and a detailed reconciliation of thenon- GAAP measures used in this section of the MD&A to the most directly comparable IFRS measure, please see pages 79 to 95 of this MD&A. |
| b. | Based on US$17.51 share price. |
| c. | 2020 Guidance includes our 61.5% share of Nevada Gold Mines, our 60% share of Pueblo Viejo, our 80% share of Loulo-Gounkoto, our 89.7% share of Tongon, our 84% share of North Mara, Bulyanhulu and Buzwagi, our 50% share of Zaldívar and Jabal Sayid, and our 45% share of Kibali, and our share of joint operations. |
| d. | Based on key assumptions included in this table. |
| BARRICK FIRST QUARTER 2020 | 37 | MANAGEMENT’S DISCUSSION AND ANALYSIS |
Operating Division Guidance
Our 2020 forecast gold and copper production, cost of sales, total cash costsa, andall-in sustaining costsa ranges by operating division are as follows:
| Operating Division | 2020 forecast attributable production (000s ozs) | 2020 forecast cost of salesa ($/oz) | 2020 forecast total cash costsb ($/oz) | 2020 forecast all-in sustaining costsb ($/oz) | ||||||||||||
Gold | ||||||||||||||||
Carlin (61.5%)c | 1,000 - 1,050 | 920 - 970 | 760 - 810 | 1,000 - 1,050 | ||||||||||||
Cortez (61.5%) | 450 - 480 | 980 - 1,030 | 640 - 690 | 910 - 960 | ||||||||||||
Turquoise Ridge (61.5%) | 430 - 460 | 900 - 950 | 540 - 590 | 690 - 740 | ||||||||||||
Phoenix (61.5%) | 100 - 120 | 1,850 - 1,900 | 700 - 750 | 920 - 970 | ||||||||||||
Long Canyon (61.5%) | 130 - 150 | 910 - 960 | 240 - 290 | 450 - 500 | ||||||||||||
Nevada Gold Mines (61.5%) | 2,100 - 2,250 | 970 - 1,020 | 660 - 710 | 880 - 930 | ||||||||||||
Hemlo | 200 - 220 | 960 - 1,010 | 800 - 850 | 1,200 - 1,250 | ||||||||||||
North America | 2,300 - 2,450 | 970 - 1,020 | 660 - 710 | 900 - 950 | ||||||||||||
Pueblo Viejo (60%) | 530 - 580 | 840 - 890 | 520 - 570 | 720 - 770 | ||||||||||||
Veladero (50%) | 240 - 270 | 1,220 - 1,270 | 670 - 720 | 1,250 - 1,300 | ||||||||||||
Porgera (47.5%)d | ||||||||||||||||
Latin America & Asia Pacific | 800 - 900 | 930 - 980 | 610 - 660 | 890 - 940 | ||||||||||||
Loulo-Gounkoto (80%) | 500 - 540 | 1,050 - 1,100 | 620 - 670 | 970 - 1,020 | ||||||||||||
Kibali (45%) | 340 - 370 | 1,030 - 1,080 | 600 - 650 | 790 - 840 | ||||||||||||
North Mara (84%)e | 240 - 270 | 750 - 800 | 570 - 620 | 830 - 880 | ||||||||||||
Tongon (89.7%) | 240 - 260 | 1,390 - 1,440 | 680 - 730 | 740 - 790 | ||||||||||||
Bulyanhulu (84%)e | 30 - 50 | 1,210 - 1,260 | 790 - 840 | 1,110 - 1,160 | ||||||||||||
Buzwagi (84%)e | 80 - 100 | 850 - 900 | 820 - 870 | 850 - 900 | ||||||||||||
Africa & Middle East
|
| 1,450 - 1,600
|
|
| 1,040 - 1,090
|
|
| 640 - 690
|
|
| 870 - 920
|
| ||||
Total Attributable to Barrickf,g,h
|
| 4,600 - 5,000
|
|
| 980 - 1,030
|
|
| 650 - 700
|
|
| 920 - 970
|
| ||||
2020 forecast attributable production (M lbs) | 2020 forecast cost of salesa($/lb) | 2020 forecast C1 cash costsb($/lb) | 2020 forecast all-in sustaining costsb ($/lb) | |||||||||||||
Copper | ||||||||||||||||
Lumwana | 250 - 280 | 2.20 - 2.40 | 1.50 - 1.70 | 2.30 - 2.60 | ||||||||||||
Zaldívar (50%) | 120 - 135 | 2.40 - 2.70 | 1.65 - 1.85 | 2.30 - 2.60 | ||||||||||||
Jabal Sayid (50%) | 60 - 70 | 1.75 - 2.00 | 1.40 - 1.60 | 1.50 - 1.70 | ||||||||||||
Total Copperh | 440 - 500 | 2.10 - 2.40 | 1.50 - 1.80 | 2.20 - 2.50 | ||||||||||||
| a. | Cost of sales applicable to gold per ounce is calculated using cost of sales applicable to gold on an attributable basis (removing thenon-controlling interest of 38.5% of Nevada Gold Mines (including 63.1% of South Arturo), 40% of Pueblo Viejo, 20% of Loulo-Gounkoto, 10.3% of Tongon, and 16% of North Mara, Bulyanhulu and Buzwagi from cost of sales and including our proportionate share of cost of sales attributable to our equity method investments in Kibali), divided by attributable gold ounces sold. Cost of sales applicable to copper per pound is calculated using cost of sales applicable to copper including our proportionate share of cost of sales attributable to our equity method investments in Zaldívar and Jabal Sayid, divided by consolidated copper pounds sold (including our proportionate share of copper pounds sold from our equity method investments). |
| b. | Total cash costs,all-in sustaining costs and C1 cash costs arenon-GAAP financial performance measures with no standardized meaning under IFRS and therefore may not be comparable to similar measures of performance presented by other issuers. For further information and a detailed reconciliation of thenon-GAAP measures used in this section of the MD&A to the most directly comparable IFRS measures, please see pages 79 to 95 of this MD&A. |
| c. | Includes our 36.9% share of South Arturo. |
| d. | Based on the communication we received from the Government of Papua New Guinea that the SML will not be extended, Porgera was placed on temporary care and maintenance on April 25, 2020 to ensure the safety and security of our employees and communities. Due to the uncertainty related to the timing and scope of future developments on the mine’s operating outlook, our full year 2020 guidance for Porgera has been withdrawn. |
| e. | Amounts are on an 84% basis as the GoT’s 16% free-carried interest was made effective from January 1, 2020. |
| f. | Total cash costs andall-in sustaining costs per ounce include the impact of hedges and/or costs allocated tonon-operating sites. |
| g. | Operating unit guidance ranges reflect expectations at each individual operating unit, and may not add up to the company-wide guidance range total. Guidance ranges exclude Pierina, Lagunas Norte, Golden Sunlight and Morila (40%). |
| h. | Includes corporate administration costs. |
| BARRICK FIRST QUARTER 2020 | 38 | MANAGEMENT’S DISCUSSION AND ANALYSIS |
Production and Cost Summary - Gold
| For the three months ended | ||||||||||||||||||||||||||||||||||||||||
| 3/31/20 | 12/31/19 | % Change | 3/31/19 | % Change | ||||||||||||||||||||||||||||||||||||
Nevada Gold Mines LLC (61.5%)a | ||||||||||||||||||||||||||||||||||||||||
Gold produced (000s oz) | 526 | 585 | (10)% | 572 | (8)% | |||||||||||||||||||||||||||||||||||
Cost of sales ($/oz) | 995 | 1,038 | (4)% | 780 | 28 % | |||||||||||||||||||||||||||||||||||
Total cash costs ($/oz)b | 690 | 711 | (3)% | 542 | 27 % | |||||||||||||||||||||||||||||||||||
All-in sustaining costs ($/oz)b | 952 | 944 | 1 % | 678 | 40 % | |||||||||||||||||||||||||||||||||||
Carlin (61.5%)c | ||||||||||||||||||||||||||||||||||||||||
Gold produced (000s oz) | 253 | 276 | (8)% | 233 | 9 % | |||||||||||||||||||||||||||||||||||
Cost of sales ($/oz) | 970 | 975 | (1)% | 947 | 2 % | |||||||||||||||||||||||||||||||||||
Total cash costs ($/oz)b | 776 | 766 | 1 % | 671 | 16 % | |||||||||||||||||||||||||||||||||||
All-in sustaining costs ($/oz)b | 1,007 | 965 | 4 % | 891 | 13 % | |||||||||||||||||||||||||||||||||||
Cortez (61.5%)d | ||||||||||||||||||||||||||||||||||||||||
Gold produced (000s oz) | 128 | 133 | (4)% | 262 | (51)% | |||||||||||||||||||||||||||||||||||
Cost of sales ($/oz) | 876 | 945 | (7)% | 682 | 28 % | |||||||||||||||||||||||||||||||||||
Total cash costs ($/oz)b | 614 | 681 | (10)% | 433 | 42 % | |||||||||||||||||||||||||||||||||||
All-in sustaining costs ($/oz)b | 1,009 | 1,012 | 0 % | 506 | 99 % | |||||||||||||||||||||||||||||||||||
Turquoise Ridge (61.5%)e | ||||||||||||||||||||||||||||||||||||||||
Gold produced (000s oz) | 84 | 111 | (24)% | 77 | 9 % | |||||||||||||||||||||||||||||||||||
Cost of sales ($/oz) | 1,032 | 971 | 6 % | 592 | 74 % | |||||||||||||||||||||||||||||||||||
Total cash costs ($/oz)b | 668 | 625 | 7 % | 506 | 32 % | |||||||||||||||||||||||||||||||||||
All-in sustaining costs ($/oz)b | 806 | 800 | 1 % | 592 | 36 % | |||||||||||||||||||||||||||||||||||
Phoenix (61.5%)f | ||||||||||||||||||||||||||||||||||||||||
Gold produced (000s oz) | 35 | 31 | 13 % | |||||||||||||||||||||||||||||||||||||
Cost of sales ($/oz) | 1,583 | 2,025 | (22)% | |||||||||||||||||||||||||||||||||||||
Total cash costs ($/oz)b | 737 | 902 | (18)% | |||||||||||||||||||||||||||||||||||||
All-in sustaining costs ($/oz)b | 914 | 1,034 | (12)% | |||||||||||||||||||||||||||||||||||||
Long Canyon (61.5%)f | ||||||||||||||||||||||||||||||||||||||||
Gold produced (000s oz) | 26 | 34 | (24)% | |||||||||||||||||||||||||||||||||||||
Cost of sales ($/oz) | 1,025 | 1,026 | 0 % | |||||||||||||||||||||||||||||||||||||
Total cash costs ($/oz)b | 345 | 317 | 9 % | |||||||||||||||||||||||||||||||||||||
All-in sustaining costs ($/oz)b | 561 | 657 | (15)% | |||||||||||||||||||||||||||||||||||||
Pueblo Viejo (60%) | ||||||||||||||||||||||||||||||||||||||||
Gold produced (000s oz) | 143 | 179 | (20)% | 148 | (3)% | |||||||||||||||||||||||||||||||||||
Cost of sales ($/oz) | 767 | 660 | 16 % | 696 | 10 % | |||||||||||||||||||||||||||||||||||
Total cash costs ($/oz)b | 502 | 422 | 19 % | 421 | 19 % | |||||||||||||||||||||||||||||||||||
All-in sustaining costs ($/oz)b | 626 | 517 | 21 % | 543 | 15 % | |||||||||||||||||||||||||||||||||||
Loulo-Gounkoto (80%) | ||||||||||||||||||||||||||||||||||||||||
Gold produced (000s oz) | 141 | 144 | (2)% | 128 | 10 % | |||||||||||||||||||||||||||||||||||
Cost of sales ($/oz) | 1,002 | 1,037 | (3)% | 1,052 | (5)% | |||||||||||||||||||||||||||||||||||
Total cash costs ($/oz)b | 614 | 631 | (3)% | 684 | (10)% | |||||||||||||||||||||||||||||||||||
All-in sustaining costs ($/oz)b | 891 | 917 | (3)% | 840 | 6 % | |||||||||||||||||||||||||||||||||||
Kibali (45%) | ||||||||||||||||||||||||||||||||||||||||
Gold produced (000s oz) | 91 | 87 | 5 % | 93 | (2)% | |||||||||||||||||||||||||||||||||||
Cost of sales ($/oz) | 1,045 | 1,205 | (13)% | 1,202 | (13)% | |||||||||||||||||||||||||||||||||||
Total cash costs ($/oz)b | 582 | 608 | (4)% | 573 | 2 % | |||||||||||||||||||||||||||||||||||
All-in sustaining costs ($/oz)b | 773 | 740 | 4 % | 673 | 15 % | |||||||||||||||||||||||||||||||||||
Veladero (50%) | ||||||||||||||||||||||||||||||||||||||||
Gold produced (000s oz) | 75 | 71 | 6 % | 70 | 7 % | |||||||||||||||||||||||||||||||||||
Cost of sales ($/oz) | 1,182 | 1,138 | 4 % | 1,195 | (1)% | |||||||||||||||||||||||||||||||||||
Total cash costs ($/oz)b | 788 | 710 | 11 % | 713 | 11 % | |||||||||||||||||||||||||||||||||||
All-in sustaining costs ($/oz)b | 1,266 | 1,142 | 11 % | 1,100 | 15 % | |||||||||||||||||||||||||||||||||||
Porgera (47.5%) | ||||||||||||||||||||||||||||||||||||||||
Gold produced (000s oz) | 62 | 82 | (24)% | 66 | (6)% | |||||||||||||||||||||||||||||||||||
Cost of sales ($/oz) | 1,097 | 909 | 21 % | 1,031 | 6 % | |||||||||||||||||||||||||||||||||||
Total cash costs ($/oz)b | 941 | 757 | 24 % | 854 | 10 % | |||||||||||||||||||||||||||||||||||
All-in sustaining costs ($/oz)b | 1,089 | 894 | 22 % | 978 | 11 % | |||||||||||||||||||||||||||||||||||
| BARRICK FIRST QUARTER 2020 | 39 | MANAGEMENT’S DISCUSSION AND ANALYSIS |
Production and Cost Summary - Gold (continued)
| For the three months ended | ||||||||||||||||||||||||||||||||||||||||
| 3/31/20 | 12/31/19 | % Change | 3/31/19 | % Change | ||||||||||||||||||||||||||||||||||||
Tongon (89.7%) | ||||||||||||||||||||||||||||||||||||||||
Gold produced (000s oz) | 61 | 61 | 0 % | 61 | 0 % | |||||||||||||||||||||||||||||||||||
Cost of sales ($/oz) | 1,368 | 1,476 | (7)% | 1,451 | (6)% | |||||||||||||||||||||||||||||||||||
Total cash costs ($/oz)b | 762 | 803 | (5)% | 799 | (5)% | |||||||||||||||||||||||||||||||||||
All-in sustaining costs ($/oz)b | 788 | 867 | (9)% | 836 | (6)% | |||||||||||||||||||||||||||||||||||
Hemlo | ||||||||||||||||||||||||||||||||||||||||
Gold produced (000s oz) | 57 | 54 | 6 % | 55 | 4 % | |||||||||||||||||||||||||||||||||||
Cost of sales ($/oz) | 1,119 | 1,632 | (31)% | 906 | 24 % | |||||||||||||||||||||||||||||||||||
Total cash costs ($/oz)b | 945 | 1,091 | (13)% | 769 | 23 % | |||||||||||||||||||||||||||||||||||
All-in sustaining costs ($/oz)b | 1,281 | 1,380 | (7)% | 915 | 40 % | |||||||||||||||||||||||||||||||||||
North Marag | ||||||||||||||||||||||||||||||||||||||||
Gold produced (000s oz) | 65 | 103 | (37)% | 42 | 55 % | |||||||||||||||||||||||||||||||||||
Cost of sales ($/oz) | 959 | 1,021 | (6)% | 1,064 | (10)% | |||||||||||||||||||||||||||||||||||
Total cash costs ($/oz)b | 646 | 675 | (4)% | 755 | (14)% | |||||||||||||||||||||||||||||||||||
All-in sustaining costs ($/oz)b | 816 | 830 | (2)% | 944 | (14)% | |||||||||||||||||||||||||||||||||||
Buzwagig | ||||||||||||||||||||||||||||||||||||||||
Gold produced (000s oz) | 22 | 28 | (21)% | 18 | 22 % | |||||||||||||||||||||||||||||||||||
Cost of sales ($/oz) | 1,373 | 1,235 | 11 % | 1,243 | 10 % | |||||||||||||||||||||||||||||||||||
Total cash costs ($/oz)b | 1,275 | 1,144 | 11 % | 1,164 | 10 % | |||||||||||||||||||||||||||||||||||
All-in sustaining costs ($/oz)b | 1,288 | 1,169 | 10 % | 1,228 | 5 % | |||||||||||||||||||||||||||||||||||
Bulyanhulug | ||||||||||||||||||||||||||||||||||||||||
Gold produced (000s oz) | 7 | 9 | (22)% | 6 | 17 % | |||||||||||||||||||||||||||||||||||
Cost of sales ($/oz) | 1,685 | 1,293 | 30 % | 1,008 | 67 % | |||||||||||||||||||||||||||||||||||
Total cash costs ($/oz)b | 686 | 752 | (9)% | 622 | 10 % | |||||||||||||||||||||||||||||||||||
All-in sustaining costs ($/oz)b | 906 | 909 | 0 % | 757 | 20 % | |||||||||||||||||||||||||||||||||||
Kalgoorlie (50%)h | ||||||||||||||||||||||||||||||||||||||||
Gold produced (000s oz) | 36 | (100)% | 55 | (100)% | ||||||||||||||||||||||||||||||||||||
Cost of sales ($/oz) | 1,127 | (100)% | 1,064 | (100)% | ||||||||||||||||||||||||||||||||||||
Total cash costs ($/oz)b | 940 | (100)% | 870 | (100)% | ||||||||||||||||||||||||||||||||||||
All-in sustaining costs ($/oz)b | 1,172 | (100)% | 1,185 | (100)% | ||||||||||||||||||||||||||||||||||||
Total Attributable to Barricki | ||||||||||||||||||||||||||||||||||||||||
Gold produced (000s oz) | 1,250 | 1,439 | (13)% | 1,367 | (9)% | |||||||||||||||||||||||||||||||||||
Cost of sales ($/oz)j | 1,020 | 1,046 | (2)% | 947 | 8 % | |||||||||||||||||||||||||||||||||||
Total cash costs ($/oz)b | 692 | 692 | 0 % | 631 | 10 % | |||||||||||||||||||||||||||||||||||
All-in sustaining costs ($/oz)b | 954 | 923 | 3 % | 825 | 16 % | |||||||||||||||||||||||||||||||||||
| a. | Represents the combined results of Cortez, Goldstrike (including our 60% share of South Arturo) and our 75% interest in Turquoise Ridge until June 30, 2019. Commencing July 1, 2019, the date Nevada Gold Mines was established, the results represent our 61.5% interest in Cortez, Carlin (including Goldstrike and 60% of South Arturo), Turquoise Ridge (including Twin Creeks), Phoenix and Long Canyon. |
| b. | These arenon-GAAP financial performance measures with no standardized meaning under IFRS and therefore may not be comparable to similar measures presented by other issuers. For further information and a detailed reconciliation of eachnon-GAAP measure used in this section of the MD&A to the most directly comparable IFRS measure, please see pages 79 to 95 of this MD&A. |
| c. | On July 1, 2019, Barrick’s Goldstrike and Newmont’s Carlin were contributed to Nevada Gold Mines and are now referred to as Carlin. As a result, the amounts presented represent Goldstrike on a 100% basis (including our 60% share of South Arturo) up until June 30, 2019, and the combined results of Carlin and Goldstrike (including NGM’s 60% share of South Arturo) on a 61.5% basis thereafter. |
| d. | On July 1, 2019, Cortez was contributed to Nevada Gold Mines, a joint venture with Newmont. As a result, the amounts presented are on an 100% basis up until June 30, 2019, and on a 61.5% basis thereafter. |
| e. | Barrick owned 75% of Turquoise Ridge through the end of the second quarter of 2019, with our joint venture partner, Newmont, owning the remaining 25%. Turquoise Ridge was proportionately consolidated on the basis that the joint venture partners that have joint control have rights to the assets and obligations for the liabilities relating to the arrangement. The figures presented in this table are based on our 75% interest in Turquoise Ridge until June 30, 2019. On July 1, 2019, Barrick’s 75% interest in Turquoise Ridge and Newmont’s Twin Creeks and 25% interest in Turquoise Ridge were contributed to Nevada Gold Mines. Starting July 1, 2019, the results represent our 61.5% share of Turquoise Ridge and Twin Creeks, now referred to as Turquoise Ridge. |
| f. | A 61.5% interest in these sites was acquired as a result of the formation of Nevada Gold Mines on July 1, 2019. |
| g. | Formerly known as Acacia Mining plc. On September 17, 2019, Barrick acquired all of the shares of Acacia it did not own. Operating results are included at 100% from October 1, 2019 to December 31, 2019 (notwithstanding the completion of the Acacia transaction on September 17, 2019, we consolidated our interest in Acacia and recorded anon-controlling interest of 36.1% in the income statement for the entirety of the third quarter of 2019 as a matter of convenience), and on an 84% basis thereafter as the GoT’s 16% free-carried interest was made effective from January 1, 2020. |
| h. | On November 28, 2019, we completed the sale of our 50% interest in Kalgoorlie in Western Australia to Saracen Mineral Holdings Limited for total cash consideration of $750 million. Accordingly, these represent our 50% interest until November 28, 2019. |
| i. | Excludes Pierina; Lagunas Norte starting in the fourth quarter of 2019; and Golden Sunlight and Morila (40%) starting in the third quarter of 2019 which are mining incidental ounces as it enters closure. |
| j. | Cost of sales per ounce (Barrick’s share) is calculated as cost of sales - gold on an attributable basis (excluding sites in care and maintenance) divided by gold equity ounces sold. |
| BARRICK FIRST QUARTER 2020 | 40 | MANAGEMENT’S DISCUSSION AND ANALYSIS |
Production and Cost Summary - Copper
| For the three months ended | ||||||||||||||||||||||||||||||||||||||||
| 3/31/20 | 12/31/19 | % Change | 3/31/19 | % Change | ||||||||||||||||||||||||||||||||||||
Lumwana | ||||||||||||||||||||||||||||||||||||||||
Copper production (millions lbs) | 64 | 63 | 2 % | 61 | 5 % | |||||||||||||||||||||||||||||||||||
Cost of sales ($/lb) | 1.94 | 2.22 | (13)% | 2.16 | (10)% | |||||||||||||||||||||||||||||||||||
C1 cash costs ($/lb)a | 1.63 | 2.10 | (22)% | 1.67 | (2)% | |||||||||||||||||||||||||||||||||||
All-in sustaining costs ($/lb)a | 2.26 | 3.41 | (34)% | 2.79 | (19)% | |||||||||||||||||||||||||||||||||||
Zaldívar (50%) | ||||||||||||||||||||||||||||||||||||||||
Copper production (millions lbs) | 31 | 36 | (14)% | 28 | 11 % | |||||||||||||||||||||||||||||||||||
Cost of sales ($/lb) | 2.39 | 2.59 | (8)% | 2.68 | (11)% | |||||||||||||||||||||||||||||||||||
C1 cash costs ($/lb)a | 1.71 | 1.95 | (12)% | 1.91 | (10)% | |||||||||||||||||||||||||||||||||||
All-in sustaining costs ($/lb)a | 1.99 | 2.56 | (22)% | 2.12 | (6)% | |||||||||||||||||||||||||||||||||||
Jabal Sayid (50%) | ||||||||||||||||||||||||||||||||||||||||
Copper production (millions lbs) | 20 | 18 | 11 % | 17 | 18 % | |||||||||||||||||||||||||||||||||||
Cost of sales ($/lb) | 1.28 | 1.47 | (13)% | 1.55 | (17)% | |||||||||||||||||||||||||||||||||||
C1 cash costs ($/lb)a | 0.97 | 1.29 | (25)% | 1.10 | (12)% | |||||||||||||||||||||||||||||||||||
All-in sustaining costs ($/lb)a | 1.11 | 1.78 | (38)% | 1.30 | (15)% | |||||||||||||||||||||||||||||||||||
Total Copper | ||||||||||||||||||||||||||||||||||||||||
Copper production (millions lbs) | 115 | 117 | (2)% | 106 | 8 % | |||||||||||||||||||||||||||||||||||
Cost of sales ($/lb)b | 1.96 | 2.26 | (13)% | 2.21 | (11)% | |||||||||||||||||||||||||||||||||||
C1 cash costs ($/lb)a | 1.55 | 1.90 | (18)% | 1.66 | (7)% | |||||||||||||||||||||||||||||||||||
All-in sustaining costs ($/lb)a | 2.04 | 2.82 | (28)% | 2.46 | (17)% | |||||||||||||||||||||||||||||||||||
| a. | These arenon-GAAP financial performance measures with no standardized meaning under IFRS and therefore may not be comparable to similar measures presented by other issuers. For further information and a detailed reconciliation of eachnon-GAAP measure used in this section of the MD&A to the most directly comparable IFRS measure, please see pages 79 to 95 of this MD&A. |
| b. | Cost of sales per pound (Barrick’s share) is calculated as cost of sales - copper plus our equity share of cost of sales attributable to Zaldívar and Jabal Sayid divided by copper pounds sold. |
OPERATING DIVISIONS PERFORMANCE
Our presentation of reportable operating segments consists of nine gold mines (Cortez, Carlin, Turquoise Ridge, Pueblo Viejo, Loulo-Gounkoto, Kibali, Veladero, Porgera and North Mara). The remaining operating segments, including our remaining gold mines, copper mines and projects, have been grouped into an “other” category and will not be reported on
individually. Segment performance is evaluated based on a number of measures including operating income before tax, production levels and unit production costs. Certain costs are managed on a consolidated basis and are therefore not reflected in segment income.
| BARRICK FIRST QUARTER 2020 | 41 | MANAGEMENT’S DISCUSSION AND ANALYSIS |
Nevada Gold Mines (61.5% basis)a, Nevada USA
| Summary of Operating and Financial Data | For the three months ended | |||||||||||||||||||||||||||||||||||||||
| 3/31/20 | 12/31/19 | % Change | 3/31/19 | % Change | ||||||||||||||||||||||||||||||||||||
Total tonnes mined (000s) | 56,516 | 53,267 | 6 % | 39,745 | 42 % | |||||||||||||||||||||||||||||||||||
Open pit ore | 10,433 | 9,316 | 12 % | 5,581 | 87 % | |||||||||||||||||||||||||||||||||||
Open pit waste | 44,808 | 42,623 | 5 % | 33,104 | 35 % | |||||||||||||||||||||||||||||||||||
Underground | 1,275 | 1,328 | (4)% | 1,060 | 20 % | |||||||||||||||||||||||||||||||||||
Average grade (grams/tonne) | ||||||||||||||||||||||||||||||||||||||||
Open pit mined | 0.78 | 0.82 | (5)% | 1.49 | (48)% | |||||||||||||||||||||||||||||||||||
Underground mined | 10.03 | 10.70 | (6)% | 10.65 | (6)% | |||||||||||||||||||||||||||||||||||
Processed | 1.71 | 1.96 | (13)% | 2.72 | (37)% | |||||||||||||||||||||||||||||||||||
Ore tonnes processed (000s) | 12,359 | 11,586 | 7 % | 7,790 | 59 % | |||||||||||||||||||||||||||||||||||
Oxide mill | 3,189 | 3,044 | 5 % | 1,056 | 202 % | |||||||||||||||||||||||||||||||||||
Roaster | 1,304 | 1,344 | (3)% | 1,360 | (4)% | |||||||||||||||||||||||||||||||||||
Autoclave | 1,402 | 1,556 | (10)% | 1,433 | (2)% | |||||||||||||||||||||||||||||||||||
Heap leach | 6,464 | 5,642 | 15 % | 3,941 | 64 % | |||||||||||||||||||||||||||||||||||
Recovery rate | 81 | % | 80 | % | 1 % | 83 | % | (2)% | ||||||||||||||||||||||||||||||||
Oxide Mill | 72 | % | 60 | % | 20 % | 82 | % | (12)% | ||||||||||||||||||||||||||||||||
Roaster | 86 | % | 86 | % | 0 % | 87 | % | (1)% | ||||||||||||||||||||||||||||||||
Autoclave | 75 | % | 74 | % | 1 % | 78 | % | (4)% | ||||||||||||||||||||||||||||||||
Gold produced (000s oz) | 526 | 585 | (10)% | 572 | (8)% | |||||||||||||||||||||||||||||||||||
Oxide mill | 71 | 76 | (7)% | 102 | (30)% | |||||||||||||||||||||||||||||||||||
Roaster | 260 | 286 | (9)% | 254 | 2 % | |||||||||||||||||||||||||||||||||||
Autoclave | 129 | 155 | (17)% | 158 | (18)% | |||||||||||||||||||||||||||||||||||
Heap leach | 66 | 68 | (2)% | 58 | 14 % | |||||||||||||||||||||||||||||||||||
| Gold sold (000s oz) | 528 | 565 | (7)% | 574 | (8)% | |||||||||||||||||||||||||||||||||||
Revenue ($ millions) | 853 | 861 | (1)% | 750 | 14% | |||||||||||||||||||||||||||||||||||
Cost of sales ($ millions) | 527 | 573 | (8)% | 448 | 18 % | |||||||||||||||||||||||||||||||||||
Income ($ millions) | 316 | 277 | 14 % | 292 | 8 % | |||||||||||||||||||||||||||||||||||
EBITDA ($ millions)b | 462 | 440 | 5 % | 428 | 8 % | |||||||||||||||||||||||||||||||||||
EBITDA marginc | 54 | % | 51 | % | 6 % | 57 | % | (5)% | ||||||||||||||||||||||||||||||||
Capital expenditures ($ millions)d | 143 | 145 | (1)% | 149 | (4)% | |||||||||||||||||||||||||||||||||||
Minesite sustaining | 122 | 124 | (2)% | 70 | 74 % | |||||||||||||||||||||||||||||||||||
Project | 21 | 21 | 0 % | 79 | (73)% | |||||||||||||||||||||||||||||||||||
Cost of sales ($/oz) | 995 | 1,038 | (4)% | 780 | 28 % | |||||||||||||||||||||||||||||||||||
Total cash costs ($/oz)b | 690 | 711 | (3)% | 542 | 27 % | |||||||||||||||||||||||||||||||||||
All-in sustaining costs ($/oz)b | 952 | 944 | 1 % | 678 | 40 % | |||||||||||||||||||||||||||||||||||
All-in costs ($/oz)b | 993 | 982 | 1 % | 817 | 22% | |||||||||||||||||||||||||||||||||||
| a. | Represents the combined results of Cortez, Goldstrike (including our 60% share of South Arturo) and our 75% interest in Turquoise Ridge until June 30, 2019. Commencing July 1, 2019, the date Nevada Gold Mines was established, the results represent our 61.5% interest in Cortez, Carlin (including Goldstrike and 60% of South Arturo), Turquoise Ridge (including Twin Creeks), Phoenix and Long Canyon. |
| b. | These arenon-GAAP financial performance measures with no standardized meaning under IFRS and therefore may not be comparable to similar measures presented by other issuers. For further information and a detailed reconciliation of eachnon-GAAP measure used in this section of the MD&A to the most directly comparable IFRS measure, please see pages 79 to 95 of this MD&A. |
| c. | Represents EBITDA divided by revenue. |
| d. | Amounts presented exclude capitalized interest. |
On July 1, 2019, Nevada Gold Mines (“NGM”) was established, which includes Barrick’s Cortez, Goldstrike, Turquoise Ridge and Goldrush properties and Newmont Corporation’s (“Newmont”) Carlin, Twin Creeks, Phoenix, Long Canyon and Lone Tree properties. Barrick is the operator of the joint venture and owns 61.5%, with Newmont owning the remaining 38.5% of the joint venture. Refer to the following pages for a detailed discussion of Cortez, Carlin (including Goldstrike) and Turquoise Ridge (including Twin Creeks) results.
| BARRICK FIRST QUARTER 2020 | 42 | MANAGEMENT’S DISCUSSION AND ANALYSIS |
Carlin (61.5% basis)a, Nevada USA
Summary of Operating and Financial Data | For the three months ended | |||||||||||||||||||||||||||||||||||||||
| 3/31/20 | 12/31/19 | % Change | 3/31/19 | % Change | ||||||||||||||||||||||||||||||||||||
Total tonnes mined (000s) | 17,120 | 13,639 | 26 % | 11,982 | 43 % | |||||||||||||||||||||||||||||||||||
Open pit ore | 1,467 | 1,832 | (20)% | 920 | 59 % | |||||||||||||||||||||||||||||||||||
Open pit waste | 14,901 | 10,966 | 36 % | 10,581 | 41 % | |||||||||||||||||||||||||||||||||||
Underground | 752 | 841 | (11)% | 481 | 56 % | |||||||||||||||||||||||||||||||||||
Average grade (grams/tonne) | ||||||||||||||||||||||||||||||||||||||||
Open pit mined | 1.36 | 1.84 | (26)% | 4.03 | (66)% | |||||||||||||||||||||||||||||||||||
Underground mined | 9.45 | 9.40 | 0 % | 9.17 | 3 % | |||||||||||||||||||||||||||||||||||
Processed | 3.41 | 3.65 | (7)% | 4.31 | (21)% | |||||||||||||||||||||||||||||||||||
Ore tonnes processed (000s) | 3,229 | 3,156 | 2 % | 2,162 | 49 % | |||||||||||||||||||||||||||||||||||
Oxide mill | 669 | 705 | (5)% | n/ | a | n/a | ||||||||||||||||||||||||||||||||||
Roasters | 928 | 991 | (6)% | 884 | 5 % | |||||||||||||||||||||||||||||||||||
Autoclave | 853 | 892 | (4)% | 1,278 | (33)% | |||||||||||||||||||||||||||||||||||
Heap leach | 779 | 568 | 37 % | n/ | a | n/a | ||||||||||||||||||||||||||||||||||
Recovery rate | 71 | % | 75 | % | (5)% | 78 | % | (9)% | ||||||||||||||||||||||||||||||||
Roasters | 85 | % | 86 | % | (1)% | 87 | % | (2)% | ||||||||||||||||||||||||||||||||
Autoclave | 64 | % | 58 | % | 11 % | 66 | % | (3)% | ||||||||||||||||||||||||||||||||
Gold produced (000s oz) | 253 | 276 | (8)% | 233 | 9 % | |||||||||||||||||||||||||||||||||||
Oxide mill | 9 | 11 | (18)% | n/ | a | n/a | ||||||||||||||||||||||||||||||||||
Roasters | 183 | 205 | (11)% | 152 | 20 % | |||||||||||||||||||||||||||||||||||
Autoclave | 50 | 49 | 2 % | 81 | (38)% | |||||||||||||||||||||||||||||||||||
Heap leach | 11 | 11 | 0 % | n/a | n/a | |||||||||||||||||||||||||||||||||||
Gold sold (000s oz) | 256 | 275 | (7)% | 239 | 7 % | |||||||||||||||||||||||||||||||||||
Revenue ($ millions) | 407 | 408 | 0 % | 311 | 31% | |||||||||||||||||||||||||||||||||||
Cost of sales ($ millions) | 248 | 268 | (8)% | 226 | 10 % | |||||||||||||||||||||||||||||||||||
Income ($ millions) | 153 | 133 | 15 % | 83 | 84 % | |||||||||||||||||||||||||||||||||||
EBITDA ($ millions)b | 202 | 191 | 6 % | 149 | 36 % | |||||||||||||||||||||||||||||||||||
EBITDA marginc | 50 | % | 47 | % | 7 % | 48 | % | 4 % | ||||||||||||||||||||||||||||||||
Capital expenditures ($ millions) | 55 | 51 | 8 % | 50 | 10 % | |||||||||||||||||||||||||||||||||||
Minesite sustaining | 55 | 51 | 8 % | 50 | 10 % | |||||||||||||||||||||||||||||||||||
Project | 0 | 0 | 0 % | 0 | 0 % | |||||||||||||||||||||||||||||||||||
Cost of sales ($/oz) | 970 | 975 | (1)% | 947 | 2 % | |||||||||||||||||||||||||||||||||||
Total cash costs ($/oz)b | 776 | 766 | 1 % | 671 | 16 % | |||||||||||||||||||||||||||||||||||
All-in sustaining costs ($/oz)b | 1,007 | 965 | 4 % | 891 | 13 % | |||||||||||||||||||||||||||||||||||
All-in costs ($/oz)b | 1,007 | 965 | 4 % | 891 | 13% | |||||||||||||||||||||||||||||||||||
| a. | On July 1, 2019, Barrick’s Goldstrike and Newmont’s Carlin were contributed to Nevada Gold Mines and are now referred to as Carlin. As a result, the amounts presented represent Goldstrike on a 100% basis (including our 60% share of South Arturo) up until June 30, 2019, and the combined results of Carlin and Goldstrike (including NGM’s 60% share of South Arturo) on a 61.5% basis thereafter. |
| b. | These arenon-GAAP financial performance measures with no standardized meaning under IFRS and therefore may not be comparable to similar measures presented by other issuers. For further information and a detailed reconciliation of eachnon-GAAP measure used in this section of the MD&A to the most directly comparable IFRS measure, please see pages 79 to 95 of this MD&A. |
| c. | Represents EBITDA divided by revenue. |
On July 1, 2019, Barrick’s Goldstrike and Newmont’s Carlin were contributed to Nevada Gold Mines and are now referred to as Carlin. As a result, the amounts presented represent Goldstrike on a 100% basis (including our 60% share of South Arturo) up until June 30, 2019, and the combined results of Carlin and Goldstrike (including NGM’s 60% share of South Arturo) on a 61.5% basis thereafter. As a result of this transaction, there is now a higher proportion of open pit ore mined and consequently, the average grade processed is lower which also aligns with the inclusion of the heap leach facilities contributed by Newmont.
Safety and Environment
Site leadership teams continue to focus their field engagements to reduce the occurrence of injuries that result from pinch-points and slips, trips and falls. As a result, Carlin achieved zero LTIs during February and March. Two LTIs were recorded during the quarter with an LTIFR of 0.96 per million hours worked versus 1.27 (three LTIs) in the previous quarter. The TRIFR for the quarter was 2.89 per million hours worked, a decrease from the previous quarter of 5.09. No Class 13 environmental incidents occurred during the quarter.
| BARRICK FIRST QUARTER 2020 | 43 | MANAGEMENT’S DISCUSSION AND ANALYSIS |
Financial Results
Q1 2020 compared to Q4 2019
Carlin’s income for the first quarter of 2020 was 15% higher than the fourth quarter of 2019 due to the higher realized gold price1 partially offset by a decrease in sales volume.
Gold production in the first quarter of 2020 was 8% lower compared to the prior quarter, primarily due to lower grades from Leeville underground and scheduled plant maintenance at the Goldstrike autoclave, partially offset by higher autoclave recoveries. In addition, production was impacted by an increase in high grade Cortez ore processed by the Carlin roasters, which displaced lower grade Carlin ore in the feed mix.
Cost of sales per ounce2 and total cash costs per ounce1 in the first quarter of 2020 were in line with the prior quarter. In the first quarter of 2020,all-in sustaining costs per ounce1 were 4% higher than the prior quarter due to higher sustaining capital expenditures.
Capital expenditures in the first quarter of 2020 were 8% higher than the prior quarter due to additional capitalized stripping at theBetze-Post open pit, and additional underground development.
Q1 2020 compared to Q1 2019
Carlin’s income for the three month period ended March 31, 2020 reflects our 61.5% interest in Nevada Gold Mines and is inclusive of income from Newmont’s former Carlin operations and the Goldstrike operations following the formation of Nevada Gold Mines on July 1, 2019. Income from Carlin for the same prior year period represents Barrick’s
100% interest in the Goldstrike operations. Consequently, this, combined with higher realized gold prices1, were the primary driver of the 84% increase in Carlin’s income compared to the first quarter of 2019.
Gold production for the three month period ended March 31, 2020 was 9% higher compared to the same prior year period, primarily due to the inclusion of Newmont’s former Carlin operations from July 1, 2019, partially offset by the reduction in Barrick’s interest in Goldstrike from 100% in the prior year period to 61.5% in the current period.
Cost of sales per ounce2 for the three month period ended March 31, 2020 was in line with the same prior year period due to a decrease in depreciation expense, primarily driven by extended asset lives based on the latest life of mine plan, offset by higher total cash costs per ounce1. Total cash costs per ounce1 for the current period was 16% higher than the same prior year period mainly due to lower grade ore processed, partially offset by the higher volumes processed through the combination of Newmont’s former Carlin operations and Goldstrike. For the three month period ended March 31, 2020,all-in sustaining costs per ounce1 increased by 13% compared to the same prior year period primarily due to the higher total cash costs per ounce1 and higher minesite sustaining capital expenditures.
Capital expenditures for the three month period ended March 31, 2020 increased by 10% mainly due to an increase in minesite sustaining capital expenditures driven by the inclusion of Newmont’s former Carlin operations in the current period.
| BARRICK FIRST QUARTER 2020 | 44 | MANAGEMENT’S DISCUSSION AND ANALYSIS |
Cortez (61.5% basis)a, Nevada USA
| Summary of Operating and Financial Data | For the three months ended | |||||||||||||||||||||||||||||||||||||||
| 3/31/20 | 12/31/19 | % Change | 3/31/19 | % Change | ||||||||||||||||||||||||||||||||||||
Total tonnes mined (000s) | 22,696 | 23,422 | (3)% | 27,572 | (18)% | |||||||||||||||||||||||||||||||||||
Open pit ore | 4,566 | 3,876 | 18 % | 4,661 | (2)% | |||||||||||||||||||||||||||||||||||
Open pit waste | 17,841 | 19,275 | (7)% | 22,523 | (21)% | |||||||||||||||||||||||||||||||||||
Underground | 289 | 271 | 7 % | 388 | (26)% | |||||||||||||||||||||||||||||||||||
Average grade (grams/tonne) | ||||||||||||||||||||||||||||||||||||||||
Open pit mined | 0.44 | 0.45 | (3)% | 0.99 | (56)% | |||||||||||||||||||||||||||||||||||
Underground mined | 10.63 | 11.58 | (8)% | 9.36 | 14 % | |||||||||||||||||||||||||||||||||||
Processed | 1.06 | 1.29 | (18)% | 1.66 | (36)% | |||||||||||||||||||||||||||||||||||
Ore tonnes processed (000s) | 4,783 | 4,259 | 12 % | 5,473 | (13)% | |||||||||||||||||||||||||||||||||||
Oxide mill | 670 | 638 | 5 % | 1,056 | (37)% | |||||||||||||||||||||||||||||||||||
Roaster | 376 | 353 | 7 % | 476 | (21)% | |||||||||||||||||||||||||||||||||||
Heap leach | 3,737 | 3,268 | 14 % | 3,941 | (5)% | |||||||||||||||||||||||||||||||||||
Recovery rate | 84 | % | 75 | % | 11 % | 85 | % | (1)% | ||||||||||||||||||||||||||||||||
Oxide Mill | 72 | % | 69 | % | 5 % | 82 | % | (12)% | ||||||||||||||||||||||||||||||||
Roaster | 88 | % | 86 | % | 2 % | 88 | % | 0 % | ||||||||||||||||||||||||||||||||
Gold produced (000s oz) | 128 | 133 | (4)% | 262 | (51)% | |||||||||||||||||||||||||||||||||||
Oxide mill | 26 | 35 | (26)% | 102 | (75)% | |||||||||||||||||||||||||||||||||||
Roaster | 77 | 81 | (5)% | 102 | (25)% | |||||||||||||||||||||||||||||||||||
Heap leach | 25 | 17 | 47 % | 58 | (57)% | |||||||||||||||||||||||||||||||||||
Gold sold (000s oz) | 128 | 132 | (3)% | 259 | (51)% | |||||||||||||||||||||||||||||||||||
Revenue ($ millions) | 203 | 194 | 5 % | 339 | (40%) | |||||||||||||||||||||||||||||||||||
Cost of sales ($ millions) | 112 | 124 | (10)% | 177 | (37)% | |||||||||||||||||||||||||||||||||||
Income ($ millions) | 89 | 69 | 29 % | 155 | (43)% | |||||||||||||||||||||||||||||||||||
EBITDA ($ millions)b | 122 | 105 | 17 % | 219 | (44)% | |||||||||||||||||||||||||||||||||||
EBITDA marginc | 60 | % | 54 | % | 11 % | 65 | % | (7)% | ||||||||||||||||||||||||||||||||
Capital expenditures ($ millions)d | 50 | 43 | 16 % | 76 | (34)% | |||||||||||||||||||||||||||||||||||
Minesite sustaining | 46 | 40 | 15 % | 13 | 254 % | |||||||||||||||||||||||||||||||||||
Project | 4 | 3 | 33 % | 63 | (94)% | |||||||||||||||||||||||||||||||||||
Cost of sales ($/oz) | 876 | 945 | (7)% | 682 | 28 % | |||||||||||||||||||||||||||||||||||
Total cash costs ($/oz)b | 614 | 681 | (10)% | 433 | 42 % | |||||||||||||||||||||||||||||||||||
All-in sustaining costs ($/oz)b | 1,009 | 1,012 | 0 % | 506 | 99 % | |||||||||||||||||||||||||||||||||||
All-in costs ($/oz)b | 1,039 | 1,039 | 0 % | 749 | 39 % | |||||||||||||||||||||||||||||||||||
| a. | On July 1, 2019, Cortez was contributed to Nevada Gold Mines, a joint venture with Newmont. As a result, the amounts presented are on an 100% basis up until June 30, 2019, and on a 61.5% basis thereafter. |
| b. | These arenon-GAAP financial performance measures with no standardized meaning under IFRS and therefore may not be comparable to similar measures presented by other issuers. For further information and a detailed reconciliation of eachnon-GAAP measure used in this section of the MD&A to the most directly comparable IFRS measure, please see pages 79 to 95 of this MD&A. |
| c. | Represents EBITDA divided by revenue. |
| d. | Amounts presented exclude capitalized interest. |
On July 1, 2019, Barrick’s Cortez operations were contributed to Nevada Gold Mines, a joint venture with Newmont. As a result, the amounts presented represent Cortez on a 100% basis up until June 30, 2019 and on a 61.5% basis thereafter.
Safety and Environment
There were zero LTIs at Cortez during the quarter which resulted in a LTIFR of zero per million hours worked, consistent with the previous quarter. The TRIFR was 4.10 per million hours worked, an increase from the zero per million hours worked in the previous quarter. No Class 13 environmental incidents occurred during the quarter.
Financial Results
Q1 2020 compared to Q4 2019
Cortez’s income for the first quarter of 2020 was 29% higher than the fourth quarter of 2019 due to the higher realized gold price1 and lower cost of sales per ounce2, partially offset by a slight decrease in sales volume.
Gold production in the first quarter of 2020 was 4% lower compared to the prior quarter, primarily due to lower grades processed at the Cortez oxide mill and Carlin roasters. This was driven by lower grade Crossroads ore processed in the current quarter, compared to the relatively higher grade Cortez Hills Open Pit (“CHOP”) oxide stockpile material processed in the previous quarter, combined with reduced mined grades at Cortez Hills Underground (“CHUG”). This
| BARRICK FIRST QUARTER 2020 | 45 | MANAGEMENT’S DISCUSSION AND ANALYSIS |
was partially offset by higher production from the heap leach as a result of additional tonnes placed on the Area 30 pad.
Cost of sales per ounce2 and total cash costs per ounce1 in the first quarter of 2020 were 7% and 10% lower, respectively, compared to the previous quarter due to lower direct operating costs. This was primarily driven by lower open pit spend from reduced maintenance and lower diesel prices, in addition to reduced roaster processing costs and higher capitalized stripping related to Crossroads. In the first quarter of 2020,all-in sustaining costs per ounce1 were in line with the prior quarter as lower total cash costs per ounce1 were offset by higher minesite sustaining capital expenditures.
Capital expenditures in the first quarter of 2020 increased by 16% compared to the prior quarter due to higher sustaining and project capital expenditures. Sustaining capital expenditures were higher relative to the fourth quarter of 2019 due to additional mining equipment for CHOP buttress work as well as higher capitalized stripping at Crossroads and higher underground development in accordance with the mine plan. Marginally higher project capital expenditures were attributed to increased spending on the Cortez Hills Underground Rangefront project as the new primary contractor ramped up in the first quarter of 2020, after the removal of the previous contractor in the fourth quarter of 2019 due to safety violations as previously disclosed.
Q1 2020 compared to Q1 2019
Cortez’s income for the three month period ended March 31, 2020 reflects the formation of Nevada Gold Mines as described above. Income from Cortez for the same prior year period represents Barrick’s 100% share of the Cortez operations. In addition to this impact, Cortez’s income was lower than the same prior year period due to a decrease in sales volume and higher cost of sales per ounce2, partially offset by the higher realized gold price1.
Gold production for the three month period ended March 31, 2020 was 51% lower due to the reduction in Barrick’s interest in Cortez from 100% in the same prior year period to 61.5% in the current period. In addition to this impact, gold production
was lower compared to the same prior year period due to lower grades processed as mining from the high grade CHOP was completed in the second quarter of 2019. This was partially offset by higher roaster production due to increased CHUG ore mined and processed.
Cost of sales per ounce2 and total cash costs per ounce1 for the three month period ended March 31, 2020 were 28% and 42% higher, respectively, than the same prior year period, due to lower grades processed as mining from CHOP was completed in the second quarter of 2019, combined with increased direct operating costs. Direct operating costs increased due to higher labor costs as well as higher variable costs that were driven by an increase in tonnes mined from CHUG and Crossroads. Additionally, there were higher processing and haulage costs resulting from the increase in tonnes transported to and processed at the Carlin roasters. For the three month period ended March 31, 2020,all-in sustaining costs per ounce1 increased by 99% compared to the same prior year period, driven by higher minesite sustaining capital expenditures in addition to the higher total cash costs per ounce1.
Capital expenditures for the three month period ended March 31, 2020 decreased by 34% from the same prior year period due to the reduction in Barrick’s interest in Cortez from 100% in the same prior year period to 61.5% in the current quarter. In addition, project capital expenditures were lower due to the end of Crossroadspre-production stripping as it transitioned to production status in the third quarter of 2019. This was combined with the ramp down in the Cortez Hills Underground Rangefront, Deep South, and Crossroads dewatering projects. The decrease in project capital expenditures was partially offset by an increase in minesite sustaining capital expenditures due to Crossroads capitalized stripping (whereas it was treated as project capital expenditures in thepre-production phase in the same prior year period), increased spending on water management, the Area 30 pad expansion and additional mining equipment for CHOP buttress work.
| BARRICK FIRST QUARTER 2020 | 46 | MANAGEMENT’S DISCUSSION AND ANALYSIS |
Turquoise Ridge (61.5%)a, Nevada USA
| Summary of Operating and Financial Data | For the three months ended | |||||||||||||||||||
3/31/20 | 12/31/19 | % Change | 3/31/19 | % Change | ||||||||||||||||
Total tonnes mined (000s) | 3,744 | 3,819 | (2)% | 191 | 1,860 % | |||||||||||||||
Open pit ore | 1,008 | 608 | 66 % | n/a | n/a | |||||||||||||||
Open pit waste | 2,502 | 2,995 | (16)% | n/a | n/a | |||||||||||||||
Underground | 234 | 216 | 8 % | 191 | 23 % | |||||||||||||||
Average grade (grams/tonne) | ||||||||||||||||||||
Open pit mined | 1.91 | 1.80 | 6 % | n/a | n/a | |||||||||||||||
Underground mined | 10.98 | 14.09 | (22)% | 15.90 | (31)% | |||||||||||||||
Processed | 3.35 | 4.28 | (22)% | 17.71 | (81)% | |||||||||||||||
Ore tonnes processed (000s) | 862 | 934 | (8)% | 155 | 456 % | |||||||||||||||
Oxide Mill | 120 | 114 | 5 % | n/a | n/a | |||||||||||||||
Autoclave | 549 | 660 | (17)% | 155 | 254 % | |||||||||||||||
Heap leach | 193 | 160 | 21 % | n/a | n/a | |||||||||||||||
Recovery rate | 84% | 86% | (3)% | 94% | (11)% | |||||||||||||||
Oxide Mill | 84% | 87% | (3)% | n/a | n/a | |||||||||||||||
Autoclave | 85% | 86% | (2)% | 94% | (10)% | |||||||||||||||
Gold produced (000s oz) | 84 | 111 | (24)% | 77 | 9 % | |||||||||||||||
Oxide Mill | 4 | 3 | 33 % | n/a | n/a | |||||||||||||||
Autoclave | 78 | 105 | (26)% | 77 | 1 % | |||||||||||||||
Heap leach | 2 | 3 | (25)% | n/a | n/a | |||||||||||||||
Gold sold (000s oz) | 87 | 99 | (11)% | 76 | 14 % | |||||||||||||||
Revenue ($ millions) | 139 | 152 | (8)% | 100 | 39 % | |||||||||||||||
Cost of sales ($ millions) | 90 | 95 | (5)% | 45 | 100 % | |||||||||||||||
Income ($ millions) | 47 | 56 | (16)% | 54 | (13)% | |||||||||||||||
EBITDA ($ millions)b | 78 | 90 | (13)% | 60 | 30 % | |||||||||||||||
EBITDA marginc | 56% | 59% | (5)% | 60% | (7)% | |||||||||||||||
Capital expenditures ($ millions) | 19 | 24 | (21)% | 16 | 19 % | |||||||||||||||
Minesite sustaining | 11 | 18 | (38)% | 7 | 58 % | |||||||||||||||
Project | 8 | 6 | 33 % | 9 | (11)% | |||||||||||||||
Cost of sales ($/oz) | 1,032 | 971 | 6 % | 592 | 74 % | |||||||||||||||
Total cash costs ($/oz)b | 668 | 625 | 7 % | 506 | 32 % | |||||||||||||||
All-in sustaining costs ($/oz)b | 806 | 800 | 1 % | 592 | 36 % | |||||||||||||||
All-in costs ($/oz)b | 903 | 863 | 5 % | 716 | 26 % | |||||||||||||||
| a. | Barrick owned 75% of Turquoise Ridge through the end of the second quarter of 2019, with our joint venture partner, Newmont, owning the remaining 25%. Turquoise Ridge was proportionately consolidated on the basis that the joint venture partners that have joint control have rights to the assets and obligations for the liabilities relating to the arrangement. The figures presented in this table are based on our 75% interest in Turquoise Ridge until June 30, 2019. On July 1, 2019, Barrick’s 75% interest in Turquoise Ridge and Newmont’s Twin Creeks and 25% interest in Turquoise Ridge were contributed to Nevada Gold Mines. Starting July 1, 2019, the results represent our 61.5% share of Turquoise Ridge and Twin Creeks, now referred to as Turquoise Ridge. |
| b. | These arenon-GAAP financial performance measures with no standardized meaning under IFRS and therefore may not be comparable to similar measures presented by other issuers. For further information and a detailed reconciliation of eachnon-GAAP measure used in this section of the MD&A to the most directly comparable IFRS measure, please see pages 79 to 95 of this MD&A. |
| c. | Represents EBITDA divided by revenue. |
Barrick owned 75% of Turquoise Ridge through to the end of the second quarter of 2019, with our joint venture partner, Newmont, owning the remaining 25%. The figures presented in this table are based on our 75% interest in Turquoise Ridge until June 30, 2019. On July 1, 2019, Barrick’s 75% interest in Turquoise Ridge and Newmont’s Twin Creeks and 25% interest in Turquoise Ridge were contributed to Nevada Gold Mines. Starting July 1, 2019, our results represent our 61.5% share of Turquoise Ridge and Twin Creeks, now referred to as Turquoise Ridge. As a result of this transaction, from July 1, 2019, Turquoise Ridge includes the Twin Creeks open pit operations resulting in considerably higher tonnes mined at a lower average grade of ore processed. It also includes the
Twin Creeks processing operations and heap leach facility contributed by Newmont.
Safety and Environment
There was one LTI during the quarter which resulted in an LTIFR of 1.49 per million hours worked versus two LTIs (LTIFR of 2.57 per million hours worked) in the previous quarter. The TRIFR for the quarter was 4.36 per million hours worked, which was an increase on the 2.57 achieved in the previous quarter. No Class 13 environmental incidents occurred during the quarter.
| BARRICK FIRST QUARTER 2020 | 47 | MANAGEMENT’S DISCUSSION AND ANALYSIS |
Financial Results
Q1 2020 compared to Q4 2019
Turquoise Ridge’s income for the first quarter of 2020 was 16% lower compared to the prior quarter, primarily due to lower sales volume, partially offset by the higher realized gold price1.
Gold production in the first quarter of 2020 was 24% lower than the prior quarter, primarily due to lower throughput reflecting maintenance activities and lower grades processed at the autoclave.
Cost of sales per ounce2 and total cash costs per ounce1 in the first quarter of 2020 were 6% and 7% higher, respectively, than the prior quarter mainly due to the impact of lower grades although this was largely offset by increased underground mining efficiencies that have resulted in lower per tonne unit costs.All-in sustaining costs per ounce1 was in line with the prior quarter, primarily reflecting higher total cash costs per ounce1 offset by lower minesite sustaining capital expenditure.
Capital expenditures in the first quarter of 2020 decreased by 21% compared to the prior quarter due to lower minesite sustaining capital expenditures, resulting from lower capitalized stripping and the timing of various underground sustaining capital projects.
Q1 2020 compared to Q1 2019
Turquoise Ridge’s income for the first quarter of 2020 reflects our 61.5% interest in Nevada Gold Mines and is inclusive of income from the Twin Creeks operations following the formation of Nevada Gold Mines on July 1, 2019. Income from Turquoise Ridge for the first quarter of 2019 represents Barrick’s 75% share of the Turquoise Ridge operations. In addition to this impact, the Turquoise Ridge assets have been
restated to fair market value as a consequence of the transaction which has resulted in a higher depreciation charge from July 1, 2019 onwards. This was the primary driver of the lower income in the current quarter relative to the same prior year period. Aside from this impact, Turquoise Ridge’s income in the current quarter also reflects increased sales volume and the higher realized gold price1, partially offset by higher cost of sales per ounce2.
Gold production for the three month period ended March 31, 2020 was 9% higher compared to the same prior year period, primarily due to the inclusion of Twin Creeks, partially offset by the reduction in Barrick’s interest in Turquoise Ridge from 75% in the same prior year period to 61.5% from July 1, 2019 onward.
Cost of sales per ounce2 for the three month period ended March 31, 2020 was 74% higher than the same prior year period reflecting the higher total cash costs per ounce1 and higher depreciation charges following the restatement to fair value as described above. For the three month period ended March 31, 2020, total cash costs per ounce1 increased by 32% compared to the same prior year period, primarily due to the impact of lower grades although this was partially offset by increased underground mining efficiencies that have resulted in lower per tonne unit costs.All-in sustaining costs per ounce1 increased by 36%, reflecting higher minesite sustaining capital expenditure combined with higher total cash costs per ounce1.
Capital expenditures for the three month period ended March 31, 2020, increased by 19% compared to the same prior year period, mainly due to an increase in underground development and the inclusion of the Twin Creeks operation.
| BARRICK FIRST QUARTER 2020 | 48 | MANAGEMENT’S DISCUSSION AND ANALYSIS |
Other Mines - Nevada Gold Mines
| Summary of Operating and Financial Data | For the three months ended | |||||||||||||||||||||||||||||||||||||||
| 3/31/20 | 12/31/19 | |||||||||||||||||||||||||||||||||||||||
Gold produced (000s oz)
| Cost of sales ($/oz)
| Total cash costs ($/oz)a
| All-in sustaining costs ($/oz)a | Capital Expend- ituresb
| Gold produced (000s oz)
| Cost of sales ($/oz)
| Total cash costs ($/oz)a
| All-in sustaining costs ($/oz)a | Capital Expend- ituresb
| |||||||||||||||||||||||||||||||
Phoenix (61.5%)c | 35 | 1,583 | 737 | 914 | 4 | 31 | 2,025 | 902 | 1,034 | 5 | ||||||||||||||||||||||||||||||
Long Canyon (61.5%)c | 26 | 1,025 | 345 | 561 | 5 | 34 | 1,026 | 317 | 657 | 10 | ||||||||||||||||||||||||||||||
| a. | These arenon-GAAP financial performance measures with no standardized meaning under IFRS and therefore may not be comparable to similar measures presented by other issuers. For further information and a detailed reconciliation of eachnon-GAAP measure used in this section of the MD&A to the most directly comparable IFRS measure, please see pages 79 to 95 of this MD&A. |
| b. | Includes both minesite sustaining and project capital expenditures. |
| c. | A 61.5% interest in these sites was acquired as a result of the formation of Nevada Gold Mines on July 1, 2019. |
Phoenix
Gold production in the first quarter of 2020 for Phoenix was 13% higher compared to the prior quarter, primarily due to higher grades and recoveries at the mill. Accordingly, cost of sales per ounce2 andall-in sustaining costs per ounce4 in the first quarter of 2020 were 22% and 12% lower, respectively, also due to higher grades and recoveries. Capital expenditures were 20% lower compared to the prior quarter due to decreased construction associated with the tailings storage facility during the quarter.
Long Canyon
Gold production for Long Canyon in the first quarter of 2020 was 24% lower compared to the fourth quarter of 2019, primarily due to leach cycle timing. Cost of sales per ounce2 in the first quarter of 2020 was in line with the prior quarter. In the first quarter of 2020,all-in sustaining costs per ounce4 decreased by 15% compared to the prior quarter primarily due to lower sustaining capital. Capital expenditures decreased by 51% compared to the prior quarter due to lower capitalized stripping as mining in Cut 7 progressed from waste stripping to mining in the main orebody. Permitting for the mine life extension continues, though currently only open pit material is included in the life of mine plan. In early April 2020, we received notification of a formal protest to the water rights applications filed as part of the permitting process with the Nevada Division of Water Resources. Our response to the protest will be submitted in May 2020.
| BARRICK FIRST QUARTER 2020 | 49 | MANAGEMENT’S DISCUSSION AND ANALYSIS |
Pueblo Viejo (60% basis)a, Dominican Republic
| Summary of Operating and Financial Data | For the three months ended | |||||||||||||||||||
| 3/31/20 | 12/31/19 | % Change | 3/31/19 | % Change | ||||||||||||||||
Open pit tonnes mined (000s) | 4,039 | 5,729 | (29)% | 7,070 | (43)% | |||||||||||||||
Open pit ore | 627 | 3,083 | (80)% | 1,739 | (64)% | |||||||||||||||
Open pit waste | 3,412 | 2,646 | 29 % | 5,331 | (36)% | |||||||||||||||
Average grade (grams/tonne) | ||||||||||||||||||||
Open pit mined | 2.21 | 2.92 | (24)% | 2.28 | (3)% | |||||||||||||||
Processed | 3.44 | 4.20 | (18)% | 3.75 | (8)% | |||||||||||||||
Autoclave ore tonnes processed (000s) | 1,471 | 1,464 | 0 % | 1,306 | 13 % | |||||||||||||||
Recovery rate | 89% | 89% | 0 % | 89% | 0 % | |||||||||||||||
Gold produced (000s oz) | 143 | 179 | (20)% | 148 | (3)% | |||||||||||||||
Gold sold (000s oz) | 144 | 174 | (17)% | 142 | 1 % | |||||||||||||||
Revenue ($ millions) | 216 | 240 | (10)% | 198 | 9 % | |||||||||||||||
Cost of sales ($ millions) | 111 | 114 | (3)% | 98 | 13 % | |||||||||||||||
Income ($ millions) | 102 | 125 | (18)% | 98 | 4 % | |||||||||||||||
EBITDA ($ millions)b | 134 | 159 | (16)% | 126 | 6 % | |||||||||||||||
EBITDA marginc | 62% | 66% | (6)% | 64% | (3)% | |||||||||||||||
Capital expenditures ($ millions) | 17 | 14 | 21 % | 16 | 6 % | |||||||||||||||
Minesite sustaining | 17 | 14 | 21 % | 16 | 6 % | |||||||||||||||
Project | 0 | 0 | 0 % | 0 | 0 % | |||||||||||||||
Cost of sales ($/oz) | 767 | 660 | 16 % | 696 | 10 % | |||||||||||||||
Total cash costs ($/oz)b | 502 | 422 | 19 % | 421 | 19 % | |||||||||||||||
All-in sustaining costs ($/oz)b | 626 | 517 | 21 % | 543 | 15 % | |||||||||||||||
All-in costs ($/oz)b | 635 | 525 | 21 % | 544 | 17 % | |||||||||||||||
| a. | Pueblo Viejo is accounted for as a subsidiary with a 40%non-controlling interest. The results in the table and the discussion that follows are based on our 60% share only. |
| b. | These arenon-GAAP financial performance measures with no standardized meaning under IFRS and therefore may not be comparable to similar measures presented by other issuers. For further information and a detailed reconciliation of eachnon-GAAP measure used in this section of the MD&A to the most directly comparable IFRS measure, please see pages 79 to 95 of this MD&A. |
| c. | Represents EBITDA divided by revenue. |
Safety and Environment
There were zero LTIs at Pueblo Viejo during the quarter which resulted in an LTIFR of zero per million hours worked, consistent with the previous quarter. The TRIFR for the quarter was 0.42 per million hours worked compared to 1.15 in the previous quarter. No Class 13 environmental incidents were reported during the quarter.
Financial Results
Q1 2020 compared to Q4 2019
Pueblo Viejo’s income for the first quarter of 2020 was 18% lower than the fourth quarter of 2019, due to lower sales volume and higher cost of sales per ounce2 partially offset by the higher realized price1.
Gold production for the first quarter of 2020 was 20% lower than the prior quarter due to the change in ore feed blend, inline with the planned mine and processing sequence. As planned, the proportion of lower grade stockpile ore in the feed blend is expected to steadily increase until the mine expansion pits are fully developed as part of the decision on the proposed plant and tailings expansion project. Mining activity during the first quarter of 2020 was focused on limestone mining to maintain strong metallurgical performance, which helped to offset the lower grades. We expect production to be lower in the second quarter of 2020 as a result of a major process plant maintenance shutdown scheduled.
Cost of sales per ounce2 for the first quarter of 2020 was 16% higher than the prior quarter primarily reflecting the impact of higher total cash costs per ounce1 and higher depreciation driven by the impairment reversal completed in the fourth quarter of 2019. Total cash costs per ounce1 for the first quarter of 2020 was 19% higher than the prior quarter due to the impact of lower grade and third-party sales from the Quisqueya power plant, partially offset by lower contractor and fuel costs. For the first quarter of 2020,all-in sustaining costs per ounce1 increased by 21%, mainly reflecting higher total cash costs per ounce1 and higher minesite sustaining capital expenditures.
Capital expenditures for the first quarter of 2020 increased by 21% compared to the prior quarter, primarily due to higher capitalized stripping costs as a result of increased waste tonnes mined.
Q1 2020 compared to Q1 2019
Pueblo Viejo’s income for the three month period ended March 31, 2020 was 4% higher than the same prior year period, driven by the higher realized gold price1 and slightly higher sales volume, partially offset by higher cost of sales per ounce2.
Gold production for the three month period ended March 31, 2020 was 3% lower than the same prior year period, due to lower head grade resulting from the change in ore feed blend,
| BARRICK FIRST QUARTER 2020 | 50 | MANAGEMENT’S DISCUSSION AND ANALYSIS |
in line with the planned mine and processing sequence. This was partially offset by higher throughput at the autoclave.
Cost of sales per ounce2 increased by 10% compared to the same prior year period as a result of lower grades and higher depreciation driven by the impairment reversal in the fourth quarter of 2019. This was partially offset by higher throughput and lower energy costs as a result of the natural gas conversion of the Quisqueya power plant. Total cash costs per ounce1 for the three month period ended March 31, 2020 was 19% higher than the same prior year period for the same reasons above, except for depreciation, together with lower third-party power sales from the Quisqueya power plant. For the three month period ended March 31, 2020,all-in
sustaining costs per ounce1 increased by 15% compared to the same prior year period reflecting higher total cash costs per ounce1, partially offset by lower sustaining capital expenditures.
Capital expenditures for the three month period ended March 31, 2020 increased by 6% compared to the same prior year period, primarily due to higher capitalized stripping as a result of a higher proportion of waste mined in 2020 in accordance with the mining sequence. This was partially offset by lower sustaining capital expenditures across the rest of the operation.
| BARRICK FIRST QUARTER 2020 | 51 | MANAGEMENT’S DISCUSSION AND ANALYSIS |
Loulo-Gounkoto (80% basis)a, Mali
| Summary of Operating and Financial Data | For the three months ended | |||||||||||||||||||
| 3/31/20 | 12/31/19 | % Change | 3/31/19 | % Change | ||||||||||||||||
Total tonnes mined (000s) | 7,572 | 7,250 | 4 % | 8,779 | (14)% | |||||||||||||||
Open pit ore | 599 | 1,080 | (45)% | 542 | 11 % | |||||||||||||||
Open pit waste | 6,405 | 5,566 | 15 % | 7,700 | (17)% | |||||||||||||||
Underground | 568 | 604 | (6)% | 537 | 6 % | |||||||||||||||
Average grade (grams/tonne) | ||||||||||||||||||||
Open pit mined | 7.47 | 5.69 | 31 % | 3.90 | 92 % | |||||||||||||||
Underground mined | 4.16 | 5.14 | (19)% | 4.46 | (7)% | |||||||||||||||
Processed | 4.96 | 5.64 | (12)% | 4.19 | 18 % | |||||||||||||||
Ore tonnes processed (000s) | 980 | 886 | 11 % | 1,011 | (3)% | |||||||||||||||
Recovery rate | 90% | 89% | 1 % | 94% | (4)% | |||||||||||||||
Gold produced (000s oz) | 141 | 144 | (2)% | 128 | 10 % | |||||||||||||||
Gold sold (000s oz) | 123 | 144 | (15)% | 128 | (4)% | |||||||||||||||
Revenue ($ millions) | 194 | 214 | (9)% | 168 | 15 % | |||||||||||||||
Cost of sales ($ millions) | 122 | 149 | (18)% | 135 | (10)% | |||||||||||||||
Income ($ millions) | 68 | 65 | 5 % | 29 | 134 % | |||||||||||||||
EBITDA ($ millions)b | 115 | 123 | (7)% | 76 | 51 % | |||||||||||||||
EBITDA marginc | 59% | 58% | 2 % | 45% | 30 % | |||||||||||||||
Capital expenditures ($ millions) | 32 | 38 | (16)% | 18 | 78 % | |||||||||||||||
Minesite sustaining | 32 | 37 | (14)% | 18 | 78 % | |||||||||||||||
Project | 0 | 1 | (100)% | 0 | 0 % | |||||||||||||||
Cost of sales ($/oz) | 1,002 | 1,037 | (3)% | 1,052 | (5)% | |||||||||||||||
Total cash costs ($/oz)b | 614 | 631 | (3)% | 684 | (10)% | |||||||||||||||
All-in sustaining costs ($/oz)b | 891 | 917 | (3)% | 840 | 6 % | |||||||||||||||
All-in costs ($/oz)b | 891 | 922 | (3)% | 840 | 6 % | |||||||||||||||
| a. | Barrick owns 80% of Société des Mines de Loulo SA and Société des Mines de Gounkoto with the Republic of Mali owning 20%. Loulo-Gounkoto is accounted for as a subsidiary with a 20%non-controlling interest on the basis that Barrick controls the asset. The results in the table and the discussion that follows are based on our 80% share inclusive of the impact of the purchase price allocation resulting from the Merger. |
| b. | These arenon-GAAP financial performance measures with no standardized meaning under IFRS and therefore may not be comparable to similar measures presented by other issuers. For further information and a detailed reconciliation of eachnon-GAAP measure used in this section of the MD&A to the most directly comparable IFRS measure, please see pages 79 to 95 of this MD&A. |
| c. | Represents EBITDA divided by revenue. |
Safety and Environment
No LTIs were recorded during the quarter with an LTIFR of zero per million hours worked, in line with the previous quarter. The TRIFR was 1.55 per million hours worked, a decrease from the previous quarter of 2.04. No Class 13 environmental incidents occurred during the quarter.
Financial Results
Q1 2020 compared to Q4 2019
Loulo-Gounkoto’s income for the first quarter of 2020 was 5% higher than the fourth quarter of 2019, primarily due to lower cost of sales per ounce2 and the higher realized gold price1, partially offset by lower sales volume.
Gold production for the first quarter of 2020 was 2% lower than the prior quarter mainly due to lower feed grade from Yalea underground partially offset by higher throughput and recovery. Lower production is expected in the second quarter of 2020,in-line with the mine plan.
Cost of sales per ounce2 for the first quarter of 2020 was 3% lower than the prior quarter, primarily due to lower depreciation expense as well as lower mining and processing costs. Total cash costs per ounce1 was 3% lower than the prior quarter for the same reasons other than depreciation. For the first quarter
of 2020,all-in sustaining costs per ounce1 decreased by 3% compared to the prior quarter as a result of lower total cash costs per ounce1 and lower minesite sustaining capital expenditures.
Capital expenditures for the first quarter of 2020 decreased by 16% compared to the prior quarter, primarily due to a decrease in minesite sustaining capital. The reduction in minesite sustaining capital expenditure was across the Complex with the exception of an increase in capitalized stripping at Gounkoto and an increase in capitalized drilling.
Q1 2020 compared to Q1 2019
Loulo-Gounkoto’s income for the first quarter of 2020 was 134% higher than the same prior year period, primarily due to the higher realized gold price1 and lower cost of sales per ounce2, slightly offset by lower sales volume.
Gold production in the three month period ended March 31, 2020 was 10% higher compared to the same prior year period, primarily due to the higher feed grade processed from Yalea underground and the Gounkoto South pit.
Cost of sales per ounce2 for the first quarter of 2020 was 5% lower than the same prior year period primarily due to lower
| BARRICK FIRST QUARTER 2020 | 52 | MANAGEMENT’S DISCUSSION AND ANALYSIS |
mining costs and lower depreciation, partially offset by higher processing costs. Total cash costs per ounce1 was 10% lower than the prior year mainly due to the impact of lower mining costs, partially offset by higher processing costs. For the first quarter of 2020,all-in sustaining costs per ounce1 increased by 6% compared to the same prior year period reflecting higher minesite sustaining capital expenditures, partially offset by lower total cash costs per ounce1.
Capital expenditures in the three month period ended March 31, 2020 increased by 78% compared to the same prior year period driven by higher underground development and drilling in Gara and Yalea, capitalized stripping at Gounkoto and other minesite sustaining capital across the Complex.
Regulatory Matters
On September 29, 2019, Mali adopted an ordinance introducing a new Mining Code of the Republic of Mali (the “2019 Mining Code”), which was ratified by the Malian National Assembly on April 28, 2020. The 2019 Mining Code cancels and replaces LawNo. 2012-015 dated February 27, 2012 (the “2012 Mining Code”) and governs the mining industry going forward. The implementation decree to the 2019 Mining Code remains under discussion.
Under the transitory provisions of the 2019 Mining Code,pre-existing mining titles and mining conventions in force remain valid for their remaining term and their holders continue to benefit from the stability of the tax and customs regime set out therein.
In addition, each of Loulo and Gounkoto (which together form Loulo-Gounkoto) and Morila have separate legally binding establishment conventions with the State of Mali, which guarantee the stability of the regime set out therein, govern applicable taxes and allow for international arbitration in the event of disputes. Refer to note 17 of the Financial Statements for more information.
| BARRICK FIRST QUARTER 2020 | 53 | MANAGEMENT’S DISCUSSION AND ANALYSIS |
Kibali (45% basis)a, Democratic Republic of Congo
| Summary of Operating and Financial Data | ||||||||||||||||||||
| 3/31/20 | 12/31/19 | % Change | 3/31/19 | % Change | ||||||||||||||||
Total tonnes mined (000s) | 3,175 | 3,096 | 3 % | 3,162 | 0 % | |||||||||||||||
Open pit ore | 375 | 346 | 8 % | 652 | (42)% | |||||||||||||||
Open pit waste | 2,333 | 2,290 | 2 % | 2,078 | 12 % | |||||||||||||||
Underground | 467 | 460 | 2 % | 432 | 8 % | |||||||||||||||
Average grade (grams/tonne) | ||||||||||||||||||||
Open pit mined | 2.12 | 2.21 | (4)% | 2.34 | (9)% | |||||||||||||||
Underground mined | 5.16 | 4.68 | 10 % | 5.39 | (4)% | |||||||||||||||
Processed | 3.77 | 3.67 | 3 % | 3.89 | (3)% | |||||||||||||||
Ore tonnes processed (000s) | 838 | 839 | 0 % | 840 | 0 % | |||||||||||||||
Recovery rate | 89% | 88% | 1 % | 89% | 0 % | |||||||||||||||
Gold produced (000s oz) | 91 | 87 | 5 % | 93 | (2)% | |||||||||||||||
Gold sold (000s oz) | 88 | 89 | (1)% | 90 | (2)% | |||||||||||||||
Revenue ($ millions) | 140 | 130 | 8 % | 117 | 20 % | |||||||||||||||
Cost of sales ($ millions) | 93 | 106 | (12)% | 108 | (14)% | |||||||||||||||
Income ($ millions) | 48 | 30 | 60 % | 10 | 380 % | |||||||||||||||
EBITDA ($ millions)b | 89 | 82 | 9 % | 66 | 35 % | |||||||||||||||
EBITDA marginc | 64% | 63% | 2 % | 56% | 13 % | |||||||||||||||
Capital expenditures ($ millions) | 15 | 9 | 67 % | 10 | 50 % | |||||||||||||||
Minesite sustaining | 15 | 9 | 67 % | 9 | 67 % | |||||||||||||||
Project | 0 | 0 | 0 % | 1 | (100)% | |||||||||||||||
Cost of sales ($/oz) | 1,045 | 1,205 | (13)% | 1,202 | (13)% | |||||||||||||||
Total cash costs ($/oz)b | 582 | 608 | (4)% | 573 | 2 % | |||||||||||||||
All-in sustaining costs ($/oz)b | 773 | 740 | 4 % | 673 | 15 % | |||||||||||||||
All-in costs ($/oz)b | 773 | 746 | 4 % | 676 | 14 % | |||||||||||||||
| a. | Barrick owns 45% of Kibali Goldmines SA (Kibali) with the Democratic Republic of Congo (“DRC”) and our joint venture partner, AngloGold Ashanti, owning 10% and 45%, respectively. Kibali is accounted for as an equity method investment on the basis that the joint venture partners that have joint control have rights to the net assets of the joint venture. The figures presented in this table and the discussion that follows are based on our 45% effective interest in Kibali inclusive of the impact of the purchase price allocation resulting from the Merger. |
| b. | These arenon-GAAP financial performance measures with no standardized meaning under IFRS and therefore may not be comparable to similar measures presented by other issuers. For further information and a detailed reconciliation of eachnon-GAAP measure used in this section of the MD&A to the most directly comparable IFRS measure, please see pages 79 to 95 of this MD&A. |
| c. | Represents EBITDA divided by revenue. |
Safety and Environment
Kibali sustained one LTI during the quarter, which resulted in an LTIFR of 0.29 per million hours worked, compared to zero in the prior quarter. The TRIFR was 2.59 per million hours worked, an increase on the 1.78 that was achieved the previous quarter. No Class 13 environmental incidents occurred during the quarter.
Financial Results
Q1 2020 compared to Q4 2019
Kibali’s income for the first quarter of 2020 was 60% higher than the fourth quarter of 2019, primarily due to the higher realized gold price1 as well as lower cost of sales per ounce2.
Gold production for the first quarter of 2020 was 5% higher than the prior quarter due to improved underground feed grade mined and processed, in addition to maintaining throughput and recovery in line with the prior quarter.
Cost of sales per ounce2 for the first quarter of 2020 was 13% lower than the prior quarter, primarily due to decreased depreciation expense relating to the fair value increments resulting from the purchase price allocation, as well as higher grade and lower operating costs. Total cash costs per ounce1 was 4% lower than the prior quarter due to higher grade and
lower operating costs resulting from increased capitalized stripping levels and lower reagent costs.
For the first quarter of 2020,all-in sustaining costs per ounce1 increased by 4% compared to the prior quarter in spite of decreased total cash costs per ounce1, as sustaining capital expenditures increased compared to the prior quarter.
Capital expenditures for the first quarter of 2020 increased by 67% mainly due to higher capitalized drilling and underground development.
Q1 2020 compared to Q1 2019
Kibali’s income for the three month period ended March 31, 2020 was 380% higher than the first quarter of 2019, mainly due to the higher realized gold price1 and lower cost of sales per ounce2.
Gold production in the three month period ended March 31, 2020 was 2% lower compared to the same prior year period, primarily due to slightly decreased feed grade in the current period, in line with the mine plan.
Cost of sales per ounce2 and total cash costs per ounce1 in the three month period ended March 31, 2020 were 13% lower
| BARRICK FIRST QUARTER 2020 | 54 | MANAGEMENT’S DISCUSSION AND ANALYSIS |
and 2% higher, respectively. Cost of sales per ounce2 was lower as a result of lower depreciation expense relating to the fair value increment from the purchase price allocation as well as lower power costs, resulting from an improved hydro power blend, reducing our reliance on diesel power generation in comparison with the same prior year period. The slightly lower grade was also the key driver of higher total cash costs per ounce1 compared to the same prior year period partially offset by the lower power costs. For the three month period ended March 31, 2020,all-in sustaining costs per ounce1 were 15%
higher compared to the same prior year period due to the higher total cash costs per ounce1 and increased sustaining capital expenditures.
Capital expenditures in the three month period ended March 31, 2020 were 50% higher than the first quarter of 2019, mainly due to increased capital development meters achieved in the underground, higher capitalized stripping and additional capitalized drilling.
| BARRICK FIRST QUARTER 2020 | 55 | MANAGEMENT’S DISCUSSION AND ANALYSIS |
Veladero (50% basis)a, Argentina
| Summary of Operating and Financial Data | For the three months ended | |||||||||||||||||||
| 3/31/20 | 12/31/19 | % Change | 3/31/19 | % Change | ||||||||||||||||
Open pit tonnes mined (000s) | 8,280 | 10,277 | (19)% | 8,848 | (6)% | |||||||||||||||
Open pit ore | 3,871 | 4,828 | (20)% | 3,599 | 8 % | |||||||||||||||
Open pit waste | 4,409 | 5,449 | (19)% | 5,249 | (16)% | |||||||||||||||
Average grade (grams/tonne) | ||||||||||||||||||||
Open pit mined | 0.74 | 0.80 | (8)% | 0.70 | 6 % | |||||||||||||||
Processed | 0.80 | 0.88 | (9)% | 0.75 | 7 % | |||||||||||||||
Heap leach ore tonnes processed (000s) | 3,243 | 3,880 | (16)% | 3,416 | (5)% | |||||||||||||||
Gold produced (000s oz) | 75 | 71 | 6 % | 70 | 7 % | |||||||||||||||
Gold sold (000s oz) | 57 | 70 | (19)% | 68 | (16)% | |||||||||||||||
Revenue ($ millions) | 90 | 106 | (15)% | 91 | (1%) | |||||||||||||||
Cost of sales ($ millions) | 67 | 82 | (18)% | 81 | (17)% | |||||||||||||||
Income ($ millions) | 24 | 21 | 14 % | 10 | 140 % | |||||||||||||||
EBITDA ($ millions)b | 46 | 50 | (8)% | 40 | 15 % | |||||||||||||||
EBITDA marginc | 51% | 47% | 8 % | 44% | 16 % | |||||||||||||||
Capital expenditures ($ millions) | 40 | 28 | 43 % | 40 | 0 % | |||||||||||||||
Minesite sustaining | 25 | 28 | (11)% | 25 | 0 % | |||||||||||||||
Project | 15 | 0 | 100 % | 15 | 0 % | |||||||||||||||
Cost of sales ($/oz) | 1,182 | 1,138 | 4 % | 1,195 | (1)% | |||||||||||||||
Total cash costs ($/oz)b | 788 | 710 | 11 % | 713 | 11 % | |||||||||||||||
All-in sustaining costs ($/oz)b | 1,266 | 1,142 | 11 % | 1,100 | 15 % | |||||||||||||||
All-in costs ($/oz)b | 1,537 | 1,142 | 35 % | 1,325 | 16% | |||||||||||||||
| a. | Barrick owns 50% of Veladero with our joint venture partner, Shandong Gold, owning the remaining 50%. Veladero is proportionately consolidated on the basis that the joint venture partners that have joint control have rights to the assets and obligations for the liabilities relating to the arrangement. The figures presented in this table and the discussion that follows are based on our 50% interest in Veladero inclusive of the impact of remeasurement of our interest in Veladero following the disposal of a 50% interest on June 30, 2017. |
| b. | These arenon-GAAP financial performance measures with no standardized meaning under IFRS and therefore may not be comparable to similar measures presented by other issuers. For further information and a detailed reconciliation of eachnon-GAAP measure used in this section of the MD&A to the most directly comparable IFRS measure, please see pages 79 to 95 of this MD&A. |
| c. | Represents EBITDA divided by revenue. |
Safety and Environment
Veladero continues to deliver a high standard of safety with one LTI recorded during the quarter, resulting in a LTIFR of 0.37 per million hours worked versus 0.87 in the previous quarter. The TRIFR for the quarter was 0.75 per million hours worked, a decrease on the 3.03 achieved in the previous quarter. No Class 13 environmental incidents occurred during the quarter.
Minera Andina del Sol SRL, the joint venture company that operates the Veladero mine, is the subject of various regulatory proceedings related to operational incidents occurring in March 2017, September 2016 and September 2015. Refer to note 17 to the Financial Statements for more information regarding these and related matters.
Financial Results
Q1 2020 compared to Q4 2019
Veladero’s income for the first quarter of 2020 was 14% higher than the fourth quarter of 2019 primarily due to the higher realized gold price1, partially offset by lower sales volume.
Gold production in the first quarter of 2020 was 6% higher than the prior quarter as a result of higher recoveries. This impact was partially offset by lower head grade and a decrease in fresh ore stacked on the leach pad due to the suspension of mining operations following the implementation of quarantine and movement restrictions by the national
government of Argentina on March 19, 2020 in response to the coronavirus pandemic. The quarantine restrictions were lifted on April 3, 2020, with mining being declared an essential activity, and while social distancing requirements have limited the remobilization of employees and contractors back to site, operations ramped up to near normal levels by the end of April. This is expected to have an impact on second quarter production.
Effective for the period of September 2018 to December 31, 2020, exports of doré at Veladero were subject to a 12% duty, capped at ARS 4.00 per USD exported. On December 14, 2019, the President of Argentina abolished the exchange rate limit applied to the calculation of export duties (previously ARS 4 for each $1). On December 23, 2019, the Argentine Congress enacted an emergency law setting a lower maximum rate for mining export duties at 8%; however, this emergency law had not yet entered into force in the first quarter of 2020. Concurrent with Barrick seeking the immediate implementation of the reduced 8% cap for customs purposes, we also recorded lower sales volumes in the first quarter of 2020 due to a deferred sales strategy to minimize export duties paid at higher rates. A legal injunction (writ of Amparo) was issued in favor of Veladero in March 2020 and the reduced 8% cap for custom purposes was implemented for all doré shipments starting in April 2020. The reduced 8% cap was also applied retroactively from December 23, 2019
| BARRICK FIRST QUARTER 2020 | 56 | MANAGEMENT’S DISCUSSION AND ANALYSIS |
and we are analyzing our options to recover any excess payment since that time.
Cost of sales per ounce2 and total cash costs per ounce1 in the first quarter of 2020 increased by 4% and 11%, respectively, mainly due to the impact of lower sales volume and increased export duties as discussed above. This was partially offset by lower processing costs due to reduced leach pad orere-handling and maintenance costs. In the first quarter of 2020,all-in sustaining costs per ounce1 increased by 11% compared to the prior quarter due to higher total cash costs per ounce1.
Capital expenditures were 43% higher compared to the previous quarter mainly due to higher project capital expenditures. Project capital expenditures mainly relate to the final unconditional payment of $15 million made during the first quarter of 2020 for the funding of a power transmission line in Argentina as a result of an agreement made with the Provincial Power Regulatory Body of San Juan (“EPRE”). Additional payments will only be required when the Pascua-Lama project commences production. Sustaining capital expenditures in the first quarter of 2020 were lower than the prior quarter mainly due to projects that were deferred during March 2020 following the implementation of quarantine and movement restrictions by the national government of Argentina.
Q1 2020 compared to Q1 2019
Veladero’s income for the three month period ended March 31, 2020 was 140% higher due to the higher realized gold price1 partially offset by lower sales volume.
Gold production for the three month period ended March 31, 2020 was 7% higher than the same prior year period, primarily due to higher head grade of ore processed, combined with
leach pad recovery initiatives resulting in improved recoveries on material stacked in prior periods and a reduction in pad inventories. These impacts were partially offset by a decrease in fresh ore stacked on the leach pad due to the suspension of mining operations following the implementation of quarantine and movement restrictions by the national government of Argentina in March 2020 in response to the coronavirus pandemic.
Cost of sales per ounce2 for the three month period ended March 31, 2020 was in line with the same prior year period. Total cash costs per ounce1 was 11% higher than the same prior year period, primarily due to lower sales volume and lower capitalized stripping. For the three month period ended March 31, 2020,all-in sustaining costs per ounce1 increased by 15% compared to the same prior year period, mainly attributed to higher total cash costs per ounce1 and higher sustaining capital expenditures on a per ounce basis.
Capital expenditures for the three month period ended March 31, 2020 were in line with the same prior year period.
Regulatory Matters
On September 1, 2019, the Argentine government issued Decree 609/2019 announcing currency restrictions in Argentina (the “Decree”). Subsequently, the Argentine Central Bank issued Communication “A” 6770 complementing the Decree. As a result, export proceeds were required to be converted into Argentine pesos within 5 days, which was later extended to 180 days. Dividend distributions and payments to foreign suppliers now require specific authorizations from the Central Bank. These currency restrictions, which became effective immediately, continue to have limited impact on operations.
| BARRICK FIRST QUARTER 2020 | 57 | MANAGEMENT’S DISCUSSION AND ANALYSIS |
Porgera (47.5% basis)a, Papua New Guinea
| Summary of Operating and Financial Data | For the three months ended | |||||||||||||||||||
| 3/31/20 | 12/31/19 | % Change | 3/31/19 | % Change | ||||||||||||||||
Total tonnes mined (000s) | 2,809 | 2,880 | (2)% | 2,964 | (5)% | |||||||||||||||
Open pit ore | 427 | 509 | (16)% | 391 | 9 % | |||||||||||||||
Open pit waste | 2,170 | 2,124 | 2 % | 2,363 | (8)% | |||||||||||||||
Underground | 212 | 247 | (14)% | 210 | 1 % | |||||||||||||||
Average grade (grams/tonne) | ||||||||||||||||||||
Open pit mined | 1.71 | 2.07 | (17)% | 1.84 | (7)% | |||||||||||||||
Underground mined | 5.82 | 7.86 | (26)% | 6.99 | (17)% | |||||||||||||||
Processed | 2.98 | 3.94 | (24)% | 3.19 | (7)% | |||||||||||||||
Autoclave ore tonnes processed (000s) | 736 | 705 | 4 % | 673 | 9 % | |||||||||||||||
Recovery rate | 90% | 92% | (2)% | 96% | (6)% | |||||||||||||||
Gold produced (000s oz) | 62 | 82 | (24)% | 66 | (6)% | |||||||||||||||
Gold sold (000s oz) | 63 | 82 | (23)% | 65 | (3)% | |||||||||||||||
Revenue ($ millions) | 101 | 123 | (18%) | 86 | 17 % | |||||||||||||||
Cost of sales ($ millions) | 70 | 75 | (7)% | 68 | 3 % | |||||||||||||||
Income ($ millions) | 29 | 44 | (34)% | 18 | 61 % | |||||||||||||||
EBITDA ($ millions)b | 39 | 56 | (30)% | 29 | 34 % | |||||||||||||||
EBITDA marginc | 39% | 46% | (14)% | 34% | 16 % | |||||||||||||||
Capital expenditures ($ millions) | 8 | 11 | (27)% | 8 | 0 % | |||||||||||||||
Minesite sustaining | 8 | 11 | (27)% | 8 | 0 % | |||||||||||||||
Project | 0 | 0 | 0 % | 0 | 0 % | |||||||||||||||
Cost of sales ($/oz) | 1,097 | 909 | 21 % | 1,031 | 6 % | |||||||||||||||
Total cash costs ($/oz)b | 941 | 757 | 24 % | 854 | 10 % | |||||||||||||||
All-in sustaining costs ($/oz)b | 1,089 | 894 | 22 % | 978 | 11 % | |||||||||||||||
All-in costs ($/oz)b | 1,089 | 894 | 22 % | 978 | 11 % | |||||||||||||||
| a. | Barrick owns 47.5% of Porgera with our joint venture partners, Zijin Mining and Mineral Resources Enga, owning the remaining 47.5% and 5%, respectively. Porgera is proportionately consolidated on the basis that the joint venture partners that have joint control have rights to the assets and obligations for the liabilities relating to the arrangement. The figures presented in this table and the discussion that follows are based on our 47.5% interest in Porgera. |
| b. | These arenon-GAAP financial performance measures with no standardized meaning under IFRS and therefore may not be comparable to similar measures presented by other issuers. For further information and a detailed reconciliation of eachnon-GAAP measure used in this section of the MD&A to the most directly comparable IFRS measure, please see pages 79 to 95 of this MD&A. |
| c. | Represents EBITDA divided by revenue. |
Safety and Environment
There was one LTI at Porgera during the quarter, which resulted in an LTIFR of 0.33 per million hours worked versus 1.04 in the previous quarter. The TRIFR for the quarter was 1.31 per million hours worked compared to 1.04 in the previous quarter. No Class 13 environmental incidents occurred during the quarter.
Financial Results
Q1 2020 compared to Q4 2019
Porgera’s income for the first quarter of 2020 was 34% lower than the fourth quarter of 2019 primarily due to lower sales volume reflecting lower gold production and an increase in cost of sales per ounce2, partially offset by the higher realized gold price1.
Gold production in the first quarter of 2020 was 24% lower than the prior quarter, primarily due to lower ore grade mined and processed. Lower grades in the open pit and underground operations were related to mine sequencing.
Cost of sales per ounce2 and total cash costs per ounce1 in the first quarter of 2020 increased by 21% and 24%, respectively, mainly due to the impact of the lower feed grade. In the first quarter of 2020,all-in sustaining costs per ounce1
increased by 22% compared to the prior quarter due to the increase in total cash costs per ounce1, partially offset by lower minesite sustaining capital expenditures.
Capital expenditures in the first quarter of 2020 decreased by 27% compared to the prior quarter, mainly due to lower capitalized stripping and equipment purchases completed in the prior quarter.
Q1 2020 compared to Q1 2019
Porgera’s income for the three month period ended March 31, 2020 was 61% higher than the same prior year period primarily due to the higher realized gold price1, partially offset by higher cost of sales per ounce and lower sales volume .
Gold production for the three month period ended March 31, 2020 was 6% lower than the same prior year period, primarily due to lower head grades and recoveries.
In the first quarter of 2020, cost of sales per ounce2 and total cash costs per ounce1 increased by 6% and 10%, respectively, mainly due to the impact of the lower feed grade and recoveries.All-in sustaining costs per ounce1 in the first quarter of 2020 increased by 11% compared to the same prior
| BARRICK FIRST QUARTER 2020 | 58 | MANAGEMENT’S DISCUSSION AND ANALYSIS |
year period, mainly due to the increase in total cash costs per ounce1.
For the three month period ended March 31, 2020, capital expenditures remained relatively consistent compared to the same prior year period.
Porgera Special Mining Lease Extension
Porgera’s current Special Mining Lease (“SML”) terminated on August 16, 2019. The Company applied for a20-year extension of the SML in June 2017 and has been engaging with the government on this matter since then. On August 2, 2019, the National Court of Papua New Guinea ruled that the provisions of the country’s 1992 Mining Act applied to the Porgera gold mine, thus allowing it to continue operating while the application to extend its Special Mining Lease was being considered. Also in 2019, in response to a request from Papua New Guinea Prime Minister Marape, the Company proposed a benefit-sharing arrangement that would deliver more than half the economic benefits from the Porgera mine to Papua New Guinea stakeholders, including the Government, for 20 years.
On April 24, 2020, Barrick Niugini Limited (“BNL”), the majority owner and operator of the Porgera joint venture, received a communication from the Government of Papua New Guinea that the SML will not be extended. The Company believes the Government’s decision not to extend the SML is tantamount to nationalization without due process and in violation of the Government’s legal obligations to BNL. The Company remains willing to discuss the issue with Prime Minister Marape and his government in light of the potentially catastrophic impact of this decision for the communities at Porgera and in the Enga Province, and for the country as a whole. BNL will pursue all legal avenues to challenge the Government’s decision and to recover any damages that BNL may suffer as a result of the Government’s decision. The Company will not discuss transitional arrangements for the management of the Porgera mine, as proposed by the Government, as this is not consistent with BNL’s rights, which were confirmed by the National Court’s decision in August 2019. Based on the communication we received from the Government of Papua New Guinea that the SML will not be extended, Porgera was placed on temporary care and maintenance on April 25, 2020 to ensure the safety and security of our employees and communities.
On April 28, 2020, BNL filed a Judicial Review action against the Government of Papua New Guinea in the Papua New Guinea National Court of Justice. Judicial review is a proceeding that challenges the procedural and constitutional adequacy of government administrative actions. The Judicial Review action seeks to quash the decision not to extend the SML on the grounds that the Government did not comply with the applicable legal standards and processes. BNL asked the National Court for a stay of the decision not to extend the SML to enable BNL to stay in possession of the mine to put it on temporary care and maintenance and to protect the mine’s assets. After a hearing on April 30, 2020, the National Court ordered that BNL could stay in possession of the Porgera mine “to ensure that the environment, the integrity of the mine and the rights of the landowners are not compromised” and ordered the Government of Papua New Guinea to cooperate with that objective. The National Court also ordered the parties to engage in substantive negotiations regarding the issues in
the case and to return to the Court to report on progress on May 8, 2020.
Our priority remains the health and safety of all our employees and community stakeholders. Due to the uncertainty related to the timing and scope of future developments on the mine’s operating outlook, we are withdrawing our full year 2020 guidance for Porgera at this time. As this is a rapidly evolving situation, we will reassess on an ongoing basis and provide further updates in due course, while maintaining operational readiness.
Porgera Tax Audits
On April 9, 2020, BNL received a position paper from the Internal Revenue Commission (“IRC”) in Papua New Guinea asserting various proposed adjustments and other taxes amounting to $191 million (not including potential penalties) arising from tax audits of BNL conducted for 2006 through 2015. The IRC provided BNL with an opportunity to respond to the position paper by June 30, 2020 and BNL intends to respond by that date. The Company has reviewed the IRC position paper and concluded that there is no merit to the proposed adjustments, except for certain immaterial items for which a provision had already been made. The Company intends to defend its position vigorously and has not recorded any additional estimated amounts for the potential liability arising from the IRC position paper.
| BARRICK FIRST QUARTER 2020 | 59 | MANAGEMENT’S DISCUSSION AND ANALYSIS |
North Mara (84% basis)a, Tanzania
| Summary of Operating and Financial Data | For the three months ended | |||||||||||||||||||
| 3/31/20 | 12/31/19 | % Change | 3/31/19 | % Change | ||||||||||||||||
Total tonnes mined (000s) | 2,448 | 3,529 | (31)% | 2,368 | 3 % | |||||||||||||||
Open pit ore | 1,158 | 1,854 | (38)% | 654 | 77 % | |||||||||||||||
Open pit waste | 993 | 1,288 | (23)% | 1,544 | (36)% | |||||||||||||||
Underground | 297 | 387 | (23)% | 170 | 75 % | |||||||||||||||
Average grade (grams/tonne) | ||||||||||||||||||||
Open pit mined | 2.04 | 2.12 | (4)% | 1.85 | 10 % | |||||||||||||||
Underground mined | 4.13 | 5.30 | (22)% | 5.75 | (28)% | |||||||||||||||
Processed | 3.42 | 4.78 | (28)% | 3.00 | 14 % | |||||||||||||||
Ore tonnes processed (000s) | 636 | 714 | (11)% | 477 | 33 % | |||||||||||||||
Recovery rate | 93% | 94% | (1)% | 92% | 1 % | |||||||||||||||
Gold produced (000s oz) | 65 | 103 | (37)% | 42 | 55 % | |||||||||||||||
Gold sold (000s oz) | 70 | 103 | (32)% | 43 | 63 % | |||||||||||||||
Revenue ($ millions) | 111 | 153 | (27)% | 56 | 97% | |||||||||||||||
Cost of sales ($ millions) | 66 | 105 | (37)% | 46 | 43 % | |||||||||||||||
Income ($ millions) | 49 | 52 | (6)% | 9 | 448 % | |||||||||||||||
EBITDA ($ millions)b | 70 | 87 | (20)% | 22 | 222 % | |||||||||||||||
EBITDA marginc | 63% | 57% | 11 % | 39% | 63 % | |||||||||||||||
Capital expenditures ($ millions) | 13 | 16 | (19)% | 7 | 86 % | |||||||||||||||
Minesite sustaining | 11 | 15 | (27)% | 6 | 83 % | |||||||||||||||
Project | 2 | 1 | 100 % | 1 | 100 % | |||||||||||||||
Cost of sales ($/oz) | 959 | 1,021 | (6)% | 1,064 | (10)% | |||||||||||||||
Total cash costs ($/oz)b | 646 | 675 | (4)% | 755 | (14)% | |||||||||||||||
All-in sustaining costs ($/oz)b | 816 | 830 | (2)% | 944 | (14)% | |||||||||||||||
All-in costs ($/oz)b | 838 | 840 | 0 % | 985 | (15)% | |||||||||||||||
| a. | Formerly part of Acacia Mining plc. On September 17, 2019, Barrick acquired all of the shares of Acacia it did not own. The results are on a 63.9% basis until September 30, 2019 (notwithstanding the completion of the Acacia transaction on September 17, 2019, we consolidated our interest in Acacia and recorded anon-controlling interest of 36.1% in the income statement for the entirety of the third quarter of 2019 as a matter of convenience), on a 100% basis from October 1, 2019 to December 31, 2019 and on a 84% basis starting January 1, 2020, the date the GoT’s 16% free carried interest was made effective. |
| b. | These arenon-GAAP financial performance measures with no standardized meaning under IFRS and therefore may not be comparable to similar measures presented by other issuers. For further information and a detailed reconciliation of eachnon-GAAP measure used in this section of the MD&A to the most directly comparable IFRS measure, please see pages 79 to 95 of this MD&A. |
| c. | Represents EBITDA divided by revenue. |
On January 24, 2020, Barrick announced that the Company had ratified the creation of Twiga at a signing ceremony with the President of Tanzania, formalizing the establishment of a joint venture between Barrick and the GoT and resolution of all outstanding disputes between Barrick and the GoT, including the lifting of the previous concentrate export ban, effective immediately. Effective January 1, 2020, the GoT received a free carried shareholding of 16% in each of the Tanzania mines (Bulyanhulu, Buzwagi and North Mara), a 16% interest in the shareholder loans owed by the operating companies and will receive half of the economic benefits from the Tanzanian operations from taxes, royalties, clearing fees and participation in all cash distributions made by the mines and Twiga, after the recoupment of capital investments. Twiga will provide management services to the mines.
Safety and Environment
No LTIs were recorded at North Mara during the quarter, which resulted in an LTIFR of zero per million hours worked, compared to 0.62 in the prior quarter. The TRIFR was 0.53 per million hours worked, which is a decrease on the 1.24 recorded in the previous quarter. No Class 13 environmental incidents occurred during the quarter.
Financial Results
Q1 2020 compared to Q4 2019
North Mara’s income for the first quarter of 2020 was 6% lower than the fourth quarter of 2019, as the GoT’s 16% interest was made effective as of January 1, 2020, which decreased our attributable share of income to 84% compared to 100% in the prior quarter. This was partially offset by the higher realized gold price1.
In the first quarter of 2020, gold production was 37% lower than the prior quarter resulting from the decrease in our attributable share from 100% to 84% and was further impacted by lower grades mined and processed from the Nyabirama open pit and Gokona underground,in-line with the mine plan.
Cost of sales per ounce2 and total cash costs per ounce1 in the first quarter of 2020 were 6% and 4% lower, respectively, due to lower general and administrative expenses and lower processing costs as a result of cost control measures implemented since the acquisition of the Acacia Mining plc minority interest in the third quarter of 2019.All-in sustaining costs per ounce1 in the first quarter of 2020 was 2% lower than the prior quarter, mainly due to lower total cash costs per ounce1, partially offset by higher minesite sustaining capital expenditures on a per ounce basis.
| BARRICK FIRST QUARTER 2020 | 60 | MANAGEMENT’S DISCUSSION AND ANALYSIS |
Capital expenditures in the first quarter of 2020 were 19% lower compared to the fourth quarter of 2019 mainly due to the 16% decrease in our attributable share.
Q1 2020 compared to Q1 2019
North Mara’s income for the three month period ended March 31, 2020 was 448% higher than the same prior year period, mainly due to higher sales volume, lower cost of sales per ounce2 and the higher realized gold price1. This was further impacted by the change in our percentage ownership from 63.9% in the same prior year period to 84% in the current period.
For the three month period ended March 31, 2020, gold production was 55% higher than the same prior year period due to the increase in our ownership interest. In addition to this impact, gold production was higher primarily due to increased tonnes from Gokona underground leading to a higher feed grade processed as well as higher throughput.
Cost of sales per ounce2 and total cash costs per ounce1 in the three month period ended March 31, 2020 were 10% and 14% lower, respectively, than the same prior year period primarily reflecting the impact of higher grade, combined with lower direct mining, processing and general and administrative costs as a result of cost control measures implemented since the acquisition of the Acacia Mining plc minority interest in the third quarter of 2019.All-in sustaining costs per ounce1 in the first quarter of 2020 was 14% lower than the same prior year period mainly due to lower total cash costs per ounce1, partially offset by higher minesite sustaining capital expenditures on a per ounce basis.
For the three month period ended March 31, 2020, capital expenditures increased by 86% compared to the same prior year period primarily due to the increase in our ownership interest.
| BARRICK FIRST QUARTER 2020 | 61 | MANAGEMENT’S DISCUSSION AND ANALYSIS |
Other Mines - Gold
| Summary of Operating and Financial Data | For the three months ended | |||||||||||||||||||||||||||||||||||||||
| 3/31/20 | 12/31/19 | |||||||||||||||||||||||||||||||||||||||
| Gold produced (000s oz) | Cost of sales ($/oz) | Total cash costs ($/oz)a | All-in sustaining costs ($/oz)a | Capital Expend- ituresb | Gold produced (000s oz) | Cost of sales ($/oz) | Total cash costs ($/oz)a | All-in sustaining costs ($/oz)a | Capital Expend- ituresb | |||||||||||||||||||||||||||||||
Tongon (89.7%) | 61 | 1,368 | 762 | 788 | 1 | 61 | 1,476 | 803 | 867 | 3 | ||||||||||||||||||||||||||||||
Hemlo | 57 | 1,119 | 945 | 1,281 | 19 | 54 | 1,632 | 1,091 | 1,380 | 15 | ||||||||||||||||||||||||||||||
Buzwagic | 22 | 1,373 | 1,275 | 1,288 | 0 | 28 | 1,235 | 1,144 | 1,169 | 0 | ||||||||||||||||||||||||||||||
Bulyanhuluc | 7 | 1,685 | 686 | 906 | 2 | 9 | 1,293 | 752 | 909 | 1 | ||||||||||||||||||||||||||||||
Kalgoorlie (50%)d | 36 | 1,127 | 940 | 1,172 | 6 | |||||||||||||||||||||||||||||||||||
| a. | These arenon-GAAP financial performance measures with no standardized meaning under IFRS and therefore may not be comparable to similar measures presented by other issuers. For further information and a detailed reconciliation of eachnon-GAAP measure used in this section of the MD&A to the most directly comparable IFRS measure, please see pages 79 to 95 of this MD&A. |
| b. | Includes both minesite sustaining and project capital expenditures. |
| c. | Formerly part of Acacia Mining plc. On September 17, 2019, Barrick acquired all of the shares of Acacia it did not own. The results are on a 100% basis from October 1, 2019 to December 31, 2019 and on a 84% basis starting January 1, 2020, the date the GoT’s 16% free carried interest was made effective. |
| d. | On November 28, 2019, we completed the sale of our 50% interest in Kalgoorlie in Western Australia to Saracen Mineral Holdings Limited for total cash consideration of $750 million. The transaction resulted in a gain of $408 million for the year ended December 31, 2019. The operating results reported for Kalgoorlie reflect the Company’s attributable share of Kalgoorlie’s results until the date of disposal. |
Tongon (89.7% basis), Côte d’Ivoire
Gold production for Tongon in the first quarter of 2020 was in line with the prior quarter. Cost of sales per ounce2 in the first quarter of 2020 was 7% lower than the prior quarter as a result of lower depreciation charges and lower total cash costs per ounce1. The decrease in total cash costs per ounce1 was primarily driven by lower processing and mining costs.All-in sustaining costs per ounce1 in the first quarter of 2020 decreased by 9%, mainly due to the decrease in total cash costs per ounce1 and lower minesite sustaining capital.
Hemlo, Ontario, Canada
Hemlo’s gold production in the first quarter of 2020 was 6% higher than the prior quarter due to processing higher grades from the underground at theC-Zone combined with processing higher grade open pit stockpiles to maintain throughput. Cost of sales per ounce2 and total cash costs per ounce1 in the first quarter of 2020 were 31% and 13% lower, respectively, than the prior quarter primarily due to the impact of higher grades. In the first quarter of 2020,all-in sustaining costs per ounce1 decreased by 7% compared to the prior quarter primarily due to lower total cash costs per ounce1, partially offset by higher minesite sustaining capital expenditures.
Buzwagi, Tanzania
Gold production for Buzwagi in the first quarter of 2020 was 21% lower compared to the fourth quarter of 2019, as the GoT’s 16% free-carried interest was made effective as of January 1, 2020, which decreased our attributable share of production to 84% compared to 100% in the prior quarter. Both cost of sales per ounce2 andall-in sustaining costs per ounce1 in the first quarter increased by 11% and 10%, respectively, mainly due to higher cyanide prices as well as increased lime and cyanide consumption due to feed blend characteristics.
Bulyanhulu, Tanzania
Gold production for Bulyanhulu in the first quarter of 2020 was 22% lower compared to the fourth quarter of 2019, as the GoT’s 16% free-carried interest was made effective as of January 1, 2020, which decreased our attributable share of production to 84% compared to 100% in the prior quarter. Cost of sales per ounce2 in the first quarter of 2020 was 30% higher than the prior quarter, mainly due to increased depreciation, partially offset by lower total cash costs per ounce1 which was driven by lower processing as well as general and administration costs.All-in sustaining costs per ounce1 were in line with the prior quarter, primarily due to lower total cash costs per ounce1, offset by increased minesite capital expenditures related to refurbishment projects in connection with the restart.
| BARRICK FIRST QUARTER 2020 | 62 | MANAGEMENT’S DISCUSSION AND ANALYSIS |
Other Mines - Copper
| Summary of Operating and Financial Data | For the three months ended | |||||||||||||||||||||||||||||||||||||||
| 3/31/20 | 12/31/19 | |||||||||||||||||||||||||||||||||||||||
| Copper production (millions of pounds) | Cost of sales ($/lb) | C1 cash costs ($/lb)a | All-in sustaining costs ($/lb)a | Capital Expend- ituresb | Copper production (millions of pounds) | Cost of sales ($/lb) | C1 cash costs ($/lb)a | All-in sustaining costs ($/lb)a | Capital Expend- ituresb | |||||||||||||||||||||||||||||||
Lumwana | 64 | 1.94 | 1.63 | 2.26 | 25 | 63 | 2.22 | 2.10 | 3.41 | 37 | ||||||||||||||||||||||||||||||
Zaldívar (50%) |
| 31 |
|
| 2.39 |
|
| 1.71 |
|
| 1.99 |
|
| 15 |
|
| 36 |
|
| 2.59 |
|
| 1.95 |
|
| 2.56 |
|
| 21 |
| ||||||||||
Jabal Sayid (50%) |
| 20 |
|
| 1.28 |
|
| 0.97 |
|
| 1.11 |
|
| 2 |
|
| 18 |
|
| 1.47 |
|
| 1.29 |
|
| 1.78 |
|
| 7 |
| ||||||||||
| a. | These arenon-GAAP financial performance measures with no standardized meaning under IFRS and therefore may not be comparable to similar measures presented by other issuers. For further information and a detailed reconciliation of eachnon-GAAP measure used in this section of the MD&A to the most directly comparable IFRS measure, please see pages 79 to 95 of this MD&A. |
| b. | Includes both minesite sustaining and project capital expenditures. |
Lumwana, Zambia
Copper production for Lumwana in the first quarter of 2020 was 2% higher than the prior quarter as increased feed grade outweighed lower throughput resulting from a decrease in crushing and milling availabilities during the period. Cost of sales per pound2 in the first quarter of 2020 was 13% lower than the prior quarter as a result of lower C1 cash costs per pound1, partially offset by higher depreciation. C1 cash costs per pound1 were lower as a result of the improved feed grade, lower general and administrative expenses as well as lower concentrate marketing unit costs. Additionally, C1 cash costs per pound1 benefited from the improvement in copper sales compared to the fourth quarter of 2019 following the completion of a major refurbishment in January at a third-party smelter that processes a portion of Lumwana’s concentrate. In the first quarter of 2020,all-in sustaining costs per pound1 were lower than the prior quarter, mainly due to lower C1 cash costs per pound1 and decreased sustaining capital expenditures.
Zaldívar (50% basis), Chile
Copper production for Zaldívar in the first quarter of 2020 was 14% lower than the prior quarter mainly due to lower grades and recoveries. Cost of sales per pound2 in the first quarter of 2020 was 8% lower than the prior quarter primarily due to a favorable exchange rate and lower input consumable costs.All-in sustaining costs per pound1 decreased by 22% compared to the prior quarter primarily due to lower C1 cash costs per pound1 and reduced sustaining capital expenditures resulting from lower capitalized stripping and the timing of capital projects.
Jabal Sayid (50% basis), Saudi Arabia
Jabal Sayid’s copper production in the first quarter of 2020 was 11% higher compared to the prior quarter, owing to strong throughput levels and improved recoveries with feed grade remaining in line for the period. Cost of sales per pound2 in the first quarter of 2020 was 13% lower than the prior quarter, primarily due to the impact of increased production volumes and lower processing costs. C1 cash costs per pound1 were lower mainly as a result of higher goldby-product credits.All-in sustaining costs per pound1 in the first quarter of 2020 decreased by 38% when compared to the prior quarter as a result of lower C1 cash costs per pound1 and decreased sustaining capital expenditures resulting from the timing of capital projects.
| BARRICK FIRST QUARTER 2020 | 63 | MANAGEMENT’S DISCUSSION AND ANALYSIS |
Growth Project Updates
Goldrush Complex, Nevada, USA
At the Goldrush Complex, drilling operations at both Goldrush and Fourmile have resumed. The main objectives for this drilling program include defining the edge of the orebody, orebody continuity, inferred resource addition and exploration upside definition.
The geotechnical mining rock mass model is being integrated into the mine planning process to determine the optimal mining method for the orebody morphology and ground conditions. Mine design is currently progressing well with an initial high-level schedule expected to be completed early in the third quarter of 2020.
Work on a localized dewatering model continues to progress well. The initial mine plan produced as part of the final feasibility study will continue to be based on the more conservative regional dewatering model, however, upside potential will be studied in the second quarter for possible inclusion in future mine planning iterations. This approach will result in reduced risks to the startup mine plan in the short to medium term, while still allowing the project to benefit from any opportunities identified by moving to a localized dewatering strategy in the medium to long term.
Construction of the twin exploration declines at Goldrush continues to progress ahead of schedule and achieved 1,229 meters of total development, an improvement of 231 meters compared to the 998 meters that was budgeted for the first quarter of 2020. Overall progress status stands at 74% (from 61% as at the end of the fourth quarter of 2019) and the forecast decline completion date remains November 2020. As at March 31, 2020, we have spent $145 million (including $15 million in the first quarter of 2020) on the Goldrush project, inclusive of the exploration declines (100% basis). The current capital estimate for the Goldrush project is approximately $1.0 billion (100% basis), subject to the completion of the final Goldrush feasibility study.
Permitting activities continue to advance largelyon-track for the first quarter of 2020. We are currently in the process of responding to questions that have been raised by the Bureau of Land Management (“BLM”) on the Plan of Operations submitted in September 2019. Based on a schedule provided by the BLM, we continue to expect receipt of a Record of Decision in the fourth quarter of 2021,in-line with plan. The water rights applications for consumptive andnon-consumptive water use for the project was approved in April 2020.
We continue to expect updated mining physicals in the third quarter of 2020 and the final Goldrush feasibility study to be completed in the first quarter of 2021.
Turquoise Ridge Third Shaft, Nevada, USA4
Construction of the third shaft at Turquoise Ridge, which has a hoisting capacity of 5,500 tonnes per day, continues to advance according to schedule and within budget, with efforts in the first quarter of 2020 focused solely on the continuance of sinking activities with the shaft liner advancing to a depth of 356 meters below collar by the end of the quarter. To date, we have spent $130 million (including $11.5 million in the first quarter of 2020) out of an estimated capital cost of approximately$300-$330 million (100% basis).
Pueblo Viejo Plant and Tailings Expansion Study, Dominican Republic5
Studies for the process plant and tailings expansion at the Pueblo Viejo mine remain supportive of an increase in throughput, allowing the operation to maintain average annual gold production of approximately 800,000 ounces after 2022 (100% basis).
The Pueblo Viejo process plant expansion study flowsheet includes an additional primary crusher, coarse ore stockpile and ore reclaim delivering to a new single stage semi-autogenous grinding (SAG) mill. A new flotation circuit will concentrate the bulk of the sulfide ore prior to oxidation. The concentrate will be blended with fresh milled ore to feed the modified autoclave circuit, which will have additional oxygen supplied from a new 3,000 tonnes per day facility. The existing autoclaves will be upgraded to increase the sulfur processing capacity of each autoclave through additional high-pressure cooling water and recycle flash capability using additional slurry pumping and thickening.
Engineering design of the flowsheet progressed during the quarter and was used to update the project schedule and cost estimates as well as development of the project execution plan.
The process plant expansion environmental impact study is complete and ready for submission. The study for additional tailings capacity to support the expansion of the process plant continues. The field work for baseline environmental assessment and geotechnical investigation has commenced, though temporarily impacted by recent health quarantine measures in the Dominican Republic. We continue discussions with the national authorities to obtain the necessary permitting to proceed.
Zaldívar Chloride Leach Project, Chile
Zaldívar is jointly owned by Antofagasta and Barrick, and is operated by Antofagasta.
In December 2019, the Board of Compańía Minera Zaldívar approved the Chloride Leach Project. The capital cost of the project of $189 million (100% basis) consists of the cost of execution and commissioning as well as a joint venture board-controlled contingency provision. The project contemplates the construction of a chloride dosing system, an upgrade of the solvent extraction plant and the construction of additional washing ponds.
Work started on site, mainly constructing the camp facilities for the construction team and installing access as well aslay-down areas for the work fronts at the solution extraction section of the plant. The detailed engineering and purchasing of long lead items continue. The construction and assembly contract has been awarded to a major Chilean construction company and they have started working on the detailed execution plan and installing office and warehouse facilities at site. Recent travel and isolation restrictions in Chile in response to the coronavirus pandemic have temporarily delayed full scale mobilization of the construction and assembly contractors, but efforts are underway to minimize the delay and its resulting impacts.
| BARRICK FIRST QUARTER 2020 | 64 | MANAGEMENT’S DISCUSSION AND ANALYSIS |
Upon completion, the project is expected to increase copper recoveries by more than 10 percent through the addition of chlorides to the leach solution and with further potential upside in recoveries possible depending on the type of ore being processed. This process is based on a proprietary technology called CuproChlor® that was developed by Antofagasta at its Michilla operation, which had similar ore types to those that are processed at Zaldívar. Once completed and in full operation, the project is expected to increase production at Zaldívar by approximately10-15 thousand tonnes per annum of copper at lower operating costs over the remaining life of mine.
Veladero Power Transmission Project, Chile-Argentina
In 2019, we commenced construction of an extension to the existing Pascua-Lama power transmission line to connect to the Veladero mine. When completed in the second half of 2020, the power transmission line will allow Veladero to
Exploration and Mineral Resource Management
North America
Nevada Gold Mines, Nevada, USA
Drilling resumed in late January with eight drills evenly split between the Carlin and Cortez districts. A total of 17,057 meters of drilling was completed during the quarter. At Cortez, 11,448 meters were completed testing four targets, including framework drilling on two earlier stage projects. At Carlin, 5,609 meters were completed testing three targets, including framework drilling on two earlier stage projects.
Within the Cortez district, a large area covered by post-mineral basalt and gravel east of Goldrush was drilled. Three holes on kilometer spacing continued to build a geological framework critical to identifying concealed targets. One of the three holes intersected favorable alteration at the same stratigraphic position hosting Goldrush mineralization two kilometers to the east of the deposit. Samples have been dispatched with results expected early in the second quarter of 2020.
Moving to the Carlin Trend, threesub-district geological models were substantially upgraded during the quarter. Drilling on the north Carlin Trend proved challenging with two holes lost prior to testing the target. Reassessment of the drilling strategy is in progress as both targets warrant testing. One hole filling a large gap in Little Boulder Basin was in progress at the end of the quarter. The hole has intersected significant alteration and complicated structure that will materially change the geological interpretation. Further south at Gold Quarry, one hole stepping a kilometer southwest of the pit along the Chukar Fault was completed at the end of the first quarter. The hole crossed a narrow zone of alteration in the Chukar Fault after encountering thicker than expected upper plate lithologies. Another hole stepping to the southwest of the Chukar Footwall deposit will continue to build the geological framework.
At Turquoise Ridge, the geological model continues to be upgraded as data mining andre-logging advances. The model and work related to upgrade the geological understanding has identified multiple targets including open-ended mineralization and untested structural intersections in favorable host rock below the mine. These targets will be tested starting in the second quarter of 2020.
convert to grid power exported from Chile and cease operating the current high-cost diesel generation power plant located at site. A power purchase price agreement was also executed during the fourth quarter of 2019 to supply power from renewable energy that will significantly reduce Veladero’s carbon footprint.
The construction of the project advanced to 71% completion with the majority of the 220kV and the 23kV towers already erected. Construction and assembly work continue in the sub-stations at Lama and Veladero. In late March 2020, the Argentinian and San Juan authorities imposed restrictive isolation measures and closed national and provincial borders fornon-essential travel. We anticipate that work will be able to recommence once restrictions are fully lifted and weather conditions allow.
Generative activities have made steady progress toward building a regional scale model of the Roberts Mountains Thrust connecting the Carlin Trend with the Battle Mountain-Eureka Trend.
Fourmile, Nevada, USA6
At Fourmile, drilling successfully extended mineralization to the west and downdip of the resource on nominal 100 to 200 meters spacing. Assays from two holes were returned during the quarter. Both holes intersected mineralization along the Anna Fault, an important feeder structure identified in 2019. Highlight intercepts of 5.8 meters at 27.1 g/t and 3.0 meters at 39.6 g/t from one of the two holes indicate significant expansion potential at depth where mineralization remains open. Additional assays are pending for visually altered zones from several more drill holes.
Results from drilling in the fourth quarter of 2019 that was testing the northernmost end of the structural corridor hosting Fourmile were returned in the first quarter. The hole intersected 4.6 meters at 9.0 g/t. This significant result is located 900 meters north of the discovery announced in the third quarter of 2019, extending the fertile corridor north into a large untested area.
A hole drilled within and on the western extent of Fourmile provided geological constraints in the footwall of the Horse Canyon fault. While the hole provided new insight about low angle faulting and duplicated favorable stratigraphy, the limited alteration has encouraged us to target another kilometer plusstep-out hole for the next test.
Hemlo, Ontario, Canada
Drilling the down-plunge extension toC-Zone was ongoing through the quarter with 860 meters completed by one underground drill. One drill hole was completed with assays returned in the first quarter of 2020, while a second hole had intersected all planned targets and was nearing the target depth at the end of the quarter.
Drilling completed this quarter successfully demonstrated that the plunge ofC-Zone mineralization and fold structures remain consistent to at least 500 meters below current resources and a kilometer below existing development. The results from this quarter’s drilling fill gaps in the geological and
| BARRICK FIRST QUARTER 2020 | 65 | MANAGEMENT’S DISCUSSION AND ANALYSIS |
structural framework for theC-Zone at depth and provide additional data for testing the300-series further west along strike.
Activities in the second quarter of 2020 will focus on data mining the dormant Golden Giant and David Bell mines in support of targeting extensions as well as reinitiating district scale exploration after years of inactivity.
Latin America & Asia Pacific
Pueblo Viejo, Dominican Republic7
Mineral Resource Management (“MRM”) remained focused on a quarterly update of the site 3D geological model, building on the framework defined during 2019. Grade control drilling and detailed pit mapping was used to redefine some of the structural controls to mineralization and tighten localized spatial controls. This information was utilized to define the estimation of input variables as direct links to geological units, eliminating the previous use of ‘grade-shell domaining’ to compensate for a lack of geological controls. MRM also focused on a first principle rebuild of the 3D geological models defining the limestone quarry. This effort provided a significant upgrade to the limestone quality predictions within the models and should reduce plan to actual variances going-forward. At Mejita, a new concept for controls to high grade mineralization is being tested, which if validated could expose a high-grade corridor southward to an open area that has recorded elevated goldin-soils.
Drill testing of targets generated from the integrated geological model and a renewed understanding on the controls to mineralization continued during the first quarter of 2020. To the east and northeast of Mejita, historic goldin-soil anomalies grading +100 ppb Au are in part coincident with the projection of a northeast ore controlling structure from the Moore Pit, in an area coincident with newly mapped phreatomagmatic breccias. Drill testing intersected high grade mineralization related to pervasive silicification with fine grained pyrite(DPV19-747, 11.5 meters at 5.3 g/t from 207 meters). Potential exists to the northeast along the Moore structural corridor and possibly to the northwest, along an emerging structural corridor towards the Cumba deposit.
An updated structural framework commenced during the first quarter of 2020. This work is already providing new insights into the structural controls to mineralization, such as movement vectors which will have a significant impact to targeting for extensions or offsets to the known orebodies. This work will not only support additional targeting within Pueblo Viejo, but will also be integral to understanding district potential.
Dominican Republic
Early in the second quarter of 2020, Barrick executed a $10 million explorationearn-in agreement with Precipitate Gold on the Pueblo Grande property surrounding Pueblo Viejo, whereby Barrick can earn up to a 70% interest through phased exploration programs, expenditure commitments, and delivery of a prefeasibility study within a six year timeframe. The property has potential for high grade, structurally controlled Cumba-like targets and the potential to extend the mine life through discoveries.
Veladero, Argentina
At Veladero, drill testing during the first quarter of 2020 resulted in the downgrading of two targets, Coiron and Fabiana. With field activities restricted at the end of the quarter, desktop work commenced to establish a high confidence structural framework for the district, which could open up new concepts and corridors for targeting. Foundational to this framework will be the generation of a 3D geological model for the district. Initially based on the compilation and integration of extensive legacy datasets, the model will be augmented with sectional mapping when field activities resume.
MRM focused its efforts on an update of the deposit 3D geological model which will utilize over 150,000 meters ofre-logged drilling, and an entire series ofre-interpreted 50 to 100 meters spaced litho-structural, alteration and mineralization sections. The principal focus of this model update is on the inclusion of multiple late stage silicification alteration events that recentre-logging and core drilling identified as potential controls to higher grade mineralization within the Veladero orebody. MRM drilling during 2020 will focus on testing the newly modeled mineralization controls and infill drilling the life of mine plan. At the district level, two brownfield targets have been delineated for drill testing this upcoming summer, while three other areas of interest have been identified for follow up activities such as mapping, sampling and geophysics.
Porgera, Papua New Guinea
The focus during the quarter was on the execution of a drill program targeting the potential expansion of the open pit, into the Wangima zone. Historical wide-spaced drill results, combined with preliminary geophysical survey responses and surface sampling, indicated the possibility of a continuation of stacked structurally controlled lenses extending along strike within an interpreted intrusive corridor.
The program is geologically designed as multi-phase and will be calibrated as results become available and geology is confirmed. Preliminary results support the extension of both the intrusive corridor and repetition of stacked structures within the Western and Central areas of the program. Drilling in the Eastern target primarily returned intercepts ofnon-favourable host geology (black sediments) and as a result, this portion of the program was terminated. Drilling was then redirected into the Western and Central zones.
As discussed on page 32, Porgera has been placed on temporary care and maintenance and consequently, all exploration activities have ceased.
Alturas-Del Carmen, Argentina and Chile8
Drill testing of four priority litho-structural targets in theAlturas-Del Carmen camp, incorporating newly defined high-grade controls to mineralization, commenced during the first quarter of 2020. Favorable alteration was intersected at two targets: Chibolita and Brecha Sur. Located between the Alturas and Rojo Grande deposits, a 300 meter long north-northwest corridor of alteration has been delineated at Chibolita. Results from the first hole returned 71 meters at 1.56 g/t Au from 157 meters(DDH-DCA-41). The potential to the north has been poorly tested and follow up drilling 200 meters south has intersected more than 150 meters of favorable silicification alteration. Results are pending. At Brecha Sur, south-southeast of Alturas, a phreatomagmatic center and favorable silicification alteration was confirmed, however the primary
| BARRICK FIRST QUARTER 2020 | 66 | MANAGEMENT’S DISCUSSION AND ANALYSIS |
target resides in Argentina and is expected to be drill tested in April.
Lagunas Norte, Peru
At Lagunas Norte, a drill program was designed and commenced to test multiple geological concepts for controls to mineralization on the peripheries of the deposit including: diatreme and hydrothermal breccias at the border of intrusions, hydrothermal breccias and diatremes along faults, and unexplained resistive anomalies.
At La Capilla, a program of 11 diamond drill holes for 2,300 meters was completed to delineate the extent of outcropping oxide mineralization defined by channel sampling and centered on a maar-diatreme complex over a 750 meter by 1 kilometer area. Mineralization to date is predominantly localized on the southern margin of the complex, extending over a400-meter strike. Final drill hole results are pending, at which time an economic assessment of the oxide mineralization will commence. This project is less than 10 kilometers east of Lagunas Norte and could provide near-term oxide material.
MRM continues to rebuild the 3D geological model from a first principle reconstruction of the property databases and datasets. The mineralization controls for the refractory sulfide mineralization (“PMR”) are being extensively reviewed and remodeled, through a comprehensive update to the Lagunas Norte litho-structural, alteration and mineralization models. A significant data compilation program commenced during the first quarter of 2020 to capture all historical drilling, production sampling (blast holes) and pit mapping to ensure the foundation for the new model is based on all available data. The updated geological model will form the foundation of a new resource andgeo-metallurgical model for use in both an updated project study, and an infill and expansion drill program is planned for the second half of 2020.
Pascua-Lama, Argentina and Chile
At Pascua-Lama, the new project team continues to focus on a compilation and validation of all historical geological and metallurgical data to improve the 3D models. All historical data is being digitized and scanned into software to allow a comprehensive review and update to the 3D deposit model. Upon completion, a drill program will be designed to validate the model. This drilling is contemplated for this coming summer.
Africa & Middle East
Bambadji, Senegal9
At Bambadji, the Reverse Circulation (RC) drill program testing auger anomalies under suppressive regolith along the12-plus kilometer Gefa-Maliki corridor was completed. Wide spaced drilling delineated a continuous system with potential economic zones at Gefa South and Gefa Main, including highlight intercepts of 18.0 meters at 1.20 g/t, including 8.0 meters at 2.40 g/t, and 22.0 meters at 1.42 g/t, including 8.0 meters at 2.22 g/t, respectively. These targets warrant further follow up; however, the focus has shifted towards emerging trends in the central and northern part of the permit where potential for high grade mineralization has been identified.
Thesix-plus kilometer long Latifa-Fava Corridor is one of these emerging trends where past drilling returned some high grade intercepts and where new strong saprolite anomalies have been delineated along strike of these targets through
the current auger program, which are supported by the recently completed Gradient Array Induced Polarization (GAIP) survey. Follow up drilling has now started testing these targets with results expected in the second quarter of 2020. In the western part of the permit, the auger program and review of historic targets has highlighted potential for mineralized breccia systems adjacent to the Faleme iron-skarn. These targets will also be subject to follow up drilling in the second quarter of 2020.
Loulo-Gounkoto, Mali10
At Loulo, the extension of the Yalea Transfer Zone was further confirmed withstep-out drilling 320 meters to the south. Infill grade control and further step out drilling is underway, with the aim of extending the system over a480-meter strike length south of the current block model. At Loulo 3, scout drilling targeting three interpreted higher-grade plunging shoots, representing an800-meter strike extension of the MZ2 system, will resume in the second quarter of 2020. Scout drilling in the Loulo 2/3 gap zone defined a 400 meter higher grade panel within the central part of the target, with highlight intercepts of 3.60 meters at 41.31 g/t. An emerging hanging wall zone has also been identified over a 475 meter strike length with key intercepts including 3.10 meters at 27.39 g/t and 3.00 meters at 2.96 g/t, highlighting additional upside potential which may improve pit economics and the strip ratio. Follow up greenfield targets along the Yalea Structure and Yalea Ridge has commenced with auger drilling and field mapping. Drill testing of the targets generated is planned to commence in the second quarter of 2020.
At Gounkoto, astep-out hole on the MZ1 North shoot returned 17.55 meters at 8.75 g/t demonstrating significant underground potential in this part of the system. Follow up drilling is planned in the second quarter of 2020 to investigate this potential. A greenfield RC drill program testing for the extension of the Gounkoto Domain Boundary, approximately 2 kilometers south of the Gounkoto main pit, successfully intersected the mineralized structure. Assays included 6.00 meters at 4.12 g/t and 8.00 meters at 3.35 g/t.Step-out drilling along this structure will continue in the second quarter of 2020. Elsewhere in Mali, generative work continues with permit scale due diligence including data review and mapping underway in the Kenieba-Kedougou Inlier and in Mali South.
Tongon, Côte d’Ivoire
On the Nielle permit, a deep diamond program was completed beneath the $1,500/oz pit shell of the Mercator project. In addition, an RC program infilled the northern limit of the Mercator pit and tested its northern extension. Both programs confirmed the geological continuity of the systemdown-dip and along strike. Initial results of are-logging program across the entire Mercator system supports the continuity of the main mineralized system with limited structural complexity. A new geological model will be delivered in the second quarter of 2020 for estimation and pit optimization. A generative review across the entire permit was initiated, which resulted in an updated structural, geochemical and geological framework. To date, 11 new targets have been identified. These targets will be validated, ranked and exploration programs will commence in the second quarter of 2020 with the aim of increasing the resource inventory to potentially extend Tongon’s mine life.
| BARRICK FIRST QUARTER 2020 | 67 | MANAGEMENT’S DISCUSSION AND ANALYSIS |
Regional Exploration, Côte d’Ivoire
Drilling and trenching programs were completed on three priority targets on the Mankono and Sissedougou permits. Current results from Lokolo, Koban and Gbongogo North do not show potential for standalone deposits. Meanwhile work progressed in parallel at generating a last set of highly prospective targets. Results from infill soil programs completed in the north of the Sissedougou permit generated a total of four large kilometer scale soil anomalies which are currently being validated with mapping, sampling and pitting. The auger program across the large laterite plateau covering gaps between the two historicAN-V and IV targets has been completed. Results are pending.
At Boundiali, work completed on the remaining targets on the Syama corridor confirm the low prospectivity of the structure on our permit to host a deposit passing our investment filters. On the Nafoun and Tengrela North permits, field work is progressing to bring the permits to a decision point. In south eastern Côte d’Ivoire, stream sampling across the Comoe-Ketesso Basin catchments is expected to be completedmid-2020 when coronavirus pandemic related travel bans are lifted.
Kibali and Ngayu Belt, Democratic Republic of Congo
At Kibali, drilling to test down plunge continuity of the KCD system in a 500 meterstep-out hole is underway, targeting the 3000, 5000 and 9000 lodes expected to be reached during the second quarter of 2020. This hole aims to confirm the geological model supporting the extension of KCD, 600 meters below the current haulage level and the existing down plunge extension that is amidst grade control conversion drilling. At Pakaka, drilling has commenced to test the down-plunge model for evaluation of a potential underground project. At Kalimva, a review conducted over the deposit confirmed the continuity of three empirical high-grade shoots that could potentially support an underground project. Initial definition drilling is planned to verify and understand these shoots in the third quarter of 2020. At Oere, along the KZ North structure, a third phase of drill testing the system at depth and along strike was completed. Results highlighted down dip continuity for an underground opportunity in addition to a potential satellite open pit resource in the northern part of the prospect. Greenfields exploration continued to investigate anomalous bulk leach extractable gold (BLEG) catchment basins through soil sampling and field mapping to continue generating and feeding the target pipeline.
Regional reconnaissance work is continuing across the Ngayu Belt with ten areas of interest identified which are presently being assessed with ongoing mapping, lithosampling and trenching. Preparations with rig mobilization are underway to drill test priority targets in the second quarter of 2020, weather permitting.
North Mara and Buzwagi, Tanzania
Building on progress from the last quarter,re-logging to extend the new Gokona geological model 1.5 kilometers eastward along strike through the Nyabigena Main and Nyabigena East mineralized system is advancing with the aim to deliver an initial geological model in the second quarter of 2020. Scout drilling is also scheduled to test the potential for resource extensions at depth beneath the current pit at Nyabigena to support a larger pitcut-back.
Observations from the new Gokona geological model have been applied to complete integrated target generation and ranking within our license areas. A total of ten conversion, resource extension, and conceptual near mine targets have been generated along the Gokona mineralized trend. Drilling on priority resource conversion targets at Gokona Upper West and Upper East is underway and results arein-line with the model.
At Buzwagi, preliminary analysis of exploration upside beneath the pit highlights underground potential, located in the new Samaki Shoot target as well as the Main Zone mineralized shear. Scout drilling is planned in the second quarter of 2020.
Jabal Sayid, Kingdom of Saudi Arabia11
At Jabal Sayid, following the remodeling of Lodes 2 and 4, drill testing of extensions to these lodes has progressed with positive outcomes. Drill hole JSSE001 confirmed a125-meter plus eastern extension to Lode 4 East intersecting 18.8 meters at 3.88% copper, demonstrating the feeder zone remains open eastwards. Surface geology with copper showings and geophysical anomalies indicate a potential extension to the same system withstep-out holes planned for the second quarter of 2020.
At Lode 2, drilling confirmed a significant northwest extension with actual intersection results expected in the second quarter of 2020. The Lode 2 Deeps underground drill program commenced with the objective to extend mineralization by over 200 vertical meters. During the second quarter of 2020, the exploration focus will shift to generating and testing greenfields targets with the potential to host new lodes.
| BARRICK FIRST QUARTER 2020 | 68 | MANAGEMENT’S DISCUSSION AND ANALYSIS |
REVIEW OF FINANCIAL RESULTS
Revenue
($ millions, except per ounce/pound data in dollars) | For the three months ended | |||||||||||
| 3/31/20 | 12/31/19 | 3/31/19 | ||||||||||
Gold | ||||||||||||
000s oz solda | 1,220 | 1,413 | 1,365 | |||||||||
000s oz produceda | 1,250 | 1,439 | 1,367 | |||||||||
Market price ($/oz) | 1,583 | 1,481 | 1,304 | |||||||||
Realized price ($/oz)b | 1,589 | 1,483 | 1,307 | |||||||||
Revenue | 2,593 | 2,758 | 1,906 | |||||||||
Copper | ||||||||||||
millions lbs solda | 110 | 91 | 103 | |||||||||
millions lbs produceda | 115 | 117 | 106 | |||||||||
Market price ($/lb) | 2.56 | 2.67 | 2.82 | |||||||||
Realized price ($/lb)b | 2.23 | 2.76 | 3.07 | |||||||||
Revenue | 99 | 82 | 163 | |||||||||
Other sales | 29 | 43 | 24 | |||||||||
Total revenue | 2,721 | 2,883 | 2,093 | |||||||||
| a. | Includes our equity share of gold ounces from Tanzania (results are on a 63.9% basis until September 30, 2019 (notwithstanding the completion of the Acacia transaction on September 17, 2019, we consolidated our interest in Acacia and recorded anon-controlling interest of 36.1% in the income statement for the entirety of the third quarter of 2019 as a matter of convenience), on a 100% basis from October 1, 2019 to December 31, 2019 and on a 84% basis starting January 1, 2020, the date the GoT’s 16% free carried interest was made effective), Pueblo Viejo, Loulo- Gounkoto, Tongon, Kibali, Morila and copper pounds from Zaldívar and Jabal Sayid. Starting July 1, 2019, it also includes our 61.5% share of Nevada Gold Mines. |
| b. | Realized price is anon-GAAP financial performance measure with no standardized meaning under IFRS and therefore may not be comparable to similar measures of performance presented by other issuers. For further information and a detailed reconciliation of eachnon-GAAP measure used in this section of the MD&A to the most directly comparable IFRS measure, please see pages 79 to 95 of this MD&A. |
Q1 2020 compared to Q4 2019
In the first quarter of 2020, gold revenues decreased by 6% compared to the fourth quarter of 2020 primarily due to lower gold sales volume, partially offset by the higher realized gold price1. The average market price for the three month period ended March 31, 2020 was $1,583 per ounce versus $1,481 per ounce for the prior quarter. During the first quarter of 2020, the gold price ranged from $1,452 per ounce to $1,703 per ounce, a seven-year high, and closed the quarter at $1,609 per ounce. Gold prices in the quarter were volatile as a result of the impact on financial markets from the current and expected economic effects of the spread of coronavirus. In particular, gold’s seven-year high resulted from a reduction in global interest rates, including US10-year Treasuries falling toall-time lows, and investors purchasing gold as a safe haven investment and store of value.
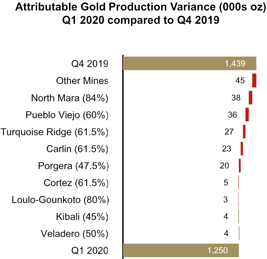
In the first quarter of 2020, gold production on an attributable basis was 189 thousand ounces lower than the prior quarter, primarily due to lower grades at North Mara, Pueblo Viejo, Turquoise Ridge and Porgera. This was combined with a decrease in our attributable production at North Mara, Bulyanhulu and Buzwagi from 100% to 84%, as well as the sale of our 50% interest in Kalgoorlie.
Copper revenues in the first quarter of 2020 increased by 21% compared to the prior quarter, primarily due to higher copper sales volume partially offset by the lower realized copper price1. The average market price in the first quarter of 2020 was $2.56 per pound, a decrease of 4% from the prior quarter. The realized copper price1 in the first quarter of 2020 was lower than the market copper price as a result of the impact of negative provisional pricing adjustments recorded, whereas positive provisional pricing adjustments were recorded in the prior quarter. During the first quarter of 2020, the copper price traded in a wide range of $1.98 per pound to $2.88 per pound and closed the quarter at $2.18 per pound. Copper prices in the first quarter were negatively influenced by demand concerns as a result of the impact of the spread of coronavirus on the global economy.
Attributable copper production in the first quarter of 2020 was 2 million pounds lower compared to the prior quarter, as lower grades and recoveries at Zaldívar were largely offset by increased throughput at Jabal Sayid and higher grades at Lumwana. Sales during the quarter improved from the previous quarter following the completion of a major refurbishment at one of the third-party smelters that processes a portion of Lumwana’s concentrate.
| BARRICK FIRST QUARTER 2020 | 69 | MANAGEMENT’S DISCUSSION AND ANALYSIS |
Q1 2020 compared to Q1 2019
For the three month period ended March 31, 2020, gold revenues increased by 36% compared to the same prior year period primarily due to the higher realized gold price1, partially offset by lower gold sales volume. The average market price for the three month period ended March 31, 2020 was $1,583 per ounce versus $1,304 per ounce for the same prior year period.
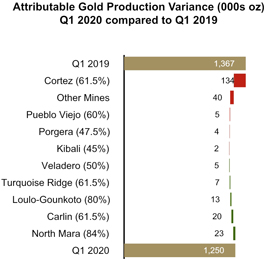
For the three month period ended March 31, 2020, attributable gold production was 117 thousand ounces lower than the same prior year period, primarily as a result of lower production at Cortez due to lower grades processed, combined with the sale of our 50% interest in Kalgoorlie on November 28, 2019, and the exclusion of Golden Sunlight and Morila after the second quarter of 2019 and Lagunas Norte after the third quarter of 2019 in our production metric as they have entered care and maintenance (all included in the Other Mines category above). This was partially offset by an increase in production at North Mara due to the increase in our attributable interest to 84% from 63.9%, as well as the formation of Nevada Gold Mines.
Copper revenues for the three month period ended March 31, 2020 decreased by 39% compared to the same prior year period, primarily due to the lower realized copper price1, partially offset by higher copper sales volumes. In the first quarter of 2020, the realized copper price1 was lower than the market copper price as a result of the impact of negative provisional pricing adjustments recorded in the first quarter of 2020, whereas positive provisional pricing adjustments were recorded in the same prior year period.
Attributable copper production for the three month period ended March 31, 2020, increased by 9 million pounds compared to the same prior year period, as a result of incremental increases at all sites.
Production Costs
| ($ millions, except per ounce/ pound data in dollars) | For the three months ended | |||||||||||
| 3/31/20 | 12/31/19 | 3/31/19 | ||||||||||
Gold | ||||||||||||
Direct mining costsa | 1,080 | 1,252 | 894 | |||||||||
Depreciation | 474 | 549 | 384 | |||||||||
Royalty expense | 84 | 85 | 66 | |||||||||
Community relations | 5 | 10 | 6 | |||||||||
Cost of sales | 1,643 | 1,896 | 1,350 | |||||||||
Cost of sales ($/oz)b | 1,020 | 1,046 | 947 | |||||||||
Total cash costs ($/oz)c | 692 | 692 | 631 | |||||||||
All-in sustaining costs ($/oz)c | 954 | 923 | 825 | |||||||||
Copper | ||||||||||||
Direct mining costs | 69 | 55 | 76 | |||||||||
Depreciation | 43 | 17 | 42 | |||||||||
Royalty expense | 11 | 8 | 12 | |||||||||
Community relations | 1 | 0 | 1 | |||||||||
Cost of sales | 124 | 80 | 131 | |||||||||
Cost of sales ($/lb)b | 1.96 | 2.26 | 2.21 | |||||||||
C1 cash costs ($/lb)c | 1.55 | 1.90 | 1.66 | |||||||||
All-in sustaining costs ($/lb)c | 2.04 | 2.82 | 2.46 | |||||||||
| a. | Includes mining and processing costs. |
| b. | Cost of sales applicable to gold per ounce is calculated using cost of sales applicable to gold on an attributable basis (removing thenon-controlling interest of 40% Pueblo Viejo; 20% Loulo-Gounkoto; 10.3% Tongon; 16% North Mara, Bulyanhulu and Buzwagi starting January 1, 2020, the date the GoT’s 16% free carried interest was made effective (36.1% from January 1, 2019 to September 30, 2019; notwithstanding the completion of the Acacia transaction on September 17, 2019, we consolidated our interest in Acacia and recorded anon-controlling interest of 36.1% in the income statement for the entirety of the third quarter of 2019 as a matter of convenience); 63.1% South Arturo from cost of sales from July 1, 2019 onwards as a result of its contribution to Nevada Gold Mines (and on a 40% basis from January 1, 2019 to June 30, 2019); and our proportionate share of cost of sales attributable to equity method investments (Kibali, and Morila until the second quarter of 2019), divided by attributable gold ounces. Also removes thenon-controlling interest of 38.5% Nevada Gold Mines from cost of sales from July 1, 2019 onwards. Cost of sales applicable to copper per pound is calculated using cost of sales applicable to copper including our proportionate share of cost of sales attributable to equity method investments (Zaldívar and Jabal Sayid), divided by consolidated copper pounds (including our proportionate share of copper pounds from our equity method investments). |
| c. | Total cash costs, C1 cash costs andall-in sustaining costs arenon-GAAP financial performance measures with no standardized meaning under IFRS and therefore may not be comparable to similar measures of performance presented by other issuers. For further information and a detailed reconciliation of eachnon-GAAP measure used in this section of the MD&A to the most directly comparable IFRS measure, please see pages 79 to 95 of this MD&A. |
Q1 2020 compared to Q4 2019
In the first quarter of 2020, cost of sales applicable to gold was 13% lower compared to the fourth quarter of 2019, mainly due to lower sales volumes. Our 45% interest in Kibali and 40% interest in Morila are equity accounted for and therefore we do not include their cost of sales in our consolidated gold cost of sales. On a per ounce basis, cost of sales applicable to gold2, after including our proportionate share of cost of sales at our equity method investees, was 2% lower, and total cash costs per ounce1 was in line with the prior quarter, as the
| BARRICK FIRST QUARTER 2020 | 70 | MANAGEMENT’S DISCUSSION AND ANALYSIS |
impact of the sale of Kalgoorlie in the prior quarter and lower energy input costs offset the impact of lower grade.
In the first quarter of 2020, goldall-in sustaining costs per ounce1 was up 3% compared to the prior quarter primarily due to higher minesite sustaining capital expenditures on a per ounce basis, while total cash costs per ounce1 remained consistent with prior quarter.
In the first quarter of 2020, cost of sales applicable to copper was 55% higher than the prior quarter primarily due to higher sales volume. Our 50% interests in Zaldívar and Jabal Sayid are equity accounted for and therefore we do not include their cost of sales in our consolidated copper cost of sales. On a per pound basis, cost of sales applicable to copper2 and C1 cash costs1, after including our proportionate share of cost of sales at our equity method investees, decreased by 13% and 18%, respectively, mainly due to the impact of higher sales volume following the completion of a major refurbishment in January at a third-party smelter that processes a portion of Lumwana’s concentrate. This was combined with lower direct mining costs at Lumwana, resulting from improved feed grade, lower general and administrative costs as well as lower concentrate marketing unit costs.
In the first quarter of 2020, copperall-in sustaining costs1, which have been adjusted to include our proportionate share of equity method investees, were 28% lower per pound than the prior quarter primarily reflecting lower C1 cash costs per pound1 and lower minesite sustaining capital expenditures.
Q1 2020 compared to Q1 2019
For the three month period ended March 31, 2020, cost of sales applicable to gold was 22% higher than the same prior year period primarily due to the formation of Nevada Gold Mines, which commenced on July 1, 2019 and is consolidated and included in cost of sales at 100%. Excluding the impact of Nevada Gold Mines, cost of sales applicable to gold was 7% lower compared to the same prior year period, primarily due to lower sales volume. Our 45% interest in Kibali and 40% interest in Morila are equity accounted for and therefore we do not include their cost of sales in our consolidated gold cost of sales. On a per ounce basis, cost of sales applicable to gold2, after including our proportionate share of cost of sales at our equity method investees, and total cash costs per ounce1 were 8% and 10% higher, respectively, compared to the same prior year period mainly due to the impact of the lower average grade processed at Cortez and the contribution from Nevada Gold Mines, which has resulted in a higher proportion of open pit ore in our sales mix.
For the three month period ended March 31, 2020, goldall-in sustaining costs1 increased by 16% on a per ounce basis compared to the same prior year period, primarily due to an increase in total cash costs per ounce1, combined with higher minesite sustaining capital expenditures.
For the three month period ended March 31, 2020, cost of sales applicable to copper was 5% lower than the same prior year period, primarily due to improvements made at Lumwana to increase plant efficiency and availability through 2019. Together with cost rationalization, these performance improvements have driven a reduction in per tonne costs. Our 50% interests in Zaldívar and Jabal Sayid are equity accounted for and therefore we do not include their cost of
sales in our consolidated copper cost of sales. On a per pound basis, cost of sales applicable to copper2 and C1 cash costs1, after including our proportionate share of cost of sales at our equity method investees, decreased by 11% and 7%, respectively, compared to the same prior year period primarily due to a combination of higher feed grades, recoveries and throughput as well as lower direct mining costs.
For the three month period ended March 31, 2020, copperall-in sustaining costs1, which have been adjusted to include our proportionate share of equity method investees, was 17% lower per pound than the same prior year period primarily reflecting lower C1 cash costs per pound1, combined with lower minesite sustaining capital expenditures.
Capital Expendituresa
| ($ millions) | For the three months ended | |||||||||||
| 3/31/20 | 12/31/19 | 3/31/19 | ||||||||||
Minesite sustainingb | 370 | 394 | 253 | |||||||||
Project capital expendituresc | 76 | 46 | 120 | |||||||||
Capitalized interest | 5 | 6 | 1 | |||||||||
Total consolidated capital expenditures | 451 | 446 | 374 | |||||||||
Attributable capital expendituresd | 364 | 393 | 361 | |||||||||
| a. | These amounts are presented on a 100% cash basis, except for attributable capital expenditures. |
| b. | Includes both minesite sustaining and mine development. |
| c. | Project capital expenditures are included in our calculation ofall-in costs, but not included in our calculation ofall-in sustaining costs. |
| d. | These amounts are presented on the same basis as our guidance and include our 60% share of Pueblo Viejo, 80% share of Loulo-Gounkoto, 89.7% share of Tongon, 45% share of Kibali, 40% share of Morila and 60% share of South Arturo (36.9% of South Arturo from July 1, 2019 onwards as a result of its contribution to Nevada Gold Mines), our 84% share of Tanzania starting January 1, 2020, the date the GoT’s 16% free carried interest was made effective (63.9% share from January 1, 2019 to September 30, 2019; notwithstanding the completion of the Acacia transaction on September 17, 2019, we consolidated our interest in Acacia and recorded anon-controlling interest of 36.1% in the income statement for the entirety of the third quarter of 2019 as a matter of convenience, and 100% share from October 1, 2019 to December 31, 2019) and our 50% share of Zaldívar and Jabal Sayid. Starting July 1, 2019, it also includes our 61.5% share of Nevada Gold Mines. |
Q1 2020 compared to Q4 2019
In the first quarter of 2020, total consolidated capital expenditures on a cash basis remained consistent with the fourth quarter of 2019, as higher project capital expenditures were offset by lower minesite sustaining capital expenditures. The increase in project capital expenditures is attributed to the final unconditional payment of $28 million made during the quarter for the funding of a power transmission line in Argentina as a result of an agreement made with EPRE. Lower minesite sustaining capital expenditures were due to lower capitalized stripping at Turquoise Ridge and Porgera.
Q1 2020 compared to Q1 2019
For the three month period ended March 31, 2020, total consolidated capital expenditures on a cash basis increased by 21% compared to the same prior year period, primarily due to the impact of the sites acquired as part of the formation of Nevada Gold Mines, which commenced on July 1, 2019, and is consolidated and included at 100%. Excluding the impact of the formation of Nevada Gold Mines, capital expenditures decreased by 3%, mainly due to Cortez as a result of the ramp
| BARRICK FIRST QUARTER 2020 | 71 | MANAGEMENT’S DISCUSSION AND ANALYSIS |
down in the Cortez Hills Underground Rangefront, Deep South, and Crossroads dewatering projects. There was also a decrease in project capital expenditures and a corresponding increase in minesite sustaining capital expenditures as the Crossroads pit was inpre-production in the first quarter of 2019 and transitioned to production status in the third quarter of 2019.
| General and Administrative Expenses | ||||||||||||
| ($ millions) | For the three months ended | |||||||||||
| 3/31/20 | 12/31/19 | 3/31/19 | ||||||||||
Corporate administrationa | 33 | 26 | 43 | |||||||||
Share-based compensationb | 7 | 5 | 6 | |||||||||
Tanzaniac | 0 | 0 | 5 | |||||||||
General & administrative expenses | 40 | 31 | 54 | |||||||||
| a. | For the three months ended March 31, 2020, corporate administration costs include approximately $nil of severance costs (December 31, 2019: $nil and March 31, 2019: $5 million). |
| b. | Based on US$18.32 share price as at March 31, 2020 (December 31, 2019: US$18.59 and March 31, 2019: US$13.71). |
| c. | Formerly known as Acacia Mining plc. |
Q1 2020 compared to Q4 2019
In the first quarter of 2020, general and administrative expenses increased by $9 million compared to the fourth quarter of 2019, primarily due to a reduction in costs allocated to our operating sites.
Q1 2020 compared to Q1 2019
For the three month period ended March 31, 2020, general and administrative expenses decreased by $14 million compared to the same prior year period primarily due to a decrease in corporate administration expenses attributed to higher executive compensation in the same prior year period. This was combined with lower general and administrative expenses incurred by Acacia Mining Plc due to the closure of their London and Johannesburg offices in the third quarter of 2019.
| Exploration, Evaluation and Project Expenses | ||||||||||||
| ($ millions) | For the three months ended | |||||||||||
| 3/31/20 | 12/31/19 | 3/31/19 | ||||||||||
Global exploration and evaluation | 39 | 33 | 31 | |||||||||
Project costs: | ||||||||||||
Pascua-Lama | 10 | 11 | 13 | |||||||||
Other | 4 | 6 | 4 | |||||||||
Corporate development | 3 | 10 | 8 | |||||||||
Business improvement and innovation | 0 | 0 | 7 | |||||||||
Global exploration and evaluation and project expense | 56 | 60 | 63 | |||||||||
Minesite exploration and evaluation | 15 | 24 | 11 | |||||||||
Total exploration, evaluation and project expenses | 71 | 84 | 74 | |||||||||
Q1 2020 compared to Q4 2019
Exploration, evaluation and project expenses for the first quarter of 2020 decreased by $13 million compared to the fourth quarter of 2019, primarily due to lower corporate development costs related to the sale of our 50% interest in Kalgoorlie occurring in the prior quarter as well as lower costs related to the settlement of all disputes between Barrick and the GoT. This was combined with lower minesite exploration and evaluation costs at Carlin, partially offset by higher global exploration and evaluation costs in Nevada as the mild winter allowed for an early restart of drill programs.
Q1 2020 compared to Q1 2019
Exploration, evaluation and project expenses for the three month period ended March 31, 2020 was $3 million lower than the same prior year period. Lower business improvement and innovation expenses relating to digitization projects occurring in the same prior year period combined with lower corporate development costs were largely offset by higher global exploration and evaluation expenses in Nevada as the mild winter allowed for an early restart of drill programs.
Finance Costs, Net
| ($ millions) | For the three months ended | |||||||||||
| 3/31/20 | 12/31/19 | 3/31/19 | ||||||||||
Interest expensea | 88 | 104 | 110 | |||||||||
Accretion | 16 | 16 | 20 | |||||||||
Loss on debt extinguishment | 15 | 0 | 0 | |||||||||
Interest capitalized | (5 | ) | (6 | ) | (2 | ) | ||||||
Other finance costs | 0 | 5 | (1 | ) | ||||||||
Finance income | (10 | ) | (13 | ) | (7 | ) | ||||||
Finance costs, net | 104 | 106 | 120 | |||||||||
| a. | For the three months ended March 31, 2020, interest expense includes approximately $9 million ofnon-cash interest expense relating to the gold and silver streaming agreement with Royal Gold, Inc. (December 31, 2019: $28 million and March 31, 2019: $25 million which is inclusive of amounts relating to the silver streaming agreement with Wheaton Precious Metals Corp.). |
| BARRICK FIRST QUARTER 2020 | 72 | MANAGEMENT’S DISCUSSION AND ANALYSIS |
Q1 2020 compared to Q4 2019
In the first quarter of 2020, net finance costs were 2% lower than the prior quarter, mainly due to a decrease in interest expense, partially offset by a loss on debt extinguishment of $15 million. The decrease in interest expense is primarily due to the absence ofnon-cash interest expense related to the silver streaming agreement at Pascua-Lama, following thede-recognition of the deferred revenue liability at the end of the prior quarter. The increase in loss on debt extinguishment is attributed to the make-whole repurchase of the outstanding $337 million of principal of our 3.85% notes due 2022 in January 2020.
Q1 2020 compared to Q1 2019
For the three month period ended March 31, 2020, net finance costs were 13% lower than the same prior year period, primarily due to a decrease in interest expense attributed to the absence ofnon-cash interest expense related to the silver streaming agreement at Pascua-Lama as described above and to debt reductions made in January 2020 and in the prior year. This was partly offset by a loss on debt extinguishment of $15 million as a result of the make-whole repurchase of the outstanding $337 million of principal of our 3.85% notes due 2022 in January 2020. In the prior year, we completed a make-whole repurchase of the outstanding $248 million of principal of our 4.95% notes due 2020 in July 2019.
Additional Significant Statement of Income Items
| ($ millions) | For the three months ended | |||||||||||
| 3/31/20 | 12/31/19 | 3/31/19 | ||||||||||
Impairment charges (reversals) | (336 | ) | (566 | ) | 3 | |||||||
Loss on currency translation | 16 | 53 | 22 | |||||||||
Other expense (income) | (35 | ) | (1,282 | ) | 26 | |||||||
Impairment Charges (Reversals)
Q1 2020 compared to Q4 2019
In the first quarter of 2020, net impairment reversals were $336 million compared to $566 million in the prior quarter. The net impairment reversal in the first quarter of 2020 relates to a reversal at Bulyanhulu of $472 million, a loss of $107 million at North Mara and a net loss at Buzwagi of $29 million, all resulting from the agreement with the GoT being signed and made effective in the quarter. In the fourth quarter of 2019, the net impairment reversal mainly relates to a reversal at Pueblo Viejo of $865 million reflecting the progression of our engineering and evaluation work on the process plant expansion and additional tailings facility, partially offset by an impairment charge of $296 million at Pascua-Lama, as we completed a study of the project and concluded that we do not have a plan that meets our investment criteria under our current assumptions.
Q1 2020 compared to Q1 2019
For the three month period ended March 31, 2020, net impairment reversals were $336 million compared to net impairment charges of $3 million in the same prior year period. The net impairment reversal in the first quarter of 2020 relates to a reversal at Bulyanhulu of $472 million, a loss of $107 million at North Mara and a net loss at Buzwagi of $29 million, all resulting from the agreement with the GoT being signed and made effective in the quarter. In the first quarter of 2019, we recorded no significant impairment charges or reversals.
For a further breakdown of impairment charges and reversals, refer to note 13 of the Financial Statements.
(Gain) Loss on Currency Translation
Q1 2020 compared to Q4 2019
Loss on currency translation in the first quarter of 2020 was $16 million compared to a loss of $53 million in the prior quarter. The losses incurred during the first quarter of 2020 were primarily due to the depreciation of the Zambian kwacha, Argentine peso and Chilean peso, partially offset by gains on the revaluation of Canadian dollar denominated liabilities. This currency depreciation resulted in the revaluation of our peso denominated value-added tax receivable balances.
Q1 2020 compared to Q1 2019
Loss on currency translation in the first quarter of 2020 was $16 million compared to $22 million in the same prior year period due to unrealized foreign currency translation losses relating to the Argentine peso, which depreciated in both periods. Fluctuations in the Argentine peso exchange rate versus the US dollar revalue our peso denominated value-added tax receivable balances.
Other Expense (Income)
Q1 2020 compared to Q4 2019
In the first quarter of 2020, other income was $35 million compared to $1,282 million in the prior quarter. Other income in the first quarter of 2020 mainly relates to the gain on the sale of Massawa of $54 million, partially offset by losses onnon-hedge derivatives. Other income in the fourth quarter of 2019 primarily consists of a $628 million gain on thede-recognition of the deferred revenue liability relating to our silver sale agreement with Wheaton Precious Metals Corp., a gain of $408 million resulting from the sale of our 50% interest in Kalgoorlie, and a gain of $216 million on a settlement of customs duty and indirect taxes at Lumwana.
Q1 2020 compared to Q1 2019
For the three month period ended March 31, 2020, other income was $35 million compared to an expense of $26 million in the same prior year period. Other income in the first quarter of 2020 mainly relates to the gain on the sale of Massawa of $54 million, partially offset by losses onnon-hedge derivatives. For the three month period ended March 31, 2019, other expense primarily consists of various costs incurred by Acacia Mining Plc.
For a further breakdown of other expense (income), refer to note 9 to the Financial Statements.
Income Tax Expense
Income tax expense was $386 million in the first quarter of 2020. The unadjusted effective income tax rate in the first quarter of 2020 was 37% of the income before income taxes.
The underlying effective income tax rate on ordinary income in the first quarter of 2020 was 28% after adjusting for the gain on the sale of the Massawa project; the impact of the settlement of all outstanding disputes with the GoT; the impact of impairment charges (reversals) at Tanzania; the impact of the transfer of a free carried shareholding of 16% in each of the Tanzania mines to the GoT; the impact of foreign currency translation losses on deferred tax balances; the impact ofnon-deductible foreign exchange losses; the impact of a reduced
| BARRICK FIRST QUARTER 2020 | 73 | MANAGEMENT’S DISCUSSION AND ANALYSIS |
corporate tax rate in Argentina on deferred tax balances; and the impact of other expense adjustments.
We record deferred tax charges or credits if changes in facts or circumstances affect the estimated tax basis of assets and therefore the amount of deferred tax assets or liabilities to reflect changing expectations in our ability to realize deferred tax assets. The interpretation of tax regulations and legislation and their application to our business is complex and subject to change. We have significant amounts of deferred tax assets (mostly unrecognized following impairments in the fourth quarter of 2018), including tax loss carry forwards, and also deferred tax liabilities. Potential changes of any of these amounts, as well as our ability to realize deferred tax assets, could significantly affect net income or cash flow in future periods. For further details on income tax expense, refer to note 10 of the Financial Statements.
Nevada Joint Venture
Nevada Gold Mines is a limited liability company treated as a flow through partnership for US tax purposes. The partnership is not subject to income tax directly, but each of its partners is liable for tax on its share of the profits of the partnership. As such, Barrick accounts for its current and deferred tax associated with the investment (61.5% share) following the principles in IAS 12.
Argentina Deferred Taxes
In December 2017, Argentina reduced its 35% corporate tax rate to 30% for 2018 and 2019, with a further reduction to 25% for 2020 and thereafter. Concurrently, a dividend distribution tax was introduced that charges 7% tax on dividend distributions for 2018 and 2019, and 13% tax on dividend distributions for 2020 and thereafter. On December 23, 2019, Argentina enacted a law that the previously approved corporate tax rate reduction from 30% to 25% will be deferred for one year until January 1, 2021. Therefore, the corporate tax rate of 30% is unchanged for the 2020 calendar year. The scheduled increase of dividend withholding tax from 7% to 13% is also deferred until January 1, 2021.
A deferred tax recovery of $35 million was recorded in the first quarter of 2020 as a result of the tax reform measures.
Tanzania
On January 24, 2020, Barrick formalized the establishment of a joint venture between Barrick and the GoT and resolution of all outstanding disputes between Barrick and the GoT, including the lifting of the previous concentrate export ban, effective immediately. Refer to note 13 to the Financial Statements for further information.
The terms of the signed agreement are consistent with those previously announced, including the payment of $300 million to settle all outstanding tax and other disputes (the “Settlement Payment”); the lifting of the concentrate export ban; the sharing of future economic benefits from the mines on a 50/50 basis; and a dispute resolution mechanism that provides for binding international arbitration. The 50/50 division of economic benefits will be maintained through an annualtrue-up mechanism, which is exclusive of the Settlement Payment.
A current tax expense and deferred tax recovery of $21 million and $44 million, respectively, was recorded in the first quarter of 2020. This was a result of changes to the 2019year-end tax balances as certain tax agreements were made retroactive starting January 1, 2019; as well as from the recognition of deferred tax assets at Buzwagi.
| BARRICK FIRST QUARTER 2020 | 74 | MANAGEMENT’S DISCUSSION AND ANALYSIS |
FINANCIAL CONDITION REVIEW
| ||||||||
| Summary Balance Sheet and Key Financial Ratios | ||||||||
| ($ millions, except ratios and share amounts) | As at 3/31/20 | As at 12/31/19 | ||||||
Total cash and equivalents | 3,327 | 3,314 | ||||||
Current assets | 3,124 | 3,573 | ||||||
Non-current assets | 38,488 | 37,505 | ||||||
Total Assets | 44,939 | 44,392 | ||||||
Current liabilities excluding short-term debt | 1,941 | 2,001 | ||||||
Non-current liabilities excluding long-term debta | 7,464 | 7,028 | ||||||
Debt (current and long-term) | 5,179 | 5,536 | ||||||
Total Liabilities | 14,584 | 14,565 | ||||||
Total shareholders’ equity | 21,687 | 21,432 | ||||||
Non-controlling interests | 8,668 | 8,395 | ||||||
Total Equity | 30,355 | 29,827 | ||||||
Total common shares outstanding (millions of shares)b | 1,778 | 1,778 | ||||||
Debt, net of cash | 1,852 | 2,222 | ||||||
Key Financial Ratios: | ||||||||
Current ratioc | 3.27:1 | 2.90:1 | ||||||
Debt-to-equityd | 0.17:1 | 0.19:1 | ||||||
| a. | Non-current financial liabilities as at March 31, 2020 were $5,479 million (December 31, 2019: $5,559 million). |
| b. | Total common shares outstanding do not include 0.1 million stock options. |
| c. | Represents current assets divided by current liabilities (including short-term debt) as at March 31, 2020 and December 31, 2019. |
| d. | Represents debt divided by total shareholders’ equity (including minority interest) as at March 31, 2020 and December 31, 2019. |
Balance Sheet Review
Total assets were $44.9 billion at March 31, 2020, approximately $0.5 billion higher than at December 31, 2019, primarily reflecting the impairment reversal at Bulyanhulu of $472 million, a loss of $107 million at North Mara and a net loss at Buzwagi of $29 million, all resulting from the agreement with the GoT being signed and made effective in the quarter.
Our asset base is primarily comprised ofnon-current assets such as property, plant and equipment and goodwill, reflecting the capital-intensive nature of the mining business and our history of growing through acquisitions. Other significant assets include production inventories, indirect taxes recoverable and receivable, concentrate sales receivable, other government and joint venture related receivables, and cash and equivalents.
Total liabilities at March 31, 2020 were $14.6 billion, which was consistent with total liabilities at December 31, 2019. Our liabilities are primarily comprised of debt, othernon-current liabilities such as provisions and deferred income tax liabilities, and accounts payable.
| Shareholders’ Equity | ||||
| As at 4/28/2020 | Number of shares | |||
Common shares | 1,778,034,807 | |||
Stock options | 119,000 | |||
Financial Position and Liquidity
We believe we have sufficient financial resources to meet our business requirements for the foreseeable future, including capital expenditures, working capital requirements, interest payments and dividends.
Total cash and cash equivalents as at March 31, 2020 were $3.3 billion. Our capital structure comprises a mix of debt,non-controlling interest (primarily at Nevada Gold Mines) and shareholders’ equity. As at March 31, 2020, our total debt was $5.2 billion (debt, net of cash and equivalents was $1.9 billion) and ourdebt-to-equity ratio was 0.17:1. This compares to debt as at December 31, 2019 of $5.5 billion (debt, net of cash and equivalents was $2.2 billion), and adebt-to-equity ratio of 0.19:1.
On January 31, 2020, we completed a make-whole repurchase of the outstanding $337 million of principal of our 3.85% notes due 2022. We now have no significant public debt maturities until 2033.
Uses of cash for the remainder of 2020 include capital commitments of $175 million and we expect to incur attributable sustaining and project capital expenditures of approximately $1,200 to $1,500 million during the final nine months of the year, based on our guidance range on page 37. For the remainder of 2020, we have contractual obligations and commitments of $447 million for supplies and consumables. In addition, we have $290 million in interest payments and other amounts as detailed in the table on page 77. We expect to fund these commitments through operating cash flow, which is our primary source of liquidity, as well as existing cash balances.
Our operating cash flow is dependent on the ability of our operations to deliver projected future cash flows. The market prices of gold, and to a lesser extent copper, are the primary drivers of our operating cash flow. Other options to enhance liquidity include further portfolio optimization and the creation of new joint ventures and partnerships; issuance of equity securities in the public markets or to private investors, which could be undertaken for liquidity enhancement and/or in connection with establishing a strategic partnership; issuance of long-term debt securities in the public markets or to private investors (Moody’s and S&P currently rate Barrick’s
| BARRICK FIRST QUARTER 2020 | 75 | MANAGEMENT’S DISCUSSION AND ANALYSIS |
outstanding long-term debt as investment grade, with ratings of Baa2 and BBB, respectively); and drawing on the $3.0 billion available under our undrawn credit facility (subject to compliance with covenants and the making of certain representations and warranties, this facility is available for drawdown as a source of financing). The key financial covenant in our undrawn credit facility requires Barrick to maintain a net debt to total capitalization ratio of less than 0.60:1. Barrick’s net debt to total capitalization ratio was 0.06:1 as at March 31, 2020 (0.07:1 as at December 31, 2019).
Summary of Cash Inflow (Outflow)
| ($ millions) | For the three months ended | |||||||||||
| 3/31/20 | 12/31/19 | 3/31/19 | ||||||||||
Net cash provided by operating activities | 889 | 875 | 520 | |||||||||
Investing activities | ||||||||||||
Capital expenditures | (451 | ) | (446 | ) | (374 | ) | ||||||
Cash acquired in | ||||||||||||
Randgold merger | 0 | 0 | 751 | |||||||||
Divestitures | 256 | 750 | 0 | |||||||||
Cash received from equity method investments | 25 | 113 | 15 | |||||||||
Other | 7 | (55 | ) | 30 | ||||||||
Total investing inflows (outflows) | (163 | ) | 362 | 422 | ||||||||
Net change in debta | (356 | ) | (6 | ) | (28 | ) | ||||||
Dividendsb | (122 | ) | (87 | ) | (333 | ) | ||||||
Net disbursements tonon-controlling interests | (216 | ) | (236 | ) | 1 | |||||||
Other | (15 | ) | 1 | 0 | ||||||||
Total financing inflows (outflows) | (709 | ) | (328 | ) | (360 | ) | ||||||
Effect of exchange rate | (4 | ) | 0 | 0 | ||||||||
Increase (decrease) in cash and equivalents | 13 | 909 | 582 | |||||||||
| a. | The difference between the net change in debt on a cash basis and the net change on the balance sheet is due to changes innon-cash charges, specifically the unwinding of discounts and amortization of debt issue costs. |
| b. | For the three months ended March 31, 2020, we declared and paid dividends per share in US dollars totaling $0.07 in respect of the fourth quarter of 2019 performance (December 31, 2019: declared and paid $0.05; March 31, 2019: declared $nil and paid $0.07, and also paid $2.69 per share to Randgold shareholders). |
Q1 2020 compared to Q4 2019
In the first quarter of 2020, we generated $889 million in operating cash flow, compared to $875 million in the prior quarter. The increase of $14 million was primarily due to lower income taxes and cash interest paid, combined with higher realized gold prices1 of $1,589 per ounce in the three months ended March 31, 2020 compared to $1,483 per ounce in the prior quarter, partially offset by lower gold sales volume. Operating cash flow was further impacted by an unfavorable movement in working capital, mainly in other current assets and liabilities, partially offset by a favorable movement resulting from the timing of payments and receivables.
Cash outflows from investing activities in the first quarter of 2020 were $163 million compared to inflows of $362 million in the prior quarter. The change of $525 million was primarily due to a decrease in cash proceeds from divestitures. In the first quarter of 2020, we received $256 million relating to the
sale of Massawa, compared to cash consideration of $750 million for the sale of our 50% interest in Kalgoorlie occurring in the prior quarter.
Net financing cash outflows for the first quarter of 2020 amounted to $709 million, compared to $328 million in the prior quarter. The increase of $381 million is primarily due to the make-whole repurchase of the outstanding $337 million of principal of our 3.85% notes due 2022 in January 2020. This was combined with an increase in dividends paid, reflecting Barrick’s profitability, financial strength and commitment to shareholder returns.
Q1 2020 compared to Q1 2019
In the first quarter of 2020, we generated $889 million in operating cash flow, compared to $520 million in the same prior year period. The increase of $369 million was primarily due to higher realized gold prices1, partially offset by lower sales volume.
Cash outflows from investing activities in the first quarter of 2020 were $163 million compared to inflows of $422 million in the same prior year period. The change of $585 million was primarily due to cash acquired as a result of the Merger of $751 million in the same prior year period, partially offset by cash received of $256 million relating to the sale of Massawa in the current period.
Net financing cash outflows for the first quarter of 2020 amounted to $709 million, compared to $360 million in the same prior year period. The higher outflows are primarily due to the make-whole repurchase of the outstanding $337 million of principal of our 3.85% notes due 2022 in January 2020. This was combined with higher disbursements tonon-controlling interests, offset by lower dividends paid as a result of the dividends paid to former Randgold shareholders in the same prior year period.
| BARRICK FIRST QUARTER 2020 | 76 | MANAGEMENT’S DISCUSSION AND ANALYSIS |
COMMITMENTS AND CONTINGENCIES
Litigation and Claims
We are currently subject to various litigation proceedings as disclosed in note 17 to the Financial Statements, and we may be involved in disputes with other parties in the future that may result in litigation. If we are unable to resolve these disputes favorably, it may have a material adverse impact on our financial condition, cash flow and results of operations.
Contractual Obligations and Commitments
In the normal course of business, we enter into contracts that give rise to commitments for future minimum payments. The following table summarizes the remaining contractual maturities of our financial liabilities and operating and capital commitments shown on an undiscounted basis:
| ($ millions) | Payments due as at 3/31/20 | |||||||||||||||||||||||||||
| 2020 | 2021 | 2022 | 2023 | 2024 | 2025 and thereafter | Total | ||||||||||||||||||||||
Debta | ||||||||||||||||||||||||||||
Repayment of principal | 0 | 7 | 0 | 0 | 0 | 5,109 | 5,116 | |||||||||||||||||||||
Capital leases | 17 | 15 | 11 | 8 | 4 | 33 | 88 | |||||||||||||||||||||
Interest | 290 | 308 | 307 | 307 | 306 | 4,447 | 5,965 | |||||||||||||||||||||
Provisions for environmental rehabilitationb | 222 | 213 | 226 | 220 | 163 | 2,326 | 3,370 | |||||||||||||||||||||
Restricted share units | 10 | 14 | 4 | 0 | 0 | 0 | 28 | |||||||||||||||||||||
Pension benefits and other post-retirement benefits | 21 | 7 | 7 | 7 | 6 | 99 | 147 | |||||||||||||||||||||
Minimum royalty paymentsc | 1 | 1 | 1 | 1 | 0 | 0 | 4 | |||||||||||||||||||||
Purchase obligations for supplies and consumablesd | 447 | 186 | 97 | 99 | 99 | 509 | 1,437 | |||||||||||||||||||||
Capital commitmentse | 175 | 43 | 0 | 0 | 0 | 0 | 218 | |||||||||||||||||||||
Social development costsf | 10 | 12 | 4 | 4 | 4 | 53 | 87 | |||||||||||||||||||||
Deposit on Pascua-Lama silver sale agreementg | 253 | 0 | 0 | 0 | 0 | 0 | 253 | |||||||||||||||||||||
Total | 1,446 | 806 | 657 | 646 | 582 | 12,576 | 16,713 | |||||||||||||||||||||
| a. | Debt and Interest - Our debt obligations do not include any subjective acceleration clauses or other clauses that enable the holder of the debt to call for early repayment, except in the event that we breach any of the terms and conditions of the debt or for other customary events of default. We are not required to post any collateral under any debt obligations. Projected interest payments on variable rate debt were based on interest rates in effect at March 31, 2020. Interest is calculated on our long-term debt obligations using both fixed and variable rates. |
| b. | Provisions for environmental rehabilitation - Amounts presented in the table represent the undiscounted uninflated future payments for the expected cost of provisions for environmental rehabilitation. |
| c. | Minimum royalty payments are related to continuing operations and are presented net of recoverable amounts. |
| d. | Purchase obligations for supplies and consumables - Includes commitments related to new purchase obligations to secure a supply of acid, tires and cyanide for our production process. |
| e. | Capital commitments - Purchase obligations for capital expenditures include only those items where binding commitments have been entered into. |
| f. | Social development costs - Includes a commitment of $14 million in 2025 and thereafter related to the funding of a power transmission line in Argentina. |
| g. | Deposit on Pascua-Lama silver sale agreement - Relates to our silver sale agreement with Wheaton Precious Metals Corp. |
| BARRICK FIRST QUARTER 2020 | 77 | MANAGEMENT’S DISCUSSION AND ANALYSIS |
REVIEW OF QUARTERLY RESULTS
Quarterly Informationa
| ($ millions, except where indicated) | 2020 Q1 | 2019 Q4 | 2019 Q3 | 2019 Q2 | 2019 Q1 | 2018 Q4 | 2018 Q3 | 2018 Q2 | ||||||||||||||||||||||||
Revenues | 2,721 | 2,883 | 2,678 | 2,063 | 2,093 | 1,904 | 1,837 | 1,712 | ||||||||||||||||||||||||
Realized price per ounce – goldb | 1,589 | 1,483 | 1,476 | 1,317 | 1,307 | 1,223 | 1,216 | 1,313 | ||||||||||||||||||||||||
Realized price per pound – copperb | 2.23 | 2.76 | 2.55 | 2.62 | 3.07 | 2.76 | 2.76 | 3.11 | ||||||||||||||||||||||||
Cost of sales | 1,776 | 1,987 | 1,889 | 1,545 | 1,490 | 1,577 | 1,315 | 1,176 | ||||||||||||||||||||||||
Net earnings (loss) | 400 | 1,387 | 2,277 | 194 | 111 | (1,197 | ) | (412 | ) | (94 | ) | |||||||||||||||||||||
Per share (dollars)c | 0.22 | 0.78 | 1.30 | 0.11 | 0.06 | (1.02 | ) | (0.35 | ) | (0.08 | ) | |||||||||||||||||||||
Adjusted net earningsb | 285 | 300 | 264 | 154 | 184 | 69 | 89 | 81 | ||||||||||||||||||||||||
Per share (dollars)b,c | 0.16 | 0.17 | 0.15 | 0.09 | 0.11 | 0.06 | 0.08 | 0.07 | ||||||||||||||||||||||||
Operating cash flow | 889 | 875 | 1,004 | 434 | 520 | 411 | 706 | 141 | ||||||||||||||||||||||||
Cash capital expenditures | 451 | 446 | 502 | 379 | 374 | 374 | 387 | 313 | ||||||||||||||||||||||||
Free cash flowb | 438 | 429 | 502 | 55 | 146 | 37 | 319 | (172 | ) | |||||||||||||||||||||||
| a. | Sum of all the quarters may not add up to the annual total due to rounding. |
| b. | Realized price, adjusted net earnings, adjusted net earnings per share and free cash flow arenon-GAAP financial performance measures with no standardized meaning under IFRS and therefore may not be comparable to similar measures of performance presented by other issuers. For further information and a detailed reconciliation of eachnon-GAAP measure used in this section of the MD&A to the most directly comparable IFRS measure, please see pages 79 to 95 of this MD&A. |
| c. | Calculated using weighted average number of shares outstanding under the basic method of earnings per share. |
Our recent financial results reflect our emphasis on cost discipline and an agile management structure that empowers our site based leadership teams. This combined with rising gold prices has resulted in stronger operating cash flows. The positive free cash flow1 generated, together with the proceeds from various divestitures, have allowed us to continue to strengthen our balance sheet over the past two years and to increase returns to shareholders.
These same fundamentals have also driven the higher net earnings in recent quarters. Prior to that, starting in the first quarter of 2019, the Merger resulted in the commencement of the contribution of Randgold’s operations to Barrick’s net earnings and cash flows. Net earnings has also been impacted by the following items in each quarter which have been excluded from adjusted net earnings1. In the first quarter of 2020, we recorded a net impairment reversal of $115 million (net of tax effects), resulting from the agreement with the GoT being signed and made effective in the quarter. In the fourth quarter of 2019, we recorded $22 million (net of tax andnon-controlling interests) of net impairment charges, mainly relating to a charge at Pascua-Lama of $296 million (no tax impact), partially offset by a net impairment reversal at Pueblo Viejo of $277 million (net of taxes andnon-controlling interest).
We also recorded a $628 million (no tax impact) gain on thede-recognition of the deferred revenue liability relating to our silver sale agreement with Wheaton Precious Metals Corp., a gain of $408 million (no tax impact) resulting from the sale of our 50% interest in Kalgoorlie, and a gain of $216 million (no tax impact) on a settlement of customs duty and indirect taxes at Lumwana. In the third quarter of 2019, net earnings and cash flows were impacted by the formation of Nevada Gold Mines and the commencement of the contribution of its operations to Barrick’s net earnings and cash flows. Net earnings in the third quarter of 2019 includes a $1.5 billion (net of tax effects) gain on remeasurement of Turquoise Ridge as a result of its contribution to Nevada Gold Mines and a $663 million (net of tax effects) impairment reversal at Lumwana. In the fourth quarter of 2018, we recorded $319 million (net of tax effects andnon-controlling interests) of net asset impairments primarily relating to impairments of $160 million ofnon-current assets and $154 million of goodwill at the Veladero mine. We also recorded in the fourth quarter of 2018 an inventory impairment of $166 million at Lagunas Norte, which was included in cost of sales. In the third quarter of 2018, we recorded a $405 million impairment charge resulting from an asset impairment at Lagunas Norte.
INTERNAL CONTROL OVER FINANCIAL REPORTING AND DISCLOSURE CONTROLS AND PROCEDURES
Management is responsible for establishing and maintaining adequate internal control over financial reporting and disclosure controls and procedures as defined in our 2019 annual MD&A.
Together, the internal control frameworks provide internal control over financial reporting and disclosure. Due to its inherent limitations, internal control over financial reporting and disclosure may not prevent or detect all misstatements. Further, the effectiveness of internal control is subject to the risk that controls may become inadequate because of
changes in conditions, or that the degree of compliance with policies or procedures may change.
There were no changes in our internal controls over financial reporting during the three months ended March 31, 2020 that have materially affected, or are reasonably likely to materially affect, our internal controls over financial reporting.
Under the supervision and with the participation of management, including the President and Chief Executive Officer and Senior Executive Vice-President and Chief
| BARRICK FIRST QUARTER 2020 | 78 | MANAGEMENT’S DISCUSSION AND ANALYSIS |
Financial Officer, management will continue to monitor and evaluate the design and effectiveness of its internal control over financial reporting and disclosure controls and
procedures, and may make modifications from time to time as considered necessary.
IFRS CRITICAL ACCOUNTING POLICIES AND ACCOUNTING ESTIMATES
Management has discussed the development and selection of our critical accounting estimates with the Audit and Risk Committee of the Board of Directors, and the Audit and Risk Committee has reviewed the disclosure relating to such estimates in conjunction with its review of this MD&A. The accounting policies and methods we utilize determine how we report our financial condition and results of operations, and they may require Management to make estimates or rely on assumptions about matters that are inherently uncertain. The consolidated financial statements have been prepared in accordance with International Financial Reporting Standards (“IFRS”) as issued by the International Accounting Standards Board (“IASB”) under the historical cost convention, as modified by revaluation of certain financial assets, derivative contracts and post-retirement assets. Our significant accounting policies are disclosed in note 2 of the Financial
Statements, including a summary of current and future changes in accounting policies.
Critical Accounting Estimates and Judgments
Certain accounting estimates have been identified as being “critical�� to the presentation of our financial condition and results of operations because they require us to make subjective and/or complex judgments about matters that are inherently uncertain; or there is a reasonable likelihood that materially different amounts could be reported under different conditions or using different assumptions and estimates. Our significant accounting judgments, estimates and assumptions are disclosed in note 3 of the accompanying Financial Statements.
NON-GAAP FINANCIAL PERFORMANCE MEASURES
Adjusted Net Earnings and Adjusted Net Earnings per Share
Adjusted net earnings is anon-GAAP financial measure which excludes the following from net earnings:
| • | Impairment charges (reversals) related to intangibles, goodwill, property, plant and equipment, and investments; |
| • | Acquisition/disposition gains/losses; |
| • | Foreign currency translation gains/losses; |
| • | Significant tax adjustments; and |
| • | Tax effect andnon-controlling interest of the above items. |
Management uses this measure internally to evaluate our underlying operating performance for the reporting periods presented and to assist with the planning and forecasting of future operating results. Management believes that adjusted net earnings is a useful measure of our performance because impairment charges, acquisition/disposition gains/losses and significant tax adjustments do not reflect the underlying operating performance of our core mining business and are not necessarily indicative of future operating results. Furthermore, foreign currency translation gains/losses are not necessarily reflective of the underlying operating results for the reporting periods presented. The tax effect andnon-controlling interest of the adjusting items are also excluded to reconcile the amounts to Barrick’s share on apost-tax basis, consistent with net earnings.
As noted, we use this measure for internal purposes. Management’s internal budgets and forecasts and public guidance do not include the types of items we adjust for. Consequently, the presentation of adjusted net earnings enables investors and analysts to better understand the underlying operating performance of our core mining business through the eyes of management. Management periodically evaluates the components of adjusted net earnings based on an internal assessment of performance measures that are useful for evaluating the operating performance of our business segments and a review of thenon-GAAP measures used by mining industry analysts and other mining companies.
Adjusted net earnings is intended to provide additional information only and does not have any standardized definition under IFRS and should not be considered in isolation or as a substitute for measures of performance prepared in accordance with IFRS. The measures are not necessarily indicative of operating profit or cash flow from operations as determined under IFRS. Other companies may calculate these measures differently. The following table reconciles thesenon-GAAP measures to the most directly comparable IFRS measure.
| BARRICK FIRST QUARTER 2020 | 79 | MANAGEMENT’S DISCUSSION AND ANALYSIS |
Reconciliation of Net Earnings to Net Earnings per Share, Adjusted Net Earnings and Adjusted Net Earnings per Share
| ($ millions, except per share amounts in dollars) | For the three months ended | |||||||||||
| 3/31/20 | 12/31/19 | 3/31/19 | ||||||||||
Net earnings (loss) attributable to equity holders of the Company | 400 | 1,387 | 111 | |||||||||
Impairment charges (reversals) related to intangibles, goodwill, property, plant and equipment, and investmentsa | (336 | ) | (566 | ) | 3 | |||||||
Acquisition/disposition (gains) lossesb | (60 | ) | (414 | ) | 0 | |||||||
(Gain) loss on currency translation | 16 | 53 | 22 | |||||||||
Significant tax adjustmentsc | (44 | ) | 74 | 8 | ||||||||
Other expense adjustmentsd | 98 | (845 | ) | 46 | ||||||||
Tax effect andnon-controlling intereste | 211 | 611 | (6 | ) | ||||||||
Adjusted net earnings | 285 | 300 | 184 | |||||||||
Net earnings per sharef | 0.22 | 0.78 | 0.06 | |||||||||
Adjusted net earnings per sharef | 0.16 | 0.17 | 0.11 | |||||||||
| a. | Net impairment reversals for the three month period ended March 31, 2020 primarily relate tonon-current asset reversals at Bulyanhulu, offset by losses at Buzwagi and North Mara. For the three month period ended December 31, 2019, net impairment reversals primarily relate tonon-current asset impairments at Pueblo Viejo, partially offset by impairment charges at Pascua-Lama. |
| b. | Acquisition/disposition gains for the three month period ended March 31, 2020 primarily relate to the gain on the sale of Massawa. For the three month period ended December 31, 2019, acquisition/disposition gains mainly relate to the gain on the sale of our 50% interest in Kalgoorlie. |
| c. | Significant tax adjustments for the three month period ended March 31, 2020 primarily relate to deferred tax recoveries as a result of tax reform measures in Argentina and adjustments made in recognition of the net settlement of all outstanding disputes with the Government of Tanzania. Refer to Note 10 to the Financial Statements for more information. |
| d. | Other expense adjustments for the three month period ended March 31, 2020 primarily relate to the impact of changes in the discount rate assumptions on our closed mine rehabilitation provision and losses on debt extinguishment. For the three month period ended December 31, 2019, other expense adjustments primarily relate to the gain on thede-recognition of the deferred revenue liability relating to our silver sale agreement with Wheaton Precious Metals Corp. and the gain on a settlement of customs duty and indirect taxes at Lumwana. |
| e. | Tax effect andnon-controlling interest for the three month periods ended March 31, 2020 and December 31, 2019 primarily relates to the net impairment reversals related to long-lived assets. |
| f. | Calculated using weighted average number of shares outstanding under the basic method of earnings per share. |
Free Cash Flow
Free cash flow is a measure that deducts capital expenditures from net cash provided by operating activities. Management believes this to be a useful indicator of our ability to operate without reliance on additional borrowing or usage of existing cash.
Free cash flow is intended to provide additional information only and does not have any standardized definition under
IFRS and should not be considered in isolation or as a substitute for measures of performance prepared in accordance with IFRS. The measure is not necessarily indicative of operating profit or cash flow from operations as determined under IFRS. Other companies may calculate this measure differently. The following table reconciles thisnon-GAAP measure to the most directly comparable IFRS measure.
Reconciliation of Net Cash Provided by Operating Activities to Free Cash Flow
| ($ millions) | For the three months ended | |||||||||||
| 3/31/20 | 12/31/19 | 3/31/19 | ||||||||||
Net cash provided by operating activities | 889 | 875 | 520 | |||||||||
Capital expenditures | (451 | ) | (446 | ) | (374 | ) | ||||||
Free cash flow | 438 | 429 | 146 | |||||||||
| BARRICK FIRST QUARTER 2020 | 80 | MANAGEMENT’S DISCUSSION AND ANALYSIS |
Total cash costs per ounce,All-in sustaining costs per ounce,All-in costs per ounce, C1 cash costs per pound andAll-in sustaining costs per pound
Total cash costs per ounce,all-in sustaining costs per ounce andall-in costs per ounce arenon-GAAP financial measures which are calculated based on the definition published by the World Gold Council (a market development organization for the gold industry comprised of and funded by 25 gold mining companies from around the world, including Barrick). The WGC is not a regulatory organization. Management uses these measures to monitor the performance of our gold mining operations and its ability to generate positive cash flow, both on an individual site basis and an overall company basis.
Total cash costs start with our cost of sales related to gold production and removes depreciation, thenon-controlling interest of cost of sales and includesby-product credits.All-in sustaining costs start with total cash costs and include sustaining capital expenditures, sustaining leases, general and administrative costs, minesite exploration and evaluation costs and reclamation cost accretion and amortization. These additional costs reflect the expenditures made to maintain current production levels.
All-in costs starts withall-in sustaining costs and adds additional costs that reflect the varying costs of producing gold over the life-cycle of a mine, including: project capital expenditures (capital expenditures at new projects and discrete projects at existing operations intended to increase production capacity and will not benefit production for at least 12 months) and othernon-sustaining costs (primarilynon-sustaining leases, exploration and evaluation costs, community relations costs and general and administrative costs that are not associated with current operations). These definitions recognize that there are different costs associated with the life-cycle of a mine, and that it is therefore appropriate to distinguish between sustaining andnon-sustaining costs.
We believe that our use of total cash costs,all-in sustaining costs andall-in costs will assist analysts, investors and other stakeholders of Barrick in understanding the costs associated with producing gold, understanding the economics of gold mining, assessing our operating performance and also our ability to generate free cash flow from current operations and to generate free cash flow on an overall company basis. Due to the capital-intensive nature of the industry and the long useful lives over which these items are depreciated, there can be a significant timing difference between net earnings calculated in accordance with IFRS and the amount of free
cash flow that is being generated by a mine and therefore we believe these measures are usefulnon-GAAP operating metrics and supplement our IFRS disclosures. These measures are not representative of all of our cash expenditures as they do not include income tax payments, interest costs or dividend payments. These measures do not include depreciation or amortization.
Total cash costs per ounce,all-in sustaining costs andall-in costs are intended to provide additional information only and do not have standardized definitions under IFRS and should not be considered in isolation or as a substitute for measures of performance prepared in accordance with IFRS. These measures are not equivalent to net income or cash flow from operations as determined under IFRS. Although the WGC has published a standardized definition, other companies may calculate these measures differently.
In addition to presenting these metrics on aby-product basis, we have calculated these metrics on aco-product basis. Ourco-product metrics remove the impact of other metal sales that are produced as aby-product of our gold production from cost per ounce calculations but does not reflect a reduction in costs for costs associated with other metal sales.
C1 cash costs per pound andall-in sustaining costs per pound arenon-GAAP financial measures related to our copper mine operations. We believe that C1 cash costs per pound enables investors to better understand the performance of our copper operations in comparison to other copper producers who present results on a similar basis. C1 cash costs per pound excludes royalties and production taxes andnon-routine charges as they are not direct production costs.All-in sustaining costs per pound is similar to the goldall-in sustaining costs metric and management uses this to better evaluate the costs of copper production. We believe this measure enables investors to better understand the operating performance of our copper mines as this measure reflects all of the sustaining expenditures incurred in order to produce copper.All-in sustaining costs per pound includes C1 cash costs, sustaining capital expenditures, sustaining leases, general and administrative costs, minesite exploration and evaluation costs, royalties and production taxes, reclamation cost accretion and amortization and write-downs taken on inventory to net realizable value.
| BARRICK FIRST QUARTER 2020 | 81 | MANAGEMENT’S DISCUSSION AND ANALYSIS |
Reconciliation of Gold Cost of Sales to Total cash costs,All-in sustaining costs andAll-in costs, including on a per ounce basis
| ($ millions, except per ounce information in dollars) | For the three months ended | |||||||||||||
| Footnote | 3/31/20 | 12/31/19 | 3/31/19 | |||||||||||
Cost of sales applicable to gold production | 1,643 | 1,896 | 1,350 | |||||||||||
Depreciation | (474 | ) | (549 | ) | (384 | ) | ||||||||
Cash cost of sales applicable to equity method investments | 52 | 57 | 62 | |||||||||||
By-product credits | (29 | ) | (43 | ) | (24 | ) | ||||||||
Realized (gains) losses on hedge andnon-hedge derivatives | a | 0 | 1 | 0 | ||||||||||
Non-recurring items | b | 0 | (22 | ) | (20 | ) | ||||||||
Other | c | (27 | ) | (37 | ) | (20 | ) | |||||||
Non-controlling interests | d | (316 | ) | (326 | ) | (101 | ) | |||||||
Total cash costs | 849 | 977 | 863 | |||||||||||
General & administrative costs | 40 | 31 | 54 | |||||||||||
Minesite exploration and evaluation costs | e | 15 | 24 | 11 | ||||||||||
Minesite sustaining capital expenditures | f | 370 | 394 | 253 | ||||||||||
Sustaining leases | 0 | 4 | 10 | |||||||||||
Rehabilitation - accretion and amortization (operating sites) | g | 14 | 7 | 14 | ||||||||||
Non-controlling interest, copper operations and other | h | (125 | ) | (135 | ) | (75 | ) | |||||||
All-in sustaining costs | 1,163 | 1,302 | 1,130 | |||||||||||
Project exploration and evaluation and project costs | e | 56 | 60 | 63 | ||||||||||
Community relations costs not related to current operations | 1 | 0 | 1 | |||||||||||
Project capital expenditures | f | 76 | 46 | 120 | ||||||||||
Rehabilitation - accretion and amortization(non-operating sites) | g | 2 | 3 | 7 | ||||||||||
Non-controlling interest and copper operations and other | h | (33 | ) | (28 | ) | (3 | ) | |||||||
All-in costs | 1,265 | 1,383 | 1,318 | |||||||||||
Ounces sold - equity basis (000s ounces) | i | 1,220 | 1,413 | 1,365 | ||||||||||
Cost of sales per ounce | j,k | 1,020 | 1,046 | 947 | ||||||||||
Total cash costs per ounce | k | 692 | 692 | 631 | ||||||||||
Total cash costs per ounce (on aco-product basis) | k,l | 705 | 712 | 644 | ||||||||||
All-in sustaining costs per ounce | k | 954 | 923 | 825 | ||||||||||
All-in sustaining costs per ounce (on aco-product basis) | k,l | 967 | 943 | 838 | ||||||||||
All-in costs per ounce | k | 1,035 | 976 | 964 | ||||||||||
All-in costs per ounce (on aco-product basis) | k,l | 1,048 | 996 | 977 | ||||||||||
| a. | Realized (gains) losses on hedge andnon-hedge derivatives |
Includes realized hedge losses of $nil for the three month periods ended March 31, 2020 (December 31, 2019: $nil and March 31, 2019: $nil), and realizednon-hedge losses of $nil for the three month periods ended March 31, 2020 (December 31, 2019: $1 million and March 31, 2019: $nil). Refer to note 5 to the Financial Statements for further information.
| b. | Non-recurring items |
Non-recurring items in 2019 relate to organizational restructuring. These costs are not indicative of our cost of production and have been excluded from the calculation of total cash costs.
| c. | Other |
Other adjustments for the three month period ended March 31, 2020 include the removal of total cash costs andby-product credits associated with our Pierina mine; Golden Sunlight and Morila starting in the third quarter of 2019; and Lagunas Norte starting in the fourth quarter of 2019, which all are mining incidental ounces as they enter closure of $25 million (December 31, 2019: $35 million; March 31, 2019: $18 million relating to Pierina only).
| d. | Non-controlling interests |
Non-controlling interests includenon-controlling interests related to gold production of $466 million for the three month periods ended March 31, 2020 (December 31, 2019: $477 million and March 31, 2019: $152 million).Non-controlling interests include Pueblo Viejo, Loulo-Gounkoto, Tongon, North Mara, Bulyanhulu, Buzwagi (notwithstanding the completion of the Acacia transaction on September 17, 2019, we consolidated our interest in Acacia and recorded anon-controlling interest of 36.1% in the income statement for the entirety of the third quarter of 2019 as a matter of convenience) and Nevada Gold Mines starting July 1, 2019. Refer to note 5 to the Financial Statements for further information.
| e. | Exploration and evaluation costs |
Exploration, evaluation and project expenses are presented as minesite sustaining if it supports current mine operations and project if it relates to future projects. Refer to page 72 of this MD&A.
| BARRICK FIRST QUARTER 2020 | 82 | MANAGEMENT’S DISCUSSION AND ANALYSIS |
| f. | Capital expenditures |
Capital expenditures are related to our gold sites only and are split between minesite sustaining and project capital expenditures. Project capital expenditures are distinct projects designed to increase the net present value of the mine and are not related to current production. Significant projects in the current year are stripping at Rangefront declines, the Goldrush exploration declines, and construction of the third shaft at Turquoise Ridge. Refer to page 71 of this MD&A.
| g. | Rehabilitation—accretion and amortization |
Includes depreciation on the assets related to rehabilitation provisions of our gold operations and accretion on the rehabilitation provision of our gold operations, split between operating andnon-operating sites.
| h. | Non-controlling interest and copper operations |
Removes general & administrative costs related tonon-controlling interests and copper based on a percentage allocation of revenue. Also removes exploration, evaluation and project expenses, rehabilitation costs and capital expenditures incurred by our copper sites and thenon-controlling interest of North Mara, Bulyanhulu and Buzwagi (notwithstanding the completion of the Acacia transaction on September 17, 2019, we consolidated our interest in Acacia and recorded anon-controlling interest of 36.1% in the income statement for the entirety of the third quarter of 2019 as a matter of convenience), Pueblo Viejo, Loulo-Gounkoto and Tongon operating segments and South Arturo (63.1% of South Arturo from July 1, 2019 onwards as a result of its contribution to Nevada Gold Mines). Also removes thenon-controlling interest of Nevada Gold Mines starting July 1, 2019. It also includes capital expenditures applicable to equity method investments. Figures remove the impact of Pierina; Golden Sunlight and Morila starting in the third quarter of 2019; and Lagunas Norte starting in the fourth quarter of 2019. The impact is summarized as the following:
| ($ millions) | For the three months ended | |||||||||||
| Non-controlling interest, copper operations and other | 3/31/20 | 12/31/19 | 3/31/19 | |||||||||
| General & administrative costs | (6 | ) | (3 | ) | (10 | ) | ||||||
| Minesite exploration and evaluation expenses | (3 | ) | (6 | ) | (1 | ) | ||||||
| Rehabilitation - accretion and amortization (operating sites) | (4 | ) | (1 | ) | (1 | ) | ||||||
| Minesite sustaining capital expenditures | (112 | ) | (125 | ) | (63 | ) | ||||||
| All-in sustaining costs total | (125 | ) | (135 | ) | (75 | ) | ||||||
| Project exploration and evaluation and project costs | (19 | ) | (14 | ) | (2 | ) | ||||||
| Project capital expenditures | (14 | ) | (14 | ) | (1 | ) | ||||||
| All-in costs total | (33 | ) | (28 | ) | (3 | ) | ||||||
| i. | Ounces sold - equity basis |
Figures remove the impact of Pierina; Golden Sunlight and Morila starting in the third quarter of 2019; and Lagunas Norte starting in the fourth quarter of 2019, which are mining incidental ounces as the sites enter closure.
| j. | Cost of sales per ounce |
Figures remove the cost of sales impact of Pierina of $6 million for the three month periods ended March 31, 2020 (December 31, 2019: $14 million and March 31, 2019: $27 million); starting in the third quarter of 2019, Golden Sunlight of $nil for the three month periods ended March 31, 2020 (December 31, 2019: $nil and March 31, 2019: $nil) and Morila of $6 million for the three month periods ended March 31, 2020 (December 31, 2019: $13 million and March 31, 2019: $nil); and starting in the fourth quarter of 2019, Lagunas Norte of $21 million for the three month periods ended March 31, 2020 (December 31, 2019: $26 million and March 31, 2019: $nil), which are mining incidental ounces as these sites enter closure. Cost of sales per ounce excludesnon-controlling interest related to gold production. Cost of sales applicable to gold per ounce is calculated using cost of sales on an attributable basis (removing thenon- controlling interest of 40% Pueblo Viejo, 20% of Loulo-Gounkoto, 10.3% of Tongon, 16% North Mara, Bulyanhulu and Buzwagi starting January 1, 2020, the effective date of the GoT’s free carried interest (36.1% up until September 30, 2019; notwithstanding the completion of the Acacia transaction on September 17, 2019, we consolidated our interest in Acacia and recorded anon-controlling interest of 36.1% in the income statement for the entirety of the third quarter of 2019 as a matter of convenience) and 40% South Arturo from cost of sales (63.1% of South Arturo from July 1, 2019 onwards as a result of its contribution to Nevada Gold Mines)), divided by attributable gold ounces. Thenon-controlling interest of 38.5% Nevada Gold Mines is also removed from cost of sales from July 1, 2019 onwards.
| k. | Per ounce figures |
Cost of sales per ounce, total cash costs per ounce,all-in sustaining costs per ounce andall-in costs per ounce may not calculate based on amounts presented in this table due to rounding.
| l. | Co-product costs per ounce |
Total cash costs per ounce,all-in sustaining costs per ounce andall-in costs per ounce presented on aco-product basis removes the impact ofby-product credits of our gold production (net ofnon-controlling interest) calculated as:
| ($ millions) | For the three months ended | |||||||||||
| 3/31/20 | 12/31/19 | 3/31/19 | ||||||||||
By-product credits | 29 | 43 | 24 | |||||||||
Non-controlling interest | (15 | ) | (17 | ) | (8 | ) | ||||||
By-product credits (net ofnon-controlling interest) | 14 | 26 | 16 | |||||||||
| BARRICK FIRST QUARTER 2020 | 83 | MANAGEMENT’S DISCUSSION AND ANALYSIS |
Reconciliation of Gold Cost of Sales to Total cash costs,All-in sustaining costs andAll-in costs, including on a per ounce basis, by operating site
| ($ millions, except per ounce information in dollars) | For the three months ended 03/31/2020 | |||||||||||||||||||||||||||||||||||
| Footnote | Carlina | Cortezb | Turquoise Ridgec | Long Canyond | Phoenixd | Nevada Gold Minese | Hemlo | North America | ||||||||||||||||||||||||||||
Cost of sales applicable to gold production | 404 | 182 | 147 | 45 | 78 | 856 | 65 | 921 | ||||||||||||||||||||||||||||
Depreciation | (80 | ) | (54 | ) | (51 | ) | (30 | ) | (22 | ) | (237 | ) | (10 | ) | (247 | ) | ||||||||||||||||||||
By-product credits | 0 | 0 | (1 | ) | 0 | (20 | ) | (21 | ) | 0 | (21 | ) | ||||||||||||||||||||||||
Non-recurring items | f | 0 | 0 | 0 | 0 | 0 | 0 | 0 | 0 | |||||||||||||||||||||||||||
Other | 0 | 0 | 0 | 0 | 0 | 0 | 0 | 0 | ||||||||||||||||||||||||||||
Non-controlling interests | (125 | ) | (49 | ) | (37 | ) | (6 | ) | (14 | ) | (231 | ) | 0 | (231 | ) | |||||||||||||||||||||
Total cash costs | 199 | 79 | 58 | 9 | 22 | 367 | 55 | 422 | ||||||||||||||||||||||||||||
General & administrative costs | 0 | 0 | 0 | 0 | 0 | 0 | 0 | 0 | ||||||||||||||||||||||||||||
Minesite exploration and evaluation costs | g | 3 | 2 | 1 | 1 | 0 | 7 | 0 | 7 | |||||||||||||||||||||||||||
Minesite sustaining capital expenditures | f | 91 | 76 | 18 | 8 | 7 | 209 | 19 | 228 | |||||||||||||||||||||||||||
Sustaining leases | 0 | 0 | 0 | 0 | 0 | 0 | 0 | 0 | ||||||||||||||||||||||||||||
Rehabilitation - accretion and amortization (operating sites) | i | 2 | 4 | 0 | 0 | 1 | 7 | 0 | 7 | |||||||||||||||||||||||||||
Non-controlling interests | (37 | ) | (32 | ) | (7 | ) | (4 | ) | (3 | ) | (83 | ) | 0 | (83 | ) | |||||||||||||||||||||
All-in sustaining costs | 258 | 129 | 70 | 14 | 27 | 507 | 74 | 581 | ||||||||||||||||||||||||||||
Project exploration and evaluation and project costs | e | 0 | 0 | 0 | 0 | 0 | 0 | 0 | 0 | |||||||||||||||||||||||||||
Project capital expenditures | f | 0 | 6 | 14 | 0 | 0 | 35 | 0 | 35 | |||||||||||||||||||||||||||
Non-controlling interests | 0 | (2 | ) | (6 | ) | 0 | 0 | (13 | ) | 0 | (13 | ) | ||||||||||||||||||||||||
All-in costs | 258 | 133 | 78 | 14 | 27 | 529 | 74 | 603 | ||||||||||||||||||||||||||||
Ounces sold - equity basis (000s ounces) | 256 | 128 | 87 | 27 | 30 | 528 | 58 | 586 | ||||||||||||||||||||||||||||
Cost of sales per ounce | j,k | 970 | 876 | 1,032 | 1,025 | 1,583 | 995 | 1,119 | 1,007 | |||||||||||||||||||||||||||
Total cash costs per ounce | k | 776 | 614 | 668 | 345 | 737 | 690 | 945 | 720 | |||||||||||||||||||||||||||
Total cash costs per ounce (on aco-product basis) | k,l | 777 | 614 | 672 | 347 | 1,140 | 730 | 945 | 757 | |||||||||||||||||||||||||||
All-in sustaining costs per ounce | k | 1,007 | 1,009 | 806 | 561 | 914 | 952 | 1,281 | 979 | |||||||||||||||||||||||||||
All-in sustaining costs per ounce (on aco-product basis) | k,l | 1,008 | 1,009 | 810 | 563 | 1,317 | 992 | 1,281 | 1,016 | |||||||||||||||||||||||||||
All-in costs per ounce | k | 1,007 | 1,039 | 903 | 561 | 914 | 993 | 1,288 | 1,017 | |||||||||||||||||||||||||||
All-in costs per ounce (on a co-product basis) | k,l | 1,008 | 1,039 | 907 | 563 | 1,317 | 1,033 | 1,288 | 1,054 | |||||||||||||||||||||||||||
| BARRICK FIRST QUARTER 2020 | 84 | MANAGEMENT’S DISCUSSION AND ANALYSIS |
| ($ millions, except per ounce information in dollars) | For the three months ended 03/31/2020 | |||||||||||||||||||||
| Footnote | Pueblo Viejo | Veladero | Porgera | Latin America & Asia Pacific | ||||||||||||||||||
Cost of sales applicable to gold production | 185 | 67 | 70 | 322 | ||||||||||||||||||
Depreciation | (53 | ) | (22 | ) | (10 | ) | (85 | ) | ||||||||||||||
By-product credits | (12 | ) | (1 | ) | 0 | (13 | ) | |||||||||||||||
Non-recurring items | f | 0 | 0 | 0 | 0 | |||||||||||||||||
Other | 0 | 0 | 0 | 0 | ||||||||||||||||||
Non-controlling interests | (48 | ) | 0 | 0 | (48 | ) | ||||||||||||||||
Total cash costs | 72 | 44 | 60 | 176 | ||||||||||||||||||
General & administrative costs | 0 | 0 | 0 | 0 | ||||||||||||||||||
Minesite exploration and evaluation costs | g | 0 | 0 | 1 | 1 | |||||||||||||||||
Minesite sustaining capital expenditures | h | 28 | 25 | 8 | 61 | |||||||||||||||||
Sustaining leases | 0 | 0 | 1 | 1 | ||||||||||||||||||
Rehabilitation - accretion and amortization (operating sites) | i | 1 | 1 | 0 | 2 | |||||||||||||||||
Non-controlling interests | (12 | ) | 0 | 0 | (12 | ) | ||||||||||||||||
All-in sustaining costs | 89 | 70 | 70 | 229 | ||||||||||||||||||
Project exploration and evaluation and project costs | e | 2 | 0 | 0 | 2 | |||||||||||||||||
Project capital expenditures | h | 0 | 15 | 0 | 15 | |||||||||||||||||
Non-controlling interests | (1 | ) | 0 | 0 | (1 | ) | ||||||||||||||||
All-in costs | 90 | 85 | 70 | 245 | ||||||||||||||||||
Ounces sold - equity basis (000s ounces) | 144 | 57 | 63 | 264 | ||||||||||||||||||
Cost of sales per ounce | j,k | 767 | 1,182 | 1,097 | 935 | |||||||||||||||||
Total cash costs per ounce | k | 502 | 788 | 941 | 668 | |||||||||||||||||
Total cash costs per ounce (on aco-product basis) | k,l | 548 | 806 | 946 | 718 | |||||||||||||||||
All-in sustaining costs per ounce | k | 626 | 1,266 | 1,089 | 874 | |||||||||||||||||
All-in sustaining costs per ounce (on aco-product basis) | k,l | 672 | 1,284 | 1,094 | 924 | |||||||||||||||||
All-in costs per ounce | k | 635 | 1,537 | 1,089 | 934 | |||||||||||||||||
All-in costs per ounce (on a co-product basis) | k,l | 681 | 1,555 | 1,094 | 984 | |||||||||||||||||
| BARRICK FIRST QUARTER 2020 | 85 | MANAGEMENT’S DISCUSSION AND ANALYSIS |
| ($ millions, except per ounce information in dollars) | For the three months ended 3/31/20 | |||||||||||||||||||||||||||||||
| Footnote | Loulo- Gounkoto | Kibali | North Mara | Tongon | Bulyanhulun | Buzwagin | Africa & Middle East | |||||||||||||||||||||||||
Cost of sales applicable to gold production | 153 | 93 | 79 | 89 | 14 | 39 | 467 | |||||||||||||||||||||||||
Depreciation | (59 | ) | (41 | ) | (25 | ) | (39 | ) | (8 | ) | (3 | ) | (175 | ) | ||||||||||||||||||
By-product credits | 0 | 0 | (1 | ) | 0 | 0 | 0 | (1 | ) | |||||||||||||||||||||||
Non-recurring items | f | 0 | 0 | 0 | 0 | 0 | 0 | 0 | ||||||||||||||||||||||||
Other | 0 | 0 | 0 | 0 | 0 | 0 | 0 | |||||||||||||||||||||||||
Non-controlling interests | (19 | ) | 0 | (9 | ) | (5 | ) | (1 | ) | (6 | ) | (40 | ) | |||||||||||||||||||
Total cash costs | 75 | 52 | 44 | 45 | 5 | 30 | 251 | |||||||||||||||||||||||||
General & administrative costs | 0 | 0 | 0 | 0 | 0 | 0 | 0 | |||||||||||||||||||||||||
Minesite exploration and evaluation costs | g | 2 | 1 | 0 | 1 | 0 | 0 | 4 | ||||||||||||||||||||||||
Minesite sustaining capital expenditures | h | 39 | 15 | 14 | 1 | 1 | 0 | 70 | ||||||||||||||||||||||||
Sustaining leases | 0 | 0 | 0 | 0 | 0 | 0 | 0 | |||||||||||||||||||||||||
Rehabilitation - accretion and amortization (operating sites) | i | 1 | 0 | 1 | 0 | 0 | 0 | 2 | ||||||||||||||||||||||||
Non-controlling interests | (8 | ) | 0 | (2 | ) | 0 | 0 | 0 | (10 | ) | ||||||||||||||||||||||
All-in sustaining costs | 109 | 68 | 57 | 47 | 6 | 30 | 317 | |||||||||||||||||||||||||
Project exploration and evaluation and project costs | e | 0 | 0 | 0 | 0 | 0 | 0 | 0 | ||||||||||||||||||||||||
Project capital expenditures | h | 0 | 0 | 2 | 0 | 1 | 0 | 3 | ||||||||||||||||||||||||
Non-controlling interests | 0 | 0 | 0 | 0 | 0 | 0 | 0 | |||||||||||||||||||||||||
All-in costs | 109 | 68 | 59 | 47 | 7 | 30 | 320 | |||||||||||||||||||||||||
Ounces sold - equity basis (000s ounces) | 123 | 88 | 70 | 58 | 7 | 24 | 370 | |||||||||||||||||||||||||
Cost of sales per ounce | j,k | 1,002 | 1,045 | 959 | 1,368 | 1,685 | 1,373 | 1,099 | ||||||||||||||||||||||||
Total cash costs per ounce | k | 614 | 582 | 646 | 762 | 686 | 1,275 | 680 | ||||||||||||||||||||||||
Total cash costs per ounce (on aco-product basis) | k,l | 614 | 585 | 653 | 763 | 709 | 1,282 | 684 | ||||||||||||||||||||||||
All-in sustaining costs per ounce | k | 891 | 773 | 816 | 788 | 906 | 1,288 | 859 | ||||||||||||||||||||||||
All-in sustaining costs per ounce (on aco-product basis) | k,l | 891 | 776 | 823 | 789 | 929 | 1,295 | 863 | ||||||||||||||||||||||||
All-in costs per ounce | k | 891 | 773 | 838 | 788 | 1,038 | 1,288 | 865 | ||||||||||||||||||||||||
All-in costs per ounce (on a co-product basis) | k,l | 891 | 776 | 845 | 789 | 1,061 | 1,295 | 869 | ||||||||||||||||||||||||
| BARRICK FIRST QUARTER 2020 | 86 | MANAGEMENT’S DISCUSSION AND ANALYSIS |
| ($ millions, except per ounce information in dollars) | For the three months ended 12/31/19 | |||||||||||||||||||||||||||||||||||||
| Footnote | Carlina | Cortezb | Turquoise Ridgec | Long Canyond | Phoenixd | Nevada Gold Minese | Hemlo | Pueblo Viejo | Veladero | |||||||||||||||||||||||||||||
Cost of sales applicable to gold production | 436 | 202 | 155 | 55 | 86 | 934 | 87 | 189 | 82 | |||||||||||||||||||||||||||||
Depreciation | (92 | ) | (58 | ) | (55 | ) | (38 | ) | (22 | ) | (265 | ) | (7 | ) | (55 | ) | (29 | ) | ||||||||||||||||||||
By-product credits | 0 | 0 | (1 | ) | 0 | (26 | ) | (27 | ) | 0 | (12 | ) | (3 | ) | ||||||||||||||||||||||||
Non-recurring items | f | (1 | ) | 0 | 0 | 0 | 0 | (1 | ) | (21 | ) | (1 | ) | 0 | ||||||||||||||||||||||||
Other | 0 | 0 | 0 | 0 | 0 | 0 | 0 | 0 | 0 | |||||||||||||||||||||||||||||
Non-controlling interests | (132 | ) | (54 | ) | (38 | ) | (7 | ) | (14 | ) | (245 | ) | 0 | (48 | ) | 0 | ||||||||||||||||||||||
Total cash costs | 211 | 90 | 61 | 10 | 24 | 396 | 59 | 73 | 50 | |||||||||||||||||||||||||||||
General & administrative costs | 0 | 0 | 0 | 0 | 0 | 0 | 0 | 0 | 0 | |||||||||||||||||||||||||||||
Minesite exploration and evaluation costs | g | 8 | 3 | 1 | 3 | 1 | 16 | 0 | 0 | 1 | ||||||||||||||||||||||||||||
Minesite sustaining capital expenditures | h | 92 | 65 | 29 | 17 | 8 | 211 | 15 | 23 | 28 | ||||||||||||||||||||||||||||
Sustaining leases | 0 | 0 | 0 | 0 | 0 | 0 | 1 | 0 | 0 | |||||||||||||||||||||||||||||
Rehabilitation - accretion and amortization (operating sites) | i | 0 | 4 | (1 | ) | (1 | ) | (2 | ) | 0 | 0 | 4 | 1 | |||||||||||||||||||||||||
Non-controlling interests | (45 | ) | (29 | ) | (9 | ) | (7 | ) | (4 | ) | (94 | ) | 0 | (11 | ) | 0 | ||||||||||||||||||||||
All-in sustaining costs | 266 | 133 | 81 | 22 | 27 | 529 | 75 | 89 | 80 | |||||||||||||||||||||||||||||
Project exploration and evaluation and project costs | e | 0 | 0 | 0 | 0 | 0 | 0 | 0 | 6 | 0 | ||||||||||||||||||||||||||||
Project capital expenditures | h | 0 | 6 | 11 | 0 | 0 | 38 | 0 | 0 | 0 | ||||||||||||||||||||||||||||
Non-controlling interests | 0 | (3 | ) | (5 | ) | 0 | 0 | (17 | ) | 0 | (3 | ) | 0 | |||||||||||||||||||||||||
All-in costs | 266 | 136 | 87 | 22 | 27 | 550 | 75 | 92 | 80 | |||||||||||||||||||||||||||||
Ounces sold - equity basis (000s ounces) | 275 | 132 | 99 | 33 | 26 | 565 | 53 | 174 | 70 | |||||||||||||||||||||||||||||
Cost of sales per ounce | j,k | 975 | 945 | 971 | 1,026 | 2,025 | 1,038 | 1,632 | 660 | 1,138 | ||||||||||||||||||||||||||||
Total cash costs per ounce | k | 766 | 681 | 625 | 317 | 902 | 711 | 1,091 | 422 | 710 | ||||||||||||||||||||||||||||
Total cash costs per ounce (on aco-product basis) | k,l | 767 | 684 | 632 | 319 | 1,504 | 760 | 1,094 | 462 | 733 | ||||||||||||||||||||||||||||
All-in sustaining costs per ounce | k | 965 | 1,012 | 800 | 657 | 1,034 | 944 | 1,380 | 517 | 1,142 | ||||||||||||||||||||||||||||
All-in sustaining costs per ounce (on aco-product basis) | k,l | 966 | 1,015 | 807 | 659 | 1,636 | 993 | 1,383 | 557 | 1,165 | ||||||||||||||||||||||||||||
All-in costs per ounce | k | 965 | 1,039 | 863 | 657 | 1,034 | 982 | 1,384 | 525 | 1,142 | ||||||||||||||||||||||||||||
All-in costs per ounce (on aco-product basis) | k,l | 966 | 1,042 | 870 | 659 | 1,636 | 1,031 | 1,387 | 565 | 1,165 | ||||||||||||||||||||||||||||
| BARRICK FIRST QUARTER 2020 | 87 | MANAGEMENT’S DISCUSSION AND ANALYSIS |
| ($ millions, except per ounce information in dollars) | For the three months ended 12/31/19 | |||||||||||||||||||||||||||||||||||
| Footnote | Porgera | Kalgoorliem | Loulo- Gounkoto | Kibali | North Mara | Tongon | Bulyanhulun | Buzwagin | ||||||||||||||||||||||||||||
Cost of sales applicable to gold production | 75 | 44 | 186 | 106 | 105 | 99 | 12 | 31 | ||||||||||||||||||||||||||||
Depreciation | (12 | ) | (6 | ) | (73 | ) | (52 | ) | (35 | ) | (45 | ) | (5 | ) | (2 | ) | ||||||||||||||||||||
By-product credits | (1 | ) | (1 | ) | 0 | (1 | ) | (1 | ) | (1 | ) | 0 | 0 | |||||||||||||||||||||||
Non-recurring items | f | 0 | 0 | 0 | 0 | 0 | 0 | 0 | 0 | |||||||||||||||||||||||||||
Other | 0 | 0 | 0 | 0 | 0 | 0 | 0 | 0 | ||||||||||||||||||||||||||||
Non-controlling interests | 0 | 0 | (22 | ) | 0 | 0 | (6 | ) | 0 | 0 | ||||||||||||||||||||||||||
Total cash costs | 62 | 37 | 91 | 53 | 69 | 47 | 7 | 29 | ||||||||||||||||||||||||||||
General & administrative costs | 0 | 0 | 0 | 0 | 0 | 0 | 0 | 0 | ||||||||||||||||||||||||||||
Minesite exploration and evaluation costs | g | 1 | 2 | 5 | 2 | 0 | 1 | 0 | 0 | |||||||||||||||||||||||||||
Minesite sustaining capital expenditures | h | 11 | 6 | 46 | 9 | 15 | 3 | 1 | 0 | |||||||||||||||||||||||||||
Sustaining leases | 1 | 0 | 0 | 1 | 0 | 1 | 0 | 1 | ||||||||||||||||||||||||||||
Rehabilitation - accretion and amortization (operating sites) | i | (1 | ) | 1 | 1 | 0 | 1 | 0 | 0 | 0 | ||||||||||||||||||||||||||
Non-controlling interests | 0 | 0 | (11 | ) | 0 | 0 | (1 | ) | 0 | 0 | ||||||||||||||||||||||||||
All-in sustaining costs | 74 | 46 | 132 | 65 | 85 | 51 | 8 | 30 | ||||||||||||||||||||||||||||
Project exploration and evaluation and project costs | e | 0 | 0 | 0 | 0 | 0 | 0 | 0 | 0 | |||||||||||||||||||||||||||
Project capital expenditures | h | 0 | 0 | 1 | 0 | 1 | 0 | 1 | 0 | |||||||||||||||||||||||||||
Non-controlling interests | 0 | 0 | 0 | 0 | 0 | 0 | 0 | 0 | ||||||||||||||||||||||||||||
All-in costs | 74 | 46 | 133 | 65 | 86 | 51 | 9 | 30 | ||||||||||||||||||||||||||||
Ounces sold - equity basis (000s ounces) | 82 | 39 | 144 | 89 | 103 | 59 | 9 | 26 | ||||||||||||||||||||||||||||
Cost of sales per ounce | j,k | 909 | 1,127 | 1,037 | 1,205 | 1,021 | 1,476 | 1,293 | 1,235 | |||||||||||||||||||||||||||
Total cash costs per ounce | k | 757 | 940 | 631 | 608 | 675 | 803 | 752 | 1,144 | |||||||||||||||||||||||||||
Total cash costs per ounce (on aco-product basis) | k,l | 765 | 943 | 631 | 611 | 687 | 805 | 805 | 1,161 | |||||||||||||||||||||||||||
All-in sustaining costs per ounce | k | 894 | 1,172 | 917 | 740 | 830 | 867 | 909 | 1,169 | |||||||||||||||||||||||||||
All-in sustaining costs per ounce (on aco-product basis) | k,l | 902 | 1,175 | 917 | 743 | 842 | 869 | 962 | 1,186 | |||||||||||||||||||||||||||
All-in costs per ounce | k | 894 | 1,172 | 922 | 746 | 840 | 867 | 935 | 1,169 | |||||||||||||||||||||||||||
All-in costs per ounce (on aco-product basis) | k,l | 902 | 1,175 | 922 | 749 | 852 | 869 | 988 | 1,186 | |||||||||||||||||||||||||||
| BARRICK FIRST QUARTER 2020 | 88 | MANAGEMENT’S DISCUSSION AND ANALYSIS |
| ($ millions, except per ounce information in dollars) | For the three months ended 3/31/19 | |||||||||||||||||||||||||||||||||||||||||||
| Footnote | Carlina | Cortezb | Turquoise Ridgec | Long Canyond | Phoenixd | Nevada Gold Minese | Hemlo | Golden Sunlighto | Pueblo Viejo | Veladero | ||||||||||||||||||||||||||||||||||
Cost of sales applicable to gold production | 226 | 177 | 45 | 448 | 53 | 16 | 163 | 81 | ||||||||||||||||||||||||||||||||||||
Depreciation | (66 | ) | (64 | ) | (6 | ) | (136 | ) | (7 | ) | (1 | ) | (46 | ) | (30 | ) | ||||||||||||||||||||||||||||
By-product credits | 0 | 0 | 0 | 0 | 0 | 0 | (16 | ) | (2 | ) | ||||||||||||||||||||||||||||||||||
Non-recurring items | f | 0 | 0 | 0 | 0 | (1 | ) | 0 | (1 | ) | (2 | ) | ||||||||||||||||||||||||||||||||
Other | 0 | 0 | 0 | 0 | 0 | 0 | 0 | 0 | ||||||||||||||||||||||||||||||||||||
Non-controlling interests | 0 | 0 | 0 | 0 | 0 | 0 | (41 | ) | 0 | |||||||||||||||||||||||||||||||||||
Total cash costs | 160 | 113 | 39 | 312 | 45 | 15 | 59 | 47 | ||||||||||||||||||||||||||||||||||||
General & administrative costs | 0 | 0 | 0 | 0 | 0 | 0 | 0 | 0 | ||||||||||||||||||||||||||||||||||||
Minesite exploration and evaluation costs | g | 2 | 2 | 0 | 4 | 0 | 0 | 0 | 0 | |||||||||||||||||||||||||||||||||||
Minesite sustaining capital expenditures | h | 55 | 13 | 7 | 75 | 8 | 1 | 27 | 25 | |||||||||||||||||||||||||||||||||||
Sustaining leases | 0 | 0 | 0 | 0 | 0 | 0 | 0 | 1 | ||||||||||||||||||||||||||||||||||||
Rehabilitation - accretion and amortization (operating sites) | i | 1 | 4 | 0 | 5 | 0 | 3 | 2 | 1 | |||||||||||||||||||||||||||||||||||
Non-controlling interests | (5 | ) | 0 | 0 | (5 | ) | 0 | 0 | (12 | ) | 0 | |||||||||||||||||||||||||||||||||
All-in sustaining costs | 213 | 132 | 46 | 391 | 53 | 19 | 76 | 74 | ||||||||||||||||||||||||||||||||||||
Project exploration and evaluation and project costs | e | 0 | 0 | 0 | 0 | 0 | 0 | 0 | 0 | |||||||||||||||||||||||||||||||||||
Project capital expenditures | h | 0 | 63 | 9 | 79 | 0 | 0 | 0 | 15 | |||||||||||||||||||||||||||||||||||
Non-controlling interests | 0 | 0 | 0 | 0 | 0 | 0 | 0 | 0 | ||||||||||||||||||||||||||||||||||||
All-in costs | 213 | 195 | 55 | 470 | 53 | 19 | 76 | 89 | ||||||||||||||||||||||||||||||||||||
Ounces sold - equity basis (000s ounces) | 239 | 259 | 76 | 574 | 58 | 7 | 142 | 68 | ||||||||||||||||||||||||||||||||||||
Cost of sales per ounce | j,k | 947 | 682 | 592 | 780 | 906 | 2,174 | 696 | 1,195 | |||||||||||||||||||||||||||||||||||
Total cash costs per ounce | k | 671 | 433 | 506 | 542 | 769 | 1,974 | 421 | 713 | |||||||||||||||||||||||||||||||||||
Total cash costs per ounce (on aco-product basis) | k,l | 671 | 434 | 506 | 543 | 773 | 1,996 | 492 | 736 | |||||||||||||||||||||||||||||||||||
All-in sustaining costs per ounce | k | 891 | 506 | 592 | 678 | 915 | 2,471 | 543 | 1,100 | |||||||||||||||||||||||||||||||||||
All-in sustaining costs per ounce (on aco-product basis) | k,l | 891 | 507 | 592 | 679 | 919 | 2,493 | 614 | 1,123 | |||||||||||||||||||||||||||||||||||
All-in costs per ounce | k | 891 | 749 | 716 | 817 | 916 | 2,471 | 544 | 1,325 | |||||||||||||||||||||||||||||||||||
All-in costs per ounce (on aco-product basis) | k,l | 891 | 750 | 716 | 818 | 920 | 2,493 | 615 | 1,348 | |||||||||||||||||||||||||||||||||||
| BARRICK FIRST QUARTER 2020 | 89 | MANAGEMENT’S DISCUSSION AND ANALYSIS |
| ($ millions, except per ounce information in dollars) | For the three months ended 3/31/19 | |||||||||||||||||||||||||||||||||||||||||||
| Footnote | Porgera | Kalgoorliem | Lagunas Norte | Loulo- Gounkoto | Kibali | North Mara | Tongon | Bulyanhulun | Buzwagin | Morilao | ||||||||||||||||||||||||||||||||||
Cost of sales applicable to gold production | 67 | 62 | 48 | 169 | 108 | 72 | 98 | 10 | 34 | 14 | ||||||||||||||||||||||||||||||||||
Depreciation | (11 | ) | (11 | ) | (7 | ) | (59 | ) | (56 | ) | (20 | ) | (44 | ) | (4 | ) | (2 | ) | (3 | ) | ||||||||||||||||||||||||
By-product credits | (1 | ) | 0 | (2 | ) | 0 | 0 | 0 | 0 | 0 | 0 | 0 | ||||||||||||||||||||||||||||||||
Non-recurring items | f | 0 | 0 | (15 | ) | 0 | 0 | 0 | 0 | 0 | 0 | 0 | ||||||||||||||||||||||||||||||||
Other | 0 | 0 | 0 | 0 | 0 | 0 | 0 | 0 | 0 | |||||||||||||||||||||||||||||||||||
Non-controlling interests | 0 | 0 | 0 | (22 | ) | 0 | (19 | ) | (6 | ) | (2 | ) | (11 | ) | 0 | |||||||||||||||||||||||||||||
Total cash costs | 55 | 51 | 24 | 88 | 52 | 33 | 48 | 4 | 21 | 11 | ||||||||||||||||||||||||||||||||||
General & administrative costs | 0 | 0 | 0 | 0 | 0 | 0 | 0 | 0 | 0 | 0 | ||||||||||||||||||||||||||||||||||
Minesite exploration and evaluation costs | g | 0 | 1 | 1 | 2 | 0 | 0 | 1 | 0 | 0 | 0 | |||||||||||||||||||||||||||||||||
Minesite sustaining capital expenditures | h | 8 | 15 | 7 | 22 | 9 | 9 | 2 | 0 | 0 | 0 | |||||||||||||||||||||||||||||||||
Sustaining leases | 0 | 2 | 5 | 1 | 0 | 0 | 0 | 0 | 0 | 0 | ||||||||||||||||||||||||||||||||||
Rehabilitation - accretion and amortization (operating sites) | i | 0 | 1 | 2 | 0 | 0 | 1 | 0 | 0 | 0 | 0 | |||||||||||||||||||||||||||||||||
Non-controlling interests | 0 | 0 | 0 | (5 | ) | 0 | (4 | ) | 0 | 0 | 0 | 0 | ||||||||||||||||||||||||||||||||
All-in sustaining costs | 63 | 70 | 39 | 108 | 61 | 39 | 51 | 4 | 21 | 11 | ||||||||||||||||||||||||||||||||||
Project exploration and evaluation and project costs | e | 0 | 0 | 0 | 0 | 0 | 0 | 0 | 0 | 0 | 0 | |||||||||||||||||||||||||||||||||
Project capital expenditures | h | 0 | 0 | 0 | 0 | 1 | 3 | 0 | 1 | 0 | 0 | |||||||||||||||||||||||||||||||||
Non-controlling interests | 0 | 0 | 0 | 0 | 0 | (1 | ) | 0 | 0 | 0 | 0 | |||||||||||||||||||||||||||||||||
All-in costs | 63 | 70 | 39 | 108 | 62 | 41 | 51 | 5 | 21 | 11 | ||||||||||||||||||||||||||||||||||
| Ounces sold - equity basis (000s ounces) | 65 | 58 | 37 | 128 | 90 | 43 | 61 | 6 | 18 | 10 | ||||||||||||||||||||||||||||||||||
Cost of sales per ounce | j,k | 1,031 | 1,064 | 1,304 | 1,052 | 1,202 | 1,064 | 1,451 | 1,008 | 1,243 | 1,445 | |||||||||||||||||||||||||||||||||
Total cash costs per ounce | k | 854 | 870 | 637 | 684 | 573 | 755 | 799 | 622 | 1,164 | 1,157 | |||||||||||||||||||||||||||||||||
| Total cash costs per ounce (on aco-product basis) | k,l | 867 | 873 | 704 | 684 | 576 | 762 | 801 | 649 | 1,171 | 1,160 | |||||||||||||||||||||||||||||||||
| All-in sustaining costs per ounce | k | 978 | 1,185 | 1,018 | 840 | 673 | 944 | 836 | 757 | 1,228 | 1,157 | |||||||||||||||||||||||||||||||||
| All-in sustaining costs per ounce (on aco-product basis) | k,l | 991 | 1,188 | 1,085 | 840 | 676 | 951 | 838 | 784 | 1,235 | 1,160 | |||||||||||||||||||||||||||||||||
All-in costs per ounce | k | 978 | 1,185 | 1,012 | 840 | 676 | 985 | 840 | 882 | 1,228 | 1,157 | |||||||||||||||||||||||||||||||||
| All-in costs per ounce (on aco-product basis) | k,l | 991 | 1,188 | 1,079 | 840 | 679 | 992 | 842 | 909 | 1,235 | 1,160 | |||||||||||||||||||||||||||||||||
| a. | On July 1, 2019, Barrick’s Goldstrike and Newmont’s Carlin were contributed to Nevada Gold Mines and are now referred to as Carlin. As a result, the amounts presented represent Goldstrike on a 100% basis (including our 60% share of South Arturo) up until June 30, 2019, and the combined results of Carlin and Goldstrike (including our 60% share of South Arturo) on a 61.5% basis thereafter. |
| b. | On July 1, 2019, Cortez was contributed to Nevada Gold Mines, a joint venture with Newmont. As a result, the amounts presented are on a 100% basis up until June 30, 2019, and on a 61.5% basis thereafter. |
| c. | Barrick owned 75% of Turquoise Ridge through to the end of the second quarter of 2019, with our joint venture partner, Newmont, owning the remaining 25%. Turquoise Ridge was proportionately consolidated on the basis that the joint venture partners that have joint control have rights to the assets and obligations for the liabilities relating to the arrangement. The figures presented in this table are based on our 75% interest in Turquoise Ridge until June 30, 2019. On July 1, 2019, Barrick’s 75% interest in Turquoise Ridge and Newmont’s Twin Creeks and 25% interest in Turquoise Ridge were contributed to Nevada Gold Mines. Starting July 1, 2019, the results represent our 61.5% share of Turquoise Ridge and Twin Creeks, now referred to as Turquoise Ridge. |
| d. | These sites were acquired as a result of the formation of Nevada Gold Mines on July 1, 2019. The results for the three months ended March 31, 2019 did not form a part of the Barrick consolidated results as these sites were acquired as a result of the formation of Nevada Gold Mines. Therefore, no comparative figures are provided. |
| BARRICK FIRST QUARTER 2020 | 90 | MANAGEMENT’S DISCUSSION AND ANALYSIS |
| e. | Represents the combined results of Cortez, Goldstrike (including our 60% share of South Arturo) and our 75% interest in Turquoise Ridge until June 30, 2019. Commencing July 1, 2019, the date Nevada Gold Mines was established, the results represent our 61.5% interest in Cortez, Carlin (including Goldstrike and 60% of South Arturo), Turquoise Ridge (including Twin Creeks), Phoenix and Long Canyon. |
| f. | Non-recurring items |
Non-recurring items in 2019 relate to organizational restructuring. These costs are not indicative of our cost of production and have been excluded from the calculation of total cash costs.
| g. | Exploration and evaluation costs |
Exploration, evaluation and project expenses are presented as minesite sustaining if it supports current mine operations and project if it relates to future projects. Refer to page 72 of this MD&A.
| h. | Capital expenditures |
Capital expenditures are related to our gold sites only and are split between minesite sustaining and project capital expenditures. Project capital expenditures are distinct projects designed to increase the net present value of the mine and are not related to current production. Significant projects in the current year are stripping at Rangefront declines, the Goldrush exploration declines, and construction of the third shaft at Turquoise Ridge. Refer to page 71 of this MD&A.
| i. | Rehabilitation - accretion and amortization |
Includes depreciation on the assets related to rehabilitation provisions of our gold operations and accretion on the rehabilitation provision of our gold operations, split between operating andnon-operating sites.
| j. | Cost of sales per ounce |
Cost of sales applicable to gold per ounce is calculated using cost of sales on an attributable basis (removing thenon-controlling interest of 40% Pueblo Viejo, 20% Loulo-Gounkoto, 10.3% Tongon, 16% North Mara, Bulyanhulu and Buzwagi starting January 1, 2020, the date the GoT’s 16% free carried interest was made effective (36.1% until September 30, 2019; notwithstanding the completion of the Acacia transaction on September 17, 2019, we consolidated our interest in Acacia and recorded anon-controlling interest of 36.1% in the income statement for the entirety of the third quarter of 2019 as a matter of convenience) and 40% South Arturo from cost of sales (63.1% of South Arturo from July 1, 2019 onwards as a result of its contribution to Nevada Gold Mines)), divided by attributable gold ounces. Thenon-controlling interest of 38.5% Nevada Gold Mines is also removed from cost of sales from July 1, 2019 onwards.
| k. | Per ounce figures |
Cost of sales per ounce, total cash costs per ounce,all-in sustaining costs per ounce andall-in costs per ounce may not calculate based on amounts presented in this table due to rounding.
| l. | Co-product costs per ounce |
Total cash costs per ounce,all-in sustaining costs per ounce andall-in costs per ounce presented on aco-product basis removes the impact ofby-product credits of our gold production (net ofnon-controlling interest) calculated as:
| ($ millions) | For the three months ended 3/31/20 | |||||||||||||||||||||||||||||||||||
| Carlina | Cortezb | Turquoise Ridgec | Long Canyond | Phoenixd | Nevada Gold Minese | Hemlo | Pueblo Viejo | Veladero | ||||||||||||||||||||||||||||
| By-product credits | 0 | 0 | 1 | 0 | 20 | 21 | 0 | 12 | 1 | |||||||||||||||||||||||||||
| Non-controlling interest | 0 | 0 | 0 | 0 | (8 | ) | (8 | ) | 0 | (5 | ) | 0 | ||||||||||||||||||||||||
| By-product credits (net ofnon-controlling interest) | 0 | 0 | 1 | 0 | 12 | 13 | 0 | 7 | 1 | |||||||||||||||||||||||||||
($ millions) | For the three months ended 3/31/20 | |||||||||||||||||||||||||||||||||||
| Porgera | Loulo- Gounkoto | Kibali | North Maran | Tongon | Bulyanhulun | Buzwagin | ||||||||||||||||||||||||||||||
| By-product credits | 0 | 0 | 0 | 1 | 0 | 0 | 0 | |||||||||||||||||||||||||||||
| Non-controlling interest | 0 | 0 | 0 | 0 | 0 | 0 | 0 | |||||||||||||||||||||||||||||
| By-product credits (net ofnon-controlling interest) | 0 | 0 | 0 | 1 | 0 | 0 | 0 | |||||||||||||||||||||||||||||
($ millions) | For the three months ended 12/31/19 | |||||||||||||||||||||||||||||||||||
| Carlina | Cortezb | Turquoise Ridgec | Long Canyond | Phoenixd | Nevada Gold Minese | Hemlo | Pueblo Viejo | Veladero | ||||||||||||||||||||||||||||
| By-product credits | 0 | 0 | 1 | 0 | 26 | 27 | 0 | 12 | 3 | |||||||||||||||||||||||||||
| Non-controlling interest | 0 | 0 | (1 | ) | 0 | (9 | ) | (10 | ) | 0 | (6 | ) | 0 | |||||||||||||||||||||||
| By-product credits (net ofnon-controlling interest) | 0 | 0 | 0 | 0 | 17 | 17 | 0 | 6 | 3 | |||||||||||||||||||||||||||
($ millions) | For the three months ended 12/31/19 | |||||||||||||||||||||||||||||||||||
| Porgera | Kalgoorliem | Loulo- Gounkoto | Kibali | North Maran | Tongon | Bulyanhulun | Buzwagin | |||||||||||||||||||||||||||||
| By-product credits | 1 | 1 | 0 | 1 | 1 | 1 | 0 | 0 | ||||||||||||||||||||||||||||
| Non-controlling interest | 0 | 0 | 0 | 0 | 0 | 0 | 0 | 0 | ||||||||||||||||||||||||||||
| By-product credits (net ofnon-controlling interest) | 1 | 1 | 0 | 1 | 1 | 1 | 0 | 0 | ||||||||||||||||||||||||||||
| BARRICK FIRST QUARTER 2020 | 91 | MANAGEMENT’S DISCUSSION AND ANALYSIS |
| ($ millions) | For the three months ended 3/31/19 | |||||||||||||||||||||||||||||||||||||||||||
| Carlina | Cortezb | Turquoise Ridgec | Long Canyond | Phoenixd | Nevada Gold Minese | Hemlo | Golden Sunlighto | Pueblo Viejo | Veladero | |||||||||||||||||||||||||||||||||||
| By-product credits | 0 | 0 | 0 | 0 | 0 | 0 | 16 | 2 | ||||||||||||||||||||||||||||||||||||
| Non-controlling interest | 0 | 0 | 0 | 0 | 0 | 0 | (6 | ) | 0 | |||||||||||||||||||||||||||||||||||
| By-product credits (net ofnon-controlling interest) | 0 | 0 | 0 | 0 | 0 | 0 | 10 | 2 | ||||||||||||||||||||||||||||||||||||
($ millions) | For the three months ended 3/31/19 | |||||||||||||||||||||||||||||||||||||||||||
| Porgera | Kalgoorliem | Lagunas Norteo | Loulo- Gounkoto | Kibali | North Maran | Tongon | Bulyanhulun | Buzwagin | Morilao | |||||||||||||||||||||||||||||||||||
| By-product credits | 1 | 0 | 2 | 0 | 0 | 0 | 0 | 0 | 0 | 0 | ||||||||||||||||||||||||||||||||||
| Non-controlling interest | 0 | 0 | 0 | 0 | 0 | 0 | 0 | 0 | 0 | 0 | ||||||||||||||||||||||||||||||||||
| By-product credits (net ofnon-controlling interest) | 1 | 0 | 2 | 0 | 0 | 0 | 0 | 0 | ||||||||||||||||||||||||||||||||||||
| m. | On November 28, 2019, we completed the sale of our 50% interest in Kalgoorlie in Western Australia to Saracen Mineral Holdings Limited for total cash consideration of $750 million. The transaction resulted in a gain of $408 million for the year ended December 31, 2019. The operating results reported for Kalgoorlie reflect the Company’s attributable share of Kalgoorlie’s results until the date of disposal. |
| n. | Formerly part of Acacia Mining plc. On September 17, 2019, Barrick acquired all of the shares of Acacia it did not own. The results are on a 63.9% basis until September 30, 2019 (notwithstanding the completion of the Acacia transaction on September 17, 2019, we consolidated our interest in Acacia and recorded anon-controlling interest of 36.1% in the income statement for the entirety of the third quarter of 2019 as a matter of convenience), on a 100% basis from October 1, 2019 to December 31, 2019, and on an 84% basis from January 1, 2020 onwards, the date the GoT’s 16% free carried interest was made effective. |
| o. | With the end of mining at Lagunas Norte in the third quarter of 2019 and at Golden Sunlight and Morila in the second quarter of 2019 as previously reported, we have ceased to include production ornon-GAAP cost metrics for these sites from October 1, 2019 and July 1, 2019, respectively, onwards. |
Reconciliation of Copper Cost of Sales to C1 cash costs andAll-in sustaining costs, including on a per pound basis
| ($ millions, except per pound information in dollars) | For the three months ended | |||||||||||
| 3/31/20 | 12/31/19 | 3/31/19 | ||||||||||
Cost of sales | 124 | 80 | 131 | |||||||||
Depreciation/amortization | (43 | ) | (17 | ) | (42 | ) | ||||||
Treatment and refinement charges | 39 | 25 | 31 | |||||||||
Cash cost of sales applicable to equity method investments | 66 | 94 | 66 | |||||||||
Less: royalties and production taxesa | (11 | ) | (9 | ) | (12 | ) | ||||||
By-product credits | (3 | ) | (1 | ) | (3 | ) | ||||||
| C1 cash cost of sales | 172 | 172 | 171 | |||||||||
General & administrative costs | 3 | 3 | 5 | |||||||||
Rehabilitation - accretion and amortization | 3 | 7 | 3 | |||||||||
Royalties and production taxesa | 11 | 9 | 12 | |||||||||
Minesite exploration and evaluation costs | 1 | 2 | 2 | |||||||||
Minesite sustaining capital expenditures | 32 | 60 | 59 | |||||||||
Sustaining leases | 3 | 3 | 1 | |||||||||
| All-in sustaining costs | 225 | 256 | 253 | |||||||||
| Pounds sold - consolidated basis (millions pounds) | 110 | 91 | 103 | |||||||||
| Cost of sales per poundb,c | 1.96 | 2.26 | 2.21 | |||||||||
| C1 cash cost per poundb | 1.55 | 1.90 | 1.66 | |||||||||
| All-in sustaining costs per poundb | 2.04 | 2.82 | 2.46 | |||||||||
| a. | For the three month period ended March 31, 2020, royalties and production taxes include royalties of $11 million (December 31, 2019: $8 million and March 31, 2019: $12 million). |
| b. | Cost of sales per pound, C1 cash costs per pound andall-in sustaining costs per pound may not calculate based on amounts presented in this table due to rounding. |
| c. | Cost of sales applicable to copper per pound is calculated using cost of sales including our proportionate share of cost of sales attributable to equity method investments (Zaldívar and Jabal Sayid), divided by consolidated copper pounds (including our proportionate share of copper pounds from our equity method investments). |
| BARRICK FIRST QUARTER 2020 | 92 | MANAGEMENT’S DISCUSSION AND ANALYSIS |
Reconciliation of Copper Cost of Sales to C1 cash costs andAll-in sustaining costs, including on a per pound basis, by operating site
| ($ millions, except per pound information in dollars) | For the three months ended | |||||||||||||||||||||||||||||||||||
3/31/20 | 12/31/19 | 3/31/19 | ||||||||||||||||||||||||||||||||||
| Zaldívar | Lumwana | Jabal Sayid | Zaldívar | Lumwana | Jabal Sayid | Zaldívar | Lumwana | Jabal Sayid | ||||||||||||||||||||||||||||
Cost of sales | 70 | 124 | 22 | 104 | 80 | 22 | 74 | 131 | 22 | |||||||||||||||||||||||||||
Depreciation/amortization | (20 | ) | (43 | ) | (6 | ) | (26 | ) | (17 | ) | (7 | ) | (21 | ) | (42 | ) | (9 | ) | ||||||||||||||||||
Treatment and refinement charges | 0 | 34 | 5 | 0 | 20 | 5 | 0 | 26 | 5 | |||||||||||||||||||||||||||
Less: royalties and production taxesa | 0 | (11 | ) | 0 | 0 | (9 | ) | 0 | 0 | (12 | ) | 0 | ||||||||||||||||||||||||
By-product credits | 0 | 0 | (3 | ) | 0 | 0 | (1 | ) | 0 | 0 | (3 | ) | ||||||||||||||||||||||||
C1 cash cost of sales | 50 | 104 | 18 | 78 | 74 | 19 | 53 | 103 | 15 | |||||||||||||||||||||||||||
Rehabilitation - accretion and amortization | 0 | 3 | 0 | 4 | 3 | 0 | 0 | 3 | 0 | |||||||||||||||||||||||||||
Royalties and production taxesa | 0 | 11 | 0 | 0 | 9 | 0 | 0 | 12 | 0 | |||||||||||||||||||||||||||
Minesite exploration and evaluation costs | 1 | 0 | 0 | 2 | 0 | 0 | 2 | 0 | 0 | |||||||||||||||||||||||||||
Minesite sustaining capital expenditures | 6 | 25 | 1 | 16 | 37 | 7 | 4 | 52 | 3 | |||||||||||||||||||||||||||
Sustaining leases | 1 | 2 | 0 | 3 | 0 | 0 | 0 | 1 | 0 | |||||||||||||||||||||||||||
All-in sustaining costs | 58 | 145 | 19 | 103 | 123 | 26 | 59 | 171 | 18 | |||||||||||||||||||||||||||
Pounds sold - consolidated basis (millions pounds) | 30 | 63 | 17 | 40 | 36 | 15 | 28 | 61 | 14 | |||||||||||||||||||||||||||
Cost of sales per poundb,c | 2.39 | 1.94 | 1.28 | 2.59 | 2.22 | 1.47 | 2.68 | 2.16 | 1.55 | |||||||||||||||||||||||||||
C1 cash cost per poundb | 1.71 | 1.63 | 0.97 | 1.95 | 2.10 | 1.29 | 1.91 | 1.67 | 1.10 | |||||||||||||||||||||||||||
All-in sustaining costs per poundb | 1.99 | 2.26 | 1.11 | 2.56 | 3.41 | 1.78 | 2.12 | 2.79 | 1.30 | |||||||||||||||||||||||||||
| a. | For the three month period ended March 31, 2020, royalties and production taxes include royalties of $11 million (December 31, 2019: $8 million and March 31, 2019: $12 million). |
| b. | Cost of sales per pound, C1 cash costs per pound andall-in sustaining costs per pound may not calculate based on amounts presented in this table due to rounding. |
| c. | Cost of sales applicable to copper per pound is calculated using cost of sales including our proportionate share of cost of sales attributable to equity method investments (Zaldívar and Jabal Sayid), divided by consolidated copper pounds (including our proportionate share of copper pounds from our equity method investments). |
EBITDA and Adjusted EBITDA
EBITDA is anon-GAAP financial measure, which excludes the following from net earnings:
| • | Income tax expense; |
| • | Finance costs; |
| • | Finance income; |
| • | Depreciation; and |
| • | Income tax expense, finance costs, finance income and depreciation from equity investees. |
Management believes that EBITDA is a valuable indicator of our ability to generate liquidity by producing operating cash flow to fund working capital needs, service debt obligations, and fund capital expenditures. Management uses EBITDA for this purpose. EBITDA is also frequently used by investors and analysts for valuation purposes whereby EBITDA is multiplied by a factor or “EBITDA multiple” that is based on an observed or inferred relationship between EBITDA and market values to determine the approximate total enterprise value of a company.
Adjusted EBITDA removes the effect of impairment charges; acquisition/disposition gains/losses; foreign currency translation gains/losses; and other expense adjustments. We believe these items provide a greater level of consistency with
the adjusting items included in our Adjusted Net Earnings reconciliation, with the exception that these amounts are adjusted to remove any impact on finance costs/income, income tax expense and/or depreciation, including the impact incurred in our equity method accounted investments, as they do not affect EBITDA. We believe this additional information will assist analysts, investors and other stakeholders of Barrick in better understanding our ability to generate liquidity from operating cash flow, by excluding these amounts from the calculation as they are not indicative of the performance of our core mining business and not necessarily reflective of the underlying operating results for the periods presented.
EBITDA and adjusted EBITDA are intended to provide additional information to investors and analysts and do not have any standardized definition under IFRS and should not be considered in isolation or as a substitute for measures of performance prepared in accordance with IFRS. EBITDA and adjusted EBITDA exclude the impact of cash costs of financing activities and taxes, and the effects of changes in operating working capital balances, and therefore are not necessarily indicative of operating profit or cash flow from operations as determined under IFRS. Other companies may calculate EBITDA and adjusted EBITDA differently.
| BARRICK FIRST QUARTER 2020 | 93 | MANAGEMENT’S DISCUSSION AND ANALYSIS |
Reconciliation of Net Earnings to EBITDA and Adjusted EBITDA
($ millions)
|
| For the three months ended
|
| |||||||||
|
| 3/31/20
|
|
| 12/31/19
|
|
| 3/31/19
|
| ||||
Net earnings (loss) | 663 | 1,776 | 140 | |||||||||
Income tax expense | 386 | 784 | 167 | |||||||||
Finance costs, neta | 88 | 90 | 100 | |||||||||
Depreciation
|
| 524
|
|
| 572
|
|
| 435
|
| |||
EBITDA | 1,661 | 3,222 | 842 | |||||||||
Impairment charges (reversals) of long-lived assetsb | (336 | ) | (566 | ) | 3 | |||||||
Acquisition/disposition (gains) lossesc | (60 | ) | (414 | ) | 0 | |||||||
Loss on currency translation | 16 | 53 | 22 | |||||||||
Other expense (income) adjustmentsd | 98 | (845 | ) | 46 | ||||||||
Income tax expense, net finance costs, and depreciation from equity investees
|
| 87
|
|
| 112
|
|
| 89
|
| |||
Adjusted EBITDA
|
| 1,467
|
|
| 1,562
|
|
| 1,002
|
| |||
| a. | Finance costs exclude accretion. |
| b. | Net impairment reversals for the three month period ended March 31, 2020 primarily relate tonon-current asset reversals at Bulyanhulu, offset by losses at Buzwagi and North Mara. For the three month period ended December 31, 2019, net impairment reversals primarily relate tonon-current asset impairments at Pueblo Viejo, partially offset by impairment charges at Pascua-Lama. |
| c. | Acquisition/disposition gains for the three month period ended March 31, 2020 primarily relate to the gain on the sale of Massawa. For the three month period ended December 31, 2019, acquisition/disposition gains mainly relate to the gain on the sale of our 50% interest in Kalgoorlie. |
| d. | Other expense adjustments for the three month period ended March 31, 2020 primarily relate to the impact of changes in the discount rate assumptions on our closed mine rehabilitation provision and losses on debt extinguishment. For the three month period ended December 31, 2019, other expense adjustments primarily relate to the gain on thede-recognition of the deferred revenue liability relating to our silver sale agreement with Wheaton Precious Metals Corp. and the gain on a settlement of customs duty and indirect taxes at Lumwana. |
Reconciliation of Income to EBITDA by operating site
($ millions)
| For the three months ended 3/31/20
| |||||||||||||||||||||||||||||||||||||||
Carlin
| Cortez
| Turquoise
| Nevada
| Pueblo
| Loulo-
| Kibali
| Veladero
| Porgera
| North
| |||||||||||||||||||||||||||||||
Income | 153 | 89 | 47 | 316 | 102 | 68 | 48 | 24 | 29 | 49 | ||||||||||||||||||||||||||||||
Depreciation | 49 | 33 | 31 | 146 | 32 | 47 | 41 | 22 | 10 | 21 | ||||||||||||||||||||||||||||||
EBITDA | 202 | 122 | 78 | 462 | 134 | 115 | 89 | 46 | 39 | 70 | ||||||||||||||||||||||||||||||
For the three months ended 12/31/19
| ||||||||||||||||||||||||||||||||||||||||
Carlin
| Cortez
| Turquoise
| Nevada
| Pueblo Viejo
| Loulo-
| Kibali
| Veladero
| Porgera
| North
| |||||||||||||||||||||||||||||||
Income | 133 | 69 | 56 | 277 | 125 | 65 | 30 | 21 | 44 | 52 | ||||||||||||||||||||||||||||||
Depreciation | 58 | 36 | 34 | 163 | 34 | 58 | 52 | 29 | 12 | 35 | ||||||||||||||||||||||||||||||
EBITDA | 191 | 105 | 90 | 440 | 159 | 123 | 82 | 50 | 56 | 87 | ||||||||||||||||||||||||||||||
For the three months ended 3/31/19
| ||||||||||||||||||||||||||||||||||||||||
Carlinb
| Cortezc
| Turquoise
| Nevada
| Pueblo Viejo
| Loulo-
| Kibali
| Veladero
| Porgera
| North
| |||||||||||||||||||||||||||||||
Income | 83 | 155 | 54 | 292 | 98 | 29 | 10 | 10 | 18 | 9 | ||||||||||||||||||||||||||||||
Depreciation | 66 | 64 | 6 | 136 | 28 | 47 | 56 | 30 | 11 | 13 | ||||||||||||||||||||||||||||||
EBITDA | 149 | 219 | 60 | 428 | 126 | 76 | 66 | 40 | 29 | 22 | ||||||||||||||||||||||||||||||
| a. | Formerly part of Acacia Mining plc. On September 17, 2019, Barrick acquired all of the shares of Acacia it did not own. The results are on a 63.9% basis until September 30, 2019 (notwithstanding the completion of the Acacia transaction on September 17, 2019, we consolidated our interest in Acacia and recorded anon-controlling interest of 36.1% in the income statement for the entirety of the third quarter of 2019 as a matter of convenience), on a 100% basis from October 1, 2019 to December 31, 2019, and on an 84% basis from January 1, 2020 onwards, the effective date of the GoT’s free carried interest. |
| b. | Represents the combined results of Cortez, Goldstrike (including our 60% share of South Arturo) and our 75% interest in Turquoise Ridge until June 30, 2019. Commencing July 1, 2019, the date Nevada Gold Mines was established, the results represent our 61.5% interest in Cortez, Carlin (including Goldstrike and 60% of South Arturo), Turquoise Ridge (including Twin Creeks), Phoenix and Long Canyon. |
| c. | On July 1, 2019, Barrick’s Goldstrike and Newmont’s Carlin were contributed to Nevada Gold Mines and are now referred to as Carlin. As a result, the amounts presented represent Goldstrike on a 100% basis (including our 60% share of South Arturo) up until June 30, 2019, and the combined results of Carlin and Goldstrike (including NGM’s 60% share of South Arturo) on a 61.5% basis thereafter. |
| d. | Barrick owned 75% of Turquoise Ridge through the end of the second quarter of 2019, with our joint venture partner, Newmont, owning the remaining 25%. Turquoise Ridge was proportionately consolidated on the basis that the joint venture partners that have joint control have rights to the assets and obligations for the liabilities relating to the arrangement. The figures presented in this table are based on our 75% interest in Turquoise Ridge until June 30, 2019. On July 1, 2019, Barrick’s 75% interest in Turquoise Ridge and Newmont’s Twin Creeks and 25% interest in Turquoise Ridge were contributed to Nevada Gold Mines. Starting July 1, 2019, the results represent our 61.5% share of Turquoise Ridge and Twin Creeks, now referred to as Turquoise Ridge. |
| BARRICK FIRST QUARTER 2020 | 94 | MANAGEMENT’S DISCUSSION AND ANALYSIS |
| e. | Represents the combined results of Cortez, Goldstrike (including our 60% share of South Arturo) and our 75% interest in Turquoise Ridge until June 30, 2019. Commencing July 1, 2019, the date Nevada Gold Mines was established, the results represent our 61.5% interest in Cortez, Carlin (including Goldstrike and 60% of South Arturo), Turquoise Ridge (including Twin Creeks), Phoenix and Long Canyon. |
Realized Price
Realized price is anon-GAAP financial measure which excludes from sales:
| • | Unrealized gains and losses onnon-hedge derivative contracts; |
| • | Unrealizedmark-to-market gains and losses on provisional pricing from copper and gold sales contracts; |
| • | Sales attributable to ore purchase arrangements; |
| • | Treatment and refining charges; and |
| • | Cumulativecatch-up adjustment to revenue relating to our streaming arrangements. |
This measure is intended to enable Management to better understand the price realized in each reporting period for gold and copper sales because unrealizedmark-to-market values ofnon-hedge gold and copper derivatives are subject to change each period due to changes in market factors such as market and forward gold and copper prices, so that prices ultimately realized may differ from those recorded. The exclusion of such unrealizedmark-to-market gains and losses from the presentation of this performance measure enables investors to understand performance based on the realized proceeds of selling gold and copper production.
The gains and losses onnon-hedge derivatives and receivable balances relate to instruments/balances that mature in future periods, at which time the gains and losses
will become realized. The amounts of these gains and losses reflect fair values based on market valuation assumptions at the end of each period and do not necessarily represent the amounts that will become realized on maturity. We also exclude export duties that are paid upon sale and netted against revenues as well as treatment and refining charges that are paid to the refiner on gold and copper concentrate sales that are netted against revenues. We believe this provides investors and analysts with a more accurate measure with which to compare to market gold prices and to assess our gold sales performance. For those reasons, management believes that this measure provides a more accurate reflection of our Company’s past performance and is a better indicator of its expected performance in future periods.
The realized price measure is intended to provide additional information, and does not have any standardized definition under IFRS and should not be considered in isolation or as a substitute for measures of performance prepared in accordance with IFRS. The measure is not necessarily indicative of sales as determined under IFRS. Other companies may calculate this measure differently. The following table reconciles realized prices to the most directly comparable IFRS measure.
Reconciliation of Sales to Realized Price per ounce/pound
| ($ millions, except per ounce/pound information in dollars) | Gold | Copper | ||||||||||||||||||||||
| For the three months ended | ||||||||||||||||||||||||
| 3/31/20 | 12/31/19 | 3/31/19 | 3/31/20 | 12/31/19 | 3/31/19 | |||||||||||||||||||
Sales | 2,593 | 2,758 | 1,906 | 99 | 82 | 163 | ||||||||||||||||||
Sales applicable tonon-controlling interests | (770 | ) | (769 | ) | (224 | ) | 0 | 0 | 0 | |||||||||||||||
Sales applicable to equity method investmentsa,b | 147 | 139 | 129 | 107 | 147 | 121 | ||||||||||||||||||
Realizednon-hedge gold/copper derivative (losses) gains | 0 | 0 | 0 | 0 | 0 | 0 | ||||||||||||||||||
Sales applicable to sites in care and maintenancec | (46 | ) | (56 | ) | (26 | ) | 0 | 0 | 0 | |||||||||||||||
Treatment and refinement charges | 0 | 0 | 0 | 39 | 25 | 31 | ||||||||||||||||||
Otherd | 15 | 22 | 0 | 0 | 0 | 0 | ||||||||||||||||||
Revenues – as adjusted | 1,939 | 2,094 | 1,785 | 245 | 254 | 315 | ||||||||||||||||||
Ounces/pounds sold (000s ounces/millions pounds)c | 1,220 | 1,413 | 1,365 | 110 | 91 | 103 | ||||||||||||||||||
Realized gold/copper price per ounce/pounde | 1,589 | 1,483 | 1,307 | 2.23 | 2.76 | 3.07 | ||||||||||||||||||
| a. | Represents sales of $140 million for the three month periods ended March 31, 2020 (December 31, 2019: $130 million and March 31, 2019: $117 million) applicable to our 45% equity method investment in Kibali and $nil (December 31, 2019: $9 million and March 31, 2019: $12 million) applicable to our 40% equity method investment in Morila for gold. Represents sales of $72 million for the three months ended March 31, 2020 (December 31, 2019: $110 million and March 31, 2019: $81 million) applicable to our 50% equity method investment in Zaldívar and $40 million (December 31, 2019: $43 million and March 31, 2019: $44 million) applicable to our 50% equity method investment in Jabal Sayid for copper. |
| b. | Sales applicable to equity method investments are net of treatment and refinement charges. |
| c. | Figures exclude Pierina; Golden Sunlight and Morila starting in the third quarter of 2019; and Lagunas Norte starting in the fourth quarter of 2019, from the calculation of realized price per ounce as the mine is mining incidental ounces as it enters closure. |
| d. | Represents cumulativecatch-up adjustment to revenue relating to our streaming arrangements. Refer to note 2f of the 2019 Annual Financial Statements for more information. |
| e. | Realized price per ounce/pound may not calculate based on amounts presented in this table due to rounding. |
| BARRICK FIRST QUARTER 2020 | 95 | MANAGEMENT’S DISCUSSION AND ANALYSIS |
TECHNICAL INFORMATION
The scientific and technical information contained in this MD&A has been reviewed and approved by Steven Yopps, MMSA, Director - Metallurgy, North America; Craig Fiddes, Manager of Growth Projects, Nevada Gold Mines; Chad Yuhasz, P.Geo, Mineral Resource Manager, Latin America and Australia Pacific; Simon Bottoms, CGeol, MGeol, FGS, FAusIMM, Mineral Resources Manager: Africa and Middle East; Rodney Quick, MSc, Pr. Sci.Nat, Mineral Resource Management and Evaluation Executive; John Steele, CIM, Metallurgy, Engineering and Capital Projects Executive; and Rob Krcmarov, FAusIMM, Executive Vice President, Exploration and Growth – each a “Qualified Person” as defined in National Instrument43-101 –Standards of Disclosure for Mineral Projects.
All mineral reserve and mineral resource estimates are estimated in accordance with National Instrument43-101 –Standards of Disclosure for Mineral Projects. Unless otherwise noted, such mineral reserve and mineral resource estimates are as of December 31, 2019.
ENDNOTES
| 1 | These arenon-GAAP financial performance measures with no standardized meaning under IFRS and therefore may not be comparable to similar measures presented by other issuers. For further information and a detailed reconciliation of eachnon-GAAP measure to the most directly comparable IFRS measure, please see pages 79 to 95 of this MD&A. |
| 2 | Cost of sales applicable to gold per ounce is calculated using cost of sales applicable to gold on an attributable basis (removing thenon-controlling interest of 40% Pueblo Viejo; 20% Loulo-Gounkoto; 10.3% Tongon; 16% North Mara, Bulyanhulu and Buzwagi starting January 1, 2020, the date the GoT’s 16% free carried interest was made effective (36.1% from January 1, 2019 to September 30, 2019; notwithstanding the completion of the Acacia transaction on September 17, 2019, we consolidated our interest in Acacia and recorded anon-controlling interest of 36.1% in the income statement for the entirety of the third quarter of 2019 as a matter of convenience); 63.1% South Arturo from cost of sales from July 1, 2019 onwards as a result of its contribution to Nevada Gold Mines (and on a 40% basis from January 1, 2019 to June 30, 2019); and our proportionate share of cost of sales attributable to equity method investments (Kibali, and Morila until the second quarter of 2019), divided by attributable gold ounces. Also removes thenon-controlling interest of 38.5% Nevada Gold Mines from cost of sales from July 1, 2019 onwards. Cost of sales applicable to copper per pound is calculated using cost of sales applicable to copper including our proportionate share of cost of sales attributable to equity method investments (Zaldívar and Jabal Sayid), divided by consolidated copper pounds (including our proportionate share of copper pounds from our equity method investments). |
| 3 | Class 1 - High Significance is defined as an incident that causes significant negative impacts on human health or the environment or an incident that extends onto publicly accessible land and has the potential to cause significant adverse impact to surrounding communities, livestock or wildlife. |
| 4 | See the Technical Report on the Turquoise Ridge complex, dated March 25, 2020, and filed on SEDAR at www.sedar.com and EDGAR at www.sec.gov on March 25, 2020. |
| 5 | See the Technical Report on the Pueblo Viejo mine, Sanchez Ramirez Province, Dominican Republic, dated March 19, 2018, and filed on SEDAR at www.sedar.com and EDGAR at www.sec.gov on March 23, 2018. |
| 6 | Fourmile Significant Interceptsa |
| Drill Results from Q1 2020 | ||||||||||
| Drill Holeb | Azimuth | Dip | Interval (m) | Width (m)c | Au (g/t) | |||||
FM19-12DW1 | 351 | (73) | 1421.6 - 1426.2 | 4.6 | 9.0 | |||||
FM19-64D | 119 | (85) | 881.7 - 885.1 | 3.4 | 15.9 | |||||
FM19-66D | 104 | (83) | no intercepts > 5 g/t | |||||||
FM19-67D | 199 | (85) | no intercepts > 5 g/t | |||||||
FM19-68D | 166 | (77) | 1092.1 - 1096.5 | 4.4 | 18.1 | |||||
FM20-150Dd | 97 | (79) | no intercepts > 5 g/t | |||||||
| 732.1 - 735.5 | 3.4 | 9.4 | ||||||||
| 738.2 - 740.3 | 2.1 | 22.3 | ||||||||
| 742.5 - 743.4 | .9 | 14.2 | ||||||||
| 1035.4 - 1041.2 | 5.8 | 27.1 | ||||||||
FM20-151Dd | 97 | (78) | 1054.6 - 1057.6 | 3 | 39.6 | |||||
| 752.9 - 754.4 | 1.5 | 10.0 | ||||||||
FM20-152Dd | 85 | (77) | 758.9 - 760.0 | 1.1 | 6.6 | |||||
| a. | All intercepts calculated using a 5 g/t Au cutoff and are uncapped; minimum intercept width is 0.8 m; internal dilution is less than 20% total width. |
.
| BARRICK FIRST QUARTER 2020 | 96 | MANAGEMENT’S DISCUSSION AND ANALYSIS |
| b. | Fourmile drill hole nomenclature: FM (Fourmile) followed by the year (19 for 2019, 20 for 2020). |
| c. | True width of intercepts are uncertain at this stage. |
| d. | Partial results received. |
The drilling results for the Fourmile property contained in this MD&A have been prepared in accordance with National Instrument43-101 – Standards of Disclosure for Mineral Projects. All drill hole assay information has been manually reviewed and approved by staff geologists andre-checked by the project manager. Sample preparation and analyses are conducted by ALS Minerals. Procedures are employed to ensure security of samples during their delivery from the drill rig to the laboratory. The quality assurance procedures, data verification and assay protocols used in connection with drilling and sampling on the Fourmile property conform to industry accepted quality control methods.
| 7 | Pueblo Viejo Significant Interceptsa |
| Drill Results from Q1 2020 | ||||||||||
| Drill Hole | Azimuth | Dip | Interval (m) | Width (m)b | Au (g/t) | |||||
| 205 - 240 | 35.00 | 2.62 | ||||||||
DPV19-747 | 270 | (70) | 207 - 218.5 | 11.50 | 5.32 | |||||
| a. | All significant intercepts calculated using a 0.5 gpt Au cutoff and are uncapped; a minimum intercept length of 10m is reported, with internal dilution of no more than 10 consecutive meters belowcut-off included in the calculation. |
| b. | True widths uncertain at this stage. |
The drilling results for the Pueblo Viejo Joint Venture property contained in this MD&A have been prepared in accordance with National Instrument43-101 –Standards of Disclosure for Mineral Projects. All drill hole assay information has been manually reviewed and approved by staff geologists andre-checked by the project manager. Sample preparation and analyses are conducted by the onsite laboratory, and 5% of samples are sent to ALS Peru, an independent laboratory, for quality assurance. Procedures are employed to ensure security of samples during their delivery from the drill rig to the respective laboratory. The quality assurance procedures, data verification and assay protocols used in connection with drilling and sampling on the Pueblo Viejo Joint Venture property conform to industry accepted quality control methods.
| 8 | Alturas-Del Carmen Significant Interceptsa |
| Drill Results from Q1 2020 | ||||||||||
| Drill Hole | Azimuth | Dip | Interval (m) | Width (m)b | Au (g/t) | |||||
| 157 - 228 | 71.00 | 1.56 | ||||||||
| 159 - 167 | 8.00 | 5.63 | ||||||||
DDH-DCA-33 | 90 | (70) | 242 - 254 | 12.00 | 0.45 | |||||
| a. | All significant intercepts calculated using a 0.25 gpt Au cutoff and are uncapped; a minimum intercept length of 10m is reported, with internal dilution of no more than 10 consecutive meters belowcut-off included in the calculation. |
| b. | True widths uncertain at this stage. |
The drilling results for theAlturas-Del Carmen property contained in this MD&A have been prepared in accordance with National Instrument43-101 –Standards of Disclosure for Mineral Projects. All drill hole assay information has been manually reviewed and approved by staff geologists andre-checked by the project manager. Sample preparation and analyses are conducted by ALS Peru, an independent laboratory. Procedures are employed to ensure security of samples during their delivery from the drill rig to the laboratory. The quality assurance procedures, data verification and assay protocols used in connection with drilling and sampling on theAlturas-Del Carmen property conform to industry accepted quality control methods.
| BARRICK FIRST QUARTER 2020 | 97 | MANAGEMENT’S DISCUSSION AND ANALYSIS |
| 9 | Bambadji Significant Interceptsa |
| Drill Results from Q1 2020 | ||||||||||||||
| Drill Holeb | Azimuth | Dip | Interval (m) | Width (m)c | Au (g/t) | |||||||||
GFRC024 | 90 | (50) | 8.0 - 26.0 | 18.00 | 1.20 | |||||||||
GFRC036 | 90 | (50) | 17.0 - 26.0 | 9.00 | 2.19 | |||||||||
GFRC095 | 90 | (50) | 7.0 - 22.0 | 15.00 | 0.70 | |||||||||
GFRC103 | 90 | (50) | 4.0 - 31.0 | 27.00 | 0.55 | |||||||||
GFRC106 | 90 | (50) | 75.0 - 83.0 | 8.00 | 0.70 | |||||||||
GFRC107 | 90 | (50) | 48.0 - 66.0 | 18.00 | 1.05 | |||||||||
| 7.0 - 15.0 | 8.00 | 1.01 | ||||||||||||
GFRC108 | 90 | (50) | 96.0 - 118.0 | 22.00 | 1.03 | |||||||||
GFRC112 | 90 | (50) | 50.0 - 72.0 | 22.00 | 1.42 | |||||||||
GFRC046 | 90 | (50) | 16.0 - 23.0 | 7.00 | 0.79 | |||||||||
| a. | All intercepts calculated using a 0.5 g/t Au cutoff and are uncapped; minimum intercept width is 2m; internal dilution is equal to or less than 2m total width. |
| b. | Gefa drill hole nomenclature: prospect initial GF (Gefa) followed by type of drilling RC (Reverse Circulation) and DH (Diamond Drilling). |
| c. | True widths uncertain at this stage. |
The drilling results for the Bambadji property contained in this MD&A have been prepared in accordance with National Instrument43-101 –Standards of Disclosure for Mineral Projects. All drill hole assay information has been manually reviewed and approved by staff geologists andre-checked by the project manager. Sample preparation and analyses are conducted by SGS Bamako, an independent laboratory. Procedures are employed to ensure security of samples during their delivery from the drill rig to the laboratory. The quality assurance procedures, data verification and assay protocols used in connection with drilling and sampling on the Bambadji property conform to industry accepted quality control methods.
| 10 | Loulo-Goukoto Significant Interceptsa |
| Drill Results from 2019 and Q1 2020 | ||||||||||||||
| Drill Holeb | Azimuth | Dip | Interval (m) | Width (m)c | Au (g/t) | |||||||||
YaDH100 | (66.8) | 103.6 | 763.0 - 769.0 | 6.00 | 12.22 | |||||||||
| 754.5 - 762.0 | 7.50 | 3.67 | ||||||||||||
YaDH101 | (66.8) | 103.6 | 804.0 - 815.2 | 11.20 | 11.73 | |||||||||
| 762.6 - 787.6 | 25.00 | 3.93 | ||||||||||||
YADH121 | (66.37) | 103.27 | 788.4 - 793.0 | 4.60 | 3.80 | |||||||||
| 746.0 - 757.2 | 11.20 | 5.04 | ||||||||||||
YADH122 | (58.64) | 266.4 | 759.9 - 768.4 | 8.50 | 10.83 | |||||||||
YADH123 | (56.09) | 254.3 | 771.0 - 788.5 | 17.50 | 5.71 | |||||||||
| 828.5 - 837.0 | 8.50 | 3.09 | ||||||||||||
YADH125 | (65.26) | 109.5 | 846.9 - 854.0 | 7.10 | 3.52 | |||||||||
YADH127 | (69.21) | 107.01 | 805.0 - 816.1 | 11.10 | 17.05 | |||||||||
YADH128 | (55.73) | 79.46 | 694.0 - 702.0 | 8.00 | 3.06 | |||||||||
YADH129 | (59.43) | 80.16 | 632.0 - 636.0 | 4.00 | 3.29 | |||||||||
| 719.0 - 730.0 | 11.00 | 3.08 | ||||||||||||
YADH131 | (68.63) | 258.8 | 741.6 - 761.6 | 20.00 | 6.33 | |||||||||
YADH135 | (64.35) | 77.66 | 742.5 - 762.9 | 20.40 | 5.59 | |||||||||
| 722.1 - 736.15 | 14.05 | 4.21 | ||||||||||||
YADH137 | (60.89) | 78.28 | 737.25 - 751.0 | 13.75 | 8.70 | |||||||||
YADH138 | (62.18) | 78.7 | 794.1 - 826.32 | 32.22 | 6.34 | |||||||||
| 696.0 - 698.0 | 2.00 | 3.34 | ||||||||||||
YADH139 | (61.77) | 79 | 707.6 - 732.6 | 25.00 | 11.06 | |||||||||
YADH140 | (64.78) | 78.51 | 761.0 - 780.9 | 19.90 | 6.56 | |||||||||
YADH141 | (67.64) | 76.58 | 817.6 - 836.0 | 18.40 | 6.65 | |||||||||
YADH143 | (68.08) | 73.24 | 940.25 - 962.0 | 21.75 | 8.53 | |||||||||
| BARRICK FIRST QUARTER 2020 | 98 | MANAGEMENT’S DISCUSSION AND ANALYSIS |
| 746.15 - 749.0 | 2.85 | 0.65 | ||||||||||||
| 768.0 - 772.0 | 4.00 | 2.24 | ||||||||||||
| 794.0 - 797.0 | 3.00 | 1.13 | ||||||||||||
| 817.4 - 819.65 | 2.25 | 2.86 | ||||||||||||
YADH145 | 76 | (68.8) | 856.85 - 862.7 | 5.85 | 2.76 | |||||||||
GKUGDH017 | 242.4 | (55) | 524.85 - 534.67 | 9.82 | 21.82 | |||||||||
| 494.66 - 506.8 | 12.14 | 40.43 | ||||||||||||
GKUGDH018 | 250.7 | (48.02) | 535.5 - 539.3 | 3.80 | 2.99 | |||||||||
GKUGDH019 | 245.6 | (45) | 484.1 - 501.65 | 17.55 | 31.36 | |||||||||
GKUGDH022 | 254 | (55) | 520.3 - 529.43 | 9.13 | 5.12 | |||||||||
| 103.0 - 120.0 | 17.00 | 1.47 | ||||||||||||
| 124.0 - 145.0 | 21.00 | 2.64 | ||||||||||||
| 148.0 - 157.0 | 9.00 | 3.56 | ||||||||||||
| 158.0 - 160.0 | 2.00 | 4.14 | ||||||||||||
GKAGCRC1507 | 269 | (86) | 169.0 - 171.0 | 2.00 | 6.24 | |||||||||
| 17.0 - 21.0 | 4.00 | 2.25 | ||||||||||||
| 63.0 - 79.0 | 16.00 | 3.95 | ||||||||||||
| 82.0 - 85.0 | 3.00 | 0.73 | ||||||||||||
| 91.0 - 94.0 | 3.00 | 0.52 | ||||||||||||
| 120.0 - 133.0 | 13.00 | 1.42 | ||||||||||||
| 135.0 - 137.0 | 2.00 | 0.76 | ||||||||||||
GKAGCRC1508 | 89 | (80) | 144.0 - 169.0 | 25.00 | 1.50 | |||||||||
| 109.0 - 111.0 | 2.00 | 0.96 | ||||||||||||
| 118.0 - 151.0 | 33.00 | 2.25 | ||||||||||||
GKAGCRC1509 | 22 | (75) | 154.0 - 161.0 | 7.00 | 1.69 | |||||||||
| 44.0 - 48.0 | 4.00 | 1.04 | ||||||||||||
| 52.0 - 56.0 | 4.00 | 0.60 | ||||||||||||
| 75.0 - 79.0 | 4.00 | 1.05 | ||||||||||||
| 85.0 - 99.0 | 14.00 | 1.68 | ||||||||||||
| 101.0 - 130.0 | 29.00 | 9.33 | ||||||||||||
| 176.0 - 188.0 | 12.00 | 1.18 | ||||||||||||
GKAGCRC1510 | 0 | (54.13) | 190.0 - 209.0 | 19.00 | 1.02 | |||||||||
DB1RC002 | 226 | (52) | 12.0 - 18.0 | 6.00 | 4.12 | |||||||||
| 113.0 - 117.0 | 4.00 | 1.35 | ||||||||||||
DB1RC003 | 226 | (52) | 128.0 - 136.0 | 8.00 | 3.35 | |||||||||
| 192.0 - 196.0 | 4.00 | 2.68 | ||||||||||||
| 210.0 - 213.0 | 3.00 | 0.60 | ||||||||||||
| 216.0 - 218.0 | 2.00 | 1.28 | ||||||||||||
DB1RC004 | 227 | (51) | 222.0 - 234.0 | 12.00 | 0.96 | |||||||||
| 359.5 - 366.1 | 6.60 | 1.75 | ||||||||||||
| 391.35 - 394.5 | 3.15 | 1.34 | ||||||||||||
| 396.95 - 400.3 | 3.35 | 2.67 | ||||||||||||
| 403.8 - 406.55 | 2.75 | 7.42 | ||||||||||||
| 412.0 - 416.8 | 4.80 | 0.53 | ||||||||||||
GKDH519 | 259.31 | (61.78) | 532.1 - 549.65 | 17.55 | 8.75 | |||||||||
L3L2DH002 | 239.53 | (57.28) | 222.35 - 224.35 | 2.00 | 0.74 | |||||||||
L3L2DH004 | 237.4 | (62.82) | 181.2 - 187.5 | 6.30 | 2.46 | |||||||||
| 144.8 - 147.9 | 3.10 | 27.39 | ||||||||||||
L3L2DH005 | 241.16 | (63.7) | 183.18 - 186.45 | 3.27 | 1.50 | |||||||||
| 133.35 - 140.35 | 7.00 | 0.93 | ||||||||||||
| 141.15 - 146.0 | 4.85 | 1.13 | ||||||||||||
| 148.1 - 151.85 | 3.75 | 0.52 | ||||||||||||
L3L2DH006 | 240.39 | (54.46) | 152.75 - 155.95 | 3.20 | 2.00 |
| BARRICK FIRST QUARTER 2020 | 99 | MANAGEMENT’S DISCUSSION AND ANALYSIS |
| 110.1 - 113.0 | 2.90 | 0.53 | ||||||||||||
L3L2DH007 | 239.78 | (55.59) | 117.6 - 121.2 | 3.60 | 41.31 | |||||||||
| 31.0 - 33.0 | 2.00 | 0.70 | ||||||||||||
| 93.4 - 96.4 | 3.00 | 2.96 | ||||||||||||
L3L2DH008 | 238.96 | (54.81) | 114.9 - 121.0 | 6.10 | 1.07 | |||||||||
L3L2DH010 | 237.18 | (54.53) | 156.1 - 158.1 | 2.00 | 4.26 | |||||||||
| 55.75 - 60.8 | 5.05 | 1.59 | ||||||||||||
L3L2DH011 | 241.8 | (56.33) | 63.05 - 66.15 | 3.10 | 0.77 | |||||||||
L3L2DH012 | 239.74 | (54.41) | 40.8 - 43.2 | 2.40 | 0.79 | |||||||||
L3L2RC019 | 234.9 | (56.38) | 100.0 - 102.0 | 2.00 | 2.75 | |||||||||
YADH43 | 78.42 | (73.75) | 836.7 - 844.0 | 7.30 | 7.24 | |||||||||
| 836.0 - 842.0 | 6.00 | 1.91 | ||||||||||||
| 845.0 - 850.5 | 5.50 | 2.20 | ||||||||||||
YADH44 | 78.39 | (71.93) | 851.3 - 861.5 | 10.20 | 5.28 | |||||||||
| 1062.75 - 1066.1 | 3.35 | 24.03 | ||||||||||||
YDH293 | 53.38 | (72.08) | 1075.8 - 1091.0 | 15.20 | 4.34 | |||||||||
YDH295 | 58.31 | (67.62) | 975.2 - 981.6 | 6.40 | 4.96 |
| a. | All intercepts calculated using a 0.5 g/t Au cutoff and are uncapped; minimum intercept width is 2m; internal dilution is equal to or less than 2m total width. |
| b. | Loulo – Gounkoto drill hole nomenclature: prospect initial Y/YA (Yalea), L2 & L2MARS (Loulo 2), L3L2 (Loulo 3 - Loulo 2), L3 (Loulo 3), GK (Gounkoto), GKUG (Gounkoto Underground) GKAGC (Gounkoto Advanced Grade Control), DB1 (Domain Boundary 1) followed by type of drilling RC (Reverse Circulation) and DH (Diamond Drilling). |
| c. | True widths uncertain at this stage. |
The drilling results for the Loulo-Gounkoto property contained in this MD&A have been prepared in accordance with National Instrument43-101 –Standards of Disclosure for Mineral Projects. All drill hole assay information has been manually reviewed and approved by staff geologists andre-checked by the project manager. Sample preparation and analyses are conducted by SGS Bamako, an independent laboratory. Industry accepted best practices for preparation and fire assaying procedures are utilized to determine gold content. Procedures are employed to ensure security of samples during their delivery from the drill rig to the laboratory. The quality assurance procedures, data verification and assay protocols used in connection with drilling and sampling on the Loulo property conform to industry accepted quality control methods.
| 11 | Jabal Sayid Significant Interceptsa |
| Drill Results from Q1 2020 | ||||||||||||
| Drill Holeb | Azimuth | Dip | Interval (m) | Width (m)c | Cu (%) | |||||||
JSSE001 | 22 | (51) | 404.0 - 422.8 | 18.80 | 3.88 | |||||||
| a. | All intercepts calculated using a 1.5% Cu cutoff and are uncapped; minimum intercept width is 2m; internal dilution is equal to or less than 2m total width. |
| b. | Jabal Sayid drill hole nomenclature: project initial JS (Jabal Sayid), prospect initial SE (SE) followed by hole number. |
| c. | True widths uncertain at this stage. |
The drilling results for the Jabal Sayid property contained in this MD&A have been prepared in accordance with National Instrument43-101 –Standards of Disclosure for Mineral Projects. All drill hole assay information has been manually reviewed and approved by staff geologists andre-checked by the project manager. Sample preparation and analyses are conducted by ALS Jeddah, an independent laboratory. Procedures are employed to ensure security of samples during their delivery from the drill rig to the laboratory. The quality assurance procedures, data verification and assay protocols used in connection with drilling and sampling on the Jabal Sayid property conform to industry accepted quality control methods.
| BARRICK FIRST QUARTER 2020 | 100 | MANAGEMENT’S DISCUSSION AND ANALYSIS |
Consolidated Statements of Income
Barrick Gold Corporation (in millions of United States dollars, except per share data) (Unaudited) | Three months ended March 31, | |||||||
| 2020 | 2019 | |||||||
Revenue (notes 5 and 6)
|
| $2,721
|
|
| $2,093
|
| ||
Costs and expenses (income) | ||||||||
Cost of sales (notes 5 and 7) | 1,776 | 1,490 | ||||||
General and administrative expenses | 40 | 54 | ||||||
Exploration, evaluation and project expenses | 71 | 74 | ||||||
Impairment (reversals) charges (notes 9B and 13) | (336 | ) | 3 | |||||
Loss on currency translation | 16 | 22 | ||||||
Closed mine rehabilitation | 90 | 25 | ||||||
Income from equity investees (note 12) | (54 | ) | (28 | ) | ||||
Other (income) expense (note 9A)
|
| (35
| )
|
| 26
|
| ||
Income before finance costs and income taxes | $1,153 | $427 | ||||||
Finance costs, net
|
| (104
| )
|
| (120
| )
| ||
Income before income taxes | $1,049 | $307 | ||||||
Income tax expense (note 10)
|
| (386
| )
|
| (167
| )
| ||
Net income
|
| $663
|
|
| $140
|
| ||
Attributable to: | ||||||||
Equity holders of Barrick Gold Corporation | $400 | $111 | ||||||
Non-controlling interests
|
| $263
|
|
| $29
|
| ||
Earnings per share data attributable to the equity holders of Barrick Gold Corporation (note 8) | ||||||||
Net income | ||||||||
Basic | $0.22 | $0.06 | ||||||
Diluted
|
| $0.22
|
|
| $0.06
|
| ||
The accompanying notes are an integral part of these condensed interim consolidated financial statements.
| BARRICK FIRST QUARTER 2020 | 101 | FINANCIAL STATEMENTS (UNAUDITED) |
Consolidated Statements of Comprehensive Income
Barrick Gold Corporation (in millions of United States dollars) (Unaudited) | Three months ended March 31, | |||||||
| 2020 | 2019 | |||||||
Net income | $663 | $140 | ||||||
Other comprehensive (loss) income, net of taxes | ||||||||
Items that may be reclassified subsequently to profit or loss: | ||||||||
Unrealized gains (losses) on derivatives designated as cash flow hedges, net of tax $nil and $nil | 1 | — | ||||||
Currency translation adjustments, net of tax $nil and $nil | (4 | ) | (2 | ) | ||||
Items that will not be reclassified to profit or loss: | ||||||||
Actuarial gain (loss) on post employment benefit obligations, net of tax $3 and $nil | 3 | — | ||||||
Net change on equity investments, net of tax $nil and $nil
|
| (25
| )
|
| (4
| )
| ||
Total other comprehensive loss
|
| (25
| )
|
| (6
| )
| ||
Total comprehensive income
|
| $638
|
|
| $134
|
| ||
Attributable to: | ||||||||
Equity holders of Barrick Gold Corporation | $375 | $105 | ||||||
Non-controlling interests
|
| $263
|
|
| $29
|
| ||
The accompanying notes are an integral part of these condensed interim consolidated financial statements.
| BARRICK FIRST QUARTER 2020 | 102 | FINANCIAL STATEMENTS (UNAUDITED) |
Consolidated Statements of Cash Flow
Barrick Gold Corporation (in millions of United States dollars) (Unaudited) | Three months ended March 31, | |||||||
| 2020 | 2019 | |||||||
OPERATING ACTIVITIES | ||||||||
Net income | $663 | $140 | ||||||
Adjustments for the following items: | ||||||||
Depreciation | 524 | 435 | ||||||
Finance costs, net | 111 | 127 | ||||||
Impairment (reversals) charges (notes 9B and 13) | (336 | ) | 3 | |||||
Income tax expense (note 10) | 386 | 167 | ||||||
Gain on sale ofnon-current assets | (60 | ) | — | |||||
Loss on currency translation | 16 | 22 | ||||||
Change in working capital (note 11) | (332 | ) | (248 | ) | ||||
Other operating activities (note 11)
|
| 53
|
|
| (24
| )
| ||
Operating cash flows before interest and income taxes | 1,025 | 622 | ||||||
Interest paid | (24 | ) | (28 | ) | ||||
Income taxes paid
|
| (112
| )
|
| (74
| )
| ||
Net cash provided by operating activities
|
| 889
|
|
| 520
|
| ||
INVESTING ACTIVITIES | ||||||||
Property, plant and equipment | ||||||||
Capital expenditures (note 5) | (451 | ) | (374 | ) | ||||
Sales proceeds | 7 | 3 | ||||||
Investment purchases | — | (3 | ) | |||||
Divestitures (note 4) | 256 | — | ||||||
Cash acquired in merger | — | 751 | ||||||
Other investing activities (note 11)
|
| 25
|
|
| 45
|
| ||
Net cash provided by (used in) investing activities
|
| (163
| )
|
| 422
|
| ||
FINANCING ACTIVITIES | ||||||||
Lease repayments | (5 | ) | (12 | ) | ||||
Debt repayments | (351 | ) | (16 | ) | ||||
Dividends | (122 | ) | (333 | ) | ||||
Funding fromnon-controlling interests | 1 | 6 | ||||||
Disbursements tonon-controlling interests | (217 | ) | (5 | ) | ||||
Other financing activities
|
| (15
| )
|
| —
|
| ||
Net cash used in financing activities
|
| (709
| )
|
| (360
| )
| ||
Effect of exchange rate changes on cash and equivalents
|
| (4
| )
|
| —
|
| ||
Net increase in cash and equivalents | 13 | 582 | ||||||
Cash and equivalents at the beginning of period
|
| 3,314
|
|
| 1,571
|
| ||
Cash and equivalents at the end of period
|
| $3,327
|
|
| $2,153
|
| ||
The accompanying notes are an integral part of these condensed interim consolidated financial statements.
| BARRICK FIRST QUARTER 2020 | 103 | FINANCIAL STATEMENTS (UNAUDITED) |
Consolidated Balance Sheets
Barrick Gold Corporation (in millions of United States dollars) (Unaudited) | As at March 31, | As at December 31, | ||||||
| 2020 | 2019 | |||||||
ASSETS | ||||||||
Current assets | ||||||||
Cash and equivalents (note 14A) | $3,327 | $3,314 | ||||||
Accounts receivable | 371 | 363 | ||||||
Inventories | 2,159 | 2,289 | ||||||
Other current assets
|
| 594
|
|
| 565
|
| ||
Total current assets (excluding assets classified as held for sale) | $6,451 | $6,531 | ||||||
Assets classified as held for sale (note 4A)
|
| —
|
|
| 356
|
| ||
Total current assets | $6,451 | $6,887 | ||||||
Non-current assets | ||||||||
Equity in investees (note 12) | 4,556 | 4,527 | ||||||
Property, plant and equipment | 24,809 | 24,141 | ||||||
Goodwill | 4,769 | 4,769 | ||||||
Intangible assets | 230 | 226 | ||||||
Deferred income tax assets | 149 | 235 | ||||||
Non-current portion of inventory | 2,523 | 2,300 | ||||||
Other assets
|
| 1,452
|
|
| 1,307
|
| ||
Total assets
|
| $44,939
|
|
| $44,392
|
| ||
LIABILITIES AND EQUITY | ||||||||
Current liabilities | ||||||||
Accounts payable | $1,140 | $1,155 | ||||||
Debt (note 14B) | 29 | 375 | ||||||
Current income tax liabilities | 249 | �� | 224 | |||||
Other current liabilities
|
| 552
|
|
| 622
|
| ||
Total current liabilities | $1,970 | $2,376 | ||||||
Non-current liabilities | ||||||||
Debt (note 14B) | 5,150 | 5,161 | ||||||
Provisions | 3,267 | 3,114 | ||||||
Deferred income tax liabilities | 3,079 | 3,091 | ||||||
Other liabilities
|
| 1,118
|
|
| 823
|
| ||
Total liabilities
|
| $14,584
|
|
| $14,565
|
| ||
Equity | ||||||||
Capital stock (note 16) | $29,233 | $29,231 | ||||||
Deficit | (9,446 | ) | (9,722 | ) | ||||
Accumulated other comprehensive loss | (147 | ) | (122 | ) | ||||
Other
|
| 2,047
|
|
| 2,045
|
| ||
Total equity attributable to Barrick Gold Corporation shareholders
|
| $21,687
|
|
| $21,432
|
| ||
Non-controlling interests
|
| 8,668
|
|
| 8,395
|
| ||
Total equity
|
| $30,355
|
|
| $29,827
|
| ||
Contingencies and commitments (notes 5 and 17)
| ||||||||
Total liabilities and equity
|
| $44,939
|
|
| $44,392
|
| ||
The accompanying notes are an integral part of these condensed interim consolidated financial statements.
| BARRICK FIRST QUARTER 2020 | 104 | FINANCIAL STATEMENTS (UNAUDITED) |
Consolidated Statements of Changes in Equity
| Barrick Gold Corporation | Attributable to equity holders of the company | |||||||||||||||||||||||||||||||
| (in millions of United States dollars) (Unaudited) | Common Shares (in thousands) | Capital stock | Retained earnings (deficit) | Accumulated other comprehensive income (loss)1 | Other2 | Total equity attributable to shareholders | Non- controlling interests | Total equity | ||||||||||||||||||||||||
At January 1, 2020
|
| 1,777,927
|
|
| $29,231
|
|
| ($9,722
| )
|
| ($122
| )
|
| $2,045
|
|
| $21,432
|
|
| $8,395
|
|
| $29,827
|
| ||||||||
Net income | — | — | 400 | — | — | 400 | 263 | 663 | ||||||||||||||||||||||||
Total other comprehensive income (loss)
|
| —
|
|
| —
|
|
| —
|
|
| (25
| )
|
| —
|
|
| (25
| )
|
| —
|
|
| (25
| )
| ||||||||
Total comprehensive income (loss)
|
| —
|
|
| —
|
|
| 400
|
|
| (25
| )
|
| —
|
|
| 375
|
|
| 263
|
|
| 638
|
| ||||||||
Transactions with owners | ||||||||||||||||||||||||||||||||
Dividends | — | — | (122 | ) | — | — | (122 | ) | — | (122 | ) | |||||||||||||||||||||
Issuance of 16% interest in Tanzania mines (note 13) | — | — | — | — | — | — | 234 | 234 | ||||||||||||||||||||||||
Issued on exercise of stock options | 30 | — | — | — | — | — | — | — | ||||||||||||||||||||||||
Funding fromnon-controlling interests | — | — | — | — | — | — | 1 | 1 | ||||||||||||||||||||||||
Disbursements to non-controlling interests | — | — | — | — | — | — | (225 | ) | (225 | ) | ||||||||||||||||||||||
Dividend reinvestment plan (note 16) | 78 | 2 | (2 | ) | — | — | — | — | — | |||||||||||||||||||||||
Share-based payments
|
| —
|
|
| —
|
|
| —
|
|
| —
|
|
| 2
|
|
| 2
|
|
| —
|
|
| 2
|
| ||||||||
Total transactions with owners
|
| 108
|
|
| 2
|
|
| (124
| )
|
| —
|
|
| 2
|
|
| (120
| )
|
| 10
|
|
| (110
| )
| ||||||||
At March 31, 2020
|
| 1,778,035
|
|
| $29,233
|
|
| ($9,446
| )
|
| ($147
| )
|
| $2,047
|
|
| $21,687
|
|
| $8,668
|
|
| $30,355
|
| ||||||||
| ||||||||||||||||||||||||||||||||
At January 1, 2019
|
| 1,167,847
|
|
| $20,883
|
|
| ($13,453
| )
|
| ($158
| )
|
| $321
|
|
| $7,593
|
|
| $1,792
|
|
| $9,385
|
| ||||||||
Net income | — | — | 111 | — | — | 111 | 29 | 140 | ||||||||||||||||||||||||
Total other comprehensive income (loss)
|
| —
|
|
| —
|
|
| —
|
|
| (6
| )
|
| —
|
|
| (6
| )
|
| —
|
|
| (6
| )
| ||||||||
Total comprehensive income (loss)
|
| —
|
|
| —
|
|
| 111
|
|
| (6
| )
|
| —
|
|
| 105
|
|
| 29
|
|
| 134
|
| ||||||||
Transactions with owners | ||||||||||||||||||||||||||||||||
Dividends | — | — | (3 | ) | — | — | (3 | ) | — | (3 | ) | |||||||||||||||||||||
Merger with Randgold Resources Limited | 583,669 | 7,903 | — | — | — | 7,903 | 882 | 8,785 | ||||||||||||||||||||||||
Funding fromnon-controlling interests | — | — | — | — | — | — | 6 | 6 | ||||||||||||||||||||||||
Disbursements to non-controlling interests | — | — | — | — | — | — | (5 | ) | (5 | ) | ||||||||||||||||||||||
Dividend reinvestment plan
|
| 466
|
|
| 6
|
|
| (6
| )
|
| —
|
|
| —
|
|
| —
|
|
| —
|
|
| —
|
| ||||||||
Total transactions with owners
|
| 584,135
|
|
| 7,909
|
|
| (9
| )
|
| —
|
|
| —
|
|
| 7,900
|
|
| 883
|
|
| 8,783
|
| ||||||||
At March 31, 2019
|
| 1,751,982
|
|
| $28,792
|
|
| ($13,351
| )
|
| ($164
| )
|
| $321
|
|
| $15,598
|
|
| $2,704
|
|
| $18,302
|
| ||||||||
1 Includes cumulative translation losses at March 31, 2020: $92 million (March 31, 2019: $84 million).
2 Includes additionalpaid-in capital as at March 31, 2020: $2,009 million (December 31, 2019: $2,007 million; March 31, 2019: $283 million).
The accompanying notes are an integral part of these condensed interim consolidated financial statements.
| BARRICK FIRST QUARTER 2020 | 105 | FINANCIAL STATEMENTS (UNAUDITED) |
NOTES TO CONSOLIDATED FINANCIAL STATEMENTS
Barrick Gold Corporation.Tabular dollar amounts in millions of United States dollars, unless otherwise shown.
1 > CORPORATE INFORMATION
Barrick Gold Corporation (“Barrick”, “we” or the “Company”) is a corporation governed by theBusiness Corporations Act (British Columbia). The Company’s head office is located at Brookfield Place, TD Canada Trust Tower, 161 Bay Street, Suite 3700, Toronto, Ontario, M5J 2S1. The Company’s registered office is 925 West Georgia Street, Suite 1600, Vancouver, British Columbia, V6C 3L2. We are principally engaged in the production and sale of gold and copper, as well as related activities such as exploration and mine development. We sell our gold and copper into the world market.
We have ownership interests in producing gold mines that are located in Argentina, Canada, Côte d’Ivoire, the Democratic Republic of Congo, the Dominican Republic, Mali, Papua New Guinea, Tanzania and the United States. We have ownership interests in producing copper mines in Chile, Saudi Arabia and Zambia. We also have various projects located throughout the Americas.
2 > SIGNIFICANT ACCOUNTING POLICIES
A) Statement of Compliance
These condensed interim consolidated financial statements have been prepared in accordance with International Accounting Standard 34 Interim Financial Reporting (“IAS 34”) as issued by the International Accounting Standards Board (“IASB”). These interim financial statements should be read in conjunction with Barrick’s most recently issued Annual Report which includes information necessary or useful to understanding the Company’s business and financial statement presentation. In particular, the Company’s significant accounting policies were presented in Note 2 of the Annual Consolidated Financial Statements for the year ended December 31, 2019 (“2019 Annual Financial Statements”), and have been consistently applied in the preparation of these interim financial statements, except as otherwise noted in Note 2B. These condensed interim consolidated financial statements were authorized for issuance by the Board of Directors on May 5, 2020.
B) New Accounting Standards Issued But Not Yet Effective
Certain new accounting standards and interpretations have been published that are not mandatory for the current period and have not been early adopted. These standards are not expected to have a material impact on Barrick in the current or future reporting periods.
3 > SIGNIFICANT JUDGMENTS, ESTIMATES,
ASSUMPTIONS AND RISKS
The judgments, estimates, assumptions and risks discussed here reflect updates from the 2019 Annual Financial Statements. For judgments, estimates, assumptions and risks related to other areas not discussed in these interim consolidated financial statements, please refer to Notes 3 and 28 of the 2019 Annual Financial Statements.
A) Provision for Environmental Rehabilitation (“PER”)
Provisions are updated each reporting period for changes to expected cash flows and for the effect of changes in the discount rate and foreign exchange rates. The change in estimate is added or deducted from the related asset and depreciated over the expected economic life of the operation to which it relates. We recorded a net increase of $136 million (2019: $202 million net increase) for the three months ended March 31, 2020 primarily due to a decrease in the discount rate.
Adjustments to the estimated amount and timing of future closure and rehabilitation cash flows are a normal occurrence in light of the significant judgments and estimates involved. Rehabilitation provisions are adjusted as a result of changes in estimates and assumptions and are accounted for prospectively. In the fourth quarter of each year, our life of mine plans are updated and that typically results in an update to the rehabilitation provision.
B) Pascua-Lama
The Pascua-Lama project received $378 million as at March 31, 2020 (December 31, 2019: $424 million) in value added tax (“VAT”) refunds in Chile relating to the development of the Chilean side of the project. Under the current arrangement this amount must be repaid if the project does not evidence exports for an amount of $3,538 million within a term that expires on December 31, 2026, unless extended. Interest on this amount would accrue from the date ofnon-compliance.
In addition, we have recorded $68 million in VAT recoverable in Argentina as at March 31, 2020 (December 31, 2019: $72 million) relating to the development of the Argentinean side of the project. These amounts may not be fully recoverable if the project does not enter into production and are subject to foreign currency risk as the amounts are recoverable in Argentine pesos.
C) Contingencies
Contingencies can be either possible assets or possible liabilities arising from past events which, by their nature, will be resolved only when one or more future events, not wholly within our control, occur or fail to occur. The assessment of such contingencies inherently involves the exercise of significant judgment and estimates of the outcome of future events. Refer to note 17 for further details on contingencies.
D) Covid-19
On March 11, 2020, theCovid-19 outbreak was declared a pandemic by the World Health Organization. The outbreak and efforts to contain it have had a significant effect on commodity prices and capital markets. Although we have adjusted some of our operating procedures, to date our operations have not been significantly impacted byCovid-19.
| BARRICK FIRST QUARTER 2020 | 106 | NOTES TO FINANCIAL STATEMENTS (UNAUDITED) |
Notwithstanding the proactive and considered actions taken to maintain a safe workplace, it is possible that in the future there will be negative impacts on our operations or supply chain and the pandemic may trigger actions such as reduced mining and production activities at our operations. This could have a material adverse effect on our cash flows, earnings, results of operations and financial position.
Our sites have continued to produce and sell their production, with no significant disruptions to date. Combined with increased market gold prices, this has resulted in Barrick being able to deliver strong operating cash flow in the first quarter of 2020. Barrick has $3.3 billion in cash, an undrawn $3 billion credit facility and no significant debt repayments due until 2033, providing us with sufficient liquidity to manage through this period of uncertainty.
In addition, the Chinese market is a significant source of global demand for commodities, including copper. A sustained slowdown in China’s growth or demand, or a significant slowdown in other markets, could have an adverse effect on the price and/or demand for copper produced at Barrick’s mines. This could lead tonon-current asset impairments of our copper operations and joint venture investments. Lower copper prices could also result in net realizable value inventory impairments.
While we have not experienced any significant negative impact to date, the extent to whichCovid-19 impacts future business activity or financial results, and the duration of any such negative impact, will depend on future developments, which are highly uncertain and unknown at this time.
4 > ACQUISITIONS AND DIVESTITURES
A) Massawa Project
On March 4, 2020, Barrick and our Senegalese joint venture partner completed the sale of our aggregate 90% interest in the Massawa project (“Massawa”) in Senegal to Teranga Gold Corporation (“Teranga”) for total consideration fair valued at $440 million on the date of closing. Barrick received 92.5% of the consideration for its interest in the Massawa project, with the balance received by Barrick’s local Senegalese partner. Barrick received a net of $256 million in cash and 19,164,403 Teranga common shares (worth $104 million at the date of closing) plus a contingent payment of up to $50 million based on the three year average gold price, which was valued at $28 million at the date of closing. The cash consideration received was net of $25 million that Barrick provided through its participation in the $225 million syndicated debt financing facility secured by Teranga in connection with the transaction. The facility has a final repayment date of December 31, 2022. The difference between the fair value of consideration received and the carrying value of the assets on closing was $54 million and has been recognized as a gain in the first quarter of 2020.
| BARRICK FIRST QUARTER 2020 | 107 | NOTES TO FINANCIAL STATEMENTS (UNAUDITED) |
5 > SEGMENT INFORMATION
Barrick’s business is organized into nineteen minesites and one project. Barrick’s Chief Operating Decision Maker (“CODM”) (Mark Bristow, President and Chief Executive Officer) reviews the operating results, assesses performance and makes capital allocation decisions at the minesite, Company and/or project level. Each individual minesite and the Pascua-Lama project are operating segments for financial reporting purposes. Our presentation of our reportable operating segments consists of nine gold mines (Carlin, Cortez, Turquoise Ridge, Pueblo Viejo, Loulo-Gounkoto, Kibali, Veladero, Porgera and North Mara). The remaining operating segments, including our copper mines, remaining gold mines and project, have been grouped into an “other” category and will not be reported on individually. Segment performance is evaluated based on a number of measures including operating income before tax, production levels and unit production costs. Certain costs are managed on a consolidated basis and are therefore not reflected in segment income. Prior period figures have been restated to reflect the changes made to our reportable operating segments in the prior year.
Consolidated Statement of Income Information
| Cost of Sales | ||||||||||||||||||||||||
For the three months ended March 31, 2020 | Revenue | Direct mining, royalties and community relations | Depreciation | Exploration, evaluation and project expenses | Other expenses (income)1 | Segment income (loss) | ||||||||||||||||||
Carlin2 | $662 | $324 | $80 | $3 | $6 | $249 | ||||||||||||||||||
Cortez2 | 330 | 128 | 54 | 2 | 2 | 144 | ||||||||||||||||||
Turquoise Ridge2 | 226 | 96 | 51 | 1 | 2 | 76 | ||||||||||||||||||
Pueblo Viejo2 | 374 | 132 | 53 | 3 | 2 | 184 | ||||||||||||||||||
Loulo-Gounkoto2 | 243 | 94 | 59 | 2 | 3 | 85 | ||||||||||||||||||
Kibali | 140 | 52 | 41 | 1 | (2 | ) | 48 | |||||||||||||||||
Veladero | 90 | 45 | 22 | — | (1 | ) | 24 | |||||||||||||||||
Porgera | 101 | 60 | 10 | 1 | 1 | 29 | ||||||||||||||||||
North Mara2 | 132 | 54 | 25 | — | (5 | ) | 58 | |||||||||||||||||
Other Mines2,3 | 563 | 320 | 160 | 4 | 14 | 65 | ||||||||||||||||||
Reportable segment total | $2,861 | $1,305 | $555 | $17 | $22 | $962 | ||||||||||||||||||
Share of equity investees | (140 | ) | (52 | ) | (41 | ) | (1 | ) | 2 | (48 | ) | |||||||||||||
Segment total | $2,721 | $1,253 | $514 | $16 | $24 | $914 | ||||||||||||||||||
Consolidated Statement of Income Information
| Cost of Sales | ||||||||||||||||||||||||
For the three months ended March 31, 2019 | Revenue | Direct mining, royalties and community relations | Depreciation | Exploration, evaluation and project expenses | Other expenses (income)1 | Segment income (loss) | ||||||||||||||||||
Carlin2 | $311 | $160 | $66 | $2 | $— | $83 | ||||||||||||||||||
Cortez2 | 339 | 113 | 64 | 2 | 5 | 155 | ||||||||||||||||||
Turquoise Ridge2 | 100 | 39 | 6 | — | 1 | 54 | ||||||||||||||||||
Pueblo Viejo2 | 326 | 117 | 46 | 3 | 1 | 159 | ||||||||||||||||||
Loulo-Gounkoto2 | 210 | 110 | 59 | 2 | 3 | 36 | ||||||||||||||||||
Kibali | 117 | 52 | 56 | — | (1 | ) | 10 | |||||||||||||||||
Veladero | 91 | 51 | 30 | — | — | 10 | ||||||||||||||||||
Porgera | 86 | 57 | 11 | — | — | 18 | ||||||||||||||||||
North Mara2 | 88 | 52 | 20 | — | 2 | 14 | ||||||||||||||||||
Other Mines2,3 | 542 | 357 | 123 | 4 | 19 | 39 | ||||||||||||||||||
Reportable segment total | $2,210 | $1,108 | $481 | $13 | $30 | $578 | ||||||||||||||||||
Share of equity investees | (117 | ) | (52 | ) | (56 | ) | — | 1 | (10 | ) | ||||||||||||||
Segment total | $2,093 | $1,056 | $425 | $13 | $31 | $568 | ||||||||||||||||||
| 1 | Includes accretion expense, which is included within finance costs in the consolidated statement of income. For the three months ended March 31, 2020, accretion expense was $12 million (2019: $13 million). |
| 2 | Includesnon-controlling interest portion of revenues, cost of sales and segment income for the three months ended March 31, 2020 for Nevada Gold Mines $536 million, $330 million, $200 million (2019: $nil, $nil, $nil), Pueblo Viejo $158 million, $74 million, $82 million (2019: $128 million, $65 million, $61 million), Loulo- Gounkoto $49 million, $31 million, $17 million (2019: $42 million, $34 million, $7 million), North Mara, Bulyanhulu and Buzwagi $31 million, $22 million, $8 million (2019: $50 million, $42 million, $4 million) and Tongon $11 million, $9 million, $1 million (2019: $9 million, $11 million, $(2) million). |
| 3 | Includes provisional pricing adjustments for the three months ended March 31, 2020 of $24 million losses (2019: $22 million gains). |
| BARRICK FIRST QUARTER 2020 | 108 | NOTES TO FINANCIAL STATEMENTS (UNAUDITED) |
Reconciliation of Segment Income to Income Before Income Taxes
| For the three months ended March 31 | ||||||||
| 2020 | 2019 | |||||||
Segment income | $914 | $568 | ||||||
Other cost of sales/amortization1 | (9 | ) | (9 | ) | ||||
Exploration, evaluation and project expenses not attributable to segments | (55 | ) | (61 | ) | ||||
General and administrative expenses | (40 | ) | (54 | ) | ||||
Other income (expense) not attributable to segments | 54 | (9 | ) | |||||
Impairment reversals (charges) | 336 | (3 | ) | |||||
Loss on currency translation | (16 | ) | (22 | ) | ||||
Closed mine rehabilitation | (90 | ) | (25 | ) | ||||
Income from equity investees | 54 | 28 | ||||||
Finance costs, net (includesnon-segment accretion) | (92 | ) | (107 | ) | ||||
Gain (loss) onnon-hedge derivatives2 | (7 | ) | 1 | |||||
Income before income taxes3 | $1,049 | $307 | ||||||
| 1 | Includes all realized hedge gains and losses for the three months ended March 31, 2020 of $nil losses (2019: $nil losses). |
| 2 | Includes unrealizednon-hedge gains and losses for for the three months ended March 31, 2020 of $nil losses (2019: $1 million gains). |
| 3 | Includesnon-controlling interest portion of revenues, cost of sales andnon-segment income for the three months ended March 31, 2020 for Acacia, $nil, $nil, $nil (2019: $nil, $nil, $(3) million) and Nevada Gold Mines, $nil, $nil, $nil (2019: $nil $nil, $nil). |
Capital Expenditures Information
Segment capital expenditures1 | ||||||||
| For the three months ended March 31 | ||||||||
| 2020 | 2019 | |||||||
Carlin | $93 | $55 | ||||||
Cortez | 87 | 77 | ||||||
Turquoise Ridge | 30 | 26 | ||||||
Pueblo Viejo | 28 | 32 | ||||||
Loulo-Gounkoto | 39 | 50 | ||||||
Kibali | 15 | 10 | ||||||
Veladero | 26 | 29 | ||||||
Porgera | 8 | 9 | ||||||
North Mara | 15 | 13 | ||||||
Other Mines | 61 | 115 | ||||||
Reportable segment total | $402 | $416 | ||||||
Other items not allocated to segments | 34 | 32 | ||||||
Total | $436 | $448 | ||||||
Share of equity investees | (15 | ) | (10 | ) | ||||
Total | $421 | $438 | ||||||
| 1 | Segment capital expenditures are presented for internal management reporting purposes on an accrual basis. Capital expenditures in the Consolidated Statements of Cash Flow are presented on a cash basis. For the three months ended March 31, 2020, cash expenditures were $451 million (2019: $374 million) and the decrease in accrued expenditures was $30 million (2019: $64 million increase). |
Purchase Commitments
At March 31, 2020, we had purchase obligations for supplies and consumables of $1,437 million (December 31, 2019: $1,681 million).
Capital Commitments
In addition to entering into various operational commitments in the normal course of business, we had capital commitments of $218 million at March 31, 2020 (December 31, 2019: $383 million).
| BARRICK FIRST QUARTER 2020 | 109 | NOTES TO FINANCIAL STATEMENTS (UNAUDITED) |
6 > REVENUE
| For the three months ended March 31 | ||||||||
| 2020 | 2019 | |||||||
Gold sales | ||||||||
Spot market sales | $2,555 | $1,894 | ||||||
Concentrate sales | 38 | 12 | ||||||
Provisional pricing adjustments | — | — | ||||||
| $2,593 | $1,906 | |||||||
Copper sales | ||||||||
Copper concentrate sales | $123 | $141 | ||||||
Provisional pricing adjustments | (24 | ) | 22 | |||||
| $99 | $163 | |||||||
Other sales1 | 29 | 24 | ||||||
Total | $2,721 | $2,093 | ||||||
| 1 | Revenues include the sale ofby-products for our gold and copper mines including silver revenue of $11 million for the three months ended March 31, 2020 (2019: $24 million). |
7 > COST OF SALES
| Gold | Copper | Other3 | Total | |||||||||||||||||||||||||||||
| For the three months ended March 31 | 2020 | 2019 | 2020 | 2019 | 2020 | 2019 | 2020 | 2019 | ||||||||||||||||||||||||
Direct mining cost1,2 | $1,080 | $894 | $69 | $76 | $2 | $— | $1,151 | $970 | ||||||||||||||||||||||||
Depreciation | 474 | 384 | 43 | 42 | 7 | 9 | 524 | 435 | ||||||||||||||||||||||||
Royalty expense | 84 | 66 | 11 | 12 | — | — | 95 | 78 | ||||||||||||||||||||||||
Community relations | 5 | 6 | 1 | 1 | — | — | 6 | 7 | ||||||||||||||||||||||||
| $1,643 | $1,350 | $124 | $131 | $9 | $9 | $1,776 | $1,490 | |||||||||||||||||||||||||
| 1 | Direct mining cost includes charges to reduce the cost of inventory to net realizable value as follows: $17 million for the three months ended March 31, 2020 (2019: $4 million). |
| 2 | Direct mining cost includes the costs of extractingby-products. |
| 3 | Other includes realized hedge gains and losses and corporate amortization. |
8 > EARNINGS PER SHARE
For the three months ended March 31 | ||||||||||||||||
| 2020 | 2019 | |||||||||||||||
| Basic | Diluted | Basic | Diluted | |||||||||||||
Net income | $663 | $663 | $140 | $140 | ||||||||||||
Net income attributable tonon-controlling interests | (263 | ) | (263 | ) | (29 | ) | (29 | ) | ||||||||
Net income attributable to equity holders of Barrick Gold Corporation | $400 | $400 | $111 | $111 | ||||||||||||
Weighted average shares outstanding | 1,778 | 1,778 | 1,745 | 1,746 | ||||||||||||
Earnings per share data attributable to the equity holders of Barrick Gold Corporation | ||||||||||||||||
Net income | $0.22 | $0.22 | $0.06 | $0.06 | ||||||||||||
| BARRICK FIRST QUARTER 2020 | 110 | NOTES TO FINANCIAL STATEMENTS (UNAUDITED) |
9 > OTHER EXPENSE
| A) | Other Expense (Income) |
| For the three | ||||||||
| months ended | ||||||||
| March 31 | ||||||||
| 2020 | 2019 | |||||||
Other expense: | ||||||||
Bank charges | $4 | $5 | ||||||
Bulyanhulu reduced operations program | ||||||||
cost1 | 7 | 6 | ||||||
Loss (gain) onnon-hedge derivatives | 7 | (1 | ) | |||||
Litigation | 3 | 10 | ||||||
Miscellaneous write-offs | 1 | 2 | ||||||
Acacia - other | — | 1 | ||||||
Other | 9 | 8 | ||||||
Total other expense | $31 | $31 | ||||||
Other income: | ||||||||
Gain on sale of long-lived assets | ($60 | ) | $— | |||||
Other | (6 | ) | (5 | ) | ||||
Total other income | ($66 | ) | ($5 | ) | ||||
Total | ($35 | ) | $26 | |||||
| 1 | Primarily relates to care and maintenance costs. |
| B) | Impairment (Reversals) Charges |
| For the three | ||||||||
| months ended | ||||||||
| March 31 | ||||||||
| 2020 | 2019 | |||||||
Impairment (reversals) ofnon-current assets1 | ($336 | ) | $3 | |||||
Total | ($336 | ) | $3 | |||||
| 1 | Refer to note 13 for further details. |
10 > INCOME TAX EXPENSE
| For the three months | ||||||||
| ended March 31 | ||||||||
| 2020 | 2019 | |||||||
Current | $252 | $130 | ||||||
Deferred | 134 | 37 | ||||||
| $386 | $167 | |||||||
Income tax expense was $386 million for the three months ended March 31, 2020. The unadjusted effective income tax rate for income for the three months ended March 31, 2020, was 37% of the income before income taxes.
The underlying effective income tax rate on ordinary income for the three months ended March 31, 2020 was 28% after adjusting for the gain on sale of the Massawa project; the impact of the settlement of all outstanding disputes with the Government of Tanzania (“GoT”); the impact of impairment charges (reversals) at Tanzania; the impact of the transfer of a free carried shareholding of 16% in each of the Tanzania mines to the GoT; the impact of foreign currency translation losses on deferred tax balances; the impact ofnon-deductible foreign exchange losses; the impact of a reduced corporate
tax rate in Argentina on deferred tax balances; and the impact of other expense adjustments.
Currency Translation
Deferred tax balances are subject to remeasurement for changes in currency exchange rates each period. The most significant balances are Argentine and Malian net deferred tax liabilities. In the three months ended March 31, 2020, tax expense of $6 million primarily arose from translation losses on tax balances in Argentina and Mali, due to the weakening of the Argentine peso and the West African CFA franc, respectively, against the US dollar. These translation losses are included within deferred income tax expense.
Nevada Joint Venture
Nevada Gold Mines is a limited liability company treated as a flow through partnership for US tax purposes. The partnership is not subject to income tax directly, but each of its partners is liable for tax on its share of the profits of the partnership. As such, Barrick accounts for its current and deferred tax associated with the investment (61.5% share) following the principles in IAS 12.
Argentina Deferred Taxes
In December 2017, Argentina reduced its 35% corporate tax rate to 30% for 2018 and 2019, with a further reduction to 25% for 2020 and thereafter. Concurrently, a dividend distribution tax was introduced that charges 7% tax on dividend distributions for 2018 and 2019, and 13% tax on dividend distributions for 2020 and thereafter. On December 23, 2019, Argentina enacted a law that the previously approved corporate tax rate reduction from 30% to 25% will be deferred for one year until January 1, 2021. Therefore, the corporate tax rate of 30% is unchanged for the 2020 calendar year. The scheduled increase of dividend withholding tax from 7% to 13% is also deferred until January 1, 2021.
A deferred tax recovery of $35 million was recorded in the first quarter of 2020 as a result of the tax reform measures.
Tanzania Dispute Resolution Framework
On January 24, 2020, Barrick formalized the establishment of a joint venture between Barrick and the GoT and resolution of all outstanding disputes between Barrick and the GoT, including the lifting of the previous concentrate export ban, effective immediately. Refer to note 13 for further details.
The terms of the signed agreement are consistent with those previously announced, including the payment of $300 million to settle all outstanding tax and other disputes (the “Settlement Payment”); the lifting of the concentrate export ban; the sharing of future economic benefits from the mines on a 50/50 basis; and a dispute resolution mechanism that provides for binding international arbitration. The 50/50 division of economic benefits will be maintained through an annualtrue-up mechanism, which is exclusive of the Settlement Payment.
A current tax expense and deferred tax recovery of $21 million and $44 million, respectively, was recorded in the first quarter of 2020. This was a result of changes to the 2019year-end tax balances as certain tax agreements were made retroactive starting January 1, 2019; as well as from the recognition of deferred tax assets at Buzwagi.
| BARRICK FIRST QUARTER 2020 | 111 | NOTES TO FINANCIAL STATEMENTS (UNAUDITED) |
11 > CASH FLOW – OTHER ITEMS
| Operating Cash Flows – Other Items | For the three months ended March 31 | |||||||
| 2020 | 2019 | |||||||
Adjustments fornon-cash income statement items: | ||||||||
Loss (gain) onnon-hedge derivatives | $7 | ($1 | ) | |||||
Share-based compensation expense | 17 | 12 | ||||||
Income from investment in equity investees | (54 | ) | (28 | ) | ||||
Change in estimate of rehabilitation costs at closed mines | 90 | 25 | ||||||
Net inventory impairment charges | 17 | 4 | ||||||
Change in other assets and liabilities | (4 | ) | (22 | ) | ||||
Settlement of rehabilitation obligations | (20 | ) | (14 | ) | ||||
Other operating activities | $53 | ($24 | ) | |||||
Cash flow arising from changes in: | ||||||||
Accounts receivable | ($8 | ) | $11 | |||||
Inventory | (84 | ) | (10 | ) | ||||
Other current assets | (106 | ) | (85 | ) | ||||
Accounts payable | (79 | ) | (123 | ) | ||||
Other current liabilities | (55 | ) | (41 | ) | ||||
Change in working capital | ($332 | ) | ($248 | ) | ||||
| Investing Cash Flows – Other Items | For the three months ended March 31 | |||||||
| 2020 | 2019 | |||||||
Dividends received from equity method investments | $25 | $15 | ||||||
Shareholder loan repayments from equity method investments | — | 30 | ||||||
Other net investing activities | $25 | $45 | ||||||
12 > EQUITY ACCOUNTING METHOD INVESTMENT CONTINUITY
| Kibali | Jabal Sayid | Zaldívar | Other | Total | ||||||||||||||||
At January 1, 2019 | $— | $245 | $989 | $— | $1,234 | |||||||||||||||
Acquisitions | 3,195 | — | — | 58 | 3,253 | |||||||||||||||
Equitypick-up from equity investees | 98 | 51 | 16 | — | 165 | |||||||||||||||
Funds invested | — | — | — | 2 | 2 | |||||||||||||||
Dividends received | (75 | ) | — | (50 | ) | — | (125 | ) | ||||||||||||
Shareholder loan repayment | — | — | — | (2 | ) | (2 | ) | |||||||||||||
At December 31, 2019 | $3,218 | $296 | $955 | $58 | $4,527 | |||||||||||||||
Equitypick-up from equity investees | 42 | 12 | — | — | 54 | |||||||||||||||
Dividends received | (25 | ) | — | — | — | (25 | ) | |||||||||||||
At March 31, 2020 | $3,235 | $308 | $955 | $58 | $4,556 | |||||||||||||||
| BARRICK FIRST QUARTER 2020 | 112 | NOTES TO FINANCIAL STATEMENTS (UNAUDITED) |
13 > IMPAIRMENT OF GOODWILL AND OTHER ASSETS
In accordance with our accounting policy, goodwill is tested for impairment in the fourth quarter and also when there is an indicator of impairment.Non-current assets are tested for impairment or impairment reversals when events or changes in circumstances suggest that the carrying amount may not be recoverable or is understated. Refer to note 21 of the 2019 Annual Financial Statements for further information.
For the three months ended March 31, 2020, we recorded net impairment reversals of $336 million (2019: $3 million impairments) fornon-current assets.
Indicators of impairment and reversals
First Quarter 2020
Tanzania
On January 24, 2020, Barrick formalized the establishment of a joint venture between Barrick and the GoT and resolution of all outstanding disputes between Barrick and the GoT, including the lifting of the previous concentrate export ban, effective immediately. Effective January 1, 2020, the GoT received a free carried shareholding of 16% in each of the Tanzania mines (Bulyanhulu, Buzwagi and North Mara), a 16% interest in the shareholder loans owed by the operating companies and will receive half of the economic benefits from the Tanzanian operations from taxes, royalties, clearing fees and participation in all cash distributions made by the mines, after the recoupment of capital investments.
We have determined this to be an indicator of impairment reversal, as the resolution of the long standing dispute has led to a decrease in the risk adjustment previously included in the weighted average cost of capital (“WACC”) and the removal of the estimated impact of the previously anticipated issuance of the equity to the GoT. The key assumptions and estimates used in determining the fair value less cost to dispose (“FVLCD”) are a short-term gold price of $1,350 per ounce, long-term gold price of $1,300 per ounce, NAV multiples of1.1-1.3 and a WACC of5.4%-6.2%. Management assumed the resumption of concentrate sales and exports commencing in Q2 2020 and the resumption of production from underground mining at Bulyanhulu in 2020. We identified that the FVLCD exceeded the carrying value and a fullnon-current asset impairment reversal was recognized in the first quarter of 2020 of $649 million at Bulyanhulu and $88 million at North Mara, based on a FVLCD of $1,237 million and $967 million, respectively. No impairment reversal was recognized at Buzwagi.
The FVLCD was also used to determine the initial value assigned to the 16% equity interest in each of the operating mines that was given to the GoT. The recognition of thisnon-controlling interest in the three Tanzanian mines resulted in a loss of $234 million being recognized in the first quarter of 2020. The assignment of 16% of the existing shareholder loans also resulted in the recognition of a $167 million loss in the first quarter of 2020.
As the signing of the agreement and substantial resolution of the outstanding disputes with the GoT caused the impairment reversal, loss on equity issuance and loss on assignment of shareholder loans, the financial impact has been aggregated
and presented as a $336 million net impairment reversal on the consolidated statement of income.
Porgera
As described in note 17, on April 24, 2020, we received communication from the Government of Papua New Guinea that the Special Mining Lease will not be extended, and therefore Porgera was placed on temporary care and maintenance on April 25, 2020. We have performed an analysis and believe that the carrying value of our 47.5% share of Porgera ($258 million as at March 31, 2020) remains recoverable under the temporary care and maintenance scenario. The ultimate resolution of this dispute may differ from this assumption and there is no guarantee that the carrying value will remain recoverable.
Sensitivities
Lumwana
In the third quarter of 2019, we recorded anon-current asset impairment reversal related to the Lumwana copper mine. As a result of this, Lumwana is sensitive to changes in the key assumptions used in this valuation, including the price of copper. In the first quarter of 2020, we experienced a significant decrease in market copper prices and while we have concluded that this does not represent an indicator of impairment, a prolonged decrease in market copper prices could lead tonon-current asset impairments in future periods.
14 > FINANCIAL INSTRUMENTS
Financial instruments include cash; evidence of ownership in an entity; or a contract that imposes an obligation on one party and conveys a right to a second party to deliver/receive cash or another financial instrument.
A) Cash and Equivalents
Cash and equivalents include cash, term deposits, treasury bills and money market funds with original maturities of less than 90 days.
B) Debt
On January 31, 2020, Barrick completed a make-whole redemption of the approximately $337 million of outstanding principal on the 3.85% notes due 2022. The settlement resulted in a debt extinguishment loss of $15 million.
In January 2020, the final installment of $14 million was repaid for the Acacia Credit Facility.
| BARRICK FIRST QUARTER 2020 | 113 | NOTES TO FINANCIAL STATEMENTS (UNAUDITED) |
15 > FAIR VALUE MEASUREMENTS
A) Assets and Liabilities Measured at Fair Value on a Recurring Basis
| As at March 31, 2020 | Quoted
(Level 1) | Significant
(Level 2) | Significant
(Level 3) | Aggregate
| ||||||||||||
Cash and equivalents | $3,327 | $— | $— | $3,327 | ||||||||||||
Other investments | 338 | — | — | 338 | ||||||||||||
Derivatives | — | 22 | — | 22 | ||||||||||||
Receivables from provisional copper and gold sales | — | 51 | — | 51 | ||||||||||||
| $3,665 | $73 | $— | $3,738 | |||||||||||||
B) Fair Values of Financial Assets and Liabilities
| As at March 31, | As at December 31, | |||||||||||||||
| 2020 | 2019 | |||||||||||||||
| Carrying amount | Estimat ed fair value | Carrying amount | Estimat ed fair value | |||||||||||||
Financial assets | ||||||||||||||||
Other assets1 | $665 | $665 | $612 | $612 | ||||||||||||
Other investments2 | 338 | 338 | 258 | 258 | ||||||||||||
Derivative assets3 | 22 | 22 | 1 | 1 | ||||||||||||
| $1,025 | $1,025 | $871 | $871 | |||||||||||||
Financial liabilities | ||||||||||||||||
Debt4 | $5,179 | $6,299 | $5,536 | $6,854 | ||||||||||||
Derivative liabilities | — | — | — | — | ||||||||||||
Other liabilities | 359 | 359 | 209 | 209 | ||||||||||||
| $5,538 | $6,658 | $5,745 | $7,063 | |||||||||||||
| 1 | Includes restricted cash and amounts due from our partners. |
| 2 | Recorded at fair value. Quoted market prices are used to determine fair value. |
| 3 | Primarily consists of contingent consideration received as part of the sale of Massawa |
| 4 | Debt is generally recorded at amortized cost. The fair value of debt is primarily determined using quoted market prices. Balance includes both current and long-term portions of debt. |
We do not offset financial assets with financial liabilities.
The Company’s valuation techniques were presented in Note 26 of the 2019 Annual Financial Statements and have been consistently applied in these interim financial statements.
16 > CAPITAL STOCK
A) Authorized Capital Stock
Our authorized capital stock is composed of an unlimited number of common shares (issued 1,778,034,807 common shares as at March 31, 2020). Our common shares have no par value.
B) Dividends
The Company’s practice has been to declare dividends after a quarter in the announcement of the results for the quarter. Dividends declared are paid in the same quarter.
The Company’s dividend reinvestment plan resulted in 78,196 common shares issued to shareholders for the three months ended March 31, 2020.
17 > CONTINGENCIES
Certain conditions may exist as of the date the financial statements are issued that may result in a loss to the Company, but which will only be resolved when one or more future events occur or fail to occur. The impact of any resulting loss from such matters affecting these financial statements and noted below may be material.
Except as noted below, no material changes have occurred with respect to the matters disclosed in Note 36 “Contingencies” to the 2019 Annual Financial Statements, and no new contingencies have occurred that are material to the Company since the issuance of the 2019 Annual Financial Statements.
The description set out below should be read in conjunction with Note 36 “Contingencies” to the 2019 Annual Financial Statements.
Litigation and Claims Update
Proposed Canadian Securities Class Actions (Pascua-Lama)
In March 2020, the Quebec court denied both the leave to proceed with statutory secondary market misrepresentation claims and the motion for class certification. As a result, subject to appeal, the claimant cannot pursue the statutory secondary market misrepresentation claims, and can only pursue his other purported claims on an individual basis rather than on behalf of other shareholders. The claimant has not yet confirmed whether he will pursue an appeal.
The motion for class certification in Ontario is scheduled to be heard in June 2020.
The Company intends to vigorously defend the proposed Canadian securities class actions. No amounts have been recorded for any potential liability arising from these matters, as the Company cannot reasonably predict the outcome.
Veladero - September 2015 Release of Cyanide-Bearing Process Solution
Glaciers Investigation
Due to the Argentine response toCovid-19, the oral arguments originally scheduled for April and May 2020 in this matter have been postponed and have not yet been rescheduled.
Veladero – Tax Assessment and Criminal Charges
In the Criminal Tax Case, the Argentinean Federal Tax Authority’s appeal of the trial court’s ruling on the defendants’ motion to dismiss on statute of limitations grounds was denied.
| BARRICK FIRST QUARTER 2020 | 114 | NOTES TO FINANCIAL STATEMENTS (UNAUDITED) |
The Company believes that the Tax Assessment and the Criminal Tax Case are without merit and intends to defend the proceedings vigorously. No amounts have been recorded for any potential liability arising from the Tax Assessment or the Criminal Tax Case, as the Company cannot reasonably predict the outcome.
Writ of Kalikasan
The tentative trial date of March 23, 2020 was postponed due to the Philippine government’s response to theCovid-19 pandemic, and has not yet been rescheduled.
No amounts have been recorded for any potential liability under this matter, as the Company cannot reasonably predict the outcome. The Company intends to continue to defend the action vigorously.
Malian Tax Dispute
The Company continues to await the State of Mali’s response to its settlement proposal.
Tanzania – Concentrate Export Ban and Related Disputes
On January 24, 2020, Barrick announced that the Company had ratified the creation of Twiga at a signing ceremony with the President of Tanzania, formalizing the establishment of a joint venture between Barrick and the GoT and resolution of all outstanding disputes between Barrick and the GoT, including the lifting of the previous concentrate export ban, effective immediately. The GoT received a free carried shareholding of 16% in each of the Tanzania mines (Bulyanhulu, Buzwagi and North Mara), a 16% interest in the shareholder loans owed by the operating companies and will receive its half of the economic benefits from taxes, royalties, clearing fees and participation in all cash distributions made by the mines and Twiga, after the recoupment of capital investments. Twiga will provide management services to the mines. Barrick and the GoT continue efforts to fulfill their respective obligations to satisfy all conditions of the signed agreement, primarily with respect to the execution and delivery of formal termination documents for the settlement of all outstanding disputes between the two parties.
Tanzanian Revenue Authority Assessments
All of the tax disputes with the TRA were resolved as part of the settlement with the GoT described above under“Tanzania– Concentrate Export Ban and Related Disputes.” As noted above, Barrick and the GoT continue efforts to fulfill their respective obligations to satisfy all conditions of the signed agreement, primarily with respect to the execution and delivery of formal termination documents for the settlement of all outstanding disputes between the two parties.
Porgera Special Mining Lease Extension
Porgera’s current Special Mining Lease (“SML”) terminated on August 16, 2019. The Company applied for a20-year extension of the SML in June 2017 and has been engaging with the government on this matter since then. On August 2, 2019, the National Court of Papua New Guinea ruled that the provisions of the country’s 1992 Mining Act applied to the Porgera gold mine, thus allowing it to continue operating while the application to extend its Special Mining Lease was being considered. Also in 2019, in response to a request from Papua New Guinea Prime Minister Marape, the Company proposed a benefit-sharing arrangement that would deliver more than half the economic benefits from the Porgera mine
to Papua New Guinea stakeholders, including the Government, for 20 years.
On April 24, 2020, Barrick Niugini Limited (“BNL”), the majority owner and operator of the Porgera joint venture, received a communication from the Government of Papua New Guinea that the SML will not be extended. The Company believes the Government’s decision not to extend the SML is tantamount to nationalization without due process and in violation of the Government’s legal obligations to BNL. The Company remains willing to discuss the issue with Prime Minister Marape and his government in light of the potentially catastrophic impact of this decision for the communities at Porgera and in the Enga Province, and for the country as a whole. BNL will pursue all legal avenues to challenge the Government’s decision and to recover any damages that BNL may suffer as a result of the Government’s decision. The Company will not discuss transitional arrangements for the management of the Porgera mine, as proposed by the Government, as this is not consistent with BNL’s rights, which were confirmed by the National Court’s decision in August 2019. Based on the communication we received from the Government of Papua New Guinea that the SML will not be extended, Porgera was placed on temporary care and maintenance on April 25, 2020 to ensure the safety and security of our employees and communities.
On April 28, 2020, BNL filed a Judicial Review action against the Government of Papua New Guinea in the Papua New Guinea National Court of Justice. Judicial review is a proceeding that challenges the procedural and constitutional adequacy of government administrative actions. The Judicial Review action seeks to quash the decision not to extend the SML on the grounds that the Government did not comply with the applicable legal standards and processes. BNL asked the National Court for a stay of the decision not to extend the SML to enable BNL to stay in possession of the mine to put it on temporary care and maintenance and to protect the mine’s assets. After a hearing on April 30, 2020, the National Court ordered that BNL could stay in possession of the Porgera mine “to ensure that the environment, the integrity of the mine and the rights of the landowners are not compromised” and ordered the Government of Papua New Guinea to cooperate with that objective. The National Court also ordered the parties to engage in substantive negotiations regarding the issues in the case and to return to the Court to report on progress on May 8, 2020. Our priority remains the health and safety of all our employees and community stakeholders.
Porgera Tax Audits
On April 9, 2020, BNL received a position paper from the Internal Revenue Commission (“IRC”) in Papua New Guinea asserting various proposed adjustments and other taxes amounting to $191 million (not including potential penalties) arising from tax audits of BNL conducted for 2006 through 2015. The IRC provided BNL with an opportunity to respond to the position paper by June 30, 2020 and BNL intends to respond by that date. The Company has reviewed the IRC position paper and concluded that there is no merit to the proposed adjustments, except for certain immaterial items for which a provision had already been made. The Company intends to defend its position vigorously and has not recorded any additional estimated amounts for the potential liability arising from the IRC position paper as the Company cannot reasonably predict the outcome.
| BARRICK FIRST QUARTER 2020 | 115 | NOTES TO FINANCIAL STATEMENTS (UNAUDITED) |
| Corporate Office | Enquiries | |||
| Barrick Gold Corporation | President and CEO | |||
161 Bay Street, Suite 3700 | Mark Bristow | |||
Toronto, Ontario M5J 2S1 | +1 647 205 7694 | |||
Canada | +44 788 071 1386 | |||
| Senior EVP and CFO | ||||
Telephone: +1 416861-9911 | Graham Shuttleworth | |||
Email: investor@barrick.com | +1 647 262 2095 | |||
Website: www.barrick.com | +44 779 771 1338 | |||
+44 1534 735 333 | ||||
| Shares Listed | Investor and Media Relations | |||
Kathy du Plessis | ||||
| GOLD | The New York Stock Exchange | +44 20 7557 7738 | ||
| ABX | The Toronto Stock Exchange | Email: barrick@dpapr.com | ||
| Transfer Agents and Registrars | ||||
| AST Trust Company (Canada) | ||||
P.O. Box 700, Postal Station B | ||||
Montreal, Quebec H3B 3K3 | ||||
or | ||||
| American Stock Transfer & Trust Company, LLC | ||||
6201 – 15 Avenue | ||||
Brooklyn, New York 11219 | ||||
Telephone:1-800-387-0825 | ||||
Fax:1-888-249-6189 | ||||
Email: inquiries@astfinancial.com | ||||
Website: www.astfinancial.com | ||||
Cautionary Statement on Forward-Looking Information
Certain information contained or incorporated by reference in this press release, including any information as to our strategy, projects, plans or future financial or operating performance, constitutes “forward-looking statements”. All statements, other than statements of historical fact, are forward-looking statements. The words “deliver”, “points to”, “plan”, “progresses”, “upside”, “opportunities”, “objective”, “expected”, “potential”, “strategy”, “will”, “proposed”, “aim”, “continues” and similar expressions identify forward-looking statements. In particular, this press release contains forward-looking statements including, without limitation, with respect to: Barrick’s forward-looking production guidance and estimates of future costs; cash flow forecasts; projected capital, operating and exploration expenditures, including with respect to Barrick’s10-year production profile; Barrick’s engagement with local communities to manage theCovid-19 pandemic; Barrick’s response to the government of Papua New Guinea’s decision not to extend Porgera’s Special Mining Lease; the duration of the temporary suspension of operations at Porgera; potential mineralization, and potential discoveries of new Tier One mines; potential extensions to life of mine, including at Veladero; potential exploration targets and mineral resource potential, including reserve
replenishment; opportunities to deliver value for Barrick’s owners and stakeholders; Barrick’s energy and sustainability strategies, including potential reductions to Barrick’s carbon footprint and costs and improvements in Barrick’s sustainability performance including the timing of Barrick’s updated ESG scorecard; future investments in community projects and contributions to local economies; expected benefits of the proposed closure solution at Golden Sunlight; and expectations regarding future price assumptions, financial performance and other outlook or guidance.
Forward-looking statements are necessarily based upon a number of estimates and assumptions including material estimates and assumptions related to the factors set forth below that, while considered reasonable by the Company as at the date of this press release in light of management’s experience and perception of current conditions and expected developments, are inherently subject to significant business, economic and competitive uncertainties and contingencies. Known and unknown factors could cause actual results to differ materially from those projected in the forward-looking statements and undue reliance should not be placed on such statements and information. Such factors include, but are not
limited to: fluctuations in the spot and forward price of gold, copper or certain other commodities (such as silver, diesel fuel, natural gas and electricity); the speculative nature of mineral exploration and development; changes in mineral production performance, exploitation and exploration successes; risks associated with projects in the early stages of evaluation and for which additional engineering and other analysis is required; the benefits expected from recent transactions being realized, including Nevada Gold Mines; diminishing quantities or grades of reserves; increased costs, delays, suspensions and technical challenges associated with the construction of capital projects; operating or technical difficulties in connection with mining or development activities, including geotechnical challenges and disruptions in the maintenance or provision of required infrastructure and information technology systems; failure to comply with environmental and health and safety laws and regulations;non-renewal of key licenses by governmental authorities, includingnon-renewal of Porgera’s Special Mining Lease; timing of receipt of, or failure to comply with, necessary permits and approvals; uncertainty whether some or all of Barrick’s targeted investments and projects will meet the Company’s capital allocation objectives and internal hurdle rate; the impact of global liquidity and credit availability on the timing of cash flows and the values of assets and liabilities based on projected future cash flows; adverse changes in our credit ratings; the impact of inflation; fluctuations in the currency markets; changes in U.S. dollar interest rates; risks arising from holding derivative instruments; changes in national and local government legislation, taxation, controls or regulations and/or changes in the administration of laws, policies and practices, expropriation or nationalization of property and political or economic developments in Canada, the United States and other jurisdictions in which the Company or its affiliates do or may carry on business in the future; lack of certainty with respect to foreign legal systems, corruption and other factors that are inconsistent with the rule of law; risks associated with illegal and artisanal mining; risks associated with new diseases, epidemics and pandemics, including the effects and potential effects of the globalCovid-19 pandemic; disruption of supply routes which may cause delays in construction and mining activities; damage to the Company’s reputation due to the actual or perceived occurrence of any number of events, including negative publicity with respect to the Company’s handling of environmental matters or dealings with community groups, whether true or not; the possibility that future exploration results will not be consistent with the Company’s expectations; risks that exploration data may be incomplete and considerable additional work may be required to complete further evaluation, including but not limited to drilling, engineering and socioeconomic studies and investment; risk of loss due to acts of war, terrorism, sabotage and civil disturbances; litigation and legal and administrative proceedings; contests over title to properties, particularly title to undeveloped properties, or over access to water, power and other required infrastructure; business opportunities that may be presented to, or pursued by, the Company; our ability to successfully integrate acquisitions or complete divestitures, including our ability to successfully reintegrate Acacia’s operations; risks associated with working with partners in jointly controlled assets; employee relations including loss of key employees; increased costs and physical risks, including extreme weather events and resource shortages, related to climate change; and availability and increased costs
associated with mining inputs and labor. Barrick also cautions that its 2020 guidance and five and ten year plan may be impacted by the unprecedented business and social disruption caused by the spread ofCovid-19. In addition, there are risks and hazards associated with the business of mineral exploration, development and mining, including environmental hazards, industrial accidents, unusual or unexpected formations, pressures,cave-ins, flooding and gold bullion, copper cathode or gold or copper concentrate losses (and the risk of inadequate insurance, or inability to obtain insurance, to cover these risks).
Many of these uncertainties and contingencies can affect our actual results and could cause actual results to differ materially from those expressed or implied in any forward-looking statements made by, or on behalf of, us. Readers are cautioned that forward-looking statements are not guarantees of future performance. All of the forward-looking statements made in this press release are qualified by these cautionary statements. Specific reference is made to the most recent Form40-F/Annual Information Form on file with the SEC and Canadian provincial securities regulatory authorities for a more detailed discussion of some of the factors underlying forward-looking statements and the risks that may affect Barrick’s ability to achieve the expectations set forth in the forward-looking statements contained in this press release. We disclaim any intention or obligation to update or revise any forward-looking statements whether as a result of new information, future events or otherwise, except as required by applicable law.