UNITED STATES
SECURITIES AND EXCHANGE COMMISSION
Washington, DC 20549
FORM N-CSR
CERTIFIED SHAREHOLDER REPORT OF REGISTERED MANAGEMENT INVESTMENT COMPANIES
Investment Company Act file number_811-04149
_Franklin Tax-Free Trust
(Exact name of registrant as specified in charter)
_One Franklin Parkway, San Mateo, CA 94403-1906
(Address of principal executive offices) (Zip code)
_Craig S. Tyle, One Franklin Parkway, San Mateo, CA 94403-1906
(Name and address of agent for service)
Registrant's telephone number, including area code:_(650) 312-2000
Date of fiscal year end:_2/28
Date of reporting period: _02/28/14
Item 1. Reports to Stockholders.

| | | | | | | |
| | Contents | | | | | |
| Shareholder Letter | 1 | Annual Report | | Franklin Kentucky | | Financial Highlights and | |
| | | Municipal Bond Market | | Tax-Free Income Fund | 36 | Statements of Investments | 92 |
| | | Overview | 4 | Franklin Louisiana | | Financial Statements | 152 |
| | | Investment Strategy and | | Tax-Free Income Fund | 43 | Notes to Financial Statements | 165 |
| | | Manager’s Discussion | 6 | Franklin Maryland | | Report of Independent | |
| | | Franklin Alabama | | Tax-Free Income Fund | 52 | Registered Public | |
| | | Tax-Free Income Fund | 7 | Franklin Missouri | | Accounting Firm | 183 |
| | | Franklin Florida | | Tax-Free Income Fund | 62 | Tax Information | 184 |
| | | Tax-Free Income Fund | 17 | Franklin North Carolina | | Board Members and Officers | 185 |
| | | Franklin Georgia | | Tax-Free Income Fund | 72 | | |
| | | | | | | Shareholder Information | 190 |
| | | Tax-Free Income Fund | 27 | Franklin Virginia | | | |
| | | | | Tax-Free Income Fund | 82 | | |
Annual Report
Municipal Bond Market Overview
For the 12-month period ended February 28, 2014, the municipal bond market declined in value. The Barclays Municipal Bond Index, which tracks investment-grade municipal securities, had a -0.21% total return for the 12-month period.1, 2 In comparison, the Barclays U.S. Treasury Index had a 12-month return of -0.88%.1, 2
Municipal bond and Treasury markets suffered steep declines beginning in late May 2013 following comments by Federal Reserve Board (Fed) Chairman Ben Bernanke that the Fed could begin tapering its bond buying in the coming months. Fears of declining bond prices increased when minutes from the Fed’s July meeting included more discussion of tapering. Municipal bond mutual funds experienced persistent, large outflows that accelerated during August. Selling in the Treasury and municipal bond markets caused yields on longer term bonds to rise faster than yields on shorter maturity bonds in both markets, but the yield difference was more pronounced for municipal bonds. Because bond prices move in the opposite direction from yields, the yield changes led to two significant developments during the sell-off — municipal bonds underperformed Treasury bonds, and longer term municipal bonds fared worse than shorter term municipal bonds. At its September meeting, the Fed decided to maintain its monthly level of bond purchases and wait for more evidence of sustained economic growth before tapering. Investors welcomed the news, and the municipal bond market posted positive returns for the month. At its December meeting, the Fed announced it would modestly reduce the pace of its bond buying program beginning in January 2014 while maintaining historically low interest rates. Municipal bond and Treasury markets showed little reaction to the news initially, but prices in both markets increased substantially during the first two months of 2014.
Other factors contributed to municipal bond price declines during the period under review. Several headline stories shook investor confidence in the municipal bond asset class. The City of Detroit, Michigan, filed for bankruptcy, the largest municipal bankruptcy filing in U.S. history. Independent credit rating agencies Standard & Poor’s, Moody’s Investors Service and Fitch Ratings downgraded Puerto Rico general obligation debt to below investment grade. The City of Chicago suffered a three-notch downgrade by Moody’s. In addition, reports from rating agencies and research organizations mentioned underfunded pensions that could affect the fiscal stability of several states and large municipalities. Bonds issued by
4 | Annual Report
municipalities involved in such stories have often experienced price erosion in secondary trading, but the extent of price erosion and the contagion to related issues have been unpredictable. Fallout from such headlines during the reporting period was no exception. As Puerto Rico debt traded at higher yields than similarly rated taxable securities, nontraditional buyers entered the market. Despite the entrance of these new buyers, Puerto Rico bonds experienced particularly poor performance and highly volatile trading. Puerto Rico bonds had a -16.99% total return for the reporting period, as measured by the Barclays Puerto Rico Municipal Bond Index.1, 2
At period-end, we maintained our positive view of the municipal bond market. We believe municipal bonds continue to be an attractive asset class among fixed income securities, and we intend to follow our solid discipline of investing to maximize income while seeking value in the municipal bond market.
The foregoing information reflects our analysis, opinions and portfolio holdings as of February 28, 2014, the end of the reporting period. The way we implement our main investment strategies and the resulting portfolio holdings may change depending on factors such as market and economic conditions. These opinions may not be relied upon as investment advice or an offer for a particular security. The information is not a complete analysis of every aspect of any market, state, industry, security or fund. Statements of fact are from sources considered reliable, but the investment manager makes no representation or warranty as to their completeness or accuracy. Although historical performance is no guarantee of future results, these insights may help you understand our investment management philosophy.
1. Source: © 2014 Morningstar. All Rights Reserved. The information contained herein: (1) is proprietary to Morningstar and/or its content providers; (2) may not be copied or distributed; and (3) is not warranted to be accurate, complete or timely. Neither Morningstar nor its content providers are responsible for any damages or losses arising from any use of this information. Past performance is no guarantee of future results.
2. Source: Barclays Global Family of Indices. © 2014 Barclays Capital Inc. Used with permission.
Annual Report | 5
Investment Strategy and
Manager’s Discussion
Investment Strategy
We use a consistent, disciplined strategy in an effort to maximize tax-exempt income for our shareholders by seeking to maintain exposure to higher coupon securities while balancing risk and return within each Fund’s range of allowable investments. We generally employ a buy-and-hold approach and invest in securities we believe should provide the most relative value in the market. We do not use leverage or derivatives, nor do we use hedging techniques that could add volatility and contribute to underperformance in adverse markets.
Manager’s Discussion
Based on the combination of our value-oriented philosophy of investing primarily for income and a positive-sloping municipal yield curve, in which yields for longer term bonds are higher than those for shorter term bonds, we favored the use of longer term bonds. Consistent with our strategy, we sought to purchase bonds from 15 to 30 years in maturity with good call features. We believe our conservative, buy-and-hold investment strategy can help us achieve high, current, tax-free income for shareholders.
We invite you to read your Fund report for more detailed performance and portfolio information. Thank you for your participation in Franklin Tax-Free Trust. We look forward to serving your future investment needs.
The foregoing information reflects our analysis, opinions and portfolio holdings as of February 28, 2014, the end of the reporting period. The way we implement our main investment strategies and the resulting portfolio holdings may change depending on factors such as market and economic conditions. These opinions may not be relied upon as investment advice or an offer for a particular security. The information is not a complete analysis of every aspect of any market, country, industry, security or fund. Statements of fact are from sources considered reliable, but the investment manager makes no representation or warranty as to their completeness or accuracy. Although historical performance is no guarantee of future results, these insights may help you understand our investment management philosophy.
6 | Annual Report
Franklin Alabama Tax-Free Income Fund
Your Fund’s Goal and Main Investments: Franklin Alabama Tax-Free Income Fund
seeks to provide as high a level of income exempt from federal and Alabama personal income taxes as is consistent with prudent investment management and preservation of capital by investing at least 80% of its total assets in securities that pay interest free from such taxes.1
Performance data represent past performance, which does not guarantee future results. Investment return and principal value will fluctuate, and you may have a gain or loss when you sell your shares. Current performance may differ from figures shown. Please visit franklintempleton.com or call (800) 342-5236 for most recent month-end performance.
This annual report for Franklin Alabama Tax-Free Income Fund covers the fiscal year ended February 28, 2014.
Performance Overview
The Fund’s Class A share price, as measured by net asset value, decreased from $11.91 on February 28, 2013, to $11.18 on February 28, 2014. The Fund’s Class A shares paid dividends totaling 42.74 cents per share for the same period.2 The Performance Summary beginning on page 11 shows that
The dollar value, number of shares or principal amount, and names of all portfolio holdings are listed in the Fund’s Statement of Investments (SOI). The SOI begins on page 94.
Annual Report | 7
| | |
| Dividend Distributions* | | |
| Franklin Alabama Tax-Free Income Fund | | |
| 3/1/13–2/28/14 | | |
| | Dividend per Share (cents) |
| Month | Class A | Class C |
| March | 3.48 | 2.92 |
| April | 3.38 | 2.82 |
| May | 3.38 | 2.82 |
| June | 3.38 | 2.84 |
| July | 3.38 | 2.84 |
| August | 3.48 | 2.94 |
| September | 3.56 | 3.07 |
| October | 3.74 | 3.25 |
| November | 3.74 | 3.25 |
| December | 3.74 | 3.25 |
| January | 3.74 | 3.25 |
| February | 3.74 | 3.25 |
| Total | 42.74 | 36.50 |
*Assumes shares were purchased and held for the entire accrual period. Since dividends accrue daily, your actual distributions will vary depending on the date you purchased your shares and any account activity. All Fund distributions will vary depending upon current market conditions, and past distributions are not indicative of future trends.
at the end of this reporting period the Fund’s Class A shares’ distribution rate was 3.84% based on an annualization of the 3.74 cent per share February dividend and the maximum offering price of $11.68 on February 28, 2014. An investor in the 2014 maximum combined effective federal and Alabama personal income tax bracket of 46.42% (including 3.8% Medicare tax) would need to earn a distribution rate of 7.17% from a taxable investment to match the Fund’s Class A tax-free distribution rate. For the Fund’s Class C shares’ performance, please see the Performance Summary.
State Update
Alabama’s economic recovery lagged the nation’s during the period under review. The housing market struggled as home prices remained relatively flat and issuance of new construction permits hovered near historical lows. Nonetheless, business sentiment remained positive and sales tax collections increased. For the 12-month period, the state added jobs at a relatively tepid rate, resulting partly from prolonged weakness in the information, mining and logging, and government sectors. In contrast, the leisure and hospitality, manufacturing and financial activities sectors exhibited solid job growth. Alabama’s unemployment rate declined to a five-year low in December and ended the period at 6.4%, which was lower than the 6.7% national average.3
8 | Annual Report
Alabama has two major operating funds — the Education Trust Fund (ETF), the main funding source for education programs, and the general fund, the primary funding source for Medicaid and other non-education government programs. The state ended fiscal year 2013 on September 30 with record revenue collections, because some of the biggest revenue sources, including individual income tax, experienced strong growth. The enacted fiscal year 2014 budget was based on modest revenue growth for the ETF and general fund, with both funds using nonrecurring revenues. While the enacted ETF budget included spending increases for pre-kindergarten programs and raises for teachers and school support staff, the enacted general fund budget provided relatively flat funding for most programs.
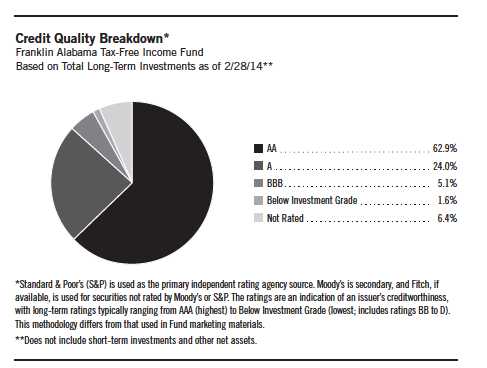
The state’s net-tax supported debt was 2.5% of personal income and $867 per capita, compared with the national medians of 2.8% and $1,074.4 Standard & Poor’s (S&P) rated Alabama’s general obligation debt AA with a stable outlook, reflecting the independent credit rating agency’s assessment of the state’s large and diversifying economy, required spending reductions to address any revenue shortfalls, dedicated revenue for capital projects and debt service, and low debt levels.5 In S&P’s view, these strengths were counterbalanced by the state’s declining reserves, planned use of one-time revenues, a restrictive tax structure and below-average pension funding.
Manager’s Discussion
We used various investment strategies during the 12 months under review as we sought to maximize tax-free income for shareholders. Puerto Rico’s municipal bond market is widely traded because of its federal and state tax-exemption advantages. During the reporting period, some Puerto Rico issuers experienced a series of downgrades from S&P, Moody’s Investors Service and Fitch Ratings. In February 2014, these credit rating firms downgraded their respective ratings of Puerto Rico’s general obligation debt to below investment grade, along with the ratings of certain related Puerto Rico issuers. Additionally, each rating agency maintained a negative outlook on certain Puerto Rico issuers, and further downgrades are possible. The Fund is not required to sell securities that have been downgraded to below investment grade, but it is prohibited from making further purchases of such securities as long as the securities are not rated investment grade by at least one U.S. nationally recognized rating service. Rating actions combined with news related to the commonwealth’s financial position and future financing endeavors caused the Puerto Rico bond market to experience sharp declines in the latter half of 2013 and contrasting positive performance year-to-date in 2014.
Portfolio Breakdown
Franklin Alabama Tax-Free Income Fund
2/28/14
| | |
| % of Total | |
| Long-Term Investments* | |
| Utilities | 21.2 | % |
| Hospital & Health Care | 14.9 | % |
| General Obligation | 14.4 | % |
| Higher Education | 12.7 | % |
| Subject to Government Appropriations | 11.1 | % |
| Tax-Supported | 6.3 | % |
| Other Revenue | 6.2 | % |
| Transportation | 4.6 | % |
| Refunded | 3.7 | % |
| Corporate-Backed | 2.8 | % |
| Housing | 2.1 | % |
*Does not include short-term investments and other net assets.
Annual Report | 9
Thank you for your continued participation in Franklin Alabama Tax-Free Income Fund. We believe our conservative, buy-and-hold investment strategy can help us achieve high, current, tax-free income for shareholders.
The foregoing information reflects our analysis, opinions and portfolio holdings as of February 28, 2014, the end
of the reporting period. The way we implement our main investment strategies and the resulting portfolio holdings
may change depending on factors such as market and economic conditions. These opinions may not be relied
upon as investment advice or an offer for a particular security. The information is not a complete analysis of
every aspect of any market, state, industry, security or the Fund. Statements of fact are from sources considered
reliable, but the investment manager makes no representation or warranty as to their completeness or accuracy.
Although historical performance is no guarantee of future results, these insights may help you understand our
investment management philosophy.
1. For investors subject to alternative minimum tax, a small portion of Fund dividends may be taxable. Distributions of
capital gains are generally taxable. To avoid imposition of 28% backup withholding on all Fund distributions and
redemption proceeds, U.S. investors must be properly certified on Form W-9 and non-U.S. investors on Form W-8BEN.
2. All Fund distributions will vary depending upon current market conditions, and past distributions are not indicative
of future trends.
3. Source: Bureau of Labor Statistics.
4. Source: Moody’s Investors Service, “2013 State Debt Medians Report,” 5/29/13.
5. This does not indicate S&P’s rating of the Fund.
10 | Annual Report
Performance Summary as of 2/28/14
Franklin Alabama Tax-Free Income Fund
Your dividend income will vary depending on dividends or interest paid by securities in the Fund’s portfolio, adjusted for operating expenses of each class. Capital gain distributions are net profits realized from the sale of portfolio securities. The performance table and graphs do not reflect any taxes that a shareholder would pay on Fund dividends, capital gain distributions, if any, or any realized gains on the sale of Fund shares. Total return reflects reinvestment of the Fund’s dividends and capital gain distributions, if any, and any unrealized gains or losses.
| | | | | | | | |
| Price and Distribution Information | | | | | | |
| Class A (Symbol: FRALX) | | | | Change | | 2/28/14 | | 2/28/13 |
| Net Asset Value (NAV) | | | -$ | 0.73 | $ | 11.18 | $ | 11.91 |
| Distributions (3/1/13–2/28/14) | | | | | | | | |
| Dividend Income | $ | 0.4274 | | | | | | |
| Long-Term Capital Gain | $ | 0.0009 | | | | | | |
| Total | $ | 0.4283 | | | | | | |
| Class C (Symbol: FALEX) | | | | Change | | 2/28/14 | | 2/28/13 |
| Net Asset Value (NAV) | | | -$ | 0.73 | $ | 11.31 | $ | 12.04 |
| Distributions (3/1/13–2/28/14) | | | | | | | | |
| Dividend Income | $ | 0.3650 | | | | | | |
| Long-Term Capital Gain | $ | 0.0009 | | | | | | |
| Total | $ | 0.3659 | | | | | | |
Annual Report | 11
Performance Summary (continued)
Performance
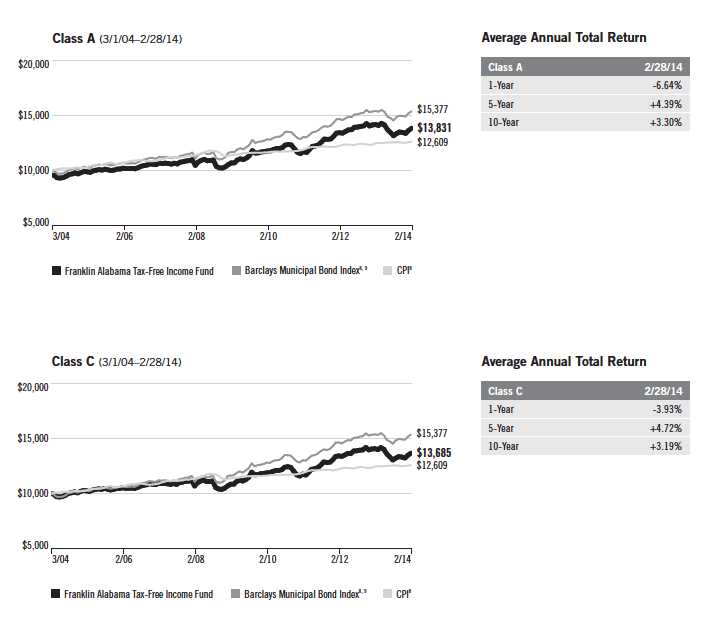
Cumulative total return excludes sales charges. Average annual total returns include maximum sales charges. Class A: 4.25% maximum initial sales charge; Class C: 1% contingent deferred sales charge in first year only.
| | | | | | | | | | |
| Class A | | | 1-Year | | | 5-Year | | | 10-Year | |
| Cumulative Total Return1 | | | -2.49 | % | + | 29.46 | % | + | 44.42 | % |
| Average Annual Total Return2 | | | -6.64 | % | + | 4.39 | % | + | 3.30 | % |
| Avg. Ann. Total Return (3/31/14)3 | | | -5.44 | % | + | 4.52 | % | + | 3.37 | % |
| Distribution Rate4 | 3.84 | % | | | | | | | | |
| Taxable Equivalent Distribution Rate5 | 7.17 | % | | | | | | | | |
| 30-Day Standardized Yield6 | 3.46 | % | | | | | | | | |
| Taxable Equivalent Yield5 | 6.46 | % | | | | | | | | |
| Total Annual Operating Expenses7 | 0.70 | % | | | | | | | | |
| Class C | | | 1-Year | | | 5-Year | | | 10-Year | |
| Cumulative Total Return1 | | | -2.99 | % | + | 25.96 | % | + | 36.85 | % |
| Average Annual Total Return2 | | | -3.93 | % | + | 4.72 | % | + | 3.19 | % |
| Avg. Ann. Total Return (3/31/14)3 | | | -2.83 | % | + | 4.84 | % | + | 3.25 | % |
| Distribution Rate4 | 3.45 | % | | | | | | | | |
| Taxable Equivalent Distribution Rate5 | 6.44 | % | | | | | | | | |
| 30-Day Standardized Yield6 | 3.07 | % | | | | | | | | |
| Taxable Equivalent Yield5 | 5.73 | % | | | | | | | | |
| Total Annual Operating Expenses7 | 1.25 | % | | | | | | | | |
Performance data represent past performance, which does not guarantee future results. Investment return and principal value will fluctuate, and you may have a gain or loss when you sell your shares. Current performance may differ from figures shown. For most recent month-end performance, go to franklintempleton.com or call (800) 342-5236.
12 | Annual Report
Performance Summary (continued)
Total Return Index Comparison for a Hypothetical $10,000 Investment
Total return represents the change in value of an investment over the periods shown. It includes any applicable maximum sales charge, Fund expenses, account fees and reinvested distributions. The unmanaged index includes reinvestment of any income or distributions. It differs from the Fund in composition and does not pay management fees or expenses. One cannot invest directly in an index.
Annual Report | 13
Performance Summary (continued)
All investments involve risks, including possible loss of principal. Because municipal bonds are sensitive to interest rate movements, the Fund’s yield and share price will fluctuate with market conditions. Bond prices generally move in the opposite direction of interest rates. Thus, as prices of bonds in the Fund adjust to a rise in interest rates, the Fund’s share price may decline. Because the Fund invests principally in a single state, it is subject to greater risk of adverse economic and regulatory changes in that state than a geographically diversified fund. The Fund holds a small portion of its assets in Puerto Rico municipal bonds that have been impacted by recent adverse economic and market changes, which may cause the Fund’s share price to decline. Changes in the credit rating of a bond, or in the credit rating or financial strength of a bond’s issuer, insurer or guarantor, may affect the bond’s value. The Fund may invest a significant part of its assets in municipal securities that finance similar types of projects, such as utilities, hospitals, higher education and transportation. A change that affects one project would likely affect all similar projects, thereby increasing market risk. The Fund is actively managed but there is no guarantee that the manager’s investment decisions will produce the desired results. The Fund’s prospectus also includes a description of the main investment risks.
Class C: These shares have higher annual fees and expenses than Class A shares.
1. Cumulative total return represents the change in value of an investment over the periods indicated.
2. Average annual total return represents the average annual change in value of an investment over the periods indicated.
3. In accordance with SEC rules, we provide standardized average annual total return information through the latest calendar quarter.
4. Distribution rate is based on an annualization of the respective class’s February dividend and the maximum offering price (NAV for Class C) per
share on 2/28/14.
5. Taxable equivalent distribution rate and yield assume the published rates as of 12/18/13 for the maximum combined effective federal and
Alabama personal income tax rate of 46.42%, based on the federal income tax rate of 39.60% plus 3.8% Medicare tax.
6. The 30-day standardized yield for the month ended 2/28/14 reflects an estimated yield to maturity (assuming all portfolio securities are held to
maturity). It should be regarded as an estimate of the Fund’s rate of investment income, and it may not equal the Fund’s actual income distribution
rate (which reflects the Fund’s past dividends paid to shareholders) or the income reported in the Fund’s financial statements.
7. Figures are as stated in the Fund’s current prospectus. In periods of market volatility, assets may decline significantly, causing total annual Fund
operating expenses to become higher than the figures shown.
8. Source: © 2014 Morningstar. The Barclays Municipal Bond Index is a market value-weighted index engineered for the long-term tax-exempt bond
market. To be included in the index, bonds must be fixed rate, have at least one year to final maturity and be rated investment grade (Baa3/BBB- or
higher) by at least two of the following agencies: Moody’s, Standard & Poor’s and Fitch. The Consumer Price Index (CPI), calculated by the Bureau of
Labor Statistics, is a commonly used measure of the inflation rate.
9. Source: Barclays Global Family of Indices. © 2014 Barclays Capital Inc. Used with permission.
14 | Annual Report
Your Fund’s Expenses
Franklin Alabama Tax-Free Income Fund
As a Fund shareholder, you can incur two types of costs:
- Transaction costs, including sales charges (loads) on Fund purchases; and
- Ongoing Fund costs, including management fees, distribution and service (12b-1) fees, and other Fund expenses. All mutual funds have ongoing costs, sometimes referred to as operating expenses.
The following table shows ongoing costs of investing in the Fund and can help you understand these costs and compare them with those of other mutual funds. The table assumes a $1,000 investment held for the six months indicated.
Actual Fund Expenses
The first line (Actual) for each share class listed in the table provides actual account values and expenses. The “Ending Account Value” is derived from the Fund’s actual return, which includes the effect of Fund expenses.
You can estimate the expenses you paid during the period by following these steps. Of course, your account value and expenses will differ from those in this illustration:
| 1. | Divide your account value by $1,000. |
| | If an account had an $8,600 value, then $8,600 ÷ $1,000 = 8.6. |
| 2. | Multiply the result by the number under the heading “Expenses Paid During Period.” |
| | If Expenses Paid During Period were $7.50, then 8.6 x $7.50 = $64.50. |
In this illustration, the estimated expenses paid this period are $64.50.
Hypothetical Example for Comparison with Other Funds
Information in the second line (Hypothetical) for each class in the table can help you compare ongoing costs of investing in the Fund with those of other mutual funds. This information may not be used to estimate the actual ending account balance or expenses you paid during the period. The hypothetical “Ending Account Value” is based on the actual expense ratio for each class and an assumed 5% annual rate of return before expenses, which does not represent the Fund’s actual return. The figure under the heading “Expenses Paid During Period” shows the hypothetical expenses your account would have incurred under this scenario. You can compare this figure with the 5% hypothetical examples that appear in shareholder reports of other funds.
Annual Report | 15
Your Fund’s Expenses (continued)
Please note that expenses shown in the table are meant to highlight ongoing costs and do not reflect any transaction costs, such as sales charges. Therefore, the second line for each class is useful in comparing ongoing costs only, and will not help you compare total costs of owning different funds. In addition, if transaction costs were included, your total costs would have been higher. Please refer to the Fund prospectus for additional information on operating expenses.
| | | | | | |
| | | Beginning Account | | Ending Account | | Expenses Paid During |
| Class A | | Value 9/1/13 | | Value 2/28/14 | | Period* 9/1/13–2/28/14 |
| Actual | $ | 1,000 | $ | 1,051.40 | $ | 3.71 |
| Hypothetical (5% return before expenses) | $ | 1,000 | $ | 1,021.17 | $ | 3.66 |
| Class C | | | | | | |
| Actual | $ | 1,000 | $ | 1,048.00 | $ | 6.50 |
| Hypothetical (5% return before expenses) | $ | 1,000 | $ | 1,018.45 | $ | 6.41 |
*Expenses are calculated using the most recent six-month expense ratio, annualized for each class (A: 0.73% and C: 1.28%), multiplied by the average account value over the period, multiplied by 181/365 to reflect the one-half year period.
16 | Annual Report
Franklin Florida Tax-Free Income Fund
Your Fund’s Goal and Main Investments: Franklin Florida Tax-Free Income Fund seeks to provide as high a level of income exempt from federal income taxes and any Florida personal income taxes as is consistent with prudent investment management and preservation of capital by investing at least 80% of its total assets in securities that pay interest free from such taxes.1
Performance data represent past performance, which does not guarantee future results. Investment return and principal value will fluctuate, and you may have a gain or loss when you sell your shares. Current performance may differ from figures shown. Please visit franklintempleton.com or call (800) 342-5236 for most recent month-end performance.
This annual report for Franklin Florida Tax-Free Income Fund covers the fiscal year ended February 28, 2014.
Performance Overview
The Fund’s Class A share price, as measured by net asset value, decreased from $11.96 on February 28, 2013, to $11.05 on February 28, 2014. The Fund’s Class A shares paid dividends totaling 44.13 cents per share for the same period.2 The Performance Summary beginning on page 21 shows that at the end of this reporting period the Fund’s Class A shares’ distribution rate was
The dollar value, number of shares or principal amount, and names of all portfolio holdings are listed in the Fund’s Statement of Investments (SOI). The SOI begins on page 99.
Annual Report | 17
| | |
| Dividend Distributions* | | |
| Franklin Florida Tax-Free Income Fund | | |
| 3/1/13–2/28/14 | | |
| | Dividend per Share (cents) |
| Month | Class A | Class C |
| March | 3.27 | 2.71 |
| April | 3.27 | 2.71 |
| May | 3.27 | 2.71 |
| June | 3.37 | 2.84 |
| July | 3.37 | 2.84 |
| August | 3.66 | 3.13 |
| September | 3.81 | 3.31 |
| October | 3.93 | 3.43 |
| November | 3.97 | 3.47 |
| December | 4.02 | 3.53 |
| January | 4.07 | 3.58 |
| February | 4.12 | 3.63 |
| Total | 44.13 | 37.89 |
*Assumes shares were purchased and held for the entire accrual period. Since dividends accrue daily, your actual distributions will vary depending on the date you purchased your shares and any account activity. All Fund distributions will vary depending upon current market conditions, and past distributions are not indicative of future trends.
4.28% based on an annualization of the 4.12 cent per share February dividend and the maximum offering price of $11.54 on February 28, 2014. An investor in the 2014 maximum federal income tax bracket of 39.60% (plus 3.8% Medicare tax) would need to earn a distribution rate of 7.56% from a taxable investment to match the Fund’s Class A tax-free distribution rate. For the Fund’s Class C shares’ performance, please see the Performance Summary.
State Update
Florida’s economic growth accelerated during the period under review as the state’s unemployment rate declined and revenue collection increased. The state’s housing market stabilized amid a slowdown in foreclosure rates and improved demand resulting largely from increased affordability and foreign investment. Fueled by private sector job growth, Florida’s employment growth rate continued to outpace the national average. For the 12-month period, nearly all employment sectors added jobs, leading the state’s unemployment rate to reach a multi-year low of 6.2% in January and February, compared to the 6.7% national average.3
18 | Annual Report
The state’s revenue collections rose as economic recovery gained traction, leading Florida to raise its fiscal year 2014 revenue forecast in December. As of January 2014, Florida exceeded the higher revenue forecast for 2014 fiscal year-to-date as sales tax collections for consumer nondurables, tourism and automobiles exceeded estimates. The governor’s proposed fiscal year 2015 budget amounted to about the same as the enacted fiscal year 2014 budget, marking the second consecutive year that Florida avoided facing a budget gap. Key highlights of the proposed budget included fee and tax cuts, increased spending for K-12 schools to be funded from projected growth in local property tax collections, government spending cuts, debt reduction and a larger contribution to the budget stabilization fund.
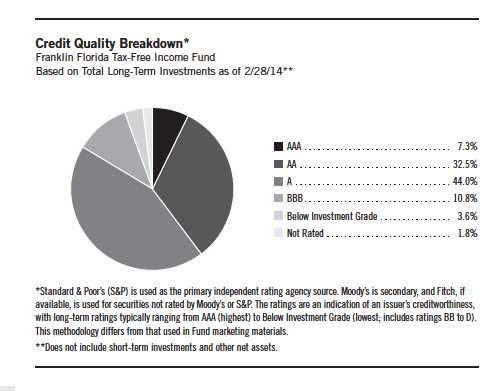
Florida’s net tax-supported debt was 2.8% of personal income and $1,087 per capita, in line with the national medians of 2.8% and $1,074.4 Moody’s Investors Service rated Florida’s general obligation debt Aa1 with a stable outlook, reflecting the independent credit rating agency’s view of the state’s conservative budget practices, willingness to raise revenues and reduce spending to balance the budget, strong reserve levels, large and diverse economic base, and relatively strong pension funding ratios.5 Some challenges that Moody’s cited included the state’s dependence on economically sensitive sales taxes, reliance on nonrecurring revenues and continued high foreclosure rates that could soften economic growth.
Manager’s Discussion
We used various investment strategies during the 12 months under review as we sought to maximize tax-free income for shareholders. Puerto Rico’s municipal bond market is widely traded because of its federal and state tax-exemption advantages. During the reporting period, some Puerto Rico issuers experienced a series of downgrades from Standard & Poor’s, Moody’s and Fitch Ratings. In February 2014, these credit rating firms downgraded their respective ratings of Puerto Rico’s general obligation debt to below investment grade, along with the ratings of certain related Puerto Rico issuers. Additionally, each rating agency maintained a negative outlook on certain Puerto Rico issuers, and further downgrades are possible. The Fund is not required to sell securities that have been downgraded to below investment grade, but it is prohibited from making further purchases of such securities as long as the securities are not rated investment grade by at least one U.S. nationally recognized rating service. Rating actions combined with news related to the commonwealth’s financial position and future financing endeavors caused the Puerto Rico bond market to experience sharp declines in the latter half of 2013 and contrasting positive performance year-to-date in 2014.
Portfolio Breakdown
Franklin Florida Tax-Free Income Fund
2/28/14
| | |
| % of Total | |
| Long-Term Investments* | |
| Utilities | 29.7 | % |
| Transportation | 15.1 | % |
| Hospital & Health Care | 14.8 | % |
| Tax-Supported | 11.4 | % |
| General Obligation | 8.5 | % |
| Subject to Government Appropriations | 5.9 | % |
| Refunded | 5.3 | % |
| Other Revenue | 4.8 | % |
| Higher Education | 3.3 | % |
| Housing | 1.2 | % |
*Does not include short-term investments and other net assets.
Annual Report | 19
Thank you for your continued participation in Franklin Florida Tax-Free Income Fund. We believe our conservative, buy-and-hold investment strategy can help us achieve high, current, tax-free income for shareholders.
The foregoing information reflects our analysis, opinions and portfolio holdings as of February 28, 2014, the end
of the reporting period. The way we implement our main investment strategies and the resulting portfolio holdings
may change depending on factors such as market and economic conditions. These opinions may not be relied
upon as investment advice or an offer for a particular security. The information is not a complete analysis of
every aspect of any market, state, industry, security or the Fund. Statements of fact are from sources considered
reliable, but the investment manager makes no representation or warranty as to their completeness or accuracy.
Although historical performance is no guarantee of future results, these insights may help you understand our
investment management philosophy.
1. For investors subject to alternative minimum tax, a small portion of Fund dividends may be taxable.
Distributions of capital gains are generally taxable. To avoid imposition of 28% backup withholding on all Fund
distributions and redemption proceeds, U.S. investors must be properly certified on Form W-9 and non-U.S.
investors on Form W-8BEN.
2. All Fund distributions will vary depending upon current market conditions, and past distributions are not indicative
of future trends.
3. Source: Bureau of Labor Statistics.
4. Source: Moody’s Investors Service, “2013 State Debt Medians Report,” 5/29/13.
5. This does not indicate Moody’s rating of the Fund.
20 | Annual Report
Performance Summary as of 2/28/14
Franklin Florida Tax-Free Income Fund
Your dividend income will vary depending on dividends or interest paid by securities in the Fund’s portfolio, adjusted for operating expenses of each class. Capital gain distributions are net profits realized from the sale of portfolio securities. The performance table and graphs do not reflect any taxes that a shareholder would pay on Fund dividends, capital gain distributions, if any, or any realized gains on the sale of Fund shares. Total return reflects reinvestment of the Fund’s dividends and capital gain distributions, if any, and any unrealized gains or losses.
| | | | | | | | |
| Price and Distribution Information | | | | | | |
| Class A (Symbol: FRFLX) | | | | Change | | 2/28/14 | | 2/28/13 |
| Net Asset Value (NAV) | | | -$ | 0.91 | $ | 11.05 | $ | 11.96 |
| Distributions (3/1/13–2/28/14) | | | | | | | | |
| Dividend Income | $ | 0.4413 | | | | | | |
| Long-Term Capital Gain | $ | 0.0271 | | | | | | |
| Total | $ | 0.4684 | | | | | | |
| Class C (Symbol: FRFIX) | | | | Change | | 2/28/14 | | 2/28/13 |
| Net Asset Value (NAV) | | | -$ | 0.92 | $ | 11.25 | $ | 12.17 |
| Distributions (3/1/13–2/28/14) | | | | | | | | |
| Dividend Income | $ | 0.3789 | | | | | | |
| Long-Term Capital Gain | $ | 0.0271 | | | | | | |
| Total | $ | 0.4060 | | | | | | |
Annual Report | 21
Performance Summary (continued)
Performance
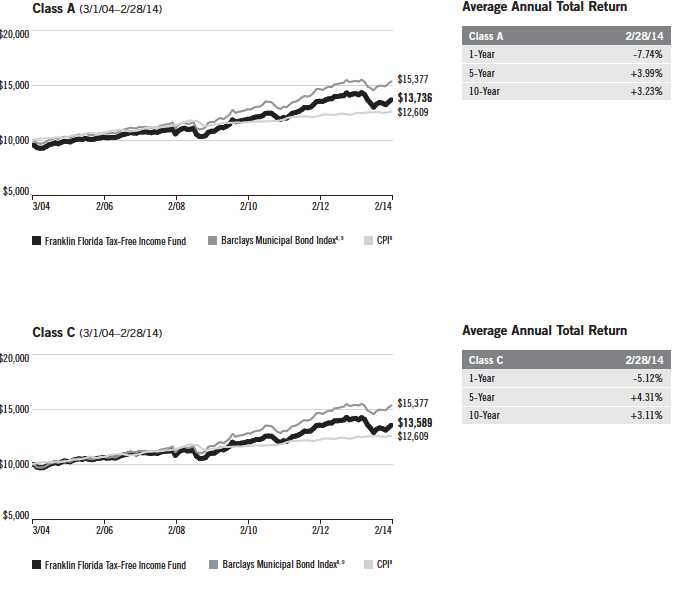
Cumulative total return excludes sales charges. Average annual total returns include maximum sales charges. Class A: 4.25% maximum initial sales charge; Class C: 1% contingent deferred sales charge in first year only.
| | | | | | | | | | |
| Class A | | | 1-Year | | | 5-Year | | | 10-Year | |
| Cumulative Total Return1 | | | -3.65 | % | + | 26.93 | % | + | 43.45 | % |
| Average Annual Total Return2 | | | -7.74 | % | + | 3.99 | % | + | 3.23 | % |
| Avg. Ann. Total Return (3/31/14)3 | | | -6.93 | % | + | 3.96 | % | + | 3.26 | % |
| Distribution Rate4 | 4.28 | % | | | | | | | | |
| Taxable Equivalent Distribution Rate5 | 7.56 | % | | | | | | | | |
| 30-Day Standardized Yield6 | 3.60 | % | | | | | | | | |
| Taxable Equivalent Yield5 | 6.36 | % | | | | | | | | |
| Total Annual Operating Expenses7 | 0.62 | % | | | | | | | | |
| Class C | | | 1-Year | | | 5-Year | | | 10-Year | |
| Cumulative Total Return1 | | | -4.19 | % | + | 23.47 | % | + | 35.89 | % |
| Average Annual Total Return2 | | | -5.12 | % | + | 4.31 | % | + | 3.11 | % |
| Avg. Ann. Total Return (3/31/14)3 | | | -4.17 | % | + | 4.29 | % | + | 3.15 | % |
| Distribution Rate4 | 3.87 | % | | | | | | | | |
| Taxable Equivalent Distribution Rate5 | 6.84 | % | | | | | | | | |
| 30-Day Standardized Yield6 | 3.22 | % | | | | | | | | |
| Taxable Equivalent Yield5 | 5.69 | % | | | | | | | | |
| Total Annual Operating Expenses7 | 1.17 | % | | | | | | | | |
Performance data represent past performance, which does not guarantee future results. Investment return and principal value will fluctuate, and you may have a gain or loss when you sell your shares. Current performance may differ from figures shown. For most recent month-end performance, go to franklintempleton.com or call (800) 342-5236.
22 | Annual Report
Performance Summary (continued)
Total Return Index Comparison for a Hypothetical $10,000 Investment
Total return represents the change in value of an investment over the periods shown. It includes any applicable maximum sales charge, Fund expenses, account fees and reinvested distributions. The unmanaged index includes reinvestment of any income or distributions. It differs from the Fund in composition and does not pay management fees or expenses. One cannot invest directly in an index.
Annual Report | 23
Performance Summary (continued)
All investments involve risks, including possible loss of principal. Because municipal bonds are sensitive to interest rate movements, the Fund’s yield and share price will fluctuate with market conditions. Bond prices generally move in the opposite direction of interest rates. Thus, as prices of bonds in the Fund adjust to a rise in interest rates, the Fund’s share price may decline. Because the Fund invests principally in a single state, it is subject to greater risk of adverse economic and regulatory changes in that state than a geographically diversified fund. The Fund holds a portion of its assets in Puerto Rico municipal bonds that have been impacted by recent adverse economic and market changes, which may cause the Fund’s share price to decline. Changes in the credit rating of a bond, or in the credit rating or financial strength of a bond’s issuer, insurer or guarantor, may affect the bond’s value. The Fund may invest a significant part of its assets in municipal securities that finance similar types of projects, such as utilities, hospitals, higher education and transportation. A change that affects one project would likely affect all similar projects, thereby increasing market risk. The Fund is actively managed but there is no guarantee that the manager’s investment decisions will produce the desired results. The Fund’s prospectus also includes a description of the main investment risks.
Class C: These shares have higher annual fees and expenses than Class A shares.
1. Cumulative total return represents the change in value of an investment over the periods indicated.
2. Average annual total return represents the average annual change in value of an investment over the periods indicated.
3. In accordance with SEC rules, we provide standardized average annual total return information through the latest calendar quarter.
4. Distribution rate is based on an annualization of the respective class’s February dividend and the maximum offering price (NAV for Class C) per
share on 2/28/14.
5. Taxable equivalent distribution rate and yield assume the 2014 maximum federal income tax rate of 39.60% plus 3.8% Medicare tax.
6. The 30-day standardized yield for the month ended 2/28/14 reflects an estimated yield to maturity (assuming all portfolio securities are held to
maturity). It should be regarded as an estimate of the Fund’s rate of investment income, and it may not equal the Fund’s actual income distribution
rate (which reflects the Fund’s past dividends paid to shareholders) or the income reported in the Fund’s financial statements.
7. Figures are as stated in the Fund’s current prospectus. In periods of market volatility, assets may decline significantly, causing total annual Fund
operating expenses to become higher than the figures shown.
8. Source: © 2014 Morningstar. The Barclays Municipal Bond Index is a market value-weighted index engineered for the long-term tax-exempt bond
market. To be included in the index, bonds must be fixed rate, have at least one year to final maturity and be rated investment grade (Baa3/BBB- or
higher) by at least two of the following agencies: Moody’s, Standard & Poor’s and Fitch. The Consumer Price Index (CPI), calculated by the Bureau of
Labor Statistics, is a commonly used measure of the inflation rate.
9. Source: Barclays Global Family of Indices. © 2014 Barclays Capital Inc. Used with permission.
24 | Annual Report
Your Fund’s Expenses
Franklin Florida Tax-Free Income Fund
As a Fund shareholder, you can incur two types of costs:
- Transaction costs, including sales charges (loads) on Fund purchases; and
- Ongoing Fund costs, including management fees, distribution and service (12b-1) fees, and other Fund expenses. All mutual funds have ongoing costs, sometimes referred to as operating expenses.
The following table shows ongoing costs of investing in the Fund and can help you understand these costs and compare them with those of other mutual funds. The table assumes a $1,000 investment held for the six months indicated.
Actual Fund Expenses
The first line (Actual) for each share class listed in the table provides actual account values and expenses. The “Ending Account Value” is derived from the Fund’s actual return, which includes the effect of Fund expenses.
You can estimate the expenses you paid during the period by following these steps. Of course, your account value and expenses will differ from those in this illustration:
| 1. | Divide your account value by $1,000. |
| | If an account had an $8,600 value, then $8,600 ÷ $1,000 = 8.6. |
| 2. | Multiply the result by the number under the heading “Expenses Paid During Period.” |
| | If Expenses Paid During Period were $7.50, then 8.6 x $7.50 = $64.50. |
In this illustration, the estimated expenses paid this period are $64.50.
Hypothetical Example for Comparison with Other Funds
Information in the second line (Hypothetical) for each class in the table can help you compare ongoing costs of investing in the Fund with those of other mutual funds. This information may not be used to estimate the actual ending account balance or expenses you paid during the period. The hypothetical “Ending Account Value” is based on the actual expense ratio for each class and an assumed 5% annual rate of return before expenses, which does not represent the Fund’s actual return. The figure under the heading “Expenses Paid During Period” shows the hypothetical expenses your account would have incurred under this scenario. You can compare this figure with the 5% hypothetical examples that appear in shareholder reports of other funds.
Annual Report | 25
Your Fund’s Expenses (continued)
Please note that expenses shown in the table are meant to highlight ongoing costs and do not reflect any transaction costs, such as sales charges. Therefore, the second line for each class is useful in comparing ongoing costs only, and will not help you compare total costs of owning different funds. In addition, if transaction costs were included, your total costs would have been higher. Please refer to the Fund prospectus for additional information on operating expenses.
| | | | | | |
| | | Beginning Account | | Ending Account | | Expenses Paid During |
| Class A | | Value 9/1/13 | | Value 2/28/14 | | Period* 9/1/13–2/28/14 |
| Actual | $ | 1,000 | $ | 1,006.40 | $ | 3.18 |
| Hypothetical (5% return before expenses) | $ | 1,000 | $ | 1,021.62 | $ | 3.21 |
| Class C | | | | | | |
| Actual | $ | 1,000 | $ | 1,011.90 | $ | 5.94 |
| Hypothetical (5% return before expenses) | $ | 1,000 | $ | 1,018.89 | $ | 5.96 |
*Expenses are calculated using the most recent six-month expense ratio, annualized for each class (A: 0.64%; and C: 1.19%), multiplied by the average account value over the period, multiplied by 181/365 to reflect the one-half year period.
26 | Annual Report
Franklin Georgia Tax-Free Income Fund
Your Fund’s Goal and Main Investments: Franklin Georgia Tax-Free Income Fund
seeks to provide as high a level of income exempt from federal and Georgia personal income taxes as is consistent with prudent investment management and preservation of capital by investing at least 80% of its total assets in securities that pay interest free from such taxes.1
Performance data represent past performance, which does not guarantee future results. Investment return and principal value will fluctuate, and you may have a gain or loss when you sell your shares. Current performance may differ from figures shown. Please visit franklintempleton.com or call (800) 342-5236 for most recent month-end performance.
This annual report for Franklin Georgia Tax-Free Income Fund covers the fiscal year ended February 28, 2014.
Performance Overview
The Fund’s Class A share price, as measured by net asset value, decreased from $12.80 on February 28, 2013, to $12.02 on February 28, 2014. The Fund’s Class A shares paid dividends totaling 45.61 cents per share for the same period.2 The Performance Summary beginning on page 31 shows that at the end of this reporting period the Fund’s Class A shares’ distribution rate was
The dollar value, number of shares or principal amount, and names of all portfolio holdings are listed in the Fund’s Statement of Investments (SOI). The SOI begins on page 106.
Annual Report | 27
| | |
| Dividend Distributions* | | |
| Franklin Georgia Tax-Free Income Fund | | |
| 3/1/13–2/28/14 | | |
| | Dividend per Share (cents) |
| Month | Class A | Class C |
| March | 3.72 | 3.12 |
| April | 3.72 | 3.12 |
| May | 3.62 | 3.02 |
| June | 3.62 | 3.04 |
| July | 3.62 | 3.04 |
| August | 3.77 | 3.19 |
| September | 3.87 | 3.34 |
| October | 3.97 | 3.44 |
| November | 3.97 | 3.44 |
| December | 3.91 | 3.38 |
| January | 3.91 | 3.38 |
| February | 3.91 | 3.38 |
| Total | 45.61 | 38.89 |
*Assumes shares were purchased and held for the entire accrual period. Since dividends accrue daily, your actual distributions will vary depending on the date you purchased your shares and any account activity. All Fund distributions will vary depending upon current market conditions, and past distributions are not indicative of future trends.
3.74% based on an annualization of the 3.91 cent per share February dividend and the maximum offering price of $12.55 on February 28, 2014. An investor in the 2014 maximum combined effective federal and Georgia personal income tax bracket of 47.02% (including 3.8% Medicare tax) would need to earn a distribution rate of 7.06% from a taxable investment to match the Fund’s Class A tax-free distribution rate. For the Fund’s Class C shares’ performance, please see the Performance Summary.
State Update
Georgia’s well-diversified economy grew during the period under review. The state’s housing market continued to recover, with home prices in the metropolitan Atlanta area showing strong annualized gains in December 2013. Although remaining near historical lows, issuance of new home construction permits improved, supporting solid job growth in the construction industry. For the 12-month period, the state added jobs in most sectors, with employment in leisure and hospitality; education and health care; business services; and transportation, warehousing and utilities exceeding prerecession levels. In February, Georgia’s unemployment rate declined to a five-year low of 7.1%, compared to the 6.7% national average.3
28 | Annual Report
The state concluded fiscal year 2013 with a surplus as it generated better-than-projected revenue growth. The enacted fiscal year 2014 budget, based on a relatively modest revenue growth estimate, incorporated the spending reductions implemented in fiscal year 2013 mid-year adjustments. It also incorporated funding improvements in Medicaid, higher education, K-12 schools and state retirement contributions. With its avoidance of using nonrecurring revenues, the enacted fiscal year 2014 budget is structurally balanced. Overall tax collections for the 2014 fiscal year-to-date in February were notably higher than for the same period in the previous year, resulting largely from strong individual income and corporate tax collections.
Georgia’s net tax-supported debt was 3.0% of personal income and $1,061 per capita, compared with the national medians of 2.8% and $1,074.4 Standard & Poor’s (S&P) rated Georgia’s general obligation debt AAA with a stable outlook, reflecting the independent credit rating agency’s view of the state’s recovering economy, strong financial monitoring and history of maintaining fiscal balance through spending cuts, a depleted but gradually growing revenue shortfall reserve, and moderate debt with rapid amortization.5 S&P’s concerns included the state’s higher-than-average unemployment rate and exposure to economic risks.
Manager’s Discussion
We used various investment strategies during the 12 months under review as we sought to maximize tax-free income for shareholders. Puerto Rico’s municipal bond market is widely traded because of its federal and state tax-exemption advantages. During the reporting period, some Puerto Rico issuers experienced a series of downgrades from S&P, Moody’s Investors Service and Fitch Ratings. In February 2014, these credit rating firms downgraded their respective ratings of Puerto Rico’s general obligation debt to below investment grade, along with the ratings of certain related Puerto Rico issuers. Additionally, each rating agency maintained a negative outlook on certain Puerto Rico issuers, and further downgrades are possible. The Fund is not required to sell securities that have been downgraded to below investment grade, but it is prohibited from making further purchases of such securities as long as the securities are not rated investment grade by at least one U.S. nationally recognized rating service. Rating actions combined with news related to the commonwealth’s financial position and future financing endeavors caused the Puerto Rico bond market to experience sharp declines in the latter half of 2013 and contrasting positive performance year-to-date in 2014.
| | |
| Portfolio Breakdown | | |
| Franklin Georgia Tax-Free Income Fund | |
| 2/28/14 | | |
| % of Total | |
| Long-Term Investments* | |
| Utilities | 25.5 | % |
| Subject to Government Appropriations | 18.6 | % |
| Hospital & Health Care | 16.8 | % |
| General Obligation | 9.4 | % |
| Higher Education | 9.3 | % |
| Transportation | 7.0 | % |
| Tax-Supported | 6.6 | % |
| Refunded | 3.8 | % |
| Housing | 2.4 | % |
| Other Revenue | 0.3 | % |
| Corporate-Backed | 0.3 | % |
| |
| *Does not include short-term investments and other | |
| net assets. | | |
Annual Report | 29
Thank you for your continued participation in Franklin Georgia Tax-Free Income Fund. We believe our conservative, buy-and-hold investment strategy can help us achieve high, current, tax-free income for shareholders.
The foregoing information reflects our analysis, opinions and portfolio holdings as of February 28, 2014, the end
of the reporting period. The way we implement our main investment strategies and the resulting portfolio holdings
may change depending on factors such as market and economic conditions. These opinions may not be relied
upon as investment advice or an offer for a particular security. The information is not a complete analysis of
every aspect of any market, state, industry, security or the Fund. Statements of fact are from sources considered
reliable, but the investment manager makes no representation or warranty as to their completeness or accuracy.
Although historical performance is no guarantee of future results, these insights may help you understand our
investment management philosophy.
1. For investors subject to alternative minimum tax, a small portion of Fund dividends may be taxable. Distributions
of capital gains are generally taxable. To avoid imposition of 28% backup withholding on all Fund distributions and
redemption proceeds, U.S. investors must be properly certified on Form W-9 and non-U.S. investors on Form W-8BEN.
2. All Fund distributions will vary depending upon current market conditions, and past distributions are not indicative
of future trends.
3. Source: Bureau of Labor Statistics.
4. Source: Moody’s Investors Service, “2013 State Debt Medians Report,” 5/29/13.
5. This does not indicate S&P’s rating of the Fund.
30 | Annual Report
Performance Summary as of 2/28/14
Franklin Georgia Tax-Free Income Fund
Your dividend income will vary depending on dividends or interest paid by securities in the Fund’s portfolio, adjusted for operating expenses of each class. Capital gain distributions are net profits realized from the sale of portfolio securities. The performance table and graphs do not reflect any taxes that a shareholder would pay on Fund dividends, capital gain distributions, if any, or any realized gains on the sale of Fund shares. Total return reflects reinvestment of the Fund’s dividends and capital gain distributions, if any, and any unrealized gains or losses.
| | | | | | | | |
| Price and Distribution Information | | | | | | |
| Class A (Symbol: FTGAX) | | | | Change | | 2/28/14 | | 2/28/13 |
| Net Asset Value (NAV) | | | -$ | 0.78 | $ | 12.02 | $ | 12.80 |
| Distributions (3/1/13–2/28/14) | | | | | | | | |
| Dividend Income | $ | 0.4561 | | | | | | |
| Class C (Symbol: FGAIX) | | | | Change | | 2/28/14 | | 2/28/13 |
| Net Asset Value (NAV) | | | -$ | 0.79 | $ | 12.17 | $ | 12.96 |
| Distributions (3/1/13–2/28/14) | | | | | | | | |
| Dividend Income | $ | 0.3889 | | | | | | |
Performance
Cumulative total return excludes sales charges. Average annual total returns include maximum sales charges. Class A: 4.25% maximum initial sales charge; Class C: 1% contingent deferred sales charge in first year only.
| | | | | | | | | | |
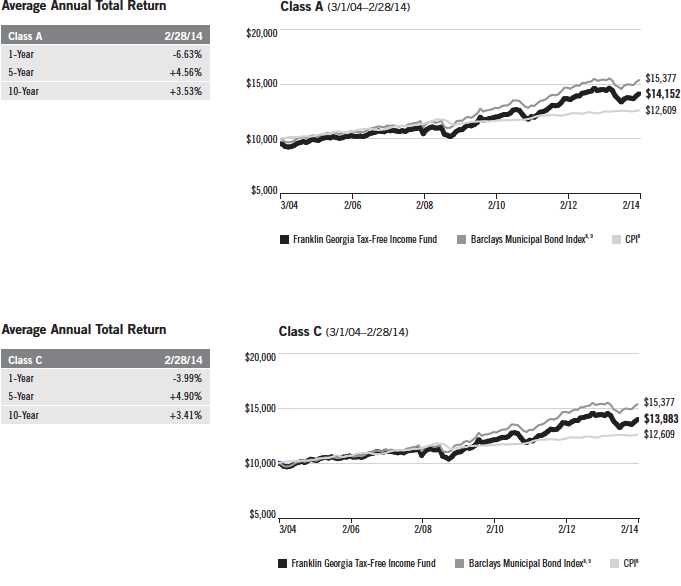
| Class A | | | 1-Year | | | 5-Year | | | 10-Year | |
| Cumulative Total Return1 | | | -2.47 | % | + | 30.51 | % | + | 47.74 | % |
| Average Annual Total Return2 | | | -6.63 | % | + | 4.56 | % | + | 3.53 | % |
| Avg. Ann. Total Return (3/31/14)3 | | | -5.68 | % | + | 4.61 | % | + | 3.60 | % |
| Distribution Rate4 | 3.74 | % | | | | | | | | |
| Taxable Equivalent Distribution Rate5 | 7.06 | % | | | | | | | | |
| 30-Day Standardized Yield6 | 3.07 | % | | | | | | | | |
| Taxable Equivalent Yield5 | 5.80 | % | | | | | | | | |
| Total Annual Operating Expenses7 | 0.66 | % | | | | | | | | |
| Class C | | | 1-Year | | | 5-Year | | | 10-Year | |
| Cumulative Total Return1 | | | -3.06 | % | + | 27.02 | % | + | 39.83 | % |
| Average Annual Total Return2 | | | -3.99 | % | + | 4.90 | % | + | 3.41 | % |
| Avg. Ann. Total Return (3/31/14)3 | | | -2.98 | % | + | 4.95 | % | + | 3.49 | % |
| Distribution Rate4 | 3.33 | % | | | | | | | | |
| Taxable Equivalent Distribution Rate5 | 6.29 | % | | | | | | | | |
| 30-Day Standardized Yield6 | 2.67 | % | | | | | | | | |
| Taxable Equivalent Yield5 | 5.04 | % | | | | | | | | |
| Total Annual Operating Expenses7 | 1.21 | % | | | | | | | | |
Performance data represent past performance, which does not guarantee future results. Investment return and principal value will fluctuate, and you may have a gain or loss when you sell your shares. Current performance may differ from figures shown. For most recent month-end performance, go to franklintempleton.com or call (800) 342-5236.
Annual Report | 31
Performance Summary (continued)
Total Return Index Comparison for a Hypothetical $10,000 Investment
Total return represents the change in value of an investment over the periods shown. It includes any applicable maximum sales charge, Fund expenses, account fees and reinvested distributions. The unmanaged index includes reinvestment of any income or distributions. It differs from the Fund in composition and does not pay management fees or expenses. One cannot invest directly in an index.
32 | Annual Report
Performance Summary (continued)
All investments involve risks, including possible loss of principal. Because municipal bonds are sensitive to interest rate movements, the Fund’s yield and share price will fluctuate with market conditions. Bond prices generally move in the opposite direction of interest rates. Thus, as prices of bonds in the Fund adjust to a rise in interest rates, the Fund’s share price may decline. Because the Fund invests principally in a single state, it is subject to greater risk of adverse economic and regulatory changes in that state than a geographically diversified fund. The Fund holds a small portion of its assets in Puerto Rico municipal bonds that have been impacted by recent adverse economic and market changes, which may cause the Fund’s share price to decline. Changes in the credit rating of a bond, or in the credit rating or financial strength of a bond’s issuer, insurer or guarantor, may affect the bond’s value. The Fund may invest a significant part of its assets in municipal securities that finance similar types of projects, such as utilities, hospitals, higher education and transportation. A change that affects one project would likely affect all similar projects, thereby increasing market risk. The Fund is actively managed but there is no guarantee that the manager’s investment decisions will produce the desired results. The Fund’s prospectus also includes a description of the main investment risks.
Class C: These shares have higher annual fees and expenses than Class A shares.
1. Cumulative total return represents the change in value of an investment over the periods indicated.
2. Average annual total return represents the average annual change in value of an investment over the periods indicated.
3. In accordance with SEC rules, we provide standardized average annual total return information through the latest calendar quarter.
4. Distribution rate is based on an annualization of the respective class’s February dividend and the maximum offering price (NAV for Class C) per
share on 2/28/14.
5. Taxable equivalent distribution rate and yield assume the published rates as of 12/18/13 for the maximum combined effective federal and Georgia
personal income tax rate of 47.02%, based on the federal income tax rate of 39.60% plus 3.8% Medicare tax.
6. The 30-day standardized yield for the month ended 2/28/14 reflects an estimated yield to maturity (assuming all portfolio securities are held to
maturity). It should be regarded as an estimate of the Fund’s rate of investment income, and it may not equal the Fund’s actual income distribution
rate (which reflects the Fund’s past dividends paid to shareholders) or the income reported in the Fund’s financial statements.
7. Figures are as stated in the Fund’s current prospectus. In periods of market volatility, assets may decline significantly, causing total annual Fund
operating expenses to become higher than the figures shown.
8. Source: © 2014 Morningstar. The Barclays Municipal Bond Index is a market value-weighted index engineered for the long-term tax-exempt bond
market. To be included in the index, bonds must be fixed rate, have at least one year to final maturity and be rated investment grade (Baa3/BBB- or
higher) by at least two of the following agencies: Moody’s, Standard & Poor’s and Fitch. The Consumer Price Index (CPI), calculated by the Bureau of
Labor Statistics, is a commonly used measure of the inflation rate.
9. Source: Barclays Global Family of Indices. © 2014 Barclays Capital Inc. Used with permission.
Annual Report | 33
Your Fund’s Expenses
Franklin Georgia Tax-Free Income Fund
As a Fund shareholder, you can incur two types of costs:
- Transaction costs, including sales charges (loads) on Fund purchases; and
- Ongoing Fund costs, including management fees, distribution and service (12b-1) fees, and other Fund expenses. All mutual funds have ongoing costs, sometimes referred to as operating expenses.
The following table shows ongoing costs of investing in the Fund and can help you understand these costs and compare them with those of other mutual funds. The table assumes a $1,000 investment held for the six months indicated.
Actual Fund Expenses
The first line (Actual) for each share class listed in the table provides actual account values and expenses. The “Ending Account Value” is derived from the Fund’s actual return, which includes the effect of Fund expenses.
You can estimate the expenses you paid during the period by following these steps. Of course, your account value and expenses will differ from those in this illustration:
| 1. | Divide your account value by $1,000. |
| | If an account had an $8,600 value, then $8,600 ÷ $1,000 = 8.6. |
| 2. | Multiply the result by the number under the heading “Expenses Paid During Period.” |
| | If Expenses Paid During Period were $7.50, then 8.6 x $7.50 = $64.50. |
In this illustration, the estimated expenses paid this period are $64.50.
Hypothetical Example for Comparison with Other Funds
Information in the second line (Hypothetical) for each class in the table can help you compare ongoing costs of investing in the Fund with those of other mutual funds. This information may not be used to estimate the actual ending account balance or expenses you paid during the period. The hypothetical “Ending Account Value” is based on the actual expense ratio for each class and an assumed 5% annual rate of return before expenses, which does not represent the Fund’s actual return. The figure under the heading “Expenses Paid During Period” shows the hypothetical expenses your account would have incurred under this scenario. You can compare this figure with the 5% hypothetical examples that appear in shareholder reports of other funds.
34 | Annual Report
Your Fund’s Expenses (continued)
Please note that expenses shown in the table are meant to highlight ongoing costs and do not reflect any transaction costs, such as sales charges. Therefore, the second line for each class is useful in comparing ongoing costs only, and will not help you compare total costs of owning different funds. In addition, if transaction costs were included, your total costs would have been higher. Please refer to the Fund prospectus for additional information on operating expenses.
| | | | | | |
| | | Beginning Account | | Ending Account | | Expenses Paid During |
| Class A | | Value 9/1/13 | | Value 2/28/14 | | Period* 9/1/13–2/28/14 |
| Actual | $ | 1,000 | $ | 1,060.60 | $ | 3.47 |
| Hypothetical (5% return before expenses) | $ | 1,000 | $ | 1,021.42 | $ | 3.41 |
| Class C | | | | | | |
| Actual | $ | 1,000 | $ | 1,058.00 | $ | 6.28 |
| Hypothetical (5% return before expenses) | $ | 1,000 | $ | 1,018.70 | $ | 6.16 |
*Expenses are calculated using the most recent six-month expense ratio, annualized for each class (A: 0.68% and C: 1.23%), multiplied by the average account value over the period, multiplied by 181/365 to reflect the one-half year period.
Annual Report | 35
Franklin Kentucky Tax-Free Income Fund
Your Fund’s Goal and Main Investments: Franklin Kentucky Tax-Free Income Fund seeks to provide as high a level of income exempt from federal and Kentucky personal income taxes as is consistent with prudent investment management and preservation of capital by investing at least 80% of its total assets in securities that pay interest free from such taxes.1
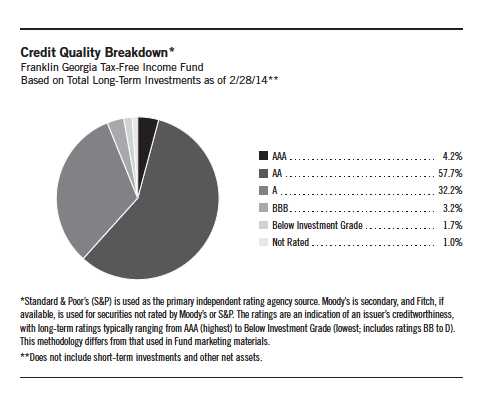
Credit Quality Breakdown*
Franklin Kentucky Tax-Free Income Fund
Based on Total Long-Term Investments as of 2/28/14**
Performance data represent past performance, which does not guarantee future results. Investment return and principal value will fluctuate, and you may have a gain or loss when you sell your shares. Current performance may differ from figures shown. Please visit franklintempleton.com or call (800) 342-5236 for most recent month-end performance.
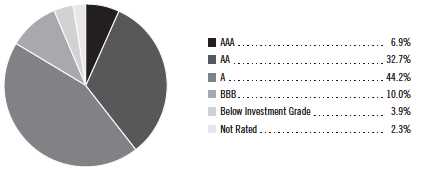
*Standard & Poor’s (S&P) is used as the primary independent rating agency source. Moody’s is secondary, and Fitch, if available, is used for securities not rated by Moody’s or S&P. The ratings are an indication of an issuer’s creditworthiness, with long-term ratings typically ranging from AAA (highest) to Below Investment Grade (lowest; includes ratings BB to D). This methodology differs from that used in Fund marketing materials.
**Does not include short-term investments and other net assets.
This annual report for Franklin Kentucky Tax-Free Income Fund covers the fiscal year ended February 28, 2014.
Performance Overview
The Fund’s Class A share price, as measured by net asset value, decreased from $11.86 on February 28, 2013, to $11.12 on February 28, 2014. The Fund’s Class A shares paid dividends totaling 41.57 cents per share for the same period.2 The Performance Summary beginning on page 39 shows that at the end of this reporting period the Fund’s Class A shares’ distribution rate
The dollar value, number of shares or principal amount, and names of all portfolio holdings are listed in the Fund’s Statement of Investments (SOI). The SOI begins on page 112.
36 | Annual Report
was 3.77%. An investor in the 2014 maximum combined effective federal and Kentucky personal income tax bracket of 47.02% (including 3.8% Medicare tax) would need to earn a distribution rate of 7.12% from a taxable investment to match the Fund’s Class A tax-free distribution rate.
Commonwealth Update
During the period under review, Kentucky’s economic recovery lagged the nation’s, partly because of weak job and personal income growth. The real estate market continued to recover as Louisville experienced the highest home sales volume since 2006 and low inventory drove home prices higher. Despite the expansion of automobile manufacturers in Kentucky, the manufacturing sector lost jobs because of weakness in the nondurables segment. For the 12-month period, only four sectors added jobs — government, other services, leisure and hospitality, and education and health services. Kentucky’s unemployment rate declined from 8.2% in February 2013 to 7.8% at period-end, which remained higher than the 6.7% national average.3
The commonwealth ended fiscal year 2013 with a budget surplus resulting from higher-than-projected revenue, driven largely by strong individual income tax collections. After 14 consecutive quarters of year-over-year growth, however, revenue collections declined in fiscal year 2014’s second quarter, largely because of weak property, corporation, coal severance and cigarette tax collections. Despite some revenue volatility, Kentucky’s budget director indicated that overall receipts through February remained on track to meet the projected revenue. The slow recovery in property taxes, softer profitability of certain companies reinvesting in production and the weaker sales tax base led the commonwealth to project modest revenue growth for fiscal years 2015 and 2016. To bridge an estimated budget gap for the 2015–2016 biennium, the governor recommended spending cuts and use of one-time measures rather than tax increases.
Kentucky’s net tax-supported debt was 5.9% of personal income and $1,998 per capita, compared with the national medians of 2.8% and $1,074.4 Moody’s Investors Service assigned Kentucky an issuer rating of Aa2, reflecting the independent credit rating agency’s assessment that the commonwealth was showing signs of revenue improvement and has a history of closely monitoring revenue and responding to shortfalls.5 However, Moody’s maintained a negative outlook, citing the commonwealth’s depleted reserves, reliance on one-time measures during economic downturns, low per-capita income, high debt ratios, weak pension funding and tendency to borrow to cover the costs of teacher retiree health benefits.
Dividend Distributions*
Franklin Kentucky Tax-Free Income Fund
Class A
3/1/13–2/28/14
| |
| | Dividend per Share |
| Month | (cents) |
| March | 3.38 |
| April | 3.38 |
| May | 3.38 |
| June | 3.38 |
| July | 3.38 |
| August | 3.43 |
| September | 3.48 |
| October | 3.48 |
| November | 3.48 |
| December | 3.55 |
| January | 3.60 |
| February | 3.65 |
| Total | 41.57 |
*Assumes shares were purchased and held for the entire accrual period. Since dividends accrue daily, your actual distributions will vary depending on the date you purchased your shares and any account activity. All Fund distributions will vary depending upon current market conditions, and past distributions are not indicative of future trends.
Annual Report | 37
Portfolio Breakdown*
Franklin Kentucky Tax-Free Income Fund
2/28/14
| | |
| % of Total | |
| Long-Term Investments* | |
| Utilities | 29.8 | % |
| Hospital & Health Care | 20.2 | % |
| Subject to Government Appropriations | 14.9 | % |
| General Obligation | 9.6 | % |
| Higher Education | 7.5 | % |
| Transportation | 5.2 | % |
| Housing | 4.0 | % |
| Refunded | 3.4 | % |
| Other Revenue | 3.0 | % |
| Tax-Supported | 2.4 | % |
| |
| *Does not include short-term investments and other | |
| net assets. | | |
Manager’s Discussion
We used various investment strategies during the 12 months under review as we sought to maximize tax-free income for shareholders. Puerto Rico’s municipal bond market is widely traded because of its federal and state tax-exemption advantages. During the reporting period, some Puerto Rico issuers experienced a series of downgrades from Standard & Poor’s, Moody’s and Fitch Ratings. In February 2014, these credit rating firms downgraded their respective ratings of Puerto Rico’s general obligation debt to below investment grade, along with the ratings of certain related Puerto Rico issuers. Additionally, each rating agency maintained a negative outlook on certain Puerto Rico issuers, and further downgrades are possible. The Fund is not required to sell securities that have been downgraded to below investment grade, but it is prohibited from making further purchases of such securities as long as the securities are not rated investment grade by at least one U.S. nationally recognized rating service. Rating actions combined with news related to Puerto Rico’s financial position and future financing endeavors caused its bond market to experience sharp declines in the latter half of 2013 and contrasting positive performance year-to-date in 2014.
Thank you for your continued participation in Franklin Kentucky Tax-Free Income Fund. We believe our conservative, buy-and-hold investment strategy can help us achieve high, current, tax-free income for shareholders.
The foregoing information reflects our analysis, opinions and portfolio holdings as of February 28, 2014, the end of the reporting period. The way we implement our main investment strategies and the resulting portfolio holdings may change depending on factors such as market and economic conditions. These opinions may not be relied upon as investment advice or an offer for a particular security. The information is not a complete analysis of every aspect of any market, state, industry, security or the Fund. Statements of fact are from sources considered reliable, but the investment manager makes no representation or warranty as to their completeness or accuracy. Although historical performance is no guarantee of future results, these insights may help you understand our investment management philosophy.
1. For investors subject to alternative minimum tax, a small portion of Fund dividends may be taxable. Distributions of capital gains are generally taxable. To avoid imposition of 28% backup withholding on all Fund distributions and redemption proceeds, U.S. investors must be properly certified on Form W-9 and non-U.S. investors on Form W-8BEN.
2. All Fund distributions will vary depending upon current market conditions, and past distributions are not indicative of future trends.
3. Source: Bureau of Labor Statistics.
4. Source: Moody’s Investors Service, “2013 State Debt Medians Report,” 5/29/13.
5. This does not indicate Moody’s rating of the Fund.
38 | Annual Report
Performance Summary as of 2/28/14
Franklin Kentucky Tax-Free Income Fund
Your dividend income will vary depending on dividends or interest paid by securities in the Fund’s portfolio, adjusted for operating expenses. Capital gain distributions are net profits realized from the sale of portfolio securities. The performance table and graph do not reflect any taxes that a shareholder would pay on Fund dividends, capital gain distributions, if any, or any realized gains on the sale of Fund shares. Total return reflects reinvestment of the Fund’s dividends and capital gain distributions, if any, and any unrealized gains or losses.
| | | | | | | | |
| Price and Distribution Information | | | | | | |
| Class A (Symbol: FRKYX) | | | | Change | | 2/28/14 | | 2/28/13 |
| Net Asset Value (NAV) | | | -$ | 0.74 | $ | 11.12 | $ | 11.86 |
| Distributions (3/1/13–2/28/14) | | | | | | | | |
| Dividend Income | $ | 0.4157 | | | | | | |
Performance
Cumulative total return excludes the sales charge. Average annual total returns include the maximum sales charge.
Class A: 4.25% maximum initial sales charge.
| | | | | | | | | | |
| Class A | | | 1-Year | | | 5-Year | | | 10-Year | |
| Cumulative Total Return1 | | | -2.70 | % | + | 29.13 | % | + | 45.05 | % |
| Average Annual Total Return2 | | | -6.86 | % | + | 4.33 | % | + | 3.34 | % |
| Avg. Ann. Total Return (3/31/14)3 | | | -6.15 | % | + | 4.25 | % | + | 3.37 | % |
| Distribution Rate4 | 3.77 | % | | | | | | | | |
| Taxable Equivalent Distribution Rate5 | 7.12 | % | | | | | | | | |
| 30-Day Standardized Yield6 | 3.16 | % | | | | | | | | |
| Taxable Equivalent Yield5 | 5.96 | % | | | | | | | | |
| Total Annual Operating Expenses7 | 0.74 | % | | | | | | | | |
Performance data represent past performance, which does not guarantee future results. Investment return and principal value will fluctuate, and you may have a gain or loss when you sell your shares. Current performance may differ from figures shown. For most recent month-end performance, go to franklintempleton.com or call (800) 342-5236.
Annual Report | 39
Performance Summary (continued)
Total Return Index Comparison for a Hypothetical $10,000 Investment
Total return represents the change in value of an investment over the periods shown. It includes the maximum sales charge, Fund expenses, account fees and reinvested distributions. The unmanaged index includes reinvestment of any income or distributions. It differs from the Fund in composition and does not pay management fees or expenses. One cannot invest directly in an index.
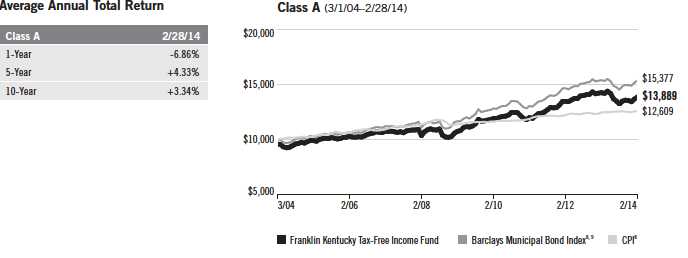
All investments involve risks, including possible loss of principal. Because municipal bonds are sensitive to interest rate movements, the Fund’s yield and share price will fluctuate with market conditions. Bond prices generally move in the opposite direction of interest rates. Thus, as prices of bonds in the Fund adjust to a rise in interest rates, the Fund’s share price may decline. Because the Fund invests principally in a single state, it is subject to greater risk of adverse economic and regulatory changes in that state than a geographically diversified fund. The Fund holds a small portion of its assets in Puerto Rico municipal bonds that have been impacted by recent adverse economic and market changes, which may cause the Fund’s share price to decline. Changes in the credit rating of a bond, or in the credit rating or financial strength of a bond’s issuer, insurer or guarantor, may affect the bond’s value. The Fund may invest a significant part of its assets in municipal securities that finance similar types of projects, such as utilities, hospitals, higher education and transportation. A change that affects one project would likely affect all similar projects, thereby increasing market risk. The Fund is actively managed but there is no guarantee that the manager’s investment decisions will produce the desired results. The Fund’s prospectus also includes a description of the main investment risks.
1. Cumulative total return represents the change in value of an investment over the periods indicated.
2. Average annual total return represents the average annual change in value of an investment over the periods indicated.
3. In accordance with SEC rules, we provide standardized average annual total return information through the latest calendar quarter.
4. Distribution rate is based on an annualization of the 3.65 cent per share February dividend and the maximum offering price of $11.61 per share on 2/28/14.
5. Taxable equivalent distribution rate and yield assume the published rates as of 12/18/13 for the maximum combined effective federal and Kentucky personal income tax rate of 47.02%, based on the federal income tax rate of 39.60% plus 3.8% Medicare tax.
6. The 30-day standardized yield for the month ended 2/28/14 reflects an estimated yield to maturity (assuming all portfolio securities are held to maturity). It should be regarded as an estimate of the Fund’s rate of investment income, and it may not equal the Fund’s actual income distribution rate (which reflects the Fund’s past dividends paid to shareholders) or the income reported in the Fund’s financial statements.
7. Figures are as stated in the Fund’s current prospectus. In periods of market volatility, assets may decline significantly, causing total annual Fund operating expenses to become higher than the figures shown.
8. Source: © 2014 Morningstar. The Barclays Municipal Bond Index is a market value-weighted index engineered for the long-term tax-exempt bond market. To be included in the index, bonds must be fixed rate, have at least one year to final maturity and be rated investment grade (Baa3/BBB- or higher) by at least two of the following agencies: Moody’s, Standard & Poor’s and Fitch. The Consumer Price Index (CPI), calculated by the Bureau of Labor Statistics, is a commonly used measure of the inflation rate.
9. Source: Barclays Global Family of Indices. © 2014 Barclays Capital Inc. Used with permission.
40 | Annual Report
Your Fund’s Expenses
Franklin Kentucky Tax-Free Income Fund
As a Fund shareholder, you can incur two types of costs:
- Transaction costs, including sales charges (loads) on Fund purchases; and
- Ongoing Fund costs, including management fees, distribution and service (12b-1) fees, and other Fund expenses. All mutual funds have ongoing costs, sometimes referred to as operating expenses.
The following table shows ongoing costs of investing in the Fund and can help you understand these costs and compare them with those of other mutual funds. The table assumes a $1,000 investment held for the six months indicated.
Actual Fund Expenses
The first line (Actual) for each share class listed in the table provides actual account values and expenses. The “Ending Account Value” is derived from the Fund’s actual return, which includes the effect of Fund expenses.
You can estimate the expenses you paid during the period by following these steps. Of course, your account value and expenses will differ from those in this illustration:
| 1. | Divide your account value by $1,000. |
| | If an account had an $8,600 value, then $8,600 ÷ $1,000 = 8.6. |
| 2. | Multiply the result by the number under the heading “Expenses Paid During Period.” |
| | If Expenses Paid During Period were $7.50, then 8.6 x $7.50 = $64.50. |
In this illustration, the estimated expenses paid this period are $64.50.
Hypothetical Example for Comparison with Other Funds
Information in the second line (Hypothetical) for each class in the table can help you compare ongoing costs of investing in the Fund with those of other mutual funds. This information may not be used to estimate the actual ending account balance or expenses you paid during the period. The hypothetical “Ending Account Value” is based on the actual expense ratio for each class and an assumed 5% annual rate of return before expenses, which does not represent the Fund’s actual return. The figure under the heading “Expenses Paid During Period” shows the hypothetical expenses your account would have incurred under this scenario. You can compare this figure with the 5% hypothetical examples that appear in shareholder reports of other funds.
Annual Report | 41
Your Fund’s Expenses (continued)
Please note that expenses shown in the table are meant to highlight ongoing costs and do not reflect any transaction costs, such as sales charges. Therefore, the second line for each class is useful in comparing ongoing costs only, and will not help you compare total costs of owning different funds. In addition, if transaction costs were included, your total costs would have been higher. Please refer to the Fund prospectus for additional information on operating expenses.
| | | | | | |
| | | Beginning Account | | Ending Account | | Expenses Paid During |
| Class A | | Value 9/1/13 | | Value 2/28/14 | | Period* 9/1/13–2/28/14 |
| Actual | $ | 1,000 | $ | 1,049.70 | $ | 3.96 |
| Hypothetical (5% return before expenses) | $ | 1,000 | $ | 1,020.93 | $ | 3.91 |
*Expenses are calculated using the most recent six-month annualized expense ratio of 0.78%, multiplied by the average account value over the period, multiplied by 181/365 to reflect the one-half year period.
42 | Annual Report
Franklin Louisiana Tax-Free Income Fund
Your Fund’s Goal and Main Investments: Franklin Louisiana Tax-Free Income Fund seeks to provide as high a level of income exempt from federal and Louisiana personal income taxes as is consistent with prudent investment management and preservation of capital by investing at least 80% of its total assets in securities that pay interest free from such taxes.1
|
| Performance data represent |
| past performance, which does |
| not guarantee future results. |
| Investment return and principal |
| value will fluctuate, and you may |
| have a gain or loss when you sell |
| your shares. Current performance |
| may differ from figures shown. |
| Please visit franklintempleton.com |
| or call (800) 342-5236 for most |
| recent month-end performance. |
| | |
| Credit Quality Breakdown* | | |
| Franklin Louisiana Tax-Free Income Fund | | |
| 2/28/14 | | |
| | % of Total | |
| Ratings | Long-Term Investments** | |
| AAA | 1.8 | % |
| AA | 38.7 | % |
| A | 43.0 | % |
| BBB | 13.6 | % |
| Below Investment Grade | 0.1 | % |
| Not Rated | 2.8 | % |
*Standard & Poor’s (S&P) is used as the primary independent rating agency source. Moody’s is secondary, and Fitch, if available, is used for securities not rated by Moody’s or S&P. The ratings are an indication of an issue’s creditworthiness, with long-term ratings typically ranging from AAA (highest) to Below Investment Grade (lowest; includes ratings BB to D). This methodology differs from that used in Fund marketing materials.
**Does not include short-term investments and other net assets.
This annual report for Franklin Louisiana Tax-Free Income Fund covers the fiscal year ended February 28, 2014.
Performance Overview
The Fund’s Class A share price, as measured by net asset value, decreased from $12.04 on February 28, 2013, to $11.26 on February 28, 2014. The Fund’s Class A shares paid dividends totaling 42.57 cents per share for the same period.2 The Performance Summary beginning on page 47 shows that at the end of this reporting period the Fund’s Class A shares’ distribution rate was
The dollar value, number of shares or principal amount, and names of all portfolio holdings are listed in the Fund’s Statement of Investments (SOI). The SOI begins on page 117.
Annual Report | 43
| | |
| Dividend Distributions* | | |
| Franklin Louisiana Tax-Free Income Fund | | |
| 3/1/13–2/28/14 | | |
| | Dividend per Share (cents) |
| Month | Class A | Class C |
| March | 3.38 | 2.81 |
| April | 3.38 | 2.81 |
| May | 3.38 | 2.81 |
| June | 3.38 | 2.83 |
| July | 3.38 | 2.83 |
| August | 3.48 | 2.93 |
| September | 3.55 | 3.06 |
| October | 3.65 | 3.16 |
| November | 3.69 | 3.20 |
| December | 3.69 | 3.21 |
| January | 3.78 | 3.30 |
| February | 3.83 | 3.35 |
| Total | 42.57 | 36.30 |
*Assumes shares were purchased and held for the entire accrual period. Since dividends accrue daily, your actual distributions will vary depending on the date you purchased your shares and any account activity. All Fund distributions will vary depending upon current market conditions, and past distributions are not indicative of future trends.
3.91% based on an annualization of the 3.83 cent per share February dividend and the maximum offering price of $11.76 on February 28, 2014. An investor in the 2014 maximum combined effective federal and Louisiana personal income tax bracket of 47.02% (including 3.8% Medicare tax) would need to earn a distribution rate of 7.38% from a taxable investment to match the Fund’s Class A tax-free distribution rate. For the Fund’s Class C shares’ performance, please see the Performance Summary.
State Update
Louisiana experienced a solid economic recovery during the period under review as it continued to record steady year-over-year job growth. The state’s incentives to promote business expansion and attract new businesses helped diversify the state’s resource-based economy. Although Louisiana’s per-capita personal income continued to lag the nation’s, it has improved in recent years as the state targeted higher paying industries. For the 12-month period, most employment sectors added jobs, led by leisure and hospitality, financial activities, and education and health services. In February, the state’s unemployment rate declined to a five-year low of 4.5%, remaining lower than the 6.7% national average.3
44 | Annual Report
The state ended fiscal year 2013 with a lower budget stabilization fund (BSF) than in fiscal year 2012, as it drew from its BSF because of reduced hurricane-related federal match and federal stimulus revenues. The proposed fiscal year 2015 budget is smaller than the enacted fiscal year 2014 budget, resulting largely from reduced federal funding as disaster and coastal recovery programs wound down. To help offset the overall revenue decline, the governor’s executive budget proposal included a recommendation to eliminate about 1,100 mostly vacant authorized positions. Despite the proposed budget reduction, the general fund portion is slightly bigger, based on higher projected sales and income tax revenues for 2015. The proposed budget also included recommendations for increased general fund spending in higher education, salary increases for certain state employees and a larger BSF contribution.
Louisiana’s net tax-supported debt was 3.7% of personal income and $1,411 per capita, compared with the national medians of 2.8% and $1,074.4 Standard & Poor’s (S&P) rated Louisiana’s general obligation debt AA with a stable outlook, reflecting the independent credit rating agency’s view of the state’s improving population and economic growth, strong governmental framework, healthy liquidity position, financial flexibility and moderate debt service.5 According to S&P, these strengths were somewhat tempered by the state’s continued reliance on fluctuating energy sector revenue, recent general fund operating deficits, reduced operating reserves, and low funding ratios for pension and other postemployment benefits.
Manager’s Discussion
We used various investment strategies during the 12 months under review as we sought to maximize tax-free income for shareholders. Puerto Rico’s municipal bond market is widely traded because of its federal and state tax-exemption advantages. During the reporting period, some Puerto Rico issuers experienced a series of downgrades from S&P, Moody’s Investors Service and Fitch Ratings. In February 2014, these credit rating firms downgraded their respective ratings of Puerto Rico’s general obligation debt to below investment grade, along with the ratings of certain related Puerto Rico issuers. Additionally, each rating agency maintained a negative outlook on certain Puerto Rico issuers, and further downgrades are possible. The Fund is not required to sell securities that have been downgraded to below investment grade, but it is prohibited from making further purchases of such securities as long as the securities are not rated investment grade by at least one U.S. nationally recognized rating service. Rating actions combined with news related to the commonwealth’s financial position and future financing endeavors caused the Puerto Rico bond market to experience sharp declines in the latter half of 2013 and contrasting positive performance year-to-date in 2014.
Portfolio Breakdown*
Franklin Louisiana Tax-Free Income Fund
2/28/14
| | |
| % of Total | |
| Long-Term Investments* | |
| Tax-Supported | 20.6 | % |
| Utilities | 19.1 | % |
| Hospital & Health Care | 10.5 | % |
| Higher Education | 9.9 | % |
| Refunded | 8.0 | % |
| Subject to Government Appropriations | 7.4 | % |
| Transportation | 7.1 | % |
| Other Revenue | 7.0 | % |
| General Obligation | 6.1 | % |
| Housing | 2.9 | % |
| Corporate-Backed | 1.4 | % |
*Does not include short-term investments and other net assets.
Annual Report | 45
Thank you for your continued participation in Franklin Louisiana Tax-Free Income Fund. We believe our conservative, buy-and-hold investment strategy can help us achieve high, current, tax-free income for shareholders.
The foregoing information reflects our analysis, opinions and portfolio holdings as of February 28, 2014, the end
of the reporting period. The way we implement our main investment strategies and the resulting portfolio holdings
may change depending on factors such as market and economic conditions. These opinions may not be relied
upon as investment advice or an offer for a particular security. The information is not a complete analysis of
every aspect of any market, state, industry, security or the Fund. Statements of fact are from sources considered
reliable, but the investment manager makes no representation or warranty as to their completeness or accuracy.
Although historical performance is no guarantee of future results, these insights may help you understand our
investment management philosophy.
1. For investors subject to alternative minimum tax, a small portion of Fund dividends may be taxable. Distributions
of capital gains are generally taxable. To avoid imposition of 28% backup withholding on all Fund distributions and
redemption proceeds, U.S. investors must be properly certified on Form W-9 and non-U.S. investors on Form W-8BEN.
2. All Fund distributions will vary depending upon current market conditions, and past distributions are not indicative
of future trends.
3. Source: Bureau of Labor Statistics.
4. Source: Moody’s Investors Service, “2013 State Debt Medians Report,” 5/29/13.
5. This does not indicate S&P’s rating of the Fund.
46 | Annual Report
Performance Summary as of 2/28/14
Franklin Louisiana Tax-Free Income Fund
Your dividend income will vary depending on dividends or interest paid by securities in the Fund’s portfolio, adjusted for operating expenses of each class. Capital gain distributions are net profits realized from the sale of portfolio securities. The performance table and graphs do not reflect any taxes that a shareholder would pay on Fund dividends, capital gain distributions, if any, or any realized gains on the sale of Fund shares. Total return reflects reinvestment of the Fund’s dividends and capital gain distributions, if any, and any unrealized gains or losses.
| | | | | | | | |
| Price and Distribution Information | | | | | | |
| Class A (Symbol: FKLAX) | | | | Change | | 2/28/14 | | 2/28/13 |
| Net Asset Value (NAV) | | | -$ | 0.78 | $ | 11.26 | $ | 12.04 |
| Distributions (3/1/13–2/28/14) | | | | | | | | |
| Dividend Income | $ | 0.4257 | | | | | | |
| Class C (Symbol: FLAIX) | | | | Change | | 2/28/14 | | 2/28/13 |
| Net Asset Value (NAV) | | | -$ | 0.80 | $ | 11.41 | $ | 12.21 |
| Distributions (3/1/13–2/28/14) | | | | | | | | |
| Dividend Income | $ | 0.3630 | | | | | | |
Performance
Cumulative total return excludes sales charges. Average annual total returns include maximum sales charges. Class A: 4.25% maximum initial sales charge; Class C: 1% contingent deferred sales charge in first year only.
| | | | | | | | | | |
| Class A | | | 1-Year | | | 5-Year | | | 10-Year | |
| Cumulative Total Return1 | | | -2.90 | % | + | 32.23 | % | + | 44.89 | % |
| Average Annual Total Return2 | | | -6.99 | % | + | 4.84 | % | + | 3.33 | % |
| Avg. Ann. Total Return (3/31/14)3 | | | -5.96 | % | + | 4.87 | % | + | 3.39 | % |
| Distribution Rate4 | 3.91 | % | | | | | | | | |
| Taxable Equivalent Distribution Rate5 | 7.38 | % | | | | | | | | |
| 30-Day Standardized Yield6 | 3.11 | % | | | | | | | | |
| Taxable Equivalent Yield5 | 5.87 | % | | | | | | | | |
| Total Annual Operating Expenses7 | 0.67 | % | | | | | | | | |
| Class C | | | 1-Year | | | 5-Year | | | 10-Year | |
| Cumulative Total Return1 | | | -3.55 | % | + | 28.69 | % | + | 37.17 | % |
| Average Annual Total Return2 | | | -4.49 | % | + | 5.17 | % | + | 3.21 | % |
| Avg. Ann. Total Return (3/31/14)3 | | | -3.31 | % | + | 5.19 | % | + | 3.27 | % |
| Distribution Rate4 | 3.52 | % | | | | | | | | |
| Taxable Equivalent Distribution Rate5 | 6.64 | % | | | | | | | | |
| 30-Day Standardized Yield6 | 2.71 | % | | | | | | | | |
| Taxable Equivalent Yield5 | 5.12 | % | | | | | | | | |
| Total Annual Operating Expenses7 | 1.22 | % | | | | | | | | |
Performance data represent past performance, which does not guarantee future results. Investment return and principal value will fluctuate, and you may have a gain or loss when you sell your shares. Current performance may differ from figures shown. For most recent month-end performance, go to franklintempleton.com or call (800) 342-5236.
Annual Report | 47
Performance Summary (continued)
Total Return Index Comparison for a Hypothetical $10,000 Investment
Total return represents the change in value of an investment over the periods shown. It includes any applicable maximum sales charge, Fund expenses, account fees and reinvested distributions. The unmanaged index includes reinvestment of any income or distributions. It differs from the Fund in composition and does not pay management fees or expenses. One cannot invest directly in an index.
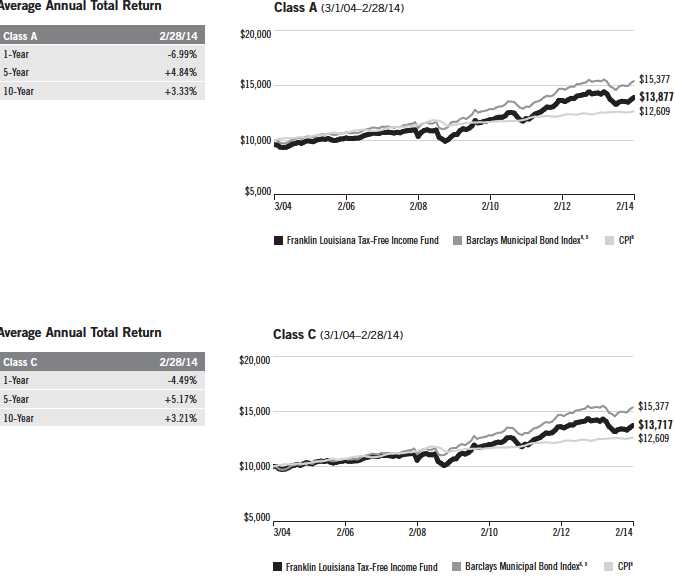
48 | Annual Report
Performance Summary (continued)
All investments involve risks, including possible loss of principal. Because municipal bonds are sensitive to interest rate movements, the Fund’s yield and share price will fluctuate with market conditions. Bond prices generally move in the opposite direction of interest rates. Thus, as prices of bonds in the Fund adjust to a rise in interest rates, the Fund’s share price may decline. Because the Fund invests principally in a single state, it is subject to greater risk of adverse economic and regulatory changes in that state than a geographically diversified fund. The Fund holds a small portion of its assets in Puerto Rico municipal bonds that have been impacted by recent adverse economic and market changes, which may cause the Fund’s share price to decline. Changes in the credit rating of a bond, or in the credit rating or financial strength of a bond’s issuer, insurer or guarantor, may affect the bond’s value. The Fund may invest a significant part of its assets in municipal securities that finance similar types of projects, such as utilities, hospitals, higher education and transportation. A change that affects one project would likely affect all similar projects, thereby increasing market risk. The Fund is actively managed but there is no guarantee that the manager’s investment decisions will produce the desired results. The Fund’s prospectus also includes a description of the main investment risks.
Class C: These shares have higher annual fees and expenses than Class A shares.
1. Cumulative total return represents the change in value of an investment over the periods indicated.
2. Average annual total return represents the average annual change in value of an investment over the periods indicated.
3. In accordance with SEC rules, we provide standardized average annual total return information through the latest calendar quarter.
4. Distribution rate is based on an annualization of the respective class’s February dividend and the maximum offering price (NAV for Class C) per
share on 2/28/14.
5. Taxable equivalent distribution rate and yield assume the published rates as of 12/18/13 for the maximum combined effective federal and
Louisiana personal income tax rate of 47.02%, based on the federal income tax rate of 39.60% plus 3.8% Medicare tax.
6. The 30-day standardized yield for the month ended 2/28/14 reflects an estimated yield to maturity (assuming all portfolio securities are held to
maturity). It should be regarded as an estimate of the Fund’s rate of investment income, and it may not equal the Fund’s actual income distribution
rate (which reflects the Fund’s past dividends paid to shareholders) or the income reported in the Fund’s financial statements.
7. Figures are as stated in the Fund’s current prospectus. In periods of market volatility, assets may decline significantly, causing total annual Fund
operating expenses to become higher than the figures shown.
8. Source: © 2014 Morningstar. The Barclays Municipal Bond Index is a market value-weighted index engineered for the long-term tax-exempt bond
market. To be included in the index, bonds must be fixed rate, have at least one year to final maturity and be rated investment grade (Baa3/BBB- or
higher) by at least two of the following agencies: Moody’s, Standard & Poor’s and Fitch. The Consumer Price Index (CPI), calculated by the Bureau of
Labor Statistics, is a commonly used measure of the inflation rate.
9. Source: Barclays Global Family of Indices. © 2014 Barclays Capital Inc. Used with permission.
Annual Report | 49
Your Fund’s Expenses
Franklin Louisiana Tax-Free Income Fund
As a Fund shareholder, you can incur two types of costs:
- Transaction costs, including sales charges (loads) on Fund purchases; and
- Ongoing Fund costs, including management fees, distribution and service (12b-1) fees, and other Fund expenses. All mutual funds have ongoing costs, sometimes referred to as operating expenses.
The following table shows ongoing costs of investing in the Fund and can help you understand these costs and compare them with those of other mutual funds. The table assumes a $1,000 investment held for the six months indicated.
Actual Fund Expenses
The first line (Actual) for each share class listed in the table provides actual account values and expenses. The “Ending Account Value” is derived from the Fund’s actual return, which includes the effect of Fund expenses.
You can estimate the expenses you paid during the period by following these steps. Of course, your account value and expenses will differ from those in this illustration:
| 1. | Divide your account value by $1,000. |
| | If an account had an $8,600 value, then $8,600 ÷ $1,000 = 8.6. |
| 2. | Multiply the result by the number under the heading “Expenses Paid During Period.” |
| | If Expenses Paid During Period were $7.50, then 8.6 x $7.50 = $64.50. |
In this illustration, the estimated expenses paid this period are $64.50.
Hypothetical Example for Comparison with Other Funds
Information in the second line (Hypothetical) for each class in the table can help you compare ongoing costs of investing in the Fund with those of other mutual funds. This information may not be used to estimate the actual ending account balance or expenses you paid during the period. The hypothetical “Ending Account Value” is based on the actual expense ratio for each class and an assumed 5% annual rate of return before expenses, which does not represent the Fund’s actual return. The figure under the heading “Expenses Paid During Period” shows the hypothetical expenses your account would have incurred under this scenario. You can compare this figure with the 5% hypothetical examples that appear in shareholder reports of other funds.
50 | Annual Report
Your Fund’s Expenses (continued)
Please note that expenses shown in the table are meant to highlight ongoing costs and do not reflect any transaction costs, such as sales charges. Therefore, the second line for each class is useful in comparing ongoing costs only, and will not help you compare total costs of owning different funds. In addition, if transaction costs were included, your total costs would have been higher. Please refer to the Fund prospectus for additional information on operating expenses.
| | | | | | |
| | | Beginning Account | | Ending Account | | Expenses Paid During |
| Class A | | Value 9/1/13 | | Value 2/28/14 | | Period* 9/1/13–2/28/14 |
| Actual | $ | 1,000 | $ | 1,050.00 | $ | 3.56 |
| Hypothetical (5% return before expenses) | $ | 1,000 | $ | 1,021.32 | $ | 3.51 |
| Class C | | | | | | |
| Actual | $ | 1,000 | $ | 1,046.60 | $ | 6.34 |
| Hypothetical (5% return before expenses) | $ | 1,000 | $ | 1,018.60 | $ | 6.26 |
*Expenses are calculated using the most recent six-month expense ratio, annualized for each class (A: 0.70% and C: 1.25%), multiplied by the average account value over the period, multiplied by 181/365 to reflect the one-half year period.
Annual Report | 51
Franklin Maryland Tax-Free Income Fund
Your Fund’s Goal and Main Investments: Franklin Maryland Tax-Free Income Fund seeks to provide as high a level of income exempt from federal and Maryland personal income taxes as is consistent with prudent investment management and preservation of capital by investing at least 80% of its total assets in securities that pay interest free from such taxes.1
Performance data represent past performance, which does not guarantee future results. Investment return and principal value will fluctuate, and you may have a gain or loss when you sell your shares. Current performance may differ from figures shown. Please visit franklintempleton.com or call (800) 342-5236 for most recent month-end performance.
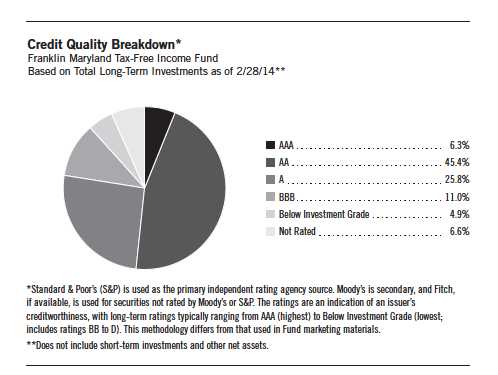
This annual report for Franklin Maryland Tax-Free Income Fund covers the fiscal year ended February 28, 2014.
Performance Overview
The Fund’s Class A share price, as measured by net asset value, decreased from $11.98 on February 28, 2013, to $11.20 on February 28, 2014. The Fund’s Class A shares paid dividends totaling 39.52 cents per share for the same period.2 The Performance Summary beginning on page 56 shows that at the end of this reporting period the Fund’s Class A shares’ distribution rate was
The dollar value, number of shares or principal amount, and names of all portfolio holdings are listed in the Fund’s Statement of Investments (SOI). The SOI begins on page 124.
52 | Annual Report
| | | |
| Dividend Distributions* | | | |
| Franklin Maryland Tax-Free Income Fund | | | |
| 3/1/13–2/28/14 | | | |
| | Dividend per Share (cents) |
| Month | Class A | Class C | Advisor Class |
| March | 3.20 | 2.64 | 3.30 |
| April | 3.20 | 2.64 | 3.30 |
| May | 3.20 | 2.64 | 3.30 |
| June | 3.15 | 2.60 | 3.25 |
| July | 3.15 | 2.60 | 3.25 |
| August | 3.15 | 2.60 | 3.25 |
| September | 3.25 | 2.76 | 3.34 |
| October | 3.35 | 2.86 | 3.44 |
| November | 3.41 | 2.92 | 3.50 |
| December | 3.41 | 2.92 | 3.50 |
| January | 3.50 | 3.01 | 3.59 |
| February | 3.55 | 3.06 | 3.64 |
| Total | 39.52 | 33.25 | 40.66 |
*Assumes shares were purchased and held for the entire accrual period. Since dividends accrue daily, your actual distributions will vary depending on the date you purchased your shares and any account activity. All Fund distributions will vary depending upon current market conditions, and past distributions are not indicative of future trends.
3.64% based on an annualization of the 3.55 cent per share February dividend and the maximum offering price of $11.70 on February 28, 2014. An investor in the 2014 maximum combined effective federal and Maryland state and local personal income tax bracket of 48.81% (including 3.8% Medicare tax) would need to earn a distribution rate of 7.11% from a taxable investment to match the Fund’s Class A tax-free distribution rate. For the Fund’s Class C and Advisor shares’ performance, please see the Performance Summary.
State Update
Maryland’s economy showed signs of improvement during the period, with higher general revenues, rising housing prices and an improving unemployment rate that remained below the national average. In addition, the stock market rally over the past few years led to an increase in capital gains tax revenues for Maryland. The state also benefited from lower health insurance costs and casino gaming revenues that exceeded estimates. Even so, state revenues were less than expected in fiscal year 2013, and the state comptroller cited a historically high unemployment rate, a 2012 state income tax increase and expiration of a federal payroll tax holiday as contributing to the revenue shortfall. One of the state’s largest employers is the federal government, and the federal sequestration and budget uncertainty during the period weighed on
Annual Report | 53
Portfolio Breakdown*
Franklin Maryland Tax-Free Income Fund 2/28/14
| | |
| % of Total | |
| Long-Term Investments* | |
| Hospital & Health Care | 20.0 | % |
| Utilities | 17.9 | % |
| Higher Education | 15.6 | % |
| Housing | 11.6 | % |
| General Obligation | 10.5 | % |
| Transportation | 7.7 | % |
| Tax-Supported | 5.3 | % |
| Refunded | 5.1 | % |
| Other Revenue | 4.9 | % |
| Subject to Government Appropriations | 1.4 | % |
*Does not include short-term investments and other net assets.
Maryland’s economy. However, independent credit rating agencies Moody’s Investors Service and Standard & Poor’s (S&P) each cited the lessened uncertainty surrounding federal spending as a positive development for Maryland. Federal government employment in Maryland is spread across vital sectors including health care, the sciences and intelligence, which might help strengthen the job market. For example, the U.S. Cyber Command at Fort Meade, Maryland, was expected to expand from about 900 to 4,900 federal employees to increase cybersecurity over the next few years.
Similarly, challenges surrounding the state’s underfunded pension system might be mitigated as the state introduced a proposal to increase employee pension contributions. Previously enacted pension measures included decreased cost-of-living adjustments and longer vesting periods for new employees. This effort to fully fund pension obligations could result in future cost savings. The pension reform was part of an executive budget proposal that also included increasing personal taxes for high-income earners and transferring select pension costs for teachers to local governments. In addition, Maryland incrementally increased sales tax rates on gasoline and special fuel through fiscal year 2018, which could further bolster state tax revenues.
The state’s net-tax supported debt was 3.6% of personal income and $1,799 per capita, compared with the national medians of 2.8% and $1,074.3 In February 2014, Moody’s assigned a rating of Aaa to new Maryland general obligation bonds.4 In reaffirming the agency’s top credit rating, Moody’s cited several strengths, including a broad and diverse economy, above-average wealth and income levels, the state’s strong financial and debt management policies, and moderate debt levels. S&P also affirmed its top long-term rating on Maryland’s general obligation debt with a stable outlook.4
Manager’s Discussion
We used various investment strategies during the 12 months under review as we sought to maximize tax-free income for shareholders. Puerto Rico’s municipal bond market is widely traded because of its federal and state tax-exemption advantages. During the reporting period, some Puerto Rico issuers experienced a series of downgrades from S&P, Moody’s and Fitch Ratings. In February 2014, these credit rating firms downgraded their respective ratings of Puerto Rico’s general obligation debt to below investment grade, along with the ratings of certain related Puerto Rico issuers. Additionally, each rating agency maintained a negative outlook on certain Puerto Rico issuers, and further downgrades are possible. The Fund is not required to sell securities that have been downgraded to below investment grade, but it is prohibited from making further purchases of such securities as long as the securities are
54 | Annual Report
not rated investment grade by at least one U.S. nationally recognized rating service. Rating actions combined with news related to the commonwealth’s financial position and future financing endeavors caused the Puerto Rico bond market to experience sharp declines in the latter half of 2013 and contrasting positive performance year-to-date in 2014.
Thank you for your continued participation in Franklin Maryland Tax-Free Income Fund. We believe our conservative, buy-and-hold investment strategy can help us achieve high, current, tax-free income for shareholders.
The foregoing information reflects our analysis, opinions and portfolio holdings as of February 28, 2014, the end
of the reporting period. The way we implement our main investment strategies and the resulting portfolio holdings
may change depending on factors such as market and economic conditions. These opinions may not be relied
upon as investment advice or an offer for a particular security. The information is not a complete analysis of
every aspect of any market, state, industry, security or the Fund. Statements of fact are from sources considered
reliable, but the investment manager makes no representation or warranty as to their completeness or accuracy.
Although historical performance is no guarantee of future results, these insights may help you understand our
investment management philosophy.
1. For investors subject to alternative minimum tax, a small portion of Fund dividends may be taxable. Distributions
of capital gains are generally taxable. To avoid imposition of 28% backup withholding on all Fund distributions and
redemption proceeds, U.S. investors must be properly certified on Form W-9 and non-U.S. investors on Form W-8BEN.
2. All Fund distributions will vary depending upon current market conditions, and past distributions are not indicative
of future trends.
3. Source: Moody’s Investors Service, “2013 State Debt Medians Report,” 5/29/13.
4. This does not indicate a rating of the Fund.
Annual Report | 55
Performance Summary as of 2/28/14
Franklin Maryland Tax-Free Income Fund
Your dividend income will vary depending on dividends or interest paid by securities in the Fund’s portfolio, adjusted for operating expenses of each class. Capital gain distributions are net profits realized from the sale of portfolio securities. The performance table and graphs do not reflect any taxes that a shareholder would pay on Fund dividends, capital gain distributions, if any, or any realized gains on the sale of Fund shares. Total return reflects reinvestment of the Fund’s dividends and capital gain distributions, if any, and any unrealized gains or losses.
| | | | | | | | |
| Price and Distribution Information | | | | | | |
| Class A (Symbol: FMDTX) | | | | Change | | 2/28/14 | | 2/28/13 |
| Net Asset Value (NAV) | | | -$ | 0.78 | $ | 11.20 | $ | 11.98 |
| Distributions (3/1/13–2/28/14) | | | | | | | | |
| Dividend Income | $ | 0.3952 | | | | | | |
| Class C (Symbol: FMDIX) | | | | Change | | 2/28/14 | | 2/28/13 |
| Net Asset Value (NAV) | | | -$ | 0.79 | $ | 11.39 | $ | 12.18 |
| Distributions (3/1/13–2/28/14) | | | | | | | | |
| Dividend Income | $ | 0.3325 | | | | | | |
| Advisor Class (Symbol: FMDZX) | | | | Change | | 2/28/14 | | 2/28/13 |
| Net Asset Value (NAV) | | | -$ | 0.79 | $ | 11.20 | $ | 11.99 |
| Distributions (3/1/13–2/28/14) | | | | | | | | |
| Dividend Income | $ | 0.4066 | | | | | | |
56 | Annual Report
Performance Summary (continued)
Performance
Cumulative total return excludes sales charges. Average annual total returns include maximum sales charges. Class A: 4.25% maximum initial sales charge; Class C: 1% contingent deferred sales charge in first year only; Advisor Class: no sales charges.
| | | | | | | | | | |
| Class A | | | 1-Year | | | 5-Year | | | 10-Year | |
| Cumulative Total Return1 | | | -3.17 | % | + | 31.90 | % | + | 42.08 | % |
| Average Annual Total Return2 | | | -7.27 | % | + | 4.78 | % | + | 3.13 | % |
| Avg. Ann. Total Return (3/31/14)3 | | | -6.49 | % | + | 4.75 | % | + | 3.17 | % |
| Distribution Rate4 | 3.64 | % | | | | | | | | |
| Taxable Equivalent Distribution Rate5 | 7.11 | % | | | | | | | | |
| 30-Day Standardized Yield6 | 3.23 | % | | | | | | | | |
| Taxable Equivalent Yield5 | 6.31 | % | | | | | | | | |
| Total Annual Operating Expenses7 | 0.65 | % | | | | | | | | |
| Class C | | | 1-Year | | | 5-Year | | | 10-Year | |
| Cumulative Total Return1 | | | -3.73 | % | + | 28.25 | % | + | 34.51 | % |
| Average Annual Total Return2 | | | -4.66 | % | + | 5.10 | % | + | 3.01 | % |
| Avg. Ann. Total Return (3/31/14)3 | | | -3.75 | % | + | 5.11 | % | + | 3.06 | % |
| Distribution Rate4 | 3.22 | % | | | | | | | | |
| Taxable Equivalent Distribution Rate5 | 6.29 | % | | | | | | | | |
| 30-Day Standardized Yield6 | 2.83 | % | | | | | | | | |
| Taxable Equivalent Yield5 | 5.53 | % | | | | | | | | |
| Total Annual Operating Expenses7 | 1.20 | % | | | | | | | | |
| Advisor Class8 | | | 1-Year | | | 5-Year | | | 10-Year | |
| Cumulative Total Return1 | | | -3.16 | % | + | 32.48 | % | + | 42.70 | % |
| Average Annual Total Return2 | | | -3.16 | % | + | 5.79 | % | + | 3.62 | % |
| Avg. Ann. Total Return (3/31/14)3 | | | -2.21 | % | + | 5.78 | % | + | 3.67 | % |
| Distribution Rate4 | 3.90 | % | | | | | | | | |
| Taxable Equivalent Distribution Rate5 | 7.62 | % | | | | | | | | |
| 30-Day Standardized Yield6 | 3.46 | % | | | | | | | | |
| Taxable Equivalent Yield5 | 6.76 | % | | | | | | | | |
| Total Annual Operating Expenses7 | 0.55 | % | | | | | | | | |
Performance data represent past performance, which does not guarantee future results. Investment return and principal value will fluctuate, and you may have a gain or loss when you sell your shares. Current performance may differ from figures shown. For most recent month-end performance, go to franklintempleton.com or call (800) 342-5236.
Annual Report | 57
Performance Summary (continued)
Total Return Index Comparison for a Hypothetical $10,000 Investment
Total return represents the change in value of an investment over the periods shown. It includes any applicable maximum sales charge, Fund expenses, account fees and reinvested distributions. The unmanaged index includes reinvestment of any income or distributions. It differs from the Fund in composition and does not pay management fees or expenses. One cannot invest directly in an index.
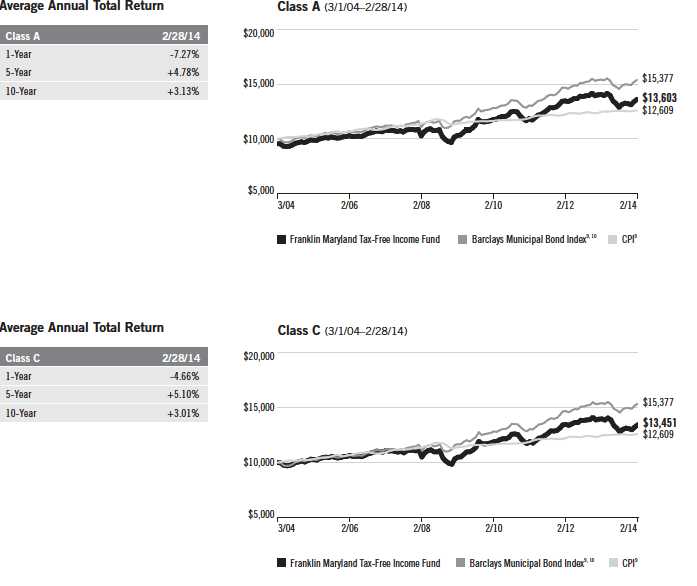
58 | Annual Report
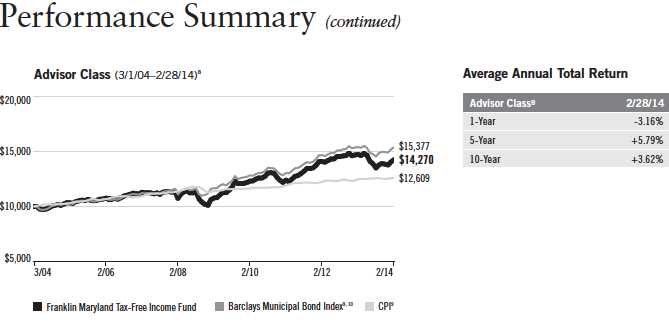
All investments involve risks, including possible loss of principal. Because municipal bonds are sensitive to interest rate movements, the Fund’s yield and share price will fluctuate with market conditions. Bond prices generally move in the opposite direction of interest rates. Thus, as prices of bonds in the Fund adjust to a rise in interest rates, the Fund’s share price may decline. Because the Fund invests principally in a single state, it is subject to greater risk of adverse economic and regulatory changes in that state than a geographically diversified fund. The Fund holds a small portion of its assets in Puerto Rico municipal bonds that have been impacted by recent adverse economic and market changes, which may cause the Fund’s share price to decline. Changes in the credit rating of a bond, or in the credit rating or financial strength of a bond’s issuer, insurer or guarantor, may affect the bond’s value. The Fund may invest a significant part of its assets in municipal securities that finance similar types of projects, such as utilities, hospitals, higher education and transportation. A change that affects one project would likely affect all similar projects, thereby increasing market risk. The Fund is actively managed but there is no guarantee that the manager’s investment decisions will produce the desired results. The Fund’s prospectus also includes a description of the main investment risks.
| |
| Class C: | These shares have higher annual fees and expenses than Class A shares. |
| Advisor Class: | Shares are available to certain eligible investors as described in the prospectus. |
1. Cumulative total return represents the change in value of an investment over the periods indicated.
2. Average annual total return represents the average annual change in value of an investment over the periods indicated.
3. In accordance with SEC rules, we provide standardized average annual total return information through the latest calendar quarter.
4. Distribution rate is based on an annualization of the respective class’s February dividend and the maximum offering price (NAV for Classes C and Advisor) per share on 2/28/14.
5. Taxable equivalent distribution rate and yield assume the published rates as of 12/18/13 for the maximum combined effective federal and Maryland state and local personal income tax rate of 48.81%, based on the federal income tax rate of 39.60% plus 3.8% Medicare tax.
6. The 30-day standardized yield for the month ended 2/28/14 reflects an estimated yield to maturity (assuming all portfolio securities are held to maturity). It should be regarded as an estimate of the Fund’s rate of investment income, and it may not equal the Fund’s actual income distribution rate (which reflects the Fund’s past dividends paid to shareholders) or the income reported in the Fund’s financial statements.
7. Figures are as stated in the Fund’s current prospectus. In periods of market volatility, assets may decline significantly, causing total annual Fund operating expenses to become higher than the figures shown.
8. Effective 7/1/09, the Fund began offering Advisor Class shares, which do not have sales charges or a Rule 12b-1 plan. Performance quotations for this class reflect the following methods of calculation: (a) For periods prior to 7/1/09, a restated figure is used based upon the Fund’s Class A performance, excluding the effect of Class A’s maximum initial sales charge, but reflecting the effect of the Class A Rule 12b-1 fees; and (b) for periods after 7/1/09, actual Advisor Class performance is used reflecting all charges and fees applicable to that class. Since 7/1/09 (commencement of sales), the cumulative and average annual total returns of Advisor Class shares were +26.22% and +5.12%.
9. Source: © 2014 Morningstar. The Barclays Municipal Bond Index is a market value-weighted index engineered for the long-term tax-exempt bond market. To be included in the index, bonds must be fixed rate, have at least one year to final maturity and be rated investment grade (Baa3/BBB- or higher) by at least two of the following agencies: Moody’s, Standard & Poor’s and Fitch. The Consumer Price Index (CPI), calculated by the Bureau of Labor Statistics, is a commonly used measure of the inflation rate.
10. Source: Barclays Global Family of Indices. © 2014 Barclays Capital Inc. Used with permission.
Annual Report | 59
Your Fund’s Expenses
Franklin Maryland Tax-Free Income Fund
As a Fund shareholder, you can incur two types of costs:
- Transaction costs, including sales charges (loads) on Fund purchases; and
- Ongoing Fund costs, including management fees, distribution and service (12b-1) fees, and other Fund expenses. All mutual funds have ongoing costs, sometimes referred to as operating expenses.
The following table shows ongoing costs of investing in the Fund and can help you understand these costs and compare them with those of other mutual funds. The table assumes a $1,000 investment held for the six months indicated.
Actual Fund Expenses
The first line (Actual) for each share class listed in the table provides actual account values and expenses. The “Ending Account Value” is derived from the Fund’s actual return, which includes the effect of Fund expenses.
You can estimate the expenses you paid during the period by following these steps. Of course, your account value and expenses will differ from those in this illustration:
| 1. | Divide your account value by $1,000. |
| | If an account had an $8,600 value, then $8,600 ÷ $1,000 = 8.6. |
| 2. | Multiply the result by the number under the heading “Expenses Paid During Period.” |
| | If Expenses Paid During Period were $7.50, then 8.6 x $7.50 = $64.50. |
In this illustration, the estimated expenses paid this period are $64.50.
Hypothetical Example for Comparison with Other Funds
Information in the second line (Hypothetical) for each class in the table can help you compare ongoing costs of investing in the Fund with those of other mutual funds. This information may not be used to estimate the actual ending account balance or expenses you paid during the period. The hypothetical “Ending Account Value” is based on the actual expense ratio for each class and an assumed 5% annual rate of return before expenses, which does not represent the Fund’s actual return. The figure under the heading “Expenses Paid During Period” shows the hypothetical expenses your account would have incurred under this scenario. You can compare this figure with the 5% hypothetical examples that appear in shareholder reports of other funds.
60 | Annual Report
Your Fund’s Expenses (continued)
Please note that expenses shown in the table are meant to highlight ongoing costs and do not reflect any transaction costs, such as sales charges. Therefore, the second line for each class is useful in comparing ongoing costs only, and will not help you compare total costs of owning different funds. In addition, if transaction costs were included, your total costs would have been higher. Please refer to the Fund prospectus for additional information on operating expenses.
| | | | | | |
| | | Beginning Account | | Ending Account | | Expenses Paid During |
| Class A | | Value 9/1/13 | | Value 2/28/14 | | Period* 9/1/13–2/28/14 |
| Actual | $ | 1,000 | $ | 1,056.40 | $ | 3.42 |
| Hypothetical (5% return before expenses) | $ | 1,000 | $ | 1,021.47 | $ | 3.36 |
| Class C | | | | | | |
| Actual | $ | 1,000 | $ | 1,053.70 | $ | 6.21 |
| Hypothetical (5% return before expenses) | $ | 1,000 | $ | 1,018.74 | $ | 6.11 |
| Advisor Class | | | | | | |
| Actual | $ | 1,000 | $ | 1,056.90 | $ | 2.91 |
| Hypothetical (5% return before expenses) | $ | 1,000 | $ | 1,021.97 | $ | 2.86 |
*Expenses are calculated using the most recent six-month expense ratio, annualized for each class (A: 0.67%; C: 1.22%; and Advisor: 0.57%), multiplied by the average account value over the period, multiplied by 181/365 to reflect the one-half year period.
Annual Report | 61
Franklin Missouri Tax-Free Income Fund
Your Fund’s Goal and Main Investments: Franklin Missouri Tax-Free Income Fund seeks to provide as high a level of income exempt from federal and Missouri personal income taxes as is consistent with prudent investment management and preservation of capital by investing at least 80% of its total assets in securities that pay interest free from such taxes.1
Performance data represent past performance, which does not guarantee future results. Investment return and principal value will fluctuate, and you may have a gain or loss when you sell your shares. Current performance may differ from figures shown. Please visit franklintempleton.com or call (800) 342-5236 for most recent month-end performance.

This annual report for Franklin Missouri Tax-Free Income Fund covers the fiscal year ended February 28, 2014.
Performance Overview
The Fund’s Class A share price, as measured by net asset value, decreased from $12.77 on February 28, 2013, to $11.88 on February 28, 2014. The Fund’s Class A shares paid dividends totaling 44.61 cents per share for the same period.2 The Performance Summary beginning on page 66 shows that at the end of this reporting period the Fund’s Class A shares’ distribution rate
The dollar value, number of shares or principal amount, and names of all portfolio holdings are listed in the Fund’s Statement of Investments (SOI). The SOI begins on page 131.
62 | Annual Report
| | | |
| Dividend Distributions* | | | |
| Franklin Missouri Tax-Free Income Fund | | | |
| 3/1/13–2/28/14 | | | |
| | Dividend per Share (cents) |
| Month | Class A | Class C | Advisor Class |
| March | 3.61 | 3.01 | 3.71 |
| April | 3.61 | 3.01 | 3.71 |
| May | 3.61 | 3.01 | 3.71 |
| June | 3.61 | 3.04 | 3.71 |
| July | 3.51 | 2.94 | 3.61 |
| August | 3.51 | 2.94 | 3.61 |
| September | 3.71 | 3.19 | 3.81 |
| October | 3.88 | 3.36 | 3.98 |
| November | 3.88 | 3.36 | 3.98 |
| December | 3.88 | 3.36 | 3.98 |
| January | 3.88 | 3.36 | 3.98 |
| February | 3.92 | 3.40 | 4.02 |
| Total | 44.61 | 37.98 | 45.81 |
*Assumes shares were purchased and held for the entire accrual period. Since dividends accrue daily, your actual distributions will vary depending on the date you purchased your shares and any account activity. All Fund distributions will vary depending upon current market conditions, and past distributions are not indicative of future trends.
was 3.79% based on an annualization of the 3.92 cent per share February dividend and the maximum offering price of $12.41 on February 28, 2014. An investor in the 2014 maximum combined effective federal and Missouri personal income tax bracket of 47.02% (including 3.8% Medicare tax) would need to earn a distribution rate of 7.15% from a taxable investment to match the Fund’s Class A tax-free distribution rate. For the Fund’s Class C and Advisor shares’ performance, please see the Performance Summary.
State Update
Missouri’s strong and diverse economy improved during the period under review as unemployment claims remained near prerecession levels and personal income grew. The value of residential construction rose to the highest level since early 2008 and home prices appreciated, contributing to the housing market recovery. For the 12-month period, most sectors added jobs, led by leisure and hospitality and professional and business services. Missouri’s unemployment rate declined to a five-year low of 6.0% in December and January but ended the period at 6.4%, compared to the 6.7% national average.3
Annual Report | 63
Portfolio Breakdown
Franklin Missouri Tax-Free Income Fund 2/28/14
| | |
| % of Total | |
| Long-Term Investments* | |
| Utilities | 27.9 | % |
| Hospital & Health Care | 17.1 | % |
| Subject to Government Appropriations | 16.2 | % |
| Tax-Supported | 11.0 | % |
| Higher Education | 8.4 | % |
| Transportation | 7.0 | % |
| Refunded | 4.6 | % |
| General Obligation | 3.8 | % |
| Other Revenue | 2.7 | % |
| Corporate-Backed | 0.9 | % |
| Housing | 0.4 | % |
*Does not include short-term investments and other net assets.
The state concluded fiscal year 2013 with a budget surplus as revenue collections grew at the fastest pace in nearly 20 years and exceeded prerecession levels. Revenue collections for the 2014 fiscal year-to-date in February were higher than for the same period in the previous year, resulting largely from solid growth in individual income, sales and corporate tax collections. The proposed fiscal year 2015 budget assumed higher revenue growth than projected for fiscal year 2014, based on expectations of stronger job growth and consumer confidence. It also included recommendations for spending increases in education, health and mental care, public safety and job development, as well as Medicaid expansion and reform.
Missouri’s net tax-supported debt was 1.8% of personal income and $699 per capita, compared with the national medians of 2.8% and $1,074.4 Standard & Poor’s (S&P) rated Missouri’s general obligation bonds AAA with a stable outlook, reflecting the independent credit rating agency’s view of the state’s robust and diverse economic base, strong budget management framework, solid reserves that can be used only under limited circumstances and moderate debt burden.5 S&P expressed concerns about the potentially significant reductions in federal funding for Missouri that could result from potential federal spending cuts.
Manager’s Discussion
We used various investment strategies during the 12 months under review as we sought to maximize tax-free income for shareholders. Puerto Rico’s municipal bond market is widely traded because of its federal and state tax-exemption advantages. During the reporting period, some Puerto Rico issuers experienced a series of downgrades from S&P, Moody’s Investors Service and Fitch Ratings. In February 2014, these credit rating firms downgraded their respective ratings of Puerto Rico’s general obligation debt to below investment grade, along with the ratings of certain related Puerto Rico issuers. Additionally, each rating agency maintained a negative outlook on certain Puerto Rico issuers, and further downgrades are possible. The Fund is not required to sell securities that have been downgraded to below investment grade, but it is prohibited from making further purchases of such securities as long as the securities are not rated investment grade by at least one U.S. nationally recognized rating service. Rating actions combined with news related to the commonwealth’s financial position and future financing endeavors caused the Puerto Rico bond market to experience sharp declines in the latter half of 2013 and contrasting positive performance year-to-date in 2014.
64 | Annual Report
Thank you for your continued participation in Franklin Missouri Tax-Free Income Fund. We believe our conservative, buy-and-hold investment strategy can help us achieve high, current, tax-free income for shareholders.
The foregoing information reflects our analysis, opinions and portfolio holdings as of February 28, 2014, the end
of the reporting period. The way we implement our main investment strategies and the resulting portfolio holdings
may change depending on factors such as market and economic conditions. These opinions may not be relied
upon as investment advice or an offer for a particular security. The information is not a complete analysis of
every aspect of any market, state, industry, security or the Fund. Statements of fact are from sources considered
reliable, but the investment manager makes no representation or warranty as to their completeness or accuracy.
Although historical performance is no guarantee of future results, these insights may help you understand our
investment management philosophy.
1. For investors subject to alternative minimum tax, a small portion of Fund dividends may be taxable. Distributions
of capital gains are generally taxable. To avoid imposition of 28% backup withholding on all Fund distributions and
redemption proceeds, U.S. investors must be properly certified on Form W-9 and non-U.S. investors on Form W-8BEN.
2. All Fund distributions will vary depending upon current market conditions, and past distributions are not indicative
of future trends.
3. Source: Bureau of Labor Statistics.
4. Source: Moody’s Investors Service, “2013 State Debt Medians Report,” 5/29/13.
5. This does not indicate S&P’s rating of the Fund.
Annual Report | 65
Performance Summary as of 2/28/14
Franklin Missouri Tax-Free Income Fund
Your dividend income will vary depending on dividends or interest paid by securities in the Fund’s portfolio, adjusted for operating expenses of each class. Capital gain distributions are net profits realized from the sale of portfolio securities. The performance table and graphs do not reflect any taxes that a shareholder would pay on Fund dividends, capital gain distributions, if any, or any realized gains on the sale of Fund shares. Total return reflects reinvestment of the Fund’s dividends and capital gain distributions, if any, and any unrealized gains or losses.
| | | | | | | | |
| Price and Distribution Information | | | | | | |
| Class A (Symbol: FRMOX) | | | | Change | | 2/28/14 | | 2/28/13 |
| Net Asset Value (NAV) | | | -$ | 0.89 | $ | 11.88 | $ | 12.77 |
| Distributions (3/1/13–2/28/14) | | | | | | | | |
| Dividend Income | $ | 0.4461 | | | | | | |
| Class C (Symbol: FMOIX) | | | | Change | | 2/28/14 | | 2/28/13 |
| Net Asset Value (NAV) | | | -$ | 0.90 | $ | 11.98 | $ | 12.88 |
| Distributions (3/1/13–2/28/14) | | | | | | | | |
| Dividend Income | $ | 0.3798 | | | | | | |
| Advisor Class (Symbol: FRMZX) | | | | Change | | 2/28/14 | | 2/28/13 |
| Net Asset Value (NAV) | | | -$ | 0.90 | $ | 11.88 | $ | 12.78 |
| Distributions (3/1/13–2/28/14) | | | | | | | | |
| Dividend Income | $ | 0.4581 | | | | | | |
66 | Annual Report
Performance Summary (continued)
Performance
Cumulative total return excludes sales charges. Average annual total returns include maximum sales charges. Class A: 4.25% maximum initial sales charge; Class C: 1% contingent deferred sales charge in first year only; Advisor Class: no sales charges.
| | | | | | | | | | |
| Class A | | | 1-Year | | | 5-Year | | | 10-Year | |
| Cumulative Total Return1 | | | -3.44 | % | + | 28.76 | % | + | 44.98 | % |
| Average Annual Total Return2 | | | -7.57 | % | + | 4.28 | % | + | 3.34 | % |
| Avg. Ann. Total Return (3/31/14)3 | | | -6.79 | % | + | 4.23 | % | + | 3.37 | % |
| Distribution Rate4 | 3.79 | % | | | | | | | | |
| Taxable Equivalent Distribution Rate5 | 7.15 | % | | | | | | | | |
| 30-Day Standardized Yield6 | 3.21 | % | | | | | | | | |
| Taxable Equivalent Yield5 | 6.06 | % | | | | | | | | |
| Total Annual Operating Expenses7 | 0.63 | % | | | | | | | | |
| Class C | | | 1-Year | | | 5-Year | | | 10-Year | |
| Cumulative Total Return1 | | | -4.02 | % | + | 25.35 | % | + | 37.32 | % |
| Average Annual Total Return2 | | | -4.95 | % | + | 4.62 | % | + | 3.22 | % |
| Avg. Ann. Total Return (3/31/14)3 | | | -4.11 | % | + | 4.58 | % | + | 3.25 | % |
| Distribution Rate4 | 3.41 | % | | | | | | | | |
| Taxable Equivalent Distribution Rate5 | 6.44 | % | | | | | | | | |
| 30-Day Standardized Yield6 | 2.81 | % | | | | | | | | |
| Taxable Equivalent Yield5 | 5.30 | % | | | | | | | | |
| Total Annual Operating Expenses7 | 1.18 | % | | | | | | | | |
| Advisor Class8 | | | 1-Year | | | 5-Year | | | 10-Year | |
| Cumulative Total Return1 | | | -3.43 | % | + | 29.32 | % | + | 45.61 | % |
| Average Annual Total Return2 | | | -3.43 | % | + | 5.28 | % | + | 3.83 | % |
| Avg. Ann. Total Return (3/31/14)3 | | | -2.56 | % | + | 5.24 | % | + | 3.86 | % |
| Distribution Rate4 | 4.06 | % | | | | | | | | |
| Taxable Equivalent Distribution Rate5 | 7.66 | % | | | | | | | | |
| 30-Day Standardized Yield6 | 3.43 | % | | | | | | | | |
| Taxable Equivalent Yield5 | 6.47 | % | | | | | | | | |
| Total Annual Operating Expenses7 | 0.53 | % | | | | | | | | |
Performance data represent past performance, which does not guarantee future results. Investment return and principal value will fluctuate, and you may have a gain or loss when you sell your shares. Current performance may differ from figures shown. For most recent month-end performance, go to franklintempleton.com or call (800) 342-5236.
Annual Report | 67
Performance Summary (continued)
Total Return Index Comparison for a Hypothetical $10,000 Investment
Total return represents the change in value of an investment over the periods shown. It includes any applicable maximum sales charge, Fund expenses, account fees and reinvested distributions. The unmanaged index includes reinvestment of any income or distributions. It differs from the Fund in composition and does not pay management fees or expenses. One cannot invest directly in an index.
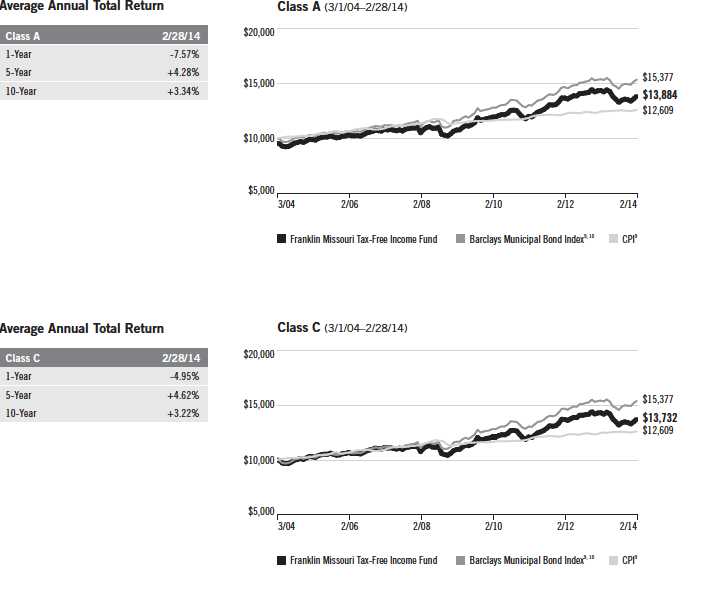
68 | Annual Report
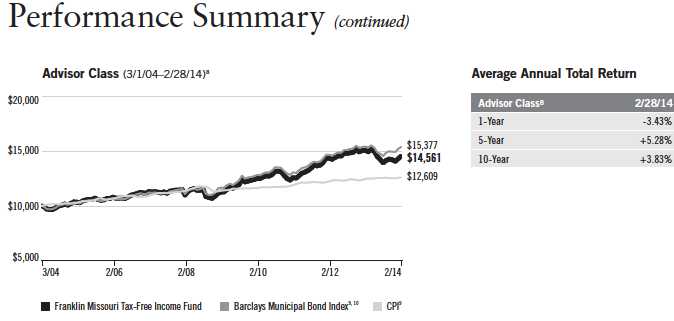
All investments involve risks, including possible loss of principal. Because municipal bonds are sensitive to interest rate movements, the Fund’s yield and share price will fluctuate with market conditions. Bond prices generally move in the opposite direction of interest rates. Thus, as prices of bonds in the Fund adjust to a rise in interest rates, the Fund’s share price may decline. Because the Fund invests principally in a single state, it is subject to greater risk of adverse economic and regulatory changes in that state than a geographically diversified fund. The Fund holds a portion of its assets in Puerto Rico municipal bonds that have been impacted by recent adverse economic and market changes, which may cause the Fund’s share price to decline. Changes in the credit rating of a bond, or in the credit rating or financial strength of a bond’s issuer, insurer or guarantor, may affect the bond’s value. The Fund may invest a significant part of its assets in municipal securities that finance similar types of projects, such as utilities, hospitals, higher education and transportation. A change that affects one project would likely affect all similar projects, thereby increasing market risk. The Fund is actively managed but there is no guarantee that the manager’s investment decisions will produce the desired results. The Fund’s prospectus also includes a description of the main investment risks.
| |
| Class C: | These shares have higher annual fees and expenses than Class A shares. |
| Advisor Class: | Shares are available to certain eligible investors as described in the prospectus. |
1. Cumulative total return represents the change in value of an investment over the periods indicated.
2. Average annual total return represents the average annual change in value of an investment over the periods indicated.
3. In accordance with SEC rules, we provide standardized average annual total return information through the latest calendar quarter.
4. Distribution rate is based on an annualization of the respective class’s February dividend and the maximum offering price (NAV for Classes C and Advisor) per share on 2/28/14.
5. Taxable equivalent distribution rate and yield assume the published rates as of 12/18/13 for the maximum combined effective federal and Missouri personal income tax rate of 47.02%, based on the federal income tax rate of 39.60% plus 3.8% Medicare tax.
6. The 30-day standardized yield for the month ended 2/28/14 reflects an estimated yield to maturity (assuming all portfolio securities are held to maturity). It should be regarded as an estimate of the Fund’s rate of investment income, and it may not equal the Fund’s actual income distribution rate (which reflects the Fund’s past dividends paid to shareholders) or the income reported in the Fund’s financial statements.
7. Figures are as stated in the Fund’s current prospectus. In periods of market volatility, assets may decline significantly, causing total annual Fund operating expenses to become higher than the figures shown.
8. Effective 7/1/09, the Fund began offering Advisor Class shares, which do not have sales charges or a Rule 12b-1 plan. Performance quotations for this class reflect the following methods of calculation: (a) For periods prior to 7/1/09, a restated figure is used based upon the Fund’s Class A performance, excluding the effect of Class A’s maximum initial sales charge, but reflecting the effect of the Class A Rule 12b-1 fees; and (b) for periods after 7/1/09, actual Advisor Class performance is used reflecting all charges and fees applicable to that class. Since 7/1/09 (commencement of sales), the cumulative and average annual total returns of Advisor Class shares were +25.11% and +4.92%.
9. Source: © 2014 Morningstar. The Barclays Municipal Bond Index is a market value-weighted index engineered for the long-term tax-exempt bond market. To be included in the index, bonds must be fixed rate, have at least one year to final maturity and be rated investment grade (Baa3/BBB- or higher) by at least two of the following agencies: Moody’s, Standard & Poor’s and Fitch. The Consumer Price Index (CPI), calculated by the Bureau of Labor Statistics, is a commonly used measure of the inflation rate.
10. Source: Barclays Global Family of Indices. © 2014 Barclays Capital Inc. Used with permission.
Annual Report | 69
Your Fund’s Expenses
Franklin Missouri Tax-Free Income Fund
As a Fund shareholder, you can incur two types of costs:
- Transaction costs, including sales charges (loads) on Fund purchases; and
- Ongoing Fund costs, including management fees, distribution and service (12b-1) fees, and other Fund expenses. All mutual funds have ongoing costs, sometimes referred to as operating expenses.
The following table shows ongoing costs of investing in the Fund and can help you understand these costs and compare them with those of other mutual funds. The table assumes a $1,000 investment held for the six months indicated.
Actual Fund Expenses
The first line (Actual) for each share class listed in the table provides actual account values and expenses. The “Ending Account Value” is derived from the Fund’s actual return, which includes the effect of Fund expenses.
You can estimate the expenses you paid during the period by following these steps. Of course, your account value and expenses will differ from those in this illustration:
| 1. | Divide your account value by $1,000. |
| | If an account had an $8,600 value, then $8,600 ÷ $1,000 = 8.6. |
| 2. | Multiply the result by the number under the heading “Expenses Paid During Period.” |
| | If Expenses Paid During Period were $7.50, then 8.6 x $7.50 = $64.50. |
In this illustration, the estimated expenses paid this period are $64.50.
Hypothetical Example for Comparison with Other Funds
Information in the second line (Hypothetical) for each class in the table can help you compare ongoing costs of investing in the Fund with those of other mutual funds. This information may not be used to estimate the actual ending account balance or expenses you paid during the period. The hypothetical “Ending Account Value” is based on the actual expense ratio for each class and an assumed 5% annual rate of return before expenses, which does not represent the Fund’s actual return. The figure under the heading “Expenses Paid During Period” shows the hypothetical expenses your account would have incurred under this scenario. You can compare this figure with the 5% hypothetical examples that appear in shareholder reports of other funds.
70 | Annual Report
Your Fund’s Expenses (continued)
Please note that expenses shown in the table are meant to highlight ongoing costs and do not reflect any transaction costs, such as sales charges. Therefore, the second line for each class is useful in comparing ongoing costs only, and will not help you compare total costs of owning different funds. In addition, if transaction costs were included, your total costs would have been higher. Please refer to the Fund prospectus for additional information on operating expenses.
| | | | | | |
| | | Beginning Account | | Ending Account | | Expenses Paid During |
| Class A | | Value 9/1/13 | | Value 2/28/14 | | Period* 9/1/13–2/28/14 |
| Actual | $ | 1,000 | $ | 1,045.40 | $ | 3.30 |
| Hypothetical (5% return before expenses) | $ | 1,000 | $ | 1,021.57 | $ | 3.26 |
| Class C | | | | | | |
| Actual | $ | 1,000 | $ | 1,042.30 | $ | 6.08 |
| Hypothetical (5% return before expenses) | $ | 1,000 | $ | 1,018.84 | $ | 6.01 |
| Advisor Class | | | | | | |
| Actual | $ | 1,000 | $ | 1,045.90 | $ | 2.79 |
| Hypothetical (5% return before expenses) | $ | 1,000 | $ | 1,022.07 | $ | 2.76 |
*Expenses are calculated using the most recent six-month expense ratio, annualized for each class (A: 0.65%; C: 1.20%; and Advisor: 0.55%), multiplied by the average account value over the period, multiplied by 181/365 to reflect the one-half year period.
Annual Report | 71
Franklin North Carolina Tax-Free Income Fund
Your Fund’s Goal and Main Investments: Franklin North Carolina Tax-Free Income Fund seeks to provide as high a level of income exempt from federal and North Carolina personal income taxes as is consistent with prudent investment management and preservation of capital by investing at least 80% of its total assets in securities that pay interest free from such taxes.1
Performance data represent past performance, which does not guarantee future results. Investment return and principal value will fluctuate, and you may have a gain or loss when you sell your shares. Current performance may differ from figures shown. Please visit franklintempleton.com or call (800) 342-5236 for most recent month-end performance.
| | |
| Credit Quality Breakdown* | | |
| Franklin North Carolina Tax-Free Income Fund | | |
| 2/28/14 | | |
| | % of Total | |
| Ratings | Long-Term Investments** | |
| AAA | 14.5 | % |
| AA | 48.4 | % |
| A | 29.1 | % |
| BBB | 5.0 | % |
| Below Investment Grade | 2.7 | % |
| Not Rated | 0.3 | % |
*Standard & Poor’s (S&P) is used as the primary independent rating agency source. Moody’s is secondary, and Fitch, if available, is used for securities not rated by Moody’s or S&P. The ratings are an indication of an issuer’s creditworthiness, with long-term ratings typically ranging from AAA (highest) to Below Investment Grade (lowest; includes ratings BB to D). This methodology differs from that used in Fund marketing materials.
**Does not include short-term investments and other net assets.
This annual report for Franklin North Carolina Tax-Free Income Fund covers the fiscal year ended February 28, 2014.
Performance Overview
The Fund’s Class A share price, as measured by net asset value, decreased from $12.96 on February 28, 2013, to $11.95 on February 28, 2014. The Fund’s Class A shares paid dividends totaling 44.36 cents per share for the same period.2 The Performance Summary beginning on page 76 shows that at the end of this reporting period the Fund’s Class A shares’ distribution
The dollar value, number of shares or principal amount, and names of all portfolio holdings are listed in the Fund’s Statement of Investments (SOI). The SOI begins on page 139.
72 | Annual Report
| | | |
| Dividend Distributions* | | | |
| Franklin North Carolina Tax-Free Income Fund | | | |
| 3/1/13–2/28/14 | | | |
| | Dividend per Share (cents) |
| Month | Class A | Class C | Advisor Class |
| March | 3.40 | 2.79 | 3.51 |
| April | 3.40 | 2.79 | 3.51 |
| May | 3.40 | 2.79 | 3.51 |
| June | 3.48 | 2.89 | 3.58 |
| July | 3.48 | 2.89 | 3.58 |
| August | 3.65 | 3.06 | 3.75 |
| September | 3.80 | 3.27 | 3.91 |
| October | 3.90 | 3.37 | 4.01 |
| November | 3.93 | 3.40 | 4.04 |
| December | 3.93 | 3.41 | 4.02 |
| January | 3.97 | 3.45 | 4.06 |
| February | 4.02 | 3.50 | 4.11 |
| Total | 44.36 | 37.61 | 45.59 |
*Assumes shares were purchased and held for the entire accrual period. Since dividends accrue daily, your actual distributions will vary depending on the date you purchased your shares and any account activity. All Fund distributions will vary depending upon current market conditions, and past distributions are not indicative of future trends.
rate was 3.87% based on an annualization of the 4.02 cent per share February dividend and the maximum offering price of $12.48 on February 28, 2014. An investor in the 2014 maximum combined effective federal and North Carolina personal income tax bracket of 46.90% (including 3.8% Medicare tax) would need to earn a distribution rate of 7.29% from a taxable investment to match the Fund’s Class A tax-free distribution rate. For the Fund’s Class C and Advisor shares’ performance, please see the Performance Summary.
State Update
Several economic measures confirmed that North Carolina’s economy expanded during the period, and a broad measure of leading economic indicators for the state reached its highest level since 2007. Increases in the economic growth rate, personal income, retail sales and single-family home sales during the state’s fiscal year 2013 accompanied an improving employment picture. North Carolina’s unemployment rate reached 6.4% at period-end, down from 8.6% at the beginning of the period as job growth accelerated during the second half of 2013.3 In addition, unemployment claims declined and employee hours and
Annual Report | 73
| | |
| Portfolio Breakdown | | |
| Franklin North Carolina | | |
| Tax-Free Income Fund | | |
| 2/28/14 | | |
| % of Total | |
| Long-Term Investments* | |
| Utilities | 20.9 | % |
| Hospital & Health Care | 19.8 | % |
| Higher Education | 14.3 | % |
| Subject to Government Appropriations | 12.6 | % |
| Transportation | 11.6 | % |
| Refunded | 7.3 | % |
| Tax-Supported | 5.6 | % |
| General Obligation | 4.9 | % |
| Housing | 2.4 | % |
| Other Revenue | 0.4 | % |
| Corporate-Backed | 0.2 | % |
*Does not include short-term investments and other net assets.
earnings rose in the manufacturing production sector during the year 2013. According to the North Carolina Department of Commerce, the state added more than 250,000 jobs since a February 2010 low, based on preliminary estimates, and early 2014 reports affirmed employment continued to expand as the state recorded its second-highest annual increase in new jobs since 2007.
The state’s revenues were slightly higher than forecast during the first half of fiscal year 2014, led by a robust increase in corporate income tax revenues. Sales tax revenues also exceeded the target amount. Although personal income tax collections increased, revenues were slightly less than targeted. In mid-2013, North Carolina enacted tax reforms that will reduce personal and corporate income taxes in fiscal year 2014. The reforms broadened sales taxes and eliminated several sales tax exemptions to help offset the cuts.
North Carolina’s net tax-supported debt remained below the national average, with debt at 2.4% of personal income and $853 per capita, compared with the national medians of 2.8% and $1,074.4 Independent credit rating agency Moody’s Investors Service affirmed North Carolina’s Aaa issuer rating and stable outlook during the review period, citing the state’s conservative fiscal management, executive authority to reduce spending, diverse economy and population growth.5
Manager’s Discussion
We used various investment strategies during the 12 months under review as we sought to maximize tax-free income for shareholders. Puerto Rico’s municipal bond market is widely traded because of its federal and state tax-exemption advantages. During the reporting period, some Puerto Rico issuers experienced a series of downgrades from Standard & Poor’s, Moody’s and Fitch Ratings. In February 2014, these credit rating firms downgraded their respective ratings of Puerto Rico’s general obligation debt to below investment grade, along with the ratings of certain related Puerto Rico issuers. Additionally, each rating agency maintained a negative outlook on certain Puerto Rico issuers, and further downgrades are possible. The Fund is not required to sell securities that have been downgraded to below investment grade, but it is prohibited from making further purchases of such securities as long as the securities are not rated investment grade by at least one U.S. nationally recognized rating service. Rating actions combined with news related to the commonwealth’s financial position and future financing endeavors caused the Puerto Rico bond market to experience sharp declines in the latter half of 2013 and contrasting positive performance year-to-date in 2014.
74 | Annual Report
Thank you for your continued participation in Franklin North Carolina Tax-Free Income Fund. We believe our conservative, buy-and-hold investment strategy can help us achieve high, current, tax-free income for shareholders.
The foregoing information reflects our analysis, opinions and portfolio holdings as of February 28, 2014, the end
of the reporting period. The way we implement our main investment strategies and the resulting portfolio holdings
may change depending on factors such as market and economic conditions. These opinions may not be relied
upon as investment advice or an offer for a particular security. The information is not a complete analysis of
every aspect of any market, state, industry, security or the Fund. Statements of fact are from sources considered
reliable, but the investment manager makes no representation or warranty as to their completeness or accuracy.
Although historical performance is no guarantee of future results, these insights may help you understand our
investment management philosophy.
1. For investors subject to alternative minimum tax, a small portion of Fund dividends may be taxable. Distributions
of capital gains are generally taxable. To avoid imposition of 28% backup withholding on all Fund distributions and
redemption proceeds, U.S. investors must be properly certified on Form W-9 and non-U.S. investors on Form W-8BEN.
2. All Fund distributions will vary depending upon current market conditions, and past distributions are not indicative
of future trends.
3. Source: Bureau of Labor Statistics.
4. Source: Moody’s Investors Service, “2013 State Debt Medians Report,” 5/29/13.
5. This does not indicate Moody’s rating of the Fund.
Annual Report | 75
Performance Summary as of 2/28/14
Franklin North Carolina Tax-Free Income Fund
Your dividend income will vary depending on dividends or interest paid by securities in the Fund’s portfolio, adjusted for operating expenses of each class. Capital gain distributions are net profits realized from the sale of portfolio securities. The performance table and graphs do not reflect any taxes that a shareholder would pay on Fund dividends, capital gain distributions, if any, or any realized gains on the sale of Fund shares. Total return reflects reinvestment of the Fund’s dividends and capital gain distributions, if any, and any unrealized gains or losses.
| | | | | | | | |
| Price and Distribution Information | | | | | | |
| Class A (Symbol: FXNCX) | | | | Change | | 2/28/14 | | 2/28/13 |
| Net Asset Value (NAV) | | | -$ | 1.01 | $ | 11.95 | $ | 12.96 |
| Distributions (3/1/13–2/28/14) | | | | | | | | |
| Dividend Income | $ | 0.4436 | | | | | | |
| Class C (Symbol: FNCIX) | | | | Change | | 2/28/14 | | 2/28/13 |
| Net Asset Value (NAV) | | | -$ | 1.01 | $ | 12.12 | $ | 13.13 |
| Distributions (3/1/13–2/28/14) | | | | | | | | |
| Dividend Income | $ | 0.3761 | | | | | | |
| Advisor Class (Symbol: FNCZX) | | | | Change | | 2/28/14 | | 2/28/13 |
| Net Asset Value (NAV) | | | -$ | 1.01 | $ | 11.95 | $ | 12.96 |
| Distributions (3/1/13–2/28/14) | | | | | | | | |
| Dividend Income | $ | 0.4559 | | | | | | |
76 | Annual Report
Performance Summary (continued)
Performance
Cumulative total return excludes sales charges. Average annual total returns include maximum sales charges. Class A: 4.25% maximum initial sales charge; Class C: 1% contingent deferred sales charge in first year only; Advisor Class: no sales charges.
| | | | | | | | | | |
| Class A | | | 1-Year | | | 5-Year | | | 10-Year | |
| Cumulative Total Return1 | | | -4.35 | % | + | 27.85 | % | + | 44.89 | % |
| Average Annual Total Return2 | | | -8.45 | % | + | 4.14 | % | + | 3.33 | % |
| Avg. Ann. Total Return (3/31/14)3 | | | -7.51 | % | + | 4.12 | % | + | 3.35 | % |
| Distribution Rate4 | 3.87 | % | | | | | | | | |
| Taxable Equivalent Distribution Rate5 | 7.29 | % | | | | | | | | |
| 30-Day Standardized Yield6 | 3.00 | % | | | | | | | | |
| Taxable Equivalent Yield5 | 5.65 | % | | | | | | | | |
| Total Annual Operating Expenses7 | 0.62 | % | | | | | | | | |
| Class C | | | 1-Year | | | 5-Year | | | 10-Year | |
| Cumulative Total Return1 | | | -4.82 | % | + | 24.53 | % | + | 37.11 | % |
| Average Annual Total Return2 | | | -5.74 | % | + | 4.49 | % | + | 3.21 | % |
| Avg. Ann. Total Return (3/31/14)3 | | | -4.88 | % | + | 4.45 | % | + | 3.23 | % |
| Distribution Rate4 | 3.47 | % | | | | | | | | |
| Taxable Equivalent Distribution Rate5 | 6.54 | % | | | | | | | | |
| 30-Day Standardized Yield6 | 2.60 | % | | | | | | | | |
| Taxable Equivalent Yield5 | 4.90 | % | | | | | | | | |
| Total Annual Operating Expenses7 | 1.17 | % | | | | | | | | |
| Advisor Class8 | | | 1-Year | | | 5-Year | | | 10-Year | |
| Cumulative Total Return1 | | | -4.25 | % | + | 28.42 | % | + | 45.53 | % |
| Average Annual Total Return2 | | | -4.25 | % | + | 5.13 | % | + | 3.82 | % |
| Avg. Ann. Total Return (3/31/14)3 | | | -3.30 | % | + | 5.11 | % | + | 3.84 | % |
| Distribution Rate4 | 4.13 | % | | | | | | | | |
| Taxable Equivalent Distribution Rate5 | 7.78 | % | | | | | | | | |
| 30-Day Standardized Yield6 | 3.26 | % | | | | | | | | |
| Taxable Equivalent Yield5 | 6.14 | % | | | | | | | | |
| Total Annual Operating Expenses7 | 0.52 | % | | | | | | | | |
Performance data represent past performance, which does not guarantee future results. Investment return and principal value will fluctuate, and you may have a gain or loss when you sell your shares. Current performance may differ from figures shown. For most recent month-end performance, go to franklintempleton.com or call (800) 342-5236.
Annual Report | 77
Performance Summary (continued)
Total Return Index Comparison for a Hypothetical $10,000 Investment
Total return represents the change in value of an investment over the periods shown. It includes any applicable maximum sales charge, Fund expenses, account fees and reinvested distributions. The unmanaged index includes reinvestment of any income or distributions. It differs from the Fund in composition and does not pay management fees or expenses. One cannot invest directly in an index.

78 | Annual Report
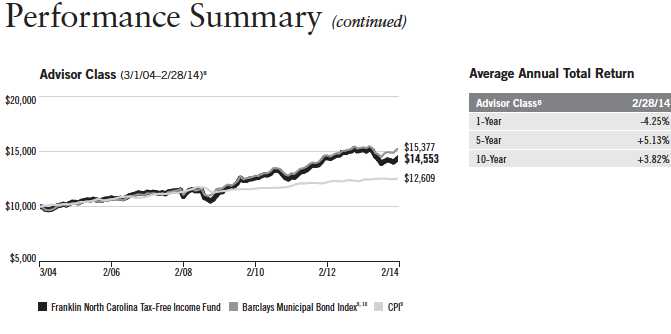
All investments involve risks, including possible loss of principal. Because municipal bonds are sensitive to interest rate movements, the Fund’s yield and share price will fluctuate with market conditions. Bond prices generally move in the opposite direction of interest rates. Thus, as prices of bonds in the Fund adjust to a rise in interest rates, the Fund’s share price may decline. Because the Fund invests principally in a single state, it is subject to greater risk of adverse economic and regulatory changes in that state than a geographically diversified fund. The Fund holds a portion of its assets in Puerto Rico municipal bonds that have been impacted by recent adverse economic and market changes, which may cause the Fund’s share price to decline. Changes in the credit rating of a bond, or in the credit rating or financial strength of a bond’s issuer, insurer or guarantor, may affect the bond’s value. The Fund may invest a significant part of its assets in municipal securities that finance similar types of projects, such as utilities, hospitals, higher education and transportation. A change that affects one project would likely affect all similar projects, thereby increasing market risk. The Fund is actively managed but there is no guarantee that the manager’s investment decisions will produce the desired results. The Fund’s prospectus also includes a description of the main investment risks.
Class C: These shares have higher annual fees and expenses than Class A shares.
Advisor Class: Shares are available to certain eligible investors as described in the prospectus.
1. Cumulative total return represents the change in value of an investment over the periods indicated.
2. Average annual total return represents the average annual change in value of an investment over the periods indicated.
3. In accordance with SEC rules, we provide standardized average annual total return information through the latest calendar quarter.
4. Distribution rate is based on an annualization of the respective class’s February dividend and the maximum offering price (NAV for Classes C and Advisor) per share on 2/28/14.
5. Taxable equivalent distribution rate and yield assume the published rates as of 12/18/13 for the maximum combined effective federal and North Carolina personal income tax rate of 46.90%, based on the federal income tax rate of 39.60% plus 3.8% Medicare tax.
6. The 30-day standardized yield for the month ended 2/28/14 reflects an estimated yield to maturity (assuming all portfolio securities are held to maturity). It should be regarded as an estimate of the Fund’s rate of investment income, and it may not equal the Fund’s actual income distribution rate (which reflects the Fund’s past dividends paid to shareholders) or the income reported in the Fund’s financial statements.
7. Figures are as stated in the Fund’s current prospectus. In periods of market volatility, assets may decline significantly, causing total annual Fund operating expenses to become higher than the figures shown.
8. Effective 7/1/09, the Fund began offering Advisor Class shares, which do not have sales charges or a Rule 12b-1 plan. Performance quotations for this class reflect the following methods of calculation: (a) For periods prior to 7/1/09, a restated figure is used based upon the Fund’s Class A performance, excluding the effect of Class A’s maximum initial sales charge, but reflecting the effect of the Class A Rule 12b-1 fees; and (b) for periods after 7/1/09, actual Advisor Class performance is used reflecting all charges and fees applicable to that class. Since 7/1/09 (commencement of sales), the cumulative and average annual total returns of Advisor Class shares were +23.58% and +4.65%.
9. Source: © 2014 Morningstar. The Barclays Municipal Bond Index is a market value-weighted index engineered for the long-term tax-exempt bond market. To be included in the index, bonds must be fixed rate, have at least one year to final maturity and be rated investment grade (Baa3/BBB- or higher) by at least two of the following agencies: Moody’s, Standard & Poor’s and Fitch. The Consumer Price Index (CPI), calculated by the Bureau of Labor Statistics, is a commonly used measure of the inflation rate.
10. Source: Barclays Global Family of Indices. © 2014 Barclays Capital Inc. Used with permission.
Annual Report | 79
Your Fund’s Expenses
Franklin North Carolina Tax-Free Income Fund
As a Fund shareholder, you can incur two types of costs:
- Transaction costs, including sales charges (loads) on Fund purchases; and
- Ongoing Fund costs, including management fees, distribution and service (12b-1) fees, and other Fund expenses. All mutual funds have ongoing costs, sometimes referred to as operating expenses.
The following table shows ongoing costs of investing in the Fund and can help you understand these costs and compare them with those of other mutual funds. The table assumes a $1,000 investment held for the six months indicated.
Actual Fund Expenses
The first line (Actual) for each share class listed in the table provides actual account values and expenses. The “Ending Account Value” is derived from the Fund’s actual return, which includes the effect of Fund expenses.
You can estimate the expenses you paid during the period by following these steps. Of course, your account value and expenses will differ from those in this illustration:
| 1. | Divide your account value by $1,000. |
| | If an account had an $8,600 value, then $8,600 ÷ $1,000 = 8.6. |
| 2. | Multiply the result by the number under the heading “Expenses Paid During Period.” |
| | If Expenses Paid During Period were $7.50, then 8.6 x $7.50 = $64.50. |
In this illustration, the estimated expenses paid this period are $64.50.
Hypothetical Example for Comparison with Other Funds
Information in the second line (Hypothetical) for each class in the table can help you compare ongoing costs of investing in the Fund with those of other mutual funds. This information may not be used to estimate the actual ending account balance or expenses you paid during the period. The hypothetical “Ending Account Value” is based on the actual expense ratio for each class and an assumed 5% annual rate of return before expenses, which does not represent the Fund’s actual return. The figure under the heading “Expenses Paid During Period” shows the hypothetical expenses your account would have incurred under this scenario. You can compare this figure with the 5% hypothetical examples that appear in shareholder reports of other funds.
80 | Annual Report
Your Fund’s Expenses (continued)
Please note that expenses shown in the table are meant to highlight ongoing costs and do not reflect any transaction costs, such as sales charges. Therefore, the second line for each class is useful in comparing ongoing costs only, and will not help you compare total costs of owning different funds. In addition, if transaction costs were included, your total costs would have been higher. Please refer to the Fund prospectus for additional information on operating expenses.
| | | | | | |
| | | Beginning Account | | Ending Account | | Expenses Paid During |
| Class A | | Value 9/1/13 | | Value 2/28/14 | | Period* 9/1/13–2/28/14 |
| Actual | $ | 1,000 | $ | 1,042.80 | $ | 3.24 |
| Hypothetical (5% return before expenses) | $ | 1,000 | $ | 1,021.62 | $ | 3.21 |
| Class C | | | | | | |
| Actual | $ | 1,000 | $ | 1,039.50 | $ | 6.02 |
| Hypothetical (5% return before expenses) | $ | 1,000 | $ | 1,018.89 | $ | 5.96 |
| Advisor Class | | | | | | |
| Actual | $ | 1,000 | $ | 1,043.30 | $ | 2.74 |
| Hypothetical (5% return before expenses) | $ | 1,000 | $ | 1,022.12 | $ | 2.71 |
*Expenses are calculated using the most recent six-month expense ratio, annualized for each class (A: 0.64%; C: 1.19%; and Advisor: 0.54%), multiplied by the average account value over the period, multiplied by 181/365 to reflect the one-half year period.
Annual Report | 81
Franklin Virginia Tax-Free Income Fund
Your Fund’s Goal and Main Investments: Franklin Virginia Tax-Free Income Fund seeks to provide as high a level of income exempt from federal and Virginia personal income taxes as is consistent with prudent investment management and preservation of capital by investing at least 80% of its total assets in securities that pay interest free from such taxes.1
Performance data represent past performance, which does not guarantee future results. Investment return and principal value will fluctuate, and you may have a gain or loss when you sell your shares. Current performance may differ from figures shown. Please visit franklintempleton.com or call (800) 342-5236 for most recent month-end performance.
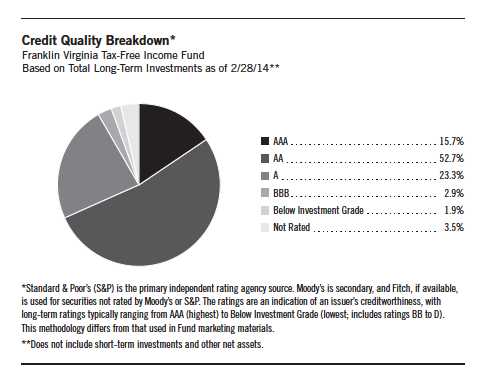
The annual report for Franklin Virginia Tax-Free Income Fund covers the fiscal year ended February 28, 2014.
Performance Overview
The Fund’s Class A share price, as measured by net asset value, decreased from $12.25 on February 28, 2013, to $11.42 on February 28, 2014. The Fund’s Class A shares paid dividends totaling 41.76 cents per share for the same period.2 The Performance Summary beginning on page 86 shows that at the end of this reporting period the Fund’s Class A shares’ distribution rate was 3.70% based on an annualization of the 3.68 cent per share February dividend and the maximum offering price of $11.93 on February 28, 2014.
The dollar value, number of shares or principal amount, and names of all portfolio holdings are listed in the Fund’s Statement of Investments (SOI). The SOI begins on page 148.
82 | Annual Report
| | | |
| Dividend Distributions* | | | |
| Franklin Virginia Tax-Free Income Fund | | | |
| 3/1/13–2/28/14 | | | |
| | Dividend per Share (cents) |
| Month | Class A | Class C | Advisor Class |
| March | 3.33 | 2.75 | 3.43 |
| April | 3.33 | 2.75 | 3.43 |
| May | 3.33 | 2.75 | 3.43 |
| June | 3.33 | 2.78 | 3.43 |
| July | 3.33 | 2.78 | 3.43 |
| August | 3.43 | 2.88 | 3.53 |
| September | 3.48 | 2.98 | 3.57 |
| October | 3.58 | 3.08 | 3.67 |
| November | 3.63 | 3.13 | 3.72 |
| December | 3.63 | 3.13 | 3.72 |
| January | 3.68 | 3.18 | 3.77 |
| February | 3.68 | 3.18 | 3.77 |
| Total | 41.76 | 35.37 | 42.90 |
*Assumes shares were purchased and held for the entire accrual period. Since dividends accrue daily, your actual distributions will vary depending on the date you purchased your shares and any account activity. All Fund distributions will vary depending upon current market conditions, and past distributions are not indicative of future trends.
An investor in the 2014 maximum combined effective federal and Virginia personal income tax bracket of 46.87% (including 3.8% Medicare tax) would need to earn a distribution rate of 6.96% from a taxable investment to match the Fund’s Class A tax-free distribution rate. For the Fund’s Class C and Advisor shares’ performance, please see the Performance Summary.
Commonwealth Update
Virginia’s economy continued to recover during the period under review. Although the commonwealth’s economy is relatively diverse, it is more vulnerable to federal budget cuts than other states because of its greater than average exposure to the federal government and the military. To cope with the potential impact of federal budget cuts, the commonwealth increased its rainy day funding requirement and the governor created a trust fund to enable the continuation of programs affected by federal budget cuts. For the 12-month period, the sectors that added jobs included education and health services, other services and financial activities. Virginia’s unemployment rate, which has historically been below the national rate, was 4.9% in February, compared to the 6.7% national rate.3
Annual Report | 83
Portfolio Breakdown
Franklin Virginia Tax-Free Income Fund 2/28/14
| | |
| % of Total | |
| Long-Term Investments* | |
| Hospital & Health Care | 16.7 | % |
| Utilities | 14.8 | % |
| Higher Education | 12.7 | % |
| Transportation | 12.0 | % |
| Refunded | 11.7 | % |
| General Obligation | 10.3 | % |
| Housing | 5.9 | % |
| Other Revenue | 5.8 | % |
| Subject to Government Appropriations | 5.1 | % |
| Tax-Supported | 5.0 | % |
*Does not include short-term investments and other net assets.
The commonwealth ended fiscal year 2013 with a general fund revenue surplus resulting largely from better-than-expected individual nonwithholding tax collections and lower-than-projected individual refunds. However, payroll withholding and sales tax collections were lower than expected. For fiscal years 2014 through 2016, Virginia projected softer revenue growth based on expectations that slower job growth and federal budget cuts could hamper revenue collections. The enacted fiscal 2013–2014 biennial budget included contributions to the retirement system for the commonwealth’s employees and public teachers.
Virginia’s net tax-supported debt was 2.9% of personal income and $1,315 per capita, compared with the 2.8% and $1,074 national medians.4 Moody’s Investors Service maintained Virginia’s general obligation debt rating of Aaa with a stable outlook, reflecting the independent credit rating agency’s view of the commonwealth’s conservative fiscal management, diverse economy that outperformed the nation’s despite a recent slowdown, and a debt affordability model that has kept its debt burden under control.5 Some challenges cited by Moody’s included the ongoing effects of a slow economic recovery on the commonwealth’s financial performance, reduced reserve levels, spending pressures from education and transportation needs, and direct exposure to the federal government.
Manager’s Discussion
We used various investment strategies during the 12 months under review as we sought to maximize tax-free income for shareholders. Puerto Rico’s municipal bond market is widely traded because of its federal and state tax-exemption advantages. During the reporting period, some Puerto Rico issuers experienced a series of downgrades from Standard & Poor’s, Moody’s and Fitch Ratings. In February 2014, these credit rating firms downgraded their respective ratings of Puerto Rico’s general obligation debt to below investment grade, along with the ratings of certain related Puerto Rico issuers. Additionally, each rating agency maintained a negative outlook on certain Puerto Rico issuers, and further downgrades are possible. The Fund is not required to sell securities that have been downgraded to below investment grade, but it is prohibited from making further purchases of such securities as long as the securities are not rated investment grade by at least one U.S. nationally recognized rating service. Rating actions combined with news related to Puerto Rico’s financial position and future financing endeavors caused its bond market to experience sharp declines in the latter half of 2013 and contrasting positive performance year-to-date in 2014.
84 | Annual Report
Thank you for your continued participation in Franklin Virginia Tax-Free Income Fund. We believe our conservative, buy-and-hold investment strategy can help us achieve high, current, tax-free income for shareholders.
The foregoing information reflects our analysis, opinions and portfolio holdings as of February 28, 2014, the end
of the reporting period. The way we implement our main investment strategies and the resulting portfolio holdings
may change depending on factors such as market and economic conditions. These opinions may not be relied
upon as investment advice or an offer for a particular security. The information is not a complete analysis of
every aspect of any market, state, industry, security or the Fund. Statements of fact are from sources considered
reliable, but the investment manager makes no representation or warranty as to their completeness or accuracy.
Although historical performance is no guarantee of future results, these insights may help you understand our
investment management philosophy.
1. For investors subject to alternative minimum tax, a small portion of Fund dividends may be taxable. Distributions
of capital gains are generally taxable. To avoid imposition of 28% backup withholding on all Fund distributions and
redemption proceeds, U.S. investors must be properly certified on Form W-9 and non-U.S. investors on Form W-8BEN.
2. All Fund distributions will vary depending upon current market conditions, and past distributions are not indicative
of future trends.
3. Source: Bureau of Labor Statistics.
4. Source: Moody’s Investors Service, “2013 State Debt Medians Report,” 5/29/13.
5. This does not indicate Moody’s rating of the Fund.
Annual Report | 85
Performance Summary as of 2/28/14
Franklin Virginia Tax-Free Income Fund
Your dividend income will vary depending on dividends or interest paid by securities in the Fund’s portfolio, adjusted for operating expenses of each class. Capital gain distributions are net profits realized from the sale of portfolio securities. The performance table and graphs do not reflect any taxes that a shareholder would pay on Fund dividends, capital gain distributions, if any, or any realized gains on the sale of Fund shares. Total return reflects reinvestment of the Fund’s dividends and capital gain distributions, if any, and any unrealized gains or losses.
| | | | | | | | |
| Price and Distribution Information | | | | | | |
| Class A (Symbol: FRVAX) | | | | Change | | 2/28/14 | | 2/28/13 |
| Net Asset Value (NAV) | | | -$ | 0.83 | $ | 11.42 | $ | 12.25 |
| Distributions (3/1/13–2/28/14) | | | | | | | | |
| Dividend Income | $ | 0.4176 | | | | | | |
| Class C (Symbol: FVAIX) | | | | Change | | 2/28/14 | | 2/28/13 |
| Net Asset Value (NAV) | | | -$ | 0.84 | $ | 11.58 | $ | 12.42 |
| Distributions (3/1/13–2/28/14) | | | | | | | | |
| Dividend Income | $ | 0.3537 | | | | | | |
| Advisor Class (Symbol: FRVZX) | | | | Change | | 2/28/14 | | 2/28/13 |
| Net Asset Value (NAV) | | | -$ | 0.83 | $ | 11.42 | $ | 12.25 |
| Distributions (3/1/13–2/28/14) | | | | | | | | |
| Dividend Income | $ | 0.4290 | | | | | | |
86 | Annual Report
Performance Summary (continued)
Performance
Cumulative total return excludes sales charges. Average annual total returns include maximum sales charges. Class A: 4.25% maximum initial sales charge; Class C: 1% contingent deferred sales charge in first year only; Advisor Class: no sales charges.
| | | | | | | | | | |
| Class A | | | 1-Year | | | 5-Year | | | 10-Year | |
| Cumulative Total Return1 | | | -3.33 | % | + | 27.14 | % | + | 44.48 | % |
| Average Annual Total Return2 | | | -7.41 | % | + | 4.00 | % | + | 3.30 | % |
| Avg. Ann. Total Return (3/31/14)3 | | | -6.50 | % | + | 4.00 | % | + | 3.33 | % |
| Distribution Rate4 | 3.70 | % | | | | | | | | |
| Taxable Equivalent Distribution Rate5 | 6.96 | % | | | | | | | | |
| 30-Day Standardized Yield6 | 2.93 | % | | | | | | | | |
| Taxable Equivalent Yield5 | 5.52 | % | | | | | | | | |
| Total Annual Operating Expenses7 | 0.64 | % | | | | | | | | |
| Class C | | | 1-Year | | | 5-Year | | | 10-Year | |
| Cumulative Total Return1 | | | -3.89 | % | + | 23.64 | % | + | 36.86 | % |
| Average Annual Total Return2 | | | -4.82 | % | + | 4.33 | % | + | 3.19 | % |
| Avg. Ann. Total Return (3/31/14)3 | | | -3.85 | % | + | 4.35 | % | + | 3.22 | % |
| Distribution Rate4 | 3.30 | % | | | | | | | | |
| Taxable Equivalent Distribution Rate5 | 6.21 | % | | | | | | | | |
| 30-Day Standardized Yield6 | 2.53 | % | | | | | | | | |
| Taxable Equivalent Yield5 | 4.76 | % | | | | | | | | |
| Total Annual Operating Expenses7 | 1.19 | % | | | | | | | | |
| Advisor Class8 | | | 1-Year | | | 5-Year | | | 10-Year | |
| Cumulative Total Return1 | | | -3.24 | % | + | 27.70 | % | + | 45.12 | % |
| Average Annual Total Return2 | | | -3.24 | % | + | 5.01 | % | + | 3.79 | % |
| Avg. Ann. Total Return (3/31/14)3 | | | -2.24 | % | + | 5.01 | % | + | 3.83 | % |
| Distribution Rate4 | 3.96 | % | | | | | | | | |
| Taxable Equivalent Distribution Rate5 | 7.45 | % | | | | | | | | |
| 30-Day Standardized Yield6 | 3.18 | % | | | | | | | | |
| Taxable Equivalent Yield5 | 5.99 | % | | | | | | | | |
| Total Annual Operating Expenses7 | 0.54 | % | | | | | | | | |
Performance data represent past performance, which does not guarantee future results. Investment return and principal value will fluctuate, and you may have a gain or loss when you sell your shares. Current performance may differ from figures shown. For most recent month-end performance, go to franklintempleton.com or call (800) 342-5236.
Annual Report | 87
Performance Summary (continued)
Total Return Index Comparison for a Hypothetical $10,000 Investment
Total return represents the change in value of an investment over the periods shown. It includes any applicable maximum sales charge, Fund expenses, account fees and reinvested distributions. The unmanaged index includes reinvestment of any income or distributions. It differs from the Fund in composition and does not pay management fees or expenses. One cannot invest directly in an index.
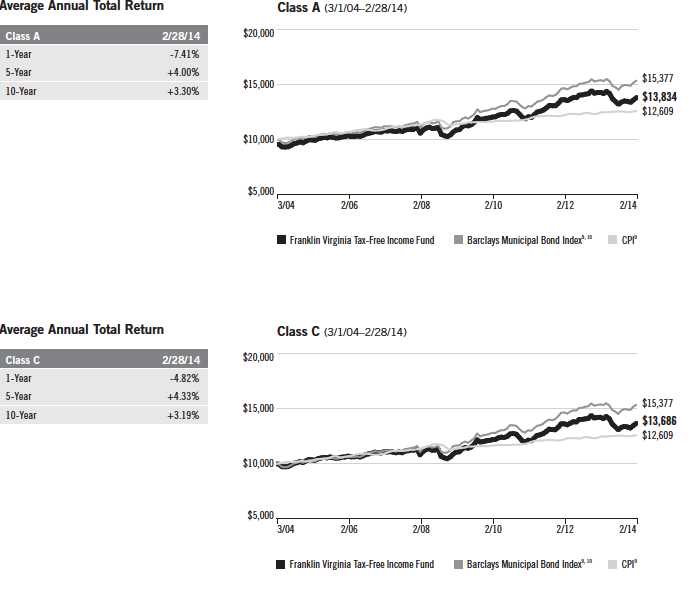
88 | Annual Report
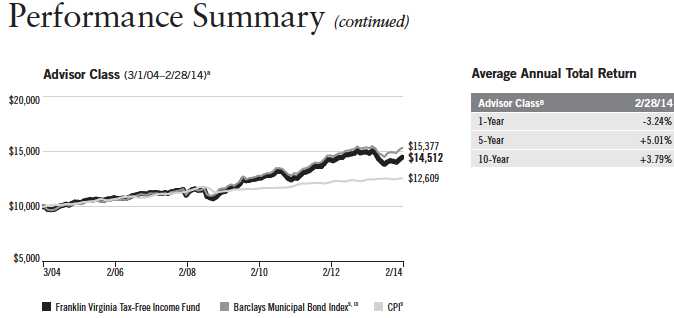
All investments involve risks, including possible loss of principal. Because municipal bonds are sensitive to interest rate movements, the Fund’s yield and share price will fluctuate with market conditions. Bond prices generally move in the opposite direction of interest rates. Thus, as prices of bonds in the Fund adjust to a rise in interest rates, the Fund’s share price may decline. Because the Fund invests principally in a single state, it is subject to greater risk of adverse economic and regulatory changes in that state than a geographically diversified fund. The Fund holds a small portion of its assets in Puerto Rico municipal bonds that have been impacted by recent adverse economic and market changes, which may cause the Fund’s share price to decline. Changes in the credit rating of a bond, or in the credit rating or financial strength of a bond’s issuer, insurer or guarantor, may affect the bond’s value. The Fund may invest a significant part of its assets in municipal securities that finance similar types of projects, such as utilities, hospitals, higher education and transportation. A change that affects one project would likely affect all similar projects, thereby increasing market risk. The Fund is actively managed but there is no guarantee that the manager’s investment decisions will produce the desired results. The Fund’s prospectus also includes a description of the main investment risks.
Class C: These shares have higher annual fees and expenses than Class A shares.
Advisor Class: Shares are available to certain eligible investors as described in the prospectus.
1. Cumulative total return represents the change in value of an investment over the periods indicated.
2. Average annual total return represents the average annual change in value of an investment over the periods indicated.
3. In accordance with SEC rules, we provide standardized average annual total return information through the latest calendar quarter.
4. Distribution rate is based on an annualization of the respective class’s February dividend and the maximum offering price (NAV for Classes C and Advisor) per share on 2/28/14.
5. Taxable equivalent distribution rate and yield assume the published rates as of 12/18/13 for the maximum combined effective federal and Virginia personal income tax rate of 46.87%, based on the federal income tax rate of 39.60% plus 3.8% Medicare tax.
6. The 30-day standardized yield for the month ended 2/28/14 reflects an estimated yield to maturity (assuming all portfolio securities are held to maturity). It should be regarded as an estimate of the Fund’s rate of investment income, and it may not equal the Fund’s actual income distribution rate (which reflects the Fund’s past dividends paid to shareholders) or the income reported in the Fund’s financial statements.
7. Figures are as stated in the Fund’s current prospectus. In periods of market volatility, assets may decline significantly, causing total annual Fund operating expenses to become higher than the figures shown.
8. Effective 7/1/09, the Fund began offering Advisor Class shares, which do not have sales charges or a Rule 12b-1 plan. Performance quotations for this class reflect the following methods of calculation: (a) For periods prior to 7/1/09, a restated figure is used based upon the Fund’s Class A performance, excluding the effect of Class A’s maximum initial sales charge, but reflecting the effect of the Class A Rule 12b-1 fees; and (b) for periods after 7/1/09, actual Advisor Class performance is used reflecting all charges and fees applicable to that class. Since 7/1/09 (commencement of sales), the cumulative and average annual total returns of Advisor Class shares were +23.54% and +4.64%.
9. Source: © 2014 Morningstar. The Barclays Municipal Bond Index is a market value-weighted index engineered for the long-term tax-exempt bond market. To be included in the index, bonds must be fixed rate, have at least one year to final maturity and be rated investment grade (Baa3/BBB- or higher) by at least two of the following agencies: Moody’s, Standard & Poor’s and Fitch. The Consumer Price Index (CPI), calculated by the Bureau of Labor Statistics, is a commonly used measure of the inflation rate.
10. Source: Barclays Global Family of Indices. © 2014 Barclays Capital Inc. Used with permission.
Annual Report | 89
Your Fund’s Expenses
Franklin Virginia Tax-Free Income Fund
As a Fund shareholder, you can incur two types of costs:
- Transaction costs, including sales charges (loads) on Fund purchases; and
- Ongoing Fund costs, including management fees, distribution and service (12b-1) fees, and other Fund expenses. All mutual funds have ongoing costs, sometimes referred to as operating expenses.
The following table shows ongoing costs of investing in the Fund and can help you understand these costs and compare them with those of other mutual funds. The table assumes a $1,000 investment held for the six months indicated.
Actual Fund Expenses
The first line (Actual) for each share class listed in the table provides actual account values and expenses. The “Ending Account Value” is derived from the Fund’s actual return, which includes the effect of Fund expenses.
You can estimate the expenses you paid during the period by following these steps. Of course, your account value and expenses will differ from those in this illustration:
| 1. | Divide your account value by $1,000. |
| | If an account had an $8,600 value, then $8,600 ÷ $1,000 = 8.6. |
| 2. | Multiply the result by the number under the heading “Expenses Paid During Period.” |
| | If Expenses Paid During Period were $7.50, then 8.6 x $7.50 = $64.50. |
In this illustration, the estimated expenses paid this period are $64.50.
Hypothetical Example for Comparison with Other Funds
Information in the second line (Hypothetical) for each class in the table can help you compare ongoing costs of investing in the Fund with those of other mutual funds. This information may not be used to estimate the actual ending account balance or expenses you paid during the period. The hypothetical “Ending Account Value” is based on the actual expense ratio for each class and an assumed 5% annual rate of return before expenses, which does not represent the Fund’s actual return. The figure under the heading “Expenses Paid During Period” shows the hypothetical expenses your account would have incurred under this scenario. You can compare this figure with the 5% hypothetical examples that appear in shareholder reports of other funds.
90 | Annual Report
Your Fund’s Expenses (continued)
Please note that expenses shown in the table are meant to highlight ongoing costs and do not reflect any transaction costs, such as sales charges. Therefore, the second line for each class is useful in comparing ongoing costs only, and will not help you compare total costs of owning different funds. In addition, if transaction costs were included, your total costs would have been higher. Please refer to the Fund prospectus for additional information on operating expenses.
| | | | | | |
| | | Beginning Account | | Ending Account | | Expenses Paid During |
| Class A | | Value 9/1/13 | | Value 2/28/14 | | Period* 9/1/13–2/28/14 |
| Actual | $ | 1,000 | $ | 1,047.80 | $ | 3.35 |
| Hypothetical (5% return before expenses) | $ | 1,000 | $ | 1,021.52 | $ | 3.31 |
| Class C | | | | | | |
| Actual | $ | 1,000 | $ | 1,045.30 | $ | 6.14 |
| Hypothetical (5% return before expenses) | $ | 1,000 | $ | 1,018.79 | $ | 6.06 |
| Advisor Class | | | | | | |
| Actual | $ | 1,000 | $ | 1,048.30 | $ | 2.84 |
| Hypothetical (5% return before expenses) | $ | 1,000 | $ | 1,022.02 | $ | 2.81 |
*Expenses are calculated using the most recent six-month expense ratio, annualized for each class (A: 0.66%; C: 1.21%; and Advisor: 0.56%), multiplied by the average account value over the period, multiplied by 181/365 to reflect the one-half year period.
Annual Report | 91
| | | | | | | | | | | | | | | |
| Franklin Tax-Free Trust | | | | | | | | | | | | | | | |
| Financial Highlights | | | | | | | | | | | | | | | |
| |
| Franklin Alabama Tax-Free Income Fund | | | | | | | | | | | | | | | |
| | | | | | Year Ended February 28, | | | | |
| Class A | | 2014 | | | 2013 | | | 2012 | a | | 2011 | | | 2010 | |
| Per share operating performance | | | | | | | | | | | | | | | |
| (for a share outstanding throughout the year) | | | | | | | | | | | | | | | |
| Net asset value, beginning of year | $ | 11.91 | | $ | 11.71 | | $ | 10.66 | | $ | 11.17 | | $ | 10.59 | |
| Income from investment operationsb: | | | | | | | | | | | | | | | |
| Net investment incomec | | 0.44 | | | 0.44 | | | 0.47 | | | 0.47 | | | 0.48 | |
| Net realized and unrealized gains (losses) | | (0.74 | ) | | 0.20 | | | 1.06 | | | (0.50 | ) | | 0.58 | |
| Total from investment operations | | (0.30 | ) | | 0.64 | | | 1.53 | | | (0.03 | ) | | 1.06 | |
| Less distributions from: | | | | | | | | | | | | | | | |
| Net investment income | | (0.43 | ) | | (0.43 | ) | | (0.48 | ) | | (0.48 | ) | | (0.48 | ) |
| Net realized gains | | (—)d | | | (0.01 | ) | | — | | | — | | | — | |
| Total distributions | | (0.43 | ) | | (0.44 | ) | | (0.48 | ) | | (0.48 | ) | | (0.48 | ) |
| Net asset value, end of year | $ | 11.18 | | $ | 11.91 | | $ | 11.71 | | $ | 10.66 | | $ | 11.17 | |
| |
| Total returne | | (2.49 | )% | | 5.57 | % | | 14.61 | % | | (0.38 | )% | | 10.14 | % |
| |
| Ratios to average net assets | | | | | | | | | | | | | | | |
| Expenses | | 0.71 | % | | 0.70 | % | | 0.71 | % | | 0.71 | % | | 0.71 | % |
| Net investment income | | 3.86 | % | | 3.68 | % | | 4.22 | % | | 4.25 | % | | 4.37 | % |
| |
| Supplemental data | | | | | | | | | | | | | | | |
| Net assets, end of year (000’s) | $ | 218,826 | | $ | 270,783 | | $ | 254,681 | | $ | 226,863 | | $ | 244,860 | |
| Portfolio turnover rate | | 14.44 | % | | 17.76 | % | | 5.35 | % | | 11.32 | % | | 7.80 | % |
aFor the year ended February 29.
bThe amount shown for a share outstanding throughout the period may not correlate with the Statement of Operations for the period due to the timing of sales and repurchases of
the Fund shares in relation to income earned and/or fluctuating market value of the investments of the Fund.
cBased on average daily shares outstanding.
dAmount rounds to less than $0.01 per share.
eTotal return does not reflect sales commissions or contingent deferred sales charges, if applicable.
92 | The accompanying notes are an integral part of these financial statements. | Annual Report
| | | | | | | | | | | | | | | |
| Franklin Tax-Free Trust | | | | | | | | | | | | | | | |
| Financial Highlights (continued) | | | | | | | | | | | | | | | |
| |
| Franklin Alabama Tax-Free Income Fund | | | | | | | | | | | | | | | |
| | | | | | Year Ended February 28, | | | | |
| Class C | | 2014 | | | 2013 | | | 2012 | a | | 2011 | | | 2010 | |
| Per share operating performance | | | | | | | | | | | | | | | |
| (for a share outstanding throughout the year) | | | | | | | | | | | | | | | |
| Net asset value, beginning of year | $ | 12.04 | | $ | 11.84 | | $ | 10.77 | | $ | 11.28 | | $ | 10.69 | |
| Income from investment operationsb: | | | | | | | | | | | | | | | |
| Net investment incomec | | 0.38 | | | 0.38 | | | 0.41 | | | 0.41 | | | 0.42 | |
| Net realized and unrealized gains (losses) | | (0.74 | ) | | 0.20 | | | 1.08 | | | (0.51 | ) | | 0.59 | |
| Total from investment operations | | (0.36 | ) | | 0.58 | | | 1.49 | | | (0.10 | ) | | 1.01 | |
| Less distributions from: | | | | | | | | | | | | | | | |
| Net investment income | | (0.37 | ) | | (0.37 | ) | | (0.42 | ) | | (0.41 | ) | | (0.42 | ) |
| Net realized gains | | (—)d | | | (0.01 | ) | | — | | | — | | | — | |
| Total distributions | | (0.37 | ) | | (0.38 | ) | | (0.42 | ) | | (0.41 | ) | | (0.42 | ) |
| Net asset value, end of year | $ | 11.31 | | $ | 12.04 | | $ | 11.84 | | $ | 10.77 | | $ | 11.28 | |
| |
| Total returne | | (2.99 | )% | | 4.92 | % | | 14.04 | % | | (0.94 | )% | | 9.54 | % |
| |
| Ratios to average net assets | | | | | | | | | | | | | | | |
| Expenses | | 1.26 | % | | 1.25 | % | | 1.26 | % | | 1.26 | % | | 1.26 | % |
| Net investment income | | 3.31 | % | | 3.13 | % | | 3.67 | % | | 3.70 | % | | 3.82 | % |
| |
| Supplemental data | | | | | | | | | | | | | | | |
| Net assets, end of year (000’s) | $ | 49,940 | | $ | 65,690 | | $ | 54,363 | | $ | 47,345 | | $ | 49,828 | |
| Portfolio turnover rate | | 14.44 | % | | 17.76 | % | | 5.35 | % | | 11.32 | % | | 7.80 | % |
aFor the year ended February 29.
bThe amount shown for a share outstanding throughout the period may not correlate with the Statement of Operations for the period due to the timing of sales and repurchases of
the Fund shares in relation to income earned and/or fluctuating market value of the investments of the Fund.
cBased on average daily shares outstanding.
dAmount rounds to less than $0.01 per share.
eTotal return does not reflect sales commissions or contingent deferred sales charges, if applicable.
Annual Report | The accompanying notes are an integral part of these financial statements. | 93
| | | | |
| Franklin Tax-Free Trust | | | | |
| |
| Statement of Investments, February 28, 2014 | | | | |
| |
| |
| Franklin Alabama Tax-Free Income Fund | | Principal Amount | | Value |
| Municipal Bonds 99.1% | | | | |
| Alabama 89.9% | | | | |
| Alabama State Port Authority Docks Facilities Revenue, Refunding, 6.00%, 10/01/40 | $ | 3,000,000 | $ | 3,354,691 |
| Alabaster Sewer Revenue, NATL Insured, Pre-Refunded, 5.00%, 4/01/29 | | 2,055,000 | | 2,062,275 |
| Anniston PBA Building Revenue, Judicial Center Project, AGMC Insured, 5.00%, 3/01/43 | | 4,120,000 | | 4,300,085 |
| Athens GO, wts., XLCA Insured, 5.00%, 2/01/36 | | 2,560,000 | | 2,614,451 |
| Auburn University General Fee Revenue, Series A, AGMC Insured, 5.00%, 6/01/38 | | 5,000,000 | | 5,148,650 |
| Baldwin County Board of Education Revenue, School wts., Refunding, 5.00%, | | | | |
| 6/01/24 | | 2,605,000 | | 3,017,710 |
| 6/01/26 | | 2,870,000 | | 3,259,201 |
| 6/01/27 | | 3,015,000 | | 3,363,534 |
| Bessemer Governmental Utility Services Corp. Water Supply Revenue, Refunding, Series A, | | | | |
| Assured Guaranty, 5.00%, 6/01/39 | | 3,825,000 | | 3,942,236 |
| Birmingham GO, Capital Appreciation, Series A, zero cpn. to 3/01/17, 5.00% thereafter, | | | | |
| 3/01/43 | | 5,000,000 | | 4,430,050 |
| Birmingham Special Care Facilities Financing Authority, Health Care Facility Revenue, | | | | |
| Children’s Hospital, Assured Guaranty, 6.00%, 6/01/39 | | 4,000,000 | | 4,472,600 |
| Birmingham Waterworks Board Water Revenue, | | | | |
| Series A, Assured Guaranty, 5.25%, 1/01/39 | | 5,950,000 | | 6,291,649 |
| Series B, 5.00%, 1/01/43 | | 3,745,000 | | 3,960,937 |
| Butler County IDA Environmental Improvement Revenue, International Paper Co. Projects, | | | | |
| Series A, 7.00%, 9/01/32 | | 1,000,000 | | 1,116,060 |
| Butler County Public Education Cooperative District Revenue, Limited Obligation School, | | | | |
| Series A, XLCA Insured, 5.00%, 7/01/37 | | 9,025,000 | | 8,938,540 |
| Central Elmore Water and Sewer Authority Revenue, Water, NATL Insured, Pre-Refunded, | | | | |
| 5.00%, 1/01/29 | | 4,290,000 | | 4,656,109 |
| Chatom IDB Gulf Opportunity Zone Revenue, PowerSouth Energy Cooperative, Refunding, | | | | |
| Series A, Assured Guaranty, 5.00%, | | | | |
| 8/01/30 | | 5,250,000 | | 5,758,200 |
| 8/01/37 | | 5,000,000 | | 5,314,750 |
| Cullman Utilities Board Water Revenue, AGMC Insured, 5.00%, 9/01/41 | | 3,000,000 | | 3,112,650 |
| DCH Health Care Authority Health Care Facilities Revenue, 5.125%, 6/01/36 | | 7,000,000 | | 7,141,050 |
| East Alabama Health Care Authority Health Care Facilities Revenue, Mandatory Put 9/01/18, | | | | |
| Series A, 5.25%, 9/01/36 | | 5,000,000 | | 5,564,700 |
| Series B, 5.50%, 9/01/33 | | 4,500,000 | | 5,086,170 |
| Fairfield GO, wts., AMBAC Insured, 5.00%, 2/01/29 | | 235,000 | | 228,258 |
| Homewood Educational Building Authority Revenue, Educational Facilities, Samford University, | | | | |
| Series A, AGMC Insured, 5.00%, 12/01/41 | | 10,000,000 | | 10,320,800 |
| Homewood GO, Capital Improvement wts., 5.00%, 9/01/42 | | 4,000,000 | | 4,226,520 |
| Houston County Health Care Authority Revenue, Refunding, Series A, AMBAC Insured, 5.25%, | | | | |
| 10/01/30 | | 5,000,000 | | 4,934,500 |
| Huntsville PBA Lease Revenue, Municipal Justice and Public Safety Center, Capital | | | | |
| Improvement and Refunding, NATL Insured, 5.00%, 10/01/33 | | 8,000,000 | | 8,582,880 |
| Jefferson County Revenue, Limited Obligation School wts., Series A, 5.00%, 1/01/24 | | 2,000,000 | | 1,975,460 |
| Leeds Public Educational Building Authority Educational Facilities Revenue, Assured Guaranty, | | | | |
| 5.125%, 4/01/33 | | 7,410,000 | | 7,785,539 |
| Limestone County Water and Sewer Authority Water Revenue, | | | | |
| AMBAC Insured, 5.00%, 12/01/29 | | 1,540,000 | | 1,584,475 |
| AMBAC Insured, 5.00%, 12/01/31 | | 3,910,000 | | 4,011,973 |
| Assured Guaranty, 5.00%, 12/01/39 | | 3,750,000 | | 3,932,512 |
94 | Annual Report
| | | | |
| Franklin Tax-Free Trust | | | | |
| |
| Statement of Investments, February 28, 2014 (continued) | | | | |
| |
| |
| Franklin Alabama Tax-Free Income Fund | | Principal Amount | | Value |
| Municipal Bonds (continued) | | | | |
| Alabama (continued) | | | | |
| Madison County Board of Education Capital Outlay Revenue, Tax Anticipation wts., | | | | |
| Assured Guaranty, 5.125%, 9/01/34 | $ | 600,000 | $ | 632,268 |
| Series A, AMBAC Insured, Pre-Refunded, 5.00%, 9/01/34 | | 1,000,000 | | 1,023,590 |
| Madison GO, wts., Refunding, XLCA Insured, 4.75%, 12/01/36 | | 1,000,000 | | 1,017,660 |
| Marshall County Health Care Authority Revenue, Refunding, AMBAC Insured, 4.75%, | | | | |
| 2/01/33 | | 3,000,000 | | 2,800,950 |
| Mobile GO, wts., Series C, 5.50%, 2/15/30 | | 2,000,000 | | 2,128,680 |
| Mobile Public Educational Building Authority Revenue, Limited Obligation School, Series A, | | | | |
| Assured Guaranty, 5.00%, 3/01/33 | | 6,500,000 | | 6,771,505 |
| Mobile Water and Sewer Commissioners Water and Sewer Revenue, Mobile Water, | | | | |
| BHAC Insured, 5.00%, 1/01/36 | | 10,000,000 | | 10,184,100 |
| Morgan County Board of Education Capital Outlay School wts., Revenue, 5.00%, 3/01/35 | | 7,020,000 | | 7,470,263 |
| Opelika Water Board Revenue, Assured Guaranty, 5.00%, 6/01/37 | | 3,000,000 | | 3,172,800 |
| Orange Beach Water Sewer and Fire Protection Authority Revenue, NATL Insured, Pre-Refunded, | | | | |
| 5.00%, 5/15/35 | | 2,000,000 | | 2,114,460 |
| Oxford GO, wts., Series C, 5.00%, 10/01/29 | | 1,435,000 | | 1,589,822 |
| aPhenix City GO, School wts., Series A, 5.00%, 8/01/43 | | 3,000,000 | | 3,156,180 |
| Phenix City Water and Sewer Revenue, wts., Series A, AGMC Insured, 5.00%, 8/15/40 | | 2,000,000 | | 2,139,540 |
| Selma IDBR, Gulf Opportunity Zone, | | | | |
| International Paper Co. Project, Series A, 5.375%, 12/01/35 | | 3,000,000 | | 3,100,380 |
| International Paper Co. Projects, Series A, 5.80%, 5/01/34 | | 3,000,000 | | 3,153,150 |
| Troy Public Educational Building Authority Dormitory Revenue, Troy University Housing LLC | | | | |
| Project, Series A, Assured Guaranty, 5.00%, 9/01/32 | | 5,000,000 | | 5,186,950 |
| Troy Public Educational Building Authority Educational Facilities Revenue, AGMC Insured, | | | | |
| 5.25%, 12/01/40 | | 2,000,000 | | 2,148,720 |
| Trussville GO, wts., | | | | |
| Series A, NATL RE, FGIC Insured, 5.00%, 10/01/36 | | 4,740,000 | | 4,751,186 |
| Series B, 5.00%, 10/01/39 | | 3,000,000 | | 3,224,190 |
| Tuscaloosa Public Educational Building Authority Student Housing Revenue, Ridgecrest Student | | | | |
| Housing LLC, University of Alabama Ridgecrest Residential Project, Assured Guaranty, 6.75%, | | | | |
| 7/01/38 | | 5,000,000 | | 5,521,650 |
| University of Alabama at Birmingham Hospital Revenue, Refunding, Series A, AMBAC Insured, | | | | |
| 5.00%, 9/01/41 | | 9,000,000 | | 9,052,200 |
| University of Alabama General Revenue, University of Alabama at Birmingham, Refunding, | | | | |
| Series D-2, 5.00%, 10/01/37 | | 7,520,000 | | 8,112,952 |
| University of South Alabama University Facilities Revenue, Capital Improvement, BHAC Insured, | | | | |
| 5.00%, 8/01/38 | | 5,000,000 | | 5,169,300 |
| Valley Special Care Facilities Financing Authority Revenue, Lanier Memorial Hospital, Series A, | | | | |
| 5.65%, 11/01/22 | | 3,465,000 | | 3,465,000 |
| | | | | 241,576,711 |
| U.S. Territories 9.2% | | | | |
| Puerto Rico 9.2% | | | | |
| Puerto Rico Commonwealth Aqueduct and Sewer Authority Revenue, senior lien, Series A, | | | | |
| 6.00%, 7/01/38 | | 1,000,000 | | 756,910 |
| Puerto Rico Commonwealth GO, Public Improvement, Refunding, AGMC Insured, 5.125%, | | | | |
| 7/01/30 | | 650,000 | | 589,323 |
| Puerto Rico Commonwealth Highways and Transportation Authority Transportation Revenue, | | | | |
| Refunding, Series N, Assured Guaranty, 5.25%, 7/01/36 | | 10,335,000 | | 8,950,213 |
| |
| | | Annual Report | 95 |
| | | | |
| Franklin Tax-Free Trust | | | | |
| |
| Statement of Investments, February 28, 2014 (continued) | | | | |
| |
| Franklin Alabama Tax-Free Income Fund | | Principal Amount | | Value |
| Municipal Bonds (continued) | | | | |
| U.S. Territories (continued) | | | | |
| Puerto Rico (continued) | | | | |
| Puerto Rico Electric Power Authority Power Revenue, Series WW, 5.50%, 7/01/38 | $ | 3,350,000 | $ | 2,277,397 |
| Puerto Rico Sales Tax FICO Sales Tax Revenue, first subordinate, Series A, | | | | |
| 5.75%, 8/01/37 | | 2,000,000 | | 1,625,840 |
| 5.375%, 8/01/39 | | 4,500,000 | | 3,462,570 |
| 6.00%, 8/01/42 | | 8,500,000 | | 7,009,270 |
| | | | | 24,671,523 |
| Total Municipal Bonds (Cost $263,759,092) 99.1% | | | | 266,248,234 |
| Other Assets, less Liabilities 0.9% | | | | 2,517,832 |
| Net Assets 100.0% | | | $ | 268,766,066 |
| |
| |
| See Abbreviations on page 182. | | | | |
| |
| aA portion or all of the security purchased on a delayed delivery basis. See Note 1(b). | | | | |
96 | The accompanying notes are an integral part of these financial statements. | Annual Report
| | | | | | | | | | | | | | | |
| Franklin Tax-Free Trust | | | | | | | | | | | | | |
| Financial Highlights | | | | | | | | | | | | | | | |
| |
| Franklin Florida Tax-Free Income Fund | | | | | | | | | | | | | | | |
| | | | | | Year Ended February 28, | | | | |
| Class A | | 2014 | | | 2013 | | | 2012 | a | | 2011 | | | 2010 | |
| Per share operating performance | | | | | | | | | | | | | | | |
| (for a share outstanding throughout the year) | | | | | | | | | | | | | | | |
| Net asset value, beginning of year | $ | 11.96 | | $ | 11.88 | | $ | 11.08 | | $ | 11.45 | | $ | 10.90 | |
| Income from investment operationsb: | | | | | | | | | | | | | | | |
| Net investment incomec | | 0.46 | | | 0.47 | | | 0.52 | | | 0.53 | | | 0.53 | |
| Net realized and unrealized gains (losses) | | (0.90 | ) | | 0.13 | | | 0.81 | | | (0.37 | ) | | 0.55 | |
| Total from investment operations | | (0.44 | ) | | 0.60 | | | 1.33 | | | 0.16 | | | 1.08 | |
| Less distributions from: | | | | | | | | | | | | | | | |
| Net investment income | | (0.44 | ) | | (0.46 | ) | | (0.53 | ) | | (0.53 | ) | | (0.53 | ) |
| Net realized gains | | (0.03 | ) | | (0.06 | ) | | — | | | — | | | — | |
| Total distributions | | (0.47 | ) | | (0.52 | ) | | (0.53 | ) | | (0.53 | ) | | (0.53 | ) |
| Net asset value, end of year | $ | 11.05 | | $ | 11.96 | | $ | 11.88 | | $ | 11.08 | | $ | 11.45 | |
| |
| Total returnd | | (3.65 | )% | | 5.15 | % | | 12.26 | % | | 1.38 | % | | 10.09 | % |
| |
| Ratios to average net assets | | | | | | | | | | | | | | | |
| Expenses | | 0.62 | % | | 0.62 | % | | 0.62 | % | | 0.62 | % | | 0.62 | % |
| Net investment income | | 4.13 | % | | 3.95 | % | | 4.57 | % | | 4.62 | % | | 4.74 | % |
| |
| Supplemental data | | | | | | | | | | | | | | | |
| Net assets, end of year (000’s) | $ | 737,869 | | $ | 1,023,241 | | $ | 1,022,293 | | $ | 1,015,181 | | $ | 1,137,684 | |
| Portfolio turnover rate | | 7.39 | % | | 24.13 | % | | 6.48 | % | | 11.13 | % | | 9.22 | % |
aFor the year ended February 29.
bThe amount shown for a share outstanding throughout the period may not correlate with the Statement of Operations for the period due to the timing of sales and repurchases of
the Fund shares in relation to income earned and/or fluctuating market value of the investments of the Fund.
cBased on average daily shares outstanding.
dTotal return does not reflect sales commissions or contingent deferred sales charges, if applicable.
Annual Report | The accompanying notes are an integral part of these financial statements. | 97
| | | | | | | | | | | | | | | |
| Franklin Tax-Free Trust | | | | | | | | | | | | | | | |
| Financial Highlights (continued) | | | | | | | | | | | | | | | |
| |
| Franklin Florida Tax-Free Income Fund | | | | | | | | | | | | | | | |
| | | | | | Year Ended February 28, | | | | |
| Class C | | 2014 | | | 2013 | | | 2012 | a | | 2011 | | | 2010 | |
| Per share operating performance | | | | | | | | | | | | | | | |
| (for a share outstanding throughout the year) | | | | | | | | | | | | | | | |
| Net asset value, beginning of year | $ | 12.17 | | $ | 12.08 | | $ | 11.25 | | $ | 11.63 | | $ | 11.06 | |
| Income from investment operationsb: | | | | | | | | | | | | | | | |
| Net investment incomec | | 0.41 | | | 0.41 | | | 0.47 | | | 0.47 | | | 0.48 | |
| Net realized and unrealized gains (losses) | | (0.92 | ) | | 0.14 | | | 0.83 | | | (0.38 | ) | | 0.56 | |
| Total from investment operations | | (0.51 | ) | | 0.55 | | | 1.30 | | | 0.09 | | | 1.04 | |
| Less distributions from: | | | | | | | | | | | | | | | |
| Net investment income | | (0.38 | ) | | (0.40 | ) | | (0.47 | ) | | (0.47 | ) | | (0.47 | ) |
| Net realized gains | | (0.03 | ) | | (0.06 | ) | | — | | | — | | | — | |
| Total distributions | | (0.41 | ) | | (0.46 | ) | | (0.47 | ) | | (0.47 | ) | | (0.47 | ) |
| Net asset value, end of year | $ | 11.25 | | $ | 12.17 | | $ | 12.08 | | $ | 11.25 | | $ | 11.63 | |
| |
| Total returnd | | (4.19 | )% | | 4.56 | % | | 11.74 | % | | 0.70 | % | | 9.53 | % |
| |
| Ratios to average net assets | | | | | | | | | | | | | | | |
| Expenses | | 1.17 | % | | 1.17 | % | | 1.17 | % | | 1.17 | % | | 1.17 | % |
| Net investment income | | 3.58 | % | | 3.40 | % | | 4.02 | % | | 4.07 | % | | 4.19 | % |
| |
| Supplemental data | | | | | | | | | | | | | | | |
| Net assets, end of year (000’s) | $ | 89,944 | | $ | 132,581 | | $ | 116,393 | | $ | 112,199 | | $ | 119,496 | |
| Portfolio turnover rate | | 7.39 | % | | 24.13 | % | | 6.48 | % | | 11.13 | % | | 9.22 | % |
aFor the year ended February 29.
bThe amount shown for a share outstanding throughout the period may not correlate with the Statement of Operations for the period due to the timing of sales and repurchases of
the Fund shares in relation to income earned and/or fluctuating market value of the investments of the Fund.
cBased on average daily shares outstanding.
dTotal return does not reflect sales commissions or contingent deferred sales charges, if applicable.
98 | The accompanying notes are an integral part of these financial statements. | Annual Report
| | | | |
| Franklin Tax-Free Trust | | | | |
| |
| Statement of Investments, February 28, 2014 | | | | |
| |
| |
| Franklin Florida Tax-Free Income Fund | | Principal Amount | | Value |
| Municipal Bonds 98.3% | | | | |
| Florida 86.9% | | | | |
| Alachua County Health Facilities Authority Health Facilities Revenue, Shands Healthcare | | | | |
| Project, Refunding, | | | | |
| Series D-1, 6.50%, 12/01/19 | $ | 1,215,000 | $ | 1,419,606 |
| Series D-1, 6.75%, 12/01/22 | | 1,000,000 | | 1,162,530 |
| Series D-2, 6.75%, 12/01/30 | | 5,000,000 | | 5,567,300 |
| Brevard County Health Facilities Authority Health Facilities Revenue, Health First Inc. Project, | | | | |
| Series B, 7.00%, 4/01/39 | | 2,000,000 | | 2,208,200 |
| Broward County Educational Facilities Authority Revenue, Educational Facilities, Nova | | | | |
| Southeastern University, Series B, Pre-Refunded, 5.60%, 4/01/29 | | 3,180,000 | | 3,192,402 |
| Broward County Water and Sewer Utility Revenue, Series A, 5.25%, 10/01/34 | | 2,200,000 | | 2,390,366 |
| Citizens Property Insurance Corp. Revenue, | | | | |
| High-Risk Account, senior secured, Series A-1, 6.00%, 6/01/17 | | 5,000,000 | | 5,787,750 |
| Personal Lines Account/Commercial Lines Account, senior secured, Series A-1, 5.00%, | | | | |
| 6/01/22 | | 10,000,000 | | 11,457,800 |
| Citrus County Hospital Board Revenue, Citrus Memorial Hospital, Refunding, 6.25%, | | | | |
| 8/15/23 | | 6,800,000 | | 6,410,768 |
| City of Winter Park Water and Sewer Revenue, Improvement, Refunding, 5.00%, 12/01/34 | | 2,000,000 | | 2,104,680 |
| Clearwater City Water and Sewer Revenue, Series A, 5.25%, 12/01/39 | | 2,000,000 | | 2,108,060 |
| Collier County Educational Facilities Authority Revenue, Hodges University Inc. Project, | | | | |
| 5.625%, 11/01/28 | | 2,860,000 | | 2,901,241 |
| Collier County IDA Health Care Facilities Revenue, NCH Healthcare System Project, 6.25%, | | | | |
| 10/01/39 | | 5,000,000 | | 5,601,900 |
| Crossing at Fleming Island CDD Special Assessment, Refunding, Series B, NATL Insured, | | | | |
| 5.80%, 5/01/16 | | 3,195,000 | | 3,195,799 |
| Duval County School Board COP, Master Lease Program, Series A, Assured Guaranty, 5.25%, | | | | |
| 7/01/35 | | 10,000,000 | | 10,341,200 |
| Escambia County Health Facilities Authority Health Facility Revenue, Baptist Hospital Inc. | | | | |
| Project, | | | | |
| Refunding, Series A, 5.75%, 8/15/29 | | 7,195,000 | | 7,688,937 |
| Series A, 6.00%, 8/15/36 | | 11,000,000 | | 11,642,730 |
| Escambia County HFA Dormitory Revenue, University of West Florida Foundation Inc. Project, | | | | |
| Refunding, NATL Insured, 5.00%, 6/01/31 | | 6,580,000 | | 6,467,614 |
| Florida HFAR, Homeowner Mortgage, Series 1, NATL Insured, 5.625%, 7/01/17 | | 705,000 | | 706,177 |
| Florida Higher Educational Facilities Financing Authority Revenue, | | | | |
| Bethune Cookman University, Refunding, 5.375%, 7/01/32 | | 3,500,000 | | 3,694,250 |
| Nova Southeastern University, 6.375%, 4/01/31 | | 2,750,000 | | 3,005,310 |
| Rollins College Project, 5.00%, 12/01/37 | | 10,000,000 | | 10,351,900 |
| Florida State Board of Education Public Education GO, Capital Outlay, | | | | |
| Refunding, Series D, 6.00%, 6/01/23 | | 15,000,000 | | 19,107,450 |
| Series A, 5.50%, 6/01/38 | | 10,000,000 | | 10,933,500 |
| Series H, 5.00%, 6/01/40 | | 7,295,000 | | 7,818,635 |
| Florida State GO, Department of Transportation, Right of Way, Refunding, Series B, 5.00%, | | | | |
| 7/01/26 | | 10,000,000 | | 11,526,500 |
| Florida State Governmental Utility Authority Utility Revenue, Lehigh Utility System, Refunding, | | | | |
| 5.25%, 10/01/40 | | 5,000,000 | | 5,287,500 |
| Florida State Higher Education Facilities Financial Authority Revenue, University of Tampa | | | | |
| Project, Refunding, Series A, 5.25%, 4/01/42 | | 2,000,000 | | 2,016,940 |
Annual Report | 99
| | | | |
| Franklin Tax-Free Trust | | | | |
| |
| Statement of Investments, February 28, 2014 (continued) | | | | |
| |
| |
| Franklin Florida Tax-Free Income Fund | | Principal Amount | | Value |
| Municipal Bonds (continued) | | | | |
| Florida (continued) | | | | |
| Florida State Mid-Bay Bridge Authority Revenue, | | | | |
| Exchangeable, Series D, ETM, 6.10%, 10/01/22 | $ | 3,545,000 | $ | 4,442,275 |
| Series A, AMBAC Insured, Pre-Refunded, zero cpn., 10/01/25 | | 9,845,000 | | 6,289,281 |
| Series A, AMBAC Insured, Pre-Refunded, zero cpn., 10/01/26 | | 2,500,000 | | 1,512,750 |
| Series A, ETM, 6.875%, 10/01/22 | | 6,000,000 | | 7,752,660 |
| Florida State Municipal Loan Council Revenue, Series D, AGMC Insured, 5.50%, 10/01/41 | | 3,750,000 | | 3,961,163 |
| Florida State Municipal Power Agency Revenue, | | | | |
| All-Requirements Power Supply Project, Series A, 5.00%, 10/01/31 | | 6,000,000 | | 6,304,560 |
| All-Requirements Power Supply Project, Series A, 6.25%, 10/01/31 | | 2,000,000 | | 2,256,760 |
| Stanton Project, Refunding, 5.50%, 10/01/19 | | 1,000,000 | | 1,213,050 |
| Florida State Turnpike Authority Turnpike Revenue, Department of Transportation, Refunding, | | | | |
| Series A, 5.00%, 7/01/35 | | 5,000,000 | | 5,243,850 |
| Fort Lauderdale Water and Sewer Revenue, | | | | |
| 5.00%, 9/01/35 | | 24,090,000 | | 26,280,022 |
| NATL Insured, 5.00%, 9/01/31 | | 6,315,000 | | 6,779,089 |
| Fort Pierce Capital Improvement Revenue, Refunding, Series A, Assured Guaranty, 6.00%, | | | | |
| 9/01/32 | | 1,500,000 | | 1,676,970 |
| Fort Pierce Utilities Authority Revenue, | | | | |
| AMBAC Insured, 5.00%, 10/01/27 | | 7,000,000 | | 7,012,600 |
| Capital Appreciation, Series B, AMBAC Insured, zero cpn., 10/01/20 | | 3,090,000 | | 2,577,245 |
| Capital Appreciation, Series B, AMBAC Insured, zero cpn., 10/01/21 | | 2,585,000 | | 2,063,166 |
| Capital Appreciation, Series B, AMBAC Insured, zero cpn., 10/01/22 | | 3,090,000 | | 2,349,821 |
| Capital Appreciation, Series B, AMBAC Insured, zero cpn., 10/01/23 | | 3,060,000 | | 2,215,991 |
| Capital Appreciation, Series B, AMBAC Insured, zero cpn., 10/01/24 | | 2,560,000 | | 1,777,587 |
| Greater Orlando Aviation Authority Orlando Airport Facilities Revenue, | | | | |
| Refunding, Series C, 5.00%, 10/01/39 | | 4,250,000 | | 4,419,363 |
| Series A, 5.00%, 10/01/39 | | 5,000,000 | | 5,230,400 |
| Halifax Hospital Medical Center Hospital Revenue, | | | | |
| Refunding and Improvement, Series A, 5.00%, 6/01/38 | | 11,395,000 | | 10,959,141 |
| Series B-1, AGMC Insured, 5.50%, 6/01/38 | | 10,000,000 | | 10,342,300 |
| Hernando County School Board COP, NATL Insured, 5.00%, 7/01/35 | | 10,000,000 | | 10,127,800 |
| Hialeah Housing Authority Revenue, Affordable Housing Program, Refunding, GNMA Secured, | | | | |
| 5.30%, 12/20/18 | | 695,000 | | 695,466 |
| Hillsborough County Assessment Revenue, Capacity Assessment Special, AGMC Insured, | | | | |
| 5.125%, 3/01/20 | | 1,000,000 | | 1,003,340 |
| Hillsborough County Aviation Authority Revenue, Series B, Assured Guaranty, 5.00%, | | | | |
| 10/01/33 | | 5,465,000 | | 5,803,721 |
| 10/01/38 | | 6,725,000 | | 7,092,387 |
| Hillsborough County IDA, PCR, Tampa Electric Co. Project, Series A, 5.65%, 5/15/18 | | 6,500,000 | | 7,585,825 |
| Jacksonville Sales Tax Revenue, Better Jacksonville, Refunding, 5.00%, 10/01/30 | | 2,000,000 | | 2,146,880 |
| Kissimmee Water and Sewer Revenue, AMBAC Insured, ETM, 6.00%, 10/01/15 | | 2,650,000 | | 2,659,699 |
| Lake County School Board COP, Series A, AMBAC Insured, 5.00%, 6/01/30 | | 5,000,000 | | 5,114,950 |
| Lakeland Electric and Water Revenue, Capital Appreciation, ETM, zero cpn., 10/01/14 | | 5,770,000 | | 5,759,441 |
| Leesburg Hospital Revenue, Leesburg Regional Medical Center Project, 5.50%, 7/01/32 | | 4,150,000 | | 4,151,328 |
| Martin County Health Facilities Authority Hospital Revenue, Martin Memorial Medical Center, | | | | |
| 5.50%, 11/15/42 | | 2,100,000 | | 2,135,364 |
| Melbourne Water and Sewer Improvement Revenue, Capital Appreciation, FGIC Insured, ETM, | | | | |
| zero cpn., 10/01/26 | | 1,500,000 | | 1,006,365 |
100 | Annual Report
| | | | |
| Franklin Tax-Free Trust | | | | |
| |
| Statement of Investments, February 28, 2014 (continued) | | | | |
| |
| |
| Franklin Florida Tax-Free Income Fund | | Principal Amount | | Value |
| Municipal Bonds (continued) | | | | |
| Florida (continued) | | | | |
| Melbourne Water and Sewer Revenue, Capital Appreciation, Refunding, Series B, NATL RE, | | | | |
| FGIC Insured, zero cpn., | | | | |
| 10/01/22 | $ | 1,785,000 | $ | 1,273,276 |
| 10/01/26 | | 4,500,000 | | 2,610,000 |
| Miami Beach Water and Sewer Revenue, AMBAC Insured, 5.00%, 9/01/30 | | 7,000,000 | | 7,008,050 |
| Miami Parking System Revenue, Refunding, Assured Guaranty, 5.00%, 10/01/39 | | 4,000,000 | | 4,109,360 |
| Miami Special Obligation, Marlins Stadium Project, Series A, AGMC Insured, 5.25%, | | | | |
| 7/01/35 | | 5,000,000 | | 5,234,850 |
| Miami Special Obligation Revenue, 5.625%, 1/01/39 | | 15,000,000 | | 15,869,700 |
| Miami-Dade County Aviation Revenue, Miami International Airport, | | | | |
| Hub of the Americas, Refunding, Series A, 5.50%, 10/01/36 | | 5,000,000 | | 5,420,500 |
| Hub of the Americas, Refunding, Series A, XLCA Insured, 5.00%, 10/01/37 | | 8,000,000 | | 8,121,680 |
| Refunding, Series A, 5.375%, 10/01/35 | | 7,500,000 | | 7,952,700 |
| Miami-Dade County Expressway Authority Toll System Revenue, Series A, 5.00%, 7/01/40 | | 18,770,000 | | 19,363,695 |
| Miami-Dade County GO, Building Better Communities Program, Series B-1, 5.75%, 7/01/33 | | 5,000,000 | | 5,525,500 |
| Miami-Dade County Health Facilities Authority Hospital Revenue, Miami Children’s Hospital, | | | | |
| Refunding, Series A, 6.125%, 8/01/42 | | 4,000,000 | | 4,316,520 |
| Miami-Dade County HFA, MFMR, Villa Esperanza Apartments Project, | | | | |
| 5.25%, 10/01/19 | | 335,000 | | 335,191 |
| 5.40%, 10/01/33 | | 1,485,000 | | 1,484,881 |
| Miami-Dade County Public Facilities Revenue, Jackson Health System, Series A, NATL Insured, | | | | |
| 5.00%, 6/01/35 | | 10,000,000 | | 10,063,700 |
| Miami-Dade County School Board COP, Assured Guaranty, 5.375%, 2/01/34 | | 5,000,000 | | 5,351,550 |
| Miami-Dade County School District GO, School Bonds, 5.00%, 3/15/43 | | 2,465,000 | | 2,600,501 |
| Miami-Dade County Seaport Revenue, Series A, 6.00%, 10/01/38 | | 10,000,000 | | 11,000,600 |
| Miami-Dade County Special Obligation Revenue, Juvenile Courthouse Project, Series A, | | | | |
| AMBAC Insured, 5.00%, 4/01/35 | | 5,000,000 | | 5,005,600 |
| Miami-Dade County Transit System Sales Surtax Revenue, 5.00%, 7/01/42 | | 5,000,000 | | 5,206,850 |
| Miami-Dade County Water and Sewer System Revenue, | | | | |
| AGMC Insured, 5.00%, 10/01/39 | | 10,000,000 | | 10,513,600 |
| Refunding, Series A, 5.00%, 10/01/42 | | 10,000,000 | | 10,417,000 |
| North Sumter County Utility Dependent District Utility Revenue, 5.75%, 10/01/43 | | 5,000,000 | | 5,256,200 |
| Okaloosa County Water and Sewer Revenue, Refunding, AGMC Insured, 5.00%, 7/01/36 | | 8,000,000 | | 8,254,160 |
| Orange County Health Facilities Authority Hospital Revenue, Orlando Regional Healthcare | | | | |
| System, | | | | |
| Refunding, Series B, AGMC Insured, 5.00%, 12/01/32 | | 5,000,000 | | 5,255,500 |
| Refunding, Series C, 5.25%, 10/01/35 | | 4,000,000 | | 4,232,600 |
| Series B, 5.125%, 11/15/39 | | 5,000,000 | | 5,034,150 |
| Orange County Health Facilities Authority Revenue, Hospital, Orlando Health Inc., Series A, | | | | |
| 5.00%, 10/01/42 | | 10,000,000 | | 9,977,000 |
| Orange County School Board COP, Series A, Assured Guaranty, 5.50%, 8/01/34 | | 10,000,000 | | 10,848,700 |
| Orlando Tourist Development Tax Revenue, 6th Central Contact Payments, senior bond, | | | | |
| Series A, Assured Guaranty, 5.25%, 11/01/38 | | 16,740,000 | | 16,854,836 |
| Orlando-Orange County Expressway Authority Revenue, | | | | |
| Refunding, 5.00%, 7/01/35 | | 8,330,000 | | 8,845,794 |
| senior lien, AMBAC Insured, ETM, 7.625%, 7/01/18 | | 225,000 | | 269,861 |
| Series A, 5.00%, 7/01/40 | | 5,000,000 | | 5,205,700 |
| Series C, 5.00%, 7/01/35 | | 5,000,000 | | 5,216,950 |
| Series C, 5.00%, 7/01/40 | | 2,755,000 | | 2,845,199 |
| |
| | | Annual Report | 101 |
| | | | |
| Franklin Tax-Free Trust | | | | |
| |
| Statement of Investments, February 28, 2014 (continued) | | | | |
| |
| |
| Franklin Florida Tax-Free Income Fund | | Principal Amount | | Value |
| Municipal Bonds (continued) | | | | |
| Florida (continued) | | | | |
| Palm Beach County Public Improvement Revenue, 5.00%, 5/01/33 | $ | 1,000,000 | $ | 1,064,270 |
| Palm Beach County Solid Waste Authority Revenue, Improvement, Series B, 5.50%, | | | | |
| 10/01/25 | | 5,000,000 | | 5,655,750 |
| Palm Beach County Water and Sewer Revenue, 5.00%, 10/01/40 | | 5,000,000 | | 5,285,750 |
| Panama City Beach Utility Revenue, Assured Guaranty, 5.00%, 6/01/39 | | 3,000,000 | | 3,130,260 |
| Port St. Lucie Utility System Revenue, | | | | |
| Capital Appreciation, Refunding, Series A, NATL Insured, zero cpn., 9/01/32 | | 5,000,000 | | 2,010,050 |
| Capital Appreciation, Refunding, Series A, NATL Insured, zero cpn., 9/01/33 | | 5,000,000 | | 1,880,950 |
| Refunding, Assured Guaranty, 5.25%, 9/01/35 | | 2,000,000 | | 2,157,140 |
| Refunding, Series A, NATL Insured, 5.00%, 9/01/30 | | 10,000,000 | | 10,559,900 |
| Sarasota Special Obligation Revenue, Capital Appreciation, Refunding, AMBAC Insured, | | | | |
| zero cpn., 11/01/15 | | 2,180,000 | | 2,070,738 |
| South Broward Hospital District Revenue, South Broward Hospital District Obligated Group, | | | | |
| Refunding, 5.00%, 5/01/36 | | 7,000,000 | | 7,154,840 |
| South Florida Water Management District COP, AMBAC Insured, 5.00%, 10/01/31 | | 12,050,000 | | 12,377,037 |
| South Lake County Hospital District Revenue, South Lake Hospital Inc., Refunding, 5.25%, | | | | |
| 10/01/34 | | 5,000,000 | | 5,278,650 |
| St. Johns County Water and Sewer Revenue, Capital Appreciation, AMBAC Insured, | | | | |
| Pre-Refunded, zero cpn., | | | | |
| 6/01/22 | | 4,000,000 | | 2,695,680 |
| 6/01/23 | | 4,255,000 | | 2,706,308 |
| 6/01/24 | | 1,500,000 | | 900,060 |
| 6/01/25 | | 2,130,000 | | 1,208,221 |
| St. Petersburg Public Utilities Revenue, Series A, 5.00%, 10/01/36 | | 3,180,000 | | 3,345,455 |
| Sunrise Utilities System Revenue, | | | | |
| AMBAC Insured, Pre-Refunded, 5.20%, 10/01/22 | | 1,050,000 | | 1,258,667 |
| Refunding, AMBAC Insured, 5.20%, 10/01/22 | | 1,500,000 | | 1,647,375 |
| Tamarac Utility System Revenue, Refunding, Assured Guaranty, 5.00%, 10/01/39 | | 1,585,000 | | 1,644,184 |
| Tampa Bay Water Regional Water Supply Authority Utility System Revenue, 5.00%, | | | | |
| 10/01/34 | | 8,000,000 | | 8,488,880 |
| 10/01/38 | | 14,340,000 | | 15,092,563 |
| 10/01/38 | | 10,000,000 | | 10,747,300 |
| Tampa Sports Authority Revenue, Guaranteed Package, Tampa Bay Arena Project, NATL Insured, | | | | |
| 6.00%, 10/01/15 | | 435,000 | | 451,582 |
| 6.05%, 10/01/20 | | 1,715,000 | | 1,888,129 |
| 6.10%, 10/01/26 | | 2,695,000 | | 3,029,773 |
| Tampa Water and Sewer Revenue, sub. lien, Series A, AMBAC Insured, ETM, 7.25%, | | | | |
| 10/01/16 | | 625,000 | | 683,513 |
| University of North Florida FICO Capital Improvement Revenue, Student Union Project, | | | | |
| NATL RE, FGIC Insured, 5.00%, 11/01/32 | | 5,150,000 | | 5,279,213 |
| Viera East CDD Special Assessment, Series B, ETM, 6.75%, 5/01/14 | | 830,000 | | 838,449 |
| aVillage Center CDD Recreational Revenue, Series A, NATL Insured, 5.20%, 11/01/25 | | 5,000,000 | | 5,022,000 |
| Volusia County Tourist Development Tax Revenue, FSA Insured, 5.00%, 12/01/34 | | 11,000,000 | | 11,207,790 |
| West Lake CDD Special Assessment, NATL Insured, 5.75%, 5/01/17 | | 620,000 | | 620,415 |
| West Palm Beach CRDA Revenue, Northwood Pleasant Community Redevelopment Area, | | | | |
| Series A, 5.00%, 3/01/35 | | 1,000,000 | | 1,008,270 |
| | | | | 719,310,771 |
102 | Annual Report
| | | | |
| Franklin Tax-Free Trust | | | | |
| |
| Statement of Investments, February 28, 2014 (continued) | | | | |
| |
| |
| Franklin Florida Tax-Free Income Fund | | Principal Amount | | Value |
| Municipal Bonds (continued) | | | | |
| U.S. Territories 11.4% | | | | |
| Puerto Rico 10.2% | | | | |
| Puerto Rico Commonwealth Aqueduct and Sewer Authority Revenue, senior lien, Series A, | | | | |
| 6.00%, 7/01/44 | $ | 2,100,000 | $ | 1,598,562 |
| Puerto Rico Commonwealth GO, Public Improvement, Refunding, Series B, 6.00%, 7/01/39 | | 15,000,000 | | 11,867,700 |
| Puerto Rico Commonwealth Highways and Transportation Authority Transportation Revenue, | | | | |
| Refunding, Series A, NATL Insured, 5.00%, 7/01/38 | | 255,000 | | 200,749 |
| Series G, 5.00%, 7/01/33 | | 1,495,000 | | 877,849 |
| Puerto Rico Electric Power Authority Power Revenue, | | | | |
| Refunding, Series A, 5.00%, 7/01/42 | | 19,800,000 | | 12,741,102 |
| Series XX, 5.25%, 7/01/40 | | 12,250,000 | | 8,152,497 |
| Puerto Rico Industrial Tourist Educational Medical and Environmental Control Facilities | | | | |
| Financing Authority Revenue, Cogeneration Facility, AES Puerto Rico Project, 6.625%, | | | | |
| 6/01/26 | | 5,900,000 | | 5,302,920 |
| Puerto Rico Public Finance Corp. Revenue, Commonwealth Appropriation, Refunding, Series B, | | | | |
| 5.50%, 8/01/31 | | 5,000,000 | | 3,220,550 |
| Puerto Rico Sales Tax FICO Sales Tax Revenue, | | | | |
| first subordinate, Series A, 6.00%, 8/01/42 | | 8,000,000 | | 6,596,960 |
| first subordinate, Series A-1, 5.25%, 8/01/43 | | 22,225,000 | | 16,929,894 |
| first subordinate, Series C, 5.50%, 8/01/40 | | 15,000,000 | | 11,930,400 |
| Refunding, Senior Series C, 5.00%, 8/01/46 | | 6,250,000 | | 5,002,750 |
| | | | | 84,421,933 |
| U.S. Virgin Islands 1.2% | | | | |
| Virgin Islands PFAR, Gross Receipts Taxes Loan Note, Radian Insured, 5.00%, 10/01/33 | | 10,000,000 | | 9,876,700 |
| Total U.S. Territories | | | | 94,298,633 |
| Total Municipal Bonds before Short Term Investments | | | | |
| (Cost $799,782,698) | | | | 813,609,404 |
| Short Term Investments (Cost $3,500,000) 0.4% | | | | |
| Municipal Bonds 0.4% | | | | |
| Florida 0.4% | | | | |
| bGainesville City Utilities System Revenue, Refunding, Series B, Daily VRDN and Put, 0.03%, | | | | |
| 10/01/42 | | 3,500,000 | | 3,500,000 |
| Total Investments (Cost $803,282,698) 98.7% | | | | 817,109,404 |
| Other Assets, less Liabilities 1.3% | | | | 10,704,236 |
| Net Assets 100.0% | | | $ | 827,813,640 |
See Abbreviations on page 182.
aThe Internal Revenue Service is examining the bond and has proposed that the income generated by the bond is taxable. The issuer of the bond is seeking relief under IRS
procedures. Until the matter is finalized, the Fund will continue to recognize interest income earned on the bond as tax-exempt. The Trust’s management believes that the final
outcome of this matter will not have a material adverse impact to the Fund and/or its shareholders.
bVariable rate demand notes (VRDNs) are tax-exempt obligations which contain a floating or variable interest rate adjustment formula and an unconditional right of demand to
receive payment of the principal balance plus accrued interest at specified dates. The coupon rate shown represents the rate at period end.
Annual Report | The accompanying notes are an integral part of these financial statements. | 103
| | | | | | | | | | | | | | | |
| Franklin Tax-Free Trust | | | | | | | | | | | | | | | |
| Financial Highlights | | | | | | | | | | | | | | | |
| |
| Franklin Georgia Tax-Free Income Fund | | | | | | | | | | | | | | | |
| | | | | | Year Ended February 28, | | | | |
| Class A | | 2014 | | | 2013 | | | 2012 | a | | 2011 | | | 2010 | |
| Per share operating performance | | | | | | | | | | | | | | | |
| (for a share outstanding throughout the year) | | | | | | | | | | | | | | | |
| Net asset value, beginning of year | $ | 12.80 | | $ | 12.49 | | $ | 11.47 | | $ | 11.92 | | $ | 11.24 | |
| Income from investment operationsb: | | | | | | | | | | | | | | | |
| Net investment incomec | | 0.46 | | | 0.46 | | | 0.50 | | | 0.50 | | | 0.50 | |
| Net realized and unrealized gains (losses) | | (0.78 | ) | | 0.30 | | | 1.02 | | | (0.45 | ) | | 0.68 | |
| Total from investment operations | | (0.32 | ) | | 0.76 | | | 1.52 | | | 0.05 | | | 1.18 | |
| Less distributions from net investment income | | (0.46 | ) | | (0.45 | ) | | (0.50 | ) | | (0.50 | ) | | (0.50 | ) |
| Net asset value, end of year | $ | 12.02 | | $ | 12.80 | | $ | 12.49 | | $ | 11.47 | | $ | 11.92 | |
| |
| Total returnd | | (2.47 | )% | | 6.13 | % | | 13.57 | % | | 0.33 | % | | 10.66 | % |
| |
| Ratios to average net assets | | | | | | | | | | | | | | | |
| Expenses | | 0.66 | % | | 0.66 | % | | 0.67 | % | | 0.67 | % | | 0.68 | % |
| Net investment income | | 3.83 | % | | 3.59 | % | | 4.15 | % | | 4.18 | % | | 4.27 | % |
| |
| Supplemental data | | | | | | | | | | | | | | | |
| Net assets, end of year (000’s) | $ | 391,837 | | $ | 498,086 | | $ | 425,181 | | $ | 361,875 | | $ | 365,223 | |
| Portfolio turnover rate | | 5.87 | % | | 5.47 | % | | 7.18 | % | | 9.09 | % | | 9.61 | % |
aFor the year ended February 29.
bThe amount shown for a share outstanding throughout the period may not correlate with the Statement of Operations for the period due to the timing of sales and repurchases of
the Fund shares in relation to income earned and/or fluctuating market value of the investments of the Fund.
cBased on average daily shares outstanding.
dTotal return does not reflect sales commissions or contingent deferred sales charges, if applicable.
104 | The accompanying notes are an integral part of these financial statements. | Annual Report
| | | | | | | | | | | | | | | |
| Franklin Tax-Free Trust | | | | | | | | | | | | | | | |
| Financial Highlights (continued) | | | | | | | | | | | | | | | |
| |
| Franklin Georgia Tax-Free Income Fund | | | | | | | | | | | | | | | |
| | | | | | Year Ended February 28, | | | | |
| Class C | | 2014 | | | 2013 | | | 2012 | a | | 2011 | | | 2010 | |
| Per share operating performance | | | | | | | | | | | | | | | |
| (for a share outstanding throughout the year) | | | | | | | | | | | | | | | |
| Net asset value, beginning of year | $ | 12.96 | | $ | 12.64 | | $ | 11.60 | | $ | 12.05 | | $ | 11.35 | |
| Income from investment operationsb: | | | | | | | | | | | | | | | |
| Net investment incomec | | 0.40 | | | 0.39 | | | 0.44 | | | 0.44 | | | 0.44 | |
| Net realized and unrealized gains (losses) | | (0.80 | ) | | 0.30 | | | 1.04 | | | (0.46 | ) | | 0.69 | |
| Total from investment operations | | (0.40 | ) | | 0.69 | | | 1.48 | | | (0.02 | ) | | 1.13 | |
| Less distributions from net investment income | | (0.39 | ) | | (0.37 | ) | | (0.44 | ) | | (0.43 | ) | | (0.43 | ) |
| Net asset value, end of year | $ | 12.17 | | $ | 12.96 | | $ | 12.64 | | $ | 11.60 | | $ | 12.05 | |
| |
| Total returnd | | (3.06 | )% | | 5.55 | % | | 12.99 | % | | (0.24 | )% | | 10.14 | % |
| |
| Ratios to average net assets | | | | | | | | | | | | | | | |
| Expenses | | 1.21 | % | | 1.21 | % | | 1.22 | % | | 1.22 | % | | 1.23 | % |
| Net investment income | | 3.28 | % | | 3.04 | % | | 3.60 | % | | 3.63 | % | | 3.72 | % |
| |
| Supplemental data | | | | | | | | | | | | | | | |
| Net assets, end of year (000’s) | $ | 112,533 | | $ | 160,443 | | $ | 129,426 | | $ | 106,356 | | $ | 101,641 | |
| Portfolio turnover rate | | 5.87 | % | | 5.47 | % | | 7.18 | % | | 9.09 | % | | 9.61 | % |
aFor the year ended February 29.
bThe amount shown for a share outstanding throughout the period may not correlate with the Statement of Operations for the period due to the timing of sales and repurchases of
the Fund shares in relation to income earned and/or fluctuating market value of the investments of the Fund.
cBased on average daily shares outstanding.
dTotal return does not reflect sales commissions or contingent deferred sales charges, if applicable.
Annual Report | The accompanying notes are an integral part of these financial statements. | 105
| | | | |
| Franklin Tax-Free Trust | | | | |
| |
| Statement of Investments, February 28, 2014 | | | | |
| |
| |
| Franklin Georgia Tax-Free Income Fund | | Principal Amount | | Value |
| Municipal Bonds 99.1% | | | | |
| Georgia 92.8% | | | | |
| Athens-Clarke County Unified Government Water and Sewerage Revenue, | | | | |
| 5.625%, 1/01/33 | $ | 10,000,000 | $ | 11,203,300 |
| 5.50%, 1/01/38 | | 5,000,000 | | 5,463,100 |
| Atlanta Airport General Revenue, | | | | |
| Refunding, Series C, 6.00%, 1/01/30 | | 6,000,000 | | 6,942,420 |
| Series A, 5.00%, 1/01/40 | | 9,000,000 | | 9,302,220 |
| Atlanta Airport Passenger Facility Charge Revenue, General, sub. lien, | | | | |
| Refunding, Series C, AGMC Insured, 5.00%, 1/01/33 | | 5,000,000 | | 5,062,300 |
| Series J, AGMC Insured, 5.00%, 1/01/34 | | 5,000,000 | | 5,131,150 |
| Atlanta Development Authority Educational Facilities Revenue, Science Park LLC Project, | | | | |
| 5.00%, 7/01/32 | | 3,000,000 | | 3,131,220 |
| Atlanta Development Authority Revenue, Tuff Yamacraw LLC Project, Refunding, Series A, | | | | |
| AMBAC Insured, 5.00%, 1/01/26 | | 2,555,000 | | 2,763,616 |
| Atlanta Development Authority Student Housing Facilities Revenue, Piedmont/Ellis LLC | | | | |
| University Commons Project, Refunding, 5.00%, 9/01/32 | | 5,000,000 | | 5,412,100 |
| Atlanta GO, Refunding, Assured Guaranty, 5.25%, 12/01/23 | | 2,000,000 | | 2,284,220 |
| Atlanta Public Safety and Judicial Facilities Authority Revenue, Public Safety Facility Project, | | | | |
| AGMC Insured, 5.00%, 12/01/26 | | 1,140,000 | | 1,222,148 |
| Atlanta Tax Allocation, Atlantic State Project, Refunding, Assured Guaranty, 5.00%, | | | | |
| 12/01/23 | | 1,000,000 | | 1,038,570 |
| Atlanta Water and Wastewater Revenue, | | | | |
| Refunding, Series A, 6.00%, 11/01/28 | | 5,055,000 | | 5,915,614 |
| Series A, AGMC Insured, 5.50%, 11/01/27 | | 5,000,000 | | 5,926,750 |
| Series A, NATL Insured, 5.00%, 11/01/33 | | 2,245,000 | | 2,246,302 |
| Baldwin County Hospital Authority Revenue, Oconee Regional Medical Center, | | | | |
| 5.25%, 12/01/22 | | 2,500,000 | | 2,423,175 |
| 5.375%, 12/01/28 | | 2,000,000 | | 1,867,500 |
| Bartow-Catersville Joint Development Authority Revenue, GHC Student Center LLC Project, | | | | |
| AGMC Insured, 5.00%, 6/15/36 | | 4,155,000 | | 4,436,501 |
| Bibb County Development Authority Revenue, Macon State College Foundation Real Estate II | | | | |
| LLC Project, AGMC Insured, 5.00%, 7/01/40 | | 7,000,000 | | 7,339,360 |
| Bleckley-Dodge County Joint Development Authority Student Housing Facilities Revenue, MGC | | | | |
| Real Estate Foundation II LLC Project, 5.00%, 7/01/33 | | 3,500,000 | | 3,594,115 |
| Brunswick and Glynn County Joint Water and Sewer Commission Revenue, Refunding, Series C, | | | | |
| AGMC Insured, 5.00%, 6/01/33 | | 2,045,000 | | 2,176,555 |
| Bulloch County Development Authority Lease Revenue, Georgia Southern University Student | | | | |
| Housing and Athletic Facilities Project, XLCA Insured, Pre-Refunded, 5.00%, 8/01/27 | | 5,000,000 | | 5,097,850 |
| Bulloch County Development Authority Student Housing Revenue, Georgia Southern University | | | | |
| Housing Foundation Five LLC Project, AGMC Insured, 5.00%, 7/01/36 | | 2,055,000 | | 2,166,854 |
| Burke County Development Authority PCR, Oglethorpe Power Corp. Vogtle Project, | | | | |
| Series B, 5.50%, 1/01/33 | | 5,000,000 | | 5,261,300 |
| Series E, 7.00%, 1/01/23 | | 5,000,000 | | 5,750,050 |
| Carroll City-County Hospital Authority Revenue, Anticipation Certificates, Tanner Medical Center | | | | |
| Inc. Project, | | | | |
| 5.00%, 7/01/40 | | 5,000,000 | | 5,149,800 |
| Assured Guaranty, 5.00%, 7/01/38 | | 5,000,000 | | 5,144,350 |
106 | Annual Report
| | | | |
| Franklin Tax-Free Trust | | | | |
| |
| Statement of Investments, February 28, 2014 (continued) | | | | |
| |
| |
| Franklin Georgia Tax-Free Income Fund | | Principal Amount | | Value |
| Municipal Bonds (continued) | | | | |
| Georgia (continued) | | | | |
| Cherokee County Water and Sewerage Authority Revenue, | | | | |
| AGMC Insured, 5.00%, 8/01/35 | $ | 3,000,000 | $ | 3,193,500 |
| NATL Insured, 6.90%, 8/01/18 | | 10,000 | | 10,028 |
| Clarke County Hospital Authority Revenue, Athens Regional Medical Center Project, Refunding, | | | | |
| 5.00%, 1/01/32 | | 2,000,000 | | 2,138,640 |
| Clayton County Development Authority Revenue, | | | | |
| Refunding, Series A, NATL Insured, 5.00%, 8/01/23 | | 2,310,000 | | 2,413,419 |
| Tuff Archives LLC-Secretary of State of Georgia Project, Refunding, 5.00%, 7/01/33 | | 5,000,000 | | 5,416,950 |
| Clayton County Development Authority Student Housing Revenue, CSU Foundation Real Estate II | | | | |
| LLC Project, AGMC Insured, 5.00%, 7/01/36 | | 3,000,000 | | 3,151,680 |
| Clayton County Hospital Authority Revenue, Anticipation Certificates, Southern Regional | | | | |
| Medical Center Project, Refunding, Series A, | | | | |
| 5.00%, 8/01/30 | | 2,000,000 | | 2,102,720 |
| 5.25%, 8/01/35 | | 1,000,000 | | 1,061,860 |
| Clayton County MFHR, Pointe Clear Apartments Project, AGMC Insured, 5.70%, 7/01/23 | | 930,000 | | 930,921 |
| Clayton County Urban Redevelopment Agency Revenue, Clayton County Project, Refunding, | | | | |
| 5.00%, 2/01/28 | | 1,285,000 | | 1,438,725 |
| Cobb County Development Authority Student Recreation and Activities Center Revenue, KSU | | | | |
| SRAC Real Estate Foundation LLC Project, 5.00%, | | | | |
| 7/15/35 | | 2,500,000 | | 2,659,600 |
| 7/15/38 | | 2,500,000 | | 2,623,475 |
| Cobb County Development Authority University Facilities Revenue, Kennesaw State University | | | | |
| Foundations Project, Series D, NATL Insured, 5.00%, 7/15/29 | | 5,000,000 | | 5,005,800 |
| Columbia County Water and Sewerage Revenue, | | | | |
| AGMC Insured, Pre-Refunded, 5.00%, 6/01/24 | | 1,010,000 | | 1,021,645 |
| Refunding, AGMC Insured, 5.00%, 6/01/24 | | 120,000 | | 120,907 |
| Columbus Water and Sewerage Revenue, AGMC Insured, Pre-Refunded, 5.00%, 5/01/29 | | 2,500,000 | | 2,752,250 |
| Coweta County Development Authority Revenue, Piedmont Healthcare Inc. Project, 5.00%, | | | | |
| 6/15/40 | | 5,000,000 | | 5,176,550 |
| Dahlonega Water and Wastewater Revenue, Series A, Assured Guaranty, | | | | |
| 5.25%, 9/01/30 | | 1,750,000 | | 1,841,263 |
| 5.50%, 9/01/37 | | 5,000,000 | | 5,261,300 |
| Decatur County School Building Authority Revenue, High School Project, AGMC Insured, 5.00%, | | | | |
| 10/01/32 | | 1,500,000 | | 1,547,910 |
| Decatur Urban Redevelopment Agency Revenue, City of Decatur Projects, Series A, 5.00%, | | | | |
| 1/01/38 | | 6,195,000 | | 6,728,142 |
| DeKalb County Public Safety and Judicial Facilities Authority Revenue, Public Safety and | | | | |
| Judicial Facility Project, 5.00%, 12/01/29 | | 2,000,000 | | 2,018,820 |
| DeKalb County Water and Sewerage Revenue, | | | | |
| Refunding, Series B, AGMC Insured, 5.00%, 10/01/35 | | 4,000,000 | | 4,387,920 |
| Second Resolution, Series A, 5.25%, 10/01/41 | | 11,425,000 | | 12,380,815 |
| DeKalb Newton and Gwinnett Counties Joint Development Authority Revenue, | | | | |
| GGC Student Center LLC Project, 5.50%, 7/01/34 | | 3,000,000 | | 3,088,860 |
| GGCF Athletic Fields LLC Project, Series A, AGMC Insured, 5.00%, 7/01/39 | | 5,000,000 | | 5,253,100 |
| DeKalb Private Hospital Authority Revenue, Anticipation Certificates, Children’s Healthcare of | | | | |
| Atlanta Inc. Project, Refunding, 5.25%, 11/15/39 | | 5,000,000 | | 5,266,000 |
Annual Report | 107
| | | | |
| Franklin Tax-Free Trust | | | | |
| |
| Statement of Investments, February 28, 2014 (continued) | | | | |
| |
| |
| Franklin Georgia Tax-Free Income Fund | | Principal Amount | | Value |
| Municipal Bonds (continued) | | | | |
| Georgia (continued) | | | | |
| Douglasville-Douglas County Water and Sewer Authority Revenue, NATL Insured, | | | | |
| 5.00%, 6/01/32 | $ | 2,225,000 | $ | 2,374,053 |
| Pre-Refunded, 5.00%, 6/01/29 | | 3,410,000 | | 3,689,620 |
| Fairburn GO, AGMC Insured, 5.75%, 12/01/31 | | 2,000,000 | | 2,212,620 |
| Fayette County School District GO, AGMC Insured, Pre-Refunded, | | | | |
| 4.75%, 3/01/21 | | 1,355,000 | | 1,474,484 |
| 4.95%, 3/01/25 | | 1,000,000 | | 1,092,140 |
| Forsyth County Water and Sewerage Authority Revenue, AGMC Insured, 5.00%, 4/01/32 | | 5,000,000 | | 5,384,250 |
| Fulton County Development Authority Revenue, | | | | |
| AMC Campus Project I LLC Project, AGMC Insured, 5.00%, 6/15/37 | | 3,075,000 | | 3,319,708 |
| Georgia Tech Facilities Inc. Project, Refunding, Series A, 5.00%, 6/01/34 | | 4,000,000 | | 4,253,200 |
| Georgia Tech Facilities Inc. Project, Series A, 5.00%, 6/01/41 | | 3,500,000 | | 3,634,540 |
| Georgia Tech Foundation Technology Square Project, Refunding, Series A, 5.00%, | | | | |
| 11/01/29 | | 5,000,000 | | 5,618,450 |
| Georgia Tech Foundation Technology Square Project, Refunding, Series A, 5.00%, | | | | |
| 11/01/30 | | 2,000,000 | | 2,230,680 |
| Georgia Tech Foundation Technology Square Project, Refunding, Series A, 5.00%, | | | | |
| 11/01/31 | | 2,455,000 | | 2,721,539 |
| Molecular Science Building Project, NATL Insured, 5.00%, 5/01/25 | | 2,240,000 | | 2,250,595 |
| Morehouse College Project, Refunding, AMBAC Insured, 5.00%, 12/01/27 | | 5,000,000 | | 5,253,300 |
| Piedmont Healthcare Inc. Project, Refunding, Series A, 5.25%, 6/15/37 | | 5,000,000 | | 5,294,400 |
| Gainesville and Hall County Hospital Authority Revenue, Anticipation Certificates, Northeast | | | | |
| Georgia Healthcare Project, Series A, 5.375%, 2/15/40 | | 5,000,000 | | 5,128,800 |
| Georgia Municipal Assn. Inc. COP, City Court Atlanta Project, AMBAC Insured, 5.25%, | | | | |
| 12/01/26 | | 2,000,000 | | 2,001,580 |
| Georgia School Boards Assn. Inc. COP, DeKalb County Public Schools Project, | | | | |
| AMBAC Insured, 5.00%, 12/01/27 | | 4,285,000 | | 4,483,224 |
| NATL Insured, 5.00%, 12/01/25 | | 2,600,000 | | 2,704,416 |
| Georgia State GO, Series B, 5.00%, 7/01/28 | | 3,225,000 | | 3,575,590 |
| Georgia State HFAR, SFM, | | | | |
| Series A, 3.80%, 12/01/37 | | 5,000,000 | | 4,892,450 |
| Series C, 5.00%, 12/01/27 | | 1,000,000 | | 1,020,950 |
| Georgia State Higher Education Facilities Authority Revenue, USG Real Estate Foundation I LLC | | | | |
| Project, | | | | |
| 6.00%, 6/15/34 | | 5,000,000 | | 5,488,150 |
| Assured Guaranty, 5.625%, 6/15/38 | | 3,000,000 | | 3,160,770 |
| Georgia State Municipal Electric Authority Power Revenue, | | | | |
| Series GG, 5.00%, 1/01/39 | | 7,000,000 | | 7,462,070 |
| Series W, 6.60%, 1/01/18 | | 530,000 | | 601,047 |
| Georgia State Municipal Electric Authority Revenue, | | | | |
| General Resolution Projects, sub. note, Refunding, Series D, 5.50%, 1/01/26 | | 5,000,000 | | 5,663,350 |
| Project One, sub. bond, Series E, NATL Insured, 5.00%, 1/01/25 | | 2,315,000 | | 2,422,879 |
| Georgia State Municipal Gas Authority Revenue, Gas Portfolio III, Refunding, Series S, 5.00%, | | | | |
| 10/01/25 | | 2,500,000 | | 2,793,250 |
| 10/01/26 | | 2,500,000 | | 2,767,775 |
| Glynn-Brunswick Memorial Hospital Authority Revenue, Anticipation Certificates, Southeast | | | | |
| Georgia Health System Project, Series A, 5.625%, 8/01/34 | | 5,000,000 | | 5,277,450 |
108 | Annual Report
| | | | | |
| | Franklin Tax-Free Trust | | | | |
| |
| | Statement of Investments, February 28, 2014 (continued) | | | | |
| |
| |
| | Franklin Georgia Tax-Free Income Fund | | Principal Amount | | Value |
| | Municipal Bonds (continued) | | | | |
| | Georgia (continued) | | | | |
| | Gwinnett County Development Authority COP, Gwinnett County Public Schools Project, | | | | |
| | Refunding, NATL Insured, 5.25%, | | | | |
| | 1/01/22 | $ | 3,000,000 | $ | 3,554,640 |
| | 1/01/24 | | 2,000,000 | | 2,378,420 |
| | Gwinnett County Hospital Authority Revenue, Anticipation Certificates, Gwinnett Hospital | | | | |
| | System Inc. Project, Series D, AGMC Insured, 5.50%, 7/01/37 | | 4,000,000 | | 4,288,800 |
| | Gwinnett County School District GO, | | | | |
| | 5.00%, 2/01/32 | | 4,125,000 | | 4,469,561 |
| | 5.00%, 2/01/36 | | 5,815,000 | | 6,236,006 |
| Pre -Refunded, 5.00%, 2/01/32 | | 875,000 | | 1,018,964 |
| | Habersham County Hospital Authority Revenue, Anticipation Certificates, XLCA Insured, 5.00%, | | | | |
| | 12/01/27 | | 2,015,000 | | 2,063,098 |
| | Habersham County School District GO, NATL Insured, Pre-Refunded, 5.00%, 4/01/28 | | 2,750,000 | | 3,016,805 |
| | Hogansville Combined Public Utility System Revenue, Refunding, AGMC Insured, 6.00%, | | | | |
| | 10/01/23 | | 3,300,000 | | 4,088,535 |
| | LaGrange-Troup County Hospital Authority Revenue, Series A, 5.50%, 7/01/38 | | 4,000,000 | | 4,213,040 |
| | Lincoln County School District GO, 5.50%, 4/01/37 | | 2,200,000 | | 2,407,086 |
| | Macon-Bibb County Hospital Authority Revenue, The Medical Center of Central Georgia Inc. | | | | |
| | Project, RAN, 5.00%, 8/01/35 | | 5,000,000 | | 5,196,350 |
| | Main Street Natural Gas Inc. Revenue, Gas Project, Series A, 5.50%, 9/15/27 | | 5,000,000 | | 5,561,550 |
| | Medical Center Hospital Authority Revenue, Anticipation Certificates, Columbus Regional | | | | |
| | Healthcare System Inc. Project, | | | | |
| | Assured Guaranty, 6.375%, 8/01/29 | | 4,000,000 | | 4,368,240 |
| | Refunding, AGMC Insured, 5.00%, 8/01/41 | | 5,000,000 | | 5,106,900 |
| | Metropolitan Atlanta Rapid Transit Authority Sales Tax Revenue, Third Indenture Series, | | | | |
| | Refunding, Series B, AGMC Insured, 5.00%, 7/01/37 | | 10,000,000 | | 10,702,800 |
| | Newton County IDAR, Georgia Perimeter College Foundation Real Estate Newton LLC Academic | | | | |
| | Building Newton Campus Project, Assured Guaranty, 5.00%, 6/01/24 | | 3,150,000 | | 3,294,364 |
| | Paulding County GO, Courthouse Government Complex Project, NATL RE, FGIC Insured, 5.00%, | | | | |
| | 2/01/32 | | 4,000,000 | | 4,258,800 |
| | Paulding County Hospital Authority Revenue, Anticipation Certificates, Series A, 5.00%, | | | | |
| | 4/01/42 | | 3,500,000 | | 3,646,090 |
| | Paulding County School District GO, 5.00%, 2/01/33 | | 4,000,000 | | 4,239,240 |
| | Peach County Development Authority Student Housing Facilities Revenue, Fort Valley State | | | | |
| | University Foundation Property LLC Project, AMBAC Insured, 5.00%, 6/01/34 | | 3,000,000 | | 3,029,490 |
| | Private Colleges and Universities Authority Revenue, Emory University, Refunding, | | | | |
| | Series A, 5.00%, 9/01/41 | | 8,695,000 | | 9,322,605 |
| | Series A, 5.00%, 10/01/43 | | 5,000,000 | | 5,435,700 |
| | Series B, 5.00%, 9/01/35 | | 10,000,000 | | 10,779,400 |
| | Richmond County Development Authority Educational Facilities Revenue, Augusta State | | | | |
| | University Jaguar Student Center LLC Project, Series A, XLCA Insured, 5.00%, 7/01/29 | | 1,000,000 | | 1,026,090 |
| | Richmond County Development Authority Solid Waste Disposal Revenue, International Paper Co. | | | | |
| | Project, 5.80%, 12/01/20 | | 1,500,000 | | 1,501,680 |
| | Savannah EDA Revenue, Armstrong Center LLC Project, Series A, XLCA Insured, 5.00%, | | | | |
| | 12/01/30 | | 1,500,000 | | 1,539,600 |
| | Thomasville Hospital Authority Revenue, Anticipation Certificates, John D. Archbold Memorial | | | | |
| | Hospital Inc. Project, | | | | |
| | 5.25%, 11/01/35 | | 1,000,000 | | 1,047,930 |
| | 5.375%, 11/01/40 | | 5,000,000 | | 5,254,750 |
| |
| | | | Annual Report | 109 |
| | | | |
| Franklin Tax-Free Trust | | | | |
| |
| Statement of Investments, February 28, 2014 (continued) | | | | |
| |
| |
| Franklin Georgia Tax-Free Income Fund | | Principal Amount | | Value |
| Municipal Bonds (continued) | | | | |
| Georgia (continued) | | | | |
| Tift County Hospital Revenue, Anticipation Certificates, Refunding, 5.00%, 12/01/38 | $ | 2,000,000 | $ | 2,083,200 |
| Upper Oconee Basin Water Authority Revenue, Refunding, NATL Insured, 5.00%, 7/01/26 | | 1,000,000 | | 1,043,340 |
| Valdosta and Lowndes County Hospital Authority Revenue, Certificates, South Georgia Medical | | | | |
| Center Project, | | | | |
| 5.00%, 10/01/33 | | 2,000,000 | | 2,022,060 |
| Series B, 5.00%, 10/01/41 | | 3,000,000 | | 3,083,610 |
| Walton County School District GO, Refunding, 5.25%, 8/01/25 | | 3,775,000 | | 4,569,864 |
| Walton County Water and Sewer Authority Revenue, | | | | |
| Hard Labor Creek Project, AGMC Insured, 5.00%, 2/01/33 | | 5,000,000 | | 5,249,050 |
| Oconee, Hard Creek Resources Project, AGMC Insured, 5.00%, 2/01/38 | | 3,845,000 | | 4,142,488 |
| | | | | 467,932,716 |
| U.S. Territories 6.3% | | | | |
| Puerto Rico 6.3% | | | | |
| Puerto Rico Commonwealth GO, Public Improvement, Refunding, Series B, 6.00%, 7/01/39 | | 5,000,000 | | 3,955,900 |
| Puerto Rico Commonwealth Highways and Transportation Authority Transportation Revenue, | | | | |
| Refunding, Series L, NATL Insured, 5.25%, 7/01/35 | | 10,000,000 | | 8,425,600 |
| Puerto Rico Electric Power Authority Power Revenue, | | | | |
| Refunding, Series A, 5.00%, 7/01/42 | | 5,000,000 | | 3,217,450 |
| Series XX, 5.25%, 7/01/40 | | 5,000,000 | | 3,327,550 |
| Puerto Rico Sales Tax FICO Sales Tax Revenue, | | | | |
| first subordinate, Series A, 5.375%, 8/01/39 | | 10,000,000 | | 7,694,600 |
| first subordinate, Series C, 5.50%, 8/01/40 | | 5,000,000 | | 3,976,800 |
| Senior Series C, 5.25%, 8/01/40 | | 1,430,000 | | 1,200,928 |
| | | | | 31,798,828 |
| Total Municipal Bonds (Cost $486,874,031) 99.1% | | | | 499,731,544 |
| Other Assets, less Liabilities 0.9% | | | | 4,638,144 |
| Net Assets 100.0% | | | $ | 504,369,688 |
| |
| |
| |
| See Abbreviations on page 182. | | | | |
110 | The accompanying notes are an integral part of these financial statements. | Annual Report
| | | | | | | | | | | | | | | |
| Franklin Tax-Free Trust | | | | | | | | | | | | | | | |
| Financial Highlights | | | | | | | | | | | | | | | |
| |
| Franklin Kentucky Tax-Free Income Fund | | | | | | | | | | | | | | | |
| | | | | | Year Ended February 28, | | | | |
| Class A | | 2014 | | | 2013 | | | 2012 | a | | 2011 | | | 2010 | |
| Per share operating performance | | | | | | | | | | | | | | | |
| (for a share outstanding throughout the year) | | | | | | | | | | | | | | | |
| Net asset value, beginning of year | $ | 11.86 | | $ | 11.62 | | $ | 10.78 | | $ | 11.15 | | $ | 10.50 | |
| Income from investment operationsb: | | | | | | | | | | | | | | | |
| Net investment incomec | | 0.43 | | | 0.43 | | | 0.47 | | | 0.45 | | | 0.46 | |
| Net realized and unrealized gains (losses) | | (0.75 | ) | | 0.24 | | | 0.83 | | | (0.37 | ) | | 0.66 | |
| Total from investment operations | | (0.32 | ) | | 0.67 | | | 1.30 | | | 0.08 | | | 1.12 | |
| Less distributions from net investment income | | (0.42 | ) | | (0.43 | ) | | (0.46 | ) | | (0.45 | ) | | (0.47 | ) |
| Net asset value, end of year | $ | 11.12 | | $ | 11.86 | | $ | 11.62 | | $ | 10.78 | | $ | 11.15 | |
| |
| Total returnd | | (2.70 | )% | | 5.84 | % | | 12.32 | % | | 0.72 | % | | 10.85 | % |
| |
| Ratios to average net assets | | | | | | | | | | | | | | | |
| Expenses | | 0.76 | % | | 0.74 | % | | 0.75 | % | | 0.74 | % | | 0.76 | % |
| Net investment income | | 3.82 | % | | 3.63 | % | | 4.19 | % | | 4.06 | % | | 4.25 | % |
| |
| Supplemental data | | | | | | | | | | | | | | | |
| Net assets, end of year (000’s) | $ | 165,889 | | $ | 218,769 | | $ | 190,231 | | $ | 182,525 | | $ | 187,618 | |
| Portfolio turnover rate | | 10.56 | % | | 6.76 | % | | 17.21 | % | | 13.17 | % | | 8.41 | % |
aFor the year ended February 29.
bThe amount shown for a share outstanding throughout the period may not correlate with the Statement of Operations for the period due to the timing of sales and repurchases of
the Fund shares in relation to income earned and/or fluctuating market value of the investments of the Fund.
cBased on average daily shares outstanding.
dTotal return does not reflect sales commissions or contingent deferred sales charges, if applicable.
Annual Report | The accompanying notes are an integral part of these financial statements. | 111
| | | | |
| Franklin Tax-Free Trust | | | | |
| |
| Statement of Investments, February 28, 2014 | | | | |
| |
| |
| Franklin Kentucky Tax-Free Income Fund | | Principal Amount | | Value |
| Municipal Bonds 98.2% | | | | |
| Kentucky 91.1% | | | | |
| Boone County PCR, Collateralized, Dayton Power and Light Co. Project, Refunding, Series A, | | | | |
| FGIC Insured, 4.70%, 1/01/28 | $ | 3,000,000 | $ | 3,049,860 |
| Bowling Green GO, Project, Series A, 5.00%, 6/01/38 | | 5,000,000 | | 5,386,800 |
| Boyle County Revenue, Refunding and College Improvement, Assured Guaranty, 5.00%, | | | | |
| 6/01/32 | | 1,500,000 | | 1,554,285 |
| Campbell and Kenton Counties Sanitation District No. 1 Sanitation District Revenue, | | | | |
| NATL Insured, 5.00%, 8/01/37 | | 2,500,000 | | 2,611,150 |
| Campbell County School District Finance Corp. School Building Revenue, AGMC Insured, | | | | |
| 5.00%, 8/01/26 | | 2,845,000 | | 2,965,941 |
| Christian County Hospital Revenue, Jennie Stuart Medical Center Inc., Refunding, | | | | |
| Assured Guaranty, 5.50%, 2/01/36 | | 3,000,000 | | 3,100,800 |
| Glasgow Healthcare Revenue, T.J. Samson Community Hospital Project, 6.45%, 2/01/41 | | 2,000,000 | | 2,180,120 |
| Greater Kentucky Housing Assistance Corp. Mortgage Revenue, Section 8 Assisted Projects, | | | | |
| Refunding, Series A, NATL Insured, 6.10%, 1/01/24 | | 265,000 | | 265,374 |
| Jefferson County School District Finance Corp. School Building Revenue, | | | | |
| Series A, NATL Insured, 4.75%, 6/01/27 | | 2,440,000 | | 2,587,815 |
| Series D, 3.00%, 10/01/27 | | 1,760,000 | | 1,616,419 |
| Kentucky Area Development Districts Financing Trust Lease Acquisition Program COP, Series L, | | | | |
| XLCA Insured, 5.00%, 11/01/29 | | 1,000,000 | | 1,028,270 |
| Kentucky Economic Development Finance Authority Hospital Revenue, Baptist Healthcare | | | | |
| System Obligated Group, 5.25%, 8/15/46 | | 5,000,000 | | 5,161,400 |
| Kentucky Economic Development Finance Authority Louisville Arena Project Revenue, Louisville | | | | |
| Arena Authority Inc., Sub Series A-1, Assured Guaranty, 6.00%, 12/01/33 | | 2,000,000 | | 2,092,460 |
| Kentucky Economic Development Finance Authority Revenue, Catholic Health, Refunding, | | | | |
| Series A, 5.00%, 5/01/29 | | 5,670,000 | | 6,010,087 |
| Kentucky Rural Water Finance Corp. Public Project Revenue, Multimodal, Flexible Term Program, | | | | |
| Series A, 5.00%, 2/01/26 | | 485,000 | | 485,485 |
| Series I, 5.00%, 2/01/34 | | 1,010,000 | | 1,015,494 |
| Kentucky State Housing Corp. Conduit MFHR, Collateral Mortgage Loan, Country Place | | | | |
| Apartments Project, GNMA Secured, | | | | |
| 5.00%, 4/20/40 | | 2,280,000 | | 2,323,206 |
| 5.25%, 4/20/45 | | 1,850,000 | | 1,904,501 |
| Kentucky State Housing Corp. Housing Revenue, Series A, 4.60%, 7/01/32 | | 2,000,000 | | 2,011,260 |
| Kentucky State Infrastructure Authority Revenue, Wastewater and Drinking Water Revolving | | | | |
| Fund, Series A, 5.00%, | | | | |
| 2/01/28 | | 2,000,000 | | 2,251,120 |
| 2/01/31 | | 4,190,000 | | 4,645,076 |
| Kentucky State Municipal Power Agency Power System Revenue, Prairie State Project, Series A, | | | | |
| NATL Insured, 5.00%, | | | | |
| 9/01/32 | | 5,000,000 | | 5,244,300 |
| 9/01/37 | | 3,250,000 | | 3,313,472 |
| Kentucky State Property and Buildings Commission Revenues, Project No. 90, Refunding, | | | | |
| 5.50%, 11/01/28 | | 5,000,000 | | 5,624,750 |
| Kentucky State Turnpike Authority Economic Development Road Revenue, Revitalization | | | | |
| Projects, Refunding, Series A, 5.00%, | | | | |
| 7/01/28 | | 1,000,000 | | 1,106,980 |
| 7/01/29 | | 1,000,000 | | 1,107,520 |
| 7/01/30 | | 2,500,000 | | 2,753,825 |
112 | Annual Report
| | | | |
| Franklin Tax-Free Trust | | | | |
| |
| Statement of Investments, February 28, 2014 (continued) | | | | |
| |
| |
| Franklin Kentucky Tax-Free Income Fund | | Principal Amount | | Value |
| Municipal Bonds (continued) | | | | |
| Kentucky (continued) | | | | |
| Lexington-Fayette Urban County Airport Board Revenue, General Airport, Refunding, | | | | |
| Series A, 5.00%, 7/01/27 | $ | 2,000,000 | $ | 2,186,060 |
| Series B, 5.00%, 7/01/29 | | 1,185,000 | | 1,302,434 |
| Lexington-Fayette Urban County Government Public Facilities Corp. Lease Revenue, Eastern | | | | |
| State Hospital Project, Refunding, Series A, 5.25%, 6/01/32 | | 3,000,000 | | 3,204,330 |
| Louisville and Jefferson County Metropolitan Sewer District Sewer and Drainage System Revenue, | | | | |
| Series A, AMBAC Insured, 5.00%, 5/15/36 | | 1,000,000 | | 1,033,080 |
| Louisville Regional Airport Authority Airport System Revenue, AGMC Insured, 5.50%, | | | | |
| 7/01/38 | | 3,000,000 | | 3,105,720 |
| Louisville/Jefferson County Metro Government College Revenue, Bellarmine University Project, | | | | |
| Refunding and Improvement, Series A, 6.00%, 5/01/38 | | 2,500,000 | | 2,588,775 |
| Louisville/Jefferson County Metro Government Health Facilities Revenue, Jewish Hospital and | | | | |
| St. Mary’s HealthCare Inc. Project, Pre-Refunded, 6.125%, 2/01/37 | | 2,000,000 | | 2,415,560 |
| Louisville/Jefferson County Metro Government Industrial Building Revenue, Sisters of Mercy of | | | | |
| the Americas, Regional Community of Cincinnati Obligated Group, 5.00%, 10/01/35 | | 1,500,000 | | 1,508,565 |
| Louisville/Jefferson County Metro Government Parking Authority Revenue, first mortgage, | | | | |
| Series A, 5.375%, 12/01/39 | | 1,995,000 | | 2,183,508 |
| Louisville/Jefferson County Metro Government Student Housing Industrial Building Revenue, | | | | |
| University of Louisville, Phase III Project, Series A, AMBAC Insured, 5.00%, 6/01/34 | | 3,755,000 | | 3,822,064 |
| Murray Hospital Facilities Revenue, Murray, Calloway County Public Hospital Corp. Project, | | | | |
| 5.125%, 8/01/37 | | 2,500,000 | | 2,396,325 |
| 6.375%, 8/01/40 | | 2,500,000 | | 2,619,350 |
| Oldham County School District Finance Corp. School Building Revenue, NATL Insured, | | | | |
| Pre-Refunded, 5.00%, 5/01/24 | | 3,000,000 | | 3,022,620 |
| Owen County Waterworks System Revenue, American Water Co. Project, | | | | |
| Series A, 6.25%, 6/01/39 | | 2,000,000 | | 2,115,680 |
| Series A, 5.375%, 6/01/40 | | 2,000,000 | | 2,036,400 |
| Series B, 5.625%, 9/01/39 | | 2,000,000 | | 2,061,280 |
| Owensboro GO, Public Project, 5.00%, 4/01/41 | | 5,440,000 | | 5,751,440 |
| Paducah Electric Plant Board Revenue, Series A, Assured Guaranty, 5.25%, 10/01/35 | | 6,500,000 | | 6,906,250 |
| Pikeville Hospital Revenue, Pikeville Medical Center, Refunding and Improvement, 6.50%, | | | | |
| 3/01/41 | | 2,875,000 | | 3,207,407 |
| Princeton Electric Plant Board Revenue, Series A, Assured Guaranty, 5.00%, 11/01/37 | | 1,500,000 | | 1,582,950 |
| Pulaski County Public Properties Corp. First Mortgage Revenue, AOC Judicial Facility, Refunding, | | | | |
| 6.00%, 12/01/28 | | 1,000,000 | | 1,127,780 |
| Russell Revenue, Bon Secours Health System Inc., Refunding, 5.00%, 11/01/26 | | 5,000,000 | | 5,370,100 |
| Trimble County Environmental Facilities Revenue, | | | | |
| Kentucky Utilities Co. Project, Series A, AMBAC Insured, 6.00%, 3/01/37 | | 5,000,000 | | 5,349,800 |
| Louisville Gas and Electric Co. Project, Refunding, Series A, AMBAC Insured, 4.60%, | | | | |
| 6/01/33 | | 3,750,000 | | 3,785,700 |
| University of Louisville Revenue, General Receipts, Series A, 5.00%, 9/01/28 | | 2,220,000 | | 2,448,460 |
| Warren County Hospital Facility Revenue, | | | | |
| Bowling Green, Warren County, Series A, 5.00%, 10/01/33 | | 1,750,000 | | 1,849,855 |
| Community Hospital Corp. Project, Refunding, Series A, 5.00%, 8/01/29 | | 1,000,000 | | 1,027,910 |
| Western Kentucky University Revenue, General Receipts, Series A, 5.00%, 5/01/32 | | 1,625,000 | | 1,777,262 |
| | | | | 151,184,435 |
Annual Report | 113
| | | | |
| Franklin Tax-Free Trust | | | | |
| |
| Statement of Investments, February 28, 2014 (continued) | | | | |
| |
| |
| Franklin Kentucky Tax-Free Income Fund | | Principal Amount | | Value |
| Municipal Bonds (continued) | | | | |
| U.S. Territories 7.1% | | | | |
| Puerto Rico 7.1% | | | | |
| Children’s Trust Fund Tobacco Settlement Revenue, Asset-Backed, Refunding, 5.375%, | | | | |
| 5/15/33 | $ | 1,375,000 | $ | 1,362,708 |
| Puerto Rico Commonwealth GO, Public Improvement, Series A, 5.125%, 7/01/31 | | 3,125,000 | | 2,337,656 |
| Puerto Rico Commonwealth Highways and Transportation Authority Transportation Revenue, | | | | |
| Series K, 5.00%, 7/01/27 | | 3,000,000 | | 1,908,390 |
| Puerto Rico PBA Guaranteed Revenue, Government Facilities, Refunding, Series N, 5.00%, | | | | |
| 7/01/32 | | 3,000,000 | | 2,167,920 |
| Puerto Rico Sales Tax FICO Sales Tax Revenue, first subordinate, Series C, 5.50%, 8/01/40 | | 5,000,000 | | 3,976,800 |
| | | | | 11,753,474 |
| Total Municipal Bonds (Cost $159,915,827) 98.2% | | | | 162,937,909 |
| Other Assets, less Liabilities 1.8% | | | | 2,951,332 |
| Net Assets 100.0% | | | $ | 165,889,241 |
| |
| |
| |
| See Abbreviations on page 182. | | | | |
114 | The accompanying notes are an integral part of these financial statements. | Annual Report
| | | | | | | | | | | | | | | |
| Franklin Tax-Free Trust | | | | | | | | | | | | | | | |
| Financial Highlights | | | | | | | | | | | | | | | |
| |
| Franklin Louisiana Tax-Free Income Fund | | | | | | | | | | | | | | | |
| | | | | | Year Ended February 28, | | | | |
| Class A | | 2014 | | | 2013 | | | 2012 | a | | 2011 | | | 2010 | |
| Per share operating performance | | | | | | | | | | | | | | | |
| (for a share outstanding throughout the year) | | | | | | | | | | | | | | | |
| Net asset value, beginning of year | $ | 12.04 | | $ | 11.88 | | $ | 10.91 | | $ | 11.28 | | $ | 10.43 | |
| Income from investment operationsb: | | | | | | | | | | | | | | | |
| Net investment incomec | | 0.45 | | | 0.44 | | | 0.48 | | | 0.48 | | | 0.48 | |
| Net realized and unrealized gains (losses) | | (0.80 | ) | | 0.15 | | | 0.98 | | | (0.37 | ) | | 0.85 | |
| Total from investment operations | | (0.35 | ) | | 0.59 | | | 1.46 | | | 0.11 | | | 1.33 | |
| Less distributions from net investment income | | (0.43 | ) | | (0.43 | ) | | (0.49 | ) | | (0.48 | ) | | (0.48 | ) |
| Net asset value, end of year | $ | 11.26 | | $ | 12.04 | | $ | 11.88 | | $ | 10.91 | | $ | 11.28 | |
| |
| Total returnd | | (2.90 | )% | | 5.06 | % | | 13.67 | % | | 0.92 | % | | 12.99 | % |
| |
| Ratios to average net assets | | | | | | | | | | | | | | | |
| Expenses | | 0.67 | % | | 0.67 | % | | 0.68 | % | | 0.68 | % | | 0.69 | % |
| Net investment income | | 3.91 | % | | 3.63 | % | | 4.22 | % | | 4.26 | % | | 4.40 | % |
| |
| Supplemental data | | | | | | | | | | | | | | | |
| Net assets, end of year (000’s) | $ | 321,748 | | $ | 432,579 | | $ | 383,414 | | $ | 323,109 | | $ | 327,368 | |
| Portfolio turnover rate | | 16.98 | % | | 10.08 | % | | 7.06 | % | | 12.90 | % | | 4.45 | % |
aFor the year ended February 29.
bThe amount shown for a share outstanding throughout the period may not correlate with the Statement of Operations for the period due to the timing of sales and repurchases of
the Fund shares in relation to income earned and/or fluctuating market value of the investments of the Fund.
cBased on average daily shares outstanding.
dTotal return does not reflect sales commissions or contingent deferred sales charges, if applicable.
Annual Report | The accompanying notes are an integral part of these financial statements. | 115
| | | | | | | | | | | | | | | |
| Franklin Tax-Free Trust | | | | | | | | | | | | | | | |
| Financial Highlights (continued) | | | | | | | | | | | | | | | |
| |
| Franklin Louisiana Tax-Free Income Fund | | | | | | | | | | | | | | | |
| | | | | | Year Ended February 28, | | | | |
| Class C | | 2014 | | | 2013 | | | 2012 | a | | 2011 | | | 2010 | |
| Per share operating performance | | | | | | | | | | | | | | | |
| (for a share outstanding throughout the year) | | | | | | | | | | | | | | | |
| Net asset value, beginning of year | $ | 12.21 | | $ | 12.03 | | $ | 11.04 | | $ | 11.41 | | $ | 10.54 | |
| Income from investment operationsb: | | | | | | | | | | | | | | | |
| Net investment incomec | | 0.39 | | | 0.37 | | | 0.42 | | | 0.42 | | | 0.43 | |
| Net realized and unrealized gains (losses) | | (0.83 | ) | | 0.17 | | | 1.00 | | | (0.38 | ) | | 0.86 | |
| Total from investment operations | | (0.44 | ) | | 0.54 | | | 1.42 | | | 0.04 | | | 1.29 | |
| Less distributions from net investment income | | (0.36 | ) | | (0.36 | ) | | (0.43 | ) | | (0.41 | ) | | (0.42 | ) |
| Net asset value, end of year | $ | 11.41 | | $ | 12.21 | | $ | 12.03 | | $ | 11.04 | | $ | 11.41 | |
| |
| Total returnd | | (3.55 | )% | | 4.58 | % | | 13.09 | % | | 0.34 | % | | 12.44 | % |
| |
| Ratios to average net assets | | | | | | | | | | | | | | | |
| Expenses | | 1.22 | % | | 1.22 | % | | 1.23 | % | | 1.23 | % | | 1.24 | % |
| Net investment income | | 3.36 | % | | 3.08 | % | | 3.67 | % | | 3.71 | % | | 3.85 | % |
| |
| Supplemental data | | | | | | | | | | | | | | | |
| Net assets, end of year (000’s) | $ | 66,262 | | $ | 100,380 | | $ | 78,121 | | $ | 64,511 | | $ | 64,018 | |
| Portfolio turnover rate | | 16.98 | % | | 10.08 | % | | 7.06 | % | | 12.90 | % | | 4.45 | % |
aFor the year ended February 29.
bThe amount shown for a share outstanding throughout the period may not correlate with the Statement of Operations for the period due to the timing of sales and repurchases of
the Fund shares in relation to income earned and/or fluctuating market value of the investments of the Fund.
cBased on average daily shares outstanding.
dTotal return does not reflect sales commissions or contingent deferred sales charges, if applicable.
116 | The accompanying notes are an integral part of these financial statements. | Annual Report
| | | | |
| Franklin Tax-Free Trust | | | | |
| |
| Statement of Investments, February 28, 2014 | | | | |
| |
| |
| Franklin Louisiana Tax-Free Income Fund | | Principal Amount | | Value |
| Municipal Bonds 96.7% | | | | |
| Louisiana 86.8% | | | | |
| Alexandria Sales and Use Tax Revenue, 5.00%, | | | | |
| 8/01/26 | $ | 1,710,000 | $ | 1,895,125 |
| 8/01/27 | | 1,790,000 | | 1,974,334 |
| 8/01/28 | | 1,875,000 | | 2,057,419 |
| Alexandria Utilities Revenue, Series A, 5.00%, 5/01/38 | | 10,000,000 | | 10,532,400 |
| Bossier City Utilities Revenue, BHAC Insured, 5.50%, 10/01/33 | | 5,000,000 | | 5,438,800 |
| Calcasieu Parish Public Trust Authority Student Lease Revenue, McNeese State University | | | | |
| Student Housing, Cowboy Facilities Inc. Project, Refunding, AGMC Insured, 5.00%, | | | | |
| 5/01/29 | | 2,050,000 | | 2,123,452 |
| Calcasieu Parish School District No. 23 GO, Public School, Refunding, Series A, 5.00%, | | | | |
| 2/15/29 | | 1,380,000 | | 1,500,502 |
| East Baton Rouge Mortgage Finance Authority SFMR, MBS Program, | | | | |
| Refunding, Series A-3, GNMA Secured, 5.00%, 10/01/28 | | 500,000 | | 502,715 |
| Series A-2, GNMA Secured, 5.10%, 10/01/40 | | 340,000 | | 344,321 |
| East Baton Rouge Parish Park and Recreation District GO, AGMC Insured, Pre-Refunded, | | | | |
| 5.00%, 5/01/25 | | 3,325,000 | | 3,509,105 |
| East Baton Rouge Parish Sales Tax Revenue, | | | | |
| Public Improvement, Series A, AMBAC Insured, Pre-Refunded, 5.00%, 2/01/24 | | 2,000,000 | | 2,086,800 |
| Road and Street Improvement, Assured Guaranty, 5.25%, 8/01/28 | | 1,000,000 | | 1,119,420 |
| Road and Street Improvement, Assured Guaranty, 5.50%, 8/01/30 | | 1,700,000 | | 1,906,958 |
| East Baton Rouge Sewerage Commission Revenue, Refunding, Series A, 5.25%, | | | | |
| 2/01/34 | | 2,500,000 | | 2,701,400 |
| 2/01/39 | | 8,250,000 | | 8,826,180 |
| England District Sub-District No. 1 Revenue, NATL RE, FGIC Insured, Pre-Refunded, 5.00%, | | | | |
| 8/15/19 | | 5,000,000 | | 5,348,250 |
| Jefferson Parish Hospital Service District No.1 Hospital Revenue, West Jefferson Medical Center, | | | | |
| Refunding, Series A, 6.00%, 1/01/39 | | 3,105,000 | | 3,306,359 |
| Jefferson Parish Revenue, Public Improvement, 24th Judicial District Project, NATL Insured, | | | | |
| 5.00%, 4/01/29 | | 3,060,000 | | 3,077,717 |
| Jefferson Parish West Jefferson Park and Community Center Revenue, NATL Insured, 5.00%, | | | | |
| 10/01/29 | | 2,925,000 | | 2,957,555 |
| Kenner Consolidated Sewerage District Revenue, AGMC Insured, 5.00%, 11/01/36 | | 4,000,000 | | 4,162,240 |
| Kenner Sales Tax Revenue, Refunding, Series A, 5.00%, 6/01/33 | | 8,605,000 | | 9,195,131 |
| Lafayette Communications Systems Revenue, XLCA Insured, 5.25%, 11/01/27 | | 5,000,000 | | 5,440,800 |
| Lafayette Public Improvement Sales Tax Revenue, 5.00%, 3/01/36 | | 1,865,000 | | 1,947,657 |
| Lafayette Public Power Authority Electric Revenue, NATL Insured, 5.00%, 11/01/32 | | 5,000,000 | | 5,260,300 |
| Lafayette Public Trust Financing Authority Revenue, | | | | |
| Ragin’ Cajun Facilities Inc. Housing and Parking Project, Assured Guaranty, 5.25%, | | | | |
| 10/01/30 | | 4,000,000 | | 4,224,800 |
| Ragin’ Cajun Facilities Inc. Project, Assured Guaranty, 5.75%, 10/01/29 | | 750,000 | | 807,968 |
| Ragin’ Cajun Facilities Inc. Project, Assured Guaranty, 6.00%, 10/01/34 | | 1,750,000 | | 1,878,030 |
| Ragin’ Cajun Facilities Inc. Project, Assured Guaranty, 6.00%, 10/01/38 | | 1,335,000 | | 1,425,219 |
| Lafayette Utilities Revenue, | | | | |
| 5.00%, 11/01/33 | | 5,000,000 | | 5,497,700 |
| NATL Insured, Pre-Refunded, 5.00%, 11/01/28 | | 5,000,000 | | 5,158,150 |
| Louisiana HFA, SFMR, Home Ownership Program, | | | | |
| Series A, GNMA Secured, 5.50%, 6/01/40 | | 2,800,000 | | 2,821,728 |
| Series B, GNMA Secured, 6.125%, 12/01/33 | | 555,000 | | 586,557 |
Annual Report | 117
| | | | |
| Franklin Tax-Free Trust | | | | |
| |
| Statement of Investments, February 28, 2014 (continued) | | | | |
| |
| |
| Franklin Louisiana Tax-Free Income Fund | | Principal Amount | | Value |
| Municipal Bonds (continued) | | | | |
| Louisiana (continued) | | | | |
| Louisiana Local Government Environmental Facilities and CDA Revenue, | | | | |
| Ascension Parish Library Projects, AMBAC Insured, Pre-Refunded, 5.25%, 4/01/29 | $ | 1,000,000 | $ | 1,054,060 |
| Delta Campus Facilities Corp. Project, Assured Guaranty, 5.50%, 10/01/27 | | 5,000,000 | | 5,368,700 |
| Denham Springs Sewer District No. 1 Project, Assured Guaranty, 5.00%, 12/01/39 | | 3,750,000 | | 3,940,387 |
| East Ascension Consolidated Gravity Drainage District No. 1 Project, Refunding, | | | | |
| AMBAC Insured, 5.00%, 12/01/37 | | 5,370,000 | | 5,605,958 |
| East Ascension Consolidated Gravity Drainage District No. 1 Project, Refunding, | | | | |
| AMBAC Insured, 5.00%, 12/01/44 | | 8,870,000 | | 9,210,164 |
| Independence Stadium Project, Refunding, 5.25%, 3/01/30 | | 8,845,000 | | 9,195,970 |
| Jefferson Parish Projects, Refunding, Series A, 5.375%, 4/01/31 | | 2,000,000 | | 2,153,580 |
| Lake Charles Public Improvements Project, AMBAC Insured, 5.00%, 5/01/27 | | 1,000,000 | | 1,076,320 |
| Livingston Parish Road Project, AMBAC Insured, 5.00%, 3/01/21 | | 3,540,000 | | 3,681,246 |
| McNeese State University Student Parking, Cowboys Facilities Inc. Project, AGMC Insured, | | | | |
| 5.00%, 3/01/36 | | 1,800,000 | | 1,851,300 |
| Monroe Regional Airport Terminal Project, Assured Guaranty, 5.50%, 2/01/39 | | 2,000,000 | | 2,116,440 |
| Shreveport Airport Cargo Project, Series C, Assured Guaranty, 6.75%, 1/01/24 | | 2,620,000 | | 2,889,467 |
| Shreveport Airport Cargo Project, Series C, Assured Guaranty, 7.00%, 1/01/33 | | 2,500,000 | | 2,706,100 |
| Southeastern Louisiana Student Housing, University Facilities Inc. Project, Series A, | | | | |
| NATL Insured, Pre-Refunded, 5.00%, 8/01/27 | | 3,000,000 | | 3,059,340 |
| Louisiana Public Facilities Authority Hospital Revenue, | | | | |
| Franciscan Missionaries of Our Lady Health System Project, Series A, 6.75%, 7/01/39 | | 3,500,000 | | 3,902,010 |
| Lafayette General Medical Center Project, Refunding, 5.50%, 11/01/40 | | 5,000,000 | | 5,130,700 |
| Touro Infirmary Project, Series A, 5.625%, 8/15/29 | | 3,435,000 | | 3,435,103 |
| Louisiana Public Facilities Authority Revenue, | | | | |
| Archdiocese of New Orleans Project, Refunding, CIFG Insured, 5.00%, 7/01/31 | | 6,000,000 | | 6,182,700 |
| Black and Gold Facilities Project, Series A, CIFG Insured, 5.00%, 7/01/30 | | 5,000,000 | | 4,445,550 |
| CHRISTUS Health, Refunding, Series B, Assured Guaranty, 6.50%, 7/01/30 | | 5,000,000 | | 5,690,900 |
| Entergy Louisiana LLC Project, Refunding, 5.00%, 6/01/30 | | 5,000,000 | | 5,115,000 |
| Loyola University Project, 5.00%, 10/01/39 | | 5,000,000 | | 5,204,100 |
| Loyola University Project, 5.00%, 10/01/41 | | 5,000,000 | | 5,171,750 |
| Ochsner Clinic Foundation Project, 6.75%, 5/15/41 | | 5,000,000 | | 5,484,850 |
| Ochsner Clinic Foundation Project, Refunding, Series A, 5.375%, 5/15/43 | | 5,000,000 | | 5,033,800 |
| Ochsner Clinic Foundation Project, Series B, 5.25%, 5/15/27 | | 3,990,000 | | 4,081,411 |
| Ochsner Clinic Foundation Project, Series B, ETM, 5.75%, 5/15/23 | | 2,500,000 | | 3,184,850 |
| Tulane University of Louisiana Project, Series B, 5.00%, 10/01/37 | | 5,540,000 | | 5,811,626 |
| Louisiana State Citizens Property Insurance Corp. Assessment Revenue, | | | | |
| Series B, AMBAC Insured, 5.00%, 6/01/23 | | 5,000,000 | | 5,283,800 |
| Series C-2, Assured Guaranty, 6.75%, 6/01/26 | | 5,000,000 | | 5,875,800 |
| Louisiana State Gasoline and Fuels Tax Revenue, | | | | |
| second lien, Refunding, Series C-1, 5.00%, 5/01/43 | | 5,000,000 | | 5,332,500 |
| Series A, AGMC Insured, 5.00%, 5/01/31 | | 13,000,000 | | 14,062,360 |
| Series A, NATL RE, FGIC Insured, Pre-Refunded, 5.00%, 5/01/35 | | 2,300,000 | | 2,427,351 |
| Louisiana State GO, Match, Series B, Assured Guaranty, Pre-Refunded, 5.00%, | | | | |
| 7/15/24 | | 3,475,000 | | 3,856,346 |
| 7/15/25 | | 1,765,000 | | 1,958,691 |
118 | Annual Report
| | | | |
| Franklin Tax-Free Trust | | | | |
| |
| Statement of Investments, February 28, 2014 (continued) | | | | |
| |
| |
| Franklin Louisiana Tax-Free Income Fund | | Principal Amount | | Value |
| Municipal Bonds (continued) | | | | |
| Louisiana (continued) | | | | |
| Louisiana State Highway Improvement Revenue, Series A, 5.00%, 6/15/30 | $ | 2,860,000 | $ | 3,173,284 |
| Louisiana State Transportation Authority Revenue, Refunding, Series A, 5.00%, 8/15/38 | | 4,500,000 | | 4,876,740 |
| Louisiana State Unclaimed Property Special Revenue, Series I-49 Project, 5.00%, 9/01/33 | | 5,860,000 | | 6,304,540 |
| Louisiana State University and Agricultural and Mechanical College Revenue, Board of | | | | |
| Supervisors, Auxiliary, | | | | |
| 5.00%, 7/01/37 | | 4,000,000 | | 4,254,040 |
| NATL RE, FGIC Insured, 5.00%, 7/01/31 | | 3,000,000 | | 3,125,280 |
| Refunding, Series A, 5.00%, 7/01/40 | | 5,000,000 | | 5,202,900 |
| New Orleans Aviation Board Revenue, Restructuring GARB, Refunding, Series A-1, | | | | |
| Assured Guaranty, 6.00%, 1/01/23 | | 2,000,000 | | 2,242,600 |
| New Orleans GO, | | | | |
| Drainage System, AMBAC Insured, 5.00%, 12/01/18 | | 1,000,000 | | 1,001,680 |
| Public Improvement, AMBAC Insured, Pre-Refunded, 5.25%, 12/01/29 | | 1,485,000 | | 1,540,450 |
| Radian Insured, 5.125%, 12/01/30 | | 10,055,000 | | 10,401,194 |
| New Orleans Sewage Service Revenue, Refunding, Assured Guaranty, 6.25%, 6/01/29 | | 500,000 | | 556,910 |
| Port of New Orleans Board of Commissioners Port Facility Revenue, Refunding, | | | | |
| Assured Guaranty, 5.125%, 4/01/38 | | 5,000,000 | | 5,033,550 |
| Shreveport GO, 5.00%, 8/01/29 | | 4,790,000 | | 5,173,871 |
| St. John the Baptist Parish Revenue, Marathon Oil Corp. Project, Series A, 5.125%, 6/01/37 | | 5,000,000 | | 5,084,850 |
| St. Tammany Parish Utilities Revenue, Series B, | | | | |
| 5.50%, 8/01/35 | | 2,650,000 | | 2,838,548 |
| 5.00%, 8/01/44 | | 3,290,000 | | 3,393,470 |
| Terrebonne Parish Sales and Use Tax Revenue, Morganza Levee Improvement, Series ST, | | | | |
| AGMC Insured, 5.00%, 4/01/32 | | 2,265,000 | | 2,397,548 |
| | | | | 336,796,777 |
| U.S. Territories 9.9% | | | | |
| Puerto Rico 8.9% | | | | |
| Puerto Rico Commonwealth GO, Public Improvement, | | | | |
| Refunding, Series A-4, AGMC Insured, 5.25%, 7/01/30 | | 5,000,000 | | 4,539,800 |
| Series A, 5.00%, 7/01/33 | | 615,000 | | 449,374 |
| Puerto Rico Commonwealth Highways and Transportation Authority Transportation Revenue, | | | | |
| Refunding, Series L, NATL Insured, 5.25%, 7/01/35 | | 10,000,000 | | 8,425,600 |
| Puerto Rico Electric Power Authority Power Revenue, | | | | |
| Series CCC, 5.25%, 7/01/27 | | 5,000,000 | | 3,503,250 |
| Series WW, 5.25%, 7/01/33 | | 6,450,000 | | 4,466,690 |
| Puerto Rico Sales Tax FICO Sales Tax Revenue, first subordinate, Series A, | | | | |
| 6.375%, 8/01/39 | | 10,000,000 | | 8,540,500 |
| 5.50%, 8/01/42 | | 6,000,000 | | 4,713,120 |
| | | | | 34,638,334 |
| U.S. Virgin Islands 1.0% | | | | |
| Virgin Islands PFAR, Matching Fund Loan Note, sub. lien, Series B, 5.00%, 10/01/25 | | 3,500,000 | | 3,712,800 |
| Total U.S. Territories | | | | 38,351,134 |
| Total Municipal Bonds before Short Term Investments (Cost $366,082,169) | | | | 375,147,911 |
Annual Report | 119
Franklin Tax-Free Trust
Statement of Investments, February 28, 2014 (continued)
| | | | |
| Franklin Louisiana Tax-Free Income Fund | | Principal Amount | | Value |
| Short Term Investments (Cost $5,000,000) 1.3% | | | | |
| Municipal Bonds 1.3% | | | | |
| Louisiana 1.3% | | | | |
| aLouisiana State Offshore Terminal Authority Deepwater Port Revenue, Loop LLC Project, | | | | |
| First Stage, ACES, Refunding, Daily VRDN and Put, 0.05%, 9/01/17 | $ | 5,000,000 | $ | 5,000,000 |
| Total Investments (Cost $371,082,169) 98.0% | | | | 380,147,911 |
| Other Assets, less Liabilities 2.0% | | | | 7,862,322 |
| Net Assets 100.0% | | | $ | 388,010,233 |
See Abbreviations on page 182.
aVariable rate demand notes (VRDNs) are tax-exempt obligations which contain a floating or variable interest rate adjustment formula and an unconditional right of demand to receive payment of the principal balance plus accrued interest at specified dates. The coupon rate shown represents the rate at period end.
120 | The accompanying notes are an integral part of these financial statements. | Annual Report
| | | | | | | | | | | | | | | |
| Franklin Tax-Free Trust | | | | | | | | | | | | | | | |
| Financial Highlights | | | | | | | | | | | | | | | |
| |
| Franklin Maryland Tax-Free Income Fund | | | | | | | | | | | | | | | |
| | | | | | Year Ended February 28, | | | | |
| Class A | | 2014 | | | 2013 | | | 2012 | a | | 2011 | | | 2010 | |
| Per share operating performance | | | | | | | | | | | | | | | |
| (for a share outstanding throughout the year) | | | | | | | | | | | | | | | |
| Net asset value, beginning of year | $ | 11.98 | | $ | 11.90 | | $ | 10.91 | | $ | 11.30 | | $ | 10.35 | |
| Income from investment operationsb: | | | | | | | | | | | | | | | |
| Net investment incomec | | 0.41 | | | 0.42 | | | 0.48 | | | 0.46 | | | 0.49 | |
| Net realized and unrealized gains (losses) | | (0.79 | ) | | 0.09 | | | 0.98 | | | (0.38 | ) | | 0.95 | |
| Total from investment operations | | (0.38 | ) | | 0.51 | | | 1.46 | | | 0.08 | | | 1.44 | |
| Less distributions from net investment income | | (0.40 | ) | | (0.43 | ) | | (0.47 | ) | | (0.47 | ) | | (0.49 | ) |
| Net asset value, end of year | $ | 11.20 | | $ | 11.98 | | $ | 11.90 | | $ | 10.91 | | $ | 11.30 | |
| |
| Total returnd | | (3.17 | )% | | 4.34 | % | | 13.65 | % | | 0.61 | % | | 14.17 | % |
| |
| Ratios to average net assets | | | | | | | | | | | | | | | |
| Expenses | | 0.65 | % | | 0.65 | % | | 0.65 | % | | 0.65 | % | | 0.66 | % |
| Net investment income | | 3.62 | % | | 3.52 | % | | 4.22 | % | | 4.06 | % | | 4.44 | % |
| |
| Supplemental data | | | | | | | | | | | | | | | |
| Net assets, end of year (000’s) | $ | 407,061 | | $ | 538,409 | | $ | 508,123 | | $ | 471,729 | | $ | 511,636 | |
| Portfolio turnover rate | | 12.30 | % | | 19.56 | % | | 11.62 | % | | 11.99 | % | | 7.33 | % |
aFor the year ended February 29.
bThe amount shown for a share outstanding throughout the period may not correlate with the Statement of Operations for the period due to the timing of sales and repurchases of
the Fund shares in relation to income earned and/or fluctuating market value of the investments of the Fund.
cBased on average daily shares outstanding.
dTotal return does not reflect sales commissions or contingent deferred sales charges, if applicable.
Annual Report | The accompanying notes are an integral part of these financial statements. | 121
| | | | | | | | | | | | | | | |
| Franklin Tax-Free Trust | | | | | | | | | | | | | | | |
| Financial Highlights (continued) | | | | | | | | | | | | | | | |
| |
| Franklin Maryland Tax-Free Income Fund | | | | | | | | | | | | | | | |
| | | | | | Year Ended February 28, | | | | |
| Class C | | 2014 | | | 2013 | | | 2012 | a | | 2011 | | | 2010 | |
| Per share operating performance | | | | | | | | | | | | | | | |
| (for a share outstanding throughout the year) | | | | | | | | | | | | | | | |
| Net asset value, beginning of year | $ | 12.18 | | $ | 12.09 | | $ | 11.08 | | $ | 11.46 | | $ | 10.50 | |
| Income from investment operationsb: | | | | | | | | | | | | | | | |
| Net investment incomec | | 0.35 | | | 0.36 | | | 0.42 | | | 0.40 | | | 0.43 | |
| Net realized and unrealized gains (losses) | | (0.81 | ) | | 0.09 | | | 1.00 | | | (0.38 | ) | | 0.96 | |
| Total from investment operations | | (0.46 | ) | | 0.45 | | | 1.42 | | | 0.02 | | | 1.39 | |
| Less distributions from net investment income | | (0.33 | ) | | (0.36 | ) | | (0.41 | ) | | (0.40 | ) | | (0.43 | ) |
| Net asset value, end of year | $ | 11.39 | | $ | 12.18 | | $ | 12.09 | | $ | 11.08 | | $ | 11.46 | |
| |
| Total returnd | | (3.73 | )% | | 3.78 | % | | 13.02 | % | | 0.12 | % | | 13.45 | % |
| |
| Ratios to average net assets | | | | | | | | | | | | | | | |
| Expenses | | 1.20 | % | | 1.20 | % | | 1.20 | % | | 1.20 | % | | 1.21 | % |
| Net investment income | | 3.07 | % | | 2.97 | % | | 3.67 | % | | 3.51 | % | | 3.89 | % |
| |
| Supplemental data | | | | | | | | | | | | | | | |
| Net assets, end of year (000’s) | $ | 130,550 | | $ | 177,499 | | $ | 155,763 | | $ | 143,708 | | $ | 142,575 | |
| Portfolio turnover rate | | 12.30 | % | | 19.56 | % | | 11.62 | % | | 11.99 | % | | 7.33 | % |
aFor the year ended February 29.
bThe amount shown for a share outstanding throughout the period may not correlate with the Statement of Operations for the period due to the timing of sales and repurchases of
the Fund shares in relation to income earned and/or fluctuating market value of the investments of the Fund.
cBased on average daily shares outstanding.
dTotal return does not reflect sales commissions or contingent deferred sales charges, if applicable.
122 | The accompanying notes are an integral part of these financial statements. | Annual Report
| | | | | | | | | | | | | | | |
| Franklin Tax-Free Trust | | | | | | | | | | | | | | | |
| Financial Highlights (continued) | | | | | | | | | | | | | | | |
| |
| Franklin Maryland Tax-Free Income Fund | | | | | | | | | | | | | | | |
| | | | | | Year Ended February 28, | | | | |
| Advisor Class | | 2014 | | | 2013 | | | 2012 | a | | 2011 | | | 2010 | b |
| Per share operating performance | | | | | | | | | | | | | | | |
| (for a share outstanding throughout the year) | | | | | | | | | | | | | | | |
| Net asset value, beginning of year | $ | 11.99 | | $ | 11.90 | | $ | 10.91 | | $ | 11.30 | | $ | 10.69 | |
| Income from investment operationsc: | | | | | | | | | | | | | | | |
| Net investment incomed | | 0.42 | | | 0.43 | | | 0.49 | | | 0.47 | | | 0.33 | |
| Net realized and unrealized gains (losses) | | (0.80 | ) | | 0.10 | | | 0.98 | | | (0.38 | ) | | 0.61 | |
| Total from investment operations | | (0.38 | ) | | 0.53 | | | 1.47 | | | 0.09 | | | 0.94 | |
| Less distributions from net investment income | | (0.41 | ) | | (0.44 | ) | | (0.48 | ) | | (0.48 | ) | | (0.33 | ) |
| Net asset value, end of year | $ | 11.20 | | $ | 11.99 | | $ | 11.90 | | $ | 10.91 | | $ | 11.30 | |
| |
| Total returne | | (3.16 | )% | | 4.53 | % | | 13.76 | % | | 0.71 | % | | 8.83 | % |
| |
| Ratios to average net assetsf | | | | | | | | | | | | | | | |
| Expenses | | 0.55 | % | | 0.55 | % | | 0.55 | % | | 0.55 | % | | 0.56 | % |
| Net investment income | | 3.72 | % | | 3.62 | % | | 4.32 | % | | 4.16 | % | | 4.54 | % |
| |
| Supplemental data | | | | | | | | | | | | | | | |
| Net assets, end of year (000’s) | $ | 19,985 | | $ | 30,380 | | $ | 18,711 | | $ | 6,245 | | $ | 3,504 | |
| Portfolio turnover rate | | 12.30 | % | | 19.56 | % | | 11.62 | % | | 11.99 | % | | 7.33 | % |
aFor the year ended February 29.
bFor the period to July 1, 2009 (effective date) to February 28, 2010.
cThe amount shown for a share outstanding throughout the period may not correlate with the Statement of Operations for the period due to the timing of sales and repurchases of
the Fund shares in relation to income earned and/or fluctuating market value of the investments of the Fund.
dBased on average daily shares outstanding.
eTotal return is not annualized for periods less than one year.
fRatios are annualized for periods less than one year.
Annual Report | The accompanying notes are an integral part of these financial statements. | 123
| | | | |
| Franklin Tax-Free Trust | | | | |
| |
| Statement of Investments, February 28, 2014 | | | | |
| |
| |
| Franklin Maryland Tax-Free Income Fund | | Principal Amount | | Value |
| Municipal Bonds 95.5% | | | | |
| Maryland 85.4% | | | | |
| Annapolis GO, Refunding, 5.00%, 8/01/31 | $ | 1,250,000 | $ | 1,424,675 |
| Anne Arundel County GO, | | | | |
| Consolidated General Improvements, Refunding, 5.00%, 4/01/33 | | 3,140,000 | | 3,534,510 |
| Consolidated Water and Sewer, 5.00%, 4/01/41 | | 12,620,000 | | 13,559,180 |
| Refunding, 4.625%, 3/01/32 | | 2,000,000 | | 2,004,720 |
| Anne Arundel County MFR, Glenview Gardens Apartments Project, Mandatory Put 1/01/27, | | | | |
| 5.00%, 1/01/28 | | 1,990,000 | | 2,224,322 |
| Baltimore City GO, Consolidated Public Improvement, Refunding, Series B, 5.00%, | | | | |
| 10/15/28 | | 500,000 | | 566,050 |
| Baltimore Convention Center Hotel Revenue, Senior Series A, XLCA Insured, 5.25%, | | | | |
| 9/01/39 | | 15,095,000 | | 13,996,839 |
| Baltimore County GO, Metropolitan District 74th Issue, Refunding, 5.00%, 2/01/32 | | 1,250,000 | | 1,416,287 |
| Baltimore Project Revenue, | | | | |
| sub. bond, Water Projects, Series A, 5.375%, 7/01/34 | | 750,000 | | 817,328 |
| sub. bond, Water Projects, Series A, 5.75%, 7/01/39 | | 1,250,000 | | 1,379,038 |
| Wastewater Projects, AGMC Insured, 5.00%, 7/01/37 | | 5,000,000 | | 5,223,450 |
| Wastewater Projects, Series A, 5.00%, 7/01/38 | | 8,930,000 | | 9,724,681 |
| Wastewater Projects, Series A, 5.00%, 7/01/41 | | 14,435,000 | | 15,465,659 |
| Wastewater Projects, Series A, AGMC Insured, 5.00%, 7/01/38 | | 5,000,000 | | 5,236,800 |
| Wastewater Projects, Series C, 5.125%, 7/01/34 | | 1,835,000 | | 1,977,635 |
| Wastewater Projects, Series C, 5.625%, 7/01/39 | | 2,965,000 | | 3,253,287 |
| Wastewater Projects, Series C, AMBAC Insured, 5.00%, 7/01/31 | | 2,855,000 | | 3,024,244 |
| Wastewater Projects, Series D, AMBAC Insured, 5.00%, 7/01/32 | | 2,120,000 | | 2,233,102 |
| Water Projects, Series A, 5.00%, 7/01/41 | | 7,845,000 | | 8,405,133 |
| Water Projects, Series C, AMBAC Insured, 5.00%, 7/01/32 | | 5,000,000 | | 5,266,750 |
| Baltimore Revenue, Water Projects, Refunding, Series B, 5.00%, 7/01/38 | | 5,000,000 | | 5,440,700 |
| Frederick County Educational Facilities Revenue, Mount St. Mary University, Refunding, | | | | |
| 5.625%, 9/01/38 | | 5,000,000 | | 4,675,950 |
| Frederick County GO, Public Improvements, Series A, 5.00%, 3/01/34 | | 8,580,000 | | 9,470,003 |
| Howard County Housing Commission Revenue, Verona Oakland Mills Project, 5.00%, | | | | |
| 10/01/28 | | 10,000,000 | | 10,314,400 |
| Maryland Environmental Service Revenue, Mid-Shore II Regional Landfill Project, Refunding, | | | | |
| 5.00%, 11/01/30 | | 3,935,000 | | 4,329,169 |
| Maryland State Community Development Administration Department of Housing and CDR, | | | | |
| Residential, | | | | |
| Series B, 4.75%, 9/01/39 | | 5,335,000 | | 5,404,888 |
| Series C, 5.375%, 9/01/39 | | 805,000 | | 826,429 |
| Maryland State Community Development Administration Local Government Infrastructure | | | | |
| Revenue, Subordinate Obligations, Refunding, Series B-1, 3.125%, 6/01/32 | | 3,415,000 | | 3,114,890 |
| Maryland State EDC Student Housing Revenue, | | | | |
| Morgan University Project, Refunding, 5.00%, 7/01/27 | | 4,750,000 | | 4,797,975 |
| Salisbury University Project, Refunding, 5.00%, 6/01/34 | | 1,050,000 | | 1,056,101 |
| Senior, Frostburg State University Project, Refunding, 5.00%, 10/01/33 | | 5,000,000 | | 4,938,350 |
| Senior, Morgan State University Project, Refunding, 5.00%, 7/01/34 | | 2,150,000 | | 2,044,499 |
| Senior, Towson University Project, 5.00%, 7/01/27 | | 1,145,000 | | 1,191,567 |
| University of Maryland Baltimore County Project, Refunding, XLCA Insured, 5.00%, | | | | |
| 7/01/30 | | 3,245,000 | | 3,142,718 |
| University of Maryland Baltimore County Project, Refunding, XLCA Insured, 5.00%, | | | | |
| 7/01/35 | | 3,675,000 | | 3,503,304 |
| |
| 124 | Annual Report | | | | |
| | | | |
| Franklin Tax-Free Trust | | | | |
| |
| Statement of Investments, February 28, 2014 (continued) | | | | |
| |
| |
| Franklin Maryland Tax-Free Income Fund | | Principal Amount | | Value |
| Municipal Bonds (continued) | | | | |
| Maryland (continued) | | | | |
| Maryland State EDC Student Housing Revenue, (continued) | | | | |
| University of Maryland College Park Projects, Refunding, Assured Guaranty, 5.00%, | | | | |
| 6/01/25 | $ | 2,500,000 | $ | 2,590,325 |
| University of Maryland College Park Projects, Refunding, Assured Guaranty, 5.00%, | | | | |
| 6/01/28 | | 2,000,000 | | 2,058,740 |
| University of Maryland College Park Projects, Refunding, Assured Guaranty, 5.00%, | | | | |
| 6/01/33 | | 9,370,000 | | 9,548,030 |
| University Village at Sheppard Pratt, 5.00%, 7/01/33 | | 1,500,000 | | 1,563,120 |
| University Village at Sheppard Pratt, 5.00%, 7/01/33 | | 2,495,000 | | 2,508,323 |
| Maryland State EDC, PCR, Potomac Electric Project, Refunding, 6.20%, 9/01/22 | | 10,000,000 | | 11,776,600 |
| Maryland State Health and Higher Educational Facilities Authority Revenue, | | | | |
| Anne Arundel Health System Issue, Series A, 6.75%, 7/01/29 | | 2,000,000 | | 2,353,360 |
| Anne Arundel Health System Issue, Series A, 6.75%, 7/01/39 | | 2,000,000 | | 2,337,340 |
| Carroll Hospital Center, 5.00%, 7/01/40 | | 6,790,000 | | 6,901,084 |
| Edenwald Issue, Series A, 5.40%, 1/01/31 | | 1,000,000 | | 1,007,720 |
| Goucher College, Refunding, Series A, 5.00%, 7/01/34 | | 1,500,000 | | 1,593,210 |
| Helix Health Issue, AMBAC Insured, ETM, 5.00%, 7/01/27 | | 11,000,000 | | 12,956,460 |
| Johns Hopkins Medical Institutions Utilities Program Issue, Series A, 5.00%, 5/15/37 | | 9,395,000 | | 9,467,999 |
| The Johns Hopkins University Issue, Series A, 5.00%, 7/01/31 | | 7,060,000 | | 7,899,646 |
| The Johns Hopkins University Issue, Series A, 5.00%, 7/01/37 | | 5,000,000 | | 5,469,200 |
| The Johns Hopkins University Issue, Series A, 5.00%, 7/01/41 | | 15,000,000 | | 16,250,850 |
| The Johns Hopkins University Issue, Series A, Pre-Refunded, 5.00%, 7/01/38 | | 5,805,000 | | 5,895,268 |
| The Johns Hopkins University Issue, Series B, 5.00%, 7/01/38 | | 5,000,000 | | 5,467,050 |
| LifeBridge Health Issue, Refunding, Assured Guaranty, 5.00%, 7/01/34 | | 10,945,000 | | 11,199,581 |
| LifeBridge Health Issue, Refunding, Assured Guaranty, 4.75%, 7/01/38 | | 10,000,000 | | 10,045,100 |
| LifeBridge Health Issue, Series A, Pre-Refunded, 5.125%, 7/01/34 | | 2,500,000 | | 2,539,475 |
| Loyola College, Series A, 5.00%, 10/01/40 | | 10,050,000 | | 10,131,204 |
| Loyola University Maryland, Refunding, Series A, 5.00%, 10/01/39 | | 5,275,000 | | 5,548,825 |
| Maryland Institute College of Art, 5.00%, 6/01/35 | | 2,000,000 | | 2,008,660 |
| Maryland Institute College of Art, 5.00%, 6/01/36 | | 6,900,000 | | 6,932,223 |
| Maryland Institute College of Art, 5.00%, 6/01/40 | | 10,000,000 | | 10,028,600 |
| Maryland Institute College of Art, Refunding, 5.00%, 6/01/29 | | 1,000,000 | | 1,023,660 |
| Medstar Health, Series A, 5.00%, 8/15/38 | | 5,000,000 | | 5,117,050 |
| Mercy Medical Center, Series A, 5.00%, 7/01/37 | | 10,000,000 | | 9,999,300 |
| Parking, The Johns Hopkins Medical Institutions Parking Facilities Issue, AMBAC Insured, | | | | |
| 5.00%, 7/01/27 | | 655,000 | | 655,301 |
| Parking, The Johns Hopkins Medical Institutions Parking Facilities Issue, AMBAC Insured, | | | | |
| 5.00%, 7/01/34 | | 5,000,000 | | 5,001,550 |
| Parking, Johns Hopkins Medical Institutions, Refunding, Series B, AMBAC Insured, 5.00%, | | | | |
| 7/01/38 | | 6,200,000 | | 6,202,542 |
| Peninsula Regional Medical Center Issue, 5.00%, 7/01/36 | | 6,625,000 | | 6,709,999 |
| Union Hospital Cecil County Issue, 5.00%, 7/01/35 | | 3,015,000 | | 3,034,326 |
| University of Maryland Medical System, Refunding, AMBAC Insured, 5.25%, 7/01/28 | | 15,000,000 | | 16,187,400 |
| University of Maryland Medical System, Series A, 5.00%, 7/01/41 | | 2,500,000 | | 2,520,525 |
| Washington County Hospital Issue, 5.75%, 1/01/38 | | 2,500,000 | | 2,526,200 |
| Western Maryland Health, Refunding, Series A, NATL Insured, 4.75%, 7/01/36 | | 17,120,000 | | 17,130,101 |
| Maryland State Transportation Authority Lease Revenue, Metrorail Parking Project, | | | | |
| AMBAC Insured, 5.00%, 7/01/28 | | 3,975,000 | | 3,996,823 |
Annual Report | 125
| | | | | |
| | Franklin Tax-Free Trust | | | | |
| |
| | Statement of Investments, February 28, 2014 (continued) | | | | |
| |
| |
| | Franklin Maryland Tax-Free Income Fund | | Principal Amount | | Value |
| | Municipal Bonds (continued) | | | | |
| | Maryland (continued) | | | | |
| | Maryland State Transportation Authority Transportation Facilities Projects Revenue, | | | | |
| | AGMC Insured, | | | | |
| | 5.00%, 7/01/31 | $ | 7,455,000 | $ | 7,538,347 |
| | 5.00%, 7/01/32 | | 7,165,000 | | 7,243,672 |
| | 5.00%, 7/01/34 | | 7,500,000 | | 7,581,375 |
| Pre -Refunded, 5.00%, 7/01/27 | | 5,890,000 | | 5,981,589 |
| | Montgomery County GO, Consolidated Public Improvement, Refunding, Series A, 4.00%, | | | | |
| | 11/01/20 | | 8,000,000 | | 8,997,200 |
| | Montgomery County Revenue, Department of Liquor Control, | | | | |
| | Refunding, Series A, 5.00%, 4/01/27 | | 1,625,000 | | 1,815,320 |
| | Refunding, Series A, 5.00%, 4/01/28 | | 2,230,000 | | 2,476,237 |
| | Refunding, Series A, 5.00%, 4/01/31 | | 2,470,000 | | 2,688,965 |
| | Series A, 5.00%, 4/01/30 | | 1,935,000 | | 2,116,658 |
| | Montgomery County Water Quality Protection Charge Revenue, Series A, 5.00%, | | | | |
| | 4/01/30 | | 1,855,000 | | 2,040,055 |
| | 4/01/31 | | 1,240,000 | | 1,356,535 |
| | Morgan State University Academic and Auxiliary Facilities Fees Revenue, Refunding, 5.00%, | | | | |
| | 7/01/25 | | 1,190,000 | | 1,359,373 |
| | 7/01/26 | | 355,000 | | 402,180 |
| | 7/01/27 | | 750,000 | | 842,093 |
| | 7/01/29 | | 630,000 | | 697,687 |
| | 7/01/31 | | 455,000 | | 497,697 |
| | Prince George’s County COP, Public Safety Communications, 5.00%, 10/01/30 | | 3,160,000 | | 3,471,070 |
| | Prince George’s County GO, Consolidated Public Improvement, Series A, 5.00%, 9/15/28 | | 3,725,000 | | 4,291,386 |
| | Prince George’s County IDA Lease Revenue, Upper Marlboro Justice, Series B, NATL Insured, | | | | |
| | 4.75%, 6/30/30 | | 4,000,000 | | 4,003,880 |
| | | | | | 476,568,722 |
| | District of Columbia 0.5% | | | | |
| | Washington Metropolitan Area Transit Authority Gross Revenue, Transit, Series A, 5.125%, | | | | |
| | 7/01/32 | | 2,500,000 | | 2,715,825 |
| | U.S. Territories 9.6% | | | | |
| | Puerto Rico 9.1% | | | | |
| | Puerto Rico Commonwealth Aqueduct and Sewer Authority Revenue, senior lien, Series A, | | | | |
| | 6.00%, 7/01/38 | | 2,100,000 | | 1,589,511 |
| | Puerto Rico Commonwealth GO, Public Improvement, Refunding, AGMC Insured, 5.125%, | | | | |
| | 7/01/30 | | 1,935,000 | | 1,754,368 |
| | Puerto Rico Electric Power Authority Power Revenue, | | | | |
| | Series WW, 5.50%, 7/01/38 | | 5,000,000 | | 3,399,100 |
| | Series XX, 5.25%, 7/01/40 | | 5,000,000 | | 3,327,550 |
| | Puerto Rico HFAR, Capital Fund Modernization Program, Puerto Rico Public Housing Projects, | | | | |
| | Refunding, 5.125%, 12/01/27 | | 4,250,000 | | 4,257,650 |
| | Puerto Rico PBA Guaranteed Revenue, Government Facilities, Refunding, | | | | |
| | Series K, AGMC Insured, 5.25%, 7/01/27 | | 5,300,000 | | 4,912,835 |
| | Series Q, 5.625%, 7/01/39 | | 5,000,000 | | 3,878,200 |
126 | Annual Report
| | | | |
| Franklin Tax-Free Trust | | | | |
| |
| Statement of Investments, February 28, 2014 (continued) | | | | |
| |
| |
| Franklin Maryland Tax-Free Income Fund | | Principal Amount | | Value |
| Municipal Bonds (continued) | | | | |
| U.S. Territories (continued) | | | | |
| Puerto Rico (continued) | | | | |
| Puerto Rico Sales Tax FICO Sales Tax Revenue, first subordinate, | | | | |
| Series A, 5.75%, 8/01/37 | $ | 11,425,000 | $ | 9,287,611 |
| Series A, 6.00%, 8/01/42 | | 18,160,000 | | 14,975,099 |
| Series C, 5.25%, 8/01/41 | | 1,300,000 | | 979,797 |
| University of Puerto Rico Revenue, University System, Refunding, Series P, 5.00%, 6/01/30 | | 3,750,000 | | 2,158,050 |
| | | | | 50,519,771 |
| U.S. Virgin Islands 0.5% | | | | |
| Virgin Islands PFAR, | | | | |
| Gross Receipts Taxes Loan Note, Refunding, Series A, AGMC Insured, 5.00%, 10/01/22 | | 2,000,000 | | 2,019,400 |
| senior lien, Capital Projects, Series A-1, 5.00%, 10/01/29 | | 1,000,000 | | 1,019,920 |
| | | | | 3,039,320 |
| Total U.S. Territories | | | | 53,559,091 |
| Total Municipal Bonds before Short Term Investments (Cost $533,579,423) | | | | 532,843,638 |
| Short Term Investments (Cost $10,430,000) 1.9% | | | | |
| Municipal Bonds 1.9% | | | | |
| Maryland 1.9% | | | | |
| aMontgomery County GO, Consolidated Public Improvement, BAN, Refunding, Series A, | | | | |
| Daily VRDN and Put, 0.03%, 6/01/26 | | 10,430,000 | | 10,430,000 |
| Total Investments (Cost $544,009,423) 97.4% | | | | 543,273,638 |
| Other Assets, less Liabilities 2.6% | | | | 14,322,091 |
| Net Assets 100.0% | | | $ | 557,595,729 |
See Abbreviations on page 182.
aVariable rate demand notes (VRDNs) are tax-exempt obligations which contain a floating or variable interest rate adjustment formula and an unconditional right of demand to
receive payment of the principal balance plus accrued interest at specified dates. The coupon rate shown represents the rate at period end.
Annual Report | The accompanying notes are an integral part of these financial statements. | 127
| | | | | | | | | | | | | | | |
| Franklin Tax-Free Trust | | | | | | | | | | | | | | | |
| Financial Highlights | | | | | | | | | | | | | | | |
| |
| Franklin Missouri Tax-Free Income Fund | | | | | | | | | | | | | | | |
| | | | | | Year Ended February 28, | | | | |
| Class A | | 2014 | | | 2013 | | | 2012 | a | | 2011 | | | 2010 | |
| Per share operating performance | | | | | | | | | | | | | | | |
| (for a share outstanding throughout the year) | | | | | | | | | | | | | | | |
| Net asset value, beginning of year | $ | 12.77 | | $ | 12.61 | | $ | 11.55 | | $ | 11.98 | | $ | 11.28 | |
| Income from investment operationsb: | | | | | | | | | | | | | | | |
| Net investment incomec | | 0.46 | | | 0.46 | | | 0.50 | | | 0.50 | | | 0.51 | |
| et realized and unrealized gains (losses) | | (0.90 | ) | | 0.16 | | | 1.07 | | | (0.42 | ) | | 0.70 | |
| Total from investment operations | | (0.44 | ) | | 0.62 | | | 1.57 | | | 0.08 | | | 1.21 | |
| Less distributions from net investment income | | (0.45 | ) | | (0.46 | ) | | (0.51 | ) | | (0.51 | ) | | (0.51 | ) |
| Net asset value, end of year | $ | 11.88 | | $ | 12.77 | | $ | 12.61 | | $ | 11.55 | | $ | 11.98 | |
| |
| Total returnd | | (3.44 | )% | | 4.96 | % | | 13.87 | % | | 0.58 | % | | 10.93 | % |
| |
| Ratios to average net assets | | | | | | | | | | | | | | | |
| Expenses | | 0.62 | % | | 0.63 | % | | 0.64 | % | | 0.64 | % | | 0.65 | % |
| Net investment income | | 3.80 | % | | 3.61 | % | | 4.15 | % | | 4.18 | % | | 4.37 | % |
| |
| Supplemental data | | | | | | | | | | | | | | | |
| Net assets, end of year (000’s) | $ | 889,702 | | $ | 1,163,080 | | $ | 1,027,452 | | $ | 884,732 | | $ | 863,925 | |
| Portfolio turnover rate | | 10.57 | % | | 8.63 | % | | 13.08 | % | | 9.18 | % | | 5.87 | % |
aFor the year ended February 29.
bThe amount shown for a share outstanding throughout the period may not correlate with the Statement of Operations for the period due to the timing of sales and repurchases of
the Fund shares in relation to income earned and/or fluctuating market value of the investments of the Fund.
cBased on average daily shares outstanding.
dTotal return does not reflect sales commissions or contingent deferred sales charges, if applicable.
128 | The accompanying notes are an integral part of these financial statements. | Annual Report
| | | | | | | | | | | | | | | |
| Franklin Tax-Free Trust | | | | | | | | | | | | | | | |
| Financial Highlights (continued) | | | | | | | | | | | | | | | |
| |
| Franklin Missouri Tax-Free Income Fund | | | | | | | | | | | | | | | |
| | | | | | Year Ended February 28, | | | | |
| Class C | | 2014 | | | 2013 | | | 2012 | a | | 2011 | | | 2010 | |
| Per share operating performance | | | | | | | | | | | | | | | |
| (for a share outstanding throughout the year) | | | | | | | | | | | | | | | |
| Net asset value, beginning of year | $ | 12.88 | | $ | 12.71 | | $ | 11.64 | | $ | 12.07 | | $ | 11.35 | |
| Income from investment operationsb: | | | | | | | | | | | | | | | |
| Net investment incomec | | 0.39 | | | 0.39 | | | 0.44 | | | 0.44 | | | 0.45 | |
| Net realized and unrealized gains (losses) | | (0.91 | ) | | 0.16 | | | 1.07 | | | (0.43 | ) | | 0.72 | |
| Total from investment operations | | (0.52 | ) | | 0.55 | | | 1.51 | | | 0.01 | | | 1.17 | |
| Less distributions from net investment income | | (0.38 | ) | | (0.38 | ) | | (0.44 | ) | | (0.44 | ) | | (0.45 | ) |
| Net asset value, end of year | $ | 11.98 | | $ | 12.88 | | $ | 12.71 | | $ | 11.64 | | $ | 12.07 | |
| |
| Total returnd | | (4.02 | )% | | 4.42 | % | | 13.24 | % | | 0.01 | % | | 10.44 | % |
| |
| Ratios to average net assets | | | | | | | | | | | | | | | |
| Expenses | | 1.17 | % | | 1.18 | % | | 1.19 | % | | 1.19 | % | | 1.20 | % |
| Net investment income | | 3.25 | % | | 3.06 | % | | 3.60 | % | | 3.63 | % | | 3.82 | % |
| |
| Supplemental data | | | | | | | | | | | | | | | |
| Net assets, end of year (000’s) | $ | 166,226 | | $ | 220,405 | | $ | 174,437 | | $ | 134,026 | | $ | 120,256 | |
| Portfolio turnover rate | | 10.57 | % | | 8.63 | % | | 13.08 | % | | 9.18 | % | | 5.87 | % |
aFor the year ended February 29.
bThe amount shown for a share outstanding throughout the period may not correlate with the Statement of Operations for the period due to the timing of sales and repurchases of
the Fund shares in relation to income earned and/or fluctuating market value of the investments of the Fund.
cBased on average daily shares outstanding.
dTotal return does not reflect sales commissions or contingent deferred sales charges, if applicable.
Annual Report | The accompanying notes are an integral part of these financial statements. | 129
| | | | | | | | | | | | | | | |
| Franklin Tax-Free Trust | | | | | | | | | | | | | | | |
| Financial Highlights (continued) | | | | | | | | | | | | | | | |
| |
| Franklin Missouri Tax-Free Income Fund | | | | | | | | | | | | | | | |
| | | | | | Year Ended February 28, | | | | |
| Advisor Class | | 2014 | | | 2013 | | | 2012 | a | | 2011 | | | 2010 | b |
| Per share operating performance | | | | | | | | | | | | | | | |
| (for a share outstanding throughout the year) | | | | | | | | | | | | | | | |
| Net asset value, beginning of year | $ | 12.78 | | $ | 12.62 | | $ | 11.55 | | $ | 11.98 | | $ | 11.48 | |
| Income from investment operationsc: | | | | | | | | | | | | | | | |
| Net investment incomed | | 0.47 | | | 0.47 | | | 0.51 | | | 0.51 | | | 0.35 | |
| Net realized and unrealized gains (losses) | | (0.91 | ) | | 0.16 | | | 1.08 | | | (0.42 | ) | | 0.49 | |
| Total from investment operations | | (0.44 | ) | | 0.63 | | | 1.59 | | | 0.09 | | | 0.84 | |
| Less distributions from net investment income | | (0.46 | ) | | (0.47 | ) | | (0.52 | ) | | (0.52 | ) | | (0.34 | ) |
| Net asset value, end of year | $ | 11.88 | | $ | 12.78 | | $ | 12.62 | | $ | 11.55 | | $ | 11.98 | |
| |
| Total returne | | (3.43 | )% | | 5.06 | % | | 14.07 | % | | 0.68 | % | | 7.37 | % |
| |
| Ratios to average net assetsf | | | | | | | | | | | | | | | |
| Expenses | | 0.52 | % | | 0.53 | % | | 0.54 | % | | 0.54 | % | | 0.55 | % |
| Net investment income | | 3.90 | % | | 3.71 | % | | 4.25 | % | | 4.28 | % | | 4.47 | % |
| |
| Supplemental data | | | | | | | | | | | | | | | |
| Net assets, end of year (000’s) | $ | 42,840 | | $ | 89,360 | | $ | 67,401 | | $ | 37,557 | | $ | 12,860 | |
| Portfolio turnover rate | | 10.57 | % | | 8.63 | % | | 13.08 | % | | 9.18 | % | | 5.87 | % |
aFor the year ended February 29.
bFor the period July 1, 2009 (effective date) to February 28, 2010.
cThe amount shown for a share outstanding throughout the period may not correlate with the Statement of Operations for the period due to the timing of sales and repurchases of
the Fund shares in relation to income earned and/or fluctuating market value of the investments of the Fund.
dBased on average daily shares outstanding.
eTotal return is not annualized for periods less than one year.
fRatios are annualized for periods less than one year.
130 | The accompanying notes are an integral part of these financial statements. | Annual Report
| | | | |
| Franklin Tax-Free Trust | | | | |
| |
| Statement of Investments, February 28, 2014 | | | | |
| |
| |
| Franklin Missouri Tax-Free Income Fund | | Principal Amount | | Value |
| Municipal Bonds 98.0% | | | | |
| Missouri 87.3% | | | | |
| Bi-State Development Agency Missouri-Illinois Metropolitan District Mass Transit Sales Tax | | | | |
| Revenue, | | | | |
| Combined Lien, Refunding, Series A, 5.00%, 10/01/33 | $ | 14,425,000 | $ | 15,669,877 |
| Combined Lien, Refunding, Series A, 5.00%, 10/01/44 | | 10,000,000 | | 10,607,600 |
| Metrolink Cross County Extension Project, Assured Guaranty, 5.00%, 10/01/35 | | 5,500,000 | | 5,808,660 |
| Metrolink Cross County Extension Project, Assured Guaranty, 5.00%, 10/01/39 | | 30,300,000 | | 31,814,697 |
| Cape Girardeau County IDA Health Facilities Revenue, | | | | |
| Southeast Missouri Hospital Assn., 5.00%, 6/01/36 | | 7,500,000 | | 7,479,450 |
| St. Francis Medical Center, Refunding, Series A, 5.00%, 6/01/33 | | 5,000,000 | | 5,198,100 |
| St. Francis Medical Center, Refunding, Series A, 5.00%, 6/01/37 | | 11,000,000 | | 11,290,510 |
| St. Francis Medical Center, Series A, 5.75%, 6/01/39 | | 3,150,000 | | 3,397,212 |
| Cape Girardeau County IDA Solid Waste Disposal Revenue, Procter and Gamble Paper | | | | |
| Products, 5.30%, 5/15/28 | | 6,875,000 | | 6,877,200 |
| Carroll County Public Water Supply District No. 1 Water System Revenue, Refunding, | | | | |
| 5.625%, 3/01/34 | | 1,000,000 | | 1,057,470 |
| 6.00%, 3/01/39 | | 1,000,000 | | 1,058,700 |
| Columbia Special Obligation Electric Utility Improvement Revenue, Annual Appropriation | | | | |
| Obligation, Series A, Pre-Refunded, 5.75%, 10/01/33 | | 10,290,000 | | 12,180,170 |
| Curators of the University of Missouri System Facilities Revenue, | | | | |
| Refunding, 5.00%, 11/01/27 | | 1,065,000 | | 1,204,238 |
| Series A, 5.00%, 11/01/33 | | 5,000,000 | | 5,465,050 |
| Series A, 5.00%, 11/01/35 | | 20,000,000 | | 21,568,600 |
| System Facilities, Refunding, Series A, 5.00%, 11/01/25 | | 4,150,000 | | 4,401,324 |
| System Facilities, Refunding, Series A, 5.00%, 11/01/26 | | 2,635,000 | | 2,790,544 |
| Ferguson Reorganized School District No. R-2 GO, Missouri Direct Deposit Program, 5.00%, | | | | |
| 5/01/24 | | 1,265,000 | | 1,490,954 |
| Hannibal IDA Health Facilities Revenue, Refunding, 5.00%, 3/01/22 | | 1,000,000 | | 1,020,080 |
| Independence School District GO, Missouri Direct Deposit Program, Series A, 5.00%, | | | | |
| 3/01/27 | | 3,300,000 | | 3,642,210 |
| 3/01/28 | | 3,000,000 | | 3,293,880 |
| 3/01/29 | | 3,000,000 | | 3,273,390 |
| Jackson County Reorganized School District No. 4 Blue Springs GO, Refunding and | | | | |
| Improvement, Series A, 5.00%, 3/01/29 | | 4,000,000 | | 4,368,120 |
| Jackson County Special Obligation Revenue, Harry S. Truman Sports Complex Project, | | | | |
| AMBAC Insured, 5.00%, | | | | |
| 12/01/28 | | 2,400,000 | | 2,571,624 |
| 12/01/29 | | 26,925,000 | | 28,776,363 |
| Jefferson County Consolidated School District No. 006 Lease Participation COP, | | | | |
| AGMC Insured, Pre-Refunded, 5.00%, 3/01/25 | | 1,050,000 | | 1,099,770 |
| Joplin IDA Health Facilities Revenue, Freeman Health System Project, | | | | |
| 5.125%, 2/15/26 | | 6,000,000 | | 6,398,100 |
| 5.00%, 2/15/28 | | 1,150,000 | | 1,213,400 |
| 5.50%, 2/15/29 | | 2,000,000 | | 2,062,620 |
| 5.50%, 2/15/31 | | 2,055,000 | | 2,183,890 |
| 5.75%, 2/15/35 | | 2,500,000 | | 2,571,975 |
| Joplin Schools GO, Schools Building, Direct Deposit Program, 5.00%, | | | | |
| 3/01/32 | | 1,250,000 | | 1,384,388 |
| 3/01/33 | | 2,175,000 | | 2,396,524 |
Annual Report | 131
| | | | |
| Franklin Tax-Free Trust | | | | |
| |
| Statement of Investments, February 28, 2014 (continued) | | | | |
| |
| |
| Franklin Missouri Tax-Free Income Fund | | Principal Amount | | Value |
| Municipal Bonds (continued) | | | | |
| Missouri (continued) | | | | |
| Kansas City IDAR, | | | | |
| Downtown Redevelopment District, Refunding, Series A, 5.50%, 9/01/29 | $ | 5,000,000 | $ | 5,491,400 |
| Downtown Redevelopment District, Refunding, Series A, 5.50%, 9/01/30 | | 12,000,000 | | 13,073,880 |
| Downtown Redevelopment District, Refunding, Series A, 5.00%, 9/01/32 | | 3,000,000 | | 3,111,840 |
| Kansas City Missouri IDA, AMBAC Insured, 5.00%, 12/01/24 | | 4,470,000 | | 4,824,829 |
| Kansas City Missouri IDA, AMBAC Insured, 4.50%, 12/01/32 | | 5,690,000 | | 5,756,004 |
| Kansas City Missouri IDA, AMBAC Insured, 5.00%, 12/01/32 | | 15,000,000 | | 15,488,850 |
| Kansas City Sanitary Sewer System Revenue, | | | | |
| Improvement and Refunding, Series A, 5.00%, 1/01/37 | | 29,210,000 | | 31,406,592 |
| Series A, 5.25%, 1/01/34 | | 9,500,000 | | 10,314,720 |
| Kansas City Special Obligation Revenue, | | | | |
| Downtown Arena Project, Refunding and Improvement, Series C, 5.125%, 4/01/38 | | 10,000,000 | | 10,852,600 |
| East Village Project, Series B, Assured Guaranty, 5.00%, 4/15/31 | | 6,445,000 | | 6,901,177 |
| Kansas City Water Revenue, Refunding and Improvement, Series A, 5.25%, 12/01/32 | | 12,725,000 | | 14,164,834 |
| Lincoln University Auxiliary System Sub. Revenue, Assured Guaranty, 5.125%, 6/01/37 | | 2,325,000 | | 2,382,265 |
| Metropolitan St. Louis Sewer District Wastewater System Revenue, | | | | |
| Series A, 5.75%, 5/01/38 | | 2,000,000 | | 2,193,420 |
| Series A, NATL Insured, Pre-Refunded, 5.00%, 5/01/34 | | 20,000,000 | | 20,150,800 |
| Series C, NATL Insured, 5.00%, 5/01/36 | | 22,740,000 | | 23,646,189 |
| Missouri Development Finance Board Cultural Facilities Revenue, Series B, 5.00%, | | | | |
| 6/01/37 | | 28,435,000 | | 29,604,816 |
| Missouri Joint Municipal Electric Utility Commission Power Project Revenue, | | | | |
| Iatan 2 Project, Series A, 6.00%, 1/01/39 | | 15,750,000 | | 16,748,707 |
| Plum Point Project, NATL Insured, 5.00%, 1/01/28 | | 5,235,000 | | 5,396,500 |
| Plum Point Project, NATL Insured, 5.00%, 1/01/34 | | 34,945,000 | | 35,220,716 |
| Prairie State Project, Series A, AMBAC Insured, 5.00%, 1/01/42 | | 34,410,000 | | 34,795,392 |
| Missouri Joint Municipal Electric Utility Commission Power Supply System Revenue, | | | | |
| MoPEP Facilities, 5.00%, | | | | |
| 1/01/32 | | 3,600,000 | | 3,751,740 |
| 1/01/37 | | 3,400,000 | | 3,490,678 |
| Missouri Southern State College Revenue, Auxiliary Enterprise System, NATL Insured, 5.50%, | | | | |
| 4/01/23 | | 1,200,000 | | 1,202,160 |
| Missouri State Board of Public Buildings Special Obligation Revenue, Refunding, Series A, | | | | |
| 4.00%, 10/01/25 | | 3,870,000 | | 4,116,209 |
| Missouri State Development Finance Board Infrastructure Facilities Leasehold Revenue, | | | | |
| Electric Systems Project, Refunding and Improvement, Series F, 4.00%, 6/01/37 | | 3,000,000 | | 2,777,550 |
| Missouri State Development Finance Board Revenue, | | | | |
| Annual Appropriation Sewer System, Series B, 5.00%, 11/01/41 | | 7,000,000 | | 7,115,290 |
| Independence Missouri Electric System, Dodwood Project, Series A, 5.00%, 6/01/37 | | 5,000,000 | | 5,101,150 |
| Missouri State Development Finance Board Solid Waste Disposal Revenue, Procter and | | | | |
| Gamble Paper Product, 5.20%, 3/15/29 | | 3,000,000 | | 3,367,470 |
| Missouri State Environmental Improvement and Energy Resources Authority Water PCR, State | | | | |
| Revolving Fund Program, | | | | |
| Series A, 6.55%, 7/01/14 | | 10,000 | | 10,045 |
| Series A, 5.75%, 1/01/16 | | 30,000 | | 30,108 |
| Series B, 5.80%, 1/01/15 | | 15,000 | | 15,060 |
| Series B, 7.20%, 7/01/16 | | 70,000 | | 70,305 |
| Series B, AGMC Insured, 6.05%, 7/01/16 | | 220,000 | | 220,792 |
132 | Annual Report
| | | | |
| Franklin Tax-Free Trust | | | | |
| |
| Statement of Investments, February 28, 2014 (continued) | | | | |
| |
| |
| Franklin Missouri Tax-Free Income Fund | | Principal Amount | | Value |
| Municipal Bonds (continued) | | | | |
| Missouri (continued) | | | | |
| Missouri State Environmental Improvement and Energy Resources Authority Water Pollution | | | | |
| Control and Drinking Water Revenue, State Revolving Funds Programs, | | | | |
| Refunding, Series A, 5.00%, 1/01/23 | $ | 12,500,000 | $ | 14,446,875 |
| Refunding, Series A, 5.00%, 1/01/24 | | 7,890,000 | | 9,076,893 |
| Refunding, Series A, 5.00%, 1/01/26 | | 2,315,000 | | 2,728,158 |
| Refunding, Series B, 5.50%, 7/01/21 | | 60,000 | | 60,162 |
| Series A, 5.75%, 1/01/29 | | 2,500,000 | | 2,841,275 |
| Missouri State Health and Educational Facilities Authority Educational Facilities Revenue, | | | | |
| A.T. Still University Health Sciences, 5.00%, 10/01/26 | | 3,095,000 | | 3,364,915 |
| A.T. Still University Health Sciences, 5.25%, 10/01/31 | | 1,200,000 | | 1,266,624 |
| A.T. Still University Health Sciences, 5.25%, 10/01/41 | | 4,500,000 | | 4,696,785 |
| University of Central Missouri, Series C, 5.00%, 10/01/34 | | 5,000,000 | | 5,328,700 |
| The Washington University, Series A, 5.375%, 3/15/39 | | 16,825,000 | | 18,276,997 |
| The Washington University, Series B, 5.00%, 11/15/37 | | 10,000,000 | | 10,982,400 |
| Webster University Project, Refunding and Improvement, 5.00%, 4/01/36 | | 7,000,000 | | 7,304,570 |
| Missouri State Health and Educational Facilities Authority Health Facilities Revenue, | | | | |
| CoxHealth, 5.50%, 11/15/39 | | 14,325,000 | | 15,324,025 |
| CoxHealth, Series A, 5.00%, 11/15/38 | | 11,680,000 | | 12,078,288 |
| CoxHealth, Series A, 5.00%, 11/15/44 | | 2,760,000 | | 2,806,478 |
| Improvement, Jefferson Memorial Hospital, Radian Insured, Pre-Refunded, 5.25%, | | | | |
| 8/15/28 | | 4,900,000 | | 5,009,417 |
| Lake Regional Health System, Refunding, 5.00%, 2/15/24 | | 4,000,000 | | 4,253,160 |
| Lake Regional Health System, Refunding, 5.00%, 2/15/34 | | 7,000,000 | | 7,105,210 |
| SSM Health Care, Series B, 5.00%, 6/01/30 | | 16,150,000 | | 17,151,946 |
| SSM Health Care, Series B, 5.00%, 6/01/34 | | 7,000,000 | | 7,288,540 |
| St. Luke’s Episcopal, 5.00%, 12/01/34 | | 7,500,000 | | 7,606,650 |
| St. Luke’s Health System, Series A, AGMC Insured, 5.50%, 11/15/35 | | 10,000,000 | | 10,653,200 |
| St. Luke’s Health System, Series B, AGMC Insured, 5.50%, 11/15/35 | | 6,725,000 | | 7,164,277 |
| Missouri State Health and Educational Facilities Authority Revenue, | | | | |
| Health Facilities, Children’s Mercy Hospital, 5.625%, 5/15/39 | | 9,500,000 | | 9,998,465 |
| Senior Living Facilities, Lutheran Senior Services Projects, 5.75%, 2/01/31 | | 1,900,000 | | 1,991,295 |
| Senior Living Facilities, Lutheran Senior Services Projects, 5.375%, 2/01/35 | | 2,520,000 | | 2,552,256 |
| Senior Living Facilities, Lutheran Senior Services Projects, 6.00%, 2/01/41 | | 4,250,000 | | 4,472,573 |
| Senior Living Facilities, Lutheran Senior Services Projects, 5.50%, 2/01/42 | | 8,985,000 | | 9,101,895 |
| Senior Living Facilities, Lutheran Senior Services Projects, Series A, 5.00%, 2/01/25 | | 1,500,000 | | 1,509,960 |
| Senior Living Facilities, Lutheran Senior Services Projects, Series A, 5.375%, 2/01/35 | | 4,655,000 | | 4,665,148 |
| Senior Living Facilities, Lutheran Senior Services, Refunding, Series B, 5.125%, | | | | |
| 2/01/22 | | 3,400,000 | | 3,485,714 |
| Senior Living Facilities, Lutheran Senior Services, Refunding, Series B, 5.125%, | | | | |
| 2/01/27 | | 2,700,000 | | 2,728,890 |
| Missouri State Highways and Transit Commission State Road Revenue, | | | | |
| 5.00%, 5/01/20 | | 6,875,000 | | 8,113,050 |
| 5.00%, 5/01/21 | | 5,000,000 | | 5,878,600 |
| first lien, Series B, 5.00%, 5/01/24 | | 6,005,000 | | 6,552,356 |
| Series A, 5.00%, 5/01/24 | | 1,150,000 | | 1,304,296 |
| Missouri State Housing Development Commission SFMR, Homeownership Loan Program, | | | | |
| Series A-1, GNMA Secured, 4.75%, 9/01/32 | | 495,000 | | 507,509 |
| Series C, GNMA Secured, 5.00%, 3/01/32 | | 775,000 | | 805,496 |
| Series D, GNMA Secured, 4.70%, 3/01/35 | | 2,485,000 | | 2,531,917 |
| |
| | | | | Annual Report | 133 |
| | | | | | |
| | Franklin Tax-Free Trust | | | | | |
| |
| | Statement of Investments, February 28, 2014 (continued) | | | | | |
| |
| |
| | Franklin Missouri Tax-Free Income Fund | | | Principal Amount | | Value |
| | Municipal Bonds (continued) | | | | | |
| | Missouri (continued) | | | | | |
| | Monarch-Chesterfield Levee District Revenue, NATL Insured, 5.75%, 3/01/19 | | $ | 1,055,000 | $ | 1,058,576 |
| | Pettis County School District 200 Sedalia Lease COP, Missouri State Assn. of Rural Education, | | | | | |
| | Assured Guaranty, 5.00%, 3/01/27 | | | 6,610,000 | | 6,989,084 |
| | Riverside-Quindaro Bend Levee District of Platte County Levee Improvement Revenue, | | | | | |
| L-385 Project, Refunding, Radian Insured, 5.00%, 3/01/27 | | | 5,000,000 | | 4,929,550 |
| | Sikeston Electric Revenue, Refunding, 5.00%, | | | | | |
| | 6/01/20 | | | 12,525,000 | | 13,879,954 |
| | 6/01/21 | | | 13,130,000 | | 14,645,727 |
| | 6/01/22 | | | 12,570,000 | | 14,051,877 |
| | Springfield Public Building Corp. Leasehold Revenue, | | | | | |
| | Capital Improvement Program, AMBAC Insured, 5.00%, 3/01/24 | | | 2,600,000 | | 2,607,592 |
| | Springfield Branson Airport, Series A, AMBAC Insured, 5.00%, 7/01/36 | | | 5,000,000 | | 5,161,100 |
| | Springfield Public Utility Revenue, NATL RE, FGIC Insured, 4.75%, 8/01/34 | | | 3,000,000 | | 3,082,920 |
| | Springfield School District No. R-12 GO, Missouri Direct Deposit Program, | | | | | |
| | 5.00%, 3/01/33 | | | 1,000,000 | | 1,112,380 |
| | AGMC Insured, 5.00%, 3/01/26 | | | 5,000,000 | | 5,407,350 |
| | Springfield Special Obligation Revenue, Sewer System Improvements Project, 5.00%, | | | | | |
| | 4/01/31 | | | 1,795,000 | | 1,953,893 |
| | 4/01/32 | | | 1,885,000 | | 2,040,927 |
| | St. Joseph IDA Special Obligation Revenue, Sewer System Improvements Project, 5.00%, | | | | | |
| | 4/01/27 | | | 2,655,000 | | 2,748,828 |
| | St. Louis Airport Revenue, Lambert-St. Louis International Airport, | | | | | |
| | Refunding, NATL Insured, 5.50%, 7/01/29 | | | 13,070,000 | | 14,397,912 |
| | Refunding, Series A, AGMC Insured, 5.00%, 7/01/23 | | | 14,615,000 | | 15,899,074 |
| | Refunding, Series B, AGMC Insured, 5.00%, 7/01/25 | | | 9,420,000 | | 9,840,980 |
| | Series A-1, 6.125%, 7/01/24 | | | 2,000,000 | | 2,280,940 |
| | Series A-1, 6.625%, 7/01/34 | | | 5,000,000 | | 5,697,750 |
| | St. Louis County IDA Senior Living Facilities Revenue, | | | | | |
| | Friendship Village Chesterfield, 5.00%, 9/01/42 | | | 3,165,000 | | 2,900,374 |
| | Friendship Village Sunset Hills, Series A, 5.875%, 9/01/43 | | | 7,000,000 | | 7,166,040 |
| | St. Louis Municipal Finance Corp. Leasehold Revenue, Convention Center Capital | | | | | |
| | Improvement, Series B, Assured Guaranty, 5.375%, 7/15/38 | | | 22,725,000 | | 24,094,408 |
| | St. Louis Municipal Finance Corp. Recreation Sales Tax Leasehold Revenue, AMBAC Insured, | | | | | |
| | 5.00%, | | | | | |
| | 2/15/32 | | | 8,075,000 | | 8,169,397 |
| | 2/15/37 | | | 7,775,000 | | 7,819,084 |
| | | | | | | 959,361,460 |
| | U.S. Territories 10.7% | | | | | |
| | Guam 0.5% | | | | | |
| | Guam Power Authority Revenue, Refunding, Series A, AGMC Insured, 5.00%, 10/01/25 | | | 5,420,000 | | 5,929,263 |
| |
| | Puerto Rico 10.2% | | | | | |
| | Puerto Rico Commonwealth GO, Public Improvement, | | | | | |
| | Refunding, Series A, 6.50%, 7/01/40 | | | 7,000,000 | | 5,804,890 |
| | Refunding, Series A, 5.75%, 7/01/41 | | | 5,000,000 | | 3,870,650 |
| | Series A, 6.00%, 7/01/38 | | | 6,250,000 | | 4,962,000 |
| | Puerto Rico Commonwealth Highways and Transportation Authority Highway Revenue, | | | | | |
| | Series Y, Pre-Refunded, 5.50%, 7/01/36 | | | 9,500,000 | | 10,654,060 |
134 | Annual Report
| | | | |
| Franklin Tax-Free Trust | | | | |
| |
| Statement of Investments, February 28, 2014 (continued) | | | | |
| |
| |
| Franklin Missouri Tax-Free Income Fund | | Principal Amount | | Value |
| Municipal Bonds (continued) | | | | |
| U.S. Territories (continued) | | | | |
| Puerto Rico (continued) | | | | |
| Puerto Rico Electric Power Authority Power Revenue, | | | | |
| Refunding, Series AAA, 5.25%, 7/01/28 | $ | 5,000,000 | $ | 3,478,400 |
| Series WW, 5.50%, 7/01/38 | | 19,320,000 | | 13,134,122 |
| Series XX, 5.75%, 7/01/36 | | 6,000,000 | | 4,209,960 |
| Series XX, 5.25%, 7/01/40 | | 22,750,000 | | 15,140,352 |
| Puerto Rico Industrial Tourist Educational Medical and Environmental Control Facilities | | | | |
| Financing Authority Industrial Revenue, Guaynabo Municipal Government Center Project, | | | | |
| 5.625%, 7/01/22 | | 2,500,000 | | 1,965,525 |
| Puerto Rico Sales Tax FICO Sales Tax Revenue, first subordinate, | | | | |
| Refunding, Series C, 5.375%, 8/01/36 | | 6,900,000 | | 5,476,875 |
| Series A, 5.50%, 8/01/37 | | 13,760,000 | | 10,832,010 |
| Series A, 5.50%, 8/01/42 | | 7,740,000 | | 6,079,925 |
| Series A, 6.50%, 8/01/44 | | 10,000,000 | | 8,607,600 |
| Series C, 5.50%, 8/01/40 | | 15,000,000 | | 11,930,400 |
| Series C, 5.25%, 8/01/41 | | 7,500,000 | | 5,652,675 |
| | | | | 111,799,444 |
| Total U.S. Territories | | | | 117,728,707 |
| Total Municipal Bonds (Cost $1,072,940,762) 98.0% | | | | 1,077,090,167 |
| Other Assets, less Liabilities 2.0% | | | | 21,677,642 |
| Net Assets 100.0% | | | $ | 1,098,767,809 |
| |
| |
| |
| See Abbreviations on page 182. | | | | |
Annual Report | The accompanying notes are an integral part of these financial statements. | 135
| | | | | | | | | | | | | | | |
| Franklin Tax-Free Trust | | | | | | | | | | | | | | | |
| Financial Highlights | | | | | | | | | | | | | | | |
| |
| Franklin North Carolina Tax-Free Income Fund | | | | | | | | | | | | | | | |
| | | | | | Year Ended February 28, | | | | |
| Class A | | 2014 | | | 2013 | | | 2012 | a | | 2011 | | | 2010 | |
| Per share operating performance | | | | | | | | | | | | | | | |
| (for a share outstanding throughout the year) | | | | | | | | | | | | | | | |
| Net asset value, beginning of year | $ | 12.96 | | $ | 12.79 | | $ | 11.73 | | $ | 12.15 | | $ | 11.37 | |
| Income from investment operationsb: | | | | | | | | | | | | | | | |
| Net investment incomec | | 0.46 | | | 0.45 | | | 0.49 | | | 0.49 | | | 0.51 | |
| Net realized and unrealized gains (losses) | | (1.03 | ) | | 0.17 | | | 1.07 | | | (0.41 | ) | | 0.77 | |
| Total from investment operations | | (0.57 | ) | | 0.62 | | | 1.56 | | | 0.08 | | | 1.28 | |
| Less distributions from net investment income | | (0.44 | ) | | (0.45 | ) | | (0.50 | ) | | (0.50 | ) | | (0.50 | ) |
| Net asset value, end of year | $ | 11.95 | | $ | 12.96 | | $ | 12.79 | | $ | 11.73 | | $ | 12.15 | |
| |
| Total returnd | | (4.35 | )% | | 4.92 | % | | 13.57 | % | | 0.63 | % | | 11.47 | % |
| |
| Ratios to average net assets | | | | | | | | | | | | | | | |
| Expenses | | 0.62 | % | | 0.62 | % | | 0.63 | % | | 0.63 | % | | 0.64 | % |
| Net investment income | | 3.79 | % | | 3.49 | % | | 4.04 | % | | 4.07 | % | | 4.25 | % |
| |
| Supplemental data | | | | | | | | | | | | | | | |
| Net assets, end of year (000’s) | $ | 851,504 | | $ | 1,168,492 | | $ | 1,045,806 | | $ | 925,162 | | $ | 924,905 | |
| Portfolio turnover rate | | 6.86 | % | | 7.10 | % | | 6.13 | % | | 9.56 | % | | 8.85 | % |
aFor the year ended February 29.
bThe amount shown for a share outstanding throughout the period may not correlate with the Statement of Operations for the period due to the timing of sales and repurchases of
the Fund shares in relation to income earned and/or fluctuating market value of the investments of the Fund.
cBased on average daily shares outstanding.
dTotal return does not reflect sales commissions or contingent deferred sales charges, if applicable.
136 | The accompanying notes are an integral part of these financial statements. | Annual Report
| | | | | | | | | | | | | | | |
| Franklin Tax-Free Trust | | | | | | | | | | | | | | | |
| Financial Highlights (continued) | | | | | | | | | | | | | | | |
| |
| Franklin North Carolina Tax-Free Income Fund | | | | | | | | | | | | | | | |
| | | | | | Year Ended February 28, | | | | |
| Class C | | 2014 | | | 2013 | | | 2012 | a | | 2011 | | | 2010 | |
| Per share operating performance | | | | | | | | | | | | | | | |
| (for a share outstanding throughout the year) | | | | | | | | | | | | | | | |
| Net asset value, beginning of year | $ | 13.13 | | $ | 12.95 | | $ | 11.88 | | $ | 12.30 | | $ | 11.49 | |
| Income from investment operationsb: | | | | | | | | | | | | | | | |
| Net investment incomec | | 0.40 | | | 0.38 | | | 0.43 | | | 0.43 | | | 0.44 | |
| Net realized and unrealized gains (losses) | | (1.03 | ) | | 0.18 | | | 1.07 | | | (0.42 | ) | | 0.81 | |
| Total from investment operations | | (0.63 | ) | | 0.56 | | | 1.50 | | | 0.01 | | | 1.25 | |
| Less distributions from net investment income | | (0.38 | ) | | (0.38 | ) | | (0.43 | ) | | (0.43 | ) | | (0.44 | ) |
| Net asset value, end of year | $ | 12.12 | | $ | 13.13 | | $ | 12.95 | | $ | 11.88 | | $ | 12.30 | |
| |
| Total returnd | | (4.82 | )% | | 4.35 | % | | 12.87 | % | | 0.06 | % | | 11.01 | % |
| |
| Ratios to average net assets | | | | | | | | | | | | | | | |
| Expenses | | 1.17 | % | | 1.17 | % | | 1.18 | % | | 1.18 | % | | 1.19 | % |
| Net investment income | | 3.24 | % | | 2.94 | % | | 3.49 | % | | 3.52 | % | | 3.70 | % |
| |
| Supplemental data | | | | | | | | | | | | | | | |
| Net assets, end of year (000’s) | $ | 229,369 | | $ | 335,092 | | $ | 280,136 | | $ | 237,607 | | $ | 224,584 | |
| Portfolio turnover rate | | 6.86 | % | | 7.10 | % | | 6.13 | % | | 9.56 | % | | 8.85 | % |
aFor the year ended February 29.
bThe amount shown for a share outstanding throughout the period may not correlate with the Statement of Operations for the period due to the timing of sales and repurchases of
the Fund shares in relation to income earned and/or fluctuating market value of the investments of the Fund.
cBased on average daily shares outstanding.
dTotal return does not reflect sales commissions or contingent deferred sales charges, if applicable.
Annual Report | The accompanying notes are an integral part of these financial statements. | 137
| | | | | | | | | | | | | | | |
| Franklin Tax-Free Trust | | | | | | | | | | | | | | | |
| Financial Highlights (continued) | | | | | | | | | | | | | | | |
| |
| Franklin North Carolina Tax-Free Income Fund | | | | | | | | | | | | | | | |
| | | | | | Year Ended February 28, | | | | |
| Advisor Class | | 2014 | | | 2013 | | | 2012 | a | | 2011 | | | 2010 | b |
| Per share operating performance | | | | | | | | | | | | | | | |
| (for a share outstanding throughout the year) | | | | | | | | | | | | | | | |
| Net asset value, beginning of year | $ | 12.96 | | $ | 12.78 | | $ | 11.73 | | $ | 12.15 | | $ | 11.64 | |
| Income from investment operationsc: | | | | | | | | | | | | | | | |
| Net investment incomed | | 0.47 | | | 0.46 | | | 0.51 | | | 0.50 | | | 0.35 | |
| Net realized and unrealized gains (losses) | | (1.02 | ) | | 0.18 | | | 1.05 | | | (0.41 | ) | | 0.50 | |
| Total from investment operations | | (0.55 | ) | | 0.64 | | | 1.56 | | | 0.09 | | | 0.85 | |
| Less distributions from net investment income | | (0.46 | ) | | (0.46 | ) | | (0.51 | ) | | (0.51 | ) | | (0.34 | ) |
| Net asset value, end of year | $ | 11.95 | | $ | 12.96 | | $ | 12.78 | | $ | 11.73 | | $ | 12.15 | |
| |
| Total returne | | (4.25 | )% | | 5.11 | % | | 13.59 | % | | 0.73 | % | | 7.33 | % |
| |
| Ratios to average net assetsf | | | | | | | | | | | | | | | |
| Expenses | | 0.52 | % | | 0.52 | % | | 0.53 | % | | 0.53 | % | | 0.54 | % |
| Net investment income | | 3.89 | % | | 3.59 | % | | 4.14 | % | | 4.17 | % | | 4.35 | % |
| |
| Supplemental data | | | | | | | | | | | | | | | |
| Net assets, end of year (000’s) | $ | 63,211 | | $ | 89,683 | | $ | 63,403 | | $ | 22,659 | | $ | 14,704 | |
| Portfolio turnover rate | | 6.86 | % | | 7.10 | % | | 6.13 | % | | 9.56 | % | | 8.85 | % |
aFor the year ended February 29.
bFor the period July 1, 2009 (effective date) to February 28 ,2010.
cThe amount shown for a share outstanding throughout the period may not correlate with the Statement of Operations for the period due to the timing of sales and repurchases of
the Fund shares in relation to income earned and/or fluctuating market value of the investments of the Fund.
dBased on average daily shares outstanding.
eTotal return is not annualized for periods less than one year.
fRatios are annualized for periods less than one year.
138 | The accompanying notes are an integral part of these financial statements. | Annual Report
| | | | |
| Franklin Tax-Free Trust | | | | |
| |
| Statement of Investments, February 28, 2014 | | | | |
| |
| |
| Franklin North Carolina Tax-Free Income Fund | | Principal Amount | | Value |
| Municipal Bonds 98.5% | | | | |
| North Carolina 87.9% | | | | |
| Asheville Water System Revenue, NATL Insured, 5.00%, 8/01/32 | $ | 2,110,000 | $ | 2,225,290 |
| Buncombe County COP, NATL Insured, 5.00%, 4/01/22 | | 1,000,000 | | 1,097,020 |
| Cape Fear Public Utility Authority Water and Sewer System Revenue, 5.00%, | | | | |
| 8/01/35 | | 21,000,000 | | 22,152,060 |
| 8/01/36 | | 8,000,000 | | 8,603,600 |
| Cary Combined Enterprise System Revenue, Refunding, 5.00%, | | | | |
| 12/01/33 | | 5,405,000 | | 5,762,703 |
| 12/01/42 | | 10,000,000 | | 10,970,400 |
| Charlotte Airport Revenue, | | | | |
| Charlotte Douglas International Airport, Refunding, Series A, 5.50%, 7/01/34 | | 3,765,000 | | 4,150,423 |
| Charlotte Douglas International Airport, Refunding, Series A, AMBAC Insured, 5.00%, | | | | |
| 7/01/32 | | 20,680,000 | | 22,024,820 |
| Charlotte Douglas International Airport, Refunding, Series A, AMBAC Insured, 5.00%, | | | | |
| 7/01/36 | | 13,085,000 | | 13,795,777 |
| Charlotte Douglas International Airport, Series A, 5.00%, 7/01/39 | | 3,000,000 | | 3,177,990 |
| Charlotte Douglas International Airport, Series A, 5.00%, 7/01/41 | | 10,000,000 | | 10,544,300 |
| Series A, NATL Insured, 5.00%, 7/01/29 | | 5,000,000 | | 5,060,800 |
| Series A, NATL Insured, 5.00%, 7/01/34 | | 10,000,000 | | 10,053,900 |
| Charlotte COP, | | | | |
| Cultural Arts Facilities, Refunding, Series E, 5.00%, 6/01/39 | | 6,000,000 | | 6,356,340 |
| Transit Projects, Phase II, Refunding, Series A, 5.00%, 6/01/33 | | 2,500,000 | | 2,630,300 |
| Transit Projects, Phase II, Series E, 5.00%, 6/01/35 | | 6,000,000 | | 6,018,840 |
| Charlotte Storm Water Fee Revenue, 5.00%, 6/01/35 | | 10,000,000 | | 10,348,200 |
| Charlotte Water and Sewer System Revenue, | | | | |
| 5.00%, 7/01/38 | | 6,775,000 | | 7,285,970 |
| Refunding, Series B, 5.00%, 7/01/38 | | 10,000,000 | | 10,802,400 |
| The Charlotte-Mecklenburg Hospital Authority Health Care Revenue, Carolinas HealthCare | | | | |
| System, | | | | |
| Refunding, Series A, 5.25%, 1/15/34 | | 4,000,000 | | 4,275,160 |
| Refunding, Series A, 5.00%, 1/15/39 | | 15,000,000 | | 15,283,650 |
| Series A, 5.125%, 1/15/37 | | 4,000,000 | | 4,208,640 |
| Series A, 5.25%, 1/15/42 | | 10,000,000 | | 10,504,200 |
| Series A, AGMC Insured, 5.00%, 1/15/23 | | 7,780,000 | | 8,364,978 |
| Chatham County COP, AMBAC Insured, 5.00%, 6/01/34 | | 5,000,000 | | 5,098,250 |
| Columbus County Industrial Facilities and PCFA Revenue, Recovery Zone Facility, | | | | |
| International Paper Co. Projects, Series A, 5.70%, 5/01/34 | | 2,500,000 | | 2,614,450 |
| Dare County COP, | | | | |
| AMBAC Insured, Pre-Refunded, 5.00%, 6/01/29 | | 5,295,000 | | 5,356,051 |
| NATL RE, FGIC Insured, Pre-Refunded, 5.00%, 6/01/23 | | 2,000,000 | | 2,118,200 |
| Dare County Utility System Revenue, 5.00%, 2/01/41 | | 5,000,000 | | 5,317,550 |
| Durham County COP, Series A, 5.00%, 6/01/31 | | 4,000,000 | | 4,385,000 |
| Durham Utility System Revenue, Refunding, 5.00%, 6/01/41 | | 4,000,000 | | 4,330,000 |
| Greenville Utilities Commission Combined Enterprise System Revenue, Refunding, Series A, | | | | |
| AGMC Insured, 5.00%, 11/01/33 | | 6,000,000 | | 6,431,220 |
| Harnett County COP, Assured Guaranty, 5.00%, | | | | |
| 6/01/28 | | 1,000,000 | | 1,081,620 |
| 6/01/29 | | 500,000 | | 537,820 |
Annual Report | 139
| | | | |
| Franklin Tax-Free Trust | | | | |
| |
| Statement of Investments, February 28, 2014 (continued) | | | | |
| |
| |
| Franklin North Carolina Tax-Free Income Fund | | Principal Amount | | Value |
| Municipal Bonds (continued) | | | | |
| North Carolina (continued) | | | | |
| High Point Combined Enterprise System Revenue, | | | | |
| AGMC Insured, 5.00%, 11/01/33 | $ | 5,000,000 | $ | 5,417,750 |
| NATL RE, FGIC Insured, Pre-Refunded, 5.00%, 11/01/31 | | 11,000,000 | | 11,347,930 |
| Iredell County COP, Iredell County Public Improvement Projects, AGMC Insured, | | | | |
| 5.125%, 6/01/27 | | 4,000,000 | | 4,397,680 |
| 5.00%, 6/01/28 | | 1,000,000 | | 1,087,320 |
| Johnston Memorial Hospital Authority Mortgage Revenue, Johnston Memorial Hospital | | | | |
| Project, AGMC Insured, 5.25%, 10/01/36 | | 6,855,000 | | 7,338,689 |
| Mecklenburg County COP, Series A, 5.00%, 2/01/28 | | 350,000 | | 383,709 |
| Monroe COP, Assured Guaranty, 5.50%, | | | | |
| 3/01/34 | | 2,425,000 | | 2,621,037 |
| 3/01/39 | | 1,085,000 | | 1,160,983 |
| Nash Health Care System Health Care Facilities Revenue, | | | | |
| 5.00%, 11/01/41 | | 5,000,000 | | 5,144,700 |
| AGMC Insured, 5.00%, 11/01/30 | | 2,250,000 | | 2,333,947 |
| New Hanover County Hospital Revenue, New Hanover Regional Medical Center Project, | | | | |
| Refunding, Series B, AGMC Insured, | | | | |
| 5.00%, 10/01/27 | | 3,500,000 | | 3,728,935 |
| 5.125%, 10/01/31 | | 8,385,000 | | 8,792,008 |
| North Carolina Capital Facilities Finance Agency Educational Facilities Revenue, Wake Forest | | | | |
| University, 5.00%, 1/01/38 | | 27,000,000 | | 28,707,480 |
| North Carolina Eastern Municipal Power Agency Power System Revenue, | | | | |
| Refunding, Series A, 6.50%, 1/01/18 | | 3,000,000 | | 3,558,780 |
| Refunding, Series A, 5.00%, 1/01/24 | | 10,000,000 | | 10,848,500 |
| Refunding, Series A, AMBAC Insured, 5.00%, 1/01/21 | | 11,555,000 | | 12,359,112 |
| Series C, 6.75%, 1/01/24 | | 3,500,000 | | 4,169,900 |
| North Carolina Medical Care Commission Health Care Facilities Revenue, | | | | |
| Appalachian Regional Healthcare System, Refunding, Series A, 6.50%, 7/01/31 | | 5,000,000 | | 5,640,800 |
| Appalachian Regional Healthcare System, Refunding, Series A, 6.625%, 7/01/34 | | 6,000,000 | | 6,779,400 |
| Blue Ridge HealthCare System Project, Refunding, NATL RE, FGIC Insured, Series A, | | | | |
| 5.00%, 1/01/33 | | 10,805,000 | | 10,826,718 |
| Duke University Health System, Series A, 5.00%, 6/01/42 | | 11,500,000 | | 12,099,035 |
| Duke University Health System, Series A, 5.00%, 6/01/42 | | 10,000,000 | | 10,542,400 |
| Duke University Health System, Series A, 5.00%, 6/01/42 | | 8,150,000 | | 8,513,164 |
| FirstHealth Carolinas Project, Series A, Pre-Refunded, 6.125%, 10/01/39 | | 11,315,000 | | 11,700,163 |
| FirstHealth Carolinas Project, Series C, 5.00%, 10/01/29 | | 5,000,000 | | 5,042,000 |
| Novant Health Obligated Group, NATL Insured, 5.00%, 11/01/39 | | 9,680,000 | | 9,806,518 |
| Novant Health Obligated Group, Refunding, Series A, 5.00%, 11/01/46 | | 20,000,000 | | 20,350,200 |
| Rex Healthcare, Refunding, Series A, 5.00%, 7/01/30 | | 5,000,000 | | 5,351,550 |
| Scotland Memorial Hospital Project, Radian Insured, 5.50%, 10/01/19 | | 435,000 | | 435,674 |
| Scotland Memorial Hospital Project, Radian Insured, 5.50%, 10/01/29 | | 1,220,000 | | 1,220,927 |
| University Health System, Refunding, Series D, 6.25%, 12/01/33 | | 10,000,000 | | 11,209,200 |
| Vidant Health, Refunding, Series A, 5.00%, 6/01/36 | | 5,000,000 | | 5,135,500 |
| WakeMed Project, Refunding, Series A, 5.00%, 10/01/38 | | 9,005,000 | | 9,309,099 |
| WakeMed Project, Series A, Assured Guaranty, Pre-Refunded, 5.625%, 10/01/29 | | 1,500,000 | | 1,546,770 |
| WakeMed Project, Series A, Assured Guaranty, Pre-Refunded, 5.625%, 10/01/38 | | 6,000,000 | | 6,187,080 |
| WakeMed Project, Series A, Assured Guaranty, Pre-Refunded, 5.875%, 10/01/38 | | 2,515,000 | | 2,597,014 |
140 | Annual Report
| | | | |
| Franklin Tax-Free Trust | | | | |
| |
| Statement of Investments, February 28, 2014 (continued) | | | | |
| |
| |
| Franklin North Carolina Tax-Free Income Fund | | Principal Amount | | Value |
| Municipal Bonds (continued) | | | | |
| North Carolina (continued) | | | | |
| North Carolina Medical Care Commission Health System Revenue, Mission Health | | | | |
| Combination Group, Refunding, AGMC Insured, 5.00%, 10/01/36 | $ | 5,000,000 | $ | 5,121,250 |
| North Carolina Medical Care Commission Revenue, Rowan Regional Medical Center Project, | | | | |
| AGMC Insured, Pre-Refunded, 5.00%, 9/01/33 | | 21,720,000 | | 22,232,375 |
| North Carolina Municipal Power Agency No. 1 Catawba Electric Revenue, Refunding, | | | | |
| Series A, 5.00%, 1/01/26 | | 2,500,000 | | 2,746,400 |
| Series A, 5.00%, 1/01/30 | | 4,670,000 | | 5,053,500 |
| Series B, 5.00%, 1/01/21 | | 5,000,000 | | 5,793,600 |
| North Carolina State Capital Facilities Finance Agency Revenue, | | | | |
| Davidson College, 5.00%, 3/01/40 | | 4,000,000 | | 4,282,520 |
| Duke University Project, Refunding, Series A, 5.00%, 10/01/41 | | 11,080,000 | | 11,274,011 |
| Duke University Project, Refunding, Series A, 5.00%, 10/01/44 | | 12,050,000 | | 12,463,556 |
| Duke University Project, Refunding, Series B, 5.00%, 10/01/38 | | 20,000,000 | | 21,191,800 |
| Duke University Project, Refunding, Series B, 4.75%, 7/01/42 | | 10,000,000 | | 10,218,100 |
| Duke University Project, Series A, 5.00%, 10/01/39 | | 2,615,000 | | 2,719,129 |
| Methodist University, 5.00%, 3/01/34 | | 2,000,000 | | 2,032,900 |
| North Carolina State Capital Improvement Limited Obligation Revenue, | | | | |
| Series A, 5.00%, 5/01/28 | | 5,000,000 | | 5,563,450 |
| Series C, 5.00%, 5/01/29 | | 10,000,000 | | 11,231,000 |
| North Carolina State GO, | | | | |
| Public Improvement, Series A, 5.00%, 5/01/23 | | 10,000,000 | | 11,991,900 |
| Public Improvement, Series A, 5.00%, 5/01/24 | | 10,000,000 | | 11,972,400 |
| Public Improvement, Series A, 4.50%, 3/01/26 | | 4,855,000 | | 5,167,613 |
| Refunding, Series B, 5.00%, 6/01/19 | | 5,000,000 | | 6,004,100 |
| North Carolina State Infrastructure Financial Corp. COP, Capital Improvement, Series A, | | | | |
| 5.00%, 5/01/22 | | 6,595,000 | | 7,423,332 |
| North Carolina State Medical Care Commission Hospital Revenue, | | | | |
| Annie Penn Memorial Hospital Project, Pre-Refunded, 5.375%, 1/01/22 | | 1,610,000 | | 1,678,409 |
| Halifax Regional Medical Center Project, 5.00%, 8/15/24 | | 1,800,000 | | 1,703,142 |
| North Carolina Baptist Hospital, Refunding, 5.00%, 6/01/34 | | 10,000,000 | | 10,356,700 |
| North Carolina State Ports Authority Port Facilities Revenue, senior lien, Refunding, Series A, | | | | |
| 5.25%, 2/01/40 | | 6,000,000 | | 6,237,120 |
| North Carolina State Turnpike Authority Monroe Connector System State Appropriated | | | | |
| Revenue, 5.00%, 7/01/41 | | 6,565,000 | | 7,007,875 |
| North Carolina Turnpike Authority Triangle Expressway System Revenue, Series A, | | | | |
| Assured Guaranty, | | | | |
| 5.50%, 1/01/29 | | 6,400,000 | | 7,168,000 |
| 5.75%, 1/01/39 | | 12,120,000 | | 13,179,530 |
| Northern Hospital District of Surry County Health Care Facilities Revenue, | | | | |
| 6.00%, 10/01/28 | | 1,000,000 | | 1,060,930 |
| 6.25%, 10/01/38 | | 2,000,000 | | 2,116,640 |
| Oak Island Enterprise System Revenue, | | | | |
| Assured Guaranty, 6.00%, 6/01/34 | | 1,540,000 | | 1,711,048 |
| Assured Guaranty, 6.00%, 6/01/36 | | 1,000,000 | | 1,106,550 |
| Series A, NATL Insured, 5.00%, 6/01/33 | | 5,000,000 | | 5,266,600 |
| Onslow County Hospital Authority FHA Insured Mortgage Revenue, Onslow Memorial Hospital | | | | |
| Project, NATL Insured, 5.00%, | | | | |
| 4/01/31 | | 5,675,000 | | 5,805,298 |
| 10/01/34 | | 6,000,000 | | 6,120,120 |
Annual Report | 141
| | | | |
| Franklin Tax-Free Trust | | | | |
| |
| Statement of Investments, February 28, 2014 (continued) | | | | |
| |
| |
| Franklin North Carolina Tax-Free Income Fund | | Principal Amount | | Value |
| Municipal Bonds (continued) | | | | |
| North Carolina (continued) | | | | |
| Onslow Water and Sewer Authority Combined Enterprise System Revenue, Series A, | | | | |
| NATL Insured, 5.00%, 6/01/33 | $ | 7,500,000 | $ | 7,887,900 |
| Pasquotank County COP, NATL Insured, Pre-Refunded, 5.00%, | | | | |
| 6/01/25 | | 470,000 | | 475,363 |
| 6/01/25 | | 930,000 | | 940,723 |
| Pitt County Revenue, Limited Obligation, Assured Guaranty, 5.00%, 4/01/34 | | 1,000,000 | | 1,076,860 |
| Raleigh Combined Enterprise System Revenue, | | | | |
| 5.00%, 3/01/40 | | 11,915,000 | | 12,800,404 |
| Refunding, Series A, 5.00%, 3/01/43 | | 10,000,000 | | 10,882,700 |
| Series A, 5.00%, 3/01/36 | | 3,365,000 | | 3,554,113 |
| Series A, Pre-Refunded, 5.00%, 3/01/36 | | 2,635,000 | | 2,883,164 |
| Raleigh COP, Downtown Improvement Projects, Series A, 5.00%, 2/01/29 | | 6,070,000 | | 6,231,948 |
| Raleigh-Durham Airport Authority Airport Revenue, | | | | |
| Refunding, Series A, 5.00%, 5/01/36 | | 10,785,000 | | 11,452,376 |
| Series A, AMBAC Insured, 5.00%, 5/01/30 | | 14,060,000 | | 14,463,944 |
| Rockingham County COP, Assured Guaranty, 5.00%, 4/01/32 | | 9,380,000 | | 9,898,526 |
| Union County COP, AMBAC Insured, Pre-Refunded, 5.00%, 6/01/30 | | 5,000,000 | | 5,520,400 |
| University of North Carolina at Chapel Hill Revenue, Board of Governors of the University of | | | | |
| North Carolina, General, | | | | |
| 5.00%, 12/01/31 | | 9,000,000 | | 10,015,920 |
| Refunding, Series A, 5.00%, 12/01/34 | | 11,460,000 | | 11,856,860 |
| University of North Carolina at Charlotte Revenue, General, | | | | |
| Series A, 5.00%, 4/01/37 | | 12,995,000 | | 13,920,634 |
| Series A, 5.00%, 4/01/41 | | 18,000,000 | | 19,116,000 |
| Series B, AGMC Insured, 5.00%, 4/01/32 | | 5,000,000 | | 5,237,350 |
| University of North Carolina at Greensboro Revenue, General, Series A, Assured Guaranty, | | | | |
| 5.00%, 4/01/34 | | 1,000,000 | | 1,065,780 |
| University of North Carolina at Wilmington COP, Student Housing Project, | | | | |
| Assured Guaranty, 5.00%, 6/01/32 | | 5,000,000 | | 5,246,550 |
| NATL RE, FGIC Insured, 5.00%, 6/01/26 | | 1,655,000 | | 1,730,849 |
| NATL RE, FGIC Insured, 5.00%, 6/01/27 | | 1,740,000 | | 1,815,116 |
| NATL RE, FGIC Insured, 5.00%, 6/01/29 | | 1,915,000 | | 1,991,332 |
| NATL RE, FGIC Insured, 5.00%, 6/01/37 | | 11,350,000 | | 11,675,972 |
| University of North Carolina System Pool Revenue, | | | | |
| 2012, Series C, AMBAC Insured, Pre-Refunded, 5.00%, 4/01/29 | | 1,155,000 | | 1,158,996 |
| 2012, Series C, AMBAC Insured, Pre-Refunded, 5.00%, 4/01/29 | | 595,000 | | 597,083 |
| Series A, Assured Guaranty, 5.00%, 10/01/33 | | 5,000,000 | | 5,342,550 |
| Series A, NATL Insured, 5.00%, 10/01/33 | | 2,000,000 | | 2,060,700 |
| Series C, AMBAC Insured, Pre-Refunded, 5.00%, 4/01/29 | | 750,000 | | 752,625 |
| Wake County Revenue, Limited Obligation, 5.00%, | | | | |
| 1/01/33 | | 10,820,000 | | 11,998,190 |
| 6/01/36 | | 5,000,000 | | 5,425,650 |
| 1/01/37 | | 12,000,000 | | 12,835,680 |
| Western Carolina University Research and Development Corp. COP, Western Carolina | | | | |
| University Student Housing Project, Assured Guaranty, 5.00%, 6/01/39 | | 5,000,000 | | 5,169,200 |
142 | Annual Report
| | | | |
| Franklin Tax-Free Trust | | | | |
| |
| Statement of Investments, February 28, 2014 (continued) | | | | |
| |
| |
| Franklin North Carolina Tax-Free Income Fund | | Principal Amount | | Value |
| Municipal Bonds (continued) | | | | |
| North Carolina (continued) | | | | |
| Wilkes County COP, NATL Insured, 5.00%, | | | | |
| 6/01/31 | $ | 4,295,000 | $ | 4,479,470 |
| 6/01/36 | | 6,085,000 | | 6,296,880 |
| Wilmington COP, | | | | |
| AMBAC Insured, Pre-Refunded, 5.00%, 9/01/29 | | 1,000,000 | | 1,023,590 |
| Refunding, Series A, AMBAC Insured, 5.00%, 6/01/32 | | 5,310,000 | | 5,498,505 |
| Series A, 5.00%, 6/01/33 | | 6,000,000 | | 6,310,320 |
| Series A, 5.00%, 6/01/38 | | 7,625,000 | | 7,955,391 |
| Wilmington Storm Water Fee Revenue, Refunding, AMBAC Insured, 5.00%, 6/01/33 | | 1,000,000 | | 1,076,960 |
| Wilmington Water and Sewer System Revenue, Refunding, AGMC Insured, 5.00%, | | | | |
| 6/01/34 | | 3,565,000 | | 3,682,681 |
| Wilson COP, Public Facilities Project, Assured Guaranty, 5.00%, 5/01/33 | | 3,000,000 | | 3,152,340 |
| Winston-Salem Water and Sewer System Revenue, | | | | |
| 5.00%, 6/01/39 | | 5,000,000 | | 5,388,150 |
| Refunding, Series A, 5.00%, 6/01/32 | | 7,590,000 | | 8,235,757 |
| | | | | 1,005,841,994 |
| U.S. Territories 10.6% | | | | |
| Puerto Rico 10.1% | | | | |
| Children’s Trust Fund Tobacco Settlement Revenue, Asset-Backed, Refunding, 5.50%, | | | | |
| 5/15/39 | | 5,000,000 | | 4,520,900 |
| Puerto Rico Commonwealth Aqueduct and Sewer Authority Revenue, senior lien, Series A, | | | | |
| 6.00%, 7/01/38 | | 2,100,000 | | 1,589,511 |
| Puerto Rico Commonwealth GO, Public Improvement, Refunding, | | | | |
| Series A, 5.50%, 7/01/32 | | 5,000,000 | | 3,867,750 |
| Series A, 5.75%, 7/01/41 | | 5,000,000 | | 3,870,650 |
| Series B, 6.00%, 7/01/39 | | 10,000,000 | | 7,911,800 |
| Puerto Rico Commonwealth Highways and Transportation Authority Transportation Revenue, | | | | |
| Refunding, Series A, NATL Insured, 5.00%, 7/01/38 | | 20,000 | | 15,745 |
| Puerto Rico Electric Power Authority Power Revenue, | | | | |
| Series RR, FGIC Insured, Pre-Refunded, 5.00%, 7/01/35 | | 3,000,000 | | 3,190,470 |
| Series RR, XLCA Insured, Pre-Refunded, 5.00%, 7/01/30 | | 1,000,000 | | 1,063,490 |
| Series WW, 5.25%, 7/01/33 | | 6,500,000 | | 4,501,315 |
| Series WW, 5.50%, 7/01/38 | | 6,700,000 | | 4,554,794 |
| Series XX, 5.25%, 7/01/40 | | 30,510,000 | | 20,304,710 |
| Puerto Rico Infrastructure Financing Authority Revenue, Ports Authority Project, Series B, | | | | |
| 5.25%, 12/15/26 | | 5,000,000 | | 3,062,950 |
| Puerto Rico PBA Guaranteed Revenue, Government Facilities, Refunding, Series P, 6.75%, | | | | |
| 7/01/36 | | 5,000,000 | | 4,221,900 |
| Puerto Rico Sales Tax FICO Sales Tax Revenue, first subordinate, Series A, | | | | |
| 5.375%, 8/01/39 | | 13,000,000 | | 10,002,980 |
| 5.50%, 8/01/42 | | 5,750,000 | | 4,516,740 |
| 6.00%, 8/01/42 | | 45,750,000 | | 37,726,365 |
| | | | | 114,922,070 |
Annual Report | 143
Franklin Tax-Free Trust
Statement of Investments, February 28, 2014 (continued)
| | | | |
| Franklin North Carolina Tax-Free Income Fund | | Principal Amount | | Value |
| Municipal Bonds (continued) | | | | |
| U.S. Territories (continued) | | | | |
| U.S. Virgin Islands 0.5% | | | | |
| Virgin Islands PFAR, senior lien, Refunding, Series B, 5.00%, 10/01/25 | $ | 5,500,000 | $ | 5,774,945 |
| Total U.S. Territories | | | | 120,697,015 |
| Total Municipal Bonds (Cost $1,118,968,515) 98.5% | | | | 1,126,539,009 |
| Other Assets, less Liabilities 1.5% | | | | 17,545,838 |
| Net Assets 100.0% | | | $ | 1,144,084,847 |
| |
| |
| See Abbreviations on page 182. | | | | |
144 | The accompanying notes are an integral part of these financial statements. | Annual Report
| | | | | | | | | | | | | | | |
| Franklin Tax-Free Trust | | | | | | | | | | | | | | | |
| Financial Highlights | | | | | | | | | | | | | | | |
| |
| Franklin Virginia Tax-Free Income Fund | | | | | | | | | | | | | | | |
| | | | | | Year Ended February 28, | | | | |
| Class A | | 2014 | | | 2013 | | | 2012 | a | | 2011 | | | 2010 | |
| Per share operating performance | | | | | | | | | | | | | | | |
| (for a share outstanding throughout the year) | | | | | | | | | | | | | | | |
| Net asset value, beginning of year | $ | 12.25 | | $ | 12.10 | | $ | 11.18 | | $ | 11.63 | | $ | 10.95 | |
| Income from investment operationsb: | | | | | | | | | | | | | | | |
| Net investment incomec | | 0.43 | | | 0.43 | | | 0.48 | | | 0.48 | | | 0.49 | |
| Net realized and unrealized gains (losses) | | (0.84 | ) | | 0.16 | | | 0.93 | | | (0.45 | ) | | 0.68 | |
| Total from investment operations | | (0.41 | ) | | 0.59 | | | 1.41 | | | 0.03 | | | 1.17 | |
| Less distributions from net investment income | | (0.42 | ) | | (0.44 | ) | | (0.49 | ) | | (0.48 | ) | | (0.49 | ) |
| Net asset value, end of year | $ | 11.42 | | $ | 12.25 | | $ | 12.10 | | $ | 11.18 | | $ | 11.63 | |
| |
| Total returnd | | (3.33 | )% | | 4.93 | % | | 12.84 | % | | 0.24 | % | | 10.82 | % |
| |
| Ratios to average net assets | | | | | | | | | | | | | | | |
| Expenses | | 0.64 | % | | 0.64 | % | | 0.64 | % | | 0.64 | % | | 0.65 | % |
| Net investment income | | 3.74 | % | | 3.55 | % | | 4.14 | % | | 4.11 | % | | 4.27 | % |
| |
| Supplemental data | | | | | | | | | | | | | | | |
| Net assets, end of year (000’s) | $ | 562,671 | | $ | 779,288 | | $ | 705,786 | | $ | 647,471 | | $ | 675,934 | |
| Portfolio turnover rate | | 11.67 | % | | 10.96 | % | | 11.58 | % | | 16.44 | % | | 6.08 | % |
aFor the year ended February 29.
bThe amount shown for a share outstanding throughout the period may not correlate with the Statement of Operations for the period due to the timing of sales and repurchases of
the Fund shares in relation to income earned and/or fluctuating market value of the investments of the Fund.
cBased on average daily shares outstanding.
dTotal return does not reflect sales commissions or contingent deferred sales charges, if applicable.
Annual Report | The accompanying notes are an integral part of these financial statements. | 145
| | | | | | | | | | | | | | | |
| Franklin Tax-Free Trust | | | | | | | | | | | | | | | |
| Financial Highlights (continued) | | | | | | | | | | | | | | | |
| |
| Franklin Virginia Tax-Free Income Fund | | | | | | | | | | | | | | | |
| | | | | | Year Ended February 28, | | | | |
| Class C | | 2014 | | | 2013 | | | 2012 | a | | 2011 | | | 2010 | |
| Per share operating performance | | | | | | | | | | | | | | | |
| (for a share outstanding throughout the year) | | | | | | | | | | | | | | | |
| Net asset value, beginning of year | $ | 12.42 | | $ | 12.26 | | $ | 11.32 | | $ | 11.77 | | $ | 11.08 | |
| Income from investment operationsb: | | | | | | | | | | | | | | | |
| Net investment incomec | | 0.37 | | | 0.37 | | | 0.42 | | | 0.42 | | | 0.43 | |
| Net realized and unrealized gains (losses) | | (0.86 | ) | | 0.16 | | | 0.94 | | | (0.45 | ) | | 0.68 | |
| Total from investment operations | | (0.49 | ) | | 0.53 | | | 1.36 | | | (0.03 | ) | | 1.11 | |
| Less distributions from net investment income | | (0.35 | ) | | (0.37 | ) | | (0.42 | ) | | (0.42 | ) | | (0.42 | ) |
| Net asset value, end of year | $ | 11.58 | | $ | 12.42 | | $ | 12.26 | | $ | 11.32 | | $ | 11.77 | |
| |
| Total returnd | | (3.89 | )% | | 4.36 | % | | 12.25 | % | | (0.33 | )% | | 10.18 | % |
| |
| Ratios to average net assets | | | | | | | | | | | | | | | |
| Expenses | | 1.19 | % | | 1.19 | % | | 1.19 | % | | 1.19 | % | | 1.20 | % |
| Net investment income | | 3.19 | % | | 3.00 | % | | 3.59 | % | | 3.56 | % | | 3.72 | % |
| |
| Supplemental data | | | | | | | | | | | | | | | |
| Net assets, end of year (000’s) | $ | 118,953 | | $ | 171,973 | | $ | 143,242 | | $ | 123,765 | | $ | 119,921 | |
| Portfolio turnover rate | | 11.67 | % | | 10.96 | % | | 11.58 | % | | 16.44 | % | | 6.08 | % |
aFor the year ended February 29.
bThe amount shown for a share outstanding throughout the period may not correlate with the Statement of Operations for the period due to the timing of sales and repurchases of
the Fund shares in relation to income earned and/or fluctuating market value of the investments of the Fund.
cBased on average daily shares outstanding.
dTotal return does not reflect sales commissions or contingent deferred sales charges, if applicable.
146 | The accompanying notes are an integral part of these financial statements. | Annual Report
| | | | | | | | | | | | | | | |
| Franklin Tax-Free Trust | | | | | | | | | | | | | | | |
| Financial Highlights (continued) | | | | | | | | | | | | | | | |
| |
| Franklin Virginia Tax-Free Income Fund | | | | | | | | | | | | | | | |
| | | | | | Year Ended February 28, | | | | |
| Advisor Class | | 2014 | | | 2013 | | | 2012 | a | | 2011 | | | 2010 | b |
| Per share operating performance | | | | | | | | | | | | | | | |
| (for a share outstanding throughout the year) | | | | | | | | | | | | | | | |
| Net asset value, beginning of year | $ | 12.25 | | $ | 12.10 | | $ | 11.18 | | $ | 11.63 | | $ | 11.15 | |
| Income from investment operationsc: | | | | | | | | | | | | | | | |
| Net investment incomed | | 0.45 | | | 0.45 | | | 0.49 | | | 0.49 | | | 0.33 | |
| Net realized and unrealized gains (losses) | | (0.85 | ) | | 0.15 | | | 0.93 | | | (0.44 | ) | | 0.47 | |
| Total from investment operations | | (0.40 | ) | | 0.60 | | | 1.42 | | | 0.05 | | | 0.80 | |
| Less distributions from net investment income | | (0.43 | ) | | (0.45 | ) | | (0.50 | ) | | (0.50 | ) | | (0.32 | ) |
| Net asset value, end of year | $ | 11.42 | | $ | 12.25 | | $ | 12.10 | | $ | 11.18 | | $ | 11.63 | |
| |
| Total returne | | (3.24 | )% | | 5.03 | % | | 12.95 | % | | 0.34 | % | | 7.26 | % |
| |
| Ratios to average net assetsf | | | | | | | | | | | | | | | |
| Expenses | | 0.54 | % | | 0.54 | % | | 0.54 | % | | 0.54 | % | | 0.55 | % |
| Net investment income | | 3.84 | % | | 3.65 | % | | 4.24 | % | | 4.21 | % | | 4.37 | % |
| |
| Supplemental data | | | | | | | | | | | | | | | |
| Net assets, end of year (000’s) | $ | 37,582 | | $ | 41,592 | | $ | 30,166 | | $ | 11,030 | | $ | 7,601 | |
| Portfolio turnover rate | | 11.67 | % | | 10.96 | % | | 11.58 | % | | 16.44 | % | | 6.08 | % |
aFor the year ended February 29.
bFor the period July 1, 2009 (effective date) to February 28, 2010.
cThe amount shown for a share outstanding throughout the period may not correlate with the Statement of Operations for the period due to the timing of sales and repurchases of
the Fund shares in relation to income earned and/or fluctuating market value of the investments of the Fund.
dBased on average daily shares outstanding.
eTotal return is not annualized for periods less than one year.
fRatios are annualized for periods less than one year.
Annual Report | The accompanying notes are an integral part of these financial statements. | 147
| | | | | |
| Franklin Tax-Free Trust | | | | | |
| |
| Statement of Investments, February 28, 2014 | | | | | |
| |
| |
| Franklin Virginia Tax-Free Income Fund | | | Principal Amount | | Value |
| Municipal Bonds 97.5% | | | | | |
| Virginia 79.7% | | | | | |
| Bristol Utility System Revenue, AGMC Insured, ETM, 5.00%, 7/15/21 | | $ | 1,245,000 | $ | 1,453,737 |
| Capital Region Airport Commission Airport Revenue, Series A, AGMC Insured, 5.00%, | | | | | |
| 7/01/31 | | | 2,000,000 | | 2,112,700 |
| 7/01/38 | | | 5,895,000 | | 6,133,630 |
| Caroline County IDA Lease Revenue, AMBAC Insured, 5.125%, 6/15/34 | | | 1,000,000 | | 1,001,490 |
| Charlotte County IDA Hospital Revenue, Halifax Regional Hospital Inc., 5.00%, 9/01/37 | | | 2,500,000 | | 2,537,525 |
| Chesterfield County EDA Revenue, Bon Secours Health System Inc., | | | | | |
| Series C-1, AGMC Insured, 5.00%, 11/01/42 | | | 2,250,000 | | 2,328,345 |
| Series C-2, Assured Guaranty, 5.00%, 11/01/42 | | | 8,000,000 | | 8,278,560 |
| Chesterfield County EDA, PCR, Virginia Electric and Power Co. Project, Refunding, Series A, | | | | | |
| 5.00%, 5/01/23 | | | 5,000,000 | | 5,491,750 |
| Fairfax County EDA Transportation District Improvement Revenue, Silver Line Phase I Project, | | | | | |
| 5.00%, 4/01/36 | | | 10,000,000 | | 10,639,400 |
| Fairfax County IDAR, Health Care, Inova Health System Project, | | | | | |
| Refunding, Series C, 5.00%, 5/15/25 | | | 3,500,000 | | 3,887,590 |
| Series A, 5.50%, 5/15/35 | | | 10,000,000 | | 11,001,700 |
| Front Royal and Warren County IDA Lease Revenue, Series B, AGMC Insured, Pre-Refunded, | | | | | |
| 5.00%, | | | | | |
| 4/01/29 | | | 5,115,000 | | 5,132,902 |
| 4/01/35 | | | 6,000,000 | | 6,021,000 |
| Greater Richmond Convention Center Authority Hotel Tax Revenue, Refunding, NATL Insured, | | | | | |
| 5.00%, 6/15/30 | | | 6,000,000 | | 6,165,840 |
| Hampton Roads Sanitation District Wastewater Revenue, | | | | | |
| 5.00%, 4/01/33 | | | 10,000,000 | | 10,757,100 |
| Refunding, 5.00%, 4/01/38 | | | 16,000,000 | | 17,003,040 |
| Harrisonburg IDAR, Hospital Facilities, Rockingham Memorial Hospital, AMBAC Insured, | | | | | |
| 5.00%, | | | | | |
| 8/15/42 | | | 8,095,000 | | 8,213,673 |
| 8/15/46 | | | 15,000,000 | | 15,202,500 |
| Henrico County EDA Revenue, Bon Secours Health System Inc., Refunding, 5.00%, | | | | | |
| 11/01/30 | | | 7,000,000 | | 7,412,930 |
| Hopewell Sewer System Revenue, Refunding, Series A, 5.00%, 7/15/42 | | | 4,850,000 | | 5,137,362 |
| King George County IDA Lease Revenue, AGMC Insured, Pre-Refunded, 5.00%, 3/01/32 | | | 3,595,000 | | 3,595,000 |
| Lexington IDA Educational Facilities Revenue, | | | | | |
| VMI Development Board Inc. Project, Series C, 5.00%, 12/01/36 | | | 5,000,000 | | 5,341,100 |
| Washington and Lee University, 5.00%, 1/01/43 | | | 10,000,000 | | 10,762,900 |
| Loudoun County Sanitation Authority Water and Sewer Revenue, Pre-Refunded, 5.00%, | | | | | |
| 1/01/33 | | | 15,060,000 | | 15,659,991 |
| Manassas Park GO, Series A, Assured Guaranty, Pre-Refunded, 5.00%, 4/01/29 | | | 5,545,000 | | 6,319,415 |
| Middle River Regional Jail Authority Jail Facility Revenue, NATL Insured, 5.00%, 5/15/28 | | | 1,000,000 | | 1,012,770 |
| Montgomery County IDA Public Facilities Lease Revenue, Public Projects, 5.00%, 2/01/29 | | | 6,500,000 | | 7,017,920 |
| Newport News EDA, EDR, Series A, Pre-Refunded, 5.00%, 1/15/31 | | | 5,870,000 | | 6,381,629 |
| Norfolk GO, Capital Improvement, Refunding, | | | | | |
| Series A, 5.00%, 8/01/32 | | | 5,845,000 | | 6,522,435 |
| Series C, 5.00%, 10/01/42 | | | 7,825,000 | | 8,352,327 |
| Northwestern Regional Jail Authority Jail Facilities Revenue, NATL Insured, Pre-Refunded, | | | | | |
| 5.00%, 7/01/33 | | | 2,600,000 | | 2,763,982 |
| Patrick County EDA Lease Revenue, School Projects, Assured Guaranty, 5.25%, 3/01/39 | | | 6,435,000 | | 6,683,134 |
148 | Annual Report
| | | | |
| Franklin Tax-Free Trust | | | | |
| |
| Statement of Investments, February 28, 2014 (continued) | | | | |
| |
| |
| Franklin Virginia Tax-Free Income Fund | | Principal Amount | | Value |
| Municipal Bonds (continued) | | | | |
| Virginia (continued) | | | | |
| Pittsylvania County School GO, Series B, 5.75%, 2/01/30 | $ | 5,800,000 | $ | 6,419,150 |
| Portsmouth GO, Public Utility, Refunding, Series A, 5.00%, 7/15/41 | | 10,000,000 | | 10,755,800 |
| Prince William County IDA Health Care Facilities Revenue, Novant Health Obligation Group, | | | | |
| Prince William Hospital, Refunding, Series B, 5.00%, 11/01/46 | | 10,000,000 | | 10,175,100 |
| Prince William County IDA Revenue, George Mason University Foundation, Prince William Life | | | | |
| Sciences Lab LLC Project, Series AA, 5.125%, 9/01/41 | | 3,200,000 | | 3,325,952 |
| Prince William County Service Authority Water and Sewer System Revenue, | | | | |
| Pre-Refunded, 5.00%, 7/01/32 | | 1,255,000 | | 1,333,287 |
| Refunding, 5.00%, 7/01/32 | | 495,000 | | 519,126 |
| Richmond Public Utility Revenue, | | | | |
| AGMC Insured, Pre-Refunded, 5.00%, 1/15/35 | | 3,500,000 | | 3,644,445 |
| Refunding, Series A, 5.00%, 1/15/35 | | 11,495,000 | | 12,360,229 |
| Refunding, Series A, 5.00%, 1/15/43 | | 10,000,000 | | 10,848,200 |
| Riverside Regional Jail Authority Jail Facility Revenue, NATL Insured, 5.00%, | | | | |
| 7/01/28 | | 7,000,000 | | 7,330,750 |
| 7/01/32 | | 22,000,000 | | 22,787,600 |
| Roanoke County EDA Lease Revenue, Public Facility Projects, Assured Guaranty, 5.125%, | | | | |
| 10/15/37 | | 10,000,000 | | 10,576,900 |
| Roanoke EDA Hospital Revenue, Carilion Clinic Obligated Group, Refunding, 5.00%, | | | | |
| 7/01/33 | | 10,615,000 | | 11,118,257 |
| Roanoke IDA Hospital Revenue, Carilion Health System Obligated Group, Series B, | | | | |
| AGMC Insured, 5.00%, 7/01/38 | | 3,950,000 | | 4,099,191 |
| Assured Guaranty, Pre-Refunded, 5.00%, 7/01/38 | | 50,000 | | 60,350 |
| Smyth County GO, Public Improvement, Series A, 5.00%, 11/01/31 | | 4,145,000 | | 4,518,506 |
| Stafford County and Staunton IDAR, Virginia Municipal League Assn. of Counties Finance | | | | |
| Program, | | | | |
| Series A, NATL Insured, 5.25%, 8/01/31 | | 3,890,000 | | 3,975,230 |
| Series A, NATL Insured, Pre-Refunded, 5.25%, 8/01/31 | | 1,110,000 | | 1,239,315 |
| Series C, NATL Insured, 5.00%, 8/01/35 | | 1,395,000 | | 1,404,528 |
| Series C, NATL Insured, Pre-Refunded, 5.00%, 8/01/35 | | 6,340,000 | | 6,765,034 |
| Series E, XLCA Insured, 5.00%, 8/01/37 | | 3,985,000 | | 4,049,318 |
| Stafford County EDA Hospital Facilities Revenue, Medicorp Health System Obligated Group, | | | | |
| 5.25%, 6/15/37 | | 5,000,000 | | 5,008,100 |
| Suffolk GO, Refunding, 5.00%, | | | | |
| 2/01/41 | | 10,000,000 | | 10,703,700 |
| 6/01/42 | | 10,000,000 | | 10,719,900 |
| University of Virginia Revenue, General, | | | | |
| 5.00%, 6/01/37 | | 2,780,000 | | 2,896,121 |
| Pre-Refunded, 5.00%, 6/01/37 | | 6,155,000 | | 6,514,821 |
| Refunding, 5.00%, 6/01/40 | | 17,750,000 | | 18,998,890 |
| Refunding, Series A, 5.00%, 6/01/43 | | 15,000,000 | | 16,624,800 |
| Virginia Beach Development Authority Public Facility Revenue, Series A, 5.00%, 7/15/27 | | 5,635,000 | | 6,110,932 |
| Virginia College Building Authority Educational Facilities Revenue, | | | | |
| Liberty University Projects, 5.25%, 3/01/29 | | 2,860,000 | | 3,155,924 |
| Liberty University Projects, 5.00%, 3/01/41 | | 26,855,000 | | 28,228,633 |
| Public Higher Education Financing Program, Series A, 5.00%, 9/01/33 | | 4,010,000 | | 4,316,524 |
| Virginia Port Authority Port Facilities Revenue, Refunding, 5.00%, 7/01/40 | | 6,000,000 | | 6,223,560 |
| Virginia State HDA Commonwealth Mortgage Revenue, Series C, Sub Series C-5, 4.80%, | | | | |
| 7/01/38 | | 8,500,000 | | 8,901,115 |
| |
| | | Annual Report | 149 |
| | | | |
| Franklin Tax-Free Trust | | | | |
| |
| Statement of Investments, February 28, 2014 (continued) | | | | |
| |
| |
| Franklin Virginia Tax-Free Income Fund | | Principal Amount | | Value |
| Municipal Bonds (continued) | | | | |
| Virginia (continued) | | | | |
| Virginia State HDA Revenue, Rental Housing, | | | | |
| Series B, 5.625%, 6/01/39 | $ | 7,240,000 | $ | 7,723,632 |
| Series B, 5.00%, 6/01/45 | | 3,050,000 | | 3,130,825 |
| Series E, 5.00%, 10/01/44 | | 6,540,000 | | 6,677,667 |
| Series F, 5.05%, 12/01/44 | | 12,125,000 | | 12,443,766 |
| Series F, 5.00%, 4/01/45 | | 2,125,000 | | 2,176,786 |
| Virginia State Public School Authority Special Obligation Fluvanna County Revenue, School | | | | |
| Financing, Pre-Refunded, 6.00%, 12/01/32 | | 5,000,000 | | 6,162,000 |
| Virginia State Resources Authority Infrastructure Revenue, | | | | |
| St. Moral Virginia Pooled Financing Program, Series B, 5.00%, 11/01/41 | | 9,410,000 | | 10,166,470 |
| Virginia Pooled Financing Program, Senior Series A, 5.00%, 11/01/31 | | 5,000,000 | | 5,340,350 |
| Virginia Pooled Financing Program, Senior Series A, 5.00%, 11/01/36 | | 4,915,000 | | 5,226,021 |
| Virginia Pooled Financing Program, Senior Series A, 5.00%, 11/01/38 | | 1,600,000 | | 1,735,120 |
| Virginia Pooled Financing Program, Senior Series B, 5.00%, 11/01/32 | | 2,505,000 | | 2,691,522 |
| Virginia State Small Business Financing Authority Healthcare Facilities Revenue, Sentara | | | | |
| Healthcare, Refunding, 5.00%, 11/01/40 | | 23,000,000 | | 23,949,670 |
| Winchester IDA Hospital Revenue, Valley Health System Obligated Group, Series E, 5.625%, | | | | |
| 1/01/44 | | 3,350,000 | | 3,603,126 |
| | | | | 573,061,620 |
| District of Columbia 8.1% | | | | |
| Metropolitan Washington D.C. Airports Authority Airport System Revenue, Refunding, | | | | |
| Series A, 5.00%, 10/01/35 | | 12,000,000 | | 12,758,400 |
| Series A, AGMC Insured, 5.00%, 10/01/32 | | 10,000,000 | | 10,473,600 |
| Series B, BHAC Insured, 5.00%, 10/01/29 | | 3,000,000 | | 3,278,340 |
| Series C, 5.125%, 10/01/34 | | 6,450,000 | | 6,911,691 |
| Metropolitan Washington D.C. Airports Authority Dulles Toll Road Revenue, first senior lien, | | | | |
| Series A, | | | | |
| 5.00%, 10/01/39 | | 10,000,000 | | 10,273,400 |
| 5.25%, 10/01/44 | | 12,000,000 | | 12,450,720 |
| Washington Metropolitan Area Transit Authority Gross Revenue, Transit, Series A, 5.125%, | | | | |
| 7/01/32 | | 2,000,000 | | 2,172,660 |
| | | | | 58,318,811 |
| U.S. Territories 9.7% | | | | |
| Puerto Rico 9.7% | | | | |
| Puerto Rico Commonwealth Aqueduct and Sewer Authority Revenue, senior lien, Series A, | | | | |
| 6.00%, 7/01/38 | | 1,100,000 | | 832,601 |
| Assured Guaranty, 5.00%, 7/01/28 | | 6,000,000 | | 5,194,980 |
| Puerto Rico Commonwealth GO, Public Improvement, | | | | |
| Refunding, Series B, 6.00%, 7/01/39 | | 5,000,000 | | 3,955,900 |
| Series A, 6.00%, 7/01/38 | | 5,000,000 | | 3,969,600 |
| Puerto Rico Commonwealth Highways and Transportation Authority Highway Revenue, Series Y, | | | | |
| Pre-Refunded, 5.50%, 7/01/36 | | 4,500,000 | | 5,046,660 |
| Puerto Rico Commonwealth Highways and Transportation Authority Transportation Revenue, | | | | |
| Series G, 5.00%, 7/01/33 | | 1,685,000 | | 989,415 |
150 | Annual Report
| | | | |
| Franklin Tax-Free Trust | | | | |
| |
| Statement of Investments, February 28, 2014 (continued) | | | | |
| |
| |
| Franklin Virginia Tax-Free Income Fund | | Principal Amount | | Value |
| Municipal Bonds (continued) | | | | |
| U.S. Territories (continued) | | | | |
| Puerto Rico (continued) | | | | |
| Puerto Rico Electric Power Authority Power Revenue, | | | | |
| Series RR, FGIC Insured, Pre-Refunded, 5.00%, 7/01/35 | $ | 3,000,000 | $ | 3,190,470 |
| Series RR, XLCA Insured, Pre-Refunded, 5.00%, 7/01/30 | | 1,000,000 | | 1,063,490 |
| Series WW, 5.50%, 7/01/38 | | 6,700,000 | | 4,554,794 |
| Series XX, 5.25%, 7/01/40 | | 8,400,000 | | 5,590,284 |
| Puerto Rico Municipal Finance Agency GO, Series A, AGMC Insured, 5.00%, 8/01/27 | | 2,530,000 | | 2,292,585 |
| Puerto Rico PBA Guaranteed Revenue, Government Facilities, Refunding, Series Q, 5.625%, | | | | |
| 7/01/39 | | 5,000,000 | | 3,878,200 |
| Puerto Rico Sales Tax FICO Sales Tax Revenue, first subordinate, | | | | |
| Series A, 5.375%, 8/01/39 | | 6,000,000 | | 4,616,760 |
| Series A, 6.00%, 8/01/42 | | 20,000,000 | | 16,492,400 |
| Series C, 5.50%, 8/01/40 | | 10,000,000 | | 7,953,600 |
| | | | | 69,621,739 |
| Total Municipal Bonds before Short Term Investments (Cost $690,178,974) | | | | 701,002,170 |
| Short Term Investments (Cost $12,000,000) 1.6% | | | | |
| Municipal Bonds 1.6% | | | | |
| Virginia 1.6% | | | | |
| aVirginia State Small Business Financing Authority Hospital Revenue, Carilion Clinic Obligated | | | | |
| Group, Series A, Daily VRDN and Put, 0.05%, 7/01/42 | | 12,000,000 | | 12,000,000 |
| Total Investments (Cost $702,178,974) 99.1% | | | | 713,002,170 |
| Other Assets, less Liabilities 0.9% | | | | 6,203,804 |
| Net Assets 100.0% | | | $ | 719,205,974 |
See Abbreviations on page 182.
aVariable rate demand notes (VRDNs) are tax-exempt obligations which contain a floating or variable interest rate adjustment formula and an unconditional right of demand to
receive payment of the principal balance plus accrued interest at specified dates. The coupon rate shown represents the rate at period end.
Annual Report | The accompanying notes are an integral part of these financial statements. | 151
| | | | | | | | | |
| Franklin Tax-Free Trust | | | | | | | | | |
| |
| Financial Statements | | | | | | | | | |
| |
| |
| Statements of Assets and Liabilities | | | | | | | | | |
| February 28, 2014 | | | | | | | | | |
| |
| |
| | | Franklin | | | Franklin | | | Franklin | |
| | | Alabama | | | Florida | | | Georgia | |
| | | Tax-Free | | | Tax-Free | | | Tax-Free | |
| | | Income Fund | | | Income Fund | | | Income Fund | |
| Assets: | | | | | | | | | |
| Investments in securities: | | | | | | | | | |
| Cost | $ | 263,759,092 | | $ | 803,282,698 | | $ | 486,874,031 | |
| Value | $ | 266,248,234 | | $ | 817,109,404 | | $ | 499,731,544 | |
| Cash | | 1,874,383 | | | 2,186,907 | | | 549,543 | |
| Receivables: | | | | | | | | | |
| Capital shares sold | | 1,299,644 | | | 187,394 | | | 485,946 | |
| Interest | | 3,666,971 | | | 11,404,252 | | | 5,608,365 | |
| Other assets | | 190 | | | 588 | | | 356 | |
| Total assets | | 273,089,422 | | | 830,888,545 | | | 506,375,754 | |
| Liabilities: | | | | | | | | | |
| Payables: | | | | | | | | | |
| Investment securities purchased | | 3,142,057 | | | — | | | — | |
| Capital shares redeemed | | 796,227 | | | 1,730,159 | | | 1,354,252 | |
| Management fees | | 121,437 | | | 330,786 | | | 209,704 | |
| Distribution fees | | 41,380 | | | 100,841 | | | 85,272 | |
| Transfer agent fees | | 18,206 | | | 55,103 | | | 42,598 | |
| Distributions to shareholders | | 153,632 | | | 781,246 | | | 250,031 | |
| Professional fees | | 33,760 | | | 36,911 | | | 34,306 | |
| Accrued expenses and other liabilities | | 16,657 | | | 39,859 | | | 29,903 | |
| Total liabilities | | 4,323,356 | | | 3,074,905 | | | 2,006,066 | |
| Net assets, at value | $ | 268,766,066 | | $ | 827,813,640 | | $ | 504,369,688 | |
| Net assets consist of: | | | | | | | | | |
| Paid-in capital | $ | 268,956,855 | | $ | 831,197,303 | | $ | 499,876,644 | |
| Undistributed net investment income | | 379,705 | | | 2,791,789 | | | 743,248 | |
| Net unrealized appreciation (depreciation) | | 2,489,142 | | | 13,826,706 | | | 12,857,513 | |
| Accumulated net realized gain (loss) | | (3,059,636 | ) | | (20,002,158 | ) | | (9,107,717 | ) |
| Net assets, at value | $ | 268,766,066 | | $ | 827,813,640 | | $ | 504,369,688 | |
| Class A: | | | | | | | | | |
| Net assets, at value | $ | 218,825,918 | | $ | 737,869,341 | | $ | 391,836,536 | |
| Shares outstanding | | 19,571,256 | | | 66,794,141 | | | 32,603,252 | |
| Net asset value per sharea | $ | 11.18 | | $ | 11.05 | | $ | 12.02 | |
| Maximum offering price per share (net asset value per share ÷ 95.75%) | $ | 11.68 | | $ | 11.54 | | $ | 12.55 | |
| Class C: | | | | | | | | | |
| Net assets, at value | $ | 49,940,148 | | $ | 89,944,299 | | $ | 112,533,152 | |
| Shares outstanding | | 4,416,211 | | | 7,996,859 | | | 9,244,756 | |
| Net asset value and maximum offering price per sharea | $ | 11.31 | | $ | 11.25 | | $ | 12.17 | |
| |
| |
| |
| aRedemption price is equal to net asset value less contingent deferred sales charges, if applicable. | | | | | | | | | |
| |
| 152 | The accompanying notes are an integral part of these financial statements. | Annual Report | | | | |
| | | | | | | | | |
| Franklin Tax-Free Trust | | | | | | | | | |
| |
| Financial Statements (continued) | | | | | | | | | |
| |
| |
| Statements of Assets and Liabilities (continued) | | | | | | | | | |
| February 28, 2014 | | | | | | | | | |
| |
| |
| | | Franklin | | | Franklin | | | Franklin | |
| | | Kentucky | | | Louisiana | | | Maryland | |
| | | Tax-Free | | | Tax-Free | | | Tax-Free | |
| | | Income Fund | | | Income Fund | | | Income Fund | |
| Assets: | | | | | | | | | |
| Investments in securities: | | | | | | | | | |
| Cost | $ | 159,915,827 | | $ | 371,082,169 | | $ | 544,009,423 | |
| Value | $ | 162,937,909 | | $ | 380,147,911 | | $ | 543,273,638 | |
| Cash | | 1,248,783 | | | 4,059,419 | | | 9,541,456 | |
| Receivables: | | | | | | | | | |
| Capital shares sold | | 98,062 | | | 432,256 | | | 425,145 | |
| Interest | | 2,091,289 | | | 4,793,136 | | | 6,242,010 | |
| Other assets | | 121 | | | 273 | | | 396 | |
| Total assets | | 166,376,164 | | | 389,432,995 | | | 559,482,645 | |
| Liabilities: | | | | | | | | | |
| Payables: | | | | | | | | | |
| Capital shares redeemed | | 281,149 | | | 1,018,853 | | | 1,138,104 | |
| Management fees | | 79,381 | | | 166,072 | | | 229,597 | |
| Distribution fees | | 12,795 | | | 57,075 | | | 95,633 | |
| Transfer agent fees | | 13,057 | | | 30,627 | | | 42,702 | |
| Distributions to shareholders | | 54,420 | | | 92,093 | | | 316,581 | |
| Professional fees | | 32,639 | | | 34,155 | | | 35,012 | |
| Accrued expenses and other liabilities | | 13,482 | | | 23,887 | | | 29,287 | |
| Total liabilities | | 486,923 | | | 1,422,762 | | | 1,886,916 | |
| Net assets, at value | $ | 165,889,241 | | $ | 388,010,233 | | $ | 557,595,729 | |
| Net assets consist of: | | | | | | | | | |
| Paid-in capital | $ | 166,056,629 | | $ | 391,799,079 | | $ | 572,215,591 | |
| Undistributed net investment income | | 272,755 | | | 963,080 | | | 1,119,111 | |
| Net unrealized appreciation (depreciation) | | 3,022,082 | | | 9,065,742 | | | (735,785 | ) |
| Accumulated net realized gain (loss) | | (3,462,225 | ) | | (13,817,668 | ) | | (15,003,188 | ) |
| Net assets, at value | $ | 165,889,241 | | $ | 388,010,233 | | $ | 557,595,729 | |
Annual Report | The accompanying notes are an integral part of these financial statements. | 153
| | | | | | |
| Franklin Tax-Free Trust | | | | | | |
| |
| Financial Statements (continued) | | | | | | |
| |
| |
| Statements of Assets and Liabilities (continued) | | | | | | |
| February 28, 2014 | | | | | | |
| |
| | | Franklin | | Franklin | | Franklin |
| | | Kentucky | | Louisiana | | Maryland |
| | | Tax-Free | | Tax-Free | | Tax-Free |
| | | Income Fund | | Income Fund | | Income Fund |
| Class A: | | | | | | |
| Net assets, at value | $ | 165,889,241 | $ | 321,748,391 | $ | 407,060,530 |
| Shares outstanding | | 14,912,298 | | 28,583,051 | | 36,356,645 |
| Net asset value per sharea | $ | 11.12 | $ | 11.26 | $ | 11.20 |
| Maximum offering price per share (net asset value per share ÷ 95.75%) | $ | 11.61 | $ | 11.76 | $ | 11.70 |
| Class C: | | | | | | |
| Net assets, at value | | | $ | 66,261,842 | $ | 130,550,011 |
| Shares outstanding | | | | 5,806,638 | | 11,463,016 |
| Net asset value and maximum offering price per sharea | | | $ | 11.41 | $ | 11.39 |
| Advisor Class: | | | | | | |
| Net assets, at value | | | | | $ | 19,985,188 |
| Shares outstanding | | | | | | 1,784,062 |
| Net asset value and maximum offering price per share | | | | | $ | 11.20 |
| |
| |
| aRedemption price is equal to net asset value less contingent deferred sales charges, if applicable. | | | | | | |
154 | The accompanying notes are an integral part of these financial statements. | Annual Report
| | | | | | | | | |
| Franklin Tax-Free Trust | | | | | | | | | |
| |
| Financial Statements (continued) | | | | | | | | | |
| |
| |
| Statements of Assets and Liabilities (continued) | | | | | | | | | |
| February 28, 2014 | | | | | | | | | |
| |
| |
| | | Franklin | | | Franklin | | | Franklin | |
| | | Missouri | | | North Carolina | | | Virginia | |
| | | Tax-Free | | | Tax-Free | | | Tax-Free | |
| | | Income Fund | | | Income Fund | | | Income Fund | |
| Assets: | | | | | | | | | |
| Investments in securities: | | | | | | | | | |
| Cost | $ | 1,072,940,762 | | $ | 1,118,968,515 | | $ | 702,178,974 | |
| Value | $ | 1,077,090,167 | | $ | 1,126,539,009 | | $ | 713,002,170 | |
| Cash | | 11,010,259 | | | 1,966,054 | | | 265,026 | |
| Receivables: | | | | | | | | | |
| Investment securities sold | | — | | | 5,419,664 | | | — | |
| Capital shares sold | | 1,251,341 | | | 414,356 | | | 553,916 | |
| Interest | | 13,436,366 | | | 14,484,954 | | | 8,766,326 | |
| Other assets | | 776 | | | 811 | | | 520 | |
| Total assets | | 1,102,788,909 | | | 1,148,824,848 | | | 722,587,958 | |
| Liabilities: | | | | | | | | | |
| Payables: | | | | | | | | | |
| Capital shares redeemed | | 2,792,939 | | | 3,334,633 | | | 2,508,134 | |
| Management fees | | 432,089 | | | 449,481 | | | 290,138 | |
| Distribution fees | | 150,099 | | | 179,149 | | | 102,537 | |
| Transfer agent fees | | 82,733 | | | 91,322 | | | 57,259 | |
| Distributions to shareholders | | 472,748 | | | 591,612 | | | 347,980 | |
| Professional fees | | 38,287 | | | 38,798 | | | 36,561 | |
| Accrued expenses and other liabilities | | 52,205 | | | 55,006 | | | 39,375 | |
| Total liabilities | | 4,021,100 | | | 4,740,001 | | | 3,381,984 | |
| Net assets, at value | $ | 1,098,767,809 | | $ | 1,144,084,847 | | $ | 719,205,974 | |
| Net assets consist of: | | | | | | | | | |
| Paid-in capital | $ | 1,114,063,713 | | $ | 1,162,753,072 | | $ | 728,906,258 | |
| Undistributed net investment income | | 1,293,657 | | | 2,632,259 | | | 1,195,929 | |
| Net unrealized appreciation (depreciation) | | 4,149,405 | | | 7,570,494 | | | 10,823,196 | |
| Accumulated net realized gain (loss) | | (20,738,966 | ) | | (28,870,978 | ) | | (21,719,409 | ) |
| Net assets, at value | $ | 1,098,767,809 | | $ | 1,144,084,847 | | $ | 719,205,974 | |
Annual Report | The accompanying notes are an integral part of these financial statements. | 155
| | | | | | | | |
| Franklin Tax-Free Trust | | | | | | | | |
| |
| Financial Statements (continued) | | | | | | | | |
| |
| |
| Statements of Assets and Liabilities (continued) | | | | | | | | |
| February 28, 2014 | | | | | | | | |
| |
| | | | Franklin | | | Franklin | | Franklin |
| | | | Missouri | | | North Carolina | | Virginia |
| | | | Tax-Free | | | Tax-Free | | Tax-Free |
| | | | Income Fund | | | Income Fund | | Income Fund |
| Class A: | | | | | | | | |
| Net assets, at value | $ | | 889,701,580 | $ | | 851,504,455 | $ | 562,670,675 |
| Shares outstanding | | | 74,911,718 | | | 71,265,516 | | 49,290,153 |
| Net asset value per sharea | | $ | 11.88 | | $ | 11.95 | $ | 11.42 |
| Maximum offering price per share (net asset value per share ÷ 95.75%) | | $ | 12.41 | | $ | 12.48 | $ | 11.93 |
| Class C: | | | | | | | | |
| Net assets, at value | $ | | 166,226,154 | $ | | 229,369,481 | $ | 118,952,833 |
| Shares outstanding | | | 13,876,336 | | | 18,930,491 | | 10,273,658 |
| Net asset value and maximum offering price per sharea | | $ | 11.98 | | $ | 12.12 | $ | 11.58 |
| Advisor Class: | | | | | | | | |
| Net assets, at value | $ | | 42,840,075 | $ | | 63,210,911 | $ | 37,582,466 |
| Shares outstanding | | | 3,605,779 | | | 5,290,750 | | 3,291,289 |
| Net asset value and maximum offering price per share | | $ | 11.88 | | $ | 11.95 | $ | 11.42 |
| |
| |
| aRedemption price is equal to net asset value less contingent deferred sales charges, if applicable. | | | | | | | | |
156 | The accompanying notes are an integral part of these financial statements. | Annual Report
| | | | | | | | | |
| Franklin Tax-Free Trust | | | | | | | | | |
| |
| Financial Statements (continued) | | | | | | | | | |
| |
| |
| Statements of Operations | | | | | | | | | |
| for the year ended February 28, 2014 | | | | | | | | | |
| |
| |
| | | Franklin | | | Franklin | | | Franklin | |
| | | Alabama | | | Florida | | | Georgia | |
| | | Tax-Free | | | Tax-Free | | | Tax-Free | |
| | | Income Fund | | | Income Fund | | | Income Fund | |
| Investment income: | | | | | | | | | |
| Interest | $ | 13,489,204 | | $ | 45,885,666 | | $ | 25,660,434 | |
| Expenses: | | | | | | | | | |
| Management fees (Note 3a) | | 1,565,879 | | | 4,535,991 | | | 2,795,093 | |
| Distribution fees: (Note 3c) | | | | | | | | | |
| Class A | | 237,696 | | | 857,511 | | | 439,023 | |
| Class C | | 371,708 | | | 703,768 | | | 864,569 | |
| Transfer agent fees: (Note 3e) | | | | | | | | | |
| Class A | | 95,287 | | | 300,256 | | | 197,384 | |
| Class C | | 23,007 | | | 37,999 | | | 60,041 | |
| Custodian fees | | 2,249 | | | 7,220 | | | 4,352 | |
| Reports to shareholders | | 19,615 | | | 46,413 | | | 31,005 | |
| Registration and filing fees | | 13,880 | | | 22,818 | | | 24,979 | |
| Professional fees | | 48,343 | | | 40,370 | | | 36,807 | |
| Trustees’ fees and expenses | | 1,497 | | | 4,977 | | | 2,912 | |
| Other | | 32,411 | | | 60,996 | | | 54,660 | |
| Total expenses | | 2,411,572 | | | 6,618,319 | | | 4,510,825 | |
| Net investment income | | 11,077,632 | | | 39,267,347 | | | 21,149,609 | |
| Realized and unrealized gains (losses): | | | | | | | | | |
| Net realized gain (loss) from investments | | (2,946,640 | ) | | (19,840,274 | ) | | (4,592,835 | ) |
| Net change in unrealized appreciation (depreciation) on investments | | (18,131,236 | ) | | (67,227,918 | ) | | (37,900,375 | ) |
| Net realized and unrealized gain (loss) | | (21,077,876 | ) | | (87,068,192 | ) | | (42,493,210 | ) |
| Net increase (decrease) in net assets resulting from operations | $ | (10,000,244 | ) | $ | (47,800,845 | ) | $ | (21,343,601 | ) |
Annual Report | The accompanying notes are an integral part of these financial statements. | 157
| | | | | | | | | |
| Franklin Tax-Free Trust | | | | | | | | | |
| |
| Financial Statements (continued) | | | | | | | | | |
| |
| |
| Statements of Operations (continued) | | | | | | | | | |
| for the year ended February 28, 2014 | | | | | | | | | |
| |
| |
| | | Franklin | | | Franklin | | | Franklin | |
| | | Kentucky | | | Louisiana | | | Maryland | |
| | | Tax-Free | | | Tax-Free | | | Tax-Free | |
| | | Income Fund | | | Income Fund | | | Income Fund | |
| Investment income: | | | | | | | | | |
| Interest | $ | 8,807,515 | | $ | 20,579,355 | | $ | 27,376,650 | |
| Expenses: | | | | | | | | | |
| Management fees (Note 3a) | | 1,076,840 | | | 2,244,310 | | | 3,102,616 | |
| Distribution fees: (Note 3c) | | | | | | | | | |
| Class A | | 193,148 | | | 367,685 | | | 460,292 | |
| Class C | | — | | | 530,601 | | | 985,880 | |
| Transfer agent fees: (Note 3e) | | | | | | | | | |
| Class A | | 85,885 | | | 159,176 | | | 187,489 | |
| Class C | | — | | | 35,502 | | | 61,897 | |
| Advisor Class | | — | | | — | | | 12,177 | |
| Custodian fees | | 1,462 | | | 3,215 | | | 4,790 | |
| Reports to shareholders | | 15,886 | | | 28,364 | | | 36,064 | |
| Registration and filing fees | | 8,715 | | | 17,798 | | | 24,147 | |
| Professional fees | | 33,996 | | | 35,693 | | | 37,641 | |
| Trustees’ fees and expenses | | 979 | | | 2,313 | | | 3,284 | |
| Other | | 30,447 | | | 46,512 | | | 49,827 | |
| Total expenses | | 1,447,358 | | | 3,471,169 | | | 4,966,104 | |
| Net investment income | | 7,360,157 | | | 17,108,186 | | | 22,410,546 | |
| Realized and unrealized gains (losses): | | | | | | | | | |
| Net realized gain (loss) from investments | | (2,708,976 | ) | | (11,779,811 | ) | | (12,419,592 | ) |
| Net change in unrealized appreciation (depreciation) on investments | | (11,700,485 | ) | | (24,941,368 | ) | | (39,139,035 | ) |
| Net realized and unrealized gain (loss) | | (14,409,461 | ) | | (36,721,179 | ) | | (51,558,627 | ) |
| Net increase (decrease) in net assets resulting from operations | $ | (7,049,304 | ) | $ | (19,612,993 | ) | $ | (29,148,081 | ) |
158 | The accompanying notes are an integral part of these financial statements. | Annual Report
| | | | | | | | | |
| Franklin Tax-Free Trust | | | | | | | | | |
| |
| Financial Statements (continued) | | | | | | | | | |
| |
| |
| Statements of Operations (continued) | | | | | | | | | |
| for the year ended February 28, 2014 | | | | | | | | | |
| |
| |
| | | Franklin | | | Franklin | | | Franklin | |
| | | Missouri | | | North Carolina | | | Virginia | |
| | | Tax-Free | | | Tax-Free | | | Tax-Free | |
| | | Income Fund | | | Income Fund | | | Income Fund | |
| Investment income: | | | | | | | | | |
| Interest | $ | 55,903,269 | | $ | 59,382,018 | | $ | 36,881,563 | |
| Expenses: | | | | | | | | | |
| Management fees (Note 3a) | | 5,863,209 | | | 6,214,988 | | | 3,988,888 | |
| Distribution fees: (Note 3c) | | | | | | | | | |
| Class A | | 1,003,899 | | | 992,495 | | | 661,381 | |
| Class C | | 1,249,531 | | | 1,814,348 | | | 923,144 | |
| Transfer agent fees: (Note 3e) | | | | | | | | | |
| Class A | | 440,742 | | | 416,468 | | | 283,997 | |
| Class C | | 84,527 | | | 117,470 | | | 61,067 | |
| Advisor Class | | 29,961 | | | 32,258 | | | 16,316 | |
| Custodian fees | | 9,411 | | | 9,978 | | | 6,348 | |
| Reports to shareholders | | 75,397 | | | 76,947 | | | 49,660 | |
| Registration and filing fees | | 39,201 | | | 41,911 | | | 31,083 | |
| Professional fees | | 43,168 | | | 43,916 | | | 40,599 | |
| Trustees’ fees and expenses | | 6,471 | | | 6,921 | | | 4,325 | |
| Other | | 73,513 | | | 77,071 | | | 57,586 | |
| Total expenses | | 8,919,030 | | | 9,844,771 | | | 6,124,394 | |
| Net investment income | | 46,984,239 | | | 49,537,247 | | | 30,757,169 | |
| Realized and unrealized gains (losses): | | | | | | | | | |
| Net realized gain (loss) from investments | | (19,496,104 | ) | | (25,955,236 | ) | | (18,266,509 | ) |
| Net change in unrealized appreciation (depreciation) on investments | | (86,557,670 | ) | | (99,611,991 | ) | | (51,484,253 | ) |
| Net realized and unrealized gain (loss) | | (106,053,774 | ) | | (125,567,227 | ) | | (69,750,762 | ) |
| Net increase (decrease) in net assets resulting from operations | $ | (59,069,535 | ) | $ | (76,029,980 | ) | $ | (38,993,593 | ) |
Annual Report | The accompanying notes are an integral part of these financial statements. | 159
| | | | | | | | | | | | |
| Franklin Tax-Free Trust | | | | | | | | | | |
| |
| Financial Statements (continued) | | | | | | | | | | | | |
| |
| |
| Statements of Changes in Net Assets | | | | | | | | | | | | |
| |
| |
| | | Franklin Alabama | | | Franklin Florida | |
| | | Tax-Free Income Fund | | | Tax-Free Income Fund | |
| | | Year Ended February 28, | | | Year Ended February 28, | |
| | | 2014 | | | 2013 | | | 2014 | | | 2013 | |
| Increase (decrease) in net assets: | | | | | | | | | | | | |
| Operations: | | | | | | | | | | | | |
| Net investment income | $ | 11,077,632 | | $ | 11,613,119 | | $ | 39,267,347 | | $ | 45,139,219 | |
| Net realized gain (loss) from investments | | (2,946,640 | ) | | 406,273 | | | (19,840,274 | ) | | 7,343,362 | |
| Net change in unrealized appreciation (depreciation) | | | | | | | | | | | | |
| on investments | | (18,131,236 | ) | | 5,024,012 | | | (67,227,918 | ) | | 5,244,085 | |
| Net increase (decrease) in net assets resulting | | | | | | | | | | | | |
| from operations | | (10,000,244 | ) | | 17,043,404 | | | (47,800,845 | ) | | 57,726,666 | |
| Distributions to shareholders from: | | | | | | | | | | | | |
| Net investment income: | | | | | | | | | | | | |
| Class A | | (8,991,815 | ) | | (9,613,750 | ) | | (33,520,766 | ) | | (40,019,581 | ) |
| Class B | | — | | | — | | | — | | | (76,153 | ) |
| Class C | | (1,821,929 | ) | | (1,829,432 | ) | | (3,551,370 | ) | | (4,068,509 | ) |
| Net realized gains: | | | | | | | | | | | | |
| Class A | | (19,746 | ) | | (241,971 | ) | | (2,181,252 | ) | | (4,909,452 | ) |
| Class B | | — | | | — | | | — | | | (4,135 | ) |
| Class C | | (4,865 | ) | | (57,288 | ) | | (277,295 | ) | | (608,850 | ) |
| Total distributions to shareholders | | (10,838,355 | ) | | (11,742,441 | ) | | (39,530,683 | ) | | (49,686,680 | ) |
| Capital share transactions: (Note 2) | | | | | | | | | | | | |
| Class A | | (35,310,227 | ) | | 11,768,868 | | | (208,087,591 | ) | | (6,140,960 | ) |
| Class B | | — | | | — | | | (220,545 | ) | | (4,028,017 | ) |
| Class C | | (11,558,248 | ) | | 10,359,720 | | | (32,589,173 | ) | | 15,267,404 | |
| Total capital share transactions | | (46,868,475 | ) | | 22,128,588 | | | (240,897,309 | ) | | 5,098,427 | |
| Net increase (decrease) in net assets | | (67,707,074 | ) | | 27,429,551 | | | (328,228,837 | ) | | 13,138,413 | |
| Net assets: | | | | | | | | | | | | |
| Beginning of year | | 336,473,140 | | | 309,043,589 | | | 1,156,042,477 | | | 1,142,904,064 | |
| End of year | $ | 268,766,066 | | $ | 336,473,140 | | $ | 827,813,640 | | $ | 1,156,042,477 | |
| Undistributed net investment income included in | | | | | | | | | | | | |
| net assets: | | | | | | | | | | | | |
| End of year | $ | 379,705 | | $ | 123,216 | | $ | 2,791,789 | | $ | 621,642 | |
160 | The accompanying notes are an integral part of these financial statements. | Annual Report
| | | | | | | | | | | | |
| Franklin Tax-Free Trust | | | | | | | | | | |
| |
| Financial Statements (continued) | | | | | | | | | | | | |
| |
| |
| Statements of Changes in Net Assets (continued) | | | | | | | | | | | | |
| |
| |
| | | Franklin Georgia | | | Franklin Kentucky | |
| | | Tax-Free Income Fund | | | Tax-Free Income Fund | |
| | | Year Ended February 28, | | | Year Ended February 28, | |
| | | 2014 | | | 2013 | | | 2014 | | | 2013 | |
| Increase (decrease) in net assets: | | | | | | | | | | | | |
| Operations: | | | | | | | | | | | | |
| Net investment income | $ | 21,149,609 | | $ | 20,919,834 | | $ | 7,360,157 | | $ | 7,494,936 | |
| Net realized gain (loss) from investments | | (4,592,835 | ) | | 365,230 | | | (2,708,976 | ) | | 92,747 | |
| Net change in unrealized appreciation (depreciation) | | | | | | | | | | | | |
| on investments | | (37,900,375 | ) | | 13,637,136 | | | (11,700,485 | ) | | 4,048,979 | |
| Net increase (decrease) in net assets resulting | | | | | | | | | | | | |
| from operations | | (21,343,601 | ) | | 34,922,200 | | | (7,049,304 | ) | | 11,636,662 | |
| Distributions to shareholders from: | | | | | | | | | | | | |
| Net investment income: | | | | | | | | | | | | |
| Class A | | (16,540,000 | ) | | (16,097,424 | ) | | (7,118,111 | ) | | (7,498,666 | ) |
| Class C | | (4,201,491 | ) | | (4,221,269 | ) | | — | | | — | |
| Total distributions to shareholders | | (20,741,491 | ) | | (20,318,693 | ) | | (7,118,111 | ) | | (7,498,666 | ) |
| Capital share transactions: (Note 2) | | | | | | | | | | | | |
| Class A | | (74,458,025 | ) | | 61,828,536 | | | (38,712,538 | ) | | 24,400,696 | |
| Class C | | (37,616,499 | ) | | 27,489,757 | | | — | | | — | |
| Total capital share transactions | | (112,074,524 | ) | | 89,318,293 | | | (38,712,538 | ) | | 24,400,696 | |
| Net increase (decrease) in net assets | | (154,159,616 | ) | | 103,921,800 | | | (52,879,953 | ) | | 28,538,692 | |
| Net assets: | | | | | | | | | | | | |
| Beginning of year | | 658,529,304 | | | 554,607,504 | | | 218,769,194 | | | 190,230,502 | |
| End of year | $ | 504,369,688 | | $ | 658,529,304 | | $ | 165,889,241 | | $ | 218,769,194 | |
| Undistributed net investment income included in | | | | | | | | | | | | |
| net assets: | | | | | | | | | | | | |
| End of year | $ | 743,248 | | $ | 336,430 | | $ | 272,755 | | $ | 30,199 | |
Annual Report | The accompanying notes are an integral part of these financial statements. | 161
| | | | | | | | | | | | |
| Franklin Tax-Free Trust | | | | | | | | | | |
| |
| Financial Statements (continued) | | | | | | | | | | | | |
| |
| |
| Statements of Changes in Net Assets (continued) | | | | | | | | | | | | |
| |
| |
| | | Franklin Louisiana | | | Franklin Maryland | |
| | | Tax-Free Income Fund | | | Tax-Free Income Fund | |
| | | Year Ended February 28, | | | Year Ended February 28, | |
| | | 2014 | | | 2013 | | | 2014 | | | 2013 | |
| Increase (decrease) in net assets: | | | | | | | | | | | | |
| Operations: | | | | | | | | | | | | |
| Net investment income | $ | 17,108,186 | | $ | 17,606,766 | | $ | 22,410,546 | | $ | 24,401,025 | |
| Net realized gain (loss) from investments | | (11,779,811 | ) | | 379,063 | | | (12,419,592 | ) | | 1,744,132 | |
| Net change in unrealized appreciation (depreciation) | | | | | | | | | | | | |
| on investments | | (24,941,368 | ) | | 6,132,715 | | | (39,139,035 | ) | | 3,618,461 | |
| Net increase (decrease) in net assets resulting | | | | | | | | | | | | |
| from operations | | (19,612,993 | ) | | 24,118,544 | | | (29,148,081 | ) | | 29,763,618 | |
| Distributions to shareholders from: | | | | | | | | | | | | |
| Net investment income: | | | | | | | | | | | | |
| Class A | | (13,711,607 | ) | | (14,690,226 | ) | | (16,072,452 | ) | | (18,849,711 | ) |
| Class C | | (2,546,831 | ) | | (2,672,919 | ) | | (4,373,565 | ) | | (4,952,895 | ) |
| Advisor Class | | — | | | — | | | (1,048,780 | ) | | (952,083 | ) |
| Total distributions to shareholders | | (16,258,438 | ) | | (17,363,145 | ) | | (21,494,797 | ) | | (24,754,689 | ) |
| Capital share transactions: (Note 2) | | | | | | | | | | | | |
| Class A | | (81,677,834 | ) | | 43,644,249 | | | (95,352,529 | ) | | 26,648,813 | |
| Class C | | (27,399,586 | ) | | 21,024,677 | | | (34,962,476 | ) | | 20,507,243 | |
| Advisor Class | | — | | | — | | | (7,734,369 | ) | | 11,524,993 | |
| Total capital share transactions | | (109,077,420 | ) | | 64,668,926 | | | (138,049,374 | ) | | 58,681,049 | |
| Net increase (decrease) in net assets | | (144,948,851 | ) | | 71,424,325 | | | (188,692,252 | ) | | 63,689,978 | |
| Net assets: | | | | | | | | | | | | |
| Beginning of year | | 532,959,084 | | | 461,534,759 | | | 746,287,981 | | | 682,598,003 | |
| End of year | $ | 388,010,233 | | $ | 532,959,084 | | $ | 557,595,729 | | $ | 746,287,981 | |
| Undistributed net investment income included in | | | | | | | | | | | | |
| net assets: | | | | | | | | | | | | |
| End of year | $ | 963,080 | | $ | 113,332 | | $ | 1,119,111 | | $ | 236,884 | |
162 | The accompanying notes are an integral part of these financial statements. | Annual Report
| | | | | | | | | | | | |
| Franklin Tax-Free Trust | | | | | | | | | | |
| |
| Financial Statements (continued) | | | | | | | | | | | | |
| |
| |
| Statements of Changes in Net Assets (continued) | | | | | | | | | | | | |
| |
| |
| | | Franklin Missouri | | | Franklin North Carolina | |
| | | Tax-Free Income Fund | | | Tax-Free Income Fund | |
| | | Year Ended February 28, | | | Year Ended February 28, | |
| | | 2014 | | | 2013 | | | 2014 | | | 2013 | |
| Increase (decrease) in net assets: | | | | | | | | | | | | |
| Operations: | | | | | | | | | | | | |
| Net investment income | $ | 46,984,239 | | $ | 48,968,179 | | $ | 49,537,247 | | $ | 50,790,855 | |
| Net realized gain (loss) from investments | | (19,496,104 | ) | | 1,945,224 | | | (25,955,236 | ) | | 746,978 | |
| Net change in unrealized appreciation | | | | | | | | | | | | |
| (depreciation) on investments | | (86,557,670 | ) | | 14,945,910 | | | (99,611,991 | ) | | 18,325,575 | |
| Net increase (decrease) in net assets | | | | | | | | | | | | |
| resulting from operations | | (59,069,535 | ) | | 65,859,313 | | | (76,029,980 | ) | | 69,863,408 | |
| Distributions to shareholders from: | | | | | | | | | | | | |
| Net investment income: | | | | | | | | | | | | |
| Class A | | (37,129,029 | ) | | (39,448,934 | ) | | (35,876,622 | ) | | (38,749,861 | ) |
| Class C | | (5,990,295 | ) | | (5,950,810 | ) | | (8,399,064 | ) | | (8,932,000 | ) |
| Advisor Class | | (2,505,322 | ) | | (2,986,066 | ) | | (2,836,411 | ) | | (2,784,070 | ) |
| Total distributions to shareholders | | (45,624,646 | ) | | (48,385,810 | ) | | (47,112,097 | ) | | (50,465,931 | ) |
| Capital share transactions: (Note 2) | | | | | | | | | | | | |
| Class A | | (191,322,678 | ) | | 121,701,067 | | | (227,135,329 | ) | | 108,332,262 | |
| Class C | | (38,172,043 | ) | | 43,429,540 | | | (79,767,549 | ) | | 50,863,331 | |
| Advisor Class | | (39,887,579 | ) | | 20,950,270 | | | (19,137,364 | ) | | 25,329,034 | |
| Total capital share transactions | | (269,382,300 | ) | | 186,080,877 | | | (326,040,242 | ) | | 184,524,627 | |
| Net increase (decrease) in net assets | | (374,076,481 | ) | | 203,554,380 | | | (449,182,319 | ) | | 203,922,104 | |
| Net assets: | | | | | | | | | | | | |
| Beginning of year | | 1,472,844,290 | | | 1,269,289,910 | | | 1,593,267,166 | | | 1,389,345,062 | |
| End of year | $ | 1,098,767,809 | | $ | 1,472,844,290 | | $ | 1,144,084,847 | | $ | 1,593,267,166 | |
| Undistributed net investment income (distributions | | | | | | | | | | | | |
| in excess of net investment income) included in | | | | | | | | | | | | |
| net assets: | | | | | | | | | | | | |
| End of year | $ | 1,293,657 | | $ | (36,151 | ) | $ | 2,632,259 | | $ | 219,082 | |
Annual Report | The accompanying notes are an integral part of these financial statements. | 163
| | | | | | |
| Franklin Tax-Free Trust | | | | | | |
| |
| Financial Statements (continued) | | | | | | |
| |
| |
| Statements of Changes in Net Assets (continued) | | | | | | |
| |
| |
| | | Franklin Virginia | |
| | | Tax-Free Income Fund | |
| | | Year Ended February 28, | |
| | | 2014 | | | 2013 | |
| Increase (decrease) in net assets: | | | | | | |
| Operations: | | | | | | |
| Net investment income | $ | 30,757,169 | | $ | 32,687,550 | |
| Net realized gain (loss) from investments | | (18,266,509 | ) | | 569,737 | |
| Net change in unrealized appreciation (depreciation) on investments | | (51,484,253 | ) | | 10,771,713 | |
| Net increase (decrease) in net assets resulting from operations | | (38,993,593 | ) | | 44,029,000 | |
| Distributions to shareholders from: | | | | | | |
| Net investment income: | | | | | | |
| Class A | | (23,854,742 | ) | | (26,772,071 | ) |
| Class C | | (4,263,895 | ) | | (4,722,450 | ) |
| Advisor Class | | (1,428,618 | ) | | (1,341,622 | ) |
| Total distributions to shareholders | | (29,547,255 | ) | | (32,836,143 | ) |
| Capital share transactions: (Note 2) | | | | | | |
| Class A | | (162,656,488 | ) | | 64,677,797 | |
| Class C | | (41,230,250 | ) | | 26,784,807 | |
| Advisor Class | | (1,220,279 | ) | | 11,003,992 | |
| Total capital share transactions | | (205,107,017 | ) | | 102,466,596 | |
| Net increase (decrease) in net assets | | (273,647,865 | ) | | 113,659,453 | |
| Net assets: | | | | | | |
| Beginning of year | | 992,853,839 | | | 879,194,386 | |
| End of year | $ | 719,205,974 | | $ | 992,853,839 | |
| Undistributed net investment income (distributions in excess of net investment income) included | | | | | | |
| in net assets: | | | | | | |
| End of year | $ | 1,195,929 | | $ | (13,940 | ) |
164 | The accompanying notes are an integral part of these financial statements. | Annual Report
Franklin Tax-Free Trust
Notes to Financial Statements
1. ORGANIZATION AND SIGNIFICANT ACCOUNTING POLICIES
Franklin Tax-Free Trust (Trust) is registered under the Investment Company Act of 1940, as amended, (1940 Act) as an open-end investment company, consisting of twenty-four separate funds, nine of which are included in this report (Funds). The financial statements of the remaining funds in the Trust are presented separately. The classes of shares offered within each of the Funds are indicated below. Effective March 1, 2013, all Class B shares were converted to Class A. Each class of shares differs by its initial sales load, contingent deferred sales charges, voting rights on matters affecting a single class, its exchange privilege and fees primarily due to differing arrangements for distribution and transfer agent fees.
| |
| Class A | Class A & Class C |
| Franklin Kentucky Tax-Free Income Fund | Franklin Alabama Tax-Free Income Fund |
| | Franklin Florida Tax-Free Income Fund |
| | Franklin Georgia Tax-Free Income Fund |
| | Franklin Louisiana Tax-Free Income Fund |
| |
| Class A, Class C & Advisor Class | |
| Franklin Maryland Tax-Free Income Fund | |
| Franklin Missouri Tax-Free Income Fund | |
| Franklin North Carolina Tax-Free Income Fund | |
| Franklin Virginia Tax-Free Income Fund | |
The following summarizes the Funds’ significant accounting policies.
a. Financial Instrument Valuation
The Funds’ investments in financial instruments are carried at fair value daily. Fair value is the price that would be received to sell an asset or paid to transfer a liability in an orderly transaction between market participants on the measurement date. The Funds calculate the net asset value per share at the close of the New York Stock Exchange (NYSE), generally at 4p.m. Eastern time (NYSE close) on each day the NYSE is open for trading. Under procedures approved by the Trust’s Board of Trustees (the Board), the Funds’ administrator, investment manager and other affiliates have formed the Valuation and Liquidity Oversight Committee (VLOC). The VLOC provides administration and oversight of the Funds’ valuation policies and procedures, which are approved annually by the Board. Among other things, these procedures allow the Funds to utilize independent pricing services, quotations from securities and financial instrument dealers, and other market sources to determine fair value.
Debt securities generally trade in the over-the-counter market rather than on a securities exchange. The Funds’ pricing services use multiple valuation techniques to determine fair value. In instances where sufficient market activity exists, the pricing services may utilize a market-based approach through which quotes from market makers are used to determine fair value. In instances where sufficient market activity may not exist or is limited, the pricing services also utilize proprietary valuation models which may consider market characteristics such as benchmark yield curves,
Annual Report | 165
Franklin Tax-Free Trust
Notes to Financial Statements (continued)
| 1. | ORGANIZATION AND SIGNIFICANT ACCOUNTING POLICIES (continued) |
| a. | Financial Instrument Valuation (continued) |
credit spreads, estimated default rates, anticipated market interest rate volatility, coupon rates, anticipated timing of principal repayments, underlying collateral, and other unique security features in order to estimate the relevant cash flows, which are then discounted to calculate the fair value.
The Funds have procedures to determine the fair value of financial instruments for which market prices are not reliable or readily available. Under these procedures, the VLOC convenes on a regular basis to review such financial instruments and considers a number of factors, including significant unobservable valuation inputs, when arriving at fair value. The VLOC primarily employs a market-based approach which may use related or comparable assets or liabilities, recent transactions, market multiples, book values, and other relevant information for the investment to determine the fair value of the investment. An income-based valuation approach may also be used in which the anticipated future cash flows of the investment are discounted to calculate fair value. Discounts may also be applied due to the nature or duration of any restrictions on the disposition of the investments. Due to the inherent uncertainty of valuations of such investments, the fair values may differ significantly from the values that would have been used had an active market existed. The VLOC employs various methods for calibrating these valuation approaches including a regular review of key inputs and assumptions, transactional back-testing or disposition analysis, and reviews of any related market activity.
b. Securities Purchased on a Delayed Delivery Basis
Certain funds purchase securities on a delayed delivery basis, with payment and delivery scheduled for a future date. These transactions are subject to market fluctuations and are subject to the risk that the value at delivery may be more or less than the trade date purchase price. Although the funds will generally purchase these securities with the intention of holding the securities, they may sell the securities before the settlement date. Sufficient assets have been segregated for these securities.
c. Income Taxes
It is each fund’s policy to qualify as a regulated investment company under the Internal Revenue Code. Each fund intends to distribute to shareholders substantially all of its income and net realized gains to relieve it from federal income and excise taxes. As a result, no provision for U.S. federal income taxes is required.
Each fund recognizes the tax benefits of uncertain tax positions only when the position is “more likely than not” to be sustained upon examination by the tax authorities based on the technical merits of the tax position. As of February 28, 2014, and for all open tax years, each fund has determined that no liability for unrecognized tax benefits is required in each fund’s financial
166 | Annual Report
Franklin Tax-Free Trust
Notes to Financial Statements (continued)
| 1. | ORGANIZATION AND SIGNIFICANT ACCOUNTING POLICIES (continued) |
| c. | Income Taxes (continued) |
statements related to uncertain tax positions taken on a tax return (or expected to be taken on future tax returns). Open tax years are those that remain subject to examination and are based on each tax jurisdiction statute of limitation.
d. Security Transactions, Investment Income, Expenses and Distributions
Security transactions are accounted for on trade date. Realized gains and losses on security transactions are determined on a specific identification basis. Interest income and estimated expenses are accrued daily. Amortization of premium and accretion of discount on debt securities are included in interest income. Dividends from net investment income are normally declared daily; these dividends may be reinvested or paid monthly to shareholders. Distributions from realized capital gains and other distributions, if any, are recorded on the ex-dividend date. Distributions to shareholders are determined according to income tax regulations (tax basis). Distributable earnings determined on a tax basis may differ from earnings recorded in accordance with accounting principles generally accepted in the United States of America. These differences may be permanent or temporary. Permanent differences are reclassified among capital accounts to reflect their tax character. These reclassifications have no impact on net assets or the results of operations. Temporary differences are not reclassified, as they may reverse in subsequent periods.
Common expenses incurred by the Trust are allocated among the funds based on the ratio of net assets of each fund to the combined net assets of the Trust. Fund specific expenses are charged directly to the fund that incurred the expense.
Realized and unrealized gains and losses and net investment income, not including class specific expenses, are allocated daily to each class of shares based upon the relative proportion of net assets of each class. Differences in per share distributions, by class, are generally due to differences in class specific expenses.
e. Insurance
The scheduled payments of interest and principal for each insured municipal security in the Trust are insured by either a new issue insurance policy or a secondary insurance policy. Some municipal securities in the Funds are secured by collateral guaranteed by an agency of the U.S. government. Depending on the type of coverage, premiums for insurance are either added to the cost basis of the security or paid by a third party.
Insurance companies typically insure municipal bonds that tend to be of very high quality, with the majority of underlying municipal bonds rated A or better. However, an event involving an insurer could have an adverse effect on the value of the securities insured by that insurance company. There is no guarantee the insurer will be able to fulfill its obligations under the terms of the policy.
Annual Report | 167
Franklin Tax-Free Trust
Notes to Financial Statements (continued)
| 1. | ORGANIZATION AND SIGNIFICANT ACCOUNTING POLICIES (continued) |
| f. | Accounting Estimates |
The preparation of financial statements in accordance with accounting principles generally accepted in the United States of America requires management to make estimates and assumptions that affect the reported amounts of assets and liabilities at the date of the financial statements and the amounts of income and expenses during the reporting period. Actual results could differ from those estimates.
g. Guarantees and Indemnifications
Under the Trust’s organizational documents, its officers and trustees are indemnified by the Trust against certain liabilities arising out of the performance of their duties to the Trust. Additionally, in the normal course of business, the Trust, on behalf of the Funds, enters into contracts with service providers that contain general indemnification clauses. The Trust’s maximum exposure under these arrangements is unknown as this would involve future claims that may be made against the Trust that have not yet occurred. Currently, the Trust expects the risk of loss to be remote.
2. SHARES OF BENEFICIAL INTEREST
At February 28, 2014, there were an unlimited number of shares authorized (without par value).
Transactions in the Funds’ shares were as follows:
| | | | | | | | | | | |
| | Franklin Alabama | | Franklin Florida | |
| | Tax-Free Income Fund | | Tax-Free Income Fund | |
| | Shares | | | Amount | | Shares | | | | Amount | |
| Class A Shares: | | | | | | | | | | | |
| Year ended February 28, 2014 | | | | | | | | | | | |
| Shares sold | 1,482,199 | | $ | 16,838,639 | | 3,306,053 | | | $ | 37,118,374 | |
| Shares issued in reinvestment of | | | | | | | | | | | |
| distributions | 679,332 | | | 7,639,313 | | 2,356,189 | | | | 26,303,464 | |
| Shares redeemed | (5,329,566 | ) | | (59,788,179 | ) | (24,406,789 | ) | | | (271,509,429 | ) |
| Net increase (decrease) | (3,168,035 | ) | $ | (35,310,227 | ) | (18,744,547 | ) | $ | (208,087,591 | ) |
| Year ended February 28, 2013 | | | | | | | | | | | |
| Shares sold | 2,828,652 | | $ | 33,553,835 | | 7,823,203 | | | $ | 93,600,648 | |
| Shares issued in reinvestment of | | | | | | | | | | | |
| distributions | 673,613 | | | 7,994,003 | | 2,776,373 | | | | 33,182,971 | |
| Shares redeemed | (2,506,058 | ) | | (29,778,970 | ) | (11,107,794 | ) | | | (132,924,579 | ) |
| Net increase (decrease) | 996,207 | | $ | 11,768,868 | | (508,218 | ) | | $ | (6,140,960 | ) |
168 | Annual Report
| | | | | | | | | | | | |
| Franklin Tax-Free Trust | | | | | | | |
| |
| Notes to Financial Statements (continued) | | | | | | | | | | | |
| |
| |
| 2. SHARES OF BENEFICIAL INTEREST (continued) | | | | | | | | | | | |
| |
| | Franklin Alabama | | Franklin Florida | |
| | Tax-Free Income Fund | | Tax-Free Income Fund | |
| | Shares | | | | Amount | | Shares | | | | Amount | |
| Class B Shares: | | | | | | | | | | | | |
| Year ended February 28, 2014a | | | | | | | | | | | | |
| Shares redeemed | | | | | | | (18,259 | ) | $ | | (220,545 | ) |
| Year ended February 28, 2013 | | | | | | | | | | | | |
| Shares sold | | | | | | | 9,413 | | $ | | 113,837 | |
| Shares issued in reinvestment of | | | | | | | | | | | | |
| distributions | | | | | | | 5,752 | | | | 69,203 | |
| Shares redeemed | | | | | | | (348,976 | ) | | | (4,211,057 | ) |
| Net increase (decrease) | | | | | | | (333,811 | ) | $ | | (4,028,017 | ) |
| Class C Shares: | | | | | | | | | | | | |
| Year ended February 28, 2014 | | | | | | | | | | | | |
| Shares sold | 471,363 | | | $ | 5,463,376 | | 750,275 | | $ | | 8,660,027 | |
| Shares issued in reinvestment of | | | | | | | | | | | | |
| distributions | 120,181 | | | | 1,366,811 | | 278,539 | | | | 3,165,175 | |
| Shares redeemed | (1,631,621 | ) | | (18,388,435 | ) | (3,925,348 | ) | | | (44,414,375 | ) |
| Net increase (decrease) | (1,040,077 | ) | $ | (11,558,248 | ) | (2,896,534 | ) | $ | | (32,589,173 | ) |
| Year ended February 28, 2013 | | | | | | | | | | | | |
| Shares sold | 1,326,641 | | $ | 15,913,007 | | 2,357,200 | | $ | | 28,692,902 | |
| Shares issued in reinvestment of | | | | | | | | | | | | |
| distributions | 111,614 | | | | 1,339,069 | | 316,022 | | | | 3,841,789 | |
| Shares redeemed | (575,000 | ) | | | (6,892,356 | ) | (1,417,401 | ) | | | (17,267,287 | ) |
| Net increase (decrease) | 863,255 | | $ | 10,359,720 | | 1,255,821 | | $ | | 15,267,404 | |
| aEffective March 1, 2013, all Class B shares were converted to Class A. | | | | | | | | | | | |
| |
| | Franklin Georgia | | Franklin Kentucky | |
| | Tax-Free Income Fund | | Tax-Free Income Fund | |
| | Shares | | | | Amount | | Shares | | | | Amount | |
| Class A Shares: | | | | | | | | | | | | |
| Year ended February 28, 2014 | | | | | | | | | | | | |
| Shares sold | 5,453,725 | | | $ | 66,088,682 | | 1,503,180 | | | $ | 17,148,151 | |
| Shares issued in reinvestment of | | | | | | | | | | | | |
| distributions | 1,161,778 | | | | 14,007,558 | | 569,264 | | | | 6,378,705 | |
| Shares redeemed | (12,913,170 | ) | | | (154,554,265 | ) | (5,600,511 | ) | | | (62,239,394 | ) |
| Net increase (decrease) | (6,297,667 | ) | | $ | (74,458,025 | ) | (3,528,067 | ) | | $ | (38,712,538 | ) |
| Year ended February 28, 2013 | | | | | | | | | | | | |
| Shares sold | 8,526,507 | | $ | 108,495,130 | | 3,632,919 | | | $ | 42,879,716 | |
| Shares issued in reinvestment of | | | | | | | | | | | | |
| distributions | 1,066,519 | | | | 13,562,073 | | 536,022 | | | | 6,325,432 | |
| Shares redeemed | (4,737,286 | ) | | | (60,228,667 | ) | (2,098,607 | ) | | | (24,804,452 | ) |
| Net increase (decrease) | 4,855,740 | | | $ | 61,828,536 | | 2,070,334 | | | $ | 24,400,696 | |
Annual Report | 169
| | | | | | | | | | | | |
| Franklin Tax-Free Trust | | | | | | |
| |
| Notes to Financial Statements (continued) | | | | | | | | | |
| |
| |
| 2. SHARES OF BENEFICIAL INTEREST (continued) | | | | | | | | | | | |
| |
| | Franklin Georgia | | | | | | |
| | Tax-Free Income Fund | | | | | | |
| | Shares | | | | | Amount | | | | | | |
| Class C Shares: | | | | | | | | | | | | |
| Year ended February 28, 2014 | | | | | | | | | | | | |
| Shares sold | 1,244,186 | | | | $ | 15,501,916 | | | | | | |
| Shares issued in reinvestment of | | | | | | | | | | | | |
| distributions | 291,633 | | | | | 3,564,656 | | | | | | |
| Shares redeemed | (4,668,428) | | | (56,683,071 | ) | | | | | |
| Net increase (decrease) | (3,132,609) | | $ | (37,616,499 | ) | | | | | |
| Year ended February 28, 2013 | | | | | | | | | | | | |
| Shares sold | 3,117,612 | | | | $ | 40,132,810 | | | | | | |
| Shares issued in reinvestment of | | | | | | | | | | | | |
| distributions | 277,416 | | | | | 3,571,219 | | | | | | |
| Shares redeemed | (1,259,291) | | | (16,214,272 | ) | | | | | |
| Net increase (decrease) | 2,135,737 | | | | $ | 27,489,757 | | | | | | |
| |
| | Franklin Louisiana | | Franklin Maryland | |
| | Tax-Free Income Fund | | Tax-Free Income Fund | |
| | Shares | | | | | Amount | | Shares | | | Amount | |
| Class A Shares: | | | | | | | | | | | | |
| Year ended February 28, 2014 | | | | | | | | | | | | |
| Shares sold | 3,279,977 | | $ | | 37,623,531 | | 3,219,635 | | $ | 36,651,592 | |
| Shares issued in reinvestment of | | | | | | | | | | | | |
| distributions | 1,119,821 | | | | 12,703,730 | | 1,176,002 | | | 13,246,010 | |
| Shares redeemed | (11,730,537 | ) | | | (132,005,095 | ) | (12,962,978 | ) | | (145,250,131 | ) |
| Net increase (decrease) | (7,330,739 | ) | $ | | (81,677,834 | ) | (8,567,341 | ) | $ | (95,352,529 | ) |
| Year ended February 28, 2013 | | | | | | | | | | | | |
| Shares sold | 7,546,541 | | $ | | 90,543,306 | | 6,658,559 | | $ | 79,870,783 | |
| Shares issued in reinvestment of | | | | | | | | | | | | |
| distributions | 1,115,610 | | | | 13,382,003 | | 1,319,215 | | | 15,808,334 | |
| Shares redeemed | (5,030,280 | ) | | | (60,281,060 | ) | (5,760,002 | ) | | (69,030,304 | ) |
| Net increase (decrease) | 3,631,871 | | $ | | 43,644,249 | | 2,217,772 | | $ | 26,648,813 | |
| Class C Shares: | | | | | | | | | | | | |
| Year ended February 28, 2014 | | | | | | | | | | | | |
| Shares sold | 673,976 | | $ | | | 7,902,716 | | 906,466 | | $ | 10,543,615 | |
| Shares issued in reinvestment of | | | | | | | | | | | | |
| distributions | 204,595 | | | | | 2,353,474 | | 325,574 | | | 3,728,316 | |
| Shares redeemed | (3,296,251 | ) | | | (37,655,776 | ) | (4,336,546 | ) | | (49,234,407 | ) |
| Net increase (decrease) | (2,417,680 | ) | $ | | (27,399,586 | ) | (3,104,506 | ) | $ | (34,962,476 | ) |
| Year ended February 28, 2013 | | | | | | | | | | | | |
| Shares sold | 2,253,888 | | $ | | 27,402,094 | | 2,849,115 | | $ | 34,727,349 | |
| Shares issued in reinvestment of | | | | | | | | | | | | |
| distributions | 196,158 | | | | | 2,384,281 | | 347,248 | | | 4,229,074 | |
| Shares redeemed | (720,807 | ) | | | | (8,761,698 | ) | (1,514,123 | ) | | (18,449,180 | ) |
| Net increase (decrease) | 1,729,239 | | $ | | 21,024,677 | | 1,682,240 | | $ | 20,507,243 | |
170 | Annual Report
| | | | | | | | | | | | |
| Franklin Tax-Free Trust | | | | | | | |
| |
| Notes to Financial Statements (continued) | | | | | | | | |
| |
| |
| 2. SHARES OF BENEFICIAL INTEREST (continued) | | | | | | | | | | | |
| |
| | | | | | | | Franklin Maryland | |
| | | | | | | | Tax-Free Income Fund | |
| | | | | | | | Shares | | | | Amount | |
| Advisor Class Shares: | | | | | | | | | | | | |
| Year ended February 28, 2014 | | | | | | | | | | | | |
| Shares sold | | | | | | | 1,117,999 | | | $ | 12,895,251 | |
| Shares issued in reinvestment of distributions | | | | | | 45,533 | | | | 513,914 | |
| Shares redeemed | | | | | | | (1,913,019 | ) | | | (21,143,534 | ) |
| Net increase (decrease) | | | | | | | (749,487 | ) | | $ | (7,734,369 | ) |
| Year ended February 28, 2013 | | | | | | | | | | | | |
| Shares sold | | | | | | | 1,330,479 | | | $ | 15,947,149 | |
| Shares issued in reinvestment of distributions | | | | | | 34,003 | | | | 408,366 | |
| Shares redeemed | | | | | | | (402,833 | ) | | | (4,830,522 | ) |
| Net increase (decrease) | | | | | | | 961,649 | | | $ | 11,524,993 | |
| |
| | Franklin Missouri | | Franklin North Carolina | |
| | Tax-Free Income Fund | | Tax-Free Income Fund | |
| | Shares | | | | Amount | | Shares | | | | Amount | |
| Class A Shares: | | | | | | | | | | | | |
| Year ended February 28, 2014 | | | | | | | | | | | | |
| Shares sold | 7,003,327 | | | $ | 84,735,207 | | 6,925,642 | | | $ | 84,525,706 | |
| Shares issued in reinvestment of | | | | | | | | | | | | |
| distributions | 2,728,507 | | | | 32,737,442 | | 2,516,133 | | | | 30,472,186 | |
| Shares redeemed | (25,890,384 | ) | | | (308,795,327 | ) | (28,364,312 | ) | | | (342,133,221 | ) |
| Net increase (decrease) | (16,158,550 | ) | $ | (191,322,678 | ) | (18,922,537 | ) | $ | (227,135,329 | ) |
| Year ended February 28, 2013 | | | | | | | | | | | | |
| Shares sold | 17,026,414 | | | $ | 216,405,499 | | 16,576,786 | | | $ | 214,155,442 | |
| Shares issued in reinvestment of | | | | | | | | | | | | |
| distributions | 2,673,289 | | | | 34,004,155 | | 2,564,087 | | | | 33,112,517 | |
| Shares redeemed | (10,118,884 | ) | | | (128,708,587 | ) | (10,745,498 | ) | | | (138,935,697 | ) |
| Net increase (decrease) | 9,580,819 | | | $ | 121,701,067 | | 8,395,375 | | | $ | 108,332,262 | |
| Class C Shares: | | | | | | | | | | | | |
| Year ended February 28, 2014 | | | | | | | | | | | | |
| Shares sold | 2,001,437 | | | $ | 24,777,626 | | 1,780,825 | | | $ | 22,267,850 | |
| Shares issued in reinvestment of | | | | | | | | | | | | |
| distributions | 436,433 | | | | 5,279,296 | | 565,287 | | | | 6,939,932 | |
| Shares redeemed | (5,676,690 | ) | | | (68,228,965 | ) | (8,931,764 | ) | | | (108,975,331 | ) |
| Net increase (decrease) | (3,238,820 | ) | | $ | (38,172,043 | ) | (6,585,652 | ) | | $ | (79,767,549 | ) |
| Year ended February 28, 2013 | | | | | | | | | | | | |
| Shares sold | 4,668,771 | | | $ | 59,846,753 | | 6,222,978 | | | $ | 81,410,926 | |
| Shares issued in reinvestment of | | | | | | | | | | | | |
| distributions | 402,945 | | | | 5,168,218 | | 555,952 | | | | 7,274,940 | |
| Shares redeemed | (1,682,537 | ) | | | (21,585,431 | ) | (2,890,825 | ) | | | (37,822,535 | ) |
| Net increase (decrease) | 3,389,179 | | | $ | 43,429,540 | | 3,888,105 | | | $ | 50,863,331 | |
Annual Report | 171
| | | | | | | | | | | |
| Franklin Tax-Free Trust | | | | | | | |
| |
| Notes to Financial Statements (continued) | | | | | | | | |
| |
| |
| 2. SHARES OF BENEFICIAL INTEREST (continued) | | | | | | | | | | |
| |
| | Franklin Missouri | | Franklin North Carolina | |
| | Tax-Free Income Fund | | Tax-Free Income Fund | |
| | Shares | | | Amount | | Shares | | | | Amount | |
| Advisor Class Shares: | | | | | | | | | | | |
| Year ended February 28, 2014 | | | | | | | | | | | |
| Shares sold | 1,073,166 | | $ | 13,013,595 | | 2,633,684 | | | $ | 31,936,880 | |
| Shares issued in reinvestment of | | | | | | | | | | | |
| distributions | 123,868 | | | 1,495,437 | | 180,476 | | | | 2,186,581 | |
| Shares redeemed | (4,584,395 | ) | | (54,396,611 | ) | (4,445,864 | ) | | | (53,260,825 | ) |
| Net increase (decrease) | (3,387,361 | ) | $ | (39,887,579 | ) | (1,631,704 | ) | | $ | (19,137,364 | ) |
| Year ended February 28, 2013 | | | | | | | | | | | |
| Shares sold | 2,508,885 | | $ | 31,910,010 | | 2,883,237 | | | $ | 37,258,202 | |
| Shares issued in reinvestment of | | | | | | | | | | | |
| distributions | 155,160 | | | 1,975,410 | | 159,044 | | | | 2,055,142 | |
| Shares redeemed | (1,013,801 | ) | | (12,935,150 | ) | (1,079,064 | ) | | | (13,984,310 | ) |
| Net increase (decrease) | 1,650,244 | | $ | 20,950,270 | | 1,963,217 | | | $ | 25,329,034 | |
| |
| | | | | | | Franklin Virginia | |
| | | | | | | Tax-Free Income Fund | |
| | | | | | | Shares | | | | Amount | |
| Class A Shares: | | | | | | | | | | | |
| Year ended February 28, 2014 | | | | | | | | | | | |
| Shares sold | | | | | | 4,402,667 | | | $ | 51,348,448 | |
| Shares issued in reinvestment of distributions | | | | | 1,758,488 | | | | 20,249,632 | |
| Shares redeemed | | | | | | (20,475,079 | ) | | | (234,254,568 | ) |
| Net increase (decrease) | | | | | | (14,313,924 | ) | $ | (162,656,488 | ) |
| Year ended February 28, 2013 | | | | | | | | | | | |
| Shares sold | | | | | | 10,167,337 | | $ | 124,228,580 | |
| Shares issued in reinvestment of distributions | | | | | 1,889,654 | | | | 23,083,370 | |
| Shares redeemed | | | | | | (6,764,788 | ) | | | (82,634,153 | ) |
| Net increase (decrease) | | | | | | 5,292,203 | | | $ | 64,677,797 | |
| Class C Shares: | | | | | | | | | | | |
| Year ended February 28, 2014 | | | | | | | | | | | |
| Shares sold | | | | | | 1,128,097 | | | $ | 13,264,571 | |
| Shares issued in reinvestment of distributions | | | | | 317,903 | | | | 3,712,682 | |
| Shares redeemed | | | | | | (5,017,378 | ) | | | (58,207,503 | ) |
| Net increase (decrease) | | | | | | (3,571,378 | ) | | $ | (41,230,250 | ) |
| Year ended February 28, 2013 | | | | | | | | | | | |
| Shares sold | | | | | | 3,323,187 | | | $ | 41,155,790 | |
| Shares issued in reinvestment of distributions | | | | | 338,905 | | | | 4,196,243 | |
| Shares redeemed | | | | | | (1,497,651 | ) | | | (18,567,226 | ) |
| Net increase (decrease) | | | | | | 2,164,441 | | | $ | 26,784,807 | |
172 | Annual Report
| | | | | |
| Franklin Tax-Free Trust | | | | | |
| |
| Notes to Financial Statements (continued) | | | | | |
| |
| |
| 2. SHARES OF BENEFICIAL INTEREST (continued) | | | | | |
| |
| | Franklin Virginia | |
| | Tax-Free Income Fund | |
| | Shares | | | Amount | |
| Advisor Class Shares: | | | | | |
| Year ended February 28, 2014 | | | | | |
| Shares sold | 1,785,416 | | $ | 20,244,533 | |
| Shares issued in reinvestment of distributions | 94,571 | | | 1,086,930 | |
| Shares redeemed | (1,982,918 | ) | | (22,551,742 | ) |
| Net increase (decrease) | (102,931 | ) | $ | (1,220,279 | ) |
| Year ended February 28, 2013 | | | | | |
| Shares sold | 1,298,876 | | $ | 15,865,866 | |
| Shares issued in reinvestment of distributions | 79,523 | | | 972,119 | |
| Shares redeemed | (476,273 | ) | | (5,833,993 | ) |
| Net increase (decrease) | 902,126 | | $ | 11,003,992 | |
3. TRANSACTIONS WITH AFFILIATES
Franklin Resources, Inc. is the holding company for various subsidiaries that together are referred to as Franklin Templeton Investments. Certain officers and trustees of the Trust are also officers and/or directors of the following subsidiaries:
| |
| Subsidiary | Affiliation |
| Franklin Advisers, Inc. (Advisers) | Investment manager |
| Franklin Templeton Services, LLC (FT Services) | Administrative manager |
| Franklin Templeton Distributors, Inc. (Distributors) | Principal underwriter |
| Franklin Templeton Investor Services, LLC (Investor Services) | Transfer agent |
a. Management Fees
The Funds pay an investment management fee to Advisers based on the month-end net assets of each of the Funds as follows:
| | |
| Annualized Fee Rate | | Net Assets |
| 0.625 | % | Up to and including $100 million |
| 0.500 | % | Over $100 million, up to and including $250 million |
| 0.450 | % | Over $250 million, up to and including $7.5 billion |
| 0.440 | % | Over $7.5 billion, up to and including $10 billion |
| 0.430 | % | Over $10 billion, up to and including $12.5 billion |
| 0.420 | % | Over $12.5 billion, up to and including $15 billion |
| 0.400 | % | Over $15 billion, up to and including $17.5 billion |
| 0.380 | % | Over $17.5 billion, up to and including $20 billion |
| 0.360 | % | In excess of $20 billion |
Annual Report | 173
Franklin Tax-Free Trust
Notes to Financial Statements (continued)
| 3. | TRANSACTIONS WITH AFFILIATES (continued) |
| b. | Administrative Fees |
Under an agreement with Advisers, FT Services provides administrative services to the Funds. The fee is paid by Advisers based on the Funds’ average daily net assets, and is not an additional expense of the Funds.
c. Distribution Fees
The Board has adopted distribution plans for each share class, with the exception of Advisor Class shares, pursuant to Rule 12b-1 under the 1940 Act. Distribution fees are not charged on shares held by affiliates. Under the Funds’ Class A reimbursement distribution plans, the Funds reimburse Distributors for costs incurred in connection with the servicing, sale and distribution of the Funds’ shares up to the maximum annual plan rate for each class. Under the Class A reimbursement distribution plans, costs exceeding the maximum for the current plan year cannot be reimbursed in subsequent periods. In addition, under the Funds’ Class C compensation distribution plans, the Funds pay Distributors for costs incurred in connection with the servicing, sale and distribution of each fund’s shares up to the maximum annual plan rate. The plan year, for purposes of monitoring compliance with the maximum annual plan rates, is February 1 through January 31 for each fund.
The maximum annual plan rates, based on the average daily net assets, for each class, are as follows:
| | | | | | | | | | |
| | | | Franklin | | Franklin | | Franklin | | Franklin | |
| | | | Alabama | | Florida | | Georgia | | Kentucky | |
| | | | Tax-Free | | Tax-Free | | Tax-Free | | Tax-Free | |
| | | | Income Fund | | Income Fund | | Income Fund | | Income Fund | |
| Reimbursement Plans: | | | | | | | | | | |
| Class A | | | 0.10 | % | 0.10 | % | 0.10 | % | 0.10 | % |
| Compensation Plans: | | | | | | | | | | |
| Class C | | | 0.65 | % | 0.65 | % | 0.65 | % | — | |
| |
| | Franklin | | Franklin | | Franklin | | Franklin | | Franklin | |
| | Louisiana | | Maryland | | Missouri | | North Carolina | | Virginia | |
| | Tax-Free | | Tax-Free | | Tax-Free | | Tax-Free | | Tax-Free | |
| | Income Fund | | Income Fund | | Income Fund | | Income Fund | | Income Fund | |
| Reimbursement Plans: | | | | | | | | | | |
| Class A | 0.10 | % | 0.10 | % | 0.10 | % | 0.10 | % | 0.10 | % |
| Compensation Plans: | | | | | | | | | | |
| Class C | 0.65 | % | 0.65 | % | 0.65 | % | 0.65 | % | 0.65 | % |
174 | Annual Report
Franklin Tax-Free Trust
Notes to Financial Statements (continued)
| 3. | TRANSACTIONS WITH AFFILIATES (continued) |
| d. | Sales Charges/Underwriting Agreements |
Front-end sales charges and contingent deferred sales charges (CDSC) do not represent expenses of the Funds. These charges are deducted from the proceeds of sales of fund shares prior to investment or from redemption proceeds prior to remittance, as applicable. Distributors has advised the Funds of the following commission transactions related to the sales and redemptions of the Funds’ shares for the year:
| | | | | | |
| | | Franklin | | Franklin | | Franklin |
| | | Alabama | | Florida | | Georgia |
| | | Tax-Free | | Tax-Free | | Tax-Free |
| | | Income Fund | | Income Fund | | Income Fund |
| Sales charges retained net of commissions paid to | | | | | | |
| unaffiliated broker/dealers | $ | 45,235 | $ | 74,618 | $ | 91,035 |
| CDSC retained | $ | 31,581 | $ | 37,677 | $ | 31,478 |
| |
| | | Franklin | | Franklin | | Franklin |
| | | Kentucky | | Louisiana | | Maryland |
| | | Tax-Free | | Tax-Free | | Tax-Free |
| | | Income Fund | | Income Fund | | Income Fund |
| Sales charges retained net of commissions paid to | | | | | | |
| unaffiliated broker/dealers | $ | 44,075 | $ | 91,281 | $ | 67,217 |
| CDSC retained | $ | 3,064 | $ | 35,020 | $ | 37,415 |
| |
| | | Franklin | | Franklin | | Franklin |
| | | Missouri | | North Carolina | | Virginia |
| | | Tax-Free | | Tax-Free | | Tax-Free |
| | | Income Fund | | Income Fund | | Income Fund |
| Sales charges retained net of commissions paid to | | | | | | |
| unaffiliated broker/dealers | $ | 234,808 | $ | 167,602 | $ | 106,067 |
| CDSC retained | $ | 64,304 | $ | 62,102 | $ | 35,968 |
e. Transfer Agent Fees
Each class of shares pays transfer agent fees to Investor Services for its performance of shareholder servicing obligations and reimburses Investor Services for out of pocket expenses incurred, including shareholding servicing fees paid to third parties. These fees are allocated daily based upon their relative proportion of such classes’ aggregate net assets.
Annual Report | 175
Franklin Tax-Free Trust
Notes to Financial Statements (continued)
| 3. | TRANSACTIONS WITH AFFILIATES (continued) |
| e. | Transfer Agent Fees (continued) |
For the year ended February 28, 2014, the Funds paid transfer agent fees as noted in the Statements of Operations of which the following amounts were retained by Investor Services:
| | | | | | |
| | | Franklin | | Franklin | | Franklin |
| | | Alabama | | Florida | | Georgia |
| | | Tax-Free | | Tax-Free | | Tax-Free |
| | | Income Fund | | Income Fund | | Income Fund |
| Transfer agent fees | $ | 44,092 | $ | 144,718 | $ | 89,087 |
| |
| | | Franklin | | Franklin | | Franklin |
| | | Kentucky | | Louisiana | | Maryland |
| | | Tax-Free | | Tax-Free | | Tax-Free |
| | | Income Fund | | Income Fund | | Income Fund |
| Transfer agent fees | $ | 28,639 | $ | 60,284 | $ | 109,541 |
| |
| | | Franklin | | Franklin | | Franklin |
| | | Missouri | | North Carolina | | Virginia |
| | | Tax-Free | | Tax-Free | | Tax-Free |
| | | Income Fund | | Income Fund | | Income Fund |
| Transfer agent fees | $ | 197,485 | $ | 188,456 | $ | 150,111 |
4. INCOME TAXES
For tax purposes, capital losses may be carried over to offset future capital gains. Capital loss carryforwards with no expiration, if any, must be fully utilized before those losses with expiration dates.
At February 28, 2014, the capital loss carryforwards were as follows:
| | | | | | |
| | | Franklin | | Franklin | | Franklin |
| | | Alabama | | Florida | | Georgia |
| | | Tax-Free | | Tax-Free | | Tax-Free |
| | | Income Fund | | Income Fund | | Income Fund |
| Capital loss carryforwards subject to expiration: | | | | | | |
| 2015 | $ | — | $ | — | $ | 125,659 |
| 2016 | | — | | — | | 414,407 |
| 2017 | | — | | — | | 2,923,290 |
| Capital loss carryforwards not subject to expiration: | | | | | | |
| Short term | | 1,159,119 | | 9,506,356 | | 2,551,572 |
| Long term | | 1,900,517 | | 10,002,410 | | 3,059,993 |
| Total capital loss carryforwards | $ | 3,059,636 | $ | 19,508,766 | $ | 9,074,921 |
176 | Annual Report
| | | | | | |
| Franklin Tax-Free Trust | | | | |
| |
| Notes to Financial Statements (continued) | | | | | | |
| |
| |
| 4. INCOME TAXES (continued) | | | | | | |
| |
| | | Franklin | | Franklin | | Franklin |
| | | Kentucky | | Louisiana | | Maryland |
| | | Tax-Free | | Tax-Free | | Tax-Free |
| | | Income Fund | | Income Fund | | Income Fund |
| Capital loss carryforwards subject to expiration: | | | | | | |
| 2016 | $ | 107,105 | $ | — | $ | — |
| 2017 | | 417,325 | | 42,728 | | 1,038,820 |
| 2018 | | — | | 782,096 | | 205,848 |
| Capital loss carryforwards not subject to expiration: | | | | | | |
| Short term | | 1,844,166 | | 8,918,092 | | 8,160,169 |
| Long term | | 1,093,629 | | 4,074,752 | | 5,598,351 |
| Total capital loss carryforwards | $ | 3,462,225 | $ | 13,817,668 | $ | 15,003,188 |
| |
| | | Franklin | | Franklin | | Franklin |
| | | Missouri | | North Carolina | | Virginia |
| | | Tax-Free | | Tax-Free | | Tax-Free |
| | | Income Fund | | Income Fund | | Income Fund |
| Capital loss carryforwards subject to expiration: | | | | | | |
| 2016 | $ | 384,082 | $ | — | $ | — |
| 2018 | | 760,455 | | 16,085 | | 1,530,757 |
| 2019 | | 835 | | — | | — |
| Capital loss carryforwards not subject to expiration: | | | | | | |
| Short term | | 7,301,123 | | 21,581,256 | | 12,539,339 |
| Long term | | 11,788,704 | | 7,005,441 | | 7,649,313 |
| Total capital loss carryforwards | $ | 20,235,199 | $ | 28,602,782 | $ | 21,719,409 |
On February 28, 2014, the Franklin Georgia Tax-Free Income Fund and Franklin Kentucky Tax-Free Income Fund had expired capital loss carryforwards of $51,012 and $65,408, respectively, which were reclassified to paid-in capital.
The tax character of distributions paid during the years ended February 28, 2014 and 2013, was as follows:
| | | | | | | | |
| | | Franklin Alabama | | Franklin Florida |
| | | Tax-Free Income Fund | | Tax-Free Income Fund |
| | | 2014 | | 2013 | | 2014 | | 2013 |
| Distributions paid from: | | | | | | | | |
| Tax exempt income | $ | 10,816,183 | $ | 11,443,182 | $ | 37,080,732 | $ | 44,164,243 |
| Ordinary income | | — | | 74,444 | | — | | — |
| Long term capital gain | | 22,172 | | 224,815 | | 2,449,951 | | 5,522,437 |
| | $ | 10,838,355 | $ | 11,742,441 | $ | 39,530,683 | $ | 49,686,680 |
Annual Report | 177
| | | | | | | | |
| Franklin Tax-Free Trust | | | | |
| |
| Notes to Financial Statements (continued) | | | | | | |
| |
| 4. INCOME TAXES (continued) | | | | | | | | |
| |
| | | Franklin Georgia | | Franklin Kentucky |
| | | Tax-Free Income Fund | | Tax-Free Income Fund |
| | | 2014 | | 2013 | | 2014 | | 2013 |
| Distributions paid from tax exempt | | | | | | | | |
| income | $ | 20,741,491 | $ | 20,318,693 | $ | 7,118,111 | $ | 7,498,666 |
| |
| | | Franklin Louisiana | | Franklin Maryland |
| | | Tax-Free Income Fund | | Tax-Free Income Fund |
| | | 2014 | | 2013 | | 2014 | | 2013 |
| Distributions paid from tax exempt | | | | | | | | |
| income | $ | 16,258,438 | $ | 17,363,145 | $ | 21,494,797 | $ | 24,754,689 |
| |
| | | Franklin Missouri | | Franklin North Carolina |
| | | Tax-Free Income Fund | | Tax-Free Income Fund |
| | | 2014 | | 2013 | | 2014 | | 2013 |
| Distributions paid from tax exempt | | | | | | | | |
| income | $ | 45,624,646 | $ | 48,385,810 | $ | 47,112,097 | $ | 50,465,931 |
| | | | |
| | | Franklin Virginia |
| | | Tax-Free Income Fund |
| | | 2014 | | 2013 |
| Distributions paid from tax exempt | | | | |
| income | $ | 29,547,255 | $ | 32,836,143 |
At February 28, 2014, the cost of investments, net unrealized appreciation (depreciation) and undistributed tax exempt income for income tax purposes were as follows:
| | | | | | | | | |
| | | Franklin | | | Franklin | | | Franklin | |
| | | Alabama | | | Florida | | | Georgia | |
| | | Tax-Free | | | Tax-Free | | | Tax-Free | |
| | | Income Fund | | | Income Fund | | | Income Fund | |
| Cost of investments | $ | 263,705,075 | | $ | 803,632,739 | | $ | 486,757,246 | |
| |
| Unrealized appreciation | $ | 9,096,604 | | $ | 45,720,018 | | $ | 24,614,110 | |
| Unrealized depreciation | | (6,553,445 | ) | | (32,243,353 | ) | | (11,639,812 | ) |
| Net unrealized appreciation (depreciation) | $ | 2,543,159 | | $ | 13,476,665 | | $ | 12,974,298 | |
| |
| Distributable earnings – undistributed tax exempt | | | | | | | | | |
| income | $ | 479,310 | | $ | 3,429,679 | | $ | 843,701 | |
178 | Annual Report
| | | | | | | | | | |
| Franklin Tax-Free Trust | | | | | | | |
| |
| Notes to Financial Statements (continued) | | | | | | | |
| |
| |
| 4. INCOME TAXES (continued) | | | | | | | | | | |
| |
| | | | Franklin | | | Franklin | | | Franklin | |
| | | | Kentucky | | | Louisiana | | | Maryland | |
| | | | Tax-Free | | | Tax-Free | | | Tax-Free | |
| | | | Income Fund | | | Income Fund | | | Income Fund | |
| Cost of investments | | $ | 159,913,442 | | $ | 371,049,819 | | $ | 543,951,091 | |
| |
| Unrealized appreciation | | $ | 7,269,447 | | $ | 18,289,088 | | $ | 15,771,967 | |
| Unrealized depreciation | | | (4,244,980 | ) | | (9,190,996 | ) | | (16,449,420 | ) |
| Net unrealized appreciation (depreciation) | | $ | 3,024,467 | | $ | 9,098,092 | | $ | (677,453 | ) |
| |
| Distributable earnings – undistributed tax exempt | | | | | | | | | | |
| income | | $ | 324,792 | | $ | 1,022,820 | | $ | 1,377,362 | |
| |
| | | | Franklin | | | Franklin | | | Franklin | |
| | | | Missouri | | | North Carolina | | | Virginia | |
| | | | Tax-Free | | | Tax-Free | | | Tax-Free | |
| | | | Income Fund | | | Income Fund | | | Income Fund | |
| Cost of investments | $ | 1,073,275,018 | | $ | 1,119,086,415 | | $ | 702,125,494 | |
| |
| Unrealized appreciation | | $ | 40,153,252 | | $ | 43,725,380 | | $ | 28,475,789 | |
| Unrealized depreciation | | | (36,338,103 | ) | | (36,272,786 | ) | | (17,599,113 | ) |
| Net unrealized appreciation (depreciation) | | $ | 3,815,149 | | $ | 7,452,594 | | $ | 10,876,676 | |
| |
| Distributable earnings – undistributed tax exempt | | | | | | | | | | |
| income | | $ | 1,596,898 | | $ | 3,073,575 | | $ | 1,490,428 | |
Differences between income and/or capital gains as determined on a book basis and a tax basis are primarily due to differing treatments of bond discounts and wash sales.
5. INVESTMENT TRANSACTIONS
Purchases and sales of investments (excluding short term securities) for the year ended February 28, 2014, were as follows:
| | | | | | |
| | | Franklin | | Franklin | | Franklin |
| | | Alabama | | Florida | | Georgia |
| | | Tax-Free | | Tax-Free | | Tax-Free |
| | | Income Fund | | Income Fund | | Income Fund |
| Purchases | $ | 41,701,249 | $ | 69,083,048 | $ | 33,011,376 |
| Sales | $ | 76,215,477 | $ | 244,608,637 | $ | 123,622,300 |
| |
| | | Franklin | | Franklin | | Franklin |
| | | Kentucky | | Louisiana | | Maryland |
| | | Tax-Free | | Tax-Free | | Tax-Free |
| | | Income Fund | | Income Fund | | Income Fund |
| Purchases | $ | 19,821,697 | $ | 75,260,435 | $ | 76,862,862 |
| Sales | $ | 50,197,944 | $ | 186,284,114 | $ | 225,766,506 |
Annual Report | 179
| | | | | | |
| Franklin Tax-Free Trust | | | | |
| |
| Notes to Financial Statements (continued) | | | | | | |
| |
| |
| 5. INVESTMENT TRANSACTIONS (continued) | | | | | | |
| |
| | | Franklin | | Franklin | | Franklin |
| | | Missouri | | North Carolina | | Virginia |
| | | Tax-Free | | Tax-Free | | Tax-Free |
| | | Income Fund | | Income Fund | | Income Fund |
| Purchases | $ | 130,393,383 | $ | 90,394,211 | $ | 96,489,056 |
| Sales | $ | 354,748,632 | $ | 365,435,132 | $ | 299,505,707 |
6. CONCENTRATION OF RISK
Each of the Funds invests a large percentage of its total assets in obligations of issuers within its respective state, U.S. territories, and the District of Columbia. Such concentration may subject the Funds to risks associated with industrial or regional matters, and economic, political or legal developments occurring within those states, U.S. territories and the District of Columbia. In addition, investments in these securities are sensitive to interest rate changes and credit risk of the issuer and may subject the funds to increased market volatility. The market for these investments may be limited, which may make them difficult to buy or sell.
7. CREDIT FACILITY
The Funds, together with other U.S. registered and foreign investment funds (collectively, Borrowers), managed by Franklin Templeton Investments, are borrowers in a joint syndicated senior unsecured credit facility totaling $1.5 billion (Global Credit Facility) which matures on February 13, 2015. This Global Credit Facility provides a source of funds to the Borrowers for temporary and emergency purposes, including the ability to meet future unanticipated or unusually large redemption requests.
Under the terms of the Global Credit Facility, the Funds shall, in addition to interest charged on any borrowings made by the Funds and other costs incurred by the Funds, pay their share of fees and expenses incurred in connection with the implementation and maintenance of the Global Credit Facility, based upon their relative share of the aggregate net assets of all of the Borrowers, including an annual commitment fee of 0.07% based upon the unused portion of the Global Credit Facility. These fees are reflected in other expenses on the Statements of Operations. During the year ended February 28, 2014, the Funds did not use the Global Credit Facility.
180 | Annual Report
Franklin Tax-Free Trust
Notes to Financial Statements (continued)
8. FAIR VALUE MEASUREMENTS
The Funds follow a fair value hierarchy that distinguishes between market data obtained from independent sources (observable inputs) and the Funds’ own market assumptions (unobservable inputs). These inputs are used in determining the value of the Funds’ financial instruments and are summarized in the following fair value hierarchy:
- Level 1 – quoted prices in active markets for identical financial instruments
- Level 2 – other significant observable inputs (including quoted prices for similar financial instruments, interest rates, prepayment speed, credit risk, etc.)
- Level 3 – significant unobservable inputs (including the Funds’ own assumptions in determining the fair value of financial instruments)
The input levels are not necessarily an indication of the risk or liquidity associated with financial instruments at that level.
For movements between the levels within the fair value hierarchy, the Funds have adopted a policy of recognizing the transfers as of the date of the underlying event which caused the movement.
At February 28, 2014, all of the Funds’ investments in financial instruments carried at fair value were valued using Level 2 inputs.
9. NEW ACCOUNTING PRONOUNCEMENTS
In June 2013, the Financial Accounting Standards Board issued Accounting Standards Update (ASU) No. 2013-08, Investment Companies (Topic 946): Amendments to the Scope, Measurement, and Disclosure Requirements. The ASU modifies the criteria used in defining an investment company under U.S. Generally Accepted Accounting Principles and also sets forth certain measurement and disclosure requirements. Under the ASU, an entity that is registered under the 1940 Act automatically qualifies as an investment company. The ASU is effective for interim and annual reporting periods beginning after December 15, 2013. Management has reviewed the requirements and believes the adoption of this ASU will not have a material impact on the financial statements.
10. SUBSEQUENT EVENTS
The Funds have evaluated subsequent events through the issuance of the financial statements and determined that no events have occurred that require disclosure.
Annual Report | 181
Franklin Tax-Free Trust
Notes to Financial Statements (continued)
| | | |
| ABBREVIATIONS | | |
| |
| |
| Selected Portfolio | | |
| |
| ACES | - Adjustable Convertible Exempt Security | HDA | -HousingDevelopment Authority/Agency |
| AGMC | - Assured Guaranty Municipal Corp. | HFA | -HousingFinance Authority/Agency |
| AMBAC | - American Municipal Bond Assurance Corp. | HFAR | -HousingFinance Authority Revenue |
| BAN | -BondAnticipation Note | IDA | -IndustrialDevelopment Authority/Agency |
| BHAC | - Berkshire Hathaway Assurance Corp. | IDAR | -IndustrialDevelopment Authority Revenue |
| CDA | - Community Development Authority/Agency | IDB | -IndustrialDevelopment Bond/Board |
| CDD | - Community Development District | IDBR | -IndustrialDevelopment Board Revenue |
| CDR | - Community Development Revenue | MBS | - Mortgage-Backed Security |
| CIFG | - CDC IXIS Financial Guaranty | MFHR | -Multi-FamilyHousing Revenue |
| COP | - Certificate of Participation | MFMR | -Multi-FamilyMortgage Revenue |
| CRDA | - Community Redevelopment Authority/Agency | MFR | -Multi-FamilyRevenue |
| EDA | - Economic Development Authority | NATL | - National Public Financial Guarantee Corp. |
| EDC | - Economic Development Corp. | NATL RE | - National Public Financial Guarantee Corp. Reinsured |
| EDR | - Economic Development Revenue | PBA | -PublicBuilding Authority |
| ETM | - Escrow to Maturity | PCFA | - Pollution Control Financing Authority |
| FGIC | -FinancialGuaranty Insurance Co. | PCR | - Pollution Control Revenue |
| FHA | - Federal Housing Authority/Agency | PFAR | -PublicFinancing Authority Revenue |
| FICO | -FinancingCorp. | RAN | - Revenue Anticipation Note |
| FSA | -FinancialSecurity Assurance Inc. | SFM | -SingleFamily Mortgage |
| GARB | -GeneralAirport Revenue Bond | SFMR | -SingleFamily Mortgage Revenue |
| GNMA | - Government National Mortgage Association | XLCA | - XL Capital Assurance |
| GO | -GeneralObligation | | |
182 | Annual Report
Franklin Tax-Free Trust
Report of Independent Registered Public Accounting Firm
To the Board of Trustees and Shareholders of Franklin Tax-Free Trust
In our opinion, the accompanying statements of assets and liabilities, including the statements of investments, and the related statements of operations and of changes in net assets and the financial highlights present fairly, in all material respects, the financial position of Franklin Alabama Tax-Free Income Fund, Franklin Florida Tax-Free Income Fund, Franklin Georgia Tax-Free Income Fund, Franklin Kentucky Tax-Free Income Fund, Franklin Louisiana Tax-Free Income Fund, Franklin Maryland Tax-Free Income Fund, Franklin Missouri Tax-Free Income Fund, Franklin North Carolina Tax-Free Income Fund and Franklin Virginia Tax-Free Income Fund (separate portfolios of Franklin Tax-Free Trust, hereafter referred to as the “Funds”) at February 28, 2014, the results of each of their operations for the year then ended, the changes in each of their net assets for each of the two years in the period then ended and the financial highlights for each of the periods presented, in conformity with accounting principles generally accepted in the United States of America. These financial statements and financial highlights (hereafter referred to as “financial statements”) are the responsibility of the Funds’ management. Our responsibility is to express an opinion on these financial statements based on our audits. We conducted our audits of these financial statements in accordance with the standards of the Public Company Accounting Oversight Board (United States). Those standards require that we plan and perform the audit to obtain reasonable assurance about whether the financial statements are free of material misstatement. An audit includes examining, on a test basis, evidence supporting the amounts and disclosures in the financial statements, assessing the accounting principles used and significant estimates made by management, and evaluating the overall financial statement presentation. We believe that our audits, which included confirmation of securities at February 28, 2014 by correspondence with the custodian and brokers, provide a reasonable basis for our opinion.
PricewaterhouseCoopers LLP
San Francisco, California
April 17, 2014
Annual Report | 183
Franklin Tax-Free Trust
Tax Information (unaudited)
Under Section 852(b)(5)(A) of the Internal Revenue Code (Code), the Funds hereby report 100% of the distributions paid from net investment income as exempt-interest dividends for the fiscal year ended February 28, 2014. A portion of the Funds’ exempt-interest dividends may be subject to the federal alternative minimum tax. By mid-February 2015, shareholders will be notified of amounts for use in preparing their 2014 income tax returns.
Under Section 852(b)(3)(C) of the Code, the funds hereby report the maximum amount allowable but no less than the following amounts as long term capital gain dividends for the fiscal year ended February 28, 2014:
| | | |
| | Franklin | | Franklin |
| | Alabama | | Florida |
| | Tax-Free | | Tax-Free |
| | Income Fund | | Income Fund |
| $ | 22,172 | $ | 2,449,951 |
184 | Annual Report
Franklin Tax-Free Trust
Board Members and Officers
The name, year of birth and address of the officers and board members, as well as their affiliations, positions held with the Trust, principal occupations during at least the past five years and number of portfolios overseen in the Franklin Templeton Investments fund complex are shown below. Generally, each board member serves until that person’s successor is elected and qualified.
| | | | |
| Independent Board Members | | | |
| |
| | | | Number of Portfolios in | |
| Name, Year of Birth | | Length of | Fund Complex Overseen | Other Directorships Held |
| and Address | Position | Time Served | by Board Member* | During at Least the Past 5 Years |
| Harris J. Ashton (1932) | Trustee | Since 1984 | 140 | Bar-S Foods (meat packing company) |
| One Franklin Parkway | | | | (1981-2010). |
Principal Occupation During at Least the Past 5 Years:
Director of various companies; and formerly, Director, RBC Holdings, Inc. (bank holding company) (until 2002); and President, Chief Executive Officer and Chairman of the Board, General Host Corporation (nursery and craft centers) (until 1998).
| | | | |
| Sam Ginn (1937) | Trustee | Since 2007 | 113 | ICO Global Communications |
| One Franklin Parkway | | | | (Holdings) Limited (satellite company) |
| San Mateo, CA 94403-1906 | | | | (2006-2010), Chevron Corporation |
| | | | | (global energy company) (1989-2009), |
| | | | | Hewlett-Packard Company (technology |
| | | | | company) (1996-2002), Safeway, Inc. |
| | | | | (grocery retailer) (1991-1998) and |
| | | | | TransAmerica Corporation (insurance |
| | | | | company) (1989-1999). |
Principal Occupation During at Least the Past 5 Years:
Private investor; Chairman, First Responder Network Authority (FirstNet) (interoperable wireless broadband network) (2012); and formerly, Chairman of the Board, Vodafone AirTouch, PLC (wireless company) (1999-2000); Chairman of the Board and Chief Executive Officer, AirTouch Communications (cellular communications) (1993-1998) and Pacific Telesis Group (telephone holding company) (1988-1994).
| | | | |
| Edith E. Holiday (1952) | Trustee | Since 1998 | 140 | Hess Corporation (exploration and |
| One Franklin Parkway | | | | refining of oil and gas), H.J. Heinz |
| San Mateo, CA 94403-1906 | | | | Company (processed foods and |
| | | | | allied products) (1994-2013), RTI |
| | | | | International Metals, Inc. (manu- |
| | | | | facture and distribution of titanium), |
| | | | | Canadian National Railway (railroad) |
| | | | | and White Mountains Insurance |
| | | | | Group, Ltd. (holding company). |
Principal Occupation During at Least the Past 5 Years:
Director or Trustee of various companies and trusts; and formerly, Assistant to the President of the United States and Secretary of the Cabinet (1990-1993); General Counsel to the United States Treasury Department (1989-1990); and Counselor to the Secretary and Assistant Secretary for Public Affairs and Public Liaison – United States Treasury Department (1988-1989).
| | | | |
| J. Michael Luttig (1954) | Trustee | Since 2009 | 140 | Boeing Capital Corporation (aircraft |
| One Franklin Parkway | | | | financing) (2006-2013). |
| San Mateo, CA 94403-1906 | | | | |
Principal Occupation During at Least the Past 5 Years:
Executive Vice President, General Counsel and member of Executive Council, The Boeing Company (aerospace company); and formerly, Federal Appeals Court Judge, U.S. Court of Appeals for the Fourth Circuit (1991-2006).
Annual Report | 185
| | | | |
| | | | Number of Portfolios in | |
| Name, Year of Birth | | Length of | Fund Complex Overseen | Other Directorships Held |
| and Address | Position | Time Served | by Board Member* | During at Least the Past 5 Years |
| Frank A. Olson (1932) | Trustee | Since 2005 | 140 | Hess Corporation (exploration and |
| One Franklin Parkway | | | | refining of oil and gas) (1998-2013). |
| San Mateo, CA 94403-1906 | | | | |
Principal Occupation During at Least the Past 5 Years:
Chairman Emeritus, The Hertz Corporation (car rental) (since 2000) (Chairman of the Board (1980-2000) and Chief Executive Officer (1977-1999)); and formerly, Chairman of the Board, President and Chief Executive Officer, UAL Corporation (airlines) (until 1987).
| | | | |
| Larry D. Thompson (1945) | Trustee | Since 2007 | 140 | Cbeyond, Inc. (business commu- |
| One Franklin Parkway | | | | nications provider) (2010-2012), The |
| San Mateo, CA 94403-1906 | | | | Southern Company (energy company) |
| | | | | (2010-2012) and Graham Holdings |
| | | | | Company (formerly, The Washington |
| | | | | Post Company) (education and media |
| | | | | organization). |
Principal Occupation During at Least the Past 5 Years:
Executive Vice President – Government Affairs, General Counsel and Corporate Secretary, PepsiCo, Inc. (consumer products) (July 2012); and formerly, John A. Sibley Professor of Corporate and Business Law, University of Georgia School of Law (2011-2012); Senior Vice President – Government Affairs, General Counsel and Secretary, PepsiCo, Inc. (2004-2011); Senior Fellow of The Brookings Institution (2003-2004); Visiting Professor, University of Georgia School of Law (2004); and Deputy Attorney General, U.S. Department of Justice (2001-2003).
| | | | |
| John B. Wilson (1959) | Lead | Trustee since | 113 | None |
| One Franklin Parkway | Independent | 2007 and Lead | | |
| San Mateo, CA 94403-1906 | Trustee | Independent | | |
| | | Trustee since | | |
| 2008 |
Principal Occupation During at Least the Past 5 Years:
President, Staples Europe (office supplies) (2012); President and Founder, Hyannis Port Capital, Inc. (real estate and private equity investing); serves on private and non-profit boards; and formerly, Chief Operating Officer and Executive Vice President, Gap, Inc. (retail) (1996-2000); Chief Financial Officer and Executive Vice President – Finance and Strategy, Staples, Inc. (1992-1996); Senior Vice President – Corporate Planning, Northwest Airlines, Inc. (airlines) (1990-1992); and Vice President and Partner, Bain & Company (consulting firm) (1986-1990).
| | | | |
| Interested Board Members and Officers | | |
| |
| | | | Number of Portfolios in | |
| Name, Year of Birth | | Length of | Fund Complex Overseen | Other Directorships Held |
| and Address | Position | Time Served | by Board Member* | During at Least the Past 5 Years |
| **Gregory E. Johnson (1961) | Trustee | Since 2007 | 150 | None |
| One Franklin Parkway | | | | |
| San Mateo, CA 94403-1906 | | | | |
Principal Occupation During at Least the Past 5 Years:
Chairman of the Board, Member – Office of the Chairman, Director, President and Chief Executive Officer, Franklin Resources, Inc.; officer and/or director or trustee, as the case may be, of some of the other subsidiaries of Franklin Resources, Inc. and of 44 of the investment companies in Franklin Templeton Investments; and Chairman, Investment Company Institute.
186 | Annual Report
| | | | |
| | | | Number of Portfolios in | |
| Name, Year of Birth | | Length of | Fund Complex Overseen | Other Directorships Held |
| and Address | Position | Time Served | by Board Member* | During at Least the Past 5 Years |
| **Rupert H. Johnson, Jr. (1940) | Chairman of | Chairman of the | 140 | None |
| One Franklin Parkway | the Board and | Board and Trustee | | |
| San Mateo, CA 94403-1906 | Trustee | since June 2013 | | |
Principal Occupation During at Least the Past 5 Years:
Vice Chairman, Member – Office of the Chairman and Director, Franklin Resources, Inc.; Director, Franklin Advisers, Inc.; Senior Vice President, Franklin Advisory Services, LLC; and officer and/or director or trustee, as the case may be, of some of the other subsidiaries of Franklin Resources, Inc. and of 41 of the investment companies in Franklin Templeton Investments.
| | | | |
| Sheila Amoroso (1959) | Vice President | Since 1999 | Not Applicable | Not Applicable |
| One Franklin Parkway | | | | |
| San Mateo, CA 94403-1906 | | | | |
Principal Occupation During at Least the Past 5 Years:
Senior Vice President, Franklin Advisers, Inc.; and officer of seven of the investment companies in Franklin Templeton Investments.
| | | | |
| Alison E. Baur (1964) | Vice President | Since 2012 | Not Applicable | Not Applicable |
| One Franklin Parkway | | | | |
| San Mateo, CA 94403-1906 | | | | |
Principal Occupation During at Least the Past 5 Years:
Deputy General Counsel, Franklin Templeton Investments; and officer of some of the other subsidiaries of Franklin Resources, Inc. and of 46 of the investment companies in Franklin Templeton Investments.
| | | | |
| Rafael R. Costas, Jr. (1965) | Vice President | Since 1999 | Not Applicable | Not Applicable |
| One Franklin Parkway | | | | |
| San Mateo, CA 94403-1906 | | | | |
Principal Occupation During at Least the Past 5 Years:
Senior Vice President, Franklin Advisers, Inc.; and officer of seven of the investment companies in Franklin Templeton Investments.
| | | | |
| Laura F. Fergerson (1962) | Chief | Since 2009 | Not Applicable | Not Applicable |
| One Franklin Parkway | Executive | | | |
| San Mateo, CA 94403-1906 | Officer – | | | |
| | Finance and | | | |
| | Administration | | | |
Principal Occupation During at Least the Past 5 Years:
Senior Vice President, Franklin Templeton Services, LLC; and officer of 46 of the investment companies in Franklin Templeton Investments.
| | | | |
| Gaston Gardey (1967) | Treasurer, | Since 2009 | Not Applicable | Not Applicable |
| One Franklin Parkway | Chief Financial | | | |
| San Mateo, CA 94403-1906 | Officer and | | | |
| | Chief | | | |
| | Accounting | | | |
| | Officer | | | |
Principal Occupation During at Least the Past 5 Years:
Director, Fund Accounting, Franklin Templeton Investments; and officer of 27 of the investment companies in Franklin Templeton Investments.
Annual Report | 187
| | | | |
| | | | Number of Portfolios in | |
| Name, Year of Birth | | Length of | Fund Complex Overseen | Other Directorships Held |
| and Address | Position | Time Served | by Board Member* | During at Least the Past 5 Years |
| Aliya S. Gordon (1973) | Vice President | Since 2009 | Not Applicable | Not Applicable |
| One Franklin Parkway | | | | |
| San Mateo, CA 94403-1906 | | | | |
Principal Occupation During at Least the Past 5 Years:
Senior Associate General Counsel, Franklin Templeton Investments; officer of 46 of the investment companies in Franklin Templeton Investments; and formerly, Litigation Associate, Steefel, Levitt & Weiss, LLP (2000-2004).
| | | | |
| Steven J. Gray (1955) | Vice President | Since 2009 | Not Applicable | Not Applicable |
| One Franklin Parkway | | | | |
| San Mateo, CA 94403-1906 | | | | |
Principal Occupation During at Least the Past 5 Years:
Senior Associate General Counsel, Franklin Templeton Investments; Vice President, Franklin Templeton Distributors, Inc. and Franklin Alternative Strategies Advisers, LLC; and officer of 46 of the investment companies in Franklin Templeton Investments.
| | | | |
| Selena L. Holmes (1965) | Vice President | Since 2012 | Not Applicable | Not Applicable |
| 100 Fountain Parkway | – AML | | | |
| St. Petersburg, FL 33716-1205 | Compliance | | | |
Principal Occupation During at Least the Past 5 Years:
Director, Global Compliance Monitoring; Deputy Chief Compliance Officer, Franklin Alternative Strategies Advisers, LLC; and officer of 46 of the investment companies in Franklin Templeton Investments.
| | | | |
| Christopher J. Molumphy (1962) | President and | Since 2010 | Not Applicable | Not Applicable |
| One Franklin Parkway | Chief | | | |
| San Mateo, CA 94403-1906 | Executive | | | |
| | Officer – | | | |
| | Investment | | | |
| | Management | | | |
Principal Occupation During at Least the Past 5 Years:
Director and Executive Vice President, Franklin Advisers, Inc.; Executive Vice President, Franklin Templeton Institutional, LLC; and officer of some of the other subsidiaries of Franklin Resources, Inc. and of 22 of the investment companies in Franklin Templeton Investments.
| | | | |
| Kimberly H. Novotny (1972) | Vice President | Since 2013 | Not Applicable | Not Applicable |
| 300 S.E. 2nd Street | | | | |
| Fort Lauderdale, FL 33301-1923 | | | | |
Principal Occupation During at Least the Past 5 Years:
Associate General Counsel, Franklin Templeton Investments; Vice President and Secretary, Fiduciary Trust International of the South; Vice President, Templeton Investment Counsel, LLC; Assistant Secretary, Franklin Resources, Inc.; and officer of 46 of the investment companies in Franklin Templeton Investments.
| | | | |
| Robert C. Rosselot (1960) | Chief | Since 2013 | Not Applicable | Not Applicable |
| 300 S.E. 2nd Street | Compliance | | | |
| Fort Lauderdale, FL 33301-1923 | Officer | | | |
Principal Occupation During at Least the Past 5 Years:
Director, Global Compliance, Franklin Templeton Investments; Vice President, Franklin Templeton Companies, LLC; officer of 46 of the investment companies in Franklin Templeton Investments; and formerly, Senior Associate General Counsel, Franklin Templeton Investments (2007-2013); and Secretary and Vice President, Templeton Group of Funds (2004-2013).
188 | Annual Report
| | | | |
| | | | Number of Portfolios in | |
| Name, Year of Birth | | Length of | Fund Complex Overseen | Other Directorships Held |
| and Address | Position | Time Served | by Board Member* | During at Least the Past 5 Years |
| Karen L. Skidmore (1952) | Vice President | Since 2006 | Not Applicable | Not Applicable |
| One Franklin Parkway | and Secretary | | | |
| San Mateo, CA 94403-1906 | | | | |
Principal Occupation During at Least the Past 5 Years:
Senior Associate General Counsel, Franklin Templeton Investments; and officer of 46 of the investment companies in Franklin Templeton Investments.
| | | | |
| Craig S. Tyle (1960) | Vice President | Since 2005 | Not Applicable | Not Applicable |
| One Franklin Parkway | | | | |
| San Mateo, CA 94403-1906 | | | | |
Principal Occupation During at Least the Past 5 Years:
General Counsel and Executive Vice President, Franklin Resources, Inc.; and officer of some of the other subsidiaries of Franklin Resources, Inc. and of 46 of the investment companies in Franklin Templeton Investments.
| | | | |
| Thomas Walsh (1961) | Vice President | Since 1999 | Not Applicable | Not Applicable |
| One Franklin Parkway | | | | |
| San Mateo, CA 94403-1906 | | | | |
Principal Occupation During at Least the Past 5 Years:
Senior Vice President, Franklin Advisers, Inc.; and officer of seven of the investment companies in Franklin Templeton Investments.
| | | | |
| Lori A. Weber (1964) | Vice President | Since 2011 | Not Applicable | Not Applicable |
| 300 S.E. 2nd Street | | | | |
| Fort Lauderdale, FL 33301-1923 | | | | |
Principal Occupation During at Least the Past 5 Years:
Senior Associate General Counsel, Franklin Templeton Investments; Assistant Secretary, Franklin Resources, Inc.; Vice President and Secretary, Templeton Investment Counsel, LLC; Vice President, Fiduciary Trust International of the South; and officer of 46 of the investment companies in Franklin Templeton Investments.
*We base the number of portfolios on each separate series of the U.S. registered investment companies within the Franklin Templeton Investments fund complex. These portfolios have a common investment manager or affiliated investment managers.
**Gregory E. Johnson is considered to be an interested person of the Fund under the federal securities laws due to his position as an officer and director of Franklin Resources, Inc. (Resources), which is the parent company of the Fund’s investment manager and distributor. Rupert H. Johnson, Jr. is considered to be an interested person of the Fund under the federal securities laws due to his position as officer and director and major shareholder of Resources.
Note 1: Rupert H. Johnson, Jr. is the uncle of Gregory E. Johnson.
Note 2: Officer information is current as of the date of this report. It is possible that after this date, information about officers may change. Note 3: Effective June 13, 2013, Charles B. Johnson ceased to be a trustee of the Fund.
The Sarbanes-Oxley Act of 2002 and Rules adopted by the Securities and Exchange Commission require the Fund to disclose whether the Fund’s Audit Committee includes cat least one member who is an audit committee financial expert within the meaning of such Act and Rules. The Fund’s Board has determined that there is at least one such financial expert on the Audit Committee and has designated John B. Wilson as its audit committee financial expert. The Board believes that Mr. Wilson qualifies as such an expert in view of his extensive business background and experience, including service as chief financial officer of Staples, Inc. from 1992 to 1996. Mr. Wilson has been a Member and Chairman of the Fund’s Audit Committee since 2007. As a result of such background and experience, the Board believes that Mr. Wilson has acquired an understanding of generally accepted accounting principles and financial statements, the general application of such principles in connection with the accounting estimates, accruals and reserves, and analyzing and evaluating financial statements that present a breadth and level of complexity of accounting issues generally comparable to those of the Fund, as well as an understanding of internal controls and procedures for financial reporting and an understanding of audit committee functions.
Mr. Wilson is an independent Board member as that term is defined under the relevant Securities and Exchange Commission Rules and Releases.
The Statement of Additional Information (SAI) includes additional information about the board members and is available, without charge, upon request. Shareholders may call (800) DIAL BEN/342-5236 to request the SAI.
Annual Report | 189
Franklin Tax-Free Trust
Shareholder Information
Board Review of Investment Management Agreement
At a meeting held February 25, 2014, the Board of Trustees (Board), including a majority of non-interested or independent Trustees, approved renewal of the investment management agreement for each of the separate tax-exempt funds within the Trust (Fund(s)). In reaching this decision, the Board took into account information furnished throughout the year at regular Board meetings, as well as information prepared specifically in connection with the annual renewal review process. Information furnished and discussed throughout the year included investment performance reports and related financial information for each Fund, along with periodic reports on expenses, shareholder services, legal and compliance matters, pricing, and other services provided by the Investment Manager (Manager) and its affiliates. Information furnished specifically in connection with the renewal process included a report for each Fund prepared by Lipper, Inc. (Lipper), an independent organization, as well as additional material, including a Fund profitability analysis prepared by management. The Lipper reports compared each Fund’s investment performance and expenses with those of other mutual funds deemed comparable to the Fund as selected by Lipper. The Fund profitability analysis discussed the profitability to Franklin Templeton Investments from its overall U.S. fund operations, as well as on an individual fund-by-fund basis. Additional material accompanying such profitability analysis included information on a fund-by-fund basis listing portfolio managers and other accounts they manage, as well as information on management fees charged by the Manager and its affiliates to U.S. mutual funds and other accounts, including management’s explanation of differences where relevant. Such material also included a memorandum prepared by management describing project initiatives and capital investments relating to the services provided to the Funds by the Franklin Templeton Investments organization, as well as a memorandum relating to economies of scale and an analysis concerning transfer agent fees charged by an affiliate of the Manager.
In considering such materials, the independent Trustees received assistance and advice from and met separately with independent counsel. While the investment management agreements for all Funds were considered at the same Board meeting, the Board dealt with each Fund separately. In approving continuance of the investment management agreement for each Fund, the Board, including a majority of independent Trustees, determined that the existing management fee structure was fair and reasonable and that continuance of the investment management agreement was in the best interests of each Fund and its shareholders. While attention was given to all information furnished, the following discusses some primary factors relevant to the Board’s decision.
NATURE, EXTENT AND QUALITY OF SERVICES. The Board was satisfied with the nature and quality of the overall services provided by the Manager and its affiliates to the Funds and their shareholders. In addition to investment performance and expenses discussed later, the Board’s opinion was based, in part, upon periodic reports furnished it showing that the investment policies and restrictions for each Fund were consistently complied with as well as other reports periodically furnished the Board covering matters such as the compliance of portfolio managers and other management personnel with the code of ethics adopted throughout the Franklin Templeton fund-complex, the adherence to fair value pricing procedures established by the Board, and the accuracy
190 | Annual Report
Franklin Tax-Free Trust
Shareholder Information (continued)
Board Review of Investment Management Agreement (continued)
of net asset value calculations. The Board also noted the extent of benefits provided Fund shareholders from being part of the Franklin Templeton family of funds, including the right to exchange investments between the same class of funds without a sales charge, the ability to reinvest Fund dividends into other funds and the right to combine holdings in other funds to obtain a reduced sales charge. Favorable consideration was given to management’s continuous efforts and expenditures in establishing back-up systems and recovery procedures to function in the event of a natural disaster, it being noted that such systems and procedures had functioned well during the Florida hurricanes and blackouts experienced in previous years and that those operations in the New York/New Jersey area ran smoothly during the period of the 2012 Hurricane Sandy. Consideration was also given to the experience of each Fund’s portfolio management team, the number of accounts managed and general method of compensation. In this latter respect, the Board noted that a primary factor in management’s determination of a portfolio manager’s bonus compensation was the relative investment performance of the funds he or she managed and that a portion of such bonus was required to be invested in a predesignated list of funds within such person’s fund management area so as to be aligned with the interests of shareholders. The Board also took into account the quality of transfer agent and shareholder services provided Fund shareholders by an affiliate of the Manager and the continuous enhancements to the Franklin Templeton website. Particular attention was given to management’s conservative approach and diligent risk management procedures, including continuous monitoring of counterparty credit risk and attention given to derivatives and other complex instruments. The Board also took into account, among other things, management’s efforts in establishing a global credit facility for the benefit of the Funds and other accounts managed by Franklin Templeton Investments to provide a source of cash for temporary and emergency purposes or to meet unusual redemption requests as well as the strong financial position of the Manager’s parent company and its commitment to the mutual fund business as evidenced by its subsidization of money market funds.
INVESTMENT PERFORMANCE. The Board placed significant emphasis on the investment performance of each Fund in view of its importance to shareholders. While consideration was given to performance reports and discussions with portfolio managers at Board meetings throughout the year, particular attention in assessing performance was given to the Lipper reports furnished for the agreement renewals. The Lipper reports prepared for each individual Fund showed its investment performance, or those of its Class A shares for Funds having multiple share classes, in comparison to a performance universe selected by Lipper. Comparative performance for each Fund was shown for the one-year period ended December 31, 2013, and for additional periods ended that date up to 10 years depending on when a particular Fund commenced operations. The Lipper report showed the income return for each Fund to be above the median of its Lipper performance universe for 2013, as well as for the previous three-, five- and 10-year periods on an annualized basis, with most being in the highest or second-highest performing quintile during all such periods. The Lipper report showed the total returns of a majority of the Funds to be below the medians of their respective Lipper performance universes in 2013, but on an annualized basis, the total returns of all the Funds were at or above the medians of their Lipper performance universes for the 10-year period, with the majority being at or above the middle performing quintiles of their respective performance
Annual Report | 191
Franklin Tax-Free Trust
Shareholder Information (continued)
Board Review of Investment Management Agreement (continued)
universes for the previous three- and five-year periods as well. The Board was satisfied with the overall performance of these Funds, noting their income oriented objective.
COMPARATIVE EXPENSES. Consideration was given to the management fee and total expense ratio of each Fund in comparison with those of a group of funds selected by Lipper as its appropriate Lipper expense group. Lipper expense data is based upon information taken from each fund’s most recent annual report, which reflects historical asset levels that may be quite different from those currently existing, particularly in a period of market volatility. While recognizing such inherent limitation and the fact that expense ratios generally increase as assets decline and decrease as assets grow, the Board believed the independent analysis conducted by Lipper to be an appropriate measure of comparative expenses. In reviewing comparative costs, Lipper provides information on each Fund’s contractual investment management fee in comparison with the contractual investment management fee that would have been charged by other funds within its Lipper expense group assuming they were similar in size to the Fund, as well as the actual total expenses of the Fund in comparison with those of its Lipper expense group. The Lipper contractual investment management fee analysis includes an administrative charge as being part of the investment management fee, and total expenses, for comparative consistency, are shown by Lipper for Fund Class A shares for Funds having multiple share classes. The Lipper reports showed that the contractual investment management fee rates for each Fund were at or below the medians of their respective Lipper expense groups, with the exception of Franklin Kentucky Tax-Free Income Fund, Franklin Maryland Tax-Free Income Fund and Franklin Virginia Tax-Free Income Fund. The contractual investment management fee rate of each such Fund, however, was within two basis points of its respective Lipper expense group median. The Lipper reports further showed that the actual total expense ratios for all Funds were below the medians of their respective Lipper expense groups, with each being in the least expensive quintile of such group. Based on the above, the Board was satisfied with the investment management fee and total expense ratio of each Fund in comparison to its Lipper expense group as shown in the Lipper reports.
MANAGEMENT PROFITABILITY. The Board also considered the level of profits realized by the Manager and its affiliates in connection with the operation of each Fund. In this respect, the Board reviewed the Fund profitability analysis that addresses the overall profitability of Franklin Templeton’s U.S. fund business, as well as its profits in providing management and other services to each of the individual funds during the 12-month period ended September 30, 2013, being the most recent fiscal year-end for Franklin Resources, Inc., the Manager’s parent. In reviewing the analysis, the Board recognized that allocation methodologies are inherently subjective and various allocation methodologies may be reasonable while producing different results. In this respect, the Board noted that while management continuously makes refinements to its methodologies in response to organizational and product related changes, the overall approach as defined by the primary drivers and activity measurements has remained consistent with that used in the Funds’ profitability report presentations from prior years. Additionally, the Funds’ independent registered
192 | Annual Report
Franklin Tax-Free Trust
Shareholder Information (continued)
Board Review of Investment Management Agreement (continued)
public accounting firm had been engaged by the Manager to periodically review the reasonableness of the allocation methodologies to be used solely by the Funds’ Board in reference to the profitability analysis. In reviewing and discussing such analysis, management discussed with the Board its belief that costs incurred in establishing the infrastructure necessary for the type of mutual fund operations conducted by the Manager and its affiliates may not be fully reflected in the expenses allocated to each Fund in determining its profitability, as well as the fact that the level of profits, to a certain extent, reflected operational cost savings and efficiencies initiated by management. The Board also took into account management’s expenditures in improving shareholder services provided the Funds, as well as the need to implement systems and meet additional regulatory and compliance requirements resulting from statutes such as the Sarbanes-Oxley and Dodd-Frank Acts and recent SEC and other regulatory requirements. In addition, the Board considered a third-party study comparing the profitability of the Manager’s parent on an overall basis to other publicly held managers broken down to show profitability from management operations exclusive of distribution expenses, as well as profitability including distribution expenses. The Board also considered the extent to which the Manager and its affiliates might derive ancillary benefits from fund operations, including revenues generated from transfer agent services. Based upon its consideration of all these factors, the Board determined that the level of profits realized by the Manager and its affiliates from providing services to each Fund was not excessive in view of the nature, quality and extent of services provided.
ECONOMIES OF SCALE. The Board also considered whether economies of scale are realized by the Manager as the Funds grow larger and the extent to which this is reflected in the level of management fees charged. While recognizing any precise determination is inherently subjective, the Board noted that based upon the Fund profitability analysis, it appears that as some Funds get larger, at some point economies of scale do result in the Manager realizing a larger profit margin on management services provided such Fund. The Board also noted that any economies of scale are shared with each of these Funds and their shareholders through management fee breakpoints existing in each of the Fund’s investment management agreements, so that as a Fund grows in size, its effective management fee rate declines. The fee structure under the investment management agreement with each Fund provides an initial fee of 0.625% on the first $100 million of assets; 0.5% on the next $150 million of assets; 0.45% on assets in excess of $250 million; with additional breakpoints beginning at 0.44% on assets in excess of $7.5 billion; 0.43% on assets in excess of $10 billion and continuing thereafter until reaching a final breakpoint of 0.36% on assets in excess of $20 billion. In reviewing such structure, management stated its belief that this fee structure reaches a relatively low rate quickly as a Fund grows and that such low rate, in effect, reflects anticipated economies of scale as a Fund’s assets increase and pointed out the favorable contractual management fee and total expense comparisons for each Fund within its Lipper expense group as discussed under “Comparative Expenses.” The Board observed that at December 31, 2013, none of these Funds had assets in excess of $8 billion and believed that to the extent economies of scale may be realized by the Manager and its affiliates, the schedule of fees under the investment management agreement for each such Fund provides a sharing of benefits with the Fund and its shareholders.
Annual Report | 193
Franklin Tax-Free Trust
Shareholder Information (continued)
Proxy Voting Policies and Procedures
The Trust’s investment manager has established Proxy Voting Policies and Procedures (Policies) that the Trust uses to determine how to vote proxies relating to portfolio securities. Shareholders may view the Trust’s complete Policies online at franklintempleton.com. Alternatively, shareholders may request copies of the Policies free of charge by calling the Proxy Group collect at (954) 527-7678 or by sending a written request to: Franklin Templeton Companies, LLC, 300 S.E. 2nd Street, Fort Lauderdale, FL 33301, Attention: Proxy Group. Copies of the Trust’s proxy voting records are also made available online at franklintempleton.com and posted on the U.S. Securities and Exchange Commission’s website at sec.gov and reflect the most recent 12-month period ended June 30.
Quarterly Statement of Investments
The Trust files a complete statement of investments with the U.S. Securities and Exchange Commission for the first and third quarters for each fiscal year on Form N-Q. Shareholders may view the filed Form N-Q by visiting the Commission’s website at sec.gov. The filed form may also be viewed and copied at the Commission’s Public Reference Room in Washington, DC. Information regarding the operations of the Public Reference Room may be obtained by calling (800) SEC-0330.
Householding of Reports and Prospectuses
You will receive each Fund’s financial reports every six months as well as an annual updated summary prospectus (prospectus available upon request). To reduce Fund expenses, we try to identify related shareholders in a household and send only one copy of the financial reports and summary prospectus. This process, called “householding,” will continue indefinitely unless you instruct us otherwise. If you prefer not to have these documents householded, please call us at (800) 632-2301. At any time you may view current prospectuses/summary prospectuses and financial reports on our website. If you choose, you may receive these documents through electronic delivery.
194 | Annual Report
This page intentionally left blank.
This page intentionally left blank.
Item 2. Code of Ethics.
(a) The Registrant has adopted a code of ethics that applies to its principal executive officers and principal financial and accounting officer.
(c) N/A
(d) N/A
(f) Pursuant to Item 12(a)(1), the Registrant is attaching as an exhibit a copy of its code of ethics that applies to its principal executive officers and principal financial and accounting officer.
Item 3. Audit Committee Financial Expert.
(a)(1) The Registrant has an audit committee financial expert serving on its audit committee.
(2) The audit committee financial expert is John B. Wilson, and he is "independent" as defined under the relevant Securities and Exchange Commission Rules and Releases.
Item 4. Principal Accountant Fees and Services.
(a) Audit Fees
The aggregate fees paid to the principal accountant for professional services rendered by the principal accountant for the audit of the registrant’s annual financial statements or for services that are normally provided by the principal accountant in connection with statutory and regulatory filings or engagements were $823,994 for the fiscal year ended February 28, 2014 and $872,267 for the fiscal year ended February 28, 2013.
(b) Audit-Related Fees
There were no fees paid to the principal accountant for assurance and related services rendered by the principal accountant to the registrant that are reasonably related to the performance of the audit of the registrant's financial statements and are not reported under paragraph (a) of Item 4.
There were no fees paid to the principal accountant for assurance and related services rendered by the principal accountant to the registrant's investment adviser and any entity controlling, controlled by or under common control with the investment adviser that provides ongoing services to the registrant that are reasonably related to the performance of the audit of their financial statements.
(c) Tax Fees
There were no fees paid to the principal accountant for professional services rendered by the principal accountant to the registrant for tax compliance, tax advice and tax planning.
The aggregate fees paid to the principal accountant for professional services rendered by the principal accountant to the registrant’s investment adviser and any entity controlling, controlled by or under common control with the investment adviser that provides ongoing services to the registrant for tax compliance, tax advice and tax planning were $6,930 for the fiscal year ended February 28, 2014 and $4,600 for the fiscal year ended February 28, 2013. The services for which these fees were paid included technical tax consultation for capital gain tax reporting to foreign governments and requirements on local country’s self certification forms.
(d) All Other Fees
The aggregate fees paid to the principal accountant for products and services rendered by the principal accountant to the registrant not reported in paragraphs (a)-(c) of Item 4 were $0 for the fiscal year ended February 28, 2014 and $12,167 for the fiscal year ended February 28, 2013. The services for which these fees were paid included review of materials provided to the fund Board in connection with the investment management contract renewal process.
The aggregate fees paid to the principal accountant for products and services rendered by the principal accountant to the registrant’s investment adviser and any entity controlling, controlled by or under common control with the investment adviser that provides ongoing services to the registrant other than services reported in paragraphs (a)-(c) of Item 4 were $39,194 for the fiscal year ended February 28, 2014 and $140,283 for the fiscal year ended February 28, 2013. The services for which these fees were paid included preparation and review of materials provided to the fund Board in connection with the investment management contract renewal process.
(e) (1) The registrant’s audit committee is directly responsible for approving the services to be provided by the auditors, including:
(i) pre-approval of all audit and audit related services;
(ii) pre-approval of all non-audit related services to be provided to the Fund by the auditors;
(iii) pre-approval of all non-audit related services to be provided to the registrant by the auditors to the registrant’s investment adviser or to any entity that controls, is controlled by or is under common control with the registrant’s investment adviser and that provides ongoing services to the registrant where the non-audit services relate directly to the operations or financial reporting of the registrant; and
(iv) establishment by the audit committee, if deemed necessary or appropriate, as an alternative to committee pre-approval of services to be provided by the auditors, as required by paragraphs (ii) and (iii) above, of policies and procedures to permit such services to be pre-approved by other means, such as through establishment of guidelines or by action of a designated member or members of the committee; provided the policies and procedures are detailed as to the particular service and the committee is informed of each service and such policies and procedures do not include delegation of audit committee responsibilities, as contemplated under the Securities Exchange Act of 1934, to management; subject, in the case of (ii) through (iv), to any waivers, exceptions or exemptions that may be available under applicable law or rules.
(e) (2) None of the services provided to the registrant described in paragraphs (b)-(d) of Item 4 were approved by the audit committee pursuant to paragraph (c)(7)(i)(C) of Rule 2-01 of regulation S-X.
(f) No disclosures are required by this Item 4(f).
(g) The aggregate non-audit fees paid to the principal accountant for services rendered by the principal accountant to the registrant and the registrant’s investment adviser and any entity controlling, controlled by or under common control with the investment adviser that provides ongoing services to the registrant were $46,124 for the fiscal year ended February 28, 2014 and $157,050 for the fiscal year ended February 28, 2013.
(h) The registrant’s audit committee of the board has considered whether the provision of non-audit services that were rendered to the registrant’s investment adviser (not including any sub-adviser whose role is primarily portfolio management and is subcontracted with or overseen by another investment adviser), and any entity controlling, controlled by, or under common control with the investment adviser that provides ongoing services to the registrant that were not pre-approved pursuant to paragraph (c)(7)(ii) of Rule 2-01 of Regulation S-X is compatible with maintaining the principal accountant’s independence.
Item 5. Audit Committee of Listed Registrants. N/A
Item 6. Schedule of Investments. N/A
Item 7. Disclosure of Proxy Voting Policies and Procedures for Closed-End Management Investment Companies. N/A
Item 8. Portfolio Managers of Closed-End Management Investment Companies. N/A
Item 9. Purchases of Equity Securities by Closed-End Management Investment Company and Affiliated Purchasers. N/A
Item 10. Submission of Matters to a Vote of Security Holders.
There have been no changes to the procedures by which shareholders may recommend nominees to the Registrant's Board of Trustees that would require disclosure herein.
Item 11. Controls and Procedures.
(a) Evaluation of Disclosure Controls and Procedures. The Registrant maintains disclosure controls and procedures that are designed to ensure that information required to be disclosed in the Registrant’s filings under the Securities Exchange Act of 1934 and the Investment Company Act of 1940 is recorded, processed, summarized and reported within the periods specified in the rules and forms of the Securities and Exchange Commission. Such information is accumulated and communicated to the Registrant’s management, including its principal executive officer and principal financial officer, as appropriate, to allow timely decisions regarding required disclosure. The Registrant’s management, including the principal executive officer and the principal financial officer, recognizes that any set of controls and procedures, no matter how well designed and operated, can provide only reasonable assurance of achieving the desired control objectives.
Within 90 days prior to the filing date of this Shareholder Report on Form N-CSR, the Registrant had carried out an evaluation, under the supervision and with the participation of the Registrant’s management, including the Registrant’s principal executive officer and the Registrant’s principal financial officer, of the effectiveness of the design and operation of the Registrant’s disclosure controls and procedures. Based on such evaluation, the Registrant’s principal executive officer and principal financial officer concluded that the Registrant’s disclosure controls and procedures are effective.
(b) Changes in Internal Controls. There have been no changes in the Registrant’s internal controls or in other factors that could materially affect the internal controls over financial reporting subsequent to the date of their evaluation in connection with the preparation of this Shareholder Report on Form N-CSR.
Item 12. Exhibits.
(a)(1) Code of Ethics
(a)(2) Certifications pursuant to Section 302 of the Sarbanes-Oxley Act of 2002 of Laura F. Fergerson, Chief Executive Officer - Finance and Administration, and Gaston Gardey, Chief Financial Officer and Chief Accounting Officer
(b) Certifications pursuant to Section 906 of the Sarbanes-Oxley Act of 2002 of Laura F. Fergerson, Chief Executive Officer - Finance and Administration, and Gaston Gardey, Chief Financial Officer and Chief Accounting Officer
SIGNATURES
Pursuant to the requirements of the Securities Exchange Act of 1934 and the Investment Company Act of 1940, the registrant has duly caused this report to be signed on its behalf by the undersigned, thereunto duly authorized.
FRANKLIN TAX-FREE TRUST
By /s/ Laura F. Fergerson
Laura F. Fergerson
Chief Executive Officer –
Finance and Administration
Date April 25, 2014
Pursuant to the requirements of the Securities Exchange Act of 1934 and the Investment Company Act of 1940, this report has been signed below by the following persons on behalf of the registrant and in the capacities and on the dates indicated.
By /s/ Laura F. Fergerson
Laura F. Fergerson
Chief Executive Officer –
Finance and Administration
Date April 25, 2014
By /s/ Gaston Gardey
Gaston Gardey
Chief Financial Officer and
Chief Accounting Officer
Date April 25, 2014