1
| 1
Annual Report
Municipal Bond Market Overview
For the 12-month period ended February 28, 2013, the municipal bond market produced solid returns. During this period, the Barclays Municipal Bond Index, which tracks investment-grade municipal securities, returned +5.01%.1 In comparison, the Barclays U.S. Treasury Index returned +2.00%.1 The tax-exempt nature of most municipal bond coupon payments included in the Barclays Municipal Bond Index further enhanced the relative strength of municipal bond performance for the period under review.
The municipal market delivered positive performance even though Moody’s Investors Service, Standard & Poor’s (S&P) and Fitch, the three largest independent municipal bond rating agencies, lowered credit ratings of several municipalities during the review period. In 2012, the agencies collectively issued 1,469 downgrades to 838 upgrades. S&P was the only firm to boost more ratings than it downgraded, whereas Moody’s was the most aggressive, cutting 824 ratings while upgrading 187. Some of the more noteworthy downgrades over the past 12 months included Connecticut, Illinois, Pennsylvania and Puerto Rico. Despite the high number of downgrades during 2012, actual monetary defaults amounted to $2.7 billion or .072% of issues.2 Low default rates have been a characteristic of the municipal bond market since the Great Depression.
During the period, investors continued to buy municipal bonds and bond funds at a strong pace. According to the Investment Company Institute, investors committed $49.6 billion in new net purchases to municipal bond funds.3 Concurrent with investors’ appetite for municipal bonds, municipalities throughout the country borrowed for new purposes at the slowest rate since 1997. Strong demand for municipal bonds coupled with low supply drove the municipal market’s positive performance.
Individual investors choose to invest in the municipal bond market for various reasons. High personal income tax rates and tax-exempt yields offered on municipal bonds are often major drivers of an investor’s preference for municipal bonds. In addition, lower price volatility implicit in protracted periods of low interest rates can give investors confidence in their fixed income investments. Federal Reserve Board (Fed) Chairman Ben Bernanke testified before
1. Source: © 2013 Morningstar. All Rights Reserved. The information contained herein: (1) is proprietary to Morningstar and/or its content providers; (2) may not be copied or distributed; and (3) is not warranted to be accurate, complete or timely. Neither Morningstar nor its content providers are responsible for any damages or losses arising from any use of this information. Past performance is no guarantee of future results.
2. Source: BofA Merrill Lynch Global Research, “Muni Commentary: Monetary and Fiscal Policy in Flux,” 1/4/13.
3. Source: Investment Company Institute, Washington, DC 2013.
4 | Annual Report
the Senate Banking Committee on February 26, 2013, and reaffirmed the Fed’s commitment to keeping interest rates low. One of the Fed’s tools used to maintain low rates is the purchase of government and governmental agency debt in the secondary market. According to the February testimony, the Fed plans to continue with this strategy “well into the second half of 2013.” This continued strategy could help support further demand for municipal bonds.
After the November elections, discussions about ways to achieve deficit reduction included possibly changing municipal bonds’ tax-exempt status. Investor nervousness about such changes prompted outflows from municipal bond mutual funds in December that reached the highest weekly level since January 2011, according to Lipper Inc. Municipal bond prices fell and their yields rose near the end of 2012. Late on January 1, 2013, Congress agreed to raise income taxes on the wealthiest Americans and defer some federal spending cuts. The bill did not include changes to municipal bonds’ tax-exempt status.
At period-end, we maintained our positive view of the municipal bond market. We believe municipal bonds continue to be an attractive asset class among fixed income securities, and we intend to follow our solid discipline of investing to maximize income while seeking value in the municipal bond market.
The foregoing information reflects our analysis and opinions as of February 28, 2013, the end of the reporting period. The information is not a complete analysis of every aspect of any market, country, industry, security or fund. Statements of fact are from sources considered reliable.
Annual Report | 5
Investment Strategy and
Manager’s Discussion
Investment Strategy
We use a consistent, disciplined strategy in an effort to maximize tax-exempt income for our shareholders by seeking to maintain exposure to higher coupon securities while balancing risk and return within each Fund’s range of allowable investments. We generally employ a buy-and-hold approach and invest in securities we believe should provide the most relative value in the market. We do not use leverage or exotic derivatives, nor do we use hedging techniques that could add volatility and contribute to underperformance in adverse markets.
Manager’s Discussion
Based on the combination of our value-oriented philosophy of investing primarily for income and a positive-sloping municipal yield curve, we favored the use of longer term bonds. Consistent with our strategy, we generally sought to purchase bonds from 15 to 30 years in maturity with good call features for the long-term funds, 10 to 15 years for the intermediate-term fund, and five years or less for the limited-term fund. We believe our conservative, buy-and-hold investment strategy can help us achieve high, current, tax-free income for shareholders.
We invite you to read your Fund report for more detailed performance and portfolio information. Thank you for your participation in Franklin Tax-Free Trust. We look forward to serving your future investment needs.
The foregoing information reflects our analysis, opinions and portfolio holdings as of February 28, 2013, the end of the reporting period. The way we implement our main investment strategies and the resulting portfolio holdings may change depending on factors such as market and economic conditions. These opinions may not be relied upon as investment advice or an offer for a particular security. The information is not a complete analysis of every aspect of any market, state, industry, security or fund. Statements of fact are from sources considered reliable, but the investment manager makes no representation or warranty as to their completeness or accuracy. Although historical performance is no guarantee of future results, these insights may help you understand our investment management philosophy.
6 | Annual Report
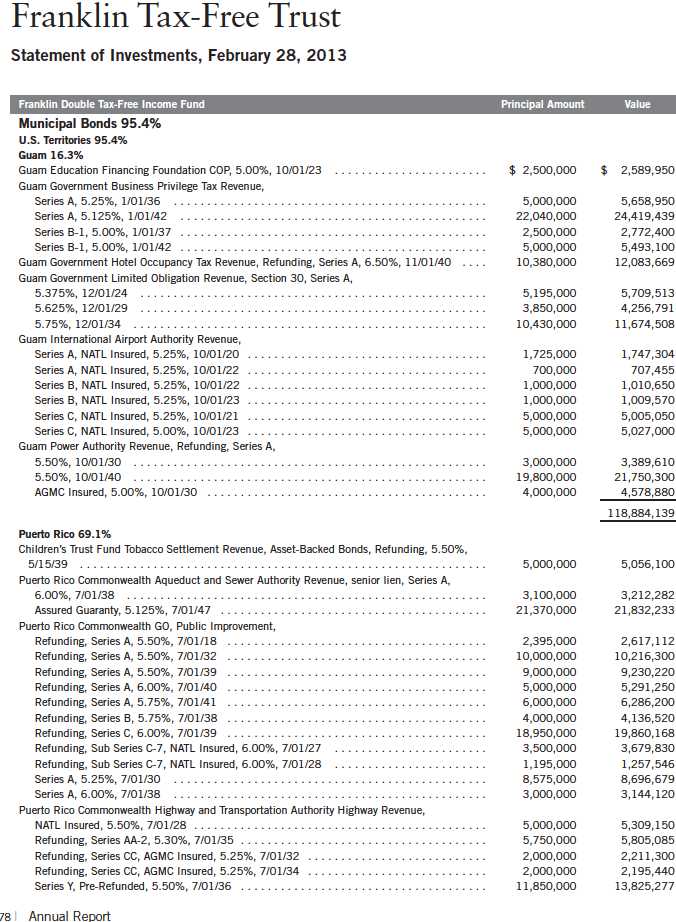
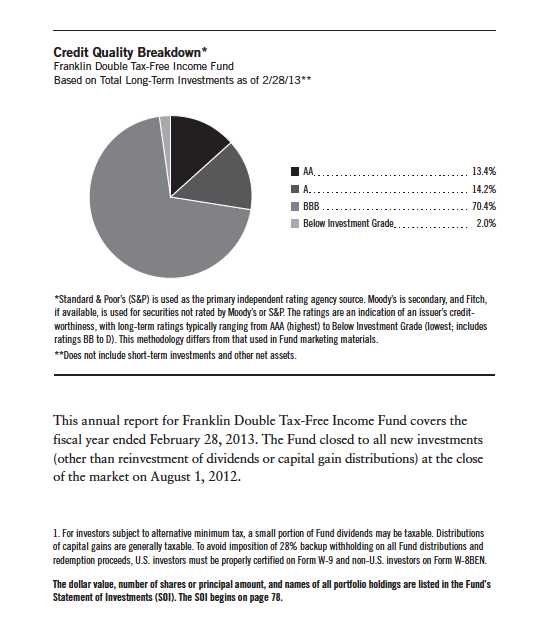
Franklin Double Tax-Free Income Fund
Your Fund’s Goal and Main Investments: Franklin Double Tax-Free Income Fund seeks to provide as high a level of income exempt from federal and state personal income taxes as is consistent with prudent investment management and preservation of capital by investing at least 80% of its net assets in securities that pay interest free from such taxes.1 The Fund focuses on municipal securities issued by U.S. territories such as Puerto Rico, Guam and the U.S. Virgin Islands, and currently invests primarily in Puerto Rican municipal securities.
Annual Report | 7
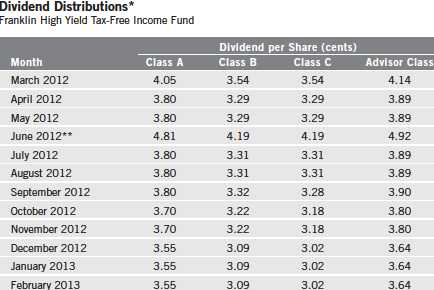
Dividend Distributions*
Performance data represent past performance, which does not guarantee future results. Investment return and principal value will fluctuate, and you may have a gain or loss when you sell your shares. Current performance may differ from figures shown. Please visit franklintempleton.com or call (800) 342-5236 for most recent month-end performance.
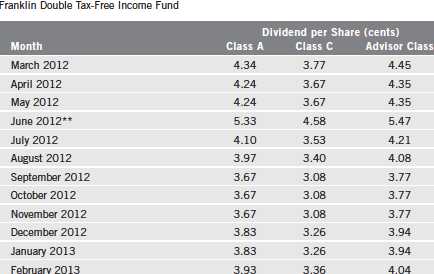
*Assumes shares were purchased and held for the entire accrual period. Prior to July 2012, this differed from the calendar month. Since dividends accrue daily, your actual distributions will vary depending on the date you purchased your shares and any account activity. All Fund distributions will vary depending upon current market conditions, and past distributions are not indicative of future trends.
**The June distribution reflects additional days in the accrual period.
Performance Overview
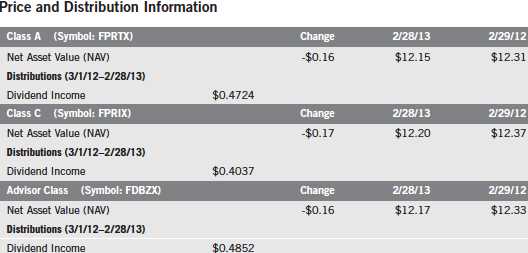
The Fund’s Class A share price, as measured by net asset value, decreased from $12.31 on February 29, 2012, to $12.15 on February 28, 2013. The Fund’s Class A shares paid dividends totaling 47.24 cents per share for the same period.2 The Performance Summary beginning on page 10 shows that at the end of this reporting period the Fund’s Class A shares’ distribution rate was 3.72%, based on an annualization of the 3.93 cent per share February dividend and the maximum offering price of $12.69 on February 28, 2013. An investor in the 2013 maximum federal income tax bracket of 39.60% (plus 3.8% Medicare tax) would need to earn a distribution rate of 6.57% from a taxable investment to match the Fund’s Class A tax-free distribution rate. For the Fund’s Class C and Advisor shares’ performance, please see the Performance Summary. The reduction in dividend distributions from the start to the end of the period under review reflected generally declining interest rates. Additionally, investor demand was strong for municipal bonds in an environment of limited tax-exempt supply. These factors resulted in reduced income for the portfolio and caused dividends to decline overall.
2. All Fund distributions will vary depending upon current market conditions, and past distributions are not indicative of future trends.
8 | Annual Report
Manager’s Discussion
We used various investment strategies during the 12 months under review as we sought to maximize tax-free income for shareholders. Please read the discussion on page 6 for details. Franklin Double Tax-Free Income Fund was the first mutual fund to offer both state and federal income tax exemptions in most states. We do this by focusing on investments in U.S. territories such as Puerto Rico, Guam and the U.S. Virgin Islands. This can be particularly appealing to residents of states where income from their own municipal securities may be fully taxable.
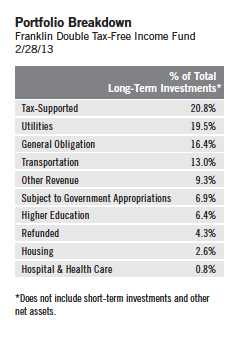
The Fund was diversified with 118 different positions across 10 different sectors as of February 28, 2013. Issuers represented in the portfolio comprised Puerto Rico (72.5% of the Fund’s total long-term investments), Guam (17.0%) and the U.S. Virgin Islands (10.5%).
During the reporting period, Puerto Rico experienced downgrades from Moody’s Investors Service that contributed to the underperformance of Puerto Rico bonds versus the market. Many municipal bond funds purchase U.S. territory paper, mainly Puerto Rico’s, as an alternative for their specialty state funds when the supply within a particular state is running low. Puerto Rico’s municipal bond market is widely traded because of its dual tax-exemption advantages. Because of the limited number of issuers of securities that are tax exempt in most states, and the growth in Fund assets, we have been challenged to keep the Fund fully invested while meeting certain diversification requirements for federal income tax purposes. Accordingly, effective at the close of the market on August 1, 2012, the Fund was closed to all new investments (other than reinvestment of dividends or capital gain distributions).
Thank you for your continued participation in Franklin Double Tax-Free Income Fund. We believe our conservative, buy-and-hold investment strategy can help us achieve high, current, tax-free income for shareholders.
The foregoing information reflects our analysis, opinions and portfolio holdings as of February 28, 2013, the end of the reporting period. The way we implement our main investment strategies and the resulting portfolio holdings may change depending on factors such as market and economic conditions. These opinions may not be relied upon as investment advice or an offer for a particular security. The information is not a complete analysis of every aspect of any market, state, industry, security or the Fund. Statements of fact are from sources considered reliable, but the investment manager makes no representation or warranty as to their completeness or accuracy. Although historical performance is no guarantee of future results, these insights may help you understand our investment management philosophy.
Annual Report | 9
Performance Summary as of 2/28/13
Franklin Double Tax-Free Income Fund
Your dividend income will vary depending on dividends or interest paid by securities in the Fund’s portfolio, adjusted for operating expenses of each class. Capital gain distributions are net profits realized from the sale of portfolio securities. The performance table and graphs do not reflect any taxes that a shareholder would pay on Fund dividends, capital gain distributions, if any, or any realized gains on the sale of Fund shares. Total return reflects reinvestment of the Fund’s dividends and capital gain distributions, if any, and any unrealized gains or losses.
10 | Annual Report
Performance Summary (continued)
Performance
Cumulative total return excludes sales charges. Average annual total returns include maximum sales charges. Class A: 4.25% maximum initial sales charge; Class C: 1% contingent deferred sales charge in first year only; Advisor Class: no sales charges.
Performance data represent past performance, which does not guarantee future results. Investment return and principal value will fluctuate, and you may have a gain or loss when you sell your shares. Current performance may differ from figures shown. For most recent month-end performance, go to franklintempleton.com or call (800) 342-5236.
Annual Report | 11
Performance Summary (continued)
Total Return Index Comparison for a Hypothetical $10,000 Investment
Total return represents the change in value of an investment over the periods shown. It includes any current, applicable, maximum sales charge, Fund expenses, account fees and reinvested distributions. The unmanaged index includes reinvestment of any income or distributions. It differs from the Fund in composition and does not pay management fees or expenses. One cannot invest directly in an index.

12 | Annual Report

Endnotes
All investments involve risks, including possible loss of principal. Because municipal bonds are particularly sensitive to interest rate movements, the Fund’s yield and share price will fluctuate with market conditions. Bond prices generally move in the opposite direction of interest rates. Thus, as prices of bonds in the Fund adjust to a rise in interest rates, the Fund’s share price may decline. Since the Fund may concentrate its investments in a single U.S. territory, it may be subject to greater risk of adverse economic and regulatory changes in that territory than a geographically diversified fund. The Fund is classified as a nondiversified Fund because it may invest a greater portion of its assets in the municipal securities of one issuer than a diversified fund. Changes in the credit rating of a bond, or in the credit rating or financial strength of a bond’s issuer, insurer or guarantor, may affect the bond’s value. The Fund is actively managed but there is no guarantee that the manager’s investment decisions will produce the desired results. The Fund’s prospectus also includes a description of the main investment risks.
| |
Class C: | Prior to 1/1/04, these shares were offered with an initial sales charge; thus actual total returns would have differed. These shares have higher annual fees and expenses than Class A shares. |
| |
Advisor Class: | Shares are available to certain eligible investors as described in the prospectus. |
1. Cumulative total return represents the change in value of an investment over the periods indicated.
2. Average annual total return represents the average annual change in value of an investment over the periods indicated.
3. In accordance with SEC rules, we provide standardized average annual total return information through the latest calendar quarter.
4. Distribution rate is based on an annualization of the respective class’s February dividend and the maximum offering price (NAV for Classes C and Advisor) per share on 2/28/13.
5. Taxable equivalent distribution rate and yield assume the 2013 maximum federal income tax rate of 39.60% plus 3.8% Medicare tax.
6. The 30-day standardized yield for the month ended 2/28/13 reflects an estimated yield to maturity (assuming all portfolio securities are held to maturity). It should be regarded as an estimate of the Fund’s rate of investment income, and it may not equal the Fund’s actual income distribution rate (which reflects the Fund’s past dividends paid to shareholders) or the income reported in the Fund’s financial statements.
7. Figures are as stated in the Fund’s prospectus current as of the date of this report. In periods of market volatility, assets may decline significantly, causing total annual Fund operating expenses to become higher than the figures shown.
8. Effective 7/15/09, the Fund began offering Advisor Class shares, which do not have sales charges or a Rule 12b-1 plan. Performance quotations for this class reflect the following methods of calculation: (a) For periods prior to 7/15/09, a restated figure is used based upon the Fund’s Class A performance, excluding the effect of Class A’s maximum initial sales charge, but reflecting the effect of the Class A Rule 12b-1 fees; and (b) for periods after 7/15/09, actual Advisor Class performance is used reflecting all charges and fees applicable to that class. Since 7/15/09 (commencement of sales), the cumulative and average annual total returns of Advisor Class shares were +32.39% and +8.05%.
9. Source: © 2013 Morningstar. The Barclays Municipal Bond Index is a market value-weighted index engineered for the long-term tax-exempt bond market. To be included in the index, bonds must be fixed rate, have at least one year to final maturity and be rated investment grade (Baa3/BBB- or higher) by at least two of the following agencies: Moody’s, Standard & Poor’s and Fitch. The Consumer Price Index (CPI), calculated by the Bureau of Labor Statistics, is a commonly used measure of the inflation rate.
Annual Report | 13
Your Fund’s Expenses
Franklin Double Tax-Free Income Fund
As a Fund shareholder, you can incur two types of costs:
- Transaction costs, including sales charges (loads) on Fund purchases; and
- Ongoing Fund costs, including management fees, distribution and service (12b-1) fees, and other Fund expenses. All mutual funds have ongoing costs, sometimes referred to as operating expenses.
The following table shows ongoing costs of investing in the Fund and can help you understand these costs and compare them with those of other mutual funds. The table assumes a $1,000 investment held for the six months indicated.
Actual Fund Expenses
The first line (Actual) for each share class listed in the table provides actual account values and expenses. The “Ending Account Value” is derived from the Fund’s actual return, which includes the effect of Fund expenses.
You can estimate the expenses you paid during the period by following these steps. Of course, your account value and expenses will differ from those in this illustration:
| 1. | Divide your account value by $1,000. |
| | If an account had an $8,600 value, then $8,600 ÷ $1,000 = 8.6. |
| 2. | Multiply the result by the number under the heading “Expenses Paid During Period.” |
| | If Expenses Paid During Period were $7.50, then 8.6 x $7.50 = $64.50. |
In this illustration, the estimated expenses paid this period are $64.50.
Hypothetical Example for Comparison with Other Funds
Information in the second line (Hypothetical) for each class in the table can help you compare ongoing costs of investing in the Fund with those of other mutual funds. This information may not be used to estimate the actual ending account balance or expenses you paid during the period. The hypothetical “Ending Account Value” is based on the actual expense ratio for each class and an assumed 5% annual rate of return before expenses, which does not represent the Fund’s actual return. The figure under the heading “Expenses Paid During Period” shows the hypothetical expenses your account would have incurred under this scenario. You can compare this figure with the 5% hypothetical examples that appear in shareholder reports of other funds.
14 | Annual Report
Your Fund’s Expenses (continued)
Please note that expenses shown in the table are meant to highlight ongoing costs and do not reflect any transaction costs, such as sales charges. Therefore, the second line for each class is useful in comparing ongoing costs only, and will not help you compare total costs of owning different funds. In addition, if transaction costs were included, your total costs would have been higher. Please refer to the Fund prospectus for additional information on operating expenses.
Annual Report | 15
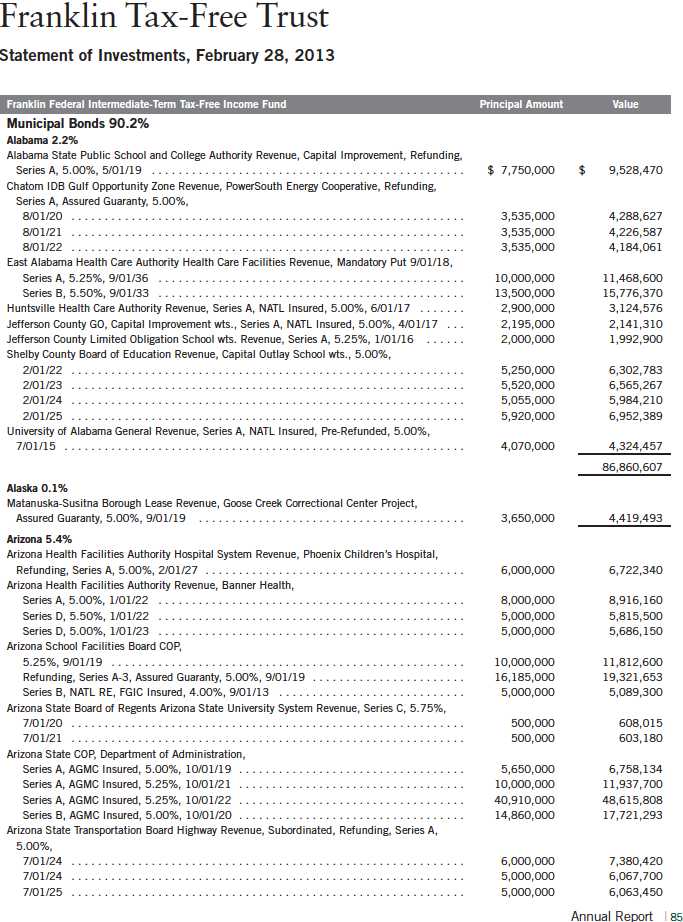
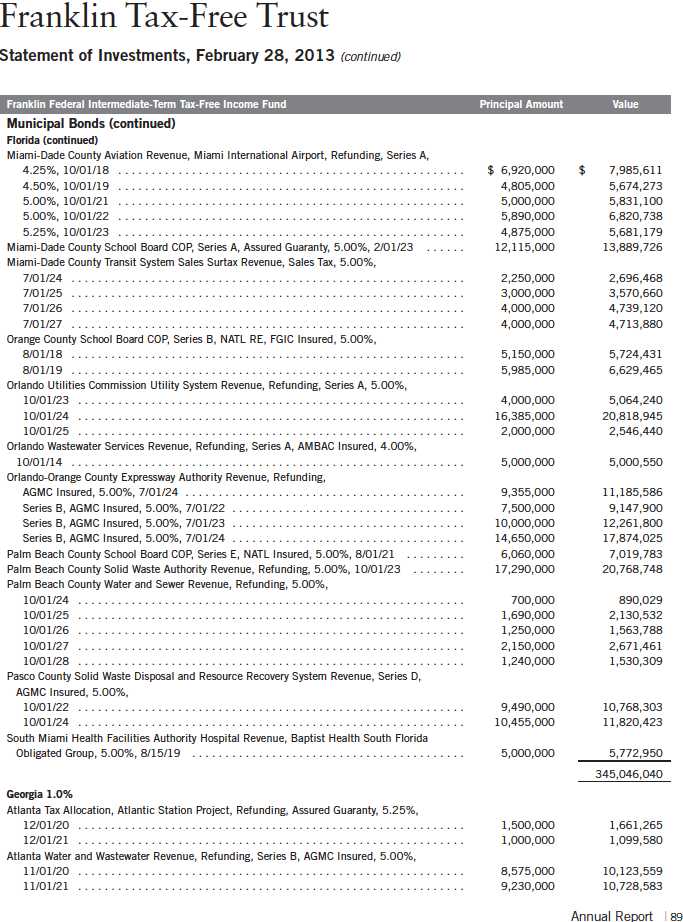
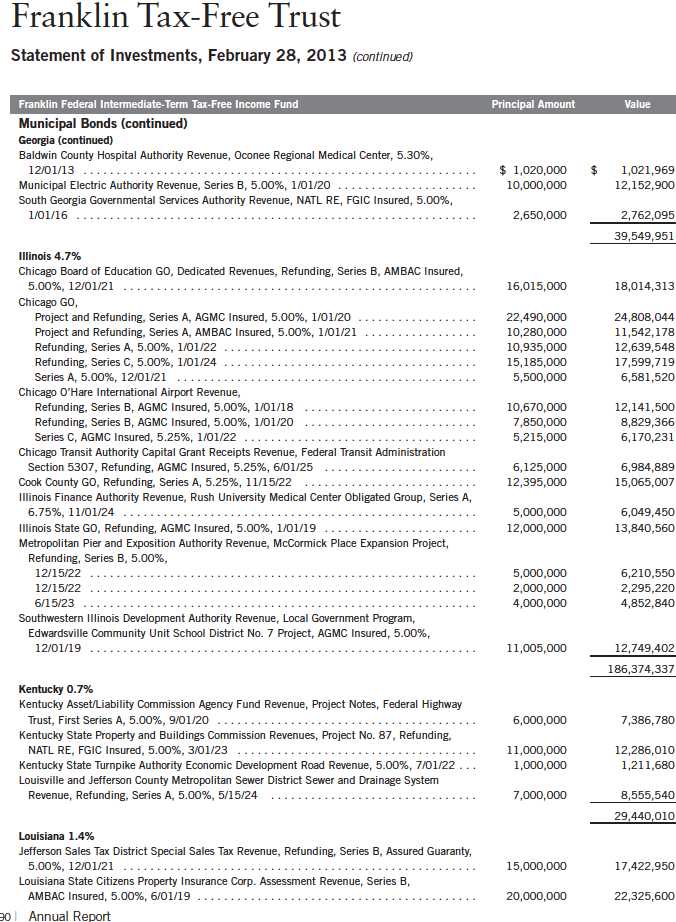
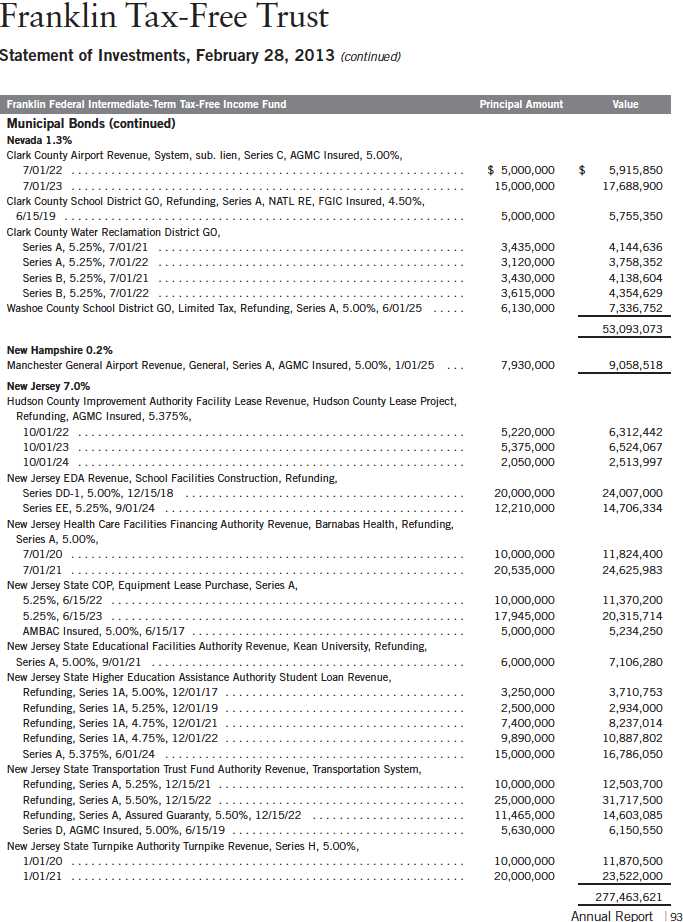
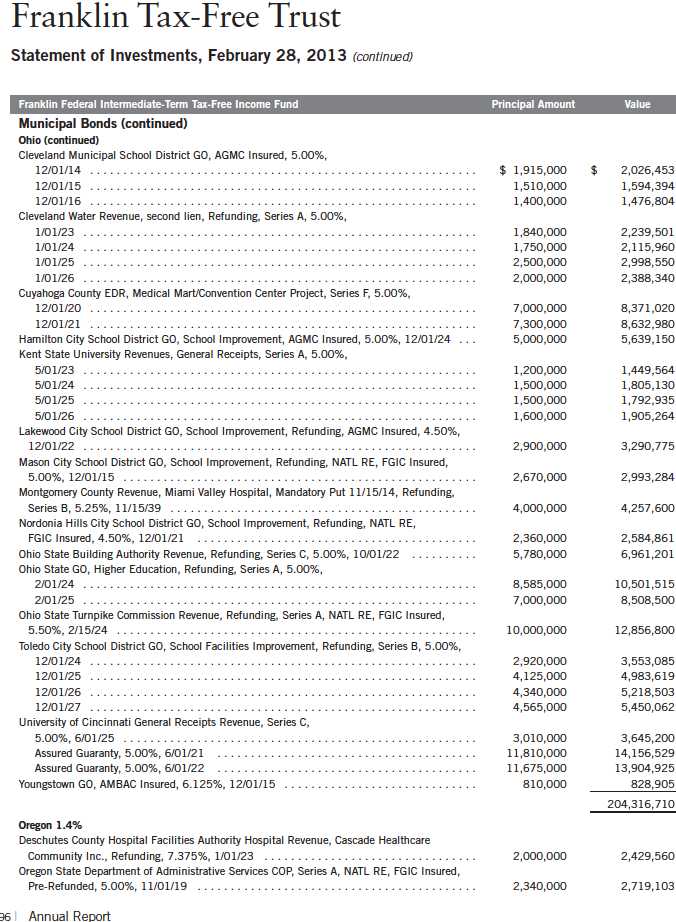
Franklin Federal Intermediate-Term Tax-Free Income Fund
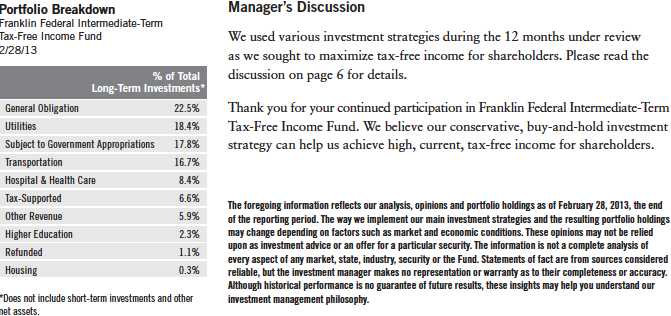
Your Fund’s Goal and Main Investments: Franklin Federal Intermediate-Term Tax-Free Income Fund seeks to provide as high a level of income exempt from federal income taxes as is consistent with prudent investment management and preservation of capital by investing at least 80% of its total assets in securities that pay interest free from such taxes.1 The Fund maintains a dollar-weighted average portfolio maturity (the time in which the debt must be repaid) of three to 10 years.
Performance data represent past performance, which does not guarantee future results. Investment return and principal value will fluctuate, and you may have a gain or loss when you sell your shares. Current performance may differ from figures shown. Please visit franklintempleton.com or call (800) 342-5236 for most recent month-end performance.
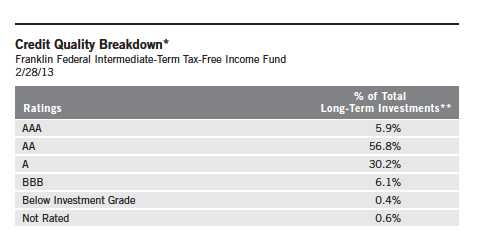
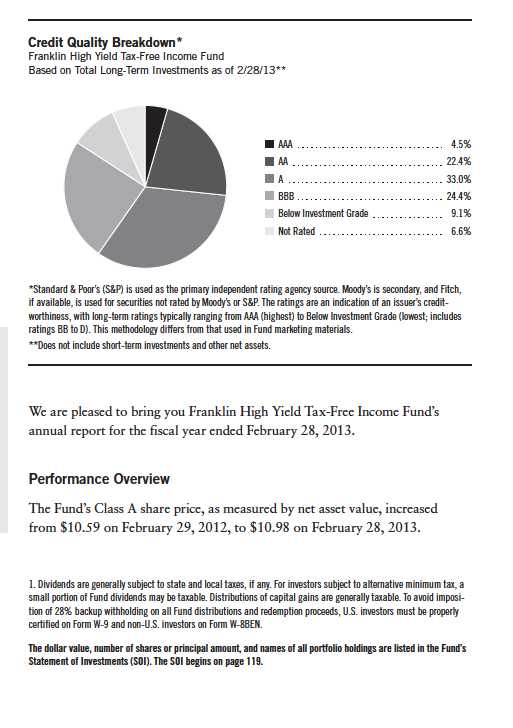
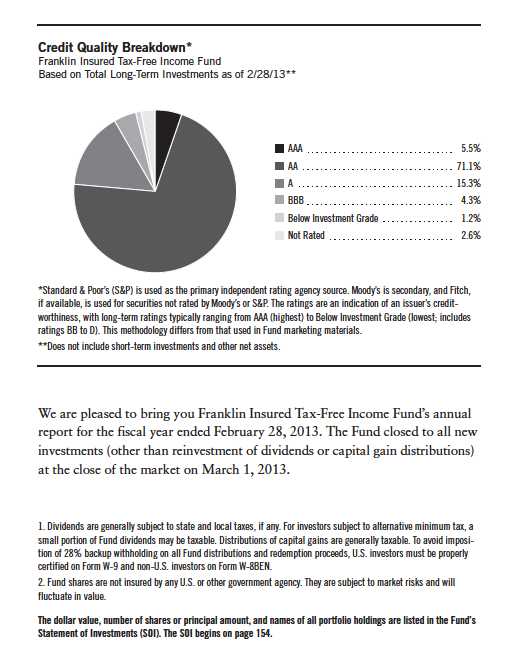
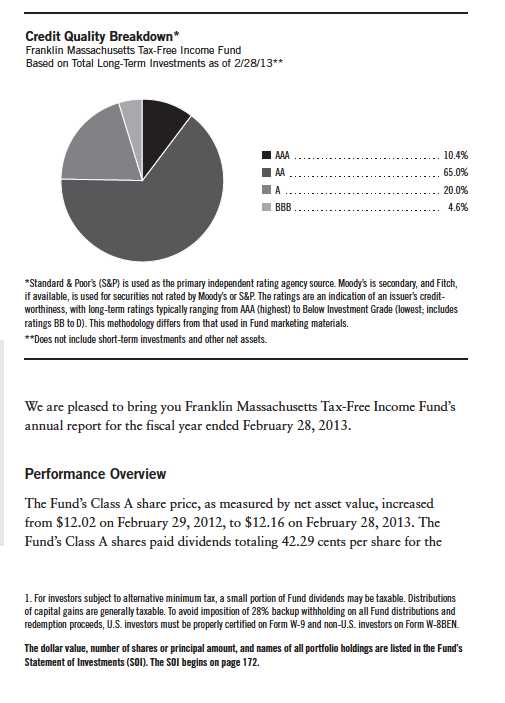
*Standard & Poor’s (S&P) is used as the primary independent rating agency source. Moody’s is secondary, and Fitch, if available, is used for securities not rated by Moody’s or S&P. The ratings are an indication of an issuer’s credit-worthiness, with long-term ratings typically ranging from AAA (highest) to Below Investment Grade (lowest; includes ratings BB to D). This methodology differs from that used in Fund marketing materials.
**Does not include short-term investments and other net assets.
We are pleased to bring you Franklin Federal Intermediate-Term Tax-Free Income Fund’s annual report for the fiscal year ended February 28, 2013.
Performance Overview
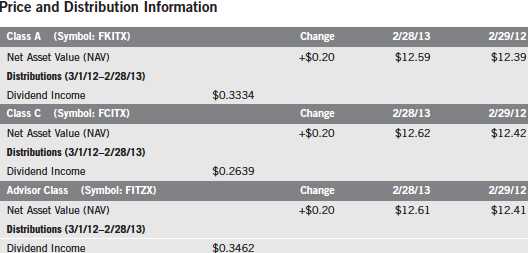
The Fund’s Class A share price, as measured by net asset value, increased from $12.39 on February 29, 2012, to $12.59 on February 28, 2013.
1. Dividends are generally subject to state and local taxes, if any. For investors subject to alternative minimum tax, a small portion of Fund dividends may be taxable. Distributions of capital gains are generally taxable. To avoid imposition of 28% backup withholding on all Fund distributions and redemption proceeds, U.S. investors must be properly certified on Form W-9 and non-U.S. investors on Form W-8BEN.
The dollar value, number of shares or principal amount, and names of all portfolio holdings are listed in the Fund’s Statement of Investments (SOI). The SOI begins on page 85.
16 | Annual Report
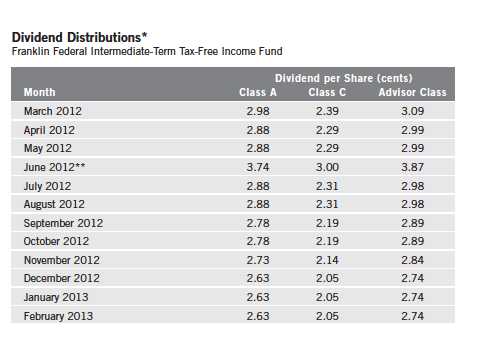
*Assumes shares were purchased and held for the entire accrual period. Prior to July 2012, this differed from the calendar month. Since dividends accrue daily, your actual distributions will vary depending on the date you purchased your shares and any account activity. All Fund distributions will vary depending upon current market conditions, and past distributions are not indicative of future trends.
**The June distribution reflects additional days in the accrual period.
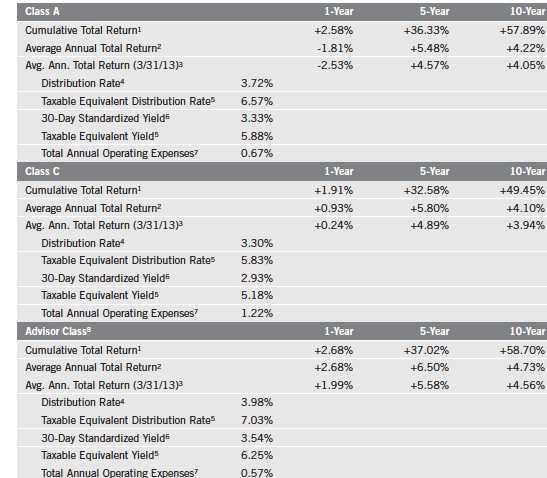
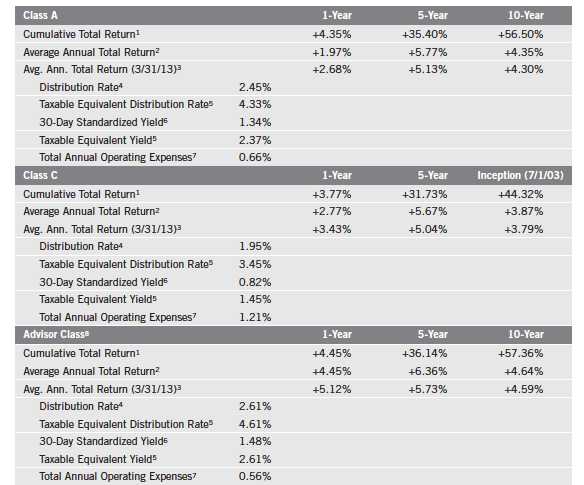
The Fund’s Class A shares paid dividends totaling 33.34 cents per share for the same period.2 The Performance Summary beginning on page 19 shows that at the end of this reporting period the Fund’s Class A shares’ distribution rate was 2.45%, based on an annualization of the 2.63 cent per share February dividend and the maximum offering price of $12.88 on February 28, 2013. An investor in the 2013 maximum federal income tax bracket of 39.60% (plus 3.8% Medicare tax) would need to earn a distribution rate of 4.33% from a taxable investment to match the Fund’s Class A tax-free distribution rate. For the Fund’s Class C and Advisor shares’ performance, please see the Performance Summary. The reduction in dividend distributions from the start to the end of the period under review reflected generally declining interest rates. Additionally, investor demand was strong for municipal bonds in an environment of limited tax-exempt supply. These factors resulted in reduced income for the portfolio and caused dividends to decline overall.
2. All Fund distributions will vary depending upon current market conditions, and past distributions are not indicative of future trends.
Annual Report | 17
18 | Annual Report
Performance Summary as of 2/28/13
Franklin Federal Intermediate-Term Tax-Free Income Fund
Your dividend income will vary depending on dividends or interest paid by securities in the Fund’s portfolio, adjusted for operating expenses of each class. Capital gain distributions are net profits realized from the sale of portfolio securities. The performance table and graphs do not reflect any taxes that a shareholder would pay on Fund dividends, capital gain distributions, if any, or any realized gains on the sale of Fund shares. Total return reflects reinvestment of the Fund’s dividends and capital gain distributions, if any, and any unrealized gains or losses.
Annual Report | 19
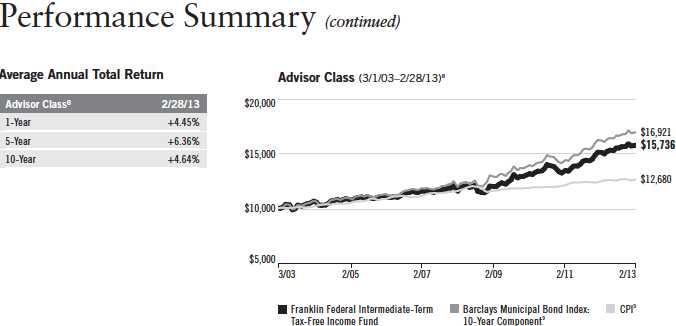
Performance Summary (continued)
Performance
Cumulative total return excludes sales charges. Average annual total returns include maximum sales charges. Class A: 2.25% maximum initial sales charge; Class C: 1% contingent deferred sales charge in first year only; Advisor Class: no sales charges.
Performance data represent past performance, which does not guarantee future results. Investment return and principal value will fluctuate, and you may have a gain or loss when you sell your shares. Current performance may differ from figures shown. For most recent month-end performance, go to franklintempleton.com or call (800) 342-5236.
20 | Annual Report
Performance Summary (continued)
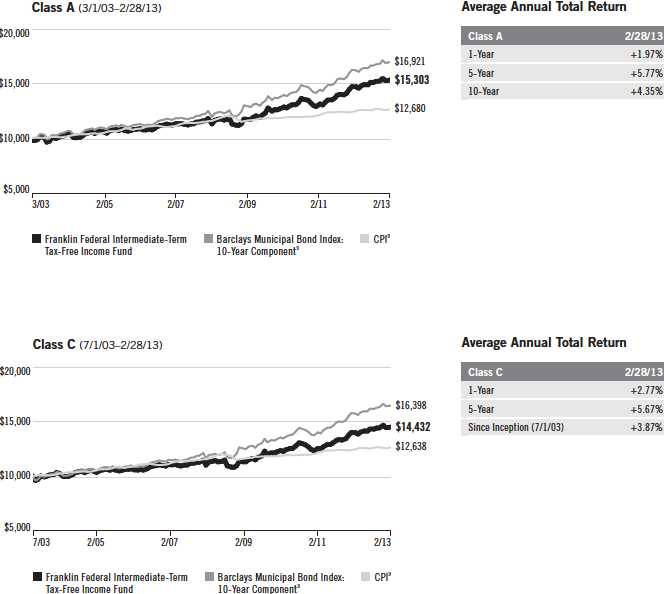
Total Return Index Comparison for a Hypothetical $10,000 Investment
Total return represents the change in value of an investment over the periods shown. It includes any current, applicable, maximum sales charge, Fund expenses, account fees and reinvested distributions. The unmanaged index includes reinvestment of any income or distributions. It differs from the Fund in composition and does not pay management fees or expenses. One cannot invest directly in an index.
Annual Report | 21
Endnotes
All investments involve risks, including possible loss of principal. Because municipal bonds are sensitive to interest rate movements, the Fund’s yield and share price will fluctuate with market conditions. Bond prices generally move in the opposite direction of interest rates. Thus, as prices of bonds in the Fund adjust to a rise in interest rates, the Fund’s share price may decline. Changes in the credit rating of a bond, or in the credit rating or financial strength of a bond’s issuer, insurer or guarantor, may affect the bond’s value. The Fund is actively managed but there is no guarantee that the manager’s investment decisions will produce the desired results. The Fund’s prospectus also includes a description of the main investment risks.
| |
Class C: | Prior to 1/1/04, these shares were offered with an initial sales charge; thus actual total returns would have differed. These shares have higher annual fees and expenses than Class A shares. |
| |
Advisor Class: | Shares are available to certain eligible investors as described in the prospectus. |
1. Cumulative total return represents the change in value of an investment over the periods indicated.
2. Average annual total return represents the average annual change in value of an investment over the periods indicated.
3. In accordance with SEC rules, we provide standardized average annual total return information through the latest calendar quarter.
4. Distribution rate is based on an annualization of the respective class’s February dividend and the maximum offering price (NAV for Classes C and Advisor) per share on 2/28/13.
5. Taxable equivalent distribution rate and yield assume the 2013 maximum federal income tax rate of 39.60% plus 3.8% Medicare tax.
6. The 30-day standardized yield for the month ended 2/28/13 reflects an estimated yield to maturity (assuming all portfolio securities are held to maturity). It should be regarded as an estimate of the Fund’s rate of investment income, and it may not equal the Fund’s actual income distribution rate (which reflects the Fund’s past dividends paid to shareholders) or the income reported in the Fund’s financial statements.
7. Figures are as stated in the Fund’s prospectus current as of the date of this report. In periods of market volatility, assets may decline significantly, causing total annual Fund operating expenses to become higher than the figures shown.
8. Effective 12/1/08, the Fund began offering Advisor Class shares, which do not have sales charges or a Rule 12b-1 plan. Performance quotations for this class reflect the following methods of calculation: (a) For periods prior to 12/1/08, a restated figure is used based upon the Fund’s Class A performance, excluding the effect of Class A’s maximum initial sales charge, but reflecting the effect of the Class A Rule 12b-1 fees; and (b) for periods after 12/1/08, actual Advisor Class performance is used reflecting all charges and fees applicable to that class. Since 12/1/08 (commencement of sales), the cumulative and average annual total returns of Advisor Class shares were +37.98% and +7.88%.
9. Source: © 2013 Morningstar. The Barclays Municipal Bond Index: 10-Year Component is the 10-year (8-12) component of the Municipal Bond Index, which is a market value-weighted index engineered for the long-term tax-exempt bond market. To be included in the index, bonds must be fixed rate, have at least one year to final maturity and be rated investment grade (Baa3/BBB- or higher) by at least two of the following agencies: Moody’s, Standard & Poor’s and Fitch. The Consumer Price Index (CPI), calculated by the Bureau of Labor Statistics, is a commonly used measure of the inflation rate.
22 | Annual Report
Your Fund’s Expenses
Franklin Federal Intermediate-Term Tax-Free Income Fund
As a Fund shareholder, you can incur two types of costs:
- Transaction costs, including sales charges (loads) on Fund purchases; and
- Ongoing Fund costs, including management fees, distribution and service (12b-1) fees, and other Fund expenses. All mutual funds have ongoing costs, sometimes referred to as operating expenses.
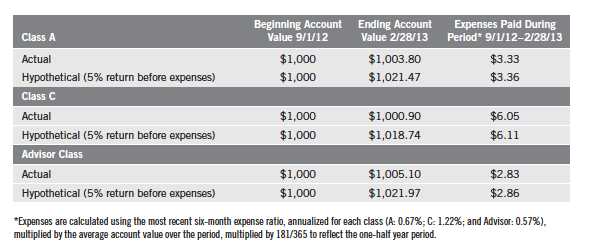
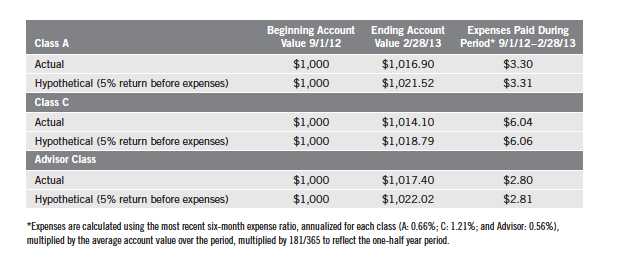
The following table shows ongoing costs of investing in the Fund and can help you understand these costs and compare them with those of other mutual funds. The table assumes a $1,000 investment held for the six months indicated.
Actual Fund Expenses
The first line (Actual) for each share class listed in the table provides actual account values and expenses. The “Ending Account Value” is derived from the Fund’s actual return, which includes the effect of Fund expenses.
You can estimate the expenses you paid during the period, by following these steps. Of course, your account value and expenses will differ from those in this illustration:
| 1. | Divide your account value by $1,000. |
| | If an account had an $8,600 value, then $8,600 ÷ $1,000 = 8.6. |
| 2. | Multiply the result by the number under the heading “Expenses Paid During Period.” |
| | If Expenses Paid During Period were $7.50, then 8.6 x $7.50 = $64.50. |
In this illustration, the estimated expenses paid this period are $64.50.
Hypothetical Example for Comparison with Other Funds
Information in the second line (Hypothetical) for each class in the table can help you compare ongoing costs of investing in the Fund with those of other mutual funds. This information may not be used to estimate the actual ending account balance or expenses you paid during the period. The hypothetical “Ending Account Value” is based on the actual expense ratio for each class and an assumed 5% annual rate of return before expenses, which does not represent the Fund’s actual return. The figure under the heading “Expenses Paid During Period” shows the hypothetical expenses your account would have incurred under this scenario. You can compare this figure with the 5% hypothetical examples that appear in shareholder reports of other funds.
Annual Report | 23
Your Fund’s Expenses (continued)
Please note that expenses shown in the table are meant to highlight ongoing costs and do not reflect any transaction costs, such as sales charge. Therefore, the second line for each class is useful in comparing ongoing costs only, and will not help you compare total costs of owning different funds. In addition, if transaction costs were included, your total costs would have been higher. Please refer to the Fund prospectus for additional information on operating expenses.
24 | Annual Report
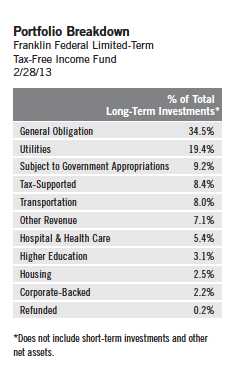
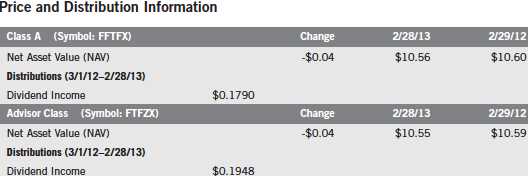
Franklin Federal Limited-Term Tax-Free Income Fund
Your Fund’s Goal and Main Investments: Franklin Federal Limited-Term Tax-Free Income Fund seeks to provide as high a level of income exempt from federal income taxes as is consistent with prudent investment management and preservation of capital by investing at least 80% of its total assets in securities that pay interest free from such taxes.1 The Fund maintains a dollar-weighted average portfolio maturity (the time in which the debt must be repaid) of five years or less.
Performance data represent past performance, which does not guarantee future results. Investment return and principal value will fluctuate, and you may have a gain or loss when you sell your shares. Current performance may differ from figures shown. Please visit franklintempleton.com or call (800) 342-5236 for most recent month-end performance.

*Standard & Poor’s (S&P) is used as the primary independent rating agency source. Moody’s is secondary, and Fitch, if available, is used for securities not rated by Moody’s or S&P. The ratings are an indication of an issuer’s credit-worthiness, with short-term ratings typically ranging from SP-1 and MIG 1 (highest) to SP-3 and SG (lowest) and long-term ratings typically ranging from AAA (highest) to Below Investment Grade (lowest; includes ratings BB to D). This methodology differs from that used in Fund marketing materials.
**Does not include short-term investments and other net assets.
This annual report for Franklin Federal Limited-Term Tax-Free Income Fund covers the fiscal year ended February 28, 2013.
Performance Overview
The Fund’s Class A share price, as measured by net asset value, decreased from $10.60 on February 29, 2012, to $10.56 on February 28, 2013.
1. Dividends are generally subject to state and local taxes, if any. For investors subject to alternative minimum tax, a small portion of Fund dividends may be taxable. Distributions of capital gains are generally taxable. To avoid imposition of 28% backup withholding on all Fund distributions and redemption proceeds, U.S. investors must be properly certified on Form W-9 and non-U.S. investors on Form W-8BEN.
The dollar value, number of shares or principal amount, and names of all portfolio holdings are listed in the Fund’s Statement of Investments (SOI). The SOI begins on page 105.
Annual Report | 25
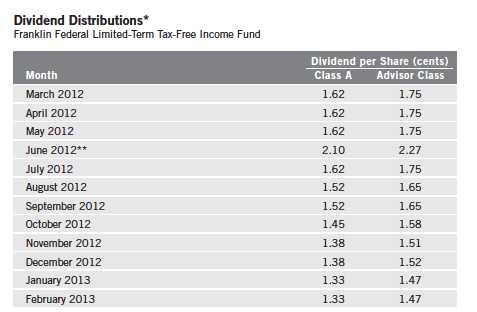
*Assumes shares were purchased and held for the entire accrual period. Prior to July 2012, this differed from the calendar month. Since dividends accrue daily, your actual distributions will vary depending on the date you purchased your shares and any account activity. All Fund distributions will vary depending upon current market conditions, and past distributions are not indicative of future trends.
**The June distribution reflects additional days in the accrual period.
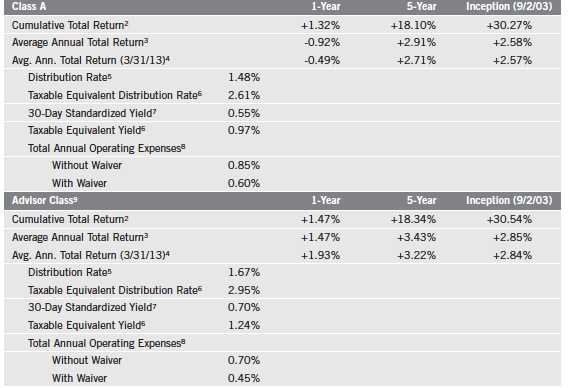
The Fund’s Class A shares paid dividends totaling 17.90 cents per share for the same period.2 The Performance Summary beginning on page 28 shows that at the end of this reporting period the Fund’s Class A shares’ distribution rate was 1.48%, based on an annualization of the 1.33 cent per share February dividend and the maximum offering price of $10.80 on February 28, 2013. An investor in the 2013 maximum federal income tax bracket of 39.60% (plus 3.8% Medicare tax) would need to earn a distribution rate of 2.61% from a taxable investment to match the Fund’s Class A tax-free distribution rate. For the Fund’s Advisor Class shares’ performance, please see the Performance Summary. The reduction in dividend distributions from the start to the end of the period under review reflected generally declining interest rates. Additionally, investor demand was strong for municipal bonds in an environment of limited tax-exempt supply. These factors resulted in reduced income for the portfolio and caused dividends to decline overall.
2. All Fund distributions will vary depending upon current market conditions, and past distributions are not indicative of future trends.
26 | Annual Report
Manager’s Discussion
We used various investment strategies during the 12 months under review as we sought to maximize tax-free income for shareholders. Please read the discussion on page 6 for details.
Consistent with our investment strategy, we invested in bonds we believed could provide the most relative value from an income perspective. Seeking a dollar-weighted average portfolio maturity of five years or less, we concentrated in the one- to five-year range in an effort to insulate investors against bond market volatility. As a result of our strategy, we believe the Fund was positioned to be less sensitive to interest rate changes, preserve capital and produce tax-free income.
Thank you for your continued participation in Franklin Federal Limited-Term Tax-Free Income Fund. We believe our conservative, buy-and-hold investment strategy can help us achieve high, current, tax-free income for shareholders.
The foregoing information reflects our analysis, opinions and portfolio holdings as of February 28, 2013, the end of the reporting period. The way we implement our main investment strategies and the resulting portfolio holdings may change depending on factors such as market and economic conditions. These opinions may not be relied upon as investment advice or an offer for a particular security. The information is not a complete analysis of every aspect of any market, state, industry, security or the Fund. Statements of fact are from sources considered reliable, but the investment manager makes no representation or warranty as to their completeness or accuracy. Although historical performance is no guarantee of future results, these insights may help you understand our investment management philosophy.
Annual Report | 27
Performance Summary as of 2/28/13
Franklin Federal Limited-Term Tax-Free Income Fund
Your dividend income will vary depending on dividends or interest paid by securities in the Fund’s portfolio, adjusted for operating expenses of each class. Capital gain distributions are net profits realized from the sale of portfolio securities. The performance table and graphs do not reflect any taxes that a shareholder would pay on Fund dividends, capital gain distributions, if any, or any realized gains on the sale of Fund shares. Total return reflects reinvestment of the Fund’s dividends and capital gain distributions, if any, and any unrealized gains or losses.
28 | Annual Report
Performance Summary (continued)
Performance1
Cumulative total return excludes sales charges. Average annual total returns include maximum sales charges. Class A: 2.25% maximum initial sales charge; Advisor Class: no sales charges.
Performance data represent past performance, which does not guarantee future results. Investment return and principal value will fluctuate, and you may have a gain or loss when you sell your shares. Current performance may differ from figures shown. For most recent month-end performance, go to franklintempleton.com or call (800) 342-5236.
The investment manager and administrator have contractually agreed to waive or assume certain expenses so that common expenses (excluding Rule 12b-1 fees and acquired fund fees and expenses) for each class of the Fund do not exceed 0.45% (other than certain nonroutine expenses) until 6/30/13.
Annual Report | 29
Performance Summary (continued)
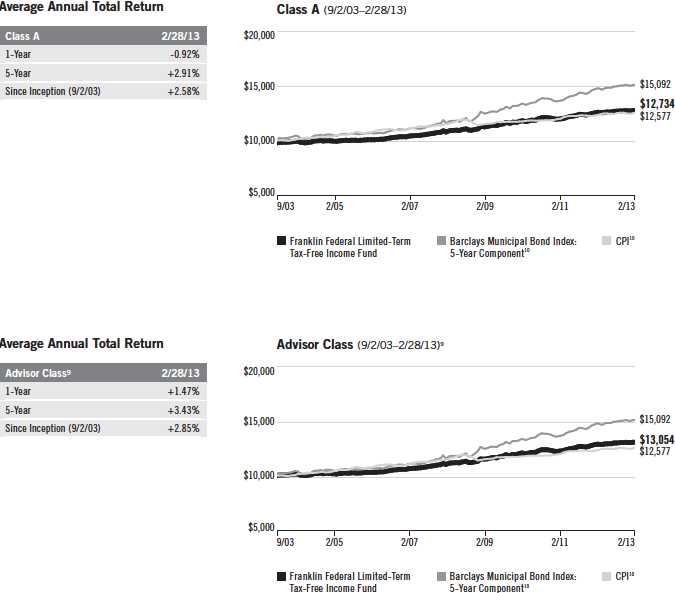
Total Return Index Comparison for a Hypothetical $10,000 Investment
Total return represents the change in value of an investment over the periods shown. It includes any current maximum sales charge, Fund expenses, account fees and reinvested distributions. The unmanaged index includes reinvestment of any income or distributions. It differs from the Fund in composition and does not pay management fees or expenses. One cannot invest directly in an index.
30 | Annual Report
Performance Summary (continued)
Endnotes
All investments involve risks, including possible loss of principal. Because municipal bonds are sensitive to interest rate movements, the Fund’s yield and share price will fluctuate with market conditions. Bond prices generally move in the opposite direction of interest rates. Thus, as prices of bonds in the Fund adjust to a rise in interest rates, the Fund’s share price may decline. Changes in the credit rating of a bond, or in the credit rating or financial strength of a bond’s issuer, insurer or guarantor, may affect the bond’s value. The Fund is actively managed but there is no guarantee that the manager’s investment decisions will produce the desired results. The Fund’s prospectus also includes a description of the main investment risks.
Class A: Prior to 2/1/06, these shares were offered without an initial sales charge; thus actual total returns would have differed.
Advisor Class: Shares are available to certain eligible investors as described in the prospectus.
1. Fund investment results reflect the expense reduction, without which the results would have been lower and yields for the period would have been 0.31% for Class A and 0.46% for Advisor Class.
2. Cumulative total return represents the change in value of an investment over the periods indicated.
3. Average annual total return represents the average annual change in value of an investment over the periods indicated.
4. In accordance with SEC rules, we provide standardized average annual total return information through the latest calendar quarter.
5. Distribution rate is based on an annualization of the respective class’s February dividend and the maximum offering price (NAV for Advisor Class) per share on 2/28/13.
6. Taxable equivalent distribution rate and yield assume the 2013 maximum federal income tax rate of 39.60% plus 3.8% Medicare tax.
7. The 30-day standardized yield for the month ended 2/28/13 reflects an estimated yield to maturity (assuming all portfolio securities are held to maturity). It should be regarded as an estimate of the Fund’s rate of investment income, and it may not equal the Fund’s actual income distribution rate (which reflects the Fund’s past dividends paid to shareholders) or the income reported in the Fund’s financial statements.
8. Figures are as stated in the Fund’s prospectus current as of the date of this report. In periods of market volatility, assets may decline significantly, causing total annual Fund operating expenses to become higher than the figures shown.
9. Effective 2/1/11, the Fund began offering Advisor Class shares, which do not have sales charges or a Rule 12b-1 plan. Performance quotations for this class reflect the following methods of calculation: (a) For periods prior to 2/1/11, a restated figure is used based upon the Fund’s Class A performance, excluding the effect of Class A’s maximum initial sales charge, but reflecting the effect of the Class A Rule 12b-1 fees; and (b) for periods after 2/1/11, actual Advisor Class performance is used reflecting all charges and fees applicable to that class. Since 2/1/11 (commencement of sales), the cumulative and average annual total returns of Advisor Class shares were +6.89% and +3.27%.
10. Source: © 2013 Morningstar. The Barclays Municipal Bond Index: 5-Year Component is the 5-year (4-6) component of the Municipal Bond Index, which is a market value-weighted index engineered for the long-term tax-exempt bond market. To be included in the index, bonds must be fixed rate, have at least one year to final maturity and be rated investment grade (Baa3/BBB- or higher) by at least two of the following agencies: Moody’s, Standard & Poor’s and Fitch. The Consumer Price Index (CPI), calculated by the Bureau of Labor Statistics, is a commonly used measure of the inflation rate.
Annual Report | 31
Your Fund’s Expenses
Franklin Federal Limited-Term Tax-Free Income Fund
As a Fund shareholder, you can incur two types of costs:
- Transaction costs, including sales charges (loads) on Fund purchases; and
- Ongoing Fund costs, including management fees, distribution and service (12b-1) fees, and other Fund expenses. All mutual funds have ongoing costs, sometimes referred to as operating expenses.
The following table shows ongoing costs of investing in the Fund and can help you understand these costs and compare them with those of other mutual funds. The table assumes a $1,000 investment held for the six months indicated.
Actual Fund Expenses
The first line (Actual) for each share class listed in the table provides actual account values and expenses. The “Ending Account Value” is derived from the Fund’s actual return, which includes the effect of Fund expenses.
You can estimate the expenses you paid during the period by following these steps. Of course, your account value and expenses will differ from those in this illustration:
| 1. | Divide your account value by $1,000. |
| | If an account had an $8,600 value, then $8,600 ÷ $1,000 = 8.6. |
| 2. | Multiply the result by the number under the heading “Expenses Paid During Period.” |
| | If Expenses Paid During Period were $7.50, then 8.6 x $7.50 = $64.50. |
In this illustration, the estimated expenses paid this period are $64.50.
Hypothetical Example for Comparison with Other Funds
Information in the second line (Hypothetical) for each class in the table can help you compare ongoing costs of investing in the Fund with those of other mutual funds. This information may not be used to estimate the actual ending account balance or expenses you paid during the period. The hypothetical “Ending Account Value” is based on the actual expense ratio for each class and an assumed 5% annual rate of return before expenses, which does not represent the Fund’s actual return. The figure under the heading “Expenses Paid During Period” shows the hypothetical expenses your account would have incurred under this scenario. You can compare this figure with the 5% hypothetical examples that appear in shareholder reports of other funds.
32 | Annual Report
Your Fund’s Expenses (continued)
Please note that expenses shown in the table are meant to highlight ongoing costs and do not reflect any transaction costs, such as sales charges. Therefore, the second line for each class is useful in comparing ongoing costs only, and will not help you compare total costs of owning different funds. In addition, if transaction costs were included, your total costs would have been higher. Please refer to the Fund prospectus for additional information on operating expenses.

*Expenses are calculated using the most recent six-month expense ratio, net of expense waivers, annualized for each class, (A: 0.60% and Advisor: 0.45%), multiplied by the average account value over the period, multiplied by 181/365 to reflect the one-half year period.
Annual Report | 33
Franklin High Yield Tax-Free Income Fund
Your Fund’s Goals and Main Investments: Franklin High Yield Tax-Free Income Fund seeks to provide a high current yield exempt from federal income taxes by investing at least 80% of its net assets in securities that pay interest free from such taxes.1 Its secondary goal is capital appreciation to the extent possible and consistent with the Fund’s principal investment goal.
Performance data represent past performance, which does not guarantee future results. Investment return and principal value will fluctuate, and you may have a gain or loss when you sell your shares. Current performance may differ from figures shown. Please visit franklintempleton.com or call (800) 342-5236 for most recent month-end performance.
34 | Annual Report
*Assumes shares were purchased and held for the entire accrual period. Prior to July 2012, this differed from the calendar month. Since dividends accrue daily, your actual distributions will vary depending on the date you purchased your shares and any account activity. All Fund distributions will vary depending upon current market conditions, and past distributions are not indicative of future trends.
**The June distribution reflects additional days in the accrual period.
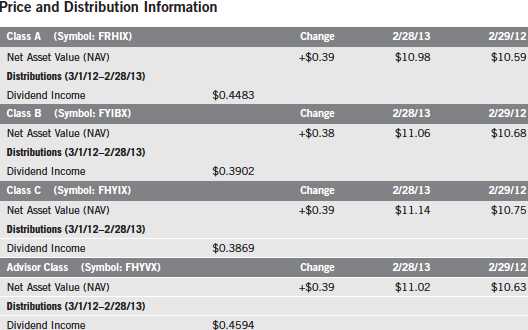
The Fund’s Class A shares paid dividends totaling 44.83 cents per share for the same period.2 The Performance Summary beginning on page 37 shows that at the end of this reporting period the Fund’s Class A shares’ distribution rate was 3.72%, based on an annualization of the 3.55 cent per share February dividend and the maximum offering price of $11.47 on February 28, 2013. An investor in the 2013 maximum federal income tax bracket of 39.60% (plus 3.8% Medicare tax) would need to earn a distribution rate of 6.57% from a taxable investment to match the Fund’s Class A tax-free distribution rate. For the Fund’s Class B, C and Advisor shares’ performance, please see the Performance Summary. The reduction in dividend distributions from the start to the end of the period under review reflected generally declining interest rates. Additionally, investor demand was strong for municipal bonds in an environment of limited tax-exempt supply. These factors resulted in reduced income for the portfolio and caused dividends to decline overall.
2. All Fund distributions will vary depending upon current market conditions, and past distributions are not indicative of future trends.
Annual Report | 35
Manager’s Discussion
We used various investment strategies during the 12 months under review as we sought to maximize tax-free income for shareholders. Please read the discussion on page 6 for details.
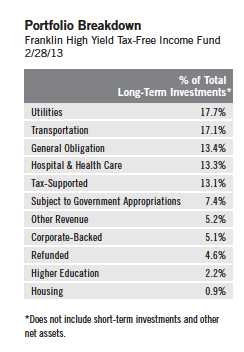
During the reporting period, the Fund continued to generate high, current, tax-free income for its shareholders. Consistent with our strategy, the Fund did not use leverage or credit derivatives to boost short-term returns, and we were careful to not overexpose the portfolio to any one credit sector.
Thank you for your continued participation in Franklin High Yield Tax-Free Income Fund. We believe our conservative, buy-and-hold investment strategy can help us achieve high, current, tax-free income for shareholders.
The foregoing information reflects our analysis, opinions and portfolio holdings as of February 28, 2013, the end of the reporting period. The way we implement our main investment strategies and the resulting portfolio holdings may change depending on factors such as market and economic conditions. These opinions may not be relied upon as investment advice or an offer for a particular security. The information is not a complete analysis of every aspect of any market, state, industry, security or the Fund. Statements of fact are from sources considered reliable, but the investment manager makes no representation or warranty as to their completeness or accuracy. Although historical performance is no guarantee of future results, these insights may help you understand our investment management philosophy.
36 | Annual Report
Performance Summary as of 2/28/13
Franklin High Yield Tax-Free Income Fund
Your dividend income will vary depending on dividends or interest paid by securities in the Fund’s portfolio, adjusted for operating expenses of each class. Capital gain distributions are net profits realized from the sale of portfolio securities. The performance table and graphs do not reflect any taxes that a shareholder would pay on Fund dividends, capital gain distributions, if any, or any realized gains on the sale of Fund shares. Total return reflects reinvestment of the Fund’s dividends and capital gain distributions, if any, and any unrealized gains or losses.
Annual Report | 37
Performance Summary (continued)
Performance
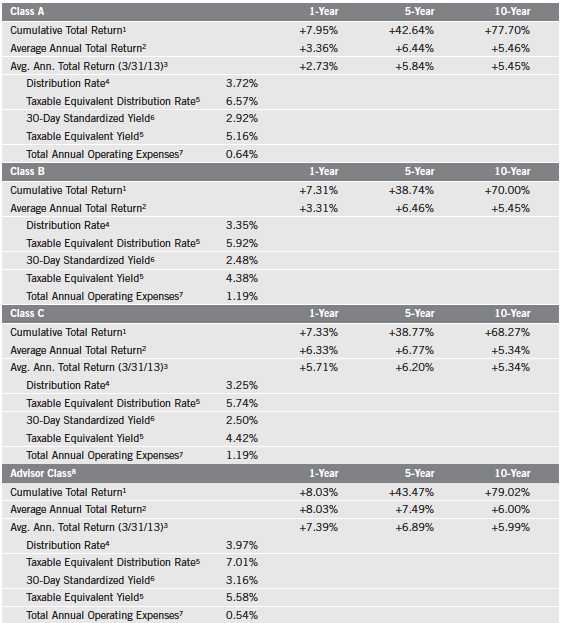
Cumulative total return excludes sales charges. Average annual total returns include maximum sales charges. Class A: 4.25% maximum initial sales charge; Class B: contingent deferred sales charge (CDSC) declining from 4% to 1% over six years, and eliminated thereafter; Class C: 1% CDSC in first year only; Advisor Class: no sales charges.
Performance data represent past performance, which does not guarantee future results. Investment return and principal value will fluctuate, and you may have a gain or loss when you sell your shares. Current performance may differ from figures shown. For most recent month-end performance, go to franklintempleton.com or call (800) 342-5236.
38 | Annual Report
Performance Summary (continued)
Total Return Index Comparison for a Hypothetical $10,000 Investment
Total return represents the change in value of an investment over the periods shown. It includes any current, applicable, maximum sales charge, Fund expenses, account fees and reinvested distributions. The unmanaged index includes reinvestment of any income or distributions. It differs from the Fund in composition and does not pay management fees or expenses. One cannot invest directly in an index.

Annual Report | 39

40 | Annual Report
Performance Summary (continued)
Endnotes
All investments involve risks, including possible loss of principal. Because municipal bonds are sensitive to interest rate movements, the Fund’s yield and share price will fluctuate with market conditions. Bond prices generally move in the opposite direction of interest rates. Thus, as prices of bonds in the Fund adjust to a rise in interest rates, the Fund’s share price may decline. In general, an investor is paid a higher yield to assume a greater degree of credit risk. Changes in the credit rating of a bond, or in the credit rating or financial strength of a bond’s issuer, insurer or guarantor, may affect the bond’s value. The Fund is actively managed but there is no guarantee that the manager’s investment decisions will produce the desired results. The Fund’s prospectus also includes a description of the main investment risks.
| |
Class B: Class C: | These shares have higher annual fees and expenses than Class A shares. Prior to 1/1/04, these shares were offered with an initial sales charge; thus actual total returns would have differed. These shares have higher annual fees and expenses than Class A shares. |
Advisor Class: | Shares are available to certain eligible investors as described in the prospectus. |
1. Cumulative total return represents the change in value of an investment over the periods indicated.
2. Average annual total return represents the average annual change in value of an investment over the periods indicated.
3. In accordance with SEC rules, we provide standardized average annual total return information through the latest calendar quarter. For Class B shares, 3/31/13 performance data are not available – all Class B shares were converted to Class A shares before the end of the quarter.
4. Distribution rate is based on an annualization of the respective class’s February dividend and the maximum offering price (NAV for Classes B, C and Advisor) per share on 2/28/13.
5. Taxable equivalent distribution rate and yield assume the 2013 maximum federal income tax rate of 39.60% plus 3.8% Medicare tax.
6. The 30-day standardized yield for the month ended 2/28/13 reflects an estimated yield to maturity (assuming all portfolio securities are held to maturity). It should be regarded as an estimate of the Fund’s rate of investment income, and it may not equal the Fund’s actual income distribution rate (which reflects the Fund’s past dividends paid to shareholders) or the income reported in the Fund’s financial statements.
7. Figures are as stated in the Fund’s prospectus current as of the date of this report. In periods of market volatility, assets may decline significantly, causing total annual Fund operating expenses to become higher than the figures shown.
8. Effective 1/3/06, the Fund began offering Advisor Class shares, which do not have sales charges or a Rule 12b-1 plan. Performance quotations for this class reflect the following methods of calculation: (a) For periods prior to 1/3/06, a restated figure is used based upon the Fund’s Class A performance, excluding the effect of Class A’s maximum initial sales charge, but reflecting the effect of the Class A Rule 12b-1 fees; and (b) for periods after 1/3/06, actual Advisor Class performance is used reflecting all charges and fees applicable to that class. Since 1/3/06 (commencement of sales), the cumulative and average annual total returns of Advisor Class shares were +48.01% and +5.63%.
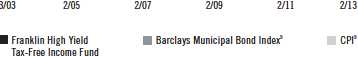
9. Source: © 2013 Morningstar. The Barclays Municipal Bond Index is a market value-weighted index engineered for the long-term tax-exempt bond market. To be included in the index, bonds must be fixed rate, have at least one year to final maturity and be rated investment grade (Baa3/BBB-or higher) by at least two of the following agencies: Moody’s, Standard & Poor’s and Fitch. The Consumer Price Index (CPI), calculated by the Bureau of Labor Statistics, is a commonly used measure of the inflation rate.
Annual Report | 41
Your Fund’s Expenses
Franklin High Yield Tax-Free Income Fund
As a Fund shareholder, you can incur two types of costs:
- Transaction costs, including sales charges (loads) on Fund purchases; and
- Ongoing Fund costs, including management fees, distribution and service (12b-1) fees, and other Fund expenses. All mutual funds have ongoing costs, sometimes referred to as operating expenses.
The following table shows ongoing costs of investing in the Fund and can help you understand these costs and compare them with those of other mutual funds. The table assumes a $1,000 investment held for the six months indicated.
Actual Fund Expenses
The first line (Actual) for each share class listed in the table provides actual account values and expenses. The “Ending Account Value” is derived from the Fund’s actual return, which includes the effect of Fund expenses.
You can estimate the expenses you paid during the period by following these steps. Of course, your account value and expenses will differ from those in this illustration:
| 1. | Divide your account value by $1,000. |
| | If an account had an $8,600 value, then $8,600 ÷ $1,000 = 8.6. |
| 2. | Multiply the result by the number under the heading “Expenses Paid During Period.” |
| | If Expenses Paid During Period were $7.50, then 8.6 x $7.50 = $64.50. |
In this illustration, the estimated expenses paid this period are $64.50.
Hypothetical Example for Comparison with Other Funds
Information in the second line (Hypothetical) for each class in the table can help you compare ongoing costs of investing in the Fund with those of other mutual funds. This information may not be used to estimate the actual ending account balance or expenses you paid during the period. The hypothetical “Ending Account Value” is based on the actual expense ratio for each class and an assumed 5% annual rate of return before expenses, which does not represent the Fund’s actual return. The figure under the heading “Expenses Paid During Period” shows the hypothetical expenses your account would have incurred under this scenario. You can compare this figure with the 5% hypothetical examples that appear in shareholder reports of other funds.
42 | Annual Report
Your Fund’s Expenses (continued)
Please note that expenses shown in the table are meant to highlight ongoing costs and do not reflect any transaction costs, such as sales charges. Therefore, the second line for each class is useful in comparing ongoing costs only, and will not help you compare total costs of owning different funds. In addition, if transaction costs were included, your total costs would have been higher. Please refer to the Fund prospectus for additional information on operating expenses.
*Expenses are calculated using the most recent six-month expense ratio, annualized for each class (A: 0.65%; B: 1.18%; C: 1.20%; and Advisor: 0.55%), multiplied by the average account value over the period, multiplied by 181/365 to reflect the one-half year period.
Annual Report | 43
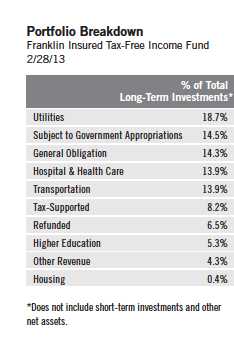
Franklin Insured Tax-Free Income Fund
Your Fund’s Goal and Main Investments: Franklin Insured Tax-Free Income Fund seeks to provide as high a level of income exempt from federal income taxes as is consistent with prudent investment management and preservation of capital by investing at least 80% of its total assets in securities that pay interest free from such taxes.1 The Fund invests predominantly in insured municipal securities.2
44 | Annual Report
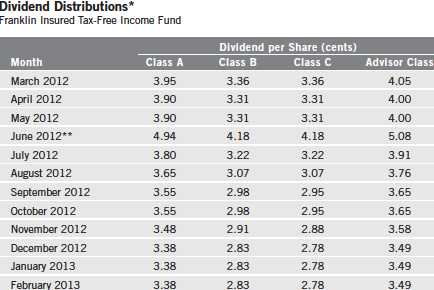
*Assumes shares were purchased and held for the entire accrual period. Prior to July 2012, this differed from the calendar month. Since dividends accrue daily, your actual distributions will vary depending on the date you purchased your shares and any account activity. All Fund distributions will vary depending upon current market conditions, and past distributions are not indicative of future trends.
**The June distribution reflects additional days in the accrual period.
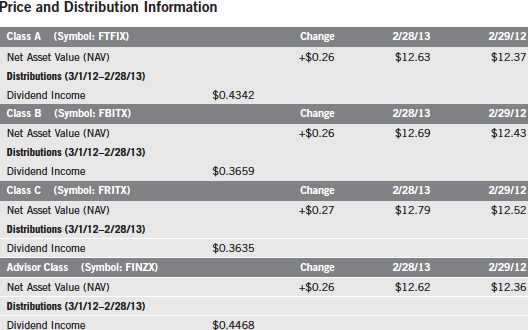
Performance Overview
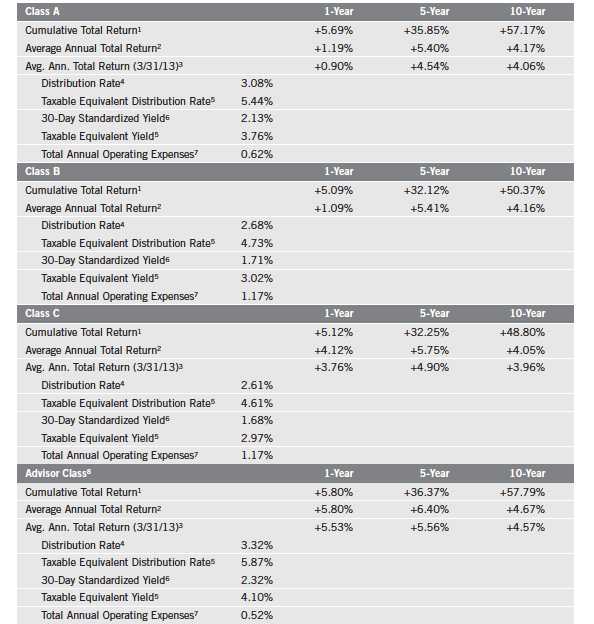
The Fund’s Class A share price, as measured by net asset value, increased from $12.37 on February 29, 2012, to $12.63 on February 28, 2013. The Fund’s Class A shares paid dividends totaling 43.42 cents per share for the same period.3 The Performance Summary beginning on page 47 shows that at the end of this reporting period the Fund’s Class A shares’ distribution rate was 3.08%, based on an annualization of the 3.38 cent per share February dividend and the maximum offering price of $13.19 on February 28, 2013. An investor in the 2013 maximum federal income tax bracket of 39.60% (plus 3.8% Medicare tax) would need to earn a distribution rate of 5.44% from a taxable investment to match the Fund’s Class A tax-free distribution rate. For the Fund’s Class B, C and Advisor shares’ performance, please see the Performance Summary. The reduction in dividend distributions from the start to the end of the period under review reflected generally declining interest rates. Additionally, investor demand was strong for municipal bonds in an environment of limited tax-exempt supply. These factors resulted in reduced income for the portfolio and caused dividends to decline overall.
3. All Fund distributions will vary depending upon current market conditions, and past distributions are not indicative of future trends.
Performance data represent past performance, which does not guarantee future results. Investment return and principal value will fluctuate, and you may have a gain or loss when you sell your shares. Current performance may differ from figures shown. Please visit franklintempleton.com or call (800) 342-5236 for most recent month-end performance.
Annual Report | 45
Manager’s Discussion
We used various investment strategies during the 12 months under review as we sought to maximize tax-free income for shareholders. Please read the discussion on page 6 for details.
During the reporting period, we limited Fund purchases to bonds insured by Assured Guaranty and non-insured bonds rated AA or higher by independent credit rating agencies. Since the 2008 financial crisis, rating agencies have lowered or withdrawn their ratings on most municipal bond insurers, and certain municipal bond insurers have withdrawn from the market or ceased writing new policies. Insurance penetration in the municipal bond market has greatly decreased, with fewer qualified bond insurers (rated BBB or better) offering insurance on new issues of municipal securities. These circumstances have led to a decrease in the supply of insured municipal securities and a consolidation among municipal bond insurers, thereby concentrating the insurance company credit risk with respect to securities in the Fund’s portfolio among fewer municipal bond insurers. Accordingly, effective at the close of the market on March 1, 2013, the Fund was closed to all new investments (other than reinvestment of dividends or capital gain distributions).
Thank you for your continued participation in Franklin Insured Tax-Free Income Fund. We believe our conservative, buy-and-hold investment strategy can help us achieve high, current, tax-free income for shareholders.
The foregoing information reflects our analysis, opinions and portfolio holdings as of February 28, 2013, the end of the reporting period. The way we implement our main investment strategies and the resulting portfolio holdings may change depending on factors such as market and economic conditions. These opinions may not be relied upon as investment advice or an offer for a particular security. The information is not a complete analysis of every aspect of any market, state, industry, security or the Fund. Statements of fact are from sources considered reliable, but the investment manager makes no representation or warranty as to their completeness or accuracy. Although historical performance is no guarantee of future results, these insights may help you understand our investment management philosophy.
46 | Annual Report
Performance Summary as of 2/28/13
Franklin Insured Tax-Free Income Fund
Your dividend income will vary depending on dividends or interest paid by securities in the Fund’s portfolio, adjusted for operating expenses of each class. Capital gain distributions are net profits realized from the sale of portfolio securities. The performance table and graphs do not reflect any taxes that a shareholder would pay on Fund dividends, capital gain distributions, if any, or any realized gains on the sale of Fund shares. Total return reflects reinvestment of the Fund’s dividends and capital gain distributions, if any, and any unrealized gains or losses.
Annual Report | 47
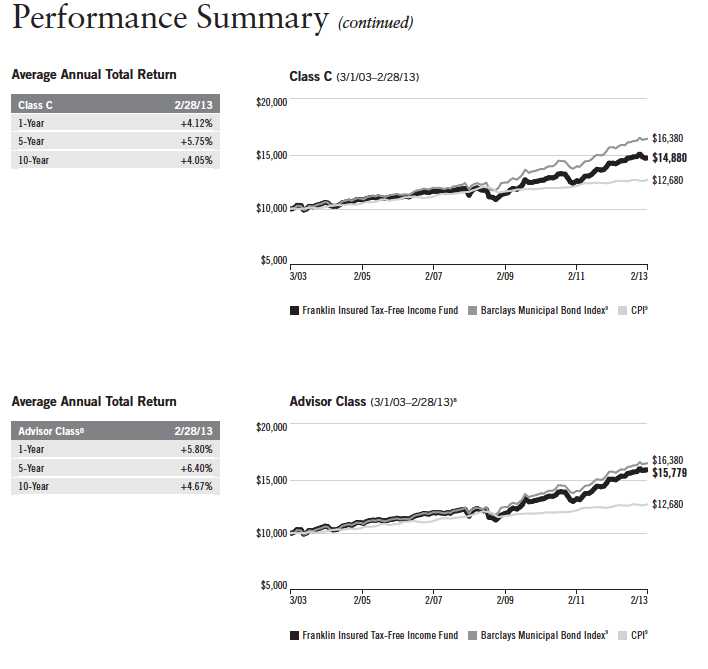
Performance Summary (continued)
Performance
Cumulative total return excludes sales charges. Average annual total returns include maximum sales charges. Class A: 4.25% maximum initial sales charge; Class B: contingent deferred sales charge (CDSC) declining from 4% to 1% over six years, and eliminated thereafter; Class C: 1% CDSC in first year only; Advisor Class: no sales charges.
Performance data represent past performance, which does not guarantee future results. Investment return and principal value will fluctuate, and you may have a gain or loss when you sell your shares. Current performance may differ from figures shown. For most recent month-end performance, go to franklintempleton.com or call (800) 342-5236.
48 | Annual Report
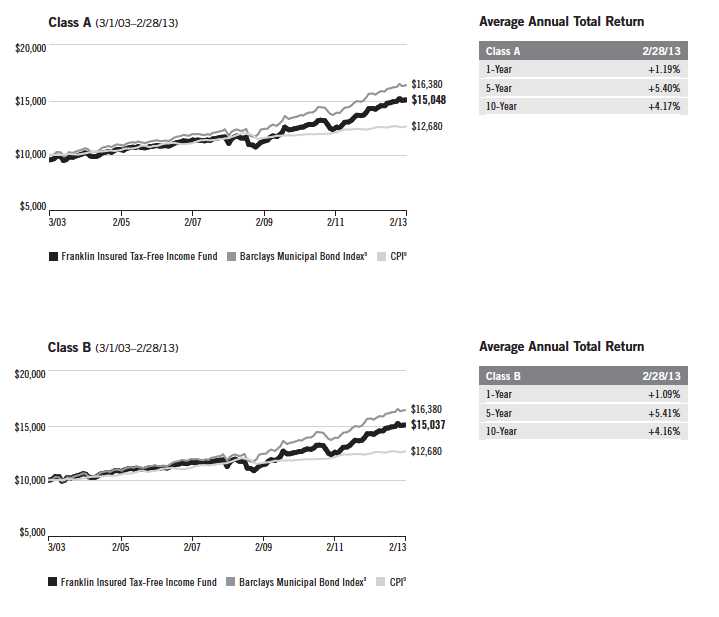
Performance Summary (continued)
Total Return Index Comparison for a Hypothetical $10,000 Investment
Total return represents the change in value of an investment over the periods shown. It includes any current, applicable, maximum sales charge, Fund expenses, account fees and reinvested distributions. The unmanaged index includes reinvestment of any income or distributions. It differs from the Fund in composition and does not pay management fees or expenses. One cannot invest directly in an index.
Annual Report | 49
50 | Annual Report
Performance Summary (continued)
Endnotes
All investments involve risks, including possible loss of principal. Because municipal bonds are sensitive to interest rate movements, the Fund’s yield and share price will fluctuate with market conditions. Bond prices generally move in the opposite direction of interest rates. Thus, as prices of bonds in the Fund adjust to a rise in interest rates, the Fund’s share price may decline. Changes in the credit rating of a bond, or in the credit rating or financial strength of a bond’s issuer, insurer or guarantor, may affect the bond’s value. The Fund is actively managed but there is no guarantee that the manager’s investment decisions will produce the desired results. The Fund’s prospectus also includes a description of the main investment risks.
| |
Class B: Class C: | These shares have higher annual fees and expenses than Class A shares. Prior to 1/1/04, these shares were offered with an initial sales charge; thus actual total returns would have differed. These shares have higher annual fees and expenses than Class A shares. |
Advisor Class: | Shares are available to certain eligible investors as described in the prospectus. |
1. Cumulative total return represents the change in value of an investment over the periods indicated.
2. Average annual total return represents the average annual change in value of an investment over the periods indicated.
3. In accordance with SEC rules, we provide standardized average annual total return information through the latest calendar quarter. For Class B shares, 3/31/13 performance data are not available – all Class B shares were converted to Class A shares before the end of the quarter.
4. Distribution rate is based on an annualization of the respective class’s February dividend and the maximum offering price (NAV for Classes B, C and Advisor) per share on 2/28/13.
5. Taxable equivalent distribution rate and yield assume the 2013 maximum federal income tax rate of 39.60% plus 3.8% Medicare tax.
6. The 30-day standardized yield for the month ended 2/28/13 reflects an estimated yield to maturity (assuming all portfolio securities are held to maturity). It should be regarded as an estimate of the Fund’s rate of investment income, and it may not equal the Fund’s actual income distribution rate (which reflects the Fund’s past dividends paid to shareholders) or the income reported in the Fund’s financial statements.
7. Figures are as stated in the Fund’s prospectus current as of the date of this report. In periods of market volatility, assets may decline significantly, causing total annual Fund operating expenses to become higher than the figures shown.
8. Effective 7/1/08, the Fund began offering Advisor Class shares, which do not have sales charges or a Rule 12b-1 plan. Performance quotations for this class reflect the following methods of calculation: (a) For periods prior to 7/1/08, a restated figure is used based upon the Fund’s Class A performance, excluding the effect of Class A’s maximum initial sales charge, but reflecting the effect of the Class A Rule 12b-1 fees; and (b) for periods after 7/1/08, actual Advisor Class performance is used reflecting all charges and fees applicable to that class. Since 7/1/08 (commencement of sales), the cumulative and average annual total returns of Advisor Class shares were +30.11% and +5.81%.
9. Source: © 2013 Morningstar. The Barclays Municipal Bond Index is a market value-weighted index engineered for the long-term tax-exempt bond market. To be included in the index, bonds must be fixed rate, have at least one year to final maturity and be rated investment grade (Baa3/BBB- or higher) by at least two of the following agencies: Moody’s, Standard & Poor’s and Fitch. The Consumer Price Index (CPI), calculated by the Bureau of Labor Statistics, is a commonly used measure of the inflation rate.
Annual Report | 51
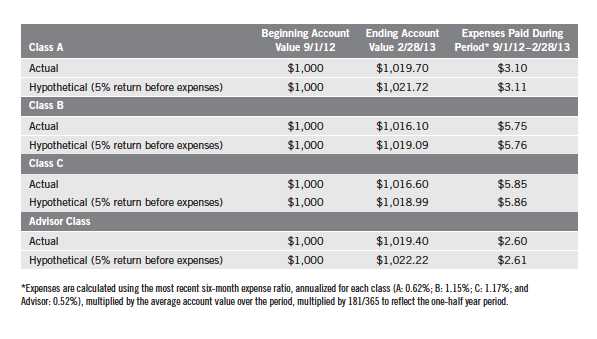
Your Fund’s Expenses
Franklin Insured Tax-Free Income Fund
As a Fund shareholder, you can incur two types of costs:
- Transaction costs, including sales charges (loads) on Fund purchases; and
- Ongoing Fund costs, including management fees, distribution and service (12b-1) fees, and other Fund expenses. All mutual funds have ongoing costs, sometimes referred to as operating expenses.
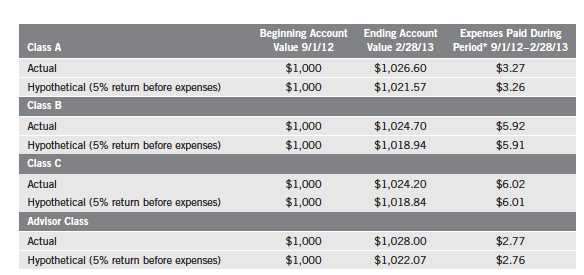
The following table shows ongoing costs of investing in the Fund and can help you understand these costs and compare them with those of other mutual funds. The table assumes a $1,000 investment held for the six months indicated.
Actual Fund Expenses
The first line (Actual) for each share class listed in the table provides actual account values and expenses. The “Ending Account Value” is derived from the Fund’s actual return, which includes the effect of Fund expenses.
You can estimate the expenses you paid during the period by following these steps. Of course, your account value and expenses will differ from those in this illustration:
| 1. | Divide your account value by $1,000. |
| | If an account had an $8,600 value, then $8,600 ÷ $1,000 = 8.6. |
| 2. | Multiply the result by the number under the heading “Expenses Paid During Period.” |
| | If Expenses Paid During Period were $7.50, then 8.6 x $7.50 = $64.50. |
In this illustration, the estimated expenses paid this period are $64.50.
Hypothetical Example for Comparison with Other Funds
Information in the second line (Hypothetical) for each class in the table can help you compare ongoing costs of investing in the Fund with those of other mutual funds. This information may not be used to estimate the actual ending account balance or expenses you paid during the period. The hypothetical “Ending Account Value” is based on the actual expense ratio for each class and an assumed 5% annual rate of return before expenses, which does not represent the Fund’s actual return. The figure under the heading “Expenses Paid During Period” shows the hypothetical expenses your account would have incurred under this scenario. You can compare this figure with the 5% hypothetical examples that appear in shareholder reports of other funds.
52 | Annual Report
Your Fund’s Expenses (continued)
Please note that expenses shown in the table are meant to highlight ongoing costs and do not reflect any transaction costs, such as sales charges. Therefore, the second line for each class is useful in comparing ongoing costs only, and will not help you compare total costs of owning different funds. In addition, if transaction costs were included, your total costs would have been higher. Please refer to the Fund prospectus for additional information on operating expenses.
Annual Report | 53
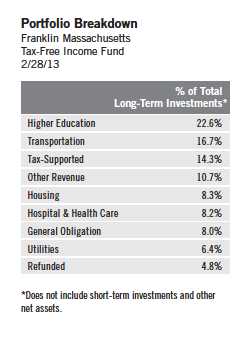
Franklin Massachusetts Tax-Free Income Fund
Your Fund’s Goal and Main Investments: Franklin Massachusetts Tax-Free Income Fund seeks to provide as high a level of income exempt from federal and Massachusetts personal income taxes as is consistent with prudent investment management and preservation of capital by investing at least 80% of its total assets in securities that pay interest free from such taxes.1
Performance data represent past performance, which does not guarantee future results. Investment return and principal value will fluctuate, and you may have a gain or loss when you sell your shares. Current performance may differ from figures shown. Please visit franklintempleton.com or call (800) 342-5236 for most recent month-end performance.
54 | Annual Report
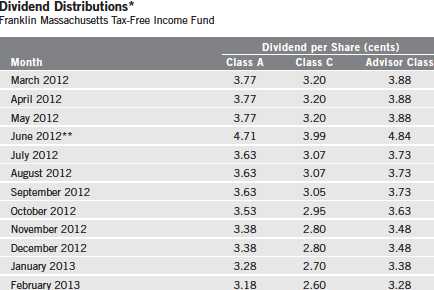
*Assumes shares were purchased and held for the entire accrual period. Prior to July 2012, this differed from the calendar month. Since dividends accrue daily, your actual distributions will vary depending on the date you purchased your shares and any account activity. All Fund distributions will vary depending upon current market conditions, and past distributions are not indicative of future trends.
**The June distribution reflects additional days in the accrual period.
same period.2 The Performance Summary beginning on page 58 shows that at the end of this reporting period the Fund’s Class A shares’ distribution rate was 3.00%, based on an annualization of the 3.18 cent per share February dividend and the maximum offering price of $12.70 on February 28, 2013. An investor in the 2013 maximum combined effective federal and Massachusetts personal income tax bracket of 46.37% (including 3.8% Medicare tax) would need to earn a distribution rate of 5.59% from a taxable investment to match the Fund’s Class A tax-free distribution rate. For the Fund’s Class C and Advisor shares’ performance, please see the Performance Summary. The reduction in dividend distributions from the start to the end of the period under review reflected generally declining interest rates. Additionally, investor demand was strong for municipal bonds in an environment of limited tax-exempt supply. These factors resulted in reduced income for the portfolio and caused dividends to decline overall.
2. All Fund distributions will vary depending upon current market conditions, and past distributions are not indicative of future trends.
Annual Report | 55
Commonwealth Update
Massachusetts has a broad, diverse economy that ranks among the nation’s highest in per-capita personal income. The commonwealth’s economy continued to recover during the 12 months under review, despite a slower growth rate near the end of 2012 largely stemming from business concerns about U.S. fiscal negotiations and potential cuts in federal government spending. Residential real estate continued to recover as it benefited from low interest rates, affordable home prices and rising rents. Commercial real estate, however, softened near period-end as office leasing demand and the pipeline for new construction projects weakened. The commonwealth’s unemployment rate rose from a 2012 low of 6.0% in May and June to 6.5% in February 2013, but it remained lower than the 7.7% national rate.3 With the exception of the manufacturing sector and the mining and logging sector, all sectors added jobs, led by construction, professional and business services, other services, and leisure and hospitality.
The commonwealth has demonstrated strong financial management practices that include monthly revenue estimates and quarterly budget reviews, five-year financial forecasting and capital investment plan, statutory limits on debt issuance, and a statutorily established budget stabilization fund (BSF). For fiscal year 2012 (ended June 30), Massachusetts closed a sizable budget gap reflecting the phase-out of federal stimulus funds largely through expenditure control. Actual revenues exceeded the commonwealth’s upwardly revised forecast as all major sources performed well, resulting in a higher BSF balance. Although the enacted budget for fiscal year 2013, which also relied heavily on expenditure control to maintain balance, included a draw from the BSF, Massachusetts expected reserve funding to remain solid. Revenue collections as of February exceeded the 2013 fiscal year-to-date forecast primarily because of higher-than-expected income tax withholding and sales tax revenues. In January, the governor proposed a balanced budget for fiscal year 2014 that called for broad-based tax changes to generate additional revenue to support increased funding for education, infrastructure, research grants for innovative fields such as life sciences and advanced manufacturing, and direct aid to cities and municipalities. The governor also recommended several reforms to control postretirement and business health care costs.
3. Source: Bureau of Labor Statistics.
56 | Annual Report
Massachusetts’s debt levels ranked among the nation’s highest, with net tax-supported debt at 9.4% of personal income and $4,814 per capita, compared with the 2.8% and $1,117 national medians.4 Independent credit rating agency Standard & Poor’s (S&P) believed the commonwealth’s high debt burden and large unfunded pension and other postemployment liabilities were offsetting considerations to the AA+ rating and stable outlook on the commonwealth’s general obligation bonds.5 The rating also reflected what S&P viewed as the commonwealth’s strong budget performance, including a focus on structural solutions to maintain budget balance; ongoing progress in improving financial, debt and budget management; and commitment to increasing BSF balances. Furthermore, S&P cited the commonwealth’s diverse economy, high wealth and income levels, and active management of postretirement liabilities as positive factors. The stable outlook reflected S&P’s expectation that Massachusetts will continue to proactively manage its budget and improve structural budget performance.
Manager’s Discussion
We used various investment strategies during the 12 months under review as we sought to maximize tax-free income for shareholders. Please read the discussion on page 6 for details.
Thank you for your continued participation in Franklin Massachusetts Tax-Free Income Fund. We believe our conservative, buy-and-hold investment strategy can help us achieve high, current, tax-free income for shareholders.
The foregoing information reflects our analysis, opinions and portfolio holdings as of February 28, 2013, the end of the reporting period. The way we implement our main investment strategies and the resulting portfolio holdings may change depending on factors such as market and economic conditions. These opinions may not be relied upon as investment advice or an offer for a particular security. The information is not a complete analysis of every aspect of any market, state, industry, security or the Fund. Statements of fact are from sources considered reliable, but the investment manager makes no representation or warranty as to their completeness or accuracy. Although historical performance is no guarantee of future results, these insights may help you understand our investment management philosophy.
4. Source: Moody’s Investors Service, “Median Report: 2012 State Debt Medians Report,” 5/22/12.
5. This does not indicate S&P’s rating of the Fund.
Annual Report | 57
Performance Summary as of 2/28/13
Franklin Massachusetts Tax-Free Income Fund
Your dividend income will vary depending on dividends or interest paid by securities in the Fund’s portfolio, adjusted for operating expenses of each class. Capital gain distributions are net profits realized from the sale of portfolio securities. The performance table and graphs do not reflect any taxes that a shareholder would pay on Fund dividends, capital gain distributions, if any, or any realized gains on the sale of Fund shares. Total return reflects reinvestment of the Fund’s dividends and capital gain distributions, if any, and any unrealized gains or losses.
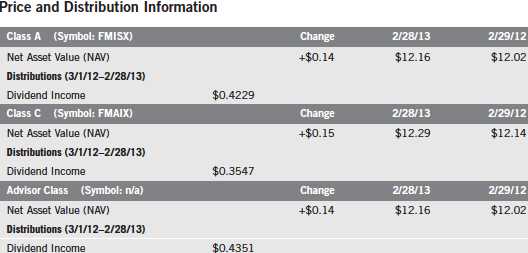
58 | Annual Report
Performance Summary (continued)
Performance
Cumulative total return excludes sales charges. Average annual total returns include maximum sales charges. Class A: 4.25% maximum initial sales charge; Class C: 1% contingent deferred sales charge in first year only; Advisor Class: no sales charges.

Performance data represent past performance, which does not guarantee future results. Investment return and principal value will fluctuate, and you may have a gain or loss when you sell your shares. Current performance may differ from figures shown. For most recent month-end performance, go to franklintempleton.com or call (800) 342-5236.
Annual Report | 59
Performance Summary (continued)
Total Return Index Comparison for a Hypothetical $10,000 Investment
Total return represents the change in value of an investment over the periods shown. It includes any current, applicable, maximum sales charge, Fund expenses, account fees and reinvested distributions. The unmanaged index includes reinvestment of any income or distributions. It differs from the Fund in composition and does not pay management fees or expenses. One cannot invest directly in an index.
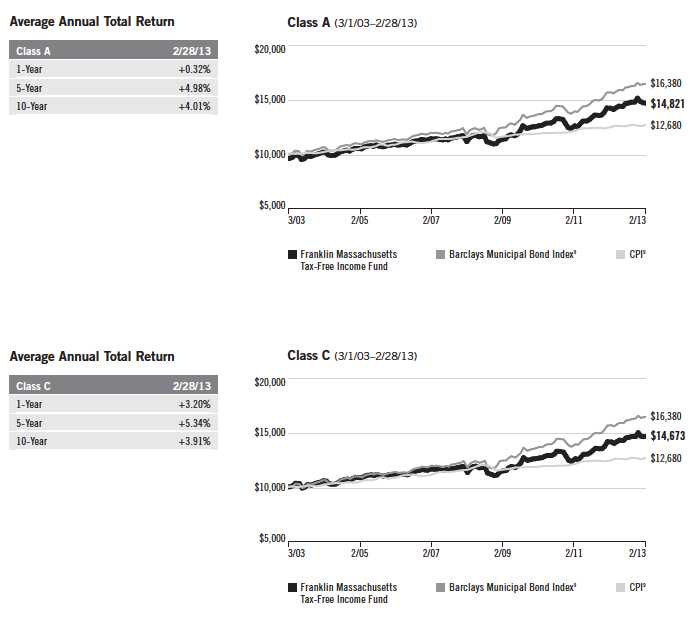
60 | Annual Report
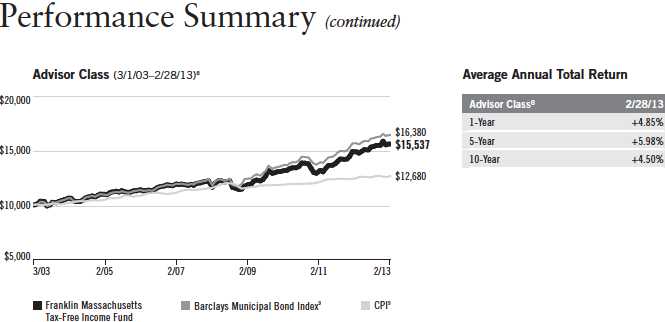
Endnotes
All investments involve risks, including possible loss of principal. Because municipal bonds are sensitive to interest rate movements, the Fund’s yield and share price will fluctuate with market conditions. Bond prices generally move in the opposite direction of interest rates. Thus, as prices of bonds in the Fund adjust to a rise in interest rates, the Fund’s share price may decline. Since the Fund concentrates its investments in a single state, it is subject to greater risk of adverse economic and regulatory changes in that state than a geographically diversified fund. Changes in the credit rating of a bond, or in the credit rating or financial strength of a bond’s issuer, insurer or guarantor, may affect the bond’s value. The Fund is actively managed but there is no guarantee that the manager’s investment decisions will produce the desired results. The Fund’s prospectus also includes a description of the main investment risks.
Class C: Prior to 1/1/04, these shares were offered with an initial sales charge; thus actual total returns would have differed. These shares
have higher annual fees and expenses than Class A shares.
Advisor Class: Shares are available to certain eligible investors as described in the prospectus.
1. Cumulative total return represents the change in value of an investment over the periods indicated.
2. Average annual total return represents the average annual change in value of an investment over the periods indicated.
3. In accordance with SEC rules, we provide standardized average annual total return information through the latest calendar quarter.
4. Distribution rate is based on an annualization of the respective class’s February dividend and the maximum offering price (NAV for Classes C and Advisor) per share on 2/28/13.
5. Taxable equivalent distribution rate and yield assume the published rates as of 1/8/13 for the maximum combined effective federal and Massachusetts personal income tax rate of 46.37%, based on the federal income tax rate of 39.60% plus 3.8% Medicare tax.
6. The 30-day standardized yield for the month ended 2/28/13 reflects an estimated yield to maturity (assuming all portfolio securities are held to maturity). It should be regarded as an estimate of the Fund’s rate of investment income, and it may not equal the Fund’s actual income distribution rate (which reflects the Fund’s past dividends paid to shareholders) or the income reported in the Fund’s financial statements.
7. Figures are as stated in the Fund’s prospectus current as of the date of this report. In periods of market volatility, assets may decline significantly, causing total annual Fund operating expenses to become higher than the figures shown.
8. Effective 7/1/09, the Fund began offering Advisor Class shares, which do not have sales charges or a Rule 12b-1 plan. Performance quotations for this class reflect the following methods of calculation: (a) For periods prior to 7/1/09, a restated figure is used based upon the Fund’s Class A performance, excluding the effect of Class A’s maximum initial sales charge, but reflecting the effect of the Class A Rule 12b-1 fees; and (b) for periods after 7/1/09, actual Advisor Class performance is used reflecting all charges and fees applicable to that class. Since 7/1/09 (commencement of sales), the cumulative and average annual total returns of Advisor Class shares were +27.47% and +6.85%.
9. Source: © 2013 Morningstar. The Barclays Municipal Bond Index is a market value-weighted index engineered for the long-term tax-exempt bond market. To be included in the index, bonds must be fixed rate, have at least one year to final maturity and be rated investment grade (Baa3/BBB- or higher) by at least two of the following agencies: Moody’s, Standard & Poor’s and Fitch. The Consumer Price Index (CPI), calculated by the Bureau of Labor Statistics, is a commonly used measure of the inflation rate.
Annual Report | 61
Your Fund’s Expenses
Franklin Massachusetts Tax-Free Income Fund
As a Fund shareholder, you can incur two types of costs:
- Transaction costs, including sales charges (loads) on Fund purchases; and
- Ongoing Fund costs, including management fees, distribution and service (12b-1) fees, and other Fund expenses. All mutual funds have ongoing costs, sometimes referred to as operating expenses.
The following table shows ongoing costs of investing in the Fund and can help you understand these costs and compare them with those of other mutual funds. The table assumes a $1,000 investment held for the six months indicated.
Actual Fund Expenses
The first line (Actual) for each share class listed in the table provides actual account values and expenses. The “Ending Account Value” is derived from the Fund’s actual return, which includes the effect of Fund expenses.
You can estimate the expenses you paid during the period by following these steps. Of course, your account value and expenses will differ from those in this illustration:
| 1. | Divide your account value by $1,000. |
| | If an account had an $8,600 value, then $8,600 ÷ $1,000 = 8.6. |
| 2. | Multiply the result by the number under the heading “Expenses Paid During Period.” |
| | If Expenses Paid During Period were $7.50, then 8.6 x $7.50 = $64.50. |
In this illustration, the estimated expenses paid this period are $64.50.
Hypothetical Example for Comparison with Other Funds
Information in the second line (Hypothetical) for each class in the table can help you compare ongoing costs of investing in the Fund with those of other mutual funds. This information may not be used to estimate the actual ending account balance or expenses you paid during the period. The hypothetical “Ending Account Value” is based on the actual expense ratio for each class and an assumed 5% annual rate of return before expenses, which does not represent the Fund’s actual return. The figure under the heading “Expenses Paid During Period” shows the hypothetical expenses your account would have incurred under this scenario. You can compare this figure with the 5% hypothetical examples that appear in shareholder reports of other funds.
62 | Annual Report
Your Fund’s Expenses (continued)
Please note that expenses shown in the table are meant to highlight ongoing costs and do not reflect any transaction costs, such as sales charges. Therefore, the second line for each class is useful in comparing ongoing costs only, and will not help you compare total costs of owning different funds. In addition, if transaction costs were included, your total costs would have been higher. Please refer to the Fund prospectus for additional information on operating expenses.
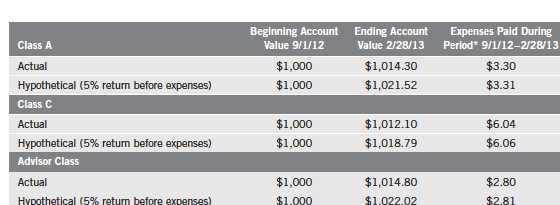
*Expenses are calculated using the most recent six-month expense ratio, annualized for each class (A: 0.66%; C: 1.21% and Advisor: 0.56%), by the average account value over the period, multiplied by 181/365 to reflect the one-half year period.
Annual Report | 63
Franklin New Jersey Tax-Free Income Fund
Your Fund’s Goal and Main Investments: Franklin New Jersey Tax-Free Income Fund seeks to provide as high a level of income exempt from federal and New Jersey personal income taxes as is consistent with prudent investment management and preservation of capital by investing at least 80% of its net assets in securities that pay interest free from such taxes.1
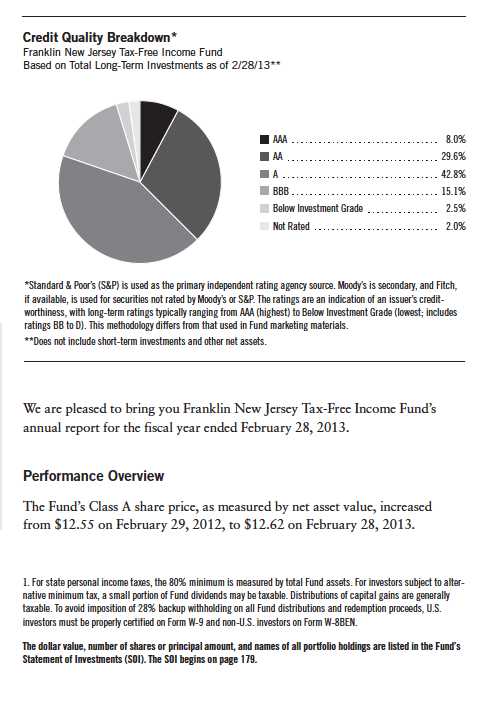
Performance data represent past performance, which does not guarantee future results. Investment return and principal value will fluctuate, and you may have a gain or loss when you sell your shares. Current performance may differ from figures shown. Please visit franklintempleton.com or call (800) 342-5236 for most recent month-end performance.
64 | Annual Report
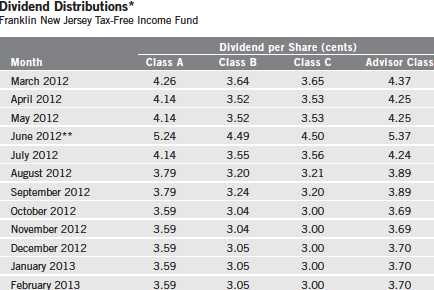
*Assumes shares were purchased and held for the entire accrual period. Prior to July 2012, this differed from the calendar month. Since dividends accrue daily, your actual distributions will vary depending on the date you purchased your shares and any account activity. All Fund distributions will vary depending upon current market conditions, and past distributions are not indicative of future trends.
**The June distribution reflects additional days in the accrual period.
The Fund’s Class A shares paid dividends totaling 46.31 cents per share for the same period.2 The Performance Summary beginning on page 68 shows that at the end of this reporting period the Fund’s Class A shares’ distribution rate was 3.27%, based on an annualization of the 3.59 cent per share February dividend and the maximum offering price of $13.18 on February 28, 2013. An investor in the 2013 maximum combined effective federal and New Jersey personal income tax bracket of 48.48% (including 3.8% Medicare tax) would need to earn a distribution rate of 6.35% from a taxable investment to match the Fund’s Class A tax-free distribution rate. For the Fund’s Class B, C and Advisor shares’ performance, please see the Performance Summary. The reduction in dividend distributions from the start to the end of the period under review reflected generally declining interest rates. Additionally, investor demand was strong for municipal bonds in an environment of limited tax-exempt supply. These factors resulted in reduced income for the portfolio and caused dividends to decline overall.
2. All Fund distributions will vary depending upon current market conditions, and past distributions are not indicative of future trends.
Annual Report | 65
State Update
New Jersey’s economic growth rate, which has trailed the nation’s during the recovery from the Great Recession, was pressured by damage and business disruptions caused by Superstorm Sandy. The state’s broad, diverse economy proved resilient, however, as the housing market continued to recover and automobile sales strengthened. In December, New Jersey posted record job gains that were broad-based and not rooted in hiring for storm relief and recovery efforts. The state’s private sector job gains in calendar year 2012 were the most recorded in more than a decade. Although New Jersey’s unemployment rate at period-end remained higher than the 7.7% national rate, it improved from a 2012 high of 9.9% in August to 9.3% at period-end. With the exception of mining and logging, construction, and information, all sectors added jobs, led by other services, professional and business services, education and health services, and government. New Jersey’s chief economist projected that rebuilding efforts from Superstorm Sandy would help support job growth in 2013.
The state has good budget management practices that include scheduled revenue and spending forecast updates, interim monitoring reports, and a strong executive system that allows the governor to reduce the enacted budget without legislative approval. New Jersey closed fiscal year 2012 (ended June 30) with slightly higher revenue growth than in fiscal year 2011 but with a lower-than-anticipated fund balance. State officials balanced the 2013 fiscal year budget through spending cuts, continued use of one-time measures and a revenue growth forecast that was significantly higher than the state’s actual 10-year annualized revenue growth rate. After lagging the revenue forecast during the first five months of the fiscal year, revenue collections rebounded in December. Despite better-than-expected revenues in recent months, as of February, total collections lagged the 2013 fiscal year-to-date forecast. In late February, the governor submitted a balanced budget with no new taxes, less reliance on one-time measures, and higher education funding. Although the proposed budget expanded Medicaid, it came with projected sizable savings to the state because of increased federal funding as provisioned in the Affordable Care Act. Additionally, the budget proposal called for a contingency fund to cover storm rebuilding expenses not reimbursed by the federal government. It also included a significant payment to the public pension system that according to the governor would be the largest in the state’s history.
66 | Annual Report
New Jersey’s debt levels remained among the nation’s highest, with net tax-supported debt at 7.8% of personal income and $3,964 per capita, compared with the 2.8% and $1,117 national medians.4 Independent credit rating agency Standard & Poor’s (S&P) affirmed the AA- rating and negative outlook for the state’s general obligation bonds.5 The rating reflected S&P’s positive view of the state’s diverse economic base and high wealth and income levels, offset by a trend of structurally unbalanced budgets, large unfunded pension liability, significant postemployment benefit obligations and an above-average debt burden. The negative outlook reflected S&P’s concerns about growing fiscal pressures and the state’s inability to achieve structural balance, as well as what S&P viewed as optimistic revenue assumptions, continued reliance on nonrecurring measures to compensate for revenue shortfalls and spending growth, and increasing fiscal pressures stemming from fixed expenditures. Furthermore, Superstorm Sandy’s impact increased uncertainty regarding the state’s revenue outlook. Although reconstruction efforts could bolster the state’s economy in the long term, the state’s economy could be pressured in the short term.
Manager’s Discussion
We used various investment strategies during the 12 months under review as we sought to maximize tax-free income for shareholders. Please read the discussion on page 6 for details. During the reporting period, Puerto Rico experienced downgrades from Moody’s Investors Service that contributed to the underperformance of Puerto Rico bonds versus the market.
Thank you for your continued participation in Franklin New Jersey Tax-Free Income Fund. We believe our conservative, buy-and-hold investment strategy can help us achieve high, current, tax-free income for shareholders.
The foregoing information reflects our analysis, opinions and portfolio holdings as of February 28, 2013, the end of the reporting period. The way we implement our main investment strategies and the resulting portfolio holdings may change depending on factors such as market and economic conditions. These opinions may not be relied upon as investment advice or an offer for a particular security. The information is not a complete analysis of every aspect of any market, state, industry, security or the Fund. Statements of fact are from sources considered reliable, but the investment manager makes no representation or warranty as to their completeness or accuracy. Although historical performance is no guarantee of future results, these insights may help you understand our investment management philosophy.
4. Source: Moody’s Investors Service, “Median Report: 2012 State Debt Medians Report,” 5/22/12.
5. This does not indicate S&P’s rating of the Fund.
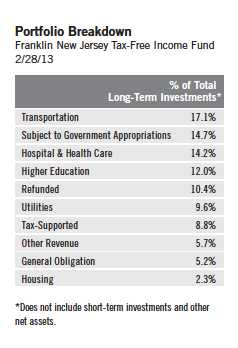
Annual Report | 67
Performance Summary as of 2/28/13
Franklin New Jersey Tax-Free Income Fund
Your dividend income will vary depending on dividends or interest paid by securities in the Fund’s portfolio, adjusted for operating expenses of each class. Capital gain distributions are net profits realized from the sale of portfolio securities. The performance table and graphs do not reflect any taxes that a shareholder would pay on Fund dividends, capital gain distributions, if any, or any realized gains on the sale of Fund shares. Total return reflects reinvestment of the Fund’s dividends and capital gain distributions, if any, and any unrealized gains or losses.
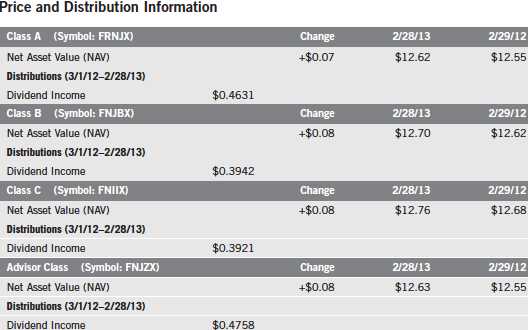
68 | Annual Report
Performance Summary (continued)
Performance
Cumulative total return excludes sales charges. Average annual total returns include maximum sales charges. Class A: 4.25% maximum initial sales charge; Class B: contingent deferred sales charge (CDSC) declining from 4% to 1% over six years, and eliminated thereafter; Class C: 1% CDSC in first year only; Advisor Class: no sales charges.
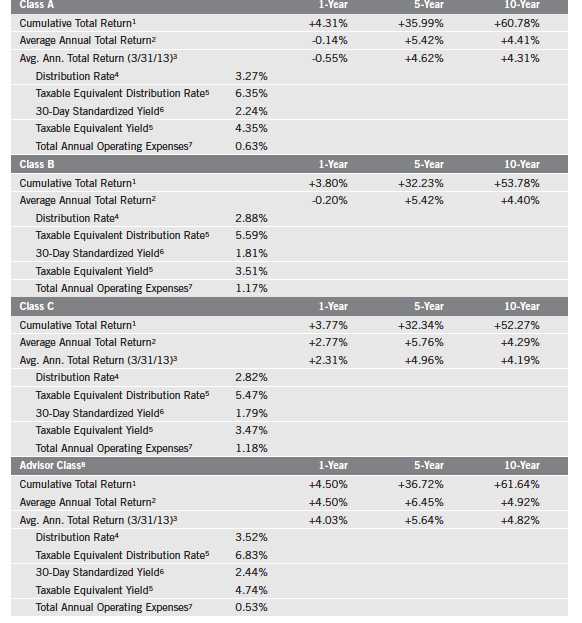
Performance data represent past performance, which does not guarantee future results. Investment return and principal value will fluctuate, and you may have a gain or loss when you sell your shares. Current performance may differ from figures shown. For most recent month-end performance, go to franklintempleton.com or call (800) 342-5236.
Annual Report | 69
Performance Summary (continued)
Total Return Index Comparison for a Hypothetical $10,000 Investment
Total return represents the change in value of an investment over the periods shown. It includes any current, applicable, maximum sales charge, Fund expenses, account fees and reinvested distributions. The unmanaged index includes reinvestment of any income or distributions. It differs from the Fund in composition and does not pay management fees or expenses. One cannot invest directly in an index.
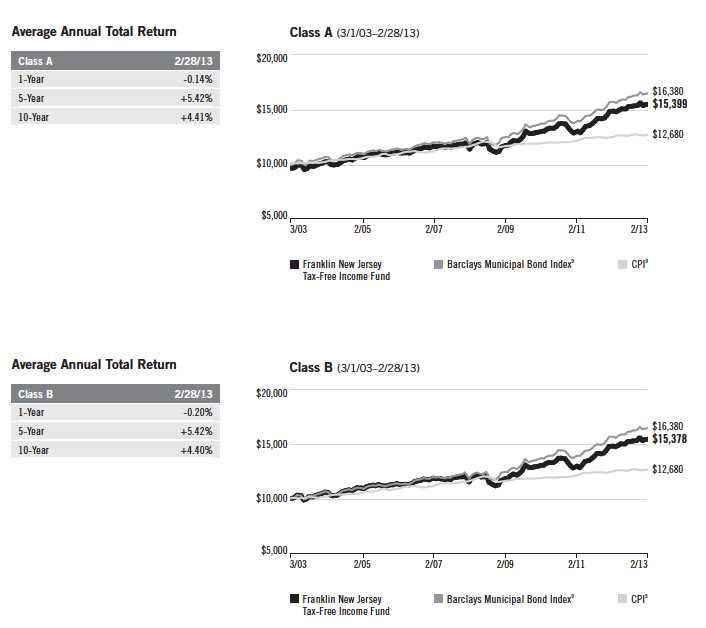
70 | Annual Report
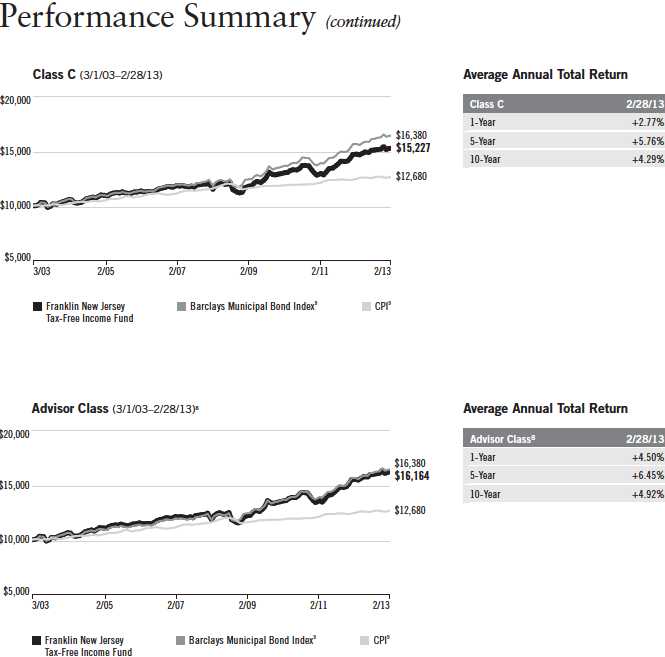
Annual Report | 71
Performance Summary (continued)
Endnotes
All investments involve risks, including possible loss of principal. Because municipal bonds are sensitive to interest rate movements, the Fund’s yield and share price will fluctuate with market conditions. Bond prices generally move in the opposite direction of interest rates. Thus, as prices of bonds in the Fund adjust to a rise in interest rates, the Fund’s share price may decline. Since the Fund concentrates its investments in a single state, it is subject to greater risk of adverse economic and regulatory changes in that state than a geographically diversified fund. Changes in the credit rating of a bond, or in the credit rating or financial strength of a bond’s issuer, insurer or guarantor, may affect the bond’s value. The Fund is actively managed but there is no guarantee that the manager’s investment decisions will produce the desired results. The Fund’s prospectus also includes a description of the main investment risks.
| |
Class B: Class C: | These shares have higher annual fees and expenses than Class A shares. Prior to 1/1/04, these shares were offered with an initial sales charge; thus actual total returns would have differed. These shares have higher annual fees and expenses than Class A shares. |
Advisor Class: | Shares are available to certain eligible investors as described in the prospectus. |
1. Cumulative total return represents the change in value of an investment over the periods indicated.
2. Average annual total return represents the average annual change in value of an investment over the periods indicated.
3. In accordance with SEC rules, we provide standardized average annual total return information through the latest calendar quarter. For Class B shares, 3/31/13 performance data are not available – all Class B shares were converted to Class A shares before the end of the quarter.
4. Distribution rate is based on an annualization of the respective class’s February dividend and the maximum offering price (NAV for Classes B, C and Advisor) per share on 2/28/13.
5. Taxable equivalent distribution rate and yield assume the published rates as of 1/8/13 for the maximum combined effective federal and New Jersey personal income tax rate of 48.48%, based on the federal income tax rate of 39.60% plus 3.8% Medicare tax.
6. The 30-day standardized yield for the month ended 2/28/13 reflects an estimated yield to maturity (assuming all portfolio securities are held to maturity). It should be regarded as an estimate of the Fund’s rate of investment income, and it may not equal the Fund’s actual income distribution rate (which reflects the Fund’s past dividends paid to shareholders) or the income reported in the Fund’s financial statements.
7. Figures are as stated in the Fund’s prospectus current as of the date of this report. In periods of market volatility, assets may decline significantly, causing total annual Fund operating expenses to become higher than the figures shown.
8. Effective 7/1/08, the Fund began offering Advisor Class shares, which do not have sales charges or a Rule 12b-1 plan. Performance quotations for this class reflect the following methods of calculation: (a) For periods prior to 7/1/08, a restated figure is used based upon the Fund’s Class A performance, excluding the effect of Class A’s maximum initial sales charge, but reflecting the effect of the Class A Rule 12b-1 fees; and (b) for periods after 7/1/08, actual Advisor Class performance is used reflecting all charges and fees applicable to that class. Since 7/1/08 (commencement of sales), the cumulative and average annual total returns of Advisor Class shares were +31.01% and +5.96%.
9. Source: © 2013 Morningstar. The Barclays Municipal Bond Index is a market value-weighted index engineered for the long-term tax-exempt bond market. To be included in the index, bonds must be fixed rate, have at least one year to final maturity and be rated investment grade (Baa3/BBB-or higher) by at least two of the following agencies: Moody’s, Standard & Poor’s and Fitch. The Consumer Price Index (CPI), calculated by the Bureau of Labor Statistics, is a commonly used measure of the inflation rate.
72 | Annual Report
Your Fund’s Expenses
Franklin New Jersey Tax-Free Income Fund
As a Fund shareholder, you can incur two types of costs:
- Transaction costs, including sales charges (loads) on Fund purchases; and
- Ongoing Fund costs, including management fees, distribution and service (12b-1) fees, and other Fund expenses. All mutual funds have ongoing costs, sometimes referred to as operating expenses.
The following table shows ongoing costs of investing in the Fund and can help you understand these costs and compare them with those of other mutual funds. The table assumes a $1,000 investment held for the six months indicated.
Actual Fund Expenses
The first line (Actual) for each share class listed in the table provides actual account values and expenses. The “Ending Account Value” is derived from the Fund’s actual return, which includes the effect of Fund expenses.
You can estimate the expenses you paid during the period by following these steps. Of course, your account value and expenses will differ from those in this illustration:
| 1. | Divide your account value by $1,000. |
| | If an account had an $8,600 value, then $8,600 ÷ $1,000 = 8.6. |
| 2. | Multiply the result by the number under the heading “Expenses Paid During Period.” |
| | If Expenses Paid During Period were $7.50, then 8.6 x $7.50 = $64.50. |
In this illustration, the estimated expenses paid this period are $64.50.
Hypothetical Example for Comparison with Other Funds
Information in the second line (Hypothetical) for each class in the table can help you compare ongoing costs of investing in the Fund with those of other mutual funds. This information may not be used to estimate the actual ending account balance or expenses you paid during the period. The hypothetical “Ending Account Value” is based on the actual expense ratio for each class and an assumed 5% annual rate of return before expenses, which does not represent the Fund’s actual return. The figure under the heading “Expenses Paid During Period” shows the hypothetical expenses your account would have incurred under this scenario. You can compare this figure with the 5% hypothetical examples that appear in shareholder reports of other funds.
Annual Report | 73
Your Fund’s Expenses (continued)
Please note that expenses shown in the table are meant to highlight ongoing costs and do not reflect any transaction costs, such as sales charges. Therefore, the second line for each class is useful in comparing ongoing costs only, and will not help you compare total costs of owning different funds. In addition, if transaction costs were included, your total costs would have been higher. Please refer to the Fund prospectus for additional information on operating expenses.
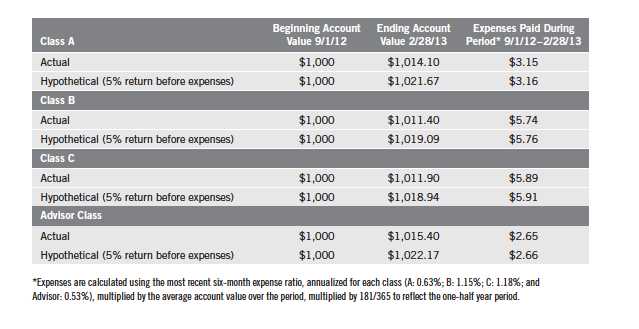
74 | Annual Report
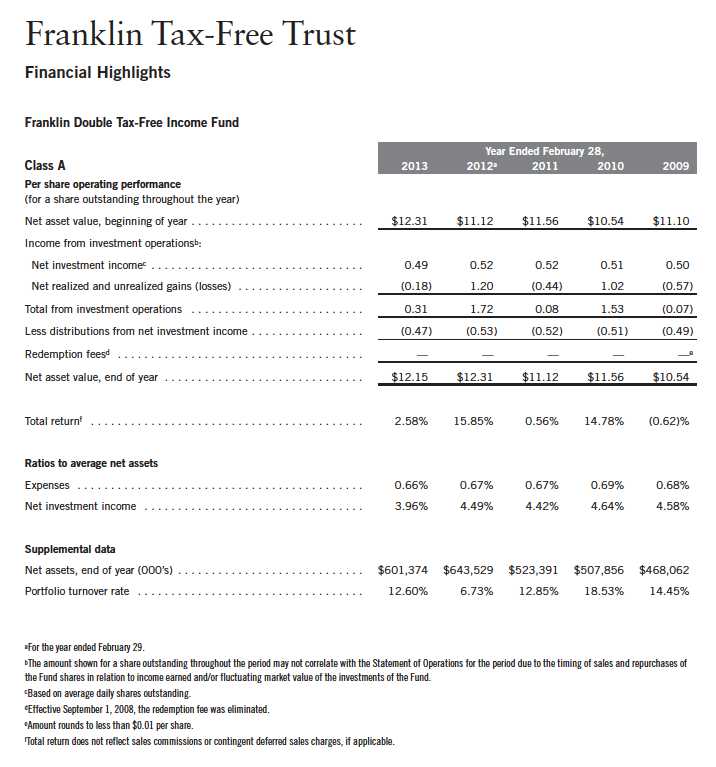
Annual Report | The accompanying notes are an integral part of these financial statements. | 75
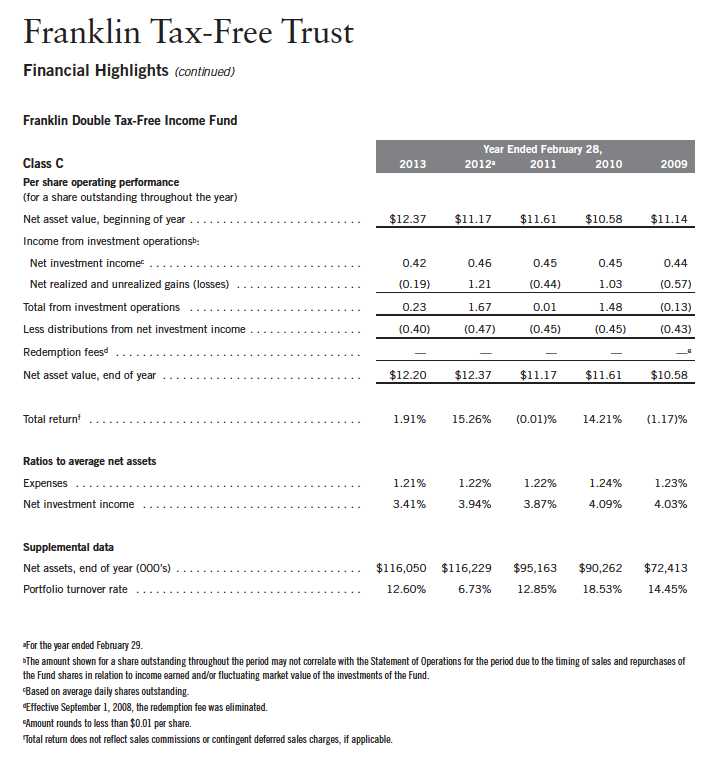
76 | The accompanying notes are an integral part of these financial statements. | Annual Report
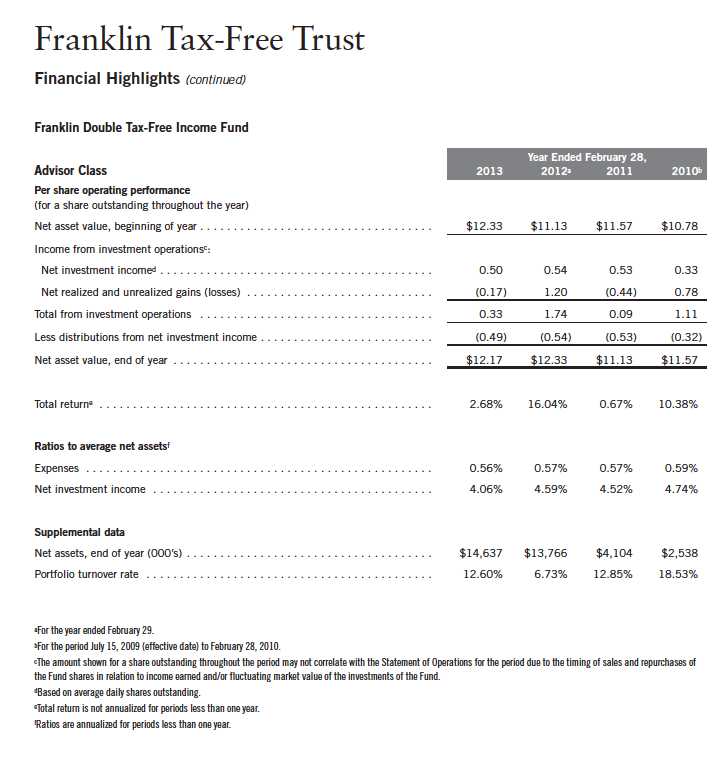
Annual Report | The accompanying notes are an integral part of these financial statements. | 77
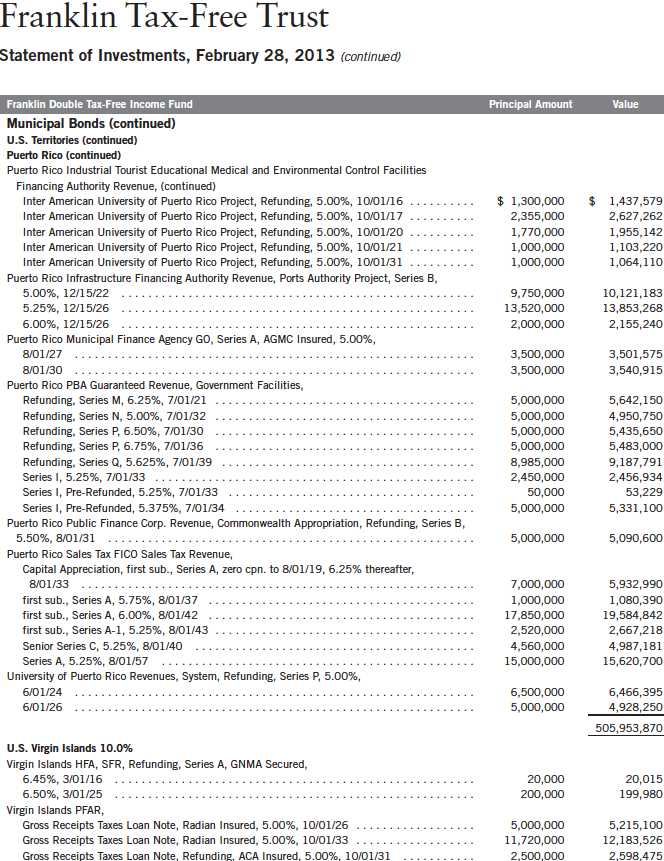
80 | Annual Report
Franklin Tax-Free Trust
Statement of Investments, February 28, 2013 (continued)
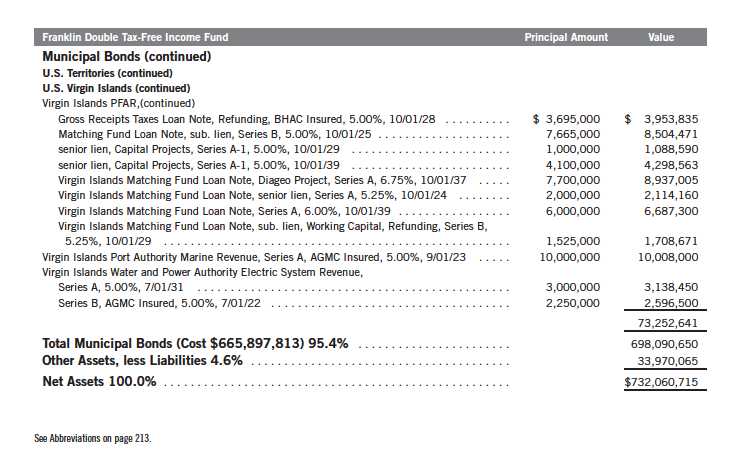
Annual Report | The accompanying notes are an integral part of these financial statements. | 81
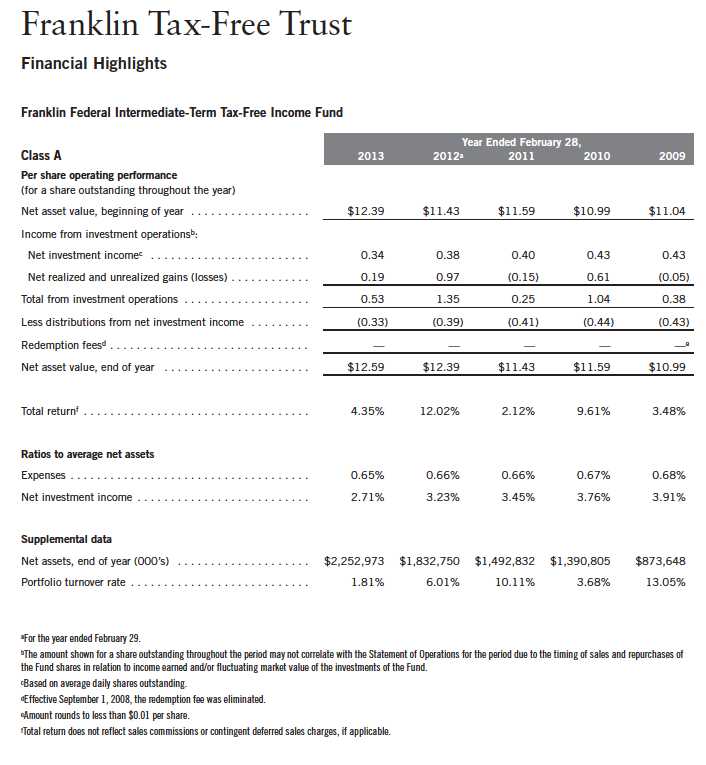
82 | The accompanying notes are an integral part of these financial statements. | Annual Report
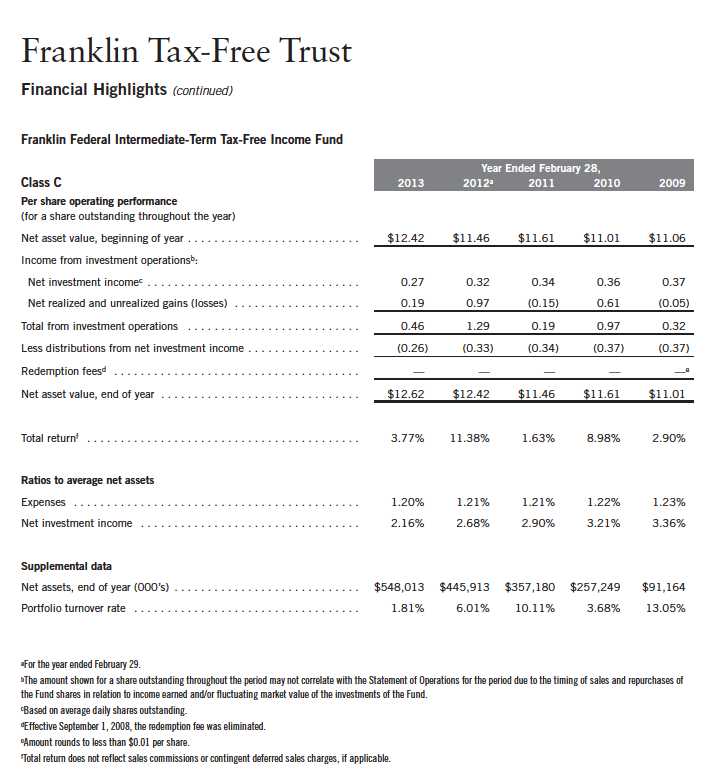
Annual Report | The accompanying notes are an integral part of these financial statements. | 83
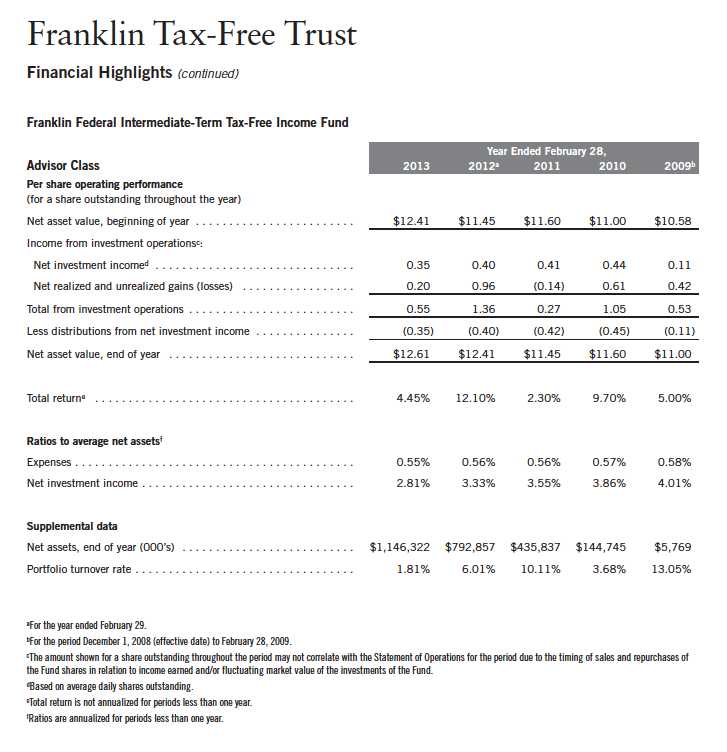
84 | The accompanying notes are an integral part of these financial statements. | Annual Report

86 | Annual Report
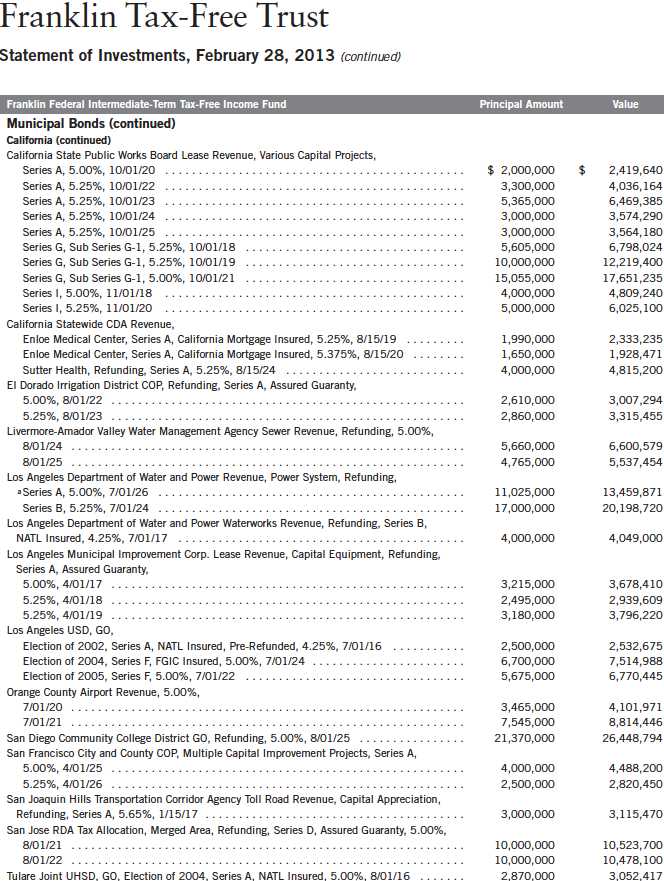
Annual Report | 87
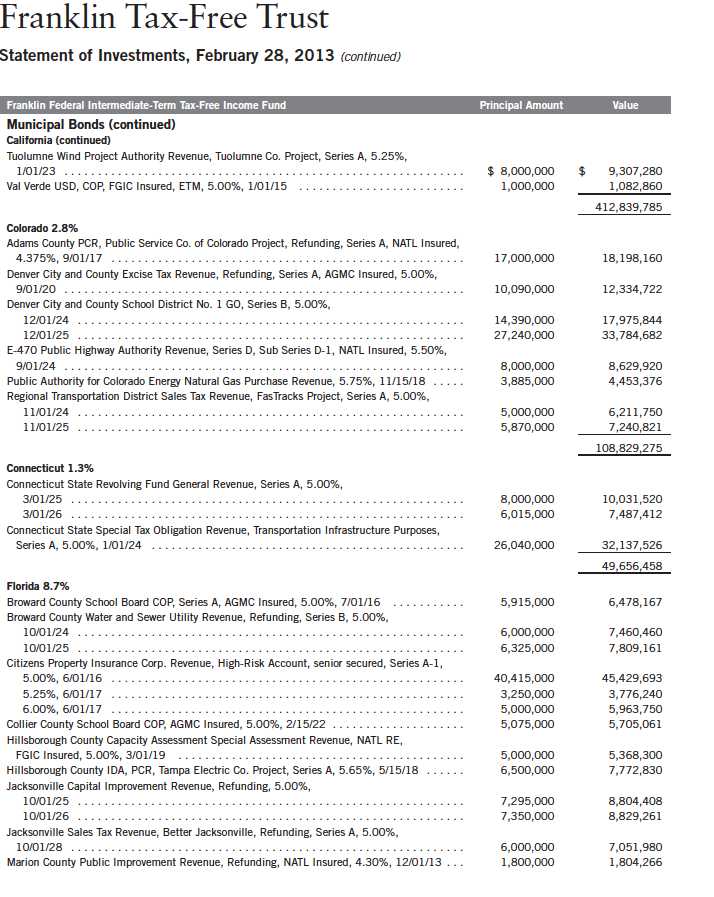
88 | Annual Report
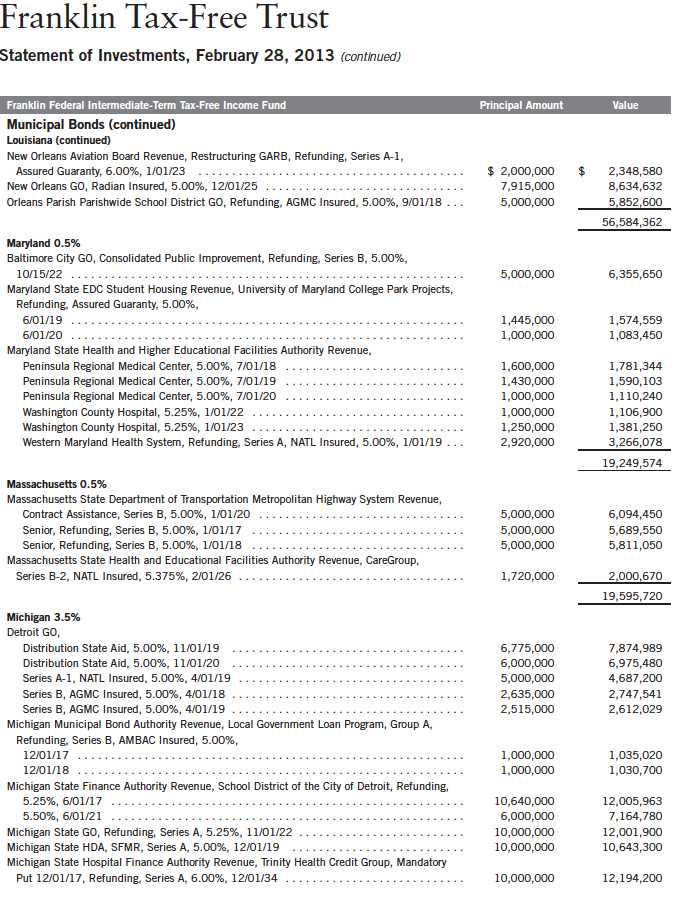
Annual Report | 91
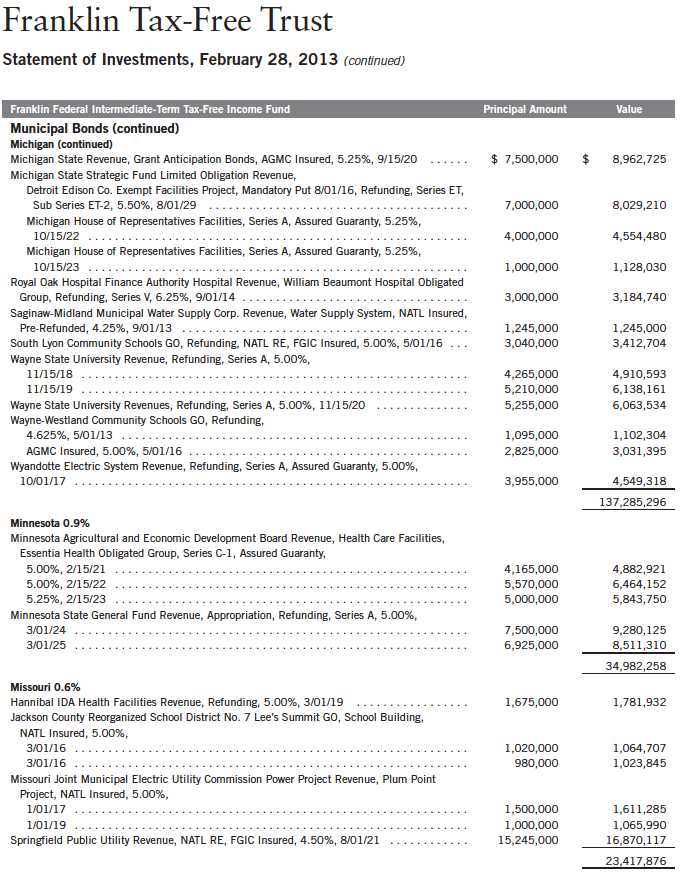
92 | Annual Report
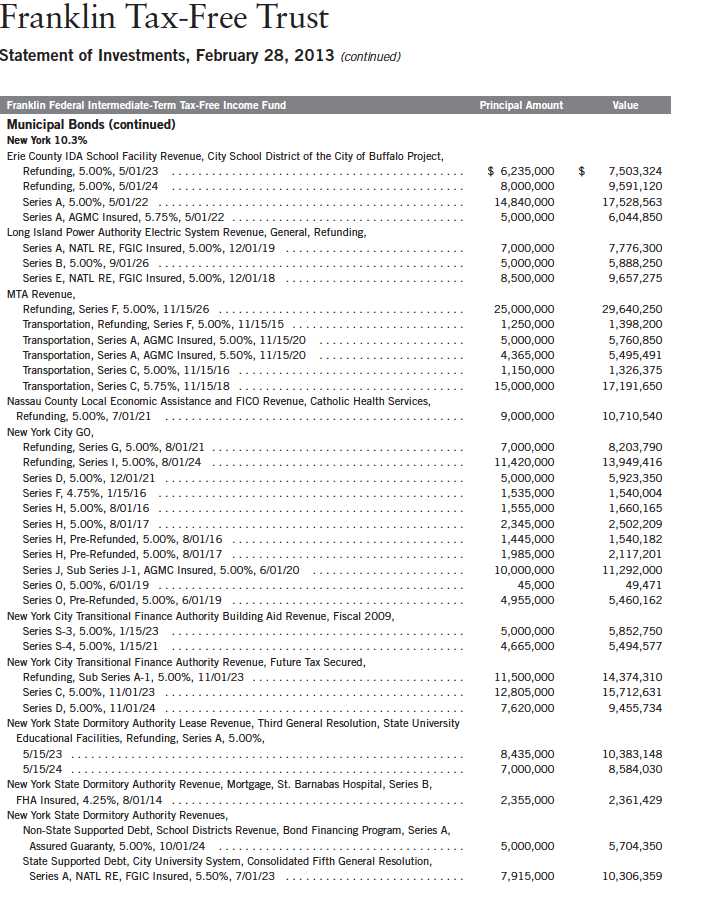
94 | Annual Report
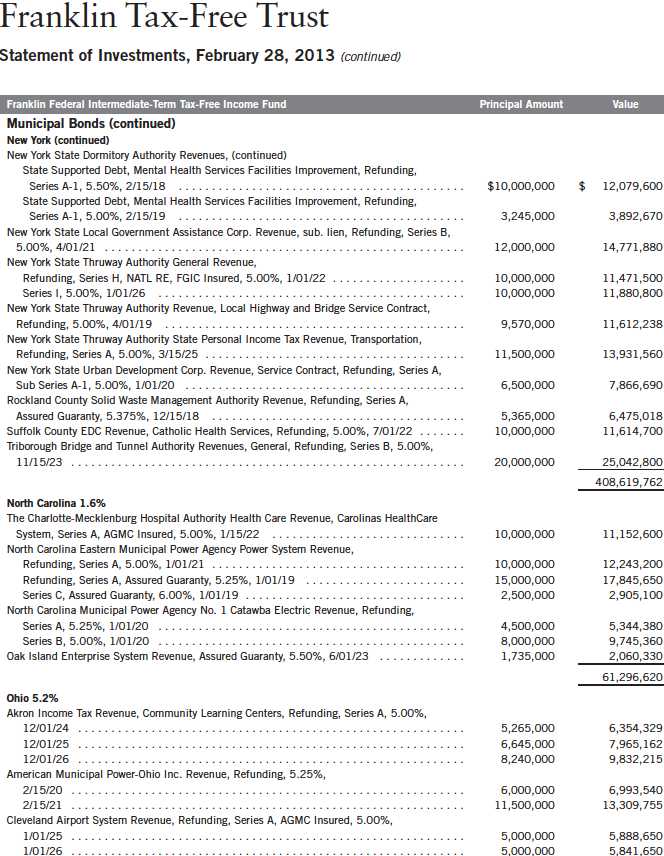
Annual Report | 95
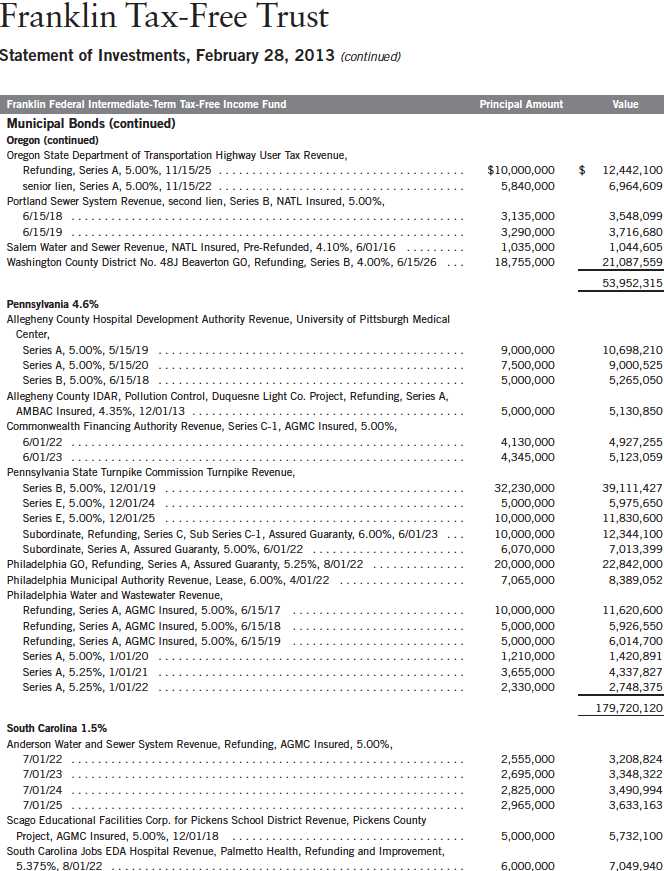
Annual Report | 97
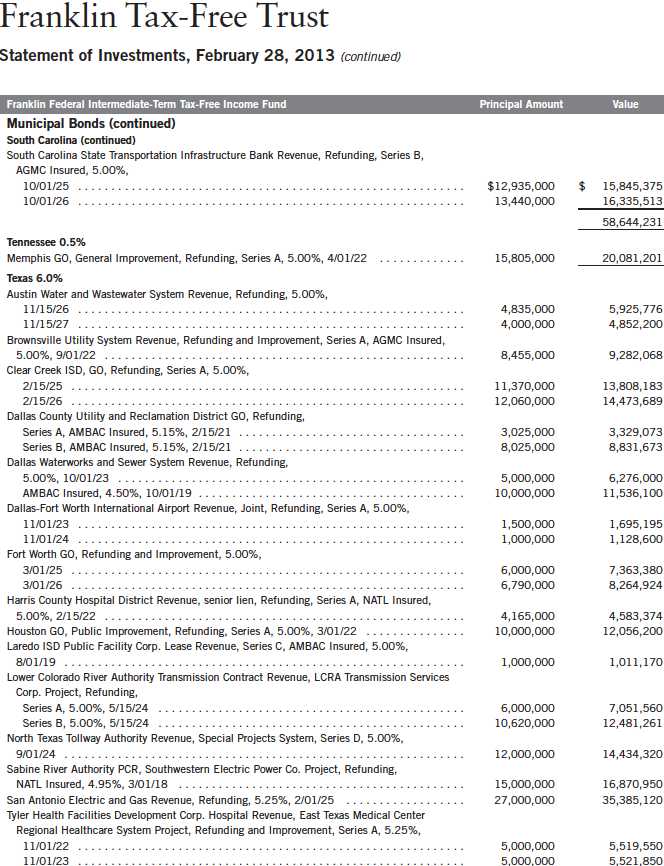
98 | Annual Report
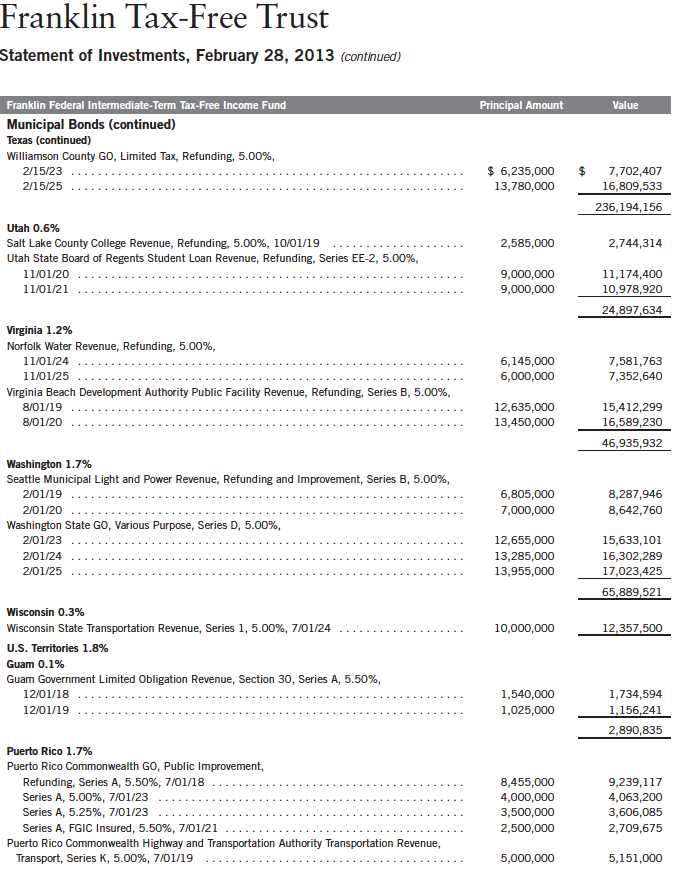
Annual Report | 99
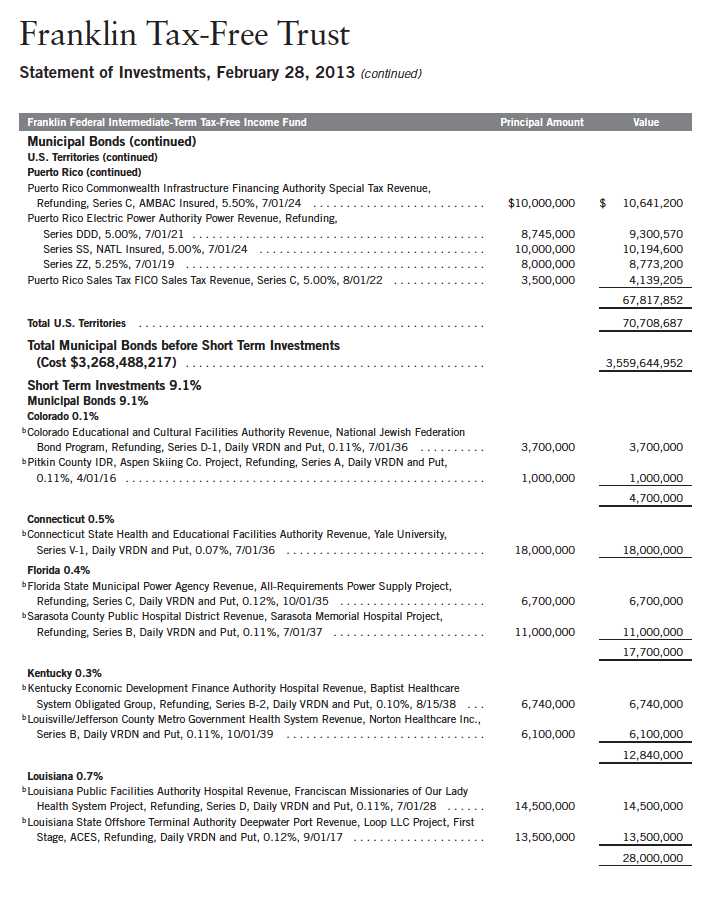
100 | Annual Report
Franklin Tax-Free Trust
Statement of Investments, February 28, 2013 (continued)
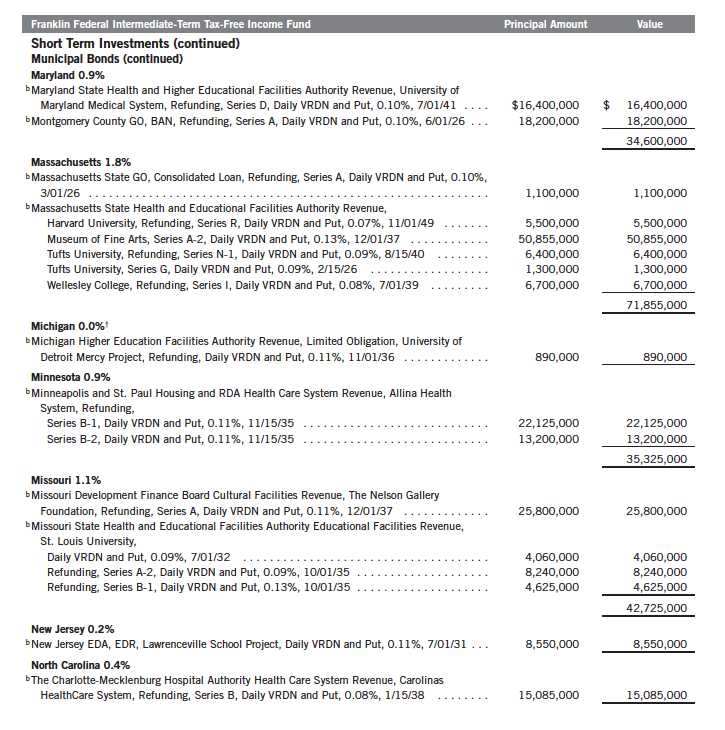
Annual Report | 101
Franklin Tax-Free Trust
Statement of Investments, February 28, 2013 (continued)
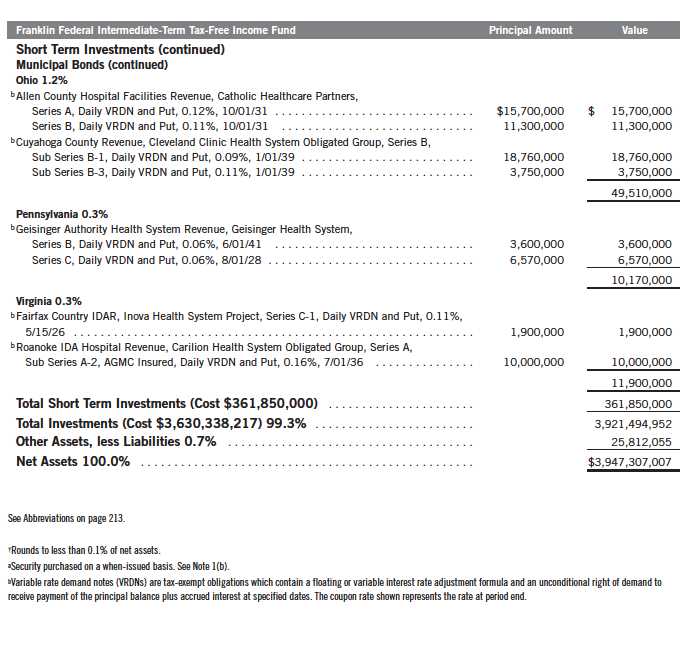
102 | The accompanying notes are an integral part of these financial statements. | Annual Report
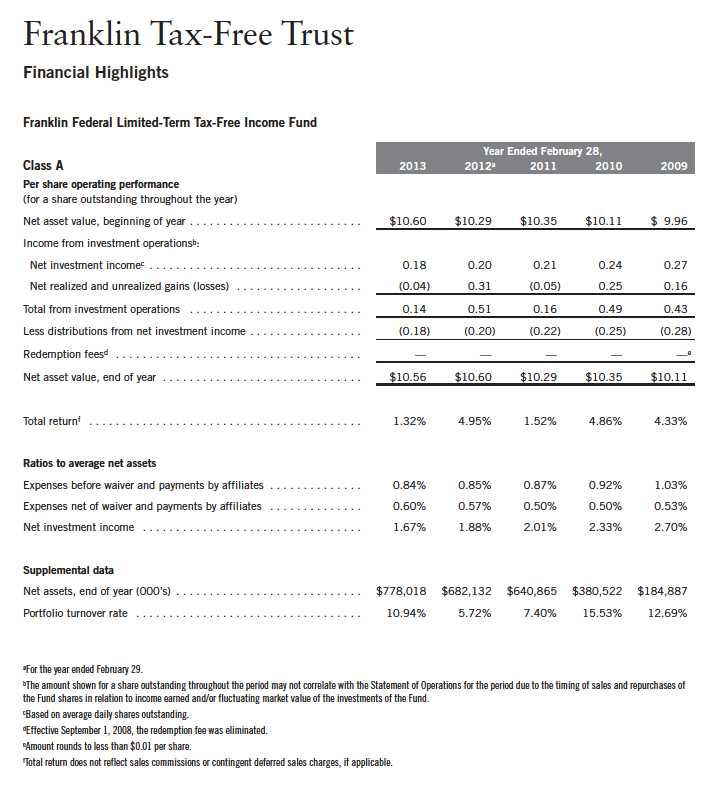
Annual Report | The accompanying notes are an integral part of these financial statements. | 103
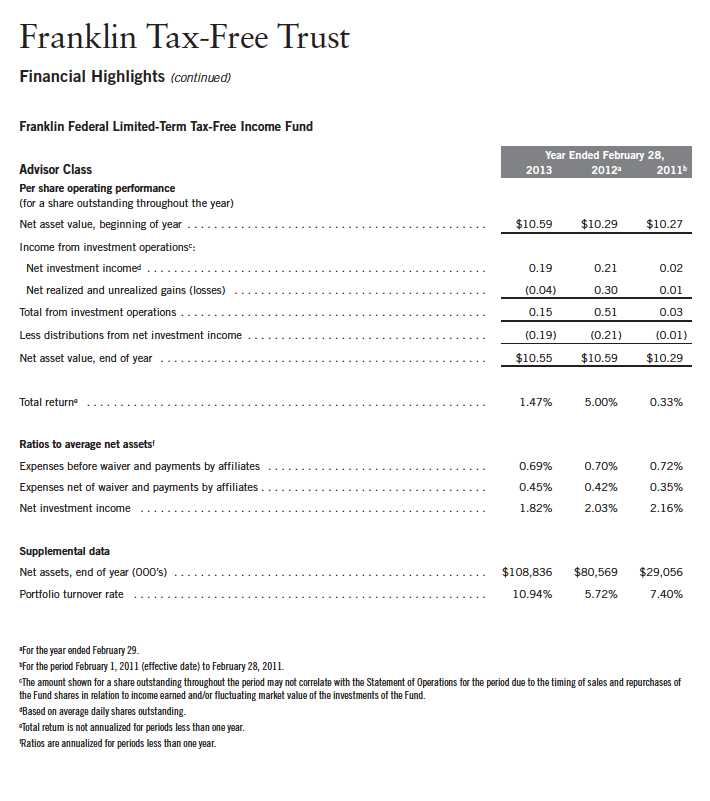
104 | The accompanying notes are an integral part of these financial statements. | Annual Report

Annual Report | 105
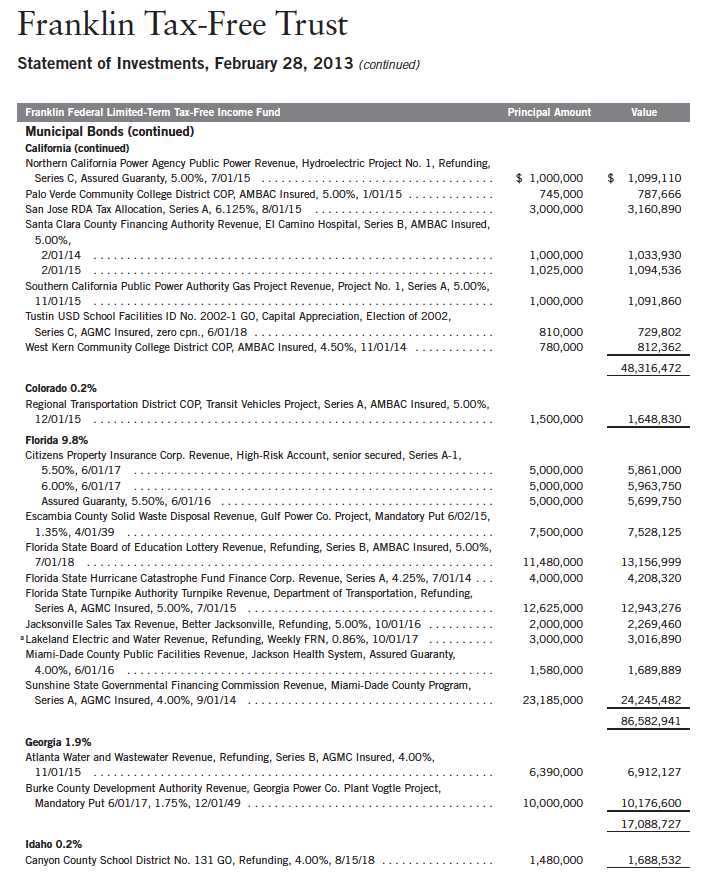
106 | Annual Report
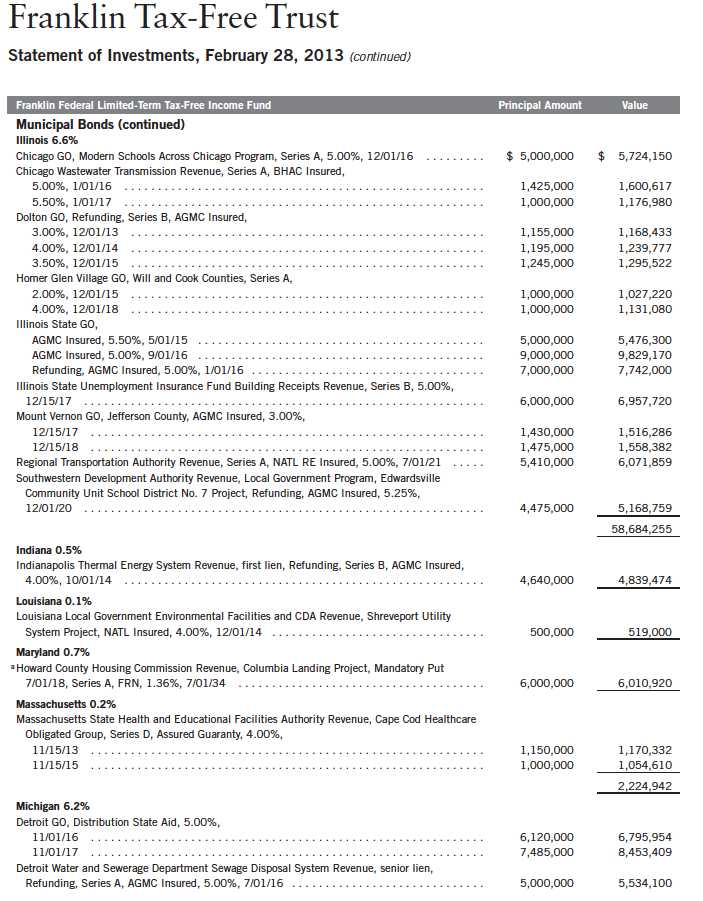
Annual Report | 107
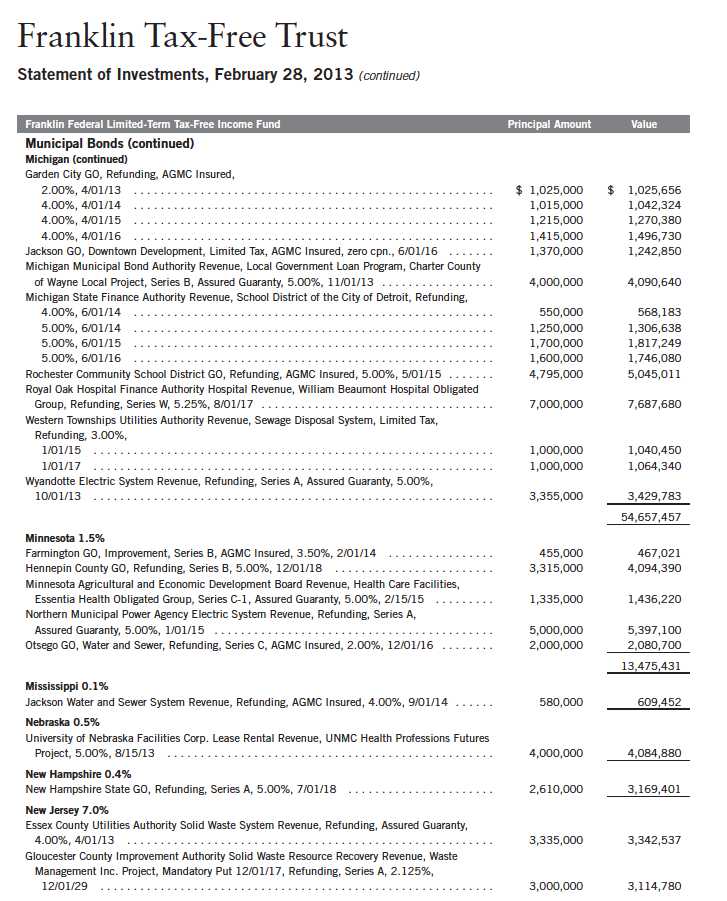
108 | Annual Report
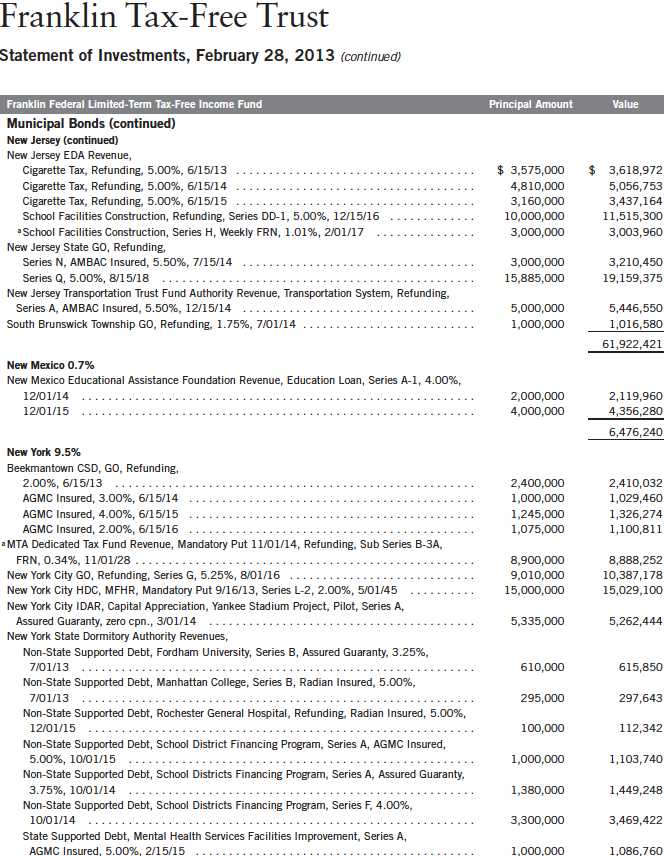
Annual Report | 109
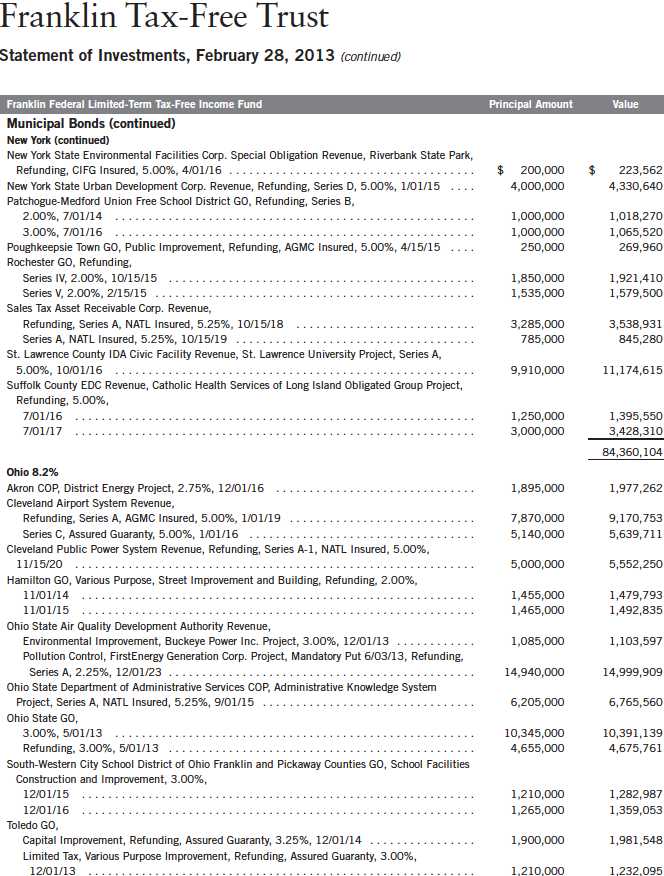
110 | Annual Report
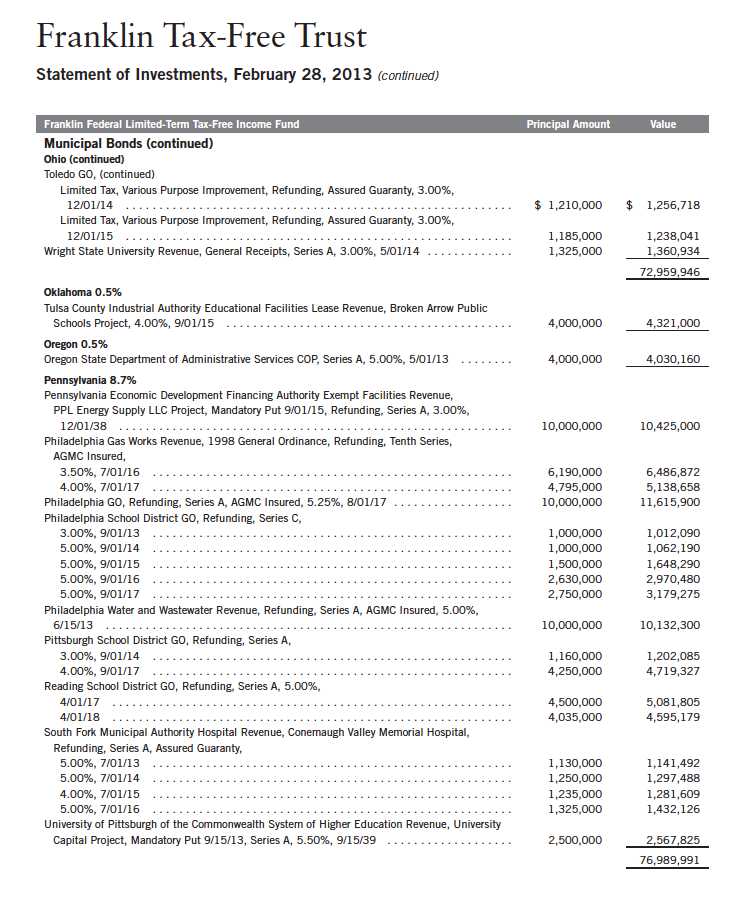
Annual Report | 111
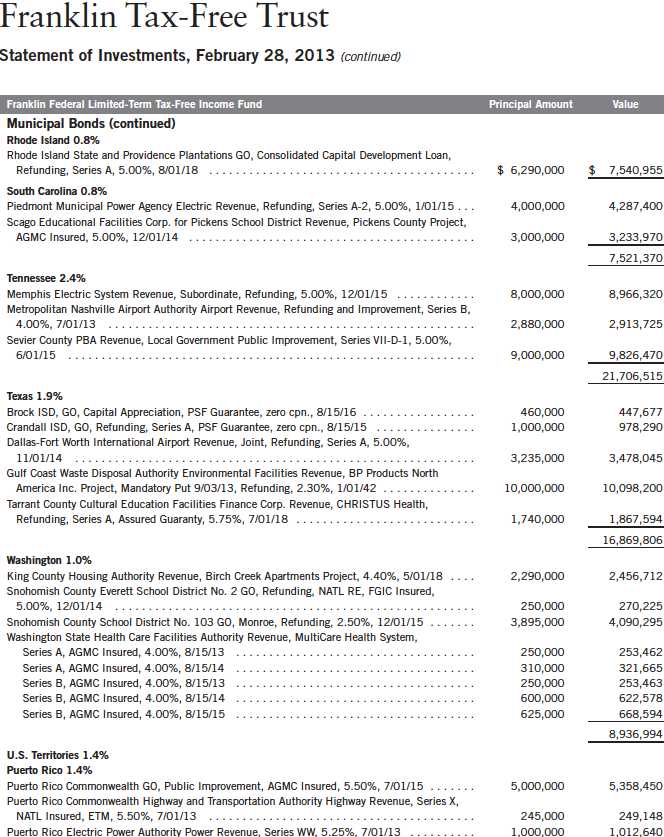
112 | Annual Report
Franklin Tax-Free Trust
Statement of Investments, February 28, 2013 (continued)
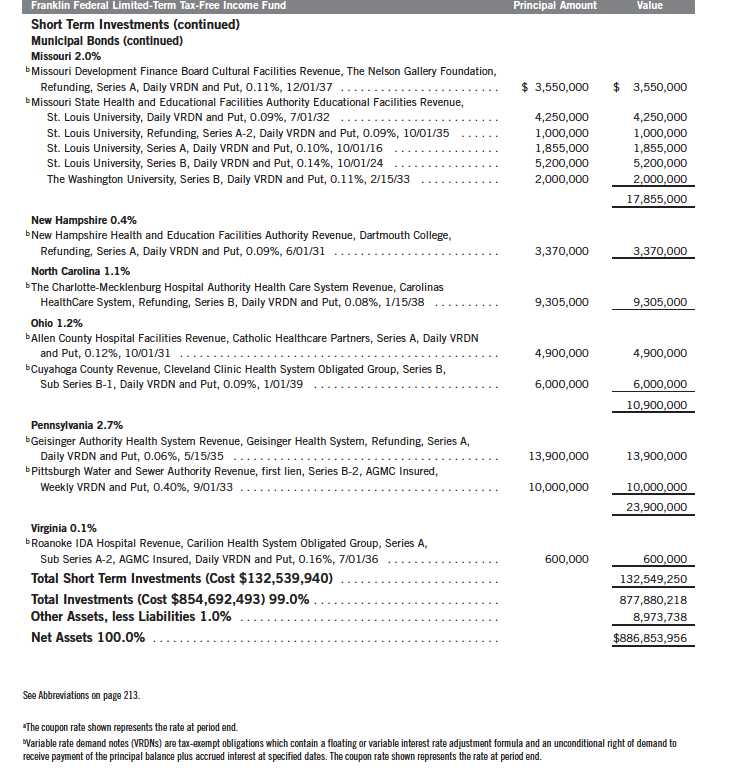
114 | The accompanying notes are an integral part of these financial statements. | Annual Report
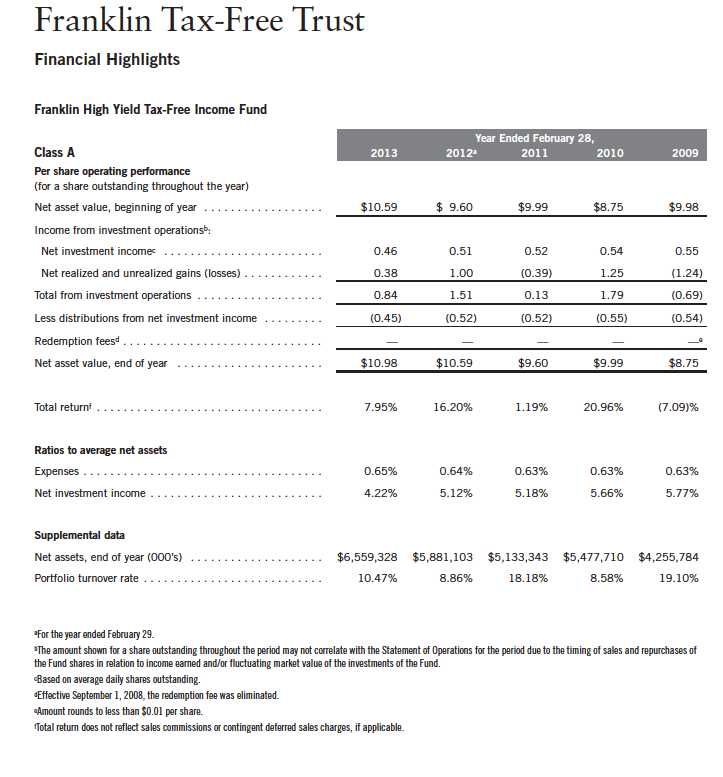
Annual Report | The accompanying notes are an integral part of these financial statements. | 115

116 | The accompanying notes are an integral part of these financial statements. | Annual Report

Annual Report | The accompanying notes are an integral part of these financial statements. | 117
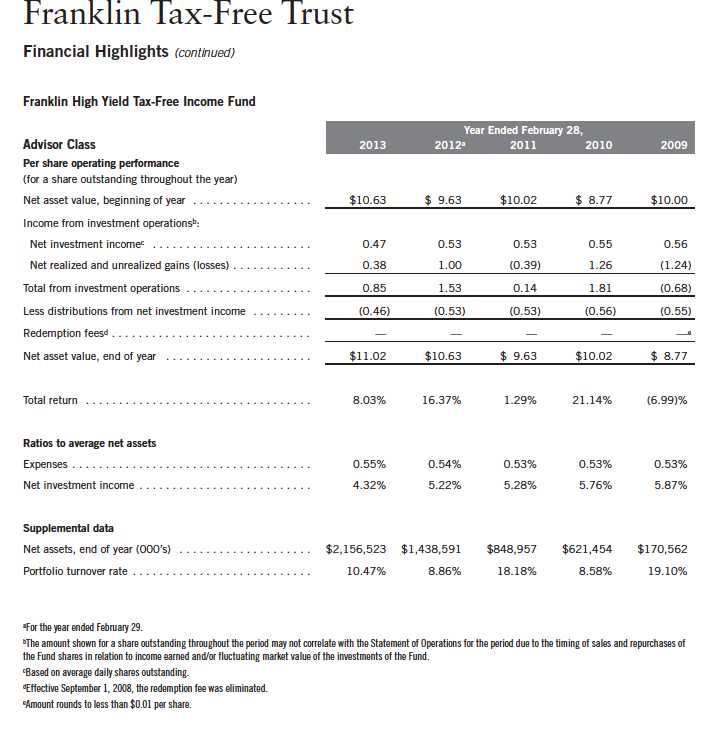
118 | The accompanying notes are an integral part of these financial statements. | Annual Report
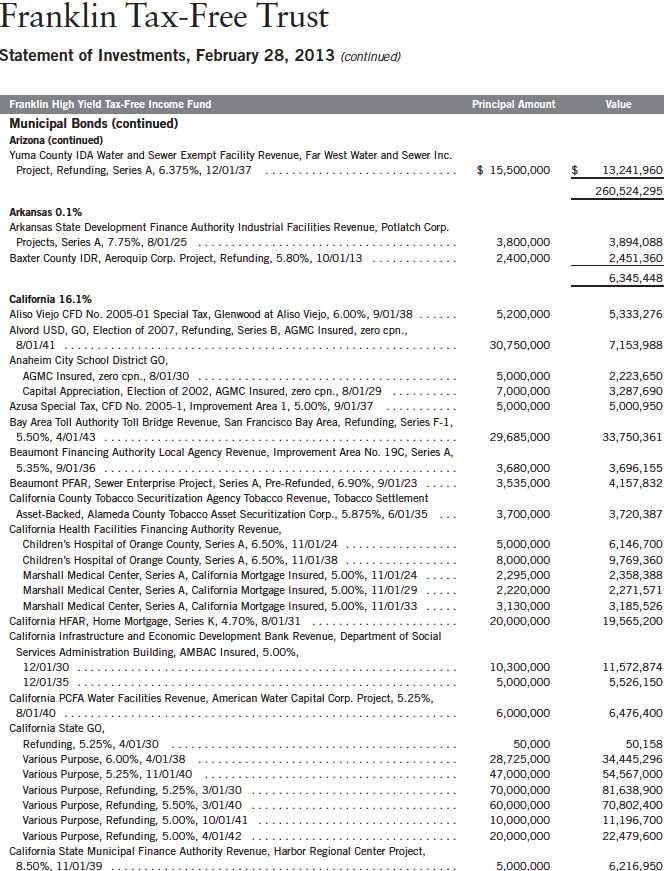
120 | Annual Report
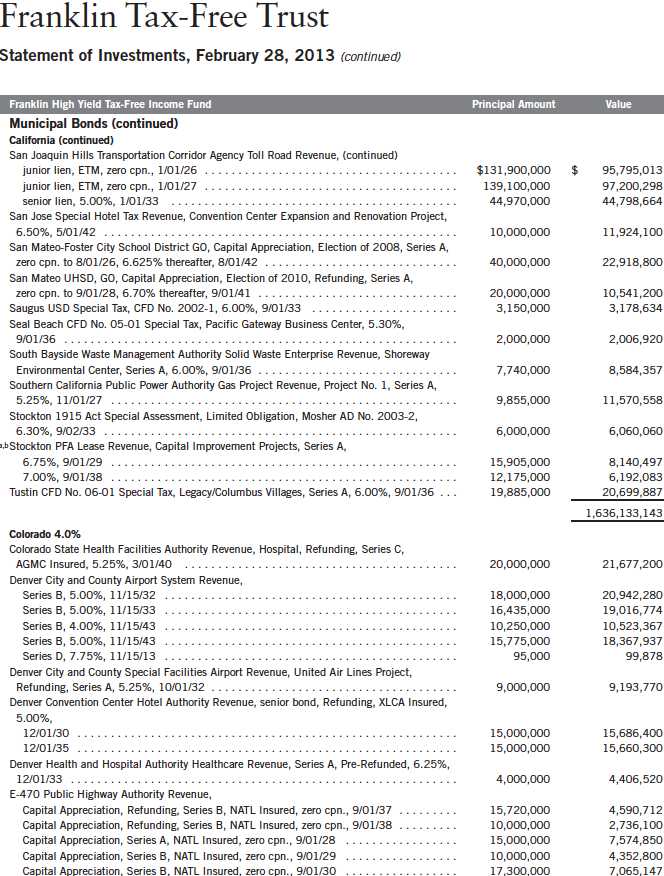
Annual Report | 123
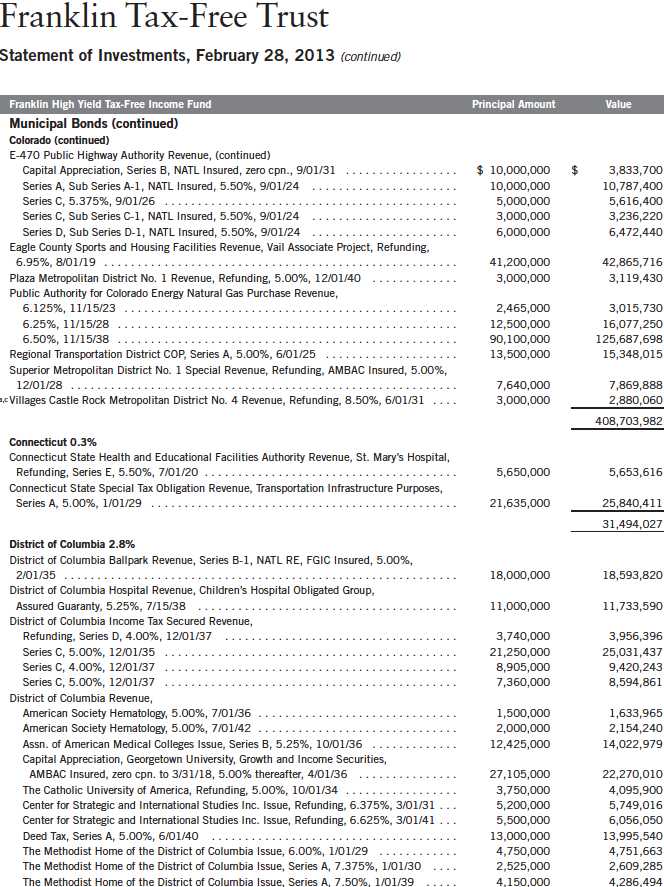
124 | Annual Report
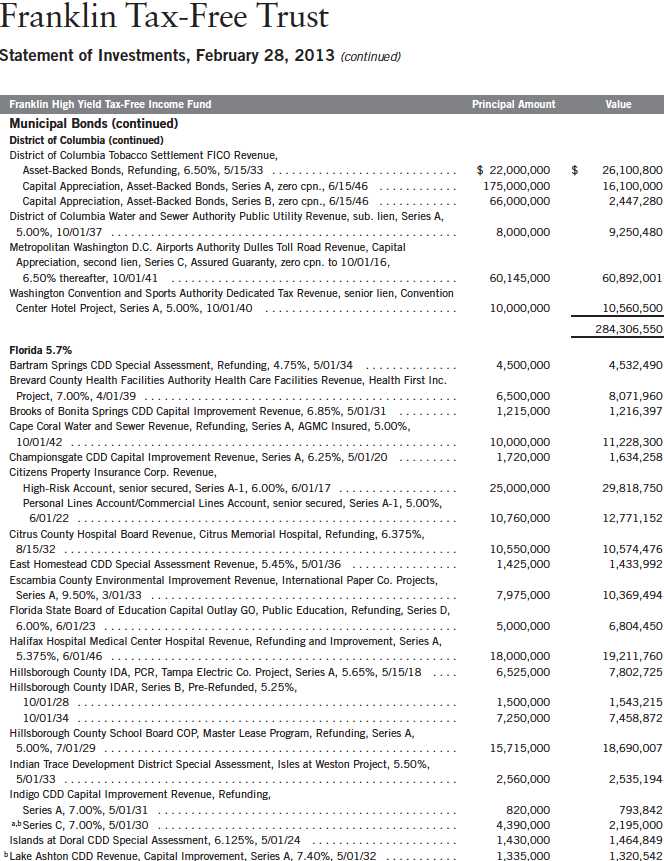
Annual Report | 125
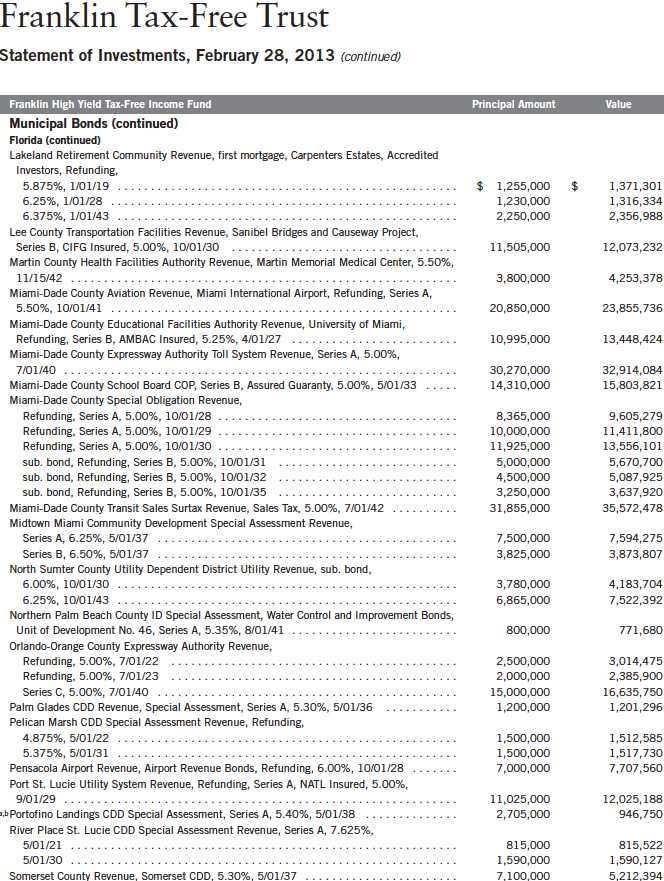
126 | Annual Report
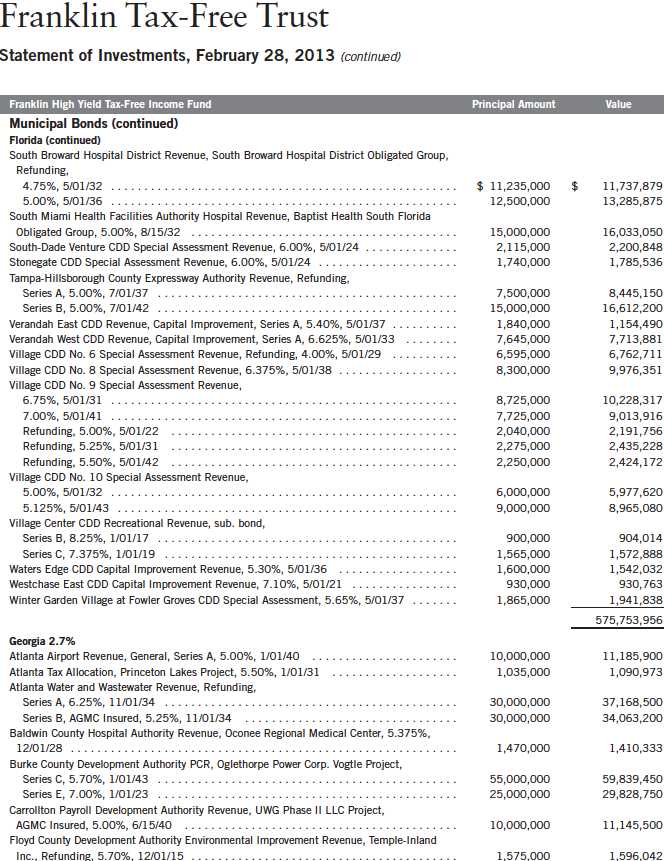
Annual Report | 127
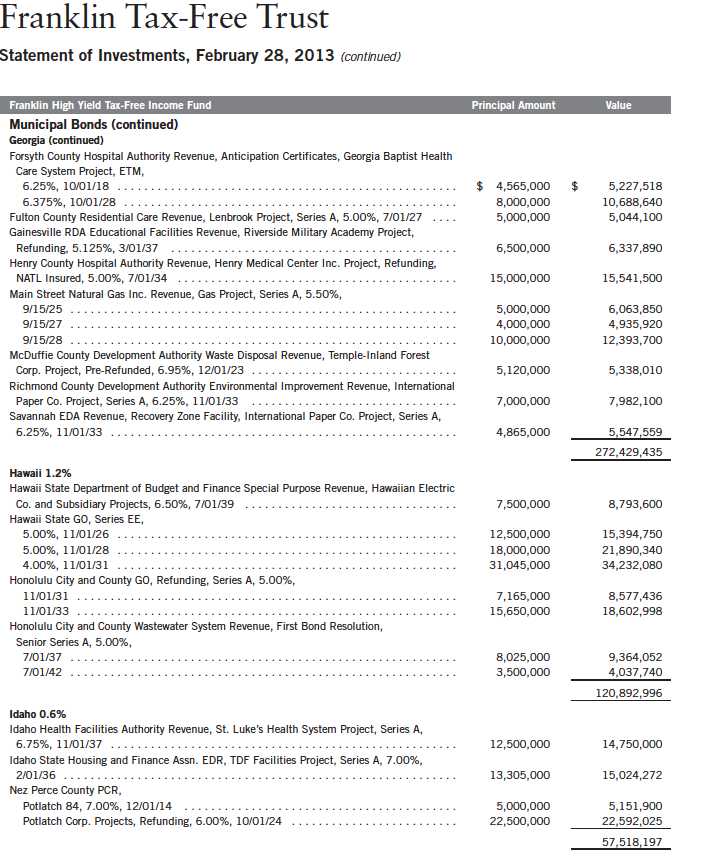
128 | Annual Report
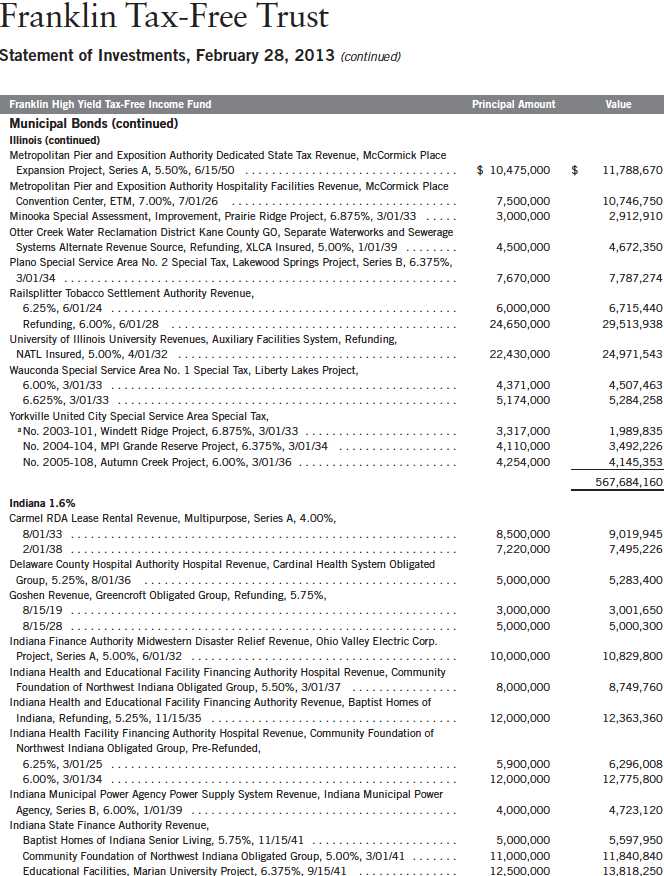
130 | Annual Report
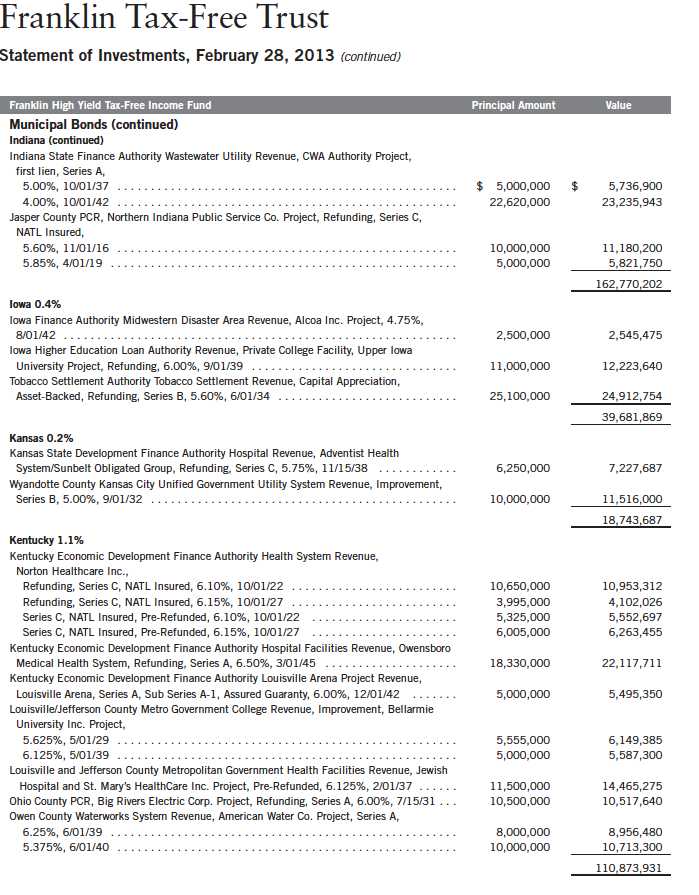
Annual Report | 131
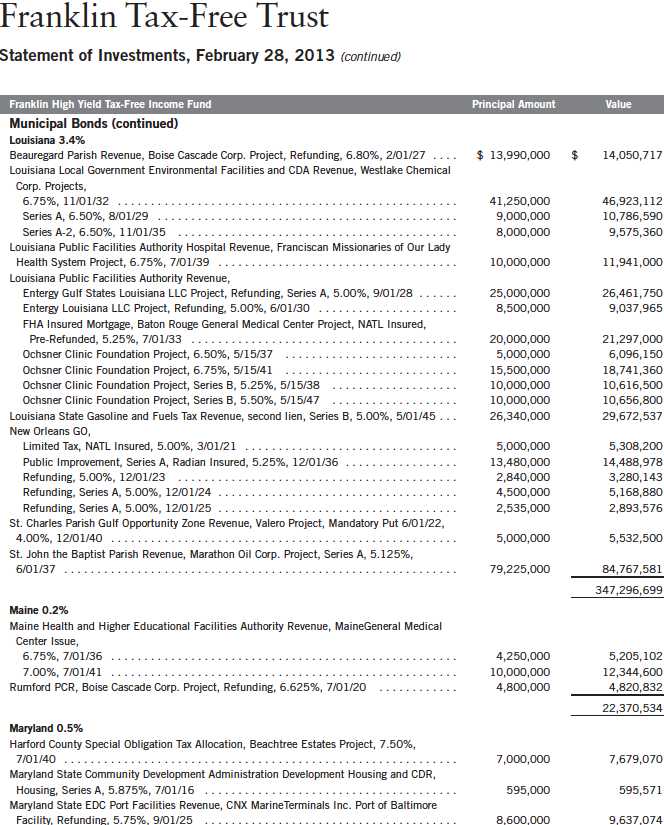
132 | Annual Report

Annual Report | 133

134 | Annual Report
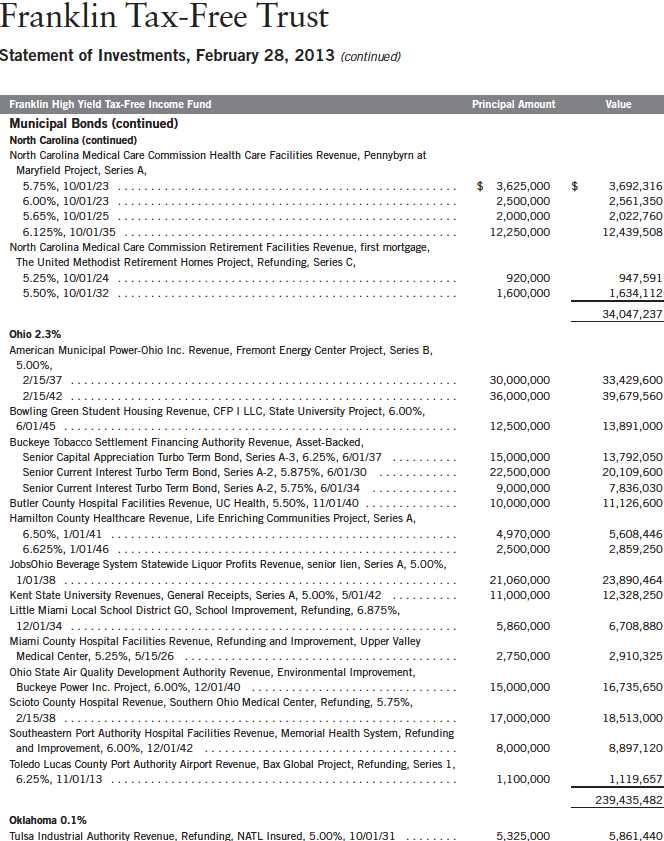
Annual Report | 139
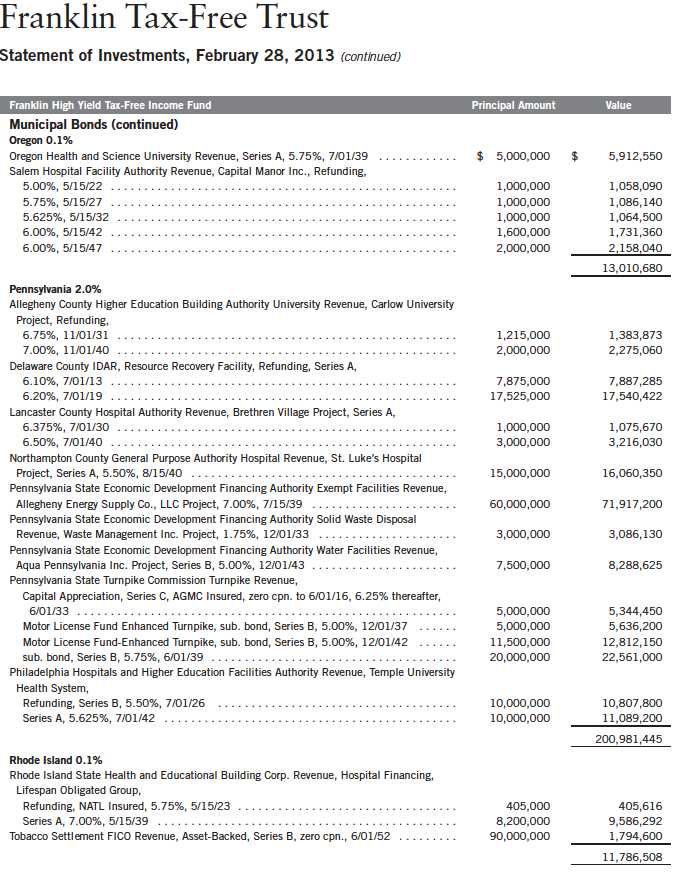
140 | Annual Report
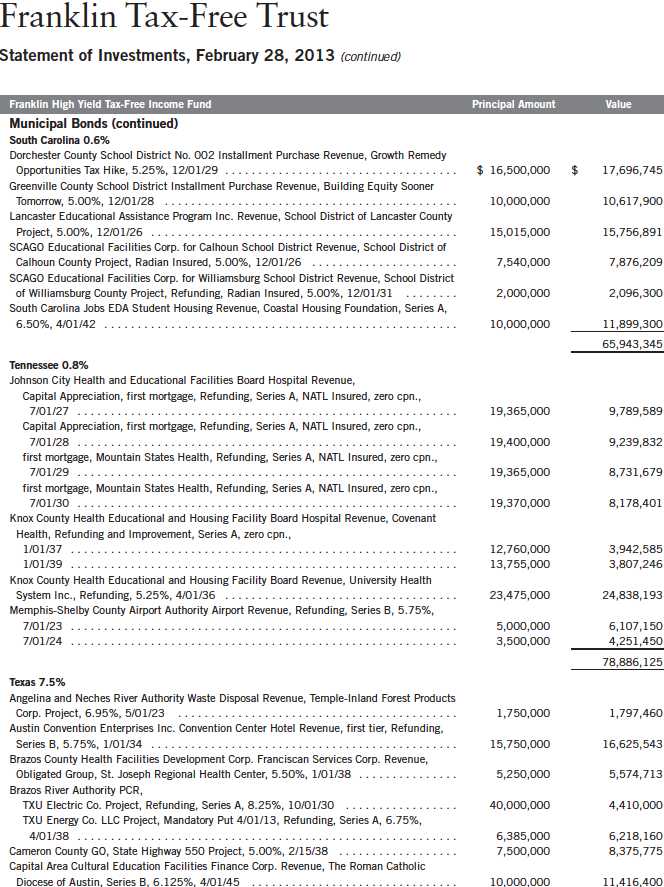
Annual Report | 141

Annual Report | 143
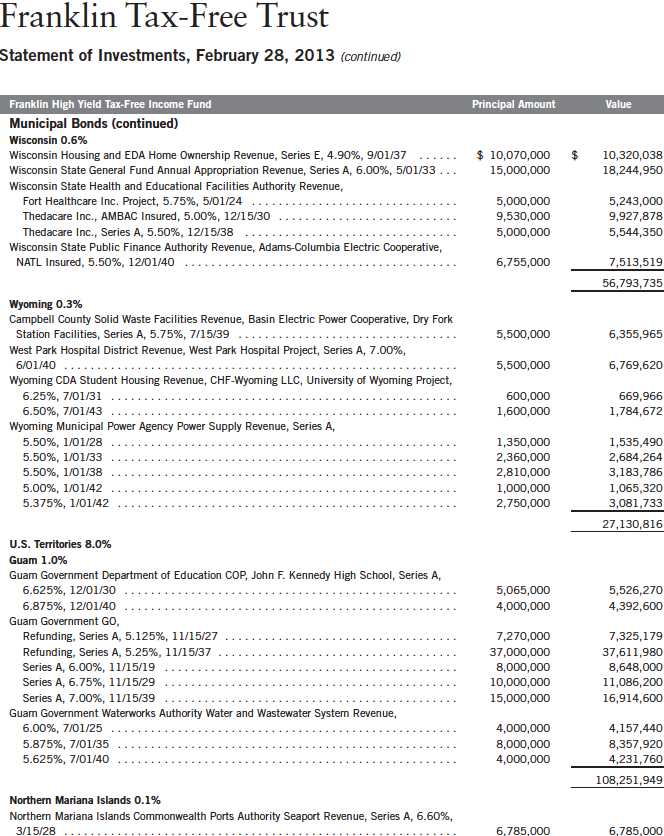
Annual Report | 145
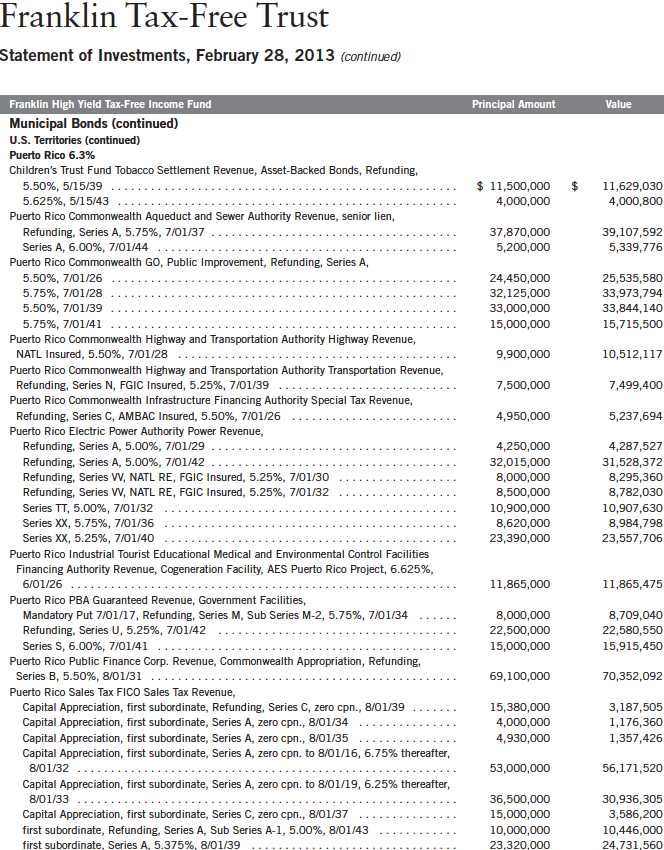
146 | Annual Report
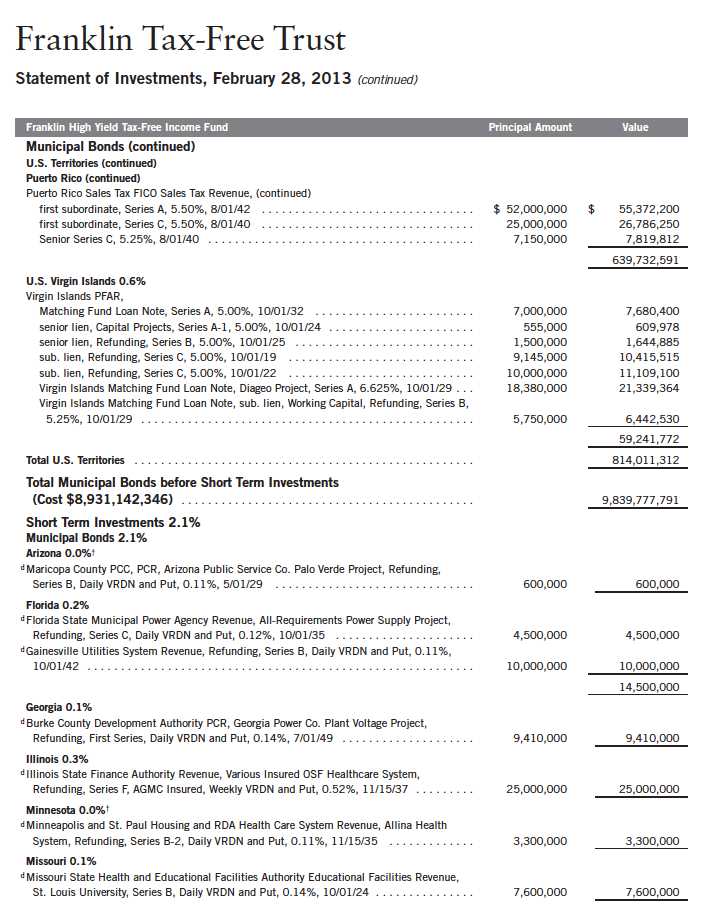
Annual Report | 147
Franklin Tax-Free Trust
Statement of Investments, February 28, 2013 (continued)

148 | Annual Report
Annual Report | The accompanying notes are an integral part of these financial statements. | 149

150 | The accompanying notes are an integral part of these financial statements. | Annual Report
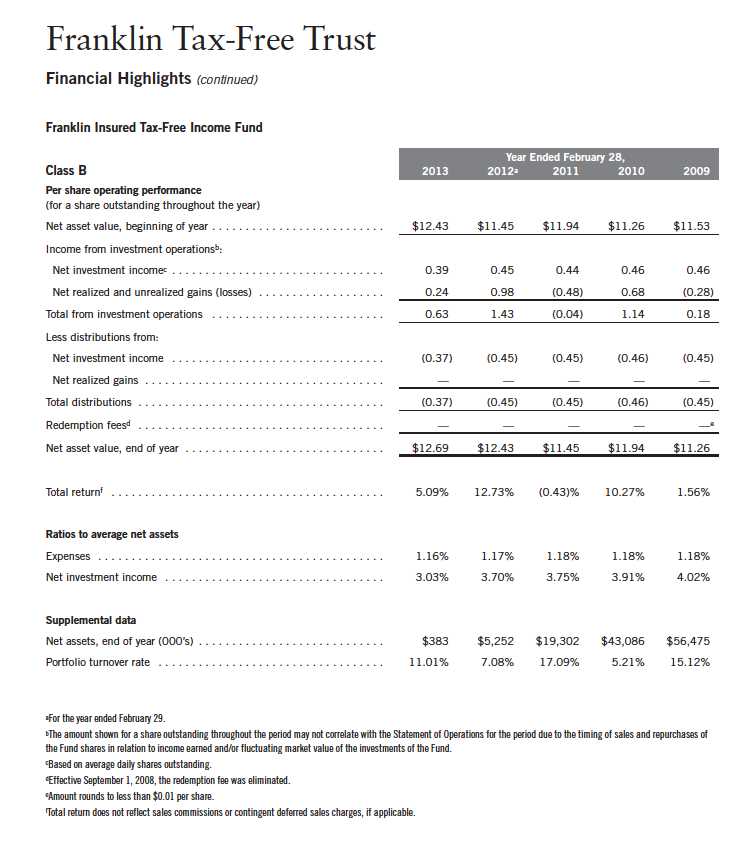
Annual Report | The accompanying notes are an integral part of these financial statements. | 151
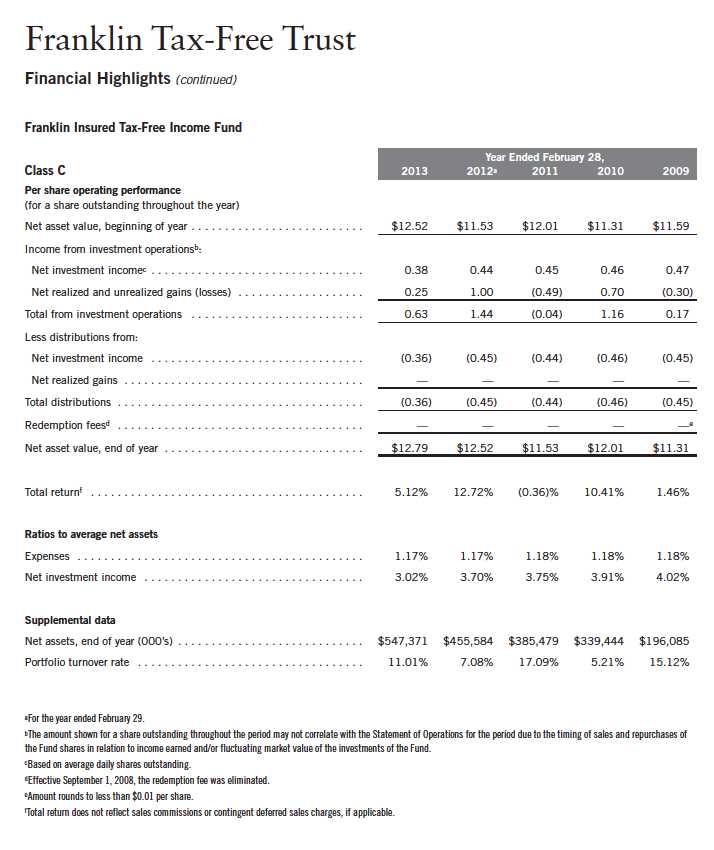
152 | The accompanying notes are an integral part of these financial statements. | Annual Report
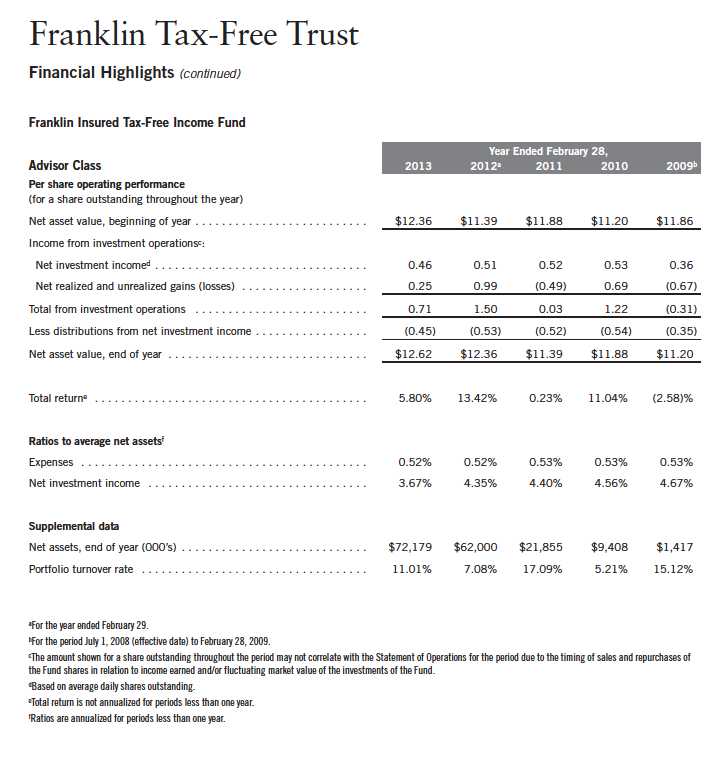
Annual Report | The accompanying notes are an integral part of these financial statements. | 153
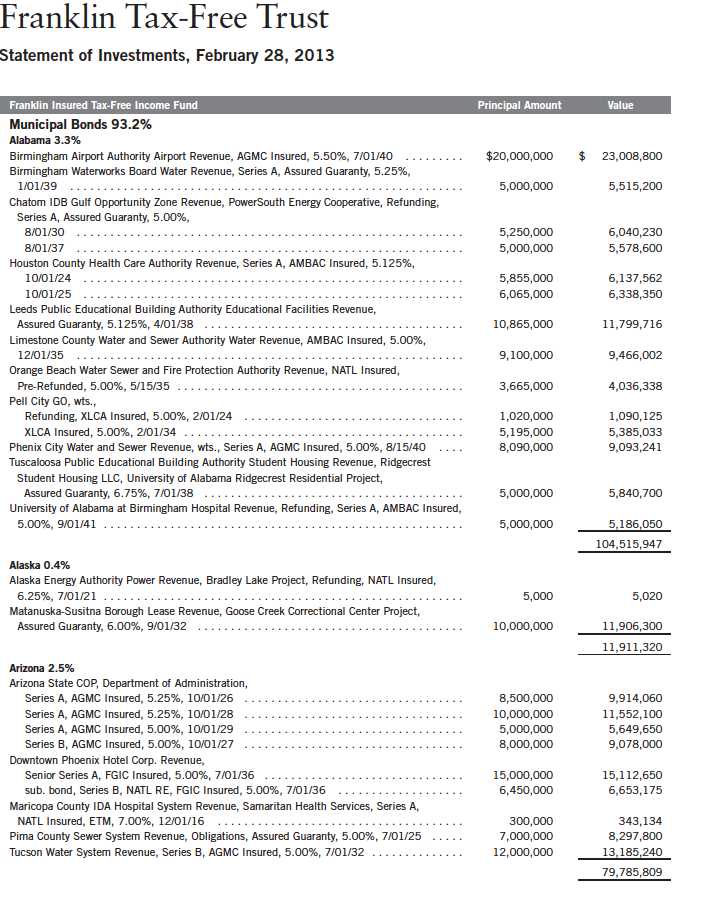
154 | Annual Report
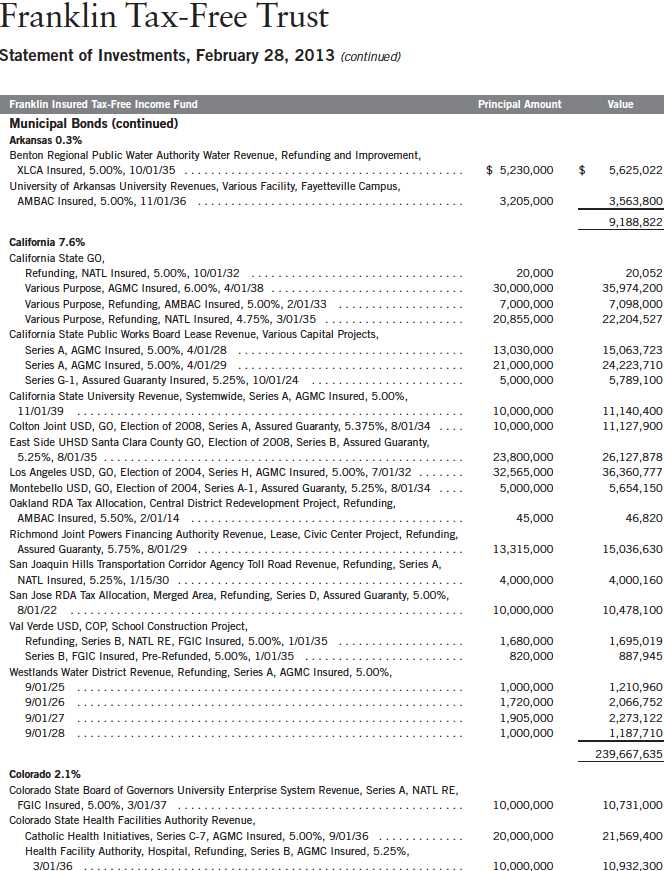
Annual Report | 155

156 | Annual Report
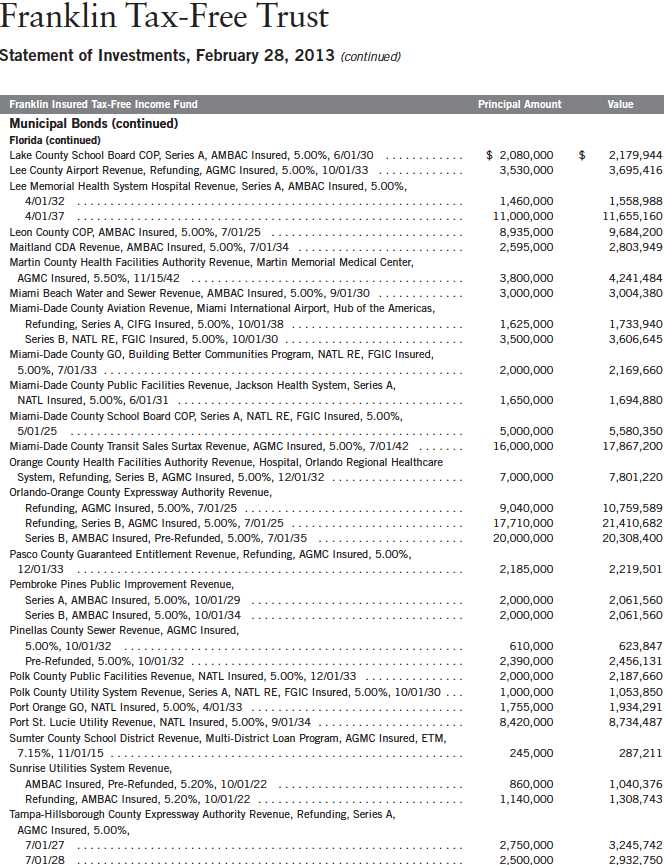
Annual Report | 157

158 | Annual Report
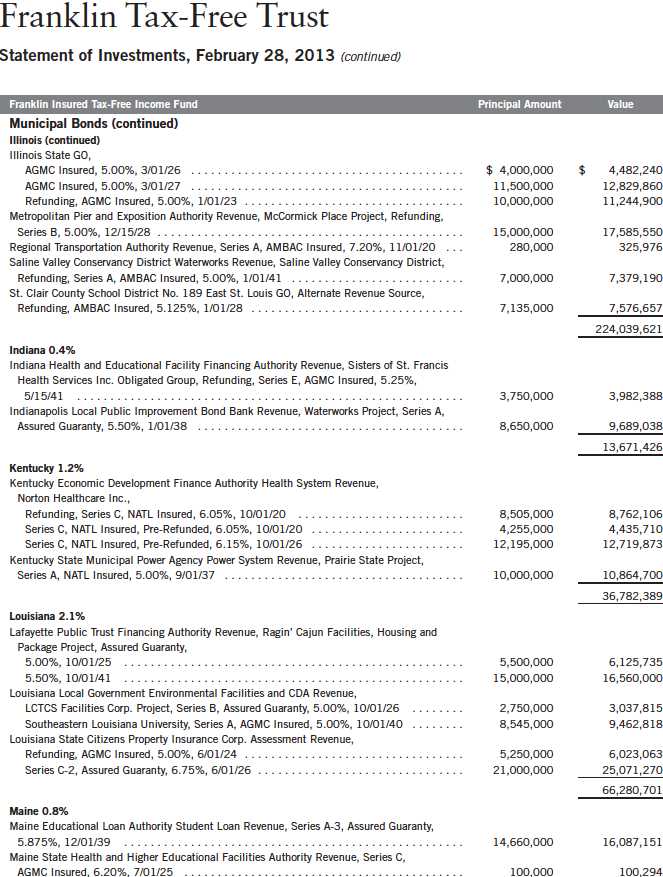
Annual Report | 159
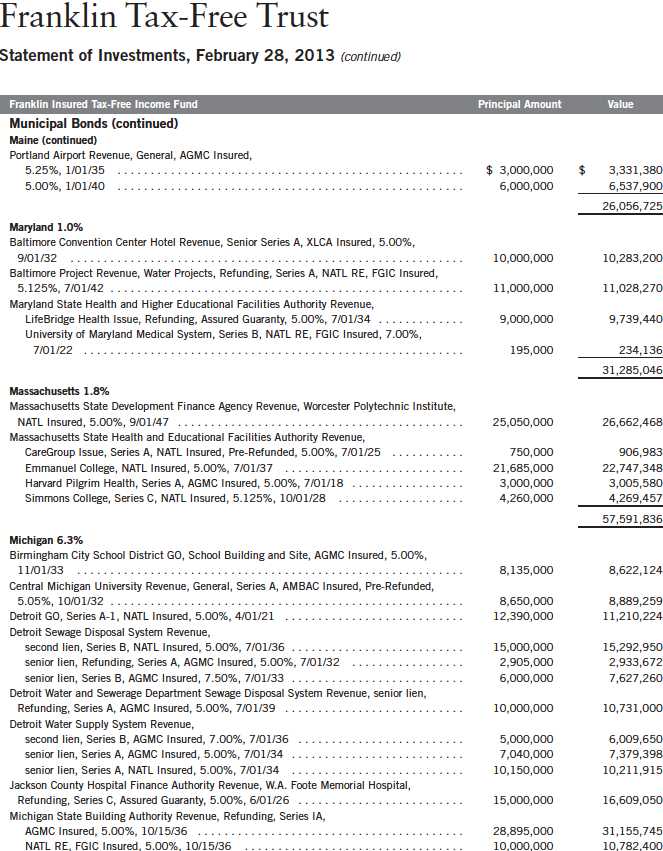
160 | Annual Report
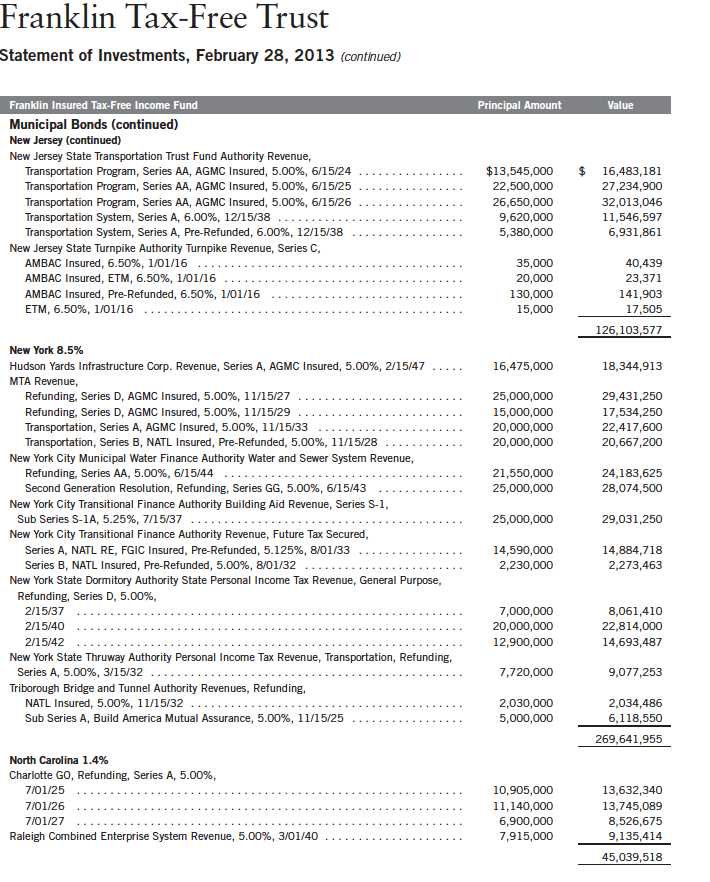
162 | Annual Report
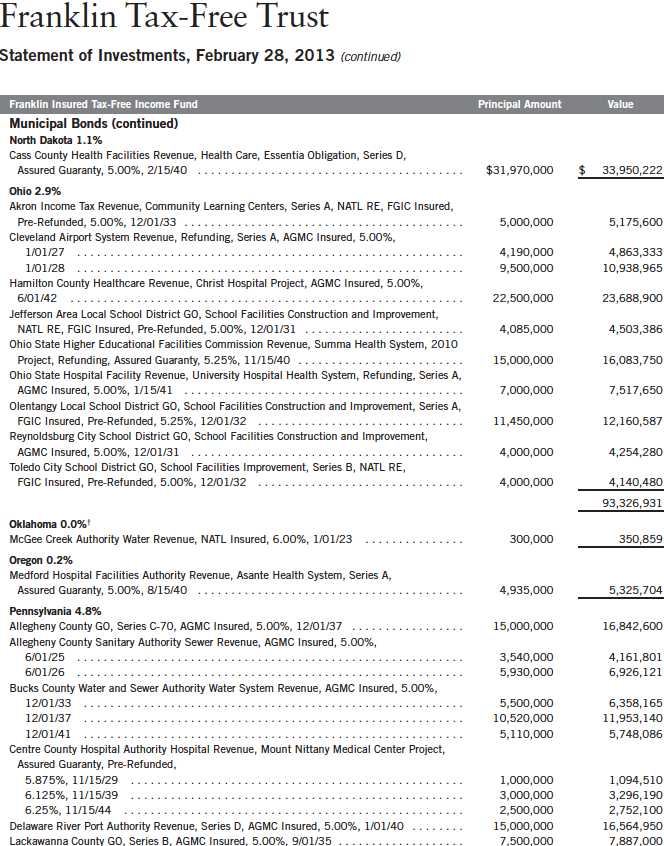
Annual Report | 163
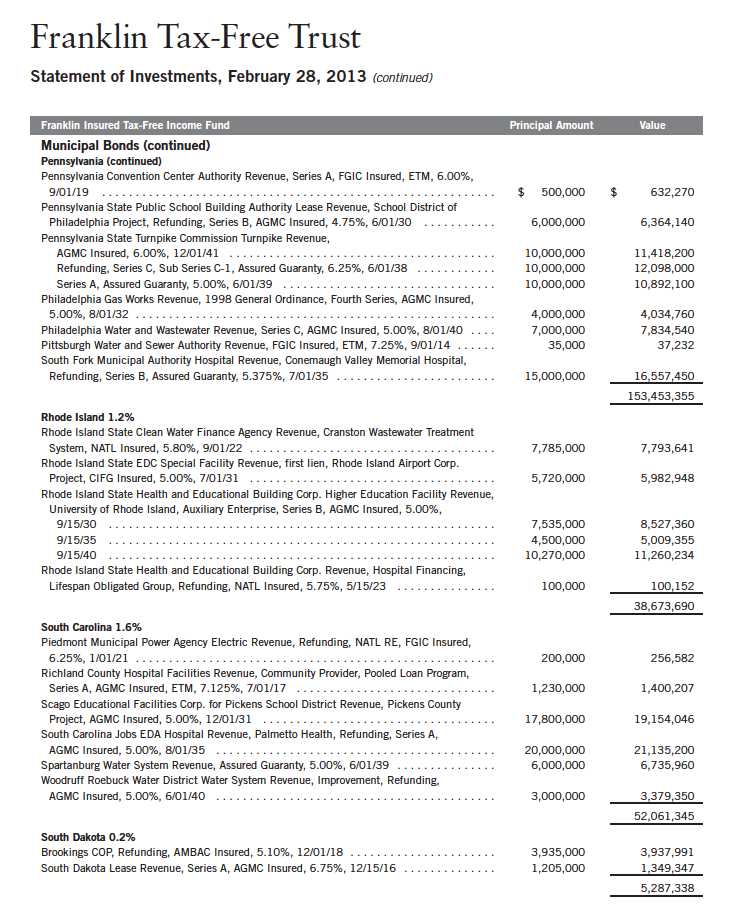
164 | Annual Report
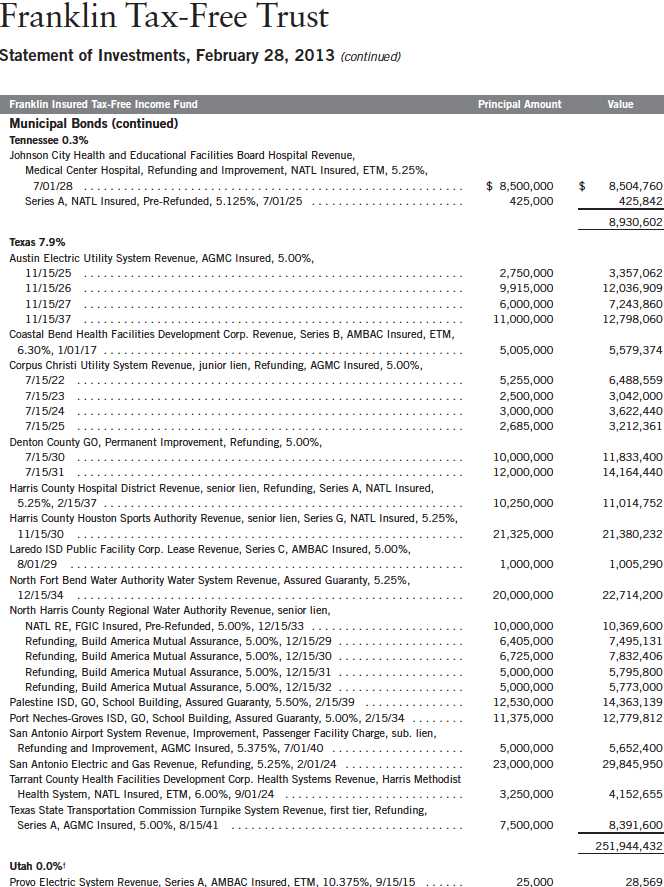
Annual Report | 165
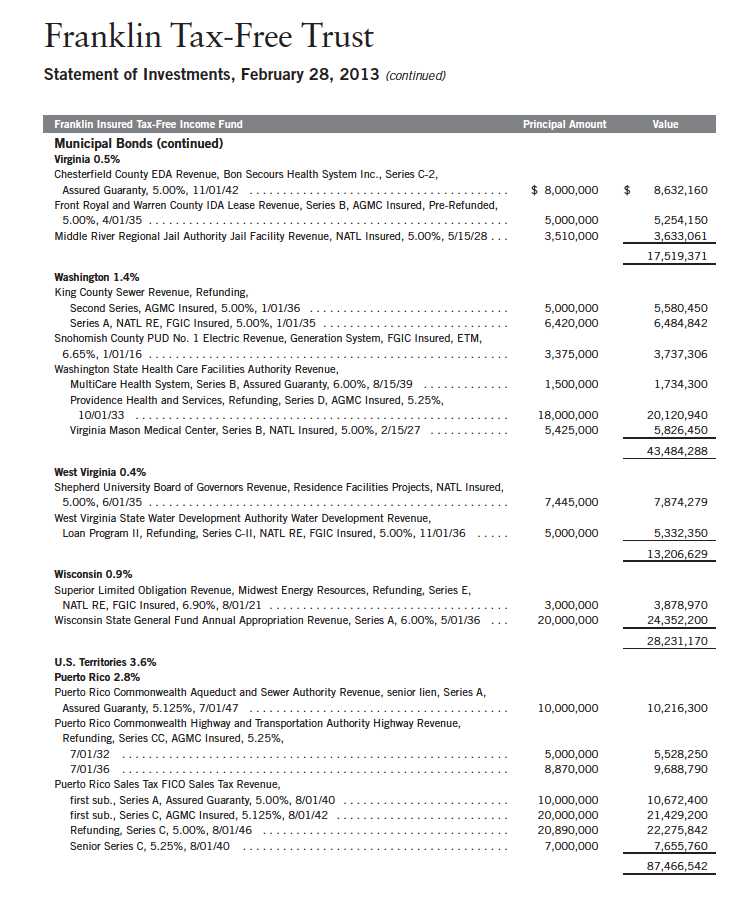
166 | Annual Report
Franklin Tax-Free Trust
Statement of Investments, February 28, 2013 (continued)
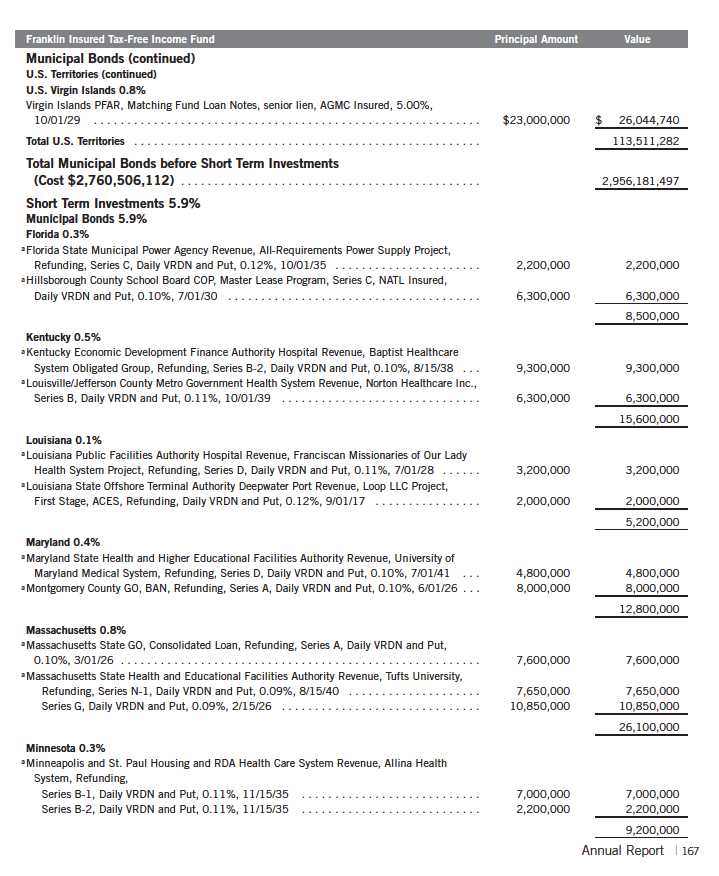
Franklin Tax-Free Trust
Statement of Investments, February 28, 2013 (continued)
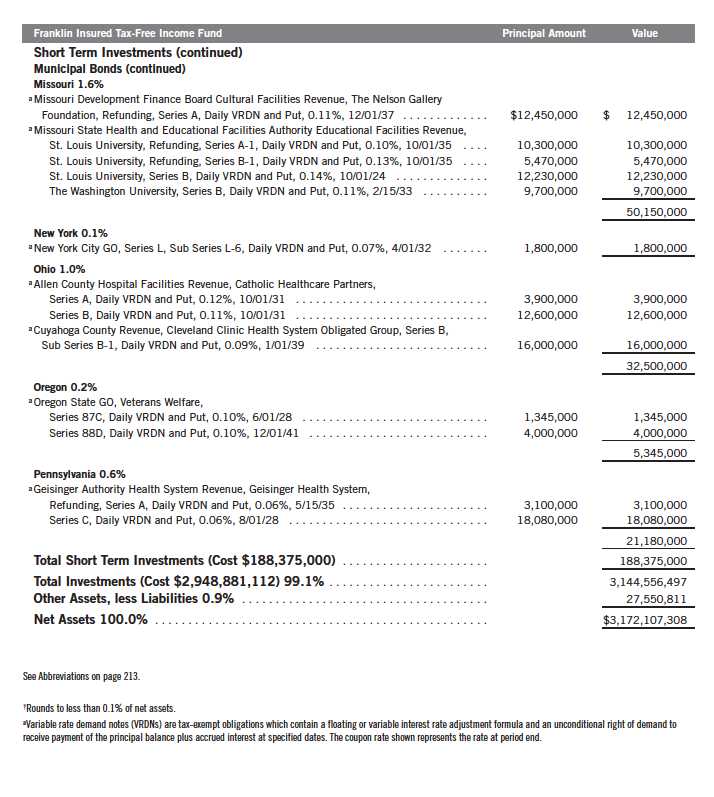
168 | The accompanying notes are an integral part of these financial statements. | Annual Report

Annual Report | The accompanying notes are an integral part of these financial statements. | 169
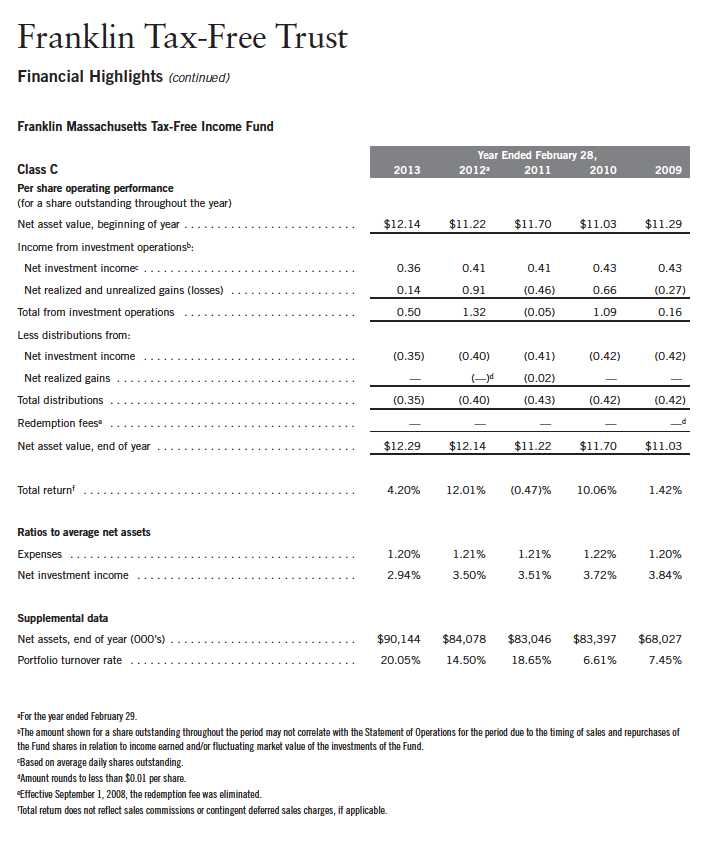
170 | The accompanying notes are an integral part of these financial statements. | Annual Report
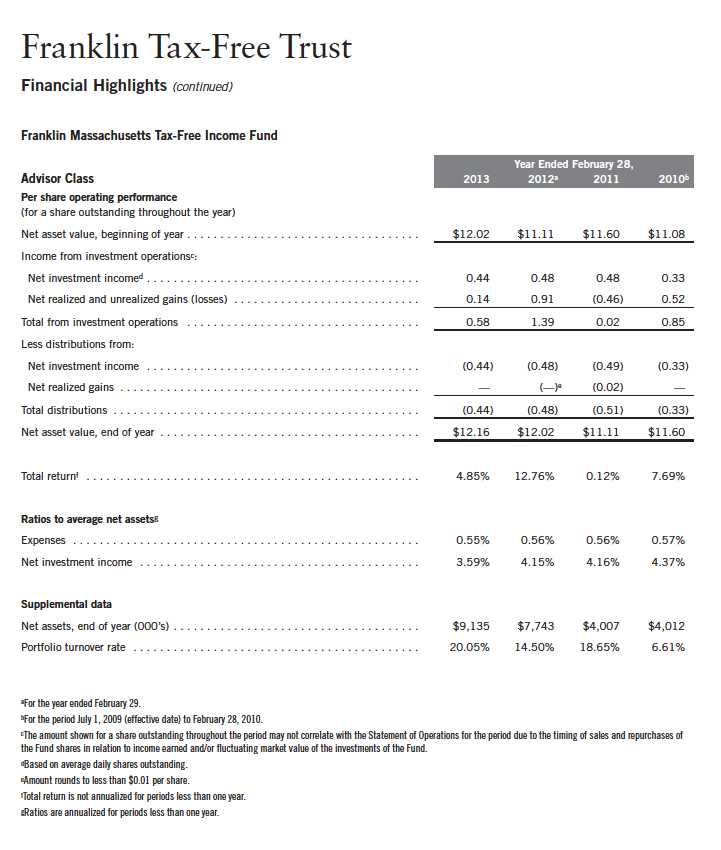
Annual Report | The accompanying notes are an integral part of these financial statements. | 171
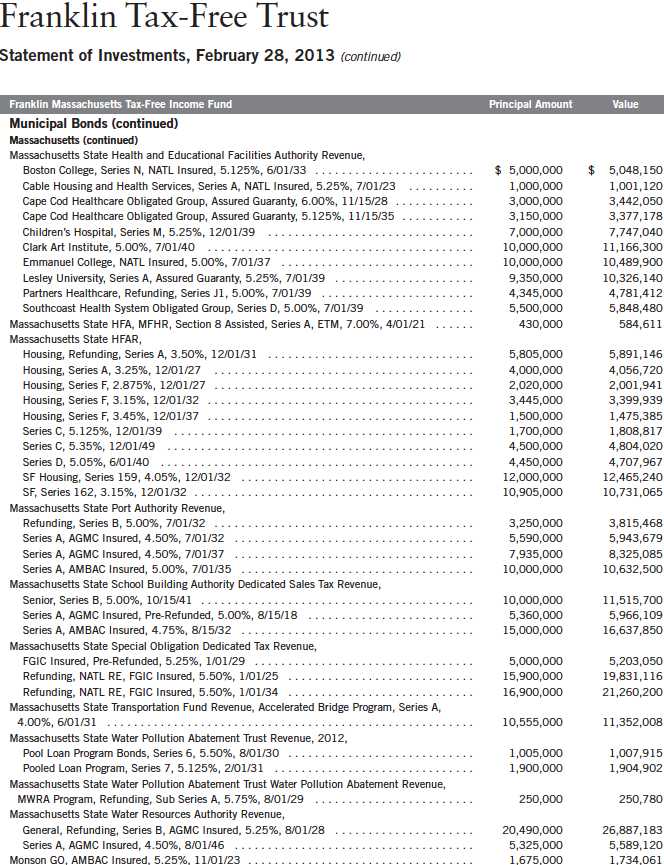
Annual Report | 173
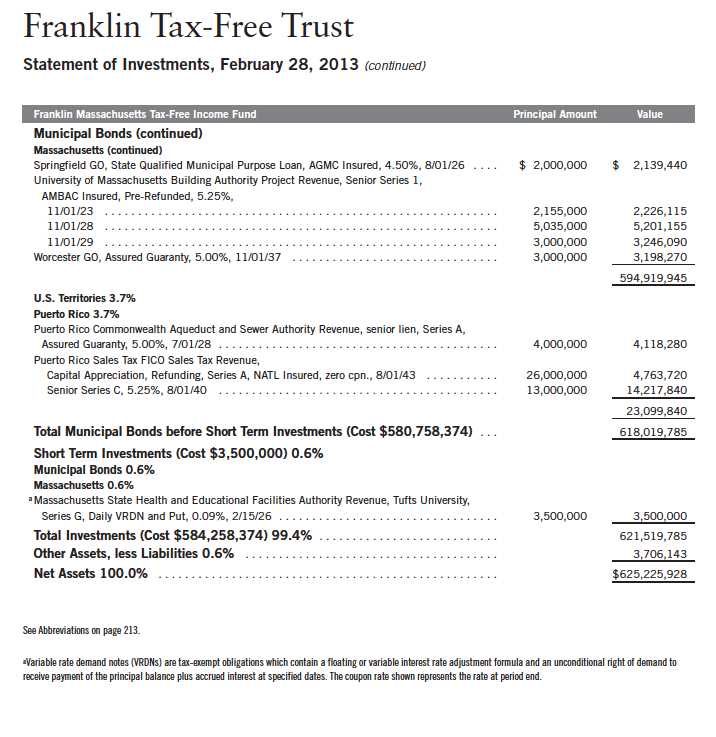
174 | The accompanying notes are an integral part of these financial statements. | Annual Report

Annual Report | The accompanying notes are an integral part of these financial statements. | 175
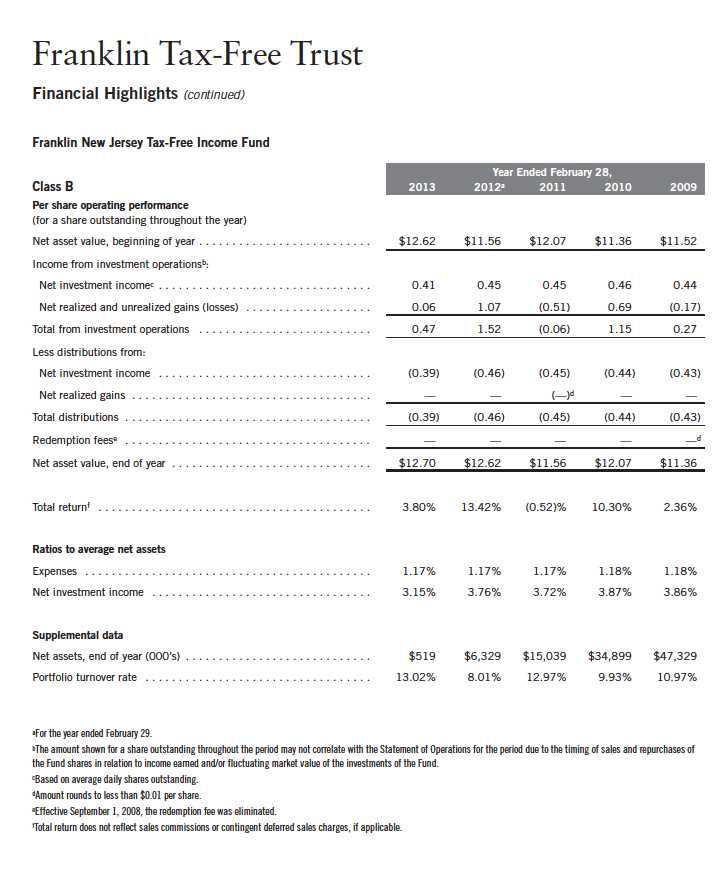
176 | The accompanying notes are an integral part of these financial statements. | Annual Report
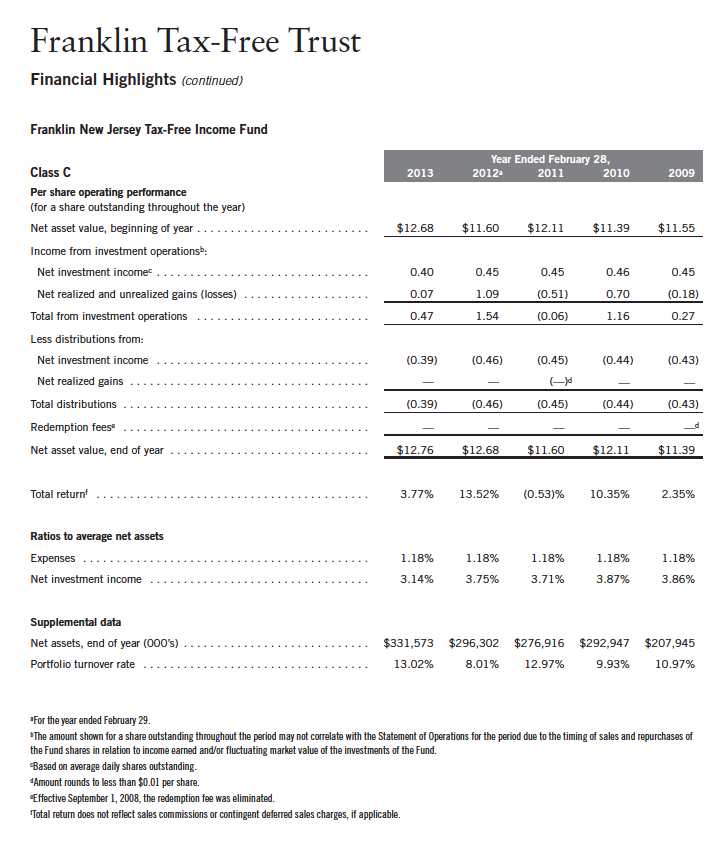
Annual Report | The accompanying notes are an integral part of these financial statements. | 177
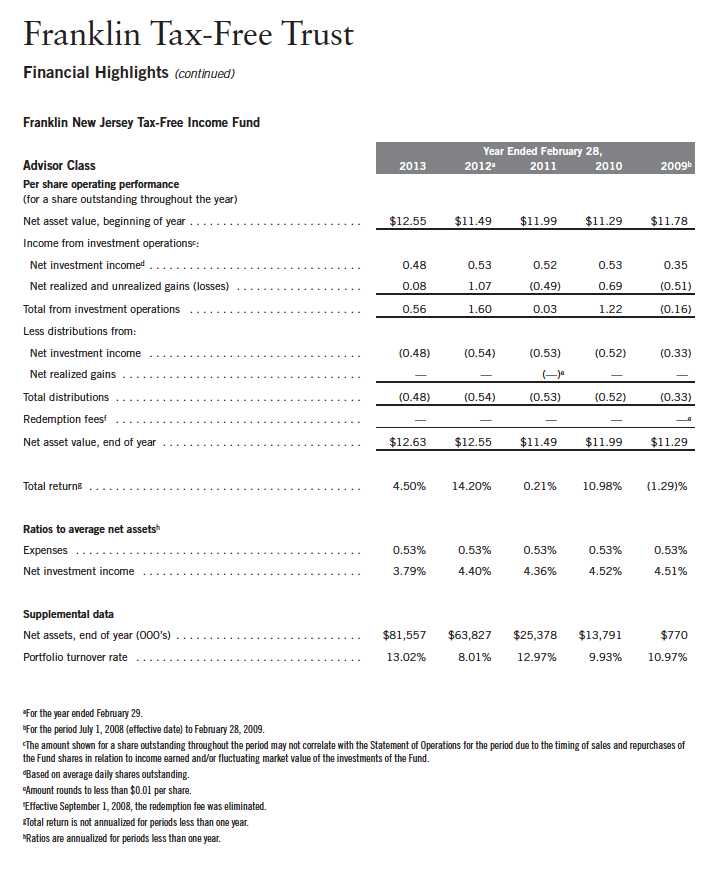
178 | The accompanying notes are an integral part of these financial statements. | Annual Report
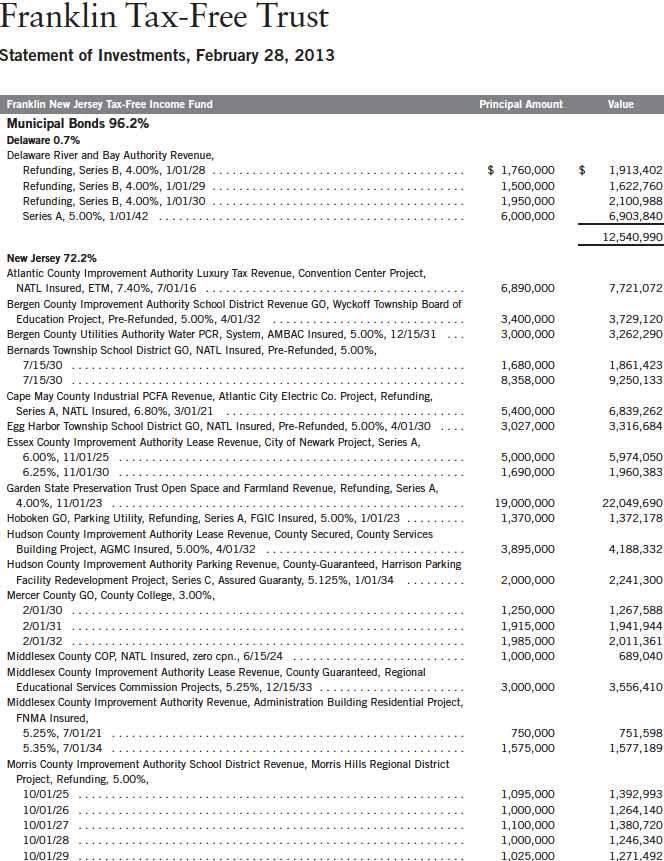
Annual Report | 179
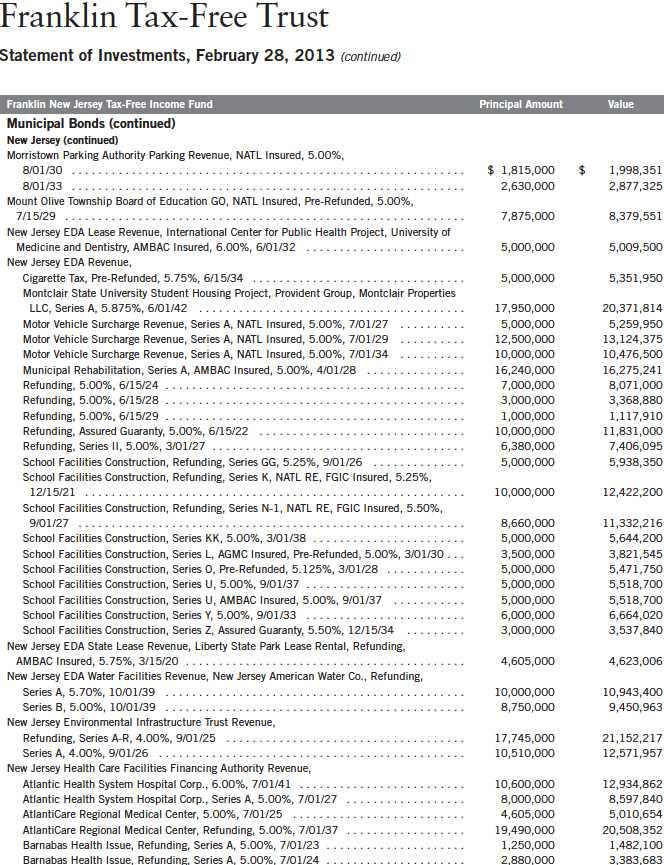
180 | Annual Report

Annual Report | 181
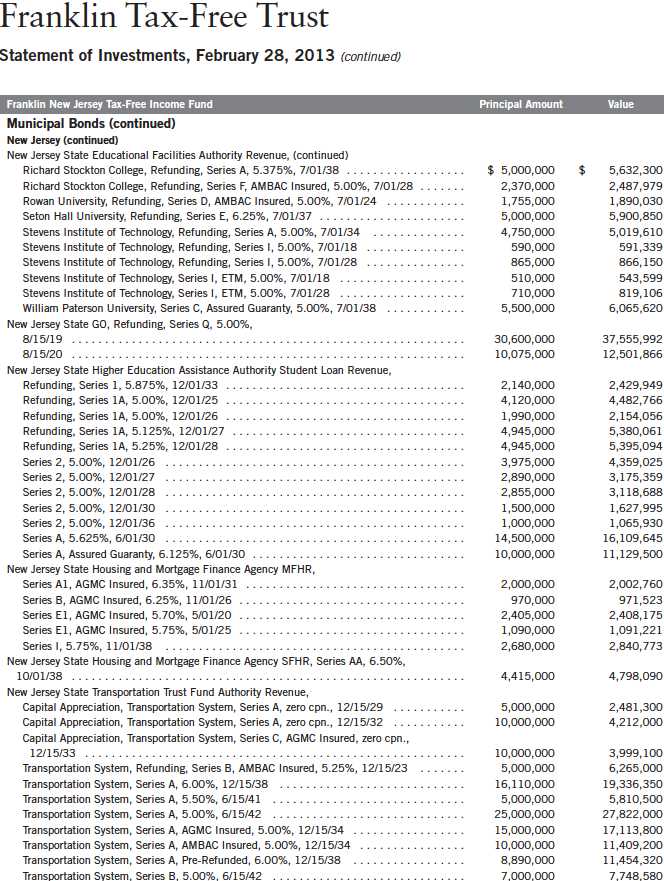
182 | Annual Report

Annual Report | 183
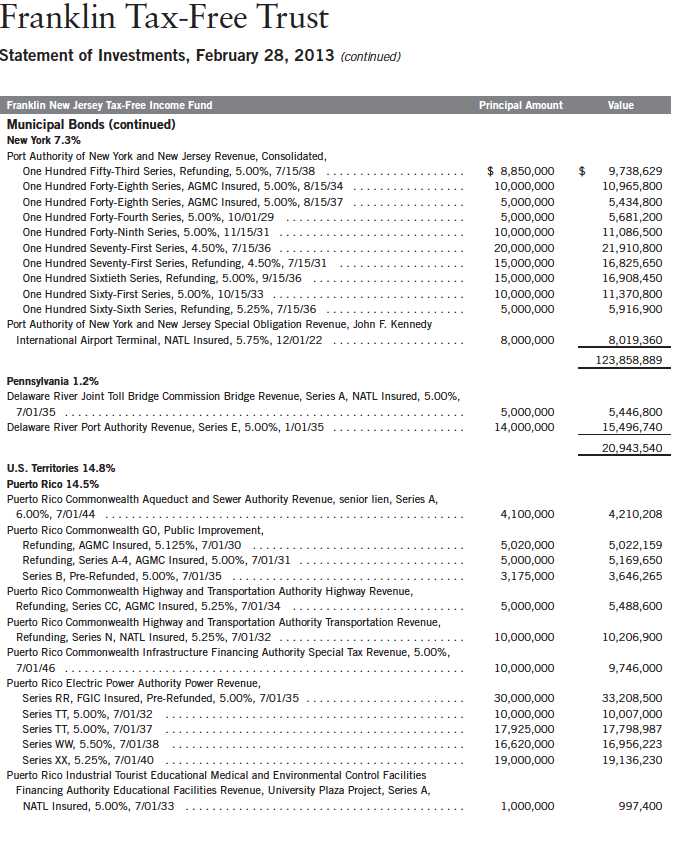
184 | Annual Report
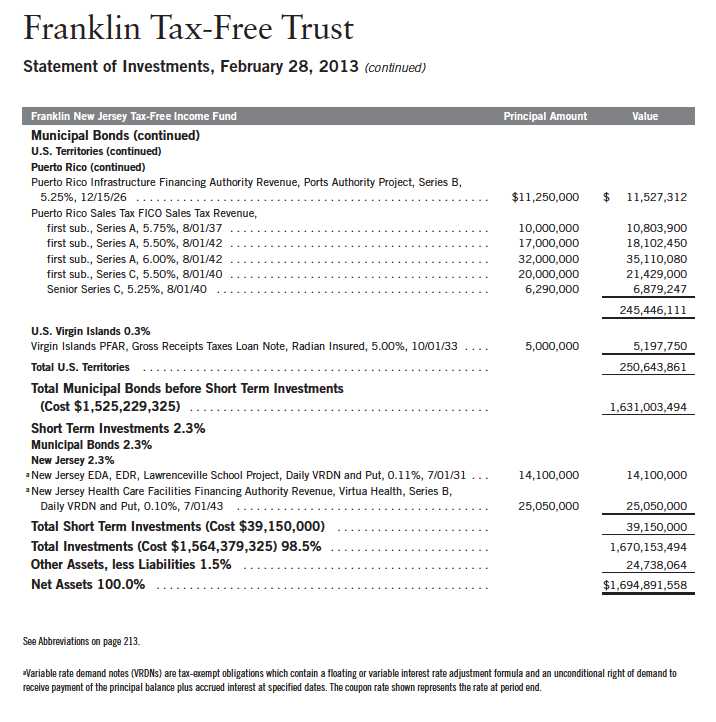
Annual Report | The accompanying notes are an integral part of these financial statements. | 185
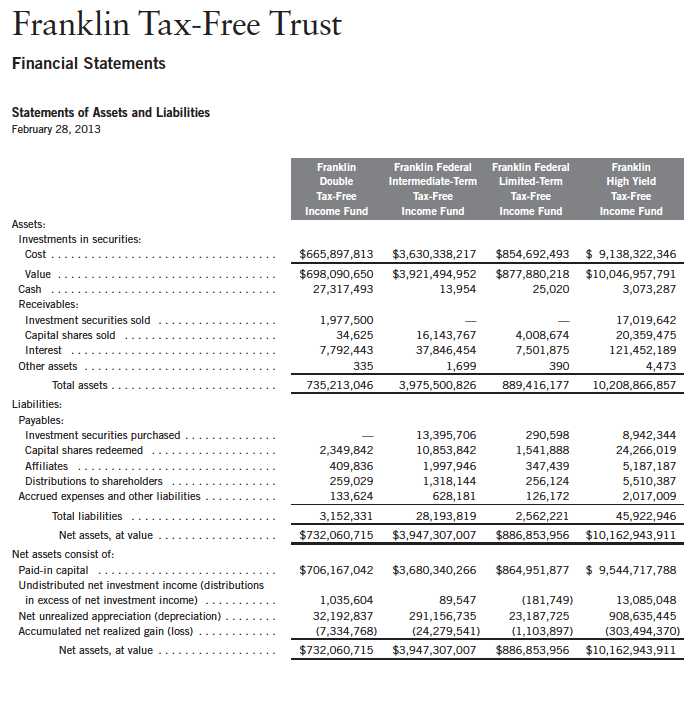
186 | The accompanying notes are an integral part of these financial statements. | Annual Report
Franklin Tax-Free Trust
Financial Statements (continued)
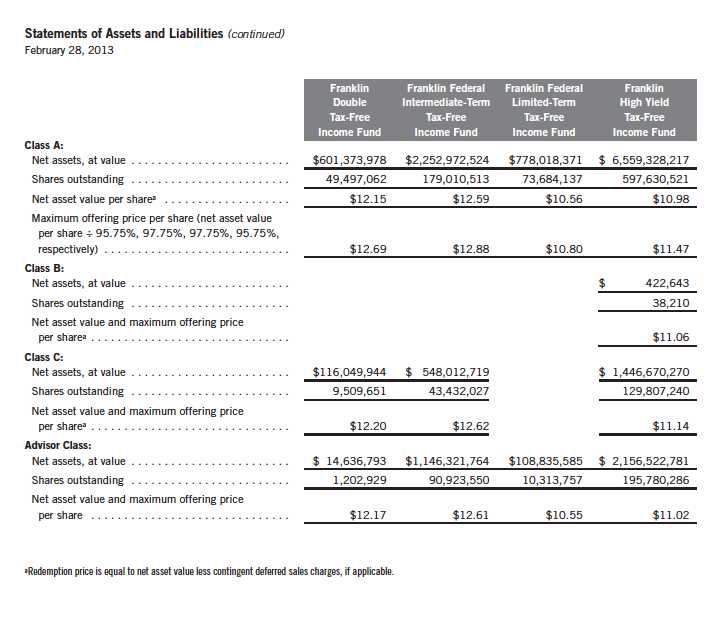
Annual Report | The accompanying notes are an integral part of these financial statements. | 187
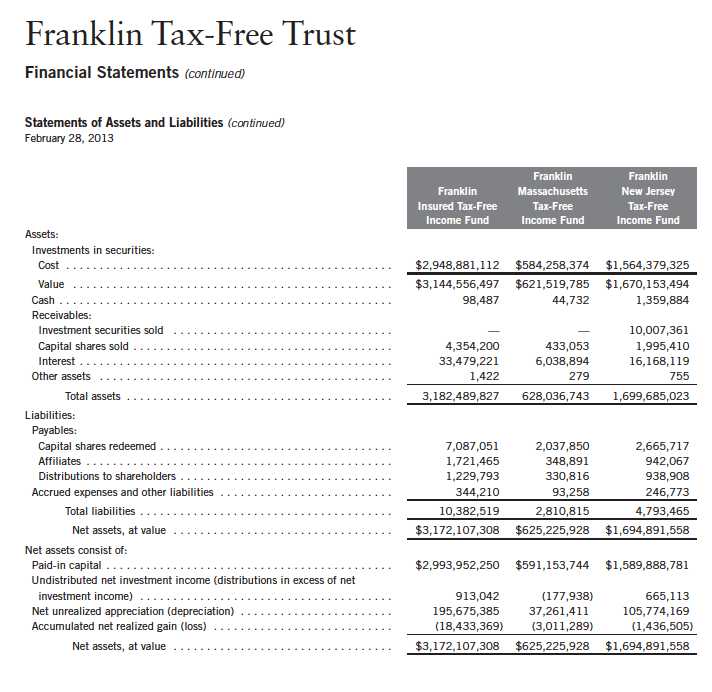
188 | The accompanying notes are an integral part of these financial statements. | Annual Report
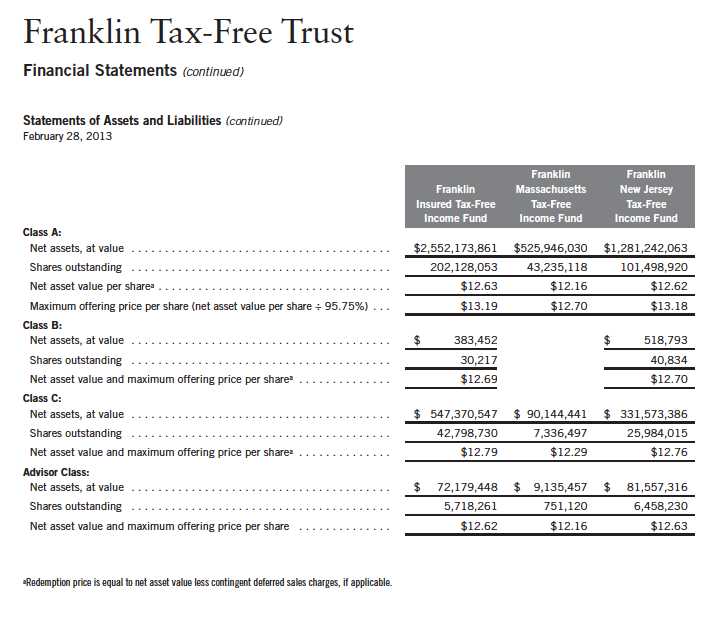
Annual Report | The accompanying notes are an integral part of these financial statements. | 189

190 | The accompanying notes are an integral part of these financial statements. | Annual Report
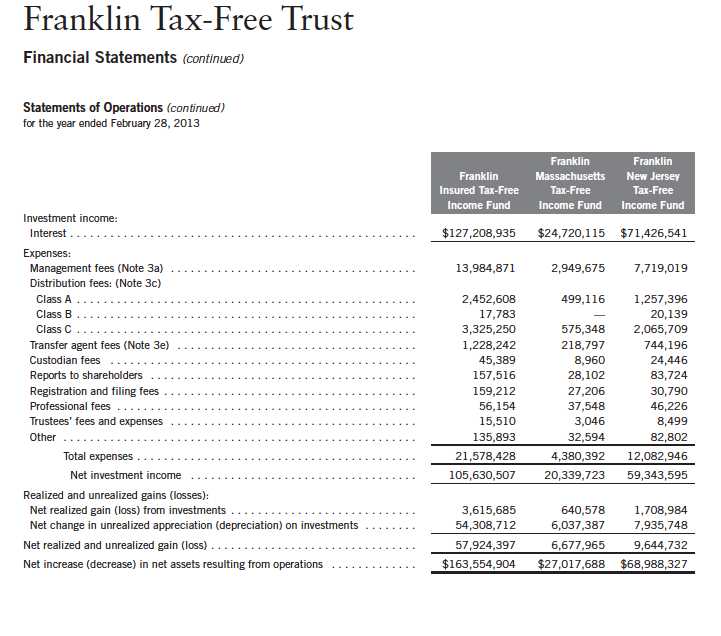
Annual Report | The accompanying notes are an integral part of these financial statements. | 191
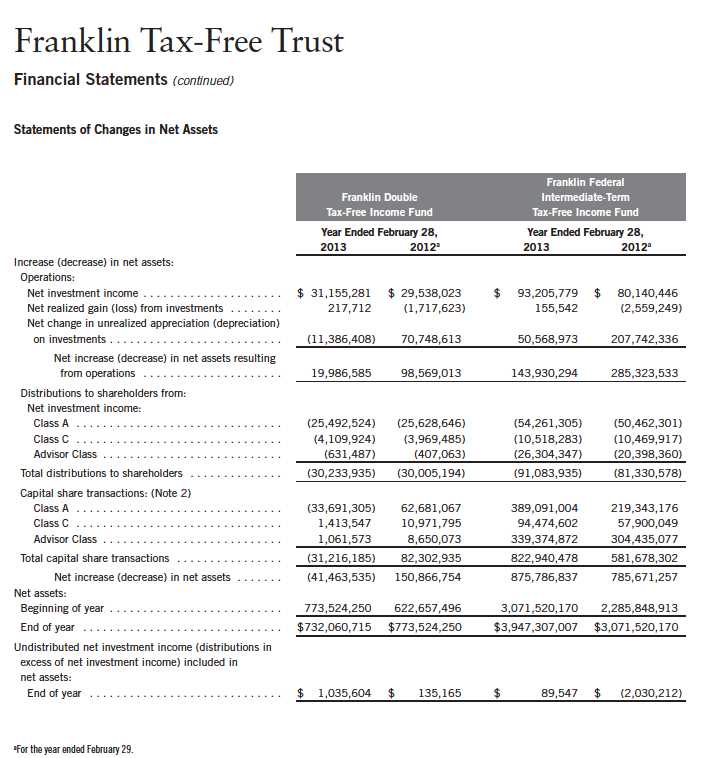
192 | The accompanying notes are an integral part of these financial statements. | Annual Report
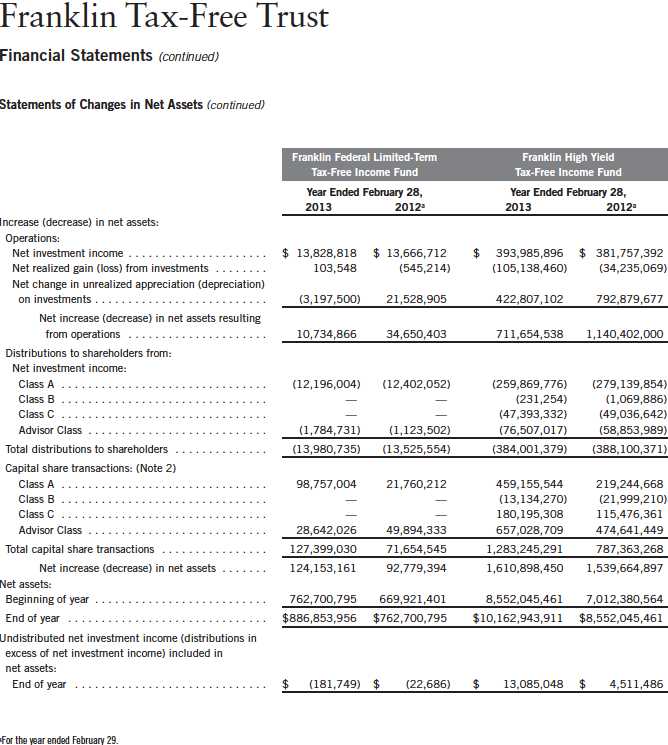
Annual Report | The accompanying notes are an integral part of these financial statements. | 193
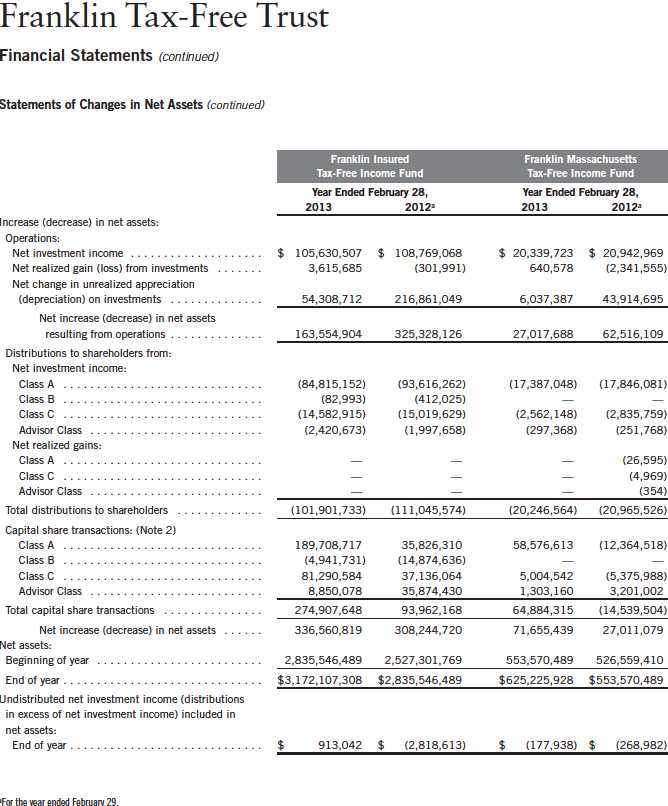
194 | The accompanying notes are an integral part of these financial statements. | Annual Report
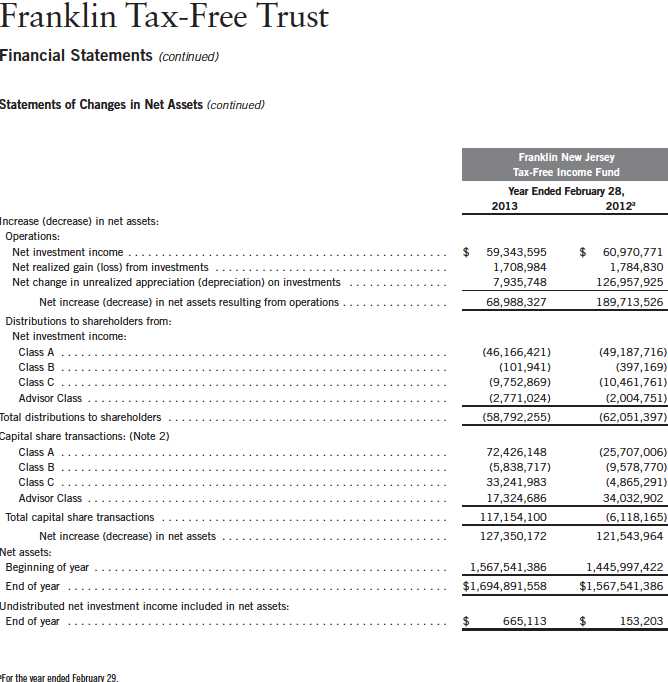
Annual Report | The accompanying notes are an integral part of these financial statements. | 195
Franklin Tax-Free Trust
Notes to Financial Statements
1. ORGANIZATION AND SIGNIFICANT ACCOUNTING POLICIES
Franklin Tax-Free Trust (Trust) is registered under the Investment Company Act of 1940, as amended, (1940 Act) as an open-end investment company, consisting of twenty-four separate funds, seven of which are included in this report (Funds). The financial statements of the remaining funds in the Trust are presented separately. The classes of shares offered within each of the Funds are indicated below. Effective March 1, 2013, all Class B shares were converted to Class A. Each class of shares differs by its initial sales load, contingent deferred sales charges, distribution fees, voting rights on matters affecting a single class and its exchange privilege. The Franklin Double Tax-Free Income Fund and Franklin Insured Tax-Free Income Fund were closed to investors effective August 1, 2012, and March 1, 2013, respectively.
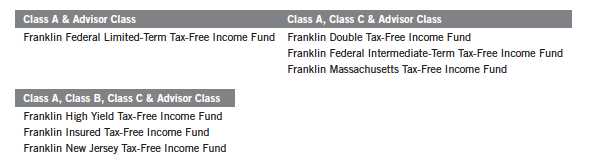
The following summarizes the Funds’ significant accounting policies.
a. Financial Instrument Valuation
The Funds’ investments in financial instruments are carried at fair value daily. Fair value is the price that would be received to sell an asset or paid to transfer a liability in an orderly transaction between market participants on the measurement date. Under procedures approved by the Trust’s Board of Trustees (the Board), the Funds’ administrator, investment manager and other affiliates have formed the Valuation and Liquidity Oversight Committee (VLOC). The VLOC provides administration and oversight of the Funds’ valuation policies and procedures, which are approved annually by the Board. Among other things, these procedures allow the Funds to utilize independent pricing services, quotations from securities and financial instrument dealers, and other market sources to determine fair value.
Debt securities generally trade in the over-the-counter market rather than on a securities exchange. The Funds’ pricing services use multiple valuation techniques to determine fair value. In instances where sufficient market activity exists, the pricing services may utilize a market-based approach through which quotes from market makers are used to determine fair value. In instances where sufficient market activity may not exist or is limited, the pricing services also utilize proprietary valuation models which may consider market characteristics such as benchmark yield curves, credit spreads, estimated default rates, anticipated market interest rate volatility, coupon rates, anticipated timing of principal repayments, underlying collateral, and other unique security features in order to estimate the relevant cash flows, which are then discounted to calculate the fair value.
196 | Annual Report
Franklin Tax-Free Trust
Notes to Financial Statements (continued)
| 1. | ORGANIZATION AND SIGNIFICANT ACCOUNTING POLICIES (continued) |
| a. | Financial Instrument Valuation (continued) |
The Funds have procedures to determine the fair value of financial instruments for which market prices are not reliable or readily available. Under these procedures, the VLOC convenes on a regular basis to review such financial instruments and considers a number of factors, including significant unobservable valuation inputs, when arriving at fair value. The VLOC primarily employs a market-based approach which may use related or comparable assets or liabilities, recent transactions, market multiples, book values, and other relevant information for the investment to determine the fair value of the investment. An income-based valuation approach may also be used in which the anticipated future cash flows of the investment are discounted to calculate fair value. Discounts may also be applied due to the nature or duration of any restrictions on the disposition of the investments. Due to the inherent uncertainty of valuations of such investments, the fair values may differ significantly from the values that would have been used had an active market existed. The VLOC employs various methods for calibrating these valuation approaches including a regular review of key inputs and assumptions, transactional back-testing or disposition analysis, and reviews of any related market activity.
b. Securities Purchased on a When-Issued Basis
Certain funds purchase securities on a when-issued basis, with payment and delivery scheduled for a future date. These transactions are subject to market fluctuations and are subject to the risk that the value at delivery may be more or less than the trade date purchase price. Although the funds will generally purchase these securities with the intention of holding the securities, they may sell the securities before the settlement date. Sufficient assets have been segregated for these securities.
c. Income Taxes
It is each fund’s policy to qualify as a regulated investment company under the Internal Revenue Code. Each fund intends to distribute to shareholders substantially all of its income and net realized gains to relieve it from federal income and excise taxes. As a result, no provision for U.S. federal income taxes is required.
Each fund recognizes the tax benefits of uncertain tax positions only when the position is “more likely than not” to be sustained upon examination by the tax authorities based on the technical merits of the tax position. As of February 28, 2013, and for all open tax years, each fund has determined that no liability for unrecognized tax benefits is required in each fund’s financial statements related to uncertain tax positions taken on a tax return (or expected to be taken on future tax returns). Open tax years are those that remain subject to examination and are based on each tax jurisdiction statute of limitation.
Annual Report | 197
Franklin Tax-Free Trust
Notes to Financial Statements (continued)
| 1. | ORGANIZATION AND SIGNIFICANT ACCOUNTING POLICIES (continued) |
| d. | Security Transactions, Investment Income, Expenses and Distributions |
Security transactions are accounted for on trade date. Realized gains and losses on security transactions are determined on a specific identification basis. Interest income and estimated expenses are accrued daily. Amortization of premium and accretion of discount on debt securities are included in interest income. Dividends from net investment income are normally declared daily; these dividends may be reinvested or paid monthly to shareholders. Distributions to shareholders are determined according to income tax regulations (tax basis). Distributable earnings determined on a tax basis may differ from earnings recorded in accordance with accounting principles generally accepted in the United States of America. These differences may be permanent or temporary. Permanent differences are reclassified among capital accounts to reflect their tax character. These reclassifications have no impact on net assets or the results of operations. Temporary differences are not reclassified, as they may reverse in subsequent periods.
Common expenses incurred by the Trust are allocated among the funds based on the ratio of net assets of each fund to the combined net assets of the Trust. Fund specific expenses are charged directly to the fund that incurred the expense.
Realized and unrealized gains and losses and net investment income, not including class specific expenses, are allocated daily to each class of shares based upon the relative proportion of net assets of each class. Differences in per share distributions, by class, are generally due to differences in class specific expenses.
e. Insurance
The scheduled payments of interest and principal for each insured municipal security in the Trust are insured by either a new issue insurance policy or a secondary insurance policy. Some municipal securities in the Funds are secured by collateral guaranteed by an agency of the U.S. government. Depending on the type of coverage, premiums for insurance are either added to the cost basis of the security or paid by a third party.
Insurance companies typically insure municipal bonds that tend to be of very high quality, with the majority of underlying municipal bonds rated A or better. However, an event involving an insurer could have an adverse effect on the value of the securities insured by that insurance company. There is no guarantee the insurer will be able to fulfill its obligations under the terms of the policy.
f. Accounting Estimates
The preparation of financial statements in accordance with accounting principles generally accepted in the United States of America requires management to make estimates and assumptions that affect the reported amounts of assets and liabilities at the date of the financial statements and the amounts of income and expenses during the reporting period. Actual results could differ from those estimates.
198 | Annual Report
Franklin Tax-Free Trust
Notes to Financial Statements (continued)
| 1. | ORGANIZATION AND SIGNIFICANT ACCOUNTING POLICIES (continued) |
| g. | Guarantees and Indemnifications |
Under the Trust’s organizational documents, its officers and trustees are indemnified by the Trust against certain liabilities arising out of the performance of their duties to the Trust. Additionally, in the normal course of business, the Trust, on behalf of the Funds, enters into contracts with service providers that contain general indemnification clauses. The Trust’s maximum exposure under these arrangements is unknown as this would involve future claims that may be made against the Trust that have not yet occurred. Currently, the Trust expects the risk of loss to be remote.
2. SHARES OF BENEFICIAL INTEREST
At February 28, 2013, there were an unlimited number of shares authorized (without par value).
Transactions in the Funds’ shares were as follows:
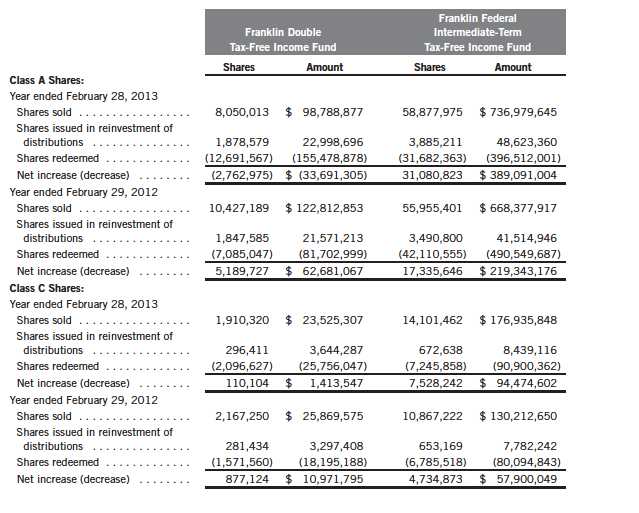
Annual Report | 199
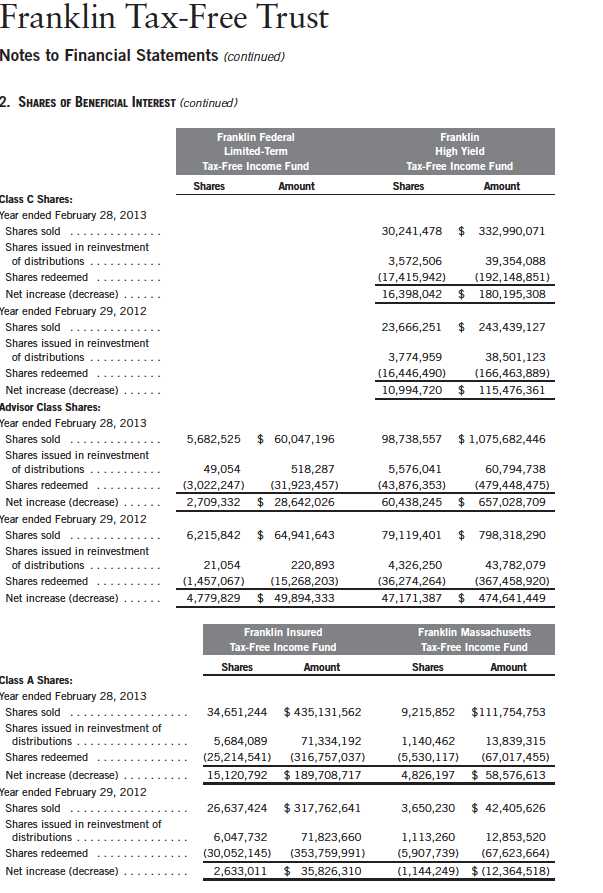
Annual Report | 201
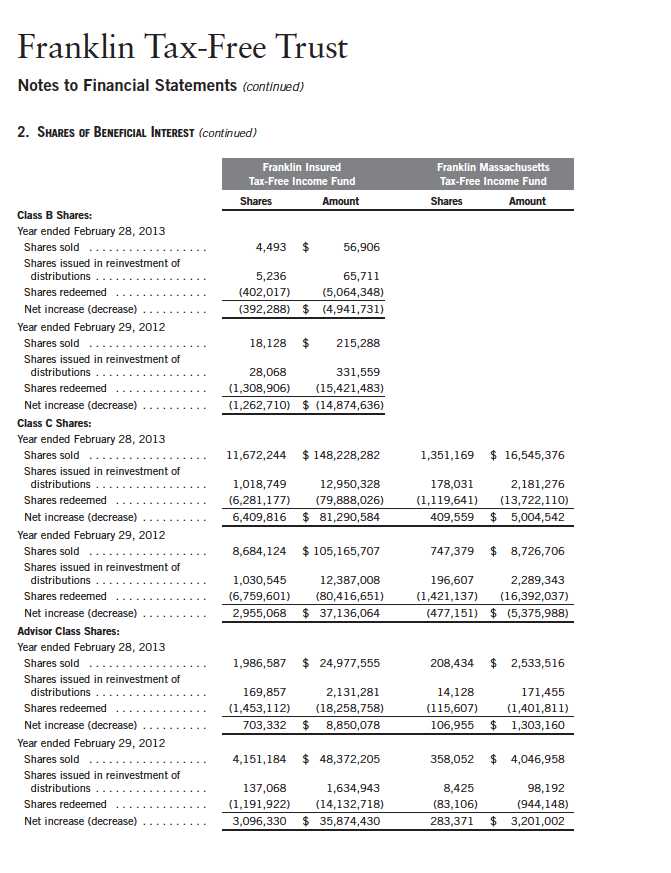
202 | Annual Report
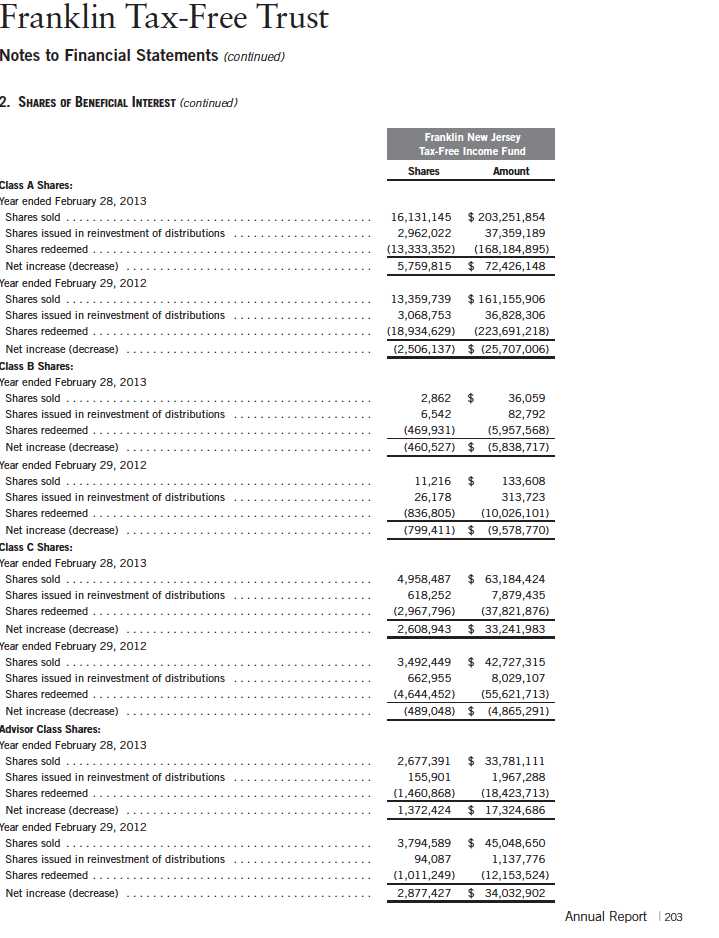
Franklin Tax-Free Trust
Notes to Financial Statements (continued)
3. TRANSACTIONS WITH AFFILIATES
Franklin Resources, Inc. is the holding company for various subsidiaries that together are referred to as Franklin Templeton Investments. Certain officers and trustees of the Trust are also officers and/or directors of the following subsidiaries:
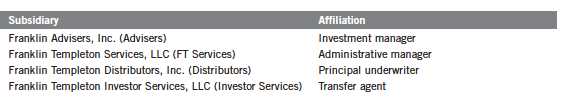
a. Management Fees
The Funds, except the Franklin Federal Limited-Term Tax-Free Income Fund, pay an investment management fee to Advisers based on the month-end net assets of each of the funds as follows:

The Franklin Federal Limited-Term Tax-Free Income Fund pays an investment management fee to Advisers based on the average daily net assets of the fund as follows:

b. Administrative Fees
FT Services provides administrative services to the Funds. The Franklin Federal Limited-Term Tax-Free Income Fund pays an administrative fee to FT Services of 0.20% per year of its average daily net assets. Under an agreement with Advisers, the administrative fee for the Funds, except the Franklin Federal Limited-Term Tax-Free Income Fund, is paid by Advisers based on each fund’s average daily net assets, and is not an additional expense of the funds.
On February 26, 2013, the Board approved the proposal to combine the Franklin Federal Limited-Term Tax-Free Income Fund’s investment management and administration agreements. The fees to be paid under the new combined agreement will not exceed the aggregate fees that would have been paid under the separate agreements. The new agreement goes into effect on May 1, 2013.
204 | Annual Report
Franklin Tax-Free Trust
Notes to Financial Statements (continued)
| 3. | TRANSACTIONS WITH AFFILIATES (continued) |
| c. | Distribution Fees |
The Board has adopted distribution plans for each share class, with the exception of Advisor Class shares, pursuant to Rule 12b-1 under the 1940 Act. Distribution fees are not charged on shares held by affiliates. Under the Funds’ Class A reimbursement distribution plans, the Funds reimburse Distributors for costs incurred in connection with the servicing, sale and distribution of each fund’s shares up to the maximum annual plan rate. Under the Class A reimbursement distribution plans, costs exceeding the maximum for the current plan year cannot be reimbursed in subsequent periods. In addition, under the funds’ Class B and C compensation distribution plans, the funds pay Distributors for costs incurred in connection with the servicing, sale and distribution of each fund’s shares up to the maximum annual plan rate for each class.
The maximum annual plan rates, based on the average daily net assets, for each class, are as follows:
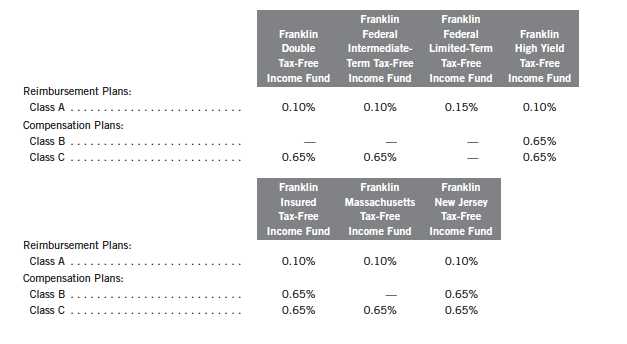
Annual Report | 205
Franklin Tax-Free Trust
Notes to Financial Statements (continued)
| 3. | TRANSACTIONS WITH AFFILIATES (continued) |
| d. | Sales Charges/Underwriting Agreements |
Front-end sales charges and contingent deferred sales charges (CDSC) do not represent expenses of the Funds. These charges are deducted from the proceeds of sales of fund shares prior to investment or from redemption proceeds prior to remittance, as applicable. Distributors has advised the Funds of the following commission transactions related to the sales and redemptions of the Funds’ shares for the year:
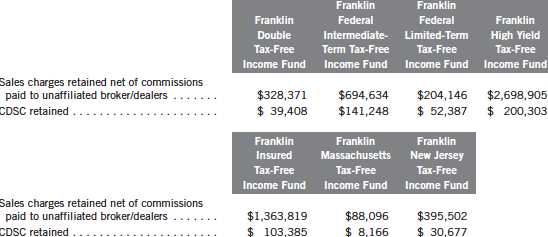
e. Transfer Agent Fees
For the year ended February 28, 2013, the Funds paid transfer agent fees as noted in the Statements of Operations of which the following amounts were retained by Investor Services:
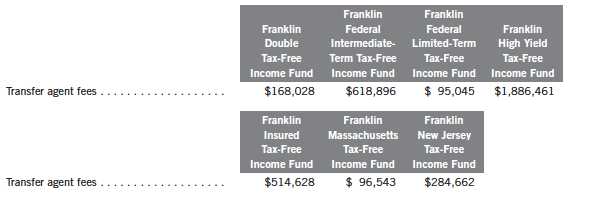
206 | Annual Report
Franklin Tax-Free Trust
Notes to Financial Statements (continued)
| 3. | TRANSACTIONS WITH AFFILIATES (continued) |
| f. | Waiver and Expense Reimbursements |
FT Services and Advisers have contractually agreed in advance to waive or limit their respective fees and to assume as their own expense certain expenses otherwise payable by the Franklin Federal Limited-Term Tax-Free Income Fund so that the common expenses (i.e. a combination of management fees, administrative fees, and other expenses, but excluding distribution fees, and acquired fund fees and expenses) for each class of the Fund do not exceed 0.45% (other than certain non-routine expenses or costs, including those relating to litigation, indemnification, reorganizations, and liquidations) until June 30, 2013.
4. INCOME TAXES
For tax purposes, capital losses may be carried over to offset future capital gains, if any. Capital loss carryforwards with no expiration, if any, must be fully utilized before those losses with expiration dates.
At February 28, 2013, the capital loss carryforwards were as follows:
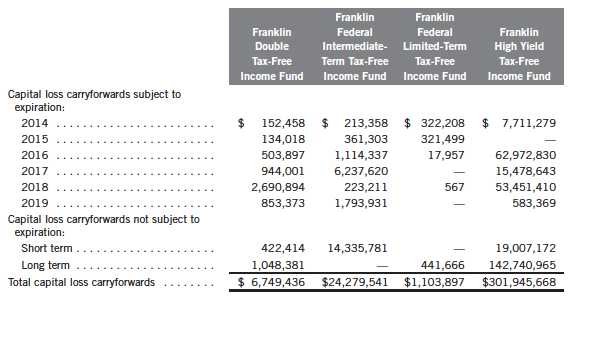
Annual Report | 207
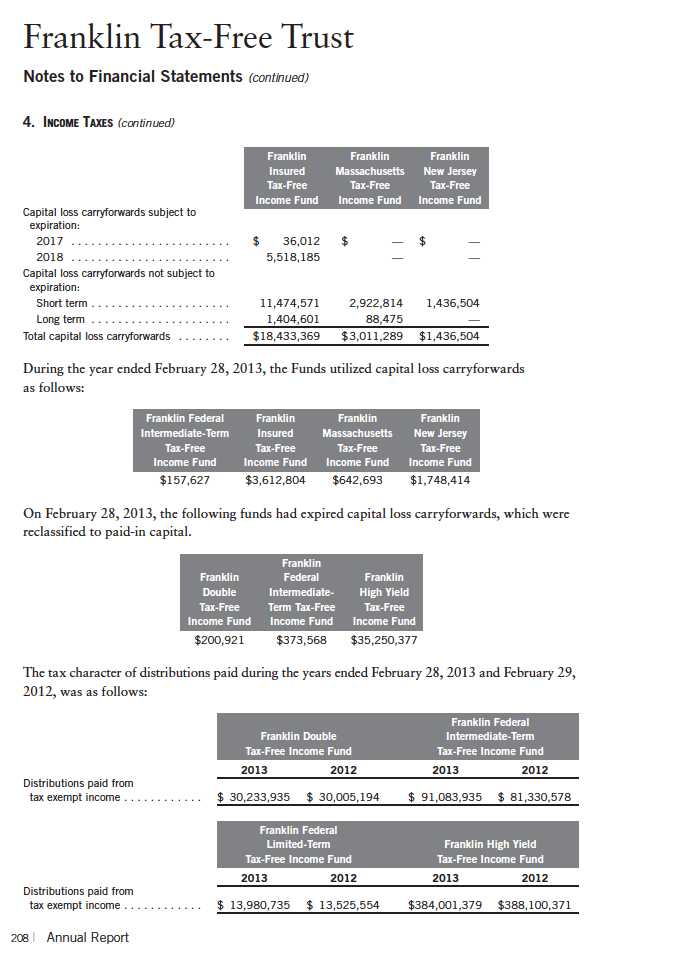
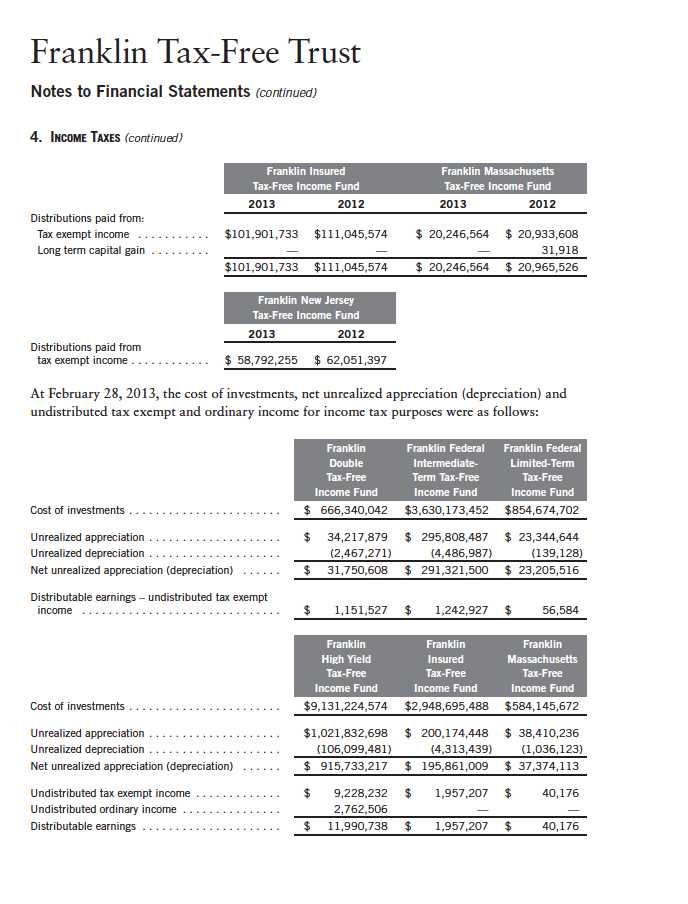
Annual Report | 209
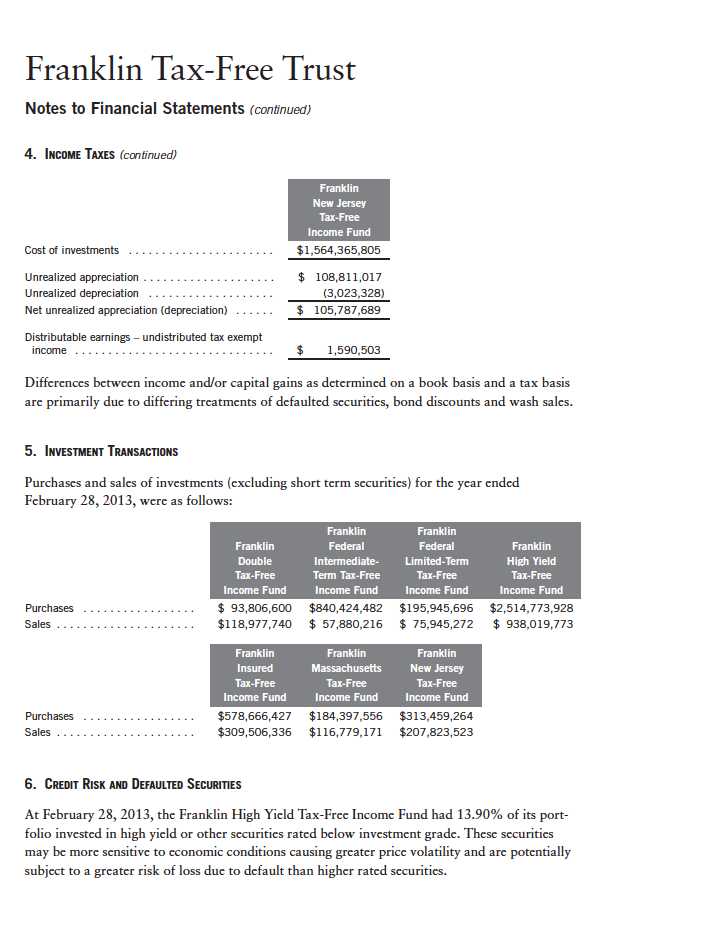
210 | Annual Report
Franklin Tax-Free Trust
Notes to Financial Statements (continued)
6. CREDIT RISK AND DEFAULTED SECURITIES (continued)
The Franklin High Yield Tax-Free Income Fund held defaulted securities and/or other securities for which the income has been deemed uncollectible. At February 28, 2013, the aggregate value of these securities was $97,050,413, representing 0.95% of the fund’s net assets. The fund discontinues accruing income on securities for which income has been deemed uncollectible and provides an estimate for losses on interest receivable. The securities have been identified on the accompanying Statement of Investments.
7. CONCENTRATION OF RISK
The Franklin Double Tax-Free Income Fund, Franklin Massachusetts Tax-Free Income Fund and Franklin New Jersey Tax-Free Income Fund invest a large percentage of their total assets in obligations of issuers within their respective state and U.S. territories. Such concentration may subject the funds to risks associated with industrial or regional matters, and economic, political or legal developments occurring within those states and U.S. territories. In addition, investments in these securities are sensitive to interest rate changes and credit risk of the issuer and may subject the funds to increased market volatility. The market for these investments may be limited, which may make them difficult to buy or sell.
8. CREDIT FACILITY
The Funds, together with other U.S. registered and foreign investment funds (collectively, Borrowers), managed by Franklin Templeton Investments, are borrowers in a joint syndicated senior unsecured credit facility totaling $1.5 billion (Global Credit Facility) which matures on January 17, 2014. This Global Credit Facility provides a source of funds to the Borrowers for temporary and emergency purposes, including the ability to meet future unanticipated or unusually large redemption requests.
Under the terms of the Global Credit Facility, the Funds shall, in addition to interest charged on any borrowings made by the Funds and other costs incurred by the Funds, pay their share of fees and expenses incurred in connection with the implementation and maintenance of the Global Credit Facility, based upon their relative share of the aggregate net assets of all of the Borrowers, including an annual commitment fee of 0.07% based upon the unused portion of the Global Credit Facility. These fees are reflected in other expenses on the Statements of Operations. During the year ended February 28, 2013, the Funds did not use the Global Credit Facility.
Annual Report | 211
Franklin Tax-Free Trust
Notes to Financial Statements (continued)
9. FAIR VALUE MEASUREMENTS
The Funds follow a fair value hierarchy that distinguishes between market data obtained from independent sources (observable inputs) and the Funds’ own market assumptions (unobservable inputs). These inputs are used in determining the value of the Funds’ financial instruments and are summarized in the following fair value hierarchy:
- Level 1 – quoted prices in active markets for identical financial instruments
- Level 2 – other significant observable inputs (including quoted prices for similar financial instruments, interest rates, prepayment speed, credit risk, etc.)
- Level 3 – significant unobservable inputs (including the Funds’ own assumptions in determining the fair value of financial instruments)
The inputs or methodology used for valuing financial instruments are not an indication of the risk associated with investing in those financial instruments.
For movements between the levels within the fair value hierarchy, the Funds have adopted a policy of recognizing the transfers as of the date of the underlying event which caused the movement.
At February 28, 2013, all of the Funds’ investments in financial instruments carried at fair value were valued using Level 2 inputs.
10. SUBSEQUENT EVENTS
The Funds have evaluated subsequent events through the issuance of the financial statements and determined that no events have occurred that require disclosure.
212 | Annual Report
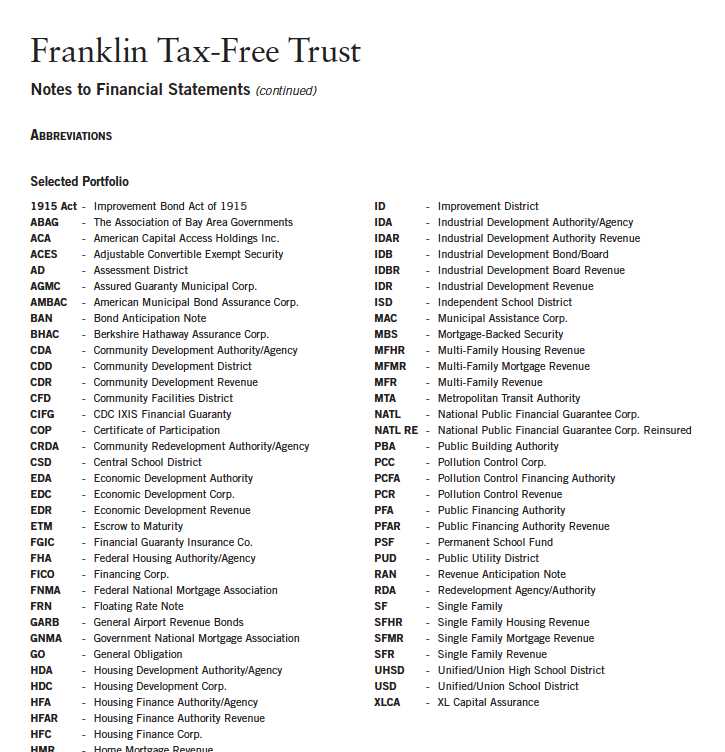
Annual Report | 213
Franklin Tax-Free Trust
Report of Independent Registered Public Accounting Firm
To the Board of Trustees and Shareholders of Franklin Tax-Free Trust
In our opinion, the accompanying statements of assets and liabilities, including the statements of investments, and the related statements of operations and of changes in net assets and the financial highlights present fairly, in all material respects, the financial position of the Franklin Double Tax-Free Income Fund, Franklin Federal Intermediate-Term Tax-Free Income Fund, Franklin Federal Limited-Term Tax-Free Income Fund, Franklin High Yield Tax-Free Income Fund, Franklin Insured Tax-Free Income Fund, Franklin Massachusetts Tax-Free Income Fund and Franklin New Jersey Tax-Free Income Fund (separate portfolios of Franklin Tax-Free Trust, hereafter referred to as the “Funds”) at February 28, 2013, the results of each of their operations for the year then ended, the changes in each of their net assets for each of the two years in the period then ended and the financial highlights for each of the periods presented, in conformity with accounting principles generally accepted in the United States of America. These financial statements and financial highlights (hereafter referred to as “financial statements”) are the responsibility of the Funds’ management. Our responsibility is to express an opinion on these financial statements based on our audits. We conducted our audits of these financial statements in accordance with the standards of the Public Company Accounting Oversight Board (United States). Those standards require that we plan and perform the audit to obtain reasonable assurance about whether the financial statements are free of material misstatement. An audit includes examining, on a test basis, evidence supporting the amounts and disclosures in the financial statements, assessing the accounting principles used and significant estimates made by management, and evaluating the overall financial statement presentation. We believe that our audits, which included confirmation of securities at February 28, 2013 by correspondence with the custodian and brokers, provide a reasonable basis for our opinion.
PricewaterhouseCoopers LLP
San Francisco, California
April 18, 2013
214 | Annual Report
Franklin Tax-Free Trust
Tax Information (unaudited)
Under Section 852(b)(5)(A) of the Internal Revenue Code (Code), the Funds hereby report 100% of the distributions paid from net investment income as exempt-interest dividends for the fiscal year ended February 28, 2013. A portion of the Funds’ exempt-interest dividends may be subject to the federal alternative minimum tax. By mid-February 2014, shareholders will be notified of amounts for use in preparing their 2013 income tax returns.
Annual Report | 215
Franklin Tax-Free Trust
Board Members and Officers
The name, year of birth and address of the officers and board members, as well as their affiliations, positions held with the Fund, principal occupations during at least the past five years and number of portfolios overseen in the Franklin Templeton Investments fund complex are shown below. Generally, each board member serves until that person’s successor is elected and qualified.
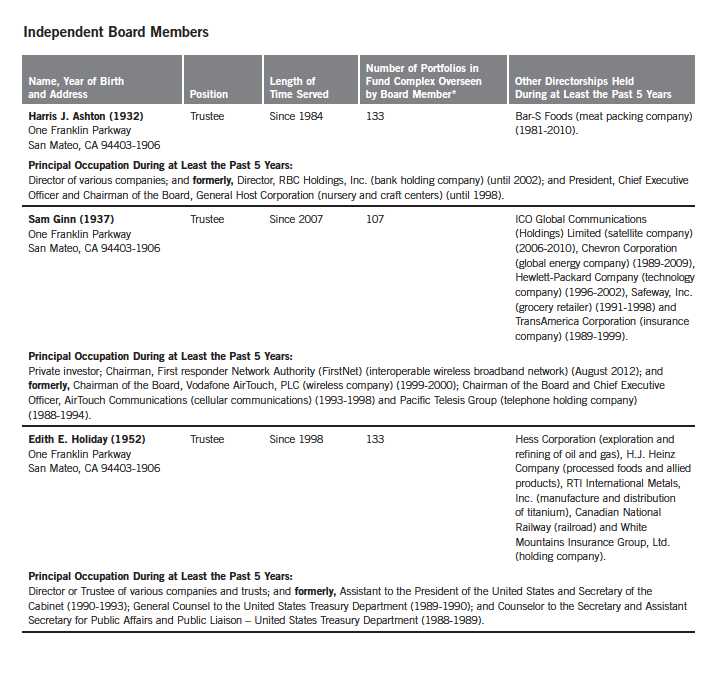
216 | Annual Report
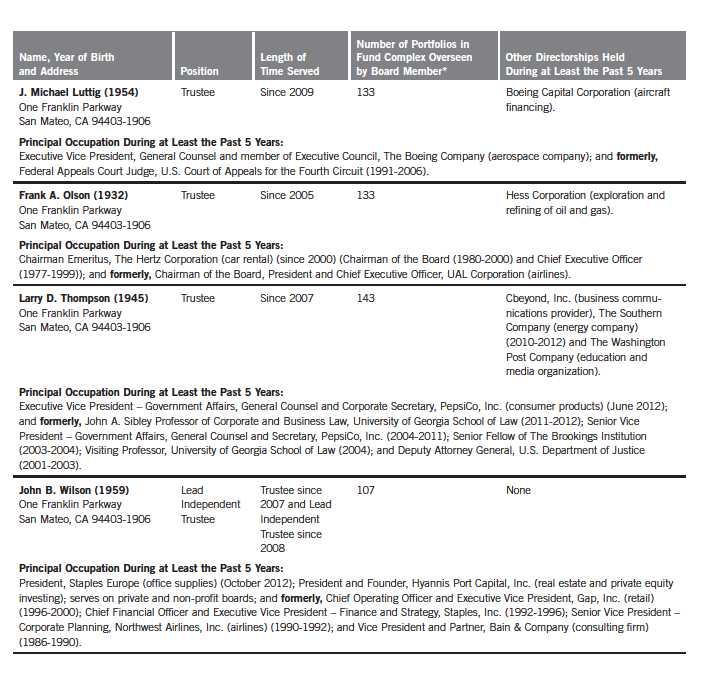
Annual Report | 217
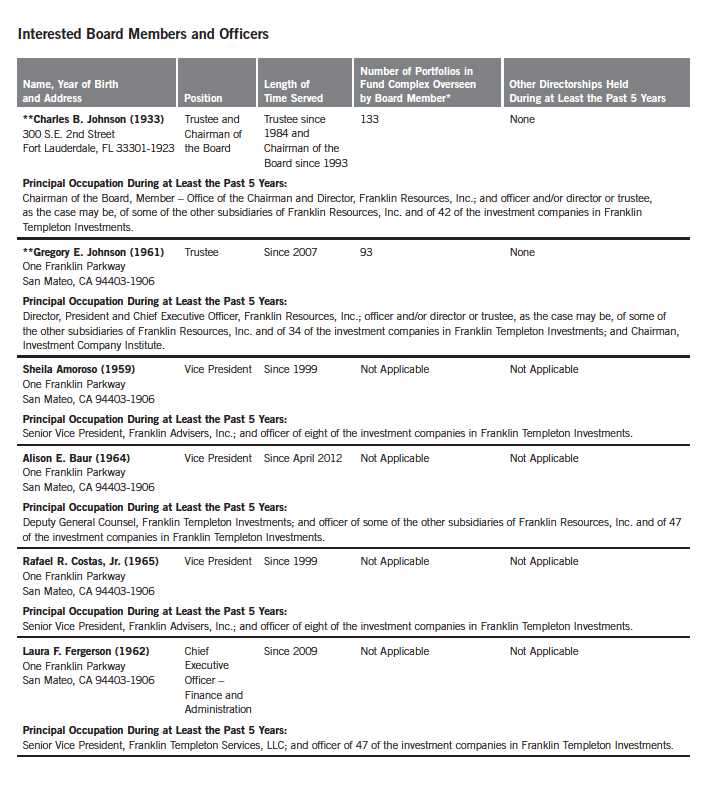
218 | Annual Report
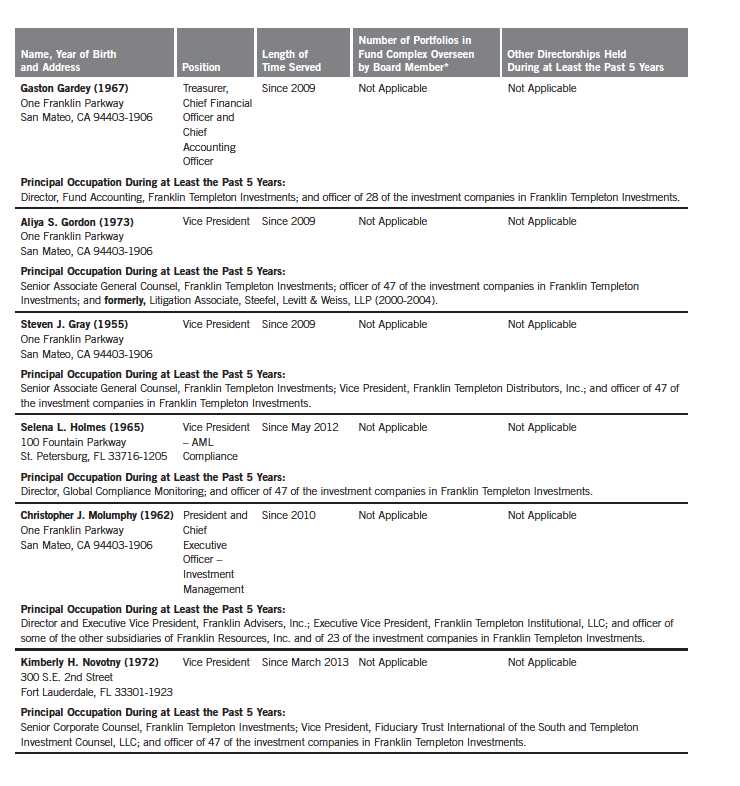
Annual Report | 219
Franklin Tax-Free Trust
Shareholder Information
Board Review of Investment Management Agreement
At a meeting held February 26, 2013, the Board of Trustees (Board), including a majority of non-interested or independent Trustees, approved renewal of the investment management agreement for each of the separate tax-exempt funds within the Trust (Fund(s)). In reaching this decision, the Board took into account information furnished throughout the year at regular Board meetings, as well as information prepared specifically in connection with the annual renewal review process. Information furnished and discussed throughout the year included investment performance reports and related financial information for each Fund, along with periodic reports on expenses, shareholder services, legal and compliance matters, pricing and other services provided by the Investment Manager (Manager) and its affiliates, as well as a third-party survey of transfer agent fees charged funds within the Franklin Templeton Investments complex in comparison with those charged other fund complexes deemed comparable. Information furnished specifically in connection with the renewal process included a report for each Fund prepared by Lipper, Inc. (Lipper), an independent organization, as well as additional material, including a Fund profitability analysis prepared by management. The Lipper reports compared each Fund’s investment performance and expenses with those of other mutual funds deemed comparable to the Fund as selected by Lipper. The Fund profitability analysis discussed the profitability to Franklin Templeton Investments from its overall U.S. fund operations, as well as on an individual fund-by-fund basis. Additional material accompanying such profitability analysis included information on a fund-by-fund basis listing portfolio managers and other accounts they manage, as well as information on management fees charged by the Manager and its affiliates to U.S. mutual funds and other accounts, including management’s explanation of differences where relevant. Such material also included a memorandum prepared by management describing project initiatives and capital investments relating to the services provided to the Funds by the Franklin Templeton Investments organization, as well as a memorandum relating to economies of scale and an analysis concerning transfer agent fees charged by an affiliate of the Manager.
In considering such materials, the independent Trustees received assistance and advice from and met separately with independent counsel. While the investment management agreements for all Funds were considered at the same Board meeting, the Board dealt with each Fund separately. In approving continuance of the investment management agreement for each Fund, the Board, including a majority of independent Trustees, determined that the existing management fee structure was fair and reasonable and that continuance of the investment management agreement was in the best interests of each Fund and its shareholders. While attention was given to all information furnished, the following discusses some primary factors relevant to the Board’s decision.
NATURE, EXTENT AND QUALITY OF SERVICES. The Board was satisfied with the nature and quality of the overall services provided by the Manager and its affiliates to the Funds and their shareholders. In addition to investment performance and expenses discussed later, the Board’s opinion was based, in part, upon periodic reports furnished it showing that the investment policies and restrictions for each Fund were consistently complied with as well as other reports periodically
Annual Report | 221
Franklin Tax-Free Trust
Shareholder Information (continued)
Board Review of Investment Management Agreement (continued)
furnished the Board covering matters such as the compliance of portfolio managers and other management personnel with the code of ethics adopted throughout the Franklin Templeton fund complex, the adherence to fair value pricing procedures established by the Board, and the accuracy of net asset value calculations. The Board also noted the extent of benefits provided Fund shareholders from being part of the Franklin Templeton family of funds, including the right to exchange investments between the same class of funds without a sales charge, the ability to reinvest Fund dividends into other funds and the right to combine holdings in other funds to obtain a reduced sales charge. Favorable consideration was given to management’s continuous efforts and expenditures in establishing back-up systems and recovery procedures to function in the event of a natural disaster, it being noted that such systems and procedures had functioned well during the Florida hurricanes and blackouts experienced in previous years and that those operations in the New York/New Jersey area ran smoothly during the more recent Hurricane Sandy. Consideration was also given to the experience of each Fund’s portfolio management team, the number of accounts managed and general method of compensation. In this latter respect, the Board noted that a primary factor in management’s determination of a portfolio manager’s bonus compensation was the relative investment performance of the funds he or she managed and that a portion of such bonus was required to be invested in a predesignated list of funds within such person’s fund management area so as to be aligned with the interests of shareholders. The Board also took into account the quality of transfer agent and shareholder services provided Fund shareholders by an affiliate of the Manager and the continuous enhancements to the Franklin Templeton website. Particular attention was given to management’s conservative approach and diligent risk management procedures, including continuous monitoring of counterparty credit risk and attention given to derivatives and other complex instruments. The Board also took into account, among other things, management’s efforts in establishing a global credit facility for the benefit of the Funds and other accounts managed by Franklin Templeton Investments to provide a source of cash for temporary and emergency purposes or to meet unusual redemption requests as well as the strong financial position of the Manager’s parent company and its commitment to the mutual fund business as evidenced by its subsidization of money market funds.
INVESTMENT PERFORMANCE. The Board placed significant emphasis on the investment performance of each Fund in view of its importance to shareholders. While consideration was given to performance reports and discussions with portfolio managers at Board meetings throughout the year, particular attention in assessing performance was given to the Lipper reports furnished for the agreement renewals. The Lipper reports prepared for each individual Fund showed its investment performance or that of its Class A shares for a Fund having multiple share classes in comparison to a performance universe selected by Lipper. Comparative performance for each Fund was shown for the one-year period ended December 31, 2012, and for additional periods ended that date up to 10 years depending on when a particular Fund commenced operations. Investment performance was shown on an income return basis, as well as a total return basis for each Fund. The Lipper reports
222 | Annual Report
Franklin Tax-Free Trust
Shareholder Information (continued)
Board Review of Investment Management Agreement (continued)
showed both the income and total return of Franklin Federal Intermediate-Term Tax-Free Income Fund and Franklin Federal Limited-Term Tax-Free Income Fund to be above the medians of their Lipper performance universes for 2012, with most being in the highest or second-highest performing quintile of such universe for such year, as well as for most of the applicable previous three-, five-and 10-year periods on an annualized basis. The Board was satisfied with the relative performance of these Funds as shown in the Lipper report. The Lipper report showed the income return for Franklin Double Tax-Free Income Fund, Franklin Insured Tax-Free Income Fund, Franklin Massachusetts Tax-Free Income Fund and Franklin New Jersey Tax-Free Income Fund to each be above the median of its Lipper performance universe for 2012, with most being in the highest or second-highest performing quintile of such universe in such year as well as for most of the applicable three-, five- and 10-year periods on an annualized basis. The Lipper report showed the total return of such Funds to be at or below the medians of their respective universes in 2012, but in each case to be above the median of such universe for the 10-year period on an annualized basis, with the majority being at or above their respective performance universe medians for the previous three-and five-year annualized periods as well. The Board was satisfied with the overall performance of these Funds, noting their income oriented objective. The Lipper report showed the income return for Franklin High Yield Tax-Free Income Fund to be in the middle performing quintile but below the median of its Lipper performance universe for 2012, as well as the previous three-year period on an annualized basis, but to be above the median and in the second-highest performing quintile of such universe during the previous five- and 10-year periods, respectively, on an annualized basis. The Lipper report showed the total return of Franklin High Yield Tax-Free Income Fund during 2012 to be in the lowest performing quintile of its performance universe, and on an annualized basis to be in the second-lowest performing quintile of such universe for the previous three-year period, but in the highest performing quintile of such universe for each of the previous five- and 10-year periods. The Board believed the overall performance of this Fund to be acceptable, noting the actual income and total returns for 2012 as shown in the Lipper report amounted to 4.37% and 11.07%, respectively.
COMPARATIVE EXPENSES. Consideration was given to the management fee and total expense ratio of each Fund in comparison with those of a group of funds selected by Lipper as its appropriate Lipper expense group. Lipper expense data is based upon information taken from each fund’s most recent annual report, which reflects historical asset levels that may be quite different from those currently existing, particularly in a period of market volatility. While recognizing such inherent limitation and the fact that expense ratios generally increase as assets decline and decrease as assets grow, the Board believed the independent analysis conducted by Lipper to be an appropriate measure of comparative expenses. In reviewing comparative costs, Lipper provides information on each Fund’s contractual investment management fee in comparison with the contractual investment management fee that would have been charged by other funds within its Lipper expense group assuming they were similar in size to the Fund, as well as the actual total expenses of the Fund in comparison
Annual Report | 223
Franklin Tax-Free Trust
Shareholder Information (continued)
Board Review of Investment Management Agreement (continued)
with those of its Lipper expense group. The Lipper contractual investment management fee analysis includes an administrative charge as being part of the investment management fee, and total expenses, for comparative consistency, are shown by Lipper for Fund Class A shares for Funds having multiple share classes. The Lipper reports showed that the contractual investment management fee rates for each Fund were at or below the median of its respective Lipper expense group, with the exception of Franklin Massachusetts Tax-Free Income Fund, Franklin Insured Tax-Free Income Fund and Franklin Federal Intermediate-Term Tax-Free Income Fund. The contractual investment management fee rate of each such Fund, however, was within two and a half basis points of its respective expense group median. The contractual investment management fee rate for Franklin Federal Limited-Term Tax-Free Income Fund was also above its Lipper expense group median, but its actual management fee rate paid was below its expense group median as a result of fee waivers. The Lipper reports further showed that the actual total expense ratios for all Funds were below the medians of their respective Lipper expense groups, with each being in the least expensive or second least expensive quintile of such group. Based on the above, the Board was satisfied with the investment management fee and total expense ratio of each Fund in comparison to its Lipper expense group as shown in the Lipper reports.
MANAGEMENT PROFITABILITY. The Board also considered the level of profits realized by the Manager and its affiliates in connection with the operation of each Fund. In this respect, the Board reviewed the Fund profitability analysis that addresses the overall profitability of Franklin Templeton’s U.S. fund business, as well as its profits in providing management and other services to each of the individual funds during the 12-month period ended September 30, 2012, being the most recent fiscal year-end for Franklin Resources, Inc., the Manager’s parent. In reviewing the analysis, attention was given to the methodology followed in allocating costs to each Fund, it being recognized that allocation methodologies are inherently subjective and various allocation methodologies may each be reasonable while producing different results. In this respect, the Board noted that while being continuously refined and reflecting changes in the Manager’s own cost accounting, such allocation methodology was consistent with that followed in profitability report presentations for the Funds made in prior years and that the Funds’ independent registered public accounting firm had been engaged by the Manager to periodically review the reasonableness of the allocation methodologies solely for use by the Funds’ Board in reference to the profitability analysis. In reviewing and discussing such analysis, management discussed with the Board its belief that costs incurred in establishing the infrastructure necessary for the type of mutual fund operations conducted by the Manager and its affiliates may not be fully reflected in the expenses allocated to each Fund in determining its profitability, as well as the fact that the level of profits, to a certain extent, reflected operational cost savings and efficiencies initiated by management. The Board also took into account management’s expenditures in improving shareholder services provided the Funds, as well as the
224 | Annual Report
Franklin Tax-Free Trust
Shareholder Information (continued)
Board Review of Investment Management Agreement (continued)
need to implement systems and meet additional regulatory and compliance requirements resulting from statutes such as the Sarbanes-Oxley and Dodd Frank Acts and recent SEC and other regulatory requirements. In addition, the Board considered a third-party study comparing the profitability of the Manager’s parent on an overall basis to other publicly held managers broken down to show profitability from management operations exclusive of distribution expenses, as well as profitability including distribution expenses. The Board also considered the extent to which the Manager and its affiliates might derive ancillary benefits from fund operations, including revenues generated from transfer agent services. Based upon its consideration of all these factors, the Board determined that the level of profits realized by the Manager and its affiliates from providing services to each Fund was not excessive in view of the nature, quality and extent of services provided.
ECONOMIES OF SCALE. The Board also considered whether economies of scale are realized by the Manager as the Funds grow larger and the extent to which this is reflected in the level of management fees charged. While recognizing any precise determination is inherently subjective, the Board noted that based upon the Fund profitability analysis, it appears that as some Funds get larger, at some point economies of scale do result in the Manager realizing a larger profit margin on management services provided such Fund. The Board also noted that any economies of scale are shared with each of these Funds and their shareholders through management fee breakpoints existing in each Fund’s investment management agreement, so that as a Fund grows in size, its effective management fee rate declines. The fee structure under the investment management agreement with Franklin Federal Limited-Term Tax-Free Income Fund provides an initial fee of 0.70% on the first $100 million of assets; 0.65% on the next $150 million of assets; 0.625% on the next $250 million of assets; and 0.60% on assets in excess of $500 million. While the assets of such Fund at December 31, 2012, amounted to $871 million, its expenses continued to be subsidized through management fee waivers. The fee structure under the investment management agreement with each other Fund provides an initial fee of 0.625% on the first $100 million of assets; 0.50% on the next $150 million of assets; 0.45% on assets in excess of $250 million; with additional breakpoints beginning at 0.44% on assets in excess of $7.5 billion; 0.43% on assets in excess of $10 billion and continuing thereafter until reaching a final breakpoint of 0.36% on assets in excess of $20 billion. In reviewing such structure, management stated its belief that this fee structure reaches a relatively low rate quickly as a Fund grows and that such low rate, in effect, reflects anticipated economies of scale as a Fund’s assets increase. In support of such position, management pointed out the favorable effective management fee and total expense comparisons for each Fund within its Lipper expense group as previously discussed under “Comparative Expenses.” The Board noted that at December 31, 2012, none of these Funds had assets in excess of $10 billion and believed that to the extent economies of scale may be realized by the Manager and its affiliates, the schedule of fees under the investment management agreement for each Fund provides a sharing of benefits with the Fund and its shareholders.
Annual Report | 225
Franklin Tax-Free Trust
Shareholder Information (continued)
Proxy Voting Policies and Procedures
The Trust’s investment manager has established Proxy Voting Policies and Procedures (Policies) that the Trust uses to determine how to vote proxies relating to portfolio securities. Shareholders may view the Trust’s complete Policies online at franklintempleton.com. Alternatively, shareholders may request copies of the Policies free of charge by calling the Proxy Group collect at (954) 527-7678 or by sending a written request to: Franklin Templeton Companies, LLC, 300 S.E. 2nd Street, Fort Lauderdale, FL 33301, Attention: Proxy Group. Copies of the Trust’s proxy voting records are also made available online at franklintempleton.com and posted on the U.S. Securities and Exchange Commission’s website at sec.gov and reflect the most recent 12-month period ended June 30.
Quarterly Statement of Investments
The Trust files a complete statement of investments with the U.S. Securities and Exchange Commission for the first and third quarters for each fiscal year on Form N-Q. Shareholders may view the filed Form N-Q by visiting the Commission’s website at sec.gov. The filed form may also be viewed and copied at the Commission’s Public Reference Room in Washington, DC. Information regarding the operations of the Public Reference Room may be obtained by calling (800) SEC-0330.
Householding of Reports and Prospectuses
You will receive each Fund’s financial reports every six months as well as an annual updated summary prospectus (prospectus available upon request). To reduce Fund expenses, we try to identify related shareholders in a household and send only one copy of the financial reports and summary prospectus. This process, called “householding,” will continue indefinitely unless you instruct us otherwise. If you prefer not to have these documents householded, please call us at (800) 632-2301. At any time you may view current prospectuses/summary prospectuses and financial reports on our website. If you choose, you may receive these documents through electronic delivery.
226 | Annual Report
This page intentionally left blank.
This page intentionally left blank.
Item 2. Code of Ethics.
(a) The Registrant has adopted a code of ethics that applies to its principal executive officers and principal financial and accounting officer.
| (c) | N/A |
| (d) | N/A |
| (f) | Pursuant to Item 12(a)(1), the Registrant is attaching as an exhibit a copy of its code of ethics that applies to its principal executive officers and principal financial and accounting officer. |
Item 3. Audit Committee Financial Expert.
(a)(1) The Registrant has an audit committee financial expert serving on its audit committee.
(2) The audit committee financial expert is John B. Wilson, and he is "independent" as defined under the relevant Securities and Exchange Commission Rules and Releases.
Item 4. Principal Account Fees and Services.
(a) Audit Fees
The aggregate fees paid to the principal accountant for professional services rendered by the principal accountant for the audit of the registrant’s annual financial statements or for services that are normally provided by the principal accountant in connection with statutory and regulatory filings or engagements were $826,971 for the fiscal year ended February 28, 2013 and $855,919 for the fiscal year ended February 29, 2012.
(b) Audit-Related Fees
There were no fees paid to the principal accountant for assurance and related services rendered by the principal accountant to the registrant that are reasonably related to the performance of the audit of the registrant's financial statements and are not reported under paragraph (a) of Item 4.
There were no fees paid to the principal accountant for assurance and related services rendered by the principal accountant to the registrant's investment adviser and any entity controlling, controlled by or under common control with the investment adviser that provides ongoing services to the registrant that are reasonably related to the performance of the audit of their financial statements.
(c) Tax Fees
There were no fees paid to the principal accountant for professional services rendered by the principal accountant to the registrant for tax compliance, tax advice and tax planning.
2
The aggregate fees paid to the principal accountant for professional services rendered by the principal accountant to the registrant’s investment adviser and any entity controlling, controlled by or under common control with the investment adviser that provides ongoing services to the registrant for tax compliance, tax advice and tax planning were $4,600 for the fiscal year ended February 28, 2013 and $75,000 for the fiscal year ended February 29, 2012. The services for which these fees were paid included technical tax consultation for capital gain tax reporting to foreign governments, application of local country tax laws to investments and licensing securities with local country offices.
(d) All Other Fees
The aggregate fees paid to the principal accountant for products and services rendered by the principal accountant to the registrant not reported in paragraphs (a)-(c) of Item 4 were $12,167 for the fiscal year ended February 28, 2013 and $0 for the fiscal year ended February 29, 2012. The services for which these fees were paid include review of materials provided to the fund Board in connection with the investment management contract renewal process.
The aggregate fees paid to the principal accountant for products and services rendered by the principal accountant to the registrant’s investment adviser and any entity controlling, controlled by or under common control with the investment adviser that provides ongoing services to the registrant other than services reported in paragraphs (a)-(c) of Item 4 were $140,283 for the fiscal year ended February 28, 2013 and $0 for the fiscal year ended February 29, 2012. The services for which these fees were paid include review of materials provided to the fund Board in connection with the investment management contract renewal process.
(e) (1) The registrant’s audit committee is directly responsible for approving the services to be provided by the auditors, including:
| (i) | pre-approval of all audit and audit related services; |
| (ii) | pre-approval of all non-audit related services to be provided to the Fund by the auditors; |
(iii) pre-approval of all non-audit related services to be provided to the registrant by the auditors to the registrant’s investment adviser or to any entity that controls, is controlled by or is under common control with the registrant’s investment adviser and that provides ongoing services to the registrant where the non-audit services relate directly to the operations or financial reporting of the registrant; and
(iv) establishment by the audit committee, if deemed necessary or appropriate, as an alternative to committee pre-approval of services to be provided by the auditors, as required by paragraphs (ii) and (iii) above, of policies and procedures to permit such services to be pre-approved by other means, such as through establishment of guidelines or by action of a designated member or members of the committee; provided the policies and procedures are detailed as to the particular service and the committee is informed of each service and such policies and procedures do not include delegation of audit
3
committee responsibilities, as contemplated under the Securities Exchange Act of 1934, to management; subject, in the case of (ii) through (iv), to any waivers, exceptions or exemptions that may be available under applicable law or rules.
(e) (2) None of the services provided to the registrant described in paragraphs (b)-(d) of Item 4 were approved by the audit committee pursuant to paragraph (c)(7)(i)(C) of Rule 2-01 of regulation S-X.
| (f) | No disclosures are required by this Item 4(f). |
| (g) | The aggregate non-audit fees paid to the principal accountant for services rendered by the principal accountant to the registrant and the registrant’s investment adviser and any entity controlling, controlled by or under common control with the investment adviser that provides ongoing services to the registrant were $157,050 for the fiscal year ended February 28, 2013 and $75,000 for the fiscal year ended February 29, 2012. |
(h) The registrant’s audit committee of the board has considered whether the provision of non-audit services that were rendered to the registrant’s investment adviser (not including any sub-adviser whose role is primarily portfolio management and is subcontracted with or overseen by another investment adviser), and any entity controlling, controlled by, or under common control with the investment adviser that provides ongoing services to the registrant that were not pre-approved pursuant to paragraph (c)(7)(ii) of Rule 2-01 of Regulation S-X is compatible with maintaining the principal accountant’s independence.
| |
Item 5. Audit Committee of Listed Registrants. Item 6. Schedule of Investments. | N/A N/A |
Item 7. Disclosure of Proxy Voting Policies and Procedures for Closed-End Management Investment Companies. N/A
Item 8. Portfolio Managers of Closed-End Management Investment Companies. N/A
Item 9. Purchases of Equity Securities by Closed-End Management Investment Company and Affiliated Purchasers. N/A
Item 10. Submission of Matters to a Vote of Security Holders.
There have been no changes to the procedures by which shareholders may recommend nominees to the Registrant's Board of Trustees that would require disclosure herein.
Item 11. Controls and Procedures.
4
(a) Evaluation of Disclosure Controls and Procedures. The Registrant maintains disclosure controls and procedures that are designed to ensure that information required to be disclosed in the Registrant’s filings under the Securities Exchange Act of 1934 and the Investment Company Act of 1940 is recorded, processed, summarized and reported within the periods specified in the rules and forms of the Securities and Exchange Commission. Such information is accumulated and communicated to the Registrant’s management, including its principal executive officer and principal financial officer, as appropriate, to allow timely decisions regarding required disclosure. The Registrant’s management, including the principal executive officer and the principal financial officer, recognizes that any set of controls and procedures, no matter how well designed and operated, can provide only reasonable assurance of achieving the desired control objectives.
Within 90 days prior to the filing date of this Shareholder Report on Form N-CSR, the Registrant had carried out an evaluation, under the supervision and with the participation of the Registrant’s management, including the Registrant’s principal executive officer and the Registrant’s principal financial officer, of the effectiveness of the design and operation of the Registrant’s disclosure controls and procedures. Based on such evaluation, the Registrant’s principal executive officer and principal financial officer concluded that the Registrant’s disclosure controls and procedures are effective.
(b) Changes in Internal Controls.
There have been no changes in the
Registrant’s internal controls or in other factors that could materially affect the internal controls over financial reporting subsequent to the date of their evaluation in connection with the preparation of this Shareholder Report on Form N-CSR.
Item 12. Exhibits.
(a)(1) Code of Ethics
(a)(2) Certifications pursuant to Section 302 of the Sarbanes-Oxley Act of 2002 of Laura F. Fergerson, Chief Executive Officer - Finance and Administration, and Gaston Gardey, Chief Financial Officer and Chief Accounting Officer
(b) Certifications pursuant to Section 906 of the Sarbanes-Oxley Act of 2002 of Laura F. Fergerson, Chief Executive Officer - Finance and Administration, and Gaston Gardey, Chief Financial Officer and Chief Accounting Officer
SIGNATURES
Pursuant to the requirements of the Securities Exchange Act of 1934 and the Investment Company Act of 1940, the registrant has duly caused this report to be signed on its behalf by the undersigned, thereunto duly authorized.
FRANKLIN TAX-FREE TRUST
By /s/LAURA F. FERGERSON
Laura F. Fergerson
5
Chief Executive Officer –
Finance and Administration
Date April 26, 2013
Pursuant to the requirements of the Securities Exchange Act of 1934 and the Investment Company Act of 1940, this report has been signed below by the following persons on behalf of the registrant and in the capacities and on the dates indicated.
By /s/LAURA F. FERGERSON
Laura F. Fergerson
Chief Executive Officer –
Finance and Administration
Date April 26, 2013
By /s/GASTON GARDEY
Gaston Gardey
Chief Financial Officer and
Chief Accounting Officer
Date April 26, 2013
6