UNITED STATES
SECURITIES AND EXCHANGE COMMISSION
Washington, DC 20549
FORM N-CSR
CERTIFIED SHAREHOLDER REPORT OF REGISTERED MANAGEMENT INVESTMENT COMPANIES
Investment Company Act file number 811-04149
Franklin Tax-Free Trust
(Exact name of registrant as specified in charter)
_One Franklin Parkway, San Mateo, CA 94403-1906
(Address of principal executive offices) (Zip code)
Craig S. Tyle, One Franklin Parkway, San Mateo, CA 94403-1906
(Name and address of agent for service)
Registrant's telephone number, including area code:(650) 312-2000
Date of fiscal year end:2/28
Date of reporting period: 02/28/14
Item 1. Reports to Stockholders.
| | | | | | | |
| | Contents | | | | | |
| Shareholder Letter | 1 | Annual Report | | Franklin Michigan Tax-Free | | Financial Highlights and | |
| | | Municipal Bond Market | | Income Fund | 37 | Statements of Investments | 87 |
| | | Overview | 4 | Franklin Minnesota Tax-Free | | Financial Statements | 156 |
| | | Investment Strategy and | | Income Fund | 47 | Notes to Financial Statements | 166 |
| | | Manager’s Discussion | 6 | Franklin Ohio Tax-Free | | Report of Independent | |
| | | Franklin Arizona Tax-Free | | Income Fund | 57 | Registered Public | |
| | | Income Fund | 7 | Franklin Oregon Tax-Free | | Accounting Firm | 182 |
| | | Franklin Colorado Tax-Free | | Income Fund | 67 | Tax Information | 183 |
| | | Income Fund | 17 | Franklin Pennsylvania | | Board Members and Officers | 184 |
| | | Franklin Connecticut Tax-Free | | Tax-Free Income Fund | 77 | | |
| | | Income Fund | 27 | | | Shareholder Information | 189 |
| | | | | | | | |
Annual Report
Municipal Bond Market Overview
For the 12-month period ended February 28, 2014, the municipal bond market declined in value. The Barclays Municipal Bond Index, which tracks investment-grade municipal securities, had a -0.21% total return for the 12-month period.1, 2 In comparison, the Barclays U.S. Treasury Index had a 12-month return of -0.88%.1, 2
Municipal bond and Treasury markets suffered steep declines beginning in late May 2013 following comments by Federal Reserve Board (Fed) Chairman Ben Bernanke that the Fed could begin tapering its bond buying in the coming months. Fears of declining bond prices increased when minutes from the Fed’s July meeting included more discussion of tapering. Municipal bond mutual funds experienced persistent, large outflows that accelerated during August. Selling in the Treasury and municipal bond markets caused yields on longer term bonds to rise faster than yields on shorter maturity bonds in both markets, but the yield difference was more pronounced for municipal bonds. Because bond prices move in the opposite direction from yields, the yield changes led to two significant developments during the sell-off — municipal bonds under-performed Treasury bonds, and longer term municipal bonds fared worse than shorter term municipal bonds. At its September meeting, the Fed decided to maintain its monthly level of bond purchases and wait for more evidence of sustained economic growth before tapering. Investors welcomed the news, and the municipal bond market posted positive returns for the month. At its December meeting, the Fed announced it would modestly reduce the pace of its bond buying program beginning in January 2014 while maintaining historically low interest rates. Municipal bond and Treasury markets showed little reaction to the news initially, but prices in both markets increased substantially during the first two months of 2014.
Other factors contributed to municipal bond price declines during the period under review. Several headline stories shook investor confidence in the municipal bond asset class. The City of Detroit, Michigan, filed for bankruptcy, the largest municipal bankruptcy filing in U.S. history. Independent credit rating agencies Standard & Poor’s, Moody’s Investors Service and Fitch Ratings downgraded Puerto Rico general obligation debt to below investment grade. The City of Chicago suffered a three-notch downgrade by Moody’s. In addition, reports from rating agencies and research organizations mentioned under-funded pensions that could affect the fiscal stability of several states and large municipalities. Bonds issued by municipalities involved in such stories have often experienced price erosion in secondary trading, but the extent of price erosion and the contagion to related issues have been unpredictable. Fallout
4 | Annual Report
from such headlines during the reporting period was no exception. As Puerto Rico debt traded at higher yields than similarly rated taxable securities, non-traditional buyers entered the market. Despite the entrance of these new buyers, Puerto Rico bonds experienced particularly poor performance and highly volatile trading. Puerto Rico bonds had a -16.99% total return for the reporting period, as measured by the Barclays Puerto Rico Municipal Bond Index.1, 2
At period-end, we maintained our positive view of the municipal bond market. We believe municipal bonds continue to be an attractive asset class among fixed income securities, and we intend to follow our solid discipline of investing to maximize income while seeking value in the municipal bond market.
The foregoing information reflects our analysis, opinions and portfolio holdings as of February 28, 2014, the end of
the reporting period. The way we implement our main investment strategies and the resulting portfolio holdings
may change depending on factors such as market and economic conditions. These opinions may not be relied upon
as investment advice or an offer for a particular security. The information is not a complete analysis of every
aspect of any market, state, industry, security or fund. Statements of fact are from sources considered reliable,
but the investment manager makes no representation or warranty as to their completeness or accuracy. Although
historical performance is no guarantee of future results, these insights may help you understand our investment
management philosophy.
1. Source: © 2014 Morningstar. All Rights Reserved. The information contained herein: (1) is proprietary to Morningstar
and/or its content providers; (2) may not be copied or distributed; and (3) is not warranted to be accurate, complete or
timely. Neither Morningstar nor its content providers are responsible for any damages or losses arising from any use of
this information. Past performance is no guarantee of future results.
2. Source: Barclays Global Family of Indices. © 2014 Barclays Capital Inc. Used with permission.
Annual Report | 5
Investment Strategy and
Manager’s Discussion
Investment Strategy
We use a consistent, disciplined strategy in an effort to maximize tax-exempt income for our shareholders by seeking to maintain exposure to higher coupon securities while balancing risk and return within each Fund’s range of allowable investments. We generally employ a buy-and-hold approach and invest in securities we believe should provide the most relative value in the market. We do not use leverage or derivatives, nor do we use hedging techniques that could add volatility and contribute to underperformance in adverse markets.
Manager’s Discussion
Based on the combination of our value-oriented philosophy of investing primarily for income and a positive-sloping municipal yield curve, in which yields for longer term bonds are higher than those for shorter term bonds, we favored the use of longer term bonds. Consistent with our strategy, we sought to purchase bonds from 15 to 30 years in maturity with good call features. We believe our conservative, buy-and-hold investment strategy can help us achieve high, current, tax-free income for shareholders.
We invite you to read your Fund report for more detailed performance and portfolio information. Thank you for your participation in Franklin Tax-Free Trust. We look forward to serving your future investment needs.
The foregoing information reflects our analysis, opinions and portfolio holdings as of February 28, 2014, the end of the reporting period. The way we implement our main investment strategies and the resulting portfolio holdings may change depending on factors such as market and economic conditions. These opinions may not be relied upon as investment advice or an offer for a particular security. The information is not a complete analysis of every aspect of any market, country, industry, security or fund. Statements of fact are from sources considered reliable, but the investment manager makes no representation or warranty as to their completeness or accuracy. Although historical performance is no guarantee of future results, these insights may help you understand our investment management philosophy.
6 | Annual Report
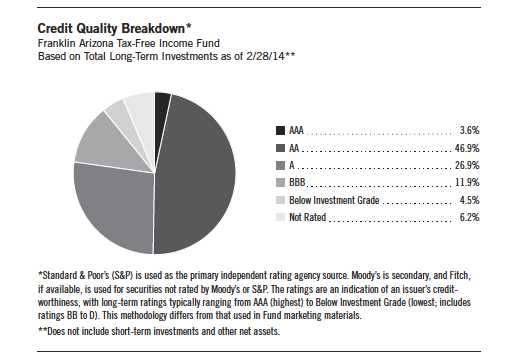
Franklin Arizona Tax-Free Income Fund
Your Fund’s Goal and Main Investments: Franklin Arizona Tax-Free Income Fund
seeks to provide as high a level of income exempt from federal and Arizona personal income taxes as is consistent with prudent investment management and preservation of capital by investing at least 80% of its net assets in securities that pay interest free from such taxes.1
Performance data represent past performance, which does not guarantee future results. Investment return and principal value will fluctuate, and you may have a gain or loss when you sell your shares. Current performance may differ from figures shown. Please visit franklintempleton.com or call (800) 342-5236 for most recent month-end performance.
This annual report Fund covers the fiscal year ended .
Performance Overview
The Fund’s Class A share price, as measured by net asset value, decreased from $11.52 on February 28, 2013, to $10.80 on February 28, 2014. The Fund’s Class A shares paid dividends totaling 44.00 cents per share for the same period.2 The Performance Summary beginning on page 11 shows that at the end of this reporting period the Fund’s Class A shares’ distribution rate was
The dollar value, number of shares or principal amount, and names of all portfolio holdings are listed in the Fund’s Statement of Investments (SOI). The SOI begins on page 90.
Annual Report | 7
| | | |
| Dividend Distributions* | | | |
| Franklin Arizona Tax-Free Income Fund | | | |
| 3/1/13–2/28/14 | | | |
| | Dividend per Share (cents) |
| Month | Class A | Class C | Advisor Class |
| March | 3.65 | 3.11 | 3.75 |
| April | 3.65 | 3.11 | 3.75 |
| May | 3.60 | 3.06 | 3.70 |
| June | 3.55 | 3.02 | 3.64 |
| July | 3.55 | 3.02 | 3.64 |
| August | 3.55 | 3.02 | 3.64 |
| September | 3.62 | 3.15 | 3.70 |
| October | 3.75 | 3.28 | 3.83 |
| November | 3.77 | 3.30 | 3.85 |
| December | 3.77 | 3.30 | 3.86 |
| January | 3.77 | 3.30 | 3.86 |
| February | 3.77 | 3.30 | 3.86 |
| Total | 44.00 | 37.97 | 45.08 |
*Assumes shares were purchased and held for the entire accrual period. Since dividends accrue daily, your actual dis-
tributions will vary depending on the date you purchased your shares and any account activity. All Fund distributions
will vary depending upon current market conditions, and past distributions are not indicative of future trends.
4.01% based on an annualization of the 3.77 cent per share February dividend and the maximum offering price of $11.28 on February 28, 2014. An investor in the 2014 maximum combined effective federal and Arizona personal income tax bracket of 46.14% (including 3.8% Medicare tax) would need to earn a distribution rate of 7.45% from a taxable investment to match the Fund’s Class A tax-free distribution rate. For the Fund’s Class C and Advisor shares’ performance, please see the Performance Summary.
State Update
Arizona’s economy continued to improve during the 12 months under review. The state’s troubled housing market, which collapsed during the last recession, strengthened as housing prices rose. These gains helped dramatically decrease the number of homes with mortgages greater than their property prices as homeowners regained equity lost during the real estate crash. Arizona also boasted one of the nation’s lowest percentages of foreclosed homes for sale. The state’s job market also improved. In 2013, Arizona’s employment growth outpaced the national rate. The state’s chronically high unemployment rate dropped to a six-year low of 7.3% at period-end based on strong growth in
8 | Annual Report
the private sector, a reduction in the size of the work force and some long-term unemployed not being tallied in surveys.3 In comparison, the national unemployment rate ended the period at 6.7%.3
The enacted fiscal year 2014 budget was balanced and modestly increased total spending, primarily on education, child welfare and protection services, and programs for the developmentally disabled. Lawmakers used federal assistance for the state Medicaid program to reduce long-term pressure on the general fund. The governor submitted a budget plan for fiscal year 2015 that called for increased spending on social service programs, education funding and infrastructure improvements. The proposal also included additional support for the state’s budget stabilization fund. The governor based spending hikes on a projection showing that tax collections could improve and help the budget achieve structural balance by the end of the governor’s term in January 2015. In contrast, lawmakers released a competing projection showing that Arizona would not achieve structural balance in the near future and also raised the possibility of the state’s finances heading toward a deficit.
Arizona does not issue general obligation bonds but instead issues appropriation-backed lease debt and revenue bonds. The state had moderate debt levels, with net tax-supported debt of $902 per capita and 2.5% of personal income, compared with the national medians of $1,074 and 2.8%.4 Independent credit rating agency Standard & Poor’s (S&P) affirmed Arizona’s issuer rating of AA-and upgraded its outlook to positive from stable.5 The rating reflected S&P’s view of the state’s diverse economy, adequate per-capita personal income, strong financial position and moderate debt burden. S&P noted that challenges included cyclical finances, restricted operational flexibility resulting from voter initiatives and a potential for structural imbalance. The upgraded outlook reflected S&P’s view of Arizona’s improved budget stabilization fund balances and debt issuance plans.
Manager’s Discussion
We used various investment strategies during the 12 months under review as we sought to maximize tax-free income for shareholders. Puerto Rico’s municipal bond market is widely traded because of its federal and state tax-exemption advantages. During the reporting period, some Puerto Rico issuers experienced a series of downgrades from S&P, Moody’s Investors Service and Fitch Ratings. In February 2014, these credit rating firms downgraded their respective ratings of Puerto Rico’s general obligation debt to below investment grade, along with the ratings of certain related Puerto Rico issuers. Additionally, each rating agency maintained a negative outlook on certain Puerto Rico issuers, and further downgrades are possible. The Fund is not required to sell securities that
| | |
| Portfolio Breakdown | | |
| Franklin Arizona Tax-Free Income Fund | |
| 2/28/14 | | |
| % of Total | |
| Long-Term Investments* | |
| Utilities | 21.4 | % |
| Hospital & Health Care | 20.0 | % |
| Tax-Supported | 14.5 | % |
| Subject to Government Appropriations | 13.7 | % |
| Higher Education | 9.4 | % |
| Other Revenue | 6.1 | % |
| Transportation | 4.5 | % |
| Refunded | 4.3 | % |
| General Obligation | 3.3 | % |
| Housing | 2.8 | % |
*Does not include short-term investments and other
net assets.
Annual Report | 9
have been downgraded to below investment grade, but it is prohibited from making further purchases of such securities as long as the securities are not rated investment grade by at least one U.S. nationally recognized rating service. Rating actions combined with news related to the commonwealth’s financial position and future financing endeavors caused the Puerto Rico bond market to experience sharp declines in the latter half of 2013 and contrasting positive performance year-to-date in 2014.
Thank you for your continued participation in Franklin Arizona Tax-Free Income Fund. We believe our conservative, buy-and-hold investment strategy can help us achieve high, current, tax-free income for shareholders.
The foregoing information reflects our analysis, opinions and portfolio holdings as of February 28, 2014, the end of the reporting period. The way we implement our main investment strategies and the resulting portfolio holdings may change depending on factors such as market and economic conditions. These opinions may not be relied upon as investment advice or an offer for a particular security. The information is not a complete analysis of every aspect of any market, state, industry, security or the Fund. Statements of fact are from sources considered reliable, but the investment manager makes no representation or warranty as to their completeness or accuracy. Although historical performance is no guarantee of future results, these insights may help you understand our investment management philosophy.
1. For state personal income taxes, the 80% minimum is measured by total Fund assets. For investors subject to alter-
native minimum tax, a small portion of Fund dividends may be taxable. Distributions of capital gains are generally
taxable. To avoid imposition of 28% backup withholding on all Fund distributions and redemption proceeds, U.S.
investors must be properly certified on Form W-9 and non-U.S. investors on Form W-8BEN.
2. All Fund distributions will vary depending upon current market conditions, and past distributions are not indicative
of future trends.
3. Source: Bureau of Labor Statistics.
4. Source: Moody’s Investors Service, “2013 State Debt Medians Report,” 5/29/13.
5. This does not indicate S&P’s rating of the Fund.
10 | Annual Report
Performance Summary as of 2/28/14
Franklin Arizona Tax-Free Income Fund
Your dividend income will vary depending on dividends or interest paid by securities in the Fund’s portfolio, adjusted for operating expenses of each class. Capital gain distributions are net profits realized from the sale of portfolio securities. The performance table and graphs do not reflect any taxes that a shareholder would pay on Fund dividends, capital gain distributions, if any, or any realized gains on the sale of Fund shares. Total return reflects reinvestment of the Fund’s dividends and capital gain distributions, if any, and any unrealized gains or losses.
| | | | | | | | |
| Price and Distribution Information | | | | | | |
| Class A (Symbol: FTAZX) | | | | Change | | 2/28/14 | | 2/28/13 |
| Net Asset Value (NAV) | | | | -$0.72 | | $10.80 | | $11.52 |
| Distributions (3/1/13–2/28/14) | | | | | | | | |
| Dividend Income | $ | 0.4400 | | | | | | |
| Class C (Symbol: FAZIX) | | | | Change | | 2/28/14 | | 2/28/13 |
| Net Asset Value (NAV) | | | | -$0.72 | | $10.96 | | $11.68 |
| Distributions (3/1/13–2/28/14) | | | | | | | | |
| Dividend Income | $ | 0.3797 | | | | | | |
| Advisor Class (Symbol: FAZZX) | | | | Change | | 2/28/14 | | 2/28/13 |
| Net Asset Value (NAV) | | | | -$0.72 | | $10.83 | | $11.55 |
| Distributions (3/1/13–2/28/14) | | | | | | | | |
| Dividend Income | $ | 0.4508 | | | | | | |
Annual Report | 11
Performance Summary (continued)
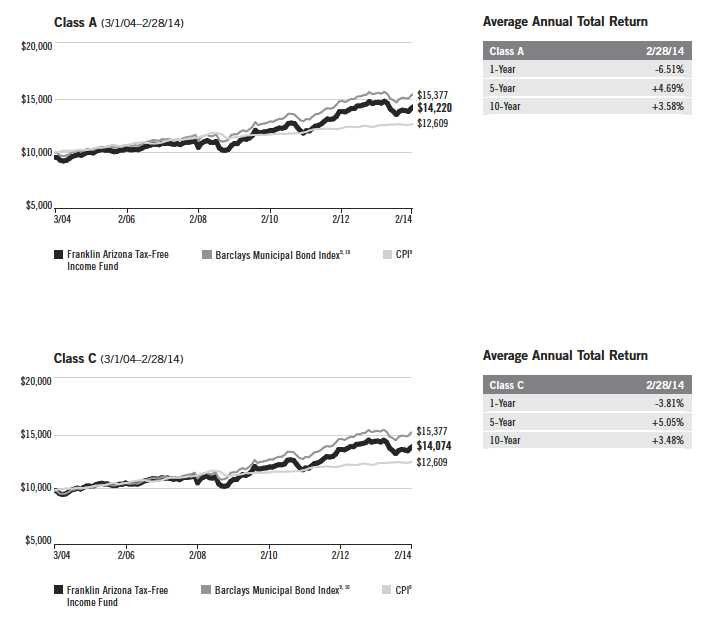
Performance
Cumulative total return excludes sales charges. Average annual total returns include maximum sales charges.
Class A: 4.25% maximum initial sales charge; Class C: 1% contingent deferred sales charge in first year only;
Advisor Class: no sales charges.
| | | | | | | | | | |
| Class A | | | 1-Year | | | 5-Year | | | 10-Year | |
| Cumulative Total Return1 | | | -2.37 | % | | +31.34 | % | | +48.54 | % |
| Average Annual Total Return2 | | | -6.51 | % | | +4.69 | % | | +3.58 | % |
| Avg. Ann. Total Return (3/31/14)3 | | | -5.44 | % | | +4.85 | % | | +3.67 | % |
| Distribution Rate4 | 4.01 | % | | | | | | | | |
| Taxable Equivalent Distribution Rate5 | 7.45 | % | | | | | | | | |
| 30-Day Standardized Yield6 | 3.44 | % | | | | | | | | |
| Taxable Equivalent Yield5 | 6.39 | % | | | | | | | | |
| Total Annual Operating Expenses7 | 0.63 | % | | | | | | | | |
| Class C | | | 1-Year | | | 5-Year | | | 10-Year | |
| Cumulative Total Return1 | | | -2.87 | % | | +27.94 | % | | +40.74 | % |
| Average Annual Total Return2 | | | -3.81 | % | | +5.05 | % | | +3.48 | % |
| Avg. Ann. Total Return (3/31/14)3 | | | -2.60 | % | | +5.19 | % | | +3.55 | % |
| Distribution Rate4 | 3.61 | % | | | | | | | | |
| Taxable Equivalent Distribution Rate5 | 6.70 | % | | | | | | | | |
| 30-Day Standardized Yield6 | 3.05 | % | | | | | | | | |
| Taxable Equivalent Yield5 | 5.66 | % | | | | | | | | |
| Total Annual Operating Expenses7 | 1.18 | % | | | | | | | | |
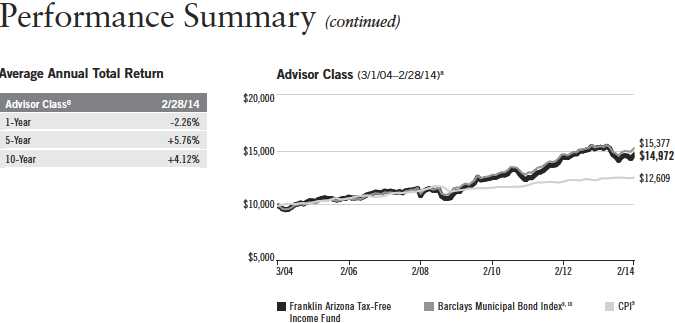
| Advisor Class8 | | | 1-Year | | | 5-Year | | | 10-Year | |
| Cumulative Total Return1 | | | -2.26 | % | | +32.30 | % | | +49.72 | % |
| Average Annual Total Return2 | | | -2.26 | % | | +5.76 | % | | +4.12 | % |
| Avg. Ann. Total Return (3/31/14)3 | | | -1.12 | % | | +5.90 | % | | +4.19 | % |
| Distribution Rate4 | 4.28 | % | | | | | | | | |
| Taxable Equivalent Distribution Rate5 | 7.95 | % | | | | | | | | |
| 30-Day Standardized Yield6 | 3.73 | % | | | | | | | | |
| Taxable Equivalent Yield5 | 6.93 | % | | | | | | | | |
| Total Annual Operating Expenses7 | 0.53 | % | | | | | | | | |
Performance data represent past performance, which does not guarantee future results. Investment return and principal
value will fluctuate, and you may have a gain or loss when you sell your shares. Current performance may differ from
figures shown. For most recent month-end performance, go to franklintempleton.com or call (800) 342-5236.
12 | Annual Report
Performance Summary (continued)
Total Return Index Comparison for a Hypothetical $10,000 Investment
Total return represents the change in value of an investment over the periods shown. It includes any applicable maximum sales charge, Fund expenses, account fees and reinvested distributions. The unmanaged index includes reinvestment of any income or distributions. It differs from the Fund in composition and does not pay management fees or expenses. One cannot invest directly in an index.
Annual Report | 13
All investments involve risks, including possible loss of principal. Because municipal bonds are sensitive to interest rate movements, the Fund’s
yield and share price will fluctuate with market conditions. Bond prices generally move in the opposite direction of interest rates. Thus, as
prices of bonds in the Fund adjust to a rise in interest rates, the Fund’s share price may decline. Because the Fund invests principally in a
single state, it is subject to greater risk of adverse economic and regulatory changes in that state than a geographically diversified fund.
The Fund holds a small portion of its assets in Puerto Rico municipal bonds that have been impacted by recent adverse economic and market
changes, which may cause the Fund’s share price to decline. Changes in the credit rating of a bond, or in the credit rating or financial strength
of a bond’s issuer, insurer or guarantor, may affect the bond’s value. The Fund may invest a significant part of its assets in municipal securities
that finance similar types of projects, such as utilities, hospitals, higher education and transportation. A change that affects one project would
likely affect all similar projects, thereby increasing market risk. The Fund is actively managed but there is no guarantee that the manager’s
investment decisions will produce the desired results. The Fund’s prospectus also includes a description of the main investment risks.
Class C: These shares have higher annual fees and expenses than Class A shares.
Advisor Class: Shares are available to certain eligible investors as described in the prospectus.
1. Cumulative total return represents the change in value of an investment over the periods indicated.
2. Average annual total return represents the average annual change in value of an investment over the periods indicated.
3. In accordance with SEC rules, we provide standardized average annual total return information through the latest calendar quarter.
4. Distribution rate is based on an annualization of the respective class’s February dividend and the maximum offering price (NAV for Classes C and
Advisor) per share on 2/28/14.
5. Taxable equivalent distribution rate and yield assume the published rates as of 12/18/13 for the maximum combined effective federal and Arizona
personal income tax rate of 46.14%, based on the federal income tax rate of 39.60% plus 3.8% Medicare tax.
6. The 30-day standardized yield for the month ended 2/28/14 reflects an estimated yield to maturity (assuming all portfolio securities are held to
maturity). It should be regarded as an estimate of the Fund’s rate of investment income, and it may not equal the Fund’s actual income distribution
rate (which reflects the Fund’s past dividends paid to shareholders) or the income reported in the Fund’s financial statements.
7. Figures are as stated in the Fund’s current prospectus. In periods of market volatility, assets may decline significantly, causing total annual Fund
operating expenses to become higher than the figures shown.
8. Effective 7/1/08, the Fund began offering Advisor Class shares, which do not have sales charges or a Rule 12b-1 plan. Performance quotations for
this class reflect the following methods of calculation: (a) For periods prior to 7/1/08, a restated figure is used based upon the Fund’s Class A per-
formance, excluding the effect of Class A’s maximum initial sales charge, but reflecting the effect of the Class A Rule 12b-1 fees; and (b) for periods
after 7/1/08, actual Advisor Class performance is used reflecting all charges and fees applicable to that class. Since 7/1/08 (commencement of
sales), the cumulative and average annual total returns of Advisor Class shares were +30.61% and +4.83%.
9. Source: © 2014 Morningstar. The Barclays Municipal Bond Index is a market value-weighted index engineered for the long-term tax-exempt bond
market. To be included in the index, bonds must be fixed rate, have at least one year to final maturity and be rated investment grade (Baa3/BBB- or
higher) by at least two of the following agencies: Moody’s, Standard & Poor’s and Fitch. The Consumer Price Index (CPI), calculated by the Bureau of
Labor Statistics, is a commonly used measure of the inflation rate.
10. Source: Barclays Global Family of Indices. © 2014 Barclays Capital Inc. Used with permission.
14 | Annual Report
Your Fund’s Expenses
Franklin Arizona Tax-Free Income Fund
As a Fund shareholder, you can incur two types of costs:
- Transaction costs, including sales charges (loads) on Fund purchases; and
- Ongoing Fund costs, including management fees, distribution and service (12b-1) fees, and other Fund expenses. All mutual funds have ongoing costs, sometimes referred to as operating expenses.
The following table shows ongoing costs of investing in the Fund and can help you understand these costs and compare them with those of other mutual funds. The table assumes a $1,000 investment held for the six months indicated.
Actual Fund Expenses
The first line (Actual) for each share class listed in the table provides actual account values and expenses. The “Ending Account Value” is derived from the Fund’s actual return, which includes the effect of Fund expenses.
You can estimate the expenses you paid during the period, by following these steps. Of course, your account value and expenses will differ from those in this illustration:
| 1. | Divide your account value by $1,000. |
| | If an account had an $8,600 value, then $8,600 ÷ $1,000 = 8.6. |
| 2. | Multiply the result by the number under the heading “Expenses Paid During Period.” |
| | If Expenses Paid During Period were $7.50, then 8.6 x $7.50 = $64.50. |
In this illustration, the estimated expenses paid this period are $64.50.
Hypothetical Example for Comparison with Other Funds
Information in the second line (Hypothetical) for each class in the table can help you compare ongoing costs of investing in the Fund with those of other mutual funds. This information may not be used to estimate the actual ending account balance or expenses you paid during the period. The hypothetical “Ending Account Value” is based on the actual expense ratio for each class and an assumed 5% annual rate of return before expenses, which does not represent the Fund’s actual return. The figure under the heading “Expenses Paid During Period” shows the hypothetical expenses your account would have incurred under this scenario. You can compare this figure with the 5% hypothetical examples that appear in shareholder reports of other funds.
Annual Report | 15
Your Fund’s Expenses (continued)
Please note that expenses shown in the table are meant to highlight ongoing costs and do not reflect any transaction costs, such as sales charges. Therefore, the second line for each class is useful in comparing ongoing costs only, and will not help you compare total costs of owning different funds. In addition, if transaction costs were included, your total costs would have been higher. Please refer to the Fund prospectus for additional information on operating expenses.
| | | | | | |
| | | Beginning Account | | Ending Account | | Expenses Paid During |
| Class A | | Value 9/1/13 | | Value 2/28/14 | | Period* 9/1/13–2/28/14 |
| Actual | $ | 1,000 | $ | 1,059.50 | $ | 3.27 |
| Hypothetical (5% return before expenses) | $ | 1,000 | $ | 1,021.62 | $ | 3.21 |
| Class C | | | | | | |
| Actual | $ | 1,000 | $ | 1,056.90 | $ | 6.07 |
| Hypothetical (5% return before expenses) | $ | 1,000 | $ | 1,018.89 | $ | 5.96 |
| Advisor Class | | | | | | |
| Actual | $ | 1,000 | $ | 1,060.90 | $ | 2.76 |
| Hypothetical (5% return before expenses) | $ | 1,000 | $ | 1,022.12 | $ | 2.71 |
*Expenses are calculated using the most recent six-month expense ratio, annualized for each class (A: 0.64%; C: 1.19%; and Advisor: 0.54%),
multiplied by the average account value over the period, multiplied by 181/365 to reflect the one-half year period.
16 | Annual Report
Franklin Colorado Tax-Free Income Fund
Your Fund’s Goal and Main Investments: Franklin Colorado Tax-Free Income Fund seeks to provide as high a level of income exempt from federal and Colorado personal income taxes as is consistent with prudent investment management and preservation of capital by investing at least 80% of its net assets in securities that pay interest free from such taxes.1
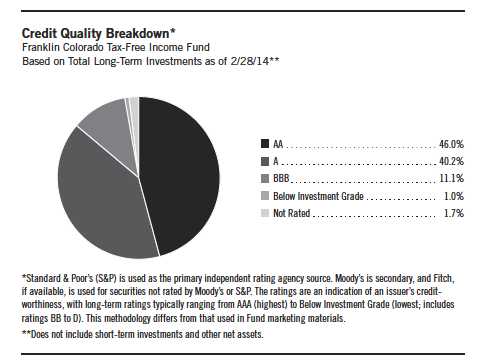
This annual report for Franklin Colorado Tax-Free Income Fund covers the fiscal year ended February 28, 2014.
Performance data represent past performance, which does not guarantee future results. Investment return and principal value will fluctuate, and you may have a gain or loss when you sell your shares. Current performance may differ from figures shown. Please visit franklintempleton.com or call (800) 342-5236 for most recent month-end performance.
Performance Overview
The Fund’s Class A share price, as measured by net asset value, decreased from $12.44 on February 28, 2013, to $11.66 on February 28, 2014. The Fund’s Class A shares paid dividends totaling 45.50 cents per share for the same period.2 The Performance Summary beginning on page 21 shows that at the end of this reporting period the Fund’s Class A shares’ distribution rate was
The dollar value, number of shares or principal amount, and names of all portfolio holdings are listed in the Fund’s
Statement of Investments (SOI). The SOI begins on page 98.
Annual Report | 17
| | | |
| Dividend Distributions* | | | |
| Franklin Colorado Tax-Free Income Fund | | | |
| 3/1/13–2/28/14 | | | |
| | Dividend per Share (cents) |
| Month | Class A | Class C | Advisor Class |
| March | 3.67 | 3.09 | 3.77 |
| April | 3.67 | 3.09 | 3.77 |
| May | 3.67 | 3.09 | 3.77 |
| June | 3.67 | 3.11 | 3.77 |
| July | 3.67 | 3.11 | 3.77 |
| August | 3.67 | 3.11 | 3.77 |
| September | 3.82 | 3.30 | 3.91 |
| October | 3.87 | 3.35 | 3.96 |
| November | 3.92 | 3.40 | 4.01 |
| December | 3.92 | 3.41 | 4.01 |
| January | 3.95 | 3.44 | 4.04 |
| February | 4.00 | 3.49 | 4.09 |
| Total | 45.50 | 38.99 | 46.64 |
*Assumes shares were purchased and held for the entire accrual period. Since dividends accrue daily, your actual dis-
tributions will vary depending on the date you purchased your shares and any account activity. All Fund distributions
will vary depending upon current market conditions, and past distributions are not indicative of future trends.
3.94% based on an annualization of the 4.00 cent per share February dividend and the maximum offering price of $12.18 on February 28, 2014. An investor in the 2014 maximum combined effective federal and Colorado personal income tax bracket of 46.20% (including 3.8% Medicare tax) would need to earn a distribution rate of 7.32% from a taxable investment to match the Fund’s Class A tax-free distribution rate. For the Fund’s Class C and Advisor shares’ performance, please see the Performance Summary.
State Update
Colorado’s economy continued to expand during the 12 months under review. The state enjoyed strong employment growth, particularly in the Denver metropolitan area, which attracted businesses from the technology, telecommunications and energy industries. Many of these businesses were drawn to the area’s highly educated workforce, low cost of doing business and rapid rate of in-migration. A real estate boom also contributed to Colorado’s economic expansion. Home sales and prices increased for much of the reporting period. Higher prices, cold weather and the holiday season, however, slowed sales in the fourth quarter of 2013. The overall gains helped Colorado’s unemployment rate stay below the nation’s during the fiscal year. The state’s unemployment rate fell to 6.1% from 7.1% over the period, while the national rate ended the period at 6.7%.3
18 | Annual Report
The enacted fiscal year 2014 budget recognized that revenue outperformance during the period was likely one-time in nature and ensured that some of the new spending was on one-time items. Lawmakers allocated additional funding for K-12 and higher education, infrastructure construction and maintenance, health services and child welfare, and economic development initiatives such as tourism promotion and incentives for companies to relocate to or expand their workforce in the state. Additionally, the fiscal year 2014 budget increased Colorado’s allocation to the general fund reserve. The governor submitted a budget proposal for fiscal year 2015 that restored funding for agencies that had endured budget cuts resulting from the need for emergency funding to address a series of wildfires and floods. Highlights of the proposal included increased spending on education, corrections and emergency recovery efforts, and increasing the general fund reserve. The governor based the spending recommendations on forecasts that the state’s economy could continue to strengthen. Near period-end, the governor released an updated budget proposal reflecting that sales tax collections from Colorado’s recently legalized marijuana market exceeded lawmakers’ expectations. The updated proposal allocated additional funding for substance abuse prevention and treatment programs. Analysts noted, however, that continued strong revenue collections could trigger a constitutional requirement that surplus revenue be returned to taxpayers as a refund.
Colorado’s constitution prohibits the state from issuing long-term general obligation debt, but the state has issued general fund appropriation-backed lease revenue debt for general purposes. Colorado’s debt levels were lower than most states, with net tax-supported debt at $525 per capita and 1.2% of personal income, compared with the $1,074 and 2.8% national medians.4 Independent credit rating agency Standard & Poor’s (S&P) affirmed its Colorado issuer rating of AA with a stable outlook.5 The rating and outlook reflected S&P’s view of the state’s strong economic fundamentals that included above-average income, employment and population trends, history of making midyear budget adjustments as required by quarterly revenue forecasts, good financial performance and low debt levels. According to S&P, challenges included a high level of unfunded pension liabilities and a track record of funding less than the required pension contribution, as well as constitutional restrictions and voter initiatives that limit tax revenue growth and spending flexibility.
| | |
| Portfolio Breakdown | | |
| Franklin Colorado Tax-Free Income Fund | |
| 2/28/14 | | |
| % of Total | |
| Long-Term Investments* | |
| Hospital & Health Care | 19.0 | % |
| Tax-Supported | 16.3 | % |
| Subject to Government Appropriations | 15.0 | % |
| Utilities | 14.9 | % |
| Higher Education | 12.2 | % |
| Refunded | 10.1 | % |
| Other Revenue | 4.9 | % |
| General Obligation | 4.1 | % |
| Transportation | 3.5 | % |
*Does not include short-term investments and other net assets.
Manager’s Discussion
We used various investment strategies during the 12 months under review as we sought to maximize tax-free income for shareholders. Puerto Rico’s municipal bond market is widely traded because of its federal and state tax-exemption advantages. During the reporting period, some Puerto Rico issuers experienced a series of downgrades from S&P, Moody’s Investors Service
Annual Report | 19
and Fitch Ratings. In February 2014, these credit rating firms downgraded their respective ratings of Puerto Rico’s general obligation debt to below investment grade, along with the ratings of certain related Puerto Rico issuers. Additionally, each rating agency maintained a negative outlook on certain Puerto Rico issuers, and further downgrades are possible. The Fund is not required to sell securities that have been downgraded to below investment grade, but it is prohibited from making further purchases of such securities as long as the securities are not rated investment grade by at least one U.S. nationally recognized rating service. Rating actions combined with news related to the commonwealth’s financial position and future financing endeavors caused the Puerto Rico bond market to experience sharp declines in the latter half of 2013 and contrasting positive performance year-to-date in 2014.
Thank you for your continued participation in Franklin Colorado Tax-Free Income Fund. We believe our conservative, buy-and-hold investment strategy can help us achieve high, current, tax-free income for shareholders.
The foregoing information reflects our analysis, opinions and portfolio holdings as of February 28, 2014, the end
of the reporting period. The way we implement our main investment strategies and the resulting portfolio holdings
may change depending on factors such as market and economic conditions. These opinions may not be relied upon
as investment advice or an offer for a particular security. The information is not a complete analysis of every aspect
of any market, state, industry, security or the Fund. Statements of fact are from sources considered reliable, but
the investment manager makes no representation or warranty as to their completeness or accuracy. Although
historical performance is no guarantee of future results, these insights may help you understand our investment
management philosophy.
1. For state personal income taxes, the 80% minimum is measured by total Fund assets. For investors subject to alter-
native minimum tax, a small portion of Fund dividends may be taxable. Distributions of capital gains are generally
taxable. To avoid imposition of 28% backup withholding on all Fund distributions and redemption proceeds, U.S.
investors must be properly certified on Form W-9 and non-U.S. investors on Form W-8BEN.
2. All Fund distributions will vary depending upon current market conditions, and past distributions are not indicative
of future trends.
3. Source: Bureau of Labor Statistics.
4. Source: Moody’s Investors Service, “2013 State Debt Medians Report,” 5/29/13.
5. This does not indicate S&P’s rating of the Fund.
20 | Annual Report
Performance Summary as of 2/28/14
Franklin Colorado Tax-Free Income Fund
Your dividend income will vary depending on dividends or interest paid by securities in the Fund’s portfolio, adjusted for operating expenses of each class. Capital gain distributions are net profits realized from the sale of portfolio securities. The performance table and graphs do not reflect any taxes that a shareholder would pay on Fund dividends, capital gain distributions, if any, or any realized gains on the sale of Fund shares. Total return reflects reinvestment of the Fund’s dividends and capital gain distributions, if any, and any unrealized gains or losses.
| | | | | | | | |
| Price and Distribution Information | | | | | | |
| Class A (Symbol: FRCOX) | | | | Change | | 2/28/14 | | 2/28/13 |
| Net Asset Value (NAV) | | | -$ | 0.78 | $ | 11.66 | $ | 12.44 |
| Distributions (3/1/13–2/28/14) | | | | | | | | |
| Dividend Income | $ | 0.4550 | | | | | | |
| Class C (Symbol: FCOIX) | | | | Change | | 2/28/14 | | 2/28/13 |
| Net Asset Value (NAV) | | | -$ | 0.78 | $ | 11.78 | $ | 12.56 |
| Distributions (3/1/13–2/28/14) | | | | | | | | |
| Dividend Income | $ | 0.3899 | | | | | | |
| Advisor Class (Symbol: FCOZX) | | | | Change | | 2/28/14 | | 2/28/13 |
| Net Asset Value (NAV) | | | -$ | 0.77 | $ | 11.66 | $ | 12.43 |
| Distributions (3/1/13–2/28/14) | | | | | | | | |
| Dividend Income | $ | 0.4664 | | | | | | |
Annual Report | 21
Performance Summary (continued)
Performance
Cumulative total return excludes sales charges. Average annual total returns include maximum sales charges.
Class A: 4.25% maximum initial sales charge; Class C: 1% contingent deferred sales charge in first year only;
Advisor Class: no sales charges.
| | | | | | | | | | |
| Class A | | | 1-Year | | | 5-Year | | | 10-Year | |
| Cumulative Total Return1 | | | -2.56 | % | | +33.17 | % | | +47.11 | % |
| Average Annual Total Return2 | | | -6.68 | % | | +4.98 | % | | +3.49 | % |
| Avg. Ann. Total Return (3/31/14)3 | | | -5.70 | % | | +4.94 | % | | +3.54 | % |
| Distribution Rate4 | 3.94 | % | | | | | | | | |
| Taxable Equivalent Distribution Rate5 | 7.32 | % | | | | | | | | |
| 30-Day Standardized Yield6 | 3.32 | % | | | | | | | | |
| Taxable Equivalent Yield5 | 6.17 | % | | | | | | | | |
| Total Annual Operating Expenses7 | 0.65 | % | | | | | | | | |
| Class C | | | 1-Year | | | 5-Year | | | 10-Year | |
| Cumulative Total Return1 | | | -3.07 | % | | +29.56 | % | | +39.27 | % |
| Average Annual Total Return2 | | | -4.01 | % | | +5.32 | % | | +3.37 | % |
| Avg. Ann. Total Return (3/31/14)3 | | | -2.87 | % | | +5.29 | % | | +3.44 | % |
| Distribution Rate4 | 3.56 | % | | | | | | | | |
| Taxable Equivalent Distribution Rate5 | 6.62 | % | | | | | | | | |
| 30-Day Standardized Yield6 | 2.92 | % | | | | | | | | |
| Taxable Equivalent Yield5 | 5.43 | % | | | | | | | | |
| Total Annual Operating Expenses7 | 1.20 | % | | | | | | | | |
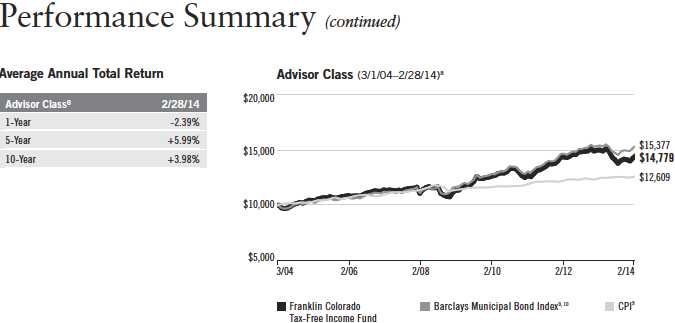
| Advisor Class8 | | | 1-Year | | | 5-Year | | | 10-Year | |
| Cumulative Total Return1 | | | -2.39 | % | | +33.78 | % | | +47.79 | % |
| Average Annual Total Return2 | | | -2.39 | % | | +5.99 | % | | +3.98 | % |
| Avg. Ann. Total Return (3/31/14)3 | | | -1.39 | % | | +5.95 | % | | +4.05 | % |
| Distribution Rate4 | 4.21 | % | | | | | | | | |
| Taxable Equivalent Distribution Rate5 | 7.82 | % | | | | | | | | |
| 30-Day Standardized Yield6 | 3.57 | % | | | | | | | | |
| Taxable Equivalent Yield5 | 6.64 | % | | | | | | | | |
| Total Annual Operating Expenses7 | 0.55 | % | | | | | | | | |
Performance data represent past performance, which does not guarantee future results. Investment return and principal
value will fluctuate, and you may have a gain or loss when you sell your shares. Current performance may differ from
figures shown. For most recent month-end performance, go to franklintempleton.com or call (800) 342-5236.
22 | Annual Report
Performance Summary (continued)
Total Return Index Comparison for a Hypothetical $10,000 Investment
Total return represents the change in value of an investment over the periods shown. It includes
any applicable maximum sales charge, Fund expenses, account fees and reinvested distributions.
The unmanaged index includes reinvestment of any income or distributions. It differs from the
Fund in composition and does not pay management fees or expenses. One cannot invest directly
in an index.

Annual Report | 23
All investments involve risks, including possible loss of principal. Because municipal bonds are sensitive to interest rate movements, the Fund’s
yield and share price will fluctuate with market conditions. Bond prices generally move in the opposite direction of interest rates. Thus, as
prices of bonds in the Fund adjust to a rise in interest rates, the Fund’s share price may decline. Because the Fund invests principally in a
single state, it is subject to greater risk of adverse economic and regulatory changes in that state than a geographically diversified fund.
The Fund holds a small portion of its assets in Puerto Rico municipal bonds that have been impacted by recent adverse economic and market
changes, which may cause the Fund’s share price to decline. Changes in the credit rating of a bond, or in the credit rating or financial strength
of a bond’s issuer, insurer or guarantor, may affect the bond’s value. The Fund may invest a significant part of its assets in municipal securities
that finance similar types of projects, such as utilities, hospitals, higher education and transportation. A change that affects one project would
likely affect all similar projects, thereby increasing market risk. The Fund is actively managed but there is no guarantee that the manager’s
investment decisions will produce the desired results. The Fund’s prospectus also includes a description of the main investment risks.
Class C: These shares have higher annual fees and expenses than Class A shares.
Advisor Class: Shares are available to certain eligible investors as described in the prospectus.
1. Cumulative total return represents the change in value of an investment over the periods indicated.
2. Average annual total return represents the average annual change in value of an investment over the periods indicated.
3. In accordance with SEC rules, we provide standardized average annual total return information through the latest calendar quarter.
4. Distribution rate is based on an annualization of the respective class’s February dividend and the maximum offering price (NAV for Classes C and
Advisor) per share on 2/28/14.
5. Taxable equivalent distribution rate and yield assume the published rates as of 12/18/13 for the maximum combined effective federal and
Colorado personal income tax rate of 46.20%, based on the federal income tax rate of 39.60% plus 3.8% Medicare tax.
6. The 30-day standardized yield for the month ended 2/28/14 reflects an estimated yield to maturity (assuming all portfolio securities are held to
maturity). It should be regarded as an estimate of the Fund’s rate of investment income, and it may not equal the Fund’s actual income distribution
rate (which reflects the Fund’s past dividends paid to shareholders) or the income reported in the Fund’s financial statements.
7. Figures are as stated in the Fund’s current prospectus. In periods of market volatility, assets may decline significantly, causing total annual Fund
operating expenses to become higher than the figures shown.
8. Effective 7/15/09, the Fund began offering Advisor Class shares, which do not have sales charges or a Rule 12b-1 plan. Performance quotations
for this class reflect the following methods of calculation: (a) For periods prior to 7/15/09, a restated figure is used based upon the Fund’s Class A
performance, excluding the effect of Class A’s maximum initial sales charge, but reflecting the effect of the Class A Rule 12b-1 fees; and (b) for peri-
ods after 7/15/09, actual Advisor Class performance is used reflecting all charges and fees applicable to that class. Since 7/15/09 (commencement
of sales), the cumulative and average annual total returns of Advisor Class shares were +26.39% and +5.19%.
9. Source: © 2014 Morningstar. The Barclays Municipal Bond Index is a market value-weighted index engineered for the long-term tax-exempt bond
market. To be included in the index, bonds must be fixed rate, have at least one year to final maturity and be rated investment grade (Baa3/BBB- or
higher) by at least two of the following agencies: Moody’s, Standard & Poor’s and Fitch. The Consumer Price Index (CPI), calculated by the Bureau of
Labor Statistics, is a commonly used measure of the inflation rate.
10. Source: Barclays Global Family of Indices. © 2014 Barclays Capital Inc. Used with permission.
24 | Annual Report
Your Fund’s Expenses
Franklin Colorado Tax-Free Income Fund
As a Fund shareholder, you can incur two types of costs:
- Transaction costs, including sales charges (loads) on Fund purchases; and
- Ongoing Fund costs, including management fees, distribution and service (12b-1) fees, and other Fund expenses. All mutual funds have ongoing costs, sometimes referred to as operating expenses.
The following table shows ongoing costs of investing in the Fund and can help you understand these costs and compare them with those of other mutual funds. The table assumes a $1,000 investment held for the six months indicated.
Actual Fund Expenses
The first line (Actual) for each share class listed in the table provides actual account values and expenses. The “Ending Account Value” is derived from the Fund’s actual return, which includes the effect of Fund expenses.
You can estimate the expenses you paid during the period by following these steps. Of course, your account value and expenses will differ from those in this illustration:
| 1. | Divide your account value by $1,000. |
| | If an account had an $8,600 value, then $8,600 ÷ $1,000 = 8.6. |
| 2. | Multiply the result by the number under the heading “Expenses Paid During Period.” |
| | If Expenses Paid During Period were $7.50, then 8.6 x $7.50 = $64.50. |
In this illustration, the estimated expenses paid this period are $64.50.
Hypothetical Example for Comparison with Other Funds
Information in the second line (Hypothetical) for each class in the table can help you compare ongoing costs of investing in the Fund with those of other mutual funds. This information may not be used to estimate the actual ending account balance or expenses you paid during the period. The hypothetical “Ending Account Value” is based on the actual expense ratio for each class and an assumed 5% annual rate of return before expenses, which does not represent the Fund’s actual return. The figure under the heading “Expenses Paid During Period” shows the hypothetical expenses your account would have incurred under this scenario. You can compare this figure with the 5% hypothetical examples that appear in shareholder reports of other funds.
Annual Report | 25
Your Fund’s Expenses (continued)
Please note that expenses shown in the table are meant to highlight ongoing costs and do not reflect any transaction costs, such as sales charges. Therefore, the second line for each class is useful in comparing ongoing costs only, and will not help you compare total costs of owning different funds. In addition, if transaction costs were included, your total costs would have been higher. Please refer to the Fund prospectus for additional information on operating expenses.
| | | | | | |
| | | Beginning Account | | Ending Account | | Expenses Paid During |
| Class A | | Value 9/1/13 | | Value 2/28/14 | | Period* 9/1/13–2/28/14 |
| Actual | $ | 1,000 | $ | 1,059.70 | $ | 3.42 |
| Hypothetical (5% return before expenses) | $ | 1,000 | $ | 1,021.47 | $ | 3.36 |
| Class C | | | | | | |
| Actual | $ | 1,000 | $ | 1,056.20 | $ | 6.22 |
| Hypothetical (5% return before expenses) | $ | 1,000 | $ | 1,018.74 | $ | 6.11 |
| Advisor Class | | | | | | |
| Actual | $ | 1,000 | $ | 1,060.20 | $ | 2.91 |
| Hypothetical (5% return before expenses) | $ | 1,000 | $ | 1,021.97 | $ | 2.86 |
*Expenses are calculated using the most recent six-month expense ratio, annualized for each class (A: 0.67%; C: 1.22%; and Advisor: 0.57%),
multiplied by the average account value over the period, multiplied by 181/365 to reflect the one-half year period.
26 | Annual Report
Franklin Connecticut Tax-Free Income Fund
Your Fund’s Goal and Main Investments: Franklin Connecticut Tax-Free Income Fund seeks to provide as high a level of income exempt from federal and Connecticut personal income taxes as is consistent with prudent investment management and preservation of capital by investing at least 80% of its net assets in securities that pay interest free from such taxes.1

Performance data represent past performance, which does not guarantee future results. Investment return and principal value will fluctuate, and you may have a gain or loss when you sell your shares. Current performance may differ from figures shown. Please visit franklintempleton.com or call (800) 342-5236 for most recent month-end performance.
This annual report for Franklin Connecticut Tax-Free Income Fund covers the fiscal year ended February 28, 2014.
Performance Overview
The Fund’s Class A share price, as measured by net asset value, decreased from $11.43 on February 28, 2013, to $10.65 on February 28, 2014. The Fund’s Class A shares paid dividends totaling 38.29 cents per share for the same period.2 The Performance Summary beginning on page 31 shows that at the end of this reporting period the Fund’s Class A shares’ distribution rate was
The dollar value, number of shares or principal amount, and names of all portfolio holdings are listed in the Fund’s
Statement of Investments (SOI). The SOI begins on page 106.
Annual Report | 27
| | | |
| Dividend Distributions* | | | |
| Franklin Connecticut Tax-Free Income Fund | | | |
| 3/1/13-2/28/14 | | | |
| | Dividend per Share (cents) |
| Month | Class A | Class C | Advisor Class |
| March | 2.99 | 2.46 | 3.09 |
| April | 2.99 | 2.46 | 3.09 |
| May | 2.99 | 2.46 | 3.09 |
| June | 2.99 | 2.48 | 3.08 |
| July | 2.99 | 2.48 | 3.08 |
| August | 3.19 | 2.68 | 3.28 |
| September | 3.24 | 2.77 | 3.32 |
| October | 3.29 | 2.82 | 3.37 |
| November | 3.34 | 2.87 | 3.42 |
| December | 3.39 | 2.93 | 3.48 |
| January | 3.42 | 2.96 | 3.51 |
| February | 3.47 | 3.01 | 3.56 |
| Total | 38.29 | 32.38 | 39.37 |
*Assumes shares were purchased and held for the entire accrual period. Since dividends accrue daily, your actual dis-
tributions will vary depending on the date you purchased your shares and any account activity. All Fund distributions
will vary depending upon current market conditions, and past distributions are not indicative of future trends.
3.74% based on an annualization of the 3.47 cent per share February dividend and the maximum offering price of $11.12 on February 28, 2014. An investor in the 2014 maximum combined effective federal and Connecticut personal income tax bracket of 47.45% (including 3.8% Medicare tax) would need to earn a distribution rate of 7.12% from a taxable investment to match the Fund’s Class A tax-free distribution rate. For the Fund’s Class C and Advisor shares’ performance, please see the Performance Summary.
State Update
Connecticut’s economy continued to show signs of improvement during the 12 months under review. The state’s above-average reliance on economically sensitive industries such as finance, insurance and real estate slowed the pace of its recovery. The troubled housing market had mixed results during the period. Foreclosure and housing permit issuance levels worsened, but home sales and prices improved. Connecticut’s persistently elevated unemployment rate fell to a five-year low of 7.0% at period-end.3 Most of the gains made in the fourth quarter of 2013 were attributed to employment, rather than job
28 | Annual Report
seekers leaving the labor force. In comparison, the national rate was 6.7% at period-end.3 Near period-end, the governor proposed a series of legislative actions to address unemployment that included borrowing funds for wage subsidy and job placement programs and creating a law that would make it illegal for employers to screen job seekers by their length of unemployment.
Lawmakers used nonrecurring measures including fund transfers, maturity extension of economic recovery notes and appropriation of a sizable portion of the fiscal year 2013 surplus to help bridge a large gap in the enacted fiscal 2014–2015 biennial budget. Other measures the state employed to balance the budget consisted of revenue enhancements without creating new taxes but encompassed reduced transfers for municipal aid, the special transportation fund, as well as spending cuts resulting largely from changes in the Medicaid cost program. Connecticut experienced positive revenue performance in fiscal year 2013 after taxpayers cashed in dividends and capital gains ahead of tax law changes. The governor proposed using an expected budget surplus for tax-free rebates and replenishing the underfunded pension fund. Lawmakers from the state house offered a competing plan that called for tax cuts. Both parties, however, agreed that surplus funds should be used to boost the rainy day fund used for fiscal emergencies and paying down long-term debt.
Connecticut’s above-average reliance on economically sensitive industries has resulted in a historically volatile revenue base and has caused the state to increase the issuance of debt to cover operating deficits during difficult economic periods. In addition, the higher level of debt can largely be attributed to funding education programs and pension liability as mandated by Connecticut, while other states may utilize local government contribution for public programs. As a result, Connecticut’s debt levels remained among the nation’s highest, with net tax-supported debt at 9.1% of personal income and $5,185 per capita, compared with the 2.8% and $1,074 national medians.4 Independent credit rating agency Standard & Poor’s (S&P) rated the state’s general obligation debt AA with a stable outlook.5 The rating reflected S&P’s view of the state’s diverse economy, high wealth and income levels, flexibility to adjust revenues and manage budget volatility, active monitoring of revenues and expenditures, and adequate operating liquidity. In S&P’s view, despite such strong fundamentals, Connecticut’s cyclical budget performance has caused it to issue debt to help finance operations during recessionary periods. Additionally, S&P expected the state’s significant cost pressure from high debt levels and large unfunded postretirement liabilities to accelerate because of new bond authorizations. The outlook reflected S&P’s expectation that the state will continue to work on restoring fiscal balance over the next two years.
Portfolio Breakdown
Franklin Connecticut Tax-Free Income Fund 2/28/14
| | |
| % of Total | |
| Long-Term Investments* | |
| Higher Education | 29.5 | % |
| Hospital & Health Care | 20.3 | % |
| Utilities | 12.4 | % |
| General Obligation | 9.5 | % |
| Other Revenue | 8.3 | % |
| Refunded | 6.4 | % |
| Tax-Supported | 5.1 | % |
| Transportation | 3.9 | % |
| Housing | 3.4 | % |
| Subject to Government Appropriations | 1.2 | % |
*Does not include short-term investments and other net assets.
Annual Report | 29
Manager’s Discussion
We used various investment strategies during the 12 months under review as we sought to maximize tax-free income for shareholders. Puerto Rico’s municipal bond market is widely traded because of its federal and state tax-exemption advantages. During the reporting period, some Puerto Rico issuers experienced a series of downgrades from S&P, Moody’s Investors Service and Fitch Ratings. In February 2014, these credit rating firms downgraded their respective ratings of Puerto Rico’s general obligation debt to below investment grade, along with the ratings of certain related Puerto Rico issuers. Additionally, each rating agency maintained a negative outlook on certain Puerto Rico issuers, and further downgrades are possible. The Fund is not required to sell securities that have been downgraded to below investment grade, but it is prohibited from making further purchases of such securities as long as the securities are not rated investment grade by at least one U.S. nationally recognized rating service. Rating actions combined with news related to the commonwealth’s financial position and future financing endeavors caused the Puerto Rico bond market to experience sharp declines in the latter half of 2013 and contrasting positive performance year-to-date in 2014.
Thank you for your continued participation in Franklin Connecticut Tax-Free Income Fund. We believe our conservative, buy-and-hold investment strategy can help us achieve high, current, tax-free income for shareholders.
The foregoing information reflects our analysis, opinions and portfolio holdings as of February 28, 2014, the end
of the reporting period. The way we implement our main investment strategies and the resulting portfolio holdings
may change depending on factors such as market and economic conditions. These opinions may not be relied
upon as investment advice or an offer for a particular security. The information is not a complete analysis of
every aspect of any market, state, industry, security or the Fund. Statements of fact are from sources considered
reliable, but the investment manager makes no representation or warranty as to their completeness or accuracy.
Although historical performance is no guarantee of future results, these insights may help you understand our
investment management philosophy.
1. For state personal income taxes, the 80% minimum is measured by total Fund assets. For investors subject to alter-
native minimum tax, a small portion of Fund dividends may be taxable. Distributions of capital gains are generally
taxable. To avoid imposition of 28% backup withholding on all Fund distributions and redemption proceeds, U.S.
investors must be properly certified on Form W-9 and non-U.S. investors on Form W-8BEN.
2. All Fund distributions will vary depending upon current market conditions, and past distributions are not indicative
of future trends.
3. Source: Bureau of Labor Statistics.
4. Source: Moody’s Investors Service, “2013 State Debt Medians Report,” 5/29/13.
5. This does not indicate S&P’s rating of the Fund.
30 | Annual Report
Performance Summary as of 2/28/14
Franklin Connecticut Tax-Free Income Fund
Your dividend income will vary depending on dividends or interest paid by securities in the Fund’s portfolio, adjusted for operating expenses of each class. Capital gain distributions are net profits realized from the sale of portfolio securities. The performance table and graphs do not reflect any taxes that a shareholder would pay on Fund dividends, capital gain distributions, if any, or any realized gains on the sale of Fund shares. Total return reflects reinvestment of the Fund’s dividends and capital gain distributions, if any, and any unrealized gains or losses.
| | | | | | | | |
| Price and Distribution Information | | | | | | |
| Class A (Symbol: FXCTX) | | | | Change | | 2/28/14 | | 2/28/13 |
| Net Asset Value (NAV) | | | -$ | 0.78 | $ | 10.65 | $ | 11.43 |
| Distributions (3/1/13–2/28/14) | | | | | | | | |
| Dividend Income | $ | 0.3829 | | | | | | |
| Class C (Symbol: FCTIX) | | | | Change | | 2/28/14 | | 2/28/13 |
| Net Asset Value (NAV) | | | -$ | 0.78 | $ | 10.73 | $ | 11.51 |
| Distributions (3/1/13–2/28/14) | | | | | | | | |
| Dividend Income | $ | 0.3238 | | | | | | |
| Advisor Class (Symbol: FCNZX) | | | | Change | | 2/28/14 | | 2/28/13 |
| Net Asset Value (NAV) | | | -$ | 0.78 | $ | 10.64 | $ | 11.42 |
| Distributions (3/1/13–2/28/14) | | | | | | | | |
| Dividend Income | $ | 0.3937 | | | | | | |
Annual Report | 31
Performance Summary (continued)
Performance
Cumulative total return excludes sales charges. Average annual total returns include maximum sales charges.
Class A: 4.25% maximum initial sales charge; Class C: 1% contingent deferred sales charge in first year only;
Advisor Class: no sales charges.
| | | | | | | | | | |
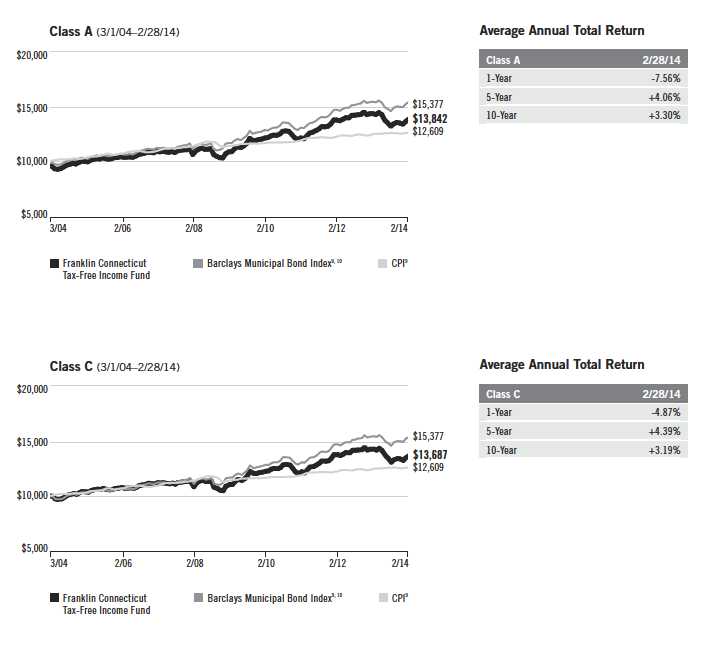
| Class A | | | 1-Year | | | 5-Year | | | 10-Year | |
| Cumulative Total Return1 | | | -3.44 | % | | +27.39 | % | | +44.52 | % |
| Average Annual Total Return2 | | | -7.56 | % | | +4.06 | % | | +3.30 | % |
| Avg. Ann. Total Return (3/31/14)3 | | | -6.65 | % | | +4.09 | % | | +3.33 | % |
| Distribution Rate4 | 3.74 | % | | | | | | | | |
| Taxable Equivalent Distribution Rate5 | 7.12 | % | | | | | | | | |
| 30-Day Standardized Yield6 | 3.11 | % | | | | | | | | |
| Taxable Equivalent Yield5 | 5.92 | % | | | | | | | | |
| Total Annual Operating Expenses7 | 0.66 | % | | | | | | | | |
| Class C | | | 1-Year | | | 5-Year | | | 10-Year | |
| Cumulative Total Return1 | | | -3.94 | % | | +23.99 | % | | +36.87 | % |
| Average Annual Total Return2 | | | -4.87 | % | | +4.39 | % | | +3.19 | % |
| Avg. Ann. Total Return (3/31/14)3 | | | -4.06 | % | | +4.44 | % | | +3.22 | % |
| Distribution Rate4 | 3.37 | % | | | | | | | | |
| Taxable Equivalent Distribution Rate5 | 6.41 | % | | | | | | | | |
| 30-Day Standardized Yield6 | 2.71 | % | | | | | | | | |
| Taxable Equivalent Yield5 | 5.16 | % | | | | | | | | |
| Total Annual Operating Expenses7 | 1.21 | % | | | | | | | | |
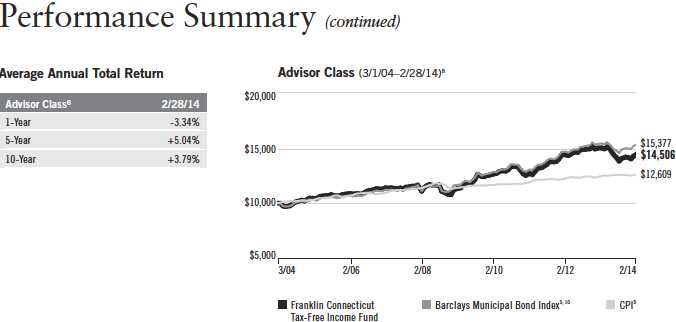
| Advisor Class8 | | | 1-Year | | | 5-Year | | | 10-Year | |
| Cumulative Total Return1 | | | -3.34 | % | | +27.87 | % | | +45.06 | % |
| Average Annual Total Return2 | | | -3.34 | % | | +5.04 | % | | +3.79 | % |
| Avg. Ann. Total Return (3/31/14)3 | | | -2.43 | % | | +5.08 | % | | +3.82 | % |
| Distribution Rate4 | 4.02 | % | | | | | | | | |
| Taxable Equivalent Distribution Rate5 | 7.65 | % | | | | | | | | |
| 30-Day Standardized Yield6 | 3.35 | % | | | | | | | | |
| Taxable Equivalent Yield5 | 6.37 | % | | | | | | | | |
| Total Annual Operating Expenses7 | 0.56 | % | | | | | | | | |
Performance data represent past performance, which does not guarantee future results. Investment return and principal
value will fluctuate, and you may have a gain or loss when you sell your shares. Current performance may differ from
figures shown. For most recent month-end performance, go to franklintempleton.com or call (800) 342-5236.
32 | Annual Report
Performance Summary (continued)
Total Return Index Comparison for a Hypothetical $10,000 Investment
Total return represents the change in value of an investment over the periods shown. It includes any applicable maximum sales charge, Fund expenses, account fees and reinvested distributions. The unmanaged index includes reinvestment of any income or distributions. It differs from the Fund in composition and does not pay management fees or expenses. One cannot invest directly in an index.
Annual Report | 33
All investments involve risks, including possible loss of principal. Because municipal bonds are sensitive to interest rate movements, the Fund’s
yield and share price will fluctuate with market conditions. Bond prices generally move in the opposite direction of interest rates. Thus, as
prices of bonds in the Fund adjust to a rise in interest rates, the Fund’s share price may decline. Because the Fund invests principally in a
single state, it is subject to greater risk of adverse economic and regulatory changes in that state than a geographically diversified fund. The
Fund holds a portion of its assets in Puerto Rico municipal bonds that have been impacted by recent adverse economic and market changes,
which may cause the Fund’s share price to decline. Changes in the credit rating of a bond, or in the credit rating or financial strength of a
bond’s issuer, insurer or guarantor, may affect the bond’s value. The Fund may invest a significant part of its assets in municipal securities
that finance similar types of projects, such as utilities, hospitals, higher education and transportation. A change that affects one project would
likely affect all similar projects, thereby increasing market risk. The Fund is actively managed but there is no guarantee that the manager’s
investment decisions will produce the desired results. The Fund’s prospectus also includes a description of the main investment risks.
Class C: These shares have higher annual fees and expenses than Class A shares.
Advisor Class: Shares are available to certain eligible investors as described in the prospectus.
1. Cumulative total return represents the change in value of an investment over the periods indicated.
2. Average annual total return represents the average annual change in value of an investment over the periods indicated.
3. In accordance with SEC rules, we provide standardized average annual total return information through the latest calendar quarter.
4. Distribution rate is based on an annualization of the respective class’s February dividend and the maximum offering price (NAV for Classes C and
Advisor) per share on 2/28/14.
5. Taxable equivalent distribution rate and yield assume the published rates as of 12/18/13 for the maximum combined effective federal and
Connecticut personal income tax rate of 47.45%, based on the federal income tax rate of 39.60% plus 3.8% Medicare tax.
6. The 30-day standardized yield for the month ended 2/28/14 reflects an estimated yield to maturity (assuming all portfolio securities are held to
maturity). It should be regarded as an estimate of the Fund’s rate of investment income, and it may not equal the Fund’s actual income distribution
rate (which reflects the Fund’s past dividends paid to shareholders) or the income reported in the Fund’s financial statements.
7. Figures are as stated in the Fund’s current prospectus. In periods of market volatility, assets may decline significantly, causing total annual Fund
operating expenses to become higher than the figures shown.
8. Effective 7/15/09, the Fund began offering Advisor Class shares, which do not have sales charges or a Rule 12b-1 plan. Performance quotations
for this class reflect the following methods of calculation: (a) For periods prior to 7/15/09, a restated figure is used based upon the Fund’s Class A
performance, excluding the effect of Class A’s maximum initial sales charge, but reflecting the effect of the Class A Rule 12b-1 fees; and (b) for peri-
ods after 7/15/09, actual Advisor Class performance is used reflecting all charges and fees applicable to that class. Since 7/15/09 (commencement
of sales), the cumulative and average annual total returns of Advisor Class shares were +22.49% and +4.49%.
9. Source: © 2014 Morningstar. The Barclays Municipal Bond Index is a market value-weighted index engineered for the long-term tax-exempt bond
market. To be included in the index, bonds must be fixed rate, have at least one year to final maturity and be rated investment grade (Baa3/BBB- or
higher) by at least two of the following agencies: Moody’s, Standard & Poor’s and Fitch. The Consumer Price Index (CPI), calculated by the Bureau of
Labor Statistics, is a commonly used measure of the inflation rate.
10. Source: Barclays Global Family of Indices. © 2014 Barclays Capital Inc. Used with permission.
34 | Annual Report
Your Fund’s Expenses
Franklin Connecticut Tax-Free Income Fund
As a Fund shareholder, you can incur two types of costs:
- Transaction costs, including sales charges (loads) on Fund purchases; and
- Ongoing Fund costs, including management fees, distribution and service (12b-1) fees, and other Fund expenses. All mutual funds have ongoing costs, sometimes referred to as operating expenses.
The following table shows ongoing costs of investing in the Fund and can help you understand these costs and compare them with those of other mutual funds. The table assumes a $1,000 investment held for the six months indicated.
Actual Fund Expenses
The first line (Actual) for each share class listed in the table provides actual account values and expenses. The “Ending Account Value” is derived from the Fund’s actual return, which includes the effect of Fund expenses.
You can estimate the expenses you paid during the period by following these steps. Of course, your account value and expenses will differ from those in this illustration:
| 1. | Divide your account value by $1,000. |
| | If an account had an $8,600 value, then $8,600 ÷ $1,000 = 8.6. |
| 2. | Multiply the result by the number under the heading “Expenses Paid During Period.” |
| | If Expenses Paid During Period were $7.50, then 8.6 x $7.50 = $64.50. |
In this illustration, the estimated expenses paid this period are $64.50.
Hypothetical Example for Comparison with Other Funds
Information in the second line (Hypothetical) for each class in the table can help you compare ongoing costs of investing in the Fund with those of other mutual funds. This information may not be used to estimate the actual ending account balance or expenses you paid during the period. The hypothetical “Ending Account Value” is based on the actual expense ratio for each class and an assumed 5% annual rate of return before expenses, which does not represent the Fund’s actual return. The figure under the heading “Expenses Paid During Period” shows the hypothetical expenses your account would have incurred under this scenario. You can compare this figure with the 5% hypothetical examples that appear in shareholder reports of other funds.
Annual Report | 35
Your Fund’s Expenses (continued)
Please note that expenses shown in the table are meant to highlight ongoing costs and do not reflect any transaction costs, such as sales charges. Therefore, the second line for each class is useful in comparing ongoing costs only, and will not help you compare total costs of owning different funds. In addition, if transaction costs were included, your total costs would have been higher. Please refer to the Fund prospectus for additional information on operating expenses.
| | | | | | |
| | | Beginning Account | | Ending Account | | Expenses Paid During |
| Class A | | Value 9/1/13 | | Value 2/28/14 | | Period* 9/1/13–2/28/14 |
| Actual | $ | 1,000 | $ | 1,050.90 | $ | 3.51 |
| Hypothetical (5% return before expenses) | $ | 1,000 | $ | 1,021.37 | $ | 3.46 |
| Class C | | | | | | |
| Actual | $ | 1,000 | $ | 1,048.80 | $ | 6.30 |
| Hypothetical (5% return before expenses) | $ | 1,000 | $ | 1,018.65 | $ | 6.21 |
| Advisor Class | | | | | | |
| Actual | $ | 1,000 | $ | 1,051.50 | $ | 3.00 |
| Hypothetical (5% return before expenses) | $ | 1,000 | $ | 1,021.87 | $ | 2.96 |
*Expenses are calculated using the most recent six-month expense ratio, annualized for each class (A: 0.69%; C: 1.24%; and Advisor: 0.59%),
multiplied by the average account value over the period, multiplied by 181/365 to reflect the one-half year period.
36 | Annual Report
Franklin Michigan Tax-Free Income Fund
Your Fund’s Goal and Main Investments: Franklin Michigan Tax-Free Income Fund seeks to provide as high a level of income exempt from federal and Michigan personal income taxes as is consistent with prudent investment management and preservation of capital by investing at least 80% of its total assets in securities that pay interest free from such taxes.1
Performance data represent past performance, which does not guarantee future results. Investment return and principal value will fluctuate, and you may have a gain or loss when you sell your shares. Current performance may differ from figures shown. Please visit franklintempleton.com or call (800) 342-5236 for most recent month-end performance.
| | |
| Credit Quality Breakdown* | | |
| Franklin Michigan Tax-Free Income Fund | | |
| 2/28/14 | | |
| | % of Total | |
| Ratings | Long-Term Investments** | |
| AAA | 2.2 | % |
| AA | 63.2 | % |
| A | 33.2 | % |
| BBB | 0.5 | % |
| Not Rated | 0.9 | % |
*Standard & Poor’s (S&P) is used as the primary independent rating agency source. Moody’s is secondary, and Fitch,
if available, is used for securities not rated by Moody’s or S&P. The ratings are an indication of an issuer’s credit-
worthiness, with long-term ratings typically ranging from AAA (highest) to Below Investment Grade (lowest; includes
ratings BB to D). This methodology differs from that used in Fund marketing materials.
**Does not include short-term investments and other net assets.
This annual report for Franklin Michigan Tax-Free Income Fund covers the fiscal year ended February 28, 2014.
Performance Overview
The Fund’s Class A share price, as measured by net asset value, decreased from $12.36 on February 28, 2013, to $11.67 on February 28, 2014. The Fund’s Class A shares paid dividends totaling 44.61 cents per share for the same period.2 The Performance Summary beginning on page 41 shows that at the end of this reporting period the Fund’s Class A shares’ distribution rate was 3.96% based on an annualization of the 4.02 cent per share February dividend and the maximum offering price of $12.19 on February 28, 2014. An investor in the 2014 maximum combined effective federal and Michigan personal income tax bracket of 45.97% (including 3.8% Medicare tax) would need to earn a distribution rate of 7.33% from a taxable investment to match the
The dollar value, number of shares or principal amount, and names of all portfolio holdings are listed in the Fund’s Statement of Investments (SOI). The SOI begins on page 112.
Annual Report | 37
| | | |
| Dividend Distributions* | | | |
| Franklin Michigan Tax-Free Income Fund | | | |
| 3/1/13–2/28/14 | | | |
| | Dividend per Share (cents) |
| Month | Class A | Class C | Advisor Class |
| March | 3.42 | 2.83 | 3.54 |
| April | 3.42 | 2.83 | 3.54 |
| May | 3.42 | 2.83 | 3.54 |
| June | 3.42 | 2.86 | 3.53 |
| July | 3.47 | 2.91 | 3.58 |
| August | 3.75 | 3.19 | 3.86 |
| September | 3.83 | 3.32 | 3.92 |
| October | 3.93 | 3.42 | 4.02 |
| November | 3.93 | 3.42 | 4.02 |
| December | 3.98 | 3.47 | 4.06 |
| January | 4.02 | 3.51 | 4.10 |
| February | 4.02 | 3.51 | 4.10 |
| Total | 44.61 | 38.10 | 45.81 |
*Assumes shares were purchased and held for the entire accrual period. Since dividends accrue daily, your actual dis-
tributions will vary depending on the date you purchased your shares and any account activity. All Fund distributions
will vary depending upon current market conditions, and past distributions are not indicative of future trends.
Fund’s Class A tax-free distribution rate. For the Fund’s Class C and Advisor shares’ performance, please see the Performance Summary.
State Update
Michigan’s troubled economy continued to show signs of recovery during the 12 months under review. Although the state’s economy was diversified, the manufacturing sector still served as a major employment source. During the review period, local car production levels increased thanks to industry cost-cutting efforts, the nation’s economic recovery and pent-up car demand. This resurgence helped push down the persistently high unemployment rate from a high of 9.0% in July and August 2013 to a six-year low of 7.7% at period-end, which was higher than the national 6.7% average.3 Most job sectors expanded during the 12-month period. Improved employment conditions boosted the beleaguered real estate market, which experienced an increase in prices and a decrease in foreclosures.
Lawmakers reported a surplus in fiscal year 2013 after income tax collections exceeded expectations and businesses claimed fewer credits than expected. The income tax gains were recognized as a likely one-time phenomenon that occurred after taxpayers cashed in dividends and capital gains ahead of tax
38 | Annual Report
law changes. The state’s enacted fiscal year 2014 budget maintained structural balance and included a modest increase in total spending, primarily in public education, roads and public transportation, and revenue sharing to communities. The budget also included a deposit to the state’s budget stabilization fund (BSF), which indicated the state’s determination to restore a strong financial profile. Near period-end, the governor presented his budget proposal for fiscal year 2015. Highlights included issuing property tax refunds, increasing revenue sharing payments with cities, increasing funding for education and public safety, and adding to the BSF and a fund used to offset possible losses incurred by Medicaid expansion. Lawmakers also began negotiating revisions to the fiscal year 2014 budget that would reflect unanticipated costs associated with Medicaid expansion and the fiscal year 2013 surplus.
Michigan maintained relatively low debt levels, with net tax-supported debt at $800 per capita and 2.2% of personal income, compared with the national medians of $1,074 and 2.8%.4 Independent credit rating agency Standard & Poor’s (S&P) affirmed its rating of AA- and positive outlook on Michigan’s general obligation bonds (GO).5 The rating reflected S&P’s view of the state’s recovering cyclical economic base, improving fund balances, strong cash position, good budget management practices, and moderate debt and pension liability levels. S&P noted that challenges included the state’s weak economic growth over the past decade, cyclical financial pressures and relatively high obligations for other postemployment benefits. S&P’s rating outlook reflected the possibility that the state’s continued economic growth, BSF replenishment and structural alignment of ongoing revenues and expenditures could lead to a rating upgrade within S&P’s two-year horizon. The city of Detroit potentially moved closer to exiting the bankruptcy process after it filed a plan of adjustment at period-end. Independent credit rating agency Moody’s Investors Service left its Aa2 rating and positive outlook unchanged for Michigan debt despite the state’s weakened position under the plan because lawmakers already incorporated some tolerance of the loss into their financial plans.5
Portfolio Breakdown
Franklin Michigan Tax-Free Income Fund 2/28/14
| | |
| % of Total | |
| Long-Term Investments* | |
| General Obligation | 26.3 | % |
| Hospital & Health Care | 18.8 | % |
| Utilities | 16.4 | % |
| Higher Education | 12.3 | % |
| Subject to Government Appropriations | 9.1 | % |
| Refunded | 6.4 | % |
| Tax-Supported | 6.2 | % |
| Transportation | 4.1 | % |
| Housing | 0.4 | % |
*Does not include short-term investments and other net assets.
Manager’s Discussion
We used various investment strategies during the 12 months under review as we sought to maximize tax-free income for shareholders. Puerto Rico’s municipal bond market is widely traded because of its federal and state tax-exemption advantages. During the reporting period, some Puerto Rico issuers experienced a series of downgrades from S&P, Moody’s and Fitch Ratings. In February 2014, these credit rating firms downgraded their respective ratings of Puerto Rico’s general obligation debt to below investment grade, along with the ratings of certain related Puerto Rico issuers. Additionally, each rating agency maintained a negative outlook on certain Puerto Rico issuers, and further downgrades are possible. The Fund is not required to sell securities that
Annual Report | 39
have been downgraded to below investment grade, but it is prohibited from making further purchases of such securities as long as the securities are not rated investment grade by at least one U.S. nationally recognized rating service. Rating actions combined with news related to the commonwealth’s financial position and future financing endeavors caused the Puerto Rico bond market to experience sharp declines in the latter half of 2013 and contrasting positive performance year-to-date in 2014.
Thank you for your continued participation in Franklin Michigan Tax-Free Income Fund. We believe our conservative, buy-and-hold investment strategy can help us achieve high, current, tax-free income for shareholders.
The foregoing information reflects our analysis, opinions and portfolio holdings as of February 28, 2014, the end
of the reporting period. The way we implement our main investment strategies and the resulting portfolio holdings
may change depending on factors such as market and economic conditions. These opinions may not be relied upon
as investment advice or an offer for a particular security. The information is not a complete analysis of every aspect
of any market, state, industry, security or the Fund. Statements of fact are from sources considered reliable, but
the investment manager makes no representation or warranty as to their completeness or accuracy. Although
historical performance is no guarantee of future results, these insights may help you understand our investment
management philosophy.
1. For investors subject to alternative minimum tax, a small portion of Fund dividends may be taxable. Distributions
of capital gains are generally taxable. To avoid imposition of 28% backup withholding on all Fund distributions and
redemption proceeds, U.S. investors must be properly certified on Form W-9 and non-U.S. investors on Form W-8BEN.
2. All Fund distributions will vary depending upon current market conditions, and past distributions are not indicative
of future trends.
3. Source: Bureau of Labor Statistics.
4. Source: Moody’s Investors Service, “2013 State Debt Medians Report,” 5/29/13.
5. This does not indicate a rating of the Fund.
40 | Annual Report
Performance Summary as of 2/28/14
Franklin Michigan Tax-Free Income Fund
Your dividend income will vary depending on dividends or interest paid by securities in the Fund’s portfolio, adjusted for operating expenses of each class. Capital gain distributions are net profits realized from the sale of portfolio securities. The performance table and graphs do not reflect any taxes that a shareholder would pay on Fund dividends, capital gain distributions, if any, or any realized gains on the sale of Fund shares. Total return reflects reinvestment of the Fund’s dividends and capital gain distributions, if any, and any unrealized gains or losses.
| | | | | | | | |
| Price and Distribution Information | | | | | | |
| Class A (Symbol: FTTMX) | | | | Change | | 2/28/14 | | 2/28/13 |
| Net Asset Value (NAV) | | | -$ | 0.69 | $ | 11.67 | $ | 12.36 |
| Distributions (3/1/13–2/28/14) | | | | | | | | |
| Dividend Income | $ | 0.4461 | | | | | | |
| Class C (Symbol: FRMTX) | | | | Change | | 2/28/14 | | 2/28/13 |
| Net Asset Value (NAV) | | | -$ | 0.69 | $ | 11.83 | $ | 12.52 |
| Distributions (3/1/13–2/28/14) | | | | | | | | |
| Dividend Income | $ | 0.3810 | | | | | | |
| Advisor Class (Symbol: FMTFX) | | | | Change | | 2/28/14 | | 2/28/13 |
| Net Asset Value (NAV) | | | -$ | 0.69 | $ | 11.70 | $ | 12.39 |
| Distributions (3/1/13–2/28/14) | | | | | | | | |
| Dividend Income | $ | 0.4581 | | | | | | |
Annual Report | 41
Performance Summary (continued)
Performance
Cumulative total return excludes sales charges. Average annual total returns include maximum sales charges.
Class A: 4.25% maximum initial sales charge; Class C: 1% contingent deferred sales charge in first year only;
Advisor Class: no sales charges.
| | | | | | | | | | |
| Class A | | | 1-Year | | | 5-Year | | | 10-Year | |
| Cumulative Total Return1 | | | -1.90 | % | | +24.46 | % | | +41.60 | % |
| Average Annual Total Return2 | | | -6.08 | % | | +3.57 | % | | +3.09 | % |
| Avg. Ann. Total Return (3/31/14)3 | | | -5.29 | % | | +3.59 | % | | +3.17 | % |
| Distribution Rate4 | 3.96 | % | | | | | | | | |
| Taxable Equivalent Distribution Rate5 | 7.33 | % | | | | | | | | |
| 30-Day Standardized Yield6 | 3.28 | % | | | | | | | | |
| Taxable Equivalent Yield5 | 6.07 | % | | | | | | | | |
| Total Annual Operating Expenses7 | 0.63 | % | | | | | | | | |
| Class C | | | 1-Year | | | 5-Year | | | 10-Year | |
| Cumulative Total Return1 | | | -2.42 | % | | +21.08 | % | | +34.07 | % |
| Average Annual Total Return2 | | | -3.36 | % | | +3.90 | % | | +2.98 | % |
| Avg. Ann. Total Return (3/31/14)3 | | | -2.67 | % | | +3.92 | % | | +3.05 | % |
| Distribution Rate4 | 3.56 | % | | | | | | | | |
| Taxable Equivalent Distribution Rate5 | 6.59 | % | | | | | | | | |
| 30-Day Standardized Yield6 | 2.89 | % | | | | | | | | |
| Taxable Equivalent Yield5 | 5.35 | % | | | | | | | | |
| Total Annual Operating Expenses7 | 1.18 | % | | | | | | | | |
| Advisor Class8 | | | 1-Year | | | 5-Year | | | 10-Year | |
| Cumulative Total Return1 | | | -1.80 | % | | +25.24 | % | | +42.70 | % |
| Average Annual Total Return2 | | | -1.80 | % | | +4.60 | % | | +3.62 | % |
| Avg. Ann. Total Return (3/31/14)3 | | | -1.02 | % | | +4.63 | % | | +3.70 | % |
| Distribution Rate4 | 4.21 | % | | | | | | | | |
| Taxable Equivalent Distribution Rate5 | 7.79 | % | | | | | | | | |
| 30-Day Standardized Yield6 | 3.68 | % | | | | | | | | |
| Taxable Equivalent Yield5 | 6.81 | % | | | | | | | | |
| Total Annual Operating Expenses7 | 0.53 | % | | | | | | | | |
Performance data represent past performance, which does not guarantee future results. Investment return and principal
value will fluctuate, and you may have a gain or loss when you sell your shares. Current performance may differ from
figures shown. For most recent month-end performance, go to franklintempleton.com or call (800) 342-5236.
42 | Annual Report
Performance Summary (continued)
Total Return Index Comparison for a Hypothetical $10,000 Investment
Total return represents the change in value of an investment over the periods shown. It includes any applicable maximum sales charge, Fund expenses, account fees and reinvested distributions. The unmanaged index includes reinvestment of any income or distributions. It differs from the Fund in composition and does not pay management fees or expenses. One cannot invest directly in an index.
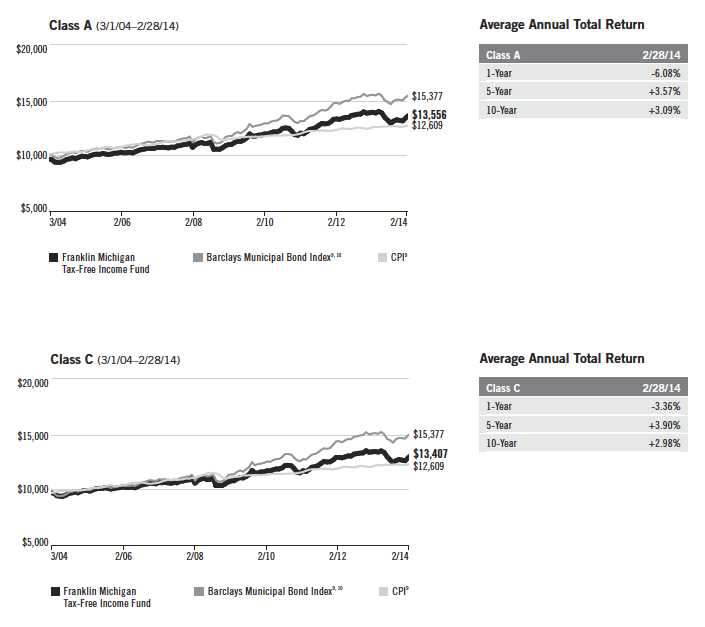
Annual Report | 43
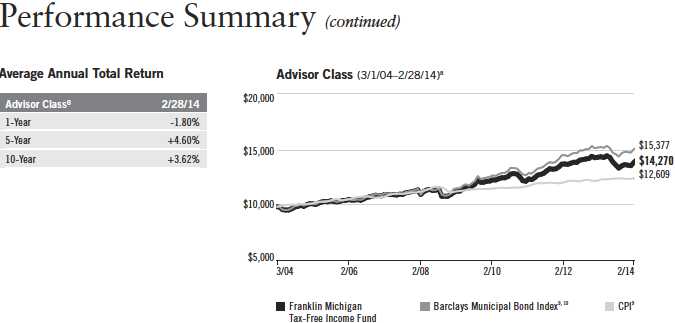
All investments involve risks, including possible loss of principal. Because municipal bonds are sensitive to interest rate movements, the Fund’s
yield and share price will fluctuate with market conditions. Bond prices generally move in the opposite direction of interest rates. Thus, as
prices of bonds in the Fund adjust to a rise in interest rates, the Fund’s share price may decline. Because the Fund invests principally in a
single state, it is subject to greater risk of adverse economic and regulatory changes in that state than a geographically diversified fund.
The Fund holds a small portion of its assets in Puerto Rico municipal bonds that have been impacted by recent adverse economic and market
changes, which may cause the Fund’s share price to decline. Changes in the credit rating of a bond, or in the credit rating or financial strength
of a bond’s issuer, insurer or guarantor, may affect the bond’s value. The Fund may invest a significant part of its assets in municipal securities
that finance similar types of projects, such as utilities, hospitals, higher education and transportation. A change that affects one project would
likely affect all similar projects, thereby increasing market risk. The Fund is actively managed but there is no guarantee that the manager’s
investment decisions will produce the desired results. The Fund’s prospectus also includes a description of the main investment risks.
Class C: These shares have higher annual fees and expenses than Class A shares.
Advisor Class: Shares are available to certain eligible investors as described in the prospectus.
1. Cumulative total return represents the change in value of an investment over the periods indicated.
2. Average annual total return represents the average annual change in value of an investment over the periods indicated.
3. In accordance with SEC rules, we provide standardized average annual total return information through the latest calendar quarter.
4. Distribution rate is based on an annualization of the respective class’s February dividend and the maximum offering price (NAV for Classes C and
Advisor) per share on 2/28/14.
5. Taxable equivalent distribution rate and yield assume the published rates as of 12/18/13 for the maximum combined effective federal and
Michigan personal income tax rate of 45.97%, based on the federal income tax rate of 39.60% plus 3.8% Medicare tax.
6. The 30-day standardized yield for the month ended 2/28/14 reflects an estimated yield to maturity (assuming all portfolio securities are held to
maturity). It should be regarded as an estimate of the Fund’s rate of investment income, and it may not equal the Fund’s actual income distribution
rate (which reflects the Fund’s past dividends paid to shareholders) or the income reported in the Fund’s financial statements.
7. Figures are as stated in the Fund’s current prospectus. In periods of market volatility, assets may decline significantly, causing total annual Fund
operating expenses to become higher than the figures shown.
8. Effective 7/1/08, the Fund began offering Advisor Class shares, which do not have sales charges or a Rule 12b-1 plan. Performance quotations for
this class reflect the following methods of calculation: (a) For periods prior to 7/1/08, a restated figure is used based upon the Fund’s Class A per-
formance, excluding the effect of Class A’s maximum initial sales charge, but reflecting the effect of the Class A Rule 12b-1 fees; and (b) for periods
after 7/1/08, actual Advisor Class performance is used reflecting all charges and fees applicable to that class. Since 7/1/08 (commencement of
sales), the cumulative and average annual total returns of Advisor Class shares were +24.09% and +3.88%.
9. Source: © 2014 Morningstar. The Barclays Municipal Bond Index is a market value-weighted index engineered for the long-term tax-exempt bond
market. To be included in the index, bonds must be fixed rate, have at least one year to final maturity and be rated investment grade (Baa3/BBB- or
higher) by at least two of the following agencies: Moody’s, Standard & Poor’s and Fitch. The Consumer Price Index (CPI), calculated by the Bureau of
Labor Statistics, is a commonly used measure of the inflation rate.
10. Source: Barclays Global Family of Indices. © 2014 Barclays Capital Inc. Used with permission.
44 | Annual Report
Your Fund’s Expenses
Franklin Michigan Tax-Free Income Fund
As a Fund shareholder, you can incur two types of costs:
- Transaction costs, including sales charges (loads) on Fund purchases; and
- Ongoing Fund costs, including management fees, distribution and service (12b-1) fees, and other Fund expenses. All mutual funds have ongoing costs, sometimes referred to as operating expenses.
The following table shows ongoing costs of investing in the Fund and can help you understand these costs and compare them with those of other mutual funds. The table assumes a $1,000 investment held for the six months indicated.
Actual Fund Expenses
The first line (Actual) for each share class listed in the table provides actual account values and expenses. The “Ending Account Value” is derived from the Fund’s actual return, which includes the effect of Fund expenses.
You can estimate the expenses you paid during the period by following these steps. Of course, your account value and expenses will differ from those in this illustration:
| 1. | Divide your account value by $1,000. |
| | If an account had an $8,600 value, then $8,600 ÷ $1,000 = 8.6. |
| 2. | Multiply the result by the number under the heading “Expenses Paid During Period.” |
| | If Expenses Paid During Period were $7.50, then 8.6 x $7.50 = $64.50. |
In this illustration, the estimated expenses paid this period are $64.50.
Hypothetical Example for Comparison with Other Funds
Information in the second line (Hypothetical) for each class in the table can help you compare ongoing costs of investing in the Fund with those of other mutual funds. This information may not be used to estimate the actual ending account balance or expenses you paid during the period. The hypothetical “Ending Account Value” is based on the actual expense ratio for each class and an assumed 5% annual rate of return before expenses, which does not represent the Fund’s actual return. The figure under the heading “Expenses Paid During Period” shows the hypothetical expenses your account would have incurred under this scenario. You can compare this figure with the 5% hypothetical examples that appear in shareholder reports of other funds.
Annual Report | 45
Your Fund’s Expenses (continued)
Please note that expenses shown in the table are meant to highlight ongoing costs and do not reflect any transaction costs, such as sales charges. Therefore, the second line for each class is useful in comparing ongoing costs only, and will not help you compare total costs of owning different funds. In addition, if transaction costs were included, your total costs would have been higher. Please refer to the Fund prospectus for additional information on operating expenses.
| | | | | | |
| | | Beginning Account | | Ending Account | | Expenses Paid During |
| Class A | | Value 9/1/13 | | Value 2/28/14 | | Period* 9/1/13–2/28/14 |
| Actual | $ | 1,000 | $ | 1,057.10 | $ | 3.32 |
| Hypothetical (5% return before expenses) | $ | 1,000 | $ | 1,021.57 | $ | 3.26 |
| Class C | | | | | | |
| Actual | $ | 1,000 | $ | 1,054.50 | $ | 6.11 |
| Hypothetical (5% return before expenses) | $ | 1,000 | $ | 1,018.84 | $ | 6.01 |
| Advisor Class | | | | | | |
| Actual | $ | 1,000 | $ | 1,057.40 | $ | 2.81 |
| Hypothetical (5% return before expenses) | $ | 1,000 | $ | 1,022.07 | $ | 2.76 |
*Expenses are calculated using the most recent six-month expense ratio, annualized for each class (A: 0.65%; C: 1.20%; and Advisor: 0.55%),
multiplied by the average account value over the period, multiplied by 181/365 to reflect the one-half year period.
46 | Annual Report
Franklin Minnesota Tax-Free Income Fund
Your Fund’s Goal and Main Investments: Franklin Minnesota Tax-Free Income Fund seeks to provide as high a level of income exempt from federal and Minnesota personal income taxes as is consistent with prudent investment management and preservation of capital by investing at least 80% of its total assets in securities that pay interest free from such taxes.1
Performance data represent past performance, which does not guarantee future results. Investment return and principal value will fluctuate, and you may have a gain or loss when you sell your shares. Current performance may differ from figures shown. Please visit franklintempleton.com or call (800) 342-5236 for most recent month-end performance.
| | |
| Credit Quality Breakdown* | | |
| Franklin Minnesota Tax-Free Income Fund | | |
| 2/28/14 | | |
| | % of Total | |
| Ratings | Long-Term Investments** | |
| AAA | 12.1 | % |
| AA | 69.2 | % |
| A | 18.5 | % |
| Below Investment Grade | 0.1 | % |
| Not Rated | 0.1 | % |
*Standard & Poor’s (S&P) is used as the primary independent rating agency source. Moody’s is secondary, and Fitch,
if available, is used for securities not rated by Moody’s or S&P. The ratings are an indication of an issuer’s credit-
worthiness, with long-term ratings typically ranging from AAA (highest) to Below Investment Grade (lowest; includes
ratings BB to D). This methodology differs from that used in Fund marketing materials.
**Does not include short-term investments and other net assets.
This annual report for Franklin Minnesota Tax-Free Income Fund covers the fiscal year ended February 28, 2014.
Performance Overview
The Fund’s Class A share price, as measured by net asset value, decreased from $12.98 on February 28, 2013, to $12.39 on February 28, 2014. The Fund’s Class A shares paid dividends totaling 39.62 cents per share for the same period.2 The Performance Summary beginning on page 51 shows that at the end of this reporting period the Fund’s Class A shares’ distribution rate was 3.16% based on an annualization of the 3.41 cent per share February dividend and the maximum offering price of $12.94 on February 28, 2014. An investor in the 2014 maximum combined effective federal and Minnesota personal
The dollar value, number of shares or principal amount, and names of all portfolio holdings are listed in the Fund’s Statement of Investments (SOI). The SOI begins on page 119.
Annual Report | 47
| | | |
| Dividend Distributions* | | | |
| Franklin Minnesota Tax-Free Income Fund | | | |
| 3/1/13–2/28/14 | | | |
| | Dividend per Share (cents) |
| Month | Class A | Class C | Advisor Class |
| March | 3.36 | 2.75 | 3.47 |
| April | 3.36 | 2.75 | 3.47 |
| May | 3.26 | 2.65 | 3.37 |
| June | 3.26 | 2.67 | 3.36 |
| July | 3.16 | 2.57 | 3.26 |
| August | 3.16 | 2.57 | 3.26 |
| September | 3.16 | 2.63 | 3.26 |
| October | 3.36 | 2.83 | 3.46 |
| November | 3.36 | 2.83 | 3.46 |
| December | 3.36 | 2.82 | 3.46 |
| January | 3.41 | 2.87 | 3.51 |
| February | 3.41 | 2.87 | 3.51 |
| Total | 39.62 | 32.81 | 40.85 |
*Assumes shares were purchased and held for the entire accrual period. Since dividends accrue daily, your actual dis-
tributions will vary depending on the date you purchased your shares and any account activity. All Fund distributions
will vary depending upon current market conditions, and past distributions are not indicative of future trends.
income tax bracket of 49.35% (including 3.8% Medicare tax) would need to earn a distribution rate of 6.24% from a taxable investment to match the Fund’s Class A tax-free distribution rate. For the Fund’s Class C and Advisor shares’ performance, please see the Performance Summary.
State Update
Increased economic activity in Minnesota helped state revenues exceed estimates in 2013. Minnesota’s economic growth rate was projected to outpace the nation’s in 2013 as employment gains, robust housing demand and new construction activity contributed to economic performance. This strength helped the state collect higher-than-expected individual income taxes and net receipts from sales and corporate taxes.
Minnesota’s lower employment rate also signaled the state’s continued recovery from the last recession. During the period, non-farm payrolls reached a prerecession peak following broad gains across job sectors. The state’s unemployment rate fell from 5.3% at the beginning of the period to 4.8% at period-end, well below the 6.7% national rate.3 Construction activity and the
48 | Annual Report
housing market improved during the period. Residential construction lifted construction payrolls, and residential building permits increased at a faster pace than the nation’s. Home sales climbed, housing prices approached their prerecession peak and the number of days a home listing stayed on the market declined. Commercial construction activity received a boost from construction beginning on a nearly $1 billion football stadium. In addition, the Mayo Clinic was in the planning stage to expand its St. Mary’s Hospital. Although the manufacturing sector lagged other job sectors, manufacturing activity grew in the third quarter of 2013, the latest period for which data were available.
Minnesota’s net tax-supported debt was 3.0% of personal income and $1,315 per capita, compared with the national medians of 2.8% and $1,074.4 Independent credit rating agency Moody’s Investors Service assigned Minnesota’s general obligation debt a rating of Aa1 with a stable outlook, which reflected Moody’s view of the state’s revenue growth, strengthened budget reserves and sound financial practices.5 Moody’s also noted Minnesota’s budget management initiatives, which included financing bonds to close the budget gap and adopting pension solutions to increase employee contributions and reduce employee pension benefits. Minnesota’s budget reserves were fully funded for the first time since 2008, and the state forecast a surplus by the end of fiscal year 2015.
| | |
| Portfolio Breakdown | | |
| Franklin Minnesota Tax-Free Income Fund | |
| 2/28/14 | | |
| % of Total | |
| Long-Term Investments* | |
| General Obligation | 34.9 | % |
| Hospital & Health Care | 19.2 | % |
| Utilities | 13.7 | % |
| Higher Education | 7.0 | % |
| Tax-Supported | 6.5 | % |
| Transportation | 5.9 | % |
| Subject to Government Appropriations | 5.5 | % |
| Housing | 3.8 | % |
| Refunded | 2.6 | % |
| Other Revenue | 0.9 | % |
| |
| *Does not include short-term investments and other | |
| net assets. | | |
Manager’s Discussion
We used various investment strategies during the 12 months under review as we sought to maximize tax-free income for shareholders. Puerto Rico’s municipal bond market is widely traded because of its federal and state tax-exemption advantages. During the reporting period, some Puerto Rico issuers experienced a series of downgrades from Standard & Poor’s, Moody’s and Fitch Ratings. In February 2014, these credit rating firms downgraded their respective ratings of Puerto Rico’s general obligation debt to below investment grade, along with the ratings of certain related Puerto Rico issuers. Additionally, each rating agency maintained a negative outlook on certain Puerto Rico issuers, and further downgrades are possible. The Fund is not required to sell securities that have been downgraded to below investment grade, but it is prohibited from making further purchases of such securities as long as the securities are not rated investment grade by at least one U.S. nationally recognized rating service. Rating actions combined with news related to the commonwealth’s financial position and future financing endeavors caused the Puerto Rico bond market to experience sharp declines in the latter half of 2013 and contrasting positive performance year-to-date in 2014.
Annual Report | 49
Thank you for your continued participation in Franklin Minnesota Tax-Free Income Fund. We believe our conservative, buy-and-hold investment strategy can help us achieve high, current, tax-free income for shareholders.
The foregoing information reflects our analysis, opinions and portfolio holdings as of February 28, 2014, the end
of the reporting period. The way we implement our main investment strategies and the resulting portfolio holdings
may change depending on factors such as market and economic conditions. These opinions may not be relied upon
as investment advice or an offer for a particular security. The information is not a complete analysis of every aspect
of any market, state, industry, security or the Fund. Statements of fact are from sources considered reliable, but
the investment manager makes no representation or warranty as to their completeness or accuracy. Although
historical performance is no guarantee of future results, these insights may help you understand our investment
management philosophy.
1. For investors subject to alternative minimum tax, a small portion of Fund dividends may be taxable. Distributions
of capital gains are generally taxable. To avoid imposition of 28% backup withholding on all Fund distributions and
redemption proceeds, U.S. investors must be properly certified on Form W-9 and non-U.S. investors on Form W-8BEN.
2. All Fund distributions will vary depending upon current market conditions, and past distributions are not indicative
of future trends.
3. Source: Bureau of Labor Statistics.
4. Source: Moody’s Investors Service, “2013 State Debt Medians Report,” 5/29/13.
5. This does not indicate Moody’s rating of the Fund.
50 | Annual Report
Performance Summary as of 2/28/14
Franklin Minnesota Tax-Free Income Fund
Your dividend income will vary depending on dividends or interest paid by securities in the Fund’s portfolio, adjusted for operating expenses of each class. Capital gain distributions are net profits realized from the sale of portfolio securities. The performance table and graphs do not reflect any taxes that a shareholder would pay on Fund dividends, capital gain distributions, if any, or any realized gains on the sale of Fund shares. Total return reflects reinvestment of the Fund’s dividends and capital gain distributions, if any, and any unrealized gains or losses.
| | | | | | | | |
| Price and Distribution Information | | | | | | |
| Class A (Symbol: FMINX) | | | | Change | | 2/28/14 | | 2/28/13 |
| Net Asset Value (NAV) | | | -$ | 0.59 | $ | 12.39 | $ | 12.98 |
| Distributions (3/1/13–2/28/14) | | | | | | | | |
| Dividend Income | $ | 0.3962 | | | | | | |
| Class C (Symbol: FMNIX) | | | | Change | | 2/28/14 | | 2/28/13 |
| Net Asset Value (NAV) | | | -$ | 0.59 | $ | 12.51 | $ | 13.10 |
| Distributions (3/1/13–2/28/14) | | | | | | | | |
| Dividend Income | $ | 0.3281 | | | | | | |
| Advisor Class (Symbol: FMNZX) | | | | Change | | 2/28/14 | | 2/28/13 |
| Net Asset Value (NAV) | | | -$ | 0.59 | $ | 12.40 | $ | 12.99 |
| Distributions (3/1/13–2/28/14) | | | | | | | | |
| Dividend Income | $ | 0.4085 | | | | | | |
Annual Report | 51
Performance Summary (continued)
Performance
Cumulative total return excludes sales charges. Average annual total returns include maximum sales charges.
Class A: 4.25% maximum initial sales charge; Class C: 1% contingent deferred sales charge in first year only;
Advisor Class: no sales charges.
| | | | | | | | | | |
| Class A | | | 1-Year | | | 5-Year | | | 10-Year | |
| Cumulative Total Return1 | | | -1.45 | % | | +25.59 | % | | +47.50 | % |
| Average Annual Total Return2 | | | -5.66 | % | | +3.76 | % | | +3.51 | % |
| Avg. Ann. Total Return (3/31/14)3 | | | -4.95 | % | | +3.69 | % | | +3.55 | % |
| Distribution Rate4 | 3.16 | % | | | | | | | | |
| Taxable Equivalent Distribution Rate5 | 6.24 | % | | | | | | | | |
| 30-Day Standardized Yield6 | 2.20 | % | | | | | | | | |
| Taxable Equivalent Yield5 | 4.34 | % | | | | | | | | |
| Total Annual Operating Expenses7 | 0.64 | % | | | | | | | | |
| Class C | | | 1-Year | | | 5-Year | | | 10-Year | |
| Cumulative Total Return1 | | | -1.97 | % | | +22.24 | % | | +39.64 | % |
| Average Annual Total Return2 | | | -2.92 | % | | +4.10 | % | | +3.40 | % |
| Avg. Ann. Total Return (3/31/14)3 | | | -2.31 | % | | +4.01 | % | | +3.44 | % |
| Distribution Rate4 | 2.75 | % | | | | | | | | |
| Taxable Equivalent Distribution Rate5 | 5.43 | % | | | | | | | | |
| 30-Day Standardized Yield6 | 1.75 | % | | | | | | | | |
| Taxable Equivalent Yield5 | 3.46 | % | | | | | | | | |
| Total Annual Operating Expenses7 | 1.19 | % | | | | | | | | |
| Advisor Class8 | | | 1-Year | | | 5-Year | | | 10-Year | |
| Cumulative Total Return1 | | | -1.35 | % | | +26.26 | % | | +48.29 | % |
| Average Annual Total Return2 | | | -1.35 | % | | +4.77 | % | | +4.02 | % |
| Avg. Ann. Total Return (3/31/14)3 | | | -0.65 | % | | +4.70 | % | | +4.06 | % |
| Distribution Rate4 | 3.40 | % | | | | | | | | |
| Taxable Equivalent Distribution Rate5 | 6.71 | % | | | | | | | | |
| 30-Day Standardized Yield6 | 2.46 | % | | | | | | | | |
| Taxable Equivalent Yield5 | 4.86 | % | | | | | | | | |
| Total Annual Operating Expenses7 | 0.54 | % | | | | | | | | |
Performance data represent past performance, which does not guarantee future results. Investment return and principal value will fluctuate, and you may have a gain or loss when you sell your shares. Current performance may differ from figures shown. For most recent month-end performance, go to franklintempleton.com or call (800) 342-5236.
52 | Annual Report
Performance Summary (continued)
Total Return Index Comparison for a Hypothetical $10,000 Investment
Total return represents the change in value of an investment over the periods shown. It includes any applicable maximum sales charge, Fund expenses, account fees and reinvested distributions. The unmanaged index includes reinvestment of any income or distributions. It differs from the Fund in composition and does not pay management fees or expenses. One cannot invest directly in an index.
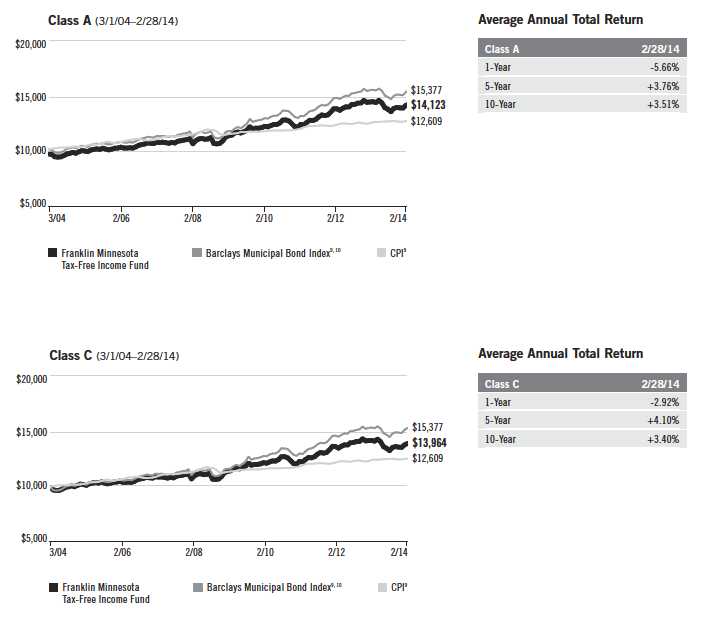
Annual Report | 53
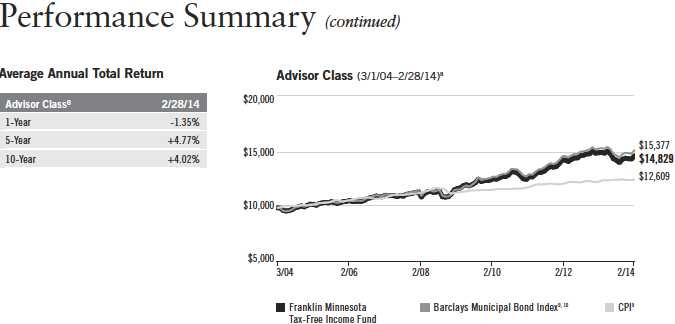
All investments involve risks, including possible loss of principal. Because municipal bonds are sensitive to interest rate movements, the Fund’s
yield and share price will fluctuate with market conditions. Bond prices generally move in the opposite direction of interest rates. Thus, as
prices of bonds in the Fund adjust to a rise in interest rates, the Fund’s share price may decline. Because the Fund invests principally in a
single state, it is subject to greater risk of adverse economic and regulatory changes in that state than a geographically diversified fund.
The Fund holds a small portion of its assets in Puerto Rico municipal bonds that have been impacted by recent adverse economic and market
changes, which may cause the Fund’s share price to decline. Changes in the credit rating of a bond, or in the credit rating or financial strength
of a bond’s issuer, insurer or guarantor, may affect the bond’s value. The Fund may invest a significant part of its assets in municipal securities
that finance similar types of projects, such as utilities, hospitals, higher education and transportation. A change that affects one project would
likely affect all similar projects, thereby increasing market risk. The Fund is actively managed but there is no guarantee that the manager’s
investment decisions will produce the desired results. The Fund’s prospectus also includes a description of the main investment risks.
Class C: These shares have higher annual fees and expenses than Class A shares.
Advisor Class: Shares are available to certain eligible investors as described in the prospectus.
1. Cumulative total return represents the change in value of an investment over the periods indicated.
2. Average annual total return represents the average annual change in value of an investment over the periods indicated.
3. In accordance with SEC rules, we provide standardized average annual total return information through the latest calendar quarter.
4. Distribution rate is based on an annualization of the respective class’s February dividend and the maximum offering price (NAV for Classes C and
Advisor) per share on 2/28/14.
5. Taxable equivalent distribution rate and yield assume the published rates as of 12/18/13 for the maximum combined effective federal and
Minnesota personal income tax rate of 49.35%, based on the federal income tax rate of 39.60% plus 3.8% Medicare tax.
6. The 30-day standardized yield for the month ended 2/28/14 reflects an estimated yield to maturity (assuming all portfolio securities are held to
maturity). It should be regarded as an estimate of the Fund’s rate of investment income, and it may not equal the Fund’s actual income distribution
rate (which reflects the Fund’s past dividends paid to shareholders) or the income reported in the Fund’s financial statements.
7. Figures are as stated in the Fund’s current prospectus. In periods of market volatility, assets may decline significantly, causing total annual Fund
operating expenses to become higher than the figures shown.
8. Effective 7/1/09, the Fund began offering Advisor Class shares, which do not have sales charges or a Rule 12b-1 plan. Performance quotations for
this class reflect the following methods of calculation: (a) For periods prior to 7/1/09, a restated figure is used based upon the Fund’s Class A per-
formance, excluding the effect of Class A’s maximum initial sales charge, but reflecting the effect of the Class A Rule 12b-1 fees; and (b) for periods
after 7/1/09, actual Advisor Class performance is used reflecting all charges and fees applicable to that class. Since 7/1/09 (commencement of
sales), the cumulative and average annual total returns of Advisor Class shares were +23.36% and +4.61%.
9. Source: © 2014 Morningstar. The Barclays Municipal Bond Index is a market value-weighted index engineered for the long-term tax-exempt bond
market. To be included in the index, bonds must be fixed rate, have at least one year to final maturity and be rated investment grade (Baa3/BBB- or
higher) by at least two of the following agencies: Moody’s, Standard & Poor’s and Fitch. The Consumer Price Index (CPI), calculated by the Bureau of
Labor Statistics, is a commonly used measure of the inflation rate.
10. Source: Barclays Global Family of Indices. © 2014 Barclays Capital Inc. Used with permission.
54 | Annual Report
Your Fund’s Expenses
Franklin Minnesota Tax-Free Income Fund
As a Fund shareholder, you can incur two types of costs:
- Transaction costs, including sales charges (loads) on Fund purchases; and
- Ongoing Fund costs, including management fees, distribution and service (12b-1) fees, and other Fund expenses. All mutual funds have ongoing costs, sometimes referred to as operating expenses.
The following table shows ongoing costs of investing in the Fund and can help you understand these costs and compare them with those of other mutual funds. The table assumes a $1,000 investment held for the six months indicated.
Actual Fund Expenses
The first line (Actual) for each share class listed in the table provides actual account values and expenses. The “Ending Account Value” is derived from the Fund’s actual return, which includes the effect of Fund expenses.
You can estimate the expenses you paid during the period by following these steps. Of course, your account value and expenses will differ from those in this illustration:
| 1. | Divide your account value by $1,000. |
| | If an account had an $8,600 value, then $8,600 ÷ $1,000 = 8.6. |
| 2. | Multiply the result by the number under the heading “Expenses Paid During Period.” |
| | If Expenses Paid During Period were $7.50, then 8.6 x $7.50 = $64.50. |
In this illustration, the estimated expenses paid this period are $64.50.
Hypothetical Example for Comparison with Other Funds
Information in the second line (Hypothetical) for each class in the table can help you compare ongoing costs of investing in the Fund with those of other mutual funds. This information may not be used to estimate the actual ending account balance or expenses you paid during the period. The hypothetical “Ending Account Value” is based on the actual expense ratio for each class and an assumed 5% annual rate of return before expenses, which does not represent the Fund’s actual return. The figure under the heading “Expenses Paid During Period” shows the hypothetical expenses your account would have incurred under this scenario. You can compare this figure with the 5% hypothetical examples that appear in shareholder reports of other funds.
Annual Report | 55
Your Fund’s Expenses (continued)
Please note that expenses shown in the table are meant to highlight ongoing costs and do not reflect any transaction costs, such as sales charges. Therefore, the second line for each class is useful in comparing ongoing costs only, and will not help you compare total costs of owning different funds. In addition, if transaction costs were included, your total costs would have been higher. Please refer to the Fund prospectus for additional information on operating expenses.
| | | | | | |
| | | Beginning Account | | Ending Account | | Expenses Paid During |
| Class A | | Value 9/1/13 | | Value 2/28/14 | | Period* 9/1/13–2/28/14 |
| Actual | $ | 1,000 | $ | 1,052.20 | $ | 3.36 |
| Hypothetical (5% return before expenses) | $ | 1,000 | $ | 1,021.52 | $ | 3.31 |
| Class C | | | | | | |
| Actual | $ | 1,000 | $ | 1,048.90 | $ | 6.15 |
| Hypothetical (5% return before expenses) | $ | 1,000 | $ | 1,018.79 | $ | 6.06 |
| Advisor Class | | | | | | |
| Actual | $ | 1,000 | $ | 1,052.60 | $ | 2.85 |
| Hypothetical (5% return before expenses) | $ | 1,000 | $ | 1,022.02 | $ | 2.81 |
*Expenses are calculated using the most recent six-month expense ratio, annualized for each class (A: 0.66%; C: 1.21%; and Advisor: 0.56%),
multiplied by the average account value over the period, multiplied by 181/365 to reflect the one-half year period.
56 | Annual Report
Franklin Ohio Tax-Free Income Fund
Your Fund’s Goal and Main Investments: Franklin Ohio Tax-Free Income Fund seeks to provide as high a level of income exempt from federal and Ohio personal income taxes as is consistent with prudent investment management and preservation of capital by investing at least 80% of its total assets in securities that pay interest free from such taxes.1
Performance data represent past performance, which does not guarantee future results. Investment return and principal value will fluctuate, and you may have a gain or loss when you sell your shares. Current performance may differ from figures shown. Please visit franklintempleton.com or call (800) 342-5236 for most recent month-end performance.
| | |
| Credit Quality Breakdown* | | |
| Franklin Ohio Tax-Free Income Fund | | |
| 2/28/14 | | |
| | % of Total | |
| Ratings | Long-Term Investments** | |
| AAA | 2.1 | % |
| AA | 73.1 | % |
| A | 20.9 | % |
| BBB | 2.2 | % |
| Below Investment Grade | 0.8 | % |
| Not Rated | 0.9 | % |
*Standard & Poor’s (S&P) is used as the primary independent rating agency source. Moody’s is secondary, and Fitch,
if available, is used for securities not rated by Moody’s or S&P. The ratings are an indication of an issuer’s credit-
worthiness, with long-term ratings typically ranging from AAA (highest) to Below Investment Grade (lowest; includes
ratings BB to D). This methodology differs from that used in Fund marketing materials.
**Does not include short-term investments and other net assets.
This annual report for Franklin Ohio Tax-Free Income Fund covers the fiscal year ended February 28, 2014.
Performance Overview
The Fund’s Class A share price, as measured by net asset value, decreased from $13.12 on February 28, 2013, to $12.44 on February 28, 2014. The Fund’s Class A shares paid dividends totaling 44.95 cents per share for the same period.2 The Performance Summary beginning on page 61 shows that at the end of this reporting period the Fund’s Class A shares’ distribution rate was
The dollar value, number of shares or principal amount, and names of all portfolio holdings are listed in the Fund’s
Statement of Investments (SOI). The SOI begins on page 129.
Annual Report | 57
| | | |
| Dividend Distributions* | | | |
| Franklin Ohio Tax-Free Income Fund | | | |
| 3/1/13–2/28/14 | | | |
| | Dividend per Share (cents) |
| Month | Class A | Class C | Advisor Class |
| March | 3.60 | 2.98 | 3.71 |
| April | 3.60 | 2.98 | 3.71 |
| May | 3.60 | 2.98 | 3.71 |
| June | 3.60 | 3.00 | 3.70 |
| July | 3.60 | 3.00 | 3.70 |
| August | 3.60 | 3.00 | 3.70 |
| September | 3.80 | 3.26 | 3.90 |
| October | 3.85 | 3.31 | 3.95 |
| November | 3.90 | 3.36 | 4.00 |
| December | 3.90 | 3.36 | 4.00 |
| January | 3.95 | 3.41 | 4.05 |
| February | 3.95 | 3.41 | 4.05 |
| Total | 44.95 | 38.05 | 46.18 |
*Assumes shares were purchased and held for the entire accrual period. Since dividends accrue daily, your actual dis-
tributions will vary depending on the date you purchased your shares and any account activity. All Fund distributions
will vary depending upon current market conditions, and past distributions are not indicative of future trends.
3.65% based on an annualization of the 3.95 cent per share February dividend and the maximum offering price of $12.99 on February 28, 2014. An investor in the 2014 maximum combined effective federal and Ohio personal income tax bracket of 46.66% (including 3.8% Medicare tax) would need to earn a distribution rate of 6.84% from a taxable investment to match the Fund’s Class A tax-free distribution rate. For the Fund’s Class C and Advisor shares’ performance, please see the Performance Summary.
State Update
Ohio’s broad economy enjoyed a robust recovery during the 12 months under review. Many major corporations from a variety of high-growth, high-demand sectors headquartered in the Columbus metropolitan area helped drive the state’s economic recovery. Ohio has also benefited in recent years from the recovery in automobile manufacturing and the growing exploration of the Marcellus and Utica oil shales, which have resulted in private investment in drilling, steel manufacturing and natural gas and petroleum processing. These conditions helped push the state’s unemployment rate to a five-year low of 6.5% at period-end.3 Improved labor market conditions stimulated the real estate market, which experienced increased sales and prices and decreased foreclosure levels.
58 | Annual Report
The state’s enacted fiscal 2014–2015 biennial budget included significant tax reform that could negatively impact revenues for the biennium. Key features included a personal income tax rate reduction financed by fiscal year 2013’s general fund balance and a sales tax increase. State officials also planned substantial changes to the key budget drivers, Medicaid and education. The state would fund the budget stabilization fund (BSF) at the 5% target, which independent credit rating agency Standard & Poor’s (S&P) viewed positively for the state’s credit rating. In January 2014, Ohio expanded its Medicaid coverage. Analysts believed the expansion would have minimal impact on the budget because the additional enrollment would be covered by federal funds in fiscal year 2014.
Ohio’s net tax-supported debt, at $1,047 per capita and 2.8% of personal income, was in line with the national medians of $1,074 and 2.8%.4 S&P affirmed Ohio’s AA+ general obligation rating with a stable outlook.5 The rating reflected S&P’s view of the state’s track record of proactive financial and budget management, improved revenue and budget performance, vast and diverse economic base, moderate debt levels and progress in funding other postemployment benefits. The outlook reflected S&P’s assessment of Ohio’s progress in achieving structural budget balance, steady economic growth that has led to revenue stabilization and BSF contributions and proactive responses to budget imbalances.
| | |
| Portfolio Breakdown | | |
| Franklin Ohio Tax-Free Income Fund | | |
| 2/28/14 | | |
| % of Total | |
| Long-Term Investments* | |
| General Obligation | 27.4 | % |
| Hospital & Health Care | 15.2 | % |
| Higher Education | 13.8 | % |
| Utilities | 11.7 | % |
| Refunded | 10.9 | % |
| Tax-Supported | 9.1 | % |
| Transportation | 5.0 | % |
| Other Revenue | 3.3 | % |
| Subject to Government Appropriations | 2.7 | % |
| Housing | 0.9 | % |
| |
| *Does not include short-term investments and other | |
| net assets. | | |
Manager’s Discussion
We used various investment strategies during the 12 months under review as we sought to maximize tax-free income for shareholders. Puerto Rico’s municipal bond market is widely traded because of its federal and state tax-exemption advantages. During the reporting period, some Puerto Rico issuers experienced a series of downgrades from S&P, Moody’s Investors Service and Fitch Ratings. In February 2014, these credit rating firms downgraded their respective ratings of Puerto Rico’s general obligation debt to below investment grade, along with the ratings of certain related Puerto Rico issuers. Additionally, each rating agency maintained a negative outlook on certain Puerto Rico issuers, and further downgrades are possible. The Fund is not required to sell securities that have been downgraded to below investment grade, but it is prohibited from making further purchases of such securities as long as the securities are not rated investment grade by at least one U.S. nationally recognized rating service. Rating actions combined with news related to the commonwealth’s financial position and future financing endeavors caused the Puerto Rico bond market to experience sharp declines in the latter half of 2013 and contrasting positive performance year-to-date in 2014.
Annual Report | 59
Thank you for your continued participation in Franklin Ohio Tax-Free Income Fund. We believe our conservative, buy-and-hold investment strategy can help us achieve high, current, tax-free income for shareholders.
The foregoing information reflects our analysis, opinions and portfolio holdings as of February 28, 2014, the end
of the reporting period. The way we implement our main investment strategies and the resulting portfolio holdings
may change depending on factors such as market and economic conditions. These opinions may not be relied upon
as investment advice or an offer for a particular security. The information is not a complete analysis of every aspect
of any market, state, industry, security or the Fund. Statements of fact are from sources considered reliable, but
the investment manager makes no representation or warranty as to their completeness or accuracy. Although
historical performance is no guarantee of future results, these insights may help you understand our investment
management philosophy.
1. For investors subject to alternative minimum tax, a small portion of Fund dividends may be taxable. Distributions
of capital gains are generally taxable. To avoid imposition of 28% backup withholding on all Fund distributions and
redemption proceeds, U.S. investors must be properly certified on Form W-9 and non-U.S. investors on Form W-8BEN.
2. All Fund distributions will vary depending upon current market conditions, and past distributions are not indicative
of future trends.
3. Source: Bureau of Labor Statistics.
4. Source: Moody’s Investors Service, “2013 State Debt Medians Report,” 5/29/13.
5. This does not indicate S&P’s rating of the Fund.
60 | Annual Report
Performance Summary as of 2/28/14
Franklin Ohio Tax-Free Income Fund
Your dividend income will vary depending on dividends or interest paid by securities in the Fund’s portfolio, adjusted for operating expenses of each class. Capital gain distributions are net profits realized from the sale of portfolio securities. The performance table and graphs do not reflect any taxes that a shareholder would pay on Fund dividends, capital gain distributions, if any, or any realized gains on the sale of Fund shares. Total return reflects reinvestment of the Fund’s dividends and capital gain distributions, if any, and any unrealized gains or losses.
| | | | | | | | |
| Price and Distribution Information | | | | | | |
| Class A (Symbol: FTOIX) | | | | Change | | 2/28/14 | | 2/28/13 |
| Net Asset Value (NAV) | | | -$ | 0.68 | $ | 12.44 | $ | 13.12 |
| Distributions (3/1/13–2/28/14) | | | | | | | | |
| Dividend Income | $ | 0.4495 | | | | | | |
| Class C (Symbol: FOITX) | | | | Change | | 2/28/14 | | 2/28/13 |
| Net Asset Value (NAV) | | | -$ | 0.69 | $ | 12.58 | $ | 13.27 |
| Distributions (3/1/13–2/28/14) | | | | | | | | |
| Dividend Income | $ | 0.3805 | | | | | | |
| Advisor Class (Symbol: FROZX) | | | | Change | | 2/28/14 | | 2/28/13 |
| Net Asset Value (NAV) | | | -$ | 0.68 | $ | 12.44 | $ | 13.12 |
| Distributions (3/1/13–2/28/14) | | | | | | | | |
| Dividend Income | $ | 0.4618 | | | | | | |
Annual Report | 61
Performance Summary (continued)
Performance
Cumulative total return excludes sales charges. Average annual total returns include maximum sales charges.
Class A: 4.25% maximum initial sales charge; Class C: 1% contingent deferred sales charge in first year only;
Advisor Class: no sales charges.
| | | | | | | | | | |
| Class A | | | 1-Year | | | 5-Year | | | 10-Year | |
| Cumulative Total Return1 | | | -1.69 | % | | +25.22 | % | | +45.97 | % |
| Average Annual Total Return2 | | | -5.85 | % | | +3.69 | % | | +3.40 | % |
| Avg. Ann. Total Return (3/31/14)3 | | | -4.83 | % | | +3.67 | % | | +3.50 | % |
| Distribution Rate4 | 3.65 | % | | | | | | | | |
| Taxable Equivalent Distribution Rate5 | 6.84 | % | | | | | | | | |
| 30-Day Standardized Yield6 | 2.99 | % | | | | | | | | |
| Taxable Equivalent Yield5 | 5.61 | % | | | | | | | | |
| Total Annual Operating Expenses7 | 0.63 | % | | | | | | | | |
| Class C | | | 1-Year | | | 5-Year | | | 10-Year | |
| Cumulative Total Return1 | | | -2.28 | % | | +21.83 | % | | +38.21 | % |
| Average Annual Total Return2 | | | -3.23 | % | | +4.03 | % | | +3.29 | % |
| Avg. Ann. Total Return (3/31/14)3 | | | -2.08 | % | | +4.03 | % | | +3.39 | % |
| Distribution Rate4 | 3.25 | % | | | | | | | | |
| Taxable Equivalent Distribution Rate5 | 6.09 | % | | | | | | | | |
| 30-Day Standardized Yield6 | 2.58 | % | | | | | | | | |
| Taxable Equivalent Yield5 | 4.84 | % | | | | | | | | |
| Total Annual Operating Expenses7 | 1.18 | % | | | | | | | | |
| Advisor Class8 | | | 1-Year | | | 5-Year | | | 10-Year | |
| Cumulative Total Return1 | | | -1.59 | % | | +25.84 | % | | +46.78 | % |
| Average Annual Total Return2 | | | -1.59 | % | | +4.70 | % | | +3.91 | % |
| Avg. Ann. Total Return (3/31/14)3 | | | -0.49 | % | | +4.70 | % | | +4.00 | % |
| Distribution Rate4 | 3.91 | % | | | | | | | | |
| Taxable Equivalent Distribution Rate5 | 7.33 | % | | | | | | | | |
| 30-Day Standardized Yield6 | 3.23 | % | | | | | | | | |
| Taxable Equivalent Yield5 | 6.06 | % | | | | | | | | |
| Total Annual Operating Expenses7 | 0.53 | % | | | | | | | | |
Performance data represent past performance, which does not guarantee future results. Investment return and principal
value will fluctuate, and you may have a gain or loss when you sell your shares. Current performance may differ from
figures shown. For most recent month-end performance, go to franklintempleton.com or call (800) 342-5236.
62 | Annual Report
Performance Summary (continued)
Total Return Index Comparison for a Hypothetical $10,000 Investment
Total return represents the change in value of an investment over the periods shown. It includes any applicable maximum sales charge, Fund expenses, account fees and reinvested distributions. The unmanaged index includes reinvestment of any income or distributions. It differs from the Fund in composition and does not pay management fees or expenses. One cannot invest directly in an index.

Annual Report | 63
Performance Summary (continued)
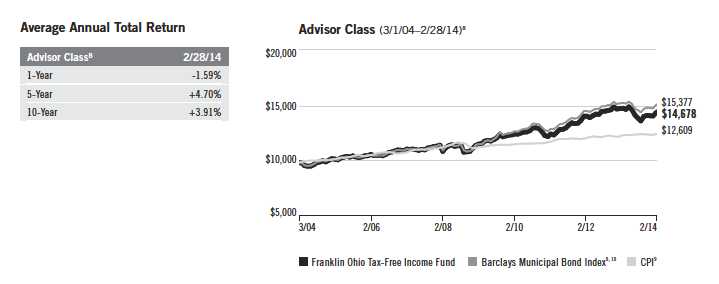
All investments involve risks, including possible loss of principal. Because municipal bonds are sensitive to interest rate movements, the Fund’s
yield and share price will fluctuate with market conditions. Bond prices generally move in the opposite direction of interest rates. Thus, as
prices of bonds in the Fund adjust to a rise in interest rates, the Fund’s share price may decline. Because the Fund invests principally in a
single state, it is subject to greater risk of adverse economic and regulatory changes in that state than a geographically diversified fund.
The Fund holds a small portion of its assets in Puerto Rico municipal bonds that have been impacted by recent adverse economic and market
changes, which may cause the Fund’s share price to decline. Changes in the credit rating of a bond, or in the credit rating or financial strength
of a bond’s issuer, insurer or guarantor, may affect the bond’s value. The Fund may invest a significant part of its assets in municipal securities
that finance similar types of projects, such as utilities, hospitals, higher education and transportation. A change that affects one project would
likely affect all similar projects, thereby increasing market risk. The Fund is actively managed but there is no guarantee that the manager’s
investment decisions will produce the desired results. The Fund’s prospectus also includes a description of the main investment risks.
Class C: These shares have higher annual fees and expenses than Class A shares.
Advisor Class: Shares are available to certain eligible investors as described in the prospectus.
1. Cumulative total return represents the change in value of an investment over the periods indicated.
2. Average annual total return represents the average annual change in value of an investment over the periods indicated.
3. In accordance with SEC rules, we provide standardized average annual total return information through the latest calendar quarter.
4. Distribution rate is based on an annualization of the respective class’s February dividend and the maximum offering price (NAV for Classes C and
Advisor) per share on 2/28/14.
5. Taxable equivalent distribution rate and yield assume the published rates as of 12/18/13 for the maximum combined effective federal and Ohio
personal income tax rate of 46.66%, based on the federal income tax rate of 39.60% plus 3.8% Medicare tax.
6. The 30-day standardized yield for the month ended 2/28/14 reflects an estimated yield to maturity (assuming all portfolio securities are held to
maturity). It should be regarded as an estimate of the Fund’s rate of investment income, and it may not equal the Fund’s actual income distribution
rate (which reflects the Fund’s past dividends paid to shareholders) or the income reported in the Fund’s financial statements.
7. Figures are as stated in the Fund’s current prospectus. In periods of market volatility, assets may decline significantly, causing total annual Fund
operating expenses to become higher than the figures shown.
8. Effective 7/1/08, the Fund began offering Advisor Class shares, which do not have sales charges or a Rule 12b-1 plan. Performance quotations for
this class reflect the following methods of calculation: (a) For periods prior to 7/1/08, a restated figure is used based upon the Fund’s Class A per-
formance, excluding the effect of Class A’s maximum initial sales charge, but reflecting the effect of the Class A Rule 12b-1 fees; and (b) for periods
after 7/1/08, actual Advisor Class performance is used reflecting all charges and fees applicable to that class. Since 7/1/08 (commencement of
sales), the cumulative and average annual total returns of Advisor Class shares were +27.57% and +4.39%.
9. Source: © 2014 Morningstar. The Barclays Municipal Bond Index is a market value-weighted index engineered for the long-term tax-exempt bond
market. To be included in the index, bonds must be fixed rate, have at least one year to final maturity and be rated investment grade (Baa3/BBB- or
higher) by at least two of the following agencies: Moody’s, Standard & Poor’s and Fitch. The Consumer Price Index (CPI), calculated by the Bureau of
Labor Statistics, is a commonly used measure of the inflation rate.
10. Source: Barclays Global Family of Indices. © 2014 Barclays Capital Inc. Used with permission.
64 | Annual Report
Your Fund’s Expenses
Franklin Ohio Tax-Free Income Fund
As a Fund shareholder, you can incur two types of costs:
- Transaction costs, including sales charges (loads) on Fund purchases; and
- Ongoing Fund costs, including management fees, distribution and service (12b-1) fees, and other Fund expenses. All mutual funds have ongoing costs, sometimes referred to as operating expenses.
The following table shows ongoing costs of investing in the Fund and can help you understand these costs and compare them with those of other mutual funds. The table assumes a $1,000 investment held for the six months indicated.
Actual Fund Expenses
The first line (Actual) for each share class listed in the table provides actual account values and expenses. The “Ending Account Value” is derived from the Fund’s actual return, which includes the effect of Fund expenses.
You can estimate the expenses you paid during the period by following these steps. Of course, your account value and expenses will differ from those in this illustration:
| 1. | Divide your account value by $1,000. |
| | If an account had an $8,600 value, then $8,600 ÷ $1,000 = 8.6. |
| 2. | Multiply the result by the number under the heading “Expenses Paid During Period.” |
| | If Expenses Paid During Period were $7.50, then 8.6 x $7.50 = $64.50. |
In this illustration, the estimated expenses paid this period are $64.50.
Hypothetical Example for Comparison with Other Funds
Information in the second line (Hypothetical) for each class in the table can help you compare ongoing costs of investing in the Fund with those of other mutual funds. This information may not be used to estimate the actual ending account balance or expenses you paid during the period. The hypothetical “Ending Account Value” is based on the actual expense ratio for each class and an assumed 5% annual rate of return before expenses, which does not represent the Fund’s actual return. The figure under the heading “Expenses Paid During Period” shows the hypothetical expenses your account would have incurred under this scenario. You can compare this figure with the 5% hypothetical examples that appear in shareholder reports of other funds.
Annual Report | 65
Your Fund’s Expenses (continued)
Please note that expenses shown in the table are meant to highlight ongoing costs and do not reflect any transaction costs, such as sales charges. Therefore, the second line for each class is useful in comparing ongoing costs only, and will not help you compare total costs of owning different funds. In addition, if transaction costs were included, your total costs would have been higher. Please refer to the Fund prospectus for additional information on operating expenses.
| | | | | | |
| | | Beginning Account | | Ending Account | | Expenses Paid During |
| Class A | | Value 9/1/13 | | Value 2/28/14 | | Period* 9/1/13–2/28/14 |
| Actual | $ | 1,000 | $ | 1,065.50 | $ | 3.33 |
| Hypothetical (5% return before expenses) | $ | 1,000 | $ | 1,021.57 | $ | 3.26 |
| Class C | | | | | | |
| Actual | $ | 1,000 | $ | 1,061.90 | $ | 6.13 |
| Hypothetical (5% return before expenses) | $ | 1,000 | $ | 1,018.84 | $ | 6.01 |
| Advisor Class | | | | | | |
| Actual | $ | 1,000 | $ | 1,066.00 | $ | 2.82 |
| Hypothetical (5% return before expenses) | $ | 1,000 | $ | 1,022.07 | $ | 2.76 |
*Expenses are calculated using the most recent six-month expense ratio, annualized for each class (A: 0.65%; C: 1.20%; and Advisor: 0.55%),
multiplied by the average account value over the period, multiplied by 181/365 to reflect the one-half year period.
66 | Annual Report
Franklin Oregon Tax-Free Income Fund
Your Fund’s Goal and Main Investments: Franklin Oregon Tax-Free Income Fund
seeks to provide as high a level of income exempt from federal and Oregon personal income taxes as is consistent with prudent investment management and preservation of capital by investing at least 80% of its net assets in securities that pay interest free from such taxes.1
| | |
| Credit Quality Breakdown* | | |
| Franklin Oregon Tax-Free Income Fund | | |
| 2/28/14 | | |
| | % of Total | |
| Ratings | Long-Term Investments** | |
| AAA | 13.7 | % |
| AA | 47.1 | % |
| A | 24.9 | % |
| BBB | 8.5 | % |
| Below Investment Grade | 5.7 | % |
| Not Rated | 0.1 | % |
*Standard & Poor’s (S&P) is used as the primary independent rating agency source. Moody’s is secondary, and Fitch,
if available, is used for securities not rated by Moody’s or S&P. The ratings are an indication of an issuer’s credit-
worthiness, with long-term ratings typically ranging from AAA (highest) to Below Investment Grade (lowest; includes
ratings BB to D). This methodology differs from that used in Fund marketing materials.
**Does not include short-term investments and other net assets.
This annual report for Franklin Oregon Tax-Free Income Fund covers the fiscal year ended February 28, 2014.
Performance data represent past performance, which does not guarantee future results. Investment return and principal value will fluctuate, and you may have a gain or loss when you sell your shares. Current performance may differ from figures shown. Please visit franklintempleton.com or call (800) 342-5236 for most recent month-end performance.
Performance Overview
The Fund’s Class A share price, as measured by net asset value, decreased from $12.58 on February 28, 2013, to $11.69 on February 28, 2014. The Fund’s Class A shares paid dividends totaling 44.39 cents per share for the same period.2 The Performance Summary beginning on page 71 shows that at the end of this reporting period the Fund’s Class A shares’ distribution rate was 3.90% based on an annualization of the 3.97 cent per share February dividend and the maximum offering price of $12.21 on February 28, 2014. An investor in the 2014 maximum combined effective federal and Oregon personal income
The dollar value, number of shares or principal amount, and names of all portfolio holdings are listed in the Fund’s Statement of Investments (SOI). The SOI begins on page 140.
Annual Report | 67
| | | |
| Dividend Distributions* | | | |
| Franklin Oregon Tax-Free Income Fund | | | |
| 3/1/13–2/28/14 | | | |
| | Dividend per Share (cents) |
| Month | Class A | Class C | Advisor Class |
| March | 3.52 | 2.92 | 3.62 |
| April | 3.52 | 2.92 | 3.62 |
| May | 3.52 | 2.92 | 3.62 |
| June | 3.52 | 2.95 | 3.62 |
| July | 3.52 | 2.95 | 3.62 |
| August | 3.52 | 2.95 | 3.62 |
| September | 3.67 | 3.15 | 3.76 |
| October | 3.87 | 3.35 | 3.96 |
| November | 3.92 | 3.40 | 4.01 |
| December | 3.92 | 3.42 | 4.02 |
| January | 3.92 | 3.42 | 4.02 |
| February | 3.97 | 3.47 | 4.07 |
| Total | 44.39 | 37.82 | 45.56 |
*Assumes shares were purchased and held for the entire accrual period. Since dividends accrue daily, your actual dis-
tributions will vary depending on the date you purchased your shares and any account activity. All Fund distributions
will vary depending upon current market conditions, and past distributions are not indicative of future trends.
tax bracket of 49.38% (including 3.8% Medicare tax) would need to earn a distribution rate of 7.70% from a taxable investment to match the Fund’s Class A tax-free distribution rate. For the Fund’s Class C and Advisor shares’ performance, please see the Performance Summary.
State Update
Oregon’s economy grew during the 12 months under review based on a number of economic measures, including industrial production, unemployment rate and wages. Manufacturing activity also increased, which was encouraging given a large manufacturing base. State exports remained near a historical high level and in the housing sector, new housing permits increased as housing starts were notably higher than the lows reached in 2009 and 2010.
The private sector led employment gains, including the construction, professional and business services and mining and logging sectors. Encouragingly, job growth began to spread across more sectors and from Portland to more areas of the state. Job growth accelerated at its fastest pace since the mid-2000s, and
68 | Annual Report
initial unemployment claims declined toward the end of 2013. Although the public sector lost jobs during 2013, the reductions were the lowest in three years. According to the Federal Reserve Bank of Philadelphia, Oregon was one of the leading states in adding jobs in the fourth quarter of 2013 and, as of period-end, Oregon had added jobs in 22 of the past 25 months.
Although Oregon’s economy expanded, tax collections trailed forecasted totals in the second half of 2013 and early 2014. For example, lower estimated personal income tax payments in December 2013 and early 2014 weighed on collected state revenues. Lower estate taxes, video lottery sales and cigarette taxes also detracted from collections. Even so, corporate tax revenues remained robust.
The state’s net-tax supported debt was 5.2% of personal income and $1,945 per capita, compared with the national medians of 2.8% and $1,074.3 Independent credit rating agency Moody’s Investors Service maintained its Aa1 rating and stable outlook for Oregon’s general obligation debt.4 The rating and outlook reflected Moody’s assessment of the state’s sensible financial controls, executive authority to limit spending and funding ratios in the state retirement system and cash reserves. However, Moody’s cited the reliance on variable personal income taxes and above-average debt ratios as challenges.
| | |
| Portfolio Breakdown | | |
| Franklin Oregon Tax-Free Income Fund | |
| 2/28/14 | | |
| % of Total | |
| Long-Term Investments* | |
| General Obligation | 26.9 | % |
| Hospital & Health Care | 19.8 | % |
| Refunded | 12.7 | % |
| Utilities | 9.8 | % |
| Tax-Supported | 9.3 | % |
| Transportation | 8.6 | % |
| Higher Education | 6.3 | % |
| Other Revenue | 2.7 | % |
| Housing | 2.2 | % |
| Subject to Government Appropriations | 1.7 | % |
| |
| *Does not include short-term investments and other | |
| net assets. | | |
Manager’s Discussion
We used various investment strategies during the 12 months under review as we sought to maximize tax-free income for shareholders. Puerto Rico’s municipal bond market is widely traded because of its federal and state tax-exemption advantages. During the reporting period, some Puerto Rico issuers experienced a series of downgrades from Standard & Poor’s, Moody’s and Fitch Ratings. In February 2014, these credit rating firms downgraded their respective ratings of Puerto Rico’s general obligation debt to below investment grade, along with the ratings of certain related Puerto Rico issuers. Additionally, each rating agency maintained a negative outlook on certain Puerto Rico issuers, and further downgrades are possible. The Fund is not required to sell securities that have been downgraded to below investment grade, but it is prohibited from making further purchases of such securities as long as the securities are not rated investment grade by at least one U.S. nationally recognized rating service. Rating actions combined with news related to the commonwealth’s financial position and future financing endeavors caused the Puerto Rico bond market to experience sharp declines in the latter half of 2013 and contrasting positive performance year-to-date in 2014.
Annual Report | 69
Thank you for your continued participation in Franklin Oregon Tax-Free Income Fund. We believe our conservative, buy-and-hold investment strategy can help us achieve high, current, tax-free income for shareholders.
The foregoing information reflects our analysis, opinions and portfolio holdings as of February 28, 2014, the end
of the reporting period. The way we implement our main investment strategies and the resulting portfolio holdings
may change depending on factors such as market and economic conditions. These opinions may not be relied upon
as investment advice or an offer for a particular security. The information is not a complete analysis of every aspect
of any market, state, industry, security or the Fund. Statements of fact are from sources considered reliable, but
the investment manager makes no representation or warranty as to their completeness or accuracy. Although
historical performance is no guarantee of future results, these insights may help you understand our investment
management philosophy.
1. For state personal income taxes, the 80% minimum is measured by total Fund assets. For investors subject to alter-
native minimum tax, a small portion of Fund dividends may be taxable. Distributions of capital gains are generally
taxable. To avoid imposition of 28% backup withholding on all Fund distributions and redemption proceeds, U.S.
investors must be properly certified on Form W-9 and non-U.S. investors on Form W-8BEN.
2. All Fund distributions will vary depending upon current market conditions, and past distributions are not indicative
of future trends.
3. Source: Moody’s Investors Service, “2013 State Debt Medians Report,” 5/29/13.
4. This does not indicate Moody’s rating of the Fund.
70 | Annual Report
Performance Summary as of 2/28/14
Franklin Oregon Tax-Free Income Fund
Your dividend income will vary depending on dividends or interest paid by securities in the Fund’s portfolio, adjusted for operating expenses of each class. Capital gain distributions are net profits realized from the sale of portfolio securities. The performance table and graphs do not reflect any taxes that a shareholder would pay on Fund dividends, capital gain distributions, if any, or any realized gains on the sale of Fund shares. Total return reflects reinvestment of the Fund’s dividends and capital gain distributions, if any, and any unrealized gains or losses.
| | | | | | | | |
| Price and Distribution Information | | | | | | |
| Class A (Symbol: FRORX) | | | | Change | | 2/28/14 | | 2/28/13 |
| Net Asset Value (NAV) | | | -$ | 0.89 | $ | 11.69 | $ | 12.58 |
| Distributions (3/1/13–2/28/14) | | | | | | | | |
| Dividend Income | $ | 0.4439 | | | | | | |
| Class C (Symbol: FORIX) | | | | Change | | 2/28/14 | | 2/28/13 |
| Net Asset Value (NAV) | | | -$ | 0.90 | $ | 11.84 | $ | 12.74 |
| Distributions (3/1/13–2/28/14) | | | | | | | | |
| Dividend Income | $ | 0.3782 | | | | | | |
| Advisor Class (Symbol: FOFZX) | | | | Change | | 2/28/14 | | 2/28/13 |
| Net Asset Value (NAV) | | | -$ | 0.89 | $ | 11.70 | $ | 12.59 |
| Distributions (3/1/13–2/28/14) | | | | | | | | |
| Dividend Income | $ | 0.4556 | | | | | | |
Annual Report | 71
Performance Summary (continued)
Performance
Cumulative total return excludes sales charges. Average annual total returns include maximum sales charges.
Class A: 4.25% maximum initial sales charge; Class C: 1% contingent deferred sales charge in first year only;
Advisor Class: no sales charges.
| | | | | | | | | | |
| Class A | | | 1-Year | | | 5-Year | | | 10-Year | |
| Cumulative Total Return1 | | | -3.50 | % | | +27.36 | % | | +47.78 | % |
| Average Annual Total Return2 | | | -7.62 | % | | +4.04 | % | | +3.53 | % |
| Avg. Ann. Total Return (3/31/14)3 | | | -6.50 | % | | +4.16 | % | | +3.57 | % |
| Distribution Rate4 | 3.90 | % | | | | | | | | |
| Taxable Equivalent Distribution Rate5 | 7.70 | % | | | | | | | | |
| 30-Day Standardized Yield6 | 2.99 | % | | | | | | | | |
| Taxable Equivalent Yield5 | 5.91 | % | | | | | | | | |
| Total Annual Operating Expenses7 | 0.62 | % | | | | | | | | |
| Class C | | | 1-Year | | | 5-Year | | | 10-Year | |
| Cumulative Total Return1 | | | -4.07 | % | | +23.87 | % | | +39.74 | % |
| Average Annual Total Return2 | | | -5.00 | % | | +4.37 | % | | +3.40 | % |
| Avg. Ann. Total Return (3/31/14)3 | | | -3.80 | % | | +4.50 | % | | +3.45 | % |
| Distribution Rate4 | 3.52 | % | | | | | | | | |
| Taxable Equivalent Distribution Rate5 | 6.95 | % | | | | | | | | |
| 30-Day Standardized Yield6 | 2.58 | % | | | | | | | | |
| Taxable Equivalent Yield5 | 5.10 | % | | | | | | | | |
| Total Annual Operating Expenses7 | 1.17 | % | | | | | | | | |
| Advisor Class8 | | | 1-Year | | | 5-Year | | | 10-Year | |
| Cumulative Total Return1 | | | -3.41 | % | | +28.03 | % | | +48.56 | % |
| Average Annual Total Return2 | | | -3.41 | % | | +5.07 | % | | +4.04 | % |
| Avg. Ann. Total Return (3/31/14)3 | | | -2.26 | % | | +5.18 | % | | +4.08 | % |
| Distribution Rate4 | 4.17 | % | | | | | | | | |
| Taxable Equivalent Distribution Rate5 | 8.24 | % | | | | | | | | |
| 30-Day Standardized Yield6 | 3.21 | % | | | | | | | | |
| Taxable Equivalent Yield5 | 6.34 | % | | | | | | | | |
| Total Annual Operating Expenses7 | 0.52 | % | | | | | | | | |
Performance data represent past performance, which does not guarantee future results. Investment return and principal
value will fluctuate, and you may have a gain or loss when you sell your shares. Current performance may differ from
figures shown. For most recent month-end performance, go to franklintempleton.com or call (800) 342-5236.
72 | Annual Report
Performance Summary (continued)
Total Return Index Comparison for a Hypothetical $10,000 Investment
Total return represents the change in value of an investment over the periods shown. It includes any applicable maximum sales charge, Fund expenses, account fees and reinvested distributions. The unmanaged index includes reinvestment of any income or distributions. It differs from the Fund in composition and does not pay management fees or expenses. One cannot invest directly in an index.
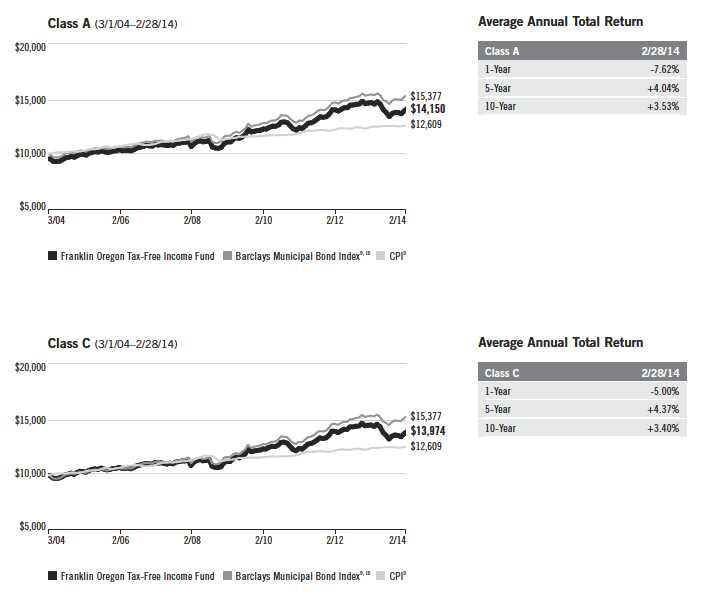
Annual Report | 73

All investments involve risks, including possible loss of principal. Because municipal bonds are sensitive to interest rate movements, the Fund’s
yield and share price will fluctuate with market conditions. Bond prices generally move in the opposite direction of interest rates. Thus, as
prices of bonds in the Fund adjust to a rise in interest rates, the Fund’s share price may decline. Because the Fund invests principally in a
single state, it is subject to greater risk of adverse economic and regulatory changes in that state than a geographically diversified fund. The
Fund holds a portion of its assets in Puerto Rico municipal bonds that have been impacted by recent adverse economic and market changes,
which may cause the Fund’s share price to decline. Changes in the credit rating of a bond, or in the credit rating or financial strength of a
bond’s issuer, insurer or guarantor, may affect the bond’s value. The Fund may invest a significant part of its assets in municipal securities
that finance similar types of projects, such as utilities, hospitals, higher education and transportation. A change that affects one project would
likely affect all similar projects, thereby increasing market risk. The Fund is actively managed but there is no guarantee that the manager’s
investment decisions will produce the desired results. The Fund’s prospectus also includes a description of the main investment risks.
Class C: These shares have higher annual fees and expenses than Class A shares.
Advisor Class: Shares are available to certain eligible investors as described in the prospectus.
1. Cumulative total return represents the change in value of an investment over the periods indicated.
2. Average annual total return represents the average annual change in value of an investment over the periods indicated.
3. In accordance with SEC rules, we provide standardized average annual total return information through the latest calendar quarter.
4. Distribution rate is based on an annualization of the respective class’s February dividend and the maximum offering price (NAV for Classes C and
Advisor) per share on 2/28/14.
5. Taxable equivalent distribution rate and yield assume the published rates as of 12/18/13 for the maximum combined effective federal and Oregon
personal income tax rate of 49.38%, based on the federal income tax rate of 39.60% plus 3.8% Medicare tax.
6. The 30-day standardized yield for the month ended 2/28/14 reflects an estimated yield to maturity (assuming all portfolio securities are held to
maturity). It should be regarded as an estimate of the Fund’s rate of investment income, and it may not equal the Fund’s actual income distribution
rate (which reflects the Fund’s past dividends paid to shareholders) or the income reported in the Fund’s financial statements.
7. Figures are as stated in the Fund’s current prospectus. In periods of market volatility, assets may decline significantly, causing total annual Fund
operating expenses to become higher than the figures shown.
8. Effective 7/15/09, the Fund began offering Advisor Class shares, which do not have sales charges or a Rule 12b-1 plan. Performance quotations
for this class reflect the following methods of calculation: (a) For periods prior to 7/15/09, a restated figure is used based upon the Fund’s Class A
performance, excluding the effect of Class A’s maximum initial sales charge, but reflecting the effect of the Class A Rule 12b-1 fees; and (b) for peri-
ods after 7/15/09, actual Advisor Class performance is used reflecting all charges and fees applicable to that class. Since 7/15/09 (commencement
of sales), the cumulative and average annual total returns of Advisor Class shares were +23.34% and +4.64%.
9. Source: © 2014 Morningstar. The Barclays Municipal Bond Index is a market value-weighted index engineered for the long-term tax-exempt bond
market. To be included in the index, bonds must be fixed rate, have at least one year to final maturity and be rated investment grade (Baa3/BBB- or
higher) by at least two of the following agencies: Moody’s, Standard & Poor’s and Fitch. The Consumer Price Index (CPI), calculated by the Bureau of
Labor Statistics, is a commonly used measure of the inflation rate.
10. Source: Barclays Global Family of Indices. © 2014 Barclays Capital Inc. Used with permission.
74 | Annual Report
Your Fund’s Expenses
Franklin Oregon Tax-Free Income Fund
As a Fund shareholder, you can incur two types of costs:
- Transaction costs, including sales charges (loads) on Fund purchases; and
- Ongoing Fund costs, including management fees, distribution and service (12b-1) fees, and other Fund expenses. All mutual funds have ongoing costs, sometimes referred to as operating expenses.
The following table shows ongoing costs of investing in the Fund and can help you understand these costs and compare them with those of other mutual funds. The table assumes a $1,000 investment held for the six months indicated.
Actual Fund Expenses
The first line (Actual) for each share class listed in the table provides actual account values and expenses. The “Ending Account Value” is derived from the Fund’s actual return, which includes the effect of Fund expenses.
You can estimate the expenses you paid during the period by following these steps. Of course, your account value and expenses will differ from those in this illustration:
| 1. | Divide your account value by $1,000. |
| | If an account had an $8,600 value, then $8,600 ÷ $1,000 = 8.6. |
| 2. | Multiply the result by the number under the heading “Expenses Paid During Period.” |
| | If Expenses Paid During Period were $7.50, then 8.6 x $7.50 = $64.50. |
In this illustration, the estimated expenses paid this period are $64.50.
Hypothetical Example for Comparison with Other Funds
Information in the second line (Hypothetical) for each class in the table can help you compare ongoing costs of investing in the Fund with those of other mutual funds. This information may not be used to estimate the actual ending account balance or expenses you paid during the period. The hypothetical “Ending Account Value” is based on the actual expense ratio for each class and an assumed 5% annual rate of return before expenses, which does not represent the Fund’s actual return. The figure under the heading “Expenses Paid During Period” shows the hypothetical expenses your account would have incurred under this scenario. You can compare this figure with the 5% hypothetical examples that appear in shareholder reports of other funds.
Annual Report | 75
Your Fund’s Expenses (continued)
Please note that expenses shown in the table are meant to highlight ongoing costs and do not reflect any transaction costs, such as sales charges. Therefore, the second line for each class is useful in comparing ongoing costs only, and will not help you compare total costs of owning different funds. In addition, if transaction costs were included, your total costs would have been higher. Please refer to the Fund prospectus for additional information on operating expenses.
| | | | | | |
| | | Beginning Account | | Ending Account | | Expenses Paid During |
| Class A | | Value 9/1/13 | | Value 2/28/14 | | Period* 9/1/13–2/28/14 |
| Actual | $ | 1,000 | $ | 1,055.60 | $ | 3.26 |
| Hypothetical (5% return before expenses) | $ | 1,000 | $ | 1,021.62 | $ | 3.21 |
| Class C | | | | | | |
| Actual | $ | 1,000 | $ | 1,052.10 | $ | 6.05 |
| Hypothetical (5% return before expenses) | $ | 1,000 | $ | 1,018.89 | $ | 5.96 |
| Advisor Class | | | | | | |
| Actual | $ | 1,000 | $ | 1,056.00 | $ | 2.75 |
| Hypothetical (5% return before expenses) | $ | 1,000 | $ | 1,022.12 | $ | 2.71 |
*Expenses are calculated using the most recent six-month expense ratio, annualized for each class (A: 0.64%; C: 1.19%; and Advisor: 0.54%),
multiplied by the average account value over the period, multiplied by 181/365 to reflect the one-half year period.
76 | Annual Report
Franklin Pennsylvania Tax-Free Income Fund
Your Fund’s Goal and Main Investments: Franklin Pennsylvania Tax-Free Income Fund seeks to provide as high a level of income exempt from federal and Pennsylvania personal income taxes as is consistent with prudent investment management and preservation of capital by investing at least 80% of its net assets in securities that pay interest free from such taxes.1
| | |
| Credit Quality Breakdown* | | |
| Franklin Pennsylvania Tax-Free Income Fund | | |
| 2/28/14 | | |
| | % of Total | |
| Ratings | Long-Term Investments** | |
| AAA | 1.0 | % |
| AA | 43.3 | % |
| A | 40.7 | % |
| BBB | 12.1 | % |
| Below Investment Grade | 2.4 | % |
| Not Rated | 0.5 | % |
*Standard & Poor’s (S&P) is used as the primary independent rating agency source. Moody’s is secondary, and Fitch,
if available, is used for securities not rated by Moody’s or S&P. The ratings are an indication of an issuer’s credit-
worthiness, with long-term ratings typically ranging from AAA (highest) to Below Investment Grade (lowest; includes
ratings BB to D). This methodology differs from that used in Fund marketing materials.
**Does not include short-term investments and other net assets.
This annual report for Franklin Pennsylvania Tax-Free Income Fund covers the fiscal year ended February 28, 2014.
Performance data represent past performance, which does not guarantee future results. Investment return and principal value will fluctuate, and you may have a gain or loss when you sell your shares. Current performance may differ from figures shown. Please visit franklintempleton.com or call (800) 342-5236 for most recent month-end performance.
Performance Overview
The Fund’s Class A share price, as measured by net asset value, decreased from $10.94 on February 28, 2013, to $10.17 on February 28, 2014. The Fund’s Class A shares paid dividends totaling 40.59 cents per share for the same period.2 The Performance Summary beginning on page 81 shows that at the end of this reporting period the Fund’s Class A shares’ distribution rate was 4.07% based on an annualization of the 3.60 cent per share February dividend and the maximum offering price of $10.62 on February 28, 2014. An investor in the 2014 maximum combined effective federal and Pennsylvania personal income tax bracket of 45.25% (including 3.8% Medicare tax) would need to
The dollar value, number of shares or principal amount, and names of all portfolio holdings are listed in the Fund’s Statement of Investments (SOI). The SOI begins on page 149.
Annual Report | 77
| | | |
| Dividend Distributions* | | | |
| Franklin Pennsylvania Tax-Free Income Fund | | | |
| 3/1/13–2/28/14 | | | |
| | Dividend per Share (cents) |
| Month | Class A | Class C | Advisor Class |
| March | 3.28 | 2.78 | 3.37 |
| April | 3.28 | 2.78 | 3.37 |
| May | 3.28 | 2.78 | 3.37 |
| June | 3.21 | 2.72 | 3.29 |
| July | 3.21 | 2.72 | 3.29 |
| August | 3.26 | 2.77 | 3.34 |
| September | 3.36 | 2.90 | 3.44 |
| October | 3.46 | 3.00 | 3.54 |
| November | 3.54 | 3.08 | 3.62 |
| December | 3.54 | 3.10 | 3.63 |
| January | 3.57 | 3.13 | 3.66 |
| February | 3.60 | 3.16 | 3.69 |
| Total | 40.59 | 34.92 | 41.61 |
*Assumes shares were purchased and held for the entire accrual period. Since dividends accrue daily, your actual dis-
tributions will vary depending on the date you purchased your shares and any account activity. All Fund distributions
will vary depending upon current market conditions, and past distributions are not indicative of future trends.
earn a distribution rate of 7.43% from a taxable investment to match the Fund’s Class A tax-free distribution rate. For the Fund’s Class C and Advisor shares’ performance, please see the Performance Summary.
Commonwealth Update
During the reporting period, Pennsylvania continued its slow economic recovery. Although the commonwealth experienced less severe losses than the nation’s and began to recover sooner during the recent recession, its rates of job and population growth slowed in recent years. The mining and logging sector grew during the period, as the Marcellus Shale natural gas reserve has been the commonwealth’s largest source of job growth in recent years. In contrast, the information, government and manufacturing sectors continued to grow. The commonwealth’s unemployment rate fell to a six-year low of 6.2% at period-end.3 In comparison, the national rate was 6.7%.3 Pennsylvania’s real estate market also contributed to the economic recovery. Home sales and prices increased while inventory levels and the number of days homes stayed on the market decreased.
78 | Annual Report
The enacted fiscal year 2014 budget was not structurally balanced. Although the budget maintained pension contributions at legally required levels, this amount fell short of the actuarially determined required amount. Lawmakers increased pension funding by delaying the elimination of capital stock and franchise fees and using unappropriated funds. Projected revenue growth decreased for fiscal year 2014, so lawmakers closed a sizable gap by suspending the required transfer of fiscal year 2013’s surplus to the budget stabilization reserve. Near period-end, the governor released his spending plan for fiscal year 2015. The plan called for increased spending compared to the previous year’s budget without raising taxes. Highlights of the plan included additional spending on education, job training programs, corrections and health care.
Pennsylvania’s debt levels were moderate and in line with national medians. Net tax-supported debt was 2.8% of personal income and $1,208 per capita, compared with the 2.8% and $1,074 national medians.4 Independent credit rating agency Standard & Poor’s (S&P) affirmed its AA rating and negative outlook of Pennsylvania’s existing general obligation bonds.5 The rating reflected S&P’s view of the commonwealth’s diverse economic base, good wealth levels with average personal income per capita and moderate debt profile, offset by its weakened financial reserves and growing unfunded pension liability. The negative outlook reflected S&P’s view that growing cost pressures, mostly regarding pension obligations, together with slow economic growth and limited reserves, could result in a lower rating without faster growth or pension reforms.
| | |
| Portfolio Breakdown | | |
| Franklin Pennsylvania Tax-Free Income Fund | |
| 2/28/14 | | |
| % of Total | |
| Long-Term Investments* | |
| Higher Education | 26.9 | % |
| General Obligation | 17.7 | % |
| Hospital & Health Care | 16.0 | % |
| Utilities | 13.9 | % |
| Transportation | 6.5 | % |
| Tax-Supported | 6.0 | % |
| Refunded | 5.1 | % |
| Subject to Government Appropriations | 3.0 | % |
| Housing | 2.7 | % |
| Other Revenue | 2.2 | % |
| |
| *Does not include short-term investments and other | |
| net assets. | | |
Manager’s Discussion
We used various investment strategies during the 12 months under review as we sought to maximize tax-free income for shareholders. Puerto Rico’s municipal bond market is widely traded because of its federal and state tax-exemption advantages. During the reporting period, some Puerto Rico issuers experienced a series of downgrades from S&P, Moody’s Investors Service and Fitch Ratings. In February 2014, these credit rating firms downgraded their respective ratings of Puerto Rico’s general obligation debt to below investment grade, along with the ratings of certain related Puerto Rico issuers. Additionally, each rating agency maintained a negative outlook on certain Puerto Rico issuers, and further downgrades are possible. The Fund is not required to sell securities that have been downgraded to below investment grade, but it is prohibited from making further purchases of such securities as long as the securities are not rated investment grade by at least one U.S. nationally recognized rating service. Rating actions combined with news related to Puerto Rico’s financial position and future financing endeavors caused its bond market to experience sharp declines in the latter half of 2013 and contrasting positive performance year-to-date in 2014.
Annual Report | 79
Thank you for your continued participation in Franklin Pennsylvania Tax-Free Income Fund. We believe our conservative, buy-and-hold investment strategy can help us achieve high, current, tax-free income for shareholders.
The foregoing information reflects our analysis, opinions and portfolio holdings as of February 28, 2014, the end
of the reporting period. The way we implement our main investment strategies and the resulting portfolio holdings
may change depending on factors such as market and economic conditions. These opinions may not be relied upon
as investment advice or an offer for a particular security. The information is not a complete analysis of every aspect
of any market, state, industry, security or the Fund. Statements of fact are from sources considered reliable, but
the investment manager makes no representation or warranty as to their completeness or accuracy. Although
historical performance is no guarantee of future results, these insights may help you understand our investment
management philosophy.
1. For state personal income taxes, the 80% minimum is measured by total Fund assets. For investors subject to alter-
native minimum tax, a small portion of Fund dividends may be taxable. Distributions of capital gains are generally
taxable. To avoid imposition of 28% backup withholding on all Fund distributions and redemption proceeds, U.S.
investors must be properly certified on Form W-9 and non-U.S. investors on Form W-8BEN.
2. All Fund distributions will vary depending upon current market conditions, and past distributions are not indicative
of future trends.
3. Source: Bureau of Labor Statistics.
4. Source: Moody’s Investors Service, “Median Report: 2013 State Debt Medians Report,” 5/29/13.
5. This does not indicate S&P’s rating of the Fund.
80 | Annual Report
Performance Summary as of 2/28/14
Franklin Pennsylvania Tax-Free Income Fund
Your dividend income will vary depending on dividends or interest paid by securities in the Fund’s portfolio, adjusted for operating expenses of each class. Capital gain distributions are net profits realized from the sale of portfolio securities. The performance table and graphs do not reflect any taxes that a shareholder would pay on Fund dividends, capital gain distributions, if any, or any realized gains on the sale of Fund shares. Total return reflects reinvestment of the Fund’s dividends and capital gain distributions, if any, and any unrealized gains or losses.
| | | | | | | | |
| Price and Distribution Information | | | | | | |
| Class A (Symbol: FRPAX) | | | | Change | | 2/28/14 | | 2/28/13 |
| Net Asset Value (NAV) | | | -$ | 0.77 | $ | 10.17 | $ | 10.94 |
| Distributions (3/1/13–2/28/14) | | | | | | | | |
| Dividend Income | $ | 0.4059 | | | | | | |
| Class C (Symbol: FRPTX) | | | | Change | | 2/28/14 | | 2/28/13 |
| Net Asset Value (NAV) | | | -$ | 0.78 | $ | 10.28 | $ | 11.06 |
| Distributions (3/1/13–2/28/14) | | | | | | | | |
| Dividend Income | $ | 0.3492 | | | | | | |
| Advisor Class (Symbol: FPFZX) | | | | Change | | 2/28/14 | | 2/28/13 |
| Net Asset Value (NAV) | | | -$ | 0.77 | $ | 10.18 | $ | 10.95 |
| Distributions (3/1/13–2/28/14) | | | | | | | | |
| Dividend Income | $ | 0.4161 | | | | | | |
Annual Report | 81
Performance Summary (continued)
Performance
Cumulative total return excludes sales charges. Average annual total returns include maximum sales charges
Class A: 4.25% maximum initial sales charge; Class C: 1% contingent deferred sales charge in first year on
Advisor Class: no sales charges.
| | | | | | | | | | |
| Class A | | | 1-Year | | | 5-Year | | | 10-Year | |
| Cumulative Total Return1 | | | -3.28 | % | | +29.73 | % | | +46.62 | % |
| Average Annual Total Return2 | | | -7.43 | % | | +4.43 | % | | +3.45 | % |
| Avg. Ann. Total Return (3/31/14)3 | | | -6.31 | % | | +4.44 | % | | +3.52 | % |
| Distribution Rate4 | 4.07 | % | | | | | | | | |
| Taxable Equivalent Distribution Rate5 | 7.43 | % | | | | | | | | |
| 30-Day Standardized Yield6 | 3.50 | % | | | | | | | | |
| Taxable Equivalent Yield5 | 6.39 | % | | | | | | | | |
| Total Annual Operating Expenses7 | 0.63 | % | | | | | | | | |
| Class C | | | 1-Year | | | 5-Year | | | 10-Year | |
| Cumulative Total Return1 | | | -3.86 | % | | +26.26 | % | | +38.83 | % |
| Average Annual Total Return2 | | | -4.79 | % | | +4.77 | % | | +3.34 | % |
| Avg. Ann. Total Return (3/31/14)3 | | | -3.61 | % | | +4.78 | % | | +3.41 | % |
| Distribution Rate4 | 3.69 | % | | | | | | | | |
| Taxable Equivalent Distribution Rate5 | 6.74 | % | | | | | | | | |
| 30-Day Standardized Yield6 | 3.15 | % | | | | | | | | |
| Taxable Equivalent Yield5 | 5.75 | % | | | | | | | | |
| Total Annual Operating Expenses7 | 1.18 | % | | | | | | | | |
| Advisor Class8 | | | 1-Year | | | 5-Year | | | 10-Year | |
| Cumulative Total Return1 | | | -3.18 | % | | +30.42 | % | | +47.40 | % |
| Average Annual Total Return2 | | | -3.18 | % | | +5.46 | % | | +3.96 | % |
| Avg. Ann. Total Return (3/31/14)3 | | | -2.06 | % | | +5.46 | % | | +4.03 | % |
| Distribution Rate4 | 4.35 | % | | | | | | | | |
| Taxable Equivalent Distribution Rate5 | 7.95 | % | | | | | | | | |
| 30-Day Standardized Yield6 | 3.78 | % | | | | | | | | |
| Taxable Equivalent Yield5 | 6.90 | % | | | | | | | | |
| Total Annual Operating Expenses7 | 0.53 | % | | | | | | | | |
Performance data represent past performance, which does not guarantee future results. Investment return and principal
value will fluctuate, and you may have a gain or loss when you sell your shares. Current performance may differ from
figures shown. For most recent month-end performance, go to franklintempleton.com or call (800) 342-5236.
82 | Annual Report
Performance Summary (continued)
Total Return Index Comparison for a Hypothetical $10,000 Investment
Total return represents the change in value of an investment over the periods shown. It includes any applicable maximum sales charge, Fund expenses, account fees and reinvested distributions. The unmanaged index includes reinvestment of any income or distributions. It differs from the Fund in composition and does not pay management fees or expenses. One cannot invest directly in an index.
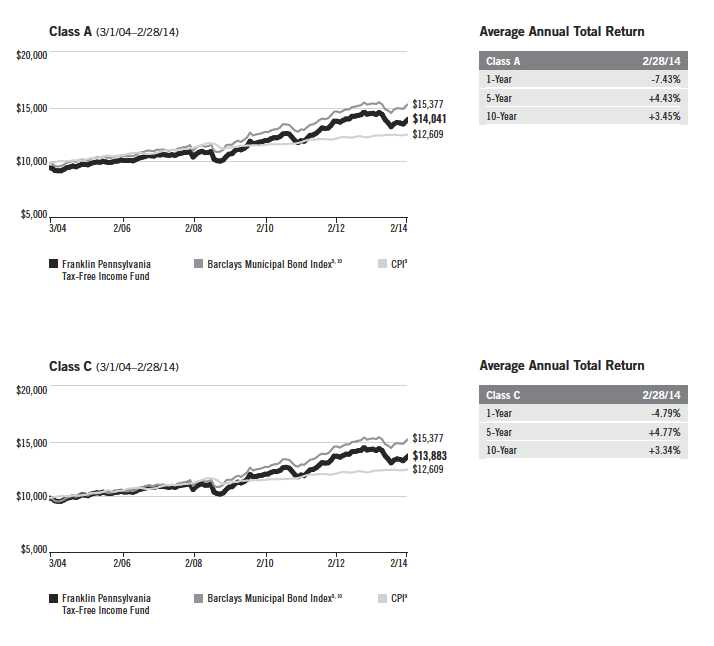
Annual Report | 83
Performance Summary (continued)
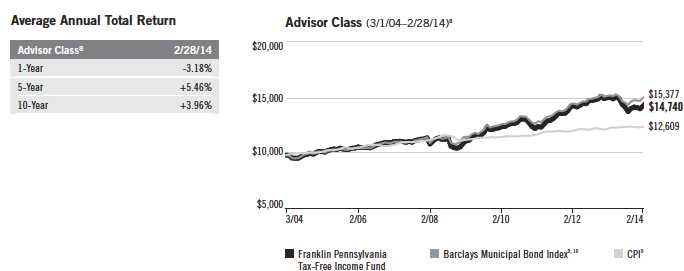
All investments involve risks, including possible loss of principal. Because municipal bonds are sensitive to interest rate movements, the Fund’s
yield and share price will fluctuate with market conditions. Bond prices generally move in the opposite direction of interest rates. Thus, as
prices of bonds in the Fund adjust to a rise in interest rates, the Fund’s share price may decline. Because the Fund invests principally in a
single state, it is subject to greater risk of adverse economic and regulatory changes in that state than a geographically diversified fund.
The Fund holds a small portion of its assets in Puerto Rico municipal bonds that have been impacted by recent adverse economic and market
changes, which may cause the Fund’s share price to decline. Changes in the credit rating of a bond, or in the credit rating or financial strength
of a bond’s issuer, insurer or guarantor, may affect the bond’s value. The Fund may invest a significant part of its assets in municipal securities
that finance similar types of projects, such as utilities, hospitals, higher education and transportation. A change that affects one project would
likely affect all similar projects, thereby increasing market risk. The Fund is actively managed but there is no guarantee that the manager’s
investment decisions will produce the desired results. The Fund’s prospectus also includes a description of the main investment risks.
Class C: These shares have higher annual fees and expenses than Class A shares.
Advisor Class: Shares are available to certain eligible investors as described in the prospectus.
1. Cumulative total return represents the change in value of an investment over the periods indicated.
2. Average annual total return represents the average annual change in value of an investment over the periods indicated.
3. In accordance with SEC rules, we provide standardized average annual total return information through the latest calendar quarter.
4. Distribution rate is based on an annualization of the respective class’s February dividend and the maximum offering price (NAV for Classes C and
Advisor) per share on 2/28/14.
5. Taxable equivalent distribution rate and yield assume the published rates as of 12/18/13 for the maximum combined effective federal and
Pennsylvania personal income tax rate of 45.25%, based on the federal income tax rate of 39.60% plus 3.8% Medicare tax.
6. The 30-day standardized yield for the month ended 2/28/14 reflects an estimated yield to maturity (assuming all portfolio securities are held to
maturity). It should be regarded as an estimate of the Fund’s rate of investment income, and it may not equal the Fund’s actual income distribution
rate (which reflects the Fund’s past dividends paid to shareholders) or the income reported in the Fund’s financial statements.
7. Figures are as stated in the Fund’s current prospectus. In periods of market volatility, assets may decline significantly, causing total annual Fund
operating expenses to become higher than the figures shown.
8. Effective 7/15/09, the Fund began offering Advisor Class shares, which do not have sales charges or a Rule 12b-1 plan. Performance quotations
for this class reflect the following methods of calculation: (a) For periods prior to 7/15/09, a restated figure is used based upon the Fund’s Class A
performance, excluding the effect of Class A’s maximum initial sales charge, but reflecting the effect of the Class A Rule 12b-1 fees; and (b) for peri-
ods after 7/15/09, actual Advisor Class performance is used reflecting all charges and fees applicable to that class. Since 7/15/09 (commencement
of sales), the cumulative and average annual total returns of Advisor Class shares were +24.72% and +4.89%.
9. Source: © 2014 Morningstar. The Barclays Municipal Bond Index is a market value-weighted index engineered for the long-term tax-exempt bond
market. To be included in the index, bonds must be fixed rate, have at least one year to final maturity and be rated investment grade (Baa3/BBB- or
higher) by at least two of the following agencies: Moody’s, Standard & Poor’s or Fitch. The Consumer Price Index (CPI), calculated by the Bureau of
Labor Statistics, is a commonly used measure of the inflation rate.
10. Source: Barclays Global Family of Indices. © 2014 Barclays Capital Inc. Used with permission.
84 | Annual Report
Your Fund’s Expenses
Franklin Pennsylvania Tax-Free Income Fund
As a Fund shareholder, you can incur two types of costs:
- Transaction costs, including sales charges (loads) on Fund purchases; and
- Ongoing Fund costs, including management fees, distribution and service (12b-1) fees, and other Fund expenses. All mutual funds have ongoing costs, sometimes referred to as operating expenses.
The following table shows ongoing costs of investing in the Fund and can help you understand these costs and compare them with those of other mutual funds. The table assumes a $1,000 investment held for the six months indicated.
Actual Fund Expenses
The first line (Actual) for each share class listed in the table provides actual account values and expenses. The “Ending Account Value” is derived from the Fund’s actual return, which includes the effect of Fund expenses.
You can estimate the expenses you paid during the period by following these steps. Of course, your account value and expenses will differ from those in this illustration:
| 1. | Divide your account value by $1,000. |
| | If an account had an $8,600 value, then $8,600 ÷ $1,000 = 8.6. |
| 2. | Multiply the result by the number under the heading “Expenses Paid During Period.” |
| | If Expenses Paid During Period were $7.50, then 8.6 x $7.50 = $64.50. |
In this illustration, the estimated expenses paid this period are $64.50.
Hypothetical Example for Comparison with Other Funds
Information in the second line (Hypothetical) for each class in the table can help you compare ongoing costs of investing in the Fund with those of other mutual funds. This information may not be used to estimate the actual ending account balance or expenses you paid during the period. The hypothetical “Ending Account Value” is based on the actual expense ratio for each class and an assumed 5% annual rate of return before expenses, which does not represent the Fund’s actual return. The figure under the heading “Expenses Paid During Period” shows the hypothetical expenses your account would have incurred under this scenario. You can compare this figure with the 5% hypothetical examples that appear in shareholder reports of other funds.
Annual Report | 85
Your Fund’s Expenses (continued)
Please note that expenses shown in the table are meant to highlight ongoing costs and do not reflect any transaction costs, such as sales charges. Therefore, the second line for each class is useful in comparing ongoing costs only, and will not help you compare total costs of owning different funds. In addition, if transaction costs were included, your total costs would have been higher. Please refer to the Fund prospectus for additional information on operating expenses.
| | | | | | |
| | | Beginning Account | | Ending Account | | Expenses Paid During |
| Class A | | Value 9/1/13 | | Value 2/28/14 | | Period* 9/1/13–2/28/14 |
| Actual | $ | 1,000 | $ | 1,056.50 | $ | 3.31 |
| Hypothetical (5% return before expenses) | $ | 1,000 | $ | 1,021.57 | $ | 3.26 |
| Class C | | | | | | |
| Actual | $ | 1,000 | $ | 1,053.10 | $ | 6.11 |
| Hypothetical (5% return before expenses) | $ | 1,000 | $ | 1,018.84 | $ | 6.01 |
| Advisor Class | | | | | | |
| Actual | $ | 1,000 | $ | 1,057.00 | $ | 2.81 |
| Hypothetical (5% return before expenses) | $ | 1,000 | $ | 1,022.07 | $ | 2.76 |
*Expenses are calculated using the most recent six-month expense ratio, annualized for each class (A: 0.65%; C: 1.20%; and Advisor: 0.55%),
multiplied by the average account value over the period, multiplied by 181/365 to reflect the one-half year period.
86 | Annual Report
| | | | | | | | | | | | | | | |
| Franklin Tax-Free Trust | | | | | | | | | | | | | | | |
| Financial Highlights | | | | | | | | | | | | | | | |
| |
| Franklin Arizona Tax-Free Income Fund | | | | | | | | | | | | | | | |
| | | | | | Year Ended February 28, | | | | |
| Class A | | 2014 | | | 2013 | | | 2012 | a | | 2011 | | | 2010 | |
| Per share operating performance | | | | | | | | | | | | | | | |
| (for a share outstanding throughout the year) | | | | | | | | | | | | | | | |
| Net asset value, beginning of year | $ | 11.52 | | $ | 11.28 | | $ | 10.30 | | $ | 10.78 | | $ | 10.18 | |
| Income from investment operationsb: | | | | | | | | | | | | | | | |
| Net investment incomec | | 0.45 | | | 0.45 | | | 0.47 | | | 0.47 | | | 0.48 | |
| Net realized and unrealized gains (losses) | | (0.73 | ) | | 0.23 | | | 0.99 | | | (0.47 | ) | | 0.60 | |
| Total from investment operations | | (0.28 | ) | | 0.68 | | | 1.46 | | | — | | | 1.08 | |
| Less distributions from net investment income | | (0.44 | ) | | (0.44 | ) | | (0.48 | ) | | (0.48 | ) | | (0.48 | ) |
| Net asset value, end of year | $ | 10.80 | | $ | 11.52 | | $ | 11.28 | | $ | 10.30 | | $ | 10.78 | |
| |
| Total returnd | | (2.37 | )% | | 6.14 | % | | 14.44 | % | | (0.09 | )% | | 10.84 | % |
| |
| Ratios to average net assets | | | | | | | | | | | | | | | |
| Expenses | | 0.62 | % | | 0.63 | % | | 0.64 | % | | 0.62 | % | | 0.63 | % |
| Net investment income | | 4.10 | % | | 3.93 | % | | 4.40 | % | | 4.40 | % | | 4.55 | % |
| |
| Supplemental data | | | | | | | | | | | | | | | |
| Net assets, end of year (000’s) | $ | 798,957 | | $ | 982,621 | | $ | 920,194 | | $ | 844,627 | | $ | 982,080 | |
| Portfolio turnover rate | | 14.75 | % | | 6.40 | % | | 13.19 | % | | 13.61 | % | | 8.37 | % |
aFor the year ended February 29.
bThe amount shown for a share outstanding throughout the period may not correlate with the Statement of Operations for the period due to the timing of sales and repurchases of
the Fund shares in relation to income earned and/or fluctuating market value of the investments of the Fund.
cBased on average daily shares outstanding.
dTotal return does not reflect sales commissions or contingent deferred sales charges, if applicable.
Annual Report | The accompanying notes are an integral part of these financial statements. | 87
| | | | | | | | | | | | | | | |
| Franklin Tax-Free Trust | | | | | | | | | | | | | | | |
| Financial Highlights (continued) | | | | | | | | | | | | | | | |
| |
| Franklin Arizona Tax-Free Income Fund | | | | | | | | | | | | | | | |
| | | | | | Year Ended February 28, | | | | |
| Class C | | 2014 | | | 2013 | | | 2012 | a | | 2011 | | | 2010 | |
| Per share operating performance | | | | | | | | | | | | | | | |
| (for a share outstanding throughout the year) | | | | | | | | | | | | | | | |
| Net asset value, beginning of year | $ | 11.68 | | $ | 11.43 | | $ | 10.44 | | $ | 10.91 | | $ | 10.29 | |
| Income from investment operationsb: | | | | | | | | | | | | | | | |
| Net investment incomec | | 0.39 | | | 0.39 | | | 0.42 | | | 0.42 | | | 0.43 | |
| Net realized and unrealized gains (losses) | | (0.73 | ) | | 0.24 | | | 0.99 | | | (0.47 | ) | | 0.62 | |
| Total from investment operations | | (0.34 | ) | | 0.63 | | | 1.41 | | | (0.05 | ) | | 1.05 | |
| Less distributions from net investment income | | (0.38 | ) | | (0.38 | ) | | (0.42 | ) | | (0.42 | ) | | (0.43 | ) |
| Net asset value, end of year | $ | 10.96 | | $ | 11.68 | | $ | 11.43 | | $ | 10.44 | | $ | 10.91 | |
| |
| Total returnd | | (2.87 | )% | | 5.56 | % | | 13.74 | % | | (0.56 | )% | | 10.32 | % |
| |
| Ratios to average net assets | | | | | | | | | | | | | | | |
| Expenses | | 1.17 | % | | 1.18 | % | | 1.19 | % | | 1.17 | % | | 1.18 | % |
| Net investment income | | 3.55 | % | | 3.38 | % | | 3.85 | % | | 3.85 | % | | 4.00 | % |
| |
| Supplemental data | | | | | | | | | | | | | | | |
| Net assets, end of year (000’s) | $ | 100,188 | | $ | 150,778 | | $ | 118,448 | | $ | 99,856 | | $ | 109,679 | |
| Portfolio turnover rate | | 14.75 | % | | 6.40 | % | | 13.19 | % | | 13.61 | % | | 8.37 | % |
aFor the year ended February 29.
bThe amount shown for a share outstanding throughout the period may not correlate with the Statement of Operations for the period due to the timing of sales and repurchases of
the Fund shares in relation to income earned and/or fluctuating market value of the investments of the Fund.
cBased on average daily shares outstanding.
dTotal return does not reflect sales commissions or contingent deferred sales charges, if applicable.
88 | The accompanying notes are an integral part of these financial statements. | Annual Report
| | | | | | | | | | | | | | | |
| Franklin Tax-Free Trust | | | | | | | | | | | | | | | |
| Financial Highlights (continued) | | | | | | | | | | | | | | | |
| |
| Franklin Arizona Tax-Free Income Fund | | | | | | | | | | | | | | | |
| | | | | | Year Ended February 28, | | | | |
| Advisor Class | | 2014 | | | 2013 | | | 2012 | a | | 2011 | | | 2010 | |
| Per share operating performance | | | | | | | | | | | | | | | |
| (for a share outstanding throughout the year) | | | | | | | | | | | | | | | |
| Net asset value, beginning of year | $ | 11.55 | | $ | 11.30 | | $ | 10.32 | | $ | 10.80 | | $ | 10.18 | |
| Income from investment operationsb: | | | | | | | | | | | | | | | |
| Net investment incomec | | 0.46 | | | 0.46 | | | 0.48 | | | 0.49 | | | 0.50 | |
| Net realized and unrealized gains (losses) | | (0.73 | ) | | 0.24 | | | 0.99 | | | (0.48 | ) | | 0.62 | |
| Total from investment operations | | (0.27 | ) | | 0.70 | | | 1.47 | | | 0.01 | | | 1.12 | |
| Less distributions from net investment income | | (0.45 | ) | | (0.45 | ) | | (0.49 | ) | | (0.49 | ) | | (0.50 | ) |
| Net asset value, end of year | $ | 10.83 | | $ | 11.55 | | $ | 11.30 | | $ | 10.32 | | $ | 10.80 | |
| |
| Total return | | (2.26 | )% | | 6.33 | % | | 14.52 | % | | 0.02 | % | | 11.15 | % |
| |
| Ratios to average net assets | | | | | | | | | | | | | | | |
| Expenses | | 0.52 | % | | 0.53 | % | | 0.54 | % | | 0.52 | % | | 0.53 | % |
| Net investment income | | 4.20 | % | | 4.03 | % | | 4.50 | % | | 4.50 | % | | 4.65 | % |
| |
| Supplemental data | | | | | | | | | | | | | | | |
| Net assets, end of year (000’s) | $ | 29,842 | | $ | 36,297 | | $ | 20,862 | | $ | 5,697 | | $ | 4,530 | |
| Portfolio turnover rate | | 14.75 | % | | 6.40 | % | | 13.19 | % | | 13.61 | % | | 8.37 | % |
aFor the year ended February 29.
bThe amount shown for a share outstanding throughout the period may not correlate with the Statement of Operations for the period due to the timing of sales and repurchases of
the Fund shares in relation to income earned and/or fluctuating market value of the investments of the Fund.
cBased on average daily shares outstanding.
Annual Report | The accompanying notes are an integral part of these financial statements. | 89
| | | | |
| Franklin Tax-Free Trust | | | | |
| |
| Statement of Investments, February 28, 2014 | | | | |
| |
| |
| Franklin Arizona Tax-Free Income Fund | | Principal Amount | | Value |
| Municipal Bonds 98.6% | | | | |
| Arizona 89.3% | | | | |
| Arizona Board of Regents COP, University of Arizona, Refunding, Series C, 5.00%, 6/01/31 | $ | 7,025,000 | $ | 7,533,891 |
| Arizona Health Facilities Authority Revenue, | | | | |
| Banner Health, Refunding, Series D, BHAC Insured, 5.50%, 1/01/38 | | 15,000,000 | | 16,041,600 |
| Banner Health, Series A, 5.00%, 1/01/35 | | 10,000,000 | | 10,247,300 |
| Banner Health, Series D, 5.50%, 1/01/38 | | 17,500,000 | | 18,522,525 |
| Catholic Healthcare West, Series B, AGMC Insured, 5.00%, 3/01/41 | | 5,000,000 | | 5,109,350 |
| Catholic Healthcare West, Series B, Sub Series B-1, 5.25%, 3/01/39 | | 10,000,000 | | 10,366,500 |
| Arizona School Facilities Board COP, 5.50%, 9/01/23 | | 10,000,000 | | 11,064,700 |
| Arizona Sports and Tourism Authority Senior Revenue, Multipurpose Stadium Facility Project, | | | | |
| Refunding, Series A, 5.00%, 7/01/36 | | 5,000,000 | | 5,203,350 |
| Arizona State Board of Regents Arizona State University System Revenue, Polytechnic Campus | | | | |
| Project, Series C, 6.00%, | | | | |
| 7/01/26 | | 2,500,000 | | 2,913,150 |
| 7/01/27 | | 3,000,000 | | 3,487,650 |
| 7/01/28 | | 3,350,000 | | 3,877,993 |
| Arizona State Board of Regents University of Arizona System Revenue, | | | | |
| Refunding, Series A, 5.00%, 6/01/37 | | 3,665,000 | | 3,933,168 |
| Series A, 5.00%, 6/01/39 | | 8,650,000 | | 9,063,037 |
| Stimulus Plan for Economic and Educational Development, 5.00%, 8/01/38 | | 10,150,000 | | 10,864,763 |
| Arizona State COP, Department of Administration, | | | | |
| Series A, AGMC Insured, 5.25%, 10/01/26 | | 8,500,000 | | 9,419,275 |
| Series A, AGMC Insured, 5.00%, 10/01/29 | | 5,855,000 | | 6,320,590 |
| Series B, AGMC Insured, 5.00%, 10/01/28 | | 5,000,000 | | 5,361,700 |
| Series B, AGMC Insured, 5.00%, 10/01/29 | | 3,000,000 | | 3,198,510 |
| Arizona State Health Facilities Authority Healthcare Education Facilities Revenue, Kirksville College | | | | |
| of Osteopathic Medicine Inc., Arizona School of Health Sciences Project, 5.125%, 1/01/30 | | 2,250,000 | | 2,331,675 |
| Arizona State Health Facilities Authority Hospital Revenue, Phoenix Children's Hospital, Refunding, | | | | |
| Series A, 5.00%, 2/01/42 | | 8,000,000 | | 8,000,160 |
| Arizona State Lottery Revenue, Series A, AGMC Insured, 5.00%, | | | | |
| 7/01/28 | | 15,540,000 | | 17,267,271 |
| 7/01/29 | | 7,500,000 | | 8,287,125 |
| Arizona State Transportation Board Highway Revenue, Subordinated, Refunding, Series A, 5.00%, | | | | |
| 7/01/36 | | 10,000,000 | | 10,846,700 |
| Arizona State University COP, Research Infrastructure Projects, AMBAC Insured, 5.00%, 9/01/30 | | 12,065,000 | | 12,174,671 |
| Downtown Phoenix Hotel Corp. Revenue, Subordinate, Series B, NATL RE, FGIC Insured, 5.00%, | | | | |
| 7/01/36 | | 18,995,000 | | 19,102,132 |
| 7/01/40 | | 11,345,000 | | 11,405,015 |
| El Mirage GO, AGMC Insured, 5.00%, 7/01/42 | | 2,200,000 | | 2,275,526 |
| Gilbert Public Facilities Municipal Property Corp. Revenue, 5.50%, 7/01/28 | | 10,000,000 | | 11,268,000 |
| Gilbert Water Resources Municipal Property Corp. Water System Development Fee and Water Utility | | | | |
| Revenue, sub. lien, NATL Insured, 5.00%, 10/01/29 | | 25,000,000 | | 26,576,500 |
| Glendale IDA Hospital Revenue, John C. Lincoln Health Network, Refunding, | | | | |
| 5.00%, 12/01/32 | | 4,775,000 | | 4,816,733 |
| 5.00%, 12/01/42 | | 12,870,000 | | 12,791,236 |
| Series B, 5.00%, 12/01/37 | | 3,000,000 | | 3,003,720 |
| Glendale IDAR, Midwestern University, | | | | |
| 5.00%, 5/15/35 | | 5,000,000 | | 5,114,500 |
| 5.125%, 5/15/40 | | 10,000,000 | | 10,220,000 |
| Refunding, 5.00%, 5/15/31 | | 3,455,000 | | 3,593,684 |
90 | Annual Report
| | | | |
| Franklin Tax-Free Trust | | | | |
| |
| Statement of Investments, February 28, 2014 (continued) | | | | |
| |
| |
| Franklin Arizona Tax-Free Income Fund | | Principal Amount | | Value |
| Municipal Bonds (continued) | | | | |
| Arizona (continued) | | | | |
| Glendale Municipal Property Corp. Excise Tax Revenue, | | | | |
| Refunding, Series C, AGMC Insured, 5.00%, 7/01/38 | $ | 6,530,000 | $ | 6,698,213 |
| Subordinate, Refunding, Series C, 5.00%, 7/01/38 | | 12,000,000 | | 12,222,000 |
| Goodyear Community Facilities Utilities District No. 1 GO, AMBAC Insured, 5.00%, 7/15/32 | | 7,500,000 | | 7,688,250 |
| Goodyear Water and Sewer Revenue, sub. lien, Obligations, Refunding, AGMC Insured, | | | | |
| 5.25%, 7/01/31 | | 1,000,000 | | 1,074,670 |
| 5.50%, 7/01/41 | | 1,500,000 | | 1,613,895 |
| Greater Arizona Development Authority Infrastructure Revenue, Series B, NATL Insured, 5.00%, | | | | |
| 8/01/35 | | 9,090,000 | | 9,261,346 |
| Marana Municipal Property Corp. Municipal Facilities Revenue, | | | | |
| Refunding, NATL Insured, 5.25%, 7/01/22 | | 1,050,000 | | 1,061,036 |
| Series A, 5.00%, 7/01/28 | | 3,000,000 | | 3,190,050 |
| Maricopa County Cartwright Elementary School District No. 83 GO, School Improvement, | | | | |
| Project of 2010, Series A, AGMC Insured, 5.375%, 7/01/30 | | 5,415,000 | | 5,933,649 |
| Maricopa County Hospital Revenue, Sun Health Corp., Pre-Refunded, 5.00%, 4/01/35 | | 12,090,000 | | 14,778,453 |
| Maricopa County IDA, MFHR, Senior, | | | | |
| National Voluntary Health Facilities II Project, Series A, AGMC Insured, ETM, 5.50%, 1/01/18 | | 1,650,000 | | 1,777,496 |
| Western Groves Apartments Project, Series A-1, AMBAC Insured, 5.30%, 12/01/22 | | 1,485,000 | | 1,485,356 |
| Maricopa County IDA Health Facility Revenue, | | | | |
| Catholic Healthcare West, Refunding, Series A, 5.375%, 7/01/23 | | 7,000,000 | | 7,085,050 |
| Catholic Healthcare West, Refunding, Series A, 5.50%, 7/01/26 | | 13,950,000 | | 14,125,491 |
| Catholic Healthcare West, Refunding, Series A, 6.00%, 7/01/39 | | 4,860,000 | | 5,319,076 |
| Mayo Clinic, 5.00%, 11/15/36 | | 16,250,000 | | 16,518,775 |
| Maricopa County IDA Hospital System Revenue, Samaritan Health Services, Series A, NATL Insured, | | | | |
| ETM, 7.00%, 12/01/16 | | 1,890,000 | | 2,054,354 |
| Maricopa County IDA Senior Living Healthcare Revenue, Immanuel Campus of Care Project, Refunding, | | | | |
| Series A, GNMA Secured, 5.00%, 8/20/35 | | 1,725,000 | | 1,740,956 |
| Maricopa County PCC, PCR, | | | | |
| El Paso Electric Co. Palo Verde Project, Refunding, Series A, 4.50%, 8/01/42 | | 10,000,000 | | 9,360,500 |
| El Paso Electric Co. Palo Verde Project, Series A, 7.25%, 2/01/40 | | 10,000,000 | | 11,193,200 |
| Public Service Co. of New Mexico Palo Verde Project, Refunding, Series A, 6.25%, 1/01/38 | | 5,000,000 | | 5,423,200 |
| Southern California Edison Co., Refunding, Series B, 5.00%, 6/01/35 | | 14,745,000 | | 15,459,838 |
| Maricopa County USD No. 11 Peoria GO, School Improvement, 5.00%, 7/01/31 | | 5,100,000 | | 5,572,209 |
| Maricopa County USD No. 89 Dysart GO, School Improvement, Project of 2006, Series B, | | | | |
| AGMC Insured, 5.00%, 7/01/27 | | 5,015,000 | | 5,248,749 |
| McAllister Academic Village LLC Revenue, Arizona State University Hassayampa Academic Village | | | | |
| Project, Refunding, | | | | |
| 5.25%, 7/01/33 | | 5,000,000 | | 5,304,600 |
| 5.00%, 7/01/38 | | 5,000,000 | | 5,238,850 |
| Assured Guaranty, 5.25%, 7/01/33 | | 2,525,000 | | 2,678,823 |
| Assured Guaranty, 5.00%, 7/01/38 | | 3,825,000 | | 4,007,720 |
| Navajo County PCC Revenue, Mandatory Put 6/01/16, Series E, 5.75%, 6/01/34 | | 6,000,000 | | 6,573,180 |
| Navajo County USD No. 6 Heber-Overgaard GO, School Improvement, Project of 2008, | | | | |
| Assured Guaranty, 5.50%, 7/01/28 | | 1,045,000 | | 1,188,552 |
| Nogales Municipal Development Authority Inc. Municipal Facilities Revenue, NATL Insured, | | | | |
| 5.00%, 6/01/36 | | 2,640,000 | | 2,709,511 |
| Northern Arizona University COP, Northern Arizona University Research Infrastructure Projects, | | | | |
| AMBAC Insured, Pre-Refunded, 5.00%, 9/01/30 | | 2,000,000 | | 2,047,180 |
Annual Report | 91
| | | | |
| Franklin Tax-Free Trust | | | | |
| |
| Statement of Investments, February 28, 2014 (continued) | | | | |
| |
| |
| Franklin Arizona Tax-Free Income Fund | | Principal Amount | | Value |
| Municipal Bonds (continued) | | | | |
| Arizona (continued) | | | | |
| Northern Arizona University Revenue, Stimulus Plan for Economic and Educational Development, 5.00%, | | | | |
| 8/01/26 | $ | 2,380,000 | $ | 2,670,027 |
| 8/01/38 | | 5,000,000 | | 5,252,400 |
| Northern Arizona University System Revenue, 5.00%, 6/01/38 | | 5,000,000 | | 5,077,800 |
| Phoenix Civic Improvement Corp. Airport Revenue, | | | | |
| junior lien, Series A, 5.00%, 7/01/40 | | 10,000,000 | | 10,249,700 |
| senior lien, Series A, 5.00%, 7/01/38 | | 10,000,000 | | 10,225,300 |
| Phoenix Civic Improvement Corp. Distribution Revenue, Capital Appreciation, Civic Plaza Expansion | | | | |
| Project, Series B, NATL RE, FGIC Insured, 5.50%, | | | | |
| 7/01/27 | | 3,945,000 | | 4,686,344 |
| 7/01/28 | | 2,000,000 | | 2,370,320 |
| 7/01/29 | | 2,000,000 | | 2,361,300 |
| 7/01/36 | | 5,000,000 | | 5,768,750 |
| 7/01/37 | | 7,000,000 | | 8,059,450 |
| Phoenix Civic Improvement Corp. Excise Tax Revenue, Subordinated, Civic Plaza Expansion Project, | | | | |
| Series A, NATL RE, FGIC Insured, 5.00%, | | | | |
| 7/01/35 | | 2,050,000 | | 2,082,390 |
| 7/01/41 | | 5,000,000 | | 5,068,000 |
| Phoenix Civic Improvement Corp. Wastewater System Revenue, | | | | |
| junior lien, Refunding, AGMC Insured, 5.00%, 7/01/37 | | 5,515,000 | | 5,789,757 |
| junior lien, Refunding, NATL RE, FGIC Insured, 5.00%, 7/01/28 | | 2,000,000 | | 2,025,900 |
| junior lien, Refunding, NATL RE, FGIC Insured, 5.00%, 7/01/29 | | 3,405,000 | | 3,447,869 |
| senior lien, Refunding, 5.50%, 7/01/24 | | 2,500,000 | | 2,898,750 |
| Phoenix Civic Improvement Corp. Water System Revenue, junior lien, Series A, 5.00%, 7/01/39 | | 14,780,000 | | 15,495,795 |
| Phoenix IDA Education Revenue, Facility, JMF-Higley 2012 LLC Project, 5.00%, | | | | |
| 12/01/34 | | 3,000,000 | | 3,105,000 |
| 12/01/39 | | 5,610,000 | | 5,737,179 |
| Phoenix IDA Student Housing Revenue, Downtown Phoenix Student Housing LLC Arizona State | | | | |
| University Project, | | | | |
| Series A, AMBAC Insured, 5.00%, 7/01/37 | | 18,095,000 | | 15,159,991 |
| Series C, AMBAC Insured, 5.00%, 7/01/37 | | 8,735,000 | | 6,908,075 |
| Pima County IDA Lease Revenue, | | | | |
| Clark County Detention Facility Project, 5.125%, 9/01/27 | | 8,655,000 | | 9,124,880 |
| Clark County Detention Facility Project, 5.00%, 9/01/39 | | 15,000,000 | | 15,282,000 |
| Metro Police Facility, Nevada Project, Series A, 5.375%, 7/01/39 | | 2,000,000 | | 2,069,440 |
| Metro Police Facility, Nevada Project, Series A, 5.50%, 7/01/39 | | 7,500,000 | | 7,804,125 |
| Pinal County Electrical District No. 3 Electric System Revenue, Refunding, 5.25%, | | | | |
| 7/01/33 | | 1,500,000 | | 1,631,805 |
| 7/01/41 | | 6,800,000 | | 7,254,512 |
| Pinal County Electrical District No. 4 Electric System Revenue, 6.00%, | | | | |
| 12/01/23 | | 525,000 | | 583,275 |
| 12/01/28 | | 740,000 | | 794,671 |
| 12/01/38 | | 1,150,000 | | 1,198,875 |
| Rio Nuevo Multipurpose Facilities District Excise Tax Revenue, sub. lien, Assured Guaranty, | | | | |
| 6.50%, 7/15/24 | | 4,220,000 | | 4,789,827 |
| Salt River Project Agricultural Improvement and Power District Electric System Revenue, | | | | |
| Refunding, Series A, 5.00%, 12/01/30 | | 4,500,000 | | 5,027,040 |
| Salt River Project, Series A, 5.00%, 1/01/37 | | 14,000,000 | | 14,611,520 |
| Salt River Project, Series A, 5.00%, 1/01/38 | | 7,000,000 | | 7,395,360 |
| Salt River Project, Series A, 5.00%, 1/01/39 | | 5,000,000 | | 5,288,950 |
92 | Annual Report
| | | | |
| Franklin Tax-Free Trust | | | | |
| |
| Statement of Investments, February 28, 2014 (continued) | | | | |
| |
| |
| Franklin Arizona Tax-Free Income Fund | | Principal Amount | | Value |
| Municipal Bonds (continued) | | | | |
| Arizona (continued) | | | | |
| Salt Verde Financial Corp. Senior Gas Revenue, 5.00%, | | | | |
| 12/01/32 | $ | 10,000,000 | $ | 10,614,700 |
| 12/01/37 | | 5,000,000 | | 5,271,850 |
| Scottsdale IDA Hospital Revenue, Scottsdale Healthcare, Refunding, Series A, 5.25%, 9/01/30 | | 5,000,000 | | 5,003,250 |
| Scottsdale Municipal Property Corp. Excise Tax Revenue, Water and Sewer Improvements Project, | | | | |
| 5.00%, 7/01/33 | | 10,660,000 | | 11,679,629 |
| Show Low IDA Hospital Revenue, Navapache Regional Medical Center, Radian Insured, 5.00%, | | | | |
| 12/01/30 | | 5,160,000 | | 5,160,464 |
| 12/01/35 | | 2,000,000 | | 1,966,020 |
| Tempe Excise Tax Revenue, Series A, 5.00%, 7/01/31 | | 2,325,000 | | 2,554,733 |
| Tempe IDA Lease Revenue, State University Foundation, AMBAC Insured, 5.00%, | | | | |
| 7/01/28 | | 4,275,000 | | 4,275,727 |
| 7/01/34 | | 11,510,000 | | 11,436,566 |
| Tucson Airport Authority Inc. Revenue, sub. lien, AMBAC Insured, 5.35%, 6/01/31 | | 10,000,000 | | 10,014,000 |
| Tucson IDA Lease Revenue, University of Arizona/Marshall Foundation Project, | | | | |
| Series A, AMBAC Insured, 5.00%, 7/15/32 | | 1,000,000 | | 1,000,080 |
| Tucson Water System Revenue, | | | | |
| 5.00%, 7/01/32 | | 5,000,000 | | 5,366,900 |
| Refunding, 5.00%, 7/01/28 | | 1,230,000 | | 1,336,875 |
| Refunding, 5.00%, 7/01/29 | | 1,765,000 | | 1,908,495 |
| University Medical Center Corp. Hospital Revenue, Tucson, | | | | |
| 5.00%, 7/01/35 | | 7,000,000 | | 7,003,080 |
| 5.625%, 7/01/36 | | 5,000,000 | | 5,166,200 |
| 6.50%, 7/01/39 | | 4,750,000 | | 5,208,945 |
| Refunding, 6.00%, 7/01/39 | | 5,000,000 | | 5,243,700 |
| Yavapai County IDA Hospital Facility Revenue, Yavapai Regional Medical Center, Series B, 5.625%, | | | | |
| 8/01/33 | | 2,315,000 | | 2,376,973 |
| 8/01/37 | | 12,435,000 | | 12,649,752 |
| | | | | 829,772,244 |
| U.S. Territories 9.3% | | | | |
| Guam 0.9% | | | | |
| Guam Government Business Privilege Tax Revenue, | | | | |
| Series A, 5.125%, 1/01/42 | | 5,300,000 | | 5,369,483 |
| Series B-1, 5.00%, 1/01/29 | | 2,980,000 | | 3,101,077 |
| | | | | 8,470,560 |
| Puerto Rico 8.4% | | | | |
| Puerto Rico Commonwealth GO, Public Improvement, | | | | |
| Refunding, Series A, 5.75%, 7/01/41 | | 5,000,000 | | 3,870,650 |
| Series A, 5.25%, 7/01/37 | | 5,000,000 | | 3,711,800 |
| Puerto Rico Electric Power Authority Power Revenue, | | | | |
| Refunding, Series ZZ, 5.25%, 7/01/26 | | 8,470,000 | | 5,934,082 |
| Series CCC, 5.25%, 7/01/27 | | 5,000,000 | | 3,503,250 |
| Puerto Rico PBA Guaranteed Revenue, Government Facilities, | | | | |
| Refunding, Series D, 5.375%, 7/01/33 | | 3,000,000 | | 2,279,580 |
| Series I, Pre-Refunded, 5.375%, 7/01/34 | | 20,000,000 | | 20,333,200 |
| Puerto Rico Public Finance Corp. Revenue, Commonwealth Appropriation, Refunding, Series B, | | | | |
| 5.50%, 8/01/31 | | 17,500,000 | | 11,271,925 |
Annual Report | 93
| | | | |
| Franklin Tax-Free Trust | | | | |
| |
| Statement of Investments, February 28, 2014 (continued) | | | | |
| |
| |
| Franklin Arizona Tax-Free Income Fund | | Principal Amount | | Value |
| Municipal Bonds (continued) | | | | |
| U.S. Territories (continued) | | | | |
| Puerto Rico (continued) | | | | |
| Puerto Rico Sales Tax FICO Sales Tax Revenue, | | | | |
| first subordinate, Refunding, Series C, 6.00%, 8/01/39 | $ | 5,100,000 | $ | 4,236,672 |
| first subordinate, Series A, 5.50%, 8/01/37 | | 6,000,000 | | 4,723,260 |
| first subordinate, Series C, 5.25%, 8/01/41 | | 10,930,000 | | 8,237,832 |
| Refunding, Senior Series C, 5.00%, 8/01/46 | | 12,500,000 | | 10,005,500 |
| | | | | 78,107,751 |
| Total U.S. Territories | | | | 86,578,311 |
| Total Municipal Bonds before Short Term Investments | | | | |
| (Cost $907,217,607) | | | | 916,350,555 |
| Short Term Investments (Cost $5,500,000) 0.6% | | | | |
| Municipal Bonds 0.6% | | | | |
| Arizona 0.6% | | | | |
| aMaricopa County PCC, PCR, Arizona Public Service Co. Palo Verde Project, Refunding, Series B, | | | | |
| Daily VRDN and Put, 0.03%, 5/01/29 | | 5,500,000 | | 5,500,000 |
| Total Investments (Cost $912,717,607) 99.2% | | | | 921,850,555 |
| Other Assets, less Liabilities 0.8% | | | | 7,135,913 |
| Net Assets 100.0% | | | $ | 928,986,468 |
See Abbreviations on page 181.
aVariable rate demand notes (VRDNs) are tax-exempt obligations which contain a floating or variable interest rate adjustment formula and an unconditional right of demand to
receive payment of the principal balance plus accrued interest at specified dates. The coupon rate shown represents the rate at period end.
94 | The accompanying notes are an integral part of these financial statements. | Annual Report
| | | | | | | | | | | | | | | |
| Franklin Tax-Free Trust | | | | | | | | | | | | | | | |
| Financial Highlights | | | | | | | | | | | | | | | |
| |
| Franklin Colorado Tax-Free Income Fund | | | | | | | | | | | �� | | | | |
| | | | | | Year Ended February 28, | | | | |
| Class A | | 2014 | | | 2013 | | | 2012 | a | | 2011 | | | 2010 | |
| Per share operating performance | | | | | | | | | | | | | | | |
| (for a share outstanding throughout the year) | | | | | | | | | | | | | | | |
| Net asset value, beginning of year | $ | 12.44 | | $ | 12.24 | | $ | 11.09 | | $ | 11.65 | | $ | 10.79 | |
| Income from investment operationsb: | | | | | | | | | | | | | | | |
| Net investment incomec | | 0.47 | | | 0.47 | | | 0.51 | | | 0.51 | | | 0.51 | |
| Net realized and unrealized gains (losses) | | (0.79 | ) | | 0.19 | | | 1.15 | | | (0.56 | ) | | 0.87 | |
| Total from investment operations | | (0.32 | ) | | 0.66 | | | 1.66 | | | (0.05 | ) | | 1.38 | |
| Less distributions from net investment income | | (0.46 | ) | | (0.46 | ) | | (0.51 | ) | | (0.51 | ) | | (0.52 | ) |
| Net asset value, end of year | $ | 11.66 | | $ | 12.44 | | $ | 12.24 | | $ | 11.09 | | $ | 11.65 | |
| |
| Total returnd | | (2.56 | )% | | 5.48 | % | | 15.33 | % | | (0.55 | )% | | 12.97 | % |
| |
| Ratios to average net assets | | | | | | | | | | | | | | | |
| Expenses | | 0.64 | % | | 0.65 | % | | 0.65 | % | | 0.65 | % | | 0.66 | % |
| Net investment income | | 4.00 | % | | 3.77 | % | | 4.37 | % | | 4.35 | % | | 4.49 | % |
| |
| Supplemental data | | | | | | | | | | | | | | | |
| Net assets, end of year (000’s) | $ | 520,275 | | $ | 660,432 | | $ | 583,088 | | $ | 530,056 | | $ | 565,222 | |
| Portfolio turnover rate | | 7.74 | % | | 9.30 | % | | 8.14 | % | | 22.47 | % | | 9.78 | % |
aFor the year ended February 29.
bThe amount shown for a share outstanding throughout the period may not correlate with the Statement of Operations for the period due to the timing of sales and repurchases of
the Fund shares in relation to income earned and/or fluctuating market value of the investments of the Fund.
cBased on average daily shares outstanding.
dTotal return does not reflect sales commissions or contingent deferred sales charges, if applicable.
Annual Report | The accompanying notes are an integral part of these financial statements. | 95
| | | | | | | | | | | | | | | |
| Franklin Tax-Free Trust | | | | | | | | | | | | | | | |
| Financial Highlights (continued) | | | | | | | | | | | | | | | |
| |
| Franklin Colorado Tax-Free Income Fund | | | | | | | | | | | | | | | |
| | | | | | Year Ended February 28, | | | | |
| Class C | | 2014 | | | 2013 | | | 2012 | a | | 2011 | | | 2010 | |
| Per share operating performance | | | | | | | | | | | | | | | |
| (for a share outstanding throughout the year) | | | | | | | | | | | | | | | |
| Net asset value, beginning of year | $ | 12.56 | | $ | 12.36 | | $ | 11.20 | | $ | 11.76 | | $ | 10.88 | |
| Income from investment operationsb: | | | | | | | | | | | | | | | |
| Net investment incomec | | 0.41 | | | 0.40 | | | 0.45 | | | 0.44 | | | 0.45 | |
| Net realized and unrealized gains (losses) | | (0.80 | ) | | 0.19 | | | 1.16 | | | (0.56 | ) | | 0.88 | |
| Total from investment operations | | (0.39 | ) | | 0.59 | | | 1.61 | | | (0.12 | ) | | 1.33 | |
| Less distributions from net investment income | | (0.39 | ) | | (0.39 | ) | | (0.45 | ) | | (0.44 | ) | | (0.45 | ) |
| Net asset value, end of year | $ | 11.78 | | $ | 12.56 | | $ | 12.36 | | $ | 11.20 | | $ | 11.76 | |
| |
| Total returnd | | (3.07 | )% | | 4.84 | % | | 14.66 | % | | (1.11 | )% | | 12.43 | % |
| |
| Ratios to average net assets | | | | | | | | | | | | | | | |
| Expenses | | 1.19 | % | | 1.20 | % | | 1.20 | % | | 1.20 | % | | 1.21 | % |
| Net investment income | | 3.45 | % | | 3.22 | % | | 3.82 | % | | 3.80 | % | | 3.94 | % |
| |
| Supplemental data | | | | | | | | | | | | | | | |
| Net assets, end of year (000’s) | $ | 107,705 | | $ | 160,856 | | $ | 126,094 | | $ | 106,536 | | $ | 118,648 | |
| Portfolio turnover rate | | 7.74 | % | | 9.30 | % | | 8.14 | % | | 22.47 | % | | 9.78 | % |
aFor the year ended February 29.
bThe amount shown for a share outstanding throughout the period may not correlate with the Statement of Operations for the period due to the timing of sales and repurchases of
the Fund shares in relation to income earned and/or fluctuating market value of the investments of the Fund.
cBased on average daily shares outstanding.
dTotal return does not reflect sales commissions or contingent deferred sales charges, if applicable.
96 | The accompanying notes are an integral part of these financial statements. | Annual Report
| | | | | | | | | | | | | | | |
| Franklin Tax-Free Trust | | | | | | | | | | | | | | | |
| Financial Highlights (continued) | | | | | | | | | | | | | | | |
| |
| Franklin Colorado Tax-Free Income Fund | | | | | | | | | | | | | | | |
| | | | | | Year Ended February 28, | | | | |
| Advisor Class | | 2014 | | | 2013 | | | 2012 | a | | 2011 | | | 2010 | b |
| Per share operating performance | | | | | | | | | | | | | | | |
| (for a share outstanding throughout the year) | | | | | | | | | | | | | | | |
| Net asset value, beginning of year | $ | 12.43 | | $ | 12.24 | | $ | 11.09 | | $ | 11.65 | | $ | 11.22 | |
| Income from investment operationsc: | | | | | | | | | | | | | | | |
| Net investment incomed | | 0.48 | | | 0.48 | | | 0.52 | | | 0.52 | | | 0.33 | |
| Net realized and unrealized gains (losses) | | (0.78 | ) | | 0.18 | | | 1.16 | | | (0.56 | ) | | 0.43 | |
| Total from investment operations | | (0.30 | ) | | 0.66 | | | 1.68 | | | (0.04 | ) | | 0.76 | |
| Less distributions from net investment income | | (0.47 | ) | | (0.47 | ) | | (0.53 | ) | | (0.52 | ) | | (0.33 | ) |
| Net asset value, end of year | $ | 11.66 | | $ | 12.43 | | $ | 12.24 | | $ | 11.09 | | $ | 11.65 | |
| |
| Total returne | | (2.39 | )% | | 5.50 | % | | 15.44 | % | | (0.45 | )% | | 6.79 | % |
| |
| Ratios to average net assetsf | | | | | | | | | | | | | | | |
| Expenses | | 0.54 | % | | 0.55 | % | | 0.55 | % | | 0.55 | % | | 0.56 | % |
| Net investment income | | 4.10 | % | | 3.87 | % | | 4.47 | % | | 4.45 | % | | 4.59 | % |
| |
| Supplemental data | | | | | | | | | | | | | | | |
| Net assets, end of year (000’s) | $ | 34,393 | | $ | 41,990 | | $ | 31,955 | | $ | 13,304 | | $ | 11,066 | |
| Portfolio turnover rate | | 7.74 | % | | 9.30 | % | | 8.14 | % | | 22.47 | % | | 9.78 | % |
aFor the year ended February 29.
bFor the period July 15, 2009 (effective date) to February 28, 2010.
cThe amount shown for a share outstanding throughout the period may not correlate with the Statement of Operations for the period due to the timing of sales and repurchases of
the Fund shares in relation to income earned and/or fluctuating market value of the investments of the Fund.
dBased on average daily shares outstanding.
eTotal return is not annualized for periods less than one year.
fRatios are annualized for periods less than one year.
Annual Report | The accompanying notes are an integral part of these financial statements. | 97
| | | | |
| Franklin Tax-Free Trust | | | | |
| |
| Statement of Investments, February 28, 2014 | | | | |
| |
| |
| Franklin Colorado Tax-Free Income Fund | | Principal Amount | | Value |
| Municipal Bonds 97.7% | | | | |
| Colorado 90.1% | | | | |
| Adams County Revenue, Platte Valley Medical Center Project, NATL Insured, Pre-Refunded, | | | | |
| 5.00%, 2/01/31 | $ | 9,615,000 | $ | 10,231,418 |
| Adams State College Board of Trustees Auxiliary Facilities Revenue, Improvement, Series A, 5.50%, | | | | |
| 5/15/34 | | 2,000,000 | | 2,114,340 |
| 5/15/39 | | 2,150,000 | | 2,255,544 |
| Adams State College Board of Trustees Institutional Enterprise Revenue, 5.00%, | | | | |
| 5/15/32 | | 1,360,000 | | 1,474,920 |
| 5/15/37 | | 1,000,000 | | 1,058,480 |
| Auraria Higher Education Center Parking Enterprise Revenue, 5th and Walnut Parking Garage Project, | | | | |
| Series A, AGMC Insured, 5.00%, 4/01/34 | | 6,150,000 | | 6,584,867 |
| Aurora COP, Refunding, Series A, 5.00%, 12/01/30 | | 5,680,000 | | 6,085,609 |
| Aurora Hospital Revenue, Children's Hospital Assn. Project, Series A, 5.00%, 12/01/40 | | 2,500,000 | | 2,556,250 |
| Aurora Water Improvement Revenue, first lien, Series A, AMBAC Insured, 5.00%, | | | | |
| 8/01/36 | | 5,880,000 | | 6,183,820 |
| 8/01/39 | | 10,000,000 | | 10,451,100 |
| Boulder Larimer and Weld Counties Vrain Valley School District No. RE-1J GO, 5.00%, 12/15/33 | | 5,300,000 | | 5,852,790 |
| Boulder Valley School District No. RE-2 Boulder GO, 5.00%, 12/01/34 | | 6,000,000 | | 6,528,900 |
| Brighton Water Activity Enterprise Revenue, Water System Project, Series A, Assured Guaranty, | | | | |
| 5.25%, 12/01/34 | | 5,380,000 | | 5,732,820 |
| Castle Rock Sales and Use Tax Revenue, 5.00%, | | | | |
| 6/01/31 | | 1,800,000 | | 1,980,126 |
| 6/01/32 | | 1,845,000 | | 2,017,544 |
| 6/01/35 | | 2,775,000 | | 2,996,334 |
| Colorado Educational and Cultural Facilities Authority Revenue, | | | | |
| Alexander Dawson School, Colorado Project, 5.00%, 2/15/40 | | 5,280,000 | | 5,427,312 |
| Charter School, James Irwin Educational Foundation Project, Refunding and Improvement, | | | | |
| Assured Guaranty, 5.00%, 8/01/37 | | 6,060,000 | | 6,074,726 |
| Student Housing, Campus Village Apartments Project, Refunding, 5.50%, 6/01/38 | | 13,500,000 | | 13,672,800 |
| Colorado Health Facilities Authority Revenue, | | | | |
| Hospital, Longmont United Hospital Project, Refunding, Series B, Radian Insured, | | | | |
| 5.00%, 12/01/25 | | 3,050,000 | | 3,098,099 |
| Hospital, Longmont United Hospital Project, Refunding, Series B, Radian Insured, | | | | |
| 5.00%, 12/01/26 | | 3,205,000 | | 3,239,069 |
| Hospital, Longmont United Hospital Project, Refunding, Series B, Radian Insured, | | | | |
| 5.00%, 12/01/27 | | 3,365,000 | | 3,383,541 |
| Hospital, Longmont United Hospital Project, Refunding, Series B, Radian Insured, | | | | |
| 5.00%, 12/01/30 | | 3,000,000 | | 2,976,270 |
| The Evangelical Lutheran Good Samaritan Society Project, 5.25%, 6/01/31 | | 4,000,000 | | 4,034,080 |
| The Evangelical Lutheran Good Samaritan Society Project, Series A, 5.25%, 6/01/34 | | 3,500,000 | | 3,502,835 |
| Colorado School of Mines Board of Trustees Enterprise Revenue, Refunding and Improvement, | | | | |
| Series A, 5.25%, 12/01/37 | | 2,000,000 | | 2,111,240 |
| Colorado Springs Public Facilities Authority COP, U.S. Olympic Committee Project, Assured Guaranty, | | | | |
| 5.00%, 11/01/39 | | 11,305,000 | | 11,566,824 |
| Colorado Springs Utilities System Revenue, | | | | |
| Improvement, Series B-1, 5.00%, 11/15/38 | | 4,000,000 | | 4,338,680 |
| Series D-1, 5.25%, 11/15/33 | | 5,000,000 | | 5,641,950 |
| Colorado State Board of Governors University Enterprise System Revenue, | | | | |
| Series A, 5.00%, 3/01/34 | | 25,000 | | 26,398 |
| Series A, 5.00%, 3/01/39 | | 145,000 | | 151,632 |
| Series A, NATL RE, FGIC Insured, 5.00%, 3/01/37 | | 1,755,000 | | 1,818,987 |
| 98 | Annual Report | | | | |
| | | | |
| Franklin Tax-Free Trust | | | | |
| |
| Statement of Investments, February 28, 2014 (continued) | | | | |
| |
| |
| Franklin Colorado Tax-Free Income Fund | | Principal Amount | | Value |
| Municipal Bonds (continued) | | | | |
| Colorado (continued) | | | | |
| Colorado State Board of Governors University Enterprise System Revenue, (continued) | | | | |
| Series A, NATL RE, FGIC Insured, Pre-Refunded, 5.00%, 3/01/37 | $ | 11,245,000 | $ | 12,755,091 |
| Series A, Pre-Refunded, 5.00%, 3/01/34 | | 2,225,000 | | 2,647,505 |
| Series A, Pre-Refunded, 5.00%, 3/01/39 | | 7,055,000 | | 8,394,674 |
| Series C, 5.00%, 3/01/44 | | 5,135,000 | | 5,451,778 |
| Colorado State Building Excellent Schools Today COP, | | | | |
| Series G, 5.00%, 3/15/32 | | 10,000,000 | | 10,657,700 |
| Series I, 5.00%, 3/15/36 | | 3,000,000 | | 3,232,920 |
| Colorado State COP, UCDHSC Fitzsimons Academic Projects, Refunding, Series A, 5.00%, | | | | |
| 11/01/28 | | 1,500,000 | | 1,668,630 |
| 11/01/29 | | 3,105,000 | | 3,424,784 |
| Colorado State Health Facilities Authority Revenue, | | | | |
| Boulder Community Hospital Project, Refunding, Series A, 6.00%, 10/01/35 | | 5,500,000 | | 5,941,980 |
| Catholic Health Initiatives, Refunding, Series A, 5.00%, 7/01/39 | | 5,000,000 | | 5,091,100 |
| Catholic Health Initiatives, Series D, 6.125%, 10/01/28 | | 2,500,000 | | 2,825,700 |
| Catholic Health Initiatives, Series D, 6.25%, 10/01/33 | | 2,000,000 | | 2,265,680 |
| Covenant Retirement Community Inc., Series A, 5.75%, 12/01/36 | | 5,000,000 | | 5,006,900 |
| Hospital, NCMC Inc. Project, Series A, AGMC Insured, 5.50%, 5/15/30 | | 7,900,000 | | 8,314,039 |
| Hospital, Refunding, Series C, AGMC Insured, 5.25%, 3/01/40 | | 5,000,000 | | 5,163,550 |
| Parkview Medical Center Inc. Project, Series A, 5.00%, 9/01/37 | | 8,000,000 | | 8,125,200 |
| Poudre Valley Health Care Inc. and Medical Center of the Rockies, Refunding, Series A, | | | | |
| AGMC Insured, 5.20%, 3/01/31 | | 9,500,000 | | 10,001,600 |
| Sisters of Charity of Leavenworth Health System, Refunding, Series A, 5.00%, 1/01/40 | | 7,320,000 | | 7,565,806 |
| The Evangelical Lutheran Good Samaritan Society Project, 5.50%, 6/01/33 | | 1,000,000 | | 1,060,090 |
| The Evangelical Lutheran Good Samaritan Society Project, 5.625%, 6/01/43 | | 4,000,000 | | 4,188,880 |
| The Evangelical Lutheran Good Samaritan Society Project, Refunding, 5.00%, 12/01/33 | | 2,500,000 | | 2,535,200 |
| The Evangelical Lutheran Good Samaritan Society Project, Series A, Pre-Refunded, | | | | |
| 6.125%, 6/01/38 | | 4,500,000 | | 4,563,945 |
| Valley View Hospital Assn. Project, Refunding, 5.75%, 5/15/36 | | 2,000,000 | | 2,066,640 |
| Yampa Valley Medical Center Project, Refunding, 5.125%, 9/15/29 | | 4,000,000 | | 4,010,800 |
| Colorado State Higher Education Capital Construction Lease Purchase Financing Program COP, | | | | |
| 5.50%, 11/01/27 | | 5,245,000 | | 5,907,706 |
| Pre-Refunded, 5.50%, 11/01/27 | | 2,030,000 | | 2,446,556 |
| Colorado State School of Mines of Board of Trustees Institutional Enterprise Revenue, | | | | |
| Series B, 5.00%, 12/01/32 | | 1,000,000 | | 1,097,040 |
| Colorado Water Resources and Power Development Authority Clean Water Revenue, Series A, | | | | |
| 6.30%, 9/01/14 | | 5,000 | | 5,022 |
| Colorado Water Resources and Power Development Authority Water Resources Revenue, | | | | |
| Arapahoe County Water and Wastewater Public Improvement District Project, Series E, | | | | |
| NATL Insured, 5.00%, 12/01/35 | | 10,000,000 | | 10,088,700 |
| Donala Water and Sanitation District Project, Series C, 5.00%, 9/01/36 | | 1,900,000 | | 2,026,977 |
| Fountain Colorado Electric Water and Wastewater Utility Enterprise Project, Series A, | | | | |
| AGMC Insured, 5.00%, 9/01/38 | | 1,210,000 | | 1,279,406 |
| Commerce City COP, AMBAC Insured, 5.00%, 12/15/37 | | 13,975,000 | | 14,154,579 |
| Commerce City Northern Infrastructure General Improvement District GO, Refunding and Improvement, | | | | |
| AGMC Insured, 5.00%, 12/01/31 | | 2,040,000 | | 2,203,139 |
| Consolidated Bell Mountain Ranch Metropolitan District GO, Douglas County, Refunding, | | | | |
| AGMC Insured, 5.00%, 12/01/39 | | 3,160,000 | | 3,226,802 |
| Denver City and County Airport System Revenue, Subordinate, Series B, 5.00%, 11/15/43 | | 5,000,000 | | 5,142,850 |
| |
| | | Annual Report | 99 |
| | | | | |
| | Franklin Tax-Free Trust | | | | |
| |
| | Statement of Investments, February 28, 2014 (continued) | | | | |
| |
| |
| | Franklin Colorado Tax-Free Income Fund | | Principal Amount | | Value |
| | Municipal Bonds (continued) | | | | |
| | Colorado (continued) | | | | |
| | Denver City and County School District No. 1 COP, Series C, 5.00%, 12/15/30 | $ | 4,000,000 | $ | 4,368,240 |
| | Denver Convention Center Hotel Authority Revenue, senior bond, Refunding, XLCA Insured, | | | | |
| | 5.00%, 12/01/30 | | 14,500,000 | | 14,635,285 |
| | Denver Health and Hospital Authority Healthcare Recovery Zone Facility Revenue, | | | | |
| | 5.50%, 12/01/30 | | 1,500,000 | | 1,548,390 |
| | 5.625%, 12/01/40 | | 4,000,000 | | 4,074,760 |
| | Refunding, Series A, 5.25%, 12/01/31 | | 9,250,000 | | 9,570,882 |
| | Series A, Pre-Refunded, 6.25%, 12/01/33 | | 3,250,000 | | 3,395,340 |
| | Dove Valley Metropolitan District Arapahoe County GO, Refunding, AGMC Insured, 5.00%, 11/01/35 | | 3,350,000 | | 3,432,176 |
| | E-470 Public Highway Authority Senior Revenue, | | | | |
| | Capital Appreciation, Series A, NATL Insured, zero cpn., 9/01/33 | | 3,000,000 | | 977,040 |
| | Capital Appreciation, Series B, NATL Insured, zero cpn., 9/01/32 | | 7,800,000 | | 2,710,188 |
| | Capital Appreciation, Series B, NATL Insured, zero cpn., 9/01/34 | | 14,075,000 | | 4,301,742 |
| | Series C, 5.25%, 9/01/25 | | 2,500,000 | | 2,681,475 |
| | Series D, Sub Series D-1, NATL Insured, 5.50%, 9/01/24 | | 2,500,000 | | 2,603,700 |
| | Eagle River Water and Sanitation District Enterprise Wastewater Revenue, 5.00%, 12/01/42 | | 3,500,000 | | 3,702,825 |
| | Erie Wastewater Enterprise Revenue, Series A, Assured Guaranty, 5.00%, | | | | |
| | 12/01/33 | | 2,860,000 | | 2,959,213 |
| | 12/01/37 | | 5,120,000 | | 5,234,893 |
| | Erie Water Enterprise Revenue, Series A, AGMC Insured, 5.00%, 12/01/32 | | 10,000,000 | | 10,520,900 |
| | Fort Lewis College Board of Trustees Enterprise Revenue, Series B-1, NATL RE, FGIC Insured, | | | | |
| | 5.00%, 10/01/37 | | 12,830,000 | | 13,017,959 |
| | Gunnison Watershed School District No. RE-1J GO, Gunnison and Saguache Counties, 5.25%, | | | | |
| | 12/01/33 | | 1,240,000 | | 1,370,411 |
| | Ignacio School District 11JT GO, La Plata and Archuleta Counties, 5.00%, 12/01/31 | | 1,215,000 | | 1,336,694 |
| | Meridian Metropolitan District GO, Douglas County, Refunding, Series A, 5.00%, 12/01/41 | | 5,000,000 | | 5,135,200 |
| | Mesa State College Board of Trustees Auxiliary Facilities System Enterprise Revenue, | | | | |
| Pre-Refunded, 6.00%, 5/15/38 | | 7,000,000 | | 8,393,210 |
| | Refunding, Series A, 5.00%, 5/15/33 | | 3,455,000 | | 3,630,307 |
| | Mesa State College College Enterprise Revenue, BHAC Insured, 5.125%, 5/15/37 | | 5,765,000 | | 5,948,615 |
| | Park Creek Metropolitan District Revenue, Senior Limited Property Tax Supported, | | | | |
| | Refunding, Series A, AGMC Insured, 6.00%, 12/01/38 | | 2,500,000 | | 2,724,800 |
| | Refunding, Series A, AGMC Insured, 6.125%, 12/01/41 | | 2,500,000 | | 2,721,575 |
| | Refunding and Improvement, Assured Guaranty, 6.375%, 12/01/37 | | 7,000,000 | | 7,693,840 |
| | Platte River Power Authority Power Revenue, Series II, 5.00%, 6/01/37 | | 12,000,000 | | 12,921,840 |
| | Poudre Tech Metropolitan District Unlimited Property Tax Supported Revenue, Refunding and | | | | |
| | Improvement, Series A, AGMC Insured, 5.00%, 12/01/39 | | 7,435,000 | | 7,457,677 |
| | Public Authority for Colorado Energy Natural Gas Purchase Revenue, 6.50%, 11/15/38 | | 9,900,000 | | 12,435,984 |
| | Pueblo County COP, County Judicial Complex Project, AGMC Insured, 5.00%, 9/15/42 | | 10,000,000 | | 10,350,700 |
| | Pueblo Urban Renewal Authority Revenue, Refunding and Improvement, Series B, | | | | |
| | 5.25%, 12/01/28 | | 1,000,000 | | 1,085,200 |
| | 5.50%, 12/01/31 | | 1,010,000 | | 1,098,698 |
| | 5.25%, 12/01/38 | | 3,615,000 | | 3,768,674 |
| | Rangeview Library District COP, Rangeview Library District Projects, Assured Guaranty, 5.00%, | | | | |
| | 12/15/30 | | 3,840,000 | | 4,037,683 |
| | Regional Transportation District COP, | | | | |
| | Refunding, Series A, 5.00%, 6/01/27 | | 5,500,000 | | 6,054,895 |
| | Series A, 5.375%, 6/01/31 | | 19,000,000 | | 20,472,120 |
100 | Annual Report
| | | | |
| Franklin Tax-Free Trust | | | | |
| |
| Statement of Investments, February 28, 2014 (continued) | | | | |
| |
| |
| Franklin Colorado Tax-Free Income Fund | | Principal Amount | | Value |
| Municipal Bonds (continued) | | | | |
| Colorado (continued) | | | | |
| Regional Transportation District Sales Tax Revenue, FasTracks Project, Series A, | | | | |
| 5.00%, 11/01/38 | $ | 10,000,000 | $ | 10,584,700 |
| AMBAC Insured, Pre-Refunded, 5.00%, 11/01/31 | | 11,150,000 | | 12,525,575 |
| Thornton Development Authority Tax Increment Revenue, North Washington Street Urban Renewal | | | | |
| Project, NATL Insured, 5.00%, 12/01/29 | | 6,100,000 | | 6,178,324 |
| Triview Metropolitan District GO, El Paso County, Refunding, 5.00%, 11/01/34 | | 10,855,000 | | 11,090,119 |
| University of Colorado Enterprise System Revenue, University of Colorado Regents, | | | | |
| Series A, 5.375%, 6/01/38 | | 3,000,000 | | 3,312,270 |
| Series B, NATL Insured, 5.00%, 6/01/32 | | 3,000,000 | | 3,203,850 |
| University of Colorado Hospital Authority Revenue, | | | | |
| Refunding, Series A, 6.00%, 11/15/29 | | 5,000,000 | | 5,662,050 |
| Series A, 5.00%, 11/15/37 | | 2,000,000 | | 2,035,600 |
| Series A, 5.25%, 11/15/39 | | 3,000,000 | | 3,093,780 |
| University of Northern Colorado Greeley Institutional Enterprise Revenue, Refunding, Series A, | | | | |
| 5.00%, 6/01/30 | | 1,690,000 | | 1,832,771 |
| Western State College Revenue, 5.00%, | | | | |
| 5/15/34 | | 2,000,000 | | 2,077,640 |
| 5/15/39 | | 2,000,000 | | 2,061,620 |
| Woodmoor Water and Sanitation District No. 1 Enterprise Water and Wastewater Revenue, | | | | |
| 5.00%, 12/01/36 | | 5,000,000 | | 5,343,400 |
| | | | | 597,083,104 |
| U.S. Territories 7.6% | | | | |
| Guam 0.9% | | | | |
| Guam Government Limited Obligation Revenue, Section 30, Series A, | | | | |
| 5.375%, 12/01/24 | | 2,000,000 | | 2,115,460 |
| 5.75%, 12/01/34 | | 3,565,000 | | 3,684,107 |
| | | | | 5,799,567 |
| Puerto Rico 6.4% | | | | |
| Puerto Rico Commonwealth Highways and Transportation Authority Highway Revenue, Refunding, | | | | |
| Series AA-2, 5.30%, 7/01/35 | | 5,000,000 | | 3,638,800 |
| Puerto Rico Commonwealth Highways and Transportation Authority Transportation Revenue, Refunding, | | | | |
| Series H, 5.45%, 7/01/35 | | 460,000 | | 279,510 |
| Puerto Rico Electric Power Authority Power Revenue, Series XX, 5.25%, 7/01/40 | | 11,410,000 | | 7,593,469 |
| Puerto Rico Industrial Tourist Educational Medical and Environmental Control Facilities Financing | | | | |
| Authority Industrial Revenue, Guaynabo Municipal Government Center Project, 5.625%, | | | | |
| 7/01/22 | | 1,335,000 | | 1,049,590 |
| Puerto Rico PBA Guaranteed Revenue, Government Facilities, Refunding, Series D, 5.375%, | | | | |
| 7/01/33 | | 2,120,000 | | 1,610,903 |
| Puerto Rico Sales Tax FICO Sales Tax Revenue, | | | | |
| first subordinate, Refunding, Series C, 5.375%, 8/01/38 | | 2,370,000 | | 1,864,692 |
| first subordinate, Series A, 5.50%, 8/01/37 | | 5,000,000 | | 3,936,050 |
| first subordinate, Series A, 6.375%, 8/01/39 | | 10,000,000 | | 8,540,500 |
| first subordinate, Series A, 5.50%, 8/01/42 | | 3,000,000 | | 2,356,560 |
| first subordinate, Series C, 5.50%, 8/01/40 | | 10,000,000 | | 7,953,600 |
| Senior Series C, 5.25%, 8/01/40 | | 4,560,000 | | 3,829,534 |
| | | | | 42,653,208 |
| |
| |
| | | Annual Report | 101 |
| | | | |
| Franklin Tax-Free Trust | | | | |
| |
| Statement of Investments, February 28, 2014 (continued) | | | | |
| |
| Franklin Colorado Tax-Free Income Fund | | Principal Amount | | Value |
| Municipal Bonds (continued) | | | | |
| U.S. Territories (continued) | | | | |
| U.S. Virgin Islands 0.3% | | | | |
| Virgin Islands PFAR, Virgin Islands Matching Fund Loan Note, Working Capital, sub. lien, Refunding, | | | | |
| Series B, 5.25%, 10/01/29 | $ | 1,800,000 | $ | 1,866,690 |
| Total U.S. Territories | | | | 50,319,465 |
| Total Municipal Bonds (Cost $633,794,498) 97.7% | | | | 647,402,569 |
| Other Assets, less Liabilities 2.3% | | | | 14,970,110 |
| Net Assets 100.0% | | | $ | 662,372,679 |
See Abbreviations on page 181.
102 | The accompanying notes are an integral part of these financial statements. | Annual Report
| | | | | | | | | | | | | | | |
| Franklin Tax-Free Trust | | | | | | | | | | | | | | | |
| Financial Highlights | | | | | | | | | | | | | | | |
| |
| Franklin Connecticut Tax-Free Income Fund | | | | | | | | | | | | | | | |
| | | | | | Year Ended February 28, | | | | |
| Class A | | 2014 | | | 2013 | | | 2012 | a | | 2011 | | | 2010 | |
| Per share operating performance | | | | | | | | | | | | | | | |
| (for a share outstanding throughout the year) | | | | | | | | | | | | | | | |
| Net asset value, beginning of year | $ | 11.43 | | $ | 11.36 | | $ | 10.45 | | $ | 10.88 | | $ | 10.18 | |
| Income from investment operationsb: | | | | | | | | | | | | | | | |
| Net investment incomec | | 0.40 | | | 0.40 | | | 0.46 | | | 0.45 | | | 0.46 | |
| Net realized and unrealized gains (losses) | | (0.80 | ) | | 0.08 | | | 0.91 | | | (0.43 | ) | | 0.69 | |
| Total from investment operations | | (0.40 | ) | | 0.48 | | | 1.37 | | | 0.02 | | | 1.15 | |
| Less distributions from net investment income | | (0.38 | ) | | (0.41 | ) | | (0.46 | ) | | (0.45 | ) | | (0.45 | ) |
| Net asset value, end of year | $ | 10.65 | | $ | 11.43 | | $ | 11.36 | | $ | 10.45 | | $ | 10.88 | |
| |
| Total returnd | | (3.44 | )% | | 4.25 | % | | 13.34 | % | | 0.13 | % | | 11.50 | % |
| |
| Ratios to average net assets | | | | | | | | | | | | | | | |
| Expenses | | 0.67 | % | | 0.66 | % | | 0.67 | % | | 0.66 | % | | 0.68 | % |
| Net investment income | | 3.71 | % | | 3.49 | % | | 4.18 | % | | 4.12 | % | | 4.29 | % |
| |
| Supplemental data | | | | | | | | | | | | | | | |
| Net assets, end of year (000’s) | $ | 301,323 | | $ | 404,713 | | $ | 388,571 | | $ | 367,664 | | $ | 405,070 | |
| Portfolio turnover rate | | 8.24 | % | | 20.69 | % | | 13.90 | % | | 15.40 | % | | 3.67 | % |
aFor the year ended February 29.
bThe amount shown for a share outstanding throughout the period may not correlate with the Statement of Operations for the period due to the timing of sales and repurchases of
the Fund shares in relation to income earned and/or fluctuating market value of the investments of the Fund.
cBased on average daily shares outstanding.
dTotal return does not reflect sales commissions or contingent deferred sales charges, if applicable.
Annual Report | The accompanying notes are an integral part of these financial statements. | 103
| | | | | | | | | | | | | | | |
| Franklin Tax-Free Trust | | | | | | | | | | | | | | | |
| Financial Highlights (continued) | | | | | | | | | | | | | | | |
| |
| Franklin Connecticut Tax-Free Income Fund | | | | | | | | | | | | | | | |
| | | | | | Year Ended February 28, | | | | |
| Class C | | 2014 | | | 2013 | | | 2012 | a | | 2011 | | | 2010 | |
| Per share operating performance | | | | | | | | | | | | | | | |
| (for a share outstanding throughout the year) | | | | | | | | | | | | | | | |
| Net asset value, beginning of year | $ | 11.51 | | $ | 11.43 | | $ | 10.52 | | $ | 10.94 | | $ | 10.24 | |
| Income from investment operationsb: | | | | | | | | | | | | | | | |
| Net investment incomec | | 0.34 | | | 0.34 | | | 0.40 | | | 0.39 | | | 0.40 | |
| Net realized and unrealized gains (losses) | | (0.80 | ) | | 0.08 | | | 0.91 | | | (0.42 | ) | | 0.69 | |
| Total from investment operations | | (0.46 | ) | | 0.42 | | | 1.31 | | | (0.03 | ) | | 1.09 | |
| Less distributions from net investment income | | (0.32 | ) | | (0.34 | ) | | (0.40 | ) | | (0.39 | ) | | (0.39 | ) |
| Net asset value, end of year | $ | 10.73 | | $ | 11.51 | | $ | 11.43 | | $ | 10.52 | | $ | 10.94 | |
| |
| Total returnd | | (3.94 | )% | | 3.73 | % | | 12.65 | % | | (0.34 | )% | | 10.83 | % |
| |
| Ratios to average net assets | | | | | | | | | | | | | | | |
| Expenses | | 1.22 | % | | 1.21 | % | | 1.22 | % | | 1.21 | % | | 1.23 | % |
| Net investment income | | 3.16 | % | | 2.94 | % | | 3.63 | % | | 3.57 | % | | 3.74 | % |
| |
| Supplemental data | | | | | | | | | | | | | | | |
| Net assets, end of year (000’s) | $ | 75,730 | | $ | 122,232 | | $ | 105,619 | | $ | 90,659 | | $ | 94,058 | |
| Portfolio turnover rate | | 8.24 | % | | 20.69 | % | | 13.90 | % | | 15.40 | % | | 3.67 | % |
aFor the year ended February 29.
bThe amount shown for a share outstanding throughout the period may not correlate with the Statement of Operations for the period due to the timing of sales and repurchases of
the Fund shares in relation to income earned and/or fluctuating market value of the investments of the Fund.
cBased on average daily shares outstanding.
dTotal return does not reflect sales commissions or contingent deferred sales charges, if applicable.
104 | The accompanying notes are an integral part of these financial statements. | Annual Report
| | | | | | | | | | | | | | | |
| Franklin Tax-Free Trust | | | | | | | | | | | | | | | |
| Financial Highlights (continued) | | | | | | | | | | | | | | | |
| |
| Franklin Connecticut Tax-Free Income Fund | | | | | | | | | | | | | | | |
| | | | | | Year Ended February 28, | | | | |
| Advisor Class | | 2014 | | | 2013 | | | 2012 | a | | 2011 | | | 2010 | b |
| Per share operating performance | | | | | | | | | | | | | | | |
| (for a share outstanding throughout the year) | | | | | | | | | | | | | | | |
| Net asset value, beginning of year | $ | 11.42 | | $ | 11.35 | | $ | 10.45 | | $ | 10.87 | | $ | 10.45 | |
| Income from investment operationsc: | | | | | | | | | | | | | | | |
| Net investment incomed | | 0.41 | | | 0.41 | | | 0.47 | | | 0.46 | | | 0.29 | |
| Net realized and unrealized gains (losses) | | (0.80 | ) | | 0.08 | | | 0.90 | | | (0.42 | ) | | 0.41 | |
| Total from investment operations | | (0.39 | ) | | 0.49 | | | 1.37 | | | 0.04 | | | 0.70 | |
| Less distributions from net investment income | | (0.39 | ) | | (0.42 | ) | | (0.47 | ) | | (0.46 | ) | | (0.28 | ) |
| Net asset value, end of year | $ | 10.64 | | $ | 11.42 | | $ | 11.35 | | $ | 10.45 | | $ | 10.87 | |
| |
| Total returne | | (3.34 | )% | | 4.35 | % | | 13.36 | % | | 0.33 | % | | 6.78 | % |
| |
| Ratios to average net assetsf | | | | | | | | | | | | | | | |
| Expenses | | 0.57 | % | | 0.56 | % | | 0.57 | % | | 0.56 | % | | 0.58 | % |
| Net investment income | | 3.81 | % | | 3.59 | % | | 4.28 | % | | 4.22 | % | | 4.39 | % |
| |
| Supplemental data | | | | | | | | | | | | | | | |
| Net assets, end of year (000’s) | $ | 15,904 | | $ | 30,975 | | $ | 23,667 | | $ | 19,295 | | $ | 11,030 | |
| Portfolio turnover rate | | 8.24 | % | | 20.69 | % | | 13.90 | % | | 15.40 | % | | 3.67 | % |
aFor the year ended February 29.
bFor the period July 15, 2009 (effective date) to February 28, 2010.
cThe amount shown for a share outstanding throughout the period may not correlate with the Statement of Operations for the period due to the timing of sales and repurchases of
the Fund shares in relation to income earned and/or fluctuating market value of the investments of the Fund.
dBased on average daily shares outstanding.
eTotal return is not annualized for periods less than one year.
fRatios are annualized for periods less than one year.
Annual Report | The accompanying notes are an integral part of these financial statements. | 105
| | | | |
| Franklin Tax-Free Trust | | | | |
| |
| Statement of Investments, February 28, 2014 | | | | |
| |
| |
| Franklin Connecticut Tax-Free Income Fund | | Principal Amount | | Value |
| Municipal Bonds 96.3% | | | | |
| Connecticut 85.4% | | | | |
| Bridgeport GO, Series A, 5.00%, 2/15/32 | $ | 10,000,000 | $ | 10,507,800 |
| Connecticut State GO, | | | | |
| Series A, 5.00%, 2/15/29 | | 10,000,000 | | 11,254,900 |
| Series C, AGMC Insured, 5.00%, 6/01/26 | | 5,000,000 | | 5,389,500 |
| Connecticut State Health and Educational Facilities Authority Revenue, | | | | |
| Ascension Health Senior Credit Group, Series A, 5.00%, 11/15/40 | | 18,520,000 | | 19,501,930 |
| Child Care Facilities Program, Series G, Assured Guaranty, 6.00%, 7/01/28 | | 2,250,000 | | 2,483,190 |
| Connecticut State University System Issue, Series N, 5.00%, 11/01/29 | | 5,060,000 | | 5,708,085 |
| Eastern Connecticut Health Network Issue, Refunding, Series A, Radian Insured, 6.00%, | | | | |
| 7/01/25 | | 2,965,000 | | 2,966,097 |
| Eastern Connecticut Health Network Issue, Refunding, Series C, Radian Insured, 5.125%, | | | | |
| 7/01/30 | | 2,500,000 | | 2,504,075 |
| Fairfield University Issue, Series M, 5.00%, 7/01/26 | | 450,000 | | 490,023 |
| Fairfield University Issue, Series M, 5.00%, 7/01/34 | | 1,000,000 | | 1,043,310 |
| Fairfield University Issue, Series N, 5.00%, 7/01/29 | | 7,000,000 | | 7,463,750 |
| Fairfield University Issues, New Money, Series O, 5.00%, 7/01/35 | | 4,000,000 | | 4,175,840 |
| Fairfield University Issues, New Money, Series O, 5.00%, 7/01/40 | | 5,000,000 | | 5,163,700 |
| Hartford Healthcare Issue, Refunding, Series A, 5.00%, 7/01/41 | | 12,000,000 | | 12,197,760 |
| The Loomis Chafee School Issue, Series G, 5.00%, 7/01/30 | | 3,000,000 | | 3,150,630 |
| The Loomis Chafee School Issue, Series G, 5.00%, 7/01/38 | | 6,285,000 | | 6,481,469 |
| Lutheran General Health Care System, ETM, 7.375%, 7/01/19 | | 255,000 | | 290,629 |
| Miss Porter's School Issue, Series B, AMBAC Insured, 5.00%, 7/01/36 | | 4,415,000 | | 4,564,271 |
| New Horizons Village Project, 7.30%, 11/01/16 | | 1,425,000 | | 1,432,310 |
| Norwich Free Academy Issue, Series A, AMBAC Insured, Pre-Refunded, 5.00%, 7/01/34 | | 1,675,000 | | 1,701,046 |
| Quinnipiac University Issue, Series H, AMBAC Insured, 5.00%, 7/01/36 | | 5,000,000 | | 5,131,900 |
| Quinnipiac University Issue, Series J, NATL Insured, 5.00%, 7/01/37 | | 15,000,000 | | 15,565,050 |
| Sacred Heart University Issue, Series G, 5.375%, 7/01/31 | | 1,500,000 | | 1,565,790 |
| Sacred Heart University Issue, Series G, 5.625%, 7/01/41 | | 5,500,000 | | 5,752,780 |
| Sacred Heart University Issue, Series H, AGMC Insured, 5.00%, 7/01/27 | | 1,190,000 | | 1,288,354 |
| Sacred Heart University Issue, Series H, AGMC Insured, 5.00%, 7/01/28 | | 2,290,000 | | 2,460,697 |
| Salisbury School Issue, Series C, Assured Guaranty, 5.00%, 7/01/38 | | 5,000,000 | | 5,198,400 |
| St. Mary's Hospital Issue, Refunding, Series E, 5.50%, 7/01/20 | | 4,615,000 | | 4,615,185 |
| Stamford Hospital Issue, Series I, 5.00%, 7/01/30 | | 5,000,000 | | 5,188,850 |
| Stamford Hospital Issue, Series J, 5.00%, 7/01/42 | | 5,000,000 | | 5,009,750 |
| Trinity College Issue, Series H, NATL Insured, 5.00%, 7/01/26 | | 1,855,000 | | 1,869,098 |
| University of Hartford Issue, Series G, Radian Insured, 5.25%, 7/01/26 | | 5,000,000 | | 5,080,400 |
| Wesleyan University Issue, Series G, 5.00%, 7/01/39 | | 10,000,000 | | 10,767,200 |
| Western Connecticut Health Network Issue, Series M, 5.375%, 7/01/41 | | 7,000,000 | | 7,413,840 |
| Westminster School Issue, Series E, XLCA Insured, 5.00%, 7/01/37 | | 10,660,000 | | 10,977,881 |
| The William W. Backus Hospital Issue, Series F, AGMC Insured, Pre-Refunded, 5.00%, | | | | |
| 7/01/28 | | 1,500,000 | | 1,765,005 |
| The William W. Backus Hospital Issue, Series F, AGMC Insured, Pre-Refunded, 5.125%, | | | | |
| 7/01/35 | | 4,025,000 | | 4,757,429 |
| Yale University Issue, Series A-2, 5.00%, 7/01/40 | | 9,000,000 | | 9,607,500 |
| Yale University Issue, Series Y-1, 5.00%, 7/01/35 | | 10,000,000 | | 10,387,900 |
| Yale University Issue, Series Z-1, 5.00%, 7/01/42 | | 10,000,000 | | 10,548,700 |
| Yale-New Haven Hospital Issue, Series J-1, AMBAC Insured, 5.00%, 7/01/31 | | 10,500,000 | | 10,874,010 |
| Yale-New Haven Hospital Issue, Series N, 5.00%, 7/01/48 | | 5,000,000 | | 5,196,050 |
106 | Annual Report
| | | | | | |
| | Franklin Tax-Free Trust | | | | | |
| |
| | Statement of Investments, February 28, 2014 (continued) | | | | | |
| |
| |
| | Franklin Connecticut Tax-Free Income Fund | | | Principal Amount | | Value |
| | Municipal Bonds (continued) | | | | | |
| | Connecticut (continued) | | | | | |
| | Connecticut State HFA Housing Mortgage Finance Program Revenue, Series C, Sub Series C-1, | | | | | |
| | 4.85%, 11/15/34 | | $ | 3,260,000 | $ | 3,339,414 |
| | 4.95%, 11/15/39 | | | 3,820,000 | | 3,886,201 |
| | Connecticut State HFAR, | | | | | |
| | Housing Mortgage Finance Program, Series B, Sub Series B-2, 5.00%, 11/15/41 | | | 1,040,000 | | 1,074,174 |
| | Special Obligation, Special Needs Housing Mortgage Finance Program, Series 1, AMBAC Insured, | | | | | |
| | 5.00%, 6/15/22 | | | 920,000 | | 924,858 |
| | Special Obligation, Special Needs Housing Mortgage Finance Program, Series 1, AMBAC Insured, | | | | | |
| | 5.00%, 6/15/32 | | | 1,000,000 | | 1,001,820 |
| | State Supported Special Obligation, Series 10, 5.00%, 6/15/28 | | | 420,000 | | 450,517 |
| | State Supported Special Obligation, Series 13, 5.00%, 6/15/40 | | | 1,500,000 | | 1,564,680 |
| | Connecticut State Higher Education Supplemental Loan Authority Revenue, CHESLA Loan Program, | | | | | |
| | Series A, 5.05%, 11/15/27 | | | 850,000 | | 905,242 |
| | Connecticut State Municipal Electric Energy Cooperative Power Supply System Revenue, Refunding, | | | | | |
| | Series A, 5.00%, 1/01/38 | | | 3,000,000 | | 3,188,880 |
| | Connecticut State Revolving Fund General Revenue, Series A, | | | | | |
| | 5.00%, 3/01/25 | | | 3,000,000 | | 3,571,170 |
| | 5.00%, 3/01/31 | | | 5,000,000 | | 5,673,150 |
| Pre-Refunded, 5.00%, 7/01/26 | | | 6,025,000 | | 6,682,749 |
| Pre-Refunded, 5.00%, 7/01/27 | | | 4,060,000 | | 4,503,230 |
| | Connecticut State Special Tax Obligation Revenue, Transportation Infrastructure Purposes, Series A, | | | | | |
| | 5.00%, | | | | | |
| | 12/01/28 | | | 5,095,000 | | 5,707,929 |
| | 10/01/30 | | | 5,000,000 | | 5,640,150 |
| | Connecticut Transmission Municipal Electric Energy Cooperative Transmission System Revenue, | | | | | |
| | Series A, 5.00%, 1/01/42 | | | 5,000,000 | | 5,281,100 |
| | Greater New Haven Water Pollution Control Authority Regional Water Revenue, | | | | | |
| | Refunding, Series A, NATL Insured, 5.00%, 11/15/24 | | | 3,315,000 | | 3,467,324 |
| | Series A, AGMC Insured, 5.00%, 11/15/37 | | | 3,000,000 | | 3,119,250 |
| | Hartford County Metropolitan District Clean Water Project Revenue, Refunding, Series A, 5.00%, | | | | | |
| | 4/01/36 | | | 5,000,000 | | 5,410,000 |
| | New Haven GO, | | | | | |
| | Series A, Assured Guaranty, 5.00%, 3/01/29 | | | 1,000,000 | | 1,043,440 |
| | Series C, NATL Insured, ETM, 5.00%, 11/01/22 | | | 25,000 | | 25,080 |
| | South Central Regional Water Authority Water System Revenue, | | | | | |
| | Eighteenth Series B, NATL Insured, 5.25%, 8/01/29 | | | 1,000,000 | | 1,076,480 |
| | Eighteenth Series B, NATL Insured, 5.25%, 8/01/32 | | | 1,000,000 | | 1,066,250 |
| | Eighteenth Series B-1, NATL Insured, 5.00%, 8/01/26 | | | 3,500,000 | | 3,542,245 |
| | Refunding, Twenty-Second Series, AGMC Insured, 5.00%, 8/01/38 | | | 5,000,000 | | 5,232,850 |
| | Stamford Water Pollution Control System and Facility Revenue, Refunding, Series A, 5.25%, | | | | | |
| | 8/15/43 | | | 1,000,000 | | 1,100,800 |
| | University of Connecticut GO, Series A, 5.00%, 8/15/28 | | | 6,590,000 | | 7,475,432 |
| | | | | | | 335,446,499 |
Annual Report | 107
| | | | |
| Franklin Tax-Free Trust | | | | |
| |
| Statement of Investments, February 28, 2014 (continued) | | | | |
| |
| |
| Franklin Connecticut Tax-Free Income Fund | | Principal Amount | | Value |
| Municipal Bonds (continued) | | | | |
| U.S. Territories 10.9% | | | | |
| Puerto Rico 10.7% | | | | |
| Puerto Rico Commonwealth Aqueduct and Sewer Authority Revenue, senior lien, Series A, 6.00%, | | | | |
| 7/01/44 | $ | 1,000,000 | $ | 761,220 |
| Puerto Rico Commonwealth GO, Public Improvement, | | | | |
| Refunding, Series B, 6.00%, 7/01/39 | | 10,000,000 | | 7,911,800 |
| Series B, Pre-Refunded, 5.00%, 7/01/35 | | 3,105,000 | | 3,446,271 |
| Puerto Rico Commonwealth Highways and Transportation Authority Transportation Revenue, | | | | |
| Refunding, Series A, 5.00%, 7/01/38 | | 55,000 | | 30,809 |
| Series G, 5.00%, 7/01/33 | | 395,000 | | 231,940 |
| Puerto Rico Electric Power Authority Power Revenue, | | | | |
| Series RR, XLCA Insured, Pre-Refunded, 5.00%, 7/01/30 | | 1,000,000 | | 1,063,490 |
| Series WW, 5.50%, 7/01/38 | | 6,700,000 | | 4,554,794 |
| Puerto Rico HFAR, Capital Fund Modernization Program, Puerto Rico Public Housing Projects, | | | | |
| Refunding, 5.125%, 12/01/27 | | 745,000 | | 746,341 |
| Puerto Rico Industrial Tourist Educational Medical and Environmental Control Facilities Financing | | | | |
| Authority Industrial Revenue, Guaynabo Warehouse for Emergencies Project, Series A, | | | | |
| 5.15%, 7/01/19 | | 2,380,000 | | 1,980,231 |
| Puerto Rico Infrastructure Financing Authority Revenue, Ports Authority Project, Series B, 5.25%, | | | | |
| 12/15/26 | | 5,000,000 | | 3,062,950 |
| Puerto Rico Sales Tax FICO Sales Tax Revenue, first subordinate, Series A, 6.00%, 8/01/42 | | 22,000,000 | | 18,141,640 |
| | | | | 41,931,486 |
| U.S. Virgin Islands 0.2% | | | | |
| Virgin Islands PFAR, senior lien, Capital Projects, Series A-1, 5.00%, 10/01/29 | | 1,000,000 | | 1,019,920 |
| Total U.S. Territories | | | | 42,951,406 |
| Total Municipal Bonds before Short Term Investments (Cost $377,843,615) | | | | 378,397,905 |
| Short Term Investments (Cost $1,000,000) 0.2% | | | | |
| Municipal Bonds 0.2% | | | | |
| Connecticut 0.2% | | | | |
| aConnecticut State HFA Housing Mortgage Finance Program Revenue, Refunding, Series C, | | | | |
| Sub Series C-2, Daily VRDN and Put, 0.03%, 11/15/36 | | 1,000,000 | | 1,000,000 |
| Total Investments (Cost $378,843,615) 96.5% | | | | 379,397,905 |
| Other Assets, less Liabilities 3.5% | | | | 13,560,069 |
| Net Assets 100.0% | | | $ | 392,957,974 |
See Abbreviations on page 181.
aVariable rate demand notes (VRDNs) are tax-exempt obligations which contain a floating or variable interest rate adjustment formula and an unconditional right of demand to
receive payment of the principal balance plus accrued interest at specified dates. The coupon rate shown represents the rate at period end.
108 | The accompanying notes are an integral part of these financial statements. | Annual Report
| | | | | | | | | | | | | | | |
| Franklin Tax-Free Trust | | | | | | | | | | | | | |
| Financial Highlights | | | | | | | | | | | | | | | |
| |
| Franklin Michigan Tax-Free Income Fund | | | | | | | | | | | | | | | |
| | | | | | Year Ended February 28, | | | | |
| Class A | | 2014 | | | 2013 | | | 2012 | a | | 2011 | | | 2010 | |
| Per share operating performance | | | | | | | | | | | | | | | |
| (for a share outstanding throughout the year) | | | | | | | | | | | | | | | |
| Net asset value, beginning of year | $ | 12.36 | | $ | 12.23 | | $ | 11.52 | | $ | 11.97 | | $ | 11.48 | |
| Income from investment operationsb: | | | | | | | | | | | | | | | |
| Net investment incomec | | 0.46 | | | 0.43 | | | 0.50 | | | 0.51 | | | 0.52 | |
| Net realized and unrealized gains (losses) | | (0.70 | ) | | 0.13 | | | 0.71 | | | (0.43 | ) | | 0.49 | |
| Total from investment operations | | (0.24 | ) | | 0.56 | | | 1.21 | | | 0.08 | | | 1.01 | |
| Less distributions from: | | | | | | | | | | | | | | | |
| Net investment income | | (0.45 | ) | | (0.43 | ) | | (0.50 | ) | | (0.51 | ) | | (0.52 | ) |
| Net realized gains | | — | | | — | | | — | | | (0.02 | ) | | — | |
| Total distributions | | (0.45 | ) | | (0.43 | ) | | (0.50 | ) | | (0.53 | ) | | (0.52 | ) |
| Net asset value, end of year | $ | 11.67 | | $ | 12.36 | | $ | 12.23 | | $ | 11.52 | | $ | 11.97 | |
| |
| Total returnd | | (1.90 | )% | | 4.61 | % | | 10.67 | % | | 0.62 | % | | 8.92 | % |
| |
| Ratios to average net assets | | | | | | | | | | | | | | | |
| Expenses | | 0.63 | % | | 0.63 | % | | 0.63 | % | | 0.63 | % | | 0.63 | % |
| Net investment income | | 3.91 | % | | 3.53 | % | | 4.17 | % | | 4.27 | % | | 4.40 | % |
| |
| Supplemental data | | | | | | | | | | | | | | | |
| Net assets, end of year (000’s) | $ | 951,409 | | $ | 1,257,112 | | $ | 1,241,960 | | $ | 1,204,877 | | $ | 1,345,427 | |
| Portfolio turnover rate | | 9.37 | % | | 16.87 | % | | 0.92 | % | | 10.74 | % | | 5.47 | % |
aFor the year ended February 29.
bThe amount shown for a share outstanding throughout the period may not correlate with the Statement of Operations for the period due to the timing of sales and repurchases of
the Fund shares in relation to income earned and/or fluctuating market value of the investments of the Fund.
cBased on average daily shares outstanding.
dTotal return does not reflect sales commissions or contingent deferred sales charges, if applicable.
Annual Report | The accompanying notes are an integral part of these financial statements. | 109
| | | | | | | | | | | | | | | |
| Franklin Tax-Free Trust | | | | | | | | | | | | | | | |
| Financial Highlights (continued) | | | | | | | | | | | | | | | |
| |
| Franklin Michigan Tax-Free Income Fund | | | | | | | | | | | | | | | |
| | | | | | Year Ended February 28, | | | | |
| Class C | | 2014 | | | 2013 | | | 2012 | a | | 2011 | | | 2010 | |
| Per share operating performance | | | | | | | | | | | | | | | |
| (for a share outstanding throughout the year) | | | | | | | | | | | | | | | |
| Net asset value, beginning of year | $ | 12.52 | | $ | 12.39 | | $ | 11.66 | | $ | 12.11 | | $ | 11.61 | |
| Income from investment operationsb: | | | | | | | | | | | | | | | |
| Net investment incomec | | 0.40 | | | 0.37 | | | 0.44 | | | 0.45 | | | 0.46 | |
| Net realized and unrealized gains (losses) | | (0.71 | ) | | 0.12 | | | 0.72 | | | (0.44 | ) | | 0.49 | |
| Total from investment operations | | (0.31 | ) | | 0.49 | | | 1.16 | | | 0.01 | | | 0.95 | |
| Less distributions from: | | | | | | | | | | | | | | | |
| Net investment income | | (0.38 | ) | | (0.36 | ) | | (0.43 | ) | | (0.44 | ) | | (0.45 | ) |
| Net realized gains | | — | | | — | | | — | | | (0.02 | ) | | — | |
| Total distributions | | (0.38 | ) | | (0.36 | ) | | (0.43 | ) | | (0.46 | ) | | (0.45 | ) |
| Net asset value, end of year | $ | 11.83 | | $ | 12.52 | | $ | 12.39 | | $ | 11.66 | | $ | 12.11 | |
| |
| Total returnd | | (2.42 | )% | | 3.97 | % | | 10.13 | % | | 0.04 | % | | 8.31 | % |
| |
| Ratios to average net assets | | | | | | | | | | | | | | | |
| Expenses | | 1.18 | % | | 1.18 | % | | 1.18 | % | | 1.18 | % | | 1.18 | % |
| Net investment income | | 3.36 | % | | 2.98 | % | | 3.62 | % | | 3.72 | % | | 3.85 | % |
| |
| Supplemental data | | | | | | | | | | | | | | | |
| Net assets, end of year (000’s) | $ | 148,136 | | $ | 212,347 | | $ | 192,719 | | $ | 180,024 | | $ | 195,638 | |
| Portfolio turnover rate | | 9.37 | % | | 16.87 | % | | 0.92 | % | | 10.74 | % | | 5.47 | % |
aFor the year ended February 29.
bThe amount shown for a share outstanding throughout the period may not correlate with the Statement of Operations for the period due to the timing of sales and repurchases of
the Fund shares in relation to income earned and/or fluctuating market value of the investments of the Fund.
cBased on average daily shares outstanding.
dTotal return does not reflect sales commissions or contingent deferred sales charges, if applicable.
110 | The accompanying notes are an integral part of these financial statements. | Annual Report
| | | | | | | | | | | | | | | |
| Franklin Tax-Free Trust | | | | | | | | | | | | | | | |
| Financial Highlights (continued) | | | | | | | | | | | | | | | |
| |
| Franklin Michigan Tax-Free Income Fund | | | | | | | | | | | | | | | |
| | | | | | Year Ended February 28, | | | | |
| Advisor Class | | 2014 | | | 2013 | | | 2012 | a | | 2011 | | | 2010 | |
| Per share operating performance | | | | | | | | | | | | | | | |
| (for a share outstanding throughout the year) | | | | | | | | | | | | | | | |
| Net asset value, beginning of year | $ | 12.39 | | $ | 12.26 | | $ | 11.54 | | $ | 11.99 | | $ | 11.49 | |
| Income from investment operationsb: | | | | | | | | | | | | | | | |
| Net investment incomec | | 0.47 | | | 0.45 | | | 0.51 | | | 0.52 | | | 0.53 | |
| Net realized and unrealized gains (losses) | | (0.70 | ) | | 0.12 | | | 0.72 | | | (0.43 | ) | | 0.50 | |
| Total from investment operations | | (0.23 | ) | | 0.57 | | | 1.23 | | | 0.09 | | | 1.03 | |
| Less distributions from: | | | | | | | | | | | | | | | |
| Net investment income | | (0.46 | ) | | (0.44 | ) | | (0.51 | ) | | (0.52 | ) | | (0.53 | ) |
| Net realized gains | | — | | | — | | | — | | | (0.02 | ) | | — | |
| Total distributions | | (0.46 | ) | | (0.44 | ) | | (0.51 | ) | | (0.54 | ) | | (0.53 | ) |
| Net asset value, end of year | $ | 11.70 | | $ | 12.39 | | $ | 12.26 | | $ | 11.54 | | $ | 11.99 | |
| |
| Total return | | (1.80 | )% | | 4.70 | % | | 10.85 | % | | 0.72 | % | | 9.11 | % |
| |
| Ratios to average net assets | | | | | | | | | | | | | | | |
| Expenses | | 0.53 | % | | 0.53 | % | | 0.53 | % | | 0.53 | % | | 0.53 | % |
| Net investment income | | 4.01 | % | | 3.63 | % | | 4.27 | % | | 4.37 | % | | 4.50 | % |
| |
| Supplemental data | | | | | | | | | | | | | | | |
| Net assets, end of year (000’s) | $ | 26,577 | | $ | 20,317 | | $ | 17,451 | | $ | 7,567 | | $ | 3,486 | |
| Portfolio turnover rate | | 9.37 | % | | 16.87 | % | | 0.92 | % | | 10.74 | % | | 5.47 | % |
aFor the year ended February 29.
bThe amount shown for a share outstanding throughout the period may not correlate with the Statement of Operations for the period due to the timing of sales and repurchases of
the Fund shares in relation to income earned and/or fluctuating market value of the investments of the Fund.
cBased on average daily shares outstanding.
Annual Report | The accompanying notes are an integral part of these financial statements. | 111
| | | | |
| Franklin Tax-Free Trust | | | | |
| |
| Statement of Investments, February 28, 2014 | | | | |
| |
| |
| Franklin Michigan Tax-Free Income Fund | | Principal Amount | | Value |
| Municipal Bonds 96.4% | | | | |
| Michigan 89.6% | | | | |
| Adrian City School District GO, AGMC Insured, Pre-Refunded, 5.00%, | | | | |
| 5/01/26 | $ | 1,960,000 | $ | 1,974,778 |
| 5/01/29 | | 2,125,000 | | 2,141,023 |
| 5/01/34 | | 6,690,000 | | 6,740,443 |
| Allendale Public School District GO, School Building and Site, Series A, AGMC Insured, 5.00%, | | | | |
| 5/01/37 | | 11,810,000 | | 12,047,381 |
| Battle Creek School District GO, School Building and Site, AGMC Insured, 5.00%, | | | | |
| 5/01/31 | | 4,000,000 | | 4,258,880 |
| 5/01/34 | | 10,165,000 | | 10,772,359 |
| Bay City School District GO, School Building and Site, AGMC Insured, 5.00%, 5/01/31 | | 6,000,000 | | 6,244,620 |
| Caledonia Community Schools GO, School Building and Site, NATL Insured, 5.00%, | | | | |
| 5/01/26 | | 3,665,000 | | 3,979,604 |
| Central Michigan University Revenue, General, AMBAC Insured, 5.00%, 10/01/34 | | 8,905,000 | | 9,197,173 |
| Chippewa Valley Schools GO, Refunding, 5.00%, | | | | |
| 5/01/28 | | 6,075,000 | | 6,859,465 |
| 5/01/29 | | 6,425,000 | | 7,184,820 |
| 5/01/30 | | 6,420,000 | | 7,120,743 |
| 5/01/31 | | 3,000,000 | | 3,305,310 |
| 5/01/32 | | 3,500,000 | | 3,833,375 |
| Detroit City School District GO, School Building and Site Improvement, Series A, | | | | |
| AGMC Insured, 6.00%, 5/01/29 | | 10,000,000 | | 10,822,900 |
| Detroit GO, | | | | |
| Distribution State Aid, 5.00%, 11/01/30 | | 5,000,000 | | 5,093,150 |
| Distribution State Aid, 5.25%, 11/01/35 | | 5,000,000 | | 5,098,050 |
| Series A, Assured Guaranty, 5.00%, 4/01/28 | | 5,000,000 | | 4,407,550 |
| Series A-1, NATL Insured, 5.00%, 4/01/20 | | 10,610,000 | | 9,434,200 |
| Detroit Sewage Disposal System Revenue, | | | | |
| second lien, Series A, NATL Insured, 5.125%, 7/01/33 | | 18,790,000 | | 18,393,907 |
| senior lien, Refunding, Series A, AGMC Insured, 5.00%, 7/01/32 | | 5,960,000 | | 5,691,025 |
| senior lien, Series B, AGMC Insured, 7.50%, 7/01/33 | | 6,000,000 | | 6,443,640 |
| Detroit Water and Sewerage Department Sewage Disposal System Revenue, senior lien, | | | | |
| Refunding, Series A, AGMC Insured, 5.00%, 7/01/39 | | 5,000,000 | | 4,615,250 |
| Detroit Water Supply System Revenue, | | | | |
| second lien, Refunding, Series C, AGMC Insured, 5.00%, 7/01/33 | | 20,000,000 | | 19,803,000 |
| second lien, Series B, NATL Insured, 5.00%, 7/01/34 | | 8,875,000 | | 8,577,599 |
| senior lien, Refunding, Series B, BHAC Insured, 5.25%, 7/01/35 | | 17,500,000 | | 17,565,625 |
| senior lien, Series A, AGMC Insured, 5.00%, 7/01/34 | | 38,740,000 | | 37,301,584 |
| senior lien, Series A, NATL RE, FGIC Insured, 5.00%, 7/01/30 | | 11,400,000 | | 11,211,900 |
| Eaton Rapids Public Schools GO, School Building and Site, AGMC Insured, Pre-Refunded, 5.00%, | | | | |
| 5/01/26 | | 2,700,000 | | 2,720,358 |
| 5/01/29 | | 820,000 | | 826,183 |
| 5/01/29 | | 1,930,000 | | 1,944,398 |
| Fennville Public Schools GO, School Building and Site, | | | | |
| FGIC Insured, Pre-Refunded, 5.00%, 5/01/30 | | 1,115,000 | | 1,123,407 |
| FGIC Insured, Pre-Refunded, 5.00%, 5/01/34 | | 3,250,000 | | 3,274,505 |
| NATL RE, FGIC Insured, Pre-Refunded, 5.00%, 5/01/30 | | 2,085,000 | | 2,100,721 |
112 | Annual Report
| | | | | | |
| | Franklin Tax-Free Trust | | | | | |
| |
| | Statement of Investments, February 28, 2014 (continued) | | | | | |
| |
| |
| | Franklin Michigan Tax-Free Income Fund | | | Principal Amount | | Value |
| | Municipal Bonds (continued) | | | | | |
| | Michigan (continued) | | | | | |
| | Fowlerville Community School District GO, School Building and Site, NATL RE, FGIC Insured, | | | | | |
| Pre-Refunded, 5.00%, | | | | | |
| | 5/01/30 | | $ | 1,990,000 | $ | 2,005,005 |
| | 5/01/34 | | | 8,145,000 | | 8,206,413 |
| | Fraser Public School District GO, School Building and Site, AGMC Insured, 5.00%, 5/01/30 | | | 8,520,000 | | 8,820,245 |
| | Genesee County GO, Water Supply System, AMBAC Insured, 5.00%, 11/01/30 | | | 4,000,000 | | 4,024,920 |
| | Grand Blanc Community Schools GO, School Building and Site, AGMC Insured, Pre-Refunded, | | | | | |
| | 5.00%, 5/01/28 | | | 4,250,000 | | 4,282,045 |
| | Grand Rapids Building Authority Revenue, Series A, AMBAC Insured, 5.00%, 10/01/28 | | | 3,590,000 | | 3,597,539 |
| | Grand Rapids Sanitary Sewer System Revenue, NATL Insured, 5.00%, 1/01/30 | | | 4,900,000 | | 5,160,729 |
| | Grand Rapids Water Supply System Revenue, Assured Guaranty, 5.10%, 1/01/39 | | | 3,000,000 | | 3,172,920 |
| | Grand Valley State University Revenue, General, | | | | | |
| | 5.75%, 12/01/34 | | | 1,500,000 | | 1,629,465 |
| | Refunding, Series A, AGMC Insured, 5.00%, 12/01/28 | | | 17,165,000 | | 17,867,907 |
| | Refunding, Series A, AGMC Insured, 5.00%, 12/01/33 | | | 8,570,000 | | 8,826,414 |
| | HealthSource Saginaw Inc. Saginaw County GO, NATL Insured, Pre-Refunded, 5.00%, | | | | | |
| | 5/01/29 | | | 4,145,000 | | 4,374,509 |
| | Jackson County Hospital Finance Authority Revenue, W.A. Foote Memorial Hospital, Refunding, | | | | | |
| | Series C, Assured Guaranty, 5.00%, 6/01/26 | | | 10,000,000 | | 10,563,700 |
| | Kalamazoo Hospital Finance Authority Hospital Facility Revenue, | | | | | |
| | Borgess Medical Center, Series A, AMBAC Insured, ETM, 5.625%, 6/01/14 | | | 360,000 | | 361,408 |
| | Bronson Methodist Hospital, Refunding, Assured Guaranty, 5.25%, 5/15/36 | | | 10,000,000 | | 10,400,900 |
| | Bronson Methodist Hospital, Refunding, Series B, AGMC Insured, 5.00%, 5/15/26 | | | 7,000,000 | | 7,361,270 |
| | L’Anse Creuse Public Schools GO, School Building and Site, AGMC Insured, 5.00%, 5/01/35 | | | 10,000,000 | | 10,251,500 |
| | Lansing Board of Water and Light Utility System Revenue, Series A, 5.50%, 7/01/41 | | | 10,000,000 | | 10,870,600 |
| | Lansing Community College GO, College Building and Site, Refunding, 5.00%, 5/01/32 | | | 3,000,000 | | 3,252,480 |
| | Lapeer Community Schools GO, School Building and Site, AGMC Insured, 5.00%, | | | | | |
| | 5/01/33 | | | 4,400,000 | | 4,570,104 |
| | 5/01/37 | | | 4,325,000 | | 4,457,086 |
| | Lenawee County Hospital Finance Authority Hospital Revenue, ProMedica Healthcare Obligated | | | | | |
| | Group, Refunding, Series B, 6.00%, 11/15/35 | | | 5,000,000 | | 5,537,650 |
| | Livonia Public Schools School District GO, School Building and Site, Series I, AGMC Insured, | | | | | |
| | 5.00%, | | | | | |
| | 5/01/36 | | | 5,725,000 | | 6,012,051 |
| | 5/01/38 | | | 6,000,000 | | 6,286,980 |
| | 5/01/43 | | | 16,850,000 | | 17,488,278 |
| | Michigan State Building Authority Revenue, | | | | | |
| | Facilities Program, Refunding, Series I, 6.25%, 10/15/38 | | | 15,000,000 | | 16,816,500 |
| | Facilities Program, Refunding, Series I, AMBAC Insured, 5.00%, 10/15/33 | | | 4,450,000 | | 4,654,744 |
| | Facilities Program, Refunding, Series I-A, 5.00%, 10/15/33 | | | 5,000,000 | | 5,403,800 |
| | Facilities Program, Refunding, Series I-A, 5.50%, 10/15/45 | | | 2,000,000 | | 2,144,900 |
| | Facilities Program, Refunding, Series I-A, 5.25%, 10/15/47 | | | 5,000,000 | | 5,222,250 |
| | Facilities Program, Refunding, Series II, AMBAC Insured, 5.00%, 10/15/33 | | | 21,000,000 | | 21,966,210 |
| | Refunding, Series IA, AGMC Insured, 5.00%, 10/15/31 | | | 15,530,000 | | 16,420,180 |
| | Refunding, Series IA, AGMC Insured, 5.00%, 10/15/32 | | | 10,000,000 | | 10,519,000 |
| | Refunding, Series IA, AGMC Insured, 5.00%, 10/15/36 | | | 1,000,000 | | 1,024,770 |
Annual Report | 113
| | | | |
| Franklin Tax-Free Trust | | | | |
| |
| Statement of Investments, February 28, 2014 (continued) | | | | |
| |
| |
| Franklin Michigan Tax-Free Income Fund | | Principal Amount | | Value |
| Municipal Bonds (continued) | | | | |
| Michigan (continued) | | | | |
| Michigan State Comprehensive Transportation Revenue, Refunding, AGMC Insured, 5.00%, | | | | |
| 5/15/26 | $ | 4,740,000 | $ | 5,145,033 |
| 5/15/31 | | 8,000,000 | | 8,454,080 |
| Michigan State Finance Authority Revenue, | | | | |
| Hospital, Oakwood Obligated Group, Refunding, 5.00%, 8/15/28 | | 5,585,000 | | 5,930,265 |
| Hospital, Oakwood Obligated Group, Refunding, 5.00%, 8/15/29 | | 5,865,000 | | 6,199,422 |
| Hospital, Oakwood Obligated Group, Refunding, 5.00%, 8/15/30 | | 4,105,000 | | 4,306,514 |
| Hospital, Oakwood Obligated Group, Refunding, 5.00%, 8/15/31 | | 2,340,000 | | 2,432,804 |
| Hospital, Oakwood Obligated Group, Refunding, AGMC Insured, 5.00%, 11/01/32 | | 10,005,000 | | 10,330,763 |
| Hospital, Oakwood Obligated Group, Refunding, AGMC Insured, 5.00%, 11/01/42 | | 12,000,000 | | 12,032,640 |
| Hospital, Sparrow Obligated Group, AGMC Insured, 5.00%, 11/15/36 | | 6,500,000 | | 6,778,850 |
| Hospital, Sparrow Obligated Group, AGMC Insured, 5.00%, 11/15/42 | | 8,000,000 | | 8,174,880 |
| State Revolving Fund, Clean Water, 5.00%, 10/01/28 | | 3,000,000 | | 3,375,630 |
| State Revolving Fund, Clean Water, 5.00%, 10/01/29 | | 3,000,000 | | 3,356,640 |
| State Revolving Fund, Clean Water, 5.00%, 10/01/32 | | 2,000,000 | | 2,201,800 |
| Michigan State HDA Rental Housing Revenue, Series A, 5.25%, 10/01/46 | | 3,890,000 | | 3,994,135 |
| Michigan State Hospital Finance Authority Revenue, | | | | |
| Hospital, Sparrow Obligated Group, Refunding, 5.00%, 11/15/31 | | 10,000,000 | | 10,191,600 |
| Hospital, Sparrow Obligated Group, Refunding, NATL Insured, 5.00%, 11/15/31 | | 8,500,000 | | 8,662,860 |
| Hospital, Sparrow Obligated Group, Refunding, NATL Insured, 5.00%, 11/15/36 | | 6,165,000 | | 6,257,968 |
| Hospital, Sparrow Obligated Group, Refunding, NATL Insured, 5.00%, 11/15/36 | | 12,465,000 | | 12,528,696 |
| Mclaren Healthcare, Refunding, Series A, 5.00%, 6/01/26 | | 2,065,000 | | 2,297,436 |
| Mclaren Healthcare, Refunding, Series A, 5.00%, 6/01/27 | | 2,285,000 | | 2,514,620 |
| Mclaren Healthcare, Refunding, Series A, 5.00%, 6/01/28 | | 2,615,000 | | 2,850,507 |
| Mclaren Healthcare, Refunding, Series A, 5.00%, 6/01/35 | | 2,250,000 | | 2,340,720 |
| MidMichigan Obligated Group, Series A, 6.125%, 6/01/39 | | 5,000,000 | | 5,423,550 |
| St. John Health System, Series A, AMBAC Insured, ETM, 5.125%, 5/15/17 | | 14,500,000 | | 14,549,010 |
| St. John Hospital, Series A, AMBAC Insured, ETM, 6.25%, 5/15/14 | | 9,545,000 | | 9,586,330 |
| Trinity Health Credit Group, Series A, 6.50%, 12/01/33 | | 25,000,000 | | 28,458,000 |
| Trinity Health Credit Group, Series B, 5.00%, 12/01/48 | | 20,000,000 | | 20,542,000 |
| Michigan State Revenue, Grant Anticipation Bonds, AGMC Insured, 5.25%, 9/15/27 | | 10,000,000 | | 10,962,000 |
| Michigan State Strategic Fund Limited Obligation Revenue, | | | | |
| Detroit Edison Co. Exempt Facilities Project, Mandatory Put 8/01/16, Refunding, | | | | |
| Series ET, Sub Series ET-2, 5.50%, 8/01/29 | | 10,000,000 | | 11,016,500 |
| Detroit Edison Co. Pollution Control Bonds Project, Refunding, Collateralized Series BB, | | | | |
| AMBAC Insured, 7.00%, 5/01/21 | | 3,000,000 | | 3,719,430 |
| Michigan State University Revenue, General, Refunding, Series C, 5.00%, 2/15/44 | | 14,630,000 | | 15,216,224 |
| Northview Public Schools District GO, School Building and Site, 5.00%, 5/01/41 | | 3,000,000 | | 3,100,860 |
| Oakland University Board of Trustees Revenue, General, 5.00%, 3/01/42 | | 8,770,000 | | 9,061,515 |
| Pennfield School District GO, School Building and Site, | | | | |
| FGIC Insured, Pre-Refunded, 5.00%, 5/01/29 | | 645,000 | | 649,863 |
| FGIC Insured, Pre-Refunded, 5.00%, 5/01/34 | | 2,500,000 | | 2,518,850 |
| NATL RE, FGIC Insured, Pre-Refunded, 5.00%, 5/01/29 | | 505,000 | | 508,808 |
| Pinckney Community Schools GO, Counties of Livington and Washtenaw, Refunding, | | | | |
| AGMC Insured, 5.00%, 5/01/26 | | 2,955,000 | | 2,968,859 |
| Rockford Public Schools GO, School Building and Site, AGMC Insured, 5.00%, 5/01/33 | | 5,000,000 | | 5,307,350 |
| Royal Oak Hospital Finance Authority Hospital Revenue, William Beaumont Hospital | | | | |
| Obligated Group, Refunding, Series V, 8.25%, 9/01/39 | | 10,000,000 | | 12,054,200 |
| Saginaw City School District GO, School Building and Site, AGMC Insured, 5.00%, 5/01/38 | | 10,555,000 | | 11,045,385 |
| Saginaw Valley State University Revenue, General, Refunding, AGMC Insured, 5.00%, | | | | |
| 7/01/28 | | 7,050,000 | | 7,479,133 |
| 114 | Annual Report | | | | |
| | | | |
| Franklin Tax-Free Trust | | | | |
| |
| Statement of Investments, February 28, 2014 (continued) | | | | |
| |
| |
| Franklin Michigan Tax-Free Income Fund | | Principal Amount | | Value |
| Municipal Bonds (continued) | | | | |
| Michigan (continued) | | | | |
| South Redford School District GO, School Building and Site, NATL Insured, 5.00%, 5/01/30 | $ | 3,500,000 | $ | 3,657,080 |
| Southfield Library Building Authority GO, Refunding, NATL Insured, 5.00%, 5/01/30 | | 6,535,000 | | 6,828,291 |
| Southfield Public Schools GO, Refunding, NATL Insured, 4.75%, 5/01/29 | | 9,040,000 | | 9,271,062 |
| Sturgis Public School District GO, Refunding, NATL RE, FGIC Insured, 5.00%, 5/01/30 | | 4,715,000 | | 4,933,304 |
| Trenton Public Schools GO, School Building and Site, AGMC Insured, 5.00%, | | | | |
| 5/01/31 | | 4,575,000 | | 4,900,237 |
| 5/01/38 | | 8,150,000 | | 8,573,474 |
| Warren Consolidated School District GO, School Building and Site, 5.00%, 5/01/32 | | 2,500,000 | | 2,710,400 |
| Wayne Charter County GO, | | | | |
| Airport Hotel, Detroit Metropolitan Wayne County Airport, Series A, NATL Insured, 5.25%, | | | | |
| 12/01/25 | | 17,000,000 | | 17,015,470 |
| Airport Hotel, Detroit Metropolitan Wayne County Airport, Series A, NATL Insured, 5.00%, | | | | |
| 12/01/30 | | 10,750,000 | | 10,752,687 |
| Building Improvement, Series A, 6.75%, 11/01/39 | | 4,735,000 | | 5,104,283 |
| Capital Improvement, Series A, AGMC Insured, 5.00%, 2/01/34 | | 7,640,000 | | 7,688,056 |
| Capital Improvement, Series A, AGMC Insured, 5.00%, 2/01/38 | | 12,135,000 | | 12,147,256 |
| Wayne County Airport Authority Revenue, Detroit Metropolitan Wayne County Airport, Refunding, | | | | |
| NATL RE, FGIC Insured, 5.00%, | | | | |
| 12/01/27 | | 9,910,000 | | 10,616,484 |
| 12/01/28 | | 10,170,000 | | 10,813,456 |
| Wayne State University Revenue, General, | | | | |
| AMBAC Insured, 5.00%, 11/15/30 | | 2,925,000 | | 3,156,368 |
| Refunding, AGMC Insured, 5.00%, 11/15/28 | | 23,550,000 | | 25,780,891 |
| Refunding, AGMC Insured, 5.00%, 11/15/35 | | 22,435,000 | | 23,114,107 |
| Western Michigan University Revenue, General, AGMC Insured, 5.00%, | | | | |
| 11/15/28 | | 5,500,000 | | 5,755,530 |
| 11/15/32 | | 6,410,000 | | 6,604,928 |
| Wyoming Sewage Disposal System Revenue, Refunding, NATL Insured, 5.00%, 6/01/27 | | 5,700,000 | | 5,991,555 |
| Zeeland Public Schools GO, Refunding, NATL RE, FGIC Insured, 5.00%, 5/01/25 | | 3,350,000 | | 3,506,713 |
| | | | | 1,009,110,760 |
| U.S. Territories 6.8% | | | | |
| Puerto Rico 6.8% | | | | |
| Puerto Rico Commonwealth Highways and Transportation Authority Transportation Revenue, | | | | |
| Series D, AGMC Insured, 5.00%, 7/01/32 | | 10,900,000 | | 9,375,090 |
| Puerto Rico Sales Tax FICO Sales Tax Revenue, first subordinate, | | | | |
| Series A, 5.375%, 8/01/39 | | 9,000,000 | | 6,925,140 |
| Series A, 6.375%, 8/01/39 | | 10,000,000 | | 8,540,500 |
| Series A, 6.00%, 8/01/42 | | 25,000,000 | | 20,615,500 |
| Series C, 5.50%, 8/01/40 | | 15,000,000 | | 11,930,400 |
| Series C, 5.25%, 8/01/41 | | 25,445,000 | | 19,177,642 |
| | | | | 76,564,272 |
| |
| Total Municipal Bonds (Cost $1,080,584,886) 96.4% | | | | 1,085,675,032 |
| Other Assets, less Liabilities 3.6% | | | | 40,446,984 |
| |
| Net Assets 100.0% | | | $ | 1,126,122,016 |
| |
| |
| |
| See Abbreviations on page 181. | | | | |
| |
| Annual Report | The accompanying notes are an integral part of these financial statements. | 115 |
| | | | | | | | | | | | | | | |
| Franklin Tax-Free Trust | | | | | | | | | | | | | | | |
| Financial Highlights | | | | | | | | | | | | | | | |
| |
| Franklin Minnesota Tax-Free Income Fund | | | | | | | | | | | | | | | |
| | | | | | Year Ended February 28, | | | | |
| Class A | | 2014 | | | 2013 | | | 2012 | a | | 2011 | | | 2010 | |
| Per share operating performance | | | | | | | | | | | | | | | |
| (for a share outstanding throughout the year) | | | | | | | | | | | | | | | |
| Net asset value, beginning of year | $ | 12.98 | | $ | 12.80 | | $ | 11.92 | | $ | 12.20 | | $ | 11.80 | |
| Income from investment operationsb: | | | | | | | | | | | | | | | |
| Net investment incomec | | 0.41 | | | 0.42 | | | 0.46 | | | 0.46 | | | 0.48 | |
| Net realized and unrealized gains (losses) | | (0.60 | ) | | 0.18 | | | 0.88 | | | (0.28 | ) | | 0.40 | |
| Total from investment operations | | (0.19 | ) | | 0.60 | | | 1.34 | | | 0.18 | | | 0.88 | |
| Less distributions from net investment income | | (0.40 | ) | | (0.42 | ) | | (0.46 | ) | | (0.46 | ) | | (0.48 | ) |
| Net asset value, end of year | $ | 12.39 | | $ | 12.98 | | $ | 12.80 | | $ | 11.92 | | $ | 12.20 | |
| |
| Total returnd | | (1.45 | )% | | 4.77 | % | | 11.44 | % | | 1.49 | % | | 7.54 | % |
| |
| Ratios to average net assets | | | | | | | | | | | | | | | |
| Expenses | | 0.64 | % | | 0.64 | % | | 0.65 | % | | 0.65 | % | | 0.65 | % |
| Net investment income | | 3.27 | % | | 3.27 | % | | 3.71 | % | | 3.80 | % | | 3.96 | % |
| |
| Supplemental data | | | | | | | | | | | | | | | |
| Net assets, end of year (000’s) | $ | 717,104 | | $ | 904,813 | | $ | 819,782 | | $ | 754,018 | | $ | 768,806 | |
| Portfolio turnover rate | | 6.93 | % | | 6.99 | % | | 5.32 | % | | 14.56 | % | | 10.24 | % |
aFor the year ended February 29.
bThe amount shown for a share outstanding throughout the period may not correlate with the Statement of Operations for the period due to the timing of sales and repurchases of
the Fund shares in relation to income earned and/or fluctuating market value of the investments of the Fund.
cBased on average daily shares outstanding.
dTotal return does not reflect sales commissions or contingent deferred sales charges, if applicable.
116 | The accompanying notes are an integral part of these financial statements. | Annual Report
| | | | | | | | | | | | | | | |
| Franklin Tax-Free Trust | | | | | | | | | | | | | | | |
| Financial Highlights (continued) | | | | | | | | | | | | | | | |
| |
| Franklin Minnesota Tax-Free Income Fund | | | | | | | | | | | | | | | |
| | | | | | Year Ended February 28, | | | | |
| Class C | | 2014 | | | 2013 | | | 2012 | a | | 2011 | | | 2010 | |
| Per share operating performance | | | | | | | | | | | | | | | |
| (for a share outstanding throughout the year) | | | | | | | | | | | | | | | |
| Net asset value, beginning of year | $ | 13.10 | | $ | 12.92 | | $ | 12.02 | | $ | 12.30 | | $ | 11.89 | |
| Income from investment operationsb: | | | | | | | | | | | | | | | |
| Net investment incomec | | 0.34 | | | 0.36 | | | 0.39 | | | 0.40 | | | 0.41 | |
| Net realized and unrealized gains (losses) | | (0.60 | ) | | 0.17 | | | 0.90 | | | (0.29 | ) | | 0.41 | |
| Total from investment operations | | (0.26 | ) | | 0.53 | | | 1.29 | | | 0.11 | | | 0.82 | |
| Less distributions from net investment income | | (0.33 | ) | | (0.35 | ) | | (0.39 | ) | | (0.39 | ) | | (0.41 | ) |
| Net asset value, end of year | $ | 12.51 | | $ | 13.10 | | $ | 12.92 | | $ | 12.02 | | $ | 12.30 | |
| |
| Total returnd | | (1.97 | )% | | 4.15 | % | | 10.82 | % | | 0.99 | % | | 6.97 | % |
| |
| Ratios to average net assets | | | | | | | | | | | | | | | |
| Expenses | | 1.19 | % | | 1.19 | % | | 1.20 | % | | 1.20 | % | | 1.20 | % |
| Net investment income | | 2.72 | % | | 2.72 | % | | 3.16 | % | | 3.25 | % | | 3.41 | % |
| |
| Supplemental data | | | | | | | | | | | | | | | |
| Net assets, end of year (000’s) | $ | 205,745 | | $ | 270,570 | | $ | 224,498 | | $ | 195,123 | | $ | 170,676 | |
| Portfolio turnover rate | | 6.93 | % | | 6.99 | % | | 5.32 | % | | 14.56 | % | | 10.24 | % |
aFor the year ended February 29.
bThe amount shown for a share outstanding throughout the period may not correlate with the Statement of Operations for the period due to the timing of sales and repurchases of
the Fund shares in relation to income earned and/or fluctuating market value of the investments of the Fund.
cBased on average daily shares outstanding.
dTotal return does not reflect sales commissions or contingent deferred sales charges, if applicable.
Annual Report | The accompanying notes are an integral part of these financial statements. | 117
| | | | | | | | | | | | | | | |
| Franklin Tax-Free Trust | | | | | | | | | | | | | | | |
| Financial Highlights (continued) | | | | | | | | | | | | | | | |
| |
| Franklin Minnesota Tax-Free Income Fund | | | | | | | | | | | | | | | |
| | | | | | Year Ended February 28, | | | | |
| Advisor Class | | 2014 | | | 2013 | | | 2012 | a | | 2011 | | | 2010 | b |
| Per share operating performance | | | | | | | | | | | | | | | |
| (for a share outstanding throughout the year) | | | | | | | | | | | | | | | |
| Net asset value, beginning of year | $ | 12.99 | | $ | 12.81 | | $ | 11.92 | | $ | 12.20 | | $ | 11.91 | |
| Income from investment operationsc: | | | | | | | | | | | | | | | |
| Net investment incomed | | 0.42 | | | 0.44 | | | 0.47 | | | 0.48 | | | 0.33 | |
| Net realized and unrealized gains (losses) | | (0.60 | ) | | 0.18 | | | 0.89 | | | (0.29 | ) | | 0.28 | |
| Total from investment operations | | (0.18 | ) | | 0.62 | | | 1.36 | | | 0.19 | | | 0.61 | |
| Less distributions from net investment income | | (0.41 | ) | | (0.44 | ) | | (0.47 | ) | | (0.47 | ) | | (0.32 | ) |
| Net asset value, end of year | $ | 12.40 | | $ | 12.99 | | $ | 12.81 | | $ | 11.92 | | $ | 12.20 | |
| |
| Total returne | | (1.35 | )% | | 4.88 | % | | 11.63 | % | | 1.59 | % | | 5.14 | % |
| |
| Ratios to average net assetsf | | | | | | | | | | | | | | | |
| Expenses | | 0.54 | % | | 0.54 | % | | 0.55 | % | | 0.55 | % | | 0.55 | % |
| Net investment income | | 3.37 | % | | 3.37 | % | | 3.81 | % | | 3.90 | % | | 4.06 | % |
| |
| Supplemental data | | | | | | | | | | | | | | | |
| Net assets, end of year (000’s) | $ | 98,382 | | $ | 49,398 | | $ | 38,461 | | $ | 10,854 | | $ | 4,451 | |
| Portfolio turnover rate | | 6.93 | % | | 6.99 | % | | 5.32 | % | | 14.56 | % | | 10.24 | % |
aFor the year ended February 29.
bFor the period July 1, 2009 (effective date) to February 28, 2010.
cThe amount shown for a share outstanding throughout the period may not correlate with the Statement of Operations for the period due to the timing of sales and repurchases of
the Fund shares in relation to income earned and/or fluctuating market value of the investments of the Fund.
dBased on average daily shares outstanding.
eTotal return is not annualized for periods less than one year.
fRatios are annualized for periods less than one year.
118 | The accompanying notes are an integral part of these financial statements. | Annual Report
| | | | |
| Franklin Tax-Free Trust | | | | |
| |
| Statement of Investments, February 28, 2014 | | | | |
| |
| |
| Franklin Minnesota Tax-Free Income Fund | | Principal Amount | | Value |
| Municipal Bonds 98.9% | | | | |
| Minnesota 97.2% | | | | |
| Alexandria ISD No. 206 GO, School Building, Minnesota School District Credit Enhancement | | | | |
| Program, Series A, 5.00%, 2/01/37 | $ | 11,700,000 | $ | 12,850,695 |
| Anoka County Housing and RDA, GO, Housing Development, Refunding, AMBAC Insured, | | | | |
| 4.875%, 2/01/24 | | 425,000 | | 425,978 |
| Anoka County Regional Railroad Authority GO, Series A, XLCA Insured, 4.50%, 2/01/32 | | 11,125,000 | | 11,494,795 |
| Anoka-Hennepin ISD No. 11 GO, Anoka and Hennepin Counties, School Building, Minnesota | | | | |
| School District Credit Enhancement Program, Refunding, Series A, Assured Guaranty, 5.00%, | | | | |
| 2/01/20 | | 5,870,000 | | 6,914,214 |
| Bemidji GO, Sales Tax Revenue, Refunding, 5.25%, 2/01/38 | | 12,055,000 | | 13,107,522 |
| Big Lake ISD No. 727 GO, Refunding, Series B, 5.00%, | | | | |
| 2/01/23 | | 2,990,000 | | 3,513,758 |
| 2/01/24 | | 3,000,000 | | 3,513,780 |
| 2/01/25 | | 2,225,000 | | 2,585,339 |
| Bloomington ISD No. 271 GO, Alternative Facilities, Series A, 3.00%, 2/01/30 | | 1,370,000 | | 1,256,454 |
| Blue Earth County EDA Public Project Lease Revenue, Series A, NATL Insured, 4.50%, | | | | |
| 12/01/24 | | 1,055,000 | | 1,113,215 |
| Brainerd ISD No. 181 GO, School Building, Refunding, Series A, 4.00%, | | | | |
| 2/01/19 | | 5,025,000 | | 5,662,622 |
| 2/01/20 | | 5,025,000 | | 5,589,257 |
| 2/01/21 | | 1,000,000 | | 1,098,890 |
| Burnsville ISD No. 191 GO, Alternative Facilities, Series A, 3.00%, | | | | |
| 2/01/29 | | 1,570,000 | | 1,518,473 |
| 2/01/30 | | 2,880,000 | | 2,741,472 |
| Byron ISD No. 531 GO, School Building, Series A, NATL RE, FGIC Insured, 5.00%, 2/01/24 | | 2,015,000 | | 2,051,270 |
| Cambridge ISD No. 911 GO, School Building, Minnesota School District Credit Enhancement | | | | |
| Program, | | | | |
| Refunding, Series A, 3.00%, 2/01/27 | | 3,410,000 | | 3,395,473 |
| Refunding, Series A, 3.00%, 2/01/30 | | 5,585,000 | | 5,273,301 |
| Series A, NATL Insured, 4.25%, 2/01/24 | | 1,235,000 | | 1,278,620 |
| Center City Health Care Facilities Revenue, Hazelden Foundation Project, 5.00%, 11/01/41 | | 1,600,000 | | 1,627,472 |
| Central Municipal Power Agency Revenue, Brookings, South East Twin Cities Transmission | | | | |
| Project, 5.00%, | | | | |
| 1/01/32 | | 1,150,000 | | 1,253,937 |
| 1/01/42 | | 1,615,000 | | 1,693,699 |
| Chaska ISD No. 112 GO, | | | | |
| Alternative Facilities, Minnesota School District Credit Enhancement Program, Refunding, | | | | |
| Series A, 5.00%, 2/01/20 | | 4,135,000 | | 4,888,356 |
| School Building, Minnesota School District Credit Enhancement Program, Refunding, | | | | |
| Series A, 4.00%, 2/01/20 | | 4,475,000 | | 5,032,182 |
| School Building, Series A, NATL Insured, 4.50%, 2/01/28 | | 15,000,000 | | 16,586,100 |
| Chisago County GO, Capital Improvement, Series A, NATL Insured, Pre-Refunded, 4.75%, | | | | |
| 2/01/26 | | 2,415,000 | | 2,619,043 |
| Dakota County CDA Governmental Housing Development GO, Senior Housing Facilities, Series A, | | | | |
| 5.125%, 1/01/35 | | 2,625,000 | | 2,802,581 |
| Dakota County CDA, SFMR, MBS Program, Series A, GNMA Secured, 4.875%, 12/01/33 | | 1,165,000 | | 1,233,584 |
Annual Report | 119
| | | | |
| Franklin Tax-Free Trust | | | | |
| |
| Statement of Investments, February 28, 2014 (continued) | | | | |
| |
| |
| Franklin Minnesota Tax-Free Income Fund | | Principal Amount | | Value |
| Municipal Bonds (continued) | | | | |
| Minnesota (continued) | | | | |
| Duluth ISD No. 709 COP, Full Term Certificates, Series B, | | | | |
| 4.75%, 2/01/25 | $ | 8,445,000 | $ | 9,126,258 |
| AGMC Insured, 5.00%, 2/01/28 | | 18,890,000 | | 20,511,140 |
| Edina ISD No. 273 GO, Alternative Facilities, Series A, | | | | |
| 2.375%, 2/01/25 | | 4,445,000 | | 4,185,545 |
| 2.50%, 2/01/26 | | 3,000,000 | | 2,809,710 |
| Elk River ISD No. 728 GO, School Building, Minnesota School District Credit Enhancement | | | | |
| Program, Refunding, Series A, AGMC Insured, 4.25%, | | | | |
| 2/01/23 | | 3,000,000 | | 3,229,230 |
| 2/01/24 | | 6,265,000 | | 6,725,164 |
| Ely Housing and RDAR, Housing Development, Series A, XLCA Insured, 4.50%, 11/01/41 | | 1,530,000 | | 1,544,795 |
| Farmington ISD No. 192 GO, School Building, | | | | |
| Refunding, Series A, AGMC Insured, 4.50%, 2/01/24 | | 5,015,000 | | 5,212,792 |
| Series B, AGMC Insured, 5.00%, 2/01/23 | | 3,000,000 | | 3,099,570 |
| Series B, AGMC Insured, 4.75%, 2/01/27 | | 16,075,000 | | 16,661,416 |
| Fergus Falls ISD No. 544 GO, School Building, Minnesota School District Credit Enhancement | | | | |
| Program, Series A, AGMC Insured, 5.00%, 1/01/25 | | 1,655,000 | | 1,832,267 |
| Fridley ISD No. 014 GO, Fridley Public Schools, Alternative Facilities, Series A, AGMC Insured, | | | | |
| 4.375%, 2/01/27 | | 2,040,000 | | 2,119,172 |
| Hennepin County Regional Railroad Authority GO, Refunding, Series A, 4.00%, | | | | |
| 12/01/27 | | 2,475,000 | | 2,605,829 |
| 12/01/28 | | 1,590,000 | | 1,663,792 |
| Hennepin County Sales Tax Revenue, | | | | |
| first lien, Ballpark Project, Series A, 4.75%, 12/15/37 | | 25,000,000 | | 26,688,750 |
| second lien, Ballpark Project, Series B, 5.00%, 12/15/17 | | 1,740,000 | | 2,000,861 |
| second lien, Ballpark Project, Series B, 5.00%, 12/15/21 | | 5,000,000 | | 5,614,800 |
| Jackson County GO, Capital Improvement Plan, Series A, 3.125%, 2/01/38 | | 3,000,000 | | 2,544,930 |
| Lakeville GO, Refunding, Series B, | | | | |
| 4.00%, 2/01/21 | | 1,000,000 | | 1,128,390 |
| 3.00%, 2/01/30 | | 4,690,000 | | 4,457,376 |
| Lakeville ISD No. 194 GO, | | | | |
| Alternative Facilities, Series B, 3.00%, 2/01/25 | | 3,560,000 | | 3,550,068 |
| School Building, Refunding, Series B, Assured Guaranty, 5.00%, 2/01/16 | | 5,405,000 | | 5,889,504 |
| School Building, Refunding, Series B, Assured Guaranty, 5.00%, 2/01/17 | | 5,750,000 | | 6,466,968 |
| School Building, Refunding, Series D, 4.25%, 2/01/24 | | 7,000,000 | | 7,287,490 |
| Maple Grove GO, Improvement, Refunding, Series A, 4.00%, | | | | |
| 2/01/21 | | 2,100,000 | | 2,382,660 |
| 2/01/22 | | 2,470,000 | | 2,787,123 |
| Metropolitan Council Minneapolis-St. Paul Metropolitan Area GO, Wastewater, Series B, 4.50%, | | | | |
| 12/01/26 | | 5,000,000 | | 5,344,900 |
| Minneapolis and St. Paul Housing and RDA Health Care Facilities Revenue, Children’s Hospitals | | | | |
| and Clinics, Series A-1, AGMC Insured, 5.00%, 8/15/34 | | 1,000,000 | | 1,041,870 |
| Minneapolis GO, Various Purpose, Refunding, 4.00%, 12/01/25 | | 3,500,000 | | 3,665,515 |
| Minneapolis Health Care System Revenue, Fairview Health Services, | | | | |
| Series B, Assured Guaranty, 6.50%, 11/15/38 | | 35,000,000 | | 39,669,000 |
| Series D, AMBAC Insured, 5.00%, 11/15/34 | | 12,645,000 | | 12,785,359 |
120 | Annual Report
| | | | |
| Franklin Tax-Free Trust | | | | |
| |
| Statement of Investments, February 28, 2014 (continued) | | | | |
| |
| |
| Franklin Minnesota Tax-Free Income Fund | | Principal Amount | | Value |
| Municipal Bonds (continued) | | | | |
| Minnesota (continued) | | | | |
| Minneapolis-St. Paul Metropolitan Airports Commission Airport Revenue, | | | | |
| senior bond, Refunding, Series A, 5.00%, 1/01/35 | $ | 9,295,000 | $ | 10,208,048 |
| senior bond, Refunding, Series A, AMBAC Insured, 5.00%, 1/01/20 | | 5,400,000 | | 5,956,578 |
| senior bond, Refunding, Series A, BHAC Insured, 5.00%, 1/01/23 | | 14,800,000 | | 16,238,856 |
| senior bond, Refunding, Series A, BHAC Insured, 5.00%, 1/01/26 | | 10,000,000 | | 10,824,700 |
| Subordinate Airport, Refunding, Series B, 5.00%, 1/01/26 | | 1,250,000 | | 1,386,300 |
| Subordinate Airport, Refunding, Series B, 5.00%, 1/01/27 | | 1,500,000 | | 1,659,225 |
| Subordinate Airport, Refunding, Series B, 5.00%, 1/01/28 | | 2,250,000 | | 2,475,855 |
| Minnesota Agricultural and Economic Development Board Revenue, | | | | |
| Health Care Facilities, Essentia Health Obligated Group, Series C-1, Assured Guaranty, | | | | |
| 5.00%, 2/15/30 | | 14,600,000 | | 15,444,464 |
| Health Care Facilities, Essentia Health Obligated Group, Series E, Assured Guaranty, 5.00%, | | | | |
| 2/15/37 | | 20,600,000 | | 21,072,564 |
| Health Care System, Fairview Hospital and Healthcare Services, Refunding, Series A, | | | | |
| NATL Insured, 5.75%, 11/15/26 | | 365,000 | | 366,055 |
| Minnesota Public Facilities Authority Clean Water Revenue, Series A, Pre-Refunded, 5.00%, | | | | |
| 3/01/24 | | 6,900,000 | | 7,837,641 |
| Minnesota Public Facilities Authority Revolving Fund Revenue, Series C, 5.00%, 3/01/26 | | 16,530,000 | | 18,884,368 |
| Minnesota Public Facilities Authority State Revenue, Refunding, Series A, 5.00%, 3/01/24 | | 17,010,000 | | 20,765,128 |
| Minnesota State 911 Revenue, Public Safety Radio Communication System Project, | | | | |
| Assured Guaranty, | | | | |
| 4.50%, 6/01/22 | | 1,000,000 | | 1,124,790 |
| 4.50%, 6/01/24 | | 3,745,000 | | 4,163,017 |
| 5.00%, 6/01/24 | | 3,000,000 | | 3,393,960 |
| Minnesota State Colleges and Universities Revenue, Board of Trustees, Fund, | | | | |
| Refunding, Series A, 5.00%, 10/01/22 | | 1,410,000 | | 1,676,857 |
| Series A, 4.00%, 10/01/24 | | 1,535,000 | | 1,685,537 |
| Series A, 5.00%, 10/01/28 | | 2,135,000 | | 2,425,381 |
| Series A, 4.625%, 10/01/29 | | 6,615,000 | | 7,187,462 |
| Series A, NATL Insured, 5.00%, 10/01/22 | | 1,745,000 | | 1,834,780 |
| Series A, NATL Insured, 5.00%, 10/01/23 | | 1,825,000 | | 1,917,144 |
| Series A, NATL Insured, 5.00%, 10/01/24 | | 1,900,000 | | 1,993,803 |
| Series A, NATL Insured, 5.00%, 10/01/25 | | 1,155,000 | | 1,210,925 |
| Series A, NATL Insured, 5.00%, 10/01/26 | | 1,715,000 | | 1,796,668 |
| Series A, NATL Insured, 5.00%, 10/01/32 | | 5,540,000 | | 5,780,104 |
| Minnesota State General Fund Revenue, Appropriation, | | | | |
| Refunding, Series A, 4.00%, 3/01/26 | | 4,000,000 | | 4,270,520 |
| Refunding, Series A, 3.00%, 3/01/30 | | 2,000,000 | | 1,856,360 |
| Refunding, Series B, 5.00%, 3/01/22 | | 1,530,000 | | 1,831,135 |
| Series A, 5.00%, 6/01/32 | | 7,000,000 | | 7,787,360 |
| Series A, 5.00%, 6/01/38 | | 8,500,000 | | 9,246,555 |
| Minnesota State GO, | | | | |
| Highway and Various Purpose, 5.00%, 8/01/23 | | 3,000,000 | | 3,387,840 |
| Highway and Various Purpose, AGMC Insured, 5.00%, 8/01/22 | | 1,000,000 | | 1,132,870 |
| Highway and Various Purpose, AGMC Insured, 5.00%, 8/01/25 | | 10,000,000 | | 11,193,000 |
| NATL Insured, 5.00%, 6/01/26 | | 1,650,000 | | 1,779,690 |
| NATL Insured, Pre-Refunded, 5.00%, 6/01/26 | | 8,350,000 | | 9,219,068 |
Annual Report | 121
| | | | |
| Franklin Tax-Free Trust | | | | |
| |
| Statement of Investments, February 28, 2014 (continued) | | | | |
| |
| |
| Franklin Minnesota Tax-Free Income Fund | | Principal Amount | | Value |
| Municipal Bonds (continued) | | | | |
| Minnesota (continued) | | | | |
| Minnesota State GO, (continued) | | | | |
| Various Purpose, Refunding, Series F, 4.00%, 10/01/25 | $ | 15,000,000 | $ | 16,475,550 |
| Various Purpose, Refunding, Series H, 5.00%, 11/01/27 | | 2,500,000 | | 2,910,750 |
| Various Purpose, Series A, 4.25%, 12/01/27 | | 5,000,000 | | 5,507,100 |
| Various Purpose, Series A, 4.50%, 12/01/28 | | 15,540,000 | | 17,226,556 |
| Minnesota State HFA Homeownership Finance Revenue, MBS Program, | | | | |
| Series E, GNMA Secured, 4.45%, 7/01/31 | | 4,295,000 | | 4,441,245 |
| Series G, GNMA Secured, 4.00%, 7/01/26 | | 2,215,000 | | 2,330,800 |
| Series G, GNMA Secured, 4.40%, 7/01/32 | | 3,640,000 | | 3,888,648 |
| Minnesota State HFAR, | | | | |
| Nonprofit Housing State Appropriation, 4.00%, 8/01/29 | | 3,675,000 | | 3,832,768 |
| Nonprofit Housing State Appropriation, 5.00%, 8/01/31 | | 2,225,000 | | 2,490,265 |
| Residential Housing Finance, Series E, 4.90%, 7/01/29 | | 9,305,000 | | 9,616,717 |
| Residential Housing Finance, Series E, 5.10%, 1/01/40 | | 8,900,000 | | 9,136,918 |
| Minnesota State Higher Education Facilities Authority Revenue, | | | | |
| Carleton College, Series 7-D, 5.00%, 3/01/40 | | 4,000,000 | | 4,225,560 |
| Macalester College, Series 7-I, 5.00%, 6/01/35 | | 5,000,000 | | 5,531,900 |
| University of St. Thomas, Series 6-X, 5.00%, 4/01/29 | | 2,250,000 | | 2,386,508 |
| University of St. Thomas, Series 6-X, 5.25%, 4/01/39 | | 10,000,000 | | 10,404,600 |
| University of St. Thomas, Series 7-A, 5.00%, 10/01/29 | | 5,420,000 | | 5,876,743 |
| University of St. Thomas, Series 7-A, 5.00%, 10/01/39 | | 4,485,000 | | 4,679,604 |
| Minnesota State Municipal Power Agency Electric Revenue, Series A, 5.25%, 10/01/35 | | 12,000,000 | | 12,837,600 |
| Minnesota State Public Facilities Authority Clean Water Revenue, Series B, 4.75%, 3/01/27 | | 5,000,000 | | 5,357,850 |
| Mounds View ISD No. 621 GO, School Building, Minnesota School District Credit Enhancement | | | | |
| Program, Refunding, Series A, 4.00%, 2/01/20 | | 1,000,000 | | 1,129,430 |
| New Brighton GO, Tax Increment, Series A, NATL Insured, 5.00%, 2/01/32 | | 5,110,000 | | 5,440,617 |
| New Prague ISD No. 721 GO, School Building, Minnesota School District Credit Enhancement | | | | |
| Program, Refunding, Series A, 4.00%, | | | | |
| 2/01/22 | | 3,090,000 | | 3,488,826 |
| 2/01/23 | | 3,045,000 | | 3,398,464 |
| 2/01/24 | | 3,245,000 | | 3,608,472 |
| 2/01/25 | | 3,300,000 | | 3,627,492 |
| North Branch Water System Revenue, | | | | |
| AGMC Insured, 4.75%, 8/01/27 | | 1,500,000 | | 1,587,330 |
| Series A, AGMC Insured, 5.00%, 8/01/33 | | 1,325,000 | | 1,387,911 |
| Northern Municipal Power Agency Electric System Revenue, | | | | |
| Refunding, Series A, Assured Guaranty, 5.00%, 1/01/21 | | 1,505,000 | | 1,673,831 |
| Series A, 5.00%, 1/01/30 | | 1,190,000 | | 1,294,268 |
| Series A, AMBAC Insured, 5.00%, 1/01/26 | | 2,000,000 | | 2,145,600 |
| Northfield ISD No. 659 GO, School Building, Refunding, Series A, 4.00%, 2/01/20 | | 3,420,000 | | 3,883,581 |
| Olmsted County GO, Refunding, Series A, 3.50%, 2/01/26 | | 3,370,000 | | 3,494,960 |
| Pine City Health Care and Housing Revenue, North Branch, Series A, GNMA Secured, | | | | |
| Pre-Refunded, 5.00%, 10/20/38 | | 4,280,000 | | 4,306,236 |
| Pipestone ISD No. 2689 GO, School Building, Refunding, Series A, AGMC Insured, 5.00%, | | | | |
| 3/01/20 | | 1,595,000 | | 1,595,000 |
122 | Annual Report
| | | | |
| Franklin Tax-Free Trust | | | | |
| |
| Statement of Investments, February 28, 2014 (continued) | | | | |
| |
| |
| Franklin Minnesota Tax-Free Income Fund | | Principal Amount | | Value |
| Municipal Bonds (continued) | | | | |
| Minnesota (continued) | | | | |
| Ramsey GO, Capital Improvement Plan, Refunding, Series A, | | | | |
| 3.00%, 12/15/28 | $ | 1,105,000 | $ | 1,061,430 |
| 3.375%, 12/15/31 | | 1,215,000 | | 1,177,736 |
| Robbinsdale ISD No. 281 GO, School Building, Refunding, Series B, 4.00%, 2/01/19 | | 2,660,000 | | 2,996,171 |
| Rochester Electricity Utility Revenue, Series B, 5.00%, 12/01/43 | | 1,000,000 | | 1,084,150 |
| Rochester Health Care Facilities Revenue, Mayo Clinic, | | | | |
| Mandatory Put 11/15/21, Series C, 4.50%, 11/15/38 | | 7,735,000 | | 8,858,122 |
| Series D, 5.00%, 11/15/38 | | 10,000,000 | | 10,470,600 |
| Series E, 5.00%, 11/15/38 | | 20,000,000 | | 20,941,200 |
| Rochester ISD No. 535 COP, Minnesota School District Credit Enhancement Program, 3.00%, | | | | |
| 2/01/27 | | 1,215,000 | | 1,167,190 |
| Rosemount ISD No. 196 GO, School Building, Refunding, Series C, 4.00%, | | | | |
| 2/01/21 | | 1,365,000 | | 1,544,948 |
| 2/01/22 | | 2,380,000 | | 2,674,573 |
| Sauk Rapids ISD No. 047 GO, School Building, Refunding, Series A, AGMC Insured, | | | | |
| 5.00%, 2/01/22 | | 2,200,000 | | 2,335,960 |
| 4.50%, 2/01/25 | | 2,175,000 | | 2,248,015 |
| Scott County GO, Capital Improvement Plan, Series A, AMBAC Insured, 5.00%, 12/01/27 | | 5,590,000 | | 6,163,478 |
| Shakopee ISD No. 720 GO, School Building, Crossover, Refunding, 4.00%, 2/01/26 | | 1,600,000 | | 1,711,280 |
| Southern Minnesota Municipal Power Agency Power Supply System Revenue, | | | | |
| Capital Appreciation, Refunding, Series A, NATL Insured, zero cpn., 1/01/19 | | 5,875,000 | | 5,378,328 |
| Capital Appreciation, Refunding, Series A, NATL Insured, zero cpn., 1/01/20 | | 14,035,000 | | 12,271,222 |
| Capital Appreciation, Refunding, Series A, NATL Insured, zero cpn., 1/01/23 | | 4,000,000 | | 3,025,520 |
| Capital Appreciation, Refunding, Series A, NATL Insured, zero cpn., 1/01/26 | | 5,395,000 | | 3,521,964 |
| Capital Appreciation, Refunding, Series A, NATL Insured, zero cpn., 1/01/27 | | 6,600,000 | | 4,062,828 |
| Capital Appreciation, Refunding, Series C, AMBAC Insured, zero cpn., 1/01/18 | | 15,935,000 | | 15,084,549 |
| Refunding, Series A, 5.00%, 1/01/21 | | 1,000,000 | | 1,121,090 |
| Refunding, Series A, 5.00%, 1/01/22 | | 2,060,000 | | 2,281,656 |
| Refunding, Series A, 5.50%, 1/01/24 | | 1,000,000 | | 1,127,210 |
| Refunding, Series A, 5.25%, 1/01/30 | | 2,000,000 | | 2,178,040 |
| Series A, NATL Insured, Pre-Refunded, 5.75%, 1/01/18 | | 760,000 | | 795,834 |
| Spring Lake Park ISD No. 16 GO, School Building, Series A, AGMC Insured, 5.00%, 2/01/29 | | 4,025,000 | | 4,212,565 |
| St. Cloud Health Care Revenue, CentraCare Health System Project, | | | | |
| Series A, 5.125%, 5/01/30 | | 19,000,000 | | 20,520,760 |
| Series D, Assured Guaranty, 5.375%, 5/01/31 | | 1,000,000 | | 1,075,480 |
| Series D, Assured Guaranty, 5.50%, 5/01/39 | | 27,400,000 | | 29,034,136 |
| St. Michael ISD No. 885 GO, | | | | |
| Refunding, Series A, 4.25%, 2/01/32 | | 10,295,000 | | 10,860,298 |
| School Building, Refunding, Series A, AGMC Insured, 5.00%, 2/01/24 | | 2,735,000 | | 2,840,352 |
| School Building, Series A, AGMC Insured, 4.75%, 2/01/29 | | 5,000,000 | | 5,171,100 |
| St. Paul Housing and RDA Health Care System Revenue, Allina Health System, | | | | |
| Refunding, Series A-1, 5.25%, 11/15/29 | | 5,000,000 | | 5,383,750 |
| Series A, NATL Insured, 5.00%, 11/15/22 | | 5,000,000 | | 5,556,000 |
Annual Report | 123
| | | | |
| Franklin Tax-Free Trust | | | | |
| |
| Statement of Investments, February 28, 2014 (continued) | | | | |
| |
| |
| Franklin Minnesota Tax-Free Income Fund | | Principal Amount | | Value |
| Municipal Bonds (continued) | | | | |
| Minnesota (continued) | | | | |
| St. Paul ISD No. 625 GO, School Building, Minnesota School District Credit Enhancement | | | | |
| Program, | | | | |
| Refunding, Series B, 5.00%, 2/01/24 | $ | 2,925,000 | $ | 3,469,577 |
| Series A, 3.00%, 2/01/30 | | 1,385,000 | | 1,297,828 |
| Series A, 3.00%, 2/01/31 | | 1,195,000 | | 1,103,332 |
| Series A, AGMC Insured, 5.00%, 2/01/24 | | 1,615,000 | | 1,808,913 |
| Series A, AGMC Insured, 5.00%, 2/01/25 | | 1,675,000 | | 1,876,117 |
| Series A, AGMC Insured, 5.00%, 2/01/26 | | 1,745,000 | | 1,954,522 |
| St. Paul Sales Tax Revenue, sub. bond, Series A, XLCA Insured, 5.00%, 11/01/30 | | 7,360,000 | | 7,717,328 |
| University of Minnesota Regents GO, Series A, | | | | |
| 4.00%, 2/01/26 | | 2,425,000 | | 2,644,923 |
| 5.25%, 4/01/29 | | 1,000,000 | | 1,117,080 |
| 5.125%, 4/01/34 | | 1,000,000 | | 1,097,790 |
| University of Minnesota Regents Revenue, State Supported Biomedical Science Research | | | | |
| Facilities Funding Program, Series B, 5.00%, 8/01/36 | | 5,000,000 | | 5,410,800 |
| Waconia ISD No. 110 GO, School Building, Refunding, Series B, 4.125%, 2/01/22 | | 5,340,000 | | 5,802,070 |
| Watertown ISD No. 111 GO, School Building, Series A, AGMC Insured, 5.00%, 2/01/24 | | 2,725,000 | | 2,891,770 |
| Western Minnesota Municipal Power Agency Revenue, | | | | |
| Refunding, Series A, 5.00%, 1/01/24 | | 5,000,000 | | 5,923,100 |
| Refunding, Series A, 5.00%, 1/01/25 | | 3,370,000 | | 3,951,628 |
| Refunding, Series A, 5.00%, 1/01/29 | | 1,200,000 | | 1,353,024 |
| Refunding, Series A, 5.00%, 1/01/30 | | 1,000,000 | | 1,119,410 |
| Series A, AGMC Insured, 5.00%, 1/01/36 | | 6,000,000 | | 6,219,960 |
| Willmar GO, Rice Memorial Hospital Project, Refunding, Series A, | | | | |
| 5.00%, 2/01/24 | | 1,100,000 | | 1,265,121 |
| 5.00%, 2/01/26 | | 1,325,000 | | 1,502,391 |
| 3.00%, 2/01/28 | | 2,150,000 | | 2,002,467 |
| 3.00%, 2/01/29 | | 1,000,000 | | 915,010 |
| | | | | 992,370,330 |
| U.S. Territories 1.7% | | | | |
| Puerto Rico 1.5% | | | | |
| Puerto Rico Commonwealth GO, Public Improvement, Refunding, AGMC Insured, 5.125%, | | | | |
| 7/01/30 | | 275,000 | | 249,329 |
| Puerto Rico Commonwealth Highways and Transportation Authority Highway Revenue, Series Y, | | | | |
| AGMC Insured, 6.25%, 7/01/21 | | 10,000,000 | | 10,397,300 |
| Puerto Rico Public Finance Corp. Revenue, Commonwealth Appropriation, Series E, | | | | |
| AMBAC Insured, ETM, 5.50%, 8/01/27 | | 1,000,000 | | 1,207,730 |
| Puerto Rico Sales Tax FICO Sales Tax Revenue, Capital Appreciation, Sub Series A, zero cpn., | | | | |
| 8/01/34 | | 17,500,000 | | 3,401,825 |
| | | | | 15,256,184 |
124 | Annual Report
| | | | |
| Franklin Tax-Free Trust | | | | |
| |
| Statement of Investments, February 28, 2014 (continued) | | | | |
| |
| Franklin Minnesota Tax-Free Income Fund | | Principal Amount | | Value |
| Municipal Bonds (continued) | | | | |
| U.S. Territories (continued) | | | | |
| U.S. Virgin Islands 0.2% | | | | |
| Virgin Islands PFAR, Gross Receipts Taxes Loan Note, AGMC Insured, 5.25%, | | | | |
| 10/01/20 | $ | 1,160,000 | $ | 1,187,979 |
| 10/01/21 | | 1,000,000 | | 1,023,950 |
| | | | | 2,211,929 |
| Total U.S. Territories | | | | 17,468,113 |
| Total Municipal Bonds (Cost $959,142,207) 98.9% | | | | 1,009,838,443 |
| Other Assets, less Liabilities 1.1% | | | | 11,393,164 |
| Net Assets 100.0% | | | $ | 1,021,231,607 |
| |
| |
| See Abbreviations on page 181. | | | | |
Annual Report | The accompanying notes are an integral part of these financial statements. | 125
| | | | | | | | | | | | | | | |
| Franklin Tax-Free Trust | | | | | | | | | | | | | |
| Financial Highlights | | | | | | | | | | | | | | | |
| |
| Franklin Ohio Tax-Free Income Fund | | | | | | | | | | | | | | | |
| | | | | | Year Ended February 28, | | | | |
| Class A | | 2014 | | | 2013 | | | 2012 | a | | 2011 | | | 2010 | |
| Per share operating performance | | | | | | | | | | | | | | | |
| (for a share outstanding throughout the year) | | | | | | | | | | | | | | | |
| Net asset value, beginning of year | $ | 13.12 | | $ | 12.96 | | $ | 11.99 | | $ | 12.50 | | $ | 12.08 | |
| Income from investment operationsb: | | | | | | | | | | | | | | | |
| Net investment incomec | | 0.48 | | | 0.48 | | | 0.51 | | | 0.51 | | | 0.51 | |
| Net realized and unrealized gains (losses) | | (0.71 | ) | | 0.15 | | | 0.97 | | | (0.51 | ) | | 0.42 | |
| Total from investment operations | | (0.23 | ) | | 0.63 | | | 1.48 | | | — | | | 0.93 | |
| Less distributions from net investment income | | (0.45 | ) | | (0.47 | ) | | (0.51 | ) | | (0.51 | ) | | (0.51 | ) |
| Net asset value, end of year | $ | 12.44 | | $ | 13.12 | | $ | 12.96 | | $ | 11.99 | | $ | 12.50 | |
| |
| Total returnd | | (1.69 | )% | | 4.96 | % | | 12.61 | % | | (0.06 | )% | | 7.82 | % |
| |
| Ratios to average net assets | | | | | | | | | | | | | | | |
| Expenses | | 0.63 | % | | 0.63 | % | | 0.63 | % | | 0.63 | % | | 0.64 | % |
| Net investment income | | 3.86 | % | | 3.69 | % | | 4.07 | % | | 4.08 | % | | 4.10 | % |
| |
| Supplemental data | | | | | | | | | | | | | | | |
| Net assets, end of year (000’s) | $ | 1,144,885 | | $ | 1,445,535 | | $ | 1,305,046 | | $ | 1,227,868 | | $ | 1,314,090 | |
| Portfolio turnover rate | | 8.78 | % | | 9.69 | % | | 10.70 | % | | 18.67 | % | | 4.17 | % |
aFor the year ended February 29.
bThe amount shown for a share outstanding throughout the period may not correlate with the Statement of Operations for the period due to the timing of sales and repurchases of
the Fund shares in relation to income earned and/or fluctuating market value of the investments of the Fund.
cBased on average daily shares outstanding.
dTotal return does not reflect sales commissions or contingent deferred sales charges, if applicable.
126 | The accompanying notes are an integral part of these financial statements. | Annual Report
| | | | | | | | | | | | | | | |
| Franklin Tax-Free Trust | | | | | | | | | | | | | | | |
| Financial Highlights (continued) | | | | | | | | | | | | | | | |
| |
| Franklin Ohio Tax-Free Income Fund | | | | | | | | | | | | | | | |
| | | | | | Year Ended February 28, | | | | |
| Class C | | 2014 | | | 2013 | | | 2012 | a | | 2011 | | | 2010 | |
| Per share operating performance | | | | | | | | | | | | | | | |
| (for a share outstanding throughout the year) | | | | | | | | | | | | | | | |
| Net asset value, beginning of year | $ | 13.27 | | $ | 13.10 | | $ | 12.11 | | $ | 12.62 | | $ | 12.19 | |
| Income from investment operationsb: | | | | | | | | | | | | | | | |
| Net investment incomec | | 0.42 | | | 0.42 | | | 0.44 | | | 0.44 | | | 0.44 | |
| Net realized and unrealized gains (losses) | | (0.73 | ) | | 0.15 | | | 0.99 | | | (0.51 | ) | | 0.43 | |
| Total from investment operations | | (0.31 | ) | | 0.57 | | | 1.43 | | | (0.07 | ) | | 0.87 | |
| Less distributions from net investment income | | (0.38 | ) | | (0.40 | ) | | (0.44 | ) | | (0.44 | ) | | (0.44 | ) |
| Net asset value, end of year | $ | 12.58 | | $ | 13.27 | | $ | 13.10 | | $ | 12.11 | | $ | 12.62 | |
| |
| Total returnd | | (2.28 | )% | | 4.41 | % | | 12.05 | % | | (0.63 | )% | | 7.24 | % |
| |
| Ratios to average net assets | | | | | | | | | | | | | | | |
| Expenses | | 1.18 | % | | 1.18 | % | | 1.18 | % | | 1.18 | % | | 1.19 | % |
| Net investment income | | 3.31 | % | | 3.14 | % | | 3.52 | % | | 3.53 | % | | 3.55 | % |
| |
| Supplemental data | | | | | | | | | | | | | | | |
| Net assets, end of year (000’s) | $ | 301,447 | | $ | 416,262 | | $ | 346,117 | | $ | 309,921 | | $ | 287,586 | |
| Portfolio turnover rate | | 8.78 | % | | 9.69 | % | | 10.70 | % | | 18.67 | % | | 4.17 | % |
aFor the year ended February 29.
bThe amount shown for a share outstanding throughout the period may not correlate with the Statement of Operations for the period due to the timing of sales and repurchases of
the Fund shares in relation to income earned and/or fluctuating market value of the investments of the Fund.
cBased on average daily shares outstanding.
dTotal return does not reflect sales commissions or contingent deferred sales charges, if applicable.
Annual Report | The accompanying notes are an integral part of these financial statements. | 127
| | | | | | | | | | | | | | | |
| Franklin Tax-Free Trust | | | | | | | | | | | | | | | |
| Financial Highlights (continued) | | | | | | | | | | | | | | | |
| |
| Franklin Ohio Tax-Free Income Fund | | | | | | | | | | | | | | | |
| | | | | | Year Ended February 28, | | | | |
| Advisor Class | | 2014 | | | 2013 | | | 2012 | a | | 2011 | | | 2010 | |
| Per share operating performance | | | | | | | | | | | | | | | |
| (for a share outstanding throughout the year) | | | | | | | | | | | | | | | |
| Net asset value, beginning of year | $ | 13.12 | | $ | 12.96 | | $ | 11.99 | | $ | 12.50 | | $ | 12.08 | |
| Income from investment operationsb: | | | | | | | | | | | | | | | |
| Net investment incomec | | 0.49 | | | 0.50 | | | 0.52 | | | 0.52 | | | 0.52 | |
| Net realized and unrealized gains (losses) | | (0.71 | ) | | 0.15 | | | 0.97 | | | (0.51 | ) | | 0.42 | |
| Total from investment operations | | (0.22 | ) | | 0.65 | | | 1.49 | | | 0.01 | | | 0.94 | |
| Less distributions from net investment income | | (0.46 | ) | | (0.49 | ) | | (0.52 | ) | | (0.52 | ) | | (0.52 | ) |
| Net asset value, end of year | $ | 12.44 | | $ | 13.12 | | $ | 12.96 | | $ | 11.99 | | $ | 12.50 | |
| |
| Total return | | (1.59 | )% | | 5.07 | % | | 12.72 | % | | 0.04 | % | | 7.93 | % |
| |
| Ratios to average net assets | | | | | | | | | | | | | | | |
| Expenses | | 0.53 | % | | 0.53 | % | | 0.53 | % | | 0.53 | % | | 0.54 | % |
| Net investment income | | 3.96 | % | | 3.79 | % | | 4.17 | % | | 4.18 | % | | 4.20 | % |
| |
| Supplemental data | | | | | | | | | | | | | | | |
| Net assets, end of year (000’s) | $ | 37,153 | | $ | 45,364 | | $ | 36,127 | | $ | 18,878 | | $ | 13,367 | |
| Portfolio turnover rate | | 8.78 | % | | 9.69 | % | | 10.70 | % | | 18.67 | % | | 4.17 | % |
aFor the year ended February 29.
bThe amount shown for a share outstanding throughout the period may not correlate with the Statement of Operations for the period due to the timing of sales and repurchases of
the Fund shares in relation to income earned and/or fluctuating market value of the investments of the Fund.
cBased on average daily shares outstanding.
128 | The accompanying notes are an integral part of these financial statements. | Annual Report
| | | | | |
| Franklin Tax-Free Trust | | | | | |
| |
| Statement of Investments, February 28, 2014 | | | | | |
| |
| |
| Franklin Ohio Tax-Free Income Fund | | | Principal Amount | | Value |
| Municipal Bonds 98.8% | | | | | |
| Ohio 92.7% | | | | | |
| Akron COP, District Energy Project, 5.00%, 12/01/30 | | $ | 9,910,000 | $ | 10,477,744 |
| Akron Income Tax Revenue, Community Learning Centers, Series A, 4.50%, 12/01/33 | | | 10,000,000 | | 10,390,700 |
| Akron Waterworks System Mortgage Revenue, Refunding and Improvement, Assured Guaranty, | | | | | |
| 5.00%, 3/01/34 | | | 1,000,000 | | 1,042,060 |
| Allen County Hospital Facilities Revenue, Catholic Healthcare Partners, Refunding, | | | | | |
| Series A, 5.25%, 6/01/38 | | | 15,000,000 | | 15,571,950 |
| Series B, 5.25%, 9/01/27 | | | 7,570,000 | | 8,255,009 |
| American Municipal Power-Ohio Inc. Revenue, Prairie State Energy Campus Project, Refunding, | | | | | |
| Series A, | | | | | |
| Assured Guaranty, 5.25%, 2/15/33 | | | 30,000,000 | | 31,691,400 |
| BHAC Insured, 5.00%, 2/15/38 | | | 22,000,000 | | 22,884,620 |
| Ashland City School District GO, Classroom Facilities and School Improvement, Series 2, | | | | | |
| 4.00%, 11/01/49 | | | 6,685,000 | | 5,700,567 |
| Austintown Local School District GO, School Improvement, AGMC Insured, Pre-Refunded, | | | | | |
| 5.125%, 12/01/30 | | | 7,715,000 | | 7,995,980 |
| Bath Local School District GO, School Improvement, AGMC Insured, | | | | | |
| 4.00%, 12/01/44 | | | 3,295,000 | | 2,864,212 |
| 5.00%, 12/01/49 | | | 5,380,000 | | 5,487,492 |
| Beaver Local School District GO, School Facilities, 4.00%, 12/01/40 | | | 4,000,000 | | 3,834,760 |
| Bowling Green MFHR, The Bowling Green Village Apartments, Series A, GNMA Secured, 5.40%, | | | | | |
| 9/20/36 | | | 2,820,000 | | 2,821,636 |
| Brookfield Local School District GO, School Facilities Improvement, AGMC Insured, 5.25%, | | | | | |
| 1/15/36 | | | 1,300,000 | | 1,396,512 |
| Brooklyn City School District GO, School Improvement, | | | | | |
| AGMC Insured, 5.25%, 12/01/43 | | | 3,000,000 | | 3,127,560 |
| Refunding, AGMC Insured, 5.50%, 12/01/49 | | | 7,780,000 | | 8,112,517 |
| Butler County GO, Various Purpose, Refunding, NATL RE, FGIC Insured, 5.00%, 12/01/26 | | | 2,130,000 | | 2,297,056 |
| Butler County Hospital Facilities Revenue, Kettering Health Network Obligated Group Project, | | | | | |
| 6.375%, 4/01/36 | | | 5,000,000 | | 5,662,550 |
| 5.625%, 4/01/41 | | | 5,000,000 | | 5,435,050 |
| Canal Winchester Local School District GO, Capital Appreciation, NATL Insured, zero cpn., | | | | | |
| 12/01/32 | | | 1,455,000 | | 650,792 |
| 12/01/33 | | | 2,000,000 | | 847,100 |
| Central Solid Waste Authority GO, | | | | | |
| Improvement, Solid Waste Facilities, Pre-Refunded, 4.00%, 12/01/32 | | | 1,505,000 | | 1,719,041 |
| Refunding and Improvement, Solid Waste Facilities, 4.00%, 12/01/32 | | | 15,440,000 | | 15,721,626 |
| Chillicothe City School District GO, Capital Appreciation, School Improvement, Refunding, | | | | | |
| NATL RE, FGIC Insured, zero cpn., | | | | | |
| 12/01/22 | | | 1,905,000 | | 1,444,714 |
| 12/01/23 | | | 1,905,000 | | 1,387,678 |
| 12/01/24 | | | 1,905,000 | | 1,360,418 |
| Cincinnati City School District COP, School Improvement Project, Refunding, AGMC Insured, | | | | | |
| 5.00%, | | | | | |
| 12/15/26 | | | 7,310,000 | | 7,825,647 |
| 12/15/27 | | | 7,000,000 | | 7,478,240 |
Annual Report | 129
| | | | |
| Franklin Tax-Free Trust | | | | |
| |
| Statement of Investments, February 28, 2014 (continued) | | | | |
| |
| |
| Franklin Ohio Tax-Free Income Fund | | Principal Amount | | Value |
| Municipal Bonds (continued) | | | | |
| Ohio (continued) | | | | |
| Cincinnati City School District GO, Classroom Facilities Construction and Improvement, | | | | |
| Refunding, NATL RE, FGIC Insured, 5.25%, | | | | |
| 12/01/27 | $ | 14,900,000 | $ | 17,868,527 |
| 12/01/28 | | 5,000,000 | | 5,975,000 |
| Cleveland Airport System Revenue, | | | | |
| Refunding, Series A, AGMC Insured, 5.00%, 1/01/30 | | 3,000,000 | | 3,148,230 |
| Refunding, Series A, AGMC Insured, 5.00%, 1/01/31 | | 1,500,000 | | 1,549,905 |
| Series C, AGMC Insured, 5.00%, 1/01/26 | | 9,500,000 | | 10,151,035 |
| Series C, AGMC Insured, 5.00%, 1/01/31 | | 11,250,000 | | 11,686,950 |
| Series C, Assured Guaranty, 5.00%, 1/01/27 | | 27,385,000 | | 28,769,859 |
| Cleveland GO, Various Purpose, Refunding, 5.00%, 12/01/30 | | 3,000,000 | | 3,263,070 |
| Cleveland Municipal School District GO, School Improvement, | | | | |
| AGMC Insured, Pre-Refunded, 5.00%, 12/01/27 | | 4,000,000 | | 4,046,120 |
| Refunding, 5.00%, 12/01/25 | | 3,600,000 | | 4,049,532 |
| Refunding, 5.00%, 12/01/27 | | 1,000,000 | | 1,107,280 |
| Cleveland Public Power System Revenue, | | | | |
| Capital Appreciation, Series B-2, NATL RE, FGIC Insured, zero cpn., 11/15/38 | | 10,000,000 | | 2,581,400 |
| Series B-1, NATL Insured, 5.00%, 11/15/28 | | 2,000,000 | | 2,104,020 |
| Series B-1, NATL Insured, 5.00%, 11/15/38 | | 10,000,000 | | 10,211,500 |
| Cleveland State University General Receipt Revenue, NATL RE, FGIC Insured, Pre-Refunded, | | | | |
| 5.25%, 6/01/24 | | 1,000,000 | | 1,012,130 |
| Cleveland-Cuyahoga County Port Authority Revenue, Student Housing Facility, Euclid Avenue | | | | |
| Housing Corp., Fenn Tower Project, AMBAC Insured, 5.00%, | | | | |
| 8/01/25 | | 2,440,000 | | 2,359,578 |
| 8/01/28 | | 2,145,000 | | 2,026,896 |
| Columbus Metropolitan Library Special Obligation Revenue, Library Fund Facilities Notes, | | | | |
| Series 1, 4.00%, | | | | |
| 12/01/27 | | 3,765,000 | | 3,897,566 |
| 12/01/28 | | 2,970,000 | | 3,058,328 |
| 12/01/29 | | 4,125,000 | | 4,222,762 |
| 12/01/37 | | 7,620,000 | | 7,573,366 |
| Coventry Local School District GO, School Improvement, 5.25%, 11/01/47 | | 5,000,000 | | 5,200,850 |
| Cuyahoga Community College District General Receipts Revenue, Series D, 5.00%, 8/01/32 | | 2,310,000 | | 2,487,108 |
| Cuyahoga County EDR, Recovery Zone Facility, Medical Mart/Convention Center Project, | | | | |
| Series F, 5.00%, 12/01/27 | | 15,000,000 | | 16,330,200 |
| Dayton Metro Library GO, Library Improvement, Series A, 4.75%, 12/01/38 | | 20,000,000 | | 20,961,600 |
| Delaware City School District GO, School Facilities Construction and Improvement, 5.75%, | | | | |
| 12/01/49 | | 6,000,000 | | 6,575,640 |
| Delaware General Income Tax Special Obligation, 4.75%, 12/01/37 | | 4,000,000 | | 4,125,320 |
| Dublin City School District GO, Capital Appreciation, NATL RE, FGIC Insured, zero cpn., | | | | |
| 12/01/16 | | 4,635,000 | | 4,523,621 |
| Edgewood City School District GO, School Improvement, Refunding, AGMC Insured, 5.00%, | | | | |
| 12/01/24 | | 2,220,000 | | 2,295,724 |
| Fairborn City School District GO, School Improvement, Refunding, AGMC Insured, 5.00%, | | | | |
| 12/01/23 | | 1,205,000 | | 1,274,480 |
| 12/01/24 | | 1,265,000 | | 1,335,663 |
| 12/01/25 | | 1,330,000 | | 1,400,131 |
130 | Annual Report
| | | | | |
| | Franklin Tax-Free Trust | | | | |
| |
| | Statement of Investments, February 28, 2014 (continued) | | | | |
| |
| |
| | Franklin Ohio Tax-Free Income Fund | | Principal Amount | | Value |
| | Municipal Bonds (continued) | | | | |
| | Ohio (continued) | | | | |
| | Fairless Local School District GO, Various Purpose School Facilities, Construction and | | | | |
| | Improvement, AGMC Insured, Pre-Refunded, 5.00%, 12/01/28 | $ | 2,085,000 | $ | 2,159,018 |
| | Franklin County Convention Facilities Authority Revenue, Tax and Lease Revenue Anticipation | | | | |
| | Bonds, Refunding, AMBAC Insured, 5.00%, 12/01/24 | | 7,255,000 | | 7,748,703 |
| | Franklin County Hospital Revenue, | | | | |
| | Improvement, Nationwide Children’s Hospital Project, 5.25%, 11/01/40 | | 15,000,000 | | 15,784,650 |
| | The Children’s Hospital Project, Series C, NATL RE, FGIC Insured, 5.00%, 5/01/35 | | 4,000,000 | | 4,074,040 |
| | Georgetown Exempted Village School District GO, Classroom Facilities, AGMC Insured, | | | | |
| Pre-Refunded, 5.125%, 12/01/31 | | 1,000,000 | | 1,036,420 |
| | Graham Local School District GO, School Improvement, NATL Insured, Pre-Refunded, 5.00%, | | | | |
| | 12/01/33 | | 6,055,000 | | 6,551,510 |
| | Green Community Learning Centers Income Tax Revenue, NATL Insured, Pre-Refunded, 5.00%, | | | | |
| | 12/01/27 | | 1,205,000 | | 1,219,038 |
| | 12/01/28 | | 1,265,000 | | 1,279,737 |
| | 12/01/32 | | 2,675,000 | | 2,706,164 |
| | Greene County Hospital Facility Revenue, Kettering Health Network Obligated Group Project, | | | | |
| | 5.50%, 4/01/39 | | 12,930,000 | | 13,480,301 |
| | Greenville City School District GO, School Improvement, 5.25%, 1/01/41 | | 2,000,000 | | 2,120,860 |
| | Hamilton County Convention Facilities Authority Revenue, NATL RE, FGIC Insured, 5.00%, | | | | |
| | 12/01/28 | | 5,400,000 | | 5,430,996 |
| | Hamilton County Sales Tax Revenue, | | | | |
| | Refunding, Series A, Assured Guaranty, 5.00%, 12/01/32 | | 10,000,000 | | 10,459,900 |
| | sub. bond, Refunding, Series A, AGMC Insured, 5.00%, 12/01/32 | | 35,080,000 | | 36,693,329 |
| | Hamilton County Sewer System Revenue, Metropolitan Sewer District Improvement, Series B, | | | | |
| | NATL Insured, 5.00%, 12/01/30 | | 4,000,000 | | 4,193,440 |
| | Hamilton County Student Housing Revenue, Stratford Heights Project, University of Cincinnati, | | | | |
| | Refunding, AGMC Insured, | | | | |
| | 5.00%, 6/01/30 | | 7,000,000 | | 7,398,510 |
| | 4.75%, 6/01/39 | | 7,000,000 | | 7,139,580 |
| | Hilliard School District GO, Capital Appreciation, School Construction, Refunding, NATL Insured, | | | | |
| | zero cpn., | | | | |
| | 12/01/19 | | 2,190,000 | | 1,959,196 |
| | 12/01/20 | | 4,525,000 | | 3,860,685 |
| | Huber Heights City School District GO, School Improvement, Refunding, 5.00%, | | | | |
| | 12/01/33 | | 4,500,000 | | 4,787,775 |
| | 12/01/36 | | 5,000,000 | | 5,277,450 |
| | Huber Heights Water System Revenue, Refunding and Improvement, NATL Insured, 5.00%, | | | | |
| | 12/01/27 | | 3,205,000 | | 3,355,475 |
| | 12/01/30 | | 2,250,000 | | 2,344,275 |
| | Ironton City School District GO, NATL Insured, Pre-Refunded, 5.00%, 12/01/34 | | 5,130,000 | | 5,779,612 |
| | Ironton Sewer Revenue, System Improvement, AGMC Insured, 5.25%, 12/01/40 | | 2,500,000 | | 2,613,700 |
| | Kent State University Revenues, General Receipts, Series B, Assured Guaranty, 4.25%, | | | | |
| | 5/01/31 | | 2,395,000 | | 2,428,123 |
| | Kettering City School District GO, School Improvement, AGMC Insured, Pre-Refunded, 5.00%, | | | | |
| | 12/01/28 | | 2,970,000 | | 3,004,244 |
| | 12/01/31 | | 2,595,000 | | 2,624,920 |
Annual Report | 131
| | | | |
| Franklin Tax-Free Trust | | | | |
| |
| Statement of Investments, February 28, 2014 (continued) | | | | |
| |
| |
| Franklin Ohio Tax-Free Income Fund | | Principal Amount | | Value |
| Municipal Bonds (continued) | | | | |
| Ohio (continued) | | | | |
| Keystone Local School District Lorain County GO, School Improvement, AGMC Insured, | | | | |
| Pre-Refunded, 5.00%, | | | | |
| 12/01/30 | $ | 3,740,000 | $ | 3,783,571 |
| 12/01/30 | | 2,430,000 | | 2,458,018 |
| Kings Local School District GO, School Improvement, NATL Insured, | | | | |
| 5.00%, 12/01/33 | | 4,635,000 | | 4,919,867 |
| Pre-Refunded, 5.00%, 12/01/33 | | 5,365,000 | | 6,212,670 |
| Lakewood City School District GO, | | | | |
| School Facilities Improvement, NATL RE, FGIC Insured, 5.00%, 12/01/30 | | 9,170,000 | | 9,976,226 |
| School Facilities Improvement, NATL RE, FGIC Insured, 4.50%, 12/01/34 | | 6,000,000 | | 6,218,940 |
| School Improvement, AGMC Insured, Pre-Refunded, 5.125%, 12/01/31 | | 21,900,000 | | 22,697,598 |
| School Improvement, Refunding, AGMC Insured, 4.50%, 12/01/31 | | 1,000,000 | | 1,047,580 |
| Lakota Local School District GO, | | | | |
| Refunding, Series A, NATL RE, FGIC Insured, 5.25%, 12/01/26 | | 2,000,000 | | 2,412,100 |
| School Improvement, AGMC Insured, Pre-Refunded, 5.00%, 12/01/29 | | 5,000,000 | | 5,414,550 |
| Lancaster City School District GO, School Facilities Construction and Improvement, 5.00%, | | | | |
| 10/01/49 | | 10,000,000 | | 10,244,800 |
| Licking Heights Local School District GO, School Facilities Construction and Improvement, | | | | |
| Series A, NATL Insured, Pre-Refunded, 5.00%, 12/01/26 | | 1,825,000 | | 1,932,858 |
| Little Miami Local School District GO, | | | | |
| Refunding, AGMC Insured, 4.50%, 12/01/34 | | 14,255,000 | | 14,356,638 |
| School Improvement, AGMC Insured, Pre-Refunded, 5.00%, 12/01/34 | | 4,000,000 | | 4,500,680 |
| Lorain County GO, Sewer System Improvement, NATL Insured, 5.00%, 12/01/19 | | 1,640,000 | | 1,655,941 |
| Lorain County Hospital Revenue, Catholic Healthcare Partners, Refunding, | | | | |
| Series C-1, AGMC Insured, 5.00%, 4/01/33 | | 19,410,000 | | 20,407,480 |
| Series C-2, AGMC Insured, 5.00%, 4/01/33 | | 8,000,000 | | 8,411,440 |
| Lucas County GO, Various Purpose, 4.50%, 10/01/35 | | 10,685,000 | | 10,865,683 |
| Madeira City School District GO, School Improvement, Refunding, AGMC Insured, 5.25%, | | | | |
| 12/01/32 | | 9,605,000 | | 11,633,096 |
| Mahoning County Career and Technical Center Board of Education COP, Series B, 4.75%, | | | | |
| 12/01/36 | | 3,500,000 | | 3,570,595 |
| Mahoning County Hospital Facilities Revenue, Western Reserve Care System Project, | | | | |
| NATL Insured, ETM, 5.50%, 10/15/25 | | 4,750,000 | | 5,680,810 |
| Maple Heights City School District GO, School Facilities Improvement, | | | | |
| 5.00%, 1/15/37 | | 8,265,000 | | 8,638,413 |
| Pre-Refunded, 5.00%, 1/15/37 | | 1,735,000 | | 1,955,449 |
| Martins Ferry City School District GO, School Facilities Construction and Improvement, | | | | |
| AGMC Insured, Pre-Refunded, 5.00%, 12/01/32 | | 3,610,000 | | 3,823,351 |
| Marysville Exempted Village School District COP, School Facilities Project, NATL Insured, | | | | |
| Pre-Refunded, 5.25%, | | | | |
| 12/01/28 | | 2,120,000 | | 2,250,486 |
| 12/01/30 | | 2,650,000 | | 2,813,107 |
| Marysville Exempted Village School District GO, | | | | |
| Capital Appreciation, Refunding, NATL Insured, zero cpn., 12/01/20 | | 1,000,000 | | 819,270 |
| Capital Appreciation, Refunding, NATL Insured, zero cpn., 12/01/21 | | 1,000,000 | | 794,180 |
| School Improvement, Refunding, AGMC Insured, 5.00%, 12/01/29 | | 5,500,000 | | 5,732,320 |
132 | Annual Report
| | | | |
| Franklin Tax-Free Trust | | | | |
| |
| Statement of Investments, February 28, 2014 (continued) | | | | |
| |
| |
| Franklin Ohio Tax-Free Income Fund | | Principal Amount | | Value |
| Municipal Bonds (continued) | | | | |
| Ohio (continued) | | | | |
| Marysville Wastewater Treatment System Revenue, | | | | |
| Assured Guaranty, 4.25%, 12/01/27 | $ | 1,170,000 | $ | 1,222,159 |
| Assured Guaranty, 4.75%, 12/01/47 | | 5,000,000 | | 5,132,250 |
| first mortgage, NATL Insured, Pre-Refunded, 5.00%, 12/01/35 | | 4,780,000 | | 5,171,960 |
| Refunding, Assured Guaranty, 4.75%, 12/01/46 | | 14,205,000 | | 14,566,943 |
| Marysville Water System Mortgage Revenue, AMBAC Insured, 5.00%, 12/01/32 | | 1,250,000 | | 1,325,013 |
| Medina School District COP, School Facilities Project, Assured Guaranty, 5.25%, 12/01/31 | | 5,725,000 | | 6,233,895 |
| Miami University Revenue, General Receipts, Refunding, 5.00%, 9/01/31 | | 4,000,000 | | 4,364,720 |
| Monroe Local School District GO, School Improvement, Refunding, AMBAC Insured, 4.50%, | | | | |
| 12/01/29 | | 3,115,000 | | 3,154,841 |
| Montgomery County Revenue, Catholic Health Initiatives, | | | | |
| Refunding, Series A, 5.50%, 5/01/34 | | 12,500,000 | | 13,912,375 |
| Refunding, Series A, 5.00%, 5/01/39 | | 10,000,000 | | 10,121,600 |
| Series C-1, AGMC Insured, 5.00%, 10/01/41 | | 10,000,000 | | 10,213,400 |
| Napoleon City School District GO, School Facilities Construction and Improvement, 5.00%, | | | | |
| 12/01/49 | | 11,460,000 | | 11,794,403 |
| New Albany Community Authority Community Facilities Revenue, Refunding, Series C, 5.00%, | | | | |
| 10/01/23 | | 1,100,000 | | 1,243,869 |
| 10/01/24 | | 1,250,000 | | 1,400,575 |
| New Albany Plain Local School District GO, School Improvement, Refunding, 4.00%, | | | | |
| 12/01/49 | | 10,000,000 | | 9,265,300 |
| Newark City School District GO, School Improvement, Series A, NATL RE, FGIC Insured, | | | | |
| Pre-Refunded, 5.00%, 12/01/33 | | 5,000,000 | | 5,180,900 |
| Northeast Ohio Medical University General Receipts Revenue, 5.00%, 12/01/42 | | 13,445,000 | | 13,143,160 |
| Northmont City School District GO, School Improvement, Series A, 5.00%, 11/01/49 | | 5,130,000 | | 5,378,908 |
| Ohio Center for Local Government Capital Asset Financing Program Fractionalized Interests GO, | | | | |
| AGMC Insured, | | | | |
| 4.875%, 12/01/18 | | 482,332 | | 483,326 |
| 5.25%, 12/01/23 | | 540,000 | | 540,907 |
| Ohio HFA Capital Fund Revenue, Series A, AGMC Insured, 5.00%, 4/01/27 | | 5,545,000 | | 5,881,415 |
| Ohio State Air Quality Development Authority Revenue, | | | | |
| Environmental Improvement, Buckeye Power Inc. Project, 6.00%, 12/01/40 | | 6,020,000 | | 6,392,096 |
| Pollution Control, Dayton Power and Light Co., Refunding, Series B, BHAC Insured, | | | | |
| 4.80%, 1/01/34 | | 23,000,000 | | 23,186,070 |
| Ohio State Building Authority Revenue, State Facilities, Adult Correction Building Fund Projects, | | | | |
| Series A, AGMC Insured, Pre-Refunded, 5.00%, 4/01/24 | | 5,390,000 | | 5,666,938 |
| Ohio State Higher Educational Facility Commission Revenue, | | | | |
| Denison University Project, Refunding and Improvement, 5.00%, 11/01/26 | | 1,445,000 | | 1,609,499 |
| Denison University Project, Refunding and Improvement, 5.00%, 11/01/30 | | 1,360,000 | | 1,477,436 |
| Higher Educational Facility, Xavier University Project, Assured Guaranty, Pre-Refunded, | | | | |
| 5.00%, 5/01/23 | | 3,385,000 | | 3,726,546 |
| Higher Educational Facility, Xavier University Project, Assured Guaranty, Pre-Refunded, | | | | |
| 5.00%, 5/01/24 | | 2,000,000 | | 2,201,800 |
| Kenyon College Project, Refunding, 5.25%, 7/01/44 | | 30,000,000 | | 31,442,700 |
| Summa Health System, 2010 Project, Refunding, Assured Guaranty, 5.25%, 11/15/40 | | 21,805,000 | | 22,253,529 |
| Summa Health System, AGMC Insured, 5.75%, 11/15/40 | | 4,500,000 | | 4,736,205 |
| University Hospital, BHAC Insured, 4.75%, 1/15/36 | | 10,000,000 | | 10,162,500 |
Annual Report | 133
| | | | |
| Franklin Tax-Free Trust | | | | |
| |
| Statement of Investments, February 28, 2014 (continued) | | | | |
| |
| |
| Franklin Ohio Tax-Free Income Fund | | Principal Amount | | Value |
| Municipal Bonds (continued) | | | | |
| Ohio (continued) | | | | |
| Ohio State Higher Educational Facility Commission Revenue, (continued) | | | | |
| University Hospital, BHAC Insured, 4.75%, 1/15/46 | $ | 25,000,000 | $ | 25,265,000 |
| University Hospital, BHAC Insured, 5.25%, 1/15/46 | | 13,500,000 | | 13,896,090 |
| University of Dayton Project, XLCA Insured, Pre-Refunded, 5.00%, 12/01/34 | | 8,500,000 | | 8,801,750 |
| Xavier University Project, 5.00%, 5/01/40 | | 14,500,000 | | 14,877,290 |
| Ohio State Higher Educational Facility Revenue, | | | | |
| Case Western Reserve University Project, Refunding, NATL Insured, 5.00%, 12/01/44 | | 7,500,000 | | 7,796,925 |
| Otterbein College Project, Assured Guaranty, 5.00%, 12/01/25 | | 2,205,000 | | 2,278,691 |
| Otterbein College Project, Assured Guaranty, 5.00%, 12/01/35 | | 3,225,000 | | 3,286,081 |
| Ohio State Turnpike Commission Revenue, Infrastructure Projects, junior lien, Series A-1, | | | | |
| 5.25%, 2/15/33 | | 4,200,000 | | 4,591,398 |
| Olentangy Local School District GO, | | | | |
| AGMC Insured, Pre-Refunded, 5.00%, 12/01/30 | | 1,745,000 | | 1,926,620 |
| Delaware and Franklin Counties, AGMC Insured, 4.50%, 12/01/33 | | 10,000,000 | | 10,269,600 |
| Refunding, Series A, AGMC Insured, 4.50%, 12/01/32 | | 11,300,000 | | 11,690,754 |
| School Facilities Construction and Improvement, Refunding, Assured Guaranty, 5.00%, | | | | |
| 12/01/36 | | 7,505,000 | | 7,977,965 |
| Painesville City School District GO, School Improvement, NATL RE, FGIC Insured, Pre-Refunded, | | | | |
| 5.00%, 12/01/28 | | 2,515,000 | | 2,604,283 |
| Princeton City School District COP, School Facilities Project, 4.50%, 12/01/41 | | 3,000,000 | | 3,042,900 |
| Reynoldsburg City School District GO, School Facilities Construction, AGMC Insured, 5.00%, | | | | |
| 12/01/32 | | 3,000,000 | | 3,216,000 |
| Ross County Hospital Revenue, Facilities, Adena Health System, Refunding, Assured Guaranty, | | | | |
| 5.25%, 12/01/38 | | 15,000,000 | | 15,448,500 |
| Shawnee State University Revenue, General Receipts, NATL Insured, 5.00%, 6/01/28 | | 5,780,000 | | 5,900,744 |
| Sheffield Lake City School District GO, School Improvement, 5.00%, 12/01/37 | | 9,635,000 | | 10,098,925 |
| South-Western City School District of Ohio Franklin and Pickaway Counties GO, School Facilities | | | | |
| Construction and Improvement, 4.00%, 12/01/42 | | 11,050,000 | | 10,628,995 |
| Springboro Community City School District GO, Refunding, AGMC Insured, 5.25%, | | | | |
| 12/01/27 | | 5,175,000 | | 6,174,551 |
| 12/01/28 | | 2,000,000 | | 2,390,000 |
| Springboro Sewer System Revenue, Mortgage, NATL Insured, Pre-Refunded, 5.00%, 6/01/27 | | 1,095,000 | | 1,107,625 |
| St. Bernard Income Tax Revenue, Various Purpose, Special Obligations, AGMC Insured, 5.00%, | | | | |
| 12/01/43 | | 3,760,000 | | 3,952,098 |
| St. Mary’s City School District GO, School Facilities Construction and Improvement, | | | | |
| AGMC Insured, 5.00%, 12/01/35 | | 3,500,000 | | 3,601,990 |
| Strongsville City School District GO, School Improvement, 4.00%, 12/01/45 | | 17,515,000 | | 16,667,099 |
| Summit County Port Authority Lease Revenue, The University of Akron Student Housing Project, | | | | |
| 6.00%, 1/01/42 | | 11,580,000 | | 12,950,146 |
| Switzerland of Local School District GO, School Improvement, Refunding, 4.00%, 12/01/37 | | 5,500,000 | | 5,351,555 |
| Sylvania City School District GO, School Improvement, Assured Guaranty, 5.25%, 12/01/36 | | 7,660,000 | | 8,185,399 |
| Toledo City School District GO, School Facilities Improvement, | | | | |
| 5.375%, 12/01/35 | | 4,565,000 | | 4,916,916 |
| Refunding, Series B, 5.00%, 12/01/32 | | 7,830,000 | | 8,540,964 |
| Toledo GO, | | | | |
| Capital Improvement, Refunding, Assured Guaranty, 5.00%, 12/01/29 | | 2,500,000 | | 2,666,525 |
| Various Purpose Improvement, Refunding, Assured Guaranty, 5.00%, 12/01/28 | | 3,000,000 | | 3,254,790 |
134 | Annual Report
| | | | |
| Franklin Tax-Free Trust | | | | |
| |
| Statement of Investments, February 28, 2014 (continued) | | | | |
| |
| |
| Franklin Ohio Tax-Free Income Fund | | Principal Amount | | Value |
| Municipal Bonds (continued) | | | | |
| Ohio (continued) | | | | |
| Toledo Special Obligation, Industrial Development, Vehicle Storage Project, AMBAC Insured, | | | | |
| 5.25%, 12/01/26 | $ | 1,500,000 | $ | 1,602,315 |
| Toledo Water System Revenue, | | | | |
| Improvement and Refunding, 5.00%, 11/15/38 | | 19,395,000 | | 20,889,191 |
| NATL Insured, 5.00%, 11/15/30 | | 6,425,000 | | 6,694,015 |
| Series A, 4.00%, 11/15/36 | | 9,125,000 | | 8,977,357 |
| Trenton Water System Revenue, Improvement, AGMC Insured, Pre-Refunded, 5.125%, | | | | |
| 12/01/34 | | 2,750,000 | | 2,850,155 |
| University of Akron General Receipts Revenue, | | | | |
| NATL RE, FGIC Insured, 5.00%, 1/01/35 | | 5,250,000 | | 5,257,087 |
| Series A, AGMC Insured, 5.00%, 1/01/33 | | 5,000,000 | | 5,284,250 |
| Series B, AGMC Insured, 5.00%, 1/01/38 | | 19,000,000 | | 19,878,750 |
| Series B, NATL RE, FGIC Insured, 5.00%, 1/01/28 | | 1,475,000 | | 1,477,596 |
| University of Cincinnati General Receipts Revenue, | | | | |
| Refunding, Series F, 5.00%, 6/01/32 | | 5,805,000 | | 6,276,308 |
| Series A, AMBAC Insured, Pre-Refunded, 5.00%, 6/01/23 | | 1,665,000 | | 1,684,197 |
| Series A, AMBAC Insured, Pre-Refunded, 5.00%, 6/01/24 | | 1,750,000 | | 1,770,388 |
| Series A, AMBAC Insured, Pre-Refunded, 5.00%, 6/01/25 | | 1,810,000 | | 1,831,087 |
| Series C, AGMC Insured, 5.00%, 6/01/31 | | 8,000,000 | | 8,500,880 |
| Series C, 5.00%, 6/01/39 | | 6,255,000 | | 6,661,512 |
| University of Toledo General Receipts Revenue, Refunding, Series A, AMBAC Insured, 4.50%, | | | | |
| 6/01/30 | | 10,000,000 | | 10,190,400 |
| Warren City School District GO, School Improvement, NATL RE, FGIC Insured, Pre-Refunded, | | | | |
| 5.00%, 12/01/28 | | 3,000,000 | | 3,034,590 |
| Westerville City School District GO, Refunding, XLCA Insured, 5.00%, 12/01/27 | | 3,820,000 | | 4,422,452 |
| Wheelersburg Local School District GO, School Improvement, AGMC Insured, Pre-Refunded, | | | | |
| 5.00%, 12/01/32 | | 1,400,000 | | 1,482,740 |
| Wright State University Revenue, General Receipts, Series A, 5.00%, 5/01/31 | | 10,120,000 | | 10,808,767 |
| Wyoming City School District GO, School Improvement, 5.00%, 12/01/42 | | 7,250,000 | | 7,608,730 |
| Youngstown State University General Receipts Revenue, Assured Guaranty, | | | | |
| 5.25%, 12/15/29 | | 4,000,000 | | 4,304,480 |
| 5.50%, 12/15/33 | | 4,225,000 | | 4,544,368 |
| | | | | 1,375,374,412 |
| U.S. Territories 6.1% | | | | |
| Puerto Rico 4.8% | | | | |
| Puerto Rico Commonwealth Highways and Transportation Authority Transportation Revenue, | | | | |
| Refunding, Series N, AGMC Insured, 5.50%, 7/01/29 | | 14,000,000 | | 13,103,300 |
| Puerto Rico Public Finance Corp. Revenue, Commonwealth Appropriation, Series E, ETM, | | | | |
| 6.00%, 8/01/26 | | 9,140,000 | | 11,507,443 |
| Puerto Rico Sales Tax FICO Sales Tax Revenue, | | | | |
| Capital Appreciation, Refunding, Series A, NATL Insured, zero cpn., 8/01/44 | | 47,550,000 | | 6,410,691 |
| Capital Appreciation, Refunding, Series A, NATL Insured, zero cpn., 8/01/46 | | 100,000,000 | | 11,817,000 |
| first subordinate, Series A, 5.25%, 8/01/27 | | 4,735,000 | | 3,955,667 |
| Refunding, Senior Series C, 5.00%, 8/01/40 | | 5,000,000 | | 4,091,350 |
| Refunding, Senior Series C, zero cpn., 8/01/39 | | 40,000,000 | | 6,914,000 |
| Senior Series C, 5.25%, 8/01/40 | | 15,025,000 | | 12,618,145 |
| | | | | 70,417,596 |
Annual Report | 135
Franklin Tax-Free Trust
Statement of Investments, February 28, 2014 (continued)
| | | | |
| Franklin Ohio Tax-Free Income Fund | | Principal Amount | | Value |
| Municipal Bonds (continued) | | | | |
| U.S. Territories (continued) | | | | |
| U.S. Virgin Islands 1.3% | | | | |
| Virgin Islands PFAR, Matching Fund Loan Notes, senior lien, AGMC Insured, 5.00%, | | | | |
| 10/01/29 | $ | 18,340,000 | $ | 19,292,763 |
| Total U.S. Territories | | | | 89,710,359 |
| Total Municipal Bonds before Short Term Investments | | | | |
| (Cost $1,422,531,272) | | | | 1,465,084,771 |
| Short Term Investments (Cost $1,500,000) 0.1% | | | | |
| Municipal Bonds 0.1% | | | | |
| Ohio 0.1% | | | | |
| aAllen County Hospital Facilities Revenue, Catholic Healthcare Partners, Series A, | | | | |
| Daily VRDN and Put, 0.04%, 10/01/31 | | 1,500,000 | | 1,500,000 |
| Total Investments (Cost $1,424,031,272) 98.9% | | | | 1,466,584,771 |
| Other Assets, less Liabilities 1.1% | | | | 16,899,991 |
| Net Assets 100.0% | | | $ | 1,483,484,762 |
See Abbreviations on page 181.
a Variable rate demand notes (VRDNs) are tax-exempt obligations which contain a floating or variable interest rate adjustment formula and an unconditional right of demand to
receive payment of the principal balance plus accrued interest at specified dates. The coupon rate shown represents the rate at period end.
136 | The accompanying notes are an integral part of these financial statements. | Annual Report
| | | | | | | | | | | | | | | |
| Franklin Tax-Free Trust | | | | | | | | | | | | | | | |
| Financial Highlights | | | | | | | | | | | | | | | |
| |
| Franklin Oregon Tax-Free Income Fund | | | | | | | | | | | | | | | |
| | | | | | Year Ended February 28, | | | | |
| Class A | | 2014 | | | 2013 | | | 2012 | a | | 2011 | | | 2010 | |
| Per share operating performance | | | | | | | | | | | | | | | |
| (for a share outstanding throughout the year) | | | | | | | | | | | | | | | |
| Net asset value, beginning of year | $ | 12.58 | | $ | 12.45 | | $ | 11.48 | | $ | 11.87 | | $ | 11.21 | |
| Income from investment operationsb: | | | | | | | | | | | | | | | |
| Net investment incomec | | 0.46 | | | 0.44 | | | 0.49 | | | 0.49 | | | 0.49 | |
| Net realized and unrealized gains (losses) | | (0.91 | ) | | 0.13 | | | 0.98 | | | (0.37 | ) | | 0.66 | |
| Total from investment operations | | (0.45 | ) | | 0.57 | | | 1.47 | | | 0.12 | | | 1.15 | |
| Less distributions from net investment income | | (0.44 | ) | | (0.44 | ) | | (0.50 | ) | | (0.51 | ) | | (0.49 | ) |
| Net asset value, end of year | $ | 11.69 | | $ | 12.58 | | $ | 12.45 | | $ | 11.48 | | $ | 11.87 | |
| |
| Total returnd | | (3.50 | )% | | 4.64 | % | | 13.11 | % | | 0.94 | % | | 10.47 | % |
| |
| Ratios to average net assets | | | | | | | | | | | | | | | |
| Expenses | | 0.62 | % | | 0.62 | % | | 0.63 | % | | 0.63 | % | | 0.64 | % |
| Net investment income | | 3.88 | % | | 3.53 | % | | 4.11 | % | | 4.11 | % | | 4.26 | % |
| |
| Supplemental data | | | | | | | | | | | | | | | |
| Net assets, end of year (000’s) | $ | 924,611 | | $ | 1,189,801 | | $ | 1,082,877 | | $ | 946,755 | | $ | 954,860 | |
| Portfolio turnover rate | | 8.28 | % | | 7.51 | % | | 12.50 | % | | 8.19 | % | | 9.79 | % |
aFor the year ended February 29.
bThe amount shown for a share outstanding throughout the period may not correlate with the Statement of Operations for the period due to the timing of sales and repurchases of
the Fund shares in relation to income earned and/or fluctuating market value of the investments of the Fund.
cBased on average daily shares outstanding.
dTotal return does not reflect sales commissions or contingent deferred sales charges, if applicable.
Annual Report | The accompanying notes are an integral part of these financial statements. | 137
| | | | | | | | | | | | | | | |
| Franklin Tax-Free Trust | | | | | | | | | | | | | | | |
| Financial Highlights (continued) | | | | | | | | | | | | | | | |
| |
| Franklin Oregon Tax-Free Income Fund | | | | | | | | | | | | | | | |
| | | | | | Year Ended February 28, | | | | |
| Class C | | 2014 | | | 2013 | | | 2012 | a | | 2011 | | | 2010 | |
| Per share operating performance | | | | | | | | | | | | | | | |
| (for a share outstanding throughout the year) | | | | | | | | | | | | | | | |
| Net asset value, beginning of year | $ | 12.74 | | $ | 12.60 | | $ | 11.62 | | $ | 12.00 | | $ | 11.33 | |
| Income from investment operationsb: | | | | | | | | | | | | | | | |
| Net investment incomec | | 0.40 | | | 0.38 | | | 0.43 | | | 0.43 | | | 0.44 | |
| Net realized and unrealized gains (losses) | | (0.92 | ) | | 0.13 | | | 0.99 | | | (0.37 | ) | | 0.66 | |
| Total from investment operations | | (0.52 | ) | | 0.51 | | | 1.42 | | | 0.06 | | | 1.10 | |
| Less distributions from net investment income | | (0.38 | ) | | (0.37 | ) | | (0.44 | ) | | (0.44 | ) | | (0.43 | ) |
| Net asset value, end of year | $ | 11.84 | | $ | 12.74 | | $ | 12.60 | | $ | 11.62 | | $ | 12.00 | |
| |
| Total returnd | | (4.07 | )% | | 4.08 | % | | 12.44 | % | | 0.44 | % | | 9.85 | % |
| |
| Ratios to average net assets | | | | | | | | | | | | | | | |
| Expenses | | 1.17 | % | | 1.17 | % | | 1.18 | % | | 1.18 | % | | 1.19 | % |
| Net investment income | | 3.33 | % | | 2.98 | % | | 3.56 | % | | 3.56 | % | | 3.71 | % |
| |
| Supplemental data | | | | | | | | | | | | | | | |
| Net assets, end of year (000’s) | $ | 188,147 | | $ | 266,819 | | $ | 230,384 | | $ | 196,909 | | $ | 195,473 | |
| Portfolio turnover rate | | 8.28 | % | | 7.51 | % | | 12.50 | % | | 8.19 | % | | 9.79 | % |
aFor the year ended February 29.
bThe amount shown for a share outstanding throughout the period may not correlate with the Statement of Operations for the period due to the timing of sales and repurchases of
the Fund shares in relation to income earned and/or fluctuating market value of the investments of the Fund.
cBased on average daily shares outstanding.
dTotal return does not reflect sales commissions or contingent deferred sales charges, if applicable.
138 | The accompanying notes are an integral part of these financial statements. | Annual Report
| | | | | | | | | | | | | | | |
| Franklin Tax-Free Trust | | | | | | | | | | | | | | | |
| Financial Highlights (continued) | | | | | | | | | | | | | | | |
| |
| Franklin Oregon Tax-Free Income Fund | | | | | | | | | | | | | | | |
| | | | | | Year Ended February 28, | | | | |
| Advisor Class | | 2014 | | | 2013 | | | 2012 | a | | 2011 | | | 2010 | b |
| Per share operating performance | | | | | | | | | | | | | | | |
| (for a share outstanding throughout the year) | | | | | | | | | | | | | | | |
| Net asset value, beginning of year | $ | 12.59 | | $ | 12.46 | | $ | 11.48 | | $ | 11.87 | | $ | 11.44 | |
| Income from investment operationsc: | | | | | | | | | | | | | | | |
| Net investment incomed | | 0.47 | | | 0.46 | | | 0.50 | | | 0.50 | | | 0.32 | |
| Net realized and unrealized gains (losses) | | (0.90 | ) | | 0.12 | | | 1.00 | | | (0.37 | ) | | 0.42 | |
| Total from investment operations | | (0.43 | ) | | 0.58 | | | 1.50 | | | 0.13 | | | 0.74 | |
| Less distributions from net investment income | | (0.46 | ) | | (0.45 | ) | | (0.52 | ) | | (0.52 | ) | | (0.31 | ) |
| Net asset value, end of year | $ | 11.70 | | $ | 12.59 | | $ | 12.46 | | $ | 11.48 | | $ | 11.87 | |
| |
| Total returne | | (3.41 | )% | | 4.74 | % | | 13.31 | % | | 1.04 | % | | 6.49 | % |
| |
| Ratios to average net assetsf | | | | | | | | | | | | | | | |
| Expenses | | 0.52 | % | | 0.52 | % | | 0.53 | % | | 0.53 | % | | 0.54 | % |
| Net investment income | | 3.98 | % | | 3.63 | % | | 4.21 | % | | 4.21 | % | | 4.36 | % |
| |
| Supplemental data | | | | | | | | | | | | | | | |
| Net assets, end of year (000’s) | $ | 34,225 | | $ | 48,678 | | $ | 39,434 | | $ | 14,482 | | $ | 6,412 | |
| Portfolio turnover rate | | 8.28 | % | | 7.51 | % | | 12.50 | % | | 8.19 | % | | 9.79 | % |
aFor the year ended February 29.
bFor the period July 15, 2009 (effective date) to February 28, 2010.
cThe amount shown for a share outstanding throughout the period may not correlate with the Statement of Operations for the period due to the timing of sales and repurchases of
the Fund shares in relation to income earned and/or fluctuating market value of the investments of the Fund.
dBased on average daily shares outstanding.
eTotal return is not annualized for periods less than one year.
fRatios are annualized for periods less than one year.
Annual Report | The accompanying notes are an integral part of these financial statements. | 139
| | | | | |
| | Franklin Tax-Free Trust | | | | |
| |
| | Statement of Investments, February 28, 2014 | | | | |
| |
| |
| | Franklin Oregon Tax-Free Income Fund | | Principal Amount | | Value |
| | Municipal Bonds 97.3% | | | | |
| | Oregon 84.0% | | | | |
| | Astoria Hospital Facilities Authority Revenue, Columbia Memorial Hospital, Refunding, 5.00%, | | | | |
| | 8/01/25 | $ | 845,000 | $ | 879,662 |
| | 8/01/28 | | 1,325,000 | | 1,339,442 |
| | 8/01/31 | | 1,350,000 | | 1,358,221 |
| | Beaverton School District GO, | | | | |
| | Washington and Multnomah Counties, AGMC Insured, Pre-Refunded, 4.125%, 6/01/26 | | 1,315,000 | | 1,426,223 |
| | Washington County School District No. 48J, Assured Guaranty, 5.00%, 6/01/31 | | 1,280,000 | | 1,386,406 |
| | Washington County School District No. 48J, Assured Guaranty, 5.125%, 6/01/36 | | 1,000,000 | | 1,084,090 |
| | Benton County Hospital Facilities Authority Revenue, Samaritan Health Services Project, | | | | |
| | Refunding, 5.125%, 10/01/28 | | 1,525,000 | | 1,525,686 |
| | Chemeketa Community College District GO, 5.00%, | | | | |
| | 6/15/25 | | 1,500,000 | | 1,665,345 |
| | 6/15/26 | | 2,615,000 | | 2,884,162 |
| | Clackamas County Canby School District No. 86 GO, AGMC Insured, Pre-Refunded, 5.00%, | | | | |
| | 6/15/23 | | 1,000,000 | | 1,060,960 |
| | 6/15/25 | | 1,000,000 | | 1,060,960 |
| | Clackamas County Hospital Facility Authority Revenue, | | | | |
| | Gross Willamette Falls Project, Pre-Refunded, 5.375%, 4/01/22 | | 2,125,000 | | 2,241,535 |
| | Gross Willamette Falls Project, Pre-Refunded, 5.125%, 4/01/26 | | 1,000,000 | | 1,052,170 |
| | Legacy Health System, Series A, 5.50%, 7/15/35 | | 6,525,000 | | 6,970,005 |
| | Clackamas County School District No. 7J Lake Oswego GO, Refunding, AGMC Insured, 5.25%, | | | | |
| | 6/01/25 | | 3,075,000 | | 3,800,331 |
| | Clackamas County School District No. 12 North Clackamas GO, | | | | |
| | Series A, AGMC Insured, 4.75%, 6/15/31 | | 2,250,000 | | 2,374,830 |
| | Series B, AGMC Insured, 5.00%, 6/15/27 | | 25,000,000 | | 27,036,250 |
| | Clackamas County School District No. 46 Oregon Trail GO, | | | | |
| | 5.00%, 6/15/32 | | 6,855,000 | | 7,349,657 |
| | Capital Appreciation, Refunding, zero cpn., 6/15/37 | | 12,130,000 | | 4,048,630 |
| | Capital Appreciation, Refunding, zero cpn., 6/15/38 | | 12,495,000 | | 3,940,798 |
| | Refunding, Series A, 5.00%, 6/15/28 | | 2,210,000 | | 2,423,044 |
| | Refunding, Series A, 5.00%, 6/15/29 | | 2,655,000 | | 2,896,047 |
| | Clackamas Education Service District GO, AMBAC Insured, 4.125%, 6/01/36 | | 1,000,000 | | 1,019,820 |
| | Columbia and Washington Counties School District No. 47J Vernonia GO, 5.00%, 6/15/35 | | 5,175,000 | | 5,575,545 |
| | Columbia Gorge Community College District GO, NATL Insured, Pre-Refunded, 5.00%, | | | | |
| | 6/15/22 | | 1,000,000 | | 1,060,960 |
| | Crook County School District GO, Crook and Deschutes Counties, 5.00%, | | | | |
| | 6/15/34 | | 4,475,000 | | 4,887,640 |
| | 6/15/37 | | 8,090,000 | | 8,743,996 |
| | Deschutes and Jefferson Counties School District No. 2J Redmond GO, | | | | |
| Pre-Refunded, 5.50%, 6/15/34 | | 5,000,000 | | 5,979,250 |
| | Series A, NATL RE, FGIC Insured, 5.00%, 6/15/21 | | 1,000,000 | | 1,012,200 |
| | Deschutes County Hospital Facilities Authority Hospital Revenue, Cascade Healthcare | | | | |
| | Community Inc., | | | | |
| | Refunding, 8.25%, 1/01/38 | | 20,000,000 | | 24,101,400 |
| | Series B, AMBAC Insured, 5.375%, 1/01/35 | | 7,000,000 | | 7,401,170 |
| | Eugene Electric Utility System Revenue, Refunding, | | | | |
| | 5.00%, 8/01/33 | | 10,060,000 | | 10,624,567 |
| | Series A, 5.00%, 8/01/40 | | 6,745,000 | | 7,213,508 |
| | Eugene Water Utility System Revenue, Refunding, 5.00%, 8/01/40 | | 4,425,000 | | 4,761,831 |
| |
| | 140 | Annual Report | | | | |
| | | | |
| Franklin Tax-Free Trust | | | | |
| |
| Statement of Investments, February 28, 2014 (continued) | | | | |
| |
| |
| Franklin Oregon Tax-Free Income Fund | | Principal Amount | | Value |
| Municipal Bonds (continued) | | | | |
| Oregon (continued) | | | | |
| Forest Grove Revenue, Campus Improvement, Pacific University Project, Pre-Refunded, | | | | |
| 6.00%, 5/01/30 | $ | 4,000,000 | $ | 4,036,040 |
| 6.375%, 5/01/39 | | 12,000,000 | | 12,115,200 |
| Hillsboro Hospital Facility Authority Revenue, Hospital Tuality Healthcare Project, | | | | |
| Radian Insured, 5.375%, | | | | |
| 10/01/26 | | 2,000,000 | | 2,001,100 |
| 10/01/31 | | 2,000,000 | | 2,000,560 |
| Independence GO, City Hall Project, AGMC Insured, 5.00%, | | | | |
| 6/15/35 | | 2,110,000 | | 2,291,840 |
| 6/15/40 | | 3,975,000 | | 4,259,610 |
| Jackson County Airport Revenue, Series A, XLCA Insured, 5.25%, | | | | |
| 12/01/27 | | 1,000,000 | | 1,049,680 |
| 12/01/32 | | 1,000,000 | | 1,035,570 |
| 12/01/37 | | 1,475,000 | | 1,506,462 |
| Jackson County School District No. 549C Medford GO, | | | | |
| 5.00%, 6/15/33 | | 3,225,000 | | 3,473,938 |
| 5.00%, 6/15/34 | | 5,000,000 | | 5,222,500 |
| Series B, AGMC Insured, 5.00%, 12/15/32 | | 5,765,000 | | 6,122,776 |
| Jefferson County School District No. 509J GO, | | | | |
| Refunding, 5.00%, 6/15/30 | | 1,000,000 | | 1,117,070 |
| Refunding, 5.00%, 6/15/31 | | 1,410,000 | | 1,563,281 |
| Series B, 5.00%, 6/15/30 | | 2,000,000 | | 2,234,140 |
| Keizer Special Assessment, Keizer Station Area A Local ID, 5.20%, 6/01/31 | | 2,885,000 | | 2,932,978 |
| Klamath County School District GO, 5.00%, | | | | |
| 6/15/29 | | 1,155,000 | | 1,298,971 |
| 6/15/30 | | 1,095,000 | | 1,223,192 |
| 6/15/31 | | 1,000,000 | | 1,108,710 |
| Lake Oswego GO, Refunding, Series A, 5.00%, 12/01/31 | | 6,400,000 | | 6,915,968 |
| Lane County Metropolitan Wastewater Management Commission Revenue, | | | | |
| 5.25%, 11/01/28 | | 5,000,000 | | 5,403,900 |
| NATL RE, FGIC Insured, 4.75%, 11/01/26 | | 1,615,000 | | 1,689,096 |
| Lane County School District No. 19 Springfield GO, AGMC Insured, zero cpn., | | | | |
| 6/15/27 | | 5,580,000 | | 3,126,697 |
| 6/15/28 | | 2,000,000 | | 1,066,320 |
| 6/15/29 | | 1,925,000 | | 973,338 |
| Lebanon GO, AMBAC Insured, 5.00%, | | | | |
| 6/01/25 | | 1,635,000 | | 1,730,468 |
| 6/01/27 | | 1,675,000 | | 1,764,344 |
| Medford Hospital Facilities Authority Revenue, | | | | |
| Asante Health System, Refunding, Assured Guaranty, 5.125%, 8/15/40 | | 25,000,000 | | 25,710,000 |
| Asante Health System, Series A, Assured Guaranty, 5.00%, 8/15/40 | | 10,050,000 | | 10,266,075 |
| Rogue Valley Manor, Refunding, 5.00%, 10/01/33 | | 1,500,000 | | 1,537,800 |
| Rogue Valley Manor, Refunding, 5.00%, 10/01/42 | | 11,595,000 | | 11,426,409 |
| Multnomah County David Douglas School District No. 40 GO, Series B, zero cpn., | | | | |
| 6/15/24 | | 1,640,000 | | 1,128,304 |
| 6/15/25 | | 1,325,000 | | 867,477 |
| 6/15/26 | | 2,585,000 | | 1,606,914 |
| 6/15/27 | | 2,655,000 | | 1,560,901 |
Annual Report | 141
| | | | |
| Franklin Tax-Free Trust | | | | |
| |
| Statement of Investments, February 28, 2014 (continued) | | | | |
| |
| |
| Franklin Oregon Tax-Free Income Fund | | Principal Amount | | Value |
| Municipal Bonds (continued) | | | | |
| Oregon (continued) | | | | |
| Multnomah County David Douglas School District No. 40 GO, Series B, zero cpn., (continued) | | | | |
| 6/15/28 | $ | 2,495,000 | $ | 1,393,133 |
| 6/15/29 | | 2,595,000 | | 1,362,375 |
| 6/15/30 | | 1,885,000 | | 935,676 |
| 6/15/31 | | 2,030,000 | | 952,273 |
| 6/15/32 | | 2,000,000 | | 886,040 |
| Multnomah County Hospital Facilities Authority Revenue, | | | | |
| Adventist Health System/West, Series A, 5.125%, 9/01/40 | | 6,500,000 | | 6,759,675 |
| Terwilliger Plaza, Refunding, 5.00%, 12/01/29 | | 3,690,000 | | 3,805,681 |
| Multnomah County School District No. 3 Park Rose GO, Series A, 5.00%, | | | | |
| 6/30/35 | | 2,000,000 | | 2,157,300 |
| 6/30/36 | | 1,500,000 | | 1,613,010 |
| Multnomah County School District No. 7 Reynolds GO, Refunding, 5.00%, 6/01/35 | | 6,605,000 | | 7,018,539 |
| North Bend School District No. 13 GO, Coos County, AGMC Insured, 5.00%, 6/15/22 | | 55,000 | | 55,135 |
| Oregon Health and Science University Revenue, | | | | |
| Capital Appreciation, Refunding, Series A, NATL Insured, zero cpn., 7/01/21 | | 11,480,000 | | 9,114,316 |
| Series A, 5.875%, 7/01/33 | | 2,500,000 | | 2,738,850 |
| Series A, 5.75%, 7/01/39 | | 13,175,000 | | 14,269,579 |
| Oregon State Department of Administrative Services COP, | | | | |
| Series A, 5.25%, 5/01/39 | | 3,800,000 | | 4,022,756 |
| Series A, AGMC Insured, Pre-Refunded, 5.00%, 5/01/23 | | 2,695,000 | | 2,844,222 |
| Series A, AGMC Insured, Pre-Refunded, 5.00%, 5/01/30 | | 13,205,000 | | 13,936,161 |
| Series B, NATL RE, FGIC Insured, Pre-Refunded, 5.00%, 11/01/30 | | 20,100,000 | | 21,686,895 |
| Series C, 5.00%, 11/01/34 | | 8,000,000 | | 8,492,400 |
| Oregon State Department of Administrative Services Lottery Revenue, Series A, 5.00%, | | | | |
| 4/01/27 | | 17,880,000 | | 20,473,315 |
| 4/01/28 | | 5,800,000 | | 6,685,370 |
| 4/01/28 | | 18,225,000 | | 20,773,948 |
| 4/01/29 | | 1,750,000 | | 1,985,725 |
| 4/01/32 | | 5,000,000 | | 5,582,650 |
| Oregon State Department of Transportation Highway User Tax Revenue, | | | | |
| senior lien, Series A, 5.00%, 11/15/29 | | 3,085,000 | | 3,468,003 |
| senior lien, Series A, 4.50%, 11/15/32 | | 21,000,000 | | 21,574,140 |
| senior lien, Series A, 5.00%, 11/15/33 | | 21,530,000 | | 23,881,076 |
| Series A, Pre-Refunded, 5.00%, 11/15/28 | | 15,000,000 | | 15,502,650 |
| Oregon State Facilities Authority Revenue, | | | | |
| Legacy Health System, Refunding, Series A, 5.00%, 3/15/30 | | 1,500,000 | | 1,582,080 |
| Lewis and Clark College Project, Refunding, Series A, 5.75%, 10/01/41 | | 30,000,000 | | 33,029,400 |
| Limited College Project, Refunding, Series A, 5.00%, 10/01/31 | | 2,000,000 | | 2,044,860 |
| Limited College Project, Refunding, Series A, 5.00%, 10/01/34 | | 2,975,000 | | 3,009,748 |
| Limited College Project, Refunding, Series A, 5.25%, 10/01/40 | | 3,750,000 | | 3,816,525 |
| PeaceHealth, Refunding, Series A, 5.00%, 11/01/39 | | 32,790,000 | | 33,962,898 |
| Reed College Project, Refunding, Series A, 5.00%, 7/01/29 | | 1,500,000 | | 1,647,060 |
| Reed College Project, Refunding, Series A, 4.75%, 7/01/32 | | 2,000,000 | | 2,112,700 |
| Reed College Project, Refunding, Series A, 5.125%, 7/01/41 | | 10,000,000 | | 10,662,700 |
| Samaritan Health Services, Refunding, Series A, 5.25%, 10/01/40 | | 13,990,000 | | 14,066,525 |
| Student Housing, CHF Ashland LLC, Southern Oregon University Project, Assured Guaranty, | | | | |
| 5.00%, 7/01/44 | | 8,910,000 | | 9,110,297 |
142 | Annual Report
| | | | |
| Franklin Tax-Free Trust | | | | |
| |
| Statement of Investments, February 28, 2014 (continued) | | | | |
| |
| |
| Franklin Oregon Tax-Free Income Fund | | Principal Amount | | Value |
| Municipal Bonds (continued) | | | | |
| Oregon (continued) | | | | |
| Oregon State Facilities Authority Revenue, (continued) | | | | |
| University of Portland Projects, Series A, 5.00%, 4/01/32 | $ | 8,795,000 | $ | 8,801,069 |
| Willamette University Projects, Series A, NATL RE, FGIC Insured, Pre-Refunded, 5.00%, | | | | |
| 10/01/35 | | 5,210,000 | | 5,600,646 |
| Oregon State GO, | | | | |
| Alternative Energy Project, Series B, 6.00%, 10/01/26 | | 1,680,000 | | 1,945,121 |
| Elderly and Disabled Housing, Series A, 6.00%, 8/01/15 | | 520,000 | | 520,936 |
| Elderly and Disabled Housing, Series A, 6.00%, 8/01/21 | | 375,000 | | 375,428 |
| Elderly and Disabled Housing, Series A, 5.375%, 8/01/28 | | 1,115,000 | | 1,115,424 |
| Elderly and Disabled Housing, Series A, 4.70%, 8/01/42 | | 3,150,000 | | 3,063,217 |
| Elderly and Disabled Housing, Series B, 6.10%, 8/01/17 | | 945,000 | | 946,417 |
| Elderly and Disabled Housing, Series B, 6.25%, 8/01/23 | | 1,355,000 | | 1,356,883 |
| State Board of Higher Education, Refunding, Series B, 5.00%, 8/01/38 | | 1,500,000 | | 1,633,890 |
| State Board of Higher Education, Series A, 5.00%, 8/01/34 | | 5,000,000 | | 5,452,800 |
| State Board of Higher Education, Series A, 5.00%, 8/01/37 | | 5,555,000 | | 5,971,681 |
| State Board of Higher Education, Series A, Pre-Refunded, 5.00%, 8/01/31 | | 1,695,000 | | 1,884,501 |
| State Board of Higher Education, Series A, Pre-Refunded, 5.00%, 8/01/35 | | 6,000,000 | | 6,402,240 |
| State Board of Higher Education, Series A, Pre-Refunded, 5.00%, 8/01/36 | | 2,715,000 | | 3,018,537 |
| State Board of Higher Education, Series B, 5.00%, 8/01/38 | | 5,000,000 | | 5,446,300 |
| State Board of Higher Education, Series C, 5.00%, 8/01/37 | | 1,115,000 | | 1,198,636 |
| Various Projects, Series H, 5.00%, 5/01/36 | | 1,000,000 | | 1,100,360 |
| Veterans’ Welfare, Series 92B, 4.625%, 12/01/38 | | 5,330,000 | | 5,467,621 |
| Oregon State Health Housing Educational and Cultural Facilities Authority Revenue, | | | | |
| PeaceHealth, AMBAC Insured, 5.00%, 11/15/26 | | 5,500,000 | | 5,514,795 |
| Oregon State Housing and Community Services Department Mortgage Revenue, SFM Program, | | | | |
| Refunding, Series G, 5.35%, 7/01/30 | | 2,910,000 | | 3,023,723 |
| Series C, 4.75%, 7/01/42 | | 3,765,000 | | 3,798,810 |
| Philomath School District No. 17J Benton and Polk Counties GO, Series B, zero cpn., | | | | |
| 6/15/31 | | 1,000,000 | | 491,820 |
| Port of Portland International Airport Revenue, Series Nineteen, 5.50%, 7/01/38 | | 23,000,000 | | 24,992,490 |
| Portland EDR, Broadway Project, Refunding, Series A, 6.50%, 4/01/35 | | 5,000,000 | | 5,588,700 |
| Portland GO, | | | | |
| Refunding, Series A, 5.00%, 6/01/28 | | 7,840,000 | | 8,766,531 |
| Refunding, Series A, 5.00%, 6/01/29 | | 8,330,000 | | 9,251,798 |
| Refunding, Series A, 5.00%, 6/01/30 | | 8,750,000 | | 9,664,900 |
| Series B, zero cpn., 6/01/21 | | 1,000,000 | | 840,190 |
| Portland Housing Authority MFR, Housing, Lovejoy Station Apartments Project, NATL Insured, | | | | |
| 6.00%, 7/01/33 | | 2,000,000 | | 2,002,400 |
| Portland River District Urban Renewal and Redevelopment Tax Allocation, | | | | |
| Refunding, Series B, 5.00%, 6/15/22 | | 1,035,000 | | 1,188,967 |
| Series C, 5.00%, 6/15/28 | | 1,000,000 | | 1,091,170 |
| Series C, 5.00%, 6/15/29 | | 850,000 | | 920,558 |
| Series C, 5.00%, 6/15/30 | | 1,000,000 | | 1,076,390 |
| Series C, 5.00%, 6/15/31 | | 750,000 | | 801,817 |
| Portland Sewer System Revenue, | | | | |
| first lien, Series A, AGMC Insured, 5.00%, 10/01/24 | | 6,235,000 | | 6,360,261 |
| second lien, Series A, 5.00%, 3/01/34 | | 25,270,000 | | 27,429,827 |
| second lien, Series B, NATL Insured, 5.00%, 6/15/28 | | 5,105,000 | | 5,413,648 |
Annual Report | 143
| | | | | |
| | Franklin Tax-Free Trust | | | | |
| |
| | Statement of Investments, February 28, 2014 (continued) | | | | |
| |
| |
| | Franklin Oregon Tax-Free Income Fund | | Principal Amount | | Value |
| | Municipal Bonds (continued) | | | | |
| | Oregon (continued) | | | | |
| | Portland Urban Renewal and Redevelopment Tax Allocation, | | | | |
| | Interstate Corridor, Refunding, Series A, NATL RE, FGIC Insured, 5.00%, 6/15/24 | $ | 1,295,000 | $ | 1,320,460 |
| | Interstate Corridor, Refunding, Series A, NATL RE, FGIC Insured, 5.00%, 6/15/25 | | 2,385,000 | | 2,428,002 |
| | Interstate Corridor, Series B, 5.00%, 6/15/29 | | 1,000,000 | | 1,045,190 |
| | Interstate Corridor, Series B, 5.00%, 6/15/30 | | 1,000,000 | | 1,039,480 |
| | Interstate Corridor, Series B, 5.00%, 6/15/31 | | 1,000,000 | | 1,033,180 |
| | Lents Town Center, Series B, 5.00%, 6/15/27 | | 2,500,000 | | 2,644,550 |
| | Lents Town Center, Series B, 5.00%, 6/15/28 | | 1,175,000 | | 1,235,595 |
| | Lents Town Center, Series B, 4.75%, 6/15/29 | | 1,000,000 | | 1,031,690 |
| | Lents Town Center, Series B, 5.00%, 6/15/30 | | 1,800,000 | | 1,872,576 |
| | North Macadam, Series B, 5.00%, 6/15/29 | | 4,250,000 | | 4,442,822 |
| | North Macadam, Series B, 5.00%, 6/15/30 | | 4,725,000 | | 4,915,512 |
| | Portland Water System Revenue, second lien, Series A, NATL Insured, Pre-Refunded, | | | | |
| | 4.375%, 10/01/25 | | 3,415,000 | | 3,773,165 |
| | 4.50%, 10/01/27 | | 1,000,000 | | 1,108,080 |
| | 4.50%, 10/01/28 | | 3,895,000 | | 4,315,972 |
| | Redmond Airport Revenue, 6.25%, 6/01/39 | | 1,010,000 | | 1,057,995 |
| | Redmond GO, Terminal Expansion Project, 5.00%, 6/01/39 | | 1,000,000 | | 1,016,970 |
| | Salem Hospital Facility Authority Revenue, Salem Hospital Project, Series A, | | | | |
| | 5.75%, 8/15/23 | | 10,000,000 | | 11,079,000 |
| | 5.00%, 8/15/27 | | 11,000,000 | | 11,372,680 |
| | 5.00%, 8/15/36 | | 9,000,000 | | 9,119,430 |
| Salem-Keizer School District No. 24J GO, Series B, zero cpn., 6/15/30 | | 8,500,000 | | 4,425,610 |
| | Sherwood GO, Washington County, Refunding, AGMC Insured, 5.00%, 6/01/36 | | 4,240,000 | | 4,514,922 |
| | Tigard Water System Revenue, 5.00%, | | | | |
| | 8/01/37 | | 11,050,000 | | 11,921,845 |
| | 8/01/42 | | 20,915,000 | | 22,241,220 |
| | Tillamook and Yamhill Counties School District No. 101 Nestucca Valley GO, AGMC Insured, | | | | |
| Pre-Refunded, 5.00%, 6/15/25 | | 1,560,000 | | 1,655,098 |
| | Tri-County Metropolitan Transportation District Revenue, Payroll Tax, senior lien, Series A, | | | | |
| | 5.00%, 9/01/37 | | 11,000,000 | | 12,033,560 |
| | Washington Clackamas and Yamhill Counties Sherwood School District No. 88J GO, | | | | |
| | Series A, NATL Insured, zero cpn., 6/15/26 | | 6,850,000 | | 4,046,158 |
| | Series A, NATL Insured, zero cpn., 6/15/27 | | 7,090,000 | | 3,976,568 |
| | Series A, NATL Insured, zero cpn., 6/15/28 | | 2,960,000 | | 1,579,515 |
| | Series A, NATL Insured, zero cpn., 6/15/29 | | 3,110,000 | | 1,575,557 |
| | Series A, NATL Insured, zero cpn., 6/15/30 | | 3,260,000 | | 1,571,190 |
| | Series A, NATL Insured, zero cpn., 12/15/31 | | 3,515,000 | | 1,569,026 |
| | Series B, NATL Insured, 4.50%, 12/15/31 | | 2,900,000 | | 3,015,391 |
| | Washington County GO, Refunding, 4.375%, 6/01/26 | | 1,000,000 | | 1,064,230 |
| | Washington County School District No. 15 Forest Grove GO, Series B, zero cpn., | | | | |
| | 6/15/29 | | 2,545,000 | | 1,328,261 |
| | 6/15/30 | | 2,490,000 | | 1,247,764 |
| | 6/15/31 | | 3,140,000 | | 1,485,314 |
| | Yamhill County McMinnville School District No. 40 GO, AGMC Insured, Pre-Refunded, 5.00%, | | | | |
| | 6/15/28 | | 4,000,000 | | 4,577,400 |
| | | | | | 963,771,136 |
144 | Annual Report
| | | | |
| Franklin Tax-Free Trust | | | | |
| |
| Statement of Investments, February 28, 2014 (continued) | | | | |
| |
| |
| Franklin Oregon Tax-Free Income Fund | | Principal Amount | | Value |
| Municipal Bonds (continued) | | | | |
| U.S. Territories 13.3% | | | | |
| Guam 0.4% | | | | |
| Guam Government Limited Obligation Revenue, Section 30, Series A, 5.625%, | | | | |
| 12/01/24 | $ | 840,000 | $ | 901,303 |
| 12/01/29 | | 3,250,000 | | 3,402,750 |
| | | | | 4,304,053 |
| Puerto Rico 12.9% | | | | |
| Children’s Trust Fund Tobacco Settlement Revenue, Asset-Backed, Refunding, 5.625%, | | | | |
| 5/15/43 | | 10,000,000 | | 8,720,400 |
| Puerto Rico Commonwealth GO, Public Improvement, | | | | |
| Refunding, Series A, 5.50%, 7/01/32 | | 15,000,000 | | 11,603,250 |
| Refunding, Series A, 5.75%, 7/01/41 | | 15,000,000 | | 11,611,950 |
| Refunding, Sub Series C-7, NATL Insured, 6.00%, 7/01/28 | | 4,500,000 | | 4,377,510 |
| Series A, 5.125%, 7/01/31 | | 9,885,000 | | 7,394,474 |
| Series A, 5.375%, 7/01/33 | | 10,000,000 | | 7,598,600 |
| Puerto Rico Commonwealth Highways and Transportation Authority Highway Revenue, Series Y, | | | | |
| Pre-Refunded, 5.50%, 7/01/36 | | 13,000,000 | | 14,579,240 |
| Puerto Rico Commonwealth Highways and Transportation Authority Transportation Revenue, | | | | |
| Refunding, Series N, FGIC Insured, 5.25%, 7/01/39 | | 10,000,000 | | 5,995,100 |
| Puerto Rico Convention Center District Authority Hotel Occupancy Tax Revenue, Series A, | | | | |
| AMBAC Insured, 5.00%, 7/01/31 | | 6,250,000 | | 4,832,812 |
| Puerto Rico Electric Power Authority Power Revenue, | | | | |
| Series RR, FGIC Insured, Pre-Refunded, 5.00%, 7/01/35 | | 10,000,000 | | 10,634,900 |
| Series WW, 5.25%, 7/01/33 | | 9,690,000 | | 6,710,422 |
| Puerto Rico PBA Guaranteed Revenue, Government Facilities, Refunding, Series M-3, | | | | |
| NATL Insured, 6.00%, 7/01/25 | | 15,000,000 | | 14,768,850 |
| Puerto Rico Public Finance Corp. Revenue, Commonwealth Appropriation, Refunding, | | | | |
| Series B, 5.50%, 8/01/31 | | 10,000,000 | | 6,441,100 |
| Puerto Rico Sales Tax FICO Sales Tax Revenue, | | | | |
| Capital Appreciation, first subordinate, Series A, zero cpn. to 8/01/16, 6.75% thereafter, | | | | |
| 8/01/32 | | 20,000,000 | | 14,986,400 |
| first subordinate, Series A, 5.375%, 8/01/39 | | 9,000,000 | | 6,925,140 |
| first subordinate, Series A, 6.50%, 8/01/44 | | 10,000,000 | | 8,607,600 |
| Senior Series C, 5.25%, 8/01/40 | | 2,860,000 | | 2,401,857 |
| | | | | 148,189,605 |
| Total U.S. Territories | | | | 152,493,658 |
| Total Municipal Bonds (Cost $1,094,261,809) 97.3% | | | | 1,116,264,794 |
| Other Assets, less Liabilities 2.7% | | | | 30,717,900 |
| Net Assets 100.0% | | | $ | 1,146,982,694 |
| |
| |
| |
| See Abbreviations on page 181. | | | | |
Annual Report | The accompanying notes are an integral part of these financial statements. | 145
| | | | | | | | | | | | | | | |
| Franklin Tax-Free Trust | | | | | | | | | | | | | |
| Financial Highlights | | | | | | | | | | | | | | | |
| |
| Franklin Pennsylvania Tax-Free Income Fund | | | | | | | | | | | | | | | |
| | | | | | Year Ended February 28, | | | | |
| Class A | | 2014 | | | 2013 | | | 2012 | a | | 2011 | | | 2010 | |
| Per share operating performance | | | | | | | | | | | | | | | |
| (for a share outstanding throughout the year) | | | | | | | | | | | | | | | |
| Net asset value, beginning of year | $ | 10.94 | | $ | 10.79 | | $ | 9.83 | | $ | 10.27 | | $ | 9.65 | |
| Income from investment operationsb: | | | | | | | | | | | | | | | |
| Net investment incomec | | 0.42 | | | 0.41 | | | 0.44 | | | 0.44 | | | 0.45 | |
| Net realized and unrealized gains (losses) | | (0.78 | ) | | 0.14 | | | 0.97 | | | (0.43 | ) | | 0.62 | |
| Total from investment operations | | (0.36 | ) | | 0.55 | | | 1.41 | | | 0.01 | | | 1.07 | |
| Less distributions from net investment income | | (0.41 | ) | | (0.40 | ) | | (0.45 | ) | | (0.45 | ) | | (0.45 | ) |
| Net asset value, end of year | $ | 10.17 | | $ | 10.94 | | $ | 10.79 | | $ | 9.83 | | $ | 10.27 | |
| |
| Total returnd | | (3.28 | )% | | 5.21 | % | | 14.64 | % | | (0.02 | )% | | 11.22 | % |
| |
| Ratios to average net assets | | | | | | | | | | | | | | | |
| Expenses | | 0.63 | % | | 0.63 | % | | 0.64 | % | | 0.64 | % | | 0.65 | % |
| Net investment income | | 4.04 | % | | 3.77 | % | | 4.30 | % | | 4.28 | % | | 4.43 | % |
| |
| Supplemental data | | | | | | | | | | | | | | | |
| Net assets, end of year (000’s) | $ | 981,992 | | $ | 1,310,224 | | $ | 1,170,547 | | $ | 1,003,723 | | $ | 1,016,824 | |
| Portfolio turnover rate | | 7.04 | % | | 4.99 | % | | 9.48 | % | | 13.15 | % | | 12.88 | % |
aFor the year ended February 29.
bThe amount shown for a share outstanding throughout the period may not correlate with the Statement of Operations for the period due to the timing of sales and repurchases of
the Fund shares in relation to income earned and/or fluctuating market value of the investments of the Fund.
cBased on average daily shares outstanding.
dTotal return does not reflect sales commissions or contingent deferred sales charges, if applicable.
146 | The accompanying notes are an integral part of these financial statements. | Annual Report
| | | | | | | | | | | | | | | |
| Franklin Tax-Free Trust | | | | | | | | | | | | | | | |
| Financial Highlights (continued) | | | | | | | | | | | | | | | |
| |
| Franklin Pennsylvania Tax-Free Income Fund | | | | | | | | | | | | | | | |
| | | | | | Year Ended February 28, | | | | |
| Class C | | 2014 | | | 2013 | | | 2012 | a | | 2011 | | | 2010 | |
| Per share operating performance | | | | | | | | | | | | | | | |
| (for a share outstanding throughout the year) | | | | | | | | | | | | | | | |
| Net asset value, beginning of year | $ | 11.06 | | $ | 10.90 | | $ | 9.92 | | $ | 10.36 | | $ | 9.73 | |
| Income from investment operationsb: | | | | | | | | | | | | | | | |
| Net investment incomec | | 0.36 | | | 0.35 | | | 0.39 | | | 0.39 | | | 0.39 | |
| Net realized and unrealized gains (losses) | | (0.79 | ) | | 0.15 | | | 0.98 | | | (0.44 | ) | | 0.63 | |
| Total from investment operations | | (0.43 | ) | | 0.50 | | | 1.37 | | | (0.05 | ) | | 1.02 | |
| Less distributions from net investment income | | (0.35 | ) | | (0.34 | ) | | (0.39 | ) | | (0.39 | ) | | (0.39 | ) |
| Net asset value, end of year | $ | 10.28 | | $ | 11.06 | | $ | 10.90 | | $ | 9.92 | | $ | 10.36 | |
| |
| Total returnd | | (3.86 | )% | | 4.67 | % | | 14.09 | % | | (0.58 | )% | | 10.62 | % |
| |
| Ratios to average net assets | | | | | | | | | | | | | | | |
| Expenses | | 1.18 | % | | 1.18 | % | | 1.19 | % | | 1.19 | % | | 1.20 | % |
| Net investment income | | 3.49 | % | | 3.22 | % | | 3.75 | % | | 3.73 | % | | 3.88 | % |
| |
| Supplemental data | | | | | | | | | | | | | | | |
| Net assets, end of year (000’s) | $ | 268,291 | | $ | 350,937 | | $ | 288,344 | | $ | 237,907 | | $ | 217,322 | |
| Portfolio turnover rate | | 7.04 | % | | 4.99 | % | | 9.48 | % | | 13.15 | % | | 12.88 | % |
aFor the year ended February 29.
bThe amount shown for a share outstanding throughout the period may not correlate with the Statement of Operations for the period due to the timing of sales and repurchases of
the Fund shares in relation to income earned and/or fluctuating market value of the investments of the Fund.
cBased on average daily shares outstanding.
dTotal return does not reflect sales commissions or contingent deferred sales charges, if applicable.
Annual Report | The accompanying notes are an integral part of these financial statements. | 147
| | | | | | | | | | | | | | | |
| Franklin Tax-Free Trust | | | | | | | | | | | | | | | |
| Financial Highlights (continued) | | | | | | | | | | | | | | | |
| |
| Franklin Pennsylvania Tax-Free Income Fund | | | | | | | | | | | | | | | |
| | | | | | Year Ended February 28, | | | | |
| Advisor Class | | 2014 | | | 2013 | | | 2012 | a | | 2011 | | | 2010 | b |
| Per share operating performance | | | | | | | | | | | | | | | |
| (for a share outstanding throughout the year) | | | | | | | | | | | | | | | |
| Net asset value, beginning of year | $ | 10.95 | | $ | 10.80 | | $ | 9.83 | | $ | 10.27 | | $ | 9.92 | |
| Income from investment operationsc: | | | | | | | | | | | | | | | |
| Net investment incomed | | 0.43 | | | 0.42 | | | 0.45 | | | 0.45 | | | 0.29 | |
| Net realized and unrealized gains (losses) | | (0.78 | ) | | 0.15 | | | 0.98 | | | (0.43 | ) | | 0.34 | |
| Total from investment operations | | (0.35 | ) | | 0.57 | | | 1.43 | | | 0.02 | | | 0.63 | |
| Less distributions from net investment income | | (0.42 | ) | | (0.42 | ) | | (0.46 | ) | | (0.46 | ) | | (0.28 | ) |
| Net asset value, end of year | $ | 10.18 | | $ | 10.95 | | $ | 10.80 | | $ | 9.83 | | $ | 10.27 | |
| |
| Total returne | | (3.18 | )% | | 5.31 | % | | 14.85 | % | | 0.08 | % | | 6.42 | % |
| |
| Ratios to average net assetsf | | | | | | | | | | | | | | | |
| Expenses | | 0.53 | % | | 0.53 | % | | 0.54 | % | | 0.54 | % | | 0.55 | % |
| Net investment income | | 4.14 | % | | 3.87 | % | | 4.40 | % | | 4.38 | % | | 4.53 | % |
| |
| Supplemental data | | | | | | | | | | | | | | | |
| Net assets, end of year (000’s) | $ | 42,043 | | $ | 57,430 | | $ | 40,671 | | $ | 18,933 | | $ | 6,832 | |
| Portfolio turnover rate | | 7.04 | % | | 4.99 | % | | 9.48 | % | | 13.15 | % | | 12.88 | % |
aFor the year ended February 29.
bFor the period July 15, 2009 (effective date) to February 28, 2010.
cThe amount shown for a share outstanding throughout the period may not correlate with the Statement of Operations for the period due to the timing of sales and repurchases of
the Fund shares in relation to income earned and/or fluctuating market value of the investments of the Fund.
dBased on average daily shares outstanding.
eTotal return is not annualized for periods less than one year.
fRatios are annualized for periods less than one year.
148 | The accompanying notes are an integral part of these financial statements. | Annual Report
| | | | |
| Franklin Tax-Free Trust | | | | |
| |
| Statement of Investments, February 28, 2014 | | | | |
| |
| |
| Franklin Pennsylvania Tax-Free Income Fund | | Principal Amount | | Value |
| Municipal Bonds 98.3% | | | | |
| Pennsylvania 88.9% | | | | |
| Allegheny County GO, | | | | |
| Series C-60, AGMC Insured, 5.00%, 11/01/27 | $ | 3,000,000 | $ | 3,186,900 |
| Series C-61, Assured Guaranty, 5.00%, 12/01/33 | | 5,000,000 | | 5,246,600 |
| Series C-65, 5.375%, 5/01/31 | | 5,000,000 | | 5,472,700 |
| Allegheny County Higher Education Building Authority University Revenue, Duquesne University, | | | | |
| 5.00%, 3/01/28 | | 3,000,000 | | 3,166,170 |
| 5.00%, 3/01/33 | | 1,300,000 | | 1,349,920 |
| Series A, 5.50%, 3/01/31 | | 3,000,000 | | 3,272,010 |
| Series A, XLCA Insured, 5.00%, 3/01/29 | | 5,000,000 | | 5,291,050 |
| Series A, XLCA Insured, 5.00%, 3/01/33 | | 5,630,000 | | 5,895,849 |
| Allegheny County Hospital Development Authority Revenue, University of Pittsburgh Medical | | | | |
| Center, Series A, 5.625%, 8/15/39 | | 12,000,000 | | 13,166,520 |
| Allegheny County Sanitary Authority Sewer Revenue, | | | | |
| AGMC Insured, 5.00%, 6/01/40 | | 5,000,000 | | 5,229,350 |
| NATL RE, FGIC Insured, 5.00%, 12/01/37 | | 6,745,000 | | 6,957,940 |
| Refunding, Series A, NATL Insured, 5.00%, 12/01/30 | | 7,000,000 | | 7,192,010 |
| Allegheny Valley School District GO, Series A, NATL Insured, 5.00%, 11/01/28 | | 1,550,000 | | 1,568,894 |
| Allentown Parking Authority Revenue, Guaranteed Parking, AGMC Insured, 5.00%, 11/15/35 | | 2,430,000 | | 2,468,102 |
| The Berks County Municipal Authority Revenue, The Reading Hospital and Medical Center | | | | |
| Project, Series A, 5.00%, 11/01/44 | | 10,000,000 | | 10,344,500 |
| Bethel Park School District GO, 5.10%, 8/01/33 | | 3,600,000 | | 3,963,240 |
| Bethlehem Area School District GO, AGMC Insured, 5.25%, 1/15/26 | | 6,605,000 | | 7,234,390 |
| Bethlehem GO, Refunding, Series B, AGMC Insured, 6.50%, 12/01/32 | | 4,990,000 | | 5,541,744 |
| Blair County Hospital Authority Revenue, Altoona Regional Heath System, Pre-Refunded, 6.00%, | | | | |
| 11/15/39 | | 6,890,000 | | 7,306,294 |
| Bucks County IDAR, George School Project, 5.00%, 9/15/41 | | 5,000,000 | | 5,229,550 |
| Bucks County Water and Sewer Authority Sewer System Revenue, Refunding, Series A, | | | | |
| Assured Guaranty, 5.00%, 12/01/35 | | 2,500,000 | | 2,644,725 |
| Bucks County Water and Sewer Authority Water System Revenue, AGMC Insured, 5.00%, | | | | |
| 12/01/41 | | 10,000,000 | | 10,536,800 |
| Butler Area School District GO, AGMC Insured, Pre-Refunded, 5.00%, 4/01/31 | | 4,000,000 | | 4,014,000 |
| Butler County Hospital Authority Hospital Revenue, Butler Health System Project, 7.25%, | | | | |
| 7/01/39 | | 4,500,000 | | 5,222,565 |
| Catasauqua Area School District GO, Refunding, AGMC Insured, 5.00%, 2/15/36 | | 6,000,000 | | 6,246,840 |
| Centennial School District Bucks County GO, Series A, 5.00%, 12/15/37 | | 5,855,000 | | 6,499,870 |
| Central Bradford Progress Authority Revenue, Guthrie Health Issue, Refunding, 5.375%, | | | | |
| 12/01/41 | | 3,000,000 | | 3,189,870 |
| Centre County Hospital Authority Hospital Revenue, Mount Nittany Medical Center Project, | | | | |
| Assured Guaranty, Pre-Refunded, | | | | |
| 5.875%, 11/15/29 | | 1,000,000 | | 1,039,570 |
| 6.125%, 11/15/39 | | 3,200,000 | | 3,332,192 |
| 6.25%, 11/15/44 | | 2,500,000 | | 2,605,450 |
| Chester County IDA Student Housing Revenue, University Student Housing LLC Project at | | | | |
| West Chester University of Pennsylvania, Series A, 5.00%, | | | | |
| 8/01/35 | | 500,000 | | 474,170 |
| 8/01/45 | | 1,500,000 | | 1,369,635 |
| Commonwealth Financing Authority Revenue, Series B, 5.00%, 6/01/32 | | 5,000,000 | | 5,307,400 |
Annual Report | 149
| | | | |
| Franklin Tax-Free Trust | | | | |
| |
| Statement of Investments, February 28, 2014 (continued) | | | | |
| |
| |
| Franklin Pennsylvania Tax-Free Income Fund | | Principal Amount | | Value |
| Municipal Bonds (continued) | | | | |
| Pennsylvania (continued) | | | | |
| Cumberland County Municipal Authority College Revenue, Dickinson College Project, Assn. of | | | | |
| Independent Colleges and Universities of Pennsylvania Financing Program, | | | | |
| Series GG1, NATL Insured, 5.00%, 5/01/34 | $ | 3,500,000 | $ | 3,643,710 |
| Series HH1, 5.00%, 11/01/39 | | 1,200,000 | | 1,245,984 |
| Cumberland County Municipal Authority Revenue, Dickinson College Project, 5.00%, | | | | |
| 11/01/42 | | 4,500,000 | | 4,692,330 |
| Dauphin County General Authority Health System Revenue, Pinnacle Health System Project, | | | | |
| Refunding, Series A, 6.00%, 6/01/36 | | 10,000,000 | | 10,877,000 |
| Series A, 5.00%, 6/01/42 | | 15,590,000 | | 15,735,611 |
| Dauphin County General Authority Hospital Revenue, HAPSCO Group Inc., The Western | | | | |
| Pennsylvania Hospital Project, Series B, NATL Insured, ETM, 6.25%, 7/01/16 | | 2,155,000 | | 2,315,160 |
| Deer Lakes School District GO, Assured Guaranty, 5.50%, 4/01/39 | | 7,500,000 | | 8,180,475 |
| Delaware County Authority Hospital Revenue, Crozer-Keystone Obligated Group, Series A, | | | | |
| 5.00%, 12/15/31 | | 5,000,000 | | 4,822,650 |
| Delaware County Authority Revenue, | | | | |
| Cabrini College, Refunding, Radian Insured, 5.875%, 7/01/29 | | 1,140,000 | | 1,140,490 |
| Haverford College, 5.00%, 11/15/40 | | 3,000,000 | | 3,178,200 |
| Health Facilities, Mercy Health Corp. Project, ETM, 6.00%, 12/15/26 | | 10,800,000 | | 11,470,896 |
| Delaware County Authority University Revenue, Neumann University, | | | | |
| 5.00%, 10/01/25 | | 1,250,000 | | 1,285,887 |
| 5.25%, 10/01/31 | | 1,250,000 | | 1,286,300 |
| Delaware County Vocational and Technical School Authority Lease Revenue, Intermediate | | | | |
| No. 25 Project, Build America Mutual Assurance, 5.00%, 11/01/38 | | 1,250,000 | | 1,294,475 |
| Delaware Valley Regional Finance Authority Local Government Revenue, Series B, | | | | |
| AMBAC Insured, 5.60%, 7/01/17 | | 5,000,000 | | 5,546,700 |
| East Hempfield Township IDA Revenue, Student Services Inc., Student Housing Project at | | | | |
| Millersville University of Pennsylvania, 5.00%, 7/01/45 | | 3,250,000 | | 3,054,382 |
| Erie County Hospital Authority Revenue, Hamot Health Foundation, CIFG Insured, 5.00%, | | | | |
| 11/01/35 | | 6,000,000 | | 6,084,000 |
| Erie Higher Education Building Authority College Revenue, Mercyhurst College Project, 5.50%, | | | | |
| 3/15/38 | | 2,000,000 | | 2,053,880 |
| Erie Parking Authority Parking Facilities Revenue, Guaranteed, Refunding, AGMC Insured, | | | | |
| 5.125%, 9/01/32 | | 4,250,000 | | 4,500,962 |
| Erie Water Authority Water Revenue, AGMC Insured, 5.00%, 12/01/43 | | 7,000,000 | | 7,174,440 |
| Falls Township Authority Water and Sewer Revenue, Guaranteed, 5.00%, 12/01/41 | | 2,210,000 | | 2,306,334 |
| Franklin County IDAR, Chambersburg Hospital Project, 5.375%, 7/01/42 | | 10,000,000 | | 10,320,600 |
| General Authority of South Central Pennsylvania Revenue, Assn. of Independent Colleges and | | | | |
| Universities, York College of Pennsylvania Project, 5.75%, 11/01/41 | | 9,500,000 | | 10,170,985 |
| General Authority of Southcentral Pennsylvania Revenue, WellSpan Health Obligated Group, | | | | |
| Refunding, Series A, 6.00%, 6/01/25 | | 10,000,000 | | 11,312,900 |
| Indiana County Hospital Authority Hospital Revenue, Indiana Regional Medical Center, Series A, | | | | |
| 6.00%, 6/01/39 | | 1,625,000 | | 1,678,316 |
| Johnstown RDA Sewer Revenue, Series A, AGMC Insured, Pre-Refunded, 5.00%, 8/15/34 | | 1,825,000 | | 1,864,566 |
| Lackawanna County GO, Series B, AGMC Insured, 5.00%, | | | | |
| 9/01/30 | | 8,100,000 | | 8,207,406 |
| 9/01/35 | | 7,500,000 | | 7,516,425 |
150 | Annual Report
| | | | |
| Franklin Tax-Free Trust | | | | |
| |
| Statement of Investments, February 28, 2014 (continued) | | | | |
| |
| |
| Franklin Pennsylvania Tax-Free Income Fund | | Principal Amount | | Value |
| Municipal Bonds (continued) | | | | |
| Pennsylvania (continued) | | | | |
| Lancaster Parking Authority Parking Revenue, Guaranteed, Series A, AMBAC Insured, 5.00%, | | | | |
| 12/01/32 | $ | 1,700,000 | $ | 1,753,618 |
| 12/01/35 | | 2,500,000 | | 2,563,150 |
| Latrobe IDAR, St. Vincent College Project, 5.00%, 5/01/43 | | 4,120,000 | | 3,839,098 |
| Lehigh County Authority Water and Sewer Revenue, Series A, 5.00%, 12/01/43 | | 5,240,000 | | 5,398,510 |
| Lehigh County General Purpose Authority Revenue, Muhlenberg College Project, | | | | |
| 5.25%, 2/01/34 | | 1,500,000 | | 1,575,210 |
| Lehigh County General Purpose Hospital Revenue, Lehigh Valley Health Network, Series B, | | | | |
| AGMC Insured, 5.00%, 7/01/35 | | 11,250,000 | | 11,523,600 |
| Luzerne County IDA Water Facility Revenue, Pennsylvania American Water Co. Water Facilities, | | | | |
| Refunding, 5.50%, 12/01/39 | | 10,000,000 | | 10,868,500 |
| Lycoming County Authority Health System Revenue, Susquehanna Health System Project, | | | | |
| Refunding, Series A, 5.75%, 7/01/39 | | 25,000,000 | | 25,841,250 |
| Lycoming County Authority Revenue, AICUP Financing Program, Lycoming College Project, | | | | |
| Series MM1, 5.25%, | | | | |
| 11/01/38 | | 1,400,000 | | 1,471,330 |
| 11/01/43 | | 1,495,000 | | 1,556,953 |
| Lycoming County Water and Sewer Authority Sewer Revenue, AGMC Insured, 5.00%, | | | | |
| 11/15/35 | | 5,835,000 | | 6,095,941 |
| Marple Newtown School District GO, AGMC Insured, 5.00%, 6/01/31 | | 11,225,000 | | 12,197,534 |
| McKeesport Municipal Authority Sewer Revenue, 5.75%, 12/15/39 | | 5,000,000 | | 5,319,750 |
| Monroe County Hospital Authority Hospital Revenue, Pocono Medical Center, | | | | |
| 5.00%, 1/01/27 | | 1,000,000 | | 1,028,530 |
| 5.125%, 1/01/37 | | 2,000,000 | | 2,025,620 |
| 5.25%, 1/01/43 | | 2,000,000 | | 2,016,000 |
| Series A, 5.00%, 1/01/41 | | 2,000,000 | | 2,005,000 |
| Montgomery County Higher Education and Health Authority Revenue, Arcadia University, | | | | |
| 5.625%, 4/01/40 | | 5,750,000 | | 5,884,607 |
| Montgomery County IDA Health Facilities Revenue, Jefferson Health System, Series A, 5.00%, | | | | |
| 10/01/41 | | 9,600,000 | | 9,797,760 |
| Montgomery County IDAR, FHA Insured, 5.375%, 8/01/38 | | 5,000,000 | | 5,361,000 |
| Montour School District GO, AGMC Insured, 5.00%, | | | | |
| 4/01/32 | | 5,000,000 | | 5,175,250 |
| 4/01/37 | | 12,500,000 | | 12,839,375 |
| Northampton Borough Municipal Authority Water Revenue, NATL Insured, Pre-Refunded, | | | | |
| 5.00%, 5/15/34 | | 2,400,000 | | 2,422,413 |
| Northampton County General Purpose Authority Hospital Revenue, St. Luke’s Hospital Project, | | | | |
| Series A, 5.50%, 8/15/35 | | 10,000,000 | | 10,176,800 |
| Series B, 5.50%, 8/15/33 | | 2,200,000 | | 2,296,822 |
| Northampton County General Purpose Authority Revenue, | | | | |
| Higher Education, Lehigh University, 5.00%, 11/15/39 | | 20,000,000 | | 21,014,800 |
| Lafayette College, Refunding, 5.00%, 11/01/34 | | 20,000,000 | | 21,092,800 |
| Northeastern Hospital and Education Authority Revenue, Wilkes University Project, Series A, | | | | |
| 5.25%, 3/01/42 | | 2,400,000 | | 2,396,496 |
| Northeastern York School District GO, Series B, NATL RE, FGIC Insured, 5.00%, | | | | |
| 4/01/30 | | 1,000,000 | | 1,054,650 |
| 4/01/31 | | 2,000,000 | | 2,104,500 |
Annual Report | 151
| | | | |
| Franklin Tax-Free Trust | | | | |
| |
| Statement of Investments, February 28, 2014 (continued) | | | | |
| |
| |
| Franklin Pennsylvania Tax-Free Income Fund | | Principal Amount | | Value |
| Municipal Bonds (continued) | | | | |
| Pennsylvania (continued) | | | | |
| Norwin School District GO, AGMC Insured, | | | | |
| 5.00%, 4/01/37 | $ | 10,000,000 | $ | 10,213,600 |
| Pre-Refunded, 5.00%, 4/01/35 | | 3,000,000 | | 3,291,060 |
| Owen J. Roberts School District GO, AGMC Insured, 5.00%, 9/01/36 | | 2,710,000 | | 2,911,516 |
| Pennsylvania State Economic Development Financing Authority Water Facilities Revenue, | | | | |
| Aqua Pennsylvania Inc. Project, Series B, 5.00%, 12/01/43 | | 25,000,000 | | 26,371,750 |
| Pennsylvania State Economic Development Financing Authority Water Facility Revenue, | | | | |
| Pennsylvania-American Water Co. Project, 6.20%, 4/01/39 | | 12,000,000 | | 13,097,160 |
| Pennsylvania State GO, | | | | |
| Second Series, 5.00%, 4/15/23 | | 10,000,000 | | 11,614,100 |
| Second Series A, 5.00%, 8/01/25 | | 5,000,000 | | 5,612,500 |
| Pennsylvania State Higher Educational Facilities Authority Revenue, | | | | |
| AICUP Financing Program, Gwynedd Mercy College Project, Series KK1, 5.375%, | | | | |
| 5/01/42 | | 1,800,000 | | 1,809,900 |
| AICUP Financing Program, St. Francis University Project, Series JJ2, 6.25%, | | | | |
| 11/01/41 | | 3,840,000 | | 4,081,690 |
| Bryn Mawr College, Refunding, AMBAC Insured, 5.00%, 12/01/37 | | 5,000,000 | | 5,301,450 |
| Drexel University, Series A, NATL Insured, 5.00%, 5/01/37 | | 25,525,000 | | 26,296,110 |
| Edinboro University Foundation, Student Housing Project, 6.00%, 7/01/43 | | 3,500,000 | | 3,512,425 |
| Foundation for Indiana University, Student Housing Project, Refunding, Series B, 5.00%, | | | | |
| 7/01/41 | | 1,250,000 | | 1,217,213 |
| La Salle University, Series A, 5.00%, 5/01/37 | | 2,500,000 | | 2,510,600 |
| Philadelphia University, Refunding, 5.00%, 6/01/30 | | 2,295,000 | | 2,302,298 |
| Shippensburg University Student Services Inc. Student Housing Project at Shippensburg | | | | |
| University of Pennsylvania, 5.00%, 10/01/35 | | 1,400,000 | | 1,348,074 |
| Shippensburg University Student Services Inc. Student Housing Project at Shippensburg | | | | |
| University of Pennsylvania, 6.25%, 10/01/43 | | 7,000,000 | | 7,509,180 |
| Shippensburg University Student Services Inc. Student Housing Project at Shippensburg | | | | |
| University of Pennsylvania, 5.00%, 10/01/44 | | 2,000,000 | | 1,858,280 |
| St. Joseph’s University, Series A, 5.00%, 11/01/40 | | 15,000,000 | | 15,331,050 |
| State System of Higher Education, Series AF, NATL Insured, 5.00%, 6/15/37 | | 7,000,000 | | 7,256,200 |
| Temple University, First Series, 5.00%, 4/01/42 | | 10,000,000 | | 10,438,200 |
| Temple University, Refunding, NATL Insured, 5.00%, 4/01/28 | | 5,000,000 | | 5,241,500 |
| Temple University, Refunding, NATL Insured, 5.00%, 4/01/33 | | 10,000,000 | | 10,388,500 |
| The Trustees of the University of Pennsylvania, Refunding, Series C, 5.00%, 7/15/38 | | 5,000,000 | | 5,114,050 |
| The Trustees of the University of Pennsylvania, Series A, 5.00%, 9/01/41 | | 25,000,000 | | 26,715,250 |
| Thomas Jefferson University, 5.00%, 3/01/40 | | 16,980,000 | | 17,502,135 |
| University of Pennsylvania Health System, 5.75%, 8/15/41 | | 3,950,000 | | 4,282,669 |
| University of Pennsylvania Health System, Refunding, Series B, 6.00%, 8/15/26 | | 5,000,000 | | 5,777,250 |
| University of Pittsburgh Medical Center, Series E, 5.00%, 5/15/31 | | 13,000,000 | | 13,568,490 |
| University of the Sciences in Philadelphia, 5.00%, 11/01/42 | | 5,000,000 | | 5,141,200 |
| University of the Sciences in Philadelphia, Assured Guaranty, 5.00%, 11/01/32 | | 5,000,000 | | 5,193,000 |
| University of the Sciences in Philadelphia, Refunding, Series A, XLCA Insured, 5.00%, | | | | |
| 11/01/36 | | 8,315,000 | | 8,416,027 |
| Widener University, 5.00%, 7/15/31 | | 500,000 | | 500,490 |
| Widener University, 5.00%, 7/15/39 | | 2,760,000 | | 2,678,773 |
| Widener University, Pre-Refunded, 5.00%, 7/15/39 | | 2,990,000 | | 3,186,264 |
152 | Annual Report
| | | | |
| Franklin Tax-Free Trust | | | | |
| |
| Statement of Investments, February 28, 2014 (continued) | | | | |
| |
| |
| Franklin Pennsylvania Tax-Free Income Fund | | Principal Amount | | Value |
| Municipal Bonds (continued) | | | | |
| Pennsylvania (continued) | | | | |
| Pennsylvania State Higher Educational Facilities Authority Student Housing Revenue, University | | | | |
| Properties Inc. Student Housing Project at East Stroudsburg University of Pennsylvania, | | | | |
| 5.00%, 7/01/42 | $ | 5,500,000 | $ | 5,092,285 |
| Pennsylvania State Public School Building Authority Community College Revenue, Community | | | | |
| College of Philadelphia Project, 6.00%, 6/15/28 | | 5,000,000 | | 5,556,900 |
| Pennsylvania State Public School Building Authority Lease Revenue, School District of | | | | |
| Philadelphia Project, Refunding, Series B, AGMC Insured, 4.75%, 6/01/30 | | 5,000,000 | | 5,166,900 |
| Pennsylvania State Public School Building Authority Revenue, Career Institute of Technology, | | | | |
| NATL RE, FGIC Insured, 5.00%, 11/15/28 | | 1,000,000 | | 1,025,630 |
| Pennsylvania State Turnpike Commission Turnpike Revenue, | | | | |
| Refunding, Series C, Sub Series C-1, Assured Guaranty, 6.25%, 6/01/38 | | 5,000,000 | | 5,559,900 |
| Series A, AMBAC Insured, 5.00%, 12/01/34 | | 5,000,000 | | 5,049,950 |
| Series A, Assured Guaranty, 5.00%, 6/01/39 | | 20,000,000 | | 20,620,800 |
| Series C, 5.00%, 12/01/43 | | 10,000,000 | | 10,382,100 |
| Series D, 5.125%, 12/01/40 | | 10,000,000 | | 10,281,800 |
| Special, Motor License Fund Enhanced Turnpike, Series A, 5.50%, 12/01/41 | | 5,000,000 | | 5,408,200 |
| Pennsylvania State University Revenue, 5.00%, | | | | |
| 9/01/35 | | 1,000,000 | | 1,028,320 |
| 3/01/40 | | 1,500,000 | | 1,604,715 |
| Philadelphia Airport Revenue, Series A, AGMC Insured, 5.00%, | | | | |
| 6/15/35 | | 5,000,000 | | 5,218,400 |
| 6/15/40 | | 5,000,000 | | 5,193,250 |
| Philadelphia Authority for IDR, | | | | |
| Cultural and Commercial Corridors Program, Series A, NATL RE, FGIC Insured, 5.00%, | | | | |
| 12/01/23 | | 6,205,000 | | 6,665,845 |
| Cultural and Commercial Corridors Program, Series A, NATL RE, FGIC Insured, 5.00%, | | | | |
| 12/01/25 | | 5,690,000 | | 6,070,320 |
| International Apartments at Temple University, Series A, 5.625%, 6/15/42 | | 4,000,000 | | 4,032,200 |
| Philadelphia Corp. for Aging Project, Series B, AMBAC Insured, 5.25%, 7/01/31 | | 2,000,000 | | 2,000,240 |
| Philadelphia Gas Works Revenue, | | | | |
| Ninth Series, 5.25%, 8/01/40 | | 5,720,000 | | 5,825,534 |
| Twelfth Series B, NATL Insured, ETM, 7.00%, 5/15/20 | | 615,000 | | 737,988 |
| Philadelphia GO, | | | | |
| Refunding, Series A, Assured Guaranty, 5.125%, 8/01/25 | | 5,000,000 | | 5,471,550 |
| Refunding, Series A, Assured Guaranty, 5.25%, 8/01/26 | | 5,000,000 | | 5,494,550 |
| Series A, 5.25%, 7/15/33 | | 5,000,000 | | 5,345,550 |
| Series B, Assured Guaranty, Pre-Refunded, 7.125%, 7/15/38 | | 10,000,000 | | 11,596,800 |
| Philadelphia Hospitals and Higher Education Facilities Authority Revenue, Children’s Hospital | | | | |
| of Philadelphia Project, Series C, 5.00%, 7/01/41 | | 5,000,000 | | 5,198,450 |
| Philadelphia Housing Authority Capital Fund Program Revenue, Series A, AGMC Insured, | | | | |
| 5.00%, 12/01/21 | | 5,000,000 | | 5,006,350 |
| Philadelphia Municipal Authority Revenue, Lease, 6.50%, | | | | |
| 4/01/34 | | 3,250,000 | | 3,616,567 |
| 4/01/39 | | 2,500,000 | | 2,732,675 |
| Philadelphia RDAR, Neighborhood Transformation Initiative, | | | | |
| Refunding, 5.00%, 4/15/26 | | 3,000,000 | | 3,271,020 |
| Series C, NATL RE, FGIC Insured, 5.00%, 4/15/31 | | 13,565,000 | | 13,747,314 |
Annual Report | 153
| | | | |
| Franklin Tax-Free Trust | | | | |
| |
| Statement of Investments, February 28, 2014 (continued) | | | | |
| |
| |
| Franklin Pennsylvania Tax-Free Income Fund | | Principal Amount | | Value |
| Municipal Bonds (continued) | | | | |
| Pennsylvania (continued) | | | | |
| Philadelphia School District GO, | | | | |
| Series D, FGIC Insured, Pre-Refunded, 5.125%, 6/01/34 | $ | 5,000,000 | $ | 5,059,150 |
| Series E, 6.00%, 9/01/38 | | 5,000,000 | | 5,398,650 |
| Philadelphia Water and Wastewater Revenue, | | | | |
| Series A, 5.25%, 1/01/36 | | 3,000,000 | | 3,174,960 |
| Series A, 5.00%, 1/01/41 | | 13,000,000 | | 13,470,080 |
| Series A, 5.125%, 1/01/43 | | 5,000,000 | | 5,250,900 |
| Series A, AGMC Insured, 5.00%, 7/01/29 | | 11,645,000 | | 11,990,158 |
| Series C, AGMC Insured, 5.00%, 8/01/35 | | 7,000,000 | | 7,387,800 |
| Pine-Richland School District GO, Allegheny County, Assured Guaranty, 5.00%, 3/01/39 | | 15,130,000 | | 16,049,299 |
| Pittsburgh Water and Sewer Authority Revenue, FGIC Insured, ETM, 7.25%, 9/01/14 | | 180,000 | | 186,271 |
| Reading GO, AGMC Insured, 6.00%, 11/01/28 | | 2,000,000 | | 2,163,840 |
| Scranton School District GO, | | | | |
| Series A, AGMC Insured, 5.00%, 7/15/38 | | 5,430,000 | | 5,536,537 |
| Series C, AGMC Insured, 5.00%, 7/15/38 | | 5,000,000 | | 5,098,100 |
| Scranton-Lackawanna Health and Welfare Authority Revenue, University of Scranton, | | | | |
| XLCA Insured, 5.00%, 11/01/37 | | 8,125,000 | | 8,426,356 |
| Snyder County Higher Education Authority University Revenue, Susquehanna University Project, | | | | |
| 5.00%, 1/01/38 | | 4,000,000 | | 4,102,800 |
| South Fork Municipal Authority Hospital Revenue, Conemaugh Valley Memorial Hospital, | | | | |
| Refunding, Series B, Assured Guaranty, 5.375%, 7/01/35 | | 10,000,000 | | 10,470,600 |
| Southmoreland School District GO, NATL Insured, Pre-Refunded, 5.00%, 4/01/27 | | 5,025,000 | | 5,283,184 |
| State Public School Building Authority College Revenue, Delaware County Community College | | | | |
| Project, AGMC Insured, 5.00%, 10/01/32 | | 1,000,000 | | 1,043,700 |
| State Public School Building Authority School Lease Revenue, | | | | |
| The School District of Philadelphia Project, 5.00%, 4/01/29 | | 1,835,000 | | 1,947,467 |
| The School District of Philadelphia Project, 5.00%, 4/01/31 | | 2,500,000 | | 2,609,550 |
| The School District of Philadelphia Project, 5.00%, 4/01/32 | | 2,000,000 | | 2,076,600 |
| The School District of the City of Harrisburg Project, Series A, Assured Guaranty, 5.00%, | | | | |
| 11/15/33 | | 5,000,000 | | 5,137,650 |
| Susquehanna Area Regional Airport Authority Airport System Revenue, Series A, 6.50%, | | | | |
| 1/01/38 | | 4,000,000 | | 4,286,440 |
| Swarthmore Borough Authority College Revenue, Swathmore College Project, 5.00%, | | | | |
| 9/15/43 | | 1,000,000 | | 1,079,390 |
| Union County Higher Educational Facilities Financing Authority University Revenue, Bucknell | | | | |
| University, Series A, 5.00%, 4/01/42 | | 6,255,000 | | 6,669,394 |
| University of Pittsburgh of the Commonwealth System of Higher Education Revenue, University | | | | |
| Capital Project, | | | | |
| Refunding, Series C, 5.00%, 9/15/35 | | 5,000,000 | | 5,389,550 |
| Series B, 5.00%, 9/15/31 | | 10,000,000 | | 10,931,800 |
| Washington County IDA College Revenue, Washington and Jefferson College, Refunding, | | | | |
| 5.25%, 11/01/30 | | 7,525,000 | | 8,024,886 |
| 5.00%, 11/01/36 | | 8,470,000 | | 8,713,343 |
| West Mifflin Area School District GO, Allegheny County, AGMC Insured, 5.125%, 4/01/31 | | 1,000,000 | | 1,072,450 |
| Whitehall-Coplay School District GO, Lehigh County, Series A, AGMC Insured, 5.375%, | | | | |
| 11/15/34 | | 6,000,000 | | 6,438,420 |
154 | Annual Report
| | | | |
| Franklin Tax-Free Trust | | | | |
| |
| Statement of Investments, February 28, 2014 (continued) | | | | |
| |
| |
| Franklin Pennsylvania Tax-Free Income Fund | | Principal Amount | | Value |
| Municipal Bonds (continued) | | | | |
| Pennsylvania (continued) | | | | |
| Wilkes-Barre Finance Authority Revenue, Wilkes University Project, Refunding, 5.00%, | | | | |
| 3/01/37 | $ | 4,500,000 | $ | 4,445,190 |
| Wyoming Area School District GO, Refunding, Series A, NATL Insured, 5.00%, 9/01/26 | | 5,005,000 | | 5,173,318 |
| | | | | 1,148,904,641 |
| U.S. Territories 9.4% | | | | |
| Puerto Rico 8.6% | | | | |
| Puerto Rico Commonwealth Aqueduct and Sewer Authority Revenue, senior lien, Series A, | | | | |
| 6.00%, 7/01/44 | | 2,100,000 | | 1,598,562 |
| Puerto Rico Commonwealth GO, Public Improvement, | | | | |
| Refunding, Series A, 5.75%, 7/01/41 | | 7,730,000 | | 5,984,025 |
| Refunding, Series A-4, AGMC Insured, 5.25%, 7/01/30 | | 5,000,000 | | 4,539,800 |
| Series A, 5.00%, 7/01/29 | | 4,000,000 | | 3,008,240 |
| Series A, 5.00%, 7/01/33 | | 7,800,000 | | 5,699,382 |
| Puerto Rico Commonwealth Infrastructure Financing Authority Special Tax Revenue, | | | | |
| Series B, 5.00%, 7/01/37 | | 7,010,000 | | 4,099,308 |
| Puerto Rico Electric Power Authority Power Revenue, | | | | |
| Refunding, Series A, 5.00%, 7/01/42 | | 8,500,000 | | 5,469,665 |
| Series TT, 5.00%, 7/01/32 | | 5,100,000 | | 3,331,269 |
| Series XX, 5.25%, 7/01/40 | | 16,020,000 | | 10,661,470 |
| Puerto Rico Public Finance Corp. Revenue, Commonwealth Appropriation, Refunding, | | | | |
| Series B, 5.50%, 8/01/31 | | 10,000,000 | | 6,441,100 |
| Puerto Rico Sales Tax FICO Sales Tax Revenue, | | | | |
| first subordinate, Series A, 5.375%, 8/01/39 | | 20,000,000 | | 15,389,200 |
| first subordinate, Series A, 6.00%, 8/01/42 | | 34,000,000 | | 28,037,080 |
| first subordinate, Series C, 5.50%, 8/01/40 | | 15,000,000 | | 11,930,400 |
| Refunding, Senior Series C, 5.00%, 8/01/46 | | 6,250,000 | | 5,002,750 |
| | | | | 111,192,251 |
| U.S. Virgin Islands 0.8% | | | | |
| Virgin Islands PFAR, | | | | |
| Gross Receipts Taxes Loan Note, Radian Insured, 5.00%, 10/01/33 | | 5,000,000 | | 4,938,350 |
| senior lien, Refunding, Series B, 5.00%, 10/01/25 | | 5,500,000 | | 5,774,945 |
| | | | | 10,713,295 |
| Total U.S. Territories | | | | 121,905,546 |
| Total Municipal Bonds (Cost $1,256,934,592) 98.3% | | | | 1,270,810,187 |
| Other Assets, less Liabilities 1.7% | | | | 21,516,348 |
| Net Assets 100.0% | | | $ | 1,292,326,535 |
| |
| |
| |
| See Abbreviations on page 181. | | | | |
Annual Report | 155
| | | | | | | | | | | | |
| Franklin Tax-Free Trust | | | | | | | | | | |
| |
| Financial Statements | | | | | | | | | | | | |
| |
| |
| Statements of Assets and Liabilities | | | | | | | | | | | | |
| February 28, 2014 | | | | | | | | | | | | |
| |
| | | Franklin | | | Franklin | | | Franklin | | | Franklin | |
| | | Arizona | | | Colorado | | | Connecticut | | | Michigan | |
| | | Tax-Free | | | Tax-Free | | | Tax-Free | | | Tax-Free | |
| | | Income Fund | | | Income Fund | | | Income Fund | | | Income Fund | |
| Assets: | | | | | | | | | | | | |
| Investments in securities: | | | | | | | | | | | | |
| Cost | $ | 912,717,607 | | $ | 633,794,498 | | $ | 378,843,615 | | $ | 1,080,584,886 | |
| Value | $ | 921,850,555 | | $ | 647,402,569 | | $ | 379,397,905 | | $ | 1,085,675,032 | |
| Cash | | 1,070,517 | | | 8,122,387 | | | 11,416,584 | | | 24,467,442 | |
| Receivables: | | | | | | | | | | | | |
| Capital shares sold | | 368,730 | | | 164,047 | | | 83,979 | | | 5,430,284 | |
| Interest | | 9,751,338 | | | 8,913,441 | | | 3,405,115 | | | 14,605,586 | |
| Other assets | | 660 | | | 469 | | | 278 | | | 794 | |
| Total assets | | 933,041,800 | | | 664,602,913 | | | 394,303,861 | | | 1,130,179,138 | |
| Liabilities: | | | | | | | | | | | | |
| Payables: | | | | | | | | | | | | |
| Capital shares redeemed | | 2,783,026 | | | 1,499,191 | | | 755,380 | | | 2,593,620 | |
| Management fees | | 368,798 | | | 268,833 | | | 168,026 | | | 442,479 | |
| Distribution fees | | 110,632 | | | 93,009 | | | 60,361 | | | 145,386 | |
| Transfer agent fees | | 51,100 | | | 45,877 | | | 26,065 | | | 93,662 | |
| Distributions to shareholders | | 590,808 | | | 253,931 | | | 277,875 | | | 701,161 | |
| Accrued expenses and other liabilities | | 150,968 | | | 69,393 | | | 58,180 | | | 80,814 | |
| Total liabilities | | 4,055,332 | | | 2,230,234 | | | 1,345,887 | | | 4,057,122 | |
| Net assets, at value | $ | 928,986,468 | | $ | 662,372,679 | | $ | 392,957,974 | | $ | 1,126,122,016 | |
| Net assets consist of: | | | | | | | | | | | | |
| Paid-in capital | $ | 930,951,333 | | $ | 665,940,486 | | $ | 403,824,057 | | $ | 1,133,194,998 | |
| Undistributed net investment income | | 733,179 | | | 1,031,854 | | | 806,291 | | | 2,333,656 | |
| Net unrealized appreciation (depreciation) | | 9,132,948 | | | 13,608,071 | | | 554,290 | | | 5,090,146 | |
| Accumulated net realized gain (loss) | | (11,830,992 | ) | | (18,207,732 | ) | | (12,226,664 | ) | | (14,496,784 | ) |
| Net assets, at value | $ | 928,986,468 | | $ | 662,372,679 | | $ | 392,957,974 | | $ | 1,126,122,016 | |
156 | The accompanying notes are an integral part of these financial statements. | Annual Report
| | | | | | | | | | |
| Franklin Tax-Free Trust | | | | | | | | |
| |
| Financial Statements (continued) | | | | | | | | | | |
| |
| |
| Statements of Assets and Liabilities (continued) | | | | | | | | | | |
| February 28, 2014 | | | | | | | | | | |
| |
| | | Franklin | | Franklin | | | Franklin | | | Franklin |
| | | Arizona | | Colorado | | | Connecticut | | | Michigan |
| | | Tax-Free | | Tax-Free | | | Tax-Free | | | Tax-Free |
| | | Income Fund | | Income Fund | | | Income Fund | | | Income Fund |
| Class A: | | | | | | | | | | |
| Net assets, at value | $ | 798,956,632 | $ | 520,274,923 | $ | | 301,323,356 | $ | | 951,408,637 |
| Shares outstanding | | 73,952,760 | | 44,613,824 | | | 28,282,862 | | | 81,531,929 |
| Net asset value per sharea | $ | 10.80 | $ | 11.66 | | $ | 10.65 | | $ | 11.67 |
| Maximum offering price per share (net asset value | | | | | | | | | | |
| per share ÷ 95.75%) | $ | 11.28 | $ | 12.18 | | $ | 11.12 | | $ | 12.19 |
| Class C: | | | | | | | | | | |
| Net assets, at value | $ | 100,188,105 | $ | 107,704,657 | $ | | 75,730,290 | $ | | 148,136,118 |
| Shares outstanding | | 9,142,714 | | 9,141,347 | | | 7,059,366 | | | 12,522,345 |
| Net asset value and maximum offering price per sharea | $ | 10.96 | $ | 11.78 | | $ | 10.73 | | $ | 11.83 |
| Advisor Class: | | | | | | | | | | |
| Net assets, at value | $ | 29,841,731 | $ | 34,393,099 | $ | | 15,904,328 | $ | | 26,577,261 |
| Shares outstanding | | 2,756,306 | | 2,949,565 | | | 1,494,101 | | | 2,271,974 |
| Net asset value and maximum offering price per share | $ | 10.83 | $ | 11.66 | | $ | 10.64 | | $ | 11.70 |
| |
| |
| aRedemption price is equal to net asset value less contingent deferred sales charges, if applicable. | | | | | | | | |
Annual Report | The accompanying notes are an integral part of these financial statements. | 157
| | | | | | | | | | | | |
| Franklin Tax-Free Trust | | | | | | | | | | |
| |
| Financial Statements (continued) | | | | | | | | | | | | |
| |
| |
| Statements of Assets and Liabilities (continued) | | | | | | | | | | | | |
| February 28, 2014 | | | | | | | | | | | | |
| |
| | | Franklin | | | Franklin | | | Franklin | | | Franklin | |
| | | Minnesota | | | Ohio | | | Oregon | | | Pennsylvania | |
| | | Tax-Free | | | Tax-Free | | | Tax-Free | | | Tax-Free | |
| | | Income Fund | | | Income Fund | | | Income Fund | | | Income Fund | |
| Assets: | | | | | | | | | | | | |
| Investments in securities: | | | | | | | | | | | | |
| Cost | $ | 959,142,207 | | $ | 1,424,031,272 | | $ | 1,094,261,809 | | $ | 1,256,934,592 | |
| Value | $ | 1,009,838,443 | | $ | 1,466,584,771 | | $ | 1,116,264,794 | | $ | 1,270,810,187 | |
| Cash | | 4,375,183 | | | 3,807,839 | | | 20,229,759 | | | 8,205,187 | |
| Receivables: | | | | | | | | | | | | |
| Investment securities sold | | — | | | — | | | 1,006,849 | | | — | |
| Capital shares sold | | 949,183 | | | 3,452,433 | | | 1,037,161 | | | 1,079,659 | |
| Interest | | 8,955,425 | | | 16,508,147 | | | 12,532,742 | | | 17,452,190 | |
| Other assets | | 729 | | | 1,056 | | | 812 | | | 942 | |
| Total assets | | 1,024,118,963 | | | 1,490,354,246 | | | 1,151,072,117 | | | 1,297,548,165 | |
| Liabilities: | | | | | | | | | | | | |
| Payables: | | | | | | | | | | | | |
| Capital shares redeemed | | 1,850,656 | | | 5,224,499 | | | 2,796,879 | | | 3,652,119 | |
| Management fees | | 403,137 | | | 576,003 | | | 450,079 | | | 504,562 | |
| Distribution fees | | 157,514 | | | 237,339 | | | 163,782 | | | 207,785 | |
| Transfer agent fees | | 88,253 | | | 129,324 | | | 76,788 | | | 110,848 | |
| Distributions to shareholders | | 299,687 | | | 565,998 | | | 505,791 | | | 635,959 | |
| Accrued expenses and other liabilities | | 88,109 | | | 136,321 | | | 96,104 | | | 110,357 | |
| Total liabilities | | 2,887,356 | | | 6,869,484 | | | 4,089,423 | | | 5,221,630 | |
| Net assets, at value | $ | 1,021,231,607 | | $ | 1,483,484,762 | | $ | 1,146,982,694 | | $ | 1,292,326,535 | |
| Net assets consist of: | | | | | | | | | | | | |
| Paid-in capital | $ | 983,218,526 | | $ | 1,468,366,713 | | $ | 1,144,578,399 | | $ | 1,303,876,319 | |
| Undistributed net investment income | | 791,812 | | | 4,977,003 | | | 2,336,701 | | | 2,325,567 | |
| Net unrealized appreciation (depreciation) | | 50,696,236 | | | 42,553,499 | | | 22,002,985 | | | 13,875,595 | |
| Accumulated net realized gain (loss) | | (13,474,967 | ) | | (32,412,453 | ) | | (21,935,391 | ) | | (27,750,946 | ) |
| Net assets, at value | $ | 1,021,231,607 | | $ | 1,483,484,762 | | $ | 1,146,982,694 | | $ | 1,292,326,535 | |
158 | The accompanying notes are an integral part of these financial statements. | Annual Report
| | | | | | | | | | | | |
| Franklin Tax-Free Trust | | | | | | | | | |
| |
| Financial Statements (continued) | | | | | | | | | | | | |
| |
| |
| Statements of Assets and Liabilities (continued) | | | | | | | | | | | | |
| February 28, 2014 | | | | | | | | | | | | |
| |
| | | | Franklin | | | Franklin | | | Franklin | | | Franklin |
| | | | Minnesota | | | Ohio | | | Oregon | | | Pennsylvania |
| | | | Tax-Free | | | Tax-Free | | | Tax-Free | | | Tax-Free |
| | | | Income Fund | | | Income Fund | | | Income Fund | | | Income Fund |
| Class A: | | | | | | | | | | | | |
| Net assets, at value | $ | | 717,104,428 | $ | | 1,144,884,743 | $ | | 924,611,068 | $ | | 981,992,484 |
| Shares outstanding | | | 57,896,222 | | | 92,060,638 | | | 79,105,296 | | | 96,562,926 |
| Net asset value per sharea | | $ | 12.39 | | $ | 12.44 | | $ | 11.69 | | $ | 10.17 |
| Maximum offering price per share (net asset value | | | | | | | | | | | | |
| per share ÷ 95.75%) | | $ | 12.94 | | $ | 12.99 | | $ | 12.21 | | $ | 10.62 |
| Class C: | | | | | | | | | | | | |
| Net assets, at value | $ | | 205,745,072 | $ | | 301,446,742 | $ | | 188,146,997 | $ | | 268,291,200 |
| Shares outstanding | | | 16,451,114 | | | 23,959,479 | | | 15,884,534 | | | 26,097,333 |
| Net asset value and maximum offering price | | | | | | | | | | | | |
| per sharea | | $ | 12.51 | | $ | 12.58 | | $ | 11.84 | | $ | 10.28 |
| Advisor Class: | | | | | | | | | | | | |
| Net assets, at value | $ | | 98,382,107 | $ | | 37,153,277 | $ | | 34,224,629 | $ | | 42,042,851 |
| Shares outstanding | | | 7,936,680 | | | 2,986,694 | | | 2,925,655 | | | 4,130,980 |
| Net asset value and maximum offering price | | | | | | | | | | | | |
| per share | | $ | 12.40 | | $ | 12.44 | | $ | 11.70 | | $ | 10.18 |
aRedemption price is equal to net asset value less contingent deferred sales charges, if applicable.
Annual Report | The accompanying notes are an integral part of these financial statements. | 159
| | | | | | | | | | | | |
| Franklin Tax-Free Trust | | | | | | | | | | | | |
| |
| Financial Statements (continued) | | | | | | | | | | | | |
| |
| |
| Statements of Operations | | | | | | | | | | | | |
| for the year ended February 28, 2014 | | | | | | | | | | | | |
| |
| | | Franklin | | | Franklin | | | Franklin | | | Franklin | |
| | | Arizona | | | Colorado | | | Connecticut | | | Michigan | |
| | | Tax-Free | | | Tax-Free | | | Tax-Free | | | Tax-Free | |
| | | Income Fund | | | Income Fund | | | Income Fund | | | Income Fund | |
| Investment income: | | | | | | | | | | | | |
| Interest | $ | 48,658,112 | | $ | 34,555,556 | | $ | 20,405,887 | | $ | 57,698,069 | |
| Expenses: | | | | | | | | | | | | |
| Management fees (Note 3a) | | 4,840,892 | | | 3,564,104 | | | 2,314,371 | | | 5,892,243 | |
| Distribution fees: (Note 3c) | | | | | | | | | | | | |
| Class A | | 875,313 | | | 577,399 | | | 345,992 | | | 1,069,852 | |
| Class C | | 789,374 | | | 839,157 | | | 621,404 | | | 1,136,081 | |
| Transfer agent fees: (Note 3e) | | | | | | | | | | | | |
| Class A | | 283,069 | | | 251,736 | | | 146,650 | | | 541,820 | |
| Class C | | 39,552 | | | 56,591 | | | 40,791 | | | 88,873 | |
| Advisor Class | | 10,839 | | | 16,474 | | | 10,461 | | | 11,670 | |
| Custodian fees | | 7,899 | | | 5,720 | | | 3,561 | | | 9,173 | |
| Reports to shareholders | | 45,098 | | | 39,611 | | | 26,056 | | | 63,765 | |
| Registration and filing fees | | 47,575 | | | 40,226 | | | 21,991 | | | 47,497 | |
| Professional fees | | 40,184 | | | 38,878 | | | 36,152 | | | 43,065 | |
| Trustees’ fees and expenses | | 5,228 | | | 3,794 | | | 2,416 | | | 6,497 | |
| Other | | 63,601 | | | 57,465 | | | 43,159 | | | 67,597 | |
| Total expenses | | 7,048,624 | | | 5,491,155 | | | 3,613,004 | | | 8,978,133 | |
| Net investment income | | 41,609,488 | | | 29,064,401 | | | 16,792,883 | | | 48,719,936 | |
| Realized and unrealized gains (losses): | | | | | | | | | | | | |
| Net realized gain (loss) from investments | | (10,662,500 | ) | | (11,130,671 | ) | | (10,361,734 | ) | | (10,871,652 | ) |
| Net change in unrealized appreciation (depreciation) on | | | | | | | | | | | | |
| investments | | (65,680,476 | ) | | (45,163,175 | ) | | (29,254,913 | ) | | (76,015,388 | ) |
| Net realized and unrealized gain (loss) | | (76,342,976 | ) | | (56,293,846 | ) | | (39,616,647 | ) | | (86,887,040 | ) |
| Net increase (decrease) in net assets resulting from | | | | | | | | | | | | |
| operations | $ | (34,733,488 | ) | $ | (27,229,445 | ) | $ | (22,823,764 | ) | $ | (38,167,104 | ) |
160 | The accompanying notes are an integral part of these financial statements. | Annual Report
| | | | | | | | | | | | |
| Franklin Tax-Free Trust | | | | | | | | | | |
| |
| Financial Statements (continued) | | | | | | | | | | | | |
| |
| |
| Statements of Operations (continued) | | | | | | | | | | | | |
| for the year ended February 28, 2014 | | | | | | | | | | | | |
| |
| | | Franklin | | | Franklin | | | Franklin | | | Franklin | |
| | | Minnesota | | | Ohio | | | Oregon | | | Pennsylvania | |
| | | Tax-Free | | | Tax-Free | | | Tax-Free | | | Tax-Free | |
| | | Income Fund | | | Income Fund | | | Income Fund | | | Income Fund | |
| Investment income: | | | | | | | | | | | | |
| Interest | $ | 43,085,735 | | $ | 74,506,109 | | $ | 58,293,914 | | $ | 69,734,399 | |
| Expenses: | | | | | | | | | | | | |
| Management fees (Note 3a) | | 5,158,732 | | | 7,634,179 | | | 6,001,673 | | | 6,884,984 | |
| Distribution fees: (Note 3c) | | | | | | | | | | | | |
| Class A | | 797,182 | | | 1,265,104 | | | 1,028,149 | | | 1,123,116 | |
| Class C | | 1,528,006 | | | 2,290,403 | | | 1,447,373 | | | 1,980,781 | |
| Transfer agent fees: (Note 3e) | | | | | | | | | | | | |
| Class A | | 419,909 | | | 622,562 | | | 403,939 | | | 559,445 | |
| Class C | | 124,197 | | | 174,151 | | | 87,821 | | | 150,010 | |
| Advisor Class | | 33,980 | | | 19,906 | | | 16,567 | | | 23,892 | |
| Custodian fees | | 8,493 | | | 12,898 | | | 9,876 | | | 11,414 | |
| Reports to shareholders | | 65,898 | | | 99,641 | | | 66,020 | | | 95,354 | |
| Registration and filing fees | | 56,514 | | | 71,521 | | | 37,970 | | | 49,815 | |
| Professional fees | | 43,304 | | | 46,975 | | | 42,842 | | | 48,094 | |
| Trustees’ fees and expenses | | 5,525 | | | 8,433 | | | 6,604 | | | 7,608 | |
| Other | | 94,342 | | | 103,559 | | | 97,920 | | | 95,122 | |
| Total expenses | | 8,336,082 | | | 12,349,332 | | | 9,246,754 | | | 11,029,635 | |
| Net investment income | | 34,749,653 | | | 62,156,777 | | | 49,047,160 | | | 58,704,764 | |
| Realized and unrealized gains (losses): | | | | | | | | | | | | |
| Net realized gain (loss) from investments | | (9,413,136 | ) | | (22,358,299 | ) | | (21,457,158 | ) | | (22,549,318 | ) |
| Net change in unrealized appreciation (depreciation) on | | | | | | | | | | | | |
| investments | | (50,034,578 | ) | | (87,446,765 | ) | | (89,418,600 | ) | | (104,345,004 | ) |
| Net realized and unrealized gain (loss) | | (59,447,714 | ) | | (109,805,064 | ) | | (110,875,758 | ) | | (126,894,322 | ) |
| Net increase (decrease) in net assets resulting from | | | | | | | | | | | | |
| operations | $ | (24,698,061 | ) | $ | (47,648,287 | ) | $ | (61,828,598 | ) | $ | (68,189,558 | ) |
Annual Report | The accompanying notes are an integral part of these financial statements. | 161
| | | | | | | | | | | | | |
| Franklin Tax-Free Trust | | | | | | | | | | | |
| |
| Financial Statements (continued) | | | | | | | | | | | | | |
| |
| |
| Statements of Changes in Net Assets | | | | | | | | | | | | | |
| |
| |
| | | Franklin Arizona | | | Franklin Colorado | |
| | | Tax-Free Income Fund | | | Tax-Free Income Fund | |
| | | Year Ended February 28, | | | Year Ended February 28, | |
| | | 2014 | | | 2013 | | | 2014 | | | | 2013 | |
| Increase (decrease) in net assets: | | | | | | | | | | | | | |
| Operations: | | | | | | | | | | | | | |
| Net investment income | $ | 41,609,488 | | $ | 43,306,566 | | $ | 29,064,401 | | $ | 29,569,308 | |
| Net realized gain (loss) from investments | | (10,662,500 | ) | | 609,376 | | | (11,130,671 | ) | | | 1,109,554 | |
| Net change in unrealized appreciation | | | | | | | | | | | | | |
| (depreciation) on investments | | (65,680,476 | ) | | 21,659,215 | | | (45,163,175 | ) | | 10,179,612 | |
| Net increase (decrease) in net assets | | | | | | | | | | | | | |
| resulting from operations | | (34,733,488 | ) | | 65,575,157 | | | (27,229,445 | ) | | 40,858,474 | |
| Distributions to shareholders from: | | | | | | | | | | | | | |
| Net investment income: | | | | | | | | | | | | | |
| Class A | | (35,403,722 | ) | | (36,828,219 | ) | | (22,330,206 | ) | | (23,163,969 | ) |
| Class B | | — | | | (27,549 | ) | | — | | | | — | |
| Class C | | (4,161,983 | ) | | (4,406,846 | ) | | (4,214,167 | ) | | | (4,478,361 | ) |
| Advisor Class | | (1,379,534 | ) | | (1,206,374 | ) | | (1,498,171 | ) | | | (1,417,394 | ) |
| Total distributions to shareholders | | (40,945,239 | ) | | (42,468,988 | ) | | (28,042,544 | ) | | (29,059,724 | ) |
| Capital share transactions: (Note 2) | | | | | | | | | | | | | |
| Class A | | (120,314,984 | ) | | 42,710,189 | | | (97,806,660 | ) | | 68,141,448 | |
| Class B | | (103,326 | ) | | (1,561,793 | ) | | — | | | | — | |
| Class C | | (40,877,767 | ) | | 29,548,564 | | | (42,993,486 | ) | | 32,678,754 | |
| Advisor Class | | (3,838,611 | ) | | 14,848,728 | | | (4,834,043 | ) | | | 9,522,595 | |
| Total capital share transactions | | (165,134,688 | ) | | 85,545,688 | | | (145,634,189 | ) | | 110,342,797 | |
| Net increase (decrease) in net assets | | (240,813,415 | ) | | 108,651,857 | | | (200,906,178 | ) | | 122,141,547 | |
| Net assets: | | | | | | | | | | | | | |
| Beginning of year | | 1,169,799,883 | | | 1,061,148,026 | | | 863,278,857 | | | 741,137,310 | |
| End of year | $ | 928,986,468 | | $ | 1,169,799,883 | | $ | 662,372,679 | | $ | 863,278,857 | |
| Undistributed net investment income included | | | | | | | | | | | | | |
| in net assets: | | | | | | | | | | | | | |
| End of year | $ | 733,179 | | $ | 77,768 | | $ | 1,031,854 | | | $ | 17,474 | |
162 | The accompanying notes are an integral part of these financial statements. | Annual Report
| | | | | | | | | | | | |
| Franklin Tax-Free Trust | | | | | | | | | | |
| |
| Financial Statements (continued) | | | | | | | | | | | | |
| |
| |
| Statements of Changes in Net Assets (continued) | | | | | | | | | | | | |
| |
| |
| | | Franklin Connecticut | | | Franklin Michigan | |
| | | Tax-Free Income Fund | | | Tax-Free Income Fund | |
| | | Year Ended February 28, | | | Year Ended February 28, | |
| | | 2014 | | | 2013 | | | 2014 | | | 2013 | |
| Increase (decrease) in net assets: | | | | | | | | | | | | |
| Operations: | | | | | | | | | | | | |
| Net investment income | $ | 16,792,883 | | $ | 18,601,245 | | $ | 48,719,936 | | $ | 51,283,358 | |
| Net realized gain (loss) from investments | | (10,361,734 | ) | | 969,628 | | | (10,871,652 | ) | | 1,588,480 | |
| Net change in unrealized appreciation | | | | | | | | | | | | |
| (depreciation) on investments | | (29,254,913 | ) | | 2,522,021 | | | (76,015,388 | ) | | 12,732,042 | |
| Net increase (decrease) in net assets | | | | | | | | | | | | |
| resulting from operations | | (22,823,764 | ) | | 22,092,894 | | | (38,167,104 | ) | | 65,603,880 | |
| Distributions to shareholders from: | | | | | | | | | | | | |
| Net investment income: | | | | | | | | | | | | |
| Class A | | (12,247,189 | ) | | (14,342,762 | ) | | (40,584,761 | ) | | (43,467,062 | ) |
| Class B | | — | | | — | | | — | | | (35,036 | ) |
| Class C | | (2,821,374 | ) | | (3,477,589 | ) | | (5,552,956 | ) | | (5,863,433 | ) |
| Advisor Class | | (875,236 | ) | | (1,029,687 | ) | | (892,204 | ) | | (724,634 | ) |
| Total distributions to shareholders | | (15,943,799 | ) | | (18,850,038 | ) | | (47,029,921 | ) | | (50,090,165 | ) |
| Capital share transactions: (Note 2) | | | | | | | | | | | | |
| Class A | | (75,143,174 | ) | | 13,740,158 | | | (234,510,548 | ) | | 2,098,972 | |
| Class B | | — | | | — | | | (154,705 | ) | | (2,369,893 | ) |
| Class C | | (38,216,039 | ) | | 15,899,624 | | | (51,944,608 | ) | | 17,415,658 | |
| Advisor Class | | (12,835,188 | ) | | 7,180,636 | | | 7,997,647 | | | 2,632,207 | |
| Total capital share transactions | | (126,194,401 | ) | | 36,820,418 | | | (278,612,214 | ) | | 19,776,944 | |
| Net increase (decrease) in net assets | | (164,961,964 | ) | | 40,063,274 | | | (363,809,239 | ) | | 35,290,659 | |
| Net assets: | | | | | | | | | | | | |
| Beginning of year | | 557,919,938 | | | 517,856,664 | | | 1,489,931,255 | | | 1,454,640,596 | |
| End of year | $ | 392,957,974 | | $ | 557,919,938 | | $ | 1,126,122,016 | | $ | 1,489,931,255 | |
| Undistributed net investment income (distributions | | | | | | | | | | | | |
| in excess of net investment income) included in | | | | | | | | | | | | |
| net assets: | | | | | | | | | | | | |
| End of year | $ | 806,291 | | $ | (30,749 | ) | $ | 2,333,656 | | $ | 672,978 | |
Annual Report | The accompanying notes are an integral part of these financial statements. | 163
| | | | | | | | | | | | |
| Franklin Tax-Free Trust | | | | | | | | | | |
| |
| Financial Statements (continued) | | | | | | | | | | | | |
| |
| |
| Statements of Changes in Net Assets (continued) | | | | | | | | | | |
| |
| |
| | | Franklin Minnesota | | | Franklin Ohio | |
| | | Tax-Free Income Fund | | | Tax-Free Income Fund | |
| | | Year Ended February 28, | | | Year Ended February 28, | |
| | | 2014 | | | 2013 | | | 2014 | | | 2013 | |
| Increase (decrease) in net assets: | | | | | | | | | | | | |
| Operations: | | | | | | | | | | | | |
| Net investment income | $ | 34,749,653 | | $ | 36,514,341 | | $ | 62,156,777 | | $ | 64,549,875 | |
| Net realized gain (loss) from investments | | (9,413,136 | ) | | 210,277 | | | (22,358,299 | ) | | 2,456,718 | |
| Net change in unrealized appreciation | | | | | | | | | | | | |
| (depreciation) on investments | | (50,034,578 | ) | | 15,396,550 | | | (87,446,765 | ) | | 17,708,714 | |
| Net increase (decrease) in net assets | | | | | | | | | | | | |
| resulting from operations | | (24,698,061 | ) | | 52,121,168 | | | (47,648,287 | ) | | 84,715,307 | |
| Distributions to shareholders from: | | | | | | | | | | | | |
| Net investment income: | | | | | | | | | | | | |
| Class A | | (25,452,835 | ) | | (28,291,653 | ) | | (45,631,208 | ) | | (49,939,124 | ) |
| Class B | | — | | | — | | | — | | | (39,110 | ) |
| Class C | | (6,147,050 | ) | | (6,638,531 | ) | | (10,595,782 | ) | | (11,602,709 | ) |
| Advisor Class | | (2,212,929 | ) | | (1,474,394 | ) | | (1,484,798 | ) | | (1,519,962 | ) |
| Total distributions to shareholders | | (33,812,814 | ) | | (36,404,578 | ) | | (57,711,788 | ) | | (63,100,905 | ) |
| Capital share transactions: (Note 2) | | | | | | | | | | | | |
| Class A | | (144,520,380 | ) | | 73,284,471 | | | (221,592,946 | ) | | 124,045,417 | |
| Class B | | — | | | — | | | (105,490 | ) | | (2,591,693 | ) |
| Class C | | (51,541,588 | ) | | 42,667,366 | | | (91,359,992 | ) | | 65,464,514 | |
| Advisor Class | | 51,023,924 | | | 10,371,102 | | | (5,363,390 | ) | | 8,767,707 | |
| Total capital share transactions | | (145,038,044 | ) | | 126,322,939 | | | (318,421,818 | ) | | 195,685,945 | |
| Net increase (decrease) in net assets | | (203,548,919 | ) | | 142,039,529 | | | (423,781,893 | ) | | 217,300,347 | |
| Net assets: | | | | | | | | | | | | |
| Beginning of year | | 1,224,780,526 | | | 1,082,740,997 | | | 1,907,266,655 | | | 1,689,966,308 | |
| End of year | $ | 1,021,231,607 | | $ | 1,224,780,526 | | $ | 1,483,484,762 | | $ | 1,907,266,655 | |
| Undistributed net investment income | | | | | | | | | | | | |
| (distributions in excess of net investment | | | | | | | | | | | | |
| income) included in net assets: | | | | | | | | | | | | |
| End of year | $ | 791,812 | | $ | (119,569 | ) | $ | 4,977,003 | | $ | 836,186 | |
164 | The accompanying notes are an integral part of these financial statements. | Annual Report
| | | | | | | | | | | | |
| Franklin Tax-Free Trust | | | | | | | | | | |
| |
| Financial Statements (continued) | | | | | | | | | | | | |
| |
| |
| Statements of Changes in Net Assets (continued) | | | | | | | | | | |
| |
| |
| | | Franklin Oregon | | | Franklin Pennsylvania | |
| | | Tax-Free Income Fund | | | Tax-Free Income Fund | |
| | | Year Ended February 28, | | | Year Ended February 28, | |
| | | 2014 | | | 2013 | | | 2014 | | | 2013 | |
| Increase (decrease) in net assets: | | | | | | | | | | | | |
| Operations: | | | | | | | | | | | | |
| Net investment income | $ | 49,047,160 | | $ | 49,668,516 | | $ | 58,704,764 | | $ | 59,363,913 | |
| Net realized gain (loss) from investments | | (21,457,158 | ) | | 1,151,204 | | | (22,549,318 | ) | | 508,601 | |
| Net change in unrealized appreciation | | | | | | | | | | | | |
| (depreciation) on investments | | (89,418,600 | ) | | 13,554,523 | | | (104,345,004 | ) | | 19,781,177 | |
| Net increase (decrease) in net assets | | | | | | | | | | | | |
| resulting from operations | | (61,828,598 | ) | | 64,374,243 | | | (68,189,558 | ) | | 79,653,691 | |
| Distributions to shareholders from: | | | | | | | | | | | | |
| Net investment income: | | | | | | | | | | | | |
| Class A | | (38,518,784 | ) | | (40,042,347 | ) | | (44,846,981 | ) | | (46,212,088 | ) |
| Class B | | — | | | — | | | — | | | (53,733 | ) |
| Class C | | (6,988,600 | ) | | (7,327,223 | ) | | (10,202,093 | ) | | (10,067,766 | ) |
| Advisor Class | | (1,603,261 | ) | | (1,568,729 | ) | | (1,954,596 | ) | | (1,830,966 | ) |
| Total distributions to shareholders | | (47,110,645 | ) | | (48,938,299 | ) | | (57,003,670 | ) | | (58,164,553 | ) |
| Capital share transactions: (Note 2) | | | | | | | | | | | | |
| Class A | | (179,265,453 | ) | | 94,750,742 | | | (232,891,942 | ) | | 123,217,052 | |
| Class B | | — | | | — | | | (213,542 | ) | | (3,249,453 | ) |
| Class C | | (59,472,908 | ) | | 33,593,027 | | | (57,008,097 | ) | | 58,182,722 | |
| Advisor Class | | (10,638,010 | ) | | 8,823,590 | | | (11,170,030 | ) | | 16,165,604 | |
| Total capital share transactions | | (249,376,371 | ) | | 137,167,359 | | | (301,283,611 | ) | | 194,315,925 | |
| Net increase (decrease) in net assets | | (358,315,614 | ) | | 152,603,303 | | | (426,476,839 | ) | | 215,805,063 | |
| Net assets: | | | | | | | | | | | | |
| Beginning of year | | 1,505,298,308 | | | 1,352,695,005 | | | 1,718,803,374 | | | 1,502,998,311 | |
| End of year | $ | 1,146,982,694 | | $ | 1,505,298,308 | | $ | 1,292,326,535 | | $ | 1,718,803,374 | |
| Undistributed net investment income | | | | | | | | | | | | |
| included in net assets: | | | | | | | | | | | | |
| End of year | $ | 2,336,701 | | $ | 407,476 | | $ | 2,325,567 | | $ | 686,730 | |
Annual Report | The accompanying notes are an integral part of these financial statements. | 165
Franklin Tax-Free Trust
Notes to Financial Statements
1. ORGANIZATION AND SIGNIFICANT ACCOUNTING POLICIES
Franklin Tax-Free Trust (Trust) is registered under the Investment Company Act of 1940, as amended, (1940 Act) as an open-end investment company, consisting of twenty-four separate funds, eight of which are included in this report (Funds). The financial statements of the remaining funds in the Trust are presented separately. The Funds offer three classes of shares: Class A, Class C, and Advisor Class. Effective March 1, 2013, all Class B shares were converted to Class A. Each class of shares differs by its initial sales load, contingent deferred sales charges, voting rights on matters affecting a single class, its exchange privilege and fees primarily due to differing arrangements for distribution and transfer agent fees.
The following summarizes the Funds’ significant accounting policies.
a. Financial Instrument Valuation
The Funds’ investments in financial instruments are carried at fair value daily. Fair value is the price that would be received to sell an asset or paid to transfer a liability in an orderly transaction between market participants on the measurement date. The Funds calculate the net asset value per share at the close of the New York Stock Exchange (NYSE), generally at 4p.m. Eastern time (NYSE close) on each day the NYSE is open for trading. Under procedures approved by the Trust’s Board of Trustees (the Board), the Funds’ administrator, investment manager and other affiliates have formed the Valuation and Liquidity Oversight Committee (VLOC). The VLOC provides administration and oversight of the Funds’ valuation policies and procedures, which are approved annually by the Board. Among other things, these procedures allow the Funds to utilize independent pricing services, quotations from securities and financial instrument dealers, and other market sources to determine fair value.
Debt securities generally trade in the over-the-counter market rather than on a securities exchange. The Funds’ pricing services use multiple valuation techniques to determine fair value. In instances where sufficient market activity exists, the pricing services may utilize a market-based approach through which quotes from market makers are used to determine fair value. In instances where sufficient market activity may not exist or is limited, the pricing services also utilize proprietary valuation models which may consider market characteristics such as benchmark yield curves, credit spreads, estimated default rates, anticipated market interest rate volatility, coupon rates, anticipated timing of principal repayments, underlying collateral, and other unique security features in order to estimate the relevant cash flows, which are then discounted to calculate the fair value.
The Funds have procedures to determine the fair value of financial instruments for which market prices are not reliable or readily available. Under these procedures, the VLOC convenes on a regular basis to review such financial instruments and considers a number of factors, including significant unobservable valuation inputs, when arriving at fair value. The VLOC primarily
166 | Annual Report
Franklin Tax-Free Trust
Notes to Financial Statements (continued)
| 1. | ORGANIZATION AND SIGNIFICANT ACCOUNTING POLICIES (continued) |
| a. | Financial Instrument Valuation (continued) |
employs a market-based approach which may use related or comparable assets or liabilities, recent transactions, market multiples, book values, and other relevant information for the investment to determine the fair value of the investment. An income-based valuation approach may also be used in which the anticipated future cash flows of the investment are discounted to calculate fair value. Discounts may also be applied due to the nature or duration of any restrictions on the disposition of the investments. Due to the inherent uncertainty of valuations of such investments, the fair values may differ significantly from the values that would have been used had an active market existed. The VLOC employs various methods for calibrating these valuation approaches including a regular review of key inputs and assumptions, transactional back-testing or disposition analysis, and reviews of any related market activity.
b. Income Taxes
It is each fund’s policy to qualify as a regulated investment company under the Internal Revenue Code. Each fund intends to distribute to shareholders substantially all of its income and net realized gains to relieve it from federal income and excise taxes. As a result, no provision for U.S. federal income taxes is required.
Each fund recognizes the tax benefits of uncertain tax positions only when the position is “more likely than not” to be sustained upon examination by the tax authorities based on the technical merits of the tax position. As of February 28, 2014, and for all open tax years, each fund has determined that no liability for unrecognized tax benefits is required in each fund’s financial statements related to uncertain tax positions taken on a tax return (or expected to be taken on future tax returns). Open tax years are those that remain subject to examination and are based on each tax jurisdiction statute of limitation.
c. Security Transactions, Investment Income, Expenses and Distributions
Security transactions are accounted for on trade date. Realized gains and losses on security transactions are determined on a specific identification basis. Interest income and estimated expenses are accrued daily. Amortization of premium and accretion of discount on debt securities are included in interest income. Dividends from net investment income are normally declared daily; these dividends may be reinvested or paid monthly to shareholders. Distributions to shareholders are determined according to income tax regulations (tax basis). Distributable earnings determined on a tax basis may differ from earnings recorded in accordance with accounting principles generally accepted in the United States of America. These differences may be permanent or temporary. Permanent differences are reclassified among capital accounts to reflect their tax character. These reclassifications have no impact on net assets or the results of operations. Temporary differences are not reclassified, as they may reverse in subsequent periods.
Annual Report | 167
Franklin Tax-Free Trust
Notes to Financial Statements (continued)
| 1. | ORGANIZATION AND SIGNIFICANT ACCOUNTING POLICIES (continued) |
| c. | Security Transactions, Investment Income, Expenses and Distributions (continued) |
Common expenses incurred by the Trust are allocated among the funds based on the ratio of net assets of each fund to the combined net assets of the Trust. Fund specific expenses are charged directly to the fund that incurred the expense.
Realized and unrealized gains and losses and net investment income, not including class specific expenses, are allocated daily to each class of shares based upon the relative proportion of net assets of each class. Differences in per share distributions, by class, are generally due to differences in class specific expenses.
d. Insurance
The scheduled payments of interest and principal for each insured municipal security in the Trust are insured by either a new issue insurance policy or a secondary insurance policy. Some municipal securities in the Funds are secured by collateral guaranteed by an agency of the U.S. government. Depending on the type of coverage, premiums for insurance are either added to the cost basis of the security or paid by a third party.
Insurance companies typically insure municipal bonds that tend to be of very high quality, with the majority of underlying municipal bonds rated A or better. However, an event involving an insurer could have an adverse effect on the value of the securities insured by that insurance company. There is no guarantee the insurer will be able to fulfill its obligations under the terms of the policy.
e. Accounting Estimates
The preparation of financial statements in accordance with accounting principles generally accepted in the United States of America requires management to make estimates and assumptions that affect the reported amounts of assets and liabilities at the date of the financial statements and the amounts of income and expenses during the reporting period. Actual results could differ from those estimates.
f. Guarantees and Indemnifications
Under the Trust’s organizational documents, its officers and trustees are indemnified by the Trust against certain liabilities arising out of the performance of their duties to the Trust. Additionally, in the normal course of business, the Trust, on behalf of the Funds, enters into contracts with service providers that contain general indemnification clauses. The Trust’s maximum exposure under these arrangements is unknown as this would involve future claims that may be made against the Trust that have not yet occurred. Currently, the Trust expects the risk of loss to be remote.
168 | Annual Report
Franklin Tax-Free Trust
Notes to Financial Statements (continued)
2. SHARES OF BENEFICIAL INTEREST
At February 28, 2014, there were an unlimited number of shares authorized (without par value).
Transactions in the Funds’ shares were as follows:
| | | | | | | | | | | | |
| | Franklin Arizona | | Franklin Colorado | |
| | Tax-Free Income Fund | | Tax-Free Income Fund | |
| | Shares | | | | Amount | | Shares | | | | Amount | |
| Class A Shares: | | | | | | | | | | | | |
| Year ended February 28, 2014 | | | | | | | | | | | | |
| Shares sold | 11,016,150 | | $ | 120,414,193 | | 4,869,829 | | | $ | 57,467,098 | |
| Shares issued in reinvestment of | | | | | | | | | | | | |
| distributions | 2,623,857 | | | | 28,453,459 | | 1,691,354 | | | | 19,813,837 | |
| Shares redeemed | (24,970,398 | ) | | | (269,182,636 | ) | (15,056,386 | ) | | (175,087,595 | ) |
| Net increase (decrease) | (11,330,391 | ) | $ | (120,314,984 | ) | (8,495,203 | ) | $ | (97,806,660 | ) |
| Year ended February 28, 2013 | | | | | | | | | | | | |
| Shares sold | 13,158,387 | | $ | 150,690,554 | | 10,860,377 | | $ | 134,937,182 | |
| Shares issued in reinvestment of | | | | | | | | | | | | |
| distributions | 2,569,237 | | | | 29,430,954 | | 1,650,720 | | | | 20,478,095 | |
| Shares redeemed | (12,018,402 | ) | | | (137,411,319 | ) | (7,031,036 | ) | | | (87,273,829 | ) |
| Net increase (decrease) | 3,709,222 | | | $ | 42,710,189 | | 5,480,061 | | | $ | 68,141,448 | |
| Class B Shares: | | | | | | | | | | | | |
| Year ended February 28, 2014a | | | | | | | | | | | | |
| Shares redeemed | (8,908 | ) | | $ | (103,326 | ) | | | | | | |
| Year ended February 28, 2013 | | | | | | | | | | | | |
| Shares sold | 3,228 | | | $ | 37,408 | | | | | | | |
| Shares issued in reinvestment of | | | | | | | | | | | | |
| distributions | 1,825 | | | | 20,950 | | | | | | | |
| Shares redeemed | (140,935 | ) | | | (1,620,151 | ) | | | | | | |
| Net increase (decrease) | (135,882 | ) | | $ | (1,561,793 | ) | | | | | | |
| Class C Shares: | | | | | | | | | | | | |
| Year ended February 28, 2014 | | | | | | | | | | | | |
| Shares sold | 1,241,721 | | | $ | 13,926,732 | | 1,164,859 | | | $ | 13,968,264 | |
| Shares issued in reinvestment of | | | | | | | | | | | | |
| distributions | 335,670 | | | | 3,698,081 | | 323,508 | | | | 3,834,313 | |
| Shares redeemed | (5,342,950 | ) | | | (58,502,580 | ) | (5,154,596 | ) | | | (60,796,063 | ) |
| Net increase (decrease) | (3,765,559 | ) | | $ | (40,877,767 | ) | (3,666,229 | ) | $ | (42,993,486 | ) |
| Year ended February 28, 2013 | | | | | | | | | | | | |
| Shares sold | 4,001,817 | | | $ | 46,478,246 | | 3,712,623 | | | $ | 46,556,699 | |
| Shares issued in reinvestment of | | | | | | | | | | | | |
| distributions | 337,803 | | | | 3,923,869 | | 327,126 | | | | 4,098,015 | |
| Shares redeemed | (1,795,068 | ) | | | (20,853,551 | ) | (1,434,656 | ) | | | (17,975,960 | ) |
| Net increase (decrease) | 2,544,552 | | | $ | 29,548,564 | | 2,605,093 | | | $ | 32,678,754 | |
Annual Report | 169
| | | | | | | | | | | |
| Franklin Tax-Free Trust | | | | | | | |
| |
| Notes to Financial Statements (continued) | | | | | | | | |
| |
| |
| 2. SHARES OF BENEFICIAL INTEREST (continued) | | | | | | | | | | |
| |
| | Franklin Arizona | | Franklin Colorado | |
| | Tax-Free Income Fund | | Tax-Free Income Fund | |
| | Shares | | | Amount | | Shares | | | | Amount | |
| Advisor Class Shares: | | | | | | | | | | | |
| Year ended February 28, 2014 | | | | | | | | | | | |
| Shares sold | 1,413,465 | | $ | 15,479,805 | | 1,018,921 | | | $ | 11,998,030 | |
| Shares issued in reinvestment of | | | | | | | | | | | |
| distributions | 87,252 | | | 947,473 | | 101,801 | | | | 1,192,272 | |
| Shares redeemed | (1,888,335 | ) | | (20,265,889 | ) | (1,548,234 | ) | | | (18,024,345 | ) |
| Net increase (decrease) | (387,618 | ) | $ | (3,838,611 | ) | (427,512 | ) | | $ | (4,834,043 | ) |
| Year ended February 28, 2013 | | | | | | | | | | | |
| Shares sold | 1,868,237 | | $ | 21,403,684 | | 1,541,497 | | | $ | 19,119,193 | |
| Shares issued in reinvestment of | | | | | | | | | | | |
| distributions | 77,773 | | | 893,843 | | 93,595 | | | | 1,161,178 | |
| Shares redeemed | (648,014 | ) | | (7,448,799 | ) | (868,481 | ) | | | (10,757,776 | ) |
| Net increase (decrease) | 1,297,996 | | $ | 14,848,728 | | 766,611 | | | $ | 9,522,595 | |
| |
| aEffective March 1, 2013, all Class B shares were converted to Class A. | | | | | | | | | | |
| |
| | Franklin Connecticut | | Franklin Michigan | |
| | Tax-Free Income Fund | | Tax-Free Income Fund | |
| | Shares | | | Amount | | Shares | | | | Amount | |
| Class A Shares: | | | | | | | | | | | |
| Year ended February 28, 2014 | | | | | | | | | | | |
| Shares sold | 4,210,757 | | $ | 45,464,290 | | 5,063,928 | | | $ | 59,643,726 | |
| Shares issued in reinvestment of | | | | | | | | | | | |
| distributions | 908,300 | | | 9,748,155 | | 2,807,637 | | | | 32,778,744 | |
| Shares redeemed | (12,242,640 | ) | | (130,355,619 | ) | (28,075,664 | ) | | (326,933,018 | ) |
| Net increase (decrease) | (7,123,583 | ) | $ | (75,143,174 | ) | (20,204,099 | ) | $ | (234,510,548 | ) |
| Year ended February 28, 2013 | | | | | | | | | | | |
| Shares sold | 5,423,418 | | $ | 62,039,119 | | 10,253,628 | | $ | 126,270,401 | |
| Shares issued in reinvestment of | | | | | | | | | | | |
| distributions | 967,826 | | | 11,069,517 | | 2,876,150 | | | | 35,415,795 | |
| Shares redeemed | (5,190,238 | ) | | (59,368,478 | ) | (12,944,825 | ) | | (159,587,224 | ) |
| Net increase (decrease) | 1,201,006 | | $ | 13,740,158 | | 184,953 | | | $ | 2,098,972 | |
| Class B Shares: | | | | | | | | | | | |
| Year ended February 28, 2014a | | | | | | | | | | | |
| Shares redeemed | | | | | | (12,445 | ) | | $ | (154,705 | ) |
| Year ended February 28, 2013 | | | | | | | | | | | |
| Shares sold | | | | | | 7 | | | $ | 104 | |
| Shares issued in reinvestment of | | | | | | | | | | | |
| distributions | | | | | | 2,694 | | | | 33,215 | |
| Shares redeemed | | | | | | (194,464 | ) | | | (2,403,212 | ) |
| Net increase (decrease) | | | | | | (191,763 | ) | | $ | (2,369,893 | ) |
170 | Annual Report
| | | | | | | | | | | |
| Franklin Tax-Free Trust | | | | | | | |
| |
| Notes to Financial Statements (continued) | | | | | | | |
| |
| |
| 2. SHARES OF BENEFICIAL INTEREST (continued) | | | | | | | | | | |
| |
| | Franklin Connecticut | | Franklin Michigan | |
| | Tax-Free Income Fund | | Tax-Free Income Fund | |
| | Shares | | | Amount | | Shares | | | | Amount | |
| Class C Shares: | | | | | | | | | | | |
| Year ended February 28, 2014 | | | | | | | | | | | |
| Shares sold | 653,834 | | $ | 7,215,674 | | 1,358,262 | | | $ | 16,333,952 | |
| Shares issued in reinvestment of | | | | | | | | | | | |
| distributions | 205,885 | | | 2,226,953 | | 402,004 | | | | 4,757,992 | |
| Shares redeemed | (4,422,120 | ) | | (47,658,666 | ) | (6,198,220 | ) | | | (73,036,552 | ) |
| Net increase (decrease) | (3,562,401 | ) | $ | (38,216,039 | ) | (4,437,954 | ) | | $ | (51,944,608 | ) |
| Year ended February 28, 2013 | | | | | | | | | | | |
| Shares sold | 2,484,083 | | $ | 28,564,759 | | 3,329,519 | | | $ | 41,506,392 | |
| Shares issued in reinvestment of | | | | | | | | | | | |
| distributions | 232,435 | | | 2,676,649 | | 406,299 | | | | 5,068,469 | |
| Shares redeemed | (1,333,285 | ) | | (15,341,784 | ) | (2,335,324 | ) | | | (29,159,203 | ) |
| Net increase (decrease) | 1,383,233 | | $ | 15,899,624 | | 1,400,494 | | | $ | 17,415,658 | |
| Advisor Class Shares: | | | | | | | | | | | |
| Year ended February 28, 2014 | | | | | | | | | | | |
| Shares sold | 475,844 | | $ | 5,158,061 | | 1,904,776 | | | $ | 22,809,707 | |
| Shares issued in reinvestment of | | | | | | | | | | | |
| distributions | 41,489 | | | 446,125 | | 65,881 | | | | 769,267 | |
| Shares redeemed | (1,734,759 | ) | | (18,439,374 | ) | (1,338,962 | ) | | | (15,581,327 | ) |
| Net increase (decrease) | (1,217,426 | ) | $ | (12,835,188 | ) | 631,695 | | | $ | 7,997,647 | |
| Year ended February 28, 2013 | | | | | | | | | | | |
| Shares sold | 1,311,840 | | $ | 15,007,933 | | 800,914 | | | $ | 9,886,686 | |
| Shares issued in reinvestment of | | | | | | | | | | | |
| distributions | 44,102 | | | 504,176 | | 48,585 | | | | 599,929 | |
| Shares redeemed | (729,196 | ) | | (8,331,473 | ) | (633,191 | ) | | | (7,854,408 | ) |
| Net increase (decrease) | 626,746 | | $ | 7,180,636 | | 216,308 | | | $ | 2,632,207 | |
| |
| aEffective March 1, 2013, all Class B shares were converted to Class A. | | | | | | | | | | |
| |
| | Franklin Minnesota | | Franklin Ohio | |
| | Tax-Free Income Fund | | Tax-Free Income Fund | |
| | Shares | | | Amount | | Shares | | | | Amount | |
| Class A Shares: | | | | | | | | | | | |
| Year ended February 28, 2014 | | | | | | | | | | | |
| Shares sold | 6,282,081 | | $ | 78,551,539 | | 8,324,965 | | $ | 104,217,066 | |
| Shares issued in reinvestment of | | | | | | | | | | | |
| distributions | 1,804,644 | | | 22,371,546 | | 3,221,051 | | | | 40,005,294 | |
| Shares redeemed | (19,891,540 | ) | | (245,443,465 | ) | (29,676,471 | ) | | (365,815,306 | ) |
| Net increase (decrease) | (11,804,815 | ) | $ | (144,520,380 | ) | (18,130,455 | ) | $ | (221,592,946 | ) |
| Year ended February 28, 2013 | | | | | | | | | | | |
| Shares sold | 12,366,511 | | $ | 159,925,264 | | 19,221,332 | | $ | 251,399,442 | |
| Shares issued in reinvestment of | | | | | | | | | | | |
| distributions | 1,929,970 | | | 24,946,581 | | 3,362,363 | | | | 43,963,592 | |
| Shares redeemed | (8,629,739 | ) | | (111,587,374 | ) | (13,108,710 | ) | | (171,317,617 | ) |
| Net increase (decrease) | 5,666,742 | | $ | 73,284,471 | | 9,474,985 | | $ | 124,045,417 | |
Annual Report | 171
| | | | | | | | | | |
| Franklin Tax-Free Trust | | | | | | |
| |
| Notes to Financial Statements (continued) | | | | | | | |
| |
| |
| 2. SHARES OF BENEFICIAL INTEREST (continued) | | | | | | | | | |
| |
| | Franklin Minnesota | | Franklin Ohio | |
| | Tax-Free Income Fund | | Tax-Free Income Fund | |
| | Shares | | | Amount | | Shares | | | Amount | |
| Class B Shares: | | | | | | | | | | |
| Year ended February 28, 2014a | | | | | | | | | | |
| Shares redeemed | | | | | | (8,004 | ) | $ | (105,490 | ) |
| Year ended February 28, 2013 | | | | | | | | | | |
| Shares sold | | | | | | 642 | | $ | 8,479 | |
| Shares issued in reinvestment of | | | | | | | | | | |
| distributions | | | | | | 2,803 | | | 36,617 | |
| Shares redeemed | | | | | | (201,193 | ) | | (2,636,789 | ) |
| Net increase (decrease) | | | | | | (197,748 | ) | $ | (2,591,693 | ) |
| Class C Shares: | | | | | | | | | | |
| Year ended February 28, 2014 | | | | | | | | | | |
| Shares sold | 2,152,620 | | $ | 27,372,712 | | 2,570,771 | | $ | 33,026,582 | |
| Shares issued in reinvestment of | | | | | | | | | | |
| distributions | 426,038 | | | 5,332,862 | | 764,242 | | | 9,606,299 | |
| Shares redeemed | (6,774,364 | ) | | (84,247,162 | ) | (10,752,045 | ) | (133,992,873 | ) |
| Net increase (decrease) | (4,195,706 | ) | $ | (51,541,588 | ) | (7,417,032 | ) | $ | (91,359,992 | ) |
| Year ended February 28, 2013 | | | | | | | | | | |
| Shares sold | 5,124,545 | | $ | 66,857,789 | | 7,471,954 | | $ | 98,746,640 | |
| Shares issued in reinvestment of | | | | | | | | | | |
| distributions | 432,298 | | | 5,640,304 | | 803,482 | | | 10,624,746 | |
| Shares redeemed | (2,287,238 | ) | | (29,830,727 | ) | (3,323,624 | ) | | (43,906,872 | ) |
| Net increase (decrease) | 3,269,605 | | $ | 42,667,366 | | 4,951,812 | | $ | 65,464,514 | |
| Advisor Class Shares: | | | | | | | | | | |
| Year ended February 28, 2014 | | | | | | | | | | |
| Shares sold | 5,727,437 | | $ | 70,622,891 | | 1,344,243 | | $ | 16,835,569 | |
| Shares issued in reinvestment of | | | | | | | | | | |
| distributions | 160,696 | | | 1,982,849 | | 76,376 | | | 949,548 | |
| Shares redeemed | (1,754,382 | ) | | (21,581,816 | ) | (1,891,026 | ) | | (23,148,507 | ) |
| Net increase (decrease) | 4,133,751 | | $ | 51,023,924 | | (470,407 | ) | $ | (5,363,390 | ) |
| Year ended February 28, 2013 | | | | | | | | | | |
| Shares sold | 1,423,095 | | $ | 18,446,616 | | 1,160,384 | | $ | 15,198,682 | |
| Shares issued in reinvestment of | | | | | | | | | | |
| distributions | 96,798 | | | 1,252,322 | | 76,913 | | | 1,006,084 | |
| Shares redeemed | (719,496 | ) | | (9,327,836 | ) | (567,532 | ) | | (7,437,059 | ) |
| Net increase (decrease) | 800,397 | | $ | 10,371,102 | | 669,765 | | $ | 8,767,707 | |
| |
| aEffective March 1, 2013, all Class B shares were converted to Class A. | | | | | | | | | |
172 | Annual Report
| | | | | | | | | | | | |
| Franklin Tax-Free Trust | | | | | | | |
| |
| Notes to Financial Statements (continued) | | | | | | | | |
| |
| |
| 2. SHARES OF BENEFICIAL INTEREST (continued) | | | | | | | | | | | |
| |
| | Franklin Oregon | | Franklin Pennsylvania | |
| | Tax-Free Income Fund | | Tax-Free Income Fund | |
| | Shares | | | | Amount | | Shares | | | | Amount | |
| Class A Shares: | | | | | | | | | | | | |
| Year ended February 28, 2014 | | | | | | | | | | | | |
| Shares sold | 7,969,601 | | | $ | 95,198,882 | | 9,953,253 | | $ | 103,585,199 | |
| Shares issued in reinvestment of | | | | | | | | | | | | |
| distributions | 2,839,496 | | | | 33,433,945 | | 3,751,723 | | | | 38,435,397 | |
| Shares redeemed | (26,268,394 | ) | | | (307,898,280 | ) | (36,892,227 | ) | | (374,912,538 | ) |
| Net increase (decrease) | (15,459,297 | ) | $ | (179,265,453 | ) | (23,187,251 | ) | $ | (232,891,942 | ) |
| Year ended February 28, 2013 | | | | | | | | | | | | |
| Shares sold | 15,554,287 | | $ | 195,217,017 | | 21,234,994 | | $ | 231,654,733 | |
| Shares issued in reinvestment of | | | | | | | | | | | | |
| distributions | 2,756,547 | | | | 34,604,992 | | 3,651,987 | | | | 39,823,306 | |
| Shares redeemed | (10,757,261 | ) | | | (135,071,267 | ) | (13,588,754 | ) | | (148,260,987 | ) |
| Net increase (decrease) | 7,553,573 | | | $ | 94,750,742 | | 11,298,227 | | $ | 123,217,052 | |
| Class B Shares: | | | | | | | | | | | | |
| Year ended February 28, 2014a | | | | | | | | | | | | |
| Shares redeemed | | | | | | | (19,441 | ) | | $ | (213,542 | ) |
| Year ended February 28, 2013 | | | | | | | | | | | | |
| Shares sold | | | | | | | 7,836 | | | $ | 84,890 | |
| Shares issued in reinvestment of | | | | | | | | | | | | |
| distributions | | | | | | | 4,216 | | | | 45,891 | |
| Shares redeemed | | | | | | | (310,021 | ) | | | (3,380,234 | ) |
| Net increase (decrease) | | | | | | | (297,969 | ) | | $ | (3,249,453 | ) |
| Class C Shares: | | | | | | | | | | | | |
| Year ended February 28, 2014 | | | | | | | | | | | | |
| Shares sold | 1,682,410 | | | $ | 20,433,459 | | 3,211,832 | | | $ | 33,853,102 | |
| Shares issued in reinvestment of | | | | | | | | | | | | |
| distributions | 526,299 | | | | 6,280,270 | | 837,910 | | | | 8,673,460 | |
| Shares redeemed | (7,260,714 | ) | | | (86,186,637 | ) | (9,692,065 | ) | | | (99,534,659 | ) |
| Net increase (decrease) | (5,052,005 | ) | | $ | (59,472,908 | ) | (5,642,323 | ) | | $ | (57,008,097 | ) |
| Year ended February 28, 2013 | | | | | | | | | | | | |
| Shares sold | 4,571,020 | | | $ | 58,040,662 | | 8,308,662 | | | $ | 91,464,060 | |
| Shares issued in reinvestment of | | | | | | | | | | | | |
| distributions | 513,463 | | | | 6,529,514 | | 782,960 | | | | 8,627,998 | |
| Shares redeemed | (2,433,856 | ) | | | (30,977,149 | ) | (3,801,196 | ) | | | (41,909,336 | ) |
| Net increase (decrease) | 2,650,627 | | | $ | 33,593,027 | | 5,290,426 | | | $ | 58,182,722 | |
Annual Report | 173
| | | | | | | | | | | | |
| Franklin Tax-Free Trust | | | | | | | |
| |
| Notes to Financial Statements (continued) | | | | | | | | |
| |
| |
| 2. SHARES OF BENEFICIAL INTEREST (continued) | | | | | | | | | | | |
| |
| | Franklin Oregon | | Franklin Pennsylvania | |
| | Tax-Free Income Fund | | Tax-Free Income Fund | |
| | Shares | | | | Amount | | Shares | | | | Amount | |
| Advisor Class Shares: | | | | | | | | | | | | |
| Year ended February 28, 2014 | | | | | | | | | | | | |
| Shares sold | 1,263,528 | | | $ | 14,994,738 | | 1,451,353 | | | $ | 14,887,063 | |
| Shares issued in reinvestment of | | | | | | | | | | | | |
| distributions | 110,171 | | | | 1,299,785 | | 153,871 | | | | 1,578,934 | |
| Shares redeemed | (2,313,714 | ) | | | (26,932,533 | ) | (2,718,949 | ) | | | (27,636,027 | ) |
| Net increase (decrease) | (940,015 | ) | $ | (10,638,010 | ) | (1,113,725 | ) | $ | (11,170,030 | ) |
| Year ended February 28, 2013 | | | | | | | | | | | | |
| Shares sold | 1,403,301 | | | $ | 17,670,751 | | 2,047,781 | | | $ | 22,372,512 | |
| Shares issued in reinvestment of | | | | | | | | | | | | |
| distributions | 100,046 | | | | 1,257,454 | | 138,045 | | | | 1,507,415 | |
| Shares redeemed | (803,703 | ) | | | (10,104,615 | ) | (706,545 | ) | | | (7,714,323 | ) |
| Net increase (decrease) | 699,644 | | | $ | 8,823,590 | | 1,479,281 | | | $ | 16,165,604 | |
aEffective March 1, 2013, all Class B Shares were converted to Class A.
3. TRANSACTIONS WITH AFFILIATES
Franklin Resources, Inc. is the holding company for various subsidiaries that together are referred to as Franklin Templeton Investments. Certain officers and trustees of the Trust are also officers and/or directors of the following subsidiaries:
| |
| Subsidiary | Affiliation |
| Franklin Advisers, Inc. (Advisers) | Investment manager |
| Franklin Templeton Services, LLC (FT Services) | Administrative manager |
| Franklin Templeton Distributors, Inc. (Distributors) | Principal underwriter |
| Franklin Templeton Investor Services, LLC (Investor Services) | Transfer agent |
a. Management Fees
The Funds pay an investment management fee to Advisers based on the month-end net assets of each of the Funds as follows:
| | |
| Annualized Fee Rate | | Net Assets |
| 0.625 | % | Up to and including $100 million |
| 0.500 | % | Over $100 million, up to and including $250 million |
| 0.450 | % | Over $250 million, up to and including $7.5 billion |
| 0.440 | % | Over $7.5 billion, up to and including $10 billion |
| 0.430 | % | Over $10 billion, up to and including $12.5 billion |
| 0.420 | % | Over $12.5 billion, up to and including $15 billion |
| 0.400 | % | Over $15 billion, up to and including $17.5 billion |
| 0.380 | % | Over $17.5 billion, up to and including $20 billion |
| 0.360 | % | In excess of $20 billion |
174 | Annual Report
Franklin Tax-Free Trust
Notes to Financial Statements (continued)
3. TRANSACTIONS WITH AFFILIATES (continued) b. Administrative Fees
Under an agreement with Advisers, FT Services provides administrative services to the Funds. The fee is paid by Advisers based on the Funds’ average daily net assets, and is not an additional expense of the Funds.
c. Distribution Fees
The Board has adopted distribution plans for each share class, with the exception of Advisor Class shares, pursuant to Rule 12b-1 under the 1940 Act. Distribution fees are not charged on shares held by affiliates. Under the Funds’ Class A reimbursement distribution plans, the Funds reimburse Distributors for costs incurred in connection with the servicing, sale and distribution of the Funds’ shares up to the maximum annual plan rate. Under the Class A reimbursement distribution plans, costs exceeding the maximum for the current plan year cannot be reimbursed in subsequent periods. In addition, under the Funds’ Class C compensation distribution plans, the Funds pay Distributors for costs incurred in connection with the servicing, sale and distribution of each fund’s shares up to the maximum annual plan rate. The plan year, for purposes of monitoring compliance with the maximum annual plan rates, is February 1 through January 31 for each fund.
The maximum annual plan rates, based on the average daily net assets, for each class, are as follows:
d. Sales Charges/Underwriting Agreements
Front-end sales charges and contingent deferred sales charges (CDSC) do not represent expenses of the Funds. These charges are deducted from the proceeds of sales of fund shares prior to investment or from redemption proceeds prior to remittance, as applicable. Distributors has advised the Funds of the following commission transactions related to the sales and redemptions of the Funds’ shares for the year:
| | | | | | | | |
| | | Franklin | | Franklin | | Franklin | | Franklin |
| | | Arizona | | Colorado | | Connecticut | | Michigan |
| | | Tax-Free | | Tax-Free | | Tax-Free | | Tax-Free |
| | | Income Fund | | Income Fund | | Income Fund | | Income Fund |
| Sales charges retained net of commissions | | | | | | | | |
| paid to unaffiliated broker/dealers | $ | 156,667 | $ | 101,463 | $ | 48,037 | $ | 111,273 |
| CDSC retained | $ | 58,379 | $ | 63,219 | $ | 32,735 | $ | 37,210 |
| |
| | | Franklin | | Franklin | | Franklin | | Franklin |
| | | Minnesota | | Ohio | | Oregon | | Pennsylvania |
| | | Tax-Free | | Tax-Free | | Tax-Free | | Tax-Free |
| | | Income Fund | | Income Fund | | Income Fund | | Income Fund |
| Sales charges retained net of commissions | | | | | | | | |
| paid to unaffiliated broker/dealers | $ | 130,958 | $ | 223,579 | $ | 229,252 | $ | 235,367 |
| CDSC retained | $ | 85,024 | $ | 79,039 | $ | 79,464 | $ | 72,339 |
Annual Report | 175
Franklin Tax-Free Trust
Notes to Financial Statements (continued)
3. TRANSACTIONS WITH AFFILIATES (continued) e. Transfer Agent Fees
Each class of shares pays transfer agent fees to Investor Services for its performance of shareholder servicing obligations and reimburses Investor Services for out of pocket expenses incurred, including shareholding servicing fees paid to third parties. These fees are allocated daily based upon their relative proportion of such classes’ aggregate net assets.
For the year ended February 28, 2014, the Funds paid transfer agent fees as noted in the Statements of Operations of which the following amounts were retained by Investor Services:
| | | | | | | | |
| | | Franklin | | Franklin | | Franklin | | Franklin |
| | | Arizona | | Colorado | | Connecticut | | Michigan |
| | | Tax-Free | | Tax-Free | | Tax-Free | | Tax-Free |
| | | Income Fund | | Income Fund | | Income Fund | | Income Fund |
| Transfer agent fees | $ | 132,948 | $ | 115,584 | $ | 79,607 | $ | 296,438 |
| |
| | | Franklin | | Franklin | | Franklin | | Franklin |
| | | Minnesota | | Ohio | | Oregon | | Pennsylvania |
| | | Tax-Free | | Tax-Free | | Tax-Free | | Tax-Free |
| | | Income Fund | | Income Fund | | Income Fund | | Income Fund |
| Transfer agent fees | $ | 220,418 | $ | 309,529 | $ | 194,871 | $ | 319,338 |
4. INCOME TAXES
For tax purposes, capital losses may be carried over to offset future capital gains. Capital loss carryforwards with no expiration, if any, must be fully utilized before those losses with expiration dates.
At February 28, 2014, the capital loss carryforwards were as follows:
| | | | | | | | |
| | | Franklin | | Franklin | | Franklin | | Franklin |
| | | Arizona | | Colorado | | Connecticut | | Michigan |
| | | Tax-Free | | Tax-Free | | Tax-Free | | Tax-Free |
| | | Income Fund | | Income Fund | | Income Fund | | Income Fund |
| Capital loss carryforwards subject to | | | | | | | | |
| expiration: | | | | | | | | |
| 2015 | $ | 659,023 | $ | — | $ | — | $ | — |
| 2018 | | — | | 2,700,288 | | — | | — |
| 2019 | | — | | 1,448,482 | | — | | — |
| Capital loss carryforwards not subject to | | | | | | | | |
| expiration: | | | | | | | | |
| Short term | | 10,123,321 | | 11,894,506 | | 7,078,540 | | 10,458,135 |
| Long term | | 559,492 | | 2,164,456 | | 4,578,082 | | 3,953,479 |
| Total capital loss carryforwards | $ | 11,341,836 | $ | 18,207,732 | $ | 11,656,622 | $ | 14,411,614 |
176 | Annual Report
| | | | | | | | | |
| Franklin Tax-Free Trust | | | | |
| |
| Notes to Financial Statements (continued) | | | | | | | |
| |
| |
| 4. INCOME TAXES (continued) | | | | | | | | | |
| |
| | | Franklin | | | Franklin | | Franklin | | Franklin |
| | | Minnesota | | | Ohio | | Oregon | | Pennsylvania |
| | | Tax-Free | | | Tax-Free | | Tax-Free | | Tax-Free |
| | | Income Fund | | Income Fund | | Income Fund | | Income Fund |
| Capital loss carryforwards subject to | | | | | | | | | |
| expiration: | | | | | | | | | |
| 2015 | $ | 502,103 | $ | | — | $ | — | $ | — |
| 2016 | | — | | | — | | 422,791 | | — |
| 2017 | | 1,004,796 | | | 264,319 | | — | | — |
| 2018 | | 286,131 | | | — | | — | | 3,499,532 |
| Capital loss carryforwards not subject to | | | | | | | | | |
| expiration: | | | | | | | | | |
| Short term | | 5,994,818 | | 14,379,065 | | 11,873,446 | | 9,574,305 |
| Long term | | 4,606,565 | | 10,760,348 | | 9,576,419 | | 12,261,385 |
| Total capital loss carryforwards | $ | 12,394,413 | $ | 25,403,732 | $ | 21,872,656 | $ | 25,335,222 |
On February 28, 2014, the Franklin Arizona Tax-Free Income Fund had expired capital loss carryforwards of $2,638,564, which were reclassified to paid-in capital.
The tax character of distributions paid during the years ended February 28, 2014 and 2013, was as follows:
| | | | | | | | |
| | | Franklin Arizona | | Franklin Colorado |
| | | Tax-Free Income Fund | | Tax-Free Income Fund |
| | | 2014 | | 2013 | | 2014 | | 2013 |
| Distributions paid from tax exempt | | | | | | | | |
| income | $ | 40,945,239 | $ | 42,468,988 | $ | 28,042,544 | $ | 29,059,724 |
| |
| | | Franklin Connecticut | | Franklin Michigan |
| | | Tax-Free Income Fund | | Tax-Free Income Fund |
| | | 2014 | | 2013 | | 2014 | | 2013 |
| Distributions paid from tax exempt | | | | | | | | |
| income | $ | 15,943,799 | $ | 18,850,038 | $ | 47,029,921 | $ | 50,090,165 |
| |
| | | Franklin Minnesota | | Franklin Ohio |
| | | Tax-Free Income Fund | | Tax-Free Income Fund |
| | | 2014 | | 2013 | | 2014 | | 2013 |
| Distributions paid from tax exempt | | | | | | | | |
| income | $ | 33,812,814 | $ | 36,404,578 | $ | 57,711,788 | $ | 63,100,905 |
| |
| | | Franklin Oregon | | Franklin Pennsylvania |
| | | Tax-Free Income Fund | | Tax-Free Income Fund |
| | | 2014 | | 2013 | | 2014 | | 2013 |
| Distributions paid from tax exempt | | | | | | | | |
| income | $ | 47,110,645 | $ | 48,938,299 | $ | 57,003,670 | $ | 58,164,553 |
Annual Report | 177
Franklin Tax-Free Trust
Notes to Financial Statements (continued)
4. INCOME TAXES (continued)
At February 28, 2014, the cost of investments, net unrealized appreciation (depreciation) and undistributed tax exempt income for income tax purposes were as follows:
| | | | | | | | | | | | |
| | | Franklin | | | Franklin | | | Franklin | | | Franklin | |
| | | Arizona | | | Colorado | | | Connecticut | | | Michigan | |
| | | Tax-Free | | | Tax-Free | | | Tax-Free | | | Tax-Free | |
| | | Income Fund | | | Income Fund | | | Income Fund | | | Income Fund | |
| Cost of investments | $ | 913,070,508 | | $ | 633,659,408 | | $ | 379,399,811 | | $ | 1,080,294,593 | |
| |
| Unrealized appreciation | $ | 38,866,951 | | $ | 29,503,564 | | $ | 12,083,853 | | $ | 33,558,405 | |
| Unrealized depreciation | | (30,086,904 | ) | | (15,760,403 | ) | | (12,085,759 | ) | | (28,177,966 | ) |
| Net unrealized appreciation | | | | | | | | | | | | |
| (depreciation) | $ | 8,780,047 | | $ | 13,743,161 | | $ | (1,906 | ) | $ | 5,380,439 | |
| |
| Distributable earnings – | | | | | | | | | | | | |
| undistributed tax exempt | | | | | | | | | | | | |
| income | $ | 1,187,730 | | $ | 1,150,698 | | $ | 1,070,318 | | $ | 2,659,360 | |
| |
| | | Franklin | | | Franklin | | | Franklin | | | Franklin | |
| | | Minnesota | | | Ohio | | | Oregon | | | Pennsylvania | |
| | | Tax-Free | | | Tax-Free | | | Tax-Free | | | Tax-Free | |
| | | Income Fund | | | Income Fund | | | Income Fund | | | Income Fund | |
| Cost of investments | $ | 959,970,958 | | $ | 1,429,868,899 | | $ | 1,094,164,873 | | $ | 1,259,176,506 | |
| |
| Unrealized appreciation | $ | 55,481,078 | | $ | 57,156,760 | | $ | 56,567,567 | | $ | 54,224,487 | |
| Unrealized depreciation | | (5,613,593 | ) | | (20,440,888 | ) | | (34,467,646 | ) | | (42,590,806 | ) |
| Net unrealized appreciation | | | | | | | | | | | | |
| (depreciation) | $ | 49,867,485 | | $ | 36,715,872 | | $ | 22,099,921 | | $ | 11,633,681 | |
| |
| Distributable earnings – | | | | | | | | | | | | |
| undistributed tax exempt | | | | | | | | | | | | |
| income | $ | 839,697 | | $ | 4,371,907 | | $ | 2,682,822 | | $ | 2,787,721 | |
Differences between income and/or capital gains as determined on a book basis and a tax basis are primarily due to differing treatments of bond discounts and wash sales.
178 | Annual Report
Franklin Tax-Free Trust
Notes to Financial Statements (continued)
5. INVESTMENT TRANSACTIONS
Purchases and sales of investments (excluding short term securities) for the year ended February 28, 2014, were as follows:
| | | | | | | | |
| | | Franklin | | Franklin | | Franklin | | Franklin |
| | | Arizona | | Colorado | | Connecticut | | Michigan |
| | | Tax-Free | | Tax-Free | | Tax-Free | | Tax-Free |
| | | Income Fund | | Income Fund | | Income Fund | | Income Fund |
| Purchases | $ | 149,125,835 | $ | 56,864,704 | $ | 37,452,048 | $ | 114,253,718 |
| Sales | $ | 297,609,933 | $ | 192,876,628 | $ | 149,680,788 | $ | 278,912,489 |
| |
| | | Franklin | | Franklin | | Franklin | | Franklin |
| | | Minnesota | | Ohio | | Oregon | | Pennsylvania |
| | | Tax-Free | | Tax-Free | | Tax-Free | | Tax-Free |
| | | Income Fund | | Income Fund | | Income Fund | | Income Fund |
| Purchases | $ | 75,339,663 | $ | 144,435,845 | $ | 105,288,800 | $ | 101,350,214 |
| Sales | $ | 209,464,993 | $ | 447,126,725 | $ | 351,719,181 | $ | 320,754,128 |
6. CONCENTRATION OF RISK
Each of the Funds invests a large percentage of its total assets in obligations of issuers within its respective state and U.S. territories. Such concentration may subject the Funds to risks associated with industrial or regional matters, and economic, political or legal developments occurring within those states and U.S. territories. In addition, investments in these securities are sensitive to interest rate changes and credit risk of the issuer and may subject the funds to increased market volatility. The market for these investments may be limited, which may make them difficult to buy or sell.
7. CREDIT FACILITY
The Funds, together with other U.S. registered and foreign investment funds (collectively, Borrowers), managed by Franklin Templeton Investments, are borrowers in a joint syndicated senior unsecured credit facility totaling $1.5 billion (Global Credit Facility) which matures on February 13, 2015. This Global Credit Facility provides a source of funds to the Borrowers for temporary and emergency purposes, including the ability to meet future unanticipated or unusually large redemption requests.
Annual Report | 179
Franklin Tax-Free Trust
Notes to Financial Statements (continued)
7. CREDIT FACILITY (continued)
Under the terms of the Global Credit Facility, the Funds shall, in addition to interest charged on any borrowings made by the Funds and other costs incurred by the Funds, pay their share of fees and expenses incurred in connection with the implementation and maintenance of the Global Credit Facility, based upon their relative share of the aggregate net assets of all of the Borrowers, including an annual commitment fee of 0.07% based upon the unused portion of the Global Credit Facility. These fees are reflected in other expenses on the Statements of Operations. During the year ended February 28, 2014, the Funds did not use the Global Credit Facility.
8. FAIR VALUE MEASUREMENTS
The Funds follow a fair value hierarchy that distinguishes between market data obtained from independent sources (observable inputs) and the Funds’ own market assumptions (unobservable inputs). These inputs are used in determining the value of the Funds’ financial instruments and are summarized in the following fair value hierarchy:
- Level 1 – quoted prices in active markets for identical financial instruments
- Level 2 – other significant observable inputs (including quoted prices for similar financial instruments, interest rates, prepayment speed, credit risk, etc.)
- Level 3 – significant unobservable inputs (including the Funds’ own assumptions in determining the fair value of financial instruments)
The input levels are not necessarily an indication of the risk or liquidity associated with financial instruments at that level.
For movements between the levels within the fair value hierarchy, the Funds have adopted a policy of recognizing the transfers as of the date of the underlying event which caused the movement.
At February 28, 2014, all of the Funds’ investments in financial instruments carried at fair value were valued using Level 2 inputs.
9. NEW ACCOUNTING PRONOUNCEMENTS
In June 2013, the Financial Accounting Standards Board issued Accounting Standards Update (ASU) No. 2013-08, Investment Companies (Topic 946): Amendments to the Scope, Measurement, and Disclosure Requirements. The ASU modifies the criteria used in defining an investment company under U.S. Generally Accepted Accounting Principles and also sets forth certain measurement and disclosure requirements. Under the ASU, an entity that is registered under the 1940 Act automatically qualifies as an investment company. The ASU is effective for interim and annual reporting periods beginning after December 15, 2013. Management has reviewed the requirements and believes the adoption of this ASU will not have a material impact on the financial statements.
180 | Annual Report
Franklin Tax-Free Trust
Notes to Financial Statements (continued)
10. SUBSEQUENT EVENTS
The Funds have evaluated subsequent events through the issuance of the financial statements and determined that no events have occurred that require disclosure.
| | | |
| ABBREVIATIONS | | |
| |
| Selected Portfolio | | |
| |
| AGMC | - Assured Guaranty Municipal Corp. | IDAR | -IndustrialDevelopment Authority Revenue |
| AMBAC | - American Municipal Bond Assurance Corp. | IDR | -IndustrialDevelopment Revenue |
| BHAC | - Berkshire Hathaway Assurance Corp. | ISD | -IndependentSchool District |
| CDA | - Community Development Authority/Agency | MBS | - Mortgage-Backed Security |
| CIFG | - CDC IXIS Financial Guaranty | MFHR | -Multi-FamilyHousing Revenue |
| COP | - Certificate of Participation | MFR | -Multi-FamilyRevenue |
| EDA | - Economic Development Authority | NATL | - National Public Financial Guarantee Corp. |
| EDR | - Economic Development Revenue | NATL RE | - National Public Financial Guarantee Corp. |
| ETM | - Escrow to Maturity | | Reinsured |
| FGIC | -FinancialGuaranty Insurance Co. | PBA | -PublicBuilding Authority |
| FHA | - Federal Housing Authority/Agency | PCC | - Pollution Control Corp. |
| FICO | -FinancingCorp. | PCR | - Pollution Control Revenue |
| GNMA | - Government National Mortgage Association | PFAR | -PublicFinancing Authority Revenue |
| GO | -GeneralObligation | RDA | - Redevelopment Agency/Authority |
| HDA | -HousingDevelopment Authority/Agency | RDAR | - Redevelopment Agency Revenue |
| HFA | -HousingFinance Authority/Agency | SFM | -SingleFamily Mortgage |
| HFAR | -HousingFinance Authority Revenue | SFMR | -SingleFamily Mortgage Revenue |
| ID | - Improvement District | USD | -Unified/UnionSchool District |
| IDA | -IndustrialDevelopment Authority/Agency | XLCA | - XL Capital Assurance |
Annual Report | 181
Franklin Tax-Free Trust
Report of Independent Registered Public Accounting Firm
To the Board of Trustees and Shareholders of Franklin Tax-Free Trust
In our opinion, the accompanying statements of assets and liabilities, including the statements of investments, and the related statements of operations and of changes in net assets and the financial highlights present fairly, in all material respects, the financial position of Franklin Arizona Tax-Free Income Fund, Franklin Colorado Tax-Free Income Fund, Franklin Connecticut Tax-Free Income Fund, Franklin Michigan Tax-Free Income Fund, Franklin Minnesota Tax-Free Income Fund, Franklin Ohio Tax-Free Income Fund, Franklin Oregon Tax-Free Income Fund, and Franklin Pennsylvania Tax-Free Income Fund (separate portfolios of Franklin Tax-Free Trust, hereafter referred to as the “Funds”) at February 28, 2014, the results of each of their operations for the year then ended, the changes in each of their net assets for each of the two years in the period then ended and the financial highlights for each of the periods presented, in conformity with accounting principles generally accepted in the United States of America. These financial statements and financial highlights (hereafter referred to as “financial statements”) are the responsibility of the Funds’ management. Our responsibility is to express an opinion on these financial statements based on our audits. We conducted our audits of these financial statements in accordance with the standards of the Public Company Accounting Oversight Board (United States). Those standards require that we plan and perform the audit to obtain reasonable assurance about whether the financial statements are free of material misstatement. An audit includes examining, on a test basis, evidence supporting the amounts and disclosures in the financial statements, assessing the accounting principles used and significant estimates made by management, and evaluating the overall financial statement presentation.
We believe that our audits, which included confirmation of securities at February 28, 2014 by correspondence with the custodian and brokers, provide a reasonable basis for our opinion.
PricewaterhouseCoopers LLP
San Francisco, California
April 17, 2014
182 | Annual Report
Franklin Tax-Free Trust
Tax Information (unaudited)
Under Section 852(b)(5)(A) of the Internal Revenue Code, the Funds hereby report 100% of the distributions paid from net investment income as exempt-interest dividends for the fiscal year ended February 28, 2014. A portion of the Funds’ exempt-interest dividends may be subject to the federal alternative minimum tax. By mid-February 2015, shareholders will be notified of amounts for use in preparing their 2014 income tax returns.
Annual Report | 183
Franklin Tax-Free Trust
Board Members and Officers
The name, year of birth and address of the officers and board members, as well as their affiliations, positions held with the Trust, principal occupations during at least the past five years and number of portfolios overseen in the Franklin Templeton Investments fund complex are shown below. Generally, each board member serves until that person’s successor is elected and qualified.
| | | | |
| Independent Board Members | | | |
| |
| | | | Number of Portfolios in | |
| Name, Year of Birth | | Length of | Fund Complex Overseen | Other Directorships Held |
| and Address | Position | Time Served | by Board Member* | During at Least the Past 5 Years |
| Harris J. Ashton (1932) | Trustee | Since 1984 | 140 | Bar-S Foods (meat packing company) |
| One Franklin Parkway | | | | (1981-2010). |
| San Mateo, CA 94403-1906 | | | | |
| Principal Occupation During at Least the Past 5 Years: | | |
| Director of various companies; and formerly, Director, RBC Holdings, Inc. (bank holding company) (until 2002); and President, Chief |
| Executive Officer and Chairman of the Board, General Host Corporation (nursery and craft centers) (until 1998). |
| |
| Sam Ginn (1937) | Trustee | Since 2007 | 113 | ICO Global Communications |
| One Franklin Parkway | | | | (Holdings) Limited (satellite company) |
| San Mateo, CA 94403-1906 | | | | (2006-2010), Chevron Corporation |
| | | | | (global energy company) (1989-2009), |
| | | | | Hewlett-Packard Company (technology |
| | | | | company) (1996-2002), Safeway, Inc. |
| | | | | (grocery retailer) (1991-1998) and |
| | | | | TransAmerica Corporation (insurance |
| | | | | company) (1989-1999). |
| Principal Occupation During at Least the Past 5 Years: | | |
| Private investor; Chairman, First Responder Network Authority (FirstNet) (interoperable wireless broadband network) (2012); and formerly, |
| Chairman of the Board, Vodafone AirTouch, PLC (wireless company) (1999-2000); Chairman of the Board and Chief Executive Officer, |
| AirTouch Communications (cellular communications) (1993-1998) and Pacific Telesis Group (telephone holding company) (1988-1994). |
| |
| Edith E. Holiday (1952) | Trustee | Since 1998 | 140 | Hess Corporation (exploration and |
| One Franklin Parkway | | | | refining of oil and gas), H.J. Heinz |
| San Mateo, CA 94403-1906 | | | | Company (processed foods and |
| | | | | allied products) (1994-2013), RTI |
| | | | | International Metals, Inc. (manu- |
| | | | | facture and distribution of titanium), |
| | | | | Canadian National Railway (railroad) |
| | | | | and White Mountains Insurance |
| | | | | Group, Ltd. (holding company). |
| Principal Occupation During at Least the Past 5 Years: | | |
| Director or Trustee of various companies and trusts; and formerly, Assistant to the President of the United States and Secretary of the |
| Cabinet (1990-1993); General Counsel to the United States Treasury Department (1989-1990); and Counselor to the Secretary and Assistant |
| Secretary for Public Affairs and Public Liaison – United States Treasury Department (1988-1989). | |
| |
| J. Michael Luttig (1954) | Trustee | Since 2009 | 140 | Boeing Capital Corporation (aircraft |
| One Franklin Parkway | | | | financing) (2006-2013). |
| San Mateo, CA 94403-1906 | | | | |
| Principal Occupation During at Least the Past 5 Years: | | |
| Executive Vice President, General Counsel and member of Executive Council, The Boeing Company (aerospace company); and formerly, |
| Federal Appeals Court Judge, U.S. Court of Appeals for the Fourth Circuit (1991-2006). | |
| |
| 184 | Annual Report | | | | |
| | | | |
| | | | Number of Portfolios in | |
| Name, Year of Birth | | Length of | Fund Complex Overseen | Other Directorships Held |
| and Address | Position | Time Served | by Board Member* | During at Least the Past 5 Years |
| Frank A. Olson (1932) | Trustee | Since 2005 | 140 | Hess Corporation (exploration and |
| One Franklin Parkway | | | | refining of oil and gas) (1998-2013). |
| San Mateo, CA 94403-1906 | | | | |
| Principal Occupation During at Least the Past 5 Years: | | |
| Chairman Emeritus, The Hertz Corporation (car rental) (since 2000) (Chairman of the Board (1980-2000) and Chief Executive Officer |
| (1977-1999)); and formerly, Chairman of the Board, President and Chief Executive Officer, UAL Corporation (airlines) (until 1987). |
| |
| Larry D. Thompson (1945) | Trustee | Since 2007 | 140 | Cbeyond, Inc. (business commu- |
| One Franklin Parkway | | | | nications provider) (2010-2012), The |
| San Mateo, CA 94403-1906 | | | | Southern Company (energy company) |
| | | | | (2010-2012) and Graham Holdings |
| | | | | Company (formerly, The Washington |
| | | | | Post Company) (education and media |
| | | | | organization). |
| Principal Occupation During at Least the Past 5 Years: | | |
| Executive Vice President – Government Affairs, General Counsel and Corporate Secretary, PepsiCo, Inc. (consumer products) (July 2012); |
| and formerly, John A. Sibley Professor of Corporate and Business Law, University of Georgia School of Law (2011-2012); Senior Vice |
| President – Government Affairs, General Counsel and Secretary, PepsiCo, Inc. (2004-2011); Senior Fellow of The Brookings Institution |
| (2003-2004); Visiting Professor, University of Georgia School of Law (2004); and Deputy Attorney General, U.S. Department of Justice |
| (2001-2003). | | | | |
| |
| John B. Wilson (1959) | Lead | Trustee since | 113 | None |
| One Franklin Parkway | Independent | 2007 and Lead | | |
| San Mateo, CA 94403-1906 | Trustee | Independent | | |
| | | Trustee since | | |
| | | 2008 | | |
| Principal Occupation During at Least the Past 5 Years: | | |
| President, Staples Europe (office supplies) (2012); President and Founder, Hyannis Port Capital, Inc. (real estate and private equity investing); |
| serves on private and non-profit boards; and formerly, Chief Operating Officer and Executive Vice President, Gap, Inc. (retail) (1996-2000); |
| Chief Financial Officer and Executive Vice President – Finance and Strategy, Staples, Inc. (1992-1996); Senior Vice President – Corporate |
| Planning, Northwest Airlines, Inc. (airlines) (1990-1992); and Vice President and Partner, Bain & Company (consulting firm) (1986-1990). |
| |
| |
| Interested Board Members and Officers | | |
| |
| | | | Number of Portfolios in | |
| Name, Year of Birth | | Length of | Fund Complex Overseen | Other Directorships Held |
| and Address | Position | Time Served | by Board Member* | During at Least the Past 5 Years |
| **Gregory E. Johnson (1961) | Trustee | Since 2007 | 150 | None |
| One Franklin Parkway | | | | |
| San Mateo, CA 94403-1906 | | | | |
| Principal Occupation During at Least the Past 5 Years: | | |
| Chairman of the Board, Member – Office of the Chairman, Director, President and Chief Executive Officer, Franklin Resources, Inc.; officer |
| and/or director or trustee, as the case may be, of some of the other subsidiaries of Franklin Resources, Inc. and of 44 of the investment |
| companies in Franklin Templeton Investments; and Chairman, Investment Company Institute. | |
Annual Report | 185
| | | | |
| | | | Number of Portfolios in | |
| Name, Year of Birth | | Length of | Fund Complex Overseen | Other Directorships Held |
| and Address | Position | Time Served | by Board Member* | During at Least the Past 5 Years |
| **Rupert H. Johnson, Jr. (1940) | Chairman of | Chairman of the | 140 | None |
| One Franklin Parkway | the Board and | Board and Trustee | | |
| San Mateo, CA 94403-1906 | Trustee | since June 2013 | | |
| Principal Occupation During at Least the Past 5 Years: | | |
| Vice Chairman, Member – Office of the Chairman and Director, Franklin Resources, Inc.; Director, Franklin Advisers, Inc.; Senior Vice |
| President, Franklin Advisory Services, LLC; and officer and/or director or trustee, as the case may be, of some of the other subsidiaries of |
| Franklin Resources, Inc. and of 41 of the investment companies in Franklin Templeton Investments. | |
| |
| Sheila Amoroso (1959) | Vice President | Since 1999 | Not Applicable | Not Applicable |
| One Franklin Parkway | | | | |
| San Mateo, CA 94403-1906 | | | | |
| Principal Occupation During at Least the Past 5 Years: | | |
| Senior Vice President, Franklin Advisers, Inc.; and officer of seven of the investment companies in Franklin Templeton Investments. |
| |
| Alison E. Baur (1964) | Vice President | Since 2012 | Not Applicable | Not Applicable |
| One Franklin Parkway | | | | |
| San Mateo, CA 94403-1906 | | | | |
| Principal Occupation During at Least the Past 5 Years: | | |
| Deputy General Counsel, Franklin Templeton Investments; and officer of some of the other subsidiaries of Franklin Resources, Inc. and of 46 |
| of the investment companies in Franklin Templeton Investments. | | |
| |
| Rafael R. Costas, Jr. (1965) | Vice President | Since 1999 | Not Applicable | Not Applicable |
| One Franklin Parkway | | | | |
| San Mateo, CA 94403-1906 | | | | |
| Principal Occupation During at Least the Past 5 Years: | | |
| Senior Vice President, Franklin Advisers, Inc.; and officer of seven of the investment companies in Franklin Templeton Investments. |
| |
| Laura F. Fergerson (1962) | Chief | Since 2009 | Not Applicable | Not Applicable |
| One Franklin Parkway | Executive | | | |
| San Mateo, CA 94403-1906 | Officer – | | | |
| | Finance and | | | |
| | Administration | | | |
| Principal Occupation During at Least the Past 5 Years: | | |
| Senior Vice President, Franklin Templeton Services, LLC; and officer of 46 of the investment companies in Franklin Templeton Investments. |
| |
| Gaston Gardey (1967) | Treasurer, | Since 2009 | Not Applicable | Not Applicable |
| One Franklin Parkway | Chief Financial | | | |
| San Mateo, CA 94403-1906 | Officer and | | | |
| | Chief | | | |
| | Accounting | | | |
| | Officer | | | |
| Principal Occupation During at Least the Past 5 Years: | | |
| Director, Fund Accounting, Franklin Templeton Investments; and officer of 27 of the investment companies in Franklin Templeton Investments. |
186 | Annual Report
| | | | |
| | | | Number of Portfolios in | |
| Name, Year of Birth | | Length of | Fund Complex Overseen | Other Directorships Held |
| and Address | Position | Time Served | by Board Member* | During at Least the Past 5 Years |
| Aliya S. Gordon (1973) | Vice President | Since 2009 | Not Applicable | Not Applicable |
| One Franklin Parkway | | | | |
| San Mateo, CA 94403-1906 | | | | |
| Principal Occupation During at Least the Past 5 Years: | | |
| Senior Associate General Counsel, Franklin Templeton Investments; officer of 46 of the investment companies in Franklin Templeton |
| Investments; and formerly, Litigation Associate, Steefel, Levitt & Weiss, LLP (2000-2004). | |
| |
| Steven J. Gray (1955) | Vice President | Since 2009 | Not Applicable | Not Applicable |
| One Franklin Parkway | | | | |
| San Mateo, CA 94403-1906 | | | | |
| Principal Occupation During at Least the Past 5 Years: | | |
| Senior Associate General Counsel, Franklin Templeton Investments; Vice President, Franklin Templeton Distributors, Inc. and Franklin |
| Alternative Strategies Advisers, LLC; and officer of 46 of the investment companies in Franklin Templeton Investments. |
| |
| Selena L. Holmes (1965) | Vice President | Since 2012 | Not Applicable | Not Applicable |
| 100 Fountain Parkway | – AML | | | |
| St. Petersburg, FL 33716-1205 | Compliance | | | |
| Principal Occupation During at Least the Past 5 Years: | | |
| Director, Global Compliance Monitoring; Deputy Chief Compliance Officer, Franklin Alternative Strategies Advisers, LLC; and officer of 46 of |
| the investment companies in Franklin Templeton Investments. | | |
| |
| Christopher J. Molumphy (1962) | President and | Since 2010 | Not Applicable | Not Applicable |
| One Franklin Parkway | Chief | | | |
| San Mateo, CA 94403-1906 | Executive | | | |
| | Officer – | | | |
| | Investment | | | |
| | Management | | | |
| Principal Occupation During at Least the Past 5 Years: | | |
| Director and Executive Vice President, Franklin Advisers, Inc.; Executive Vice President, Franklin Templeton Institutional, LLC; and officer of |
| some of the other subsidiaries of Franklin Resources, Inc. and of 22 of the investment companies in Franklin Templeton Investments. |
| |
| Kimberly H. Novotny (1972) | Vice President | Since 2013 | Not Applicable | Not Applicable |
| 300 S.E. 2nd Street | | | | |
| Fort Lauderdale, FL 33301-1923 | | | | |
| Principal Occupation During at Least the Past 5 Years: | | |
| Associate General Counsel, Franklin Templeton Investments; Vice President and Secretary, Fiduciary Trust International of the South; Vice |
| President, Templeton Investment Counsel, LLC; Assistant Secretary, Franklin Resources, Inc.; and officer of 46 of the investment companies |
| in Franklin Templeton Investments. | | | |
| |
| Robert C. Rosselot (1960) | Chief | Since 2013 | Not Applicable | Not Applicable |
| 300 S.E. 2nd Street | Compliance | | | |
| Fort Lauderdale, FL 33301-1923 | Officer | | | |
| Principal Occupation During at Least the Past 5 Years: | | |
| Director, Global Compliance, Franklin Templeton Investments; Vice President, Franklin Templeton Companies, LLC; officer of 46 of the invest- |
| ment companies in Franklin Templeton Investments; and formerly, Senior Associate General Counsel, Franklin Templeton Investments |
| (2007-2013); and Secretary and Vice President, Templeton Group of Funds (2004-2013). | |
Annual Report | 187
| | | | |
| | | | Number of Portfolios in | |
| Name, Year of Birth | | Length of | Fund Complex Overseen | Other Directorships Held |
| and Address | Position | Time Served | by Board Member* | During at Least the Past 5 Years |
| Karen L. Skidmore (1952) | Vice President | Since 2006 | Not Applicable | Not Applicable |
| One Franklin Parkway | and Secretary | | | |
| San Mateo, CA 94403-1906 | | | | |
| Principal Occupation During at Least the Past 5 Years: | | |
| Senior Associate General Counsel, Franklin Templeton Investments; and officer of 46 of the investment companies in Franklin |
| Templeton Investments. | | | | |
| |
| Craig S. Tyle (1960) | Vice President | Since 2005 | Not Applicable | Not Applicable |
| One Franklin Parkway | | | | |
| San Mateo, CA 94403-1906 | | | | |
| Principal Occupation During at Least the Past 5 Years: | | |
| General Counsel and Executive Vice President, Franklin Resources, Inc.; and officer of some of the other subsidiaries of Franklin Resources, |
| Inc. and of 46 of the investment companies in Franklin Templeton Investments. | |
| |
| Thomas Walsh (1961) | Vice President | Since 1999 | Not Applicable | Not Applicable |
| One Franklin Parkway | | | | |
| San Mateo, CA 94403-1906 | | | | |
| Principal Occupation During at Least the Past 5 Years: | | |
| Senior Vice President, Franklin Advisers, Inc.; and officer of seven of the investment companies in Franklin Templeton Investments. |
| |
| Lori A. Weber (1964) | Vice President | Since 2011 | Not Applicable | Not Applicable |
| 300 S.E. 2nd Street | | | | |
| Fort Lauderdale, FL 33301-1923 | | | | |
| Principal Occupation During at Least the Past 5 Years: | | |
| Senior Associate General Counsel, Franklin Templeton Investments; Assistant Secretary, Franklin Resources, Inc.; Vice President and |
| Secretary, Templeton Investment Counsel, LLC; Vice President, Fiduciary Trust International of the South; and officer of 46 of the investment |
| companies in Franklin Templeton Investments. | | | |
*We base the number of portfolios on each separate series of the U.S. registered investment companies within the Franklin Templeton Investments fund complex. These portfolios
have a common investment manager or affiliated investment managers.
**Gregory E. Johnson is considered to be an interested person of the Fund under the federal securities laws due to his position as an officer and director of Franklin Resources, Inc.
(Resources), which is the parent company of the Fund’s investment manager and distributor. Rupert H. Johnson, Jr. is considered to be an interested person of the Fund under the
federal securities laws due to his position as officer and director and major shareholder of Resources.
Note 1: Rupert H. Johnson, Jr. is the uncle of Gregory E. Johnson.
Note 2: Officer information is current as of the date of this report. It is possible that after this date, information about officers may change.
Note 3: Effective June 13, 2013, Charles B. Johnson ceased to be a trustee of the Fund.
The Sarbanes-Oxley Act of 2002 and Rules adopted by the Securities and Exchange Commission require the Fund to disclose whether the Fund’s Audit Committee includes
at least one member who is an audit committee financial expert within the meaning of such Act and Rules. The Fund’s Board has determined that there is at least one such
financial expert on the Audit Committee and has designated John B. Wilson as its audit committee financial expert. The Board believes that Mr. Wilson qualifies as such an
expert in view of his extensive business background and experience, including service as chief financial officer of Staples, Inc. from 1992 to 1996. Mr. Wilson has been a
Member and Chairman of the Fund’s Audit Committee since 2007. As a result of such background and experience, the Board believes that Mr. Wilson has acquired an under-
standing of generally accepted accounting principles and financial statements, the general application of such principles in connection with the accounting estimates,
accruals and reserves, and analyzing and evaluating financial statements that present a breadth and level of complexity of accounting issues generally comparable to those
of the Fund, as well as an understanding of internal controls and procedures for financial reporting and an understanding of audit committee functions. Mr. Wilson is an
independent Board member as that term is defined under the relevant Securities and Exchange Commission Rules and Releases.
The Statement of Additional Information (SAI) includes additional information about the board members and is available, without charge, upon request. Shareholders may
call (800) DIAL BEN/342-5236 to request the SAI.
188 | Annual Report
Franklin Tax-Free Trust
Shareholder Information
Board Review of Investment Management Agreement
At a meeting held February 25, 2014, the Board of Trustees (Board), including a majority of non-interested or independent Trustees, approved renewal of the investment management agreement for each of the separate tax-exempt funds within the Trust (Fund(s)). In reaching this decision, the Board took into account information furnished throughout the year at regular Board meetings, as well as information prepared specifically in connection with the annual renewal review process. Information furnished and discussed throughout the year included investment performance reports and related financial information for each Fund, along with periodic reports on expenses, shareholder services, legal and compliance matters, pricing, and other services provided by the Investment Manager (Manager) and its affiliates. Information furnished specifically in connection with the renewal process included a report for each Fund prepared by Lipper, Inc. (Lipper), an independent organization, as well as additional material, including a Fund profitability analysis prepared by management. The Lipper reports compared each Fund’s investment performance and expenses with those of other mutual funds deemed comparable to the Fund as selected by Lipper. The Fund profitability analysis discussed the profitability to Franklin Templeton Investments from its overall U.S. fund operations, as well as on an individual fund-by-fund basis. Additional material accompanying such profitability analysis included information on a fund-by-fund basis listing portfolio managers and other accounts they manage, as well as information on management fees charged by the Manager and its affiliates to U.S. mutual funds and other accounts, including management’s explanation of differences where relevant. Such material also included a memorandum prepared by management describing project initiatives and capital investments relating to the services provided to the Funds by the Franklin Templeton Investments organization, as well as a memorandum relating to economies of scale and an analysis concerning transfer agent fees charged by an affiliate of the Manager.
In considering such materials, the independent Trustees received assistance and advice from and met separately with independent counsel. While the investment management agreements for all Funds were considered at the same Board meeting, the Board dealt with each Fund separately. In approving continuance of the investment management agreement for each Fund, the Board, including a majority of independent Trustees, determined that the existing management fee structure was fair and reasonable and that continuance of the investment management agreement was in the best interests of each Fund and its shareholders. While attention was given to all information furnished, the following discusses some primary factors relevant to the Board’s decision.
NATURE, EXTENT AND QUALITY OF SERVICES. The Board was satisfied with the nature and quality of the overall services provided by the Manager and its affiliates to the Funds and their shareholders. In addition to investment performance and expenses discussed later, the Board’s opinion was based, in part, upon periodic reports furnished it showing that the investment policies and restrictions for each Fund were consistently complied with as well as other reports periodically furnished the Board covering matters such as the compliance of portfolio managers and other management personnel with the code of ethics adopted throughout the Franklin Templeton fund
Annual Report | 189
Franklin Tax-Free Trust
Shareholder Information (continued)
Board Review of Investment Management Agreement (continued)
complex, the adherence to fair value pricing procedures established by the Board, and the accuracy of net asset value calculations. The Board also noted the extent of benefits provided Fund shareholders from being part of the Franklin Templeton family of funds, including the right to exchange investments between the same class of funds without a sales charge, the ability to reinvest Fund dividends into other funds and the right to combine holdings in other funds to obtain a reduced sales charge. Favorable consideration was given to management’s continuous efforts and expenditures in establishing back-up systems and recovery procedures to function in the event of a natural disaster, it being noted that such systems and procedures had functioned well during the Florida hurricanes and blackouts experienced in previous years and that those operations in the New York/ New Jersey area ran smoothly during the period of the 2012 Hurricane Sandy. Consideration was also given to the experience of each Fund’s portfolio management team, the number of accounts managed and general method of compensation. In this latter respect, the Board noted that a primary factor in management’s determination of a portfolio manager’s bonus compensation was the relative investment performance of the funds he or she managed and that a portion of such bonus was required to be invested in a predesignated list of funds within such person’s fund management area so as to be aligned with the interests of shareholders. The Board also took into account the quality of transfer agent and shareholder services provided Fund shareholders by an affiliate of the Manager and the continuous enhancements to the Franklin Templeton website. Particular attention was given to management’s conservative approach and diligent risk management procedures, including continuous monitoring of counterparty credit risk and attention given to derivatives and other complex instruments. The Board also took into account, among other things, management’s efforts in establishing a global credit facility for the benefit of the Funds and other accounts managed by Franklin Templeton Investments to provide a source of cash for temporary and emergency purposes or to meet unusual redemption requests as well as the strong financial position of the Manager’s parent company and its commitment to the mutual fund business as evidenced by its subsidization of money market funds.
INVESTMENT PERFORMANCE. The Board placed significant emphasis on the investment performance of each Fund in view of its importance to shareholders. While consideration was given to performance reports and discussions with portfolio managers at Board meetings throughout the year, particular attention in assessing performance was given to the Lipper reports furnished for the agreement renewals. The Lipper reports prepared for each individual Fund showed its investment performance, or those of its Class A shares for Funds having multiple share classes, in comparison to a performance universe selected by Lipper. Comparative performance for each Fund was shown for the one-year period ended December 31, 2013, and for additional periods ended that date up to 10 years depending on when a particular Fund commenced operations. The Lipper report showed the income return for each Fund to be above the median of its Lipper performance universe for 2013, as well as for the previous three-, five- and 10-year periods on an annualized basis, with most being in the highest or second-highest performing quintile during all such periods. The Lipper
190 | Annual Report
Franklin Tax-Free Trust
Shareholder Information (continued)
Board Review of Investment Management Agreement (continued)
report showed the total returns of a majority of the Funds to be below the medians of their respective Lipper performance universes in 2013, but on an annualized basis, the total returns of all the Funds were at or above the medians of their Lipper performance universes for the 10-year period, with the majority being at or above the middle performing quintile of their respective performance universes for the previous three- and five-year periods as well. The Board was satisfied with the overall performance of these Funds, noting their income oriented objective.
COMPARATIVE EXPENSES. Consideration was given to the management fee and total expense ratio of each Fund in comparison with those of a group of funds selected by Lipper as its appropriate Lipper expense group. Lipper expense data is based upon information taken from each fund’s most recent annual report, which reflects historical asset levels that may be quite different from those currently existing, particularly in a period of market volatility. While recognizing such inherent limitation and the fact that expense ratios generally increase as assets decline and decrease as assets grow, the Board believed the independent analysis conducted by Lipper to be an appropriate measure of comparative expenses. In reviewing comparative costs, Lipper provides information on each Fund’s contractual investment management fee in comparison with the contractual investment management fee that would have been charged by other funds within its Lipper expense group assuming they were similar in size to the Fund, as well as the actual total expenses of the Fund in comparison with those of its Lipper expense group. The Lipper contractual investment management fee analysis includes an administrative charge as being part of the investment management fee, and total expenses, for comparative consistency, are shown by Lipper for Fund Class A shares for Funds having multiple share classes. The Lipper reports showed that the contractual investment management fee rates for each Fund were at or below the medians of their respective Lipper expense groups. The Lipper reports further showed that the actual total expense ratios for all Funds were below the medians of their respective Lipper expense groups, with each being in the least expensive quintile of such group. Based on the above, the Board was satisfied with the investment management fee and total expense ratio of each Fund in comparison to its Lipper expense group as shown in the Lipper reports.
MANAGEMENT PROFITABILITY. The Board also considered the level of profits realized by the Manager and its affiliates in connection with the operation of each Fund. In this respect, the Board reviewed the Fund profitability analysis that addresses the overall profitability of Franklin Templeton’s U.S. fund business, as well as its profits in providing management and other services to each of the individual funds during the 12-month period ended September 30, 2013, being the most recent fiscal year-end for Franklin Resources, Inc., the Manager’s parent. In reviewing the analysis, the Board recognized that allocation methodologies are inherently subjective and various allocation methodologies may be reasonable while producing different results. In this respect, the Board noted that while management continuously makes refinements to its methodologies in response to organizational and product related changes, the overall approach as defined by the primary drivers and activity measurements has remained consistent with that used in the Funds’ profitability report presentations from prior years. Additionally, the Funds’ independent registered
Annual Report | 191
Franklin Tax-Free Trust
Shareholder Information (continued)
Board Review of Investment Management Agreement (continued)
public accounting firm had been engaged by the Manager to periodically review the reasonableness of the allocation methodologies to be used solely by the Funds’ Board in reference to the profitability analysis. In reviewing and discussing such analysis, management discussed with the Board its belief that costs incurred in establishing the infrastructure necessary for the type of mutual fund operations conducted by the Manager and its affiliates may not be fully reflected in the expenses allocated to each Fund in determining its profitability, as well as the fact that the level of profits, to a certain extent, reflected operational cost savings and efficiencies initiated by management. The Board also took into account management’s expenditures in improving shareholder services provided the Funds, as well as the need to implement systems and meet additional regulatory and compliance requirements resulting from statutes such as the Sarbanes-Oxley and Dodd-Frank Acts and recent SEC and other regulatory requirements. In addition, the Board considered a third-party study comparing the profitability of the Manager’s parent on an overall basis to other publicly held managers broken down to show profitability from management operations exclusive of distribution expenses, as well as profitability including distribution expenses. The Board also considered the extent to which the Manager and its affiliates might derive ancillary benefits from fund operations, including revenues generated from transfer agent services. Based upon its consideration of all these factors, the Board determined that the level of profits realized by the Manager and its affiliates from providing services to each Fund was not excessive in view of the nature, quality and extent of services provided.
ECONOMIES OF SCALE. The Board also considered whether economies of scale are realized by the Manager as the Funds grow larger and the extent to which this is reflected in the level of management fees charged. While recognizing any precise determination is inherently subjective, the Board noted that based upon the Fund profitability analysis, it appears that as some Funds get larger, at some point economies of scale do result in the Manager realizing a larger profit margin on management services provided such Fund. The Board also noted that any economies of scale are shared with each of these Funds and their shareholders through management fee breakpoints existing in each of the Fund’s investment management agreements, so that as a Fund grows in size, its effective management fee rate declines. The fee structure under the investment management agreement with each Fund provides an initial fee of 0.625% on the first $100 million of assets; 0.5% on the next $150 million of assets; 0.45% on assets in excess of $250 million; with additional breakpoints beginning at 0.44% on assets in excess of $7.5 billion; 0.43% on assets in excess of $10 billion and continuing thereafter until reaching a final breakpoint of 0.36% on assets in excess of $20 billion. In reviewing such structure, management stated its belief that this fee structure reaches a relatively low rate quickly as a Fund grows and that such low rate, in effect, reflects anticipated economies of scale as a Fund’s assets increase and pointed out the favorable contractual management fee and total expense comparisons for each Fund within its Lipper expense group as discussed under “Comparative Expenses.” The Board observed that at December 31, 2013, none of these Funds had assets in excess of $8 billion and believed that to the extent economies of scale may be realized by the Manager and its affiliates, the schedule of fees under the investment management agreement for each such Fund provides a sharing of benefits with the Fund and its shareholders.
192 | Annual Report
Franklin Tax-Free Trust
Shareholder Information (continued)
Proxy Voting Policies and Procedures
The Trust’s investment manager has established Proxy Voting Policies and Procedures (Policies) that the Trust uses to determine how to vote proxies relating to portfolio securities. Shareholders may view the Trust’s complete Policies online at franklintempleton.com. Alternatively, shareholders may request copies of the Policies free of charge by calling the Proxy Group collect at (954) 527-7678 or by sending a written request to: Franklin Templeton Companies, LLC, 300 S.E. 2nd Street, Fort Lauderdale, FL 33301, Attention: Proxy Group. Copies of the Trust’s proxy voting records are also made available online at franklintempleton.com and posted on the U.S. Securities and Exchange Commission’s website at sec.gov and reflect the most recent 12-month period ended June 30.
Quarterly Statement of Investments
The Trust files a complete statement of investments with the U.S. Securities and Exchange Commission for the first and third quarters for each fiscal year on Form N-Q. Shareholders may view the filed Form N-Q by visiting the Commission’s website at sec.gov. The filed form may also be viewed and copied at the Commission’s Public Reference Room in Washington, DC. Information regarding the operations of the Public Reference Room may be obtained by calling (800) SEC-0330.
Householding of Reports and Prospectuses
You will receive each Fund’s financial reports every six months as well as an annual updated summary prospectus (prospectus available upon request). To reduce Fund expenses, we try to identify related shareholders in a household and send only one copy of the financial reports and summary prospectus. This process, called “householding,” will continue indefinitely unless you instruct us otherwise. If you prefer not to have these documents householded, please call us at (800) 632-2301. At any time you may view current prospectuses/summary prospectuses and financial reports on our website. If you choose, you may receive these documents through electronic delivery.
Annual Report | 193
This page intentionally left blank.
This page intentionally left blank.
This page intentionally left blank.
Item 2. Code of Ethics.
(a) The Registrant has adopted a code of ethics that applies to its principal executive officers and principal financial and accounting officer.
(c) N/A
(d) N/A
(f) Pursuant to Item 12(a)(1), the Registrant is attaching as an exhibit a copy of its code of ethics that applies to its principal executive officers and principal financial and accounting officer.
Item 3. Audit Committee Financial Expert.
(a)(1) The Registrant has an audit committee financial expert serving on its audit committee.
(2) The audit committee financial expert is John B. Wilson, and he is "independent" as defined under the relevant Securities and Exchange Commission Rules and Releases.
Item 4. Principal Accountant Fees and Services.
(a) Audit Fees
The aggregate fees paid to the principal accountant for professional services rendered by the principal accountant for the audit of the registrant’s annual financial statements or for services that are normally provided by the principal accountant in connection with statutory and regulatory filings or engagements were $823,994 for the fiscal year ended February 28, 2014 and $872,267 for the fiscal year ended February 28, 2013.
(b) Audit-Related Fees
There were no fees paid to the principal accountant for assurance and related services rendered by the principal accountant to the registrant that are reasonably related to the performance of the audit of the registrant's financial statements and are not reported under paragraph (a) of Item 4.
There were no fees paid to the principal accountant for assurance and related services rendered by the principal accountant to the registrant's investment adviser and any entity controlling, controlled by or under common control with the investment adviser that provides ongoing services to the registrant that are reasonably related to the performance of the audit of their financial statements.
(c) Tax Fees
There were no fees paid to the principal accountant for professional services rendered by the principal accountant to the registrant for tax compliance, tax advice and tax planning.
The aggregate fees paid to the principal accountant for professional services rendered by the principal accountant to the registrant’s investment adviser and any entity controlling, controlled by or under common control with the investment adviser that provides ongoing services to the registrant for tax compliance, tax advice and tax planning were $6,930 for the fiscal year ended February 28, 2014 and $4,600 for the fiscal year ended February 28, 2013. The services for which these fees were paid included technical tax consultation for capital gain tax reporting to foreign governments and requirements on local country’s self certification forms.
(d) All Other Fees
The aggregate fees paid to the principal accountant for products and services rendered by the principal accountant to the registrant not reported in paragraphs (a)-(c) of Item 4 were $0 for the fiscal year ended February 28, 2014 and $12,167 for the fiscal year ended February 28, 2013. The services for which these fees were paid included review of materials provided to the fund Board in connection with the investment management contract renewal process.
The aggregate fees paid to the principal accountant for products and services rendered by the principal accountant to the registrant’s investment adviser and any entity controlling, controlled by or under common control with the investment adviser that provides ongoing services to the registrant other than services reported in paragraphs (a)-(c) of Item 4 were $39,194 for the fiscal year ended February 28, 2014 and $140,283 for the fiscal year ended February 28, 2013. The services for which these fees were paid included preparation and review of materials provided to the fund Board in connection with the investment management contract renewal process.
(e) (1) The registrant’s audit committee is directly responsible for approving the services to be provided by the auditors, including:
(i) pre-approval of all audit and audit related services;
(ii) pre-approval of all non-audit related services to be provided to the Fund by the auditors;
(iii) pre-approval of all non-audit related services to be provided to the registrant by the auditors to the registrant’s investment adviser or to any entity that controls, is controlled by or is under common control with the registrant’s investment adviser and that provides ongoing services to the registrant where the non-audit services relate directly to the operations or financial reporting of the registrant; and
(iv) establishment by the audit committee, if deemed necessary or appropriate, as an alternative to committee pre-approval of services to be provided by the auditors, as required by paragraphs (ii) and (iii) above, of policies and procedures to permit such services to be pre-approved by other means, such as through establishment of guidelines or by action of a designated member or members of the committee; provided the policies and procedures are detailed as to the particular service and the committee is informed of each service and such policies and procedures do not include delegation of audit committee responsibilities, as contemplated under the Securities Exchange Act of 1934, to management; subject, in the case of (ii) through (iv), to any waivers, exceptions or exemptions that may be available under applicable law or rules.
(e) (2) None of the services provided to the registrant described in paragraphs (b)-(d) of Item 4 were approved by the audit committee pursuant to paragraph (c)(7)(i)(C) of Rule 2-01 of regulation S-X.
(f) No disclosures are required by this Item 4(f).
(g) The aggregate non-audit fees paid to the principal accountant for services rendered by the principal accountant to the registrant and the registrant’s investment adviser and any entity controlling, controlled by or under common control with the investment adviser that provides ongoing services to the registrant were $46,124 for the fiscal year ended February 28, 2014 and $157,050 for the fiscal year ended February 28, 2013.
(h) The registrant’s audit committee of the board has considered whether the provision of non-audit services that were rendered to the registrant’s investment adviser (not including any sub-adviser whose role is primarily portfolio management and is subcontracted with or overseen by another investment adviser), and any entity controlling, controlled by, or under common control with the investment adviser that provides ongoing services to the registrant that were not pre-approved pursuant to paragraph (c)(7)(ii) of Rule 2-01 of Regulation S-X is compatible with maintaining the principal accountant’s independence.
Item 5. Audit Committee of Listed Registrants. N/A
Item 6. Schedule of Investments. N/A
Item 7. Disclosure of Proxy Voting Policies and Procedures for Closed-End Management Investment Companies. N/A
Item 8. Portfolio Managers of Closed-End Management Investment Companies. N/A
Item 9. Purchases of Equity Securities by Closed-End Management Investment Company and Affiliated Purchasers. N/A
Item 10. Submission of Matters to a Vote of Security Holders.
There have been no changes to the procedures by which shareholders may recommend nominees to the Registrant's Board of Trustees that would require disclosure herein.
Item 11. Controls and Procedures.
(a) Evaluation of Disclosure Controls and Procedures. The Registrant maintains disclosure controls and procedures that are designed to ensure that information required to be disclosed in the Registrant’s filings under the Securities Exchange Act of 1934 and the Investment Company Act of 1940 is recorded, processed, summarized and reported within the periods specified in the rules and forms of the Securities and Exchange Commission. Such information is accumulated and communicated to the Registrant’s management, including its principal executive officer and principal financial officer, as appropriate, to allow timely decisions regarding required disclosure. The Registrant’s management, including the principal executive officer and the principal financial officer, recognizes that any set of controls and procedures, no matter how well designed and operated, can provide only reasonable assurance of achieving the desired control objectives.
Within 90 days prior to the filing date of this Shareholder Report on Form N-CSR, the Registrant had carried out an evaluation, under the supervision and with the participation of the Registrant’s management, including the Registrant’s principal executive officer and the Registrant’s principal financial officer, of the effectiveness of the design and operation of the Registrant’s disclosure controls and procedures. Based on such evaluation, the Registrant’s principal executive officer and principal financial officer concluded that the Registrant’s disclosure controls and procedures are effective.
(b) Changes in Internal Controls. There have been no changes in the Registrant’s internal controls or in other factors that could materially affect the internal controls over financial reporting subsequent to the date of their evaluation in connection with the preparation of this Shareholder Report on Form N-CSR.
Item 12. Exhibits.
(a)(1) Code of Ethics
(a)(2) Certifications pursuant to Section 302 of the Sarbanes-Oxley Act of 2002 of Laura F. Fergerson, Chief Executive Officer - Finance and Administration, and Gaston Gardey, Chief Financial Officer and Chief Accounting Officer
(b) Certifications pursuant to Section 906 of the Sarbanes-Oxley Act of 2002 of Laura F. Fergerson, Chief Executive Officer - Finance and Administration, and Gaston Gardey, Chief Financial Officer and Chief Accounting Officer
SIGNATURES
Pursuant to the requirements of the Securities Exchange Act of 1934 and the Investment Company Act of 1940, the registrant has duly caused this report to be signed on its behalf by the undersigned, thereunto duly authorized.
FRANKLIN TAX-FREE TRUST
By /s/ Laura F. Fergerson
Laura F. Fergerson
Chief Executive Officer –
Finance and Administration
Date April 25, 2014
Pursuant to the requirements of the Securities Exchange Act of 1934 and the Investment Company Act of 1940, this report has been signed below by the following persons on behalf of the registrant and in the capacities and on the dates indicated.
By /s/ Laura F. Fergerson
Laura F. Fergerson
Chief Executive Officer –
Finance and Administration
Date April 25, 2014
By /s/ Gaston Gardey
Gaston Gardey
Chief Financial Officer and
Chief Accounting Officer
Date April 25, 2014