

| 1
Annual Report
Municipal Bond Market Overview
For the 12 months ended February 29, 2012, the municipal bond market posted healthy gains as measured by the +12.42% return of the Barclays Capital (BC) Municipal Bond Index, which tracks investment-grade securities.1 Over the reporting period municipal bonds generally outperformed Treasuries, which returned +9.60% according to the BC U.S. Treasury Index, which tracks various U.S. Treasury securities.1
During the reporting period, domestic and global events affected the municipal bond market. Domestically, the Federal Reserve Board’s (Fed’s) commitment to maintain an accommodative monetary policy stance with historically low interest rates supported the municipal market. The market was further supported by an extended period of low supply, thus reducing the availability of bonds to meet investor demand. In Europe, several countries struggled with financial challenges that resulted in a flight to quality benefiting the U.S. Treasury market, as well as the municipal bond market.
From a credit perspective, on August 2, 2011, the U.S. raised its debt ceiling and avoided defaulting on its debt obligations. Independent credit rating agency Standard & Poor’s (S&P) lowered the country’s long-term Treasury bond rating to AA+ from AAA, citing political risks and a rising debt burden.2 All municipal bonds backed by the U.S. government or government-sponsored enterprises (GSEs) were also downgraded along with the country’s rating and those of GSEs. S&P’s downgrade of U.S. Treasury securities led to the review of more than 11,000 municipal credits supported by federal programs and agency escrows. Primarily, prerefunded municipal bonds and housing bonds tied to federal subsidy programs were affected by the downgrade, although they generally still carried high-grade ratings. Furthermore, on July 19, 2011, independent credit rating agency Moody’s Investors Service placed five Aaa-rated states on its watch list for potential rating cuts partly based on their dependency on federal funding. After the debt ceiling was raised, Moody’s reconfirmed the Aaa rating to states and public finance issuers previously identified as directly or indirectly linked to the U.S. government.2 The same credits are currently assigned a negative outlook based on the identification of certain shared characteristics.
1. Source: © 2012 Morningstar. All Rights Reserved. The information contained herein: (1) is proprietary to Morningstar and/or its content providers; (2) may not be copied or distributed; and (3) is not warranted to be accurate, complete or timely. Neither Morningstar nor its content providers are responsible for any damages or losses arising from any use of this information. Past performance is no guarantee of future results.
2. These do not indicate ratings of the Funds.
4 | Annual Report
Congress enacted the Budget Control Act of 2011 with the potential to reduce the federal deficit by approximately $2 trillion by 2021. While the plan of action is unknown, one can expect reduced federal funding, which would impact state and local programs dependent on federal subsidies. State and local officials may need to reevaluate current budget forecasts and the potential effects. Despite facing fiscal restraints and broad budget cuts to achieve balance, many states continued to show mild growth in revenues, and the actual default rate for municipal bonds was very low.
At period-end, we maintained our positive view of the municipal bond market. We believe municipal bonds continue to be an attractive asset class among fixed income securities, and we intend to follow our solid discipline of investing to maximize income while seeking value in the municipal bond market.
The foregoing information reflects our analysis and opinions as of February 29, 2012, the end of the reporting period. The information is not a complete analysis of every aspect of any market, country, industry, security or fund. Statements of fact are from sources considered reliable.
Annual Report | 5
Investment Strategy and
Manager’s Discussion
Investment Strategy
We use a consistent, disciplined strategy in an effort to maximize tax-exempt income for our shareholders by seeking to maintain exposure to higher coupon securities while balancing risk and return within each Fund’s range of allowable investments. We generally employ a buy-and-hold approach and invest in securities we believe should provide the most relative value in the market. As we invest during different interest rate environments, each Fund’s portfolio remains diversified with a broad range of securities. This broad diversification may help mitigate interest rate risk. We do not use leverage or exotic derivatives, nor do we use hedging techniques that could add volatility and contribute to under-performance in adverse markets. We generally stay fully invested to help maximize income distribution.
Manager’s Discussion
Based on the combination of our value-oriented philosophy of investing primarily for income and a positive-sloping municipal yield curve, we favored the use of longer term bonds. Consistent with our strategy, we sought to purchase bonds from 15 to 30 years in maturity with good call features for the long-term funds, 10 to 15 years for the intermediate-term fund, and five years or less for the limited-term fund. We believe our conservative, buy-and-hold investment strategy can help us achieve high, current, tax-free income for shareholders.
We invite you to read your Fund report for more detailed performance and portfolio information. Thank you for your participation in Franklin Tax-Free Trust. We look forward to serving your future investment needs.
The foregoing information reflects our analysis, opinions and portfolio holdings as of February 29, 2012, the end of the reporting period. The way we implement our main investment strategies and the resulting portfolio holdings may change depending on factors such as market and economic conditions. These opinions may not be relied upon as investment advice or an offer for a particular security. The information is not a complete analysis of every aspect of any market, state, industry, security or fund. Statements of fact are from sources considered reliable, but the investment manager makes no representation or warranty as to their completeness or accuracy. Although historical performance is no guarantee of future results, these insights may help you understand our investment management philosophy.
6 | Annual Report
Franklin Double Tax-Free Income Fund
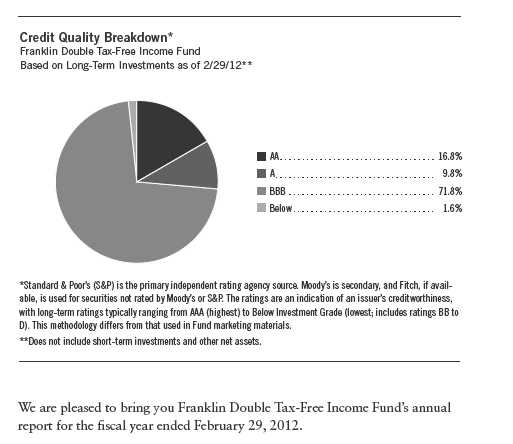
Your Fund’s Goal and Main Investments: Franklin Double Tax-Free Income Fund seeks to provide as high a level of income exempt from federal and state personal income taxes as is consistent with prudent investment management and preservation of capital by investing at least 80% of its net assets in securities that pay interest free from such taxes.1 The Fund focuses on municipal securities issued by U.S. territories such as Puerto Rico, Guam and the U.S. Virgin Islands, and currently invests primarily in Puerto Rican municipal securities.
Performance data represent past performance, which does not guarantee future results. Investment return and principal value will fluctuate, and you may have a gain or loss when you sell your shares. Current performance may differ from figures shown. Please visit franklintempleton.com or call (800) 342-5236 for most recent month-end performance.
Performance Overview
The Fund’s Class A share price, as measured by net asset value, increased from $11.12 on February 28, 2011, to $12.31 on February 29, 2012. The Fund’s
1. For investors subject to alternative minimum tax, a small portion of Fund dividends may be taxable. Distributions of capital gains are generally taxable. To avoid imposition of 28% backup withholding on all Fund distributions and redemption proceeds, U.S. investors must be properly certified on Form W-9 and non-U.S. investors on Form W-8BEN.
The dollar value, number of shares or principal amount, and names of all portfolio holdings are listed in the Fund’s Statement of Investments (SOI). The SOI begins on page 78.
Annual Report | 7
| | |
| Portfolio Breakdown | | |
| Franklin Double Tax-Free Income Fund | |
| 2/29/12 | | |
| % of Total | |
| Long-Term Investments* | |
| Utilities | 21.7 | % |
| General Obligation | 19.2 | % |
| Tax-Supported | 18.5 | % |
| Transportation | 11.2 | % |
| Other Revenue | 7.7 | % |
| Subject to Government Appropriations | 7.4 | % |
| Refunded | 7.2 | % |
| Housing | 3.0 | % |
| Higher Education | 2.9 | % |
| Hospital & Health Care | 1.2 | % |
| |
| *Does not include short-term investments and other | |
| net assets. | | |
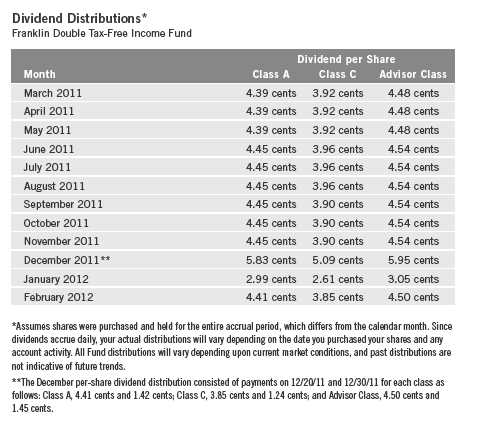
Class A shares paid dividends totaling 53.26 cents per share for the same period.2 The Performance Summary beginning on page 10 shows that at the end of this reporting period the Fund’s Class A shares’ distribution rate was 4.05%, based on an annualization of the current 4.34 cent per share dividend and the maximum offering price of $12.86 on February 29, 2012. An investor in the 2012 maximum federal income tax bracket of 35.00% would need to earn a distribution rate of 6.23% from a taxable investment to match the Fund’s Class A tax-free distribution rate. For the Fund’s Class C and Advisor shares’ performance, please see the Performance Summary.
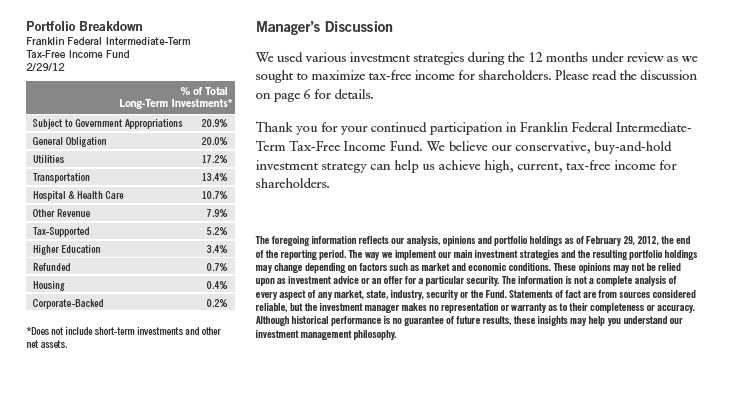
Manager’s Discussion
We used various investment strategies during the 12 months under review as we sought to maximize tax-free income for shareholders. Please read the discussion on page 6 for details. Franklin Double Tax-Free Income Fund is the
2. All Fund distributions will vary depending upon current market conditions, and past distributions are not indicative of future trends.
8 | Annual Report
first mutual fund to offer both state and federal income tax exemptions in all 50 states. We do this by focusing on investments in U.S. territories such as Puerto Rico, the U.S. Virgin Islands and Guam. This can be particularly appealing to residents of states such as Illinois, Iowa and Wisconsin, where income from their own municipal securities may be fully taxable.
The Fund was well diversified with 120 different positions across 10 different sectors as of February 29, 2012. Issuers represented in the portfolio included Puerto Rico (74.6% of the Fund’s total long-term investments), Guam (14.9%) and the U.S. Virgin Islands (10.5%).
Many municipal bond funds purchase U.S. territory paper, mainly Puerto Rico’s, as an alternative for their specialty state funds when the supply within a particular state is running low. This strong demand for territory paper can help to keep bond values high relative to other states. Puerto Rico’s municipal bond market is widely traded because of its dual tax-exemption advantages.
Thank you for your continued participation in Franklin Double Tax-Free Income Fund. We believe our conservative, buy-and-hold investment strategy can help us achieve high, current, tax-free income for shareholders.
The foregoing information reflects our analysis, opinions and portfolio holdings as of February 29, 2012, the end of the reporting period. The way we implement our main investment strategies and the resulting portfolio holdings may change depending on factors such as market and economic conditions. These opinions may not be relied upon as investment advice or an offer for a particular security. The information is not a complete analysis of every aspect of any market, state, industry, security or the Fund. Statements of fact are from sources considered reliable, but the investment manager makes no representation or warranty as to their completeness or accuracy. Although historical performance is no guarantee of future results, these insights may help you understand our investment management philosophy.
Annual Report | 9
Performance Summary as of 2/29/12
Franklin Double Tax-Free Income Fund
Your dividend income will vary depending on dividends or interest paid by securities in the Fund’s portfolio, adjusted for operating expenses of each class. Capital gain distributions are net profits realized from the sale of portfolio securities. The performance table and graphs do not reflect any taxes that a shareholder would pay on Fund dividends, capital gain distributions, if any, or any realized gains on the sale of Fund shares. Total return reflects reinvestment of the Fund’s dividends and capital gain distributions, if any, and any unrealized gains or losses.
| | | | | | | | |
| Price and Distribution Information | | | | | | |
| Class A (Symbol: FPRTX) | | | | Change | | 2/29/12 | | 2/28/11 |
| Net Asset Value (NAV) | | | +$ | 1.19 | $ | 12.31 | $ | 11.12 |
| Distributions (3/1/11–2/29/12) | | | | | | | | |
| Dividend Income | $ | 0.5326 | | | | | | |
| Class C (Symbol: FPRIX) | | | | Change | | 2/29/12 | | 2/28/11 |
| Net Asset Value (NAV) | | | +$ | 1.20 | $ | 12.37 | $ | 11.17 |
| Distributions (3/1/11–2/29/12) | | | | | | | | |
| Dividend Income | $ | 0.4700 | | | | | | |
| Advisor Class (Symbol: FDBZX) | | | | Change | | 2/29/12 | | 2/28/11 |
| Net Asset Value (NAV) | | | +$ | 1.20 | $ | 12.33 | $ | 11.13 |
| Distributions (3/1/11–2/29/12) | | | | | | | | |
| Dividend Income | $ | 0.5435 | | | | | | |
10 | Annual Report
Performance Summary (continued)
Performance
Cumulative total return excludes sales charges. Average annual total returns include maximum sales charges. Class A: 4.25% maximum initial sales charge; Class C: 1% contingent deferred sales charge in first year only; Advisor Class: no sales charges.
| | | | | | | | | | | |
| Class A | | | | 1-Year | | | 5-Year | | | 10-Year | |
| Cumulative Total Return1 | | | + | 15.85 | % | + | 27.51 | % | + | 64.20 | % |
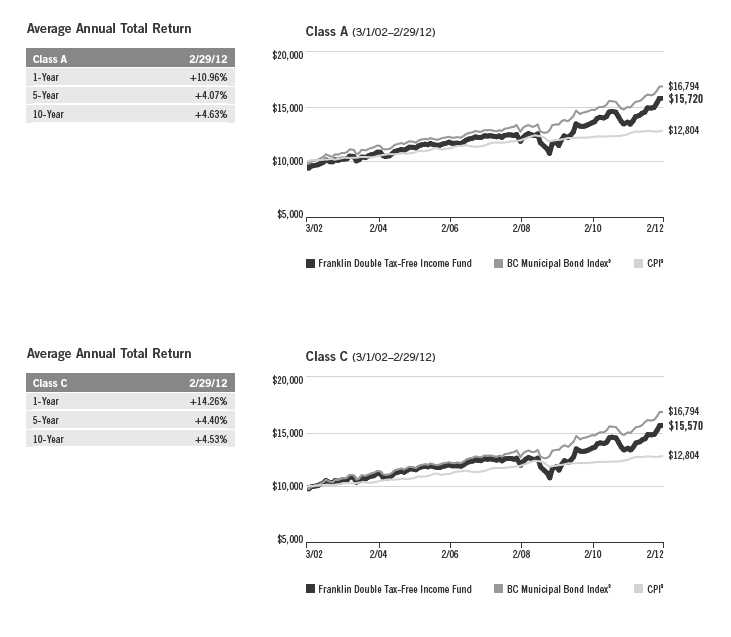
| Average Annual Total Return2 | | | + | 10.96 | % | + | 4.07 | % | + | 4.63 | % |
| Avg. Ann. Total Return (3/31/12)3 | | | + | 11.74 | % | + | 3.97 | % | + | 4.74 | % |
| Distribution Rate4 | 4.05 | % | | | | | | | | | |
| Taxable Equivalent Distribution Rate5 | 6.23 | % | | | | | | | | | |
| 30-Day Standardized Yield6 | 3.24 | % | | | | | | | | | |
| Taxable Equivalent Yield5 | 4.98 | % | | | | | | | | | |
| Total Annual Operating Expenses7 | 0.67 | % | | | | | | | | | |
| Class C | | | | 1-Year | | | 5-Year | | | 10-Year | |
| Cumulative Total Return1 | | | + | 15.26 | % | + | 24.04 | % | + | 55.70 | % |
| Average Annual Total Return2 | | | + | 14.26 | % | + | 4.40 | % | + | 4.53 | % |
| Avg. Ann. Total Return (3/31/12)3 | | | + | 14.96 | % | + | 4.30 | % | + | 4.62 | % |
| Distribution Rate4 | 3.66 | % | | | | | | | | | |
| Taxable Equivalent Distribution Rate5 | 5.63 | % | | | | | | | | | |
| 30-Day Standardized Yield6 | 2.84 | % | | | | | | | | | |
| Taxable Equivalent Yield5 | 4.37 | % | | | | | | | | | |
| Total Annual Operating Expenses7 | 1.22 | % | | | | | | | | | |
| Advisor Class8 | | | | 1-Year | | | 5-Year | | | 10-Year | |
| Cumulative Total Return1 | | | + | 16.04 | % | + | 28.03 | % | + | 64.87 | % |
| Average Annual Total Return2 | | | + | 16.04 | % | + | 5.07 | % | + | 5.13 | % |
| Avg. Ann. Total Return (3/31/12)3 | | | + | 16.75 | % | + | 4.94 | % | + | 5.23 | % |
| Distribution Rate4 | 4.33 | % | | | | | | | | | |
| Taxable Equivalent Distribution Rate5 | 6.66 | % | | | | | | | | | |
| 30-Day Standardized Yield6 | 3.49 | % | | | | | | | | | |
| Taxable Equivalent Yield5 | 5.37 | % | | | | | | | | | |
| Total Annual Operating Expenses7 | 0.57 | % | | | | | | | | | |
Performance data represent past performance, which does not guarantee future results. Investment return and principal value will fluctuate, and you may have a gain or loss when you sell your shares. Current performance may differ from figures shown. For most recent month-end performance, go to franklintempleton.com or call (800) 342-5236.
Annual Report | 11
Performance Summary (continued)
Total Return Index Comparison for a Hypothetical $10,000 Investment
Total return represents the change in value of an investment over the periods shown. It includes any current, applicable, maximum sales charge, Fund expenses, account fees and reinvested distributions. The unmanaged index includes reinvestment of any income or distributions. It differs from the Fund in composition and does not pay management fees or expenses. One cannot invest directly in an index.
12 | Annual Report

Endnotes
All investments involve risks, including possible loss of principal. Because municipal bonds are sensitive to interest rate movements, the Fund’s yield and share price will fluctuate with market conditions. Bond prices generally move in the opposite direction of interest rates. Thus, as prices of bonds in the Fund adjust to a rise in interest rates, the Fund’s share price may decline. Changes in the financial strength of a bond issuer or in a bond’s credit rating may affect its value. The Fund is actively managed but there is no guarantee that the manager’s investment decisions will produce the desired results. Since the Fund may concentrate its investments in a single U.S. territory, it may be subject to greater risk of adverse economic and regulatory changes in that territory than a geographically diversified fund. The Fund is classified as a nondiversified Fund because it may invest a greater portion of its assets in the municipal securities of one issuer than a diversified fund. The Fund’s prospectus also includes a description of the main investment risks.
Class C: Prior to 1/1/04, these shares were offered with an initial sales charge; thus actual total returns would have differed. These shares have higher annual fees and expenses than Class A shares.
Advisor Class: Shares are available to certain eligible investors as described in the prospectus.
1. Cumulative total return represents the change in value of an investment over the periods indicated.
2. Average annual total return represents the average annual change in value of an investment over the periods indicated.
3. In accordance with SEC rules, we provide standardized average annual total return information through the latest calendar quarter.
4. Distribution rate is based on an annualization of the respective class’s current monthly dividend and the maximum offering price (NAV for Classes C and Advisor) per share on 2/29/12.
5. Taxable equivalent distribution rate and yield assume the 2012 maximum federal income tax rate of 35.00%.
6. The 30-day standardized yield for the month ended 2/29/12 reflects an estimated yield to maturity (assuming all portfolio securities are held to maturity). It should be regarded as an estimate of the Fund’s rate of investment income, and it may not equal the Fund’s actual income distribution rate (which reflects the Fund’s past dividends paid to shareholders) or the income reported in the Fund’s financial statements.
7. Figures are as stated in the Fund’s prospectus current as of the date of this report. In periods of market volatility, assets may decline significantly, causing total annual Fund operating expenses to become higher than the figures shown.
8. Effective 7/15/09, the Fund began offering Advisor Class shares, which do not have sales charges or a Rule 12b-1 plan. Performance quotations for this class reflect the following methods of calculation: (a) For periods prior to 7/15/09, a restated figure is used based upon the Fund’s Class A performance, excluding the effect of Class A’s maximum initial sales charge, but reflecting the effect of the Class A Rule 12b-1 fees; and (b) for periods after 7/15/09, actual Advisor Class performance is used reflecting all charges and fees applicable to that class. Since 7/15/09 (commencement of sales), the cumulative and average annual total returns of Advisor Class shares were +28.93% and +10.17%.
9. Source: © 2012 Morningstar. The BC Municipal Bond Index is a market value-weighted index engineered for the long-term tax-exempt bond market. To be included in the index, bonds must be fixed rate, have at least one year to final maturity and be rated investment grade (Baa3/BBB- or higher) by at least two of the following agencies: Moody’s, Standard & Poor’s and Fitch. The Consumer Price Index (CPI), calculated by the U.S. Bureau of Labor Statistics, is a commonly used measure of the inflation rate.
Annual Report | 13
Your Fund’s Expenses
Franklin Double Tax-Free Income Fund
As a Fund shareholder, you can incur two types of costs:
- Transaction costs, including sales charges (loads) on Fund purchases; and
- Ongoing Fund costs, including management fees, distribution and service (12b-1) fees, and other Fund expenses. All mutual funds have ongoing costs, sometimes referred to as operating expenses.
The following table shows ongoing costs of investing in the Fund and can help you understand these costs and compare them with those of other mutual funds. The table assumes a $1,000 investment held for the six months indicated.
Actual Fund Expenses
The first line (Actual) for each share class listed in the table provides actual account values and expenses. The “Ending Account Value” is derived from the Fund’s actual return, which includes the effect of Fund expenses.
You can estimate the expenses you paid during the period by following these steps. Of course, your account value and expenses will differ from those in this illustration:
| 1 | Divide your account value by $1,000. |
| | If an account had an $8,600 value, then $8,600 ÷ $1,000 = 8.6. |
| 2. | Multiply the result by the number under the heading “Expenses Paid During Period.” |
| | If Expenses Paid During Period were $7.50, then 8.6 x $7.50 = $64.50. |
In this illustration, the estimated expenses paid this period are $64.50.
Hypothetical Example for Comparison with Other Funds
Information in the second line (Hypothetical) for each class in the table can help you compare ongoing costs of investing in the Fund with those of other mutual funds. This information may not be used to estimate the actual ending account balance or expenses you paid during the period. The hypothetical “Ending Account Value” is based on the actual expense ratio for each class and an assumed 5% annual rate of return before expenses, which does not represent the Fund’s actual return. The figure under the heading “Expenses Paid During Period” shows the hypothetical expenses your account would have incurred under this scenario. You can compare this figure with the 5% hypothetical examples that appear in shareholder reports of other funds.
14 | Annual Report
Your Fund’s Expenses (continued)
Please note that expenses shown in the table are meant to highlight ongoing costs and do not reflect any transaction costs, such as sales charges. Therefore, the second line for each class is useful in comparing ongoing costs only, and will not help you compare total costs of owning different funds. In addition, if transaction costs were included, your total costs would have been higher. Please refer to the Fund prospectus for additional information on operating expenses.
| | | | | | |
| | | Beginning Account | | Ending Account | | Expenses Paid During |
| Class A | | Value 9/1/11 | | Value 2/29/12 | | Period* 9/1/11–2/29/12 |
| Actual | $ | 1,000 | $ | 1,086.70 | $ | 3.48 |
| Hypothetical (5% return before expenses) | $ | 1,000 | $ | 1,021.53 | $ | 3.37 |
| Class C | | | | | | |
| Actual | $ | 1,000 | $ | 1,084.20 | $ | 6.37 |
| Hypothetical (5% return before expenses) | $ | 1,000 | $ | 1,018.75 | $ | 6.17 |
| Advisor Class | | | | | | |
| Actual | $ | 1,000 | $ | 1,087.10 | $ | 2.96 |
| Hypothetical (5% return before expenses) | $ | 1,000 | $ | 1,022.03 | $ | 2.87 |
*Expenses are calculated using the most recent six-month expense ratio, annualized for each class (A: 0.67%; C: 1.23%; and Advisor: 0.57%), multiplied by the average account value over the period, multiplied by 182/366 to reflect the one-half year period.
Annual Report | 15
Franklin Federal Intermediate-Term Tax-Free Income Fund
Your Fund’s Goal and Main Investments: Franklin Federal Intermediate-Term Tax-Free Income Fund seeks to provide as high a level of income exempt from federal income taxes as is consistent with prudent investment management and preservation of capital by investing at least 80% of its total assets in securities that pay interest free from such taxes.1 The Fund maintains a dollar-weighted average portfolio maturity (the time in which the debt must be repaid) of three to 10 years.
Performance data represent past performance, which does not guarantee future results. Investment return and principal value will fluctuate, and you may have a gain or loss when you sell your shares. Current performance may differ from figures shown. Please visit franklintempleton.com or call (800) 342-5236 for most recent month-end performance.
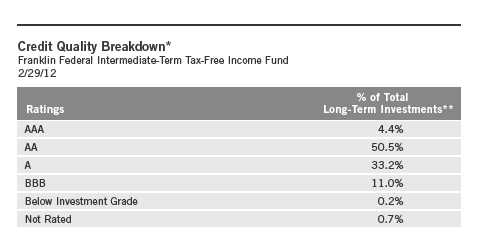
*Standard & Poor’s (S&P) is the primary independent rating agency source. Moody’s is secondary, and Fitch, if available, is used for securities not rated by Moody’s or S&P. The ratings are an indication of an issuer’s creditworthiness, with long-term ratings typically ranging from AAA (highest) to Below Investment Grade (lowest; includes ratings BB to D). This methodology differs from that used in Fund marketing materials.
**Does not include short-term investments and other net assets.
We are pleased to bring you Franklin Federal Intermediate-Term Tax-Free Income Fund’s annual report for the fiscal year ended February 29, 2012.
Performance Overview
The Fund’s Class A share price, as measured by net asset value, increased from $11.43 on February 28, 2011, to $12.39 on February 29, 2012. The Fund’s
1. Dividends are generally subject to state and local taxes, if any. For investors subject to alternative minimum tax, a small portion of Fund dividends may be taxable. Distributions of capital gains are generally taxable. To avoid imposition of 28% backup withholding on all Fund distributions and redemption proceeds, U.S. investors must be properly certified on Form W-9 and non-U.S. investors on Form W-8BEN.
The dollar value, number of shares or principal amount, and names of all portfolio holdings are listed in the Fund’s Statement of Investments (SOI). The SOI begins on page 85.
16 | Annual Report
| | | |
| Dividend Distributions* | | | |
| Franklin Federal Intermediate-Term Tax-Free Income Fund | | |
| | | Dividend per Share |
| Month | Class A | Class C | Advisor Class |
| March 2011 | 3.23 cents | 2.72 cents | 3.32 cents |
| April 2011 | 3.23 cents | 2.72 cents | 3.32 cents |
| May 2011 | 3.23 cents | 2.72 cents | 3.32 cents |
| June 2011 | 3.38 cents | 2.87 cents | 3.47 cents |
| July 2011 | 3.38 cents | 2.87 cents | 3.47 cents |
| August 2011 | 3.38 cents | 2.87 cents | 3.47 cents |
| September 2011 | 3.28 cents | 2.73 cents | 3.38 cents |
| October 2011 | 3.28 cents | 2.73 cents | 3.38 cents |
| November 2011 | 3.28 cents | 2.73 cents | 3.38 cents |
| December 2011** | 4.13 cents | 3.38 cents | 4.27 cents |
| January 2012 | 2.13 cents | 1.74 cents | 2.19 cents |
| February 2012 | 3.13 cents | 2.56 cents | 3.23 cents |
*Assumes shares were purchased and held for the entire accrual period, which differs from the calendar month. Since dividends accrue daily, your actual distributions will vary depending on the date you purchased your shares and any account activity. All Fund distributions will vary depending upon current market conditions, and past distributions are not indicative of future trends.
**The December per-share dividend distribution consisted of payments on 12/20/11 and 12/30/11 for each class as follows: Class A, 3.13 cents and 1.00 cent; Class C, 2.56 cents and 0.82 cents; and Advisor Class, 3.23 cents and 1.04 cents.
Class A shares paid dividends totaling 39.10 cents per share for the same period.2 The Performance Summary beginning on page 19 shows that at the end of this reporting period the Fund’s Class A shares’ distribution rate was 2.82%, based on an annualization of the current 2.98 cent per share dividend and the maximum offering price of $12.68 on February 29, 2012. An investor in the 2012 maximum federal income tax bracket of 35.00% would need to earn a distribution rate of 4.34% from a taxable investment to match the Fund’s Class A tax-free distribution rate. For the Fund’s Class C and Advisor shares’ performance, please see the Performance Summary. The reduction in dividend distributions from the start to the end of the period under review reflected generally declining interest rates. Additionally, investor demand was strong for municipal bonds in an environment of limited tax-exempt supply. These factors resulted in reduced income for the portfolio and caused dividends to decline overall.
2. All Fund distributions will vary depending upon current market conditions, and past distributions are not indicative of future trends.
Annual Report | 17
18 | Annual Report
Performance Summary as of 2/29/12
Franklin Federal Intermediate-Term Tax-Free Income Fund
Your dividend income will vary depending on dividends or interest paid by securities in the Fund’s portfolio, adjusted for operating expenses of each class. Capital gain distributions are net profits realized from the sale of portfolio securities. The performance table and graphs do not reflect any taxes that a shareholder would pay on Fund dividends, capital gain distributions, if any, or any realized gains on the sale of Fund shares. Total return reflects reinvestment of the Fund’s dividends and capital gain distributions, if any, and any unrealized gains or losses.
| | | | | | | | |
| Price and Distribution Information | | | | | | |
| Class A (Symbol: FKITX) | | | | Change | | 2/29/12 | | 2/28/11 |
| Net Asset Value (NAV) | | | +$ | 0.96 | $ | 12.39 | $ | 11.43 |
| Distributions (3/1/11–2/29/12) | | | | | | | | |
| Dividend Income | $ | 0.3910 | | | | | | |
| Class C (Symbol: FCITX) | | | | Change | | 2/29/12 | | 2/28/11 |
| Net Asset Value (NAV) | | | +$ | 0.96 | $ | 12.42 | $ | 11.46 |
| Distributions (3/1/11–2/29/12) | | | | | | | | |
| Dividend Income | $ | 0.3263 | | | | | | |
| Advisor Class (Symbol: FITZX) | | | | Change | | 2/29/12 | | 2/28/11 |
| Net Asset Value (NAV) | | | +$ | 0.96 | $ | 12.41 | $ | 11.45 |
| Distributions (3/1/11–2/29/12) | | | | | | | | |
| Dividend Income | $ | 0.4025 | | | | | | |
Annual Report | 19
Performance Summary (continued)
Performance
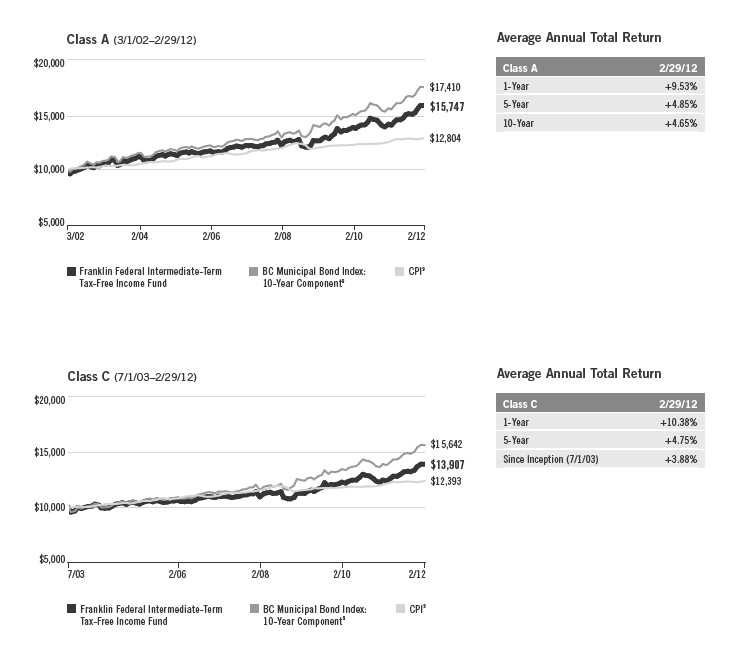
Cumulative total return excludes sales charges. Average annual total returns include maximum sales charges. Class A: 2.25% maximum initial sales charge; Class C: 1% contingent deferred sales charge in first year only; Advisor Class: no sales charges.
| | | | | | | | | | | |
| Class A | | | | 1-Year | | | 5-Year | | | 10-Year | |
| Cumulative Total Return1 | | | + | 12.02 | % | + | 29.60 | % | + | 61.15 | % |
| Average Annual Total Return2 | | | + | 9.53 | % | + | 4.85 | % | + | 4.65 | % |
| Avg. Ann. Total Return (3/31/12)3 | | | + | 9.16 | % | + | 4.68 | % | + | 4.73 | % |
| Distribution Rate4 | 2.82 | % | | | | | | | | | |
| Taxable Equivalent Distribution Rate5 | 4.34 | % | | | | | | | | | |
| 30-Day Standardized Yield6 | 1.64 | % | | | | | | | | | |
| Taxable Equivalent Yield5 | 2.52 | % | | | | | | | | | |
| Total Annual Operating Expenses7 | 0.66 | % | | | | | | | | | |
| Class C | | | | 1-Year | | | 5-Year | | | Inception (7/1/03) | |
| Cumulative Total Return1 | | | + | 11.38 | % | + | 26.10 | % | + | 39.07 | % |
| Average Annual Total Return2 | | | + | 10.38 | % | + | 4.75 | % | + | 3.88 | % |
| Avg. Ann. Total Return (3/31/12)3 | | | + | 10.04 | % | + | 4.60 | % | + | 3.72 | % |
| Distribution Rate4 | 2.31 | % | | | | | | | | | |
| Taxable Equivalent Distribution Rate5 | 3.55 | % | | | | | | | | | |
| 30-Day Standardized Yield6 | 1.14 | % | | | | | | | | | |
| Taxable Equivalent Yield5 | 1.75 | % | | | | | | | | | |
| Total Annual Operating Expenses7 | 1.21 | % | | | | | | | | | |
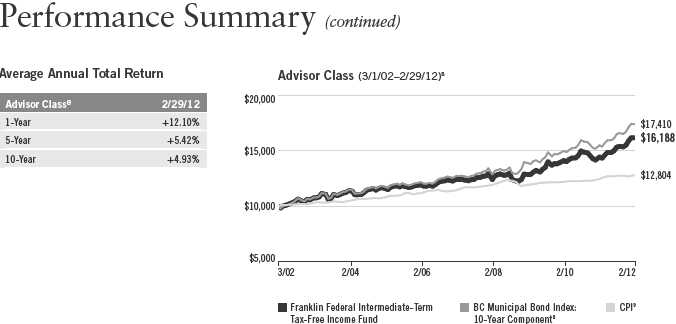
| Advisor Class8 | | | | 1-Year | | | 5-Year | | | 10-Year | |
| Cumulative Total Return1 | | | + | 12.10 | % | + | 30.18 | % | + | 61.88 | % |
| Average Annual Total Return2 | | | + | 12.10 | % | + | 5.42 | % | + | 4.93 | % |
| Avg. Ann. Total Return (3/31/12)3 | | | + | 11.76 | % | + | 5.25 | % | + | 5.01 | % |
| Distribution Rate4 | 2.99 | % | | | | | | | | | |
| Taxable Equivalent Distribution Rate5 | 4.60 | % | | | | | | | | | |
| 30-Day Standardized Yield6 | 1.78 | % | | | | | | | | | |
| Taxable Equivalent Yield5 | 2.74 | % | | | | | | | | | |
| Total Annual Operating Expenses7 | 0.56 | % | | | | | | | | | |
Performance data represent past performance, which does not guarantee future results. Investment return and principal value will fluctuate, and you may have a gain or loss when you sell your shares. Current performance may differ from figures shown. For most recent month-end performance, go to franklintempleton.com or call (800) 342-5236.
20 | Annual Report
Performance Summary (continued)
Total Return Index Comparison for a Hypothetical $10,000 Investment
Total return represents the change in value of an investment over the periods shown. It includes any current, applicable, maximum sales charge, Fund expenses, account fees and reinvested distributions. The unmanaged index includes reinvestment of any income or distributions. It differs from the Fund in composition and does not pay management fees or expenses. One cannot invest directly in an index.
Annual Report | 21
Endnotes
All investments involve risks, including possible loss of principal. Because municipal bonds are sensitive to interest rate movements, the Fund’s yield and share price will fluctuate with market conditions. Bond prices generally move in the opposite direction of interest rates. Thus, as prices of bonds in the Fund adjust to a rise in interest rates, the Fund’s share price may decline. Changes in the financial strength of a bond issuer or in a bond’s credit rating may affect its value. The Fund is actively managed but there is no guarantee that the manager’s investment decisions will produce the desired results. The Fund’s prospectus also includes a description of the main investment risks.
| |
Class C: | Prior to 1/1/04, these shares were offered with an initial sales charge; thus actual total returns would have differed. These shares have higher annual fees and expenses than Class A shares. |
| |
Advisor Class: | Shares are available to certain eligible investors as described in the prospectus. |
1. Cumulative total return represents the change in value of an investment over the periods indicated.
2. Average annual total return represents the average annual change in value of an investment over the periods indicated.
3. In accordance with SEC rules, we provide standardized average annual total return information through the latest calendar quarter.
4. Distribution rate is based on an annualization of the respective class’s current monthly dividend and the maximum offering price (NAV for Classes C and Advisor) per share on 2/29/12.
5. Taxable equivalent distribution rate and yield assume the 2012 maximum federal income tax rate of 35.00%.
6. The 30-day standardized yield for the month ended 2/29/12 reflects an estimated yield to maturity (assuming all portfolio securities are held to maturity). It should be regarded as an estimate of the Fund’s rate of investment income, and it may not equal the Fund’s actual income distribution rate (which reflects the Fund’s past dividends paid to shareholders) or the income reported in the Fund’s financial statements.
7. Figures are as stated in the Fund’s prospectus current as of the date of this report. In periods of market volatility, assets may decline significantly, causing total annual Fund operating expenses to become higher than the figures shown.
8. Effective 12/1/08, the Fund began offering Advisor Class shares, which do not have sales charges or a Rule 12b-1 plan. Performance quotations for this class reflect the following methods of calculation: (a) For periods prior to 12/1/08, a restated figure is used based upon the Fund’s Class A performance, excluding the effect of Class A’s maximum initial sales charge, but reflecting the effect of the Class A Rule 12b-1 fees; and (b) for periods after 12/1/08, actual Advisor Class performance is used reflecting all charges and fees applicable to that class. Since 12/1/08 (commencement of sales), the cumulative and average annual total returns of Advisor Class shares were +32.10% and +8.96%.
9. Source: © 2012 Morningstar. The BC Municipal Bond Index: 10-Year Component is the 10-year (8-12) component of the Municipal Bond Index, which is a market value-weighted index engineered for the long-term tax-exempt bond market. To be included in the index, bonds must be fixed rate, have at least one year to final maturity and be rated investment grade (Baa3/BBB- or higher) by at least two of the following agencies: Moody’s, Standard & Poor’s and Fitch. The Consumer Price Index (CPI), calculated by the U.S. Bureau of Labor Statistics, is a commonly used measure of the inflation rate.
22 | Annual Report
Your Fund’s Expenses
Franklin Federal Intermediate-Term Tax-Free Income Fund
As a Fund shareholder, you can incur two types of costs:
- Transaction costs, including sales charges (loads) on Fund purchases; and
- Ongoing Fund costs, including management fees, distribution and service (12b-1) fees, and other Fund expenses. All mutual funds have ongoing costs, sometimes referred to as operating expenses.
The following table shows ongoing costs of investing in the Fund and can help you understand these costs and compare them with those of other mutual funds. The table assumes a $1,000 investment held for the six months indicated.
Actual Fund Expenses
The first line (Actual) for each share class listed in the table provides actual account values and expenses. The “Ending Account Value” is derived from the Fund’s actual return, which includes the effect of Fund expenses.
You can estimate the expenses you paid during the period by following these steps. Of course, your account value and expenses will differ from those in this illustration:
| 1. | Divide your account value by $1,000. |
| | If an account had an $8,600 value, then $8,600 ÷ $1,000 = 8.6. |
| 2. | Multiply the result by the number under the heading “Expenses Paid During Period.” |
| | If Expenses Paid During Period were $7.50, then 8.6 x $7.50 = $64.50. |
In this illustration, the estimated expenses paid this period are $64.50.
Hypothetical Example for Comparison with Other Funds
Information in the second line (Hypothetical) for each class in the table can help you compare ongoing costs of investing in the Fund with those of other mutual funds. This information may not be used to estimate the actual ending account balance or expenses you paid during the period. The hypothetical “Ending Account Value” is based on the actual expense ratio for each class and an assumed 5% annual rate of return before expenses, which does not represent the Fund’s actual return. The figure under the heading “Expenses Paid During Period” shows the hypothetical expenses your account would have incurred under this scenario. You can compare this figure with the 5% hypothetical examples that appear in shareholder reports of other funds.
Annual Report | 23
Your Fund’s Expenses (continued)
Please note that expenses shown in the table are meant to highlight ongoing costs and do not reflect any transaction costs, such as sales charges. Therefore, the second line for each class is useful in comparing ongoing costs only, and will not help you compare total costs of owning different funds. In addition, if transaction costs were included, your total costs would have been higher. Please refer to the Fund prospectus for additional information on operating expenses.
| | | | | | |
| | | Beginning Account | | Ending Account | | Expenses Paid During |
| Class A | | Value 9/1/11 | | Value 2/29/12 | | Period* 9/1/11–2/29/12 |
| Actual | $ | 1,000 | $ | 1,055.00 | $ | 3.37 |
| Hypothetical (5% return before expenses) | $ | 1,000 | $ | 1,021.58 | $ | 3.32 |
| Class C | | | | | | |
| Actual | $ | 1,000 | $ | 1,052.00 | $ | 6.17 |
| Hypothetical (5% return before expenses) | $ | 1,000 | $ | 1,018.85 | $ | 6.07 |
| Advisor Class | | | | | | |
| Actual | $ | 1,000 | $ | 1,055.40 | $ | 2.86 |
| Hypothetical (5% return before expenses) | $ | 1,000 | $ | 1,022.08 | $ | 2.82 |
*Expenses are calculated using the most recent six-month expense ratio, annualized for each class (A: 0.66%; C: 1.21%; and Advisor: 0.56%), multiplied by the average account value over the period, multiplied by 182/366 to reflect the one-half year period.
24 | Annual Report
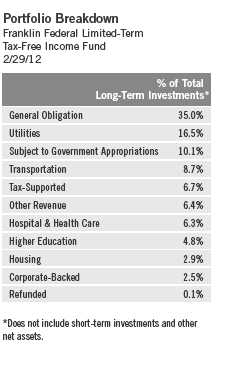
Franklin Federal Limited-Term Tax-Free Income Fund
Your Fund’s Goal and Main Investments: Franklin Federal Limited-Term Tax-Free Income Fund seeks to provide as high a level of income exempt from federal income taxes as is consistent with prudent investment management and preservation of capital by investing at least 80% of its total assets in securities that pay interest free from such taxes.1 The Fund maintains a dollar-weighted average portfolio maturity (the time in which the debt must be repaid) of five years or less.
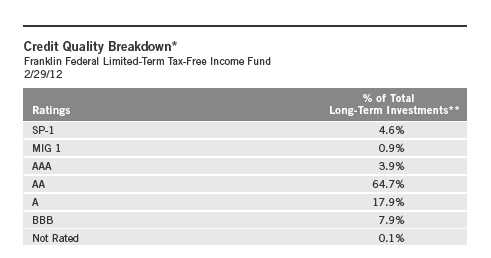
*Standard & Poor’s (S&P) is the primary independent rating agency source. Moody’s is secondary, and Fitch, if available, is used for securities not rated by Moody’s or S&P. The ratings are an indication of an issuer’s creditworthiness, with short-term ratings typically ranging from SP-1 and MIG 1 (highest) to SP-3 and SG (lowest) and long-term ratings typically ranging from AAA (highest) to Below Investment Grade (lowest; includes ratings BB to D). This methodology differs from that used in Fund marketing materials.
**Does not include short-term investments and other net assets.
We are pleased to bring you Franklin Federal Limited-Term Tax-Free Income Fund’s annual report for the fiscal year ended February 29, 2012.
1. Dividends are generally subject to state and local taxes, if any. For investors subject to alternative minimum tax, a small portion of Fund dividends may be taxable. Distributions of capital gains are generally taxable. To avoid imposition of 28% backup withholding on all Fund distributions and redemption proceeds, U.S. investors must be properly certified on Form W-9 and non-U.S. investors on Form W-8BEN.
The dollar value, number of shares or principal amount, and names of all portfolio holdings are listed in the Fund’s Statement of Investments (SOI). The SOI begins on page 102.
Annual Report | 25
Dividend Distributions*
Performance data represent past performance, which does not guarantee future results. Investment return and principal value will fluctuate, and you may have a gain or loss when you sell your shares. Current performance may differ from figures shown. Please visit franklintempleton.com or call (800) 342-5236 for most recent month-end performance.
| | |
| Franklin Federal Limited-Term Tax-Free Income Fund | | |
| | Dividend per Share |
| Month | Class A | Advisor Class |
| March 2011 | 1.62 cents | 1.70 cents |
| April 2011 | 1.62 cents | 1.70 cents |
| May 2011 | 1.62 cents | 1.70 cents |
| June 2011 | 1.62 cents | 1.74 cents |
| July 2011 | 1.62 cents | 1.74 cents |
| August 2011 | 1.62 cents | 1.74 cents |
| September 2011 | 1.62 cents | 1.77 cents |
| October 2011 | 1.62 cents | 1.77 cents |
| November 2011 | 1.62 cents | 1.77 cents |
| December 2011** | 2.14 cents | 2.31 cents |
| January 2012 | 1.10 cents | 1.19 cents |
| February 2012 | 1.62 cents | 1.75 cents |
*Assumes shares were purchased and held for the entire accrual period, which differs from the calendar month. Since dividends accrue daily, your actual distributions will vary depending on the date you purchased your shares and any account activity. All Fund distributions will vary depending upon current market conditions, and past distributions are not indicative of future trends.
**The December per-share dividend distribution consisted of payments on 12/20/11 and 12/30/11 for each class as follows: Class A, 1.62 cents and 0.52 cents; and Advisor Class, 1.75 cents and 0.56 cents.
Performance Overview
The Fund’s Class A share price, as measured by net asset value, increased from $10.29 on February 28, 2011, to $10.60 on February 29, 2012. The Fund’s Class A shares paid dividends totaling 19.51 cents per share for the same period.2 The Performance Summary beginning on page 28 shows that at the end of this reporting period the Fund’s Class A shares’ distribution rate was 1.79%, based on an annualization of the current 1.62 cent per share dividend and the maximum offering price of $10.84 on February 29, 2012. An investor in the 2012 maximum federal income tax bracket of 35.00% would need to earn a distribution rate of 2.75% from a taxable investment to match the Fund’s Class A tax-free distribution rate. For the Fund’s Advisor shares’ performance, please see the Performance Summary.
2. All Fund distributions will vary depending upon current market conditions, and past distributions are not indicative of future trends.
26 | Annual Report
Manager’s Discussion
We used various investment strategies during the 12 months under review as we sought to maximize tax-free income for shareholders. Please read the discussion on page 6 for details.
Consistent with our investment strategy, we invested in bonds we believed could provide the most relative value from an income perspective. Seeking a dollar-weighted average portfolio maturity of five years or less, we concentrated in the one- to five-year range in an effort to insulate investors against bond market volatility. As a result of our strategy, we believe the Fund was positioned to capture changes in short-term interest rates, preserve capital and produce tax-free income.
Thank you for your continued participation in Franklin Federal Limited-Term Tax-Free Income Fund. We believe our conservative, buy-and-hold investment strategy can help us achieve high, current, tax-free income for shareholders.
The foregoing information reflects our analysis, opinions and portfolio holdings as of February 29, 2012, the end of the reporting period. The way we implement our main investment strategies and the resulting portfolio holdings may change depending on factors such as market and economic conditions. These opinions may not be relied upon as investment advice or an offer for a particular security. The information is not a complete analysis of every aspect of any market, state, industry, security or the Fund. Statements of fact are from sources considered reliable, but the investment manager makes no representation or warranty as to their completeness or accuracy. Although historical performance is no guarantee of future results, these insights may help you understand our investment management philosophy.
Annual Report | 27
Performance Summary as of 2/29/12
Franklin Federal Limited-Term Tax-Free Income Fund
Your dividend income will vary depending on dividends or interest paid by securities in the Fund’s portfolio, adjusted for operating expenses of each class. Capital gain distributions are net profits realized from the sale of portfolio securities. The performance table and graphs do not reflect any taxes that a shareholder would pay on Fund dividends, capital gain distributions, if any, or any realized gains on the sale of Fund shares. Total return reflects reinvestment of the Fund’s dividends and capital gain distributions, if any, and any unrealized gains or losses.
| | | | | | | | |
| Price and Distribution Information | | | | | | |
| Class A (Symbol: FFTFX) | | | | Change | | 2/29/12 | | 2/28/11 |
| Net Asset Value (NAV) | | | +$ | 0.31 | $ | 10.60 | $ | 10.29 |
| Distributions (3/1/11–2/29/12) | | | | | | | | |
| Dividend Income | $ | 0.1951 | | | | | | |
| Advisor Class (Symbol: FTFZX) | | | | Change | | 2/29/12 | | 2/28/11 |
| Net Asset Value (NAV) | | | +$ | 0.30 | $ | 10.59 | $ | 10.29 |
| Distributions (3/1/11–2/29/12) | | | | | | | | |
| Dividend Income | $ | 0.2097 | | | | | | |
28 | Annual Report
Performance Summary (continued)
Performance1
Cumulative total return excludes sales charges. Average annual total returns include maximum sales charges. Class A: 2.25% maximum initial sales charge; Advisor Class: no sales charges.
| | | | | | | | | | | |
| Class A | | | | 1-Year | | | 5-Year | | | Inception (9/2/03) | |
| Cumulative Total Return2 | | | + | 4.95 | % | + | 20.80 | % | + | 28.57 | % |
| Average Annual Total Return3 | | | + | 2.56 | % | + | 3.38 | % | + | 2.73 | % |
| Avg. Ann. Total Return (3/31/12)4 | | | + | 2.06 | % | + | 3.25 | % | + | 2.66 | % |
| Distribution Rate5 | 1.79 | % | | | | | | | | | |
| Taxable Equivalent Distribution Rate6 | 2.75 | % | | | | | | | | | |
| 30-Day Standardized Yield7 | 0.79 | % | | | | | | | | | |
| Taxable Equivalent Yield6 | 1.22 | % | | | | | | | | | |
| Total Annual Operating Expenses8 | | | | | | | | | | | |
| Without Waiver | 0.87 | % | | | | | | | | | |
| With Waiver | 0.60 | % | | | | | | | | | |
| Advisor Class9 | | | | 1-Year | | | 5-Year | | | Inception (9/2/03) | |
| Cumulative Total Return2 | | | + | 5.00 | % | + | 20.86 | % | + | 28.64 | % |
| Average Annual Total Return3 | | | + | 5.00 | % | + | 3.86 | % | + | 3.01 | % |
| Avg. Ann. Total Return (3/31/12)4 | | | + | 4.49 | % | + | 3.74 | % | + | 2.94 | % |
| Distribution Rate5 | 1.98 | % | | | | | | | | | |
| Taxable Equivalent Distribution Rate6 | 3.05 | % | | | | | | | | | |
| 30-Day Standardized Yield7 | 0.96 | % | | | | | | | | | |
| Taxable Equivalent Yield6 | 1.48 | % | | | | | | | | | |
| Total Annual Operating Expenses8 | | | | | | | | | | | |
| Without Waiver | 0.72 | % | | | | | | | | | |
| With Waiver | 0.45 | % | | | | | | | | | |
Performance data represent past performance, which does not guarantee future results. Investment return and principal value will fluctuate, and you may have a gain or loss when you sell your shares. Current performance may differ from figures shown. For most recent month-end performance, go to franklintempleton.com or call (800) 342-5236.
The investment manager and administrator have contractually agreed to waive or assume certain expenses so that common expenses (excluding Rule 12b-1 fees and acquired fund fees and expenses) for each class of the Fund do not exceed 0.45% (other than certain nonroutine expenses) until 6/30/12.
Annual Report | 29
Performance Summary (continued)
Total Return Index Comparison for a Hypothetical $10,000 Investment
Total return represents the change in value of an investment over the periods shown. It includes any current maximum sales charge, Fund expenses, account fees and reinvested distributions. The unmanaged index includes reinvestment of any income or distributions. It differs from the Fund in composition and does not pay management fees or expenses. One cannot invest directly in an index.

30 | Annual Report
Performance Summary (continued)
Endnotes
All investments involve risks, including possible loss of principal. Because municipal bonds are sensitive to interest rate movements, the Fund’s yield and share price will fluctuate with market conditions. Bond prices generally move in the opposite direction of interest rates. Thus, as prices of bonds in the Fund adjust to a rise in interest rates, the Fund’s share price may decline. Changes in the financial strength of a bond issuer or in a bond’s credit rating may affect its value. The Fund is actively managed but there is no guarantee that the manager’s investment decisions will produce the desired results. The Fund’s prospectus also includes a description of the main investment risks.
| |
Class A: Advisor Class: | Prior to 2/1/06, these shares were offered without an initial sales charge; thus actual total returns would have differed. Shares are available to certain eligible investors as described in the prospectus. |
1. If the manager and administrator had not waived fees, the Fund’s distribution rate and total return would have been lower, and yield for the period would have been 0.54% for Class A and 0.70% for Advisor Class.
2. Cumulative total return represents the change in value of an investment over the periods indicated.
3. Average annual total return represents the average annual change in value of an investment over the periods indicated.
4. In accordance with SEC rules, we provide standardized average annual total return information through the latest calendar quarter.
5. Distribution rate is based on an annualization of the respective class’s current monthly dividend and the maximum offering price (NAV for Advisor Class) per share on 2/29/12.
6. Taxable equivalent distribution rate and yield assume the 2012 maximum federal income tax rate of 35.00%.
7. The 30-day standardized yield for the month ended 2/29/12 reflects an estimated yield to maturity (assuming all portfolio securities are held to maturity). It should be regarded as an estimate of the Fund’s rate of investment income, and it may not equal the Fund’s actual income distribution rate (which reflects the Fund’s past dividends paid to shareholders) or the income reported in the Fund’s financial statements.
8. Figures are as stated in the Fund’s prospectus current as of the date of this report. In periods of market volatility, assets may decline significantly, causing total annual Fund operating expenses to become higher than the figures shown.
9. Effective 2/1/11, the Fund began offering Advisor Class shares, which do not have sales charges or a Rule 12b-1 plan. Performance quotations for this class reflect the following methods of calculation: (a) For periods prior to 2/1/11, a restated figure is used based upon the Fund’s Class A performance, excluding the effect of Class A’s maximum initial sales charge, but reflecting the effect of the Class A Rule 12b-1 fees; and (b) for periods after 2/1/11, actual Advisor Class performance is used reflecting all charges and fees applicable to that class. Since 2/1/11 (commencement of sales), the cumulative and average annual total returns of Advisor Class shares were +5.34% and +4.96%.
10. Source: © 2012 Morningstar. The BC Municipal Bond Index: 5-Year Component is the 5-year (4-6) component of the Municipal Bond Index, which is a market value-weighted index engineered for the long-term tax-exempt bond market. To be included in the index, bonds must be fixed rate, have at least one year to final maturity and be rated investment grade (Baa3/BBB- or higher) by at least two of the following agencies: Moody’s, Standard & Poor’s and Fitch. The Consumer Price Index (CPI), calculated by the U.S. Bureau of Labor Statistics, is a commonly used measure of the inflation rate.
Annual Report | 31
Your Fund’s Expenses
Franklin Federal Limited-Term Tax-Free Income Fund
As a Fund shareholder, you can incur two types of costs:
- Transaction costs, including sales charges (loads) on Fund purchases; and
- Ongoing Fund costs, including management fees, distribution and service (12b-1) fees, and other Fund expenses. All mutual funds have ongoing costs, sometimes referred to as operating expenses.
The following table shows ongoing costs of investing in the Fund and can help you understand these costs and compare them with those of other mutual funds. The table assumes a $1,000 investment held for the six months indicated.
Actual Fund Expenses
The first line (Actual) for each share class listed in the table provides actual account values and expenses. The “Ending Account Value” is derived from the Fund’s actual return, which includes the effect of Fund expenses.
You can estimate the expenses you paid during the period by following these steps. Of course, your account value and expenses will differ from those in this illustration:
| 1. | Divide your account value by $1,000. |
| | If an account had an $8,600 value, then $8,600 ÷ $1,000 = 8.6. |
| 2. | Multiply the result by the number under the heading “Expenses Paid During Period.” |
| | If Expenses Paid During Period were $7.50, then 8.6 x $7.50 = $64.50. |
In this illustration, the estimated expenses paid this period are $64.50.
Hypothetical Example for Comparison with Other Funds
Information in the second line (Hypothetical) for each class in the table can help you compare ongoing costs of investing in the Fund with those of other mutual funds. This information may not be used to estimate the actual ending account balance or expenses you paid during the period. The hypothetical “Ending Account Value” is based on the actual expense ratio for each class and an assumed 5% annual rate of return before expenses, which does not represent the Fund’s actual return. The figure under the heading “Expenses Paid During Period” shows the hypothetical expenses your account would have incurred under this scenario. You can compare this figure with the 5% hypothetical examples that appear in shareholder reports of other funds.
32 | Annual Report
Your Fund’s Expenses (continued)
Please note that expenses shown in the table are meant to highlight ongoing costs and do not reflect any transaction costs, such as sales charges. Therefore, the second line for each class is useful in comparing ongoing costs only, and will not help you compare total costs of owning different funds. In addition, if transaction costs were included, your total costs would have been higher. Please refer to the Fund prospectus for additional information on operating expenses.
| | | | | | |
| | | Beginning Account | | Ending Account | | Expenses Paid During |
| Class A | | Value 9/1/11 | | Value 2/29/12 | | Period* 9/1/11–2/29/12 |
| Actual | $ | 1,000 | $ | 1,015.00 | $ | 3.01 |
| Hypothetical (5% return before expenses) | $ | 1,000 | $ | 1,021.88 | $ | 3.02 |
| Advisor Class | | | | | | |
| Actual | $ | 1,000 | $ | 1,015.80 | $ | 2.26 |
| Hypothetical (5% return before expenses) | $ | 1,000 | $ | 1,022.63 | $ | 2.26 |
*Expenses are calculated using the most recent six-month annualized expense ratio, net of expense waivers, annualized for each class (A: 0.60%; and Advisor: 0.45%), multiplied by the average account value over the period, multiplied by 182/366 to reflect the one-half year period.
Annual Report | 33
Franklin High Yield Tax-Free Income Fund
Your Fund’s Goals and Main Investments: Franklin High Yield Tax-Free Income Fund seeks to provide a high current yield exempt from federal income taxes by investing at least 80% of its net assets in securities that pay interest free from such taxes.1 Its secondary goal is capital appreciation to the extent possible and consistent with the Fund’s principal investment goal.
Performance data represent past performance, which does not guarantee future results. Investment return and principal value will fluctuate, and you may have a gain or loss when you sell your shares. Current performance may differ from figures shown. Please visit franklintempleton.com or call (800) 342-5236 for most recent month-end performance.
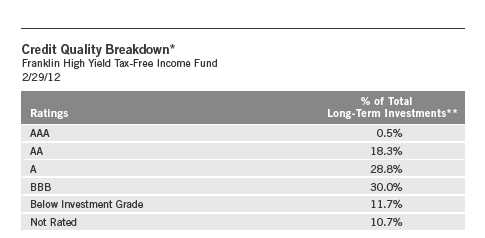
*Standard & Poor’s (S&P) is the primary independent rating agency source. Moody’s is secondary, and Fitch, if available, is used for securities not rated by Moody’s or S&P. The ratings are an indication of an issuer’s creditworthiness, with long-term ratings typically ranging from AAA (highest) to Below Investment Grade (lowest; includes ratings BB to D). This methodology differs from that used in Fund marketing materials.
**Does not include short-term investments and other net assets.
We are pleased to bring you Franklin High Yield Tax-Free Income Fund’s annual report for the fiscal year ended February 29, 2012.
Performance Overview
The Fund’s Class A share price, as measured by net asset value, increased from $9.60 on February 28, 2011, to $10.59 on February 29, 2012. The Fund’s Class A shares paid dividends totaling 52.43 cents per share for the
1. Dividends are generally subject to state and local taxes, if any. For investors subject to alternative minimum tax, a small portion of Fund dividends may be taxable. Distributions of capital gains are generally taxable. To avoid imposition of 28% backup withholding on all Fund distributions and redemption proceeds, U.S. investors must be properly certified on Form W-9 and non-U.S. investors on Form W-8BEN.
The dollar value, number of shares or principal amount, and names of all portfolio holdings are listed in the Fund’s Statement of Investments (SOI). The SOI begins on page 115.
34 | Annual Report
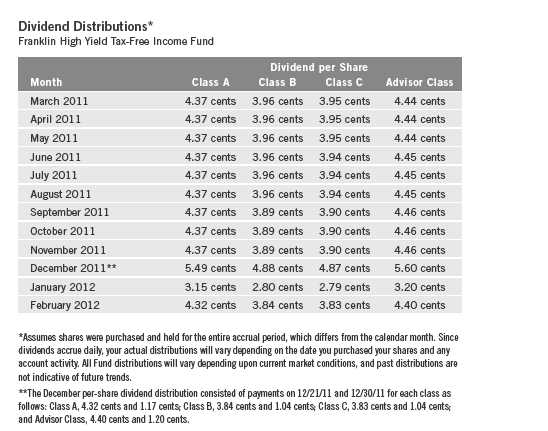
same period.2 The Performance Summary beginning on page 37 shows that at the end of this reporting period the Fund’s Class A shares’ distribution rate was 4.39%, based on an annualization of the current 4.05 cent per share dividend and the maximum offering price of $11.06 on February 29, 2012. An investor in the 2012 maximum federal income tax bracket of 35.00% would need to earn a distribution rate of 6.75% from a taxable investment to match the Fund’s Class A tax-free distribution rate. For the Fund’s Class B, C and Advisor shares’ performance, please see the Performance Summary. The reduction in dividend distributions from the start to the end of the period under review reflected generally declining interest rates. Additionally, investor demand was strong for municipal bonds in an environment of limited tax-exempt supply. These factors resulted in reduced income for the portfolio and caused dividends to decline overall.
2. All Fund distributions will vary depending upon current market conditions, and past distributions are not indicative of future trends.
Annual Report | 35
Portfolio Breakdown
Franklin High Yield Tax-Free Income Fund 2/29/12
|
| % of Total |
| Long-Term Investments* |
| | |
| Utilities | 19.0 | % |
| Transportation | 18.0 | % |
| Hospital & Health Care | 17.2 | % |
| Tax-Supported | 10.6 | % |
| General Obligation | 9.0 | % |
| Corporate-Backed | 6.3 | % |
| Subject to Government Appropriations | 5.6 | % |
| Other Revenue | 5.6 | % |
| Refunded | 5.3 | % |
| Higher Education | 2.3 | % |
| Housing | 1.1 | % |
*Does not include short-term investments and other net assets.
Manager’s Discussion
We used various investment strategies during the 12 months under review as we sought to maximize tax-free income for shareholders. Please read the discussion on page 6 for details.
During the reporting period, the Fund continued to generate high, current, tax-free income for its shareholders. Consistent with our strategy, the Fund did not use leverage or credit derivatives to boost short-term returns, and we were careful to not overexpose the portfolio to any one credit sector.
Thank you for your continued participation in Franklin High Yield Tax-Free Income Fund. We believe our conservative, buy-and-hold investment strategy can help us achieve high, current, tax-free income for shareholders.
The foregoing information reflects our analysis, opinions and portfolio holdings as of February 29, 2012, the end of the reporting period. The way we implement our main investment strategies and the resulting portfolio holdings may change depending on factors such as market and economic conditions. These opinions may not be relied upon as investment advice or an offer for a particular security. The information is not a complete analysis of every aspect of any market, state, industry, security or the Fund. Statements of fact are from sources considered reliable, but the investment manager makes no representation or warranty as to their completeness or accuracy. Although historical performance is no guarantee of future results, these insights may help you understand our investment management philosophy.
36 | Annual Report
Performance Summary as of 2/29/12
Franklin High Yield Tax-Free Income Fund
Your dividend income will vary depending on dividends or interest paid by securities in the Fund’s portfolio, adjusted for operating expenses of each class. Capital gain distributions are net profits realized from the sale of portfolio securities. The performance table and graphs do not reflect any taxes that a shareholder would pay on Fund dividends, capital gain distributions, if any, or any realized gains on the sale of Fund shares. Total return reflects reinvestment of the Fund’s dividends and capital gain distributions, if any, and any unrealized gains or losses.
| | | | | | | | |
| Price and Distribution Information | | | | | | |
| Class A (Symbol: FRHIX) | | | | Change | | 2/29/12 | | 2/28/11 |
| Net Asset Value (NAV) | | | +$ | 0.99 | $ | 10.59 | $ | 9.60 |
| Distributions (3/1/11–2/29/12) | | | | | | | | |
| Dividend Income | $ | 0.5243 | | | | | | |
| Class B (Symbol: FYIBX) | | | | Change | | 2/29/12 | | 2/28/11 |
| Net Asset Value (NAV) | | | +$ | 1.00 | $ | 10.68 | $ | 9.68 |
| Distributions (3/1/11–2/29/12) | | | | | | | | |
| Dividend Income | $ | 0.4705 | | | | | | |
| Class C (Symbol: FHYIX) | | | | Change | | 2/29/12 | | 2/28/11 |
| Net Asset Value (NAV) | | | +$ | 1.02 | $ | 10.75 | $ | 9.73 |
| Distributions (3/1/11–2/29/12) | | | | | | | | |
| Dividend Income | $ | 0.4696 | | | | | | |
| Advisor Class (Symbol: FHYVX) | | | | Change | | 2/29/12 | | 2/28/11 |
| Net Asset Value (NAV) | | | +$ | 1.00 | $ | 10.63 | $ | 9.63 |
| Distributions (3/1/11–2/29/12) | | | | | | | | |
| Dividend Income | $ | 0.5340 | | | | | | |
Annual Report | 37
Performance Summary (continued)
Performance
Cumulative total return excludes sales charges. Average annual total returns include maximum sales charges. Class A: 4.25% maximum initial sales charge; Class B: contingent deferred sales charge (CDSC) declining from 4% to 1% over six years, and eliminated thereafter; Class C: 1% CDSC in first year only; Advisor Class: no sales charges.
| | | | | | | | | | | |
| Class A | | | | 1-Year | | | 5-Year | | | 10-Year | |
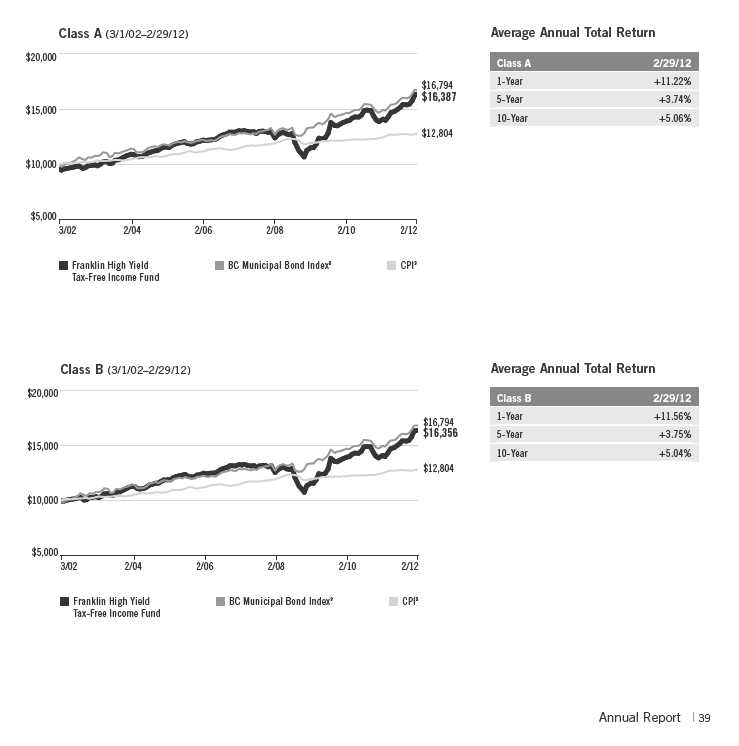
| Cumulative Total Return1 | | | + | 16.20 | % | + | 25.49 | % | + | 71.15 | % |
| Average Annual Total Return2 | | | + | 11.22 | % | + | 3.74 | % | + | 5.06 | % |
| Avg. Ann. Total Return (3/31/12)3 | | | + | 11.90 | % | + | 3.78 | % | + | 5.15 | % |
| Distribution Rate4 | 4.39 | % | | | | | | | | | |
| Taxable Equivalent Distribution Rate5 | 6.75 | % | | | | | | | | | |
| 30-Day Standardized Yield6 | 3.70 | % | | | | | | | | | |
| Taxable Equivalent Yield5 | 5.69 | % | | | | | | | | | |
| Total Annual Operating Expenses7 | 0.63 | % | | | | | | | | | |
| Class B | | | | 1-Year | | | 5-Year | | | 10-Year | |
| Cumulative Total Return1 | | | + | 15.56 | % | + | 22.13 | % | + | 63.56 | % |
| Average Annual Total Return2 | | | + | 11.56 | % | + | 3.75 | % | + | 5.04 | % |
| Avg. Ann. Total Return (3/31/12)3 | | | + | 12.33 | % | + | 3.79 | % | + | 5.14 | % |
| Distribution Rate4 | 3.98 | % | | | | | | | | | |
| Taxable Equivalent Distribution Rate5 | 6.12 | % | | | | | | | | | |
| 30-Day Standardized Yield6 | 3.31 | % | | | | | | | | | |
| Taxable Equivalent Yield5 | 5.09 | % | | | | | | | | | |
| Total Annual Operating Expenses7 | 1.18 | % | | | | | | | | | |
| Class C | | | | 1-Year | | | 5-Year | | | 10-Year | |
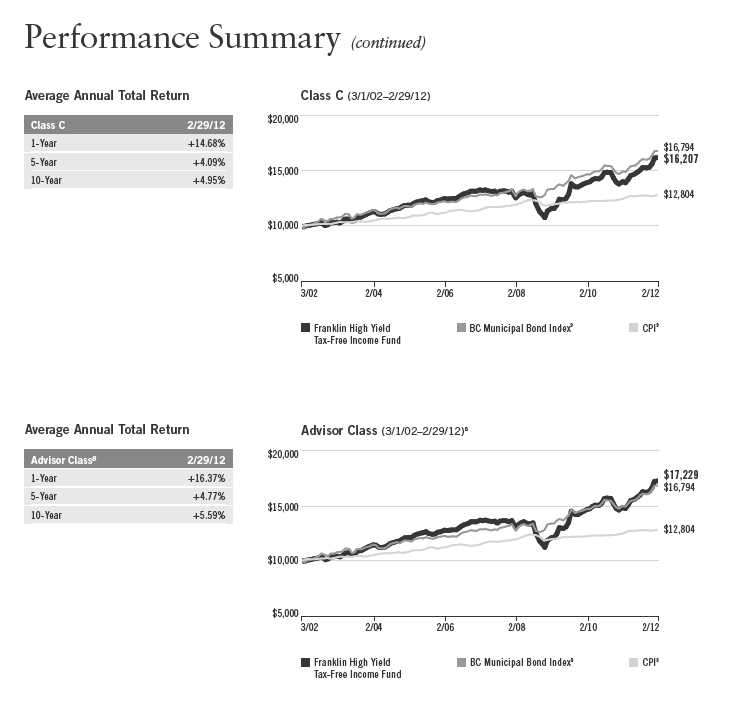
| Cumulative Total Return1 | | | + | 15.68 | % | + | 22.17 | % | + | 62.07 | % |
| Average Annual Total Return2 | | | + | 14.68 | % | + | 4.09 | % | + | 4.95 | % |
| Avg. Ann. Total Return (3/31/12)3 | | | + | 15.32 | % | + | 4.13 | % | + | 5.03 | % |
| Distribution Rate4 | 3.95 | % | | | | | | | | | |
| Taxable Equivalent Distribution Rate5 | 6.08 | % | | | | | | | | | |
| 30-Day Standardized Yield6 | 3.32 | % | | | | | | | | | |
| Taxable Equivalent Yield5 | 5.11 | % | | | | | | | | | |
| Total Annual Operating Expenses7 | 1.18 | % | | | | | | | | | |
| Advisor Class8 | | | | 1-Year | | | 5-Year | | | 10-Year | |
| Cumulative Total Return1 | | | + | 16.37 | % | + | 26.25 | % | + | 72.29 | % |
| Average Annual Total Return2 | | | + | 16.37 | % | + | 4.77 | % | + | 5.59 | % |
| Avg. Ann. Total Return (3/31/12)3 | | | + | 17.02 | % | + | 4.82 | % | + | 5.67 | % |
| Distribution Rate4 | 4.67 | % | | | | | | | | | |
| Taxable Equivalent Distribution Rate5 | 7.18 | % | | | | | | | | | |
| 30-Day Standardized Yield6 | 3.98 | % | | | | | | | | | |
| Taxable Equivalent Yield5 | 6.12 | % | | | | | | | | | |
| Total Annual Operating Expenses7 | 0.53 | % | | | | | | | | | |
Performance data represent past performance, which does not guarantee future results. Investment return and principal value will fluctuate, and you may have a gain or loss when you sell your shares. Current performance may differ from figures shown. For most recent month-end performance, go to franklintempleton.com or call (800) 342-5236.
38 | Annual Report
Performance Summary (continued)
Total Return Index Comparison for a Hypothetical $10,000 Investment
Total return represents the change in value of an investment over the periods shown. It includes any current, applicable, maximum sales charge, Fund expenses, account fees and reinvested distributions. The unmanaged index includes reinvestment of any income or distributions. It differs from the Fund in composition and does not pay management fees or expenses. One cannot invest directly in an index.
40 | Annual Report
Performance Summary (continued)
Endnotes
All investments involve risks, including possible loss of principal. Because municipal bonds are sensitive to interest rate movements, the Fund’s yield and share price will fluctuate with market conditions. Bond prices generally move in the opposite direction of interest rates. Thus, as prices of bonds in the Fund adjust to a rise in interest rates, the Fund’s share price may decline. Changes in the financial strength of a bond issuer or in a bond’s credit rating may affect its value. The Fund is actively managed but there is no guarantee that the manager’s investment decisions will produce the desired results. In general, an investor is paid a higher yield to assume a greater degree of credit risk. The Fund’s prospectus also includes a description of the main investment risks.
| |
Class B: Class C: | These shares have higher annual fees and expenses than Class A shares. Prior to 1/1/04, these shares were offered with an initial sales charge; thus actual total returns would have differed. These shares have higher annual fees and expenses than Class A shares. |
Advisor Class: | Shares are available to certain eligible investors as described in the prospectus. |
1. Cumulative total return represents the change in value of an investment over the periods indicated.
2. Average annual total return represents the average annual change in value of an investment over the periods indicated.
3. In accordance with SEC rules, we provide standardized average annual total return information through the latest calendar quarter.
4. Distribution rate is based on an annualization of the respective class’s current monthly dividend and the maximum offering price (NAV for Classes B, C and Advisor) per share on 2/29/12.
5. Taxable equivalent distribution rate and yield assume the 2012 maximum federal income tax rate of 35.00%.
6. The 30-day standardized yield for the month ended 2/29/12 reflects an estimated yield to maturity (assuming all portfolio securities are held to maturity). It should be regarded as an estimate of the Fund’s rate of investment income, and it may not equal the Fund’s actual income distribution rate (which reflects the Fund’s past dividends paid to shareholders) or the income reported in the Fund’s financial statements.
7. Figures are as stated in the Fund’s prospectus current as of the date of this report. In periods of market volatility, assets may decline significantly, causing total annual Fund operating expenses to become higher than the figures shown.
8. Effective 1/3/06, the Fund began offering Advisor Class shares, which do not have sales charges or a Rule 12b-1 plan. Performance quotations for this class reflect the following methods of calculation: (a) For periods prior to 1/3/06, a restated figure is used based upon the Fund’s Class A performance, excluding the effect of Class A’s maximum initial sales charge, but reflecting the effect of the Class A Rule 12b-1 fees; and (b) for periods after 1/3/06, actual Advisor Class performance is used reflecting all charges and fees applicable to that class. Since 1/3/06 (commencement of sales), the cumulative and average annual total returns of Advisor Class shares were +37.01% and +5.25%.
9. Source: © 2012 Morningstar. The BC Municipal Bond Index is a market value-weighted index engineered for the long-term tax-exempt bond market. To be included in the index, bonds must be fixed rate, have at least one year to final maturity and be rated investment grade (Baa3/BBB- or higher) by at least two of the following agencies: Moody’s, Standard & Poor’s and Fitch. The Consumer Price Index (CPI), calculated by the U.S. Bureau of Labor Statistics, is a commonly used measure of the inflation rate.
Annual Report | 41
Your Fund’s Expenses
Franklin High Yield Tax-Free Income Fund
As a Fund shareholder, you can incur two types of costs:
- Transaction costs, including sales charges (loads) on Fund purchases; and
- Ongoing Fund costs, including management fees, distribution and service (12b-1) fees, and other Fund expenses. All mutual funds have ongoing costs, sometimes referred to as operating expenses.
The following table shows ongoing costs of investing in the Fund and can help you understand these costs and compare them with those of other mutual funds. The table assumes a $1,000 investment held for the six months indicated.
Actual Fund Expenses
The first line (Actual) for each share class listed in the table provides actual account values and expenses. The “Ending Account Value” is derived from the Fund’s actual return, which includes the effect of Fund expenses.
You can estimate the expenses you paid during the period by following these steps. Of course, your account value and expenses will differ from those in this illustration:
| 1 | Divide your account value by $1,000. |
| | If an account had an $8,600 value, then $8,600 ÷ $1,000 = 8.6. |
| 2. | Multiply the result by the number under the heading “Expenses Paid During Period.” |
| | If Expenses Paid During Period were $7.50, then 8.6 x $7.50 = $64.50. |
In this illustration, the estimated expenses paid this period are $64.50.
Hypothetical Example for Comparison with Other Funds
Information in the second line (Hypothetical) for each class in the table can help you compare ongoing costs of investing in the Fund with those of other mutual funds. This information may not be used to estimate the actual ending account balance or expenses you paid during the period. The hypothetical “Ending Account Value” is based on the actual expense ratio for each class and an assumed 5% annual rate of return before expenses, which does not represent the Fund’s actual return. The figure under the heading “Expenses Paid During Period” shows the hypothetical expenses your account would have incurred under this scenario. You can compare this figure with the 5% hypothetical examples that appear in shareholder reports of other funds.
42 | Annual Report
Your Fund’s Expenses (continued)
Please note that expenses shown in the table are meant to highlight ongoing costs and do not reflect any transaction costs, such as sales charges. Therefore, the second line for each class is useful in comparing ongoing costs only, and will not help you compare total costs of owning different funds. In addition, if transaction costs were included, your total costs would have been higher. Please refer to the Fund prospectus for additional information on operating expenses.
| | | | | | |
| | | Beginning Account | | Ending Account | | Expenses Paid During |
| Class A | | Value 9/1/11 | | Value 2/29/12 | | Period* 9/1/11–2/29/12 |
| Actual | $ | 1,000 | $ | 1,080.50 | $ | 3.36 |
| Hypothetical (5% return before expenses) | $ | 1,000 | $ | 1,021.63 | $ | 3.27 |
| Class B | | | | | | |
| Actual | $ | 1,000 | $ | 1,077.90 | $ | 6.20 |
| Hypothetical (5% return before expenses) | $ | 1,000 | $ | 1,018.90 | $ | 6.02 |
| Class C | | | | | | |
| Actual | $ | 1,000 | $ | 1,077.30 | $ | 6.20 |
| Hypothetical (5% return before expenses) | $ | 1,000 | $ | 1,018.90 | $ | 6.02 |
| Advisor Class | | | | | | |
| Actual | $ | 1,000 | $ | 1,081.80 | $ | 2.85 |
| Hypothetical (5% return before expenses) | $ | 1,000 | $ | 1,022.13 | $ | 2.77 |
*Expenses are calculated using the most recent six-month expense ratio, annualized for each class (A: 0.65%; B: 1.20%; C: 1.20%; and Advisor: 0.55%), multiplied by the average account value over the period, multiplied by 182/366 to reflect the one-half year period.
Annual Report | 43
Franklin Insured Tax-Free Income Fund
Your Fund’s Goal and Main Investments: Franklin Insured Tax-Free Income Fund seeks to provide as high a level of income exempt from federal income taxes as is consistent with prudent investment management and preservation of capital by investing at least 80% of its total assets in securities that pay interest free from such taxes.1 The Fund invests predominantly in insured municipal securities.2

Performance data represent past performance, which does not guarantee future results. Investment return and principal value will fluctuate, and you may have a gain or loss when you sell your shares. Current performance may differ from figures shown. Please visit franklintempleton.com or call (800) 342-5236 for most recent month-end performance.
Performance Overview
The Fund’s Class A share price, as measured by net asset value, increased from $11.39 on February 28, 2011, to $12.37 on February 29, 2012. The Fund’s
1. Dividends are generally subject to state and local taxes, if any. For investors subject to alternative minimum tax, a small portion of Fund dividends may be taxable. Distributions of capital gains are generally taxable. To avoid imposition of 28% backup withholding on all Fund distributions and redemption proceeds, U.S. investors must be properly certified on Form W-9 and non-U.S. investors on Form W-8BEN.
2. Fund shares are not insured by any U.S. or other government agency. They are subject to market risks and will fluctuate in value.
The dollar value, number of shares or principal amount, and names of all portfolio holdings are listed in the Fund’s Statement of Investments (SOI). The SOI begins on page 147.
44 | Annual Report
| | | | |
| Dividend Distributions* | | | | |
| Franklin Insured Tax-Free Income Fund | | | |
| | | Dividend per Share | |
| Month | Class A | Class B | Class C | Advisor Class |
| March 2011 | 4.30 cents | 3.82 cents | 3.80 cents | 4.39 cents |
| April 2011 | 4.30 cents | 3.82 cents | 3.80 cents | 4.39 cents |
| May 2011 | 4.30 cents | 3.82 cents | 3.80 cents | 4.39 cents |
| June 2011 | 4.35 cents | 3.86 cents | 3.84 cents | 4.44 cents |
| July 2011 | 4.35 cents | 3.86 cents | 3.84 cents | 4.44 cents |
| August 2011 | 4.35 cents | 3.86 cents | 3.84 cents | 4.44 cents |
| September 2011 | 4.35 cents | 3.81 cents | 3.80 cents | 4.44 cents |
| October 2011 | 4.35 cents | 3.81 cents | 3.80 cents | 4.44 cents |
| November 2011 | 4.35 cents | 3.81 cents | 3.80 cents | 4.44 cents |
| December 2011** | 5.48 cents | 4.69 cents | 4.72 cents | 5.63 cents |
| January 2012 | 2.82 cents | 2.41 cents | 2.42 cents | 2.89 cents |
| February 2012 | 4.15 cents | 3.55 cents | 3.57 cents | 4.26 cents |
*Assumes shares were purchased and held for the entire accrual period, which differs from the calendar month. Since dividends accrue daily, your actual distributions will vary depending on the date you purchased your shares and any account activity. All Fund distributions will vary depending upon current market conditions, and past distributions are not indicative of future trends.
**The December per-share dividend distribution consisted of payments on 12/20/11 and 12/30/11 for each class as follows: Class A, 4.15 cents and 1.33 cents; Class B, 3.55 cents and 1.14 cents; Class C, 3.57 cents and 1.15 cents; and Advisor Class, 4.26 cents and 1.37 cents.
Class A shares paid dividends totaling 51.50 cents per share for the same period.3 The Performance Summary beginning on page 47 shows that at the end of this reporting period the Fund’s Class A shares’ distribution rate was 3.67%, based on an annualization of the current 3.95 cent per share dividend and the maximum offering price of $12.92 on February 29, 2012. An investor in the 2012 maximum federal income tax bracket of 35.00% would need to earn a distribution rate of 5.65% from a taxable investment to match the Fund’s Class A tax-free distribution rate. For the Fund’s Class B, C and Advisor shares’ performance, please see the Performance Summary. The reduction in dividend distributions from the start to the end of the period under review reflected generally declining interest rates. Additionally, investor demand was strong for municipal bonds in an environment of limited tax-exempt supply. These factors resulted in reduced income for the portfolio and caused dividends to decline overall.
3. All Fund distributions will vary depending upon current market conditions, and past distributions are not indicative of future trends.
Annual Report | 45
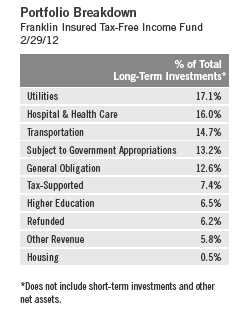
Manager’s Discussion
We used various investment strategies during the 12 months under review as we sought to maximize tax-free income for shareholders. Please read the discussion on page 6 for details.
During the reporting period, we limited Fund purchases to bonds insured by Assured Guaranty and non-insured bonds rated AA or higher by independent credit rating agencies. The municipal bond insurance industry has gone through significant downgrades since the 2008 financial crisis. As a result, Assured Guaranty was the only major municipal bond insurer currently providing new municipal bond insurance. Aside from Berkshire Hathaway Assurance, Assured Guaranty was the only insurer that carried a rating in the AA category. Since October 2010, when Standard & Poor’s downgraded Assured Guaranty to AA+ from AAA, no municipal bond insurers have been rated AAA.
We will continue to closely monitor the municipal insurance industry’s progress and the market for insured bonds. As always, we strive for solid performance on a relative value basis with a focus on income and credit safety.
Thank you for your continued participation in Franklin Insured Tax-Free Income Fund. We believe our conservative, buy-and-hold investment strategy can help us achieve high, current, tax-free income for shareholders.
The foregoing information reflects our analysis, opinions and portfolio holdings as of February 29, 2012, the end of the reporting period. The way we implement our main investment strategies and the resulting portfolio holdings may change depending on factors such as market and economic conditions. These opinions may not be relied upon as investment advice or an offer for a particular security. The information is not a complete analysis of every aspect of any market, state, industry, security or the Fund. Statements of fact are from sources considered reliable, but the investment manager makes no representation or warranty as to their completeness or accuracy. Although historical performance is no guarantee of future results, these insights may help you understand our investment management philosophy.
46 | Annual Report
Performance Summary as of 2/29/12
Franklin Insured Tax-Free Income Fund
Your dividend income will vary depending on dividends or interest paid by securities in the Fund’s portfolio, adjusted for operating expenses of each class. Capital gain distributions are net profits realized from the sale of portfolio securities. The performance table and graphs do not reflect any taxes that a shareholder would pay on Fund dividends, capital gain distributions, if any, or any realized gains on the sale of Fund shares. Total return reflects reinvestment of the Fund’s dividends and capital gain distributions, if any, and any unrealized gains or losses.
| | | | | | | | |
| Price and Distribution Information | | | | | | |
| Class A (Symbol: FTFIX) | | | | Change | | 2/29/12 | | 2/28/11 |
| Net Asset Value (NAV) | | | +$ | 0.98 | $ | 12.37 | $ | 11.39 |
| Distributions (3/1/11–2/29/12) | | | | | | | | |
| Dividend Income | $ | 0.5150 | | | | | | |
| Class B (Symbol: FBITX) | | | | Change | | 2/29/12 | | 2/28/11 |
| Net Asset Value (NAV) | | | +$ | 0.98 | $ | 12.43 | $ | 11.45 |
| Distributions (3/1/11–2/29/12) | | | | | | | | |
| Dividend Income | $ | 0.4511 | | | | | | |
| Class C (Symbol: FRITX) | | | | Change | | 2/29/12 | | 2/28/11 |
| Net Asset Value (NAV) | | | +$ | 0.99 | $ | 12.52 | $ | 11.53 |
| Distributions (3/1/11–2/29/12) | | | | | | | | |
| Dividend Income | $ | 0.4503 | | | | | | |
| Advisor Class (Symbol: FINZX) | | | | Change | | 2/29/12 | | 2/28/11 |
| Net Asset Value (NAV) | | | +$ | 0.97 | $ | 12.36 | $ | 11.39 |
| Distributions (3/1/11–2/29/12) | | | | | | | | |
| Dividend Income | $ | 0.5265 | | | | �� | | |
Annual Report | 47
Performance Summary (continued)
Performance
Cumulative total return excludes sales charges. Average annual total returns include maximum sales charges. Class A: 4.25% maximum initial sales charge; Class B: contingent deferred sales charge (CDSC) declining from 4% to 1% over six years, and eliminated thereafter; Class C: 1% CDSC in first year only; Advisor Class: no sales charges.
| | | | | | | | | | | |
| Class A | | | | 1-Year | | | 5-Year | | | 10-Year | |
| Cumulative Total Return1 | | | + | 13.40 | % | + | 25.06 | % | + | 58.98 | % |
| Average Annual Total Return2 | | | + | 8.54 | % | + | 3.66 | % | + | 4.29 | % |
| Avg. Ann. Total Return (3/31/12)3 | | | + | 8.95 | % | + | 3.64 | % | + | 4.43 | % |
| Distribution Rate4 | 3.67 | % | | | | | | | | | |
| Taxable Equivalent Distribution Rate5 | 5.65 | % | | | | | | | | | |
| 30-Day Standardized Yield6 | 2.78 | % | | | | | | | | | |
| Taxable Equivalent Yield5 | 4.28 | % | | | | | | | | | |
| Total Annual Operating Expenses7 | 0.63 | % | | | | | | | | | |
| Class B | | | | 1-Year | | | 5-Year | | | 10-Year | |
| Cumulative Total Return1 | | | + | 12.73 | % | + | 21.66 | % | + | 52.18 | % |
| Average Annual Total Return2 | | | + | 8.73 | % | + | 3.65 | % | + | 4.29 | % |
| Avg. Ann. Total Return (3/31/12)3 | | | + | 9.20 | % | + | 3.62 | % | + | 4.43 | % |
| Distribution Rate4 | 3.24 | % | | | | | | | | | |
| Taxable Equivalent Distribution Rate5 | 4.98 | % | | | | | | | | | |
| 30-Day Standardized Yield6 | 2.36 | % | | | | | | | | | |
| Taxable Equivalent Yield5 | 3.63 | % | | | | | | | | | |
| Total Annual Operating Expenses7 | 1.18 | % | | | | | | | | | |
| Class C | | | | 1-Year | | | 5-Year | | | 10-Year | |
| Cumulative Total Return1 | | | + | 12.72 | % | + | 21.78 | % | + | 50.70 | % |
| Average Annual Total Return2 | | | + | 11.72 | % | + | 4.02 | % | + | 4.19 | % |
| Avg. Ann. Total Return (3/31/12)3 | | | + | 12.19 | % | + | 3.99 | % | + | 4.33 | % |
| Distribution Rate4 | 3.22 | % | | | | | | | | | |
| Taxable Equivalent Distribution Rate5 | 4.95 | % | | | | | | | | | |
| 30-Day Standardized Yield6 | 2.37 | % | | | | | | | | | |
| Taxable Equivalent Yield5 | 3.65 | % | | | | | | | | | |
| Total Annual Operating Expenses7 | 1.18 | % | | | | | | | | | |
| Advisor Class8 | | | | 1-Year | | | 5-Year | | | 10-Year | |
| Cumulative Total Return1 | | | + | 13.42 | % | + | 25.42 | % | + | 59.43 | % |
| Average Annual Total Return2 | | | + | 13.42 | % | + | 4.63 | % | + | 4.78 | % |
| Avg. Ann. Total Return (3/31/12)3 | | | + | 13.90 | % | + | 4.62 | % | + | 4.93 | % |
| Distribution Rate4 | 3.93 | % | | | | | | | | | |
| Taxable Equivalent Distribution Rate5 | 6.05 | % | | | | | | | | | |
| 30-Day Standardized Yield6 | 3.01 | % | | | | | | | | | |
| Taxable Equivalent Yield5 | 4.63 | % | | | | | | | | | |
| Total Annual Operating Expenses7 | 0.53 | % | | | | | | | | | |
Performance data represent past performance, which does not guarantee future results. Investment return and principal value will fluctuate, and you may have a gain or loss when you sell your shares. Current performance may differ from figures shown. For most recent month-end performance, go to franklintempleton.com or call (800) 342-5236.
48 | Annual Report
Performance Summary (continued)
Total Return Index Comparison for a Hypothetical $10,000 Investment
Total return represents the change in value of an investment over the periods shown. It includes any current, applicable, maximum sales charge, Fund expenses, account fees and reinvested distributions. The unmanaged index includes reinvestment of any income or distributions. It differs from the Fund in composition and does not pay management fees or expenses. One cannot invest directly in an index.
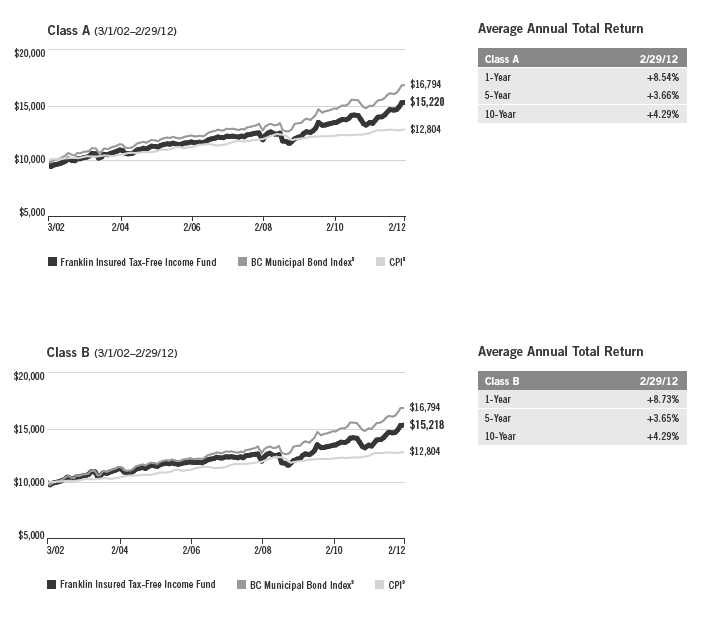
Annual Report | 49
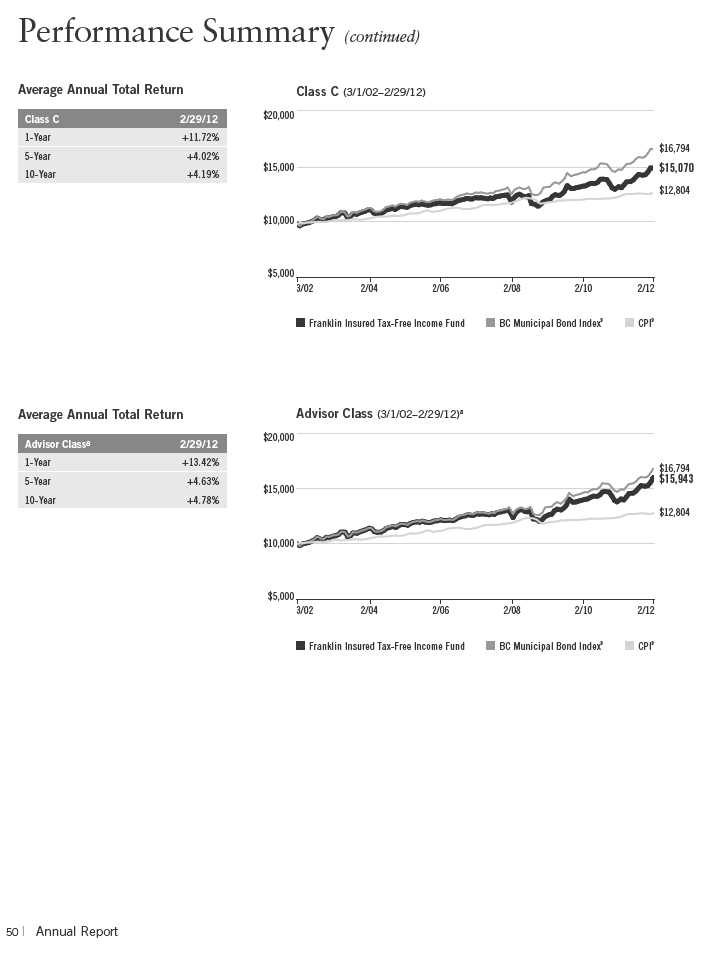
Performance Summary (continued)
Endnotes
All investments involve risks, including possible loss of principal. Because municipal bonds are sensitive to interest rate movements, the Fund’s yield and share price will fluctuate with market conditions. Bond prices generally move in the opposite direction of interest rates. Thus, as prices of bonds in the Fund adjust to a rise in interest rates, the Fund’s share price may decline. Changes in the financial strength of a bond issuer or in a bond’s credit rating may affect its value. The Fund is actively managed but there is no guarantee that the manager’s investment decisions will produce the desired results. The Fund’s prospectus also includes a description of the main investment risks.
| |
Class B: Class C: | These shares have higher annual fees and expenses than Class A shares. Prior to 1/1/04, these shares were offered with an initial sales charge; thus actual total returns would have differed. These shares have higher annual fees and expenses than Class A shares. |
Advisor Class: | Shares are available to certain eligible investors as described in the prospectus. |
1. Cumulative total return represents the change in value of an investment over the periods indicated.
2. Average annual total return represents the average annual change in value of an investment over the periods indicated.
3. In accordance with SEC rules, we provide standardized average annual total return information through the latest calendar quarter.
4. Distribution rate is based on an annualization of the respective class’s current monthly dividend and the maximum offering price (NAV for Classes B, C and Advisor) per share on 2/29/12.
5. Taxable equivalent distribution rate and yield assume the 2012 maximum federal income tax rate of 35.00%.
6. The 30-day standardized yield for the month ended 2/29/12 reflects an estimated yield to maturity (assuming all portfolio securities are held to maturity). It should be regarded as an estimate of the Fund’s rate of investment income, and it may not equal the Fund’s actual income distribution rate (which reflects the Fund’s past dividends paid to shareholders) or the income reported in the Fund’s financial statements.
7. Figures are as stated in the Fund’s prospectus current as of the date of this report. In periods of market volatility, assets may decline significantly, causing total annual Fund operating expenses to become higher than the figures shown.
8. Effective 7/1/08, the Fund began offering Advisor Class shares, which do not have sales charges or a Rule 12b-1 plan. Performance quotations for this class reflect the following methods of calculation: (a) For periods prior to 7/1/08, a restated figure is used based upon the Fund’s Class A performance, excluding the effect of Class A’s maximum initial sales charge, but reflecting the effect of the Class A Rule 12b-1 fees; and (b) for periods after 7/1/08, actual Advisor Class performance is used reflecting all charges and fees applicable to that class. Since 7/1/08 (commencement of sales), the cumulative and average annual total returns of Advisor Class shares were +22.98% and +5.81%.
9. Source: © 2012 Morningstar. The BC Municipal Bond Index is a market value-weighted index engineered for the long-term tax-exempt bond market. To be included in the index, bonds must be fixed rate, have at least one year to final maturity and be rated investment grade (Baa3/BBB- or higher) by at least two of the following agencies: Moody’s, Standard & Poor’s and Fitch. The Consumer Price Index (CPI), calculated by the U.S. Bureau of Labor Statistics, is a commonly used measure of the inflation rate.
Annual Report | 51
Your Fund’s Expenses
Franklin Insured Tax-Free Income Fund
As a Fund shareholder, you can incur two types of costs:
- Transaction costs, including sales charges (loads) on Fund purchases; and
- Ongoing Fund costs, including management fees, distribution and service (12b-1) fees, and other Fund expenses. All mutual funds have ongoing costs, sometimes referred to as operating expenses.
The following table shows ongoing costs of investing in the Fund and can help you understand these costs and compare them with those of other mutual funds. The table assumes a $1,000 investment held for the six months indicated.
Actual Fund Expenses
The first line (Actual) for each share class listed in the table provides actual account values and expenses. The “Ending Account Value” is derived from the Fund’s actual return, which includes the effect of Fund expenses.
You can estimate the expenses you paid during the period by following these steps. Of course, your account value and expenses will differ from those in this illustration:
| 1. | Divide your account value by $1,000. |
| | If an account had an $8,600 value, then $8,600 ÷ $1,000 = 8.6. |
| 2. | Multiply the result by the number under the heading “Expenses Paid During Period.” |
| | If Expenses Paid During Period were $7.50, then 8.6 x $7.50 = $64.50. |
In this illustration, the estimated expenses paid this period are $64.50.
Hypothetical Example for Comparison with Other Funds
Information in the second line (Hypothetical) for each class in the table can help you compare ongoing costs of investing in the Fund with those of other mutual funds. This information may not be used to estimate the actual ending account balance or expenses you paid during the period. The hypothetical “Ending Account Value” is based on the actual expense ratio for each class and an assumed 5% annual rate of return before expenses, which does not represent the Fund’s actual return. The figure under the heading “Expenses Paid During Period” shows the hypothetical expenses your account would have incurred under this scenario. You can compare this figure with the 5% hypothetical examples that appear in shareholder reports of other funds.
52 | Annual Report
Your Fund’s Expenses (continued)
Please note that expenses shown in the table are meant to highlight ongoing costs and do not reflect any transaction costs, such as sales charges. Therefore, the second line for each class is useful in comparing ongoing costs only, and will not help you compare total costs of owning different funds. In addition, if transaction costs were included, your total costs would have been higher. Please refer to the Fund prospectus for additional information on operating expenses.
| | | | | | |
| | | Beginning Account | | Ending Account | | Expenses Paid During |
| Class A | | Value 9/1/11 | | Value 2/29/12 | | Period* 9/1/11–2/29/12 |
| Actual | $ | 1,000 | $ | 1,060.50 | $ | 3.18 |
| Hypothetical (5% return before expenses) | $ | 1,000 | $ | 1,021.78 | $ | 3.12 |
| Class B | | | | | | |
| Actual | $ | 1,000 | $ | 1,057.20 | $ | 6.04 |
| Hypothetical (5% return before expenses) | $ | 1,000 | $ | 1,019.00 | $ | 5.92 |
| Class C | | | | | | |
| Actual | $ | 1,000 | $ | 1,056.80 | $ | 5.98 |
| Hypothetical (5% return before expenses) | $ | 1,000 | $ | 1,019.05 | $ | 5.87 |
| Advisor Class | | | | | | |
| Actual | $ | 1,000 | $ | 1,060.20 | $ | 2.66 |
| Hypothetical (5% return before expenses) | $ | 1,000 | $ | 1,022.28 | $ | 2.61 |
*Expenses are calculated using the most recent six-month expense ratio, annualized for each class (A: 0.62%; B: 1.18%; C: 1.17%; and Advisor: 0.52%), multiplied by the average account value over the period, multiplied by 182/366 to reflect the one-half year period.
Annual Report | 53
Franklin Massachusetts Tax-Free Income Fund
Your Fund’s Goal and Main Investments: Franklin Massachusetts Tax-Free Income Fund seeks to provide as high a level of income exempt from federal and Massachusetts personal income taxes as is consistent with prudent investment management and preservation of capital by investing at least 80% of its total assets in securities that pay interest free from such taxes.1
Performance data represent past performance, which does not guarantee future results. Investment return and principal value will fluctuate, and you may have a gain or loss when you sell your shares. Current performance may differ from figures shown. Please visit franklintempleton.com or call (800) 342-5236 for most recent month-end performance.
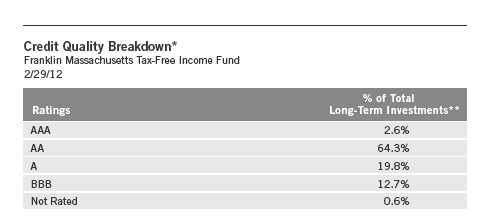
*Standard & Poor’s (S&P) is the primary independent rating agency source. Moody’s is secondary, and Fitch, if available, is used for securities not rated by Moody’s or S&P. The ratings are an indication of an issuer’s creditworthiness, with long-term ratings typically ranging from AAA (highest) to Below Investment Grade (lowest; includes ratings BB to D). This methodology differs from that used in Fund marketing materials.
**Does not include short-term investments and other net assets.
We are pleased to bring you Franklin Massachusetts Tax-Free Income Fund’s annual report for the fiscal year ended February 29, 2012.
Performance Overview
The Fund’s Class A share price, as measured by net asset value, increased from $11.11 on February 28, 2011, to $12.02 on February 29, 2012. The Fund’s Class A shares paid dividends totaling 46.68 cents per share for the same period.2 The Performance Summary beginning on page 58 shows that at the end of this reporting period the Fund’s Class A shares’ distribution rate was
1. For investors subject to alternative minimum tax, a small portion of Fund dividends may be taxable. Distributions of capital gains are generally taxable. To avoid imposition of 28% backup withholding on all Fund distributions and redemption proceeds, U.S. investors must be properly certified on Form W-9 and non-U.S. investors on Form W-8BEN.
2. All Fund distributions will vary depending upon current market conditions, and past distributions are not indicative of future trends.
The dollar value, number of shares or principal amount, and names of all portfolio holdings are listed in the Fund’s Statement of Investments (SOI). The SOI begins on page 166.
54 | Annual Report
| | | |
| Dividend Distributions* | | | |
| Franklin Massachusetts Tax-Free Income Fund | | | |
| | | Dividend per Share |
| Month | Class A | Class C | Advisor Class |
| March 2011 | 3.88 cents | 3.40 cents | 3.97 cents |
| April 2011 | 3.88 cents | 3.40 cents | 3.97 cents |
| May 2011 | 3.88 cents | 3.40 cents | 3.97 cents |
| June 2011 | 3.88 cents | 3.38 cents | 3.97 cents |
| July 2011 | 3.88 cents | 3.38 cents | 3.97 cents |
| August 2011 | 3.88 cents | 3.38 cents | 3.97 cents |
| September 2011 | 3.88 cents | 3.34 cents | 3.97 cents |
| October 2011 | 3.88 cents | 3.34 cents | 3.97 cents |
| November 2011 | 3.88 cents | 3.34 cents | 3.97 cents |
| December 2011** | 5.13 cents | 4.40 cents | 5.25 cents |
| January 2012 | 2.63 cents | 2.26 cents | 2.69 cents |
| February 2012 | 3.88 cents | 3.33 cents | 3.97 cents |
*Assumes shares were purchased and held for the entire accrual period, which differs from the calendar month. Since dividends accrue daily, your actual distributions will vary depending on the date you purchased your shares and any account activity. All Fund distributions will vary depending upon current market conditions, and past distributions are not indicative of future trends.
**The December per-share dividend distribution consisted of payments on 12/20/11 and 12/30/11 for each class as follows: Class A, 3.88 cents and 1.25 cents; Class C, 3.33 cents and 1.07 cents; and Advisor Class, 3.97 cents and 1.28 cents.
3.60%, based on an annualization of the current 3.77 cent per share dividend and the maximum offering price of $12.55 on February 29, 2012. An investor in the 2012 maximum combined effective federal and Massachusetts personal income tax bracket of 38.45% would need to earn a distribution rate of 5.85% from a taxable investment to match the Fund’s Class A tax-free distribution rate. For the Fund’s Class C and Advisor shares’ performance, please see the Performance Summary.
Commonwealth Update
Massachusetts’s diverse economy continued to recover at a faster pace than the national average. While the commonwealth’s housing market remained weak, it showed signs of improvement as its foreclosure rate remained well below the national average and the number of housing permits continued to grow. The commonwealth’s improving economy resulted in job gains for sectors such as professional and business services, leisure and hospitality, and other services. Sectors that lost jobs included information, financial activities and construction. Massachusetts’s unemployment rate was 6.9% in February
Annual Report | 55
|
| Portfolio Breakdown |
| Franklin Massachusetts |
| Tax-Free Income Fund |
| 2/29/12 |
| |
| % of Total |
| Long-Term Investments* |
| | |
| Higher Education | 23.1 | % |
| Other Revenue | 16.3 | % |
| Tax-Supported | 13.0 | % |
| Refunded | 12.8 | % |
| Transportation | 9.1 | % |
| Hospital & Health Care | 8.7 | % |
| General Obligation | 8.1 | % |
| Utilities | 6.8 | % |
| Housing | 2.1 | % |
*Does not include short-term investments and other net assets.
2012, remaining well below the 8.3% national rate.3 Massachusetts has led the New England region in recovery, and its key economic anchors, centered on higher education, health care, and technology and defense contracting, are expected to contribute to further economic growth prospects over time. Ongoing challenges include high business and housing costs, slow population growth with negative migration trends, net job losses during the last two recessions and subsequent expansions, and the potential for future health care industry downsizing.
The commonwealth has effectively managed its finances during economic downturns and promptly identified and closed budget gaps through new revenues, spending cuts and prudent use of reserves. It ended fiscal year 2011 with a general fund surplus due to higher-than-expected tax revenues. Preliminary reports of tax collections for fiscal year 2012 through the end of December indicated continued revenue growth despite a decrease in personal income tax estimated payments. The enacted fiscal year 2012 budget was balanced by reducing expenditures while drawing from the Budget Stabilization Fund, which could result in a slight cushion, although the withdrawal would be subject to reduction or elimination if revenue collections increase.
Massachusetts’s debt levels were among the nation’s highest, with net tax-supported debt at 9.5% of personal income and $4,711 per capita, compared with the 2.8% and $1,066 national medians.4 Independent credit rating agency Moody’s Investors Service affirmed its Aa1 rating and stable outlook on Massachusetts’s general obligation bonds.5 The rating reflected the commonwealth’s high wealth and education attainment levels, demonstrated willingness to increase revenues and cut expenditures to balance the budget, as well as a sizable and high-wage education and health services sector that has helped offset job losses and maintain a degree of economic stability, high debt levels and adequate budget reserves. One future challenge may be its relatively low pension funding levels. The outlook reflected the commonwealth’s improving revenues, efforts to regain structural budget balance by reducing use of onetime resources, and Moody’s expectation that Massachusetts would continue to proactively close any budget gaps and rebuild reserves as its economic recovery continues.
3. Source: Bureau of Labor Statistics.
4. Source: Moody’s Investors Service, “Special Comment: 2011 State Debt Medians Report,” 6/3/11.
5. This does not indicate Moody’s rating of the Fund.
56 | Annual Report
Manager’s Discussion
We used various investment strategies during the 12 months under review as we sought to maximize tax-free income for shareholders. Please read the discussion on page 6 for details.
Thank you for your continued participation in Franklin Massachusetts Tax-Free Income Fund. We believe our conservative, buy-and-hold investment strategy can help us achieve high, current, tax-free income for shareholders.
The foregoing information reflects our analysis, opinions and portfolio holdings as of February 29, 2012, the end of the reporting period. The way we implement our main investment strategies and the resulting portfolio holdings may change depending on factors such as market and economic conditions. These opinions may not be relied upon as investment advice or an offer for a particular security. The information is not a complete analysis of every aspect of any market, state, industry, security or the Fund. Statements of fact are from sources considered reliable, but the investment manager makes no representation or warranty as to their completeness or accuracy. Although historical performance is no guarantee of future results, these insights may help you understand our investment management philosophy.
Annual Report | 57
Performance Summary as of 2/29/12
Franklin Massachusetts Tax-Free Income Fund
Your dividend income will vary depending on dividends or interest paid by securities in the Fund’s portfolio, adjusted for operating expenses of each class. Capital gain distributions are net profits realized from the sale of portfolio securities. The performance table and graphs do not reflect any taxes that a shareholder would pay on Fund dividends, capital gain distributions, if any, or any realized gains on the sale of Fund shares. Total return reflects reinvestment of the Fund’s dividends and capital gain distributions, if any, and any unrealized gains or losses.
| | | | | | | | |
| Price and Distribution Information | | | | | | |
| Class A (Symbol: FMISX) | | | | Change | | 2/29/12 | | 2/28/11 |
| Net Asset Value (NAV) | | | +$ | 0.91 | $ | 12.02 | $ | 11.11 |
| Distributions (3/1/11–2/29/12) | | | | | | | | |
| Dividend Income | $ | 0.4668 | | | | | | |
| Long-Term Capital Gain | $ | 0.0007 | | | | | | |
| Total | $ | 0.4675 | | | | | | |
| Class C (Symbol: FMAIX) | | | | Change | | 2/29/12 | | 2/28/11 |
| Net Asset Value (NAV) | | | +$ | 0.92 | $ | 12.14 | $ | 11.22 |
| Distributions (3/1/11–2/29/12) | | | | | | | | |
| Dividend Income | $ | 0.4042 | | | | | | |
| Long-Term Capital Gain | $ | 0.0007 | | | | | | |
| Total | $ | 0.4049 | | | | | | |
| Advisor Class (Symbol: n/a) | | | | Change | | 2/29/12 | | 2/28/11 |
| Net Asset Value (NAV) | | | +$ | 0.91 | $ | 12.02 | $ | 11.11 |
| Distributions (3/1/11–2/29/12) | | | | | | | | |
| Dividend Income | $ | 0.4777 | | | | | | |
| Long-Term Capital Gain | $ | 0.0007 | | | | | | |
| Total | $ | 0.4784 | | | | | | |
58 | Annual Report
Performance Summary (continued)
Performance
Cumulative total return excludes sales charges. Average annual total returns include maximum sales charges. Class A: 4.25% maximum initial sales charge; Class C: 1% contingent deferred sales charge in first year only; Advisor Class: no sales charges.
| | | | | | | | | | | |
| Class A | | | | 1-Year | | | 5-Year | | | 10-Year | |
| Cumulative Total Return1 | | | + | 12.65 | % | + | 24.18 | % | + | 58.42 | % |
| Average Annual Total Return2 | | | + | 7.89 | % | + | 3.53 | % | + | 4.25 | % |
| Avg. Ann. Total Return (3/31/12)3 | | | + | 7.97 | % | + | 3.42 | % | + | 4.35 | % |
| Distribution Rate4 | 3.60 | % | | | | | | | | | |
| Taxable Equivalent Distribution Rate5 | 5.85 | % | | | | | | | | | |
| 30-Day Standardized Yield6 | 2.54 | % | | | | | | | | | |
| Taxable Equivalent Yield5 | 4.13 | % | | | | | | | | | |
| Total Annual Operating Expenses7 | 0.66 | % | | | | | | | | | |
| Class C | | | | 1-Year | | | 5-Year | | | 10-Year | |
| Cumulative Total Return1 | | | + | 12.01 | % | + | 20.90 | % | + | 50.18 | % |
| Average Annual Total Return2 | | | + | 11.01 | % | + | 3.87 | % | + | 4.15 | % |
| Avg. Ann. Total Return (3/31/12)3 | | | + | 11.16 | % | + | 3.75 | % | + | 4.24 | % |
| Distribution Rate4 | 3.16 | % | | | | | | | | | |
| Taxable Equivalent Distribution Rate5 | 5.13 | % | | | | | | | | | |
| 30-Day Standardized Yield6 | 2.12 | % | | | | | | | | | |
| Taxable Equivalent Yield5 | 3.44 | % | | | | | | | | | |
| Total Annual Operating Expenses7 | 1.21 | % | | | | | | | | | |
| Advisor Class8 | | | | 1-Year | | | 5-Year | | | 10-Year | |
| Cumulative Total Return1 | | | + | 12.76 | % | + | 24.51 | % | + | 58.83 | % |
| Average Annual Total Return2 | | | + | 12.76 | % | + | 4.48 | % | + | 4.74 | % |
| Avg. Ann. Total Return (3/31/12)3 | | | + | 13.00 | % | + | 4.38 | % | + | 4.84 | % |
| Distribution Rate4 | 3.87 | % | | | | | | | | | |
| Taxable Equivalent Distribution Rate5 | 6.29 | % | | | | | | | | | |
| 30-Day Standardized Yield6 | 2.76 | % | | | | | | | | | |
| Taxable Equivalent Yield5 | 4.48 | % | | | | | | | | | |
| Total Annual Operating Expenses7 | 0.56 | % | | | | | | | | | |
Performance data represent past performance, which does not guarantee future results. Investment return and principal value will fluctuate, and you may have a gain or loss when you sell your shares. Current performance may differ from figures shown. For most recent month-end performance, go to franklintempleton.com or call (800) 342-5236.
Annual Report | 59
Performance Summary (continued)
Total Return Index Comparison for a Hypothetical $10,000 Investment
Total return represents the change in value of an investment over the periods shown. It includes any current, applicable, maximum sales charge, Fund expenses, account fees and reinvested distributions. The unmanaged index includes reinvestment of any income or distributions. It differs from the Fund in composition and does not pay management fees or expenses. One cannot invest directly in an index.

60 | Annual Report
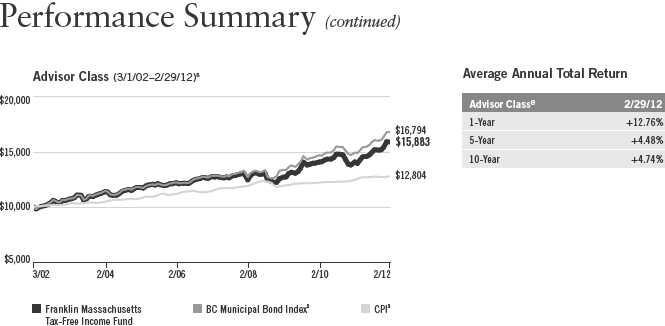
Endnotes
All investments involve risks, including possible loss of principal. Because municipal bonds are sensitive to interest rate movements, the Fund’s yield and share price will fluctuate with market conditions. Bond prices generally move in the opposite direction of interest rates. Thus, as prices of bonds in the Fund adjust to a rise in interest rates, the Fund’s share price may decline. Changes in the financial strength of a bond issuer or in a bond’s credit rating may affect its value. The Fund is actively managed but there is no guarantee that the manager’s investment decisions will produce the desired results. Since the Fund concentrates its investments in a single state, it is subject to greater risk of adverse economic and regulatory changes in that state than a geographically diversified fund. The Fund’s prospectus also includes a description of the main investment risks.
| |
Class C: | Prior to 1/1/04, these shares were offered with an initial sales charge; thus actual total returns would have differed. These shares have higher annual fees and expenses than Class A shares. |
| |
Advisor Class: | Shares are available to certain eligible investors as described in the prospectus. |
1. Cumulative total return represents the change in value of an investment over the periods indicated.
2. Average annual total return represents the average annual change in value of an investment over the periods indicated.
3. In accordance with SEC rules, we provide standardized average annual total return information through the latest calendar quarter.
4. Distribution rate is based on an annualization of the respective class’s current monthly dividend and the maximum offering price (NAV for Classes C and Advisor) per share on 2/29/12.
5. Taxable equivalent distribution rate and yield assume the published rates as of 12/28/11 for the maximum combined effective federal and Massachusetts personal income tax rate of 38.45%, based on the federal income tax rate of 35.00%.
6. The 30-day standardized yield for the month ended 2/29/12 reflects an estimated yield to maturity (assuming all portfolio securities are held to maturity). It should be regarded as an estimate of the Fund’s rate of investment income, and it may not equal the Fund’s actual income distribution rate (which reflects the Fund’s past dividends paid to shareholders) or the income reported in the Fund’s financial statements.
7. Figures are as stated in the Fund’s prospectus current as of the date of this report. In periods of market volatility, assets may decline significantly, causing total annual Fund operating expenses to become higher than the figures shown.
8. Effective 7/1/09, the Fund began offering Advisor Class shares, which do not have sales charges or a Rule 12b-1 plan. Performance quotations for this class reflect the following methods of calculation: (a) For periods prior to 7/1/09, a restated figure is used based upon the Fund’s Class A performance, excluding the effect of Class A’s maximum initial sales charge, but reflecting the effect of the Class A Rule 12b-1 fees; and (b) for periods after 7/1/09, actual Advisor Class performance is used reflecting all charges and fees applicable to that class. Since 7/1/09 (commencement of sales), the cumulative and average annual total returns of Advisor Class shares were +21.57% and +7.61%.
9. Source: © 2012 Morningstar. The BC Municipal Bond Index is a market value-weighted index engineered for the long-term tax-exempt bond market. To be included in the index, bonds must be fixed rate, have at least one year to final maturity and be rated investment grade (Baa3/BBB- or higher) by at least two of the following agencies: Moody’s, Standard & Poor’s and Fitch. The Consumer Price Index (CPI), calculated by the U.S. Bureau of Labor Statistics, is a commonly used measure of the inflation rate.
Annual Report | 61
Your Fund’s Expenses
Franklin Massachusetts Tax-Free Income Fund
As a Fund shareholder, you can incur two types of costs:
- Transaction costs, including sales charges (loads) on Fund purchases; and
- Ongoing Fund costs, including management fees, distribution and service (12b-1) fees, and other Fund expenses. All mutual funds have ongoing costs, sometimes referred to as operating expenses.
The following table shows ongoing costs of investing in the Fund and can help you understand these costs and compare them with those of other mutual funds. The table assumes a $1,000 investment held for the six months indicated.
Actual Fund Expenses
The first line (Actual) for each share class listed in the table provides actual account values and expenses. The “Ending Account Value” is derived from the Fund’s actual return, which includes the effect of Fund expenses.
You can estimate the expenses you paid during the period by following these steps. Of course, your account value and expenses will differ from those in this illustration:
| 1. | Divide your account value by $1,000. |
| | If an account had an $8,600 value, then $8,600 ÷ $1,000 = 8.6. |
| 2. | Multiply the result by the number under the heading “Expenses Paid During Period.” |
| | If Expenses Paid During Period were $7.50, then 8.6 x $7.50 = $64.50. |
In this illustration, the estimated expenses paid this period are $64.50.
Hypothetical Example for Comparison with Other Funds
Information in the second line (Hypothetical) for each class in the table can help you compare ongoing costs of investing in the Fund with those of other mutual funds. This information may not be used to estimate the actual ending account balance or expenses you paid during the period. The hypothetical “Ending Account Value” is based on the actual expense ratio for each class and an assumed 5% annual rate of return before expenses, which does not represent the Fund’s actual return. The figure under the heading “Expenses Paid During Period” shows the hypothetical expenses your account would have incurred under this scenario. You can compare this figure with the 5% hypothetical examples that appear in shareholder reports of other funds.
62 | Annual Report
Your Fund’s Expenses (continued)
Please note that expenses shown in the table are meant to highlight ongoing costs and do not reflect any transaction costs, such as sales charges. Therefore, the second line for each class is useful in comparing ongoing costs only, and will not help you compare total costs of owning different funds. In addition, if transaction costs were included, your total costs would have been higher. Please refer to the Fund prospectus for additional information on operating expenses.
| | | | | | |
| | | Beginning Account | | Ending Account | | Expenses Paid During |
| Class A | | Value 9/1/11 | | Value 2/29/12 | | Period* 9/1/11–2/29/12 |
| Actual | $ | 1,000 | $ | 1,060.40 | $ | 3.38 |
| Hypothetical (5% return before expenses) | $ | 1,000 | $ | 1,021.58 | $ | 3.32 |
| Class C | | | | | | |
| Actual | $ | 1,000 | $ | 1,057.80 | $ | 6.19 |
| Hypothetical (5% return before expenses) | $ | 1,000 | $ | 1,018.85 | $ | 6.07 |
| Advisor Class | | | | | | |
| Actual | $ | 1,000 | $ | 1,060.90 | $ | 2.87 |
| Hypothetical (5% return before expenses) | $ | 1,000 | $ | 1,022.08 | $ | 2.82 |
*Expenses are calculated using the most recent six-month expense ratio, annualized for each class (A: 0.66%; C: 1.21% and Advisor: 0.56%), multiplied by the average account value over the period, multiplied by 182/366 to reflect the one-half year period.
Annual Report | 63
Franklin New Jersey Tax-Free Income Fund
Your Fund’s Goal and Main Investments: Franklin New Jersey Tax-Free Income Fund seeks to provide as high a level of income exempt from federal and New Jersey personal income taxes as is consistent with prudent investment management and preservation of capital by investing at least 80% of its net assets in securities that pay interest free from such taxes.1
Performance data represent past performance, which does not guarantee future results. Investment return and principal value will fluctuate, and you may have a gain or loss when you sell your shares. Current performance may differ from figures shown. Please visit franklintempleton.com or call (800) 342-5236 for most recent month-end performance.

*Standard & Poor’s (S&P) is the primary independent rating agency source. Moody’s is secondary, and Fitch, if available, is used for securities not rated by Moody’s or S&P. The ratings are an indication of an issuer’s creditworthiness, with long-term ratings typically ranging from AAA (highest) to Below Investment Grade (lowest; includes ratings BB to D). This methodology differs from that used in Fund marketing materials.
**Does not include short-term investments and other net assets.
We are pleased to bring you Franklin New Jersey Tax-Free Income Fund’s annual report for the fiscal year ended February 29, 2012.
Performance Overview
The Fund’s Class A share price, as measured by net asset value, increased from $11.49 on February 28, 2011, to $12.55 on February 29, 2012. The Fund’s Class A shares paid dividends totaling 52.47 cents per share for the same period.2 The Performance Summary beginning on page 68 shows that at the
1. For state personal income taxes, the 80% minimum is measured by total Fund assets. For investors subject to alternative minimum tax, a small portion of Fund dividends may be taxable. Distributions of capital gains are generally taxable. To avoid imposition of 28% backup withholding on all Fund distributions and redemption proceeds,
| U. | S. investors must be properly certified on Form W-9 and non-U.S. investors on Form W-8BEN. |
| 2. | All Fund distributions will vary depending upon current market conditions, and past distributions are not indicative |
of future trends.
The dollar value, number of shares or principal amount, and names of all portfolio holdings are listed in the Fund’s Statement of Investments (SOI). The SOI begins on page 173.
64 | Annual Report
| | | | |
| Dividend Distributions* | | | | |
| Franklin New Jersey Tax-Free Income Fund | | | |
| | | Dividend per Share | |
| Month | Class A | Class B | Class C | Advisor Class |
| March 2011 | 4.34 cents | 3.84 cents | 3.83 cents | 4.43 cents |
| April 2011 | 4.34 cents | 3.84 cents | 3.83 cents | 4.43 cents |
| May 2011 | 4.34 cents | 3.84 cents | 3.83 cents | 4.43 cents |
| June 2011 | 4.36 cents | 3.86 cents | 3.85 cents | 4.45 cents |
| July 2011 | 4.36 cents | 3.86 cents | 3.85 cents | 4.45 cents |
| August 2011 | 4.36 cents | 3.86 cents | 3.85 cents | 4.45 cents |
| September 2011 | 4.36 cents | 3.83 cents | 3.79 cents | 4.45 cents |
| October 2011 | 4.36 cents | 3.83 cents | 3.79 cents | 4.45 cents |
| November 2011 | 4.36 cents | 3.83 cents | 3.79 cents | 4.45 cents |
| December 2011** | 5.54 cents | 4.86 cents | 4.82 cents | 5.68 cents |
| January 2012 | 3.18 cents | 2.78 cents | 2.76 cents | 3.26 cents |
| February 2012 | 4.36 cents | 3.82 cents | 3.79 cents | 4.47 cents |
*Assumes shares were purchased and held for the entire accrual period, which differs from the calendar month. Since dividends accrue daily, your actual distributions will vary depending on the date you purchased your shares and any account activity. All Fund distributions will vary depending upon current market conditions, and past distributions are not indicative of future trends.
**The December per-share dividend distribution consisted of payments on 12/21/11 and 12/30/11 for each class as follows: Class A, 4.36 cents and 1.18 cents; Class B, 3.82 cents and 1.04 cents; Class C, 3.79 cents and 1.03 cents; and Advisor Class, 4.47 cents and 1.21 cents.
end of this reporting period the Fund’s Class A shares’ distribution rate was 3.90%, based on an annualization of the current 4.26 cent per share dividend and the maximum offering price of $13.11 on February 29, 2012. An investor in the 2012 maximum combined effective federal and New Jersey personal income tax bracket of 40.83% would need to earn a distribution rate of 6.59% from a taxable investment to match the Fund’s Class A tax-free distribution rate. For the Fund’s Class B, C and Advisor shares’ performance, please see the Performance Summary.
State Update
New Jersey’s broad and diverse economy, with an industry mix that mirrors the nation’s, continued to recover at a slower pace than the nation. Although its wealth and income levels per capita continued to be higher than for most states, its per-capita household debt was above average with a delinquency rate among the nation’s highest. The state’s foreclosure rate remained well below the national average and new housing permit issuance increased; however, home prices continued to decease in many areas. The state’s slowly improving
Annual Report | 65
economy experienced sluggish job growth and resulted in a significant loss for the information sector. Most other sectors delivered gains, led by increases in education and health services, other services and construction. New Jersey’s unemployment rate remained elevated, at 9.0% in February 2012, compared to the 8.3% national rate.3
The state has solid budget management practices, with formally scheduled revenue and expenditure forecast updates and a strong executive system that gives the governor some flexibility in reducing enacted budgets without legislative approval. The state’s reliance on appropriation-backed debt backed up by consistent related funding is also favorable. New Jersey closed its fiscal year 2011 budget with a positive fund balance about twice the amount originally budgeted, as a result of relatively flat appropriations and better-than-expected revenue growth during the second half of the fiscal year. The enacted fiscal year 2012 budget absorbed the loss of federal stimulus funds and decreased reliance on nonrecurring resources, although remaining structurally balanced could be challenging. While the total budget was slightly less than in fiscal year 2011, state officials expected supplemental appropriations might be needed if savings on Transitional Aid to cities and other categories were not realized. In addition to decreasing Transitional Aid, fiscal year 2012 budget savings included pension reform, health care reform and plan redesign, and prepayment of fiscal year 2012 school construction aid during fiscal year 2011. An ongoing lawsuit regarding reforms to the state’s largest pension fund may reverse these reforms and related savings, and underfunding of pensions in general is a concern. Other challenges include decreased reserves and liquidity, and revenue growth that may not keep up with fixed costs.
New Jersey’s debt levels were among the nation’s highest, with net tax-supported debt at 7.9% of personal income and $3,940 per capita, compared with the 2.8% and $1,066 national medians.4 Independent credit rating agency Moody’s Investors Service assigned the state’s general obligation bonds a rating of Aa3 with a stable outlook.5 The rating reflected the state’s relatively weak finances and the expectation that recovery would be unlikely in the medium term due to rapidly rising fixed costs, slow economic recovery and no specific plan to improve reserves. The outlook reflected recent state revenue growth that indicated some economic stability, less reliance on nonrecurring resources to balance the fiscal year 2012 budget and proactive steps to control long-term liability growth, including pension and other post-employment benefit reforms.
3. Source: Bureau of Labor Statistics.
4. Source: Moody’s Investors Service, “Special Comment: 2011 State Debt Medians Report,” 6/3/11.
5. This does not indicate Moody’s rating of the Fund.
66 | Annual Report

Annual Report | 67
Performance Summary as of 2/29/12
Franklin New Jersey Tax-Free Income Fund
Your dividend income will vary depending on dividends or interest paid by securities in the Fund’s portfolio, adjusted for operating expenses of each class. Capital gain distributions are net profits realized from the sale of portfolio securities. The performance table and graphs do not reflect any taxes that a shareholder would pay on Fund dividends, capital gain distributions, if any, or any realized gains on the sale of Fund shares. Total return reflects reinvestment of the Fund’s dividends and capital gain distributions, if any, and any unrealized gains or losses.
| | | | | | | | |
| Price and Distribution Information | | | | | | |
| Class A (Symbol: FRNJX) | | | | Change | | 2/29/12 | | 2/28/11 |
| Net Asset Value (NAV) | | | +$ | 1.06 | $ | 12.55 | $ | 11.49 |
| Distributions (3/1/11–2/29/12) | | | | | | | | |
| Dividend Income | $ | 0.5247 | | | | | | |
| Class B (Symbol: FNJBX) | | | | Change | | 2/29/12 | | 2/28/11 |
| Net Asset Value (NAV) | | | +$ | 1.06 | $ | 12.62 | $ | 11.56 |
| Distributions (3/1/11–2/29/12) | | | | | | | | |
| Dividend Income | $ | 0.4620 | | | | | | |
| Class C (Symbol: FNIIX) | | | | Change | | 2/29/12 | | 2/28/11 |
| Net Asset Value (NAV) | | | +$ | 1.08 | $ | 12.68 | $ | 11.60 |
| Distributions (3/1/11–2/29/12) | | | | | | | | |
| Dividend Income | $ | 0.4593 | | | | | | |
| Advisor Class (Symbol: FNJZX) | | | | Change | | 2/29/12 | | 2/28/11 |
| Net Asset Value (NAV) | | | +$ | 1.06 | $ | 12.55 | $ | 11.49 |
| Distributions (3/1/11–2/29/12) | | | | | | | | |
| Dividend Income | $ | 0.5362 | | | | | | |
68 | Annual Report
Performance Summary (continued)
Performance
Cumulative total return excludes sales charges. Average annual total returns include maximum sales charges. Class A: 4.25% maximum initial sales charge; Class B: contingent deferred sales charge (CDSC) declining from 4% to 1% over six years, and eliminated thereafter; Class C: 1% CDSC in first year only; Advisor Class: no sales charges.
| | | | | | | | | | | |
| Class A | | | | 1-Year | | | 5-Year | | | 10-Year | |
| Cumulative Total Return1 | | | + | 14.09 | % | + | 27.38 | % | + | 64.02 | % |
| Average Annual Total Return2 | | | + | 9.24 | % | + | 4.06 | % | + | 4.61 | % |
| Avg. Ann. Total Return (3/31/12)3 | | | + | 10.03 | % | + | 4.05 | % | + | 4.78 | % |
| Distribution Rate4 | 3.90 | % | | | | | | | | | |
| Taxable Equivalent Distribution Rate5 | 6.59 | % | | | | | | | | | |
| 30-Day Standardized Yield6 | 2.63 | % | | | | | | | | | |
| Taxable Equivalent Yield5 | 4.44 | % | | | | | | | | | |
| Total Annual Operating Expenses7 | 0.63 | % | | | | | | | | | |
| Class B | | | | 1-Year | | | 5-Year | | | 10-Year | |
| Cumulative Total Return1 | | | + | 13.42 | % | + | 23.90 | % | + | 57.09 | % |
| Average Annual Total Return2 | | | + | 9.42 | % | + | 4.04 | % | + | 4.62 | % |
| Avg. Ann. Total Return (3/31/12)3 | | | + | 10.30 | % | + | 4.04 | % | + | 4.78 | % |
| Distribution Rate4 | 3.46 | % | | | | | | | | | |
| Taxable Equivalent Distribution Rate5 | 5.85 | % | | | | | | | | | |
| 30-Day Standardized Yield6 | 2.20 | % | | | | | | | | | |
| Taxable Equivalent Yield5 | 3.72 | % | | | | | | | | | |
| Total Annual Operating Expenses7 | 1.17 | % | | | | | | | | | |
| Class C | | | | 1-Year | | | 5-Year | | | 10-Year | |
| Cumulative Total Return1 | | | + | 13.52 | % | + | 24.05 | % | + | 55.26 | % |
| Average Annual Total Return2 | | | + | 12.52 | % | + | 4.41 | % | + | 4.50 | % |
| Avg. Ann. Total Return (3/31/12)3 | | | + | 13.21 | % | + | 4.39 | % | + | 4.66 | % |
| Distribution Rate4 | 3.45 | % | | | | | | | | | |
| Taxable Equivalent Distribution Rate5 | 5.83 | % | | | | | | | | | |
| 30-Day Standardized Yield6 | 2.20 | % | | | | | | | | | |
| Taxable Equivalent Yield5 | 3.72 | % | | | | | | | | | |
| Total Annual Operating Expenses7 | 1.18 | % | | | | | | | | | |
| Advisor Class8 | | | | 1-Year | | | 5-Year | | | 10-Year | |
| Cumulative Total Return1 | | | + | 14.20 | % | + | 27.83 | % | + | 64.60 | % |
| Average Annual Total Return2 | | | + | 14.20 | % | + | 5.03 | % | + | 5.11 | % |
| Avg. Ann. Total Return (3/31/12)3 | | | + | 15.00 | % | + | 5.04 | % | + | 5.27 | % |
| Distribution Rate4 | 4.18 | % | | | | | | | | | |
| Taxable Equivalent Distribution Rate5 | 7.06 | % | | | | | | | | | |
| 30-Day Standardized Yield6 | 2.86 | % | | | | | | | | | |
| Taxable Equivalent Yield5 | 4.83 | % | | | | | | | | | |
| Total Annual Operating Expenses7 | 0.53 | % | | | | | | | | | |
Performance data represent past performance, which does not guarantee future results. Investment return and principal value will fluctuate, and you may have a gain or loss when you sell your shares. Current performance may differ from figures shown. For most recent month-end performance, go to franklintempleton.com or call (800) 342-5236.
Annual Report | 69
Performance Summary (continued)
Total Return Index Comparison for a Hypothetical $10,000 Investment
Total return represents the change in value of an investment over the periods shown. It includes any current, applicable, maximum sales charge, Fund expenses, account fees and reinvested distributions. The unmanaged index includes reinvestment of any income or distributions. It differs from the Fund in composition and does not pay management fees or expenses. One cannot invest directly in an index.
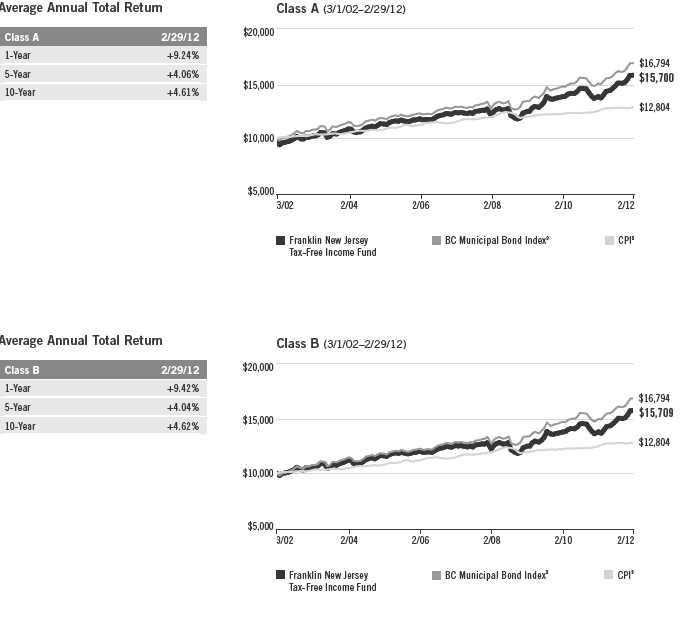
70 | Annual Report
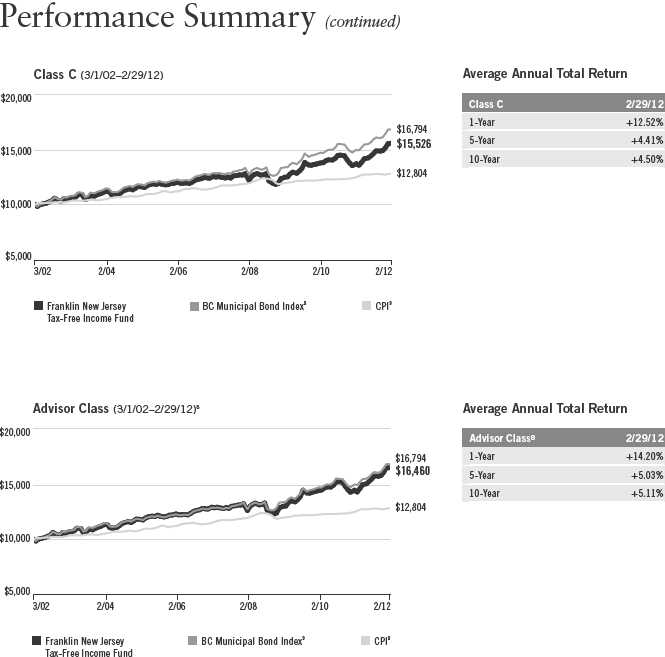
Annual Report | 71
Performance Summary (continued)
Endnotes
All investments involve risks, including possible loss of principal. Because municipal bonds are sensitive to interest rate movements, the Fund’s yield and share price will fluctuate with market conditions. Bond prices generally move in the opposite direction of interest rates. Thus, as prices of bonds in the Fund adjust to a rise in interest rates, the Fund’s share price may decline. Changes in the financial strength of a bond issuer or in a bond’s credit rating may affect its value. The Fund is actively managed but there is no guarantee that the manager’s investment decisions will produce the desired results. Since the Fund concentrates its investments in a single state, it is subject to greater risk of adverse economic and regulatory changes in that state than a geographically diversified fund. The Fund’s prospectus also includes a description of the main investment risks.
| |
Class B: Class C: | These shares have higher annual fees and expenses than Class A shares. Prior to 1/1/04, these shares were offered with an initial sales charge; thus actual total returns would have differed. These shares have higher annual fees and expenses than Class A shares. |
Advisor Class: | Shares are available to certain eligible investors as described in the prospectus. |
1. Cumulative total return represents the change in value of an investment over the periods indicated.
2. Average annual total return represents the average annual change in value of an investment over the periods indicated.
3. In accordance with SEC rules, we provide standardized average annual total return information through the latest calendar quarter.
4. Distribution rate is based on an annualization of the respective class’s current monthly dividend and the maximum offering price (NAV for Classes B, C and Advisor) per share on 2/29/12.
5. Taxable equivalent distribution rate and yield assume the published rates as of 12/28/11 for the maximum combined effective federal and New Jersey personal income tax rate of 40.83%, based on the federal income tax rate of 35.00%.
6. The 30-day standardized yield for the month ended 2/29/12 reflects an estimated yield to maturity (assuming all portfolio securities are held to maturity). It should be regarded as an estimate of the Fund’s rate of investment income, and it may not equal the Fund’s actual income distribution rate (which reflects the Fund’s past dividends paid to shareholders) or the income reported in the Fund’s financial statements.
7. Figures are as stated in the Fund’s prospectus current as of the date of this report. In periods of market volatility, assets may decline significantly, causing total annual Fund operating expenses to become higher than the figures shown.
8. Effective 7/1/08, the Fund began offering Advisor Class shares, which do not have sales charges or a Rule 12b-1 plan. Performance quotations for this class reflect the following methods of calculation: (a) For periods prior to 7/1/08, a restated figure is used based upon the Fund’s Class A performance, excluding the effect of Class A’s maximum initial sales charge, but reflecting the effect of the Class A Rule 12b-1 fees; and (b) for periods after 7/1/08, actual Advisor Class performance is used reflecting all charges and fees applicable to that class. Since 7/1/08 (commencement of sales), the cumulative and average annual total returns of Advisor Class shares were +25.37% and +6.37%.
9. Source: © 2012 Morningstar. The BC Municipal Bond Index is a market value-weighted index engineered for the long-term tax-exempt bond market. To be included in the index, bonds must be fixed rate, have at least one year to final maturity and be rated investment grade (Baa3/BBB- or higher) by at least two of the following agencies: Moody’s, Standard & Poor’s and Fitch. The Consumer Price Index (CPI), calculated by the U.S. Bureau of Labor Statistics, is a commonly used measure of the inflation rate.
72 | Annual Report
Your Fund’s Expenses
Franklin New Jersey Tax-Free Income Fund
As a Fund shareholder, you can incur two types of costs:
- Transaction costs, including sales charges (loads) on Fund purchases; and
- Ongoing Fund costs, including management fees, distribution and service (12b-1) fees, and other Fund expenses. All mutual funds have ongoing costs, sometimes referred to as operating expenses.
The following table shows ongoing costs of investing in the Fund and can help you understand these costs and compare them with those of other mutual funds. The table assumes a $1,000 investment held for the six months indicated.
Actual Fund Expenses
The first line (Actual) for each share class listed in the table provides actual account values and expenses. The “Ending Account Value” is derived from the Fund’s actual return, which includes the effect of Fund expenses.
You can estimate the expenses you paid during the period by following these steps. Of course, your account value and expenses will differ from those in this illustration:
| 1. | Divide your account value by $1,000. |
| | If an account had an $8,600 value, then $8,600 ÷ $1,000 = 8.6. |
| 2. | Multiply the result by the number under the heading “Expenses Paid During Period.” |
| | If Expenses Paid During Period were $7.50, then 8.6 x $7.50 = $64.50. |
In this illustration, the estimated expenses paid this period are $64.50.
Hypothetical Example for Comparison with Other Funds
Information in the second line (Hypothetical) for each class in the table can help you compare ongoing costs of investing in the Fund with those of other mutual funds. This information may not be used to estimate the actual ending account balance or expenses you paid during the period. The hypothetical “Ending Account Value” is based on the actual expense ratio for each class and an assumed 5% annual rate of return before expenses, which does not represent the Fund’s actual return. The figure under the heading “Expenses Paid During Period” shows the hypothetical expenses your account would have incurred under this scenario. You can compare this figure with the 5% hypothetical examples that appear in shareholder reports of other funds.
Annual Report | 73
Your Fund’s Expenses (continued)
Please note that expenses shown in the table are meant to highlight ongoing costs and do not reflect any transaction costs, such as sales charges. Therefore, the second line for each class is useful in comparing ongoing costs only, and will not help you compare total costs of owning different funds. In addition, if transaction costs were included, your total costs would have been higher. Please refer to the Fund prospectus for additional information on operating expenses.
| | | | | | |
| | | Beginning Account | | Ending Account | | Expenses Paid During |
| Class A | | Value 9/1/11 | | Value 2/29/12 | | Period* 9/1/11–2/29/12 |
| Actual | $ | 1,000 | $ | 1,066.40 | $ | 3.29 |
| Hypothetical (5% return before expenses) | $ | 1,000 | $ | 1,021.68 | $ | 3.22 |
| Class B | | | | | | |
| Actual | $ | 1,000 | $ | 1,063.20 | $ | 6.05 |
| Hypothetical (5% return before expenses) | $ | 1,000 | $ | 1,019.00 | $ | 5.92 |
| Class C | | | | | | |
| Actual | $ | 1,000 | $ | 1,063.60 | $ | 6.11 |
| Hypothetical (5% return before expenses) | $ | 1,000 | $ | 1,018.95 | $ | 5.97 |
| Advisor Class | | | | | | |
| Actual | $ | 1,000 | $ | 1,066.90 | $ | 2.72 |
| Hypothetical (5% return before expenses) | $ | 1,000 | $ | 1,022.23 | $ | 2.66 |
*Expenses are calculated using the most recent six-month expense ratio, annualized for each class (A: 0.64%; B: 1.18%; C: 1.19%; and Advisor: 0.53%), multiplied by the average account value over the period, multiplied by 182/366 to reflect the one-half year period.
74 | Annual Report
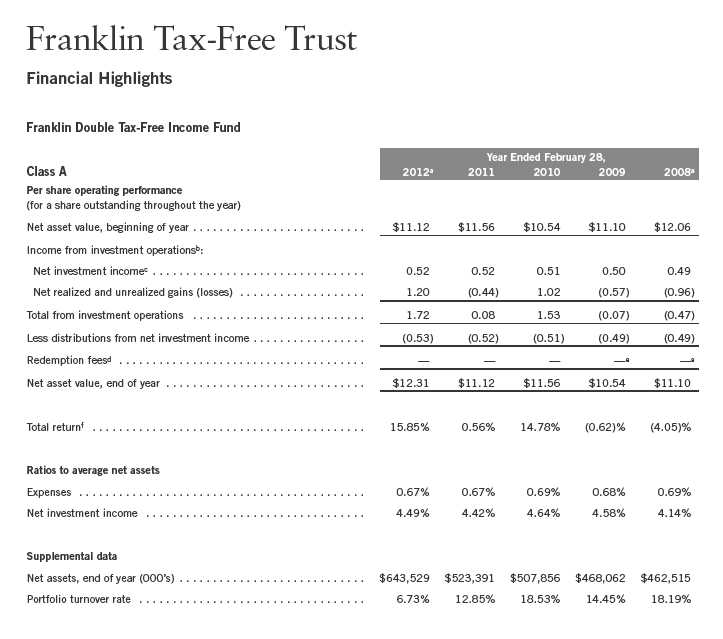
aFor the year ended February 29.
bThe amount shown for a share outstanding throughout the period may not correlate with the Statement of Operations for the period due to the timing of sales and repurchases of
the Fund shares in relation to income earned and/or fluctuating market value of the investments of the Fund.
cBased on average daily shares outstanding.
dEffective September 1, 2008, the redemption fee was eliminated.
eAmount rounds to less than $0.01 per share.
fTotal return does not reflect sales commissions or contingent deferred sales charges, if applicable.
Annual Report | The accompanying notes are an integral part of these financial statements. | 75
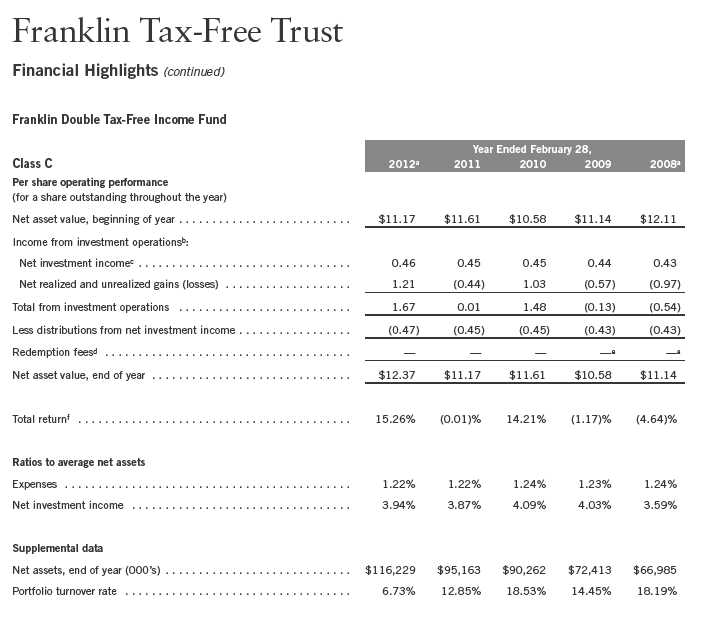
aFor the year ended February 29.
bThe amount shown for a share outstanding throughout the period may not correlate with the Statement of Operations for the period due to the timing of sales and repurchases of
the Fund shares in relation to income earned and/or fluctuating market value of the investments of the Fund.
cBased on average daily shares outstanding.
dEffective September 1, 2008, the redemption fee was eliminated.
eAmount rounds to less than $0.01 per share.
fTotal return does not reflect sales commissions or contingent deferred sales charges, if applicable.
76 | The accompanying notes are an integral part of these financial statements. | Annual Report
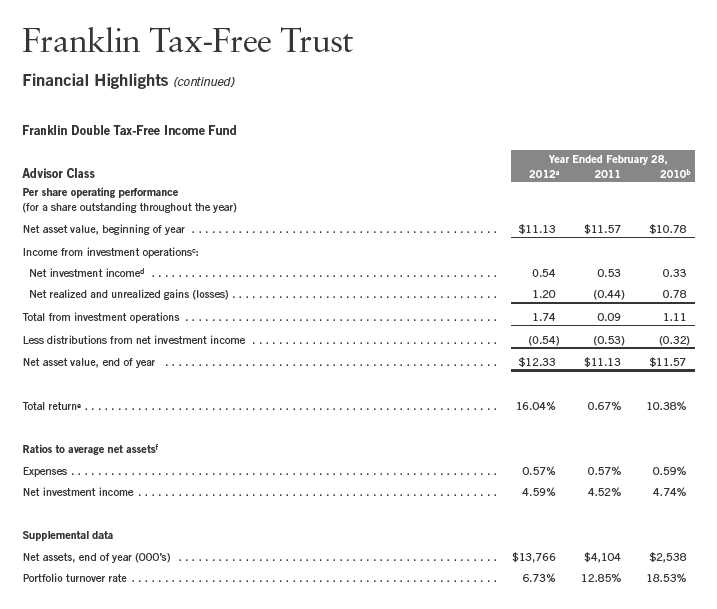
aFor the year ended February 29.
bFor the period July 15, 2009 (effective date) to February 28, 2010.
cThe amount shown for a share outstanding throughout the period may not correlate with the Statement of Operations for the period due to the timing of sales and repurchases of
the Fund shares in relation to income earned and/or fluctuating market value of the investments of the Fund.
dBased on average daily shares outstanding.
eTotal return is not annualized for periods less than one year.
fRatios are annualized for periods less than one year.
Annual Report | The accompanying notes are an integral part of these financial statements. | 77
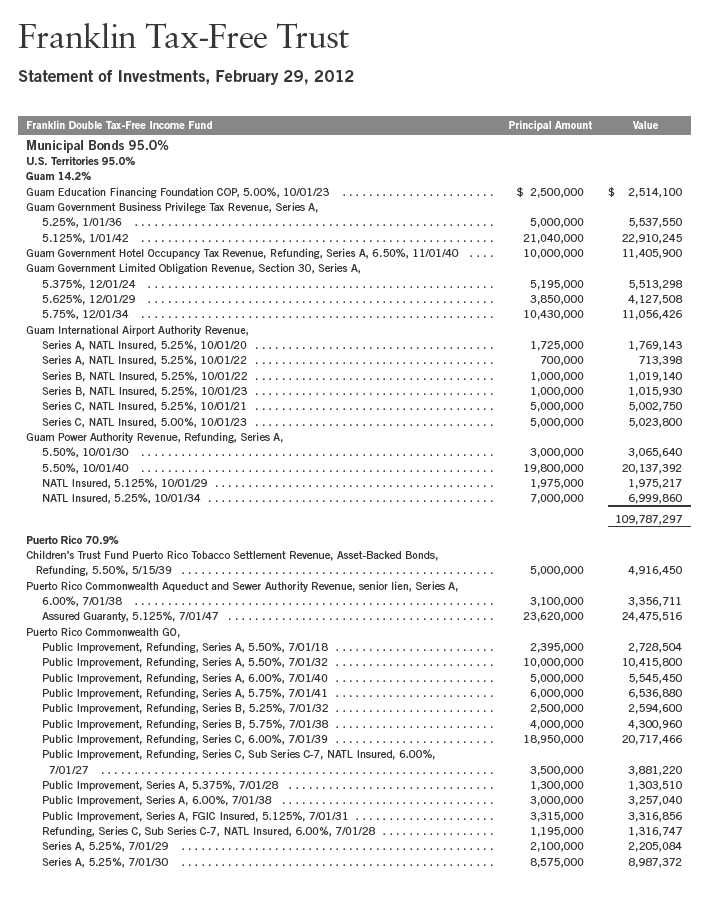
78 | Annual Report
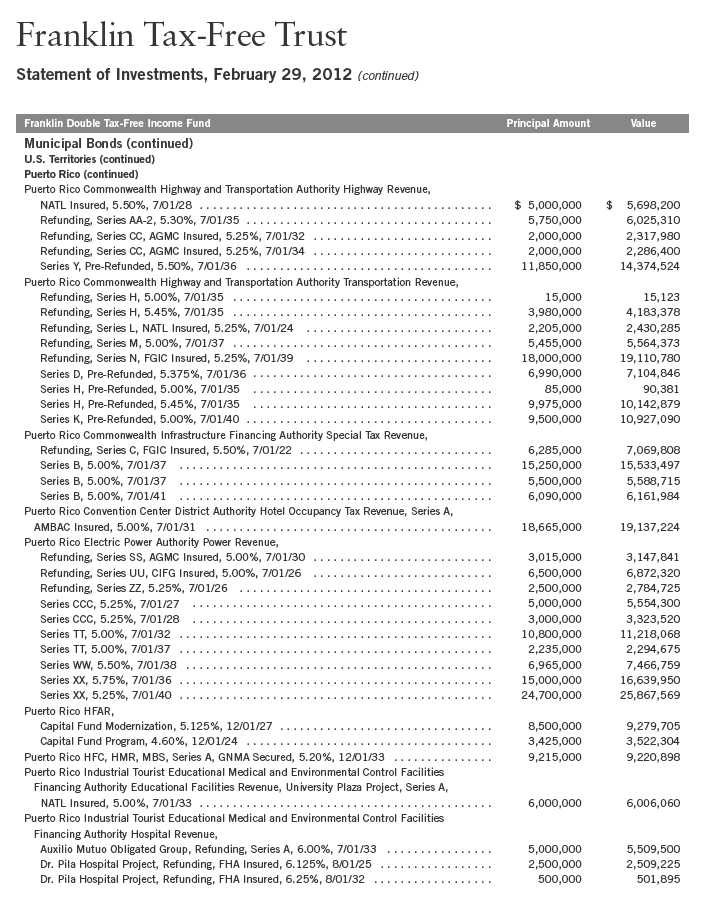
Annual Report | 79
| | | | |
| Franklin Tax-Free Trust | | | | |
| |
| Statement of Investments, February 29, 2012 (continued) | | | | |
| |
| |
| Franklin Double Tax-Free Income Fund | | Principal Amount | | Value |
| Municipal Bonds (continued) | | | | |
| U.S. Territories (continued) | | | | |
| Puerto Rico (continued) | | | | |
| Puerto Rico Industrial Tourist Educational Medical and Environmental Control Facilities | | | | |
| Financing Authority Industrial Revenue, | | | | |
| Guaynabo Municipal Government, 5.625%, 7/01/15 | $ | 3,305,000 | $ | 3,312,436 |
| Guaynabo Municipal Government, 5.625%, 7/01/22 | | 3,160,000 | | 3,162,718 |
| Guaynabo Warehouse, Series A, 5.15%, 7/01/19 | | 1,015,000 | | 1,041,847 |
| Guaynabo Warehouse, Series A, 5.20%, 7/01/24 | | 4,120,000 | | 4,220,240 |
| Puerto Rico Industrial Tourist Educational Medical and Environmental Control Facilities | | | | |
| Financing Authority Revenue, | | | | |
| Ana G. Mendez University System Project, Refunding, 5.375%, 12/01/21 | | 1,865,000 | | 1,897,376 |
| Ana G. Mendez University System Project, Refunding, 5.375%, 2/01/29 | | 7,850,000 | | 7,852,119 |
| Inter American University of Puerto Rico Project, NATL Insured, 4.25%, 10/01/24 | | 1,000,000 | | 1,000,940 |
| Inter American University of Puerto Rico Project, NATL Insured, 4.375%, 10/01/25 | | 1,000,000 | | 1,006,860 |
| Inter American University of Puerto Rico Project, NATL Insured, 4.50%, 10/01/29 | | 3,750,000 | | 3,755,288 |
| Puerto Rico Industrial Tourist Educational Medical and Environmental Control Facilities Revenue, | | | | |
| Cogeneration Facility, AES Puerto Rico Project, 6.625%, 6/01/26 | | 5,970,000 | | 5,971,015 |
| Puerto Rico Infrastructure Financing Authority Revenue, Ports Authority Project, Series B, | | | | |
| 5.25%, 12/15/26 | | 9,485,000 | | 10,181,768 |
| Puerto Rico Municipal Finance Agency GO, Series A, AGMC Insured, | | | | |
| 5.75%, 8/01/12 | | 7,500,000 | | 7,527,225 |
| 5.00%, 8/01/27 | | 3,500,000 | | 3,516,940 |
| 5.00%, 8/01/30 | | 3,500,000 | | 3,623,795 |
| Puerto Rico PBA Guaranteed Revenue, Government Facilities, | | | | |
| Refunding, Series M, 6.25%, 7/01/21 | | 5,000,000 | | 5,953,750 |
| Refunding, Series N, 5.00%, 7/01/32 | | 5,000,000 | | 5,157,400 |
| Refunding, Series N, 5.00%, 7/01/37 | | 10,000,000 | | 10,200,500 |
| Refunding, Series P, 6.50%, 7/01/30 | | 5,000,000 | | 5,776,000 |
| Refunding, Series P, 6.75%, 7/01/36 | | 5,000,000 | | 5,755,350 |
| Refunding, Series Q, 5.625%, 7/01/39 | | 8,985,000 | | 9,585,917 |
| Series D, Pre-Refunded, 5.375%, 7/01/33 | | 4,070,000 | | 4,135,527 |
| Series I, 5.25%, 7/01/33 | | 2,450,000 | | 2,517,669 |
| Series I, 5.00%, 7/01/36 | | 4,000,000 | | 4,050,440 |
| Series I, Pre-Refunded, 5.25%, 7/01/33 | | 50,000 | | 55,464 |
| Series I, Pre-Refunded, 5.375%, 7/01/34 | | 5,000,000 | | 5,560,800 |
| Puerto Rico Public Finance Corp. Revenue, Commonwealth Appropriation, Refunding, Series B, | | | | |
| 5.50%, 8/01/31 | | 5,000,000 | | 5,359,950 |
| Puerto Rico Sales Tax FICO Sales Tax Revenue, | | | | |
| Capital Appreciation, first sub., Series A, zero cpn. to 8/01/19, 6.25% thereafter, | | | | |
| 8/01/33 | | 7,000,000 | | 5,720,960 |
| first sub., Series A, 5.75%, 8/01/37 | | 1,000,000 | | 1,111,170 |
| first sub., Series A, 6.00%, 8/01/42 | | 17,850,000 | | 20,203,522 |
| first sub., Series C, 5.25%, 8/01/41 | | 2,500,000 | | 2,691,525 |
| Series A, 5.25%, 8/01/57 | | 15,000,000 | | 15,925,200 |
| Series C, 5.25%, 8/01/40 | | 4,560,000 | | 5,059,594 |
| | | | | 548,229,562 |
80 | Annual Report
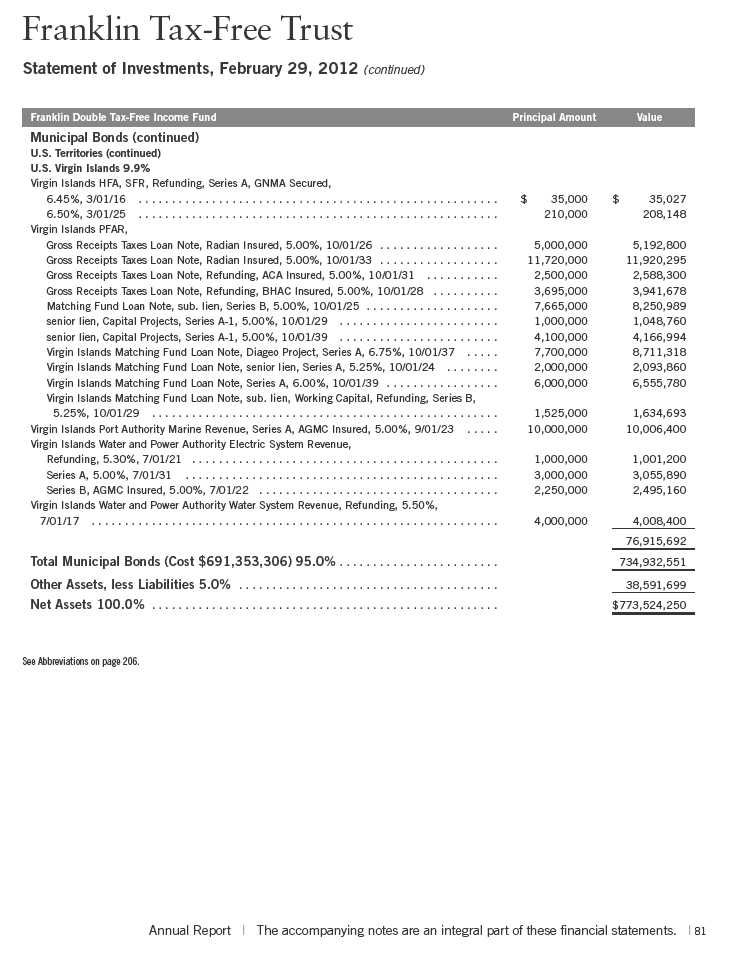

aFor the year ended February 29.
bThe amount shown for a share outstanding throughout the period may not correlate with the Statement of Operations for the period due to the timing of sales and repurchases of
the Fund shares in relation to income earned and/or fluctuating market value of the investments of the Fund.
cBased on average daily shares outstanding.
dEffective September 1, 2008, the redemption fee was eliminated.
eAmount rounds to less than $0.01 per share.
fTotal return does not reflect sales commissions or contingent deferred sales charges, if applicable.
82 | The accompanying notes are an integral part of these financial statements. | Annual Report
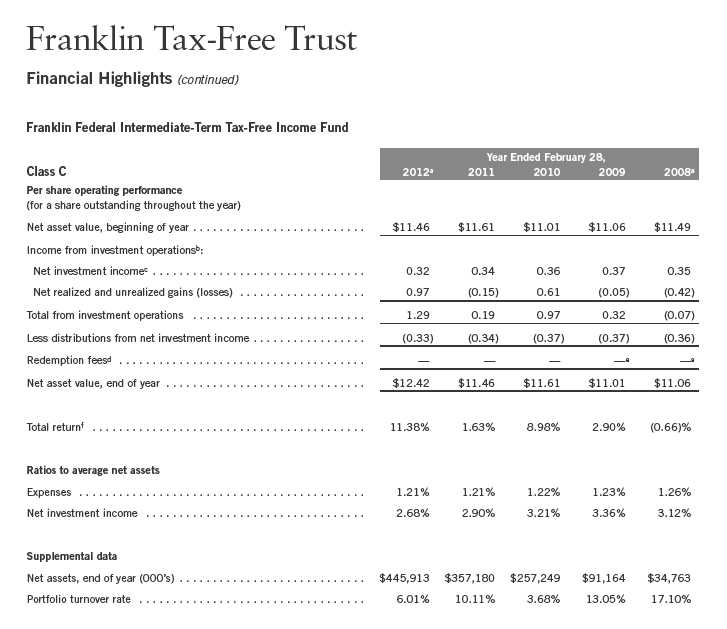
aFor the year ended February 29.
bThe amount shown for a share outstanding throughout the period may not correlate with the Statement of Operations for the period due to the timing of sales and repurchases of
the Fund shares in relation to income earned and/or fluctuating market value of the investments of the Fund.
cBased on average daily shares outstanding.
dEffective September 1, 2008, the redemption fee was eliminated.
eAmount rounds to less than $0.01 per share.
fTotal return does not reflect sales commissions or contingent deferred sales charges, if applicable.
Annual Report | The accompanying notes are an integral part of these financial statements. | 83
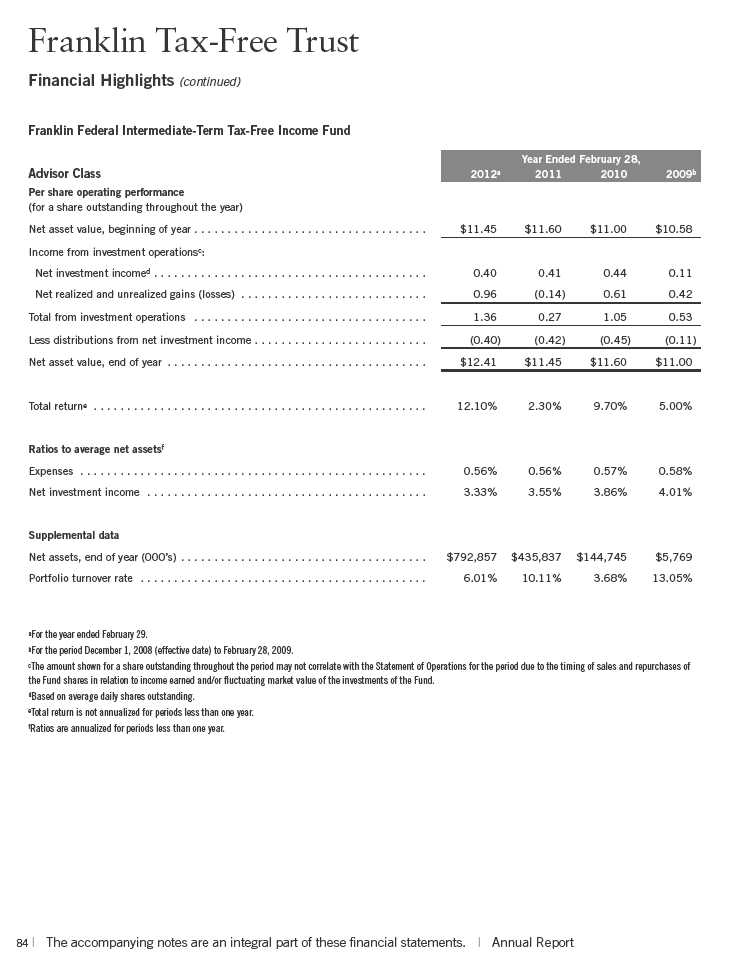

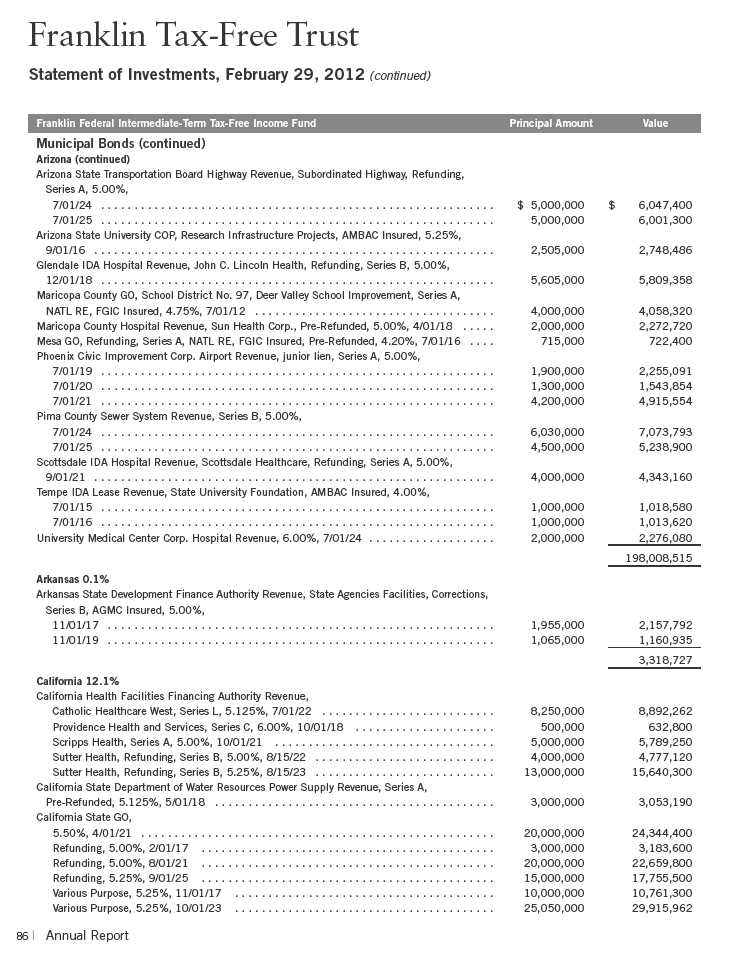
| | | | |
| Franklin Tax-Free Trust | | | | |
| |
| Statement of Investments, February 29, 2012 (continued) | | | | |
| |
| |
| Franklin Federal Intermediate-Term Tax-Free Income Fund | | Principal Amount | | Value |
| Municipal Bonds (continued) | | | | |
| California (continued) | | | | |
| California State GO, (continued) | | | | |
| Various Purpose, 5.25%, 10/01/24 | $ | 9,780,000 | $ | 11,652,772 |
| Various Purpose, 5.25%, 10/01/25 | | 5,000,000 | | 5,866,300 |
| Various Purpose, XLCA Insured, 5.00%, 11/01/22 | | 4,805,000 | | 5,538,772 |
| California State Public Works Board Lease Revenue, Various Capital Projects, | | | | |
| Series A, 5.00%, 10/01/20 | | 2,000,000 | | 2,298,700 |
| Series A, 5.25%, 10/01/22 | | 3,300,000 | | 3,842,091 |
| Series A, 5.25%, 10/01/23 | | 5,365,000 | | 6,179,514 |
| Series A, 5.25%, 10/01/24 | | 3,000,000 | | 3,429,060 |
| Series A, 5.25%, 10/01/25 | | 3,000,000 | | 3,392,550 |
| Series G, Sub Series G-1, 5.25%, 10/01/18 | | 5,605,000 | | 6,548,546 |
| Series G, Sub Series G-1, 5.25%, 10/01/19 | | 10,000,000 | | 11,743,000 |
| Series G, Sub Series G-1, 5.00%, 10/01/21 | | 15,055,000 | | 16,982,943 |
| Series I, 5.00%, 11/01/18 | | 4,000,000 | | 4,620,120 |
| Series I, 5.25%, 11/01/20 | | 5,000,000 | | 5,782,700 |
| California Statewide CDA Revenue, | | | | |
| Enloe Medical Center, Series A, California Mortgage Insured, 5.25%, 8/15/19 | | 1,990,000 | | 2,260,541 |
| Enloe Medical Center, Series A, California Mortgage Insured, 5.375%, 8/15/20 | | 1,650,000 | | 1,856,432 |
| Sutter Health, Refunding, Series A, 5.25%, 8/15/24 | | 4,000,000 | | 4,739,000 |
| El Dorado Irrigation District COP, Refunding, Series A, Assured Guaranty, | | | | |
| 5.00%, 8/01/22 | | 2,610,000 | | 2,941,340 |
| 5.25%, 8/01/23 | | 2,860,000 | | 3,245,785 |
| Livermore-Amador Valley Water Management Agency Sewer Revenue, Refunding, 5.00%, | | | | |
| 8/01/24 | | 5,660,000 | | 6,606,805 |
| 8/01/25 | | 4,765,000 | | 5,532,356 |
| Los Angeles Department of Water and Power Revenue, Refunding, Series B, 5.25%, | | | | |
| 7/01/24 | | 17,000,000 | | 20,247,680 |
| Los Angeles Department of Water and Power Waterworks Revenue, Refunding, Series B, | | | | |
| NATL Insured, 4.25%, 7/01/17 | | 4,000,000 | | 4,199,600 |
| Los Angeles Municipal Improvement Corp. Lease Revenue, Capital Equipment, Refunding, | | | | |
| Series A, Assured Guaranty, | | | | |
| 5.00%, 4/01/17 | | 3,215,000 | | 3,762,579 |
| 5.25%, 4/01/18 | | 2,495,000 | | 2,987,987 |
| 5.25%, 4/01/19 | | 3,180,000 | | 3,809,672 |
| Los Angeles USD, GO, | | | | |
| Election of 2004, Series F, FGIC Insured, 5.00%, 7/01/24 | | 6,700,000 | | 7,548,890 |
| Series A, NATL Insured, Pre-Refunded, 4.25%, 7/01/16 | | 2,500,000 | | 2,631,925 |
| Series F, 5.00%, 7/01/22 | | 5,675,000 | | 6,701,948 |
| Orange County Airport Revenue, 5.00%, | | | | |
| 7/01/20 | | 3,465,000 | | 4,041,229 |
| 7/01/21 | | 7,545,000 | | 8,690,708 |
| San Francisco City and County COP, Multiple Capital Improvement Projects, Series A, | | | | |
| 5.00%, 4/01/25 | | 4,000,000 | | 4,367,680 |
| 5.25%, 4/01/26 | | 2,500,000 | | 2,770,275 |
| San Joaquin Hills Transportation Corridor Agency Toll Road Revenue, Capital Appreciation, | | | | |
| Refunding, Series A, 5.65%, 1/15/17 | | 3,000,000 | | 3,064,320 |
| San Jose RDA Tax Allocation, Merged Area, Refunding, Series D, Assured Guaranty, 5.00%, | | | | |
| 8/01/21 | | 10,000,000 | | 10,576,100 |
| 8/01/22 | | 10,000,000 | | 10,526,100 |
| |
| | | | | Annual Report | 87 |
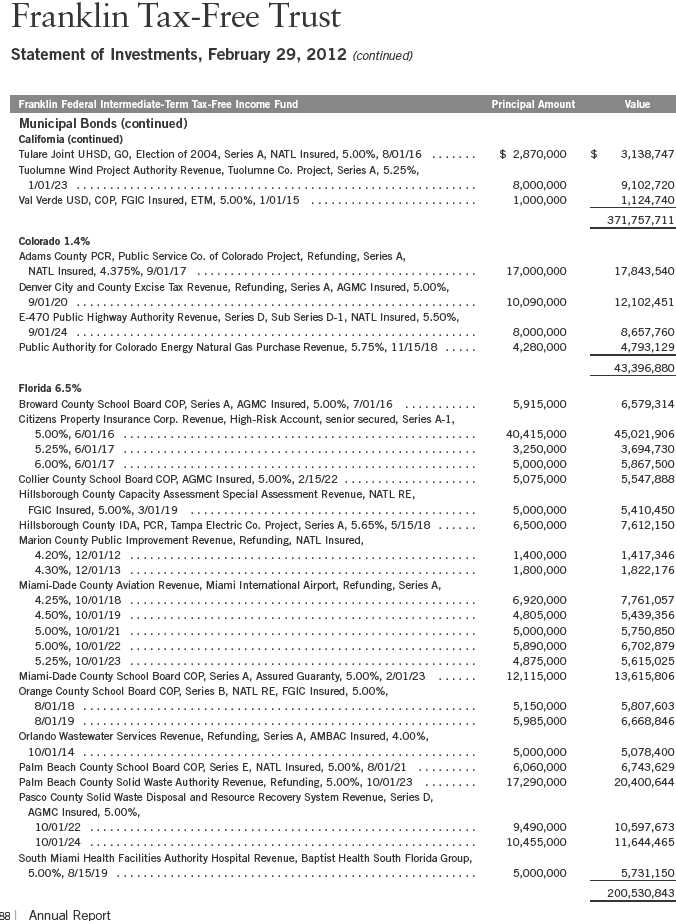

| | | | |
| Franklin Tax-Free Trust | | | | |
| |
| Statement of Investments, February 29, 2012 (continued) | | | | |
| |
| |
| Franklin Federal Intermediate-Term Tax-Free Income Fund | | Principal Amount | | Value |
| Municipal Bonds (continued) | | | | |
| Louisiana (continued) | | | | |
| New Orleans GO, Radian Insured, 5.00%, 12/01/25 | $ | 7,915,000 | $ | 8,404,384 |
| Orleans Parish Parishwide School District GO, Refunding, AGMC Insured, 5.00%, 9/01/18 | | 5,000,000 | | 5,905,200 |
| St. John the Baptist Parish EDR, USX Corp. Project, Refunding, 5.35%, 12/01/13 | | 4,000,000 | | 4,002,800 |
| | | | | 59,730,164 |
| Maryland 0.4% | | | | |
| Maryland State EDC Student Housing Revenue, University of Maryland College Park Projects, | | | | |
| Refunding, Assured Guaranty, 5.00%, | | | | |
| 6/01/19 | | 1,445,000 | | 1,568,764 |
| 6/01/20 | | 1,000,000 | | 1,077,360 |
| Maryland State Health and Higher Educational Facilities Authority Revenue, | | | | |
| Peninsula Regional Medical Center, 5.00%, 7/01/18 | | 1,600,000 | | 1,764,240 |
| Peninsula Regional Medical Center, 5.00%, 7/01/19 | | 1,430,000 | | 1,551,722 |
| Peninsula Regional Medical Center, 5.00%, 7/01/20 | | 1,000,000 | | 1,076,260 |
| Washington County Hospital, 5.25%, 1/01/22 | | 1,000,000 | | 1,066,970 |
| Washington County Hospital, 5.25%, 1/01/23 | | 1,250,000 | | 1,330,375 |
| Western Maryland Health, Refunding, Series A, NATL Insured, 5.00%, 1/01/19 | | 2,920,000 | | 3,299,016 |
| | | | | 12,734,707 |
| Massachusetts 0.6% | | | | |
| Massachusetts State Department of Transportation Metropolitan Highway System Revenue, | | | | |
| Contract Assistance, Series B, 5.00%, 1/01/20 | | 5,000,000 | | 6,158,350 |
| Senior, Refunding, Series B, 5.00%, 1/01/17 | | 5,000,000 | | 5,790,850 |
| Senior, Refunding, Series B, 5.00%, 1/01/18 | | 5,000,000 | | 5,850,350 |
| Massachusetts State Health and Educational Facilities Authority Revenue, CareGroup, | | | | |
| Series B-2, NATL Insured, 5.375%, 2/01/26 | | 1,720,000 | | 1,922,392 |
| | | | | 19,721,942 |
| Michigan 4.8% | | | | |
| Detroit GO, | | | | |
| Distribution State Aid, 5.00%, 11/01/19 | | 6,775,000 | | 7,835,830 |
| Distribution State Aid, 5.00%, 11/01/20 | | 6,000,000 | | 6,918,480 |
| Series A-1, NATL Insured, 5.00%, 4/01/19 | | 5,000,000 | | 4,571,900 |
| Series B, AGMC Insured, 5.00%, 4/01/18 | | 2,635,000 | | 2,713,075 |
| Series B, AGMC Insured, 5.00%, 4/01/19 | | 2,515,000 | | 2,561,226 |
| Michigan Municipal Bond Authority Revenue, Local Government Loan Program, Group A, | | | | |
| Refunding, Series B, AMBAC Insured, 5.00%, | | | | |
| 12/01/17 | | 1,000,000 | | 1,045,820 |
| 12/01/18 | | 1,000,000 | | 1,032,460 |
| Michigan State Finance Authority Revenue, | | | | |
| School District of The City of Detroit, AGMC Insured, 5.00%, 6/01/17 | | 10,000,000 | | 10,625,200 |
| School District of the City of Detroit, Refunding, 5.25%, 6/01/17 | | 10,640,000 | | 11,689,210 |
| School District of the City of Detroit, Refunding, 5.50%, 6/01/21 | | 6,000,000 | | 6,611,100 |
| Michigan State GO, Refunding, Series A, 5.25%, 11/01/22 | | 10,000,000 | | 11,576,500 |
| Michigan State HDA, SFMR, Series A, 5.00%, 12/01/19 | | 10,000,000 | | 10,596,700 |
| Michigan State Hospital Finance Authority Revenue, Trinity Health Credit Group, Mandatory | | | | |
| Put 12/01/17, Refunding, Series A, 6.00%, 12/01/34 | | 10,000,000 | | 12,397,000 |
| Michigan State Revenue, Grant Anticipation Bonds, AGMC Insured, 5.25%, 9/15/20 | | 7,500,000 | | 8,604,525 |
90 | Annual Report
| | | | |
| Franklin Tax-Free Trust | | | | |
| |
| Statement of Investments, February 29, 2012 (continued) | | | | |
| |
| |
| Franklin Federal Intermediate-Term Tax-Free Income Fund | | Principal Amount | | Value |
| Municipal Bonds (continued) | | | | |
| Michigan (continued) | | | | |
| Michigan State Strategic Fund Limited Obligation Revenue, | | | | |
| Detroit Edison Co. Exempt Facilities Project, Mandatory Put 8/01/16, Refunding, | | | | |
| Series ET-2, 5.50%, 8/01/29 | $ | 7,000,000 | $ | 8,172,990 |
| Michigan House of Representatives Facilities, Series A, Assured Guaranty, 5.25%, | | | | |
| 10/15/22 | | 4,000,000 | | 4,502,760 |
| Michigan House of Representatives Facilities, Series A, Assured Guaranty, 5.25%, | | | | |
| 10/15/23 | | 1,000,000 | | 1,118,720 |
| Royal Oak Hospital Finance Authority Hospital Revenue, William Beaumont Hospital, | | | | |
| Refunding, 6.25%, 9/01/14 | | 3,000,000 | | 3,308,820 |
| Saginaw-Midland Municipal Water Supply Corp. Revenue GO, Water Supply System, Refunding, | | | | |
| NATL Insured, 4.25%, 9/01/13 | | 1,245,000 | | 1,286,471 |
| South Lyon Community Schools GO, Refunding, NATL RE, FGIC Insured, 5.00%, 5/01/16 | | 3,040,000 | | 3,556,709 |
| Wayne State University Revenues, Refunding, Series A, 5.00%, | | | | |
| 11/15/18 | | 4,265,000 | | 4,918,355 |
| 11/15/19 | | 5,210,000 | | 6,064,857 |
| 11/15/20 | | 5,255,000 | | 6,034,369 |
| Wayne-Westland Community Schools GO, Refunding, | | | | |
| 4.50%, 5/01/12 | | 1,035,000 | | 1,041,831 |
| 4.625%, 5/01/13 | | 1,095,000 | | 1,147,494 |
| AGMC Insured, 5.00%, 5/01/16 | | 2,825,000 | | 3,069,080 |
| Wyandotte Electric Revenue, Refunding, Assured Guaranty, 5.00%, 10/01/17 | | 3,955,000 | | 4,517,085 |
| | | | | 147,518,567 |
| Minnesota 0.6% | | | | |
| Minnesota Agricultural and Economic Development Board Revenue, Health Care Facilities, | | | | |
| Essentia, Series C-1, Assured Guaranty, | | | | |
| 5.00%, 2/15/21 | | 4,165,000 | | 4,807,160 |
| 5.00%, 2/15/22 | | 5,570,000 | | 6,373,305 |
| 5.25%, 2/15/23 | | 5,000,000 | | 5,782,250 |
| | | | | 16,962,715 |
| Missouri 0.8% | | | | |
| Hannibal IDA Health Facilities Revenue, Refunding, 5.00%, 3/01/19 | | 1,675,000 | | 1,760,140 |
| Jackson County Reorganized School District No. 7 Lee’s Summit GO, School Building, | | | | |
| NATL Insured, 5.00%, 3/01/16 | | 2,000,000 | | 2,179,980 |
| Missouri Joint Municipal Electric Utility Commission Power Project Revenue, Plum Point | | | | |
| Project, NATL Insured, 5.00%, | | | | |
| 1/01/17 | | 1,500,000 | | 1,621,035 |
| 1/01/19 | | 1,000,000 | | 1,064,970 |
| Springfield Public Utility Revenue, NATL RE, FGIC Insured, 4.50%, 8/01/21 | | 15,245,000 | | 16,729,406 |
| | | | | 23,355,531 |
| Nevada 1.4% | | | | |
| Clark County Airport Revenue, System, sub. lien, Series C, AGMC Insured, 5.00%, | | | | |
| 7/01/22 | | 5,000,000 | | 5,705,700 |
| 7/01/23 | | 15,000,000 | | 17,000,550 |
| Clark County School District GO, Refunding, Series A, NATL RE, FGIC Insured, 4.50%, | | | | |
| 6/15/19 | | 5,000,000 | | 5,725,300 |
Annual Report | 91
| | | | |
| Franklin Tax-Free Trust | | | | |
| |
| Statement of Investments, February 29, 2012 (continued) | | | | |
| |
| |
| Franklin Federal Intermediate-Term Tax-Free Income Fund | | Principal Amount | | Value |
| Municipal Bonds (continued) | | | | |
| Nevada (continued) | | | | |
| Clark County Water Reclamation District GO, | | | | |
| Series A, 5.25%, 7/01/21 | $ | 3,435,000 | $ | 4,088,680 |
| Series A, 5.25%, 7/01/22 | | 3,120,000 | | 3,690,742 |
| Series B, 5.25%, 7/01/21 | | 3,430,000 | | 4,082,729 |
| Series B, 5.25%, 7/01/22 | | 3,615,000 | | 4,276,292 |
| | | | | 44,569,993 |
| New Jersey 8.9% | | | | |
| Hudson County Improvement Authority Facility Lease Revenue, Hudson County Lease Project, | | | | |
| Refunding, AGMC Insured, 5.375%, | | | | |
| 10/01/22 | | 5,220,000 | | 6,304,351 |
| 10/01/23 | | 5,375,000 | | 6,515,467 |
| 10/01/24 | | 2,050,000 | | 2,489,500 |
| New Jersey EDA Revenue, School Facilities Construction, Refunding, | | | | |
| Series DD-1, 5.00%, 12/15/18 | | 20,000,000 | | 24,350,800 |
| Series EE, 5.25%, 9/01/24 | | 12,210,000 | | 14,540,645 |
| New Jersey Health Care Facilities Financing Authority Revenue, Barnabas Health, Refunding, | | | | |
| Series A, 5.00%, | | | | |
| 7/01/20 | | 10,000,000 | | 10,774,800 |
| 7/01/21 | | 20,535,000 | | 22,052,536 |
| New Jersey State COP, Equipment Lease Purchase, Series A, | | | | |
| 5.25%, 6/15/22 | | 10,000,000 | | 11,425,700 |
| 5.25%, 6/15/23 | | 17,945,000 | | 20,440,611 |
| AMBAC Insured, 5.00%, 6/15/17 | | 5,000,000 | | 5,312,650 |
| New Jersey State Educational Facilities Authority Revenue, Kean University, Refunding, | | | | |
| Series A, 5.00%, 9/01/21 | | 6,000,000 | | 6,921,240 |
| New Jersey State Higher Education Assistance Authority Student Loan Revenue, | | | | |
| Refunding, Series 1A, 5.00%, 12/01/17 | | 3,250,000 | | 3,755,050 |
| Refunding, Series 1A, 5.25%, 12/01/19 | | 2,500,000 | | 2,931,000 |
| Refunding, Series 1A, 4.75%, 12/01/21 | | 7,500,000 | | 8,301,825 |
| Refunding, Series 1A, 4.75%, 12/01/22 | | 10,000,000 | | 10,939,800 |
| Series A, 5.375%, 6/01/24 | | 15,000,000 | | 16,712,850 |
| New Jersey State Transportation Trust Fund Authority Revenue, Transportation System, | | | | |
| Refunding, Series A, 5.25%, 12/15/21 | | 10,000,000 | | 12,294,000 |
| Refunding, Series A, 5.50%, 12/15/22 | | 25,000,000 | | 31,373,750 |
| Refunding, Series A, Assured Guaranty, 5.50%, 12/15/22 | | 11,465,000 | | 14,388,002 |
| Series D, AGMC Insured, 5.00%, 6/15/19 | | 5,630,000 | | 6,275,085 |
| New Jersey State Turnpike Authority Turnpike Revenue, Series H, 5.00%, | | | | |
| 1/01/20 | | 10,000,000 | | 11,820,100 |
| 1/01/21 | | 20,000,000 | | 23,349,600 |
| | | | | 273,269,362 |
| New York 9.6% | | | | |
| Erie County IDA School Facility Revenue, City School District of the City of Buffalo Project, | | | | |
| Series A, | | | | |
| 5.00%, 5/01/22 | | 14,840,000 | | 17,151,330 |
| AGMC Insured, 5.75%, 5/01/22 | | 5,000,000 | | 5,905,950 |
| Liverpool Central School District GO, Refunding, AGMC Insured, 5.00%, 7/15/14 | | 1,560,000 | | 1,582,760 |
92 | Annual Report
| | | | |
| Franklin Tax-Free Trust | | | | |
| |
| Statement of Investments, February 29, 2012 (continued) | | | | |
| |
| |
| Franklin Federal Intermediate-Term Tax-Free Income Fund | | Principal Amount | | Value |
| Municipal Bonds (continued) | | | | |
| New York (continued) | | | | |
| Long Island Power Authority Electric System Revenue, General, Refunding, | | | | |
| Series A, NATL RE, FGIC Insured, 5.00%, 12/01/19 | $ | 7,000,000 | $ | 7,903,980 |
| Series E, NATL RE, FGIC Insured, 5.00%, 12/01/18 | | 8,500,000 | | 9,813,675 |
| MTA Revenue, Transportation, | | | | |
| Refunding, Series F, 5.00%, 11/15/15 | | 1,250,000 | | 1,422,100 |
| Series A, AGMC Insured, 5.00%, 11/15/20 | | 5,000,000 | | 5,631,150 |
| Series A, AGMC Insured, 5.50%, 11/15/20 | | 4,365,000 | | 5,463,801 |
| Series C, 5.00%, 11/15/16 | | 1,150,000 | | 1,337,439 |
| Series C, 5.75%, 11/15/18 | | 15,000,000 | | 17,563,200 |
| Nassau County Local Economic Assistance and FICO Revenue, Catholic Health Services, | | | | |
| Refunding, 5.00%, 7/01/21 | | 9,000,000 | | 10,477,800 |
| New York City GO, | | | | |
| Refunding, Series C, NATL Insured, 5.875%, 8/01/16 | | 5,000 | | 5,021 |
| Refunding, Series G, 5.00%, 8/01/21 | | 7,000,000 | | 8,168,440 |
| Refunding, Series H, 5.00%, 8/01/17 | | 4,330,000 | | 4,787,594 |
| Series D, 5.00%, 12/01/21 | | 5,000,000 | | 5,883,450 |
| Series F, 4.75%, 1/15/16 | | 1,535,000 | | 1,586,376 |
| Series F, Pre-Refunded, 4.75%, 1/15/16 | | 1,465,000 | | 1,522,194 |
| Series H, 5.00%, 8/01/16 | | 3,000,000 | | 3,325,440 |
| Series J, Sub Series J-1, AGMC Insured, 5.00%, 6/01/20 | | 10,000,000 | | 11,547,800 |
| Series O, 5.00%, 6/01/19 | | 5,000,000 | | 5,623,800 |
| New York City Transitional Finance Authority Building Aid Revenue, Fiscal 2009, | | | | |
| Series S-3, 5.00%, 1/15/23 | | 5,000,000 | | 5,831,500 |
| Series S-4, 5.00%, 1/15/21 | | 4,665,000 | | 5,482,775 |
| New York City Transitional Finance Authority Revenue, Future Tax Secured, | | | | |
| Refunding, Sub Series A-1, 5.00%, 11/01/23 | | 11,500,000 | | 14,152,015 |
| Series C, 5.00%, 11/01/23 | | 12,805,000 | | 15,481,757 |
| Series D, 5.00%, 11/01/24 | | 7,620,000 | | 9,303,487 |
| New York State Dormitory Authority Lease Revenue, Third General Resolution, State University | | | | |
| Educational Facilities, Refunding, Series A, 5.00%, | | | | |
| 5/15/23 | | 8,435,000 | | 10,313,559 |
| 5/15/24 | | 7,000,000 | | 8,495,760 |
| New York State Dormitory Authority Revenue, Mortgage, St. Barnabas Hospital, Series B, | | | | |
| FHA Insured, 4.25%, 8/01/14 | | 2,355,000 | | 2,390,631 |
| New York State Dormitory Authority Revenues, | | | | |
| Non-State Supported Debt, School Districts, Financing Program, Series A, | | | | |
| Assured Guaranty, 5.00%, 10/01/24 | | 5,000,000 | | 5,683,650 |
| State Supported Debt, City University System, Consolidated Fifth General Resolution, | | | | |
| Series A, NATL RE, FGIC Insured, 5.50%, 7/01/23 | | 7,915,000 | | 10,198,398 |
| State Supported Debt, Mental Health Services Facilities Improvement, Refunding, 5.50%, | | | | |
| 2/15/18 | | 10,000,000 | | 12,234,800 |
| State Supported Debt, Mental Health Services Facilities Improvement, Refunding, 5.00%, | | | | |
| 2/15/19 | | 3,245,000 | | 3,915,287 |
| State Supported Debt, Mental Health Services Facilities Improvement, Refunding, | | | | |
| Series D, NATL Insured, 5.00%, 8/15/17 | | 190,000 | | 190,173 |
| New York State Local Government Assistance Corp. Revenue, sub. lien, Refunding, Series B, | | | | |
| 5.00%, 4/01/21 | | 12,000,000 | | 14,801,880 |
Annual Report | 93
| | | | |
| Franklin Tax-Free Trust | | | | |
| |
| Statement of Investments, February 29, 2012 (continued) | | | | |
| |
| |
| Franklin Federal Intermediate-Term Tax-Free Income Fund | | Principal Amount | | Value |
| Municipal Bonds (continued) | | | | |
| New York (continued) | | | | |
| New York State Thruway Authority General Revenue, Refunding, Series H, NATL RE, | | | | |
| FGIC Insured, 5.00%, 1/01/22 | $ | 10,000,000 | $ | 11,652,800 |
| New York State Thruway Authority Revenue, Local Highway and Bridge Service Contract, | | | | |
| Refunding, 5.00%, 4/01/19 | | 9,570,000 | | 11,744,591 |
| New York State Urban Development Corp. Revenue, Service Contract, Refunding, Series A-1, | | | | |
| 5.00%, 1/01/20 | | 6,500,000 | | 7,754,760 |
| Rockland County Solid Waste Management Authority Revenue, Refunding, Series A, | | | | |
| Assured Guaranty, 5.375%, 12/15/18 | | 5,365,000 | | 6,328,286 |
| Suffolk County EDC Revenue, Catholic Health Services, Refunding, 5.00%, 7/01/22 | | 10,000,000 | | 11,518,900 |
| | | | | 294,178,309 |
| North Carolina 2.2% | | | | |
| Charlotte-Mecklenburg Hospital Authority Health Care System Revenue, Carolinas HealthCare | | | | |
| System, Series A, AGMC Insured, 5.00%, 1/15/22 | | 10,000,000 | | 10,935,900 |
| North Carolina Eastern Municipal Power Agency Power System Revenue, | | | | |
| Refunding, Series A, 5.00%, 1/01/21 | | 10,000,000 | | 11,959,200 |
| Refunding, Series A, Assured Guaranty, 5.25%, 1/01/19 | | 15,000,000 | | 17,720,550 |
| Series C, Assured Guaranty, 6.00%, 1/01/19 | | 2,500,000 | | 2,916,750 |
| North Carolina Municipal Power Agency No. 1 Catawba Electric Revenue, Refunding, | | | | |
| Series A, 5.25%, 1/01/20 | | 4,500,000 | | 5,346,180 |
| Series B, 5.00%, 1/01/20 | | 8,000,000 | | 9,665,280 |
| Oak Island Enterprise System Revenue, Assured Guaranty, 5.50%, 6/01/23 | | 1,735,000 | | 2,014,040 |
| Wake County GO, Public Improvement, Pre-Refunded, 4.50%, 3/01/14 | | 6,400,000 | | 6,400,000 |
| | | | | 66,957,900 |
| Ohio 4.1% | | | | |
| Akron GO, Various Purpose, Improvement, NATL Insured, Pre-Refunded, 4.125%, | | | | |
| 12/01/14 | | 1,000,000 | | 1,029,190 |
| Allen County GO, Refunding, AMBAC Insured, 4.75%, 12/01/17 | | 2,180,000 | | 2,207,904 |
| American Municipal Power-Ohio Inc. Revenue, Refunding, 5.25%, | | | | |
| 2/15/20 | | 6,000,000 | | 6,988,980 |
| 2/15/21 | | 11,500,000 | | 13,284,800 |
| Cleveland Airport System Revenue, Refunding, Series A, AGMC Insured, 5.00%, | | | | |
| 1/01/25 | | 5,000,000 | | 5,565,850 |
| 1/01/26 | | 5,000,000 | | 5,517,950 |
| Cleveland Municipal School District GO, AGMC Insured, 5.00%, | | | | |
| 12/01/14 | | 1,915,000 | | 2,091,754 |
| 12/01/15 | | 1,510,000 | | 1,646,187 |
| 12/01/16 | | 1,400,000 | | 1,526,924 |
| Cuyahoga County EDR, Medical Mart Center, Series G, 5.00%, | | | | |
| 12/01/20 | | 7,000,000 | | 8,371,930 |
| 12/01/21 | | 7,300,000 | | 8,667,655 |
| Hamilton City School District GO, School Improvement, AGMC Insured, 5.00%, 12/01/24 | | 5,000,000 | | 5,468,550 |
| Lake Local School District Wood County GO, NATL Insured, 5.20%, 12/01/17 | | 375,000 | | 379,714 |
| Lakewood City School District GO, School Improvement, Refunding, AGMC Insured, 4.50%, | | | | |
| 12/01/22 | | 2,900,000 | | 3,187,013 |
| Mason City School District GO, School Improvement, Refunding, NATL RE, FGIC Insured, | | | | |
| 5.00%, 12/01/15 | | 2,670,000 | | 3,096,159 |
94 | Annual Report
| | | | |
| Franklin Tax-Free Trust | | | | |
| |
| Statement of Investments, February 29, 2012 (continued) | | | | |
| |
| |
| Franklin Federal Intermediate-Term Tax-Free Income Fund | | Principal Amount | | Value |
| Municipal Bonds (continued) | | | | |
| Ohio (continued) | | | | |
| Montgomery County Revenue, Miami Valley Hospital, Mandatory Put 11/15/14, Refunding, | | | | |
| Series B, 5.25%, 11/15/39 | $ | 4,000,000 | $ | 4,389,000 |
| Nordonia Hills City School District GO, School Improvement, Refunding, NATL RE, | | | | |
| FGIC Insured, 4.50%, 12/01/21 | | 2,360,000 | | 2,567,420 |
| Ohio State Building Authority Revenue, Refunding, Series C, 5.00%, 10/01/22 | | 5,780,000 | | 6,820,227 |
| Ohio State Turnpike Commission Revenue, Refunding, Series A, NATL RE, FGIC Insured, | | | | |
| 5.50%, 2/15/24 | | 10,000,000 | | 12,724,900 |
| University of Cincinnati General Receipts Revenue, Series C, Assured Guaranty, 5.00%, | | | | |
| 6/01/21 | | 11,810,000 | | 14,076,811 |
| 6/01/22 | | 11,675,000 | | 13,779,769 |
| Youngstown GO, AMBAC Insured, 6.125%, 12/01/15 | | 1,050,000 | | 1,102,448 |
| | | | | 124,491,135 |
| Oregon 0.7% | | | | |
| Deschutes County Hospital Facilities Authority Hospital Revenue, Cascade Healthcare, | | | | |
| Refunding, 7.375%, 1/01/23 | | 2,000,000 | | 2,451,600 |
| Oregon State Department of Administrative Services COP, Series A, NATL RE, FGIC Insured, | | | | |
| 5.00%, 11/01/19 | | 2,340,000 | | 2,670,665 |
| Oregon State Department of Transportation Highway User Tax Revenue, senior lien, Series A, | | | | |
| 5.00%, 11/15/22 | | 5,840,000 | | 6,965,251 |
| Portland Sewer System Revenue, second lien, Series B, NATL Insured, 5.00%, | | | | |
| 6/15/18 | | 3,135,000 | | 3,623,151 |
| 6/15/19 | | 3,290,000 | | 3,755,042 |
| Salem Water and Sewer Revenue, | | | | |
| NATL Insured, 4.10%, 6/01/16 | | 1,035,000 | | 1,073,481 |
| Refunding, AGMC Insured, 4.50%, 6/01/12 | | 2,250,000 | | 2,273,153 |
| | | | | 22,812,343 |
| Pennsylvania 5.9% | | | | |
| Allegheny County Hospital Development Authority Revenue, University of Pittsburgh Medical | | | | |
| Center, | | | | |
| Series A, 5.00%, 5/15/19 | | 9,000,000 | | 10,707,570 |
| Series A, 5.00%, 5/15/20 | | 7,500,000 | | 8,844,750 |
| Series B, 5.00%, 6/15/18 | | 5,000,000 | | 5,449,200 |
| Allegheny County IDAR, Pollution Control, Refunding, Series A, AMBAC Insured, 4.35%, | | | | |
| 12/01/13 | | 5,000,000 | | 5,263,950 |
| Commonwealth Financing Authority Revenue, Series C-1, AGMC Insured, 5.00%, | | | | |
| 6/01/22 | | 4,130,000 | | 4,918,045 |
| 6/01/23 | | 4,345,000 | | 5,134,921 |
| Pennsylvania State Turnpike Commission Turnpike Revenue, | | | | |
| Series B, 5.00%, 12/01/19 | | 32,230,000 | | 39,336,070 |
| Series E, 5.00%, 12/01/24 | | 5,000,000 | | 5,978,850 |
| Series E, 5.00%, 12/01/25 | | 10,000,000 | | 11,863,500 |
| Subordinate, Refunding, Series C, Sub Series C-1, Assured Guaranty, 6.00%, 6/01/23 | | 10,000,000 | | 12,048,300 |
| Subordinate, Series A, Assured Guaranty, 5.00%, 6/01/22 | | 6,070,000 | | 7,034,098 |
| Philadelphia GO, Refunding, Series A, Assured Guaranty, 5.25%, 8/01/22 | | 20,000,000 | | 23,068,200 |
| Philadelphia Municipal Authority Revenue, Lease, 6.00%, 4/01/22 | | 7,065,000 | | 8,167,635 |
Annual Report | 95
| | | | |
| Franklin Tax-Free Trust | | | | |
| |
| Statement of Investments, February 29, 2012 (continued) | | | | |
| |
| |
| Franklin Federal Intermediate-Term Tax-Free Income Fund | | Principal Amount | | Value |
| Municipal Bonds (continued) | | | | |
| Pennsylvania (continued) | | | | |
| Philadelphia Water and Wastewater Revenue, | | | | |
| Refunding, Series A, AGMC Insured, 5.00%, 6/15/17 | $ | 10,000,000 | $ | 11,775,000 |
| Refunding, Series A, AGMC Insured, 5.00%, 6/15/18 | | 5,000,000 | | 5,958,700 |
| Refunding, Series A, AGMC Insured, 5.00%, 6/15/19 | | 5,000,000 | | 5,984,900 |
| Series A, 5.00%, 1/01/20 | | 1,210,000 | | 1,380,683 |
| Series A, 5.25%, 1/01/21 | | 3,655,000 | | 4,200,107 |
| Series A, 5.25%, 1/01/22 | | 2,330,000 | | 2,661,978 |
| | | | | 179,776,457 |
| South Carolina 0.5% | | | | |
| Rock Hill Utility System Revenue, Refunding and Improvement, Series A, AGMC Insured, | | | | |
| 4.00%, 1/01/14 | | 2,000,000 | | 2,055,680 |
| Scago Educational Facilities Corp. for Pickens School District Revenue, Pickens County Project, | | | | |
| AGMC Insured, 5.00%, 12/01/18 | | 5,000,000 | | 5,743,150 |
| South Carolina Jobs EDA Hospital Revenue, Palmetto Health, Refunding and Improvement, | | | | |
| 5.375%, 8/01/22 | | 6,000,000 | | 6,811,860 |
| | | | | 14,610,690 |
| Texas 3.7% | | | | |
| Brownsville Utility System Revenue, Refunding and Improvement, Series A, AGMC Insured, | | | | |
| 5.00%, 9/01/22 | | 8,455,000 | | 9,186,527 |
| Dallas County Utility and Reclamation District GO, Refunding, | | | | |
| Series A, AMBAC Insured, 5.15%, 2/15/21 | | 3,025,000 | | 3,235,570 |
| Series B, AMBAC Insured, 5.15%, 2/15/21 | | 8,025,000 | | 8,583,620 |
| Dallas Waterworks and Sewer System Revenue, Refunding, AMBAC Insured, 4.50%, | | | | |
| 10/01/19 | | 10,000,000 | | 11,499,700 |
| Dallas-Fort Worth International Airport Revenue, Joint, Refunding, Series A, 5.00%, | | | | |
| 11/01/23 | | 1,500,000 | | 1,673,580 |
| 11/01/24 | | 1,000,000 | | 1,110,590 |
| Harris County Hospital District Revenue, senior lien, Refunding, Series A, NATL Insured, | | | | |
| 5.00%, 2/15/22 | | 4,165,000 | | 4,422,980 |
| Houston GO, Public Improvement, Refunding, Series A, 5.00%, 3/01/22 | | 10,000,000 | | 12,081,800 |
| Laredo ISD Public Facility Corp. Lease Revenue, Series C, AMBAC Insured, 5.00%, | | | | |
| 8/01/19 | | 1,000,000 | | 1,010,110 |
| Lower Colorado River Authority Transmission Contract Revenue, LCRA Transmission Services | | | | |
| Corp. Project, Refunding, | | | | |
| Series A, 5.00%, 5/15/24 | | 6,000,000 | | 6,828,480 |
| Series B, 5.00%, 5/15/24 | | 10,620,000 | | 12,086,410 |
| North Texas Tollway Authority Revenue, Special Projects System, Series D, 5.00%, | | | | |
| 9/01/24 | | 12,000,000 | | 14,023,080 |
| Sabine River Authority PCR, Southwestern Electric Co., Refunding, NATL Insured, 4.95%, | | | | |
| 3/01/18 | | 15,000,000 | | 16,723,050 |
| Tyler Health Facilities Development Corp. Hospital Revenue, East Texas Medical Center, | | | | |
| Refunding and Improvement, Series A, 5.25%, | | | | |
| 11/01/22 | | 5,000,000 | | 5,243,600 |
| 11/01/23 | | 5,000,000 | | 5,243,600 |
| | | | | 112,952,697 |
96 | Annual Report
| | | | |
| Franklin Tax-Free Trust | | | | |
| |
| Statement of Investments, February 29, 2012 (continued) | | | | |
| |
| |
| Franklin Federal Intermediate-Term Tax-Free Income Fund | | Principal Amount | | Value |
| Municipal Bonds (continued) | | | | |
| Utah 0.8% | | | | |
| Salt Lake County College Revenue, Refunding, 5.00%, 10/01/19 | $ | 2,585,000 | $ | 2,722,057 |
| Utah State Board of Regents Student Loan Revenue, Refunding, Series EE-2, 5.00%, | | | | |
| 11/01/20 | | 9,000,000 | | 11,176,290 |
| 11/01/21 | | 9,000,000 | | 10,991,880 |
| | | | | 24,890,227 |
| Virginia 1.0% | | | | |
| Virginia Beach Development Authority Public Facility Revenue, Refunding, Series B, 5.00%, | | | | |
| 8/01/19 | | 12,635,000 | | 15,514,769 |
| 8/01/20 | | 13,450,000 | | 16,522,384 |
| | | | | 32,037,153 |
| Washington 2.2% | | | | |
| Seattle Municipal Light and Power Revenue, Refunding and Improvement, Series B, 5.00%, | | | | |
| 2/01/19 | | 6,805,000 | | 8,381,855 |
| 2/01/20 | | 7,000,000 | | 8,684,410 |
| aWashington State GO, Various Purpose, Series D, 5.00%, | | | | |
| 2/01/23 | | 12,655,000 | | 15,716,751 |
| 2/01/24 | | 13,285,000 | | 16,340,151 |
| 2/01/25 | | 13,955,000 | | 17,012,819 |
| | | | | 66,135,986 |
| U.S. Territories 2.4% | | | | |
| Guam 0.1% | | | | |
| Guam Government Limited Obligation Revenue, Section 30, Series A, 5.50%, | | | | |
| 12/01/18 | | 1,540,000 | | 1,706,813 |
| 12/01/19 | | 1,025,000 | | 1,142,270 |
| | | | | 2,849,083 |
| Puerto Rico 2.3% | | | | |
| Puerto Rico Commonwealth GO, | | | | |
| Public Improvement, Refunding, Series A, 5.50%, 7/01/18 | | 8,455,000 | | 9,632,359 |
| Public Improvement, Series A, 5.25%, 7/01/23 | | 3,500,000 | | 3,686,060 |
| Public Improvement, Series A, FGIC Insured, 5.50%, 7/01/21 | | 2,500,000 | | 2,799,600 |
| Series A, 5.00%, 7/01/23 | | 4,000,000 | | 4,175,840 |
| Puerto Rico Commonwealth Highway and Transportation Authority Transportation Revenue, | | | | |
| Transport, Series K, 5.00%, 7/01/19 | | 5,000,000 | | 5,258,700 |
| Puerto Rico Commonwealth Infrastructure Financing Authority Special Tax Revenue, Refunding, | | | | |
| Series C, AMBAC Insured, 5.50%, 7/01/24 | | 10,000,000 | | 11,168,400 |
| Puerto Rico Electric Power Authority Power Revenue, Refunding, | | | | |
| Series DDD, 5.00%, 7/01/21 | | 8,745,000 | | 9,832,353 |
| Series SS, NATL Insured, 5.00%, 7/01/24 | | 10,000,000 | | 10,527,100 |
| Series ZZ, 5.25%, 7/01/19 | | 8,000,000 | | 9,300,640 |
| Puerto Rico Sales Tax FICO Sales Tax Revenue, Series C, 5.00%, 8/01/22 | | 3,500,000 | | 4,196,815 |
| | | | | 70,577,867 |
| Total U.S. Territories | | | | 73,426,950 |
| Total Municipal Bonds before Short Term Investments | | | | |
| (Cost $2,505,704,797) | | | | 2,746,292,559 |
Annual Report | 97
| | | | |
| Franklin Tax-Free Trust | | | | |
| |
| Statement of Investments, February 29, 2012 (continued) | | | | |
| |
| |
| Franklin Federal Intermediate-Term Tax-Free Income Fund | | Principal Amount | | Value |
| Short Term Investments 10.2% | | | | |
| Municipal Bonds 10.2% | | | | |
| California 0.6% | | | | |
| bMetropolitan Water District of Southern California Waterworks Revenue, | | | | |
| Refunding, Series B-3, Daily VRDN and Put, 0.06%, 7/01/35 | $ | 10,500,000 | $ | 10,500,000 |
| Series B, Weekly VRDN and Put, 0.13%, 7/01/27 | | 8,000,000 | | 8,000,000 |
| | | | | 18,500,000 |
| Colorado 0.3% | | | | |
| bColorado Educational and Cultural Facilities Authority Revenue, National Jewish Federation | | | | |
| Bond Program, Refunding, Series A-8, Daily VRDN and Put, 0.13%, 9/01/35 | | 10,225,000 | | 10,225,000 |
| Florida 0.2% | | | | |
| bFlorida State Municipal Power Agency Revenue, All-Requirements Power Supply Project, | | | | |
| Refunding, Series C, Daily VRDN and Put, 0.20%, 10/01/35 | | 5,600,000 | | 5,600,000 |
| Kentucky 0.9% | | | | |
| bKentucky Economic Development Finance Authority Hospital Facilities Revenue, Baptist | | | | |
| Healthcare System, Refunding, Series B-2, Daily VRDN and Put, 0.10%, 8/15/38 | | 28,340,000 | | 28,340,000 |
| Maryland 0.6% | | | | |
| bMaryland State EDC, EDR, U.S. Pharmacopeial Convention Inc. Project, Refunding, Series B, | | | | |
| Daily VRDN and Put, 0.25%, 7/01/38 | | 13,200,000 | | 13,200,000 |
| bMontgomery County GO, BAN, Refunding, Series A, Daily VRDN and Put, 0.09%, 6/01/26 | | 3,910,000 | | 3,910,000 |
| | | | | 17,110,000 |
| Massachusetts 1.3% | | | | |
| bMassachusetts State Health and Educational Facilities Authority Revenue, | | | | |
| Museum of Fine Arts, Series A-1, Daily VRDN and Put, 0.20%, 12/01/37 | | 21,450,000 | | 21,450,000 |
| Museum of Fine Arts, Series A-2, Daily VRDN and Put, 0.13%, 12/01/37 | | 6,800,000 | | 6,800,000 |
| Tufts University, Refunding, Series N-2, Daily VRDN and Put, 0.12%, 8/15/34 | | 7,300,000 | | 7,300,000 |
| Wellesley College, Refunding, Series I, Daily VRDN and Put, 0.09%, 7/01/39 | | 5,100,000 | | 5,100,000 |
| | | | | 40,650,000 |
| Michigan 0.1% | | | | |
| bEastern Michigan University Revenues, General, Refunding, Series A, Daily VRDN and Put, | | | | |
| 0.16%, 3/01/49 | | 3,600,000 | | 3,600,000 |
| bMichigan Higher Education Facilities Authority Revenue, Limited Obligation, University of | | | | |
| Detroit Mercy Project, Refunding, Daily VRDN and Put, 0.12%, 11/01/36 | | 1,000,000 | | 1,000,000 |
| | | | | 4,600,000 |
| Minnesota 0.7% | | | | |
| bMinneapolis and St. Paul Housing and RDA Health Care System Revenue, Allina Health | | | | |
| System, Refunding, | | | | |
| Series B-1, Daily VRDN and Put, 0.13%, 11/15/35 | | 15,825,000 | | 15,825,000 |
| Series B-2, Daily VRDN and Put, 0.10%, 11/15/35 | | 5,200,000 | | 5,200,000 |
| | | | | 21,025,000 |
| Missouri 3.3% | | | | |
| bMissouri Development Finance Board Cultural Facilities Revenue, The Nelson Gallery | | | | |
| Foundation, Refunding, Series A, Daily VRDN and Put, 0.10%, 12/01/37 | | 23,000,000 | | 23,000,000 |
| bMissouri State Health and Educational Facilities Authority Educational Facilities Revenue, | | | | |
| St. Louis University, | | | | |
| Daily VRDN and Put, 0.12%, 7/01/32 | | 4,350,000 | | 4,350,000 |
| Refunding, Series A-2, Daily VRDN and Put, 0.12%, 10/01/35 | | 13,440,000 | | 13,440,000 |
| Refunding, Series B-1, Daily VRDN and Put, 0.10%, 10/01/35 | | 30,125,000 | | 30,125,000 |
| 98 | Annual Report | | | | |
Franklin Tax-Free Trust
Statement of Investments, February 29, 2012 (continued)
| | | | |
| Franklin Federal Intermediate-Term Tax-Free Income Fund | | Principal Amount | | Value |
| Short Term Investments (continued) | | | | |
| Municipal Bonds (continued) | | | | |
| Missouri (continued) | | | | |
| bMissouri State Health and Educational Facilities Authority Health Facilities Revenue, | | | | |
| SSM Health Care, Series C, Daily VRDN and Put, 0.19%, 6/01/45 | $ | 29,930,000 | $ | 29,930,000 |
| | | | | 100,845,000 |
| North Carolina 1.5% | | | | |
| bThe Charlotte-Mecklenburg Hospital Authority Health Care System Revenue, Carolinas | | | | |
| HealthCare System, | | | | |
| Refunding, Series B, Daily VRDN and Put, 0.08%, 1/15/38 | | 3,570,000 | | 3,570,000 |
| Series H, Daily VRDN and Put, 0.09%, 1/15/45 | | 40,440,000 | | 40,440,000 |
| bNorth Carolina Medical Care Commission Health Care Facilities Revenue, Wake Forest | | | | |
| University, Refunding, Series D, Daily VRDN and Put, 0.20%, 7/01/34 | | 3,000,000 | | 3,000,000 |
| | | | | 47,010,000 |
| Ohio 0.4% | | | | |
| bCuyahoga County Revenue, Cleveland Clinic Health System Obligated Group, Series B, | | | | |
| Sub Series B-1, Daily VRDN and Put, 0.12%, 1/01/39 | | 11,300,000 | | 11,300,000 |
| Pennsylvania 0.3% | | | | |
| bGeisinger Authority Health System Revenue, Geisinger Health System, | | | | |
| Daily VRDN and Put, 0.12%, 11/15/32 | | 3,550,000 | | 3,550,000 |
| Refunding, Series A, Daily VRDN and Put, 0.08%, 5/15/35 | | 4,500,000 | | 4,500,000 |
| | | | | 8,050,000 |
| Virginia 0.0%† | | | | |
| bVirginia Commonwealth University Revenue, General, Series B, AMBAC Insured, Daily VRDN | | | | |
| and Put, 0.13%, 11/01/30 | | 330,000 | | 330,000 |
| Total Short Term Investments (Cost $313,585,000) | | | | 313,585,000 |
| Total Investments (Cost $2,819,289,797) 99.6% | | | | 3,059,877,559 |
| Other Assets, less Liabilities 0.4% | | | | 11,642,611 |
| Net Assets 100.0% | | | $ | 3,071,520,170 |
See Abbreviations on page 206.
†Rounds to less than 0.1% of net assets.
aSecurity purchased on a when-issued basis. See Note 1(b).
bVariable rate demand notes (VRDNs) are tax-exempt obligations which contain a floating or variable interest rate adjustment formula and an unconditional right of demand to receive payment of the principal balance plus accrued interest at specified dates. The coupon rate shown represents the rate at period end.
Annual Report | The accompanying notes are an integral part of these financial statements. | 99
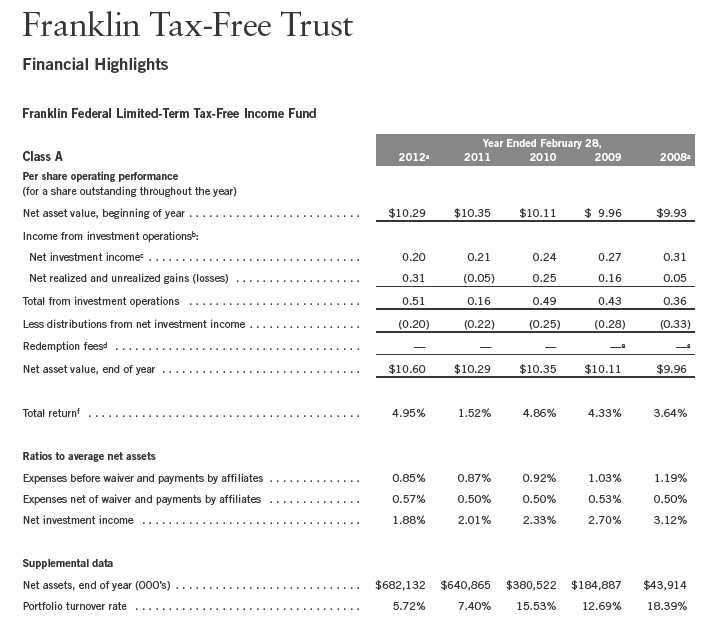
aFor the year ended February 29.
bThe amount shown for a share outstanding throughout the period may not correlate with the Statement of Operations for the period due to the timing of sales and repurchases of
the Fund shares in relation to income earned and/or fluctuating market value of the investments of the Fund.
cBased on average daily shares outstanding.
dEffective September 1, 2008, the redemption fee was eliminated.
eAmount rounds to less than $0.01 per share.
fTotal return does not reflect sales commissions or contingent deferred sales charges, if applicable.
100 | The accompanying notes are an integral part of these financial statements. | Annual Report
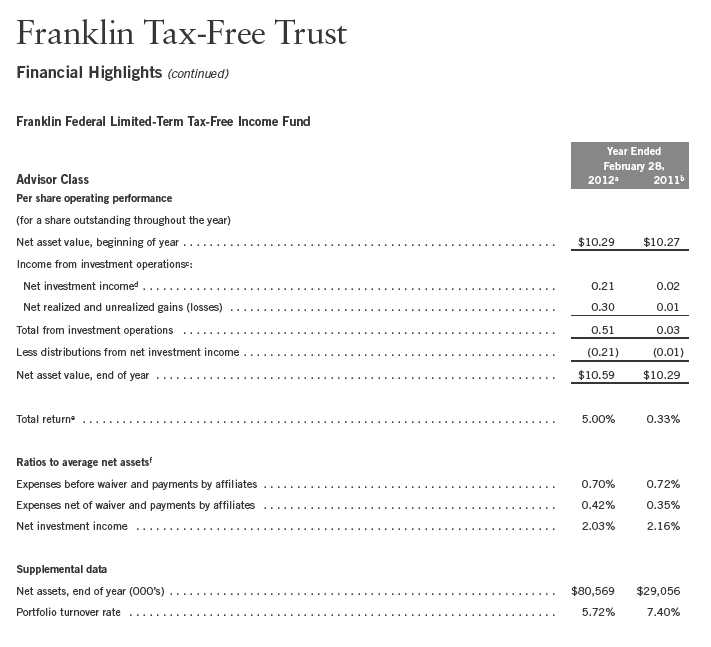
aFor the year ended February 29.
bFor the period February 1, 2011 (effective date) to February 28, 2011.
cThe amount shown for a share outstanding throughout the period may not correlate with the Statement of Operations for the period due to the timing of sales and repurchases of
the Fund shares in relation to income earned and/or fluctuating market value of the investments of the Fund.
dBased on average daily shares outstanding.
eTotal return is not annualized for periods less than one year.
fRatios are annualized for periods less than one year.
Annual Report | The accompanying notes are an integral part of these financial statements. | 101
| | | | |
| Franklin Tax-Free Trust | | | | |
| |
| Statement of Investments, February 29, 2012 | | | | |
| |
| |
| Franklin Federal Limited-Term Tax-Free Income Fund | | Principal Amount | | Value |
| Municipal Bonds 83.5% | | | | |
| Alabama 0.6% | | | | |
| Alabama State University Revenue, General Tuition and Fee, Assured Guaranty, 5.00%, | | | | |
| 9/01/14 | $ | 665,000 | $ | 727,982 |
| 9/01/15 | | 700,000 | | 789,082 |
| 9/01/16 | | 730,000 | | 847,056 |
| East Alabama Health Care Authority Health Care Facilities Revenue, | | | | |
| Mandatory Put 9/01/13, Series B, 5.00%, 9/01/33 | | 1,000,000 | | 1,059,890 |
| Mandatory Put 9/01/18, Series A, 5.25%, 9/01/36 | | 1,000,000 | | 1,127,370 |
| | | | | 4,551,380 |
| Alaska 0.7% | | | | |
| Valdez Marine Terminal Revenue, BP Pipelines Inc. Project, Refunding, Series A, 5.00%, | | | | |
| 1/01/16 | | 5,000,000 | | 5,723,800 |
| Arizona 4.2% | | | | |
| Arizona State COP, Department of Administration, Series B, AGMC Insured, 5.00%, | | | | |
| 10/01/15 | | 11,975,000 | | 13,396,313 |
| Phoenix Civic Improvement Corp. Excise Tax Revenue, Light Rail Project, AMBAC Insured, | | | | |
| 5.00%, 7/01/16 | | 17,000,000 | | 18,672,460 |
| | | | | 32,068,773 |
| California 7.9% | | | | |
| Alameda-Contra Costa Transit District COP, FHR Computer System Project, 4.00%, 8/01/12 | | 245,000 | | 248,317 |
| Bennett Valley USD, GO, BANS, 4.00%, 1/01/15 | | 2,130,000 | | 2,278,397 |
| California Health Facilities Financing Authority Revenue, Sutter Health, Series A, 5.00%, | | | | |
| 8/15/12 | | 1,000,000 | | 1,020,900 |
| California State Economic Recovery GO, Series A, 5.25%, 7/01/13 | | 200,000 | | 212,806 |
| California State GO, Refunding, 5.00%, 4/01/15 | | 500,000 | | 562,140 |
| California State Public Works Board Lease Revenue, Various Capital Projects, Series G, | | | | |
| Sub Series G-1, 5.00%, 10/01/13 | | 10,685,000 | | 11,318,834 |
| California Statewide CDA, PCR, Southern California Edison Co., Mandatory Put 4/01/13, | | | | |
| Refunding, Series A, XLCA Insured, 4.10%, 4/01/28 | | 1,500,000 | | 1,555,860 |
| California Statewide CDA Revenue, | | | | |
| CHF-Irvine LLC, UCI East Campus Apartments, Phase II, 5.00%, 5/15/14 | | 1,000,000 | | 1,069,870 |
| Methodist Hospital of Southern California Project, FHA Insured, 5.50%, 2/01/13 | | 2,430,000 | | 2,526,957 |
| Fontana PFA Lease Revenue, AMBAC Insured, 5.00%, 9/01/14 | | 375,000 | | 413,051 |
| Fontana USD, GO, | | | | |
| BAN, 4.00%, 12/01/12 | | 10,540,000 | | 10,829,218 |
| Capital Appreciation, BAN, zero cpn., 12/01/12 | | 5,000,000 | | 4,977,200 |
| Gilroy USD, GO, | | | | |
| BAN, Measure P, 5.00%, 4/01/13 | | 2,575,000 | | 2,704,445 |
| BAN, Measure P, ETM, 5.00%, 4/01/13 | | 425,000 | | 446,556 |
| Capital Appreciation, BAN, Measure P, zero cpn., 4/01/13 | | 2,000,000 | | 1,959,860 |
| Imperial Community College District GO, Capital Appreciation Bonds, zero cpn., 8/01/14 | | 7,250,000 | | 6,701,030 |
| Los Angeles CRDA Community Redevelopment Financing Authority Revenue, Bunker Hill Project, | | | | |
| Series A, AGMC Insured, 5.00%, 12/01/13 | | 1,000,000 | | 1,055,750 |
| Northern California Power Agency Public Power Revenue, Hydroelectric Project No. 1, Refunding, | | | | |
| Series C, Assured Guaranty, 5.00%, 7/01/15 | | 1,000,000 | | 1,126,870 |
| Pacifica COP, AMBAC Insured, 4.50%, 1/01/13 | | 525,000 | | 538,556 |
| Palo Verde Community College District COP, AMBAC Insured, 5.00%, 1/01/15 | | 745,000 | | 810,299 |
102 | Annual Report
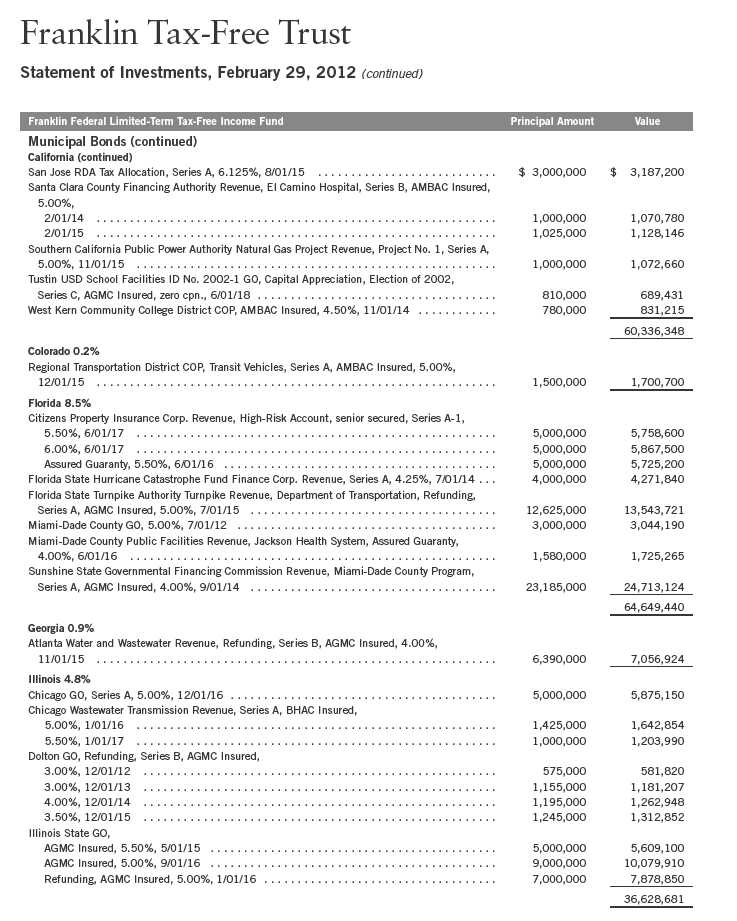
Annual Report | 103
| | | | |
| Franklin Tax-Free Trust | | | | |
| |
| Statement of Investments, February 29, 2012 (continued) | | | | |
| |
| |
| Franklin Federal Limited-Term Tax-Free Income Fund | | Principal Amount | | Value |
| Municipal Bonds (continued) | | | | |
| Indiana 0.6% | | | | |
| Indianapolis Thermal Energy System Revenue, Refunding, AGMC Insured, 4.00%, 10/01/14 | $ | 4,640,000 | $ | 4,958,304 |
| Louisiana 0.1% | | | | |
| Louisiana Local Government Environmental Facilities and CDA Revenue, Shreveport Utility | | | | |
| System Projects, NATL Insured, 4.00%, 12/01/14 | | 500,000 | | 528,705 |
| Massachusetts 0.3% | | | | |
| Massachusetts State Health and Educational Facilities Authority Revenue, Cape Cod Healthcare | | | | |
| Obligation, Assured Guaranty, 4.00%, | | | | |
| 11/15/13 | | 1,150,000 | | 1,193,573 |
| 11/15/15 | | 1,000,000 | | 1,070,120 |
| | | | | 2,263,693 |
| Michigan 5.5% | | | | |
| Detroit GO, Distribution State Aid, 5.00%, | | | | |
| 11/01/16 | | 6,120,000 | | 6,929,248 |
| 11/01/17 | | 7,485,000 | | 8,589,262 |
| Garden City GO, Refunding, AGMC Insured, | | | | |
| 2.00%, 4/01/13 | | 1,025,000 | | 1,033,815 |
| 4.00%, 4/01/14 | | 1,015,000 | | 1,066,359 |
| 4.00%, 4/01/15 | | 1,215,000 | | 1,294,911 |
| 4.00%, 4/01/16 | | 1,415,000 | | 1,523,403 |
| Jackson GO, Capital Appreciation Downtown Development, AGMC Insured, zero cpn., | | | | |
| 6/01/16 | | 1,370,000 | | 1,207,038 |
| Michigan Municipal Bond Authority Revenue, Local Government Loan Program, Charter County | | | | |
| of Wayne Local Project, Series B, Assured Guaranty, 5.00%, 11/01/13 | | 4,000,000 | | 4,223,280 |
| Rochester Community School District GO, Refunding, AGMC Insured, 5.00%, 5/01/15 | | 4,795,000 | | 5,152,755 |
| Royal Oak Hospital Finance Authority Hospital Revenue, William Beaumont Hospital, Refunding, | | | | |
| Series W, 5.25%, 8/01/17 | | 7,000,000 | | 7,637,910 |
| Wyandotte Electric Revenue, Refunding, Assured Guaranty, 5.00%, 10/01/13 | | 3,355,000 | | 3,531,372 |
| | | | | 42,189,353 |
| Minnesota 2.1% | | | | |
| Farmington GO, Improvement, Series B, AGMC Insured, 3.50%, 2/01/14 | | 455,000 | | 479,784 |
| Minneapolis Health Care System Revenue, Fairview Health Services, Series A, 5.00%, | | | | |
| 11/15/12 | | 1,000,000 | | 1,028,730 |
| Minnesota Agricultural and Economic Development Board Revenue, Health Care Facilities, | | | | |
| Essentia, Series C-1, Assured Guaranty, 5.00%, 2/15/15 | | 1,335,000 | | 1,468,673 |
| Minnesota State Municipal Power Agency Electric Revenue, Series B, 4.00%, 10/01/13 | | 5,000,000 | | 5,013,400 |
| Northern Municipal Power Agency Electric System Revenue, Refunding, Series A, | | | | |
| Assured Guaranty, 5.00%, 1/01/15 | | 5,000,000 | | 5,575,900 |
| Otsego GO, Water, Refunding, Series C, AGMC Insured, 2.00%, 12/01/16 | | 2,000,000 | | 2,089,480 |
| | | | | 15,655,967 |
| Mississippi 0.1% | | | | |
| Mississippi Development Bank Special Obligation Revenue, Jackson Public School District GO | | | | |
| Bond Project, AGMC Insured, 5.00%, 4/01/12 | | 500,000 | | 501,705 |
| Nebraska 0.6% | | | | |
| University of Nebraska Facilities Corp. Lease Rent Revenue, UNMC Health Professions, 5.00%, | | | | |
| 8/15/13 | | 4,000,000 | | 4,268,960 |
104 | Annual Report
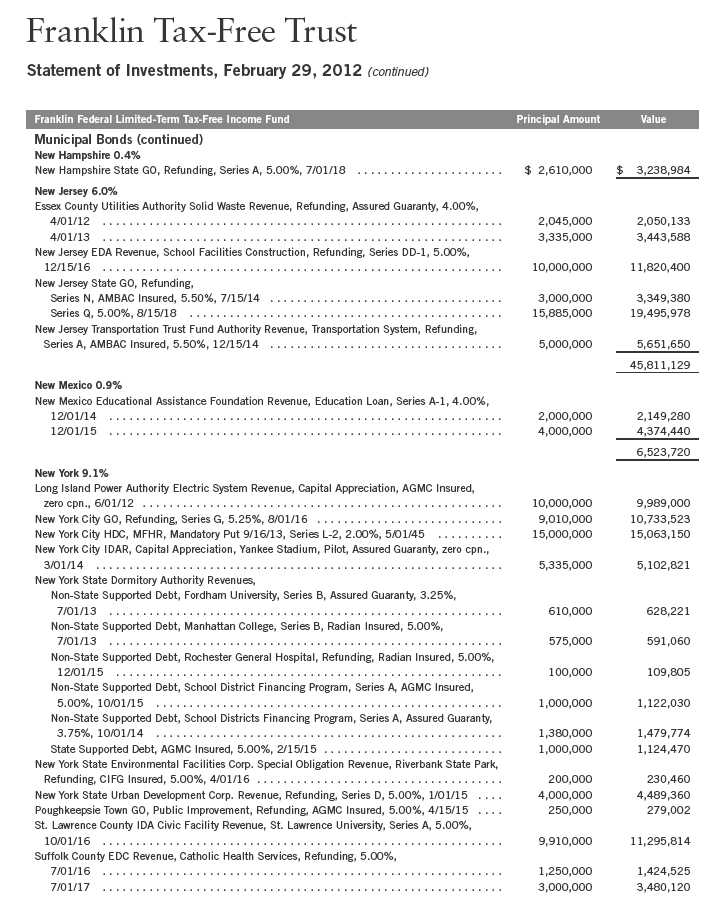
Annual Report | 105
| | | | |
| Franklin Tax-Free Trust | | | | |
| |
| Statement of Investments, February 29, 2012 (continued) | | | | |
| |
| |
| Franklin Federal Limited-Term Tax-Free Income Fund | | Principal Amount | | Value |
| Municipal Bonds (continued) | | | | |
| New York (continued) | | | | |
| Suffolk County IDA Civic Facility Revenue, Westhampton Free Associates Library, | | | | |
| AMBAC Insured, 3.25%, 6/15/12 | $ | 300,000 | $ | 302,328 |
| Syracuse GO, Public Improvement, Series A, AGMC Insured, 3.25%, 6/15/12 | | 725,000 | | 729,792 |
| Triborough Bridge and Tunnel Authority Revenues, Refunding, Series C, 5.00%, 11/15/12 | | 1,000,000 | | 1,033,430 |
| | | | | 69,208,685 |
| Ohio 8.1% | | | | |
| Akron COP, District Energy Project, 2.75%, 12/01/16 | | 1,895,000 | | 1,937,334 |
| Cleveland Airport System Revenue, | | | | |
| Refunding, Series A, AGMC Insured, 5.00%, 1/01/19 | | 7,870,000 | | 9,006,507 |
| Series C, Assured Guaranty, 5.00%, 1/01/16 | | 5,140,000 | | 5,750,838 |
| Hamilton GO, Various Purpose, Street Improvement and Building, Refunding, 2.00%, | | | | |
| 11/01/12 | | 1,350,000 | | 1,362,339 |
| 11/01/14 | | 1,455,000 | | 1,489,935 |
| 11/01/15 | | 1,465,000 | | 1,500,424 |
| Ohio State Air Quality Development Authority Revenue, | | | | |
| Environmental Improvement, Buckeye Power Inc. Project, 3.00%, 12/01/13 | | 1,085,000 | | 1,104,183 |
| Pollution Control, FirstEnergy Solutions Corp., Mandatory Put 6/03/13, Refunding, Series A, | | | | |
| 2.25%, 12/01/23 | | 8,000,000 | | 8,068,000 |
| Ohio State Department of Administrative Services COP, Administrative Knowledge System, | | | | |
| Series A, NATL Insured, 5.25%, 9/01/15 | | 6,205,000 | | 6,917,334 |
| Ohio State GO, | | | | |
| 3.00%, 5/01/13 | | 10,345,000 | | 10,671,798 |
| Refunding, 3.00%, 5/01/13 | | 4,655,000 | | 4,802,051 |
| Toledo GO, | | | | |
| Capital Improvement, Refunding, Assured Guaranty, 3.25%, 12/01/14 | | 2,860,000 | | 2,995,335 |
| Limited Tax, Various Purpose Improvement, Refunding, Assured Guaranty, 3.00%, | | | | |
| 12/01/12 | | 1,315,000 | | 1,336,356 |
| Limited Tax, Various Purpose Improvement, Refunding, Assured Guaranty, 3.00%, | | | | |
| 12/01/13 | | 1,210,000 | | 1,250,329 |
| Limited Tax, Various Purpose Improvement, Refunding, Assured Guaranty, 3.00%, | | | | |
| 12/01/14 | | 1,210,000 | | 1,267,499 |
| Limited Tax, Various Purpose Improvement, Refunding, Assured Guaranty, 3.00%, | | | | |
| 12/01/15 | | 1,185,000 | | 1,252,924 |
| Wright State University Revenue, General Receipts, Series A, 3.00%, 5/01/14 | | 1,325,000 | | 1,374,727 |
| | | | | 62,087,913 |
| Oklahoma 0.6% | | | | |
| Tulsa County Industrial Authority Educational Facilities Lease Revenue, Broken Arrow Public | | | | |
| Schools Project, 4.00%, 9/01/15 | | 4,000,000 | | 4,367,200 |
| Oregon 0.5% | | | | |
| Oregon State Department of Administrative Services COP, Series A, 5.00%, 5/01/13 | | 4,000,000 | | 4,204,240 |
| Pennsylvania 9.6% | | | | |
| Pennsylvania Economic Development Financing Authority Exempt Facilities Revenue, PPL Energy | | | | |
| Supply LLC Project, Mandatory Put 9/01/15, Refunding, Series A, 3.00%, 12/01/38 | | 10,000,000 | | 10,373,100 |
106 | Annual Report
| | | | |
| Franklin Tax-Free Trust | | | | |
| |
| Statement of Investments, February 29, 2012 (continued) | | | | |
| |
| |
| Franklin Federal Limited-Term Tax-Free Income Fund | | Principal Amount | | Value |
| Municipal Bonds (continued) | | | | |
| Pennsylvania (continued) | | | | |
| Philadelphia Gas Works Revenue, 1998 General Ordinance, Refunding, Tenth Series, | | | | |
| AGMC Insured, | | | | |
| 3.50%, 7/01/16 | $ | 6,190,000 | $ | 6,572,480 |
| 4.00%, 7/01/17 | | 4,795,000 | | 5,191,019 |
| Philadelphia GO, Refunding, Series A, AGMC Insured, 5.25%, 8/01/17 | | 10,000,000 | | 11,718,700 |
| Philadelphia Water and Wastewater Revenue, Refunding, Series A, AGMC Insured, 5.00%, | | | | |
| 6/15/13 | | 10,000,000 | | 10,592,300 |
| Reading School District GO, Refunding, Series A, 5.00%, | | | | |
| 4/01/17 | | 4,500,000 | | 5,232,960 |
| 4/01/18 | | 4,035,000 | | 4,733,943 |
| School District of Philadelphia GO, Refunding, Series C, | | | | |
| 3.00%, 9/01/13 | | 1,000,000 | | 1,035,370 |
| 5.00%, 9/01/14 | | 1,000,000 | | 1,094,710 |
| 5.00%, 9/01/15 | | 1,500,000 | | 1,690,350 |
| 5.00%, 9/01/16 | | 2,630,000 | | 3,034,336 |
| 5.00%, 9/01/17 | | 2,750,000 | | 3,209,525 |
| South Fork Municipal Authority Hospital Revenue, Conemaugh Valley Memorial, Refunding, | | | | |
| Series A, Assured Guaranty, | | | | |
| 5.00%, 7/01/12 | | 1,000,000 | | 1,011,120 |
| 5.00%, 7/01/13 | | 1,130,000 | | 1,173,087 |
| 5.00%, 7/01/14 | | 1,250,000 | | 1,324,975 |
| 4.00%, 7/01/15 | | 1,235,000 | | 1,296,898 |
| 5.00%, 7/01/16 | | 1,325,000 | | 1,462,721 |
| University of Pittsburgh of the Commonwealth System of Higher Education Revenue, University | | | | |
| Capital Project, Mandatory Put 9/15/13, Series A, 5.50%, 9/15/39 | | 2,500,000 | | 2,668,150 |
| | | | | 73,415,744 |
| South Carolina 1.0% | | | | |
| Piedmont Municipal Power Agency Electric Revenue, Refunding, Series A-2, 5.00%, 1/01/15 | | 4,000,000 | | 4,397,040 |
| Scago Educational Facilities Corp. for Pickens School District Revenue, Pickens County Project, | | | | |
| AGMC Insured, 5.00%, 12/01/14 | | 3,000,000 | | 3,331,110 |
| | | | | 7,728,150 |
| Tennessee 3.6% | | | | |
| Memphis Electric System Revenue, sub. note, Refunding, 5.00%, 12/01/15 | | 8,000,000 | | 9,200,000 |
| Memphis GO, BAN, Refunding, 4.00%, 5/01/12 | | 5,000,000 | | 5,029,750 |
| Metropolitan Nashville Airport Authority Airport Revenue, Refunding and Improvement, Series B, | | | | |
| 4.00%, 7/01/13 | | 2,880,000 | | 3,006,403 |
| Sevier County PBA Revenue, Local Government Public Improvement, Series VII-D-1, 5.00%, | | | | |
| 6/01/15 | | 9,000,000 | | 10,122,840 |
| | | | | 27,358,993 |
| Texas 2.4% | | | | |
| Brock ISD, GO, Capital Appreciation, PSF Guarantee, zero cpn., 8/15/16 | | 460,000 | | 442,980 |
| Dallas-Fort Worth International Airport Revenue, Joint, Refunding, Series A, 5.00%, | | | | |
| 11/01/14 | | 3,235,000 | | 3,585,836 |
| Gulf Coast Waste Disposal Authority Environmental Facilities Revenue, BP Products North | | | | |
| America Inc., Mandatory Put 9/03/13, Refunding, 2.30%, 1/01/42 | | 10,000,000 | | 10,282,800 |
Annual Report | 107
| | | | |
| Franklin Tax-Free Trust | | | | |
| |
| Statement of Investments, February 29, 2012 (continued) | | | | |
| |
| |
| Franklin Federal Limited-Term Tax-Free Income Fund | | Principal Amount | | Value |
| Municipal Bonds (continued) | | | | |
| Texas (continued) | | | | |
| Harris County Health Facilities Development Corp. Revenue, Christus Health, Series A-5, | | | | |
| AGMC Insured, 3.00%, 7/01/12 | $ | 1,500,000 | $ | 1,511,850 |
| San Antonio Water Revenue, System, Series A, AGMC Insured, Pre-Refunded, 5.50%, | | | | |
| 5/15/13 | | 500,000 | | 505,195 |
| Tarrant County Cultural Education Facilities Finance Corp. Revenue, Christus Health, Refunding, | | | | |
| Series A, Assured Guaranty, 5.75%, 7/01/18 | | 1,860,000 | | 2,039,304 |
| | | | | 18,367,965 |
| Washington 1.2% | | | | |
| King County Housing Authority Revenue, Birch Creek Apartments Project, 4.40%, 5/01/18 | | 2,290,000 | | 2,426,576 |
| Snohomish County School District No. 2 Everett GO, Refunding, NATL RE, FGIC Insured, 5.00%, | | | | |
| 12/01/14 | | 250,000 | | 279,037 |
| Snohomish County School District No. 103 GO, Refunding, 2.50%, 12/01/15 | | 3,895,000 | | 4,086,868 |
| Washington State Health Care Facilities Authority Revenue, MultiCare Health System, | | | | |
| Series A, AGMC Insured, 4.00%, 8/15/13 | | 250,000 | | 258,970 |
| Series A, AGMC Insured, 4.00%, 8/15/14 | | 310,000 | | 325,779 |
| Series B, AGMC Insured, 4.00%, 8/15/13 | | 250,000 | | 258,970 |
| Series B, AGMC Insured, 4.00%, 8/15/14 | | 600,000 | | 634,230 |
| Series B, AGMC Insured, 4.00%, 8/15/15 | | 625,000 | | 671,369 |
| | | | | 8,941,799 |
| U.S. Territories 3.0% | | | | |
| Guam 0.1% | | | | |
| Guam Government Limited Obligation Revenue, Section 30, Series A, 5.00%, 12/01/12 | | 1,000,000 | | 1,020,900 |
| Puerto Rico 2.9% | | | | |
| Puerto Rico Commonwealth GO, Public Improvement, AGMC Insured, 5.50%, 7/01/15 | | 5,000,000 | | 5,556,250 |
| Puerto Rico Commonwealth Government Development Bank Revenue, Refunding, NATL Insured, | | | | |
| 4.75%, 12/01/15 | | 5,000,000 | | 5,154,350 |
| Puerto Rico Commonwealth Highway and Transportation Authority Highway Revenue, Refunding, | | | | |
| Series X, NATL Insured, 5.50%, 7/01/13 | | 415,000 | | 436,476 |
| Puerto Rico Electric Power Authority Power Revenue, Series WW, 5.25%, 7/01/13 | | 1,000,000 | | 1,057,990 |
| Puerto Rico Municipal Finance Agency GO, Series A, AGMC Insured, 5.75%, 8/01/12 | | 3,000,000 | | 3,010,890 |
| Puerto Rico PBA Guaranteed Revenue, | | | | |
| Government Facilities, Mandatory Put 7/01/17, Refunding, Series M-2, 5.75%, 7/01/34 | | 5,000,000 | | 5,577,700 |
| Mandatory Put 7/01/17, Refunding, AMBAC Insured, 5.50%, 7/01/35 | | 750,000 | | 827,588 |
| | | | | 21,621,244 |
| Total U.S. Territories | | | | 22,642,144 |
| Total Municipal Bonds before Short Term Investments (Cost $610,594,043) | | | | 636,979,399 |
| Short Term Investments 15.8% | | | | |
| Municipal Bonds 15.8% | | | | |
| California 0.2% | | | | |
| aCalifornia PCFA, PCR, Pacific Gas and Electric Co., Refunding, Series C, Daily VRDN and Put, | | | | |
| 0.10%, 11/01/26 | | 1,900,000 | | 1,900,000 |
108 | Annual Report
Franklin Tax-Free Trust
Statement of Investments, February 29, 2012 (continued)
| | | | |
| Franklin Federal Limited-Term Tax-Free Income Fund | | Principal Amount | | Value |
| Short Term Investments (continued) | | | | |
| Municipal Bonds (continued) | | | | |
| Colorado 1.0% | | | | |
| aColorado Educational and Cultural Facilities Authority Revenue, National Jewish Federation | | | | |
| Bond Program, Series A-11, Daily VRDN and Put, 0.13%, 8/01/27 | $ | 4,700,000 | $ | 4,700,000 |
| aPitkin County IDR, Aspen Skiing Co. Project, Refunding, Series A, Daily VRDN and Put, 0.12%, | | | | |
| 4/01/16 | | 3,000,000 | | 3,000,000 |
| | | | | 7,700,000 |
| Florida 0.2% | | | | |
| aFlorida State Municipal Power Agency Revenue, All-Requirements Power Supply Project, | | | | |
| Refunding, Series C, Daily VRDN and Put, 0.20%, 10/01/35 | | 1,200,000 | | 1,200,000 |
| Kentucky 2.1% | | | | |
| aLouisville and Jefferson County Metropolitan Government Health System Revenue, | | | | |
| Norton Healthcare, Series B, Daily VRDN and Put, 0.10%, 10/01/39 | | 13,400,000 | | 13,400,000 |
| aShelby County Lease Revenue, Series A, Daily VRDN and Put, 0.10%, 9/01/34 | | 2,730,000 | | 2,730,000 |
| | | | | 16,130,000 |
| Maryland 1.5% | | | | |
| aMaryland State EDC, EDR, U.S. Pharmacopeial Convention Inc. Project, Refunding, | | | | |
| Series A, Daily VRDN and Put, 0.25%, 7/01/38 | | 7,900,000 | | 7,900,000 |
| Series B, Daily VRDN and Put, 0.25%, 7/01/38 | | 400,000 | | 400,000 |
| aMontgomery County GO, BAN, Refunding, Series A, Daily VRDN and Put, 0.09%, 6/01/26 | | 3,545,000 | | 3,545,000 |
| | | | | 11,845,000 |
| Michigan 0.4% | | | | |
| aEastern Michigan University Revenues, General, Refunding, Series A, Daily VRDN and Put, | | | | |
| 0.16%, 3/01/49 | | 800,000 | | 800,000 |
| Garden City GO, Refunding, AGMC Insured, 2.00%, 4/01/12 | | 1,010,000 | | 1,010,919 |
| aMichigan Higher Education Facilities Authority Revenue, Limited Obligation, University of | | | | |
| Detroit Mercy Project, Refunding, Daily VRDN and Put, 0.12%, 11/01/36 | | 1,365,000 | | 1,365,000 |
| | | | | 3,175,919 |
| Minnesota 0.6% | | | | |
| aMinneapolis and St. Paul Housing and RDA Health Care System Revenue, Allina Health System, | | | | |
| Refunding, Series B-1, Daily VRDN and Put, 0.13%, 11/15/35 | | 4,500,000 | | 4,500,000 |
| Missouri 2.3% | | | | |
| aMissouri Development Finance Board Cultural Facilities Revenue, The Nelson Gallery Foundation, | | | | |
| Refunding, Series A, Daily VRDN and Put, 0.10%, 12/01/37 | | 5,350,000 | | 5,350,000 |
| aMissouri State Health and Educational Facilities Authority Educational Facilities Revenue, | | | | |
| St. Louis University, Daily VRDN and Put, 0.12%, 7/01/32 | | 4,500,000 | | 4,500,000 |
| The Washington University, Series B, Daily VRDN and Put, 0.13%, 2/15/33 | | 7,900,000 | | 7,900,000 |
| | | | | 17,750,000 |
| New Hampshire 0.3% | | | | |
| aNew Hampshire Health and Education Facilities Authority Revenue, Dartmouth College, | | | | |
| Refunding, Series A, Daily VRDN and Put, 0.14%, 6/01/31 | | 2,370,000 | | 2,370,000 |
| New York 3.3% | | | | |
| aMTA Dedicated Tax Fund Revenue, Refunding, Series B, AGMC Insured, Weekly VRDN and Put, | | | | |
| 0.75%, 11/01/22 | | 25,000,000 | | 25,000,000 |
Annual Report | 109
Franklin Tax-Free Trust
Statement of Investments, February 29, 2012 (continued)
| | | | |
| Franklin Federal Limited-Term Tax-Free Income Fund | | Principal Amount | | Value |
| Short Term Investments (continued) | | | | |
| Municipal Bonds (continued) | | | | |
| North Carolina 2.0% | | | | |
| aCharlotte-Mecklenburg Hospital Authority Health Care System Revenue, Carolinas, | | | | |
| Refunding, Series B, Daily VRDN and Put, 0.08%, 1/15/38 | $ | 11,900,000 | $ | 11,900,000 |
| Series H, Daily VRDN and Put, 0.09%, 1/15/45 | | 1,100,000 | | 1,100,000 |
| aNorth Carolina Medical Care Commission Health Care Facilities Revenue, Wake Forest University, | | | | |
| Refunding, Series D, Daily VRDN and Put, 0.20%, 7/01/34 | | 2,100,000 | | 2,100,000 |
| | | | | 15,100,000 |
| Ohio 1.3% | | | | |
| aCuyahoga County Revenue, Cleveland Clinic Health System Obligated Group, Series B, | | | | |
| Sub Series B-1, Daily VRDN and Put, 0.12%, 1/01/39 | | 9,100,000 | | 9,100,000 |
| Wright State University Revenue, General Receipts, Series A, 2.00%, 5/01/12 | | 550,000 | | 551,298 |
| | | | | 9,651,298 |
| Pennsylvania 0.6% | | | | |
| aGeisinger Authority Health System Revenue, Geisinger Health System, | | | | |
| Daily VRDN and Put, 0.12%, 11/15/32 | | 1,100,000 | | 1,100,000 |
| Refunding, Series A, Daily VRDN and Put, 0.08%, 5/15/35 | | 3,200,000 | | 3,200,000 |
| | | | | 4,300,000 |
| Total Short Term Investments (Cost $120,622,348) | | | | 120,622,217 |
| Total Investments (Cost $731,216,391) 99.3% | | | | 757,601,616 |
| Other Assets, less Liabilities 0.7% | | | | 5,099,179 |
| Net Assets 100.0% | | | $ | 762,700,795 |
See Abbreviations on page 206.
aVariable rate demand notes (VRDNs) are tax-exempt obligations which contain a floating or variable interest rate adjustment formula and an unconditional right of demand to receive payment of the principal balance plus accrued interest at specified dates. The coupon rate shown represents the rate at period end.
110 | The accompanying notes are an integral part of these financial statements. | Annual Report
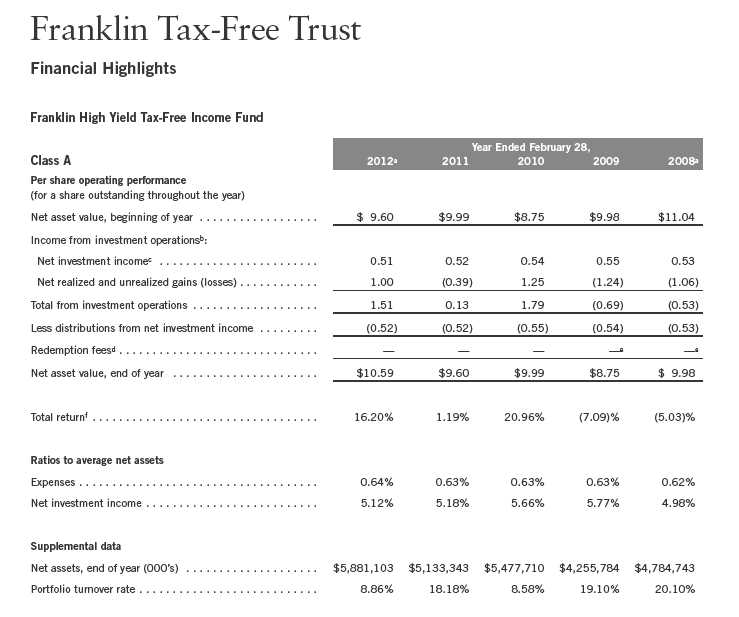
aFor the year ended February 29.
bThe amount shown for a share outstanding throughout the period may not correlate with the Statement of Operations for the period due to the timing of sales and repurchases of
the Fund shares in relation to income earned and/or fluctuating market value of the investments of the Fund.
cBased on average daily shares outstanding.
dEffective September 1, 2008, the redemption fee was eliminated.
eAmount rounds to less than $0.01 per share.
fTotal return does not reflect sales commissions or contingent deferred sales charges, if applicable.
Annual Report | The accompanying notes are an integral part of these financial statements. | 111
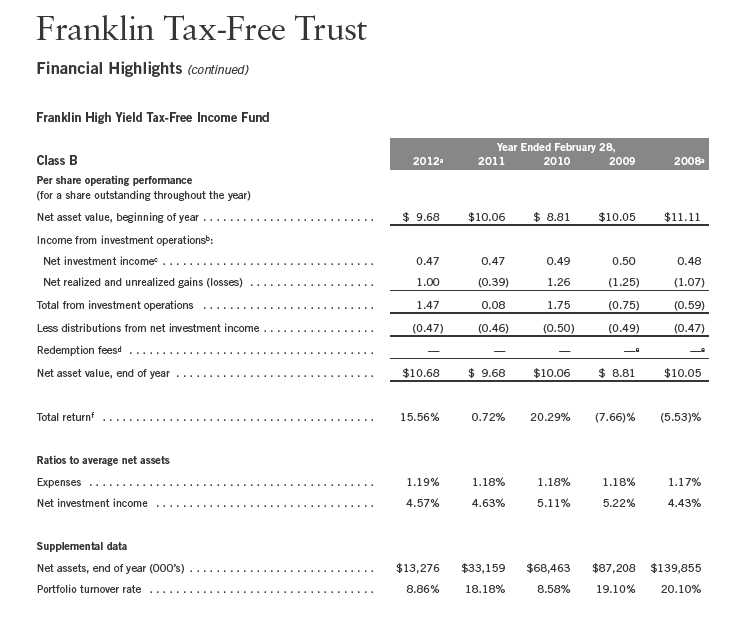
aFor the year ended February 29.
bThe amount shown for a share outstanding throughout the period may not correlate with the Statement of Operations for the period due to the timing of sales and repurchases of
the Fund shares in relation to income earned and/or fluctuating market value of the investments of the Fund.
cBased on average daily shares outstanding.
dEffective September 1, 2008, the redemption fee was eliminated.
eAmount rounds to less than $0.01 per share.
fTotal return does not reflect sales commissions or contingent deferred sales charges, if applicable.
112 | The accompanying notes are an integral part of these financial statements. | Annual Report
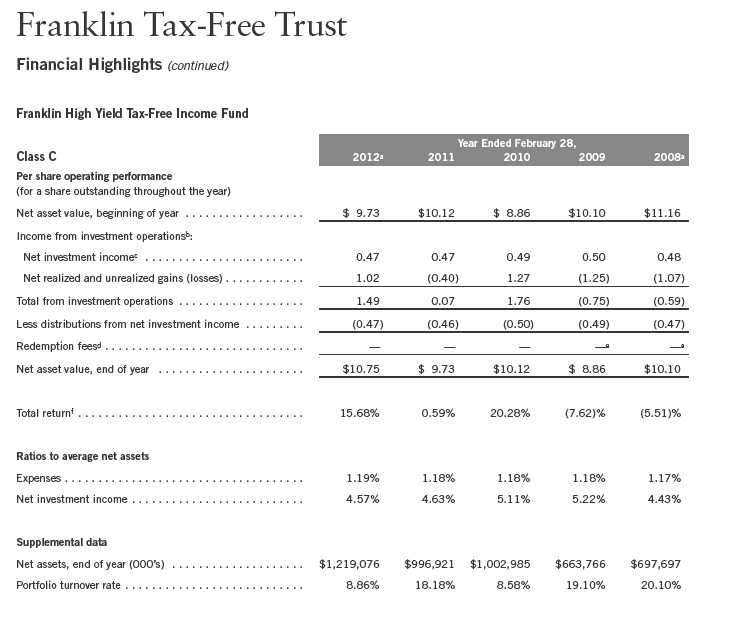
aFor the year ended February 29.
bThe amount shown for a share outstanding throughout the period may not correlate with the Statement of Operations for the period due to the timing of sales and repurchases of
the Fund shares in relation to income earned and/or fluctuating market value of the investments of the Fund.
cBased on average daily shares outstanding.
dEffective September 1, 2008, the redemption fee was eliminated.
eAmount rounds to less than $0.01 per share.
fTotal return does not reflect sales commissions or contingent deferred sales charges, if applicable.
Annual Report | The accompanying notes are an integral part of these financial statements. | 113
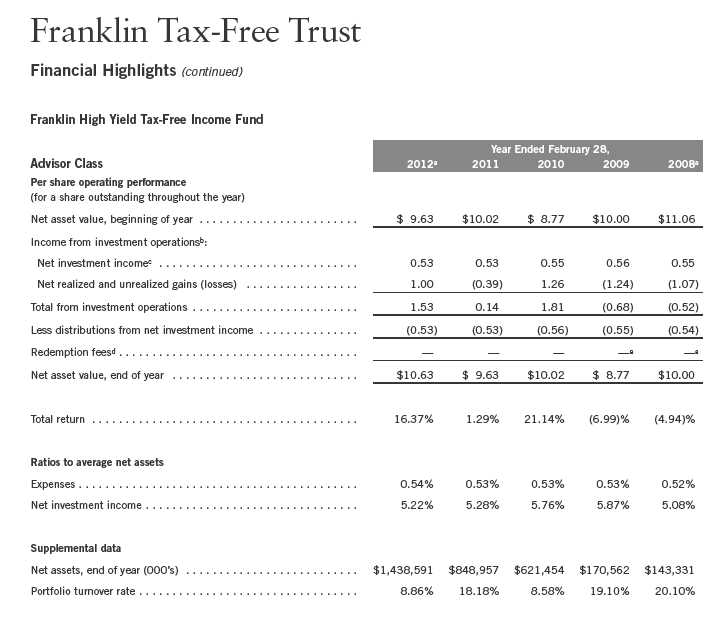
aFor the year ended February 29.
bThe amount shown for a share outstanding throughout the period may not correlate with the Statement of Operations for the period due to the timing of sales and repurchases of
the Fund shares in relation to income earned and/or fluctuating market value of the investments of the Fund.
cBased on average daily shares outstanding.
dEffective September 1, 2008, the redemption fee was eliminated.
eAmount rounds to less than $0.01 per share.
114 | The accompanying notes are an integral part of these financial statements. | Annual Report
| | | | |
| Franklin Tax-Free Trust | | | | |
| |
| Statement of Investments, February 29, 2012 | | | | |
| |
| |
| Franklin High Yield Tax-Free Income Fund | | Principal Amount | | Value |
| Municipal Bonds 92.5% | | | | |
| Alabama 0.4% | | | | |
| Alabama State Port Authority Docks Facilities Revenue, Refunding, 6.00%, 10/01/40 | $ | 6,000,000 | $ | 6,558,180 |
| Camden IDB Exempt Facilities Revenue, Weyerhaeuser, | | | | |
| Series A, Pre-Refunded, 6.125%, 12/01/24 | | 3,000,000 | | 3,302,280 |
| Series B, Pre-Refunded, 6.375%, 12/01/24 | | 1,750,000 | | 1,921,010 |
| Courtland IDB Environmental Improvement Revenue, International Paper Co. Projects, | | | | |
| Refunding, Series B, 6.25%, 8/01/25 | | 2,500,000 | | 2,584,350 |
| Cullman County Health Care Authority GO, Refunding, 7.00%, 2/01/36 | | 7,500,000 | | 7,589,100 |
| Phenix City IDB Environmental Improvement Revenue, MeadWestvaco-Mead Coated Board | | | | |
| Project, Refunding, Series B, 6.10%, 5/15/30 | | 5,800,000 | | 5,808,178 |
| Prattville IDB Environmental Improvement Revenue, International Paper Co. Projects, Series A, | | | | |
| 9.25%, 3/01/33 | | 5,500,000 | | 7,032,740 |
| Selma IDBR, Gulf Opportunity Zone, International Paper Co. Projects, Series A, 5.80%, | | | | |
| 5/01/34 | | 3,000,000 | | 3,208,620 |
| | | | | 38,004,458 |
| Alaska 0.1% | | | | |
| Alaska Industrial Development and Export Authority Power Revenue, Upper Lynn Canal | | | | |
| Regional Power, | | | | |
| 5.80%, 1/01/18 | | 1,495,000 | | 1,496,077 |
| 5.875%, 1/01/32 | | 5,730,000 | | 5,679,805 |
| | | | | 7,175,882 |
| Arizona 4.0% | | | | |
| Apache County IDA, | | | | |
| IDR, Tucson Electric Power Co. Project, Refunding, Series C, 5.85%, 3/01/26 | | 16,500,000 | | 16,523,100 |
| PCR, Tucson Electric Power Co. Project, Refunding, Series A, 5.85%, 3/01/28 | | 53,150,000 | | 53,218,563 |
| PCR, Tucson Electric Power Co. Project, Refunding, Series B, 5.875%, 3/01/33 | | 33,800,000 | | 33,832,786 |
| Arizona Health Facilities Authority Hospital System Revenue, John C. Lincoln Health Network, | | | | |
| Pre-Refunded, 6.375%, 12/01/37 | | 2,500,000 | | 2,635,575 |
| Arizona Health Facilities Authority Revenue, Catholic Healthcare West, Series B1, 5.25%, | | | | |
| 3/01/39 | | 10,000,000 | | 10,686,700 |
| Casa Grande IDA Hospital Revenue, Casa Grande Regional Medical Center, Series A, 7.25%, | | | | |
| 12/01/32 | | 14,500,000 | | 14,714,455 |
| Downtown Phoenix Hotel Corp. Revenue, sub. bond, Series B, NATL RE, FGIC Insured, 5.00%, | | | | |
| 7/01/36 | | 10,000,000 | | 10,159,100 |
| Maricopa County IDA Health Facility Revenue, Catholic Healthcare West Project, Refunding, | | | | |
| Series A, 5.50%, 7/01/26 | | 7,500,000 | | 8,013,075 |
| Maricopa County PCC, PCR, | | | | |
| El Paso Electric Co. Project, Series A, 7.25%, 4/01/40 | | 20,000,000 | | 23,604,400 |
| Southern California Edison Co., Refunding, Series A, 5.00%, 6/01/35 | | 6,025,000 | | 6,554,236 |
| Various, Public Service Co., Palo Verde Project, Refunding, Series A, 6.25%, 1/01/38 | | 15,000,000 | | 16,180,950 |
| Navajo County PCC Revenue, Mandatory Put 6/01/16, Series D, 5.75%, 6/01/34 | | 10,750,000 | | 12,342,398 |
| Phoenix Civic Improvement Corp. Airport Revenue, | | | | |
| junior lien, Series A, 5.00%, 7/01/40 | | 24,000,000 | | 25,318,080 |
| senior lien, Series A, 5.00%, 7/01/38 | | 15,000,000 | | 15,924,450 |
| Pima County IDAR, Industrial Development, Tucson Electric Power Co., Series A, 6.375%, | | | | |
| 9/01/29 | | 35,000,000 | | 35,791,000 |
| Pinal County Electric District No. 3 Revenue, Refunding, 5.25%, 7/01/41 | | 10,000,000 | | 10,627,900 |
Annual Report | 115
| | | | |
| Franklin Tax-Free Trust | | | | |
| |
| Statement of Investments, February 29, 2012 (continued) | | | | |
| |
| |
| Franklin High Yield Tax-Free Income Fund | | Principal Amount | | Value |
| Municipal Bonds (continued) | | | | |
| Arizona (continued) | | | | |
| Salt Verde Financial Corp. Senior Gas Revenue, | | | | |
| 5.25%, 12/01/25 | $ | 6,000,000 | $ | 6,469,740 |
| 5.50%, 12/01/29 | | 11,105,000 | | 12,053,256 |
| University Medical Center Corp. Hospital Revenue, | | | | |
| 6.00%, 7/01/24 | | 250,000 | | 284,510 |
| 6.25%, 7/01/29 | | 1,000,000 | | 1,125,320 |
| 5.00%, 7/01/35 | | 10,175,000 | | 10,199,013 |
| 6.50%, 7/01/39 | | 1,500,000 | | 1,679,310 |
| Yuma County IDA Water and Sewer Exempt Facility Revenue, Water and Sewer, Refunding, | | | | |
| Series A, 6.375%, 12/01/37 | | 15,500,000 | | 14,666,565 |
| | | | | 342,604,482 |
| Arkansas 0.1% | | | | |
| Arkansas State Development Finance Authority Industrial Facilities Revenue, Potlatch Corp. | | | | |
| Projects, Series A, 7.75%, 8/01/25 | | 3,800,000 | | 3,910,352 |
| Baxter County IDR, Aeroquip Corp. Project, Refunding, 5.80%, 10/01/13 | | 2,400,000 | | 2,519,904 |
| Warren Solid Waste Disposal Revenue, Potlatch Corp. Project, 7.00%, 4/01/12 | | 3,150,000 | | 3,159,450 |
| | | | | 9,589,706 |
| California 17.9% | | | | |
| Aliso Viejo CFD No. 2005-01 Special Tax, Glenwood at Aliso Viejo, 6.00%, 9/01/38 | | 5,200,000 | | 5,152,264 |
| Alvord USD, GO, Election of 2007, Refunding, Series B, AGMC Insured, zero cpn., | | | | |
| 8/01/41 | | 30,750,000 | | 5,940,592 |
| Anaheim City School District GO, | | | | |
| AGMC Insured, zero cpn., 8/01/30 | | 5,000,000 | | 2,003,900 |
| Election of 2002, AGMC Insured, zero cpn., 8/01/29 | | 7,000,000 | | 2,993,760 |
| Anaheim PFAR, Refunding, Series A-2, NATL RE, FGIC Insured, 4.75%, 9/01/29 | | 24,000,000 | | 24,891,120 |
| Azusa Special Tax, Escrow, CFD No. 2005-1, Improvement Area 1, 5.00%, 9/01/37 | | 5,370,000 | | 4,448,615 |
| Bay Area Toll Authority Toll Bridge Revenue, San Francisco Bay Area, Refunding, Series F-1, | | | | |
| 5.50%, 4/01/43 | | 29,765,000 | | 32,824,247 |
| Beaumont Financing Authority Local Agency Revenue, Improvement Area No. 19C, Series A, | | | | |
| 5.35%, 9/01/36 | | 3,680,000 | | 3,501,741 |
| Beaumont PFAR, Sewer Enterprise Project, Series A, Pre-Refunded, 6.90%, 9/01/23 | | 3,700,000 | | 4,286,820 |
| California County Tobacco Securitization Agency Tobacco Revenue, Asset-Backed, Alameda | | | | |
| County Tobacco Asset Securitization Corp., 5.875%, 6/01/35 | | 3,700,000 | | 3,279,088 |
| California Health Facilities Financing Authority Revenue, | | | | |
| Children’s Hospital of Orange County, Series A, 6.50%, 11/01/24 | | 5,000,000 | | 6,051,750 |
| Children’s Hospital of Orange County, Series A, 6.50%, 11/01/38 | | 8,000,000 | | 9,261,520 |
| Marshall Medical Center, Series A, California Mortgage Insured, 5.00%, 11/01/24 | | 2,295,000 | | 2,366,168 |
| Marshall Medical Center, Series A, California Mortgage Insured, 5.00%, 11/01/29 | | 2,220,000 | | 2,267,996 |
| Marshall Medical Center, Series A, California Mortgage Insured, 5.00%, 11/01/33 | | 3,130,000 | | 3,174,039 |
| California HFAR, Home Mortgage, Series K, 4.70%, 8/01/31 | | 20,000,000 | | 17,703,000 |
| California Infrastructure and Economic Development Bank Revenue, Department of Social | | | | |
| Services Administration Building, AMBAC Insured, 5.00%, | | | | |
| 12/01/30 | | 10,300,000 | | 11,422,597 |
| 12/01/35 | | 5,000,000 | | 5,379,250 |
| California Municipal Finance Authority Revenue, Harbor Regional Center Project, 8.50%, | | | | |
| 11/01/39 | | 5,000,000 | | 5,691,900 |
116 | Annual Report
| | | | |
| Franklin Tax-Free Trust | | | | |
| |
| Statement of Investments, February 29, 2012 (continued) | | | | |
| |
| |
| Franklin High Yield Tax-Free Income Fund | | Principal Amount | | Value |
| Municipal Bonds (continued) | | | | |
| California (continued) | | | | |
| California PCFA Water Facilities Revenue, American Water Capital Corp. Project, 5.25%, | | | | |
| 8/01/40 | $ | 6,000,000 | $ | 6,034,920 |
| California State GO, | | | | |
| Refunding, 5.25%, 4/01/30 | | 50,000 | | 50,080 |
| Refunding, 5.25%, 4/01/32 | | 40,000 | | 40,055 |
| Various Purpose, 6.00%, 4/01/38 | | 28,725,000 | | 33,052,708 |
| Various Purpose, 5.25%, 11/01/40 | | 47,000,000 | | 51,224,360 |
| Various Purpose, Refunding, 5.25%, 3/01/30 | | 70,000,000 | | 78,472,800 |
| Various Purpose, Refunding, 5.50%, 3/01/40 | | 60,000,000 | | 66,231,600 |
| Various Purpose, Refunding, 5.00%, 10/01/41 | | 10,000,000 | | 10,665,500 |
| California State Public Works Board Lease Revenue, Trustees of California State University, | | | | |
| Series J, 6.00%, | | | | |
| 11/01/29 | | 7,365,000 | | 8,683,851 |
| 11/01/34 | | 17,560,000 | | 19,732,172 |
| California Statewide CDA Revenue, | | | | |
| American Baptist Home West, Refunding, 6.00%, 10/01/29 | | 3,125,000 | | 3,257,875 |
| American Baptist Home West, Refunding, 6.25%, 10/01/39 | | 5,000,000 | | 5,201,200 |
| Elder Care Alliance, Series A, Pre-Refunded, 8.25%, 11/15/32 | | 13,090,000 | | 14,070,572 |
| Monterey Institute International, 5.50%, 7/01/31 | | 13,240,000 | | 14,827,344 |
| St. Joseph Health System, Series B, FGIC Insured, 5.75%, 7/01/47 | | 5,000,000 | | 5,411,650 |
| St. Joseph Health System, Series E, AGMC Insured, 5.25%, 7/01/47 | | 10,000,000 | | 10,447,200 |
| Sutter Health, Refunding, Series A, 5.00%, 11/15/43 | | 25,000,000 | | 25,642,000 |
| Thomas Jefferson School of Law, Refunding, Series A, 7.25%, 10/01/38 | | 11,730,000 | | 12,398,727 |
| California Statewide CDA Special Tax Revenue, CFD 2007-1, Orinda, 6.00%, 9/01/37 | | 10,000,000 | | 9,757,900 |
| Chabot-Las Positas Community College District GO, Capital Appreciation Bonds, Series C, | | | | |
| AMBAC Insured, zero cpn., | | | | |
| 8/01/33 | | 21,015,000 | | 6,844,375 |
| 8/01/34 | | 10,000,000 | | 3,037,100 |
| 8/01/45 | | 34,035,000 | | 5,257,386 |
| Chino CFD Special Tax, No. 03-3, Improvement Area 2, 5.00%, 9/01/36 | | 2,215,000 | | 2,000,854 |
| Chula Vista CFD Special Tax, | | | | |
| No. 07-I, Otay Ranch Village Eleven, 5.875%, 9/01/34 | | 2,890,000 | | 2,915,548 |
| No. 13-I, Otay Ranch Village Seven, 5.35%, 9/01/36 | | 2,155,000 | | 1,855,671 |
| El Dorado County CFD No. 2001-1 Special Tax, Promontory Specific Plan, 6.30%, | | | | |
| 9/01/31 | | 3,500,000 | | 3,516,695 |
| Foothill/Eastern Corridor Agency Toll Road Revenue, Capital Appreciation, Refunding, | | | | |
| 5.85%, 1/15/23 | | 35,000,000 | | 35,839,300 |
| zero cpn., 1/15/22 | | 49,115,000 | | 27,413,537 |
| zero cpn., 1/15/31 | | 4,000,000 | | 1,252,960 |
| zero cpn., 1/15/34 | | 4,500,000 | | 1,123,335 |
| zero cpn., 1/15/36 | | 4,000,000 | | 871,360 |
| Fullerton CFD No. 1 Special Tax, Amerige Heights, 6.20%, 9/01/32 | | 3,500,000 | | 3,515,470 |
| Golden State Tobacco Securitization Corp. Tobacco Settlement Revenue, | | | | |
| Asset-Backed, Refunding, Senior Series A-1, 5.00%, 6/01/33 | | 9,960,000 | | 7,619,699 |
| Asset-Backed, Series A-3, Pre-Refunded, 7.875%, 6/01/42 | | 10,000,000 | | 10,929,300 |
| Enhanced, Asset-Backed, Refunding, Series A, 5.00%, 6/01/45 | | 30,750,000 | | 30,811,500 |
| Enhanced, Asset-Backed, Refunding, Series A, AMBAC Insured, 5.00%, 6/01/45 | | 13,250,000 | | 13,276,500 |
Annual Report | 117
| | | | |
| Franklin Tax-Free Trust | | | | |
| |
| Statement of Investments, February 29, 2012 (continued) | | | | |
| |
| |
| Franklin High Yield Tax-Free Income Fund | | Principal Amount | | Value |
| Municipal Bonds (continued) | | | | |
| California (continued) | | | | |
| Lake Elsinore 1915 Act Special Assessment, AD No. 93-1, Limited Obligation, Refunding, | | | | |
| 7.00%, 9/02/30 | $ | 7,195,000 | $ | 7,255,582 |
| Lee Lake Water District CFD No. 3 Special Tax, Retreat, 5.95%, 9/01/34 | | 5,000,000 | | 5,006,200 |
| Livermore CFD Special Tax, No. 06-1, Shea Properties, 5.40%, 9/01/36 | | 6,595,000 | | 5,821,736 |
| Los Angeles Department of Airports Airport Revenue, Los Angeles International Airport, | | | | |
| Senior, Refunding, Series A, 5.00%, 5/15/40 | | 25,500,000 | | 28,031,640 |
| senior bond, Series D, 5.00%, 5/15/40 | | 52,685,000 | | 58,191,109 |
| Los Angeles MFR, Refunding, | | | | |
| Series J-1B, 7.125%, 1/01/24 | | 60,000 | | 60,034 |
| Series J-1C, 7.125%, 1/01/24 | | 335,000 | | 325,978 |
| Series J-2B, 8.50%, 1/01/24 | | 280,000 | | 280,011 |
| aSeries J-2C, 8.50%, 1/01/24 | | 1,400,000 | | 1,352,344 |
| Los Angeles USD, GO, Series KRY, 5.25%, 7/01/34 | | 36,625,000 | | 41,869,700 |
| Los Angeles Wastewater System Revenue, Refunding, Series A, NATL Insured, 5.00%, | | | | |
| 6/01/30 | | 7,530,000 | | 7,926,906 |
| M-S-R Energy Authority Gas Revenue, | | | | |
| Series B, 6.125%, 11/01/29 | | 30,505,000 | | 35,518,192 |
| Series B, 7.00%, 11/01/34 | | 20,000,000 | | 26,068,200 |
| Series C, 6.50%, 11/01/39 | | 20,000,000 | | 24,676,200 |
| Murrieta 1915 Act Special Tax, CFD No. 2000-1, 6.375%, 9/01/30 | | 3,955,000 | | 4,000,997 |
| Novato RDA Tax Allocation, Hamilton Field Redevelopment Project, 6.75%, 9/01/40 | | 3,750,000 | | 4,101,637 |
| Perris UHSD Financing Authority Revenue, | | | | |
| 5.75%, 9/01/30 | | 1,690,000 | | 1,743,100 |
| 6.00%, 9/01/33 | | 2,570,000 | | 2,651,649 |
| 6.125%, 9/01/41 | | 5,500,000 | | 5,672,920 |
| Poway USD Special Tax, | | | | |
| CFD No. 10, Area A, Pre-Refunded, 6.10%, 9/01/31 | | 1,995,000 | | 1,995,000 |
| CFD No. 11, Area A, 5.375%, 9/01/28 | | 2,965,000 | | 2,981,159 |
| CFD No. 11, Area A, 5.375%, 9/01/34 | | 2,235,000 | | 2,202,011 |
| CFD No. 14, Del Sur, 5.25%, 9/01/36 | | 7,500,000 | | 6,973,350 |
| Rocklin Special Tax, CFD No. 10, Whitney, 5.00%, 9/01/35 | | 7,030,000 | | 5,985,834 |
| Romoland School District Special Tax, CFD No. 1, | | | | |
| Improvement Area 1, 5.35%, 9/01/28 | | 7,015,000 | | 7,041,447 |
| Improvement Area 1, 5.40%, 9/01/36 | | 6,175,000 | | 6,117,017 |
| Improvement Area 2, 5.35%, 9/01/38 | | 7,900,000 | | 7,222,891 |
| Roseville Special Tax, CFD No. 1, Westpark, 5.25%, 9/01/25 | | 1,550,000 | | 1,523,557 |
| San Buenaventura Revenue, Community Memorial Health System, | | | | |
| 8.00%, 12/01/31 | | 10,000,000 | | 11,881,000 |
| 7.50%, 12/01/41 | | 15,000,000 | | 16,958,700 |
| San Francisco City and County COP, Multiple Capital Improvement Projects, Series A, 5.00%, | | | | |
| 4/01/29 | | 10,000,000 | | 10,795,700 |
| San Francisco City and County RDA Lease Revenue, George R. Moscone Center, zero cpn., | | | | |
| 7/01/12 | | 4,500,000 | | 4,484,115 |
| 7/01/13 | | 4,250,000 | | 4,182,212 |
| 7/01/14 | | 2,250,000 | | 2,175,255 |
| San Francisco Uptown Parking Corp. Parking Revenue, Union Square, NATL Insured, 6.00%, | | | | |
| 7/01/31 | | 8,920,000 | | 9,116,686 |
118 | Annual Report
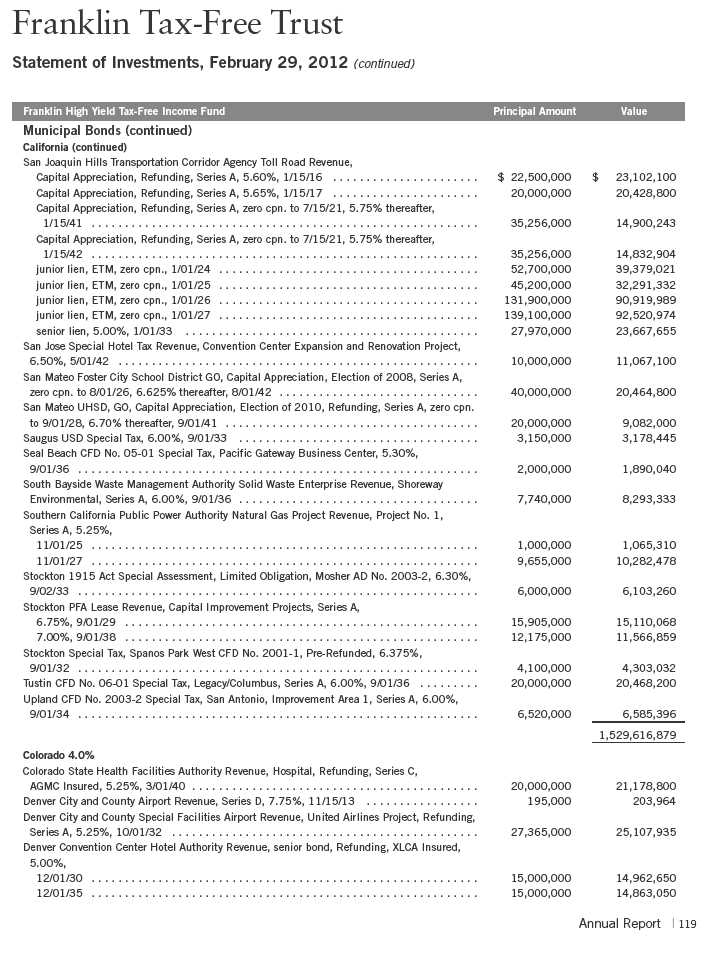
| | | | |
| Franklin Tax-Free Trust | | | | |
| |
| Statement of Investments, February 29, 2012 (continued) | | | | |
| |
| |
| Franklin High Yield Tax-Free Income Fund | | Principal Amount | | Value |
| Municipal Bonds (continued) | | | | |
| Colorado (continued) | | | | |
| Denver Health and Hospital Authority Healthcare Revenue, Series A, Pre-Refunded, 6.25%, | | | | |
| 12/01/33 | $ | 4,000,000 | $ | 4,630,800 |
| E-470 Public Highway Authority Revenue, | | | | |
| Capital Appreciation, Refunding, Series B, NATL Insured, zero cpn., 9/01/37 | | 15,720,000 | | 3,381,844 |
| Capital Appreciation, Refunding, Series B, NATL Insured, zero cpn., 9/01/38 | | 20,000,000 | | 4,040,400 |
| Capital Appreciation, Refunding, Series B, NATL Insured, zero cpn., 9/01/39 | | 30,000,000 | | 5,690,400 |
| Capital Appreciation, Series A, NATL Insured, zero cpn., 9/01/28 | | 15,000,000 | | 6,160,950 |
| Capital Appreciation, Series B, NATL Insured, zero cpn., 9/01/29 | | 10,000,000 | | 3,785,700 |
| Capital Appreciation, Series B, NATL Insured, zero cpn., 9/01/30 | | 17,300,000 | | 6,139,424 |
| Capital Appreciation, Series B, NATL Insured, zero cpn., 9/01/31 | | 10,000,000 | | 3,319,000 |
| Series A1, NATL Insured, 5.50%, 9/01/24 | | 10,000,000 | | 10,822,200 |
| Series C, 5.375%, 9/01/26 | | 5,000,000 | | 5,364,150 |
| Series C1, NATL Insured, 5.50%, 9/01/24 | | 3,000,000 | | 3,246,660 |
| Series D1, NATL Insured, 5.50%, 9/01/24 | | 6,000,000 | | 6,493,320 |
| Eagle County Sports and Housing Facilities Revenue, Vail Associate Project, Refunding, | | | | |
| 6.95%, 8/01/19 | | 41,200,000 | | 41,683,276 |
| Public Authority for Colorado Energy Natural Gas Purchase Revenue, | | | | |
| 6.125%, 11/15/23 | | 2,465,000 | | 2,845,399 |
| 6.25%, 11/15/28 | | 12,500,000 | | 14,819,500 |
| 6.50%, 11/15/38 | | 90,100,000 | | 113,165,600 |
| Regional Transportation District COP, Series A, 5.00%, 6/01/25 | | 13,500,000 | | 15,330,735 |
| Superior Metropolitan District No. 1 Special Revenue, Refunding, AMBAC Insured, 5.00%, | | | | |
| 12/01/28 | | 7,640,000 | | 7,772,248 |
| a,bVillages Castle Rock Metropolitan District No. 4 Revenue, Refunding, 8.50%, 6/01/31 | | 3,000,000 | | 2,911,140 |
| | | | | 337,919,145 |
| Connecticut 0.2% | | | | |
| Connecticut State Development Authority PCR, Western Massachusetts Electric Co., | | | | |
| Refunding, Series A, 5.85%, 9/01/28 | | 12,500,000 | | 12,569,125 |
| Connecticut State Health and Educational Facilities Authority Revenue, St. Mary’s Hospital, | | | | |
| Refunding, Series E, 5.50%, 7/01/20 | | 5,650,000 | | 5,650,000 |
| | | | | 18,219,125 |
| District of Columbia 2.4% | | | | |
| District of Columbia Ballpark Revenue, Series B-1, NATL RE, FGIC Insured, 5.00%, | | | | |
| 2/01/35 | | 18,000,000 | | 18,151,560 |
| District of Columbia Hospital Revenue, Children’s Hospital Obligated Group, Assured Guaranty, | | | | |
| 5.25%, 7/15/38 | | 11,000,000 | | 11,594,330 |
| District of Columbia Revenue, | | | | |
| Assn. of American Medical Colleges, Series B, 5.25%, 10/01/36 | | 12,425,000 | | 13,383,216 |
| Capital Appreciation, Georgetown University, Growth and Income Securities, | | | | |
| AMBAC Insured, zero cpn. to 3/31/18, 5.00% thereafter, 4/01/36 | | 27,105,000 | | 20,327,937 |
| The Catholic University of America, Refunding, 5.00%, 10/01/34 | | 3,750,000 | | 3,975,863 |
| Center for Strategic and International Studies Inc. Issue, Refunding, 6.375%, 3/01/31 | | 5,200,000 | | 5,595,616 |
| Center for Strategic and International Studies Inc. Issue, Refunding, 6.625%, 3/01/41 | | 5,500,000 | | 5,893,910 |
| Deed Tax, Series A, 5.00%, 6/01/40 | | 13,000,000 | | 13,588,120 |
| Methodist Home Issue, 6.00%, 1/01/29 | | 4,750,000 | | 4,607,785 |
| Methodist Home Issue, Series A, 7.375%, 1/01/30 | | 2,525,000 | | 2,591,887 |
| Methodist Home Issue, Series A, 7.50%, 1/01/39 | | 4,150,000 | | 4,257,028 |
120 | Annual Report
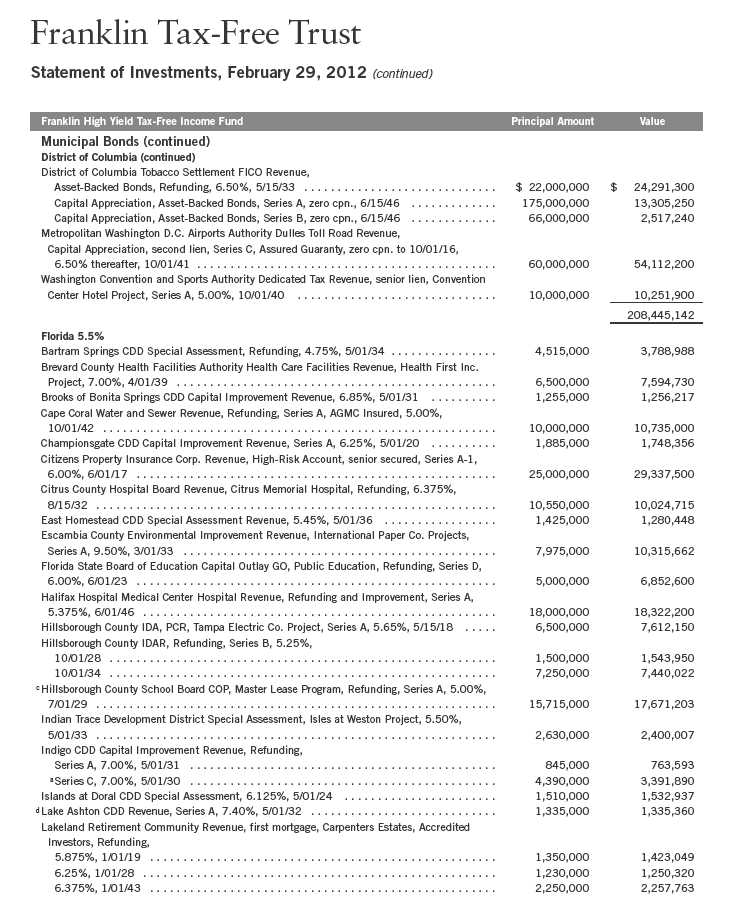
Annual Report | 121
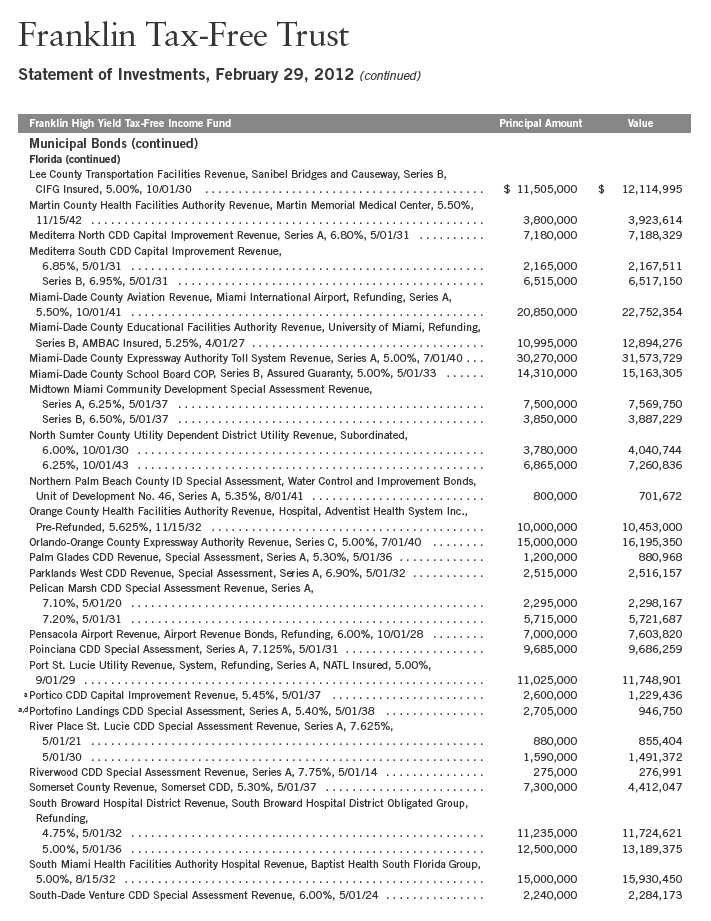
122 | Annual Report
| | | | |
| Franklin Tax-Free Trust | | | | |
| |
| Statement of Investments, February 29, 2012 (continued) | | | | |
| |
| |
| Franklin High Yield Tax-Free Income Fund | | Principal Amount | | Value |
| Municipal Bonds (continued) | | | | |
| Florida (continued) | | | | |
| Stonegate CDD Special Assessment Revenue, 6.00%, 5/01/24 | $ | 1,835,000 | $ | 1,853,699 |
| Tara CDD No. 1 Capital Improvement Revenue, Series A, 7.15%, 5/01/31 | | 1,175,000 | | 1,176,175 |
| Venetian CDD Capital Improvement Revenue, Series A, 6.75%, 5/01/34 | | 7,905,000 | | 7,927,529 |
| Verandah East CDD Revenue, Capital Improvement, Series A, 5.40%, 5/01/37 | | 1,875,000 | | 977,288 |
| Verandah West CDD Revenue, Series A, 6.625%, 5/01/33 | | 7,835,000 | | 7,858,192 |
| Village CDD No. 8 Special Assessment Revenue, 6.375%, 5/01/38 | | 8,900,000 | | 9,555,396 |
| Village CDD No. 9 Special Assessment Revenue, | | | | |
| 6.75%, 5/01/31 | | 9,035,000 | | 10,156,153 |
| 7.00%, 5/01/41 | | 8,000,000 | | 8,981,920 |
| Refunding, 5.00%, 5/01/22 | | 2,045,000 | | 2,075,798 |
| Refunding, 5.25%, 5/01/31 | | 2,280,000 | | 2,313,904 |
| Refunding, 5.50%, 5/01/42 | | 2,250,000 | | 2,283,053 |
| Village Center CDD Recreational Revenue, | | | | |
| sub. bond, Series B, 6.25%, 1/01/13 | | 910,000 | | 923,868 |
| Sub Series B, 8.25%, 1/01/17 | | 1,095,000 | | 1,099,479 |
| Sub Series C, 7.375%, 1/01/19 | | 1,725,000 | | 1,732,883 |
| Waterlefe CDD Capital Improvement Revenue, Series A, 6.95%, 5/01/31 | | 1,040,000 | | 1,041,092 |
| Waters Edge CDD Capital Improvement Revenue, 5.30%, 5/01/36 | | 1,700,000 | | 1,499,893 |
| Westchase East CDD Capital Improvement Revenue, 7.10%, 5/01/21 | | 1,020,000 | | 1,020,347 |
| Winter Garden Village at Fowler Groves CDD Special Tax, 5.65%, 5/01/37 | | 1,900,000 | | 1,919,437 |
| | | | | 471,475,188 |
| Georgia 3.0% | | | | |
| Atlanta Airport Revenue, General, Series A, 5.00%, 1/01/40 | | 10,000,000 | | 10,624,000 |
| Atlanta Tax Allocation, Princeton Lakes Project, 5.50%, 1/01/31 | | 1,035,000 | | 1,017,063 |
| Atlanta Water and Wastewater Revenue, Refunding, | | | | |
| Series A, 6.25%, 11/01/34 | | 30,000,000 | | 35,342,400 |
| Series B, AGMC Insured, 5.25%, 11/01/34 | | 30,000,000 | | 33,348,600 |
| Baldwin County Hospital Authority Revenue, Oconee Regional Medical Center, 5.375%, | | | | |
| 12/01/28 | | 1,470,000 | | 1,289,014 |
| Burke County Development Authority PCR, Oglethorpe Power Corp., Vogtle Project, | | | | |
| Series C, 5.70%, 1/01/43 | | 55,000,000 | | 58,749,900 |
| Series E, 7.00%, 1/01/23 | | 25,000,000 | | 29,774,250 |
| Floyd County Development Authority Environmental Improvement Revenue, Temple-Inland Inc., | | | | |
| Refunding, 5.70%, 12/01/15 | | 1,575,000 | | 1,610,910 |
| Forsyth County Hospital Authority Revenue, Anticipation Certificates, Georgia Baptist Health | | | | |
| Care System Project, ETM, | | | | |
| 6.25%, 10/01/18 | | 4,565,000 | | 5,312,291 |
| 6.375%, 10/01/28 | | 8,000,000 | | 10,642,880 |
| Fulton County Residential Care Revenue, Lenbrook Project, Series A, 5.00%, 7/01/27 | | 5,000,000 | | 4,138,600 |
| Gainesville RDA Educational Facilities Revenue, Riverside Military Academy, Refunding, | | | | |
| 5.125%, 3/01/37 | | 6,500,000 | | 5,279,755 |
| Henry County Hospital Authority Revenue, Henry Medical Center Inc. Project, Refunding, | | | | |
| NATL Insured, 5.00%, 7/01/34 | | 15,000,000 | | 15,611,400 |
| Main Street Natural Gas Inc. Gas Project Revenue, Series A, 5.50%, | | | | |
| 9/15/25 | | 5,000,000 | | 5,529,250 |
| 9/15/27 | | 4,000,000 | | 4,443,440 |
| 9/15/28 | | 10,000,000 | | 11,046,000 |
Annual Report | 123
| | | | |
| Franklin Tax-Free Trust | | | | |
| |
| Statement of Investments, February 29, 2012 (continued) | | | | |
| |
| |
| Franklin High Yield Tax-Free Income Fund | | Principal Amount | | Value |
| Municipal Bonds (continued) | | | | |
| Georgia (continued) | | | | |
| McDuffie County Development Authority Waste Disposal Revenue, Temple-Inland Forest | | | | |
| Products, 6.95%, 12/01/23 | $ | 5,120,000 | $ | 5,254,963 |
| Richmond County Development Authority Environmental Improvement Revenue, International | | | | |
| Paper Co. Project, Series A, 6.25%, 11/01/33 | | 7,000,000 | | 7,761,530 |
| Savannah EDA Revenue, Recovery Zone Facility, International Paper Co. Project, Series A, | | | | |
| 6.25%, 11/01/33 | | 4,865,000 | | 5,394,263 |
| | | | | 252,170,509 |
| Hawaii 0.1% | | | | |
| Hawaii State Department of Budget and Finance Special Purpose Revenue, Hawaiian Electric | | | | |
| Co. and Subsidiary, 6.50%, 7/01/39 | | 7,500,000 | | 8,401,500 |
| Idaho 0.7% | | | | |
| Idaho Health Facilities Authority Revenue, St. Luke’s Health System Project, Series A, 6.75%, | | | | |
| 11/01/37 | | 12,500,000 | | 14,395,875 |
| Idaho State Housing and Finance Assn. EDR, TDF Facility Project, Recovery Zone Facilities, | | | | |
| Series A, 7.00%, 2/01/36 | | 13,305,000 | | 14,547,554 |
| Nez Perce County PCR, | | | | |
| Potlatch 84, 7.00%, 12/01/14 | | 5,000,000 | | 5,242,200 |
| Potlatch Corp. Project, Refunding, 6.00%, 10/01/24 | | 22,500,000 | | 22,593,150 |
| | | | | 56,778,779 |
| Illinois 5.9% | | | | |
| Antioch Village Special Service Area No. 1 Special Tax, Deercrest Project, 6.625%, | | | | |
| 3/01/33 | | 3,218,000 | | 2,686,354 |
| Bolingbrook Special Service Area No. 1 Special Tax, Augusta Village Project, Pre-Refunded, | | | | |
| 6.25%, 3/01/32 | | 3,496,000 | | 3,565,920 |
| 6.75%, 3/01/32 | | 5,046,000 | | 5,146,920 |
| Bourbonnais Industrial Project Revenue, Olivet Nazarene University Project, 5.50%, | | | | |
| 11/01/40 | | 3,570,000 | | 3,716,834 |
| Bryant PCR, Central Illinois Light Co. Project, Refunding, NATL Insured, 5.90%, 8/01/23 | | 11,000,000 | | 11,034,980 |
| Cary Special Tax, Refunding, Radian Insured, 5.00%, 3/01/30 | | 3,035,000 | | 2,889,654 |
| Chicago Board of Education GO, | | | | |
| Refunding, 5.00%, 12/01/31 | | 12,500,000 | | 13,470,875 |
| Series A, 5.50%, 12/01/39 | | 6,500,000 | | 7,274,085 |
| Chicago GO, | | | | |
| Project, Series A, 5.25%, 1/01/35 | | 7,000,000 | | 7,639,240 |
| Refunding, Series A, AGMC Insured, 5.00%, 1/01/27 | | 34,105,000 | | 37,749,801 |
| Chicago O’Hare International Airport Revenue, | | | | |
| General Airport Third Lien, Series A, NATL RE, FGIC Insured, 5.00%, 1/01/33 | | 15,000,000 | | 15,429,450 |
| Passenger Facility, Series B, 5.00%, 1/01/35 | | 12,555,000 | | 13,166,805 |
| Passenger Facility, Series B, 5.00%, 1/01/40 | | 20,430,000 | | 21,150,566 |
| Refunding, Series A, AGMC Insured, 5.00%, 1/01/38 | | 16,500,000 | | 17,226,495 |
| Chicago Sales Tax Revenue, Refunding, Series A, 5.00%, 1/01/41 | | 10,000,000 | | 10,830,500 |
| Chicago Transit Authority Sales Tax Receipts Revenue, 5.25%, 12/01/36 | | 11,000,000 | | 12,230,790 |
| Cook County GO, Refunding, | | | | |
| Series A, 5.25%, 11/15/33 | | 8,720,000 | | 9,689,141 |
| Series G, 5.00%, 11/15/28 | | 50,000,000 | | 55,419,500 |
124 | Annual Report
| | | | |
| Franklin Tax-Free Trust | | | | |
| |
| Statement of Investments, February 29, 2012 (continued) | | | | |
| |
| |
| Franklin High Yield Tax-Free Income Fund | | Principal Amount | | Value |
| Municipal Bonds (continued) | | | | |
| Illinois (continued) | | | | |
| Illinois Finance Authority Revenue, | | | | |
| Institute Technology, 6.50%, 2/01/23 | $ | 1,000,000 | $ | 1,014,330 |
| Institute Technology, 7.125%, 2/01/34 | | 1,500,000 | | 1,564,905 |
| Lutheran Hillside Village, Refunding, 5.25%, 2/01/37 | | 7,500,000 | | 7,101,150 |
| Navistar International, Recovery Zone Facility, 6.50%, 10/15/40 | | 8,500,000 | | 9,124,410 |
| Resurrection Health Care, Series A, AGMC Insured, 5.25%, 5/15/29 | | 15,500,000 | | 16,352,655 |
| Riverside Health System, 6.25%, 11/15/35 | | 5,000,000 | | 5,601,300 |
| Roosevelt University Project, Refunding, 6.50%, 4/01/39 | | 15,000,000 | | 16,304,700 |
| Rush University Medical Center Obligated Group, Series B, 7.25%, 11/01/38 | | 10,000,000 | | 12,050,500 |
| Sherman Health System, Series A, 5.50%, 8/01/37 | | 17,240,000 | | 17,504,462 |
| Illinois Finance Authority Water Facility Revenue, American Water Capital Corp. Project, | | | | |
| 5.25%, | | | | |
| 10/01/39 | | 6,050,000 | | 6,106,144 |
| 5/01/40 | | 10,415,000 | | 10,476,032 |
| Illinois Health Facilities Authority Revenue, Thorek Hospital and Medical Center, Refunding, | | | | |
| 5.375%, 8/15/28 | | 8,595,000 | | 8,599,727 |
| Illinois State Development Finance Authority PCR, Ameren Corp. and Central Illinois Public | | | | |
| Service Co., Refunding, Series A, 5.50%, 3/01/14 | | 3,515,000 | | 3,525,405 |
| Illinois State Finance Authority Student Housing Revenue, | | | | |
| CHF-DeKalb II LLC, Northern Illinois University Project, 6.875%, 10/01/43 | | 15,000,000 | | 16,471,350 |
| Normal LLC, Illinois State University, 7.00%, 4/01/43 | | 7,500,000 | | 8,283,450 |
| Metropolitan Pier and Exposition Authority Dedicated State Tax Revenue, McCormick Place | | | | |
| Expansion Project, Series A, 5.50%, 6/15/50 | | 10,475,000 | | 11,304,096 |
| Metropolitan Pier and Exposition Authority Hospitality Facilities Revenue, McCormick Place | | | | |
| Convention Center, ETM, 7.00%, 7/01/26 | | 7,500,000 | | 10,809,750 |
| Minooka Special Assessment, Improvement, Prairie Ridge Project, 6.875%, 3/01/33 | | 3,000,000 | | 2,712,720 |
| Otter Creek Water Reclamation District Kane County GO, Separate Waterworks and Sewage | | | | |
| System, Refunding, XLCA Insured, 5.00%, 1/01/39 | | 4,500,000 | | 4,619,835 |
| Plano Special Service Area No. 2 Special Tax, Lakewood Springs Project, Series B, 6.375%, | | | | |
| 3/01/34 | | 7,751,000 | | 7,665,197 |
| Railsplitter Tobacco Settlement Authority Revenue, | | | | |
| 6.25%, 6/01/24 | | 6,000,000 | | 6,691,920 |
| Refunding, 6.00%, 6/01/28 | | 24,650,000 | | 27,875,699 |
| University of Illinois University Revenues, Auxiliary Facilities System, Refunding, | | | | |
| NATL Insured, 5.00%, 4/01/32 | | 22,430,000 | | 23,461,780 |
| Wauconda Special Service Area No. 1 Special Tax, Liberty Lakes Project, | | | | |
| 6.00%, 3/01/33 | | 4,415,000 | | 4,111,557 |
| 6.625%, 3/01/33 | | 5,174,000 | | 5,176,018 |
| Yorkville United City Special Service Area Special Tax, | | | | |
| No. 2003-101, Windett Ridge Project, 6.875%, 3/01/33 | | 3,380,000 | | 2,707,650 |
| No. 2004-104, MPI Grande Reserve Project, 6.375%, 3/01/34 | | 4,219,000 | | 3,330,858 |
| No. 2005-108, Autumn Creek Project, 6.00%, 3/01/36 | | 4,852,000 | | 4,001,105 |
| | | | | 504,866,615 |
| Indiana 1.1% | | | | |
| Delaware County Hospital Authority Hospital Revenue, Cardinal Health System, 5.25%, | | | | |
| 8/01/36 | | 5,000,000 | | 5,013,350 |
Annual Report | 125
| | | | |
| Franklin Tax-Free Trust | | | | |
| |
| Statement of Investments, February 29, 2012 (continued) | | | | |
| |
| |
| Franklin High Yield Tax-Free Income Fund | | Principal Amount | | Value |
| Municipal Bonds (continued) | | | | |
| Indiana (continued) | | | | |
| Goshen Industrial Revenue, Greencroft Hospital Assn. Inc., Refunding, 5.75%, | | | | |
| 8/15/19 | $ | 3,000,000 | $ | 2,999,760 |
| 8/15/28 | | 5,000,000 | | 4,657,750 |
| Indiana Health and Educational Facility Financing Authority Hospital Revenue, 5.50%, | | | | |
| 3/01/37 | | 8,000,000 | | 8,328,480 |
| Indiana Health and Educational Facility Financing Authority Revenue, Baptist Homes of | | | | |
| Indiana, Refunding, 5.25%, 11/15/35 | | 12,000,000 | | 12,113,640 |
| Indiana Health Facility Financing Authority Hospital Revenue, | | | | |
| 6.25%, 3/01/25 | | 5,900,000 | | 6,211,697 |
| 6.00%, 3/01/34 | | 12,000,000 | | 12,504,480 |
| Indiana Municipal Power Agency Power Supply System Revenue, Indiana Municipal Power | | | | |
| Agency, Series B, 6.00%, 1/01/39 | | 4,000,000 | | 4,493,560 |
| Indiana State Finance Authority Revenue, | | | | |
| Baptist Homes of Indiana Senior Living, 5.75%, 11/15/41 | | 5,000,000 | | 5,284,900 |
| Educational Facilities, Marian University Project, 6.375%, 9/15/41 | | 12,500,000 | | 12,964,625 |
| Jasper County PCR, Northern Indiana Public Service Co., Refunding, Series C, NATL Insured, | | | | |
| 5.60%, 11/01/16 | | 10,000,000 | | 11,269,700 |
| 5.85%, 4/01/19 | | 5,000,000 | | 5,730,350 |
| | | | | 91,572,292 |
| Iowa 0.1% | | | | |
| Iowa Higher Education Loan Authority Revenue, Private College Facility, Upper Iowa University | | | | |
| Project, Refunding, 6.00%, 9/01/39 | | 11,000,000 | | 11,636,350 |
| Kansas 0.1% | | | | |
| Kansas State Development Finance Authority Hospital Revenue, Adventist Health, Refunding, | | | | |
| 5.75%, 11/15/38 | | 6,250,000 | | 7,056,125 |
| Kentucky 1.4% | | | | |
| Kentucky Economic Development Finance Authority Health System Revenue, | | | | |
| Norton Healthcare Inc., | | | | |
| Refunding, Series C, NATL Insured, 6.10%, 10/01/22 | | 10,650,000 | | 11,215,834 |
| Refunding, Series C, NATL Insured, 6.15%, 10/01/27 | | 3,995,000 | | 4,185,122 |
| Series C, NATL Insured, Pre-Refunded, 6.10%, 10/01/22 | | 5,325,000 | | 5,853,134 |
| Series C, NATL Insured, Pre-Refunded, 6.15%, 10/01/27 | | 6,005,000 | | 6,605,260 |
| Kentucky Economic Development Finance Authority Hospital Facilities Revenue, Owensboro | | | | |
| Medical Health System, Refunding, Series A, 6.50%, 3/01/45 | | 18,330,000 | | 20,734,529 |
| Kentucky Economic Development Finance Authority Hospital System Revenue, Appalachian | | | | |
| Regional Health Center Facility, Refunding and Improvement, 5.875%, 10/01/22 | | 10,825,000 | | 10,826,083 |
| Kentucky Economic Development Finance Authority Louisville Arena Project Revenue, | | | | |
| Louisville Arena, Sub Series A-1, Assured Guaranty, 6.00%, 12/01/42 | | 5,000,000 | | 5,426,250 |
| Louisville and Jefferson County Metropolitan Government College Revenue, Improvement, | | | | |
| Bellarmie University Inc. Project, | | | | |
| 5.625%, 5/01/29 | | 5,555,000 | | 5,907,520 |
| 6.125%, 5/01/39 | | 5,000,000 | | 5,376,800 |
| Louisville and Jefferson County Metropolitan Government Health Facilities Revenue, Jewish | | | | |
| Hospital and St. Mary’s HealthCare Inc. Project, Refunding, 6.125%, 2/01/37 | | 11,500,000 | | 12,220,245 |
| Ohio County PCR, Big Rivers Electric Corp. Project, Refunding, Series A, 6.00%, 7/15/31 | | 7,500,000 | | 7,991,025 |
126 | Annual Report
| | | | |
| Franklin Tax-Free Trust | | | | |
| |
| Statement of Investments, February 29, 2012 (continued) | | | | |
| |
| |
| Franklin High Yield Tax-Free Income Fund | | Principal Amount | | Value |
| Municipal Bonds (continued) | | | | |
| Kentucky (continued) | | | | |
| Owen County Waterworks System Revenue, American Water Co. Project, Series A, | | | | |
| 6.25%, 6/01/39 | $ | 8,000,000 | $ | 8,711,760 |
| 5.375%, 6/01/40 | | 10,000,000 | | 10,290,700 |
| | | | | 115,344,262 |
| Louisiana 3.7% | | | | |
| Beauregard Parish Revenue, Boise Cascade Corp. Project, Refunding, 6.80%, 2/01/27 | | 13,990,000 | | 13,323,097 |
| Louisiana Local Government Environmental Facilities and CDA Revenue, Westlake Chemical | | | | |
| Corp. Projects, | | | | |
| 6.75%, 11/01/32 | | 41,250,000 | | 45,339,113 |
| Series A, 6.50%, 8/01/29 | | 9,000,000 | | 10,060,740 |
| Series A-2, 6.50%, 11/01/35 | | 8,000,000 | | 8,786,960 |
| Louisiana Public Facilities Authority Hospital Revenue, Franciscan Missionaries of Our Lady | | | | |
| Health System Project, 6.75%, 7/01/39 | | 10,000,000 | | 11,483,600 |
| Louisiana Public Facilities Authority Revenue, | | | | |
| Entergy Gulf States Louisiana, Refunding, Series A, 5.00%, 9/01/28 | | 25,000,000 | | 26,229,750 |
| Entergy LLC Project, Refunding, 5.00%, 6/01/30 | | 8,500,000 | | 8,973,280 |
| FHA Insured Mortgage, Baton Rouge General Medical Center Project, NATL Insured, | | | | |
| 5.25%, 7/01/33 | | 20,000,000 | | 21,373,000 |
| Ochsner Clinic Foundation Project, 6.50%, 5/15/37 | | 5,000,000 | | 5,574,300 |
| Ochsner Clinic Foundation Project, 6.75%, 5/15/41 | | 15,500,000 | | 17,454,085 |
| Ochsner Clinic Foundation Project, Series B, 5.25%, 5/15/38 | | 10,000,000 | | 10,153,500 |
| Ochsner Clinic Foundation Project, Series B, 5.50%, 5/15/47 | | 10,000,000 | | 10,175,100 |
| Louisiana State Gasoline and Fuels Tax Revenue, second lien, Series B, 5.00%, 5/01/45 | | 26,340,000 | | 28,769,338 |
| New Orleans GO, | | | | |
| Limited Tax, NATL Insured, 5.00%, 3/01/21 | | 5,000,000 | | 5,356,350 |
| Public Improvement, Series A, Radian Insured, 5.25%, 12/01/36 | | 13,480,000 | | 13,895,993 |
| St. John the Baptist Parish Revenue, Marathon Oil Corp. Project, Series A, 5.125%, | | | | |
| 6/01/37 | | 79,225,000 | | 82,195,937 |
| | | | | 319,144,143 |
| Maine 0.2% | | | | |
| Maine Health and Higher Educational Facilities Authority Revenue, MaineGeneral Medical | | | | |
| Center Issue, | | | | |
| 6.75%, 7/01/36 | | 4,250,000 | | 4,672,025 |
| 7.00%, 7/01/41 | | 10,000,000 | | 11,127,900 |
| Rumford PCR, Boise Cascade Corp. Project, Refunding, 6.625%, 7/01/20 | | 4,800,000 | | 4,719,840 |
| | | | | 20,519,765 |
| Maryland 0.6% | | | | |
| Harford County Special Obligation Tax Allocation, Beachtree Estates Project, 7.50%, | | | | |
| 7/01/40 | | 7,000,000 | | 7,420,070 |
| Maryland State Community Development Administration Development Housing and CDR, | | | | |
| Housing, Series A, 5.875%, 7/01/16 | | 880,000 | | 880,783 |
| Maryland State EDC Port Facilities Revenue, CNX MarineTerminals Inc., Refunding, 5.75%, | | | | |
| 9/01/25 | | 8,600,000 | | 9,060,530 |
Annual Report | 127
| | | | |
| Franklin Tax-Free Trust | | | | |
| |
| Statement of Investments, February 29, 2012 (continued) | | | | |
| |
| |
| Franklin High Yield Tax-Free Income Fund | | Principal Amount | | Value |
| Municipal Bonds (continued) | | | | |
| Maryland (continued) | | | | |
| Maryland State EDC Revenue, Chesapeake Bay Conference Center Project, senior lien, | | | | |
| Refunding, | | | | |
| Series A, 5.00%, 12/01/16 | $ | 3,000,000 | $ | 2,590,620 |
| Series A, 5.00%, 12/01/31 | | 10,000,000 | | 6,613,900 |
| Series B, 5.00%, 12/01/16 | | 500,000 | | 431,770 |
| Series B, 5.25%, 12/01/31 | | 2,000,000 | | 1,369,920 |
| Maryland State EDC, EDR, 5.75%, 6/01/35 | | 13,070,000 | | 13,823,616 |
| Maryland State Health and Higher Educational Facilities Authority Revenue, | | | | |
| Anne Arundel Health System, Series A, 6.75%, 7/01/39 | | 3,000,000 | | 3,601,170 |
| Edenwald, Series A, 5.40%, 1/01/37 | | 1,200,000 | | 1,161,672 |
| Washington County Hospital, 6.00%, 1/01/43 | | 6,000,000 | | 6,287,040 |
| | | | | 53,241,091 |
| Massachusetts 0.9% | | | | |
| Massachusetts Bay Transportation Authority Revenue, General Transportation System, Series A, | | | | |
| 7.00%, 3/01/21 | | 1,070,000 | | 1,405,627 |
| ETM, 7.00%, 3/01/21 | | 930,000 | | 1,105,212 |
| Massachusetts State Development Finance Agency Revenue, | | | | |
| Berkshire Retirement Project, first mortgage, 5.60%, 7/01/19 | | 870,000 | | 870,618 |
| Berkshire Retirement Project, first mortgage, 5.625%, 7/01/29 | | 1,620,000 | | 1,620,243 |
| Curry College, Series A, ACA Insured, 5.00%, 3/01/36 | | 2,000,000 | | 1,997,220 |
| Loomis Community Project, first mortgage, Refunding, Series A, 5.625%, 7/01/15 | | 1,140,000 | | 1,140,923 |
| Loomis Community Project, first mortgage, Refunding, Series A, 5.75%, 7/01/23 | | 3,500,000 | | 3,501,050 |
| Massachusetts State Development Finance Agency Solid Waste Disposal Revenue, Mandatory | | | | |
| Put 5/01/19, Refunding, 5.75%, 12/01/42 | | 3,700,000 | | 4,355,899 |
| Massachusetts State Health and Educational Facilities Authority Revenue, St. Memorial | | | | |
| Medical Center, Refunding, Series A, 6.00%, 10/01/23 | | 5,050,000 | | 4,213,064 |
| Massachusetts State Port Authority Special Facilities Revenue, ConRAC Project, Series A, | | | | |
| 5.125%, 7/01/41 | | 10,340,000 | | 11,112,191 |
| Massachusetts State Special Obligation Dedicated Tax Revenue, Refunding, NATL RE, | | | | |
| FGIC Insured, 5.50%, 1/01/34 | | 40,000,000 | | 49,008,800 |
| | | | | 80,330,847 |
| Michigan 3.9% | | | | |
| Delta County EDC Environmental Improvement Revenue, Mead Escanaba Paper, Series A, | | | | |
| Pre-Refunded, 6.25%, 4/15/27 | | 10,500,000 | | 10,571,085 |
| Detroit City School District GO, School Building and Site Improvement, Series A, | | | | |
| AGMC Insured, 6.00%, 5/01/29 | | 15,900,000 | | 18,941,829 |
| Detroit GO, Distribution State Aid, 5.25%, 11/01/35 | | 23,000,000 | | 24,325,260 |
| Detroit Sewage Disposal System Revenue, second lien, | | | | |
| Series A, NATL Insured, 5.00%, 7/01/35 | | 25,750,000 | | 26,109,727 |
| Series B, Assured Guaranty, 5.00%, 7/01/36 | | 10,000,000 | | 10,107,700 |
| Series B, NATL Insured, 5.00%, 7/01/36 | | 3,000,000 | | 3,032,310 |
| Series B, NATL RE, FGIC Insured, 5.50%, 7/01/29 | | 5,000,000 | | 5,733,900 |
| Detroit Water Supply System Revenue, | | | | |
| Refunding, Series D, NATL Insured, 5.00%, 7/01/33 | | 20,430,000 | | 21,027,986 |
| second lien, Refunding, Series C, AGMC Insured, 5.00%, 7/01/33 | | 11,000,000 | | 11,217,470 |
| Ecorse City GO, Financial Recovery, Dedicated Tax, 6.50%, 11/01/35 | | 5,215,000 | | 5,576,973 |
128 | Annual Report
| | | | | |
| | Franklin Tax-Free Trust | | | | |
| |
| | Statement of Investments, February 29, 2012 (continued) | | | | |
| |
| |
| | Franklin High Yield Tax-Free Income Fund | | Principal Amount | | Value |
| | Municipal Bonds (continued) | | | | |
| | Michigan (continued) | | | | |
| | Garden City Hospital Finance Authority Hospital Revenue, Garden City Hospital Obligated | | | | |
| | Group, Refunding, Series A, | | | | |
| | 5.75%, 9/01/17 | $ | 465,000 | $ | 465,270 |
| | 5.00%, 8/15/38 | | 5,250,000 | | 4,102,508 |
| | Michigan State Building Authority Revenue, Facilities Program, Refunding, | | | | |
| | Series I, 6.00%, 10/15/38 | | 6,000,000 | | 6,825,120 |
| | Series I, AMBAC Insured, 5.00%, 10/15/33 | | 13,495,000 | | 13,875,424 |
| | Series IA, NATL RE, FGIC Insured, 5.00%, 10/15/31 | | 9,500,000 | | 10,039,410 |
| | Series II, NATL Insured, 5.00%, 10/15/29 | | 16,585,000 | | 16,962,972 |
| | Series II-A, 5.375%, 10/15/41 | | 10,000,000 | | 11,266,400 |
| | Michigan State Finance Authority Revenue, School District of the City of Detroit, Refunding, | | | | |
| | 5.50%, 6/01/21 | | 10,000,000 | | 11,018,500 |
| | Michigan State Hospital Finance Authority Revenue, | | | | |
| | Marquette General Hospital Obligated Group, Series A, 5.00%, 5/15/34 | | 6,000,000 | | 5,669,040 |
| | Memorial Healthcare Center, Refunding, 5.75%, 11/15/15 | | 825,000 | | 827,921 |
| | Mercy Health Services, Series Q, AMBAC Insured, ETM, 5.75%, 8/15/16 | | 6,210,000 | | 6,230,555 |
| Mid | -Michigan Obligated Group, Series A, 6.125%, 6/01/34 | | 4,065,000 | | 4,570,361 |
| | Oakwood Obligated Group, Refunding, Series A, 5.00%, 7/15/37 | | 3,680,000 | | 3,733,323 |
| | Michigan State Strategic Fund Limited Obligation Revenue, Dow Chemical, | | | | |
| | Mandatory Put 6/02/14, Refunding, Series A-1, 6.75%, 12/01/28 | | 2,800,000 | | 3,101,112 |
| | Refunding, Series B-2, 6.25%, 6/01/14 | | 20,050,000 | | 22,218,407 |
| | Michigan Tobacco Settlement Finance Authority Revenue, Tobacco Settlement Asset, | | | | |
| | Senior Series A, 6.00%, | | | | |
| | 6/01/34 | | 13,675,000 | | 10,652,825 |
| | 6/01/48 | | 10,000,000 | | 7,579,300 |
| | Royal Oak Hospital Finance Authority Hospital Revenue, William Beaumont Hospital, | | | | |
| | Refunding, | | | | |
| | 8.25%, 9/01/39 | | 20,000,000 | | 25,193,800 |
| | Series W, 6.00%, 8/01/39 | | 33,120,000 | | 36,305,150 |
| | Tawas City Hospital Finance Authority Revenue, Tawas St. Joseph’s Hospital Project, Series A, | | | | |
| | ETM, 5.60%, 2/15/13 | | 230,000 | | 230,888 |
| | | | | | 337,512,526 |
| | Minnesota 0.6% | | | | |
| | Hubbard County Solid Waste Disposal Revenue, Potlatch Corp. Project, 7.25%, 8/01/14 | | 9,000,000 | | 9,418,140 |
| | Mahtomedi Senior Housing Revenue, St. Andrews Village Project, Refunding, 5.75%, | | | | |
| | 12/01/40 | | 5,000,000 | | 4,705,700 |
| | Minneapolis Health Care Facility Revenue, Augustana Chapel View Homes, Series D, 5.875%, | | | | |
| | 6/01/35 | | 5,075,000 | | 4,202,303 |
| | Minneapolis Health Care System Revenue, Fairview Health Services, Series A, | | | | |
| | 6.625%, 11/15/28 | | 11,000,000 | | 12,856,250 |
| | 6.75%, 11/15/32 | | 6,250,000 | | 7,318,250 |
| | Minnesota Agricultural and Economic Development Board Revenue, Health Care System, | | | | |
| | Refunding, Series A, 6.375%, 11/15/29 | | 175,000 | | 175,705 |
| | Minnesota State HFAR, Rental Housing, Refunding, Series D, NATL Insured, 5.95%, | | | | |
| | 2/01/18 | | 225,000 | | 225,165 |
| | St. Paul Housing and RDA Hospital Revenue, Healtheast Project, 6.00%, 11/15/35 | | 10,000,000 | | 10,164,200 |
| | | | | | 49,065,713 |
Annual Report | 129
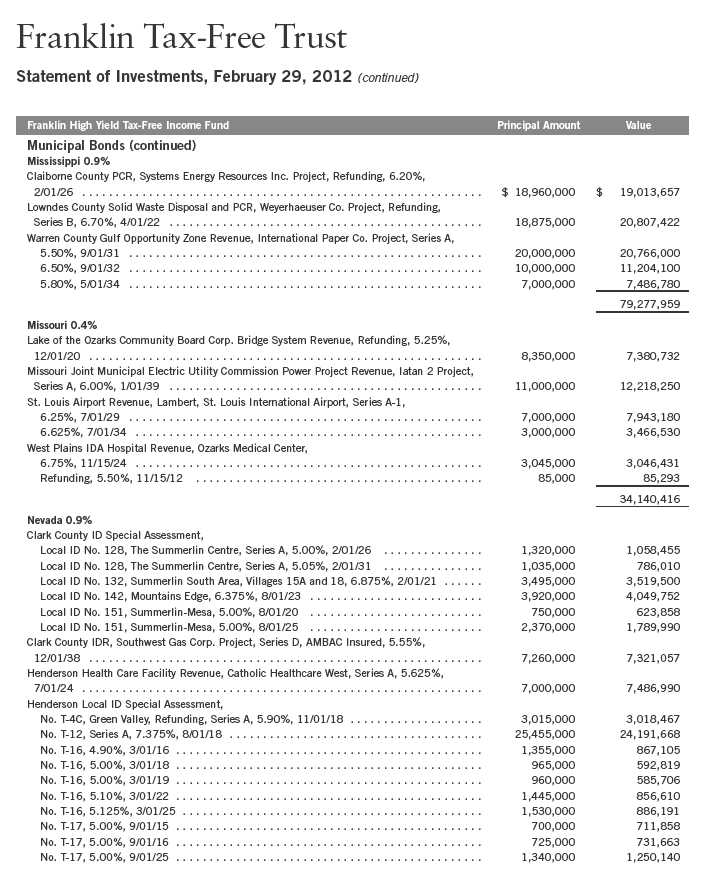
130 | Annual Report
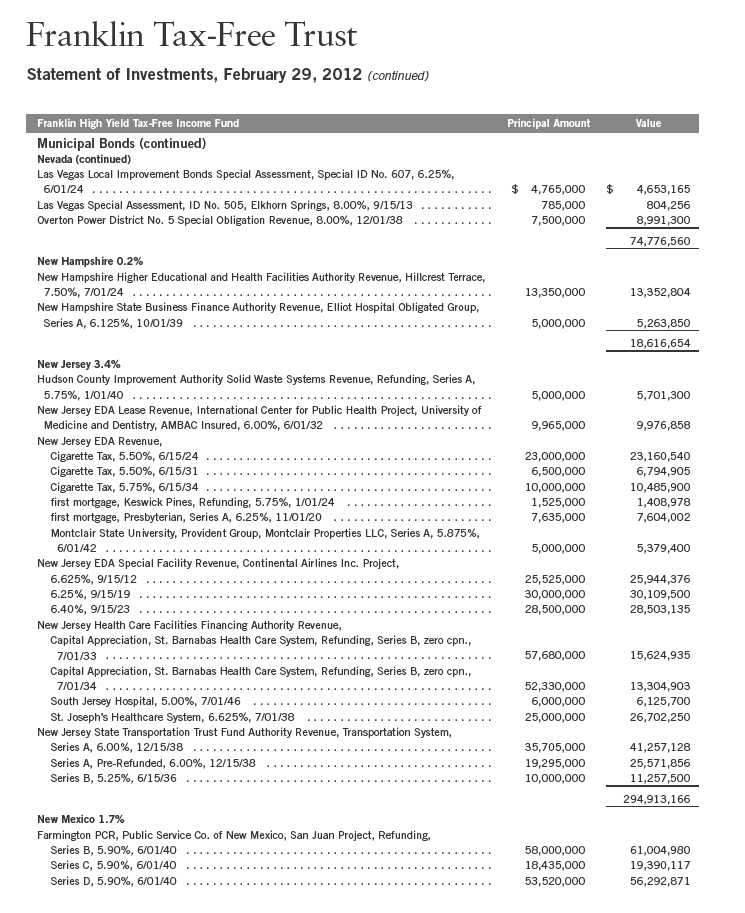
Annual Report | 131
| | | | |
| Franklin Tax-Free Trust | | | | |
| |
| Statement of Investments, February 29, 2012 (continued) | | | | |
| |
| |
| Franklin High Yield Tax-Free Income Fund | | Principal Amount | | Value |
| Municipal Bonds (continued) | | | | |
| New Mexico (continued) | | | | |
| New Mexico State Hospital Equipment Loan Council Hospital Revenue, St. Vincent Hospital, | | | | |
| Series A, Radian Insured, Pre-Refunded, | | | | |
| 5.25%, 7/01/30 | $ | 4,360,000 | $ | 5,007,199 |
| 5.00%, 7/01/35 | | 3,470,000 | | 3,956,633 |
| | | | | 145,651,800 |
| New York 5.5% | | | | |
| Long Island Power Authority Electric System Revenue, General, Refunding, Series A, 6.00%, | | | | |
| 5/01/33 | | 12,500,000 | | 14,652,250 |
| MAC for City of Troy Revenue, Capital Appreciation, Series C, NATL Insured, zero cpn., | | | | |
| 7/15/21 | | 428,010 | | 324,787 |
| 1/15/22 | | 649,658 | | 482,475 |
| MTA Revenue, Transportation, | | | | |
| Refunding, Series D, 5.25%, 11/15/40 | | 10,000,000 | | 11,056,700 |
| Series A, 5.00%, 11/15/41 | | 15,500,000 | | 16,631,500 |
| Series F, 5.00%, 11/15/30 | | 7,000,000 | | 7,541,730 |
| New York City GO, | | | | |
| Refunding, Series H, 6.25%, 8/01/15 | | 20,000 | | 20,084 |
| Refunding, Series H, 6.125%, 8/01/25 | | 10,000 | | 10,038 |
| Refunding, Series J, 6.00%, 8/01/21 | | 5,000 | | 5,019 |
| Series B, 7.00%, 2/01/18 | | 115,000 | | 115,562 |
| Series D, 7.625%, 2/01/14 | | 5,000 | | 5,026 |
| Series F, 7.50%, 2/01/21 | | 85,000 | | 85,422 |
| Series G, 7.50%, 2/01/22 | | 10,000 | | 10,050 |
| New York City IDA Civic Facility Revenue, | | | | |
| Amboy Properties Corp. Project, Refunding, 6.75%, 6/01/20 | | 5,370,000 | | 5,208,041 |
| Series C, 6.80%, 6/01/28 | | 5,000,000 | | 5,155,400 |
| Staten Island University Hospital Project, Series C, Pre-Refunded, 6.45%, 7/01/32 | | 1,395,000 | | 1,435,748 |
| New York City IDA Special Facility Revenue, | | | | |
| dAmerican Airlines Inc., JFK International Airport Project, 7.625%, 8/01/25 | | 31,860,000 | | 30,182,890 |
| dAmerican Airlines Inc., JFK International Airport Project, 7.75%, 8/01/31 | | 15,000,000 | | 14,216,250 |
| dAmerican Airlines Inc., JFK International Airport Project, Series A, 8.00%, 8/01/12 | | 30,000,000 | | 28,811,700 |
| British Airways PLC Project, 7.625%, 12/01/32 | | 15,550,000 | | 15,757,126 |
| New York City IDAR, Liberty, 7 World Trade Center Project, | | | | |
| Series A, 6.25%, 3/01/15 | | 45,000,000 | | 45,065,700 |
| Series A, 6.50%, 3/01/35 | | 50,000,000 | | 50,041,500 |
| Series B, 6.75%, 3/01/15 | | 5,000,000 | | 5,009,100 |
| New York City Municipal Water Finance Authority Water and Sewer System Revenue, Series E, | | | | |
| 5.00%, 6/15/34 | | 10,000,000 | | 10,452,800 |
| New York Liberty Development Corp. Liberty Revenue, Second Priority, Bank of America Tower | | | | |
| at One Bryant Park Project, Class 3, Refunding, 6.375%, 7/15/49 | | 18,500,000 | | 20,060,290 |
| New York Liberty Development Corp. Revenue, Goldman Sachs Headquarters, 5.25%, | | | | |
| 10/01/35 | | 65,000,000 | | 71,935,500 |
| New York State Dormitory Authority Revenues, Non-State Supported Debt, Orange Regional | | | | |
| Medical Center, | | | | |
| 6.125%, 12/01/29 | | 16,000,000 | | 16,747,520 |
| 6.25%, 12/01/37 | | 30,000,000 | | 31,062,000 |
132 | Annual Report
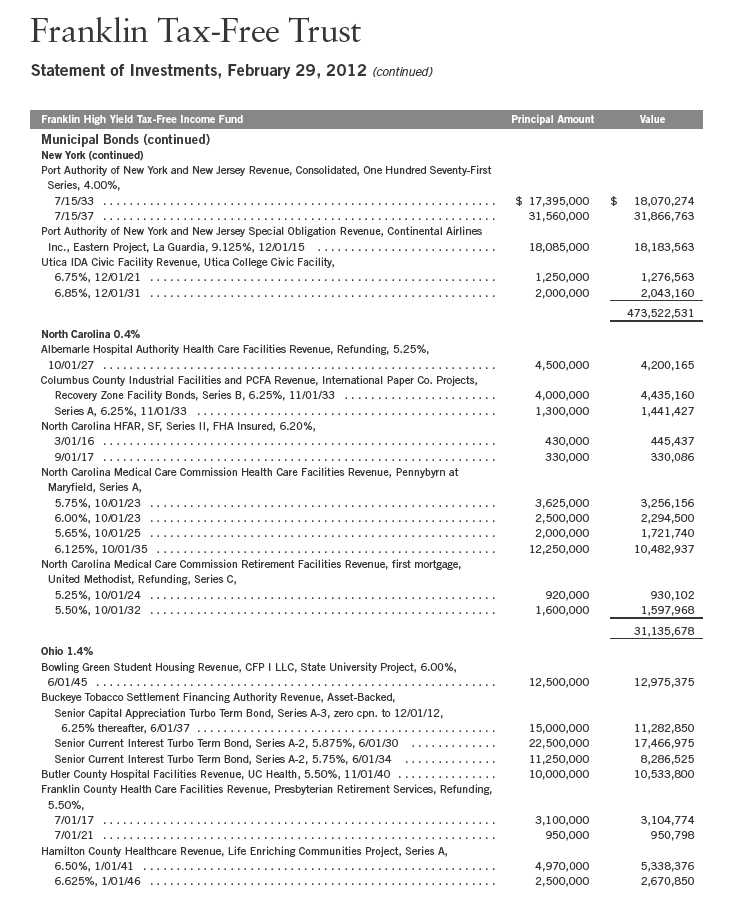
Annual Report | 133
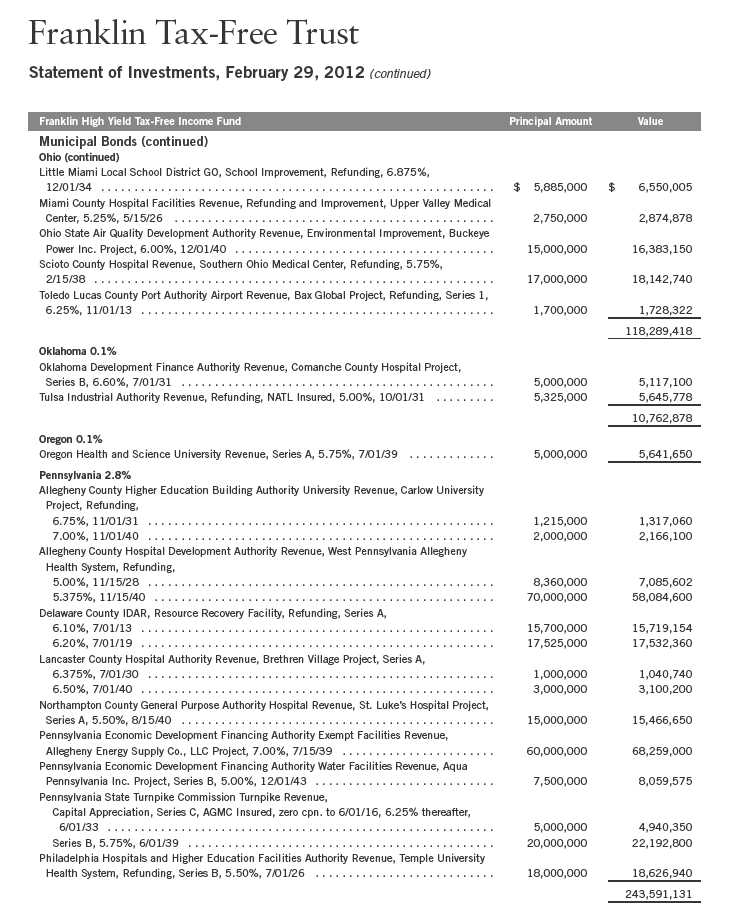
134 | Annual Report
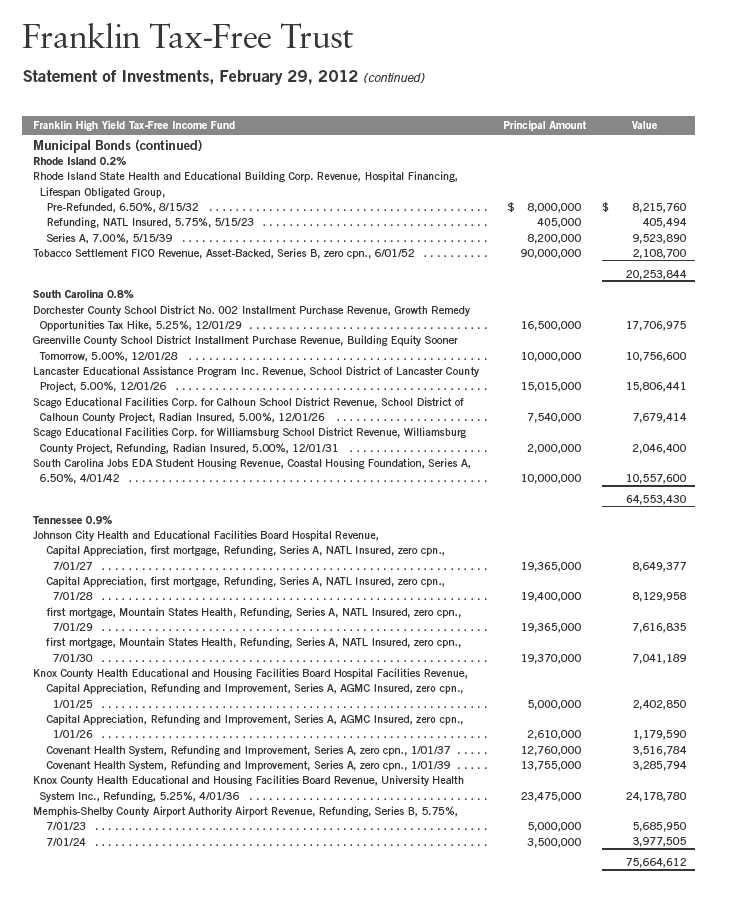
Annual Report | 135
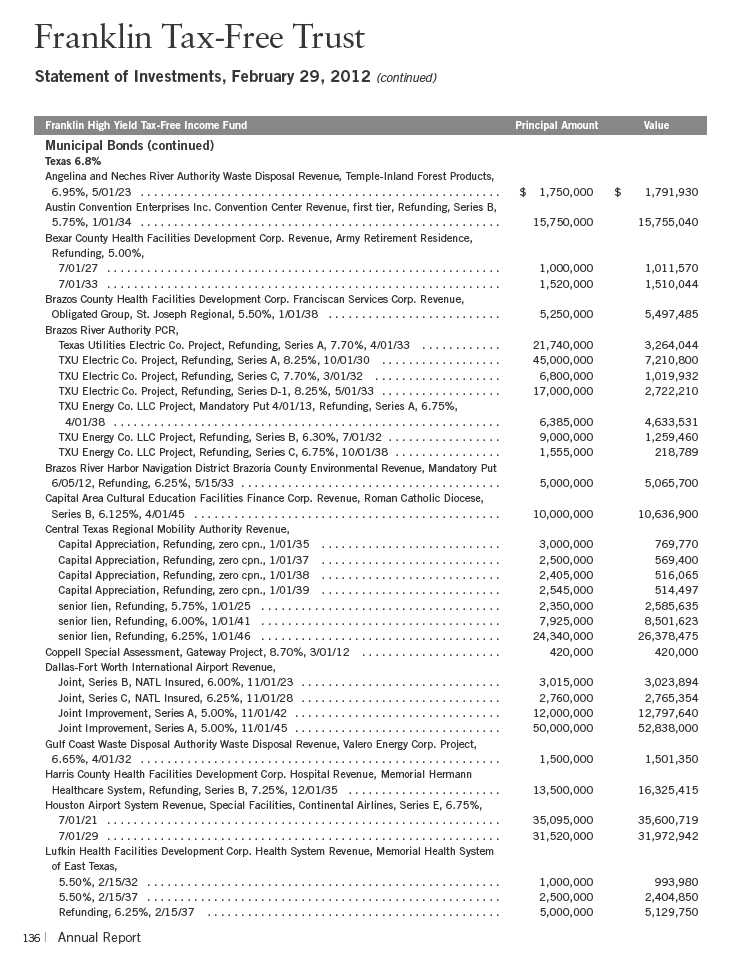
| | | | |
| Franklin Tax-Free Trust | | | | |
| |
| Statement of Investments, February 29, 2012 (continued) | | | | |
| |
| |
| Franklin High Yield Tax-Free Income Fund | | Principal Amount | | Value |
| Municipal Bonds (continued) | | | | |
| Texas (continued) | | | | |
| Matagorda County Navigation District No. 1 PCR, Central Power and Light Co. Project, | | | | |
| Refunding, Series A, 6.30%, 11/01/29 | $ | 10,000,000 | $ | 11,417,800 |
| Matagorda County Navigation District No. 1 Revenue, CenterPoint Energy Houston Electric LLC | | | | |
| Project, Refunding, 5.60%, 3/01/27 | | 12,000,000 | | 12,441,720 |
| North Texas Tollway Authority Revenue, | | | | |
| Special Projects System, Capital Appreciation, first tier, Refunding, Series I, zero cpn. to | | | | |
| 1/01/15, 6.50% thereafter, 1/01/43 | | 25,000,000 | | 24,997,250 |
| Special Projects System, Capital Appreciation, Series B, zero cpn., 9/01/37 | | 7,500,000 | | 1,754,475 |
| Special Projects System, Capital Appreciation, Series C, zero cpn. to 9/01/23, | | | | |
| 7.00% thereafter, 9/01/43 | | 10,000,000 | | 6,672,800 |
| Special Projects System, Capital Appreciation, Series C, zero cpn. to 9/01/21, | | | | |
| 6.75% thereafter, 9/01/45 | | 25,000,000 | | 18,979,000 |
| System, first tier, Refunding, Series A, 5.625%, 1/01/33 | | 1,000,000 | | 1,097,200 |
| System, first tier, Refunding, Series A, 6.25%, 1/01/39 | | 12,500,000 | | 14,140,000 |
| System, first tier, Refunding, Series A, 5.75%, 1/01/48 | | 30,000,000 | | 31,994,700 |
| System, first tier, Refunding, Series B, 5.00%, 1/01/38 | | 10,000,000 | | 10,644,800 |
| System, first tier, Refunding, Series B, 5.75%, 1/01/40 | | 11,680,000 | | 12,586,952 |
| System, first tier, Refunding, Series K-2, 6.00%, 1/01/38 | | 15,000,000 | | 16,755,750 |
| System, second tier, Refunding, Series F, 5.75%, 1/01/38 | | 20,000,000 | | 21,329,800 |
| Red River Health Facilities Development Corp. First Mortgage Revenue, Eden Home Project, | | | | |
| 7.25%, 12/15/42 | | 11,000,000 | | 10,984,820 |
| Sabine River Authority PCR, TXU Electric Co. Project, Refunding, | | | | |
| Series A, 5.80%, 7/01/22 | | 1,000,000 | | 135,150 |
| Series B, 6.15%, 8/01/22 | | 13,115,000 | | 1,836,756 |
| Series C, 5.20%, 5/01/28 | | 29,945,000 | | 3,746,419 |
| Sam Rayburn Municipal Power Agency Revenue, Refunding, 6.00%, | | | | |
| 10/01/16 | | 8,500,000 | | 8,647,305 |
| 10/01/21 | | 1,500,000 | | 1,522,560 |
| Tarrant County Cultural Education Facilities Finance Corp. Revenue, Texas Health Resources, | | | | |
| Refunding, 5.00%, 11/15/40 | | 15,225,000 | | 16,263,649 |
| Texas State Municipal Power Agency Revenue, sub. lien, Transmission, Refunding, 5.00%, | | | | |
| 9/01/40 | | 15,250,000 | | 16,509,650 |
| Texas State Turnpike Authority Central Turnpike System Revenue, | | | | |
| Capital Appreciation, AMBAC Insured, zero cpn., 8/15/32 | | 51,000,000 | | 15,133,740 |
| Series A, AMBAC Insured, 5.75%, 8/15/38 | | 31,000,000 | | 31,594,890 |
| Trinity River Authority PCR, TXU Electric Co. Project, Refunding, 6.25%, 5/01/28 | | 445,000 | | 62,349 |
| Tyler Health Facilities Development Corp. Hospital Revenue, | | | | |
| East Texas Medical Center, Refunding and Improvement, Series A, 5.375%, 11/01/37 | | 8,000,000 | | 8,067,280 |
| Mother Frances Hospital, Series B, 5.00%, 7/01/37 | | 3,400,000 | | 3,442,534 |
| Wood County Central Hospital District Hospital Revenue, East Texas Medical Center Quitman | | | | |
| Project, 6.00%, 11/01/41 | | 9,350,000 | | 10,028,810 |
| | | | | 579,994,953 |
| Virginia 0.2% | | | | |
| James City County EDA Residential Care Facility Revenue, first mortgage, Williamsburg | | | | |
| Landing, Series A, 5.35%, 9/01/26 | | 750,000 | | 741,068 |
| Peninsula Ports Authority Coal Terminal Revenue, Dominion Terminal Associates, Refunding, | | | | |
| 6.00%, 4/01/33 | | 9,500,000 | | 9,694,655 |
Annual Report | 137

138 | Annual Report
| | | | |
| Franklin Tax-Free Trust | | | | |
| |
| Statement of Investments, February 29, 2012 (continued) | | | | |
| |
| |
| Franklin High Yield Tax-Free Income Fund | | Principal Amount | | Value |
| Municipal Bonds (continued) | | | | |
| Wyoming 0.3% | | | | |
| Campbell County Solid Waste Facilities Revenue, Basin Electric Power Cooperative, Series A, | | | | |
| 5.75%, 7/15/39 | $ | 5,500,000 | $ | 6,126,725 |
| West Park Hospital District Revenue, West Park Hospital Project, Series A, 7.00%, | | | | |
| 6/01/40 | | 5,500,000 | | 6,474,820 |
| Wyoming CDA Student Housing Revenue, CHF-Wyoming LLC, University of Wyoming Project, | | | | |
| 6.25%, 7/01/31 | | 600,000 | | 640,992 |
| 6.50%, 7/01/43 | | 1,600,000 | | 1,708,112 |
| Wyoming Municipal Power Agency Power Supply Revenue, Series A, | | | | |
| 5.50%, 1/01/28 | | 1,350,000 | | 1,501,551 |
| 5.50%, 1/01/33 | | 2,360,000 | | 2,583,138 |
| 5.50%, 1/01/38 | | 2,810,000 | | 3,035,924 |
| 5.00%, 1/01/42 | | 1,000,000 | | 1,054,250 |
| 5.375%, 1/01/42 | | 2,750,000 | | 2,940,080 |
| | | | | 26,065,592 |
| U.S. Territories 5.7% | | | | |
| Guam 1.2% | | | | |
| Guam Government Department of Education COP, John F. Kennedy High School, Series A, | | | | |
| 6.625%, 12/01/30 | | 5,065,000 | | 5,462,906 |
| 6.875%, 12/01/40 | | 4,000,000 | | 4,291,040 |
| Guam Government GO, | | | | |
| Refunding, Series A, 5.125%, 11/15/27 | | 7,270,000 | | 7,112,241 |
| Refunding, Series A, 5.25%, 11/15/37 | | 37,000,000 | | 33,972,290 |
| Series A, 6.00%, 11/15/19 | | 8,000,000 | | 8,778,000 |
| Series A, 6.75%, 11/15/29 | | 10,000,000 | | 10,684,100 |
| Series A, 7.00%, 11/15/39 | | 15,000,000 | | 16,016,550 |
| Guam Government Waterworks Authority Water and Wastewater System Revenue, | | | | |
| 6.00%, 7/01/25 | | 4,000,000 | | 4,115,800 |
| 5.875%, 7/01/35 | | 8,000,000 | | 8,113,440 |
| 5.625%, 7/01/40 | | 4,000,000 | | 4,032,680 |
| | | | | 102,579,047 |
| Northern Mariana Islands 0.3% | | | | |
| Northern Mariana Islands Commonwealth GO, Refunding, Series B, 5.00%, 10/01/33 | | 24,885,000 | | 20,486,078 |
| Northern Mariana Islands Commonwealth Ports Authority Seaport Revenue, Series A, 6.60%, | | | | |
| 3/15/28 | | 7,020,000 | | 6,710,629 |
| | | | | 27,196,707 |
| Puerto Rico 3.6% | | | | |
| Children’s Trust Fund Puerto Rico Tobacco Settlement Revenue, Asset-Backed Bonds, | | | | |
| Refunding, | | | | |
| 5.50%, 5/15/39 | | 11,500,000 | | 11,307,835 |
| 5.625%, 5/15/43 | | 3,500,000 | | 3,466,645 |
| Puerto Rico Commonwealth Aqueduct and Sewer Authority Revenue, senior lien, | | | | |
| Refunding, Series A, 5.75%, 7/01/37 | | 13,000,000 | | 13,842,530 |
| Series A, 6.00%, 7/01/44 | | 5,200,000 | | 5,603,936 |
Annual Report | 139
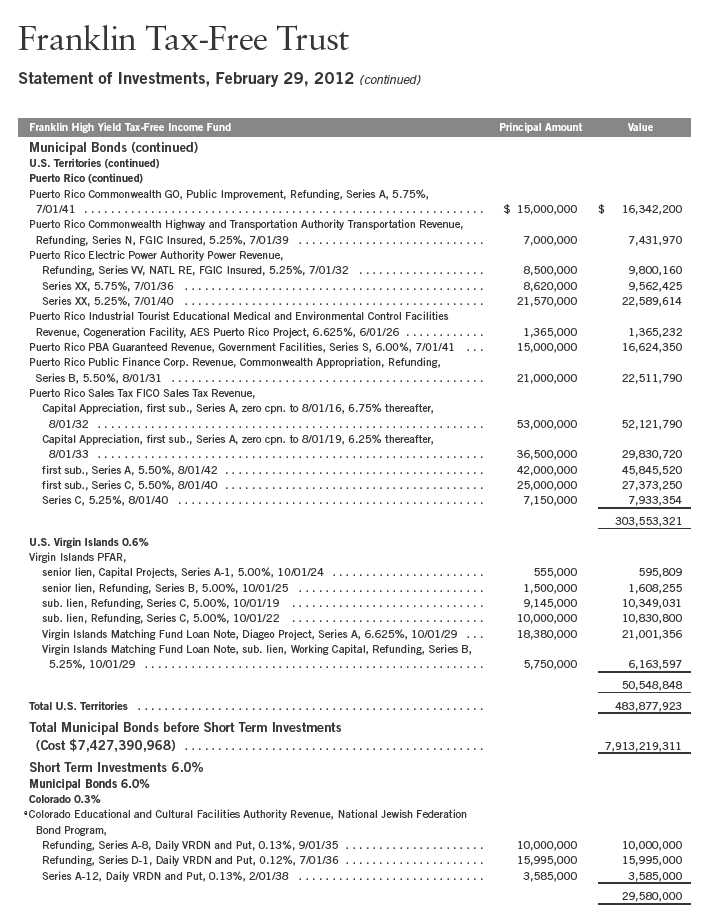
140 | Annual Report
Franklin Tax-Free Trust
Statement of Investments, February 29, 2012 (continued)
| | | | |
| Franklin High Yield Tax-Free Income Fund | | Principal Amount | | Value |
| Short Term Investments (continued) | | | | |
| Municipal Bonds (continued) | | | | |
| Connecticut 0.2% | | | | |
| eConnecticut State Health and Educational Facilities Authority Revenue, Greater Hartford | | | | |
| YMCA, Series B, Daily VRDN and Put, 0.20%, 7/01/38 | $ | 15,480,000 | $ | 15,480,000 |
| District of Columbia 0.6% | | | | |
| eMetropolitan Washington D.C. Airports Authority Airport System Revenue, Refunding, Series D, | | | | |
| Sub Series D-2, Daily VRDN and Put, 0.14%, 10/01/39 | | 51,635,000 | | 51,635,000 |
| Florida 0.2% | | | | |
| eFlorida State Municipal Power Agency Revenue, All-Requirements Power Supply Project, | | | | |
| Refunding, Series C, Daily VRDN and Put, 0.20%, 10/01/35 | | 19,500,000 | | 19,500,000 |
| Kentucky 0.2% | | | | |
| eKentucky Economic Development Finance Authority Hospital Facilities Revenue, Baptist | | | | |
| Healthcare System, Refunding, Series B-2, Daily VRDN and Put, 0.10%, 8/15/38 | | 15,030,000 | | 15,030,000 |
| Maryland 0.2% | | | | |
| eMaryland State EDC, EDR, U.S. Pharmacopeial Convention Inc. Project, Refunding, Series A, | | | | |
| Daily VRDN and Put, 0.25%, 7/01/38 | | 15,800,000 | | 15,800,000 |
| Massachusetts 0.2% | | | | |
| eMassachusetts State Health and Educational Facilities Authority Revenue, Museum of Fine | | | | |
| Arts, Series A-1, Daily VRDN and Put, 0.20%, 12/01/37 | | 15,900,000 | | 15,900,000 |
| Michigan 0.0%† | | | | |
| eUniversity of Michigan Revenue, General, Series A, Daily VRDN and Put, 0.12%, 4/01/38 | | 3,850,000 | | 3,850,000 |
| Minnesota 0.1% | | | | |
| eMinneapolis and St. Paul Housing and RDA Health Care System Revenue, Allina Health | | | | |
| System, Refunding, Series B-2, Daily VRDN and Put, 0.10%, 11/15/35 | | 4,700,000 | | 4,700,000 |
| Missouri 0.5% | | | | |
| eMissouri State Health and Educational Facilities Authority Educational Facilities Revenue, | | | | |
| St. Louis University, | | | | |
| Refunding, Series A-1, Daily VRDN and Put, 0.10%, 10/01/35 | | 13,465,000 | | 13,465,000 |
| Series B, Daily VRDN and Put, 0.16%, 10/01/24 | | 13,300,000 | | 13,300,000 |
| eMissouri State Health and Educational Facilities Authority Health Facilities Revenue, | | | | |
| SSM Health Care, Series C, Daily VRDN and Put, 0.19%, 6/01/45 | | 18,545,000 | | 18,545,000 |
| | | | | 45,310,000 |
| New Jersey 0.2% | | | | |
| eNew Jersey Health Care Facilities Financing Authority Revenue, Virtua Health, Series C, | | | | |
| Daily VRDN and Put, 0.15%, 7/01/43 | | 12,865,000 | | 12,865,000 |
| New York 1.3% | | | | |
| eNew York City GO, | | | | |
| Refunding, Series J, Sub Series J-4, Daily VRDN and Put, 0.19%, 8/01/25 | | 42,685,000 | | 42,685,000 |
| Series A, Sub Series A-7, Daily VRDN and Put, 0.09%, 8/01/20 | | 8,100,000 | | 8,100,000 |
| Series A, Sub Series A-10, Daily VRDN and Put, 0.14%, 8/01/16 | | 4,500,000 | | 4,500,000 |
| Series E, Sub Series E-2, Daily VRDN and Put, 0.19%, 8/01/34 | | 10,000,000 | | 10,000,000 |
| Series L, Sub Series L-6, Daily VRDN and Put, 0.10%, 4/01/32 | | 46,805,000 | | 46,805,000 |
| | | | | 112,090,000 |
Annual Report | 141

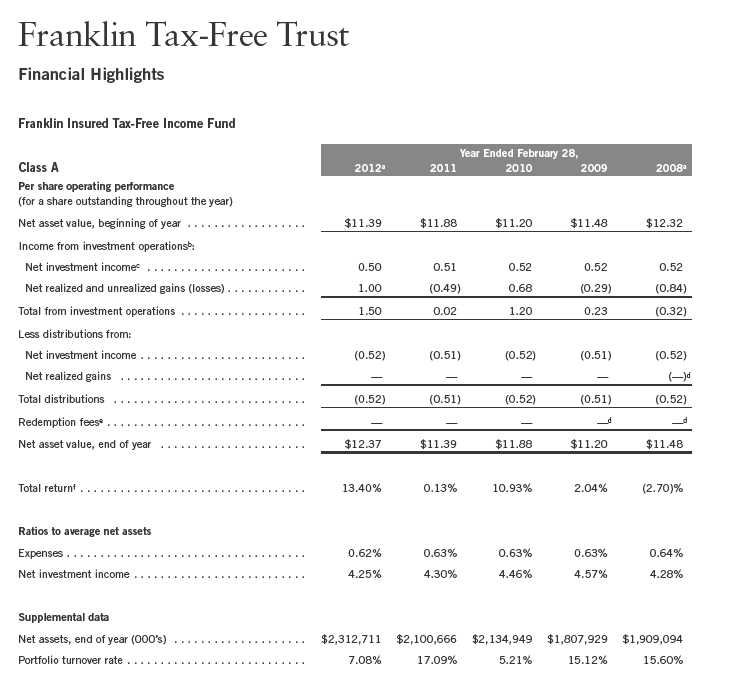
aFor the year ended February 29.
bThe amount shown for a share outstanding throughout the period may not correlate with the Statement of Operations for the period due to the timing of sales and repurchases of
the Fund shares in relation to income earned and/or fluctuating market value of the investments of the Fund.
cBased on average daily shares outstanding.
dAmount rounds to less than $0.01 per share.
eEffective September 1, 2008, the redemption fee was eliminated.
fTotal return does not reflect sales commissions or contingent deferred sales charges, if applicable.
Annual Report | The accompanying notes are an integral part of these financial statements. | 143
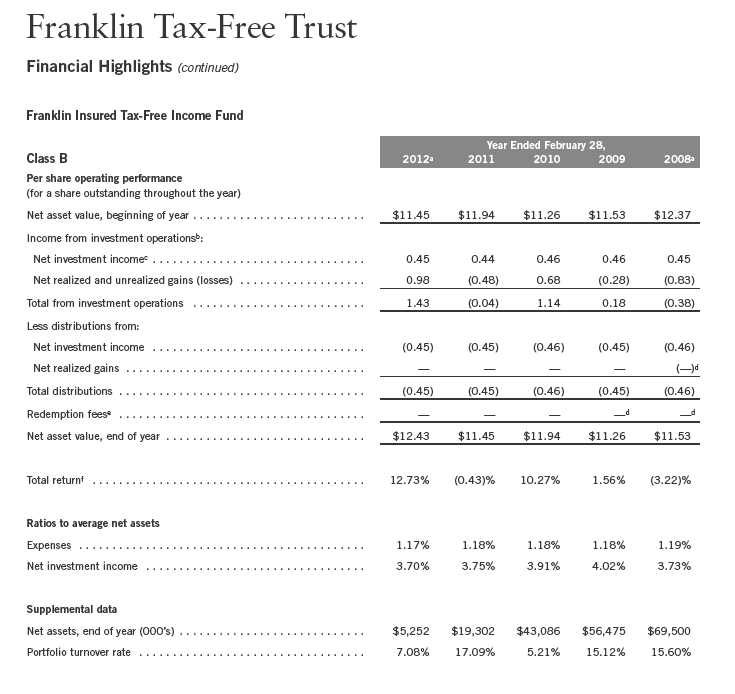
aFor the year ended February 29.
bThe amount shown for a share outstanding throughout the period may not correlate with the Statement of Operations for the period due to the timing of sales and repurchases of
the Fund shares in relation to income earned and/or fluctuating market value of the investments of the Fund.
cBased on average daily shares outstanding.
dAmount rounds to less than $0.01 per share.
eEffective September 1, 2008, the redemption fee was eliminated.
fTotal return does not reflect sales commissions or contingent deferred sales charges, if applicable.
144 | The accompanying notes are an integral part of these financial statements. | Annual Report

|
| aFor the year ended February 29. |
| bThe amount shown for a share outstanding throughout the period may not correlate with the Statement of Operations for the period due to the timing of sales and repurchases of |
| the Fund shares in relation to income earned and/or fluctuating market value of the investments of the Fund. |
| cBased on average daily shares outstanding. |
| dAmount rounds to less than $0.01 per share. |
| eEffective September 1, 2008, the redemption fee was eliminated. |
| fTotal return does not reflect sales commissions or contingent deferred sales charges, if applicable. |
Annual Report | The accompanying notes are an integral part of these financial statements. | 145
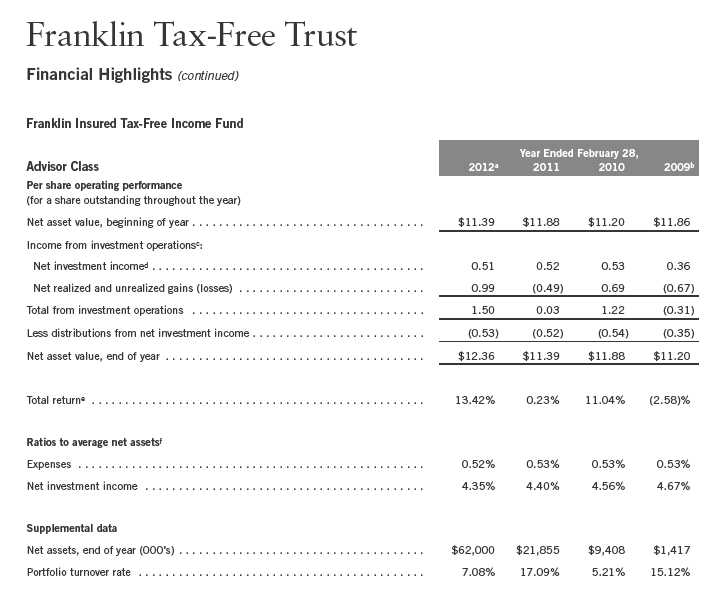
aFor the year ended February 29.
bFor the period July 1, 2008 (effective date) to February 28, 2009.
cThe amount shown for a share outstanding throughout the period may not correlate with the Statement of Operations for the period due to the timing of sales and repurchases of
the Fund shares in relation to income earned and/or fluctuating market value of the investments of the Fund.
dBased on average daily shares outstanding.
eTotal return is not annualized for periods less than one year.
fRatios are annualized for periods less than one year.
146 | The accompanying notes are an integral part of these financial statements. | Annual Report
| | | | |
| Franklin Tax-Free Trust | | | | |
| |
| Statement of Investments, February 29, 2012 | | | | |
| |
| |
| Franklin Insured Tax-Free Income Fund | | Principal Amount | | Value |
| Municipal Bonds 92.9% | | | | |
| Alabama 4.0% | | | | |
| Alabama Drinking Water Finance Authority Revenue, Revolving Fund Loan, Series A, | | | | |
| AMBAC Insured, 5.25%, 8/15/21 | $ | 2,490,000 | $ | 2,493,486 |
| Bessemer GO, wts., XLCA Insured, 5.00%, 2/01/35 | | 2,000,000 | | 1,895,460 |
| Birmingham Airport Authority Airport Revenue, AGMC Insured, 5.50%, 7/01/40 | | 20,000,000 | | 21,867,800 |
| Birmingham Waterworks Board Water Revenue, Series A, Assured Guaranty, 5.25%, | | | | |
| 1/01/39 | | 5,000,000 | | 5,369,650 |
| Chatom IDB Gulf Opportunity Zone Revenue, PowerSouth Energy Cooperative, Refunding, | | | | |
| Series A, Assured Guaranty, 5.00%, | | | | |
| 8/01/30 | | 5,250,000 | | 5,933,235 |
| 8/01/37 | | 5,000,000 | | 5,428,100 |
| Helena Utilities Board Water and Sewer Revenue, NATL Insured, Pre-Refunded, 5.25%, | | | | |
| 4/01/27 | | 3,260,000 | | 3,304,466 |
| 4/01/33 | | 4,890,000 | | 4,956,700 |
| Houston County Health Care Authority Revenue, Series A, AMBAC Insured, 5.125%, | | | | |
| 10/01/24 | | 5,855,000 | | 6,085,453 |
| 10/01/25 | | 6,065,000 | | 6,279,458 |
| Leeds Public Educational Building Authority Educational Facilities Revenue, Assured Guaranty, | | | | |
| 5.125%, 4/01/38 | | 10,865,000 | | 11,596,323 |
| Limestone County Water and Sewer Authority Water Revenue, AMBAC Insured, 5.00%, | | | | |
| 12/01/35 | | 9,100,000 | | 9,310,028 |
| Orange Beach Water Sewer and Fire Protection Authority Revenue, NATL Insured, 5.00%, | | | | |
| 5/15/35 | | 3,665,000 | | 3,788,107 |
| Pell City GO, wts., | | | | |
| Refunding, XLCA Insured, 5.00%, 2/01/24 | | 1,020,000 | | 1,083,791 |
| XLCA Insured, 5.00%, 2/01/34 | | 5,195,000 | | 5,292,458 |
| Phenix City Water and Sewer Revenue, wts., Series A, AGMC Insured, 5.00%, 8/15/40 | | 8,090,000 | | 8,858,874 |
| Tuscaloosa Public Educational Building Authority Student Housing Revenue, Ridgecrest | | | | |
| Student Housing LLC, University of Alabama Ridgecrest Residential Project, | | | | |
| Assured Guaranty, 6.75%, 7/01/38 | | 5,000,000 | | 5,815,600 |
| University of Alabama at Birmingham Hospital Revenue, Refunding, Series A, AMBAC Insured, | | | | |
| 5.00%, 9/01/41 | | 5,000,000 | | 5,143,550 |
| | | | | 114,502,539 |
| Alaska 0.4% | | | | |
| Alaska Energy Authority Power Revenue, Bradley Lake Project, Refunding, NATL Insured, | | | | |
| 6.25%, 7/01/21 | | 5,000 | | 5,019 |
| Matanuska-Susitna Borough Lease Revenue, Goose Creek Correctional Center, | | | | |
| Assured Guaranty, 6.00%, 9/01/32 | | 10,000,000 | | 11,785,800 |
| | | | | 11,790,819 |
| Arizona 2.7% | | | | |
| Arizona State COP, Department of Administration, | | | | |
| Series A, AGMC Insured, 5.25%, 10/01/26 | | 8,500,000 | | 9,675,635 |
| Series A, AGMC Insured, 5.25%, 10/01/28 | | 10,000,000 | | 11,289,700 |
| Series A, AGMC Insured, 5.00%, 10/01/29 | | 5,000,000 | | 5,481,050 |
| Series B, AGMC Insured, 5.00%, 10/01/27 | | 8,000,000 | | 8,914,720 |
| Downtown Phoenix Hotel Corp. Revenue, | | | | |
| Senior Series A, FGIC Insured, 5.00%, 7/01/36 | | 15,000,000 | | 13,391,100 |
| sub. bond, Series B, NATL RE, FGIC Insured, 5.00%, 7/01/36 | | 6,450,000 | | 6,552,619 |
Annual Report | 147
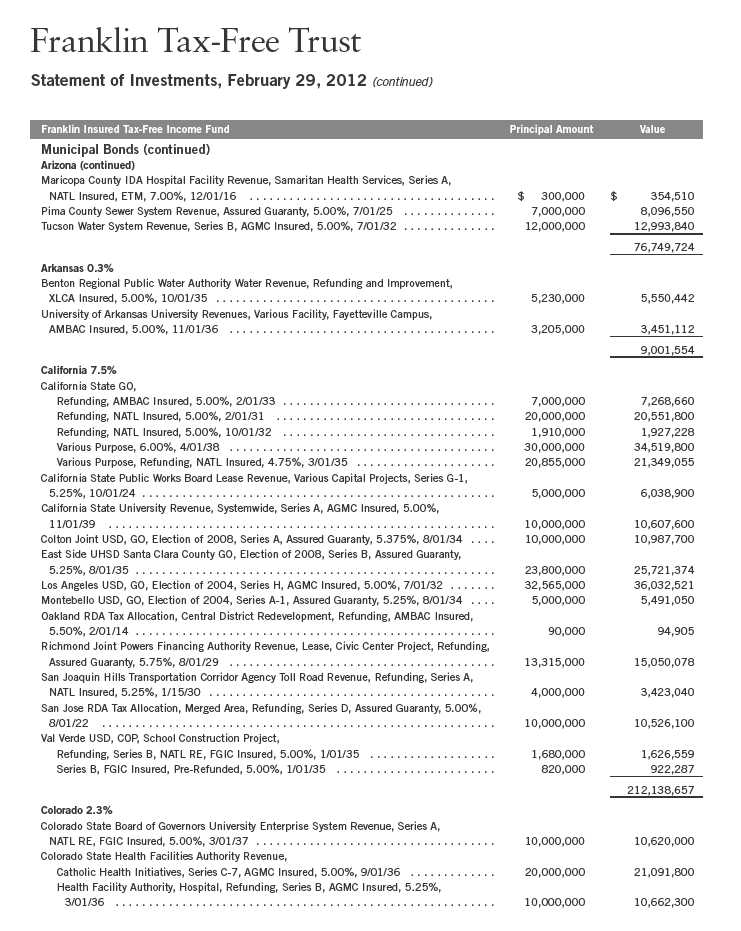
148 | Annual Report
| | | | |
| Franklin Tax-Free Trust | | | | |
| |
| Statement of Investments, February 29, 2012 (continued) | | | | |
| |
| |
| Franklin Insured Tax-Free Income Fund | | Principal Amount | | Value |
| Municipal Bonds (continued) | | | | |
| Colorado (continued) | | | | |
| Denver City and County Airport Revenue, Series C, NATL Insured, ETM, 6.125%, | | | | |
| 11/15/25 | $ | 3,590,000 | $ | 4,913,202 |
| 11/15/25 | | 4,410,000 | | 4,422,613 |
| Denver Convention Center Hotel Authority Revenue, senior bond, Refunding, XLCA Insured, | | | | |
| 5.00%, 12/01/35 | | 15,000,000 | | 14,863,050 |
| | | | | 66,572,965 |
| Connecticut 0.2% | | | | |
| Connecticut State Health and Educational Facilities Authority Revenue, Child Care Facilities | | | | |
| Program, Series G, Assured Guaranty, 6.00%, 7/01/38 | | 5,000,000 | | 5,681,900 |
| District of Columbia 0.7% | | | | |
| District of Columbia Hospital Revenue, Children’s Hospital Obligated Group, Sub Series 1, | | | | |
| AGMC Insured, 5.45%, 7/15/35 | | 19,540,000 | | 21,108,280 |
| Florida 8.8% | | | | |
| Brevard County Local Option Fuel Tax Revenue, NATL RE, FGIC Insured, 5.00%, | | | | |
| 8/01/32 | | 12,440,000 | | 12,837,334 |
| 8/01/37 | | 13,000,000 | | 13,183,690 |
| Broward County HFAR, | | | | |
| 5.65%, 11/01/22 | | 405,000 | | 405,356 |
| 5.70%, 11/01/29 | | 225,000 | | 225,133 |
| Broward County School Board COP, | | | | |
| NATL Insured, 5.00%, 7/01/28 | | 2,000,000 | | 2,042,760 |
| Series A, AGMC Insured, 5.00%, 7/01/26 | | 2,850,000 | | 2,869,323 |
| Series A, AGMC Insured, 5.00%, 7/01/30 | | 2,000,000 | | 2,086,840 |
| Cape Coral Water and Sewer Revenue, AMBAC Insured, 5.00%, 10/01/36 | | 2,000,000 | | 2,042,500 |
| Celebration CDD Special Assessment, Series B, NATL Insured, 5.50%, 5/01/19 | | 170,000 | | 170,644 |
| Coral Gables Health Facilities Authority Hospital Revenue, Baptist Health South Florida | | | | |
| Obligated Group, AGMC Insured, Pre-Refunded, 5.00%, 8/15/29 | | 1,000,000 | | 1,113,340 |
| Dade County HFA, MFMR, Siesta Pointe Apartments, Series A, 5.75%, 9/01/29 | | 1,890,000 | | 1,891,191 |
| Destin Capital Improvement Revenue, NATL Insured, 5.00%, 8/01/27 | | 1,315,000 | | 1,334,857 |
| Escambia County Utilities Authority Utility System Revenue, NATL RE, FGIC Insured, 5.00%, | | | | |
| 1/01/31 | | 1,775,000 | | 1,776,864 |
| Florida Gulf Coast University FICO Capital Improvement Revenue, Housing Project, Series A, | | | | |
| NATL Insured, 5.00%, 2/01/37 | | 10,000,000 | | 10,208,700 |
| Florida HFAR, Spinnaker Cove Apartments, Series G, AMBAC Insured, 6.50%, 7/01/36 | | 1,600,000 | | 1,600,416 |
| Florida HFC Revenue, | | | | |
| Housing, Logan’s Pointe Apartments, Series F-1, AGMC Insured, 5.90%, 12/01/19 | | 1,080,000 | | 1,081,188 |
| Marina Bay Apartments, Series S, AGMC Insured, 5.85%, 2/01/41 | | 1,070,000 | | 1,070,642 |
| Florida Intergovernmental Finance Commission Capital Revenue, Series A, AMBAC Insured, | | | | |
| 5.00%, 8/01/32 | | 3,570,000 | | 3,589,314 |
| Florida State Board of Education Capital Outlay GO, Public Education, Series B, NATL RE, | | | | |
| FGIC Insured, Pre-Refunded, 5.00%, 6/01/23 | | 5,395,000 | | 5,511,802 |
| Florida State Board of Education GO, | | | | |
| Series C, NATL Insured, Pre-Refunded, 5.00%, 6/01/27 | | 4,245,000 | | 4,315,170 |
| Series F, NATL Insured, 5.00%, 6/01/28 | | 2,000,000 | | 2,043,300 |
| Florida State Correctional Privatization Commission COP, Series B, AMBAC Insured, 5.00%, | | | | |
| 8/01/25 | | 2,000,000 | | 2,132,400 |
Annual Report | 149
| | | | |
| Franklin Tax-Free Trust | | | | |
| |
| Statement of Investments, February 29, 2012 (continued) | | | | |
| |
| |
| Franklin Insured Tax-Free Income Fund | | Principal Amount | | Value |
| Municipal Bonds (continued) | | | | |
| Florida (continued) | | | | |
| Florida State Department of Environmental Protection Preservation Revenue, Florida Forever, | | | | |
| Series A, NATL Insured, Pre-Refunded, 5.00%, 7/01/21 | $ | 3,000,000 | $ | 3,076,620 |
| Hernando County School Board COP, NATL Insured, 5.00%, 7/01/30 | | 1,150,000 | | 1,191,147 |
| Hillsborough County School Board COP, Master Lease Program, Refunding, Series A, | | | | |
| NATL Insured, 5.00%, 7/01/26 | | 1,670,000 | | 1,763,954 |
| Indian Trail Water Control District Improvement Revenue, NATL Insured, 5.75%, 8/01/16 | | 820,000 | | 823,296 |
| Jacksonville Capital Improvement Revenue, Refunding, Series C, AMBAC Insured, 5.00%, | | | | |
| 10/01/25 | | 4,000,000 | | 4,066,960 |
| Jacksonville Guaranteed Entitlement Revenue, Refunding and Improvement, NATL RE, | | | | |
| FGIC Insured, 5.00%, 10/01/32 | | 1,000,000 | | 1,008,800 |
| Jacksonville Sales Tax Revenue, | | | | |
| AMBAC Insured, 5.00%, 10/01/30 | | 5,000,000 | | 5,004,100 |
| Better Jacksonville, NATL Insured, 5.00%, 10/01/30 | | 1,500,000 | | 1,527,630 |
| Jacksonville Transportation Revenue, NATL Insured, | | | | |
| 5.00%, 10/01/26 | | 2,000,000 | | 2,004,900 |
| 5.25%, 10/01/29 | | 11,000,000 | | 11,025,190 |
| Lake County School Board COP, Series A, AMBAC Insured, 5.00%, 6/01/30 | | 2,080,000 | | 2,143,752 |
| Lee County Airport Revenue, Refunding, AGMC Insured, 5.00%, 10/01/33 | | 3,530,000 | | 3,672,541 |
| Lee Memorial Health System Hospital Revenue, Series A, AMBAC Insured, 5.00%, | | | | |
| 4/01/32 | | 1,460,000 | | 1,503,406 |
| 4/01/37 | | 11,000,000 | | 11,216,590 |
| Leon County COP, AMBAC Insured, 5.00%, 7/01/25 | | 8,935,000 | | 9,508,448 |
| Maitland CDA Revenue, AMBAC Insured, 5.00%, 7/01/34 | | 2,595,000 | | 2,711,801 |
| Marion County Utility System Revenue, NATL RE, FGIC Insured, 5.00%, 12/01/31 | | 880,000 | | 891,678 |
| Martin County Health Facilities Authority Revenue, Martin Memorial Medical Center, | | | | |
| AGMC Insured, 5.50%, 11/15/42 | | 3,800,000 | | 4,158,150 |
| Miami Beach Water and Sewer Revenue, AMBAC Insured, 5.00%, 9/01/30 | | 3,000,000 | | 3,018,510 |
| Miami-Dade County Aviation Revenue, Miami International Airport, Hub of the Americas, | | | | |
| Refunding, Series A, CIFG Insured, 5.00%, 10/01/38 | | 1,625,000 | | 1,641,331 |
| Series B, NATL RE, FGIC Insured, 5.75%, 10/01/29 | | 2,500,000 | | 2,516,100 |
| Series B, NATL RE, FGIC Insured, 5.00%, 10/01/30 | | 3,500,000 | | 3,607,975 |
| Miami-Dade County GO, Building Better Communities Program, NATL RE, FGIC Insured, | | | | |
| 5.00%, 7/01/33 | | 2,000,000 | | 2,087,480 |
| Miami-Dade County Public Facilities Revenue, Jackson Health System, Series A, | | | | |
| NATL Insured, 5.00%, 6/01/31 | | 1,650,000 | | 1,689,484 |
| Miami-Dade County School Board COP, Series A, NATL RE, FGIC Insured, 5.00%, | | | | |
| 5/01/25 | | 5,000,000 | | 5,439,300 |
| Orange County Health Facilities Authority Revenue, Hospital, Orlando Regional Healthcare | | | | |
| System, Refunding, Series B, AGMC Insured, 5.00%, 12/01/32 | | 7,000,000 | | 7,543,480 |
| Orange County School Board COP, Series A, NATL Insured, 5.00%, 8/01/27 | | 10,000,000 | | 10,090,900 |
| Orlando-Orange County Expressway Authority Revenue, | | | | |
| junior lien, NATL RE, FGIC Insured, 6.50%, 7/01/12 | | 225,000 | | 229,347 |
| Series B, AMBAC Insured, 5.00%, 7/01/35 | | 20,000,000 | | 20,375,600 |
| Osceola County School Board COP, Series A, AMBAC Insured, Pre-Refunded, 5.25%, | | | | |
| 6/01/27 | | 13,000,000 | | 13,287,560 |
| Osceola County Tourist Development Tax Revenue, NATL RE, FGIC Insured, 5.00%, | | | | |
| 10/01/32 | | 3,000,000 | | 3,026,400 |
| Panama City Beach Utility Revenue, Refunding, AMBAC Insured, 5.00%, 6/01/32 | | 2,000,000 | | 2,026,280 |
150 | Annual Report
| | | | |
| Franklin Tax-Free Trust | | | | |
| |
| Statement of Investments, February 29, 2012 (continued) | | | | |
| |
| |
| Franklin Insured Tax-Free Income Fund | | Principal Amount | | Value |
| Municipal Bonds (continued) | | | | |
| Florida (continued) | | | | |
| Pasco County Guaranteed Entitlement Revenue, Refunding, AGMC Insured, 5.00%, | | | | |
| 12/01/33 | $ | 2,185,000 | $ | 2,240,084 |
| Pembroke Pines Public Improvement Revenue, | | | | |
| Series A, AMBAC Insured, 5.00%, 10/01/29 | | 2,000,000 | | 2,074,620 |
| Series B, AMBAC Insured, 5.00%, 10/01/34 | �� | 2,000,000 | | 2,066,660 |
| Pinellas County Health Facilities Authority Revenue, Baycare Health System, AGMC Insured, | | | | |
| 5.00%, 11/15/30 | | 4,000,000 | | 4,005,200 |
| Pinellas County Sewer Revenue, AGMC Insured, 5.00%, 10/01/32 | | 3,000,000 | | 3,078,840 |
| Polk County Public Facilities Revenue, NATL Insured, 5.00%, 12/01/33 | | 2,000,000 | | 2,094,880 |
| Polk County Utility System Revenue, Series A, NATL RE, FGIC Insured, 5.00%, 10/01/30 | | 1,000,000 | | 1,046,100 |
| Port Orange GO, NATL Insured, 5.00%, 4/01/33 | | 1,755,000 | | 1,873,989 |
| Port St. Lucie Utility Revenue, NATL Insured, 5.00%, 9/01/34 | | 8,420,000 | | 8,794,185 |
| Sumter County School District Revenue, Multi-District Loan Program, AGMC Insured, ETM, | | | | |
| 7.15%, 11/01/15 | | 245,000 | | 301,732 |
| Sunrise Utilities System Revenue, | | | | |
| AMBAC Insured, Pre-Refunded, 5.20%, 10/01/22 | | 860,000 | | 1,043,937 |
| Refunding, AMBAC Insured, 5.20%, 10/01/22 | | 1,140,000 | | 1,322,468 |
| Tavares Water and Sewer Revenue, AMBAC Insured, 5.50%, 10/01/30 | | 1,000,000 | | 1,002,500 |
| University of Central Florida Athletics Assn. Inc. COP, Series A, NATL RE, FGIC Insured, | | | | |
| 5.00%, | | | | |
| 10/01/27 | | 1,000,000 | | 1,007,110 |
| 10/01/30 | | 1,485,000 | | 1,486,381 |
| | | | | 250,850,160 |
| Georgia 5.1% | | | | |
| Albany Dougherty Payroll Development Authority Revenue, Darton College Project, | | | | |
| Assured Guaranty, 5.75%, 6/15/41 | | 5,550,000 | | 6,129,531 |
| Athens Housing Authority Student Housing Lease Revenue, University of Georgia, | | | | |
| AMBAC Insured, Pre-Refunded, 5.00%, 12/01/33 | | 6,000,000 | | 6,211,621 |
| Atlanta Airport Revenue, General, Series A, AGMC Insured, 5.00%, 1/01/40 | | 9,215,000 | | 9,790,016 |
| Atlanta Water and Wastewater Revenue, | | | | |
| AGMC Insured, 5.00%, 11/01/37 | | 15,000,000 | | 15,538,200 |
| Refunding, Series B, AGMC Insured, 5.375%, 11/01/39 | | 23,000,000 | | 25,385,560 |
| Series A, NATL RE, FGIC Insured, 5.00%, 11/01/29 | | 4,750,000 | | 4,755,225 |
| Brunswick Water and Sewer Revenue, Improvement, NATL Insured, ETM, 6.10%, | | | | |
| 10/01/14 | | 1,535,000 | | 1,663,694 |
| Bulloch County Development Authority Student Housing Revenue, Georgia Southern University | | | | |
| Housing Foundation Four, Assured Guaranty, 5.25%, 7/01/33 | | 14,825,000 | | 16,275,478 |
| Cherokee County Water and Sewer Authority Revenue, NATL Insured, 6.90%, 8/01/18 | | 15,000 | | 15,071 |
| Columbus Building Authority Lease Revenue, Series A, NATL RE, FGIC Insured, 5.00%, | | | | |
| 1/01/31 | | 3,500,000 | | 3,608,290 |
| Dahlonega Water and Wastewater Revenue, Series A, Assured Guaranty, 5.50%, 9/01/37 | | 6,450,000 | | 7,009,602 |
| East Point Building Authority Revenue, Water and Sewer Project, Series A, XLCA Insured, | | | | |
| 5.00%, 2/01/30 | | 11,360,000 | | 10,879,813 |
| Fulton County Development Authority Revenue, Georgia Institute of Technology Athletic Assn., | | | | |
| Refunding, AMBAC Insured, 5.125%, 10/01/32 | | 9,000,000 | | 9,033,210 |
| Georgia State Higher Education Facilities Authority Revenue, USG Real Estate Foundation III | | | | |
| LLC Project, Series A, Assured Guaranty, 5.00%, 6/15/38 | | 9,250,000 | | 9,683,270 |
Annual Report | 151
| | | | |
| Franklin Tax-Free Trust | | | | |
| |
| Statement of Investments, February 29, 2012 (continued) | | | | |
| |
| |
| Franklin Insured Tax-Free Income Fund | | Principal Amount | | Value |
| Municipal Bonds (continued) | | | | |
| Georgia (continued) | | | | |
| Medical Center Hospital Authority Revenue, Anticipation Certificates, Columbus Regional | | | | |
| Healthcare System, Refunding, AGMC Insured, 5.00%, 8/01/41 | $ | 7,500,000 | $ | 7,644,000 |
| Savannah EDA Revenue, SSU Community Development LLC Project, Series I, | | | | |
| Assured Guaranty, 5.75%, 6/15/41 | | 10,000,000 | | 11,014,900 |
| | | | | 144,637,481 |
| Hawaii 0.1% | | | | |
| Hawaii County GO, Refunding and Improvement, Series A, NATL RE, FGIC Insured, 5.60%, | | | | |
| 5/01/12 | | 1,000,000 | | 1,008,460 |
| 5/01/13 | | 1,000,000 | | 1,061,930 |
| | | | | 2,070,390 |
| Illinois 6.0% | | | | |
| Chicago Board of Education GO, Refunding, Series C, Assured Guaranty, 5.25%, | | | | |
| 12/01/26 | | 12,575,000 | | 13,980,885 |
| Chicago GO, Refunding, Series A, AGMC Insured, 5.00%, | | | | |
| 1/01/28 | | 29,885,000 | | 33,100,327 |
| 1/01/29 | | 13,345,000 | | 14,694,180 |
| 1/01/30 | | 6,200,000 | | 6,795,696 |
| Chicago O’Hare International Airport Revenue, | | | | |
| AGMC Insured, 5.25%, 1/01/35 | | 26,635,000 | | 29,018,832 |
| Refunding, Series A, AGMC Insured, 5.00%, 1/01/28 | | 24,915,000 | | 26,921,405 |
| Illinois Finance Authority Revenue, | | | | |
| Edward Hospital, Series A, AMBAC Insured, 5.50%, 2/01/40 | | 4,000,000 | | 4,201,000 |
| Southern Illinois HealthCare, AGMC Insured, 5.375%, 3/01/35 | | 8,500,000 | | 9,142,005 |
| Illinois Health Facilities Authority Revenue, Northwestern Medical Facility Foundation, | | | | |
| Refunding, NATL Insured, 5.125%, 11/15/28 | | 5,000,000 | | 5,002,450 |
| Illinois State GO, Refunding, AGMC Insured, 5.00%, 1/01/23 | | 10,000,000 | | 11,090,400 |
| Regional Transportation Authority Revenue, Series A, AMBAC Insured, 7.20%, 11/01/20 | | 285,000 | | 344,907 |
| Saline Valley Conservancy District Waterworks Revenue, Saline Valley Conservancy District, | | | | |
| Refunding, Series A, AMBAC Insured, 5.00%, 1/01/41 | | 7,000,000 | | 7,367,430 |
| St. Clair County School District No. 189 East St. Louis GO, Alternate Revenue Source, | | | | |
| Refunding, AMBAC Insured, 5.125%, 1/01/28 | | 7,135,000 | | 7,570,663 |
| | | | | 169,230,180 |
| Indiana 0.5% | | | | |
| Indiana Health and Educational Facility Finance Authority Revenue, St. Francis, Series E, | | | | |
| AGMC Insured, 5.25%, 5/15/41 | | 3,750,000 | | 3,951,037 |
| Indianapolis Local Public Improvement Bond Bank Revenue, Waterworks Project, Series A, | | | | |
| Assured Guaranty, 5.50%, 1/01/38 | | 8,650,000 | | 9,558,769 |
| | | | | 13,509,806 |
| Kansas 0.6% | | | | |
| Overland Park Development Corp. Revenue, second tier, Overland Park Convention Center | | | | |
| Hotel, Refunding, Series B, AMBAC Insured, 5.125%, 1/01/32 | | 20,000,000 | | 17,857,400 |
152 | Annual Report
| | | | |
| Franklin Tax-Free Trust | | | | |
| |
| Statement of Investments, February 29, 2012 (continued) | | | | |
| |
| |
| Franklin Insured Tax-Free Income Fund | | Principal Amount | | Value |
| Municipal Bonds (continued) | | | | |
| Kentucky 1.3% | | | | |
| Kentucky Economic Development Finance Authority Health System Revenue, | | | | |
| Norton Healthcare Inc., | | | | |
| Refunding, Series C, NATL Insured, 6.05%, 10/01/20 | $ | 8,505,000 | $ | 9,001,692 |
| Series C, NATL Insured, Pre-Refunded, 6.05%, 10/01/20 | | 4,255,000 | | 4,673,692 |
| Series C, NATL Insured, Pre-Refunded, 6.15%, 10/01/26 | | 12,195,000 | | 13,414,012 |
| Kentucky State Municipal Power Agency Power System Revenue, Prairie State Project, | | | | |
| Series A, NATL Insured, 5.00%, 9/01/37 | | 10,000,000 | | 10,368,700 |
| | | | | 37,458,096 |
| Louisiana 2.9% | | | | |
| Lafayette Public Trust Financing Authority Revenue, Ragin’ Cajun Facilities, Housing and | | | | |
| Package Project, Assured Guaranty, | | | | |
| 5.00%, 10/01/25 | | 5,500,000 | | 6,119,190 |
| 5.50%, 10/01/41 | | 15,000,000 | | 16,323,600 |
| Louisiana Local Government Environmental Facilities and CDA Revenue, | | | | |
| LCTCS Facilities Corp. Project, Series B, Assured Guaranty, 5.00%, 10/01/26 | | 2,750,000 | | 3,039,575 |
| Parking Facilities Corp. Garage Project, Series A, AMBAC Insured, 5.375%, 10/01/31 | | 5,480,000 | | 5,480,164 |
| Southeastern Louisiana University, Series A, AGMC Insured, 5.00%, 10/01/40 | | 8,545,000 | | 9,440,345 |
| Louisiana State Citizens Property Insurance Corp. Assessment Revenue, | | | | |
| aRefunding, AGMC Insured, 5.00%, 6/01/24 | | 5,250,000 | | 5,975,813 |
| Series C-2, Assured Guaranty, 6.75%, 6/01/26 | | 21,000,000 | | 25,053,630 |
| Louisiana State Gasoline and Fuels Tax Revenue, Series A, AMBAC Insured, 5.00%, | | | | |
| 6/01/27 | | 10,000,000 | | 10,044,600 |
| | | | | 81,476,917 |
| Maine 1.0% | | | | |
| Maine Educational Loan Authority Student Loan Revenue, Series A-3, Assured Guaranty, | | | | |
| 5.875%, 12/01/39 | | 16,910,000 | | 18,212,577 |
| Maine State Health and Higher Educational Facilities Authority Revenue, Series C, | | | | |
| AGMC Insured, 6.20%, 7/01/25 | | 100,000 | | 100,278 |
| Portland Airport Revenue, General, AGMC Insured, | | | | |
| 5.25%, 1/01/35 | | 3,000,000 | | 3,237,030 |
| 5.00%, 1/01/40 | | 6,000,000 | | 6,353,760 |
| | | | | 27,903,645 |
| Maryland 1.1% | | | | |
| Baltimore Convention Center Hotel Revenue, Senior Series A, XLCA Insured, 5.00%, | | | | |
| 9/01/32 | | 10,000,000 | | 9,205,500 |
| Baltimore Project Revenue, Water Projects, Refunding, Series A, NATL RE, FGIC Insured, | | | | |
| 5.125%, 7/01/42 | | 11,000,000 | | 11,103,290 |
| Maryland State Health and Higher Educational Facilities Authority Revenue, | | | | |
| LifeBridge Health, Refunding, Assured Guaranty, 5.00%, 7/01/34 | | 9,000,000 | | 9,427,140 |
| University of Maryland Medical System, Series B, NATL RE, FGIC Insured, 7.00%, | | | | |
| 7/01/22 | | 200,000 | | 243,108 |
| | | | | 29,979,038 |
Annual Report | 153
| | | | |
| Franklin Tax-Free Trust | | | | |
| |
| Statement of Investments, February 29, 2012 (continued) | | | | |
| |
| |
| Franklin Insured Tax-Free Income Fund | | Principal Amount | | Value |
| Municipal Bonds (continued) | | | | |
| Massachusetts 2.8% | | | | |
| Massachusetts State Development Finance Agency Revenue, Worcester Polytechnic Institute, | | | | |
| NATL Insured, 5.00%, 9/01/47 | $ | 25,050,000 | $ | 26,023,193 |
| Massachusetts State GO, Consolidated Loan, Series D, NATL Insured, | | | | |
| ETM, 5.00%, 8/01/27 | | 3,535,000 | | 3,604,180 |
| Pre-Refunded, 5.00%, 8/01/27 | | 855,000 | | 871,732 |
| Massachusetts State Health and Educational Facilities Authority Revenue, | | | | |
| CareGroup Issue, Refunding, Series A, NATL Insured, 5.00%, 7/01/25 | | 2,810,000 | | 2,813,681 |
| CareGroup Issue, Series A, NATL Insured, Pre-Refunded, 5.00%, 7/01/25 | | 750,000 | | 910,598 |
| Emmanuel College, NATL Insured, 5.00%, 7/01/37 | | 21,685,000 | | 21,784,100 |
| Harvard Pilgrim Health, Series A, AGMC Insured, 5.00%, 7/01/18 | | 3,000,000 | | 3,004,500 |
| Simmons College, Series C, NATL Insured, 5.125%, 10/01/28 | | 4,260,000 | | 4,261,661 |
| Massachusetts State Water Resources Authority Revenue, Series J, AGMC Insured, | | | | |
| Pre-Refunded, 5.00%, 8/01/32 | | 16,250,000 | | 16,568,013 |
| | | | | 79,841,658 |
| Michigan 7.3% | | | | |
| Birmingham City School District GO, School Building and Site, AGMC Insured, 5.00%, | | | | |
| 11/01/33 | | 8,135,000 | | 8,500,424 |
| Central Michigan University Revenue, Series A, AMBAC Insured, 5.05%, 10/01/32 | | 8,650,000 | | 8,735,548 |
| Detroit City School District GO, School Building and Site Improvement, Series A, | | | | |
| AGMC Insured, Pre-Refunded, 5.125%, 5/01/31 | | 6,500,000 | | 6,550,245 |
| Detroit GO, Series A-1, NATL Insured, 5.00%, 4/01/21 | | 12,390,000 | | 11,044,446 |
| Detroit Sewage Disposal System Revenue, | | | | |
| second lien, Series B, NATL Insured, 5.00%, 7/01/36 | | 15,000,000 | | 15,161,550 |
| senior lien, Refunding, Series A, AGMC Insured, 5.00%, 7/01/32 | | 2,905,000 | | 2,940,005 |
| senior lien, Series B, AGMC Insured, 7.50%, 7/01/33 | | 6,000,000 | | 7,480,860 |
| Detroit Water Supply System Revenue, | | | | |
| second lien, Series B, AGMC Insured, 7.00%, 7/01/36 | | 5,000,000 | | 5,992,750 |
| senior lien, Series A, AGMC Insured, 5.00%, 7/01/34 | | 7,040,000 | | 7,193,050 |
| senior lien, Series A, NATL Insured, 5.00%, 7/01/34 | | 10,150,000 | | 10,228,053 |
| Jackson County Hospital Finance Authority Revenue, W.A. Foote Memorial Hospital, Refunding, | | | | |
| Series C, Assured Guaranty, 5.00%, 6/01/26 | | 15,000,000 | | 16,597,500 |
| Michigan State Building Authority Revenue, Refunding, Series IA, | | | | |
| AGMC Insured, 5.00%, 10/15/36 | | 28,895,000 | | 30,099,633 |
| NATL RE, FGIC Insured, 5.00%, 10/15/36 | | 10,000,000 | | 10,416,900 |
| Michigan State Hospital Finance Authority Revenue, | | | | |
| Hospital, Botsford Obligated Group, Refunding, Series A, NATL Insured, 5.25%, | | | | |
| 2/15/22 | | 2,000,000 | | 2,000,960 |
| Oakwood Obligated Group, Refunding, Series A, AGMC Insured, 5.00%, 8/15/31 | | 10,000,000 | | 10,008,600 |
| Sparrow Obligated Group, Refunding, NATL Insured, 5.00%, 11/15/36 | | 13,000,000 | | 13,182,780 |
| St. John’s Hospital, Refunding, Series A, AMBAC Insured, ETM, 6.00%, 5/15/13 | | 1,105,000 | | 1,126,746 |
| Trinity Health Credit Group, Series A, 6.50%, 12/01/33 | | 25,000,000 | | 29,449,500 |
| Michigan State Strategic Fund Limited Obligation Revenue, Detroit Edison Co. Pollution | | | | |
| Control Bonds Project, Refunding, Collateralized Series BB, AMBAC Insured, 7.00%, | | | | |
| 5/01/21 | | 250,000 | | 326,953 |
| Michigan State Strategic Fund Resources Recovery Limited Obligation Revenue, Detroit | | | | |
| Education Exempt Facilities, Refunding, Series D, XLCA Insured, 5.25%, 12/15/32 | | 10,000,000 | | 10,069,700 |
| | | | | 207,106,203 |
154 | Annual Report
| | | | |
| Franklin Tax-Free Trust | | | | |
| |
| Statement of Investments, February 29, 2012 (continued) | | | | |
| |
| |
| Franklin Insured Tax-Free Income Fund | | Principal Amount | | Value |
| Municipal Bonds (continued) | | | | |
| Minnesota 0.6% | | | | |
| Minneapolis and St. Paul Metropolitan Airports Commission Airport Revenue, sub. bond, | | | | |
| Refunding, Series A, AMBAC Insured, 5.00%, 1/01/35 | $ | 15,000,000 | $ | 15,391,650 |
| Minnesota Agricultural and Economic Development Board Revenue, Health Care System, | | | | |
| Refunding, Series A, NATL Insured, 5.75%, 11/15/26 | | 180,000 | | 180,257 |
| Minnesota State HFAR, Rental Housing, Refunding, Series D, NATL Insured, 6.00%, | | | | |
| 2/01/22 | | 130,000 | | 130,130 |
| | | | | 15,702,037 |
| Mississippi 0.4% | | | | |
| Harrison County Wastewater Management District Revenue, Wastewater Treatment Facilities, | | | | |
| Series A, FGIC Insured, ETM, 8.50%, 2/01/13 | | 80,000 | | 85,920 |
| Mississippi Development Bank Special Obligation Revenue, Municipal Energy Agency, | | | | |
| Series A, XLCA Insured, 5.00%, 3/01/36 | | 10,915,000 | | 11,024,914 |
| | | | | 11,110,834 |
| Missouri 0.8% | | | | |
| Bi-State Development Agency Missouri-Illinois Metropolitan District Mass Transit Sales Tax | | | | |
| Revenue, Metrolink Cross County Extension, Assured Guaranty, 5.00%, 10/01/39 | | 6,000,000 | | 6,556,440 |
| Missouri State Health and Educational Facilities Authority Health Facilities Revenue, | | | | |
| St. Luke’s Health System, Series B, AGMC Insured, 5.50%, 11/15/35 | | 15,000,000 | | 16,290,750 |
| | | | | 22,847,190 |
| Nebraska 0.1% | | | | |
| Lancaster County Hospital Authority Revenue, Bryan Memorial Hospital Project No. 1, | | | | |
| NATL Insured, ETM, 6.70%, 6/01/22 | | 2,500,000 | | 3,195,800 |
| Nevada 1.1% | | | | |
| Clark County GO, Series A, AMBAC Insured, 6.50%, 6/01/17 | | 250,000 | | 308,765 |
| Clark County Passenger Facility Charge Revenue, Las Vegas, McCarran International Airport, | | | | |
| Series A, | | | | |
| AGMC Insured, 5.25%, 7/01/42 | | 5,000,000 | | 5,271,600 |
| Assured Guaranty, 5.25%, 7/01/39 | | 20,000,000 | | 21,318,000 |
| Reno Hospital Revenue, Washoe Medical Center, Refunding, Series C, AGMC Insured, | | | | |
| 5.375%, 6/01/39 | | 5,000,000 | | 5,280,400 |
| | | | | 32,178,765 |
| New Hampshire 0.2% | | | | |
| Manchester General Airport Revenue, General, Refunding, Series A, AGMC Insured, 5.125%, | | | | |
| 1/01/30 | | 6,000,000 | | 6,537,480 |
| New Jersey 1.8% | | | | |
| Essex County Improvement Authority Revenue, Garden State Cancer Center Project, | | | | |
| AMBAC Insured, 6.00%, 12/01/20 | | 1,940,000 | | 1,947,391 |
| New Brunswick Parking Authority Revenue, Guaranteed Parking, Series A, NATL Insured, | | | | |
| 5.00%, 9/01/34 | | 1,500,000 | | 1,510,215 |
| New Jersey EDA Revenue, | | | | |
| Motor Vehicle Surcharge Revenue, Series A, NATL Insured, 5.00%, 7/01/29 | | 3,450,000 | | 3,722,860 |
| Motor Vehicle Surcharge Revenue, Series A, NATL Insured, 5.00%, 7/01/34 | | 21,250,000 | | 22,748,975 |
| Municipal Rehabilitation, Series A, AMBAC Insured, 5.00%, 4/01/28 | | 4,000,000 | | 4,103,800 |
Annual Report | 155
| | | | |
| Franklin Tax-Free Trust | | | | |
| |
| Statement of Investments, February 29, 2012 (continued) | | | | |
| |
| |
| Franklin Insured Tax-Free Income Fund | | Principal Amount | | Value |
| Municipal Bonds (continued) | | | | |
| New Jersey (continued) | | | | |
| New Jersey State Transportation Trust Fund Authority Revenue, Transportation System, | | | | |
| Series A, | | | | |
| 6.00%, 12/15/38 | $ | 9,620,000 | $ | 11,115,910 |
| Pre-Refunded, 6.00%, 12/15/38 | | 5,380,000 | | 7,130,168 |
| New Jersey State Turnpike Authority Turnpike Revenue, | | | | |
| Refunding, Series C, AMBAC Insured, 6.50%, 1/01/16 | | 50,000 | | 56,155 |
| Series C, AMBAC Insured, ETM, 6.50%, 1/01/16 | | 20,000 | | 23,023 |
| Series C, AMBAC Insured, Pre-Refunded, 6.50%, 1/01/16 | | 175,000 | | 201,455 |
| | | | | 52,559,952 |
| New York 6.3% | | | | |
| Hudson Yards Infrastructure Corp. Revenue, Series A, AGMC Insured, 5.00%, 2/15/47 | | 16,475,000 | | 17,361,026 |
| MTA Revenue, | | | | |
| Series B, NATL Insured, 5.00%, 11/15/28 | | 20,000,000 | | 20,820,400 |
| Transportation, Series A, AGMC Insured, 5.00%, 11/15/33 | | 20,000,000 | | 21,503,600 |
| MTA Service Contract Revenue, Series B, NATL Insured, 5.00%, 1/01/31 | | 7,000,000 | | 7,091,560 |
| New York City Municipal Water Finance Authority Water and Sewer System Revenue, | | | | |
| Refunding, Series AA, 5.00%, 6/15/44 | | 21,550,000 | | 23,590,138 |
| Second Generation Resolution, Refunding, Series GG, 5.00%, 6/15/43 | | 25,000,000 | | 27,572,500 |
| New York City Transitional Finance Authority Building Aid Revenue, Sub Series S1-A, 5.25%, | | | | |
| 7/15/37 | | 25,000,000 | | 28,210,000 |
| New York City Transitional Finance Authority Revenue, | | | | |
| Future Tax Secured, Series A, NATL RE, FGIC Insured, 5.125%, 8/01/33 | | 14,590,000 | | 15,175,059 |
| Refunding, Series B, NATL Insured, 5.00%, 8/01/32 | | 2,230,000 | | 2,318,442 |
| New York State Dormitory Authority Revenues, | | | | |
| State Supported Debt, Mental Health Services Facilities Improvement, Series B, | | | | |
| NATL Insured, 5.25%, 8/15/31 | | 5,530,000 | | 5,540,507 |
| Vassar Brothers Hospital, AGMC Insured, 5.375%, 7/01/25 | | 4,000,000 | | 4,014,720 |
| Triborough Bridge and Tunnel Authority Revenues, Refunding, NATL Insured, 5.00%, | | | | |
| 11/15/32 | | 5,000,000 | | 5,138,000 |
| | | | | 178,335,952 |
| North Carolina 0.3% | | | | |
| Raleigh Combined Enterprise System Revenue, 5.00%, 3/01/40 | | 7,915,000 | | 9,020,251 |
| North Dakota 1.2% | | | | |
| Cass County Health Facilities Revenue, Health Care, Essentia Obligation, Series D, | | | | |
| Assured Guaranty, 5.00%, 2/15/40 | | 31,970,000 | | 33,200,206 |
| Ohio 2.7% | | | | |
| Akron Income Tax Revenue, Community Learning Centers, Series A, NATL RE, FGIC Insured, | | | | |
| 5.00%, 12/01/33 | | 5,000,000 | | 5,171,400 |
| Cleveland Airport System Revenue, | | | | |
| Refunding, Series A, AGMC Insured, 5.00%, 1/01/27 | | 4,190,000 | | 4,591,528 |
| Refunding, Series A, AGMC Insured, 5.00%, 1/01/28 | | 9,500,000 | | 10,377,895 |
| Series A, AGMC Insured, 5.00%, 1/01/31 | | 13,780,000 | | 13,818,997 |
| Jefferson Area Local School District GO, School Facilities Construction and Improvement, | | | | |
| NATL RE, FGIC Insured, 5.00%, 12/01/31 | | 4,085,000 | | 4,279,814 |
| Ohio State Higher Educational Facility Commission Revenue, Summa Health System, | | | | |
| 2010 Project, Refunding, Assured Guaranty, 5.25%, 11/15/40 | | 15,000,000 | | 15,974,400 |
156 | Annual Report
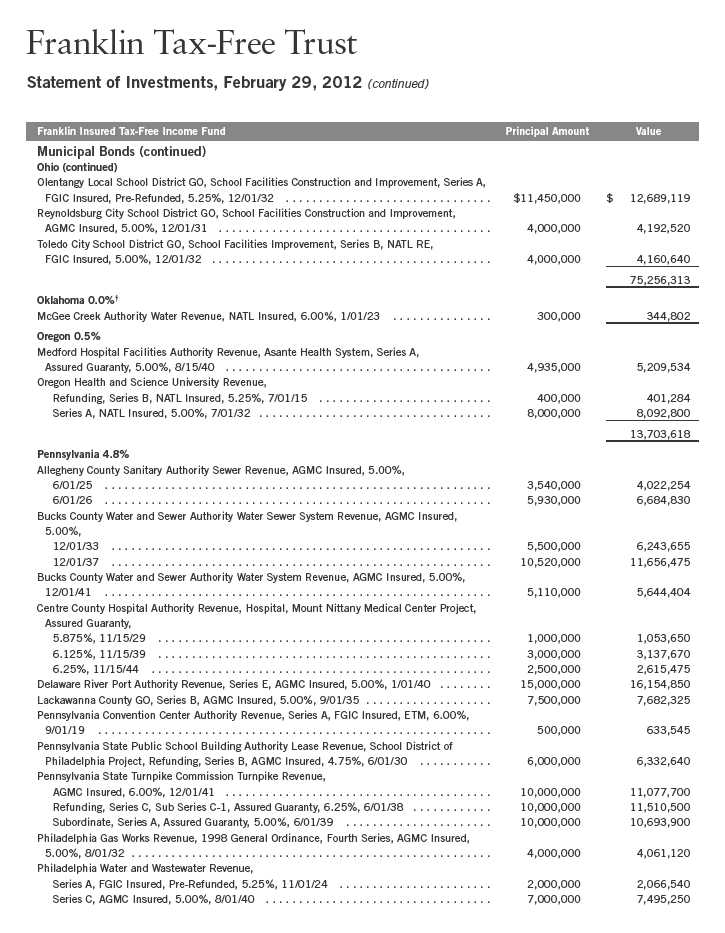
Annual Report | 157
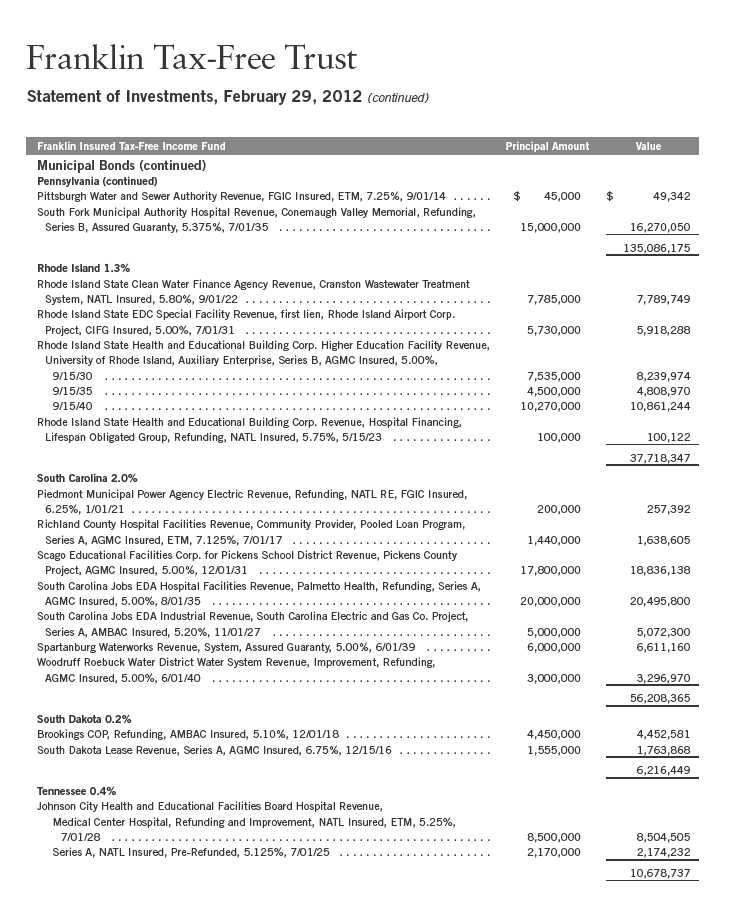
158 | Annual Report

Annual Report | 159
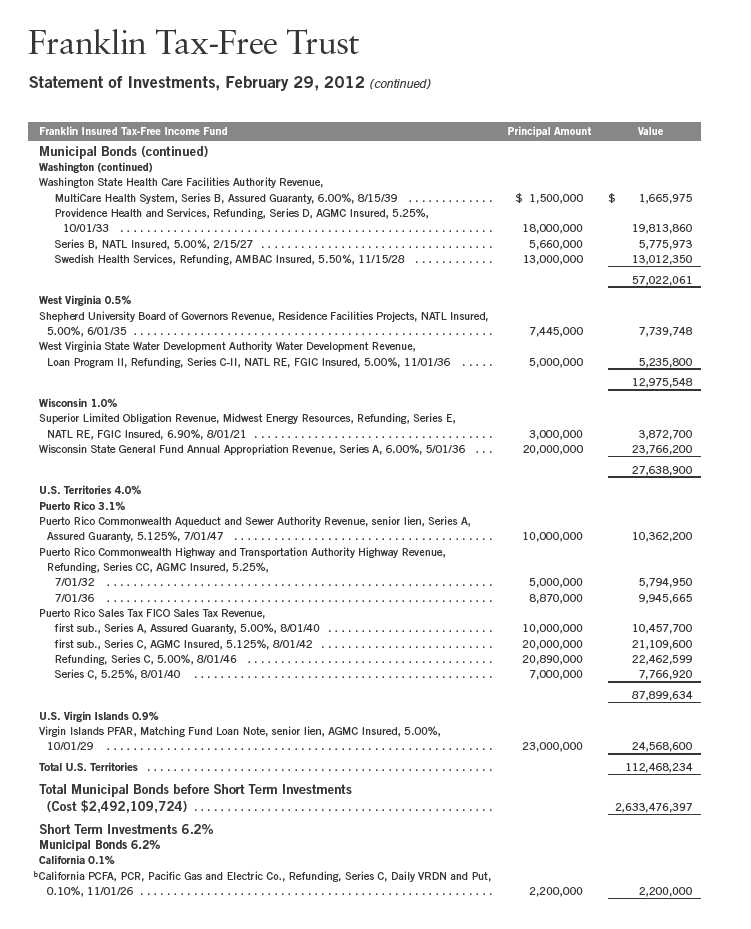
160 | Annual Report
Franklin Tax-Free Trust
Statement of Investments, February 29, 2012 (continued)
| | | | |
| Franklin Insured Tax-Free Income Fund | | Principal Amount | | Value |
| Short Term Investments (continued) | | | | |
| Municipal Bonds (continued) | | | | |
| Colorado 0.5% | | | | |
| bColorado Educational and Cultural Facilities Authority Revenue, National Jewish Federation | | | | |
| Bond Program, Series A-10, Daily VRDN and Put, 0.25%, 9/01/37 | $ | 14,875,000 | $ | 14,875,000 |
| Florida 0.4% | | | | |
| bFlorida State Municipal Power Agency Revenue, All-Requirements Power Supply Project, | | | | |
| Refunding, Series C, Daily VRDN and Put, 0.20%, 10/01/35 | | 4,000,000 | | 4,000,000 |
| bHillsborough County School Board COP, Master Lease Program, Series C, NATL Insured, | | | | |
| Daily VRDN and Put, 0.15%, 7/01/30 | | 6,400,000 | | 6,400,000 |
| | | | | 10,400,000 |
| Georgia 0.0%† | | | | |
| bAthens-Clarke County Unified Government Development Authority Revenue, University of | | | | |
| Georgia Athletic Assn. Project, Daily VRDN and Put, 0.24%, 8/01/33 | | 1,100,000 | | 1,100,000 |
| Kentucky 0.3% | | | | |
| bKentucky Economic Development Finance Authority Hospital Facilities Revenue, Baptist | | | | |
| Healthcare System, Refunding, Series B-2, Daily VRDN and Put, 0.10%, 8/15/38 | | 7,700,000 | | 7,700,000 |
| Maryland 0.1% | | | | |
| bMaryland State EDC, EDR, U.S. Pharmacopeial Convention Inc. Project, Refunding, Series B, | | | | |
| Daily VRDN and Put, 0.25%, 7/01/38 | | 2,200,000 | | 2,200,000 |
| Massachusetts 1.0% | | | | |
| bMassachusetts State Health and Educational Facilities Authority Revenue, | | | | |
| Stonehill College, Series K, Daily VRDN and Put, 0.20%, 7/01/37 | | 9,090,000 | | 9,090,000 |
| Tufts University, Refunding, Series N-1, Daily VRDN and Put, 0.14%, 8/15/40 | | 6,600,000 | | 6,600,000 |
| Tufts University, Refunding, Series N-2, Daily VRDN and Put, 0.12%, 8/15/34 | | 13,300,000 | | 13,300,000 |
| | | | | 28,990,000 |
| Missouri 0.8% | | | | |
| bMissouri Development Finance Board Cultural Facilities Revenue, The Nelson Gallery | | | | |
| Foundation, Refunding, Series A, Daily VRDN and Put, 0.10%, 12/01/37 | | 13,650,000 | | 13,650,000 |
| bMissouri State Health and Educational Facilities Authority Educational Facilities Revenue, | | | | |
| St. Louis University, | | | | |
| Refunding, Series B-1, Daily VRDN and Put, 0.10%, 10/01/35 | | 1,800,000 | | 1,800,000 |
| Series B, Daily VRDN and Put, 0.16%, 10/01/24 | | 8,500,000 | | 8,500,000 |
| | | | | 23,950,000 |
| New Hampshire 0.1% | | | | |
| bNew Hampshire Health and Education Facilities Authority Revenue, Dartmouth College, | | | | |
| Refunding, Series A, Daily VRDN and Put, 0.14%, 6/01/31 | | 1,600,000 | | 1,600,000 |
| New York 0.8% | | | | |
| bNew York City GO, Refunding, Series J, Sub Series J-4, Daily VRDN and Put, 0.19%, | | | | |
| 8/01/25 | | 21,915,000 | | 21,915,000 |
| North Carolina 1.1% | | | | |
| bCharlotte-Mecklenburg Hospital Authority Health Care System Revenue, Carolinas, Refunding, | | | | |
| Series B, Daily VRDN and Put, 0.08%, 1/15/38 | | 31,000,000 | | 31,000,000 |
| Ohio 0.1% | | | | |
| bCuyahoga County Revenue, Cleveland Clinic Health System Obligated Group, Series B, | | | | |
| Sub Series B-1, Daily VRDN and Put, 0.12%, 1/01/39 | | 2,650,000 | | 2,650,000 |
| |
| | | | | Annual Report | 161 |
Franklin Tax-Free Trust
Statement of Investments, February 29, 2012 (continued)
| | | | |
| Franklin Insured Tax-Free Income Fund | | Principal Amount | | Value |
| Short Term Investments (continued) | | | | |
| Municipal Bonds (continued) | | | | |
| Pennsylvania 0.9% | | | | |
| bGeisinger Authority Health System Revenue, Geisinger Health System, | | | | |
| Daily VRDN and Put, 0.12%, 11/15/32 | $ | 20,200,000 | $ | 20,200,000 |
| Refunding, Series A, Daily VRDN and Put, 0.08%, 5/15/35 | | 6,850,000 | | 6,850,000 |
| | | | | 27,050,000 |
| Total Short Term Investments (Cost $175,630,000) | | | | 175,630,000 |
| Total Investments (Cost $2,667,739,724) 99.1% | | | | 2,809,106,397 |
| Other Assets, less Liabilities 0.9% | | | | 26,440,092 |
| Net Assets 100.0% | | | $ | 2,835,546,489 |
See Abbreviations on page 206.
†Rounds to less than 0.1% of net assets.
aSecurity purchased on a when-issued basis. See Note 1(b).
bVariable rate demand notes (VRDNs) are tax-exempt obligations which contain a floating or variable interest rate adjustment formula and an unconditional right of demand to
receive payment of the principal balance plus accrued interest at specified dates. The coupon rate shown represents the rate at period end.
162 | The accompanying notes are an integral part of these financial statements. | Annual Report
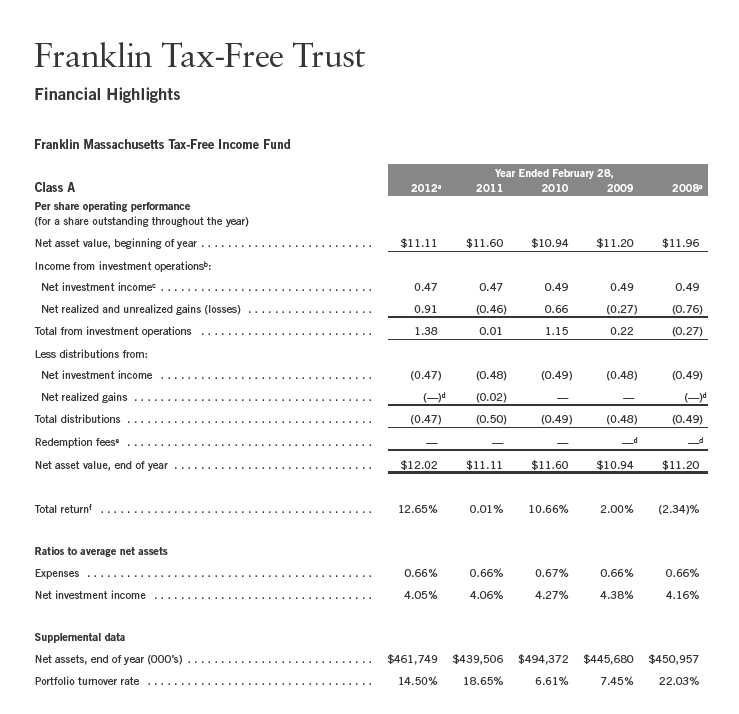
aFor the year ended February 29.
bThe amount shown for a share outstanding throughout the period may not correlate with the Statement of Operations for the period due to the timing of sales and repurchases of
the Fund shares in relation to income earned and/or fluctuating market value of the investments of the Fund.
cBased on average daily shares outstanding.
dAmount rounds to less than $0.01 per share.
eEffective September 1, 2008, the redemption fee was eliminated.
fTotal return does not reflect sales commissions or contingent deferred sales charges, if applicable.
Annual Report | The accompanying notes are an integral part of these financial statements. | 163
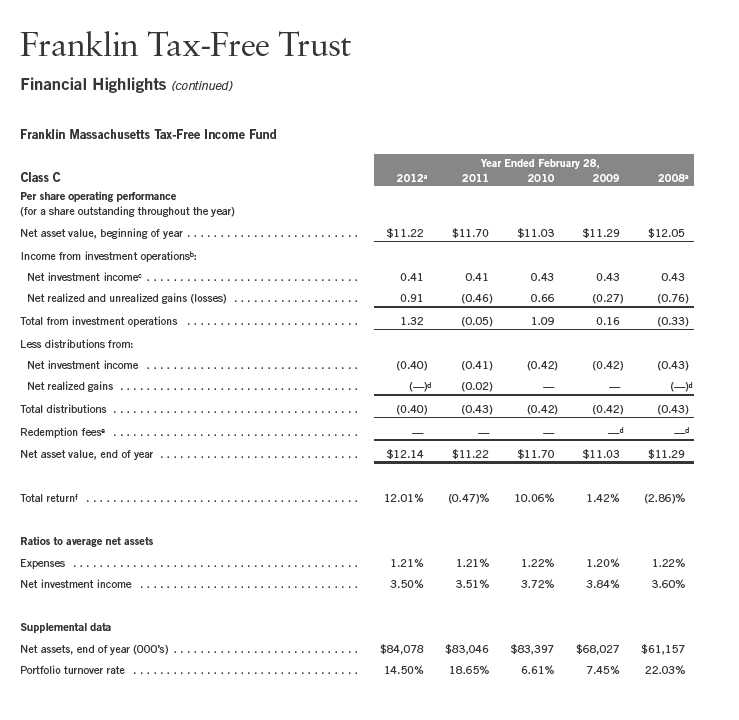
aFor the year ended February 29.
bThe amount shown for a share outstanding throughout the period may not correlate with the Statement of Operations for the period due to the timing of sales and repurchases of
the Fund shares in relation to income earned and/or fluctuating market value of the investments of the Fund.
cBased on average daily shares outstanding.
dAmount rounds to less than $0.01 per share.
eEffective September 1, 2008, the redemption fee was eliminated.
fTotal return does not reflect sales commissions or contingent deferred sales charges, if applicable.
164 | The accompanying notes are an integral part of these financial statements. | Annual Report
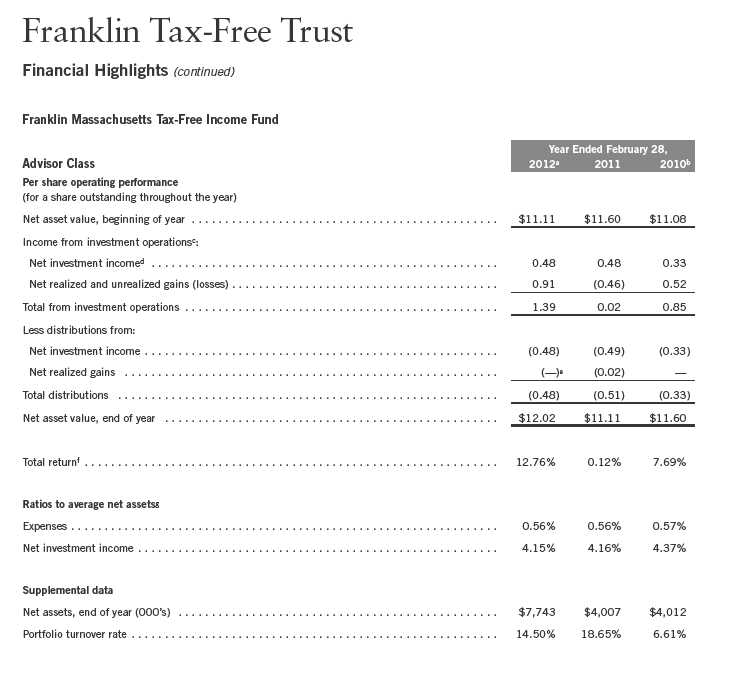
aFor the year ended February 29.
bFor the period July 1, 2009 (effective date) to February 28, 2010.
cThe amount shown for a share outstanding throughout the period may not correlate with the Statement of Operations for the period due to the timing of sales and repurchases of
the Fund shares in relation to income earned and/or fluctuating market value of the investments of the Fund.
dBased on average daily shares outstanding.
eAmount rounds to less than $0.01 per share.
fTotal return is not annualized for periods less than one year.
gRatios are annualized for periods less than one year.
Annual Report | The accompanying notes are an integral part of these financial statements. | 165
| | | | |
| Franklin Tax-Free Trust | | | | |
| |
| Statement of Investments, February 29, 2012 | | | | |
| |
| |
| Franklin Massachusetts Tax-Free Income Fund | | Principal Amount | | Value |
| Municipal Bonds 98.5% | | | | |
| Massachusetts 97.1% | | | | |
| Auburn GO, AMBAC Insured, 5.125%, 6/01/24 | $ | 1,465,000 | $ | 1,593,319 |
| Boston Convention Center Act of 1997 Revenue, Special Obligation, Series A, AMBAC Insured, | | | | |
| Pre-Refunded, 5.00%, 5/01/27 | | 3,970,000 | | 3,999,934 |
| Dudley-Charlton Regional School District GO, Series B, NATL RE, FGIC Insured, 5.25%, | | | | |
| 5/01/19 | | 3,140,000 | | 3,761,594 |
| Holyoke Gas and Electric Department Revenue, Series A, NATL Insured, 5.00%, 12/01/26 | | 9,805,000 | | 9,885,793 |
| Martha’s Vineyard Land Bank Revenue, AMBAC Insured, | | | | |
| 4.875%, 5/01/22 | | 2,000,000 | | 2,056,480 |
| 5.00%, 5/01/34 | | 7,000,000 | | 7,193,830 |
| Massachusetts Bay Transportation Authority Revenue, General Transportation System, Series C, | | | | |
| NATL RE, FGIC Insured, 5.25%, 3/01/15 | | 2,000,000 | | 2,282,760 |
| Massachusetts Bay Transportation Authority Sales Tax Revenue, senior bond, Series A, | | | | |
| FGIC Insured, Pre-Refunded, 5.00%, 7/01/27 | | 5,000,000 | | 5,078,550 |
| Massachusetts Educational Financing Authority Education Loan Revenue, | | | | |
| Issue I, Refunding, Series A, 5.50%, 1/01/22 | | 3,000,000 | | 3,471,750 |
| Series I, 6.00%, 1/01/28 | | 10,305,000 | | 11,647,432 |
| Massachusetts State College Building Authority Project Revenue, | | | | |
| Refunding, Series B, XLCA Insured, 5.50%, 5/01/39 | | 5,000,000 | | 6,668,750 |
| Series A, Assured Guaranty, 5.00%, 5/01/33 | | 10,000,000 | | 11,151,800 |
| Series A, XLCA Insured, Pre-Refunded, 5.00%, 5/01/43 | | 2,000,000 | | 2,110,500 |
| Series B, 5.00%, 5/01/40 | | 4,625,000 | | 5,099,525 |
| Massachusetts State Department of Transportation Metropolitan Highway System Revenue, | | | | |
| Contract Assistance, Series B, 5.00%, 1/01/35 | | 10,000,000 | | 11,097,600 |
| Massachusetts State Development Finance Agency Revenue, | | | | |
| Boston University, Series T-1, AMBAC Insured, 5.00%, 10/01/35 | | 3,600,000 | | 3,724,668 |
| Boston University, Series T-1, AMBAC Insured, 5.00%, 10/01/39 | | 18,630,000 | | 19,206,412 |
| Brandeis University, Series N, 5.00%, 10/01/39 | | 5,000,000 | | 5,250,950 |
| Broad Institute, Series A, 5.375%, 4/01/41 | | 15,000,000 | | 16,223,700 |
| Massachusetts College of Pharmacy and Allied Health Sciences, Series E, Assured Guaranty, | | | | |
| 5.00%, 7/01/31 | | 5,000,000 | | 5,311,150 |
| Massachusetts College of Pharmacy and Allied Health Sciences, Series E, Assured Guaranty, | | | | |
| 5.00%, 7/01/37 | | 5,035,000 | | 5,264,143 |
| Massachusetts/Saltonstall Redevelopment Building Corp., Series A, NATL Insured, 5.125%, | | | | |
| 2/01/34 | | 22,400,000 | | 22,399,776 |
| Partners Healthcare, Refunding, Series L, 5.00%, 7/01/41 | | 5,000,000 | | 5,454,750 |
| Series P, NATL Insured, 4.75%, 7/01/42 | | 11,000,000 | | 11,601,810 |
| Sterling and Francine Clark Art Institute, 5.00%, 7/01/41 | | 12,900,000 | | 14,243,535 |
| Western New England College, Refunding, Series A, Assured Guaranty, 5.00%, 9/01/33 | | 12,200,000 | | 12,629,684 |
| WGBH Educational Foundation, Refunding, Series A, Assured Guaranty, 5.00%, 1/01/36 | | 15,945,000 | | 16,813,365 |
| Worcester Polytechnic Institute, Refunding, NATL Insured, 5.00%, 9/01/37 | | 12,850,000 | | 13,496,997 |
| Massachusetts State GO, | | | | |
| Consolidated Loan, Series A, AGMC Insured, Pre-Refunded, 5.00%, 3/01/24 | | 5,000,000 | | 5,679,450 |
| Consolidated Loan, Series C, AMBAC Insured, 5.00%, 8/01/37 | | 10,000,000 | | 10,928,200 |
| Consolidated Loan, Series C, FGIC Insured, Pre-Refunded, 5.25%, 11/01/30 | | 6,205,000 | | 6,411,440 |
| Consolidated Loan, Series D, NATL Insured, ETM, 5.00%, 8/01/27 | | 3,430,000 | | 3,497,125 |
| Consolidated Loan, Series D, NATL Insured, Pre-Refunded, 5.00%, 8/01/27 | | 965,000 | | 983,885 |
| NATL Insured, Pre-Refunded, 5.00%, 8/01/22 | | 4,100,000 | | 4,180,237 |
| Refunding, Series A, AMBAC Insured, 5.50%, 8/01/30 | | 15,340,000 | | 20,702,250 |
| Series C, FGIC Insured, Pre-Refunded, 5.25%, 11/01/30 | | 3,440,000 | | 3,554,449 |
| |
| 166 | Annual Report | | | | |

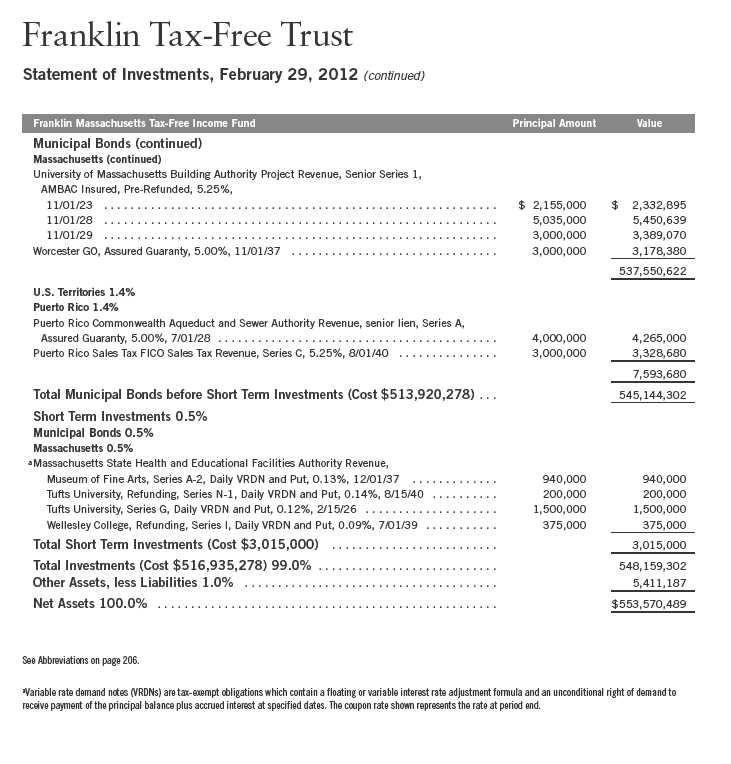
168 | The accompanying notes are an integral part of these financial statements. | Annual Report
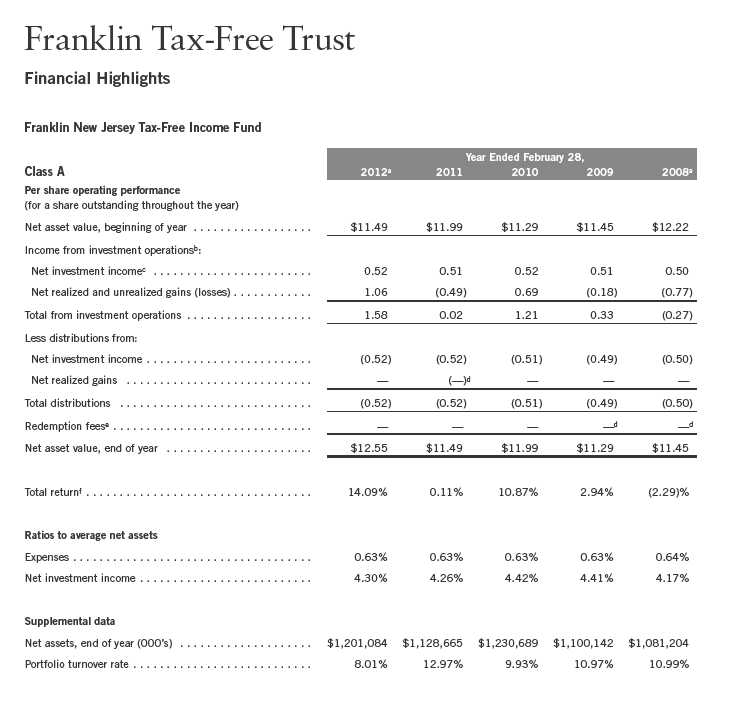
aFor the year ended February 29.
bThe amount shown for a share outstanding throughout the period may not correlate with the Statement of Operations for the period due to the timing of sales and repurchases of
the Fund shares in relation to income earned and/or fluctuating market value of the investments of the Fund.
cBased on average daily shares outstanding.
dAmount rounds to less than $0.01 per share.
eEffective September 1, 2008, the redemption fee was eliminated.
fTotal return does not reflect sales commissions or contingent deferred sales charges, if applicable.
Annual Report | The accompanying notes are an integral part of these financial statements. | 169
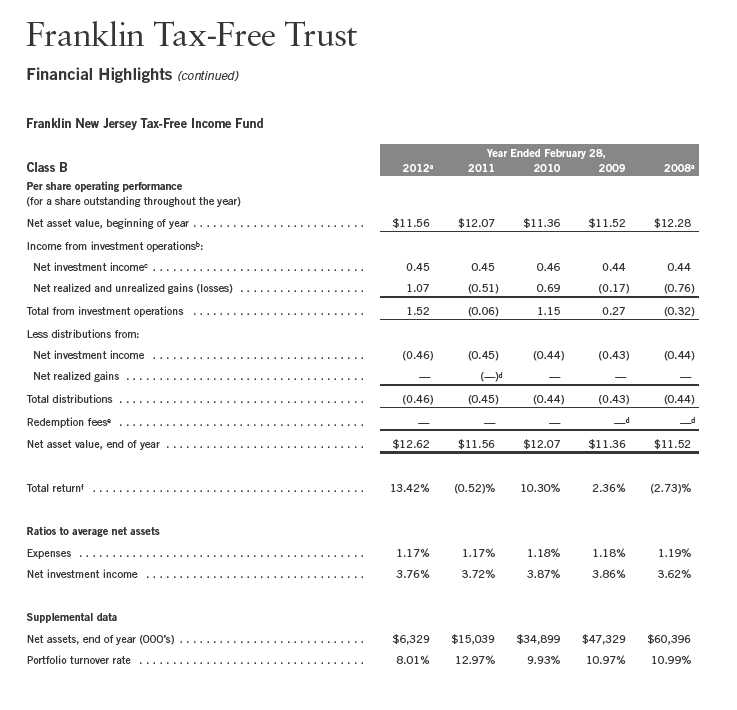
aFor the year ended February 29.
bThe amount shown for a share outstanding throughout the period may not correlate with the Statement of Operations for the period due to the timing of sales and repurchases of
the Fund shares in relation to income earned and/or fluctuating market value of the investments of the Fund.
cBased on average daily shares outstanding.
dAmount rounds to less than $0.01 per share.
eEffective September 1, 2008, the redemption fee was eliminated.
fTotal return does not reflect sales commissions or contingent deferred sales charges, if applicable.
170 | The accompanying notes are an integral part of these financial statements. | Annual Report
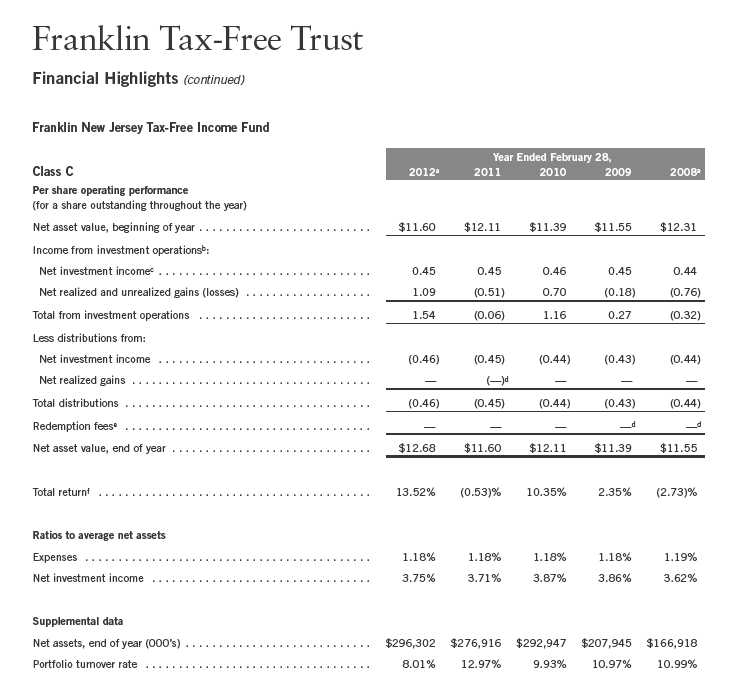
aFor the year ended February 29.
bThe amount shown for a share outstanding throughout the period may not correlate with the Statement of Operations for the period due to the timing of sales and repurchases of
the Fund shares in relation to income earned and/or fluctuating market value of the investments of the Fund.
cBased on average daily shares outstanding.
dAmount rounds to less than $0.01 per share.
eEffective September 1, 2008, the redemption fee was eliminated.
fTotal return does not reflect sales commissions or contingent deferred sales charges, if applicable.
Annual Report | The accompanying notes are an integral part of these financial statements. | 171
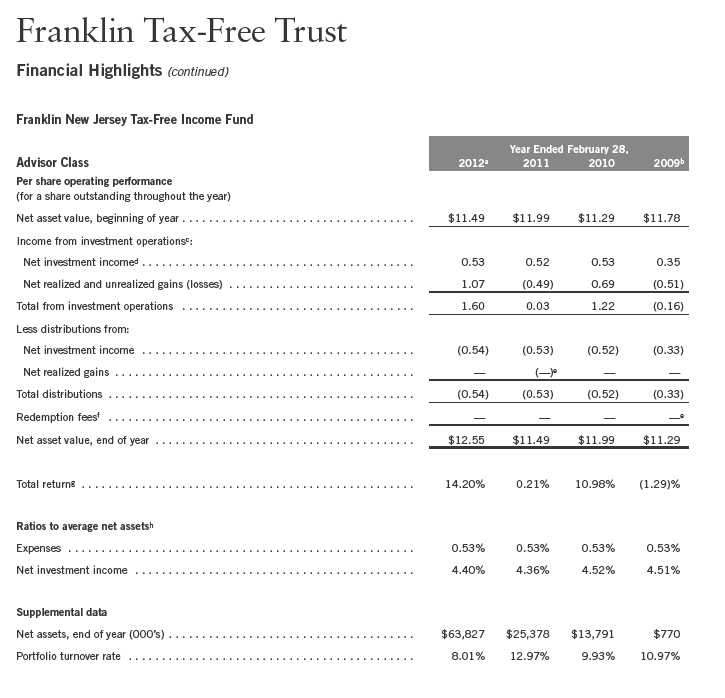
aFor the year ended February 29.
bFor the period July 1, 2008 (effective date) to February 28, 2009.
cThe amount shown for a share outstanding throughout the period may not correlate with the Statement of Operations for the period due to the timing of sales and repurchases of
the Fund shares in relation to income earned and/or fluctuating market value of the investments of the Fund.
dBased on average daily shares outstanding.
eAmount rounds to less than $0.01 per share.
fEffective September 1, 2008, the redemption fee was eliminated.
gTotal return is not annualized for periods less than one year.
hRatios are annualized for periods less than one year.
172 | The accompanying notes are an integral part of these financial statements. | Annual Report
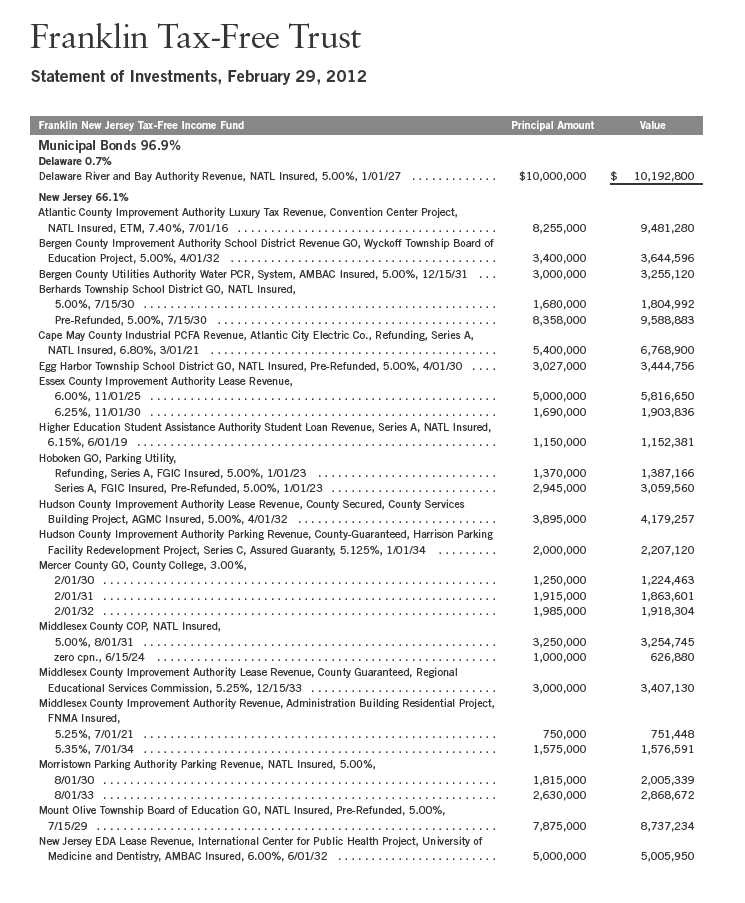
Annual Report | 173
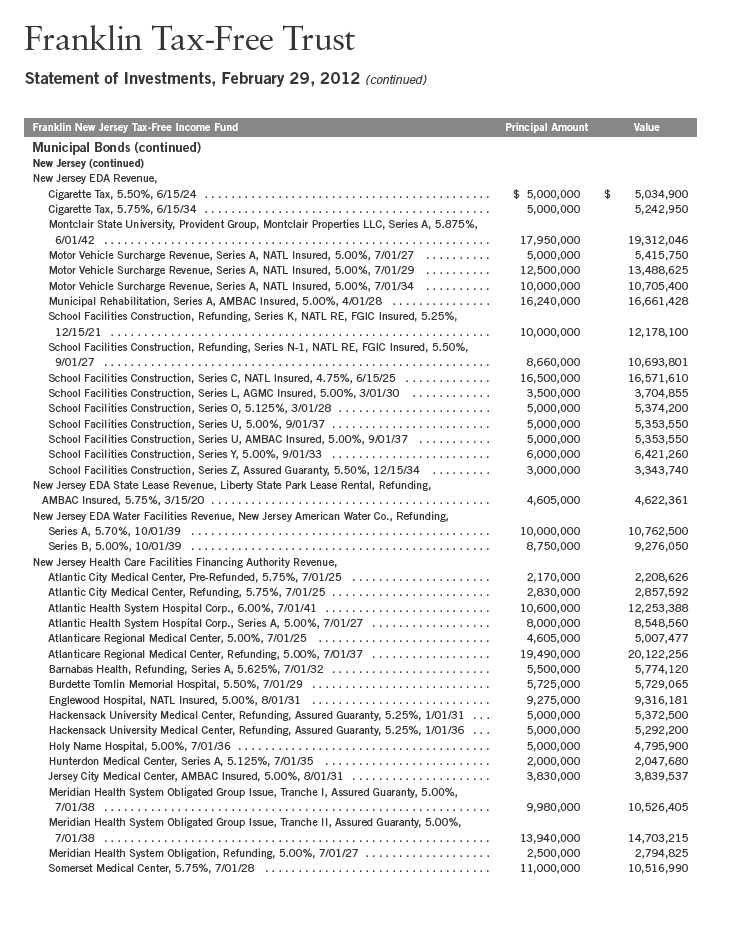
174 | Annual Report
| | | | |
| Franklin Tax-Free Trust | | | | |
| |
| Statement of Investments, February 29, 2012 (continued) | | | | |
| |
| |
| Franklin New Jersey Tax-Free Income Fund | | Principal Amount | | Value |
| Municipal Bonds (continued) | | | | |
| New Jersey (continued) | | | | |
| New Jersey Health Care Facilities Financing Authority Revenue, (continued) | | | | |
| South Jersey Hospital, 5.00%, 7/01/36 | $ | 10,000,000 | $ | 10,237,200 |
| South Jersey Hospital, 5.00%, 7/01/46 | | 27,200,000 | | 27,769,840 |
| South Jersey Hospital, Pre-Refunded, 5.875%, 7/01/21 | | 10,000,000 | | 10,183,700 |
| South Jersey Hospital, Pre-Refunded, 6.00%, 7/01/32 | | 18,600,000 | | 18,949,122 |
| St. Barnabas Health Care System, Series A, 5.00%, 7/01/29 | | 7,000,000 | | 7,142,660 |
| St. Mary’s Hospital, ETM, 5.875%, 7/01/12 | | 545,000 | | 554,919 |
| St. Peters University Hospital, Refunding, 6.00%, 7/01/26 | | 1,000,000 | | 1,092,400 |
| St. Peters University Hospital, Refunding, 6.25%, 7/01/35 | | 3,400,000 | | 3,666,016 |
| Virtua Health, Assured Guaranty, 5.50%, 7/01/38 | | 10,000,000 | | 10,890,400 |
| New Jersey Health Care Facilities Financing Authority State Contract Revenue, Hospital Asset | | | | |
| Transformation Program, Series A, | | | | |
| 5.75%, 10/01/31 | | 10,000,000 | | 11,279,400 |
| 5.25%, 10/01/38 | | 15,000,000 | | 16,073,850 |
| New Jersey State COP, Equipment Lease Purchase, Series A, 5.25%, 6/15/29 | | 1,000,000 | | 1,100,730 |
| New Jersey State Educational Facilities Authority Revenue, | | | | |
| College of New Jersey, Refunding, Series D, AGMC Insured, 5.00%, 7/01/28 | | 5,940,000 | | 6,568,808 |
| College of New Jersey, Refunding, Series D, AGMC Insured, 5.00%, 7/01/35 | | 11,000,000 | | 11,824,670 |
| Kean University, Refunding, Series A, 5.50%, 9/01/36 | | 6,500,000 | | 7,072,975 |
| Kean University, Series B, NATL Insured, Pre-Refunded, 5.00%, 7/01/30 | | 5,240,000 | | 6,212,334 |
| Kean University, Series D, AGMC Insured, 5.00%, 7/01/39 | | 1,000,000 | | 1,053,830 |
| Kean University, Series D, FGIC Insured, Pre-Refunded, 5.00%, 7/01/33 | | 10,000,000 | | 10,599,100 |
| Kean University, Series D, NATL RE, FGIC Insured, 5.00%, 7/01/39 | | 4,695,000 | | 4,924,679 |
| Montclair State University, Refunding, Series A, AMBAC Insured, 5.00%, 7/01/31 | | 10,000,000 | | 10,473,600 |
| Montclair State University, Refunding, Series A, AMBAC Insured, 5.00%, 7/01/36 | | 20,000,000 | | 20,882,400 |
| Montclair State University, Series J, 5.25%, 7/01/38 | | 2,000,000 | | 2,130,280 |
| Princeton University, Refunding, Series A, 5.00%, 7/01/30 | | 5,000,000 | | 5,434,250 |
| Princeton University, Refunding, Series E, 5.00%, 7/01/33 | | 5,000,000 | | 5,574,250 |
| Princeton University, Series B, 5.00%, 7/01/39 | | 15,000,000 | | 17,396,850 |
| Princeton University, Series D, Pre-Refunded, 5.00%, 7/01/29 | | 1,000,000 | | 1,108,930 |
| Ramapo College of New Jersey, Series D, NATL Insured, Pre-Refunded, 5.00%, 7/01/36 | | 6,745,000 | | 7,996,602 |
| Refunding, Series D, 5.00%, 7/01/27 | | 1,325,000 | | 1,380,147 |
| Refunding, Series D, 5.00%, 7/01/33 | | 1,000,000 | | 1,019,570 |
| Richard Stockton College, Refunding, Series A, 5.375%, 7/01/38 | | 5,000,000 | | 5,468,000 |
| Richard Stockton College, Refunding, Series F, AMBAC Insured, 5.00%, 7/01/28 | | 2,370,000 | | 2,499,497 |
| Rowan University, Refunding, Series D, AMBAC Insured, 5.00%, 7/01/24 | | 1,755,000 | | 1,888,169 |
| Seton Hall University, Refunding, Series E, 6.25%, 7/01/37 | | 5,000,000 | | 5,800,550 |
| Stevens Institute of Technology, Refunding, Series A, 5.00%, 7/01/34 | | 4,750,000 | | 4,851,982 |
| Stevens Institute of Technology, Refunding, Series I, 5.00%, 7/01/18 | | 590,000 | | 590,956 |
| Stevens Institute of Technology, Refunding, Series I, 5.00%, 7/01/28 | | 865,000 | | 865,528 |
| Stevens Institute of Technology, Series I, ETM, 5.00%, 7/01/18 | | 510,000 | | 551,754 |
| Stevens Institute of Technology, Series I, ETM, 5.00%, 7/01/28 | | 710,000 | | 812,410 |
| William Paterson University, Series C, Assured Guaranty, 5.00%, 7/01/38 | | 5,500,000 | | 5,797,990 |
| New Jersey State Higher Education Assistance Authority Student Loan Revenue, | | | | |
| Refunding, Series 1, 5.875%, 12/01/33 | | 2,140,000 | | 2,272,616 |
| Refunding, Series 1A, 5.00%, 12/01/25 | | 4,150,000 | | 4,512,876 |
Annual Report | 175
| | | | |
| Franklin Tax-Free Trust | | | | |
| |
| Statement of Investments, February 29, 2012 (continued) | | | | |
| |
| |
| Franklin New Jersey Tax-Free Income Fund | | Principal Amount | | Value |
| Municipal Bonds (continued) | | | | |
| New Jersey (continued) | | | | |
| New Jersey State Higher Education Assistance Authority Student Loan Revenue, (continued) | | | | |
| Refunding, Series 1A, 5.00%, 12/01/26 | $ | 2,000,000 | $ | 2,160,880 |
| Refunding, Series 1A, 5.125%, 12/01/27 | | 5,000,000 | | 5,405,450 |
| Refunding, Series 1A, 5.25%, 12/01/28 | | 5,000,000 | | 5,426,000 |
| Series 2, 5.00%, 12/01/26 | | 4,125,000 | | 4,458,052 |
| Series 2, 5.00%, 12/01/27 | | 3,000,000 | | 3,219,240 |
| Series 2, 5.00%, 12/01/28 | | 2,955,000 | | 3,157,447 |
| Series 2, 5.00%, 12/01/30 | | 1,500,000 | | 1,583,550 |
| Series 2, 5.00%, 12/01/36 | | 1,000,000 | | 1,035,730 |
| Series A, 5.625%, 6/01/30 | | 14,500,000 | | 15,843,425 |
| Series A, Assured Guaranty, 6.125%, 6/01/30 | | 10,000,000 | | 10,857,600 |
| New Jersey State Housing and Mortgage Finance Agency MFHR, | | | | |
| Series A1, AGMC Insured, 6.35%, 11/01/31 | | 2,000,000 | | 2,002,140 |
| Series B, AGMC Insured, 6.25%, 11/01/26 | | 970,000 | | 971,242 |
| Series D, AGMC Insured, 5.50%, 5/01/22 | | 630,000 | | 630,000 |
| Series E1, AGMC Insured, 5.70%, 5/01/20 | | 2,405,000 | | 2,407,982 |
| Series E1, AGMC Insured, 5.75%, 5/01/25 | | 1,090,000 | | 1,091,123 |
| Series I, 5.75%, 11/01/38 | | 2,680,000 | | 2,809,176 |
| New Jersey State Housing and Mortgage Finance Agency Revenue, Series AA, 6.50%, | | | | |
| 10/01/38 | | 5,555,000 | | 5,864,580 |
| New Jersey State Transportation Trust Fund Authority Revenue, | | | | |
| Capital Appreciation, Transportation System, Series A, zero cpn., 12/15/29 | | 5,000,000 | | 2,151,550 |
| Capital Appreciation, Transportation System, Series C, AGMC Insured, zero cpn., | | | | |
| 12/15/33 | | 10,000,000 | | 3,462,400 |
| Transportation System, Refunding, Series B, AMBAC Insured, 5.25%, 12/15/23 | | 5,000,000 | | 6,125,750 |
| Transportation System, Series A, 6.00%, 12/15/38 | | 16,110,000 | | 18,615,105 |
| Transportation System, Series A, 5.50%, 6/15/41 | | 5,000,000 | | 5,756,150 |
| Transportation System, Series A, AGMC Insured, 5.00%, 12/15/34 | | 15,000,000 | | 16,158,900 |
| Transportation System, Series A, AMBAC Insured, 5.00%, 12/15/34 | | 10,000,000 | | 10,750,900 |
| Transportation System, Series A, Pre-Refunded, 6.00%, 12/15/38 | | 8,890,000 | | 11,782,006 |
| Transportation System, Series A, zero cpn., 12/15/32 | | 10,000,000 | | 3,627,800 |
| Transportation System, Series B, 5.00%, 6/15/42 | | 5,000,000 | | 5,457,000 |
| New Jersey State Turnpike Authority Turnpike Revenue, | | | | |
| Growth and Income Securities, Series B, AMBAC Insured, zero cpn. to 1/01/15, | | | | |
| 5.15% thereafter, 1/01/35 | | 7,500,000 | | 6,777,600 |
| Refunding, Series I, 5.00%, 1/01/35 | | 5,000,000 | | 5,537,950 |
| Series A, AMBAC Insured, 5.00%, 1/01/30 | | 13,500,000 | | 14,072,535 |
| Series E, 5.25%, 1/01/40 | | 25,000,000 | | 27,955,000 |
| Series H, 5.00%, 1/01/36 | | 14,000,000 | | 15,308,440 |
| Newark Housing Authority Port Authority Revenue, Newark Marine Terminal, NATL Insured, | | | | |
| Pre-Refunded, | | | | |
| 5.00%, 1/01/26 | | 3,245,000 | | 3,521,312 |
| 5.50%, 1/01/27 | | 3,240,000 | | 3,545,305 |
| 5.50%, 1/01/28 | | 2,000,000 | | 2,188,460 |
| 5.00%, 1/01/34 | | 15,000,000 | | 16,277,250 |
176 | Annual Report
| | | | |
| Franklin Tax-Free Trust | | | | |
| |
| Statement of Investments, February 29, 2012 (continued) | | | | |
| |
| |
| Franklin New Jersey Tax-Free Income Fund | | Principal Amount | | Value |
| Municipal Bonds (continued) | | | | |
| New Jersey (continued) | | | | |
| North Hudson Sewer Authority Sewer Revenue, Series C, NATL Insured, 5.00%, | | | | |
| 8/01/22 | $ | 1,000,000 | $ | 1,002,070 |
| 8/01/31 | | 1,000,000 | | 1,001,190 |
| Passaic County Improvement Authority Parking Facilities Revenue, 200 Hospital Plaza Corp. | | | | |
| Project, 5.00%, 5/01/42 | | 3,200,000 | | 3,495,136 |
| Rutgers State University Revenue, Series F, 5.00%, 5/01/39 | | 20,000,000 | | 21,883,600 |
| Salem County PCFA, PCR, Atlantic City Electric, Refunding, Series A, 4.875%, 6/01/29 | | 5,000,000 | | 5,495,000 |
| South Jersey Transportation Authority Transportation System Revenue, AMBAC Insured, 5.00%, | | | | |
| 11/01/29 | | 12,000,000 | | 12,011,640 |
| Sussex County Municipal Utilities Authority Wastewater Facilities Revenue, | | | | |
| Capital Appreciation, Series B, AGMC Insured, zero cpn., | | | | |
| 12/01/35 | | 2,815,000 | | 965,235 |
| 12/01/36 | | 2,810,000 | | 888,241 |
| 12/01/37 | | 2,815,000 | | 838,729 |
| 12/01/38 | | 2,810,000 | | 788,093 |
| Tobacco Settlement FICO Revenue, Asset-Backed, Pre-Refunded, 6.00%, 6/01/37 | | 13,000,000 | | 13,180,960 |
| University of Medicine and Dentistry COP, | | | | |
| AMBAC Insured, 5.00%, 4/15/32 | | 2,000,000 | | 2,016,240 |
| NATL Insured, 5.00%, 6/15/36 | | 12,500,000 | | 12,668,125 |
| Series A, NATL Insured, 5.00%, 9/01/22 | | 1,700,000 | | 1,745,254 |
| University of Medicine and Dentistry Revenue, Series A, AMBAC Insured, 5.00%, | | | | |
| 12/01/24 | | 2,500,000 | | 2,527,725 |
| 12/01/31 | | 28,395,000 | | 28,548,617 |
| Upper Freehold Regional School District GO, NATL Insured, Pre-Refunded, 5.00%, | | | | |
| 2/15/35 | | 8,730,000 | | 10,560,594 |
| | | | | 1,036,275,366 |
| New York 8.3% | | | | |
| Port Authority of New York and New Jersey Revenue, Consolidated, | | | | |
| One Hundred Fifty-Third Series, Refunding, 5.00%, 7/15/38 | | 8,850,000 | | 9,658,801 |
| One Hundred Forty-Eighth Series, AGMC Insured, 5.00%, 8/15/34 | | 10,000,000 | | 10,934,500 |
| One Hundred Forty-Eighth Series, AGMC Insured, 5.00%, 8/15/37 | | 5,000,000 | | 5,399,650 |
| One Hundred Forty-Fourth Series, 5.00%, 10/01/29 | | 5,000,000 | | 5,635,900 |
| One Hundred Forty-Ninth Series, 5.00%, 11/15/31 | | 10,000,000 | | 11,116,800 |
| One Hundred Seventy-First Series, 4.50%, 7/15/36 | | 20,000,000 | | 21,516,600 |
| One Hundred Sixtieth Series, Refunding, 5.00%, 9/15/36 | | 15,000,000 | | 16,708,500 |
| One Hundred Sixty-First Series, 5.00%, 10/15/33 | | 10,000,000 | | 11,257,400 |
| One Hundred Sixty-Sixth Series, Refunding, 5.25%, 7/15/36 | | 5,000,000 | | 5,751,900 |
| One Hundred Twenty-Fifth Series, AGMC Insured, 5.00%, 4/15/32 | | 23,950,000 | | 24,292,485 |
| Port Authority of New York and New Jersey Special Obligation Revenue, John F. Kennedy | | | | |
| International Airport Terminal, NATL Insured, 5.75%, 12/01/22 | | 8,000,000 | | 8,046,880 |
| | | | | 130,319,416 |
| Pennsylvania 1.3% | | | | |
| Delaware River Joint Toll Bridge Commission Bridge Revenue, Series A, NATL Insured, 5.00%, | | | | |
| 7/01/35 | | 5,000,000 | | 5,296,300 |
| Delaware River Port Authority Revenue, Series E, 5.00%, 1/01/35 | | 14,000,000 | | 14,980,140 |
| | | | | 20,276,440 |
Annual Report | 177
| | | | |
| Franklin Tax-Free Trust | | | | |
| |
| Statement of Investments, February 29, 2012 (continued) | | | | |
| |
| |
| Franklin New Jersey Tax-Free Income Fund | | Principal Amount | | Value |
| Municipal Bonds (continued) | | | | |
| U.S. Territories 20.5% | | | | |
| Puerto Rico 20.2% | | | | |
| Puerto Rico Commonwealth Aqueduct and Sewer Authority Revenue, senior lien, Series A, | | | | |
| 6.00%, 7/01/44 | $ | 4,100,000 | $ | 4,418,488 |
| Puerto Rico Commonwealth GO, Public Improvement, | | | | |
| Refunding, AGMC Insured, 5.125%, 7/01/30 | | 8,350,000 | | 8,357,014 |
| Refunding, Series A-4, AGMC Insured, 5.00%, 7/01/31 | | 5,000,000 | | 5,383,400 |
| Series A, 5.00%, 7/01/29 | | 10,000,000 | | 10,199,100 |
| Series B, 5.00%, 7/01/35 | | 1,825,000 | | 1,867,559 |
| Series B, Pre-Refunded, 5.00%, 7/01/35 | | 3,175,000 | | 3,776,123 |
| Puerto Rico Commonwealth Highway and Transportation Authority Highway Revenue, | | | | |
| Refunding, Series CC, AGMC Insured, 5.25%, 7/01/34 | | 5,000,000 | | 5,716,000 |
| Puerto Rico Commonwealth Highway and Transportation Authority Transportation Revenue, | | | | |
| Refunding, Series N, NATL Insured, 5.25%, 7/01/32 | | 10,000,000 | | 10,810,200 |
| Puerto Rico Commonwealth Infrastructure Financing Authority Special Tax Revenue, | | | | |
| 5.00%, 7/01/46 | | 14,200,000 | | 14,391,700 |
| Series B, 5.00%, 7/01/37 | | 8,000,000 | | 8,148,720 |
| Puerto Rico Electric Power Authority Power Revenue, | | | | |
| Series RR, FGIC Insured, Pre-Refunded, 5.00%, 7/01/35 | | 30,000,000 | | 34,452,900 |
| Series TT, 5.00%, 7/01/32 | | 17,000,000 | | 17,658,070 |
| Series TT, 5.00%, 7/01/37 | | 17,925,000 | | 18,403,598 |
| Series WW, 5.50%, 7/01/38 | | 16,620,000 | | 17,817,305 |
| Series XX, 5.25%, 7/01/40 | | 19,000,000 | | 19,898,130 |
| Puerto Rico Industrial Tourist Educational Medical and Environmental Control Facilities | | | | |
| Financing Authority Educational Facilities Revenue, University Plaza Project, Series A, | | | | |
| NATL Insured, 5.00%, 7/01/33 | | 1,000,000 | | 1,001,010 |
| Puerto Rico Infrastructure Financing Authority Revenue, Ports Authority Project, Series B, | | | | |
| 5.25%, 12/15/26 | | 11,250,000 | | 12,076,425 |
| Puerto Rico PBA Guaranteed Revenue, Government Facilities, Refunding, | | | | |
| Series D, 5.375%, 7/01/33 | | 6,830,000 | | 6,861,486 |
| Series N, 5.00%, 7/01/32 | | 20,000,000 | | 20,629,600 |
| Puerto Rico Sales Tax FICO Sales Tax Revenue, | | | | |
| first sub., Series A, 5.75%, 8/01/37 | | 10,000,000 | | 11,111,700 |
| first sub., Series A, 5.50%, 8/01/42 | | 17,000,000 | | 18,556,520 |
| first sub., Series A, 6.00%, 8/01/42 | | 32,000,000 | | 36,219,200 |
| first sub., Series C, 5.50%, 8/01/40 | | 20,000,000 | | 21,898,600 |
| Series C, 5.25%, 8/01/40 | | 6,290,000 | | 6,979,132 |
| | | | | 316,631,980 |
| U.S. Virgin Islands 0.3% | | | | |
| Virgin Islands PFAR, Gross Receipts Taxes Loan Note, Radian Insured, 5.00%, 10/01/33 | | 5,000,000 | | 5,085,450 |
| Total U.S. Territories | | | | 321,717,430 |
| Total Municipal Bonds before Short Term Investments | | | | |
| (Cost $1,420,943,031) | | | | 1,518,781,452 |
178 | Annual Report
Franklin Tax-Free Trust
Statement of Investments, February 29, 2012 (continued)
| | | | |
| Franklin New Jersey Tax-Free Income Fund | | Principal Amount | | Value |
| Short Term Investments 1.4% | | | | |
| Municipal Bonds 1.4% | | | | |
| New Jersey 1.4% | | | | |
| aNew Jersey EDA, EDR, Lawrenceville School Project, Daily VRDN and Put, 0.13%, | | | | |
| 7/01/31 | $ | 5,100,000 | $ | 5,100,000 |
| aNew Jersey Health Care Facilities Financing Authority Revenue, Virtua Health, | | | | |
| Series B, Daily VRDN, 0.10%, 7/01/43 | | 12,565,000 | | 12,565,000 |
| Series C, Daily VRDN and Put, 0.15%, 7/01/43 | | 5,000,000 | | 5,000,000 |
| Total Short Term Investments (Cost $22,665,000) | | | | 22,665,000 |
| Total Investments (Cost $1,443,608,031) 98.3% | | | | 1,541,446,452 |
| Other Assets, less Liabilities 1.7% | | | | 26,094,934 |
| Net Assets 100.0% | | | $ | 1,567,541,386 |
See Abbreviations on page 206.
aVariable rate demand notes (VRDNs) are tax-exempt obligations which contain a floating or variable interest rate adjustment formula and an unconditional right of demand to receive payment of the principal balance plus accrued interest at specified dates. The coupon rate shown represents the rate at period end.
Annual Report | The accompanying notes are an integral part of these financial statements. | 179
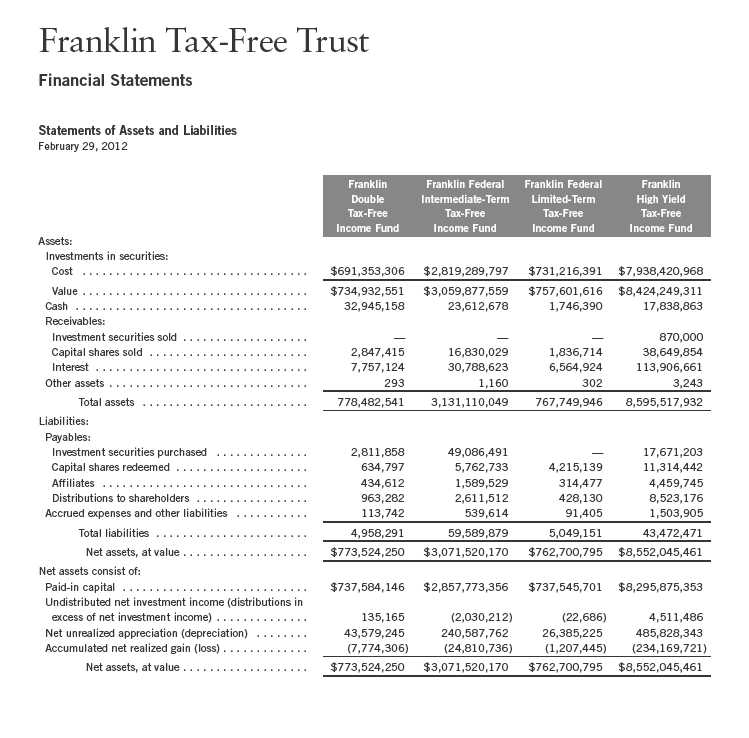
180 | The accompanying notes are an integral part of these financial statements. | Annual Report
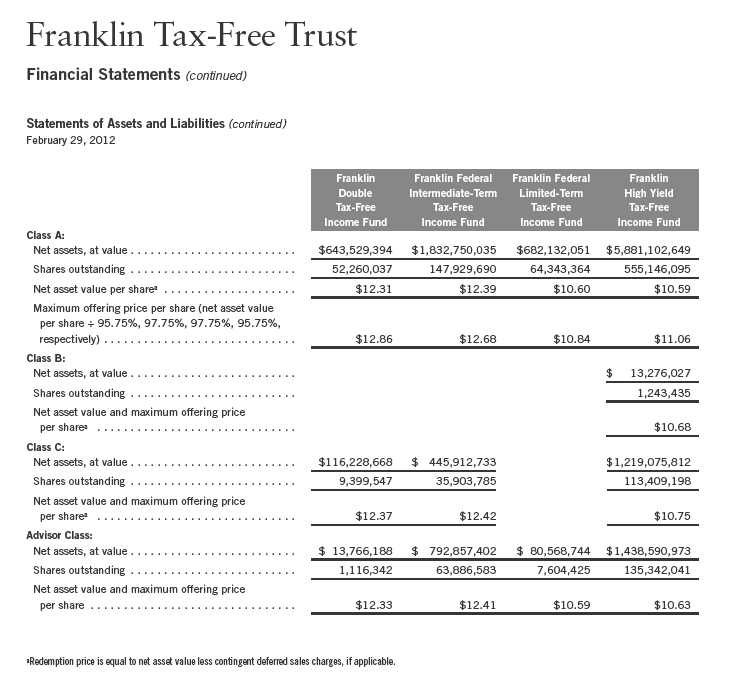
Annual Report | The accompanying notes are an integral part of these financial statements. | 181
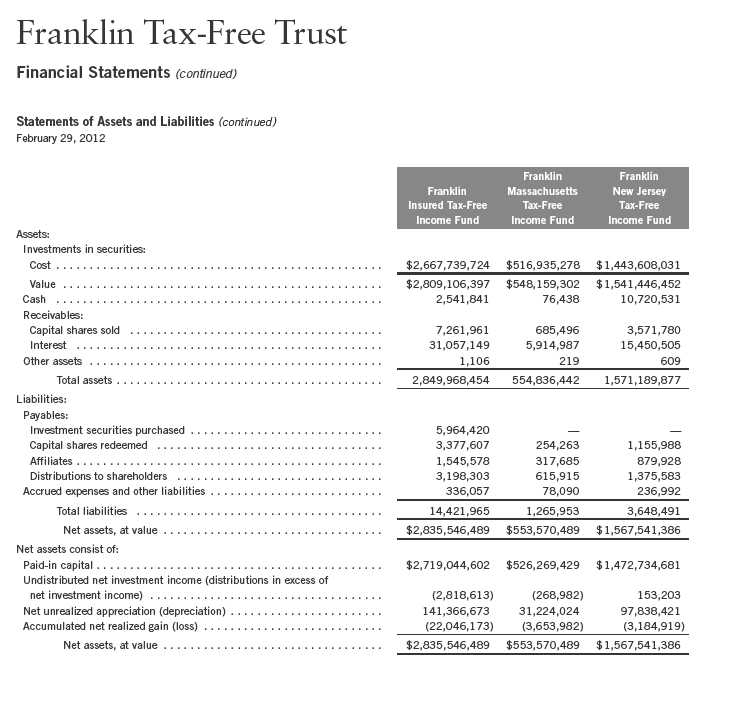
182 | The accompanying notes are an integral part of these financial statements. | Annual Report
Franklin Tax-Free Trust
Financial Statements (continued)
Statements of Assets and Liabilities (continued)
February 29, 2012
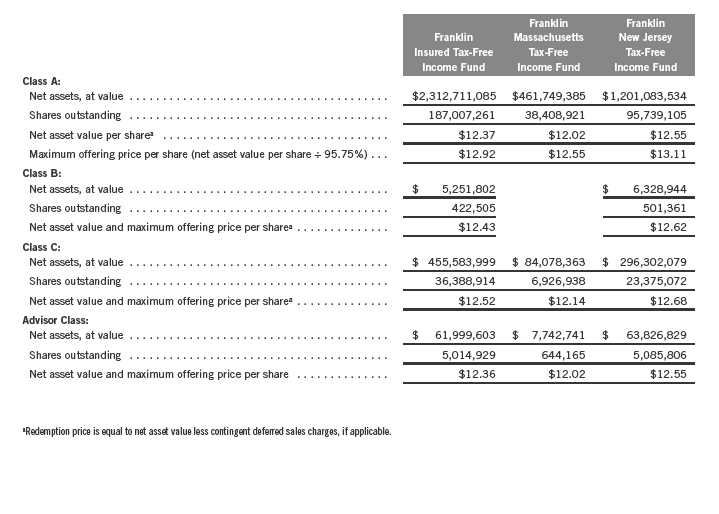
Annual Report | The accompanying notes are an integral part of these financial statements. | 183
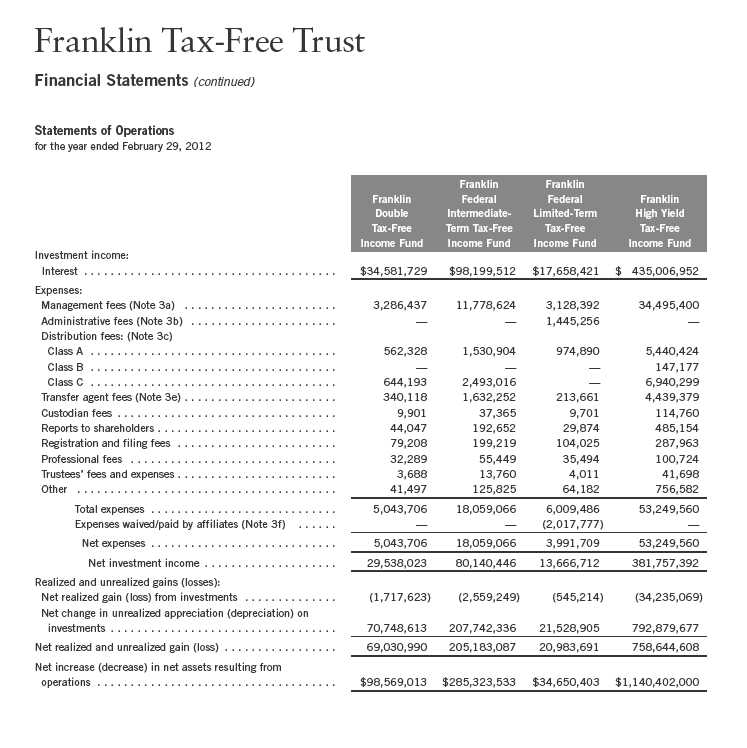
184 | The accompanying notes are an integral part of these financial statements. | Annual Report
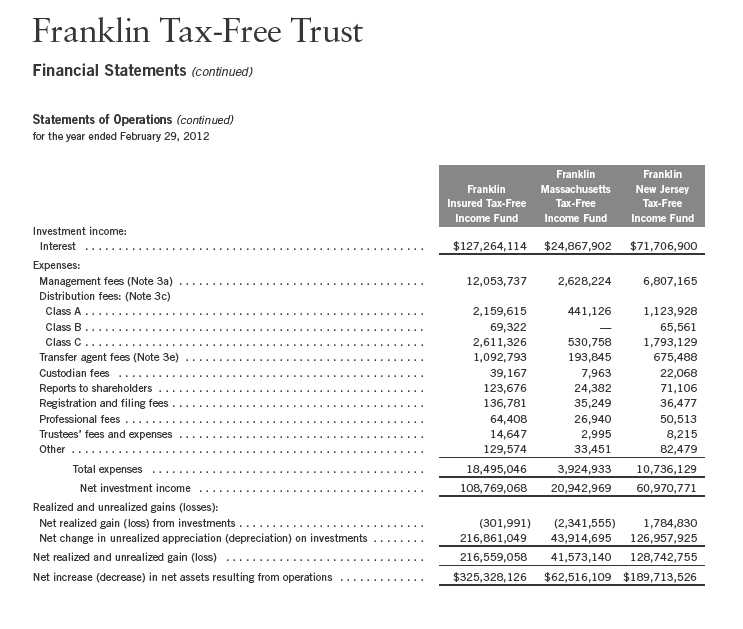
Annual Report | The accompanying notes are an integral part of these financial statements. | 185
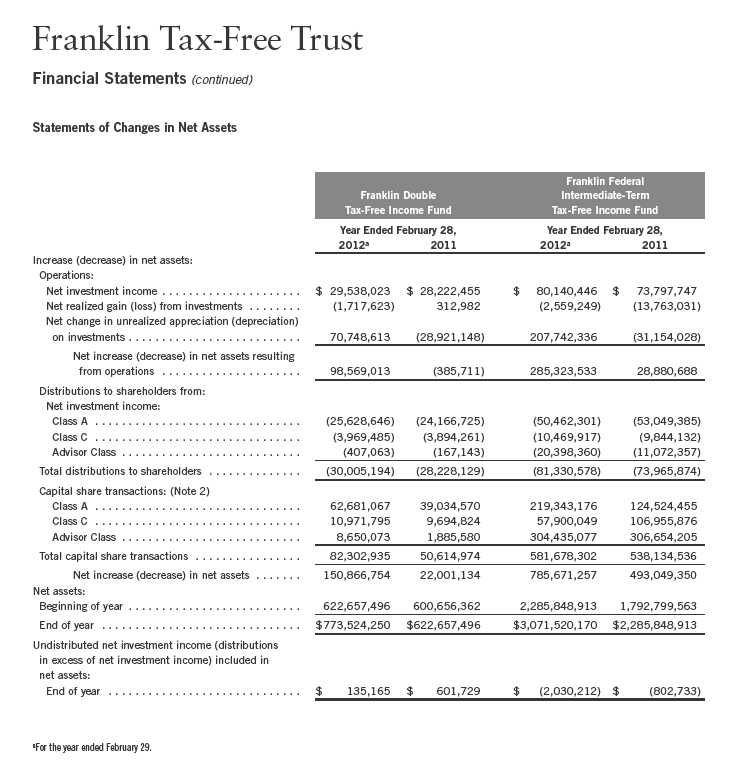
186 | The accompanying notes are an integral part of these financial statements. | Annual Report
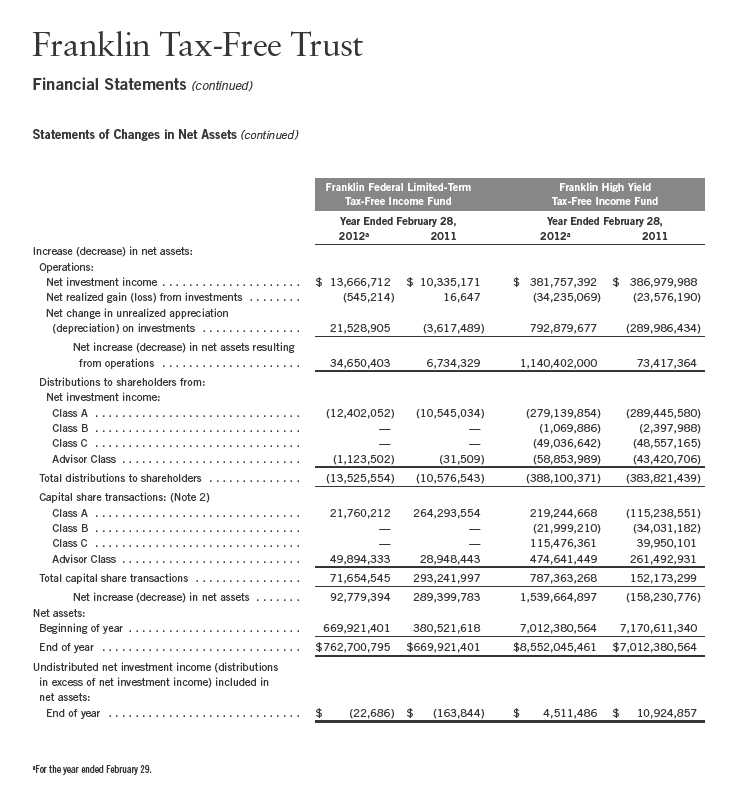
Annual Report | The accompanying notes are an integral part of these financial statements. | 187
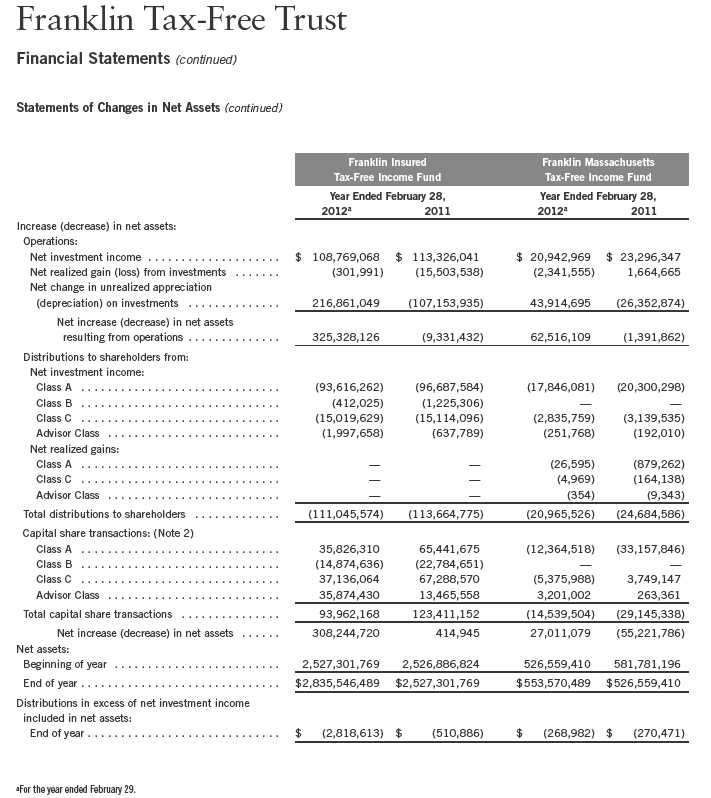
188 | The accompanying notes are an integral part of these financial statements. | Annual Report
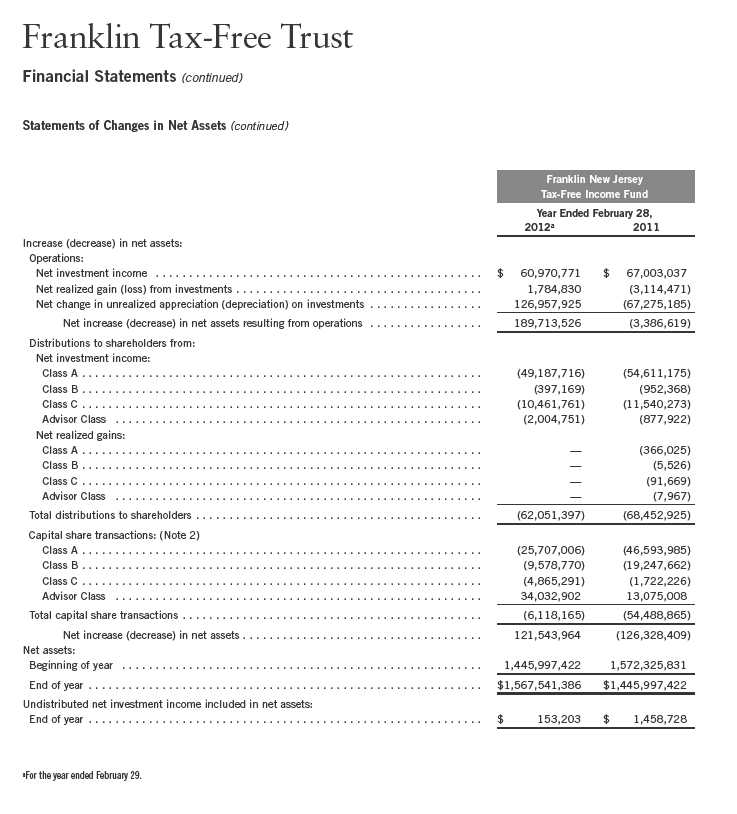
Annual Report | The accompanying notes are an integral part of these financial statements. | 189
Franklin Tax-Free Trust
Notes to Financial Statements
1. ORGANIZATION AND SIGNIFICANT ACCOUNTING POLICIES
Franklin Tax-Free Trust (Trust) is registered under the Investment Company Act of 1940, as amended, (1940 Act) as an open-end investment company, consisting of twenty-four separate funds, seven of which are included in this report (Funds). The financial statements of the remaining funds in the Trust are presented separately. The classes of shares offered within each of the Funds are indicated below. Each class of shares differs by its initial sales load, contingent deferred sales charges, distribution fees, voting rights on matters affecting a single class and its exchange privilege.

Class A, Class B, Class C & Advisor Class
Franklin High Yield Tax-Free Income Fund Franklin Insured Tax-Free Income Fund Franklin New Jersey Tax-Free Income Fund
The following summarizes the Funds’ significant accounting policies.
a. Financial Instrument Valuation
The Funds’ investments in securities and other financial instruments are carried at fair value daily. Fair value is the price that would be received to sell an asset or paid to transfer a liability in an orderly transaction between market participants on the measurement date. Under procedures approved by the Trust’s Board of Trustees, the Funds may utilize independent pricing services, quotations from securities and financial instrument dealers, and other market sources to determine fair value.
Debt securities generally trade in the over-the-counter market rather than on a securities exchange. The Funds’ pricing services use multiple valuation techniques to determine fair value. In instances where sufficient market activity exists, the pricing services may utilize a market-based approach through which quotes from market makers are used to determine fair value. In instances where sufficient market activity may not exist or is limited, the pricing services also utilize proprietary valuation models which may consider market characteristics such as benchmark yield curves, option-adjusted spreads, credit spreads, estimated default rates, coupon rates, anticipated timing of principal repayments, underlying collateral, and other unique security features in order to estimate the relevant cash flows, which are then discounted to calculate the fair value.
The Funds have procedures to determine the fair value of securities and other financial instruments for which market prices are not readily available or which may not be reliably priced. Under these procedures, the Funds primarily employ a market-based approach which may use related or comparable assets or liabilities, recent transactions, market multiples, book values, and other relevant information for the investment to determine the fair value of the investment. The Funds
190 | Annual Report
Franklin Tax-Free Trust
Notes to Financial Statements (continued)
| 1. | ORGANIZATION AND SIGNIFICANT ACCOUNTING POLICIES (continued) |
| a. | Financial Instrument Valuation (continued) |
may also use an income-based valuation approach in which the anticipated future cash flows of the investment are discounted to calculate fair value. Discounts may also be applied due to the nature or duration of any restrictions on the disposition of the investments. Due to the inherent uncertainty of valuations of such investments, the fair values may differ significantly from the values that would have been used had an active market existed.
b. Securities Purchased on a When-Issued Basis
The Funds purchase securities on a when-issued basis, with payment and delivery scheduled for a future date. These transactions are subject to market fluctuations and are subject to the risk that the value at delivery may be more or less than the trade date purchase price. Although the Funds will generally purchase these securities with the intention of holding the securities, they may sell the securities before the settlement date. Sufficient assets have been segregated for these securities.
c. Income Taxes
It is each fund’s policy to qualify as a regulated investment company under the Internal Revenue Code. Each fund intends to distribute to shareholders substantially all of its income and net realized gains to relieve it from federal income and excise taxes. As a result, no provision for U.S. federal income taxes is required.
Each fund recognizes the tax benefits of uncertain tax positions only when the position is “more likely than not” to be sustained upon examination by the tax authorities based on the technical merits of the tax position. As of February 29, 2012, and for all open tax years, each fund has determined that no liability for unrecognized tax benefits is required in each fund’s financial statements related to uncertain tax positions taken on a tax return (or expected to be taken on future tax returns). Open tax years are those that remain subject to examination and are based on each tax jurisdiction statute of limitation.
d. Security Transactions, Investment Income, Expenses and Distributions
Security transactions are accounted for on trade date. Realized gains and losses on security transactions are determined on a specific identification basis. Interest income and estimated expenses are accrued daily. Amortization of premium and accretion of discount on debt securities are included in interest income. Dividends from net investment income are normally declared daily; these dividends may be reinvested or paid monthly to shareholders. Distributions from realized capital gains and other distributions, if any, are recorded on the ex-dividend date. Distributions to shareholders are determined according to income tax regulations (tax basis). Distributable earnings determined on a tax basis may differ from earnings recorded in accordance with accounting principles generally accepted in the United States of America. These differences may be permanent or temporary. Permanent differences are reclassified among capital accounts to reflect their tax character. These reclassifications have no impact on net assets or the results of operations. Temporary differences are not reclassified, as they may reverse in subsequent periods.
Annual Report | 191
Franklin Tax-Free Trust
Notes to Financial Statements (continued)
| 1. | ORGANIZATION AND SIGNIFICANT ACCOUNTING POLICIES (continued) |
| d. | Security Transactions, Investment Income, Expenses and Distributions (continued) |
Common expenses incurred by the Trust are allocated among the funds based on the ratio of net assets of each fund to the combined net assets of the Trust. Fund specific expenses are charged directly to the fund that incurred the expense.
Realized and unrealized gains and losses and net investment income, not including class specific expenses, are allocated daily to each class of shares based upon the relative proportion of net assets of each class. Differences in per share distributions, by class, are generally due to differences in class specific expenses.
e. Insurance
The scheduled payments of interest and principal for each insured municipal security in the Trust are insured by either a new issue insurance policy or a secondary insurance policy. Some municipal securities in the Funds are secured by collateral guaranteed by an agency of the U.S. government. Depending on the type of coverage, premiums for insurance are either added to the cost basis of the security or paid by a third party.
Insurance companies typically insure municipal bonds that tend to be of very high quality, with the majority of underlying municipal bonds rated A or better. However, an event involving an insurer could have an adverse effect on the value of the securities insured by that insurance company. There is no guarantee the insurer will be able to fulfill its obligations under the terms of the policy.
f. Accounting Estimates
The preparation of financial statements in accordance with accounting principles generally accepted in the United States of America requires management to make estimates and assumptions that affect the reported amounts of assets and liabilities at the date of the financial statements and the amounts of income and expenses during the reporting period. Actual results could differ from those estimates.
g. Guarantees and Indemnifications
Under the Trust’s organizational documents, its officers and trustees are indemnified by the Trust against certain liabilities arising out of the performance of their duties to the Trust. Additionally, in the normal course of business, the Trust, on behalf of the Funds, enters into contracts with service providers that contain general indemnification clauses. The Trust’s maximum exposure under these arrangements is unknown as this would involve future claims that may be made against the Trust that have not yet occurred. Currently, the Trust expects the risk of loss to be remote.
192 | Annual Report
Franklin Tax-Free Trust
Notes to Financial Statements (continued)
2. SHARES OF BENEFICIAL INTEREST
At February 29, 2012, there were an unlimited number of shares authorized (without par value).
Transactions in the Funds’ shares were as follows:
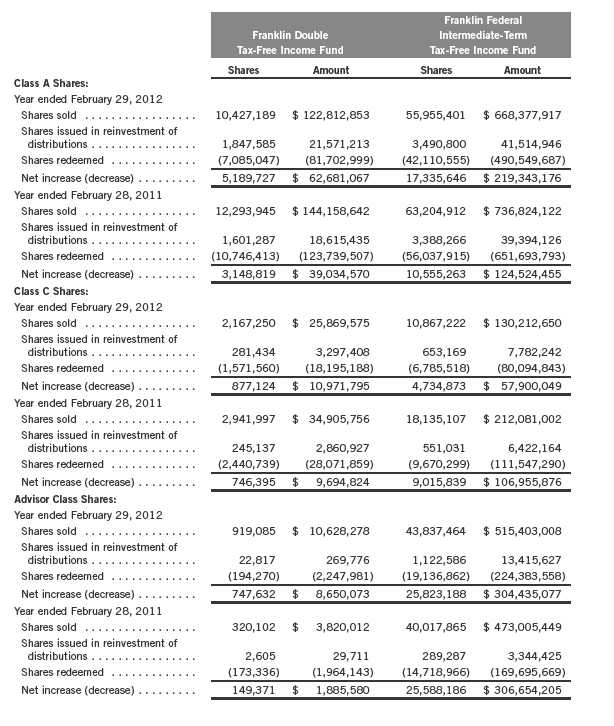
Annual Report | 193
| | | | | | | | | | |
| Franklin Tax-Free Trust | | | | | | |
| |
| Notes to Financial Statements (continued) | | | | | | |
| |
| |
| 2. SHARES OF BENEFICIAL INTEREST (continued) | | | | | | | | | |
| |
| | Franklin Federal | | Franklin | |
| | Limited-Term | | High Yield | |
| | Tax-Free Income Fund | | Tax-Free Income Fund | |
| | Shares | | | Amount | | Shares | | | Amount | |
| Class A Shares: | | | | | | | | | | |
| Year ended February 29, 2012 | | | | | | | | | | |
| Shares sold | 28,326,395 | | $ | 296,353,591 | | 92,336,308 | | $ | 933,780,298 | |
| Shares issued in reinvestment of | | | | | | | | | | |
| distributions | 897,139 | | | 9,395,591 | | 21,362,568 | | | 214,852,825 | |
| Shares redeemed | (27,140,809 | ) | | (283,988,970 | ) | (93,280,641 | ) | | (929,388,455 | ) |
| Net increase (decrease) | 2,082,725 | | $ | 21,760,212 | | 20,418,235 | | $ | 219,244,668 | |
| Year ended February 28, 2011 | | | | | | | | | | |
| Shares sold | 47,804,572 | | $ | 494,798,400 | | 97,296,734 | | $ | 977,100,810 | |
| Shares issued in reinvestment of | | | | | | | | | | |
| distributions | 685,744 | | | 7,097,403 | | 19,020,088 | | | 189,973,012 | |
| Shares redeemed | (23,004,978 | ) | | (237,602,249 | ) | (129,935,472 | ) | | (1,282,312,373 | ) |
| Net increase (decrease) | 25,485,338 | | $ | 264,293,554 | | (13,618,650 | ) | $ | (115,238,551 | ) |
| Class B Shares: | | | | | | | | | | |
| Year ended February 29, 2012 | | | | | | | | | | |
| Shares sold | | | | | | 34,691 | | $ | 352,807 | |
| Shares issued in reinvestment of | | | | | | | | | | |
| distributions | | | | | | 83,368 | | | 838,614 | |
| Shares redeemed | | | | | | (2,301,875 | ) | | (23,190,631 | ) |
| Net increase (decrease) | | | | | | (2,183,816 | ) | $ | (21,999,210 | ) |
| Year ended February 28, 2011 | | | | | | | | | | |
| Shares sold | | | | | | 87,916 | | $ | 890,508 | |
| Shares issued in reinvestment of | | | | | | | | | | |
| distributions | | | | | | 150,334 | | | 1,518,140 | |
| Shares redeemed | | | | | | (3,614,227 | ) | | (36,439,830 | ) |
| Net increase (decrease) | | | | | | (3,375,977 | ) | $ | (34,031,182 | ) |
| Class C Shares: | | | | | | | | | | |
| Year ended February 29, 2012 | | | | | | | | | | |
| Shares sold | | | | | | 23,666,251 | | $ | 243,439,127 | |
| Shares issued in reinvestment of | | | | | | | | | | |
| distributions | | | | | | 3,774,959 | | | 38,501,123 | |
| Shares redeemed | | | | | | (16,446,490 | ) | | (166,463,889 | ) |
| Net increase (decrease) | | | | | | 10,994,720 | | $ | 115,476,361 | |
| Year ended February 28, 2011 | | | | | | | | | | |
| Shares sold | | | | | | 25,557,425 | | $ | 261,096,346 | |
| Shares issued in reinvestment of | | | | | | | | | | |
| distributions | | | | | | 3,262,596 | | | 33,020,628 | |
| Shares redeemed | | | | | | (25,514,255 | ) | | (254,166,873 | ) |
| Net increase (decrease) | | | | | | 3,305,766 | | $ | 39,950,101 | |
194 | Annual Report
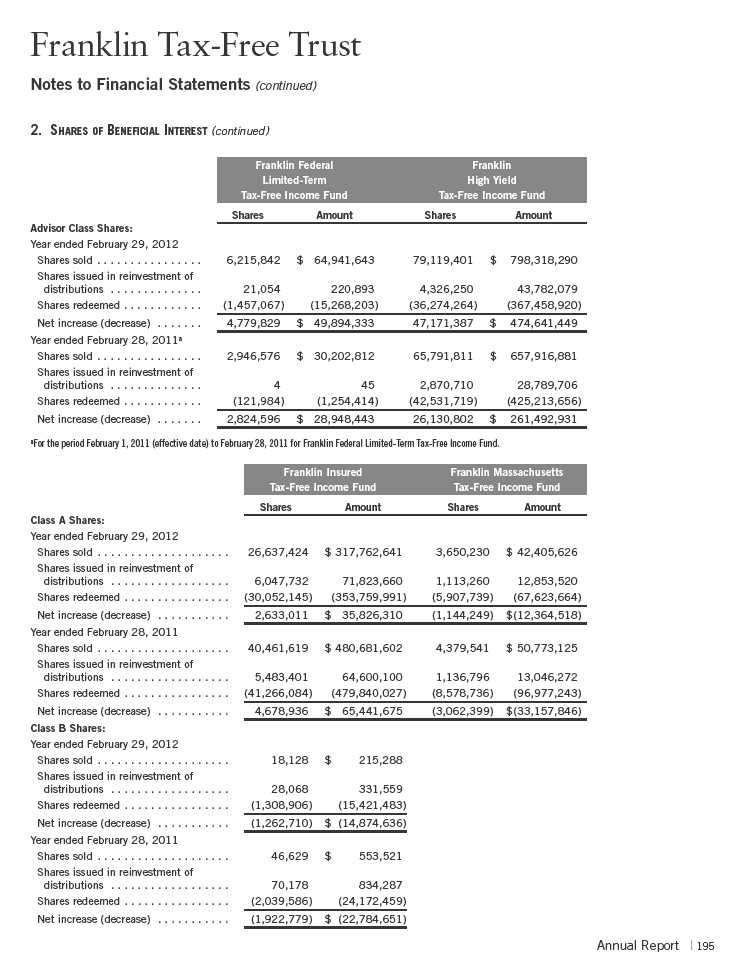

196 | Annual Report
| | | | | |
| Franklin Tax-Free Trust | | | | | |
| |
| Notes to Financial Statements (continued) | | | | | |
| |
| |
| 2. SHARES OF BENEFICIAL INTEREST (continued) | | | | | |
| |
| | Franklin New Jersey | |
| | Tax-Free Income Fund | |
| | Shares | | | Amount | |
| Class B Shares: | | | | | |
| Year ended February 29, 2012 | | | | | |
| Shares sold | 11,216 | | $ | 133,608 | |
| Shares issued in reinvestment of distributions | 26,178 | | | 313,723 | |
| Shares redeemed | (836,805 | ) | | (10,026,101 | ) |
| Net increase (decrease) | (799,411 | ) | $ | (9,578,770 | ) |
| Year ended February 28, 2011 | | | | | |
| Shares sold | 9,060 | | $ | 109,359 | |
| Shares issued in reinvestment of distributions | 57,866 | | | 698,723 | |
| Shares redeemed | (1,658,524 | ) | | (20,055,744 | ) |
| Net increase (decrease) | (1,591,598 | ) | $ | (19,247,662 | ) |
| Class C Shares: | | | | | |
| Year ended February 29, 2012 | | | | | |
| Shares sold | 3,492,449 | | $ | 42,727,315 | |
| Shares issued in reinvestment of distributions | 662,955 | | | 8,029,107 | |
| Shares redeemed | (4,644,452 | ) | | (55,621,713 | ) |
| Net increase (decrease) | (489,048 | ) | $ | (4,865,291 | ) |
| Year ended February 28, 2011 | | | | | |
| Shares sold | 6,003,031 | | $ | 73,210,281 | |
| Shares issued in reinvestment of distributions | 674,149 | | | 8,133,129 | |
| Shares redeemed | (7,012,230 | ) | | (83,065,636 | ) |
| Net increase (decrease) | (335,050 | ) | $ | (1,722,226 | ) |
| Advisor Class Shares: | | | | | |
| Year ended February 29, 2012 | | | | | |
| Shares sold | 3,794,589 | | $ | 45,048,650 | |
| Shares issued in reinvestment of distributions | 94,087 | | | 1,137,776 | |
| Shares redeemed | (1,011,249 | ) | | (12,153,524 | ) |
| Net increase (decrease) | 2,877,427 | | $ | 34,032,902 | |
| Year ended February 28, 2011 | | | | | |
| Shares sold | 1,889,953 | | $ | 22,850,704 | |
| Shares issued in reinvestment of distributions | 11,993 | | | 139,920 | |
| Shares redeemed | (843,475 | ) | | (9,915,616 | ) |
| Net increase (decrease) | 1,058,471 | | $ | 13,075,008 | |
Annual Report | 197
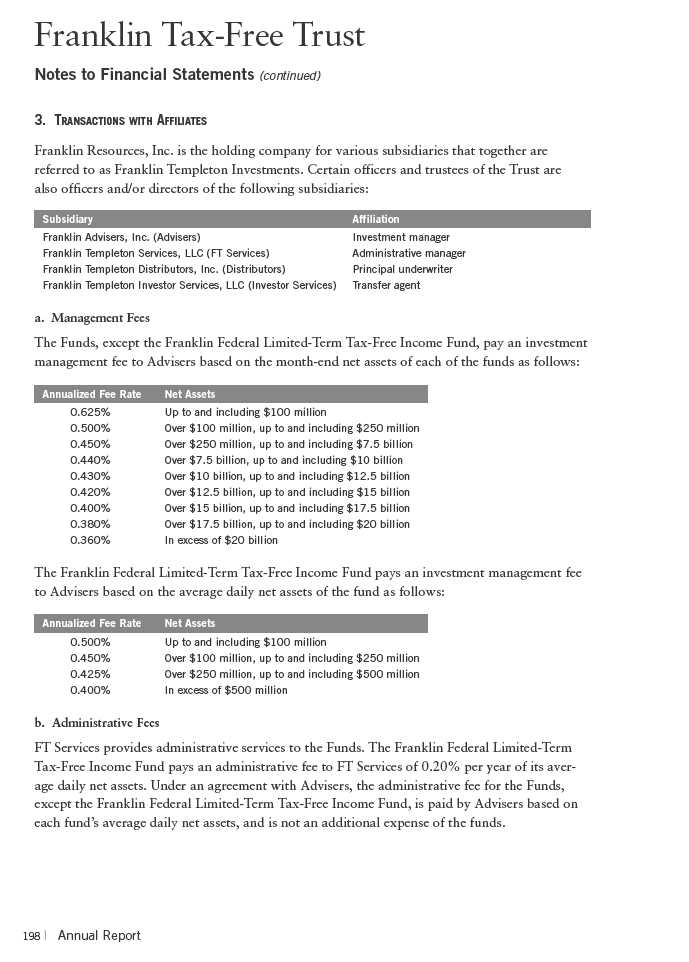
Franklin Tax-Free Trust
Notes to Financial Statements (continued)
| 3. | TRANSACTIONS WITH AFFILIATES (continued) |
| c. | Distribution Fees |
The Trust’s Board of Trustees has adopted distribution plans for each share class, with the exception of Advisor Class shares, pursuant to Rule 12b-1 under the 1940 Act. Under the Funds’ Class A reimbursement distribution plans, the Funds reimburse Distributors for costs incurred in connection with the servicing, sale and distribution of each fund’s shares up to the maximum annual plan rate. Under the Class A reimbursement distribution plans, costs exceeding the maximum for the current plan year cannot be reimbursed in subsequent periods.
In addition, under the funds’ Class B and C compensation distribution plans, the funds pay Distributors for costs incurred in connection with the servicing, sale and distribution of each fund’s shares up to the maximum annual plan rate for each class.
The maximum annual plan rates, based on the average daily net assets, for each class, are as follows:
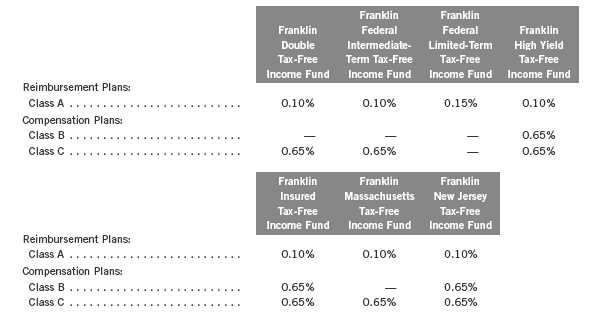
d. Sales Charges/Underwriting Agreements
Front-end sales charges and contingent deferred sales charges (CDSC) do not represent expenses of the Funds. These charges are deducted from the proceeds of sales of fund shares prior to investment or from redemption proceeds prior to remittance, as applicable. Distributors has advised
Annual Report | 199
Franklin Tax-Free Trust
Notes to Financial Statements (continued)
| 3. | TRANSACTIONS WITH AFFILIATES (continued) |
| d. | Sales Charges/Underwriting Agreements (continued) |
the Funds of the following commission transactions related to the sales and redemptions of the Funds’ shares for the year:
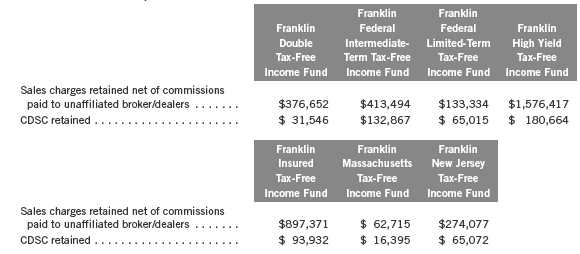
e. Transfer Agent Fees
For the year ended February 29, 2012, the Funds paid transfer agent fees as noted in the Statements of Operations of which the following amounts were retained by Investor Services:
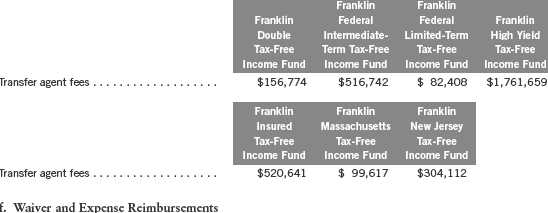
FT Services and Advisers have contractually agreed in advance to waive or limit their respective fees and to assume as their own expense certain expenses otherwise payable by the Franklin Federal Limited-Term Tax-Free Income Fund so that the common expenses (i.e. a combination of management fees, administrative fees, and other expenses, but excluding distribution fees, and acquired fund fees and expenses) for each class of the Fund do not exceed 0.45% (other than certain non-routine expenses or costs, including those relating to litigation, indemnification, reorganizations, and liquidations) until June 30, 2012. Prior to July 1, 2011, common expenses were limited to 0.35%.
200 | Annual Report
Franklin Tax-Free Trust
Notes to Financial Statements (continued)
4. INCOME TAXES
For tax purposes, capital losses may be carried over to offset future capital gains, if any. Under the Regulated Investment Company Modernization Act of 2010, capital losses incurred by the Funds in taxable years beginning after December 22, 2010 are not subject to expiration and such losses retain their character as either short-term or long-term, rather than being considered short-term as under previous law. Post-enactment capital losses must be fully utilized prior to utilizing any losses incurred in pre-enactment tax years.
At February 29, 2012, the capital loss carryforwards were as follows:
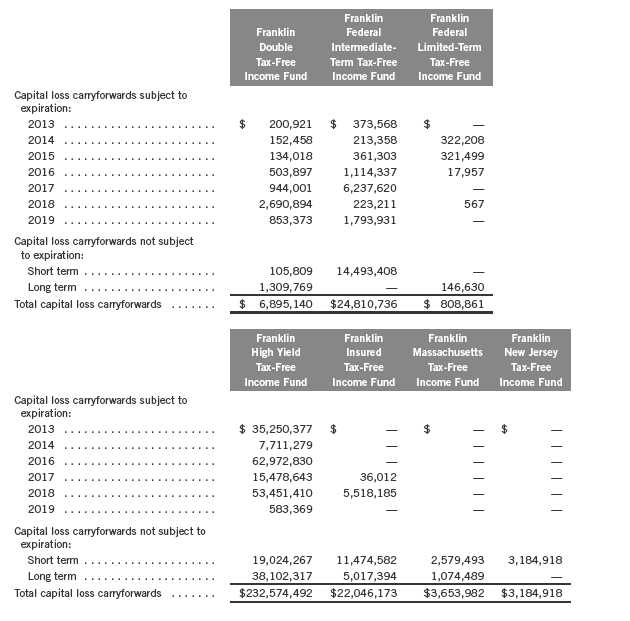
Annual Report | 201
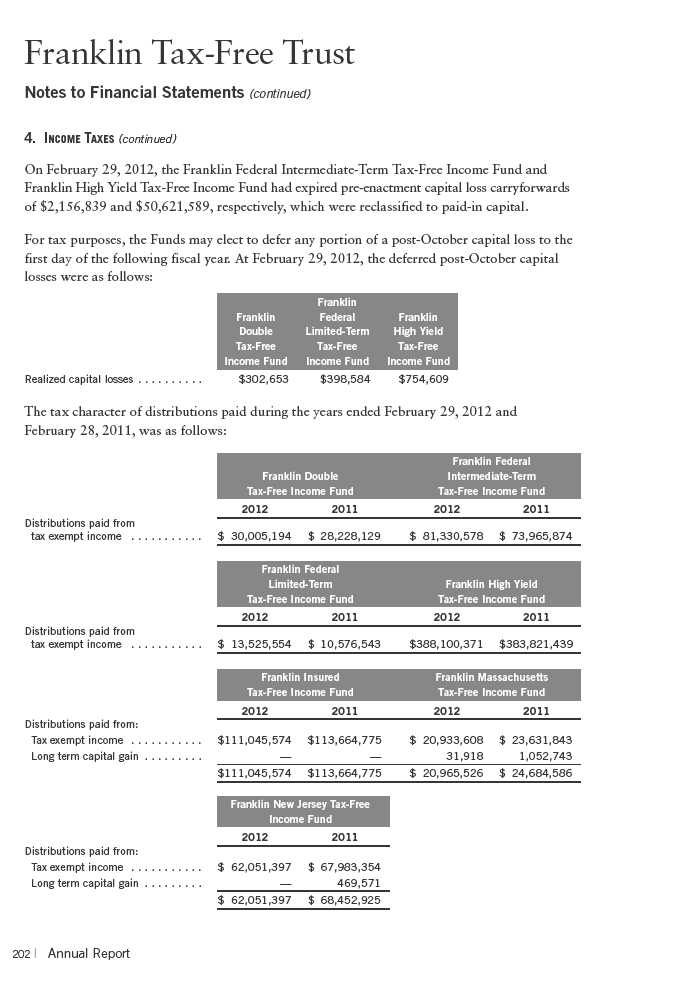
Franklin Tax-Free Trust
Notes to Financial Statements (continued)
4. INCOME TAXES (continued)
At February 29, 2012, the cost of investments, net unrealized appreciation (depreciation), and undistributed tax exempt and ordinary income for income tax purposes were as follows:
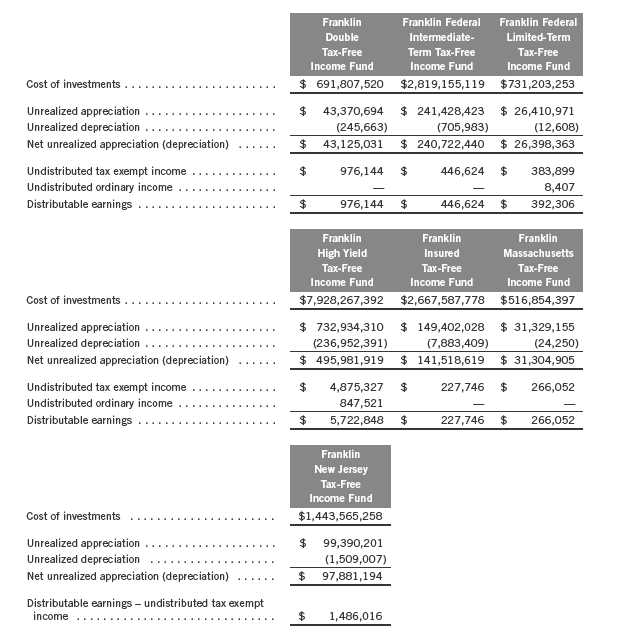
Differences between income and/or capital gains as determined on a book basis and a tax basis are primarily due to differing treatments of defaulted securities, bond discounts, and wash sales.
Annual Report | 203
Franklin Tax-Free Trust
Notes to Financial Statements (continued)
5. INVESTMENT TRANSACTIONS
Purchases and sales of investments (excluding short term securities) for the year ended February 29, 2012, were as follows:

6. CREDIT RISK AND DEFAULTED SECURITIES
At February 29, 2012, the Franklin High Yield Tax-Free Income Fund had 19.40% of its portfolio invested in high yield or other securities rated below investment grade. These securities may be more sensitive to economic conditions causing greater price volatility and are potentially subject to a greater risk of loss due to default than higher rated securities.
The Franklin High Yield Tax-Free Income Fund held defaulted securities and/or other securities for which the income has been deemed uncollectible. At February 29, 2012, the aggregate value of these securities was $75,492,950, representing 0.88% of the fund’s net assets. The fund discontinues accruing income on securities for which income has been deemed uncollectible and provides an estimate for losses on interest receivable. The securities have been identified on the accompanying Statement of Investments.
7. CONCENTRATION OF RISK
The Franklin Double Tax-Free Income Fund, Franklin Massachusetts Tax-Free Income Fund and Franklin New Jersey Tax-Free Income Fund invest a large percentage of their total assets in obligations of issuers within their respective state and U.S. territories. Such concentration may subject the funds to risks associated with industrial or regional matters, and economic, political or legal developments occurring within those states and U.S. territories. In addition, investments in these securities are sensitive to interest rate changes and credit risk of the issuer and may subject the funds to increased market volatility. The market for these investments may be limited, which may make them difficult to buy or sell.
204 | Annual Report
Franklin Tax-Free Trust
Notes to Financial Statements (continued)
8. CREDIT FACILITY
The Funds, together with other U.S. registered and foreign investment funds (collectively, Borrowers), managed by Franklin Templeton Investments, are borrowers in a joint syndicated senior unsecured credit facility totaling $1.5 billion (Global Credit Facility) which matures on January 18, 2013. This Global Credit Facility provides a source of funds to the Borrowers for temporary and emergency purposes, including the ability to meet future unanticipated or unusually large redemption requests.
Under the terms of the Global Credit Facility, the Funds shall, in addition to interest charged on any borrowings made by the Funds and other costs incurred by the Funds, pay their share of fees and expenses incurred in connection with the implementation and maintenance of the Global Credit Facility, based upon their relative share of the aggregate net assets of all of the Borrowers, including an annual commitment fee of 0.08% based upon the unused portion of the Global Credit Facility, which is reflected in other expenses on the Statements of Operations. During the year ended February 29, 2012, the Funds did not use the Global Credit Facility.
9. FAIR VALUE MEASUREMENTS
The Funds follow a fair value hierarchy that distinguishes between market data obtained from independent sources (observable inputs) and the Funds’ own market assumptions (unobservable inputs). These inputs are used in determining the value of the Funds’ investments and are summarized in the following fair value hierarchy:
- Level 1 – quoted prices in active markets for identical securities
- Level 2 – other significant observable inputs (including quoted prices for similar securities, interest rates, prepayment speed, credit risk, etc.)
- Level 3 – significant unobservable inputs (including the Funds’ own assumptions in determining the fair value of investments)
The inputs or methodology used for valuing securities are not an indication of the risk associated with investing in those securities.
For movements between the levels within the fair value hierarchy, the Funds have adopted a policy of recognizing the transfers as of the date of the underlying event which caused the movement.
At February 29, 2012, all of the Funds’ investments in securities carried at fair value were valued using Level 2 inputs.
10. NEW ACCOUNTING PRONOUNCEMENTS
In May 2011, the Financial Accounting Standards Board (FASB) issued Accounting Standards Update (ASU) No. 2011-04, Fair Value Measurement (Topic 820): Amendments to Achieve Common Fair Value Measurement and Disclosure Requirements in U.S. GAAP and IFRSs. The
Annual Report | 205
Franklin Tax-Free Trust
Notes to Financial Statements (continued)
10. NEW ACCOUNTING PRONOUNCEMENTS (continued)
amendments in the ASU will improve the comparability of fair value measurements presented and disclosed in financial statements prepared in accordance with U.S. GAAP (Generally Accepted Accounting Principles) and IFRS (International Financial Reporting Standards) and include new guidance for certain fair value measurement principles and disclosure requirements. The ASU is effective for interim and annual periods beginning after December 15, 2011. The Funds believe the adoption of this ASU will not have a material impact on their financial statements.
11. SUBSEQUENT EVENTS
The Funds have evaluated subsequent events through the issuance of the financial statements and determined that no events have occurred that require disclosure.
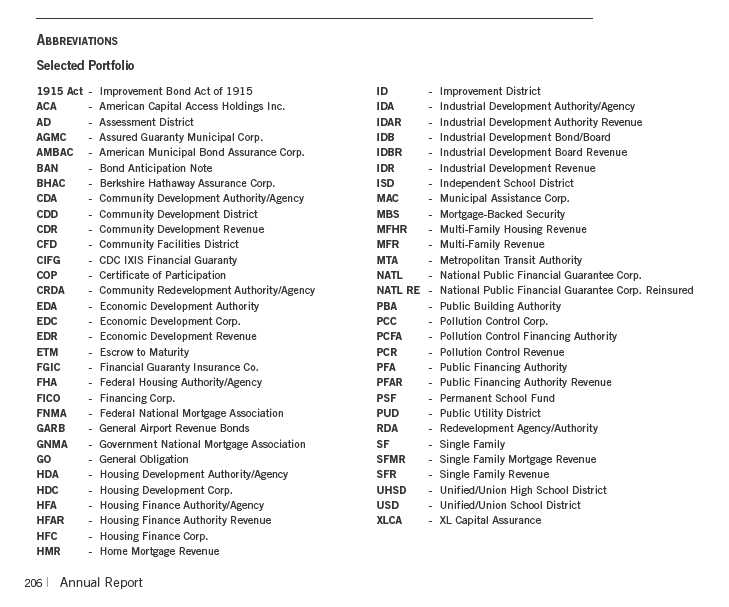
Franklin Tax-Free Trust
Report of Independent Registered Public Accounting Firm
To the Board of Trustees and Shareholders of Franklin Tax-Free Trust
In our opinion, the accompanying statements of assets and liabilities, including the statements of investments, and the related statements of operations and of changes in net assets and the financial highlights present fairly, in all material respects, the financial position of Franklin Double Tax-Free Income Fund, Franklin Federal Intermediate-Term Tax-Free Income Fund, Franklin Federal Limited-Term Tax-Free Income Fund, Franklin High Yield Tax-Free Income Fund, Franklin Insured Tax-Free Income Fund, Franklin Massachusetts Tax-Free Income Fund and Franklin New Jersey Tax-Free Income Fund (separate portfolios of Franklin Tax-Free Trust, hereafter referred to as the “Funds”) at February 29, 2012, the results of each of their operations for the year then ended, the changes in each of their net assets for each of the two years in the period then ended and the financial highlights for each of the periods presented, in conformity with accounting principles generally accepted in the United States of America. These financial statements and financial highlights (hereafter referred to as “financial statements”) are the responsibility of the Funds’ management. Our responsibility is to express an opinion on these financial statements based on our audits. We conducted our audits of these financial statements in accordance with the standards of the Public Company Accounting Oversight Board (United States). Those standards require that we plan and perform the audit to obtain reasonable assurance about whether the financial statements are free of material misstatement. An audit includes examining, on a test basis, evidence supporting the amounts and disclosures in the financial statements, assessing the accounting principles used and significant estimates made by management, and evaluating the overall financial statement presentation. We believe that our audits, which included confirmation of securities at February 29, 2012 by correspondence with the custodian and brokers, provide a reasonable basis for our opinion.
PricewaterhouseCoopers LLP
San Francisco, California
April 16, 2012
Annual Report | 207
Franklin Tax-Free Trust
Tax Information (unaudited)
Under Section 852(b)(5)(A) of the Internal Revenue Code (Code), the Funds hereby report 100% of the distributions paid from net investment income as exempt-interest dividends for the fiscal year ended February 29, 2012. A portion of the Funds’ exempt-interest dividends may be subject to the federal alternative minimum tax. By mid-February 2013, shareholders will be notified of amounts for use in preparing their 2012 income tax returns.
Under Section 852(b)(3)(C) of the Code, the Franklin Massachusetts Tax-Free Income Fund hereby reports the maximum amount allowable but no less than $28,553 as a long term capital gain dividend for the fiscal year ended February 29, 2012.
208 | Annual Report
Franklin Tax-Free Trust
Board Members and Officers
The name, year of birth and address of the officers and board members, as well as their affiliations, positions held with the Fund, principal occupations during at least the past five years and number of portfolios overseen in the Franklin Templeton Investments fund complex are shown below. Generally, each board member serves until that person’s successor is elected and qualified.
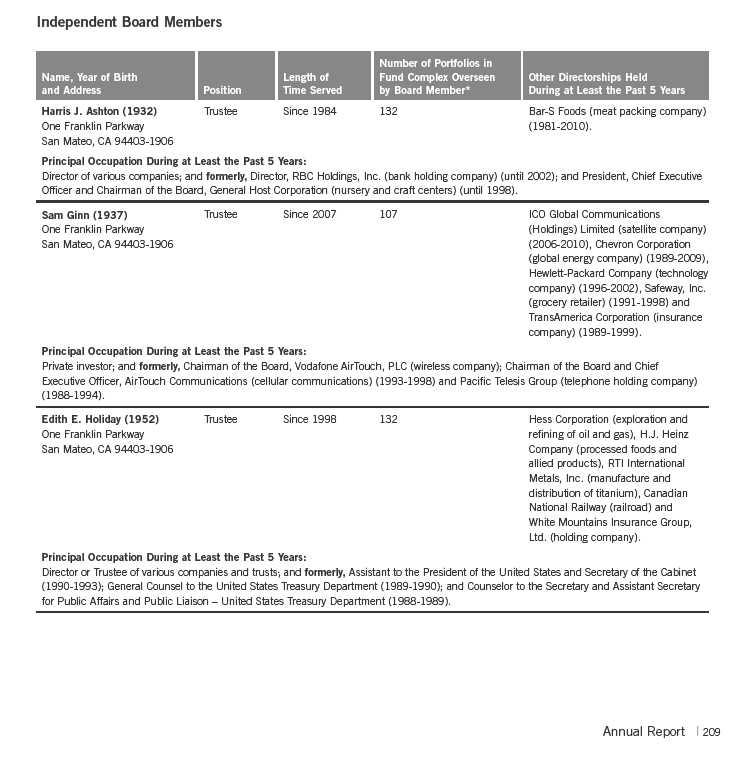
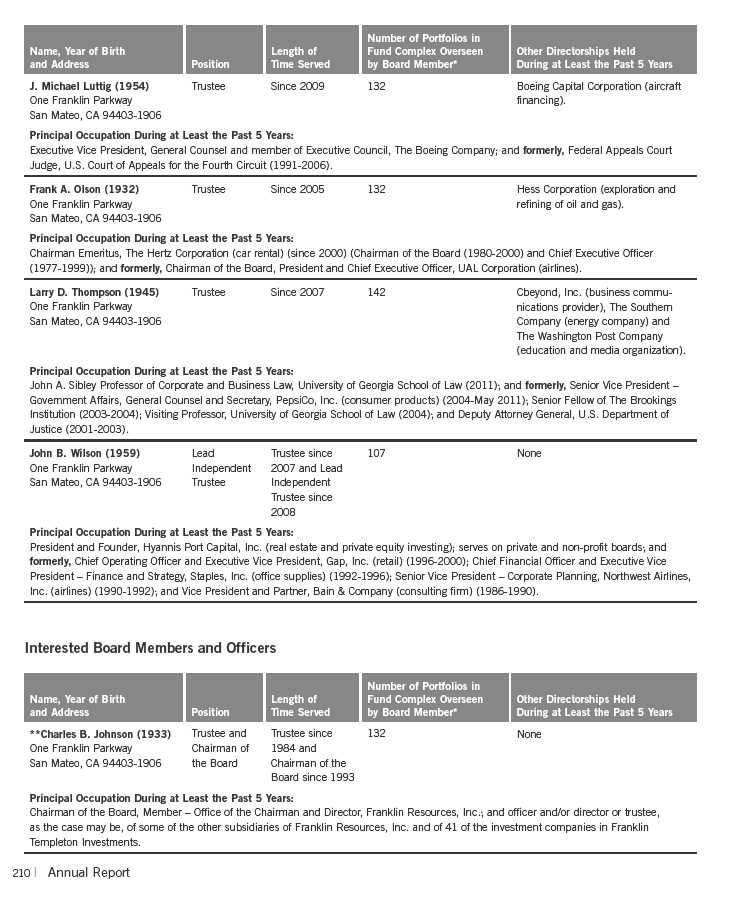
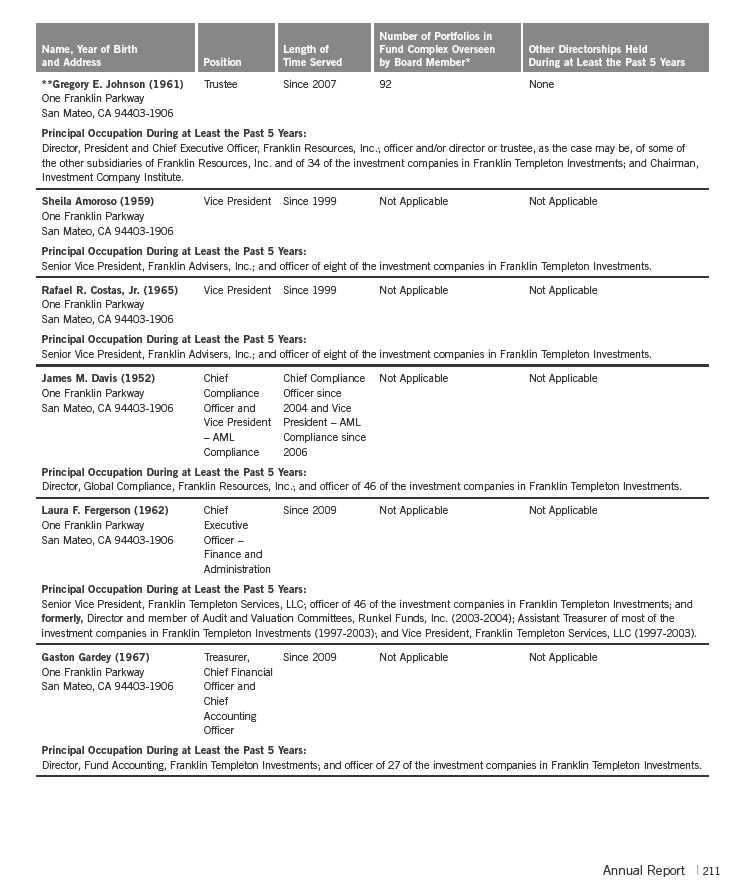
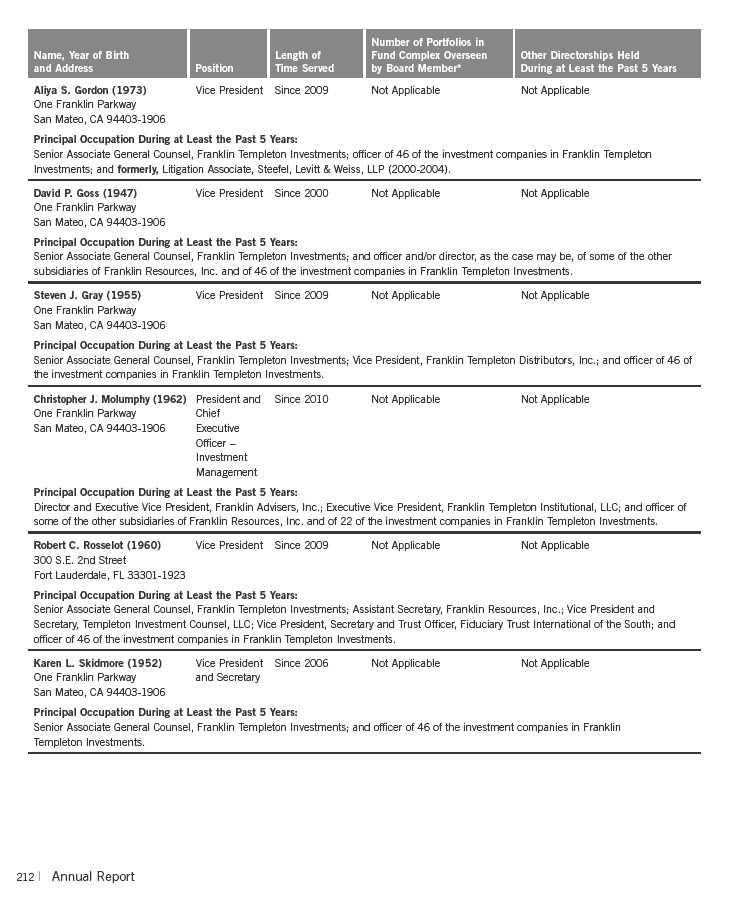
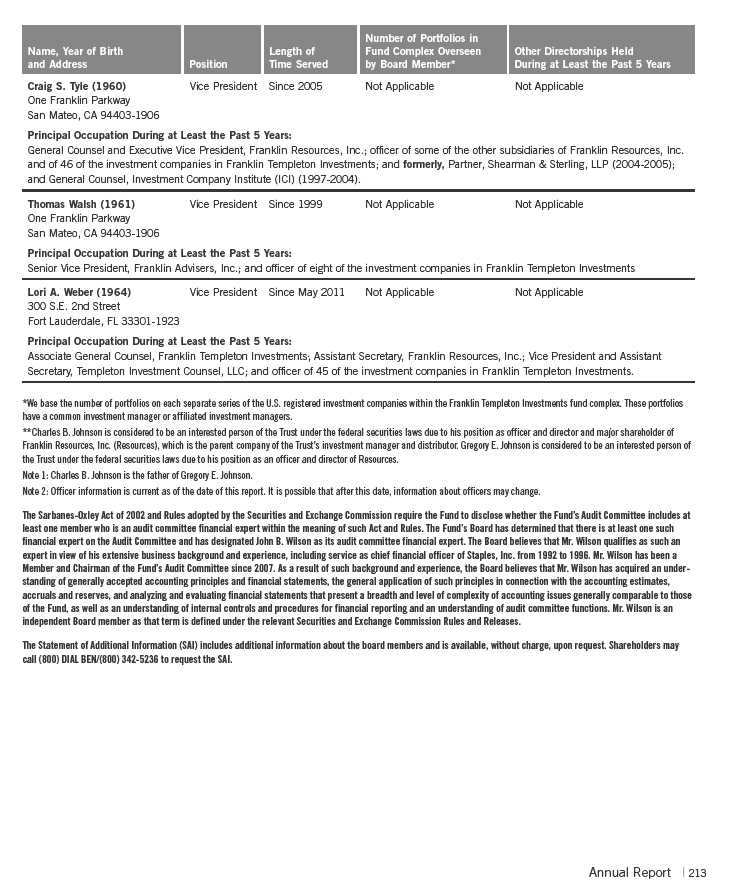
Franklin Tax-Free Trust
Shareholder Information
Board Review of Investment Management Agreement
At a meeting held February 28, 2012, the Board of Trustees (Board), including a majority of non-interested or independent Trustees, approved renewal of the investment management agreement for each of the separate tax-exempt funds within the Trust (Fund(s)). In reaching this decision, the Board took into account information furnished throughout the year at regular Board meetings, as well as information prepared specifically in connection with the annual renewal review process. Information furnished and discussed throughout the year included investment performance reports and related financial information for each Fund, as well as periodic reports on expenses, shareholder services, legal and compliance matters, pricing, and other services provided by the Investment Manager (Manager) and its affiliates. Information furnished specifically in connection with the renewal process included a report for each Fund prepared by Lipper, Inc. (Lipper), an independent organization, as well as additional material, including a Fund profitability analysis prepared by management. The Lipper reports compared each Fund’s investment performance and expenses with those of other mutual funds deemed comparable to the Fund as selected by Lipper. The Fund profitability analysis discussed the profitability to Franklin Templeton Investments from its overall U.S. fund operations, as well as on an individual fund-by-fund basis. Additional material accompanying such profitability analysis included information on a fund-by-fund basis listing portfolio managers and other accounts they manage, as well as information on management fees charged by the Manager and its affiliates to U.S. mutual funds and other accounts, including management’s explanation of differences where relevant. Such material also included a memorandum prepared by management describing project initiatives and capital investments relating to the services provided to the Funds by the Franklin Templeton Investments organization, as well as a memorandum relating to economies of scale and an analysis concerning transfer agent fees charged by an affiliate of the Manager.
In considering such materials, the independent Trustees received assistance and advice from and met separately with independent counsel. While the investment management agreements for all Funds were considered at the same Board meeting, the Board dealt with each Fund separately. In approving continuance of the investment management agreement for each Fund, the Board, including a majority of independent Trustees, determined that the existing management fee structure was fair and reasonable and that continuance of the investment management agreement was in the best interests of each Fund and its shareholders. While attention was given to all information furnished, the following discusses some primary factors relevant to the Board’s decision.
NATURE, EXTENT AND QUALITY OF SERVICES. The Board was satisfied with the nature and quality of the overall services provided by the Manager and its affiliates to the Funds and their shareholders. In addition to investment performance and expenses discussed later, the Board’s opinion was based, in part, upon periodic reports furnished it showing that the investment policies and restrictions for each Fund were consistently complied with as well as other reports periodically furnished the Board covering matters such as the compliance of portfolio managers and other management personnel with the code of ethics adopted throughout the Franklin Templeton fund complex, the adherence to fair value pricing procedures established by the Board, and the accuracy of net asset value calculations. The Board also noted the extent of benefits provided Fund shareholders
214 | Annual Report
Franklin Tax-Free Trust
Shareholder Information (continued)
Board Review of Investment Management Agreement (continued)
from being part of the Franklin Templeton family of funds, including the right to exchange investments between the same class of funds without a sales charge, the ability to reinvest Fund dividends into other funds and the right to combine holdings in other funds to obtain a reduced sales charge. Favorable consideration was given to management’s continuous efforts and expenditures in establishing back-up systems and recovery procedures to function in the event of a natural disaster, it being noted that such systems and procedures had functioned smoothly during the Florida hurricanes and blackouts experienced in previous years. Consideration was also given to the experience of each Fund’s portfolio management team, the number of accounts managed and general method of compensation. In this latter respect, the Board noted that a primary factor in management’s determination of a portfolio manager’s bonus compensation was the relative investment performance of the funds he or she managed and that a portion of such bonus was required to be invested in a predesignated list of funds within such person’s fund management area so as to be aligned with the interests of shareholders. The Board also took into account the quality of transfer agent and shareholder services provided Fund shareholders by an affiliate of the Manager and the continuous enhancements to the Franklin Templeton website. Particular attention was given to management’s conservative approach and diligent risk management procedures, including continuous monitoring of counterparty credit risk and attention given to derivatives and other complex instruments. The Board also took into account, among other things, management’s efforts in establishing a global credit facility for the benefit of the Funds and other accounts managed by Franklin Templeton Investments to provide a source of cash for temporary and emergency purposes or to meet unusual redemption requests as well as the strong financial position of the Manager’s parent company and its commitment to the mutual fund business as evidenced by its subsidization of money market funds.
INVESTMENT PERFORMANCE. The Board placed significant emphasis on the investment performance of each Fund in view of its importance to shareholders. While consideration was given to performance reports and discussions with portfolio managers at Board meetings throughout the year, particular attention in assessing performance was given to the Lipper reports furnished for the agreement renewals. The Lipper reports prepared for each individual Fund showed its investment performance or that of its Class A shares for a Fund having multiple share classes in comparison to a performance universe selected by Lipper. Comparative performance for each Fund was shown for the one-year period ended December 31, 2011, and for additional periods ended that date up to 10 years depending on when a particular Fund commenced operations. Investment performance was shown on an income return basis, as well as a total return basis for each Fund. Except as mentioned below, the Lipper reports showed both the income and total return of each Fund to be above the median of its Lipper performance universe during 2011, with most being in the highest or second-highest performing quintile of such universe during such year, as well as for most of the applicable previous three-, five- and 10-year periods on an annualized basis. The Board was satisfied with the relative performance of these Funds as shown in the Lipper report. The Lipper report showed the income return for Franklin High Yield Tax-Free Income Fund to be below the median of its Lipper performance universe for 2011 and for the previous three-year period on an annualized
Annual Report | 215
Franklin Tax-Free Trust
Shareholder Information (continued)
Board Review of Investment Management Agreement (continued)
basis, but to be above the median and in the second-highest performing quintile of such universe during the previous five- and 10-year periods, respectively, on an annualized basis. The Lipper report showed the total return of Franklin High Yield Tax-Free Income Fund during 2011 to be in the highest performing quintile of its performance universe, and on an annualized basis to also be in the highest performing quintile during the previous five- and 10-year periods and above the median of such universe for the previous three-year period. The Board believed the overall performance of this Fund to be acceptable, noting that its income return during 2011 and the previous three-year annualized period were in each case within 13 basis points of the performance universe median.
COMPARATIVE EXPENSES. Consideration was given to the management fee and total expense ratios of each Fund in comparison with those of a group of funds selected by Lipper as its appropriate Lipper expense group. Lipper expense data is based upon information taken from each fund’s most recent annual report, which reflects historical asset levels that may be quite different from those currently existing, particularly in a period of market volatility. While recognizing such inherent limitation and the fact that expense ratios generally increase as assets decline and decrease as assets grow, the Board believed the independent analysis conducted by Lipper to be an appropriate measure of comparative expenses. In reviewing comparative costs, Lipper provides information on each Fund’s contractual investment management fee in comparison with the contractual investment management fee that would have been charged by other funds within its Lipper expense group assuming they were similar in size to the Fund, as well as the actual total expenses of the Fund in comparison with those of its Lipper expense group. The Lipper contractual investment management fee analysis includes an administrative charge as being part of the investment management fee, and total expenses, for comparative consistency, are shown by Lipper for Fund Class A shares for Funds having multiple share classes. The Lipper reports showed that the contractual investment management fee rates for each Fund were at or below the median of their respective Lipper expense groups, with the exception of Franklin New Jersey Tax-Free Income Fund and Franklin Federal Intermediate-Term Tax-Free Income Fund, whose fee rates in each case were within one-and-a-half basis points of their respective expense group medians. The contractual investment management fee rate for Franklin Federal Limited-Term Tax-Free Income Fund was also above its Lipper expense group median, but its actual management fee rate paid was below its expense group median as a result of fee waivers. The Lipper reports further showed that the actual total expense ratios for all Funds were in the least expensive quintiles of their respective Lipper expense groups, except for Franklin Intermediate-Term Tax-Free Income Fund whose total expense ratio was in the second least expensive quintile of its Lipper expense group. Based on the above, the Board was satisfied with the investment management fee and total expense ratios of each Fund in comparison to its Lipper expense group as shown in the Lipper reports.
MANAGEMENT PROFITABILITY. The Board also considered the level of profits realized by the Manager and its affiliates in connection with the operation of each Fund. In this respect, the Board reviewed the Fund profitability analysis that addresses the overall profitability of Franklin Templeton’s U.S. fund business, as well as its profits in providing management and other services to each of the individual funds during the 12-month period ended September 30, 2011, being the
216 | Annual Report
Franklin Tax-Free Trust
Shareholder Information (continued)
Board Review of Investment Management Agreement (continued)
most recent fiscal year-end for Franklin Resources, Inc., the Manager’s parent. In reviewing the analysis, attention was given to the methodology followed in allocating costs to each Fund, it being recognized that allocation methodologies are inherently subjective and various allocation methodologies may each be reasonable while producing different results. In this respect, the Board noted that while being continuously refined and reflecting changes in the Manager’s own cost accounting, such allocation methodology was consistent with that followed in profitability report presentations for the Funds made in prior years and that the Funds’ independent registered public accounting firm had been engaged by the Manager to review the reasonableness of the allocation methodologies solely for use by the Funds’ Board in reference to the profitability analysis. In reviewing and discussing such analysis, management discussed with the Board its belief that costs incurred in establishing the infrastructure necessary for the type of mutual fund operations conducted by the Manager and its affiliates may not be fully reflected in the expenses allocated to each Fund in determining its profitability, as well as the fact that the level of profits, to a certain extent, reflected operational cost savings and efficiencies initiated by management. The Board also took into account management’s expenditures in improving shareholder services provided the Funds, as well as the need to implement systems and meet additional regulatory and compliance requirements resulting from statutes such as the Sarbanes-Oxley and Dodd-Frank Acts and recent SEC and other regulatory requirements. In addition, the Board considered a third-party study comparing the profitability of the Manager’s parent on an overall basis to other publicly held managers broken down to show profitability from management operations exclusive of distribution expenses, as well as profitability including distribution expenses. The Board also considered the extent to which the Manager and its affiliates might derive ancillary benefits from fund operations, including revenues generated from transfer agent services. Based upon its consideration of all these factors, the Board determined that the level of profits realized by the Manager and its affiliates from providing services to each Fund was not excessive in view of the nature, quality and extent of services provided.
ECONOMIES OF SCALE. The Board also considered whether economies of scale are realized by the Manager as the Funds grow larger and the extent to which this is reflected in the level of management fees charged. While recognizing any precise determination is inherently subjective, the Board noted that based upon the Fund profitability analysis, it appears that as some Funds get larger, at some point economies of scale do result in the Manager realizing a larger profit margin on management services provided such Fund. The Board also noted that any economies of scale are shared with each of these Funds and their shareholders through management fee breakpoints existing in each of the Funds’ investment management agreements, so that as a Fund grows in size, its effective management fee rate declines. The fee structure under the investment management agreement with Franklin Federal Limited-Term Tax-Free Income Fund provides an initial fee of 0.70% on the first $100 million of assets, 0.65% on the next $150 million of assets, 0.625% on the next $250 million of assets, and 0.60% on assets in excess of $500 million. While the assets of such Fund at December 31, 2011, amounted to $743 million, its expenses continued to be subsidized through management fee waivers. The fee structure under the investment management agreement with each other Fund provides an initial fee of 0.625% on the first $100 million of assets, 0.5% on the next $150 million of assets, 0.45% on assets in excess of $250 million, with
Annual Report | 217
Franklin Tax-Free Trust
Shareholder Information (continued)
Board Review of Investment Management Agreement (continued)
additional breakpoints beginning at 0.44% on assets in excess of $7.5 billion, 0.43% on assets in excess of $10 billion and continuing thereafter until reaching a final breakpoint of 0.36% on assets in excess of $20 billion. In reviewing such structure, management stated its belief that this fee structure reaches a relatively low rate quickly as a Fund grows and that such low rate, in effect, reflects anticipated economies of scale as a Fund’s assets increase. In support of such position, management pointed out the favorable effective management fee and total expense comparisons for each Fund within its Lipper expense group as previously discussed under “Comparative Expenses.” The Board noted that at December 31, 2011, none of these Funds had assets in excess of $10 billion and believed that to the extent economies of scale may be realized by the Manager and its affiliates, the schedule of fees under the investment management agreement for each Fund provides a sharing of benefits with the Fund and its shareholders.
Proxy Voting Policies and Procedures
The Trust’s investment manager has established Proxy Voting Policies and Procedures (Policies) that the Trust uses to determine how to vote proxies relating to portfolio securities. Shareholders may view the Trust’s complete Policies online at franklintempleton.com. Alternatively, shareholders may request copies of the Policies free of charge by calling the Proxy Group collect at (954) 527-7678 or by sending a written request to: Franklin Templeton Companies, LLC, 300 S.E. 2nd Street, Fort Lauderdale, FL 33301, Attention: Proxy Group. Copies of the Trust’s proxy voting records are also made available online at franklintempleton.com and posted on the U.S. Securities and Exchange Commission’s website at sec.gov and reflect the most recent 12-month period ended June 30.
Quarterly Statement of Investments
The Trust files a complete statement of investments with the U.S. Securities and Exchange Commission for the first and third quarters for each fiscal year on Form NQ. Shareholders may view the filed Form NQ by visiting the Commission’s website at sec.gov. The filed form may also be viewed and copied at the Commission’s Public Reference Room in Washington, DC. Information regarding the operations of the Public Reference Room may be obtained by calling (800) SEC-0330.
Householding of Reports and Prospectuses
You will receive each Fund’s financial reports every six months as well as an annual updated summary prospectus (prospectus available upon request). To reduce Fund expenses, we try to identify related shareholders in a household and send only one copy of the financial reports and summary prospectus. This process, called “householding,” will continue indefinitely unless you instruct us otherwise. If you prefer not to have these documents householded, please call us at (800) 632-2301. At any time you may view current prospectuses/summary prospectuses and financial reports on our website. If you choose, you may receive these documents through electronic delivery.
218 | Annual Report

Item 2. Code of Ethics.
(a) The Registrant has adopted a code of ethics that applies to its principal executive officers and principal financial and accounting officer.
(c) N/A
(d) N/A
(f) Pursuant to Item 12(a)(1), the Registrant is attaching as an exhibit a copy of its code of ethics that applies to its principal executive officers and principal financial and accounting officer.
Item 3. Audit Committee Financial Expert.
(a)(1) The Registrant has an audit committee financial expert serving on its audit committee.
(2) The audit committee financial expert is John B. Wilson, and he is "independent" as defined under the relevant Securities and Exchange Commission Rules and Releases.
Item 4. Principal Account Fees and Services.
(a) Audit Fees
The aggregate fees paid to the principal accountant for professional services rendered by the principal accountant for the audit of the registrant’s annual financial statements or for services that are normally provided by the principal accountant in connection with statutory and regulatory filings or engagements were $789,951 for the fiscal year ended February 29, 2012 and $814,407 for the fiscal year ended February 28, 2011.
(b) Audit-Related Fees
There were no fees paid to the principal accountant for assurance and related services rendered by the principal accountant to the registrant that are reasonably related to the performance of the audit of the registrant's financial statements and are not reported under paragraph (a) of Item 4.
There were no fees paid to the principal accountant for assurance and related services rendered by the principal accountant to the registrant's investment adviser and any entity controlling, controlled by or under common control with the investment adviser that provides ongoing services to the registrant that are reasonably related to the performance of the audit of their financial statements.
(c) Tax Fees
There were no fees paid to the principal accountant for professional services rendered by the principal accountant to the registrant for tax compliance, tax advice and tax planning.
The aggregate fees paid to the principal accountant for professional services rendered by the principal accountant to the registrant’s
investment adviser and any entity controlling, controlled by or under common control with the investment adviser that provides ongoing services to the registrant for tax compliance, tax advice and tax planning were $75,000 for the fiscal year ended February 29, 2012 and $60,000 for the fiscal year ended February 28, 2011. The services for which these fees were paid included technical tax consultation for capital gain tax reporting to foreign governments, application of local country tax laws to investments and licensing securities with local country offices.
(d) All Other Fees
The aggregate fees paid to the principal accountant for products and services rendered by the principal accountant to the registrant not reported in paragraphs (a)-(c) of Item 4 were $0 for the fiscal year ended February 29, 2012 and $12,442 for the fiscal year ended February 28, 2011. The services for which these fees were paid included review of materials provided to the fund Board in connection with the investment management contract renewal process.
The aggregate fees paid to the principal accountant for products and services rendered by the principal accountant to the registrant’s investment adviser and any entity controlling, controlled by or under common control with the investment adviser that provides ongoing services to the registrant other than services reported in paragraphs (a)-(c) of Item 4 were $0 for the fiscal year ended February 29, 2012 and $132,358 for the fiscal year ended February 28, 2011. The services for which these fees were paid included review of materials provided to the fund Board in connection with the investment management contract renewal process.
(e) (1) The registrant’s audit committee is directly responsible for approving the services to be provided by the auditors, including:
(i) pre-approval of all audit and audit related services;
(ii) pre-approval of all non-audit related services to be provided to the Fund by the auditors;
(iii) pre-approval of all non-audit related services to be provided to the registrant by the auditors to the registrant’s investment adviser or to any entity that controls, is controlled by or is under common control with the registrant’s investment adviser and that provides ongoing services to the registrant where the non-audit services relate directly to the operations or financial reporting of the registrant; and
(iv) establishment by the audit committee, if deemed necessary or appropriate, as an alternative to committee pre-approval of services to be provided by the auditors, as required by paragraphs (ii) and (iii) above, of policies and procedures to permit such services to be pre-approved by other means, such as through establishment of guidelines or by action of a designated member or members of the committee; provided the policies and procedures are detailed as to the particular service and the committee is informed of each service and such policies and procedures do not include delegation of audit committee responsibilities, as contemplated under the Securities Exchange Act of 1934, to management; subject, in the case of (ii)
through (iv), to any waivers, exceptions or exemptions that may be available under applicable law or rules.
(e) (2) None of the services provided to the registrant described in paragraphs (b)-(d) of Item 4 were approved by the audit committee pursuant to paragraph (c)(7)(i)(C) of Rule 2-01 of regulation S-X.
(f) No disclosures are required by this Item 4(f).
(g) The aggregate non-audit fees paid to the principal accountant for services rendered by the principal accountant to the registrant and the registrant’s investment adviser and any entity controlling, controlled by or under common control with the investment adviser that provides ongoing services to the registrant were $75,000 for the fiscal year ended February 29, 2012 and $204,800 for the fiscal year ended February 28, 2011.
(h) The registrant’s audit committee of the board has considered whether the provision of non-audit services that were rendered to the registrant’s investment adviser (not including any sub-adviser whose role is primarily portfolio management and is subcontracted with or overseen by another investment adviser), and any entity controlling, controlled by, or under common control with the investment adviser that provides ongoing services to the registrant that were not pre-approved pursuant to paragraph (c)(7)(ii) of Rule 2-01 of Regulation S-X is compatible with maintaining the principal accountant’s independence.
Item 5. Audit Committee of Listed Registrants. N/A
Item 6. Schedule of Investments. N/A
Item 7. Disclosure of Proxy Voting Policies and Procedures for Closed-End Management Investment Companies. N/A
Item 8. Portfolio Managers of Closed-End Management Investment Companies. N/A
Item 9. Purchases of Equity Securities by Closed-End Management Investment Company and Affiliated Purchasers. N/A
Item 10. Submission of Matters to a Vote of Security Holders.
There have been no changes to the procedures by which shareholders may recommend nominees to the Registrant's Board of Trustees that would require disclosure herein.
Item 11. Controls and Procedures.
(a) Evaluation of Disclosure Controls and Procedures. The Registrant maintains disclosure controls and procedures that are designed to
ensure that information required to be disclosed in the Registrant’s filings under the Securities Exchange Act of 1934 and the Investment Company Act of 1940 is recorded, processed, summarized and reported within the periods specified in the rules and forms of the Securities and Exchange Commission. Such information is accumulated and communicated to the Registrant’s management, including its principal executive officer and principal financial officer, as appropriate, to allow timely decisions regarding required disclosure. The Registrant’s management, including the principal executive officer and the principal financial officer, recognizes that any set of controls and procedures, no matter how well designed and operated, can provide only reasonable assurance of achieving the desired control objectives.
Within 90 days prior to the filing date of this Shareholder Report on Form N-CSR, the Registrant had carried out an evaluation, under the supervision and with the participation of the Registrant’s management, including the Registrant’s principal executive officer and the Registrant’s principal financial officer, of the effectiveness of the design and operation of the Registrant’s disclosure controls and procedures. Based on such evaluation, the Registrant’s principal executive officer and principal financial officer concluded that the Registrant’s disclosure controls and procedures are effective.
(b) Changes in Internal Controls. There have been no significant changes in the Registrant’s internal controls or in other factors that could significantly affect the internal controls subsequent to the date of their evaluation in connection with the preparation of this Shareholder Report on Form N-CSR.
Item 12. Exhibits.
(a)(1) Code of Ethics
(a)(2) Certifications pursuant to Section 302 of the Sarbanes-Oxley Act of 2002 of Laura F. Fergerson, Chief Executive Officer - Finance and Administration, and Gaston Gardey, Chief Financial Officer and Chief Accounting Officer
(b) Certifications pursuant to Section 906 of the Sarbanes-Oxley Act of 2002 of Laura F. Fergerson, Chief Executive Officer - Finance and Administration, and Gaston Gardey, Chief Financial Officer and Chief Accounting Officer
SIGNATURES
Pursuant to the requirements of the Securities Exchange Act of 1934 and the Investment Company Act of 1940, the registrant has duly caused this report to be signed on its behalf by the undersigned, thereunto duly authorized.
FRANKLIN TAX-FREE TRUST
By /s/LAURA F. FERGERSON
Laura F. Fergerson
5
Chief Executive Officer –
Finance and Administration
Date April 26, 2012
Pursuant to the requirements of the Securities Exchange Act of 1934 and the Investment Company Act of 1940, this report has been signed below by the following persons on behalf of the registrant and in the capacities and on the dates indicated.
By /s/LAURA F. FERGERSON
Laura F. Fergerson
Chief Executive Officer –
Finance and Administration
Date April 26, 2012
By /s/GASTON GARDY
Gaston Gardey
Chief Financial Officer and
Chief Accounting Officer
Date April 26, 2012
6