| |
| UNITED STATES | |
| SECURITIES AND EXCHANGE COMMISSION | |
| Washington, D.C. 20549 | |
| FORM N-CSR | |
| CERTIFIED SHAREHOLDER REPORT OF REGISTERED MANAGEMENT INVESTMENT |
| COMPANIES | |
| Investment Company Act file number_811-04149 | |
| _Franklin Tax-Free Trust | |
| (Exact name of registrant as specified in charter) |
| _One Franklin Parkway, San Mateo, CA 94403-1906 |
| (Address of principal executive offices) | (Zip code) |
| _Craig S. Tyle, One Franklin Parkway, San Mateo, CA | 94403-1906 |
| (Name and address of agent for service) | |
| Registrant's telephone number, including area code:_(650) 312-2000 |
| Date of fiscal year end:_2/28 | |
| Date of reporting period: _2/28/11 | |
| Item 1. Reports to Stockholders. | |

| | | | | | | |
| | Contents | | | | | |
| Shareholder Letter | 1 | Annual Report | | Franklin High Yield Tax-Free | | Notes to Financial | |
| | | Municipal Bond Market | | Income Fund | 34 | Statements | 189 |
| | | Overview | 4 | Franklin Insured Tax-Free | | Report of Independent | |
| | | Investment Strategy | | Income Fund | 44 | Registered Public | |
| | | and Manager’s Discussion | 6 | Franklin Massachusetts | | Accounting Firm | 207 |
| | | Franklin Double Tax-Free | | Tax-Free Income Fund | 54 | Tax Designation | 208 |
| | | Income Fund | 7 | Franklin New Jersey | | Board Members and Officers | 209 |
| | | Franklin Federal Intermediate- | | Tax-Free Income Fund | 64 | Shareholder Information | 214 |
| | | Term Tax-Free Income Fund | 16 | Financial Highlights and | | | |
| | | Franklin Federal Limited-Term | | Statements of Investments | 75 | | |
| | | Tax-Free Income Fund | 25 | Financial Statements | 179 | | |
Annual Report
Municipal Bond Market Overview
For the 12 months ended February 28, 2011, the municipal bond market posted a mild gain of 1.72% as measured by the Barclays Capital (BC) Municipal Bond Index, which tracks investment-grade municipal securities.1 The gain was noteworthy considering the same index endured a record five consecutive months of negative total returns from September 2010 through January 2011. In comparison during the same period, Treasuries returned +3.71%, according to the BC U.S. Treasury Index, which tracks various U.S. Treasury securities.1
For the first six months of the reporting period municipal bond performance was robust, supported by strong investor demand and generally low interest rates resulting in part from the Federal Reserve Board’s (Fed’s) accommodative stance. The market also benefited from lower-than-normal tax-exempt issuance due to the Build America Bonds (BAB) program. The BAB program allowed municipal issuers to sell their bonds in the taxable market and take advantage of a 35% federal government subsidy for all coupon payments made on those municipal bonds. Such taxable bonds, however, are not part of the Funds’ tax-free portfolios. This subsidy enabled municipalities to borrow at significantly lower net yields than they could otherwise obtain in the traditional tax-exempt municipal bond market, which dramatically reduced the supply of new tax-exempt bonds. Of the $433 billion in issuance for the year 2010, $275 billion, or 64%, was in the form of tax-exempt municipal bonds.2 For the year 2008 (prior to the BAB program), municipal issuance totaled $390 billion, with $341 billion, or 88%, in the form of tax-exempt municipal bonds.2
November, December and January were particularly challenging months for many fixed income markets as they pulled back sharply after the Fed announced its intention to implement a second round of quantitative easing (QE2) with a $600 billion bond buying program. During the three-month period, the BC Municipal Bond Index: Long Component, which consists of 22-year and longer municipal securities, fell 8.58%, while the BC U.S. Treasury Index: Long Component, which tracks Treasuries with 10-year or longer maturities, dipped 7.07%.1
1. Source: © 2011 Morningstar. All Rights Reserved. The information contained herein: (1) is proprietary to Morningstar and/or its content providers; (2) may not be copied or distributed; and (3) is not warranted to be accurate, complete or timely. Neither Morningstar nor its content providers are responsible for any damages or losses arising from any use of this information. Past performance is no guarantee of future results.
2. Source: Thomson Reuters.
4 | Annual Report
Several factors contributed to municipal bond market weakness:
- The market seemed dissatisfied that the Fed indicated it would target bonds with maturities of 10 years or less, which contributed to a sell-off in bonds with maturities longer than 10 years.
- Some observers felt QE2 was unnecessary and might even ignite inflation, which contributed to weakness in shorter term bonds. The municipal bond market pulled back as yields generally rose. This was exacerbated as market concerns led to investor redemptions, forcing further sell-offs.
According to the Investment Company Institute, cash flows into munici- pal bond mutual funds during the reporting period first turned negative the week of November 10 and worsened in following weeks. - For most of calendar year 2010, market participants had expected the BAB program to be extended beyond 2010, and they began to anticipate a larger-than-normal supply of municipal bonds going into year-end. This belief waned, however, as Republicans took over the majority of the House of Representatives and did not propose legislation that would continue the program.
- Market participants feared municipalities would concentrate their borrow- ing needs in tax-free bonds during 2011 as they no longer had the option of using BABs. During the first two months of 2011, however, new-issue supply in the municipal bond market was almost 50% less than in the first two months of 2010, suggesting the fear of a large tax-exempt supply in 2011 may have been unwarranted.2
- In December Congress enacted an extension of tax cuts for all Americans, which further reduced demand for tax-exempt municipal bonds.
- Some observers raised concerns about the ability of municipal market borrowers to meet their debt obligations. High-profile and repetitive media coverage of such comments created panic among some investors.
However, counterarguments citing the historically low level of municipal defaults alleviated these fears somewhat.
In February, reduced supply helped drive bond prices higher, and the market turned positive. Although the municipal bond market experienced recent, short-term volatility, we maintained a long-term perspective. In our view, the pullback in yields provided us opportunities to buy high-quality, essential use revenue and general obligation bonds at levels that may enhance the Funds’ income-earning potential.
The foregoing information reflects our analysis and opinions as of February 28, 2011, the end of the reporting period. The information is not a complete analysis of every aspect of any market, country, industry, security or fund. Statements of fact are from sources considered reliable.
Annual Report | 5
Investment Strategy and
Manager’s Discussion
We use a consistent, disciplined strategy in an effort to maximize tax-exempt income for our shareholders by seeking to maintain exposure to higher coupon securities. We generally employ a buy-and-hold approach and invest in securities we believe should provide the most relative value in the market. As we invest during different interest rate environments, each Fund’s portfolio becomes progressively more diversified with a broad range of securities. This broad diversification may help mitigate interest rate risk. We do not use leverage or exotic derivatives, nor do we use hedging techniques that could add volatility and contribute to underperformance in adverse markets. We generally stay fully invested to help maximize income distribution.
The mixture of our value-oriented philosophy of investing primarily for income and a positive sloping municipal yield curve favored the use of longer term bonds. Consequently, we sought to purchase bonds from 15 to 30 years in maturity with good call features for the long-term funds, 10 to 15 years for the intermediate-term fund, and 5 years or less for the limited-term fund. We intend to maintain our conservative, buy-and-hold investment strategy as we attempt to provide shareholders with high, current, tax-free income.
We invite you to read your Fund report for more detailed performance and portfolio information. Thank you for your continued participation in Franklin Tax-Free Trust. We look forward to serving your future investment needs.
The foregoing information reflects our analysis, opinions and portfolio holdings as of February 28, 2011, the end of the reporting period. The way we implement our main investment strategies and the resulting portfolio holdings may change depending on factors such as market and economic conditions. These opinions may not be relied upon as investment advice or an offer for a particular security. The information is not a complete analysis of every aspect of any market, country, industry, security or fund. Statements of fact are from sources considered reliable, but the investment manager makes no representation or warranty as to their completeness or accuracy. Although historical performance is no guarantee of future results, these insights may help you understand our investment management philosophy.
6 | Annual Report
Franklin Double Tax-Free Income Fund
Your Fund’s Goal and Main Investments: Franklin Double Tax-Free Income Fund seeks to provide as high a level of income exempt from federal and state personal income taxes as is consistent with prudent investment management and preservation of capital by investing at least 80% of its net assets in securities that pay interest free from such taxes.1 The Fund focuses on municipal securities issued by U.S. territories such as Puerto Rico, Guam and the U.S. Virgin Islands, and currently invests primarily in Puerto Rican municipal securities.
Performance data represent past performance, which does not guarantee future results. Investment return and principal value will fluctuate, and you may have a gain or loss when you sell your shares. Current performance may differ from figures shown. Please visit franklintempleton.com or call (800) 342-5236 for most recent month-end performance.
| | |
| Credit Quality Breakdown* | | |
| Franklin Double Tax-Free Income Fund | | |
| 2/28/11 | | |
| | % of Total | |
| Ratings | Long-Term Investments** | |
| AAA | 1.2 | % |
| AA | 17.1 | % |
| A | 7.0 | % |
| BBB | 74.6 | % |
| Not Rated | 0.1 | % |
*Standard & Poor’s (S&P) is used as the primary independent rating agency source, Moody’s is secondary, and Fitch, if available, is used for securities not rated by Moody’s or S&P. The letter ratings are provided to indicate the credit-worthiness of the Fund’s bond holdings and generally range from AAA (highest) to Below Investment Grade (lowest; includes ratings BB to D). STANDARD & POOR’S®, S&P® and S&P 500® are registered trademarks of Standard & Poor’s Financial Services LLC. Standard & Poor’s does not sponsor, endorse, sell or promote any S&P index-based product.
**Does not include short-term investments and other net assets.
This annual report for Franklin Double Tax-Free Income Fund covers the fiscal year ended February 28, 2011.
Performance Overview
The Fund’s Class A share price, as measured by net asset value, decreased from $11.56 on February 28, 2010, to $11.12 on February 28, 2011. The Fund’s
1. For investors subject to alternative minimum tax, a small portion of Fund dividends may be taxable. Distributions of capital gains are generally taxable. To avoid imposition of 28% backup withholding on all Fund distributions and redemption proceeds, U.S. investors must be properly certified on Form W-9 and non-U.S. investors on Form W-8BEN.
The dollar value, number of shares or principal amount, and names of all portfolio holdings are listed in the Fund’s Statement of Investments (SOI). The SOI begins on page 78.
Annual Report | 7
| | | |
| Dividend Distributions* | | | |
| Franklin Double Tax-Free Income Fund | | | |
| | | Dividend per Share |
| Month | Class A | Class C | Advisor Class |
| March 2010 | 4.28 cents | 3.73 cents | 4.38 cents |
| April 2010 | 4.28 cents | 3.73 cents | 4.38 cents |
| May 2010 | 4.28 cents | 3.73 cents | 4.38 cents |
| June 2010 | 4.28 cents | 3.74 cents | 4.37 cents |
| July 2010 | 4.28 cents | 3.74 cents | 4.37 cents |
| August 2010 | 4.28 cents | 3.74 cents | 4.37 cents |
| September 2010 | 4.28 cents | 3.73 cents | 4.38 cents |
| October 2010 | 4.28 cents | 3.73 cents | 4.38 cents |
| November 2010 | 4.28 cents | 3.73 cents | 4.38 cents |
| December 2010 | 4.28 cents | 3.71 cents | 4.39 cents |
| January 2011 | 4.28 cents | 3.71 cents | 4.39 cents |
| February 2011 | 4.28 cents | 3.71 cents | 4.39 cents |
*Assumes shares were purchased and held for the entire accrual period, which differs from the calendar month. Since dividends accrue daily, your actual distributions will vary depending on the date you purchased your shares and any account activity. All Fund distributions will vary depending upon current market conditions, and past distributions are not indicative of future trends.
Class A shares paid dividends totaling 51.71 cents per share for the same period.2 The Performance Summary beginning on page 10 shows that at the end of this reporting period the Fund’s Class A shares’ distribution rate was 4.54% based on an annualization of the current 4.39 cent per share dividend and the maximum offering price of $11.61 on February 28, 2011. An investor in the 2011 maximum federal income tax bracket of 35.00% would need to earn a distribution rate of 6.98% from a taxable investment to match the Fund’s Class A tax-free distribution rate. For the Fund’s Class C and Advisor shares’ performance, please see the Performance Summary.
Manager’s Discussion
We used various investment strategies during the 12 months under review as we sought to maximize tax-free income for shareholders. Please read the discussion on page 6 for details. Franklin Double Tax-Free Income Fund was the first mutual fund of its kind to offer both state and federal income tax exemptions in all 50 states. We do this by investing principally in U.S. territories
2. All Fund distributions will vary depending upon current market conditions, and past distributions are not indicative of future trends.
8 | Annual Report
such as Puerto Rico, the U.S. Virgin Islands and Guam. This can be particularly appealing to residents of states such as Illinois, Iowa and Wisconsin, where income from their own municipal securities may be fully taxable.
The Fund was well diversified with 114 different positions across 10 different sectors as of February 28, 2011. Issuers represented in the portfolio included Puerto Rico (76.5% of the Fund’s total long-term investments), U.S. Virgin Islands (13.0%) and Guam (10.5%).
Many municipal bond funds purchase U.S. territory paper, mainly Puerto Rico’s, as an alternative for their specialty state funds when the supply within a particular state is running low. This strong demand for territory paper has also helped to keep bond values high relative to other states. Puerto Rico’s municipal bond market is widely traded and is very liquid because of its dual tax-exemption advantages.
Thank you for your continued participation in Franklin Double Tax-Free Income Fund. We intend to maintain our conservative, buy-and-hold investment strategy as we attempt to provide shareholders with high, current, tax-free income.
| | |
| Portfolio Breakdown | | |
| Franklin Double Tax-Free Income Fund | |
| 2/28/11 | | |
| % of Total | |
| Long-Term Investments* | |
| Utilities | 21.6 | % |
| General Obligation | 20.0 | % |
| Tax-Supported | 13.2 | % |
| Transportation | 11.8 | % |
| Other Revenue | 9.0 | % |
| Subject to Government Appropriations | 8.0 | % |
| Refunded | 7.8 | % |
| Housing | 3.6 | % |
| Higher Education | 3.1 | % |
| Hospital & Health Care | 1.9 | % |
| |
| *Does not include short-term investments and other | |
| net assets. | | |
The foregoing information reflects our analysis, opinions and portfolio holdings as of February 28, 2011, the end of the reporting period. The way we implement our main investment strategies and the resulting portfolio holdings may change depending on factors such as market and economic conditions. These opinions may not be relied upon as investment advice or an offer for a particular security. The information is not a complete analysis of every aspect of any market, state, industry, security or the Fund. Statements of fact are from sources considered reliable, but the investment manager makes no representation or warranty as to their completeness or accuracy. Although historical performance is no guarantee of future results, these insights may help you understand our investment management philosophy.
Annual Report | 9
Performance Summary as of 2/28/11
Franklin Double Tax-Free Income Fund
Your dividend income will vary depending on dividends or interest paid by securities in the Fund’s portfolio, adjusted for operating expenses of each class. Capital gain distributions are net profits realized from the sale of portfolio securities. The performance table and graphs do not reflect any taxes that a shareholder would pay on Fund dividends, capital gain distributions, if any, or any realized gains on the sale of Fund shares. Total return reflects reinvestment of the Fund’s dividends and capital gain distributions, if any, and any unrealized gains or losses.
| | | | | | | | |
| Price and Distribution Information | | | | | | |
| Class A (Symbol: FPRTX) | | | | Change | | 2/28/11 | | 2/28/10 |
| Net Asset Value (NAV) | | | -$ | 0.44 | $ | 11.12 | $ | 11.56 |
| Distributions (3/1/10–2/28/11) | | | | | | | | |
| Dividend Income | $ | 0.5171 | | | | | | |
| Class C (Symbol: FPRIX) | | | | Change | | 2/28/11 | | 2/28/10 |
| Net Asset Value (NAV) | | | -$ | 0.44 | $ | 11.17 | $ | 11.61 |
| Distributions (3/1/10–2/28/11) | | | | | | | | |
| Dividend Income | $ | 0.4506 | | | | | | |
| Advisor Class (Symbol: n/a) | | | | Change | | 2/28/11 | | 2/28/10 |
| Net Asset Value (NAV) | | | -$ | 0.44 | $ | 11.13 | $ | 11.57 |
| Distributions (3/1/10–2/28/11) | | | | | | | | |
| Dividend Income | $ | 0.5291 | | | | | | |
10 | Annual Report
Performance Summary (continued)
Performance
Cumulative total return excludes sales charges. Average annual total returns include maximum sales charges. Class A: 4.25% maximum initial sales charge; Class C: 1% contingent deferred sales charge in first year only; Advisor Class: no sales charges.
| | | | | | | | | | | |
| Class A | | | | 1-Year | | | 5-Year | | | 10-Year | |
| Cumulative Total Return1 | | | + | 0.56 | % | + | 15.53 | % | + | 50.64 | % |
| Average Annual Total Return2 | | | | -3.69 | % | + | 2.04 | % | + | 3.73 | % |
| Avg. Ann. Total Return (3/31/11)3 | | | | -5.82 | % | + | 1.89 | % | + | 3.51 | % |
| Distribution Rate4 | 4.54 | % | | | | | | | | | |
| Taxable Equivalent Distribution Rate5 | 6.98 | % | | | | | | | | | |
| 30-Day Standardized Yield6 | 4.46 | % | | | | | | | | | |
| Taxable Equivalent Yield5 | 6.86 | % | | | | | | | | | |
| Total Annual Operating Expenses7 | 0.69 | % | | | | | | | | | |
| Class C | | | | 1-Year | | | 5-Year | | | 10-Year | |
| Cumulative Total Return1 | | | | -0.01 | % | + | 12.52 | % | + | 42.64 | % |
| Average Annual Total Return2 | | | | -0.97 | % | + | 2.39 | % | + | 3.62 | % |
| Avg. Ann. Total Return (3/31/11)3 | | | | -3.08 | % | + | 2.23 | % | + | 3.39 | % |
| Distribution Rate4 | 4.21 | % | | | | | | | | | |
| Taxable Equivalent Distribution Rate5 | 6.48 | % | | | | | | | | | |
| 30-Day Standardized Yield6 | 4.12 | % | | | | | | | | | |
| Taxable Equivalent Yield5 | 6.34 | % | | | | | | | | | |
| Total Annual Operating Expenses7 | 1.24 | % | | | | | | | | | |
| Advisor Class8 | | | | 1-Year | | | 5-Year | | | 10-Year | |
| Cumulative Total Return1 | | | + | 0.67 | % | + | 15.82 | % | + | 51.02 | % |
| Average Annual Total Return2 | | | + | 0.67 | % | + | 2.98 | % | + | 4.21 | % |
| Avg. Ann. Total Return (3/31/11)3 | | | | -1.58 | % | + | 2.84 | % | + | 3.98 | % |
| Distribution Rate4 | 4.83 | % | | | | | | | | | |
| Taxable Equivalent Distribution Rate5 | 7.43 | % | | | | | | | | | |
| 30-Day Standardized Yield6 | 4.76 | % | | | | | | | | | |
| Taxable Equivalent Yield5 | 7.32 | % | | | | | | | | | |
| Total Annual Operating Expenses7 | 0.59 | % | | | | | | | | | |
Performance data represent past performance, which does not guarantee future results. Investment return and principal value will fluctuate, and you may have a gain or loss when you sell your shares. Current performance may differ from figures shown. For most recent month-end performance, go to franklintempleton.com or call (800) 342-5236.
Annual Report | 11
Performance Summary (continued)
Total Return Index Comparison for a Hypothetical $10,000 Investment
Total return represents the change in value of an investment over the periods shown. It includes any current, applicable, maximum sales charge, Fund expenses, account fees and reinvested distributions. The unmanaged index includes reinvestment of any income or distributions. It differs from the Fund in composition and does not pay management fees or expenses. One cannot invest directly in an index.


Because municipal bonds are particularly sensitive to interest rate movements, the Fund’s yield and share price will fluctuate with market conditions. Bond prices generally move in the opposite direction of interest rates. Thus, as prices of bonds in the Fund adjust to a rise in interest rates, the Fund’s share price may decline. The Fund is classified as a nondiversified fund because it may invest a greater portion of its assets in the municipal securities of one issuer than a diversified fund. The manager applies various techniques and analyses in making investment decisions for the Fund, but there can be no guarantee that these decisions will produce the desired results. The Fund’s prospectus also includes a description of the main investment risks.
| |
| Class C: | Prior to 1/1/04, these shares were offered with an initial sales charge; thus actual total returns would |
| have differed. These shares have higher annual fees and expenses than Class A shares. |
| |
| Advisor Class: | Shares are available to certain eligible investors as described in the prospectus. |
|
| 1. Cumulative total return represents the change in value of an investment over the periods indicated. |
| 2. Average annual total return represents the average annual change in value of an investment over the periods |
| indicated. |
| 3. In accordance with SEC rules, we provide standardized average annual total return information through the latest |
| calendar quarter. |
| 4. Distribution rate is based on an annualization of the respective class’s current monthly dividend and the maxi- |
| mum offering price (NAV for Classes C and Advisor) per share on 2/28/11. |
| 5. Taxable equivalent distribution rate and yield assume the 2011 maximum federal income tax rate of 35.00%. |
| 6. The 30-day standardized yield for the month ended 2/28/11 reflects an estimated yield to maturity (assuming all |
| portfolio securities are held to maturity). It should be regarded as an estimate of the Fund’s rate of investment |
| income, and it may not equal the Fund’s actual income distribution rate (which reflects the Fund’s past dividends |
| paid to shareholders) or the income reported in the Fund’s financial statements. |
| 7. Figures are as stated in the Fund’s prospectus current as of the date of this report. In periods of market volatility, |
| assets may decline significantly, causing total annual Fund operating expenses to become higher than the figures |
| shown. |
| 8. Effective 7/15/09, the Fund began offering Advisor Class shares, which do not have sales charges or a Rule 12b-1 |
| plan. Performance quotations for this class reflect the following methods of calculation: (a) For periods prior to |
| 7/15/09, a restated figure is used based upon the Fund’s Class A performance, excluding the effect of Class A’s max- |
| imum initial sales charge, but reflecting the effect of the Class A Rule 12b-1 fees; and (b) for periods after 7/14/09, |
| actual Advisor Class performance is used reflecting all charges and fees applicable to that class. Since 7/15/09 |
| (commencement of sales), the cumulative and average annual total returns of Advisor Class shares were +11.11% |
| and +6.70%. |
| 9. Source: © 2011 Morningstar. The BC Municipal Bond Index is a market value-weighted index engineered for the |
| long-term tax-exempt bond market. To be included in the index, bonds must be fixed rate, have at least one year to |
| final maturity and be rated investment grade (Baa3/BBB- or higher) by at least two of the following agencies: |
| Moody’s, Standard & Poor’s and Fitch. The Consumer Price Index (CPI), calculated by the U.S. Bureau of Labor |
| Statistics, is a commonly used measure of the inflation rate. |
Annual Report | 13
Your Fund’s Expenses
Franklin Double Tax-Free Income Fund
As a Fund shareholder, you can incur two types of costs:
- Transaction costs, including sales charges (loads) on Fund purchases; and
- Ongoing Fund costs, including management fees, distribution and service (12b-1) fees, and other Fund expenses. All mutual funds have ongoing costs, sometimes referred to as operating expenses.
The following table shows ongoing costs of investing in the Fund and can help you understand these costs and compare them with those of other mutual funds. The table assumes a $1,000 investment held for the six months indicated.
Actual Fund Expenses
The first line (Actual) for each share class listed in the table provides actual account values and expenses. The “Ending Account Value” is derived from the Fund’s actual return, which includes the effect of Fund expenses.
You can estimate the expenses you paid during the period by following these steps. Of course, your account value and expenses will differ from those in this illustration:
| 1 | Divide your account value by $1,000. |
| | If an account had an $8,600 value, then $8,600 ÷ $1,000 = 8.6. |
| 2. | Multiply the result by the number under the heading “Expenses Paid During Period.” |
| | If Expenses Paid During Period were $7.50, then 8.6 x $7.50 = $64.50 |
In this illustration, the estimated expenses paid this period are $64.50.
Hypothetical Example for Comparison with Other Funds
Information in the second line (Hypothetical) for each class in the table can help you compare ongoing costs of investing in the Fund with those of other mutual funds. This information may not be used to estimate the actual ending account balance or expenses you paid during the period. The hypothetical “Ending Account Value” is based on the actual expense ratio for each class and an assumed 5% annual rate of return before expenses, which does not represent the Fund’s actual return. The figure under the heading “Expenses Paid During Period” shows the hypothetical expenses your account would have incurred under this scenario. You can compare this figure with the 5% hypothetical examples that appear in shareholder reports of other funds.
14 | Annual Report
Your Fund’s Expenses (continued)
Please note that expenses shown in the table are meant to highlight ongoing costs and do not reflect any transaction costs, such as sales charges. Therefore, the second line for each class is useful in comparing ongoing costs only, and will not help you compare total costs of owning different funds. In addition, if transaction costs were included, your total costs would have been higher. Please refer to the Fund prospectus for additional information on operating expenses.
| | | | | | |
| | | Beginning Account | | Ending Account | | Expenses Paid During |
| Class A | | Value 9/1/10 | | Value 2/28/11 | | Period* 9/1/10–2/28/11 |
| Actual | $ | 1,000 | $ | 937.50 | $ | 3.22 |
| Hypothetical (5% return before expenses) | $ | 1,000 | $ | 1,021.47 | $ | 3.36 |
| Class C | | | | | | |
| Actual | $ | 1,000 | $ | 935.00 | $ | 5.85 |
| Hypothetical (5% return before expenses) | $ | 1,000 | $ | 1,018.74 | $ | 6.11 |
| Advisor Class | | | | | | |
| Actual | $ | 1,000 | $ | 938.00 | $ | 2.74 |
| Hypothetical (5% return before expenses) | $ | 1,000 | $ | 1,021.97 | $ | 2.86 |
*Expenses are calculated using the most recent six-month expense ratio, annualized for each class (A: 0.67%; C: 1.22%; and Advisor: 0.57%), multiplied by the average account value over the period, multiplied by 181/365 to reflect the one-half year period.
Annual Report | 15
Franklin Federal Intermediate-Term Tax-Free Income Fund
Your Fund’s Goal and Main Investments: Franklin Federal Intermediate-Term Tax-Free Income Fund seeks to provide as high a level of income exempt from federal income taxes as is consistent with prudent investment management and preservation of capital by investing at least 80% of its total assets in securities that pay interest free from such taxes.1 The Fund maintains a dollar-weighted average portfolio maturity (the time in which the debt must be repaid) of three to 10 years.
Performance data represent past performance, which does not guarantee future results. Investment return and principal value will fluctuate, and you may have a gain or loss when you sell your shares. Current performance may differ from figures shown. Please visit franklintempleton.com or call (800) 342-5236 for most recent month-end performance.
| | |
| Credit Quality Breakdown* | | |
| Franklin Federal Intermediate-Term Tax-Free Income Fund | | |
| 2/28/11 | | |
| | % of Total | |
| Ratings | Long-Term Investments** | |
| AAA | 5.3 | % |
| AA | 50.9 | % |
| A | 32.0 | % |
| BBB | 10.7 | % |
| Below Investment Grade | 0.2 | % |
| Not Rated | 0.9 | % |
*Standard & Poor’s (S&P) is used as the primary independent rating agency source, Moody’s is secondary, and Fitch, if available, is used for securities not rated by Moody’s or S&P. The letter ratings are provided to indicate the credit-worthiness of the Fund’s bond holdings and generally range from AAA (highest) to Below Investment Grade (lowest; includes ratings BB to D).
**Does not include short-term investments and other net assets.
This annual report for Franklin Federal Intermediate-Term Tax-Free Income Fund covers the fiscal year ended February 28, 2011.
Performance Overview
The Fund’s Class A share price, as measured by net asset value, decreased from $11.59 on February 28, 2010, to $11.43 on February 28, 2011. The
1. Dividends are generally subject to state and local taxes, if any. For investors subject to alternative minimum tax, a small portion of Fund dividends may be taxable. Distributions of capital gains are generally taxable. To avoid imposition of 28% backup withholding on all Fund distributions and redemption proceeds, U.S. investors must be properly certified on Form W-9 and non-U.S. investors on Form W-8BEN.
The dollar value, number of shares or principal amount, and names of all portfolio holdings are listed in the Fund’s Statement of Investments (SOI). The SOI begins on page 85.
16 | Annual Report
| | | |
| Dividend Distributions* | | | |
| Franklin Federal Intermediate-Term Tax-Free Income Fund | | |
| | | Dividend per Share |
| Month | Class A | Class C | Advisor Class |
| March 2010 | 3.58 cents | 3.04 cents | 3.67 cents |
| April 2010 | 3.58 cents | 3.04 cents | 3.67 cents |
| May 2010 | 3.58 cents | 3.04 cents | 3.67 cents |
| June 2010 | 3.48 cents | 2.95 cents | 3.57 cents |
| July 2010 | 3.48 cents | 2.95 cents | 3.57 cents |
| August 2010 | 3.48 cents | 2.95 cents | 3.57 cents |
| September 2010 | 3.48 cents | 2.93 cents | 3.58 cents |
| October 2010 | 3.28 cents | 2.73 cents | 3.38 cents |
| November 2010 | 3.13 cents | 2.58 cents | 3.23 cents |
| December 2010 | 3.13 cents | 2.58 cents | 3.22 cents |
| January 2011 | 3.13 cents | 2.58 cents | 3.22 cents |
| February 2011 | 3.13 cents | 2.58 cents | 3.22 cents |
*Assumes shares were purchased and held for the entire accrual period, which differs from the calendar month. Since dividends accrue daily, your actual distributions will vary depending on the date you purchased your shares and any account activity. All Fund distributions will vary depending upon current market conditions, and past distributions are not indicative of future trends.
Fund’s Class A shares paid dividends totaling 40.61 cents per share for the same period.2 The Performance Summary beginning on page 19 shows that at the end of this reporting period the Fund’s Class A shares’ distribution rate was 3.32% based on an annualization of the current 3.23 cent per share dividend and the maximum offering price of $11.69 on February 28, 2011. An investor in the 2011 maximum federal income tax bracket of 35.00% would need to earn a distribution rate of 5.11% from a taxable investment to match the Fund’s Class A tax-free distribution rate. For the Fund’s Class C and Advisor shares’ performance, please see the Performance Summary. Dividend distributions during the year under review were affected by securities purchased in the prior period and by falling municipal bond rates in 2009 through November 2010. In addition, for most of the Fund’s fiscal year, investor demand was strong for municipal bonds in an environment of limited tax-exempt supply. These factors resulted in reduced income for the portfolio and caused dividends to decline.
2. All Fund distributions will vary depending upon current market conditions, and past distributions are not indicative of future trends.
Annual Report | 17
| | | |
| Portfolio Breakdown | | | Manager’s Discussion |
| Franklin Federal Intermediate-Term | | | |
| Tax-Free Income Fund | | | We used various investment strategies during the 12 months under review as |
| 2/28/11 | | | |
| | | | we sought to maximize tax-free income for shareholders. Please read the dis- |
| % of Total | | cussion on page 6 for details. |
| Long-Term Investments* | | |
| |
| Subject to Government Appropriations | 21.5 | % | Thank you for your continued participation in Franklin Federal Intermediate- |
| Utilities | 19.1 | % | Term Tax-Free Income Fund. We intend to maintain our conservative, buy- |
| General Obligation | 17.7 | % | and-hold investment strategy as we attempt to provide shareholders with high, |
| Transportation | 12.1 | % | current, tax-free income. |
| Hospital & Health Care | 9.9 | % | |
| Other Revenue | 9.1 | % | |
| Tax-Supported | 5.0 | % | |
| | | | The foregoing information reflects our analysis, opinions and portfolio holdings as of February 28, 2011, the end |
| Higher Education | 3.2 | % | of the reporting period. The way we implement our main investment strategies and the resulting portfolio holdings |
| Refunded | 1.8 | % | may change depending on factors such as market and economic conditions. These opinions may not be relied |
| Housing | 0.4 | % | upon as investment advice or an offer for a particular security. The information is not a complete analysis of |
| | | | every aspect of any market, state, industry, security or the Fund. Statements of fact are from sources considered |
| Corporate-Backed | 0.2 | % | reliable, but the investment manager makes no representation or warranty as to their completeness or accuracy. |
| | | | Although historical performance is no guarantee of future results, these insights may help you understand our |
| *Does not include short-term investments and other | | investment management philosophy. |
| net assets. | | | |
18 | Annual Report
Performance Summary as of 2/28/11
Franklin Federal Intermediate-Term Tax-Free Income Fund
Your dividend income will vary depending on dividends or interest paid by securities in the Fund’s portfolio, adjusted for operating expenses of each class. Capital gain distributions are net profits realized from the sale of portfolio securities. The performance table and graphs do not reflect any taxes that a shareholder would pay on Fund dividends, capital gain distributions, if any, or any realized gains on the sale of Fund shares. Total return reflects reinvestment of the Fund’s dividends and capital gain distributions, if any, and any unrealized gains or losses.
| | | | | | | | |
| Price and Distribution Information | | | | | | |
| Class A (Symbol: FKITX) | | | | Change | | 2/28/11 | | 2/28/10 |
| Net Asset Value (NAV) | | | -$ | 0.16 | $ | 11.43 | $ | 11.59 |
| Distributions (3/1/10–2/28/11) | | | | | | | | |
| Dividend Income | $ | 0.4061 | | | | | | |
| Class C (Symbol: FCITX) | | | | Change | | 2/28/11 | | 2/28/10 |
| Net Asset Value (NAV) | | | -$ | 0.15 | $ | 11.46 | $ | 11.61 |
| Distributions (3/1/10–2/28/11) | | | | | | | | |
| Dividend Income | $ | 0.3407 | | | | | | |
| Advisor Class (Symbol: FITZX) | | | | Change | | 2/28/11 | | 2/28/10 |
| Net Asset Value (NAV) | | | -$ | 0.15 | $ | 11.45 | $ | 11.60 |
| Distributions (3/1/10–2/28/11) | | | | | | | | |
| Dividend Income | $ | 0.4172 | | | | | | |
Annual Report | 19
Performance Summary (continued)
Performance
Cumulative total return excludes sales charges. Average annual total returns include maximum sales charges. Class A: 2.25% maximum initial sales charge; Class C: 1% contingent deferred sales charge in first year only; Advisor Class: no sales charges.
| | | | | | | | | | | |
| Class A | | | | 1-Year | | | 5-Year | | | 10-Year | |
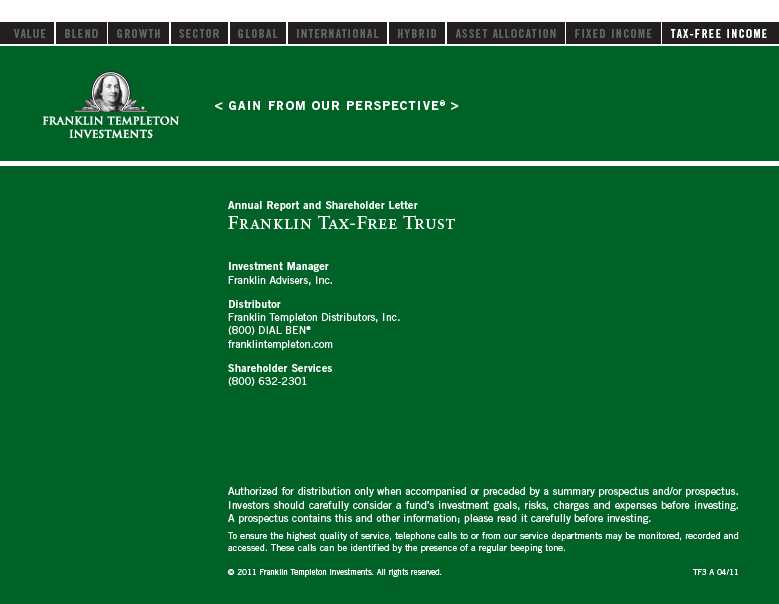
| Cumulative Total Return1 | | | + | 2.12 | % | + | 20.58 | % | + | 53.42 | % |
| Average Annual Total Return2 | | | | -0.20 | % | + | 3.35 | % | + | 4.14 | % |
| Avg. Ann. Total Return (3/31/11)3 | | | | -0.21 | % | + | 3.39 | % | + | 3.99 | % |
| Distribution Rate4 | 3.32 | % | | | | | | | | | |
| Taxable Equivalent Distribution Rate5 | 5.11 | % | | | | | | | | | |
| 30-Day Standardized Yield6 | 3.33 | % | | | | | | | | | |
| Taxable Equivalent Yield5 | 5.12 | % | | | | | | | | | |
| Total Annual Operating Expenses7 | 0.67 | % | | | | | | | | | |
| Class C | | | | 1-Year | | | 5-Year | | | Inception (7/1/03) | |
| Cumulative Total Return1 | | | + | 1.63 | % | + | 17.35 | % | + | 24.86 | % |
| Average Annual Total Return2 | | | + | 0.65 | % | + | 3.25 | % | + | 2.94 | % |
| Avg. Ann. Total Return (3/31/11)3 | | | + | 0.58 | % | + | 3.30 | % | + | 2.81 | % |
| Distribution Rate4 | 2.85 | % | | | | | | | | | |
| Taxable Equivalent Distribution Rate5 | 4.38 | % | | | | | | | | | |
| 30-Day Standardized Yield6 | 2.86 | % | | | | | | | | | |
| Taxable Equivalent Yield5 | 4.40 | % | | | | | | | | | |
| Total Annual Operating Expenses7 | 1.22 | % | | | | | | | | | |
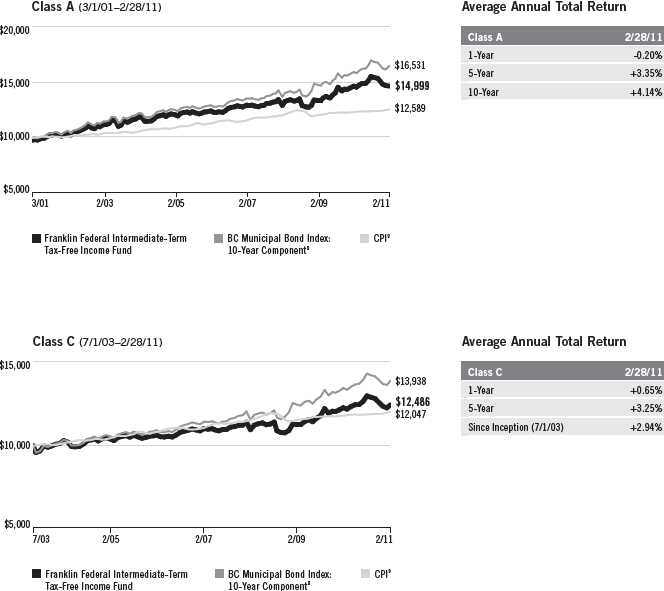
| Advisor Class8 | | | | 1-Year | | | 5-Year | | | 10-Year | |
| Cumulative Total Return1 | | | + | 2.30 | % | + | 21.03 | % | + | 53.99 | % |
| Average Annual Total Return2 | | | + | 2.30 | % | + | 3.89 | % | + | 4.41 | % |
| Avg. Ann. Total Return (3/31/11)3 | | | + | 2.23 | % | + | 3.94 | % | + | 4.26 | % |
| Distribution Rate4 | 3.48 | % | | | | | | | | | |
| Taxable Equivalent Distribution Rate5 | 5.35 | % | | | | | | | | | |
| 30-Day Standardized Yield6 | 3.49 | % | | | | | | | | | |
| Taxable Equivalent Yield5 | 5.37 | % | | | | | | | | | |
| Total Annual Operating Expenses7 | 0.57 | % | | | | | | | | | |
Performance data represent past performance, which does not guarantee future results. Investment return and principal value will fluctuate, and you may have a gain or loss when you sell your shares. Current performance may differ from figures shown. For most recent month-end performance, go to franklintempleton.com or call (800) 342-5236.
20 | Annual Report
Performance Summary (continued)
Total Return Index Comparison for a Hypothetical $10,000 Investment
Total return represents the change in value of an investment over the periods shown. It includes any current, applicable, maximum sales charge, Fund expenses, account fees and reinvested distributions. The unmanaged index includes reinvestment of any income or distributions. It differs from the Fund in composition and does not pay management fees or expenses. One cannot invest directly in an index.
Annual Report | 21
Endnotes
Because municipal bonds are sensitive to interest rate movements, the Fund’s yield and share price will fluctuate with market conditions. Bond prices generally move in the opposite direction of interest rates. Thus, as prices of bonds in the Fund adjust to a rise in interest rates, the Fund’s share price may decline. The manager applies various techniques and analyses in making investment decisions for the Fund, but there can be no guarantee that these decisions will produce the desired results. The Fund’s prospectus also includes a description of the main investment risks.
| |
| Class C: | Prior to 1/1/04, these shares were offered with an initial sales charge; thus actual total returns would |
| have differed. These shares have higher annual fees and expenses than Class A shares |
| |
| Advisor Class: | Shares are available to certain eligible investors as described in the prospectus. |
|
| 1. Cumulative total return represents the change in value of an investment over the periods indicated. |
| 2. Average annual total return represents the average annual change in value of an investment over the periods indicated. |
| 3. In accordance with SEC rules, we provide standardized average annual total return information through the latest |
| calendar quarter. |
| 4. Distribution rate is based on an annualization of the respective class’s current monthly dividend and the maximum |
| offering price (NAV for Classes C and Advisor) per share on 2/28/11. |
| 5. Taxable equivalent distribution rate and yield assume the 2011 maximum federal income tax rate of 35.00%. |
| 6. The 30-day standardized yield for the month ended 2/28/11 reflects an estimated yield to maturity (assuming all |
| portfolio securities are held to maturity). It should be regarded as an estimate of the Fund’s rate of investment income, |
| and it may not equal the Fund’s actual income distribution rate (which reflects the Fund’s past dividends paid to share- |
| holders) or the income reported in the Fund’s financial statements. |
| 7. Figures are as stated in the Fund’s prospectus current as of the date of this report. In periods of market volatility, |
| assets may decline significantly, causing total annual Fund operating expenses to become higher than the figures shown. |
| 8. Effective 12/1/08, the Fund began offering Advisor Class shares, which do not have sales charges or a Rule 12b-1 |
| plan. Performance quotations for this class reflect the following methods of calculation: (a) For periods prior to 12/1/08, |
| a restated figure is used based upon the Fund’s Class A performance, excluding the effect of Class A’s maximum initial |
| sales charge, but reflecting the effect of the Class A Rule 12b-1 fees; and (b) for periods after 11/30/08, actual Advisor |
| Class performance is used reflecting all charges and fees applicable to that class. Since 12/1/08 (commencement of |
| sales), the cumulative and average annual total returns of Advisor Class shares were +17.84% and +7.59%. |
| 9. Source: © 2011 Morningstar. The BC Municipal Bond Index: 10-Year Component is the 10-year (8-12) component |
| of the Municipal Bond Index, which is a market value-weighted index engineered for the long-term tax-exempt bond |
| market. To be included in the index, bonds must be fixed rate, have at least one year to final maturity and be rated |
| investment grade (Baa3/BBB- or higher) by at least two of the following agencies: Moody’s, Standard & Poor’s and Fitch. |
| The Consumer Price Index (CPI), calculated by the U.S. Bureau of Labor Statistics, is a commonly used measure of the |
| inflation rate. |
22 | Annual Report
Annual Report | 22
Your Fund’s Expenses
Franklin Federal Intermediate-Term Tax-Free Income Fund
As a Fund shareholder, you can incur two types of costs:
- Transaction costs, including sales charges (loads) on Fund purchases; and
- Ongoing Fund costs, including management fees, distribution and service (12b-1) fees, and other Fund expenses. All mutual funds have ongoing costs, sometimes referred to as operating expenses.
The following table shows ongoing costs of investing in the Fund and can help you understand these costs and compare them with those of other mutual funds. The table assumes a $1,000 investment held for the six months indicated.
Actual Fund Expenses
The first line (Actual) for each share class listed in the table provides actual account values and expenses. The “Ending Account Value” is derived from the Fund’s actual return, which includes the effect of Fund expenses.
You can estimate the expenses you paid during the period by following these steps. Of course, your account value and expenses will differ from those in this illustration:
| 1. | Divide your account value by $1,000. |
| | If an account had an $8,600 value, then $8,600 ÷ $1,000 = 8.6. |
| 2. | Multiply the result by the number under the heading “Expenses Paid During Period.” |
| | If Expenses Paid During Period were $7.50, then 8.6 x $7.50 = $64.50. |
In this illustration, the estimated expenses paid this period are $64.50.
Hypothetical Example for Comparison with Other Funds
Information in the second line (Hypothetical) for each class in the table can help you compare ongoing costs of investing in the Fund with those of other mutual funds. This information may not be used to estimate the actual ending account balance or expenses you paid during the period. The hypothetical “Ending Account Value” is based on the actual expense ratio for each class and an assumed 5% annual rate of return before expenses, which does not represent the Fund’s actual return. The figure under the heading “Expenses Paid During Period” shows the hypothetical expenses your account would have incurred under this scenario. You can compare this figure with the 5% hypothetical examples that appear in shareholder reports of other funds.
Annual Report | 23
Your Fund’s Expenses (continued)
Please note that expenses shown in the table are meant to highlight ongoing costs and do not reflect any transaction costs, such as sales charges. Therefore, the second line for each class is useful in comparing ongoing costs only, and will not help you compare total costs of owning different funds. In addition, if transaction costs were included, your total costs would have been higher. Please refer to the Fund prospectus for additional information on operating expenses.
| | | | | | |
| | | Beginning Account | | Ending Account | | Expenses Paid During |
| Class A | | Value 9/1/10 | | Value 2/28/11 | | Period* 9/1/10–2/28/11 |
| Actual | $ | 1,000 | $ | 962.80 | $ | 3.26 |
| Hypothetical (5% return before expenses) | $ | 1,000 | $ | 1,021.47 | $ | 3.36 |
| Class C | | | | | | |
| Actual | $ | 1,000 | $ | 960.10 | $ | 5.93 |
| Hypothetical (5% return before expenses) | $ | 1,000 | $ | 1,018.74 | $ | 6.11 |
| Advisor Class | | | | | | |
| Actual | $ | 1,000 | $ | 963.30 | $ | 2.77 |
| Hypothetical (5% return before expenses) | $ | 1,000 | $ | 1,021.97 | $ | 2.86 |
*Expenses are calculated using the most recent six-month expense ratio, annualized for each class (A: 0.67%; C: 1.22%; and Advisor: 0.57%), multiplied by the average account value over the period, multiplied by 181/365 to reflect the one-half year period.
24 | Annual Report
Franklin Federal Limited-Term Tax-Free Income Fund
Your Fund’s Goal and Main Investments: Franklin Federal Limited-Term Tax-Free Income Fund seeks to provide as high a level of income exempt from federal income taxes as is consistent with prudent investment management and preservation of capital by investing at least 80% of its total assets in securities that pay interest free from such taxes.1 The Fund maintains a dollar-weighted average portfolio maturity (the time in which the debt must be repaid) of five years or less.
| | |
| Credit Quality Breakdown* | | |
| Franklin Federal Limited-Term Tax-Free Income Fund | | |
| 2/28/11 | | |
| | % of Total | |
| Ratings | Long-Term Investments** | |
| AAA | 4.6 | % |
| AA | 61.5 | % |
| SP-1 | 7.4 | % |
| A | 18.4 | % |
| BBB | 7.6 | % |
| Below Investment Grade | 0.3 | % |
| Not Rated | 0.2 | % |
*Standard & Poor’s (S&P) is used as the primary independent rating agency source, Moody’s is secondary, and Fitch, if available, is used for securities not rated by Moody’s or S&P. The letter ratings are provided to indicate the credit-worthiness of the Fund’s bond holdings and generally range from AAA (highest) to Below Investment Grade (lowest; includes ratings BB to D). S&P may rate long-term securities using short-term ratings; SP-1 reflects a strong capacity to pay principal and interest.
**Does not include short-term investments and other net assets.
This annual report for Franklin Federal Limited-Term Tax-Free Income Fund covers the fiscal year ended February 28, 2011.
1. Dividends are generally subject to state and local taxes, if any. For investors subject to alternative minimum tax, a small portion of Fund dividends may be taxable. Distributions of capital gains are generally taxable. To avoid imposition of 28% backup withholding on all Fund distributions and redemption proceeds, U.S. investors must be properly certified on Form W-9 and non-U.S. investors on Form W-8BEN.
The dollar value, number of shares or principal amount, and names of all portfolio holdings are listed in the Fund’s Statement of Investments (SOI). The SOI begins on page 101.
Annual Report | 25
Dividend Distributions*
Performance data represent past performance, which does not guarantee future results. Investment return and principal value will fluctuate, and you may have a gain or loss when you sell your shares. Current performance may differ from figures shown. Please visit franklintempleton.com or call (800) 342-5236 for most recent month-end performance.
| | |
| Franklin Federal Limited-Term Tax-Free Income Fund | | |
| | Dividend per Share |
| Month | Class A | Advisor Class** |
| March 2010 | 1.90 cents | — |
| April 2010 | 1.90 cents | — |
| May 2010 | 1.90 cents | — |
| June 2010 | 1.90 cents | — |
| July 2010 | 1.90 cents | — |
| August 2010 | 1.90 cents | — |
| September 2010 | 1.90 cents | — |
| October 2010 | 1.75 cents | — |
| November 2010 | 1.75 cents | — |
| December 2010 | 1.75 cents | — |
| January 2011 | 1.75 cents | — |
| February 2011 | 1.30 cents | 0.83 cents |
*Assumes shares were purchased and held for the entire accrual period, which differs from the calendar month. Since dividends accrue daily, your actual distributions will vary depending on the date you purchased your shares and any account activity. All Fund distributions will vary depending upon current market conditions, and past distributions are not indicative of future trends.
**Effective 2/1/11, the Fund began offering Advisor Class shares. See the prospectus for details.
Performance Overview
The Fund’s Class A share price, as measured by net asset value, decreased from $10.35 on February 28, 2010, to $10.29 on February 28, 2011. The Fund’s Class A shares paid dividends totaling 21.65 cents per share for the same period.2 The Performance Summary beginning on page 28 shows that at the end of this reporting period the Fund’s Class A shares’ distribution rate was 1.85% based on an annualization of the current 1.62 cent per share dividend and the maximum offering price of $10.53 on February 28, 2011. An investor in the 2011 maximum federal income tax bracket of 35.00% would need to earn a distribution rate of 2.85% from a taxable investment to match the Fund’s Class A tax-free distribution rate. For the Fund’s Advisor shares’ performance, please see the Performance Summary. Dividend distributions during the year under review were affected by securities purchased in the prior period and by falling municipal bond rates in 2009 through November 2010. In addition, for most of the Fund’s fiscal year, investor demand was strong for
2. All Fund distributions will vary depending upon current market conditions, and past distributions are not indicative of future trends.
26 | Annual Report
municipal bonds in an environment of limited tax-exempt supply. These factors resulted in reduced income for the portfolio and caused dividends to decline.
Manager’s Discussion
We used various investment strategies during the 12 months under review as we sought to maximize tax-free income for shareholders. Please read the discussion on page 6 for details.
Consistent with our investment strategy, we invested in bonds we believed could provide the most relative value from an income perspective. Seeking a dollar-weighted average portfolio maturity of five years or less, we concentrated in the one- to five-year range in an effort to insulate investors against bond market volatility. As a result of our strategy, we believe the Fund was positioned to capture changes in short-term interest rates, preserve capital and produce tax-free income.
Thank you for your continued participation in Franklin Federal Limited-Term Tax-Free Income Fund. We intend to maintain our conservative, buy-and-hold investment strategy as we attempt to provide shareholders with high, current, tax-free income.
The foregoing information reflects our analysis, opinions and portfolio holdings as of February 28, 2011, the end of the reporting period. The way we implement our main investment strategies and the resulting portfolio holdings may change depending on factors such as market and economic conditions. These opinions may not be relied upon as investment advice or an offer for a particular security. The information is not a complete analysis of every aspect of any market, state, industry, security or the Fund. Statements of fact are from sources considered reliable, but the investment manager makes no representation or warranty as to their completeness or accuracy. Although historical performance is no guarantee of future results, these insights may help you understand our investment management philosophy.
|
| Portfolio Breakdown |
| Franklin Federal Limited-Term |
| Tax-Free Income Fund |
| 2/28/11 |
| |
| % of Total |
| Long-Term Investments* |
| | |
| General Obligation | 31.6 | % |
| Utilities | 17.9 | % |
| Subject to Government Appropriations | 12.2 | % |
| Transportation | 9.5 | % |
| Other Revenue | 8.1 | % |
| Hospital & Health Care | 6.9 | % |
| Higher Education | 4.6 | % |
| Tax-Supported | 4.0 | % |
| Housing | 3.4 | % |
| Corporate-Backed | 1.8 | % |
*Does not include short-term investments and other net assets.
Annual Report | 27
Performance Summary as of 2/28/11
Franklin Federal Limited-Term Tax-Free Income Fund
Your dividend income will vary depending on dividends or interest paid by securities in the Fund’s portfolio, adjusted for operating expenses of each class. Capital gain distributions are net profits realized from the sale of portfolio securities. The performance table and graphs do not reflect any taxes that a shareholder would pay on Fund dividends, capital gain distributions, if any, or any realized gains on the sale of Fund shares. Total return reflects reinvestment of the Fund’s dividends and capital gain distributions, if any, and any unrealized gains or losses.
| | | | | | | | |
| Price and Distribution Information | | | | | | |
| Class A (Symbol: FFTFX) | | | | Change | | 2/28/11 | | 2/28/10 |
| Net Asset Value (NAV) | | | -$ | 0.06 | $ | 10.29 | $ | 10.35 |
| Distributions (3/1/10–2/28/11) | | | | | | | | |
| Dividend Income | $ | 0.2165 | | | | | | |
| Advisor Class (Symbol: n/a) | | | | Change | | 2/28/11 | | 2/1/11 |
| Net Asset Value (NAV) | | | +$ | 0.02 | $ | 10.29 | $ | 10.27 |
| Distributions (2/1/11–2/28/11) | | | | | | | | |
| Dividend Income | $ | 0.0138 | | | | | | |
28 | Annual Report
Performance Summary (continued)
Performance1
Cumulative total return excludes the sales charge. Average annual total returns include the maximum sales charge.
Class A: 2.25% maximum initial sales charge; Advisor Class: no sales charges.
| | | | | | | | | | | |
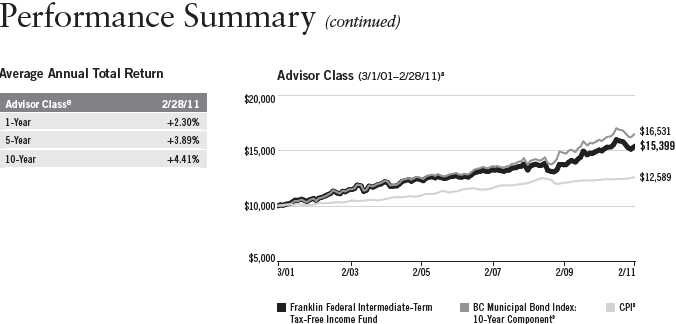
| Class A | | | | 1-Year | | | 5-Year | | | Inception (9/2/03) | |
| Cumulative Total Return2 | | | + | 1.52 | % | + | 18.78 | % | + | 22.51 | % |
| Average Annual Total Return3 | | | | -0.78 | % | + | 3.03 | % | + | 2.44 | % |
| Avg. Ann. Total Return (3/31/11)4 | | | | -0.07 | % | + | 3.08 | % | + | 2.43 | % |
| Distribution Rate5 | 1.85 | % | | | | | | | | | |
| Taxable Equivalent Distribution Rate6 | 2.85 | % | | | | | | | | | |
| 30-Day Standardized Yield7 | 1.67 | % | | | | | | | | | |
| Taxable Equivalent Yield6 | 2.57 | % | | | | | | | | | |
| Total Annual Operating Expenses8 | 0.50 | % | | | | | | | | | |
| Without Waiver | 0.92 | % | | | | | | | | | |
| With Waiver | 0.50 | % | | | | | | | | | |
| Advisor Class9 | | | | 1-Year | | | 5-Year | | | Inception (9/2/03) | |
| Cumulative Total Return2 | | | + | 1.53 | % | + | 18.79 | % | + | 22.52 | % |
| Average Annual Total Return3 | | | + | 1.53 | % | + | 3.50 | % | + | 2.75 | % |
| Avg. Ann. Total Return (3/31/11)4 | | | + | 2.28 | % | + | 3.56 | % | + | 2.74 | % |
| Distribution Rate5 | 1.98 | % | | | | | | | | | |
| Taxable Equivalent Distribution Rate6 | 3.05 | % | | | | | | | | | |
| 30-Day Standardized Yield7 | n/a | | | | | | | | | | |
| Taxable Equivalent Yield6 | n/a | | | | | | | | | | |
| Total Annual Operating Expenses8 | 0.35 | % | | | | | | | | | |
| Without Waiver | 0.77 | % | | | | | | | | | |
| With Waiver | 0.35 | % | | | | | | | | | |
Performance data represent past performance, which does not guarantee future results. Investment return and principal value will fluctuate, and you may have a gain or loss when you sell your shares. Current performance may differ from figures shown. For most recent month-end performance, go to franklintempleton.com or call (800) 342-5236.
The investment manager and administrator have contractually agreed to waive or assume certain expenses so that common expenses (excluding Rule 12b-1 fees and acquired fund fees and expenses) for the Fund do not exceed 0.35% (other than certain nonroutine expenses) until 6/30/11.
Annual Report | 29
Performance Summary (continued)
Total Return Index Comparison for a Hypothetical $10,000 Investment
Total return represents the change in value of an investment over the periods shown. It includes any current maximum sales charge, Fund expenses, account fees and reinvested distributions. The unmanaged index includes reinvestment of any income or distributions. It differs from the Fund in composition and does not pay management fees or expenses. One cannot invest directly in an index.
30 | Annual Report
Performance Summary (continued)
Endnotes
Because municipal bonds are sensitive to interest rate movements, the Fund’s yield and share price will fluctuate with market conditions. Bond prices generally move in the opposite direction of interest rates. Thus, as prices of bonds in the Fund adjust to a rise in interest rates, the Fund’s share price may decline. The manager applies various techniques and analyses in making investment decisions for the Fund, but there can be no guarantee that these decisions will produce the desired results. The Fund’s prospectus also includes a description of the main investment risks.
| |
| Class A: | Prior to 2/1/06, these shares were offered without an initial sales charge; thus actual total returns would have differed. |
| Advisor Class: | Shares are available to certain eligible investors as described in the prospectus. |
|
| 1. If the manager and administrator had not waived fees, the Fund’s distribution rate and total returns would have been lower, and yield for the period would |
| have been 1.34% for Class A. |
| 2. Cumulative total return represents the change in value of an investment over the periods indicated. |
| 3. Average annual total return represents the average annual change in value of an investment over the periods indicated. |
| 4. In accordance with SEC rules, we provide standardized average annual total return information through the latest calendar quarter. |
| 5. Distribution rate is based on an annualization of the respective class’s current monthly dividend and the maximum offering price (NAV for Advisor Class) |
| per share on 2/28/11. |
| 6. Taxable equivalent distribution rate and yield assume the 2011 maximum federal income tax rate of 35.00%. Because Advisor Class shares have existed |
| for fewer than 30 days, 30-day standardized yield is not available. |
| 7. The 30-day standardized yield for the month ended 2/28/11 reflects an estimated yield to maturity (assuming all portfolio securities are held to maturity). |
| It should be regarded as an estimate of the Fund’s rate of investment income, and it may not equal the Fund’s actual income distribution rate (which reflects |
| the Fund’s past dividends paid to shareholders) or the income reported in the Fund’s financial statements. Because Advisor Class shares have existed for |
| fewer than 30 days, 30-day standardized yield is not available. |
| 8. Figures are as stated in the Fund’s prospectus current as of the date of this report. In periods of market volatility, assets may decline significantly, causing |
| total annual Fund operating expenses to become higher than the figures shown. |
| 9. Effective 2/1/11, the Fund began offering Advisor Class shares, which do not have sales charges or a Rule 12b-1 plan. Performance quotations for this |
| class reflect the following methods of calculation: (a) For periods prior to 2/1/11, a restated figure is used based upon the Fund’s Class A performance, |
| excluding the effect of Class A’s maximum initial sales charge, but reflecting the effect of the Class A Rule 12b-1 fees; and (b) for periods after 1/31/11, |
| actual Advisor Class performance is used reflecting all charges and fees applicable to that class. Since 2/1/11 (commencement of sales), the cumulative |
| total return of Advisor Class shares was +0.33%. |
| 10. Source: © 2011 Morningstar. The BC Municipal Bond Index: 5-Year Component is the 5-year (4-6) component of the Municipal Bond Index, which is a |
| market value-weighted index engineered for the long-term tax-exempt bond market. To be included in the index, bonds must be fixed rate, have at least one |
| year to final maturity and be rated investment grade (Baa3/BBB- or higher) by at least two of the following agencies: Moody’s, Standard & Poor’s and Fitch. |
| The Consumer Price Index (CPI), calculated by the U.S. Bureau of Labor Statistics, is a commonly used measure of the inflation rate. |
Annual Report | 31
Your Fund’s Expenses
Franklin Federal Limited-Term Tax-Free Income Fund
As a Fund shareholder, you can incur two types of costs:
- Transaction costs, including sales charges (loads) on Fund purchases; and
- Ongoing Fund costs, including management fees, distribution and service (12b-1) fees, and other Fund expenses. All mutual funds have ongoing costs, sometimes referred to as operating expenses.
The following table shows ongoing costs of investing in the Fund and can help you understand these costs and compare them with those of other mutual funds. The table assumes a $1,000 investment held for the six months indicated.
Actual Fund Expenses
The first line (Actual) for each share class listed in the table provides actual account values and expenses. The “Ending Account Value” is derived from the Fund’s actual return, which includes the effect of Fund expenses.
You can estimate the expenses you paid during the period by following these steps. Of course, your account value and expenses will differ from those in this illustration:
| 1. | Divide your account value by $1,000. |
| | If an account had an $8,600 value, then $8,600 ÷ $1,000 = 8.6. |
| 2. | Multiply the result by the number under the heading “Expenses Paid During Period.” |
| | If Expenses Paid During Period were $7.50, then 8.6 x $7.50 = $64.50. |
In this illustration, the estimated expenses paid this period are $64.50.
Hypothetical Example for Comparison with Other Funds
Information in the second line (Hypothetical) for each class in the table can help you compare ongoing costs of investing in the Fund with those of other mutual funds. This information may not be used to estimate the actual ending account balance or expenses you paid during the period. The hypothetical “Ending Account Value” is based on the actual expense ratio for each class and an assumed 5% annual rate of return before expenses, which does not represent the Fund’s actual return. The figure under the heading “Expenses Paid During Period” shows the hypothetical expenses your account would have incurred under this scenario. You can compare this figure with the 5% hypothetical examples that appear in shareholder reports of other funds.
32 | Annual Report
Your Fund’s Expenses (continued)
Please note that expenses shown in the table are meant to highlight ongoing costs and do not reflect any transaction costs, such as sales charges. Therefore, the second line for each class is useful in comparing ongoing costs only, and will not help you compare total costs of owning different funds. In addition, if transaction costs were included, your total costs would have been higher. Please refer to the Fund prospectus for additional information on operating expenses.
| | | | | | |
| | | Beginning Account | | Ending Account | | Expenses Paid During |
| Class A | | Value 9/1/10 | | Value 2/28/11 | | Period* 9/1/10–2/28/11 |
| Actual | $ | 1,000 | $ | 990.50 | $ | 2.42 |
| Hypothetical (5% return before expenses) | $ | 1,000 | $ | 1,022.36 | $ | 2.46 |
| Advisor Class | | | | | | |
| Actual (2/1/11-2/28/11) | $ | 1,000 | $ | 1,003.30 | $ | 0.27 |
| Hypothetical (5% return before expenses) | $ | 1,000 | $ | 1,023.26 | $ | 1.76 |
*Expenses are calculated using the most recent six-month annualized expense ratio, net of expense waivers, annualized for each class (A: 0.50%; and Advisor: 0.35%), multiplied by the average account value over the period, multiplied by 181/365 (Hypothetical for all share classes; Actual for Class A) to reflect the one-half year period. For Actual Advisor Class expenses, the multiplier is 28/365 to reflect the number of days since inception.
Annual Report | 33
Franklin High Yield Tax-Free Income Fund
Your Fund’s Goals and Main Investments: Franklin High Yield Tax-Free Income Fund seeks to provide a high current yield exempt from federal income taxes by investing at least 80% of its net assets in securities that pay interest free from such taxes.1 Its secondary goal is capital appreciation to the extent possible and consistent with the Fund’s principal investment goal.
Performance data represent past performance, which does not guarantee future results. Investment return and principal value will fluctuate, and you may have a gain or loss when you sell your shares. Current performance may differ from figures shown. Please visit franklintempleton.com or call (800) 342-5236 for most recent month-end performance.
This annual report for Franklin High Yield Tax-Free Income Fund covers the fiscal year ended February 28, 2011.
Performance Overview
The Fund’s Class A share price, as measured by net asset value, decreased from $9.99 on February 28, 2010, to $9.60 on February 28, 2011. The Fund’s
1. Dividends are generally subject to state and local taxes, if any. For investors subject to alternative minimum tax, a small portion of Fund dividends may be taxable. Distributions of capital gains are generally taxable. To avoid imposition of 28% backup withholding on all Fund distributions and redemption proceeds, U.S. investors must be properly certified on Form W-9 and non-U.S. investors on Form W-8BEN.
The dollar value, number of shares or principal amount, and names of all portfolio holdings are listed in the Fund’s Statement of Investments (SOI). The SOI begins on page 114.
34 | Annual Report
| | | | |
| Dividend Distributions* | | | | |
| Franklin High Yield Tax-Free Income Fund | | | |
| | | Dividend per Share | |
| Month | Class A | Class B | Class C | Advisor Class |
| March 2010 | 4.31 cents | 3.82 cents | 3.81 cents | 4.39 cents |
| April 2010 | 4.31 cents | 3.82 cents | 3.81 cents | 4.39 cents |
| May 2010 | 4.31 cents | 3.82 cents | 3.81 cents | 4.39 cents |
| June 2010 | 4.31 cents | 3.87 cents | 3.84 cents | 4.39 cents |
| July 2010 | 4.31 cents | 3.87 cents | 3.84 cents | 4.39 cents |
| August 2010 | 4.31 cents | 3.87 cents | 3.84 cents | 4.39 cents |
| September 2010 | 4.31 cents | 3.85 cents | 3.84 cents | 4.39 cents |
| October 2010 | 4.26 cents | 3.80 cents | 3.79 cents | 4.34 cents |
| November 2010 | 4.26 cents | 3.80 cents | 3.79 cents | 4.34 cents |
| December 2010 | 4.21 cents | 3.72 cents | 3.72 cents | 4.30 cents |
| January 2011 | 4.21 cents | 3.72 cents | 3.72 cents | 4.30 cents |
| February 2011 | 4.21 cents | 3.72 cents | 3.72 cents | 4.30 cents |
*Assumes shares were purchased and held for the entire accrual period, which differs from the calendar month. Since dividends accrue daily, your actual distributions will vary depending on the date you purchased your shares and any account activity. All Fund distributions will vary depending upon current market conditions, and past distributions are not indicative of future trends.
Class A shares paid dividends totaling 51.64 cents per share for the same period.2 The Performance Summary beginning on page 37 shows that at the end of this reporting period the Fund’s Class A shares’ distribution rate was 5.23% based on an annualization of the current 4.37 cent per share dividend and the maximum offering price of $10.03 on February 28, 2011. An investor in the 2011 maximum federal income tax bracket of 35.00% would need to earn a distribution rate of 8.05% from a taxable investment to match the Fund’s Class A tax-free distribution rate. For the Fund’s Class B, C and Advisor shares’ performance, please see the Performance Summary. Dividend distributions during the year under review were affected by securities purchased in the prior period and by falling municipal bond rates in 2009 through November 2010. In addition, for most of the Fund’s fiscal year, investor demand was strong for municipal bonds in an environment of limited tax-exempt supply. These factors resulted in reduced income for the portfolio and caused dividends to decline.
2. All Fund distributions will vary depending upon current market conditions, and past distributions are not indicative of future trends.
Annual Report | 35
| | |
| Portfolio Breakdown | | |
| Franklin High Yield Tax-Free Income Fund | |
| 2/28/11 | | |
| % of Total | |
| Long-Term Investments* | |
| Utilities | 22.2 | % |
| Hospital & Health Care | 16.3 | % |
| Transportation | 16.1 | % |
| Tax-Supported | 10.0 | % |
| Refunded | 7.8 | % |
| General Obligation | 7.4 | % |
| Corporate-Backed | 6.1 | % |
| Other Revenue | 6.1 | % |
| Subject to Government Appropriations | 5.2 | % |
| Higher Education | 1.9 | % |
| Housing | 0.9 | % |
| |
| *Does not include short-term investments and other | |
| net assets. | | |
Manager’s Discussion
We used various investment strategies during the 12 months under review as we sought to maximize tax-free income for shareholders. Please read the discussion on page 6 for details.
During the reporting period, the Fund continued to generate high, current, tax-free income for its shareholders. Consistent with our strategy, the Fund did not use leverage or credit derivatives to boost short-term returns, and we were careful to not overexpose the portfolio to any one credit sector. At period-end, we believed the Fund was well positioned for any changes in yield spreads or interest rates.
Thank you for your continued participation in Franklin High Yield Tax-Free Income Fund. We intend to maintain our conservative, buy-and-hold investment strategy as we attempt to provide shareholders with high, current, tax-free income.
The foregoing information reflects our analysis, opinions and portfolio holdings as of February 28, 2011, the end of the reporting period. The way we implement our main investment strategies and the resulting portfolio holdings may change depending on factors such as market and economic conditions. These opinions may not be relied upon as investment advice or an offer for a particular security. The information is not a complete analysis of every aspect of any market, state, industry, security or the Fund. Statements of fact are from sources considered reliable, but the investment manager makes no representation or warranty as to their completeness or accuracy. Although historical performance is no guarantee of future results, these insights may help you understand our investment management philosophy.
36 | Annual Report
Performance Summary as of 2/28/11
Franklin High Yield Tax-Free Income Fund
Your dividend income will vary depending on dividends or interest paid by securities in the Fund’s portfolio, adjusted for operating expenses of each class. Capital gain distributions are net profits realized from the sale of portfolio securities. The performance table and graphs do not reflect any taxes that a shareholder would pay on Fund dividends, capital gain distributions, if any, or any realized gains on the sale of Fund shares. Total return reflects reinvestment of the Fund’s dividends and capital gain distributions, if any, and any unrealized gains or losses.
| | | | | | | | |
| Price and Distribution Information | | | | | | |
| Class A (Symbol: FRHIX) | | | | Change | | 2/28/11 | | 2/28/10 |
| Net Asset Value (NAV) | | | -$ | 0.39 | $ | 9.60 | $ | 9.99 |
| Distributions (3/1/10–2/28/11) | | | | | | | | |
| Dividend Income | $ | 0.5164 | | | | | | |
| Class B (Symbol: FYIBX) | | | | Change | | 2/28/11 | | 2/28/10 |
| Net Asset Value (NAV) | | | -$ | 0.38 | $ | 9.68 | $ | 10.06 |
| Distributions (3/1/10–2/28/11) | | | | | | | | |
| Dividend Income | $ | 0.4598 | | | | | | |
| Class C (Symbol: FHYIX) | | | | Change | | 2/28/11 | | 2/28/10 |
| Net Asset Value (NAV) | | | -$ | 0.39 | $ | 9.73 | $ | 10.12 |
| Distributions (3/1/10–2/28/11) | | | | | | | | |
| Dividend Income | $ | 0.4583 | | | | | | |
| Advisor Class (Symbol: FHYVX) | | | | Change | | 2/28/11 | | 2/28/10 |
| Net Asset Value (NAV) | | | -$ | 0.39 | $ | 9.63 | $ | 10.02 |
| Distributions (3/1/10–2/28/11) | | | | | | | | |
| Dividend Income | $ | 0.5263 | | | | | | |
Annual Report | 37
Performance Summary (continued)
Performance
Cumulative total return excludes sales charges. Average annual total returns include maximum sales charges. Class A: 4.25% maximum initial sales charge; Class B: contingent deferred sales charge (CDSC) declining from 4% to 1% over six years, and eliminated thereafter; Class C: 1% CDSC in first year only; Advisor Class: no sales charges.
| | | | | | | | | | | |
| Class A | | | | 1-Year | | | 5-Year | | | 10-Year | |
| Cumulative Total Return1 | | | + | 1.19 | % | + | 15.54 | % | + | 56.91 | % |
| Average Annual Total Return2 | | | | -3.08 | % | + | 2.04 | % | + | 4.15 | % |
| Avg. Ann. Total Return (3/31/11)3 | | | | -4.09 | % | + | 1.95 | % | + | 3.99 | % |
| Distribution Rate4 | 5.23 | % | | | | | | | | | |
| Taxable Equivalent Distribution Rate5 | 8.05 | % | | | | | | | | | |
| 30-Day Standardized Yield6 | 5.10 | % | | | | | | | | | |
| Taxable Equivalent Yield5 | 7.85 | % | | | | | | | | | |
| Total Annual Operating Expenses7 | 0.63 | % | | | | | | | | | |
| Class B | | | | 1-Year | | | 5-Year | | | 10-Year | |
| Cumulative Total Return1 | | | + | 0.72 | % | + | 12.41 | % | + | 50.18 | % |
| Average Annual Total Return2 | | | | -3.13 | % | + | 2.04 | % | + | 4.15 | % |
| Avg. Ann. Total Return (3/31/11)3 | | | | -4.32 | % | + | 1.95 | % | + | 3.97 | % |
| Distribution Rate4 | 4.91 | % | | | | | | | | | |
| Taxable Equivalent Distribution Rate5 | 7.55 | % | | | | | | | | | |
| 30-Day Standardized Yield6 | 4.77 | % | | | | | | | | | |
| Taxable Equivalent Yield5 | 7.34 | % | | | | | | | | | |
| Total Annual Operating Expenses7 | 1.18 | % | | | | | | | | | |
| Class C | | | | 1-Year | | | 5-Year | | | 10-Year | |
| Cumulative Total Return1 | | | + | 0.59 | % | + | 12.31 | % | + | 48.48 | % |
| Average Annual Total Return2 | | | | -0.37 | % | + | 2.35 | % | + | 4.03 | % |
| Avg. Ann. Total Return (3/31/11)3 | | | | -1.48 | % | + | 2.28 | % | + | 3.87 | % |
| Distribution Rate4 | 4.87 | % | | | | | | | | | |
| Taxable Equivalent Distribution Rate5 | 7.49 | % | | | | | | | | | |
| 30-Day Standardized Yield6 | 4.79 | % | | | | | | | | | |
| Taxable Equivalent Yield5 | 7.37 | % | | | | | | | | | |
| Total Annual Operating Expenses7 | 1.18 | % | | | | | | | | | |
| Advisor Class8 | | | | 1-Year | | | 5-Year | | | 10-Year | |
| Cumulative Total Return1 | | | + | 1.29 | % | + | 16.18 | % | + | 57.72 | % |
| Average Annual Total Return2 | | | + | 1.29 | % | + | 3.04 | % | + | 4.66 | % |
| Avg. Ann. Total Return (3/31/11)3 | | | + | 0.23 | % | + | 2.95 | % | + | 4.49 | % |
| Distribution Rate4 | 5.53 | % | | | | | | | | | |
| Taxable Equivalent Distribution Rate5 | 8.51 | % | | | | | | | | | |
| 30-Day Standardized Yield6 | 5.46 | % | | | | | | | | | |
| Taxable Equivalent Yield5 | 8.40 | % | | | | | | | | | |
| Total Annual Operating Expenses7 | 0.53 | % | | | | | | | | | |
Performance data represent past performance, which does not guarantee future results. Investment return and principal value will fluctuate, and you may have a gain or loss when you sell your shares. Current performance may differ from figures shown. For most recent month-end performance, go to franklintempleton.com or call (800) 342-5236.
38 | Annual Report
Performance Summary (continued)
Total Return Index Comparison for a Hypothetical $10,000 Investment
Total return represents the change in value of an investment over the periods shown. It includes any current, applicable, maximum sales charge, Fund expenses, account fees and reinvested distributions. The unmanaged index includes reinvestment of any income or distributions. It differs from the Fund in composition and does not pay management fees or expenses. One cannot invest directly in an index.
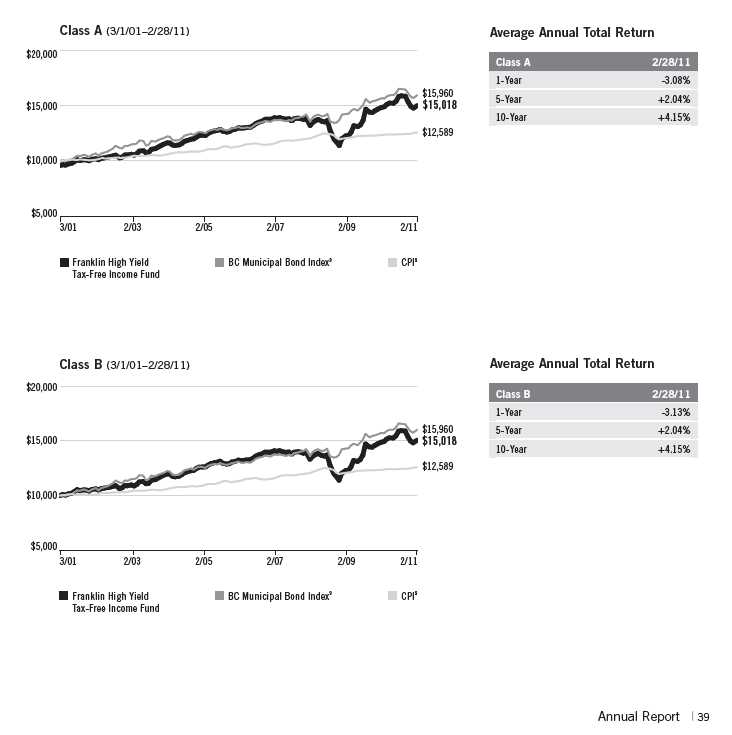
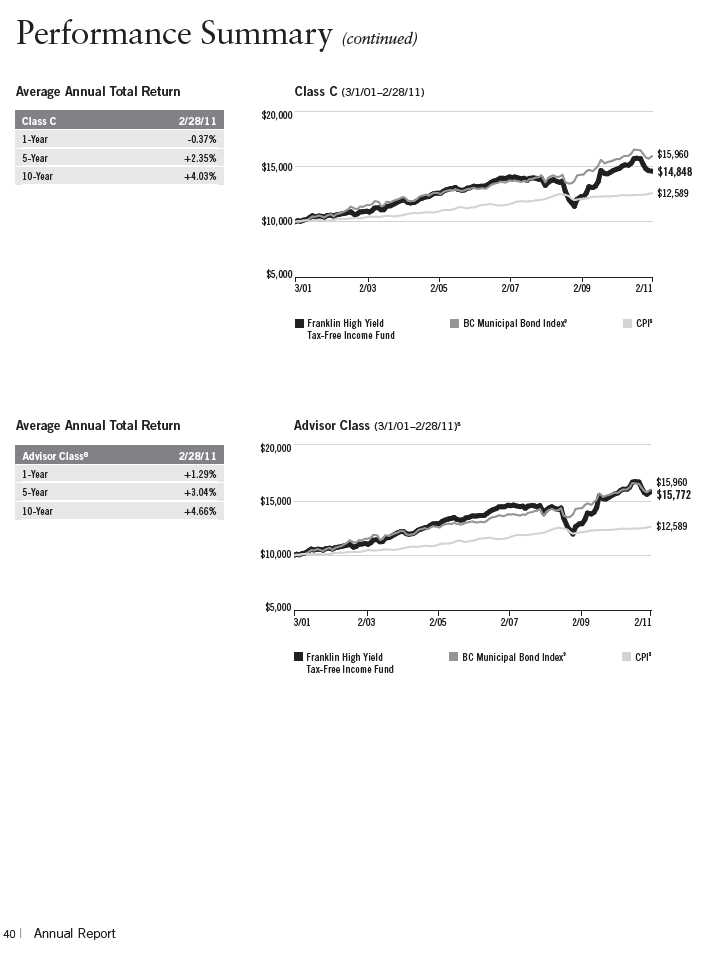
Performance Summary (continued)
Endnotes
Because municipal bonds are sensitive to interest rate movements, the Fund’s yield and share price will fluctuate with market conditions. Bond prices generally move in the opposite direction of interest rates. Thus, as prices of bonds in the Fund adjust to a rise in interest rates, the Fund’s share price may decline. In general, an investor is paid a higher yield to assume a greater degree of credit risk. The manager applies various techniques and analyses in making investment decisions for the Fund, but there can be no guarantee that these decisions will produce the desired results. The Fund’s prospectus also includes a description of the main investment risks.
| |
| Class B: | These shares have higher annual fees and expenses than Class A shares. |
| Class C: | Prior to 1/1/04, these shares were offered with an initial sales charge; thus actual total returns would have differed. These shares |
| | have higher annual fees and expenses than Class A shares. |
| Advisor Class: | Shares are available to certain eligible investors as described in the prospectus. |
|
| 1. Cumulative total return represents the change in value of an investment over the periods indicated. |
| 2. Average annual total return represents the average annual change in value of an investment over the periods indicated. |
| 3. In accordance with SEC rules, we provide standardized average annual total return information through the latest calendar quarter. |
| 4. Distribution rate is based on an annualization of the respective class’s current monthly dividend and the maximum offering price (NAV for Classes |
| B, C and Advisor) per share on 2/28/11. |
| 5. Taxable equivalent distribution rate and yield assume the 2011 maximum federal income tax rate of 35.00%. |
| 6. The 30-day standardized yield for the month ended 2/28/11 reflects an estimated yield to maturity (assuming all portfolio securities are held to |
| maturity). It should be regarded as an estimate of the Fund’s rate of investment income, and it may not equal the Fund’s actual income distribution |
| rate (which reflects the Fund’s past dividends paid to shareholders) or the income reported in the Fund’s financial statements. |
| 7. Figures are as stated in the Fund’s prospectus current as of the date of this report. In periods of market volatility, assets may decline significantly, |
| causing total annual Fund operating expenses to become higher than the figures shown. |
| 8. Effective 1/3/06, the Fund began offering Advisor Class shares, which do not have sales charges or a Rule 12b-1 plan. Performance quotations for |
| this class reflect the following methods of calculation: (a) For periods prior to 1/3/06, a restated figure is used based upon the Fund’s Class A per- |
| formance, excluding the effect of Class A’s maximum initial sales charge, but reflecting the effect of the Class A Rule 12b-1 fees; and (b) for periods |
| after 1/2/06, actual Advisor Class performance is used reflecting all charges and fees applicable to that class. Since 1/3/06 (commencement of |
| sales), the cumulative and average annual total returns of Advisor Class shares were +17.74% and +3.22%. |
| 9. Source: © 2011 Morningstar. The BC Municipal Bond Index is a market value-weighted index engineered for the long-term tax-exempt bond mar- |
| ket. To be included in the index, bonds must be fixed rate, have at least one year to final maturity and be rated investment grade (Baa3/BBB- or |
| higher) by at least two of the following agencies: Moody’s, Standard & Poor’s and Fitch. The Consumer Price Index (CPI), calculated by the U.S. |
| Bureau of Labor Statistics, is a commonly used measure of the inflation rate. |
Annual Report | 41
Your Fund’s Expenses
Franklin High Yield Tax-Free Income Fund
As a Fund shareholder, you can incur two types of costs:
- Transaction costs, including sales charges (loads) on Fund purchases; and
- Ongoing Fund costs, including management fees, distribution and service (12b-1) fees, and other Fund expenses. All mutual funds have ongoing costs, sometimes referred to as operating expenses.
The following table shows ongoing costs of investing in the Fund and can help you understand these costs and compare them with those of other mutual funds. The table assumes a $1,000 investment held for the six months indicated.
Actual Fund Expenses
The first line (Actual) for each share class listed in the table provides actual account values and expenses. The “Ending Account Value” is derived from the Fund’s actual return, which includes the effect of Fund expenses.
You can estimate the expenses you paid during the period by following these steps. Of course, your account value and expenses will differ from those in this illustration:
| 1. | Divide your account value by $1,000. |
| | If an account had an $8,600 value, then $8,600 ÷ $1,000 = 8.6. |
| 2. | Multiply the result by the number under the heading “Expenses Paid During Period.” |
| | If Expenses Paid During Period were $7.50, then 8.6 x $7.50 = $64.50. |
In this illustration, the estimated expenses paid this period are $64.50.
Hypothetical Example for Comparison with Other Funds
Information in the second line (Hypothetical) for each class in the table can help you compare ongoing costs of investing in the Fund with those of other mutual funds. This information may not be used to estimate the actual ending account balance or expenses you paid during the period. The hypothetical “Ending Account Value” is based on the actual expense ratio for each class and an assumed 5% annual rate of return before expenses, which does not represent the Fund’s actual return. The figure under the heading “Expenses Paid During Period” shows the hypothetical expenses your account would have incurred under this scenario. You can compare this figure with the 5% hypothetical examples that appear in shareholder reports of other funds.
42 | Annual Report
Your Fund’s Expenses (continued)
Please note that expenses shown in the table are meant to highlight ongoing costs and do not reflect any transaction costs, such as sales charges. Therefore, the second line for each class is useful in comparing ongoing costs only, and will not help you compare total costs of owning different funds. In addition, if transaction costs were included, your total costs would have been higher. Please refer to the Fund prospectus for additional information on operating expenses.
| | | | | | |
| | | Beginning Account | | Ending Account | | Expenses Paid During |
| Class A | | Value 9/1/10 | | Value 2/28/11 | | Period* 9/1/10–2/28/11 |
| Actual | $ | 1,000 | $ | 947.90 | $ | 3.09 |
| Hypothetical (5% return before expenses) | $ | 1,000 | $ | 1,021.62 | $ | 3.21 |
| Class B | | | | | | |
| Actual | $ | 1,000 | $ | 945.70 | $ | 5.74 |
| Hypothetical (5% return before expenses) | $ | 1,000 | $ | 1,018.89 | $ | 5.96 |
| Class C | | | | | | |
| Actual | $ | 1,000 | $ | 945.00 | $ | 5.74 |
| Hypothetical (5% return before expenses) | $ | 1,000 | $ | 1,018.89 | $ | 5.96 |
| Advisor Class | | | | | | |
| Actual | $ | 1,000 | $ | 948.60 | $ | 2.61 |
| Hypothetical (5% return before expenses) | $ | 1,000 | $ | 1,022.12 | $ | 2.71 |
*Expenses are calculated using the most recent six-month expense ratio, annualized for each class (A: 0.64%; B: 1.19%; C: 1.19%; and Advisor: 0.54%), multiplied by the average account value over the period, multiplied by 181/365 to reflect the one-half year period.
Annual Report | 43
Franklin Insured Tax-Free Income Fund
Your Fund’s Goal and Main Investments: Franklin Insured Tax-Free Income Fund seeks to provide as high a level of income exempt from federal income taxes as is consistent with prudent investment management and preservation of capital by investing at least 80% of its total assets in securities that pay interest free from such taxes.1 The Fund invests predominantly in insured municipal securities.2
Performance data represent past performance, which does not guarantee future results. Investment return and principal value will fluctuate, and you may have a gain or loss when you sell your shares. Current performance may differ from figures shown. Please visit franklintempleton.com or call (800) 342-5236 for most recent month-end performance.
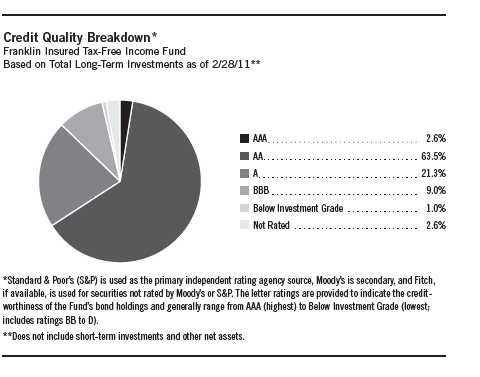
This annual report for Franklin Insured Tax-Free Income Fund covers the fiscal year ended February 28, 2011.
Performance Overview
The Fund’s Class A share price, as measured by net asset value, decreased from $11.88 on February 28, 2010, to $11.39 on February 28, 2011. The Fund’s
1. Dividends are generally subject to state and local taxes, if any. For investors subject to alternative minimum tax, a small portion of Fund dividends may be taxable. Distributions of capital gains are generally taxable. To avoid imposition of 28% backup withholding on all Fund distributions and redemption proceeds, U.S. investors must be properly certified on Form W-9 and non-U.S. investors on Form W-8BEN.
2. Fund shares are not insured by any U.S. or other government agency. They are subject to market risks and will fluctuate in value.
The dollar value, number of shares or principal amount, and names of all portfolio holdings are listed in the Fund’s Statement of Investments (SOI). The SOI begins on page 145.
44 | Annual Report
| | | | |
| Dividend Distributions* | | | | |
| Franklin Insured Tax-Free Income Fund | | | |
| | | Dividend per Share | |
| Month | Class A | Class B | Class C | Advisor Class |
| March 2010 | 4.30 cents | 3.75 cents | 3.73 cents | 4.40 cents |
| April 2010 | 4.30 cents | 3.75 cents | 3.73 cents | 4.40 cents |
| May 2010 | 4.30 cents | 3.75 cents | 3.73 cents | 4.40 cents |
| June 2010 | 4.30 cents | 3.78 cents | 3.75 cents | 4.43 cents |
| July 2010 | 4.30 cents | 3.78 cents | 3.75 cents | 4.43 cents |
| August 2010 | 4.30 cents | 3.78 cents | 3.75 cents | 4.43 cents |
| September 2010 | 4.30 cents | 3.75 cents | 3.74 cents | 4.39 cents |
| October 2010 | 4.20 cents | 3.65 cents | 3.64 cents | 4.29 cents |
| November 2010 | 4.13 cents | 3.58 cents | 3.57 cents | 4.22 cents |
| December 2010 | 4.13 cents | 3.57 cents | 3.56 cents | 4.22 cents |
| January 2011 | 4.13 cents | 3.57 cents | 3.56 cents | 4.22 cents |
| February 2011 | 4.13 cents | 3.57 cents | 3.56 cents | 4.22 cents |
*Assumes shares were purchased and held for the entire accrual period, which differs from the calendar month. Since dividends accrue daily, your actual distributions will vary depending on the date you purchased your shares and any account activity. All Fund distributions will vary depending upon current market conditions, and past distributions are not indicative of future trends.
Class A shares paid dividends totaling 51.13 cents per share for the same period.3 The Performance Summary beginning on page 47 shows that at the end of this reporting period the Fund’s Class A shares’ distribution rate was 4.34% based on an annualization of the current 4.30 cent per share dividend and the maximum offering price of $11.90 on February 28, 2011. An investor in the 2011 maximum federal income tax bracket of 35.00% would need to earn a distribution rate of 6.68% from a taxable investment to match the Fund’s Class A tax-free distribution rate. For the Fund’s Class B, C and Advisor shares’ performance, please see the Performance Summary. Dividend distributions during the year under review were affected by securities purchased in the prior period and by falling municipal bond rates in 2009 through November 2010. In addition, for most of the Fund’s fiscal year, investor demand was strong for municipal bonds in an environment of limited tax-exempt supply. These factors resulted in reduced income for the portfolio and caused dividends to decline.
3. All Fund distributions will vary depending upon current market conditions, and past distributions are not indicative of future trends.
Annual Report | 45
| | |
| Portfolio Breakdown | | |
| Franklin Insured Tax-Free Income Fund | |
| 2/28/11 | | |
| % of Total | |
| Long-Term Investments* | |
| Utilities | 17.2 | % |
| Hospital & Health Care | 17.1 | % |
| General Obligation | 13.4 | % |
| Transportation | 13.3 | % |
| Subject to Government Appropriations | 11.9 | % |
| Refunded | 8.4 | % |
| Higher Education | 6.9 | % |
| Other Revenue | 6.5 | % |
| Tax-Supported | 4.6 | % |
| Housing | 0.7 | % |
| |
| *Does not include short-term investments and other | |
| net assets. | | |
Manager’s Discussion
We used various investment strategies during the 12 months under review as we sought to maximize tax-free income for shareholders. Please read the discussion on page 6 for details.
During the reporting period, we limited Fund purchases to bonds insured by Assured Guaranty and non-insured bonds rated AA or higher by independent credit rating agencies. The municipal bond insurance industry has gone through significant downgrades since the 2008 financial crisis. As a result, Assured Guaranty was the only major municipal bond insurer currently providing municipal bond insurance. Aside from Berkshire Hathaway Assurance, Assured Guaranty was the only insurer that carried a rating of AA. On October 25, 2010, Standard & Poor’s downgraded Assured Guaranty to AA+ from AAA, so that by the end of February 2011 no municipal bond insurers were rated AAA.
The rating agencies continued to reevaluate their methods for rating municipal bond insurance firms, which has created a measure of uncertainty with regard to ratings going forward. We will continue to closely monitor the municipal insurance industry’s progress and the market for insured bonds. As always, we strive for solid performance on a relative value basis with a focus on income and credit safety.
Thank you for your continued participation in Franklin Insured Tax-Free Income Fund. We intend to maintain our conservative, buy-and-hold investment strategy as we attempt to provide shareholders with high, current, tax-free income.
The foregoing information reflects our analysis, opinions and portfolio holdings as of February 28, 2011, the end of the reporting period. The way we implement our main investment strategies and the resulting portfolio holdings may change depending on factors such as market and economic conditions. These opinions may not be relied upon as investment advice or an offer for a particular security. The information is not a complete analysis of every aspect of any market, state, industry, security or the Fund. Statements of fact are from sources considered reliable, but the investment manager makes no representation or warranty as to their completeness or accuracy. Although historical performance is no guarantee of future results, these insights may help you understand our investment management philosophy.
46 | Annual Report
Performance Summary as of 2/28/11
Franklin Insured Tax-Free Income Fund
Your dividend income will vary depending on dividends or interest paid by securities in the Fund’s portfolio, adjusted for operating expenses of each class. Capital gain distributions are net profits realized from the sale of portfolio securities. The performance table and graphs do not reflect any taxes that a shareholder would pay on Fund dividends, capital gain distributions, if any, or any realized gains on the sale of Fund shares. Total return reflects reinvestment of the Fund’s dividends and capital gain distributions, if any, and any unrealized gains or losses.
| | | | | | | | |
| Price and Distribution Information | | | | | | |
| Class A (Symbol: FTFIX) | | | | Change | | 2/28/11 | | 2/28/10 |
| Net Asset Value (NAV) | | | -$ | 0.49 | $ | 11.39 | $ | 11.88 |
| Distributions (3/1/10–2/28/11) | | | | | | | | |
| Dividend Income | $ | 0.5113 | | | | | | |
| Class B (Symbol: FBITX) | | | | Change | | 2/28/11 | | 2/28/10 |
| Net Asset Value (NAV) | | | -$ | 0.49 | $ | 11.45 | $ | 11.94 |
| Distributions (3/1/10–2/28/11) | | | | | | | | |
| Dividend Income | $ | 0.4457 | | | | | | |
| Class C (Symbol: FRITX) | | | | Change | | 2/28/11 | | 2/28/10 |
| Net Asset Value (NAV) | | | -$ | 0.48 | $ | 11.53 | $ | 12.01 |
| Distributions (3/1/10–2/28/11) | | | | | | | | |
| Dividend Income | $ | 0.4436 | | | | | | |
| Advisor Class (Symbol: FINZX) | | | | Change | | 2/28/11 | | 2/28/10 |
| Net Asset Value (NAV) | | | -$ | 0.49 | $ | 11.39 | $ | 11.88 |
| Distributions (3/1/10–2/28/11) | | | | | | | | |
| Dividend Income | $ | 0.5237 | | | | | | |
Annual Report | 47
Performance Summary (continued)
Performance
Cumulative total return excludes sales charges. Average annual total returns include maximum sales charges. Class A: 4.25% maximum initial sales charge; Class B: contingent deferred sales charge (CDSC) declining from 4% to 1% over six years, and eliminated thereafter; Class C: 1% CDSC in first year only; Advisor Class: no sales charges.
| | | | | | | | | | | |
| Class A | | | | 1-Year | | | 5-Year | | | 10-Year | |
| Cumulative Total Return1 | | | + | 0.13 | % | + | 15.25 | % | + | 49.15 | % |
| Average Annual Total Return2 | | | | -4.15 | % | + | 1.99 | % | + | 3.63 | % |
| Avg. Ann. Total Return (3/31/11)3 | | | | -5.11 | % | + | 1.94 | % | + | 3.47 | % |
| Distribution Rate4 | 4.34 | % | | | | | | | | | |
| Taxable Equivalent Distribution Rate5 | 6.68 | % | | | | | | | | | |
| 30-Day Standardized Yield6 | 4.15 | % | | | | | | | | | |
| Taxable Equivalent Yield5 | 6.38 | % | | | | | | | | | |
| Total Annual Operating Expenses7 | 0.63 | % | | | | | | | | | |
| Class B | | | | 1-Year | | | 5-Year | | | 10-Year | |
| Cumulative Total Return1 | | | | -0.43 | % | + | 12.16 | % | + | 43.04 | % |
| Average Annual Total Return2 | | | | -4.26 | % | + | 1.98 | % | + | 3.64 | % |
| Avg. Ann. Total Return (3/31/11)3 | | | | -5.20 | % | + | 1.93 | % | + | 3.47 | % |
| Distribution Rate4 | 4.00 | % | | | | | | | | | |
| Taxable Equivalent Distribution Rate5 | 6.15 | % | | | | | | | | | |
| 30-Day Standardized Yield6 | 3.80 | % | | | | | | | | | |
| Taxable Equivalent Yield5 | 5.85 | % | | | | | | | | | |
| Total Annual Operating Expenses7 | 1.18 | % | | | | | | | | | |
| Class C | | | | 1-Year | | | 5-Year | | | 10-Year | |
| Cumulative Total Return1 | | | | -0.36 | % | + | 12.34 | % | + | 41.50 | % |
| Average Annual Total Return2 | | | | -1.32 | % | + | 2.36 | % | + | 3.53 | % |
| Avg. Ann. Total Return (3/31/11)3 | | | | -2.28 | % | + | 2.30 | % | + | 3.37 | % |
| Distribution Rate4 | 3.95 | % | | | | | | | | | |
| Taxable Equivalent Distribution Rate5 | 6.08 | % | | | | | | | | | |
| 30-Day Standardized Yield6 | 3.79 | % | | | | | | | | | |
| Taxable Equivalent Yield5 | 5.83 | % | | | | | | | | | |
| Total Annual Operating Expenses7 | 1.18 | % | | | | | | | | | |
| Advisor Class8 | | | | 1-Year | | | 5-Year | | | 10-Year | |
| Cumulative Total Return1 | | | + | 0.23 | % | + | 15.57 | % | + | 49.56 | % |
| Average Annual Total Return2 | | | + | 0.23 | % | + | 2.94 | % | + | 4.11 | % |
| Avg. Ann. Total Return (3/31/11)3 | | | | -0.76 | % | + | 2.88 | % | + | 3.95 | % |
| Distribution Rate4 | 4.63 | % | | | | | | | | | |
| Taxable Equivalent Distribution Rate5 | 7.12 | % | | | | | | | | | |
| 30-Day Standardized Yield6 | 4.45 | % | | | | | | | | | |
| Taxable Equivalent Yield5 | 6.85 | % | | | | | | | | | |
| Total Annual Operating Expenses7 | 0.53 | % | | | | | | | | | |
Performance data represent past performance, which does not guarantee future results. Investment return and principal value will fluctuate, and you may have a gain or loss when you sell your shares. Current performance may differ from figures shown. For most recent month-end performance, go to franklintempleton.com or call (800) 342-5236.
48 | Annual Report
Performance Summary (continued)
Total Return Index Comparison for a Hypothetical $10,000 Investment
Total return represents the change in value of an investment over the periods shown. It includes any current, applicable, maximum sales charge, Fund expenses, account fees and reinvested distributions. The unmanaged index includes reinvestment of any income or distributions. It differs from the Fund in composition and does not pay management fees or expenses. One cannot invest directly in an index.
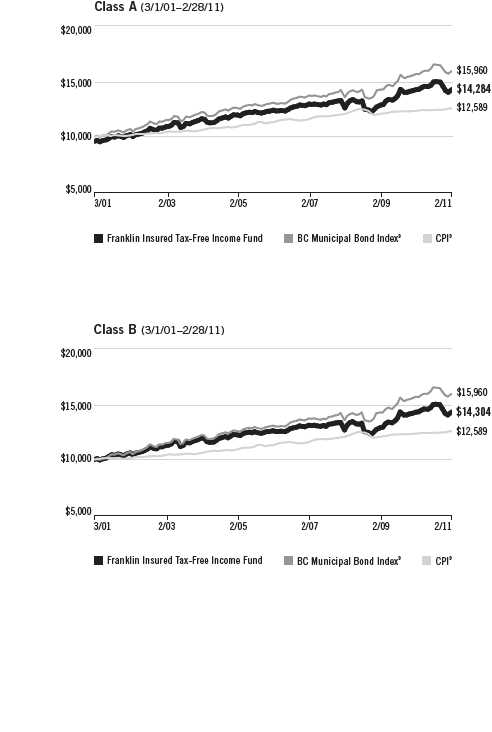
Average Annual Total Return
| | | |
| Class A | | 2/28/11 | |
| 1-Year | | -4.15 | % |
| 5-Year | + | 1.99 | % |
| 10-Year | + | 3.63 | % |
Average Annual Total Return
| | | |
| Class B | | 2/28/11 | |
| 1-Year | | -4.26 | % |
| 5-Year | + | 1.98 | % |
| 10-Year | + | 3.64 | % |
Annual Report | 49
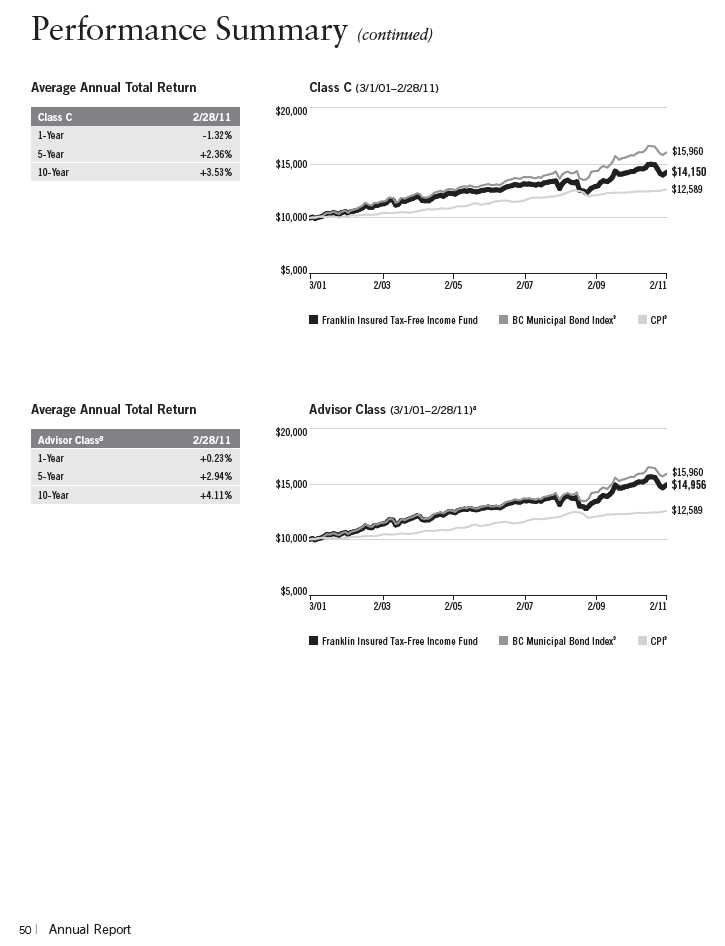
Performance Summary (continued)
Endnotes
Because municipal bonds are particularly sensitive to interest rate movements, the Fund’s yield and share price will fluctuate with market conditions. Bond prices generally move in the opposite direction of interest rates. Thus, as prices of bonds in the Fund adjust to a rise in interest rates, the Fund’s share price may decline. The manager applies various techniques and analyses in making investment decisions for the Fund, but there can be no guarantee that these decisions will produce the desired results. The Fund’s prospectus also includes a description of the main investment risks.
| |
Class B: Class C: | These shares have higher annual fees and expenses than Class A shares. Prior to 1/1/04, these shares were offered with an initial sales charge; thus actual total returns would have differed. These shares have higher annual fees and expenses than Class A shares. |
Advisor Class: | Shares are available to certain eligible investors as described in the prospectus. |
1. Cumulative total return represents the change in value of an investment over the periods indicated.
2. Average annual total return represents the average annual change in value of an investment over the periods indicated.
3. In accordance with SEC rules, we provide standardized average annual total return information through the latest calendar quarter.
4. Distribution rate is based on an annualization of the respective class’s current monthly dividend and the maximum offering price (NAV for Classes B, C and Advisor) per share on 2/28/11.
5. Taxable equivalent distribution rate and yield assume the 2011 maximum federal income tax rate of 35.00%.
6. The 30-day standardized yield for the month ended 2/28/11 reflects an estimated yield to maturity (assuming all portfolio securities are held to maturity). It should be regarded as an estimate of the Fund’s rate of investment income, and it may not equal the Fund’s actual income distribution rate (which reflects the Fund’s past dividends paid to shareholders) or the income reported in the Fund’s financial statements.
7. Figures are as stated in the Fund’s prospectus current as of the date of this report. In periods of market volatility, assets may decline significantly, causing total annual Fund operating expenses to become higher than the figures shown.
8. Effective 7/1/08, the Fund began offering Advisor Class shares, which do not have sales charges or a Rule 12b-1 plan. Performance quotations for this class reflect the following methods of calculation: (a) For periods prior to 7/1/08, a restated figure is used based upon the Fund’s Class A performance, excluding the effect of Class A’s maximum initial sales charge, but reflecting the effect of the Class A Rule 12b-1 fees; and (b) for periods after 6/30/08, actual Advisor Class performance is used reflecting all charges and fees applicable to that class. Since 7/1/08 (commencement of sales), the cumulative and average annual total returns of Advisor Class shares were +8.42% and +3.08%.
9. Source: © 2011 Morningstar. The BC Municipal Bond Index is a market value-weighted index engineered for the long-term tax-exempt bond market. To be included in the index, bonds must be fixed rate, have at least one year to final maturity and be rated investment grade (Baa3/BBB- or higher) by at least two of the following agencies: Moody’s, Standard & Poor’s and Fitch. The Consumer Price Index (CPI), calculated by the U.S. Bureau of Labor Statistics, is a commonly used measure of the inflation rate.
Annual Report | 51
Your Fund’s Expenses
Franklin Insured Tax-Free Income Fund
As a Fund shareholder, you can incur two types of costs:
- Transaction costs, including sales charges (loads) on Fund purchases; and
- Ongoing Fund costs, including management fees, distribution and service (12b-1) fees, and other Fund expenses. All mutual funds have ongoing costs, sometimes referred to as operating expenses.
The following table shows ongoing costs of investing in the Fund and can help you understand these costs and compare them with those of other mutual funds. The table assumes a $1,000 investment held for the six months indicated.
Actual Fund Expenses
The first line (Actual) for each share class listed in the table provides actual account values and expenses. The “Ending Account Value” is derived from the Fund’s actual return, which includes the effect of Fund expenses.
You can estimate the expenses you paid during the period by following these steps. Of course, your account value and expenses will differ from those in this illustration:
| 1. | Divide your account value by $1,000. |
| | If an account had an $8,600 value, then $8,600 ÷ $1,000 = 8.6. |
| 2. | Multiply the result by the number under the heading “Expenses Paid During Period.” |
| | If Expenses Paid During Period were $7.50, then 8.6 x $7.50 = $64.50. |
In this illustration, the estimated expenses paid this period are $64.50.
Hypothetical Example for Comparison with Other Funds
Information in the second line (Hypothetical) for each class in the table can help you compare ongoing costs of investing in the Fund with those of other mutual funds. This information may not be used to estimate the actual ending account balance or expenses you paid during the period. The hypothetical “Ending Account Value” is based on the actual expense ratio for each class and an assumed 5% annual rate of return before expenses, which does not represent the Fund’s actual return. The figure under the heading “Expenses Paid During Period” shows the hypothetical expenses your account would have incurred under this scenario. You can compare this figure with the 5% hypothetical examples that appear in shareholder reports of other funds.
52 | Annual Report
Your Fund’s Expenses (continued)
Please note that expenses shown in the table are meant to highlight ongoing costs and do not reflect any transaction costs, such as sales charges. Therefore, the second line for each class is useful in comparing ongoing costs only, and will not help you compare total costs of owning different funds. In addition, if transaction costs were included, your total costs would have been higher. Please refer to the Fund prospectus for additional information on operating expenses.
| | | | | | |
| | | Beginning Account | | Ending Account | | Expenses Paid During |
| Class A | | Value 9/1/10 | | Value 2/28/11 | | Period* 9/1/10–2/28/11 |
| Actual | $ | 1,000 | $ | 954.70 | $ | 3.05 |
| Hypothetical (5% return before expenses) | $ | 1,000 | $ | 1,021.67 | $ | 3.16 |
| Class B | | | | | | |
| Actual | $ | 1,000 | $ | 952.20 | $ | 5.71 |
| Hypothetical (5% return before expenses) | $ | 1,000 | $ | 1,018.94 | $ | 5.91 |
| Class C | | | | | | |
| Actual | $ | 1,000 | $ | 952.50 | $ | 5.71 |
| Hypothetical (5% return before expenses) | $ | 1,000 | $ | 1,018.94 | $ | 5.91 |
| Advisor Class | | | | | | |
| Actual | $ | 1,000 | $ | 955.90 | $ | 2.57 |
| Hypothetical (5% return before expenses) | $ | 1,000 | $ | 1,022.17 | $ | 2.66 |
*Expenses are calculated using the most recent six-month expense ratio, annualized for each class (A: 0.63%; B: 1.18%; C: 1.18%; and Advisor: 0.53%), multiplied by the average account value over the period, multiplied by 181/365 to reflect the one-half year period.
Annual Report | 53
Franklin Massachusetts Tax-Free Income Fund
Your Fund’s Goal and Main Investments: Franklin Massachusetts Tax-Free Income Fund seeks to provide as high a level of income exempt from federal and Massachusetts personal income taxes as is consistent with prudent investment management and preservation of capital by investing at least 80% of its total assets in securities that pay interest free from such taxes.1
Performance data represent past performance, which does not guarantee future results. Investment return and principal value will fluctuate, and you may have a gain or loss when you sell your shares. Current performance may differ from figures shown. Please visit franklintempleton.com or call (800) 342-5236 for most recent month-end performance.
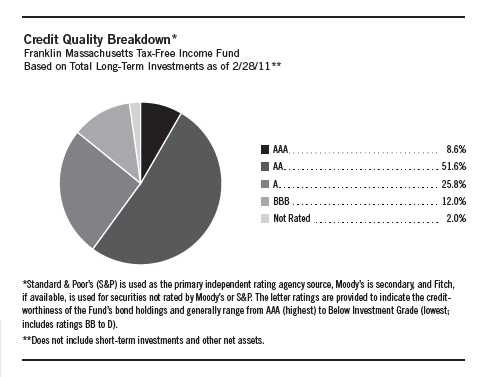
This annual report for Franklin Massachusetts Tax-Free Income Fund covers the fiscal year ended February 28, 2011.
Performance Overview
The Fund’s Class A share price, as measured by net asset value, decreased from $11.60 on February 28, 2010, to $11.11 on February 28, 2011. The Fund’s
1. For investors subject to alternative minimum tax, a small portion of Fund dividends may be taxable. Distributions of capital gains are generally taxable. To avoid imposition of 28% backup withholding on all Fund distributions and redemption proceeds, U.S. investors must be properly certified on Form W-9 and non-U.S. investors on Form W-8BEN.
The dollar value, number of shares or principal amount, and names of all portfolio holdings are listed in the Fund’s Statement of Investments (SOI). The SOI begins on page 164.
54 | Annual Report
| | | |
| Dividend Distributions* | | | |
| Franklin Massachusetts Tax-Free Income Fund | | | |
| | | Dividend per Share |
| Month | Class A | Class C | Advisor Class |
| March 2010 | 4.06 cents | 3.49 cents | 4.16 cents |
| April 2010 | 4.06 cents | 3.49 cents | 4.16 cents |
| May 2010 | 4.06 cents | 3.49 cents | 4.16 cents |
| June 2010 | 3.98 cents | 3.44 cents | 4.07 cents |
| July 2010 | 3.98 cents | 3.44 cents | 4.07 cents |
| August 2010 | 3.98 cents | 3.44 cents | 4.07 cents |
| September 2010 | 3.88 cents | 3.33 cents | 3.98 cents |
| October 2010 | 3.88 cents | 3.33 cents | 3.98 cents |
| November 2010 | 3.88 cents | 3.33 cents | 3.98 cents |
| December 2010 | 3.88 cents | 3.34 cents | 3.98 cents |
| January 2011 | 3.88 cents | 3.34 cents | 3.98 cents |
| February 2011 | 3.88 cents | 3.34 cents | 3.98 cents |
*Assumes shares were purchased and held for the entire accrual period, which differs from the calendar month. Since dividends accrue daily, your actual distributions will vary depending on the date you purchased your shares and any account activity. All Fund distributions will vary depending upon current market conditions, and past distributions are not indicative of future trends.
Class A shares paid dividends totaling 47.64 cents per share for the same period.2 The Performance Summary beginning on page 58 shows that at the end of this reporting period the Fund’s Class A shares’ distribution rate was 4.01% based on an annualization of the current 3.88 cent per share dividend and the maximum offering price of $11.60 on February 28, 2011. An investor in the 2011 maximum combined effective federal and Massachusetts personal income tax bracket of 38.45% would need to earn a distribution rate of 6.51% from a taxable investment to match the Fund’s Class A tax-free distribution rate. For the Fund’s Class C and Advisor shares’ performance, please see the Performance Summary. Dividend distributions during the year under review were affected by securities purchased in the prior period and by falling municipal bond rates in 2009 through November 2010. In addition, for most of the Fund’s fiscal year, investor demand was strong for municipal bonds in an environment of limited tax-exempt supply. These factors resulted in reduced income for the portfolio and caused dividends to decline.
2. All Fund distributions will vary depending upon current market conditions, and past distributions are not indicative of future trends.
Annual Report | 55
|
| Portfolio Breakdown |
| Franklin Massachusetts |
| Tax-Free Income Fund |
| 2/28/11 |
| |
| % of Total |
| Long-Term Investments* |
| | |
| Higher Education | 24.1 | % |
| Refunded | 16.5 | % |
| Tax-Supported | 14.9 | % |
| Other Revenue | 14.0 | % |
| Transportation | 11.9 | % |
| Utilities | 6.6 | % |
| General Obligation | 5.2 | % |
| Hospital & Health Care | 4.4 | % |
| Housing | 2.0 | % |
| Subject to Government Appropriations | 0.4 | % |
*Does not include short-term investments and other net assets.
Commonwealth Update
After declining through the recession, Massachusetts’ deep, diverse economy has been showing signs of steady recovery. The commonwealth’s unemployment rate, which remained below the national average throughout the recession and the reporting period, fell to 8.2% in February 2011 compared with 8.9% for the nation.3 At the same time, Massachusetts’ employment growth was quite strong relative to other states, and job losses in the 2008-2009 recession were significantly less severe than in earlier recessions. Massachusetts has led the northeast region in recovery, and its key economic anchors, centered on higher education, technology and health care, are expected to contribute to further positive economic growth prospects over time. However, slow population growth and high business and housing costs continued to pose economic challenges for the commonwealth.
Massachusetts’ strong and conservative financial management practices helped restore budget balance that was compromised by the economic downturn. After a period of steady downward revisions to revenues throughout the recession, recent revenue performance turned positive and the commonwealth ended fiscal year 2010 with a slight surplus. By January 2011, the current fiscal year budget was revised upward, reflecting better-than-forecast performance of income, sales and corporate taxes as business and consumer activity picked up. With cash flows stabilizing, underscored by an increase in the projected year-end cash balance of about $39 million for fiscal year 2011, the governor requested supplemental appropriations on the additional revenue to help cover health programs and other costs.4 Although Massachusetts is in a relatively better fiscal position than many states, by most measures its debt burden ranked among the highest in the country. Massachusetts’ net tax-supported debt was 9.2% of personal income and $4,606 per capita, compared with the 2.5% and $936 national medians, ranking the state’s debt levels second-highest among the 50 states.5
Independent credit rating agency Standard & Poor’s (S&P) rated Massachusetts’ general obligation (GO) bonds AA, due in part to its high wealth and income levels, steadily recovering economy, strong financial management, and swift action to restore balance after identifying revenue shortfalls throughout the recession.6 Furthermore, S&P revised the commonwealth’s GO bonds’ outlook from stable to positive in February 2011, due to the commonwealth’s ongoing
3. Source: Bureau of Labor Statistics.
4. Source: Standard & Poor’s, “Massachusetts; General Obligation,” RatingsDirect, 2/10/11.
5. Source: Moody’s Investors Service, “Special Comment: 2010 State Debt Medians Report,” May 2010.
6. This does not indicate S&P’s rating of the Fund.
56 | Annual Report
progress in improving financial, debt and budget management practices, while at the same time implementing cost control and reform measures associated with its long-term liabilities.
Manager’s Discussion
We used various investment strategies during the 12 months under review as we sought to maximize tax-free income for shareholders. Please read the discussion on page 6 for details.
Thank you for your continued participation in Franklin Massachusetts Tax-Free Income Fund. We intend to maintain our conservative, buy-and-hold investment strategy as we attempt to provide shareholders with high, current, tax-free income.
The foregoing information reflects our analysis, opinions and portfolio holdings as of February 28, 2011, the end of the reporting period. The way we implement our main investment strategies and the resulting portfolio holdings may change depending on factors such as market and economic conditions. These opinions may not be relied upon as investment advice or an offer for a particular security. The information is not a complete analysis of every aspect of any market, state, industry, security or the Fund. Statements of fact are from sources considered reliable, but the investment manager makes no representation or warranty as to their completeness or accuracy. Although historical performance is no guarantee of future results, these insights may help you understand our investment management philosophy.
Annual Report | 57
Performance Summary as of 2/28/11
Franklin Massachusetts Tax-Free Income Fund
Your dividend income will vary depending on dividends or interest paid by securities in the Fund’s portfolio, adjusted for operating expenses of each class. Capital gain distributions are net profits realized from the sale of portfolio securities. The performance table and graphs do not reflect any taxes that a shareholder would pay on Fund dividends, capital gain distributions, if any, or any realized gains on the sale of Fund shares. Total return reflects reinvestment of the Fund’s dividends and capital gain distributions, if any, and any unrealized gains or losses.
| | | | | | | | |
| Price and Distribution Information | | | | | | |
| Class A (Symbol: FMISX) | | | | Change | | 2/28/11 | | 2/28/10 |
| Net Asset Value (NAV) | | | -$ | 0.49 | $ | 11.11 | $ | 11.60 |
| Distributions (3/1/10–2/28/11) | | | | | | | | |
| Dividend Income | $ | 0.4764 | | | | | | |
| Long–Term Capital Gain | $ | 0.0208 | | | | | | |
| Total | $ | 0.4972 | | | | | | |
| Class C (Symbol: FMAIX) | | | | Change | | 2/28/11 | | 2/28/10 |
| Net Asset Value (NAV) | | | -$ | 0.48 | $ | 11.22 | $ | 11.70 |
| Distributions (3/1/10–2/28/11) | | | | | | | | |
| Dividend Income | $ | 0.4102 | | | | | | |
| Long–Term Capital Gain | $ | 0.0208 | | | | | | |
| Total | $ | 0.4310 | | | | | | |
| Advisor Class (Symbol: n/a) | | | | Change | | 2/28/11 | | 2/28/10 |
| Net Asset Value (NAV) | | | -$ | 0.49 | $ | 11.11 | $ | 11.60 |
| Distributions (3/1/10–2/28/11) | | | | | | | | |
| Dividend Income | $ | 0.4881 | | | | | | |
| Long–Term Capital Gain | $ | 0.0208 | | | | | | |
| Total | $ | 0.5089 | | | | | | |
58 | Annual Report
Performance Summary (continued)
Performance
Cumulative total return excludes sales charges. Average annual total returns include maximum sales charges. Class A: 4.25% maximum initial sales charge; Class C: 1% contingent deferred sales charge in first year only; Advisor Class: no sales charges.
| | | | | | | | | | | |
| Class A | | | | 1-Year | | | 5-Year | | | 10-Year | |
| Cumulative Total Return1 | | | + | 0.01 | % | + | 15.30 | % | + | 48.89 | % |
| Average Annual Total Return2 | | | | -4.20 | % | + | 2.00 | % | + | 3.61 | % |
| Avg. Ann. Total Return (3/31/11)3 | | | | -5.28 | % | + | 1.97 | % | + | 3.45 | % |
| Distribution Rate4 | 4.01 | % | | | | | | | | | |
| Taxable Equivalent Distribution Rate5 | 6.51 | % | | | | | | | | | |
| 30-Day Standardized Yield6 | 3.57 | % | | | | | | | | | |
| Taxable Equivalent Yield5 | 5.80 | % | | | | | | | | | |
| Total Annual Operating Expenses7 | 0.67 | % | | | | | | | | | |
| Class C | | | | 1-Year | | | 5-Year | | | 10-Year | |
| Cumulative Total Return1 | | | | -0.47 | % | + | 12.32 | % | + | 40.99 | % |
| Average Annual Total Return2 | | | | -1.43 | % | + | 2.35 | % | + | 3.49 | % |
| Avg. Ann. Total Return (3/31/11)3 | | | | -2.68 | % | + | 2.28 | % | + | 3.32 | % |
| Distribution Rate4 | 3.64 | % | | | | | | | | | |
| Taxable Equivalent Distribution Rate5 | 5.91 | % | | | | | | | | | |
| 30-Day Standardized Yield6 | 3.21 | % | | | | | | | | | |
| Taxable Equivalent Yield5 | 5.21 | % | | | | | | | | | |
| Total Annual Operating Expenses7 | 1.22 | % | | | | | | | | | |
| Advisor Class8 | | | | 1-Year | | | 5-Year | | | 10-Year | |
| Cumulative Total Return1 | | | + | 0.12 | % | + | 15.49 | % | + | 49.13 | % |
| Average Annual Total Return2 | | | + | 0.12 | % | + | 2.92 | % | + | 4.08 | % |
| Avg. Ann. Total Return (3/31/11)3 | | | | -1.10 | % | + | 2.87 | % | + | 3.90 | % |
| Distribution Rate4 | 4.29 | % | | | | | | | | | |
| Taxable Equivalent Distribution Rate5 | 6.97 | % | | | | | | | | | |
| 30-Day Standardized Yield6 | 3.82 | % | | | | | | | | | |
| Taxable Equivalent Yield5 | 6.21 | % | | | | | | | | | |
| Total Annual Operating Expenses7 | 0.57 | % | | | | | | | | | |
Performance data represent past performance, which does not guarantee future results. Investment return and principal value will fluctuate, and you may have a gain or loss when you sell your shares. Current performance may differ from figures shown. For most recent month-end performance, go to franklintempleton.com or call (800) 342-5236.
Annual Report | 59
Performance Summary (continued)
Total Return Index Comparison for a Hypothetical $10,000 Investment
Total return represents the change in value of an investment over the periods shown. It includes any current, applicable, maximum sales charge, Fund expenses, account fees and reinvested distributions. The unmanaged index includes reinvestment of any income or distributions. It differs from the Fund in composition and does not pay management fees or expenses. One cannot invest directly in an index.
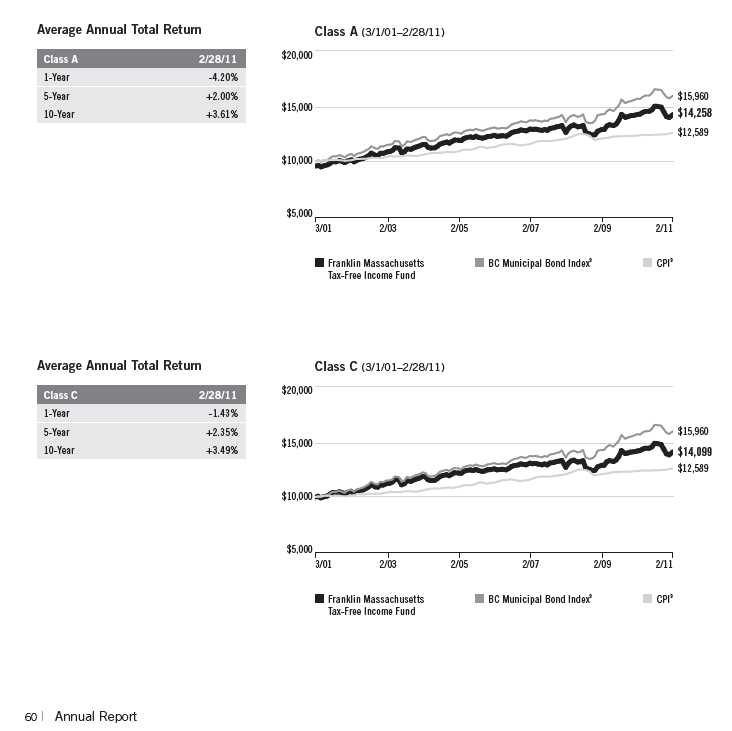
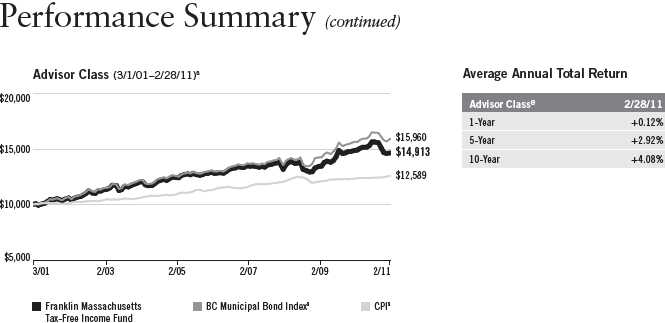
Endnotes
Because municipal bonds are sensitive to interest rate movements, the Fund’s yield and share price will fluctuate with market conditions. Bond prices generally move in the opposite direction of interest rates. Thus, as prices of bonds in the Fund adjust to a rise in interest rates, the Fund’s share price may decline. Since the Fund concentrates its investments in a single state, it is subject to greater risk of adverse economic and regulatory changes in that state than a geographically diversified fund. The manager applies various techniques and analyses in making investment decisions for the Fund, but there can be no guarantee that these decisions will produce the desired results. The Fund’s prospectus also includes a description of the main investment risks.
| |
Class C: | Prior to 1/1/04, these shares were offered with an initial sales charge; thus actual total returns would have differed. These shares have higher annual fees and expenses than Class A shares. |
| |
Advisor Class: | Shares are available to certain eligible investors as described in the prospectus. |
1. Cumulative total return represents the change in value of an investment over the periods indicated.
2. Average annual total return represents the average annual change in value of an investment over the periods indicated.
3. In accordance with SEC rules, we provide standardized average annual total return information through the latest calendar quarter.
4. Distribution rate is based on an annualization of the respective class’s current monthly dividend and the maximum offering price (NAV for Classes C and Advisor) per share on 2/28/11.
5. Taxable equivalent distribution rate and yield assume the published rates as of 12/28/10 for the maximum combined effective federal and Massachusetts personal income tax rate of 38.45%, based on the federal income tax rate of 35.00%.
6. The 30-day standardized yield for the month ended 2/28/11 reflects an estimated yield to maturity (assuming all portfolio securities are held to maturity). It should be regarded as an estimate of the Fund’s rate of investment income, and it may not equal the Fund’s actual income distribution rate (which reflects the Fund’s past dividends paid to shareholders) or the income reported in the Fund’s financial statements.
7. Figures are as stated in the Fund’s prospectus current as of the date of this report. In periods of market volatility, assets may decline significantly, causing total annual Fund operating expenses to become higher than the figures shown.
8. Effective 7/1/09, the Fund began offering Advisor Class shares, which do not have sales charges or a Rule 12b-1 plan. Performance quotations for this class reflect the following methods of calculation: (a) For periods prior to 7/1/09, a restated figure is used based upon the Fund’s Class A performance, excluding the effect of Class A’s maximum initial sales charge, but reflecting the effect of the Class A Rule 12b-1 fees; and (b) for periods after 6/30/09, actual Advisor Class performance is used reflecting all charges and fees applicable to that class. Since 7/1/09 (commencement of sales), the cumulative and average annual total returns of Advisor Class shares were +7.82% and +4.63%.
9. Source: © 2011 Morningstar. The BC Municipal Bond Index is a market value-weighted index engineered for the long-term tax-exempt bond market. To be included in the index, bonds must be fixed rate, have at least one year to final maturity and be rated investment grade (Baa3/BBB- or higher) by at least two of the following agencies: Moody’s, Standard & Poor’s and Fitch. The Consumer Price Index (CPI), calculated by the U.S. Bureau of Labor Statistics, is a commonly used measure of the inflation rate.
Annual Report | 61
Your Fund’s Expenses
Franklin Massachusetts Tax-Free Income Fund
As a Fund shareholder, you can incur two types of costs:
- Transaction costs, including sales charges (loads) on Fund purchases; and
- Ongoing Fund costs, including management fees, distribution and service (12b-1) fees, and other Fund expenses. All mutual funds have ongoing costs, sometimes referred to as operating expenses.
The following table shows ongoing costs of investing in the Fund and can help you understand these costs and compare them with those of other mutual funds. The table assumes a $1,000 investment held for the six months indicated.
Actual Fund Expenses
The first line (Actual) for each share class listed in the table provides actual account values and expenses. The “Ending Account Value” is derived from the Fund’s actual return, which includes the effect of Fund expenses.
You can estimate the expenses you paid during the period by following these steps. Of course, your account value and expenses will differ from those in this illustration:
| 1. | Divide your account value by $1,000. |
| | If an account had an $8,600 value, then $8,600 ÷ $1,000 = 8.6. |
| 2. | Multiply the result by the number under the heading “Expenses Paid During Period.” |
| | If Expenses Paid During Period were $7.50, then 8.6 x $7.50 = $64.50. |
In this illustration, the estimated expenses paid this period are $64.50.
Hypothetical Example for Comparison with Other Funds
Information in the second line (Hypothetical) for each class in the table can help you compare ongoing costs of investing in the Fund with those of other mutual funds. This information may not be used to estimate the actual ending account balance or expenses you paid during the period. The hypothetical “Ending Account Value” is based on the actual expense ratio for each class and an assumed 5% annual rate of return before expenses, which does not represent the Fund’s actual return. The figure under the heading “Expenses Paid During Period” shows the hypothetical expenses your account would have incurred under this scenario. You can compare this figure with the 5% hypothetical examples that appear in shareholder reports of other funds.
62 | Annual Report
Your Fund’s Expenses (continued)
Please note that expenses shown in the table are meant to highlight ongoing costs and do not reflect any transaction costs, such as sales charges. Therefore, the second line for each class is useful in comparing ongoing costs only, and will not help you compare total costs of owning different funds. In addition, if transaction costs were included, your total costs would have been higher. Please refer to the Fund prospectus for additional information on operating expenses.
| | | | | | |
| | | Beginning Account | | Ending Account | | Expenses Paid During |
| Class A | | Value 9/1/10 | | Value 2/28/11 | | Period* 9/1/10–2/28/11 |
| Actual | $ | 1,000 | $ | 950.80 | $ | 3.19 |
| Hypothetical (5% return before expenses) | $ | 1,000 | $ | 1,021.52 | $ | 3.31 |
| Class C | | | | | | |
| Actual | $ | 1,000 | $ | 948.60 | $ | 5.80 |
| Hypothetical (5% return before expenses) | $ | 1,000 | $ | 1,018.84 | $ | 6.01 |
| Advisor Class | | | | | | |
| Actual | $ | 1,000 | $ | 952.10 | $ | 2.71 |
| Hypothetical (5% return before expenses) | $ | 1,000 | $ | 1,022.02 | $ | 2.81 |
*Expenses are calculated using the most recent six-month expense ratio, annualized for each class (A: 0.66%; C: 1.20% and Advisor: 0.56%), multiplied by the average account value over the period, multiplied by 181/365 to reflect the one-half year period.
Annual Report | 63
Franklin New Jersey Tax-Free Income Fund
Your Fund’s Goal and Main Investments: Franklin New Jersey Tax-Free Income Fund seeks to provide as high a level of income exempt from federal and New Jersey personal income taxes as is consistent with prudent investment management and preservation of capital by investing at least 80% of its net assets in securities that pay interest free from such taxes.1
Performance data represent past performance, which does not guarantee future results. Investment return and principal value will fluctuate, and you may have a gain or loss when you sell your shares. Current performance may differ from figures shown. Please visit franklintempleton.com or call (800) 342-5236 for most recent month-end performance.
| | |
| Credit Quality Breakdown* | | |
| Franklin New Jersey Tax-Free Income Fund | | |
| 2/28/11 | | |
| | % of Total | |
| Ratings | Long-Term Investments** | |
| AAA | 7.1 | % |
| AA | 26.2 | % |
| A | 42.0 | % |
| BBB | 21.1 | % |
| Below Investment Grade | 0.6 | % |
| Not Rated | 3.0 | % |
|
| *Standard & Poor’s (S&P) is used as the primary independent rating agency source, Moody’s is secondary, and Fitch, |
| if available, is used for securities not rated by Moody’s or S&P. The letter ratings are provided to indicate the credit- |
| worthiness of the Fund’s bond holdings and generally range from AAA (highest) to Below Investment Grade (lowest; |
| includes ratings BB to D). |
| **Does not include short-term investments and other net assets. |
This annual report for Franklin New Jersey Tax-Free Income Fund covers the fiscal year ended February 28, 2011.
Performance Overview
The Fund’s Class A share price, as measured by net asset value, decreased from $11.99 on February 28, 2010, to $11.49 on February 28, 2011. The
1. For investors subject to alternative minimum tax, a small portion of Fund dividends may be taxable. Distributions of capital gains are generally taxable. To avoid imposition of 28% backup withholding on all Fund distributions and redemption proceeds, U.S. investors must be properly certified on Form W-9 and non-U.S. investors on Form W-8BEN.
The dollar value, number of shares or principal amount, and names of all portfolio holdings are listed in the Fund’s Statement of Investments (SOI). The SOI begins on page 172.
64 | Annual Report
| | | | |
| Dividend Distributions* | | | | |
| Franklin New Jersey Tax-Free Income Fund | | | |
| | | Dividend per Share | |
| Month | Class A | Class B | Class C | Advisor Class |
| March 2010 | 4.30 cents | 3.74 cents | 3.72 cents | 4.41 cents |
| April 2010 | 4.30 cents | 3.74 cents | 3.72 cents | 4.41 cents |
| May 2010 | 4.30 cents | 3.74 cents | 3.72 cents | 4.41 cents |
| June 2010 | 4.30 cents | 3.78 cents | 3.75 cents | 4.40 cents |
| July 2010 | 4.30 cents | 3.78 cents | 3.75 cents | 4.40 cents |
| August 2010 | 4.30 cents | 3.78 cents | 3.75 cents | 4.40 cents |
| September 2010 | 4.30 cents | 3.75 cents | 3.74 cents | 4.40 cents |
| October 2010 | 4.30 cents | 3.75 cents | 3.74 cents | 4.40 cents |
| November 2010 | 4.30 cents | 3.75 cents | 3.74 cents | 4.40 cents |
| December 2010 | 4.30 cents | 3.73 cents | 3.73 cents | 4.40 cents |
| January 2011 | 4.30 cents | 3.73 cents | 3.73 cents | 4.40 cents |
| February 2011 | 4.30 cents | 3.73 cents | 3.73 cents | 4.40 cents |
*Assumes shares were purchased and held for the entire accrual period, which differs from the calendar month. Since dividends accrue daily, your actual distributions will vary depending on the date you purchased your shares and any account activity. All Fund distributions will vary depending upon current market conditions, and past distributions are not indicative of future trends.
Fund’s Class A shares paid dividends totaling 51.92 cents per share for the same period.2 The Performance Summary beginning on page 68 shows that at the end of this reporting period the Fund’s Class A shares’ distribution rate was 4.34% based on an annualization of the current 4.34 cent per share dividend and the maximum offering price of $12.00 on February 28, 2011. An investor in the 2011 maximum combined effective federal and New Jersey personal income tax bracket of 40.83% would need to earn a distribution rate of 7.33% from a taxable investment to match the Fund’s Class A tax-free distribution rate. For the Fund’s Class B, C and Advisor shares’ performance, please see the Performance Summary.
State Update
Recent data suggested New Jersey’s diverse and fundamentally sound economy is making a modest recovery. Although the state’s real estate market has yet to improve materially, the pace of job losses slowed as more residents entered the
2. All Fund distributions will vary depending upon current market conditions, and past distributions are not indicative of future trends.
Annual Report | 65
| | |
| Portfolio Breakdown | | |
| Franklin New Jersey Tax-Free Income Fund | |
| 2/28/11 | | |
| % of Total | |
| Long-Term Investments* | |
| Refunded | 17.3 | % |
| Hospital & Health Care | 16.1 | % |
| Subject to Government Appropriations | 15.3 | % |
| Transportation | 14.6 | % |
| Higher Education | 9.1 | % |
| Utilities | 7.5 | % |
| Tax-Supported | 6.5 | % |
| Other Revenue | 6.4 | % |
| General Obligation | 4.6 | % |
| Housing | 2.5 | % |
| Corporate-Backed | 0.1 | % |
| |
| *Does not include short-term investments and other | |
| net assets. | | |
workforce. The state’s jobless rate generally tracked national unemployment trends and fell from 9.7% in February 2010 to 9.2% in February 2011.3 The Garden State’s climate, location, resources and employment opportunities supported economic development, an environment hindered somewhat by its relatively high cost of living and tax structure when compared with other U.S. states.
As a means to help New Jersey bridge a large fiscal year 2010 budget gap, its legislature used broad discretion to enact significant cuts in education, clean energy and pension funding as well as the use of federal aid and some revenue enhancements. For the current, 2011 fiscal year, the state closed a $10.9 billion budget deficit with across-the-board spending cuts that included suspension of property tax rebates, pension funding deferrals and reduced aid to cities, towns and local schools districts.4 In the absence of any broad-based revenue enhancements and a sharp drop in federal stimulus funding from fiscal year 2010 levels, the current budget mandated net spending reductions of nearly $3 billion over year-ago outlays, including proposed debt restructurings and fiscal austerity to decrease state spending.4 A large unfunded pension liability of about $37 billion represented a major budgetary pressure for New Jersey and remained the most significant risk to its long-term credit quality.4 In addition, the state’s debt levels and debt burdens were among the highest in the nation. Net tax-supported debt was $3,669 per capita and 7.2% of personal income, compared with the $936 and 2.5% national medians.5
In February 2011, independent credit rating agency Standard & Poor’s (S&P) lowered its long-term and underlying credit ratings on New Jersey’s general obligation (GO) debt to AA- from AA, reflecting stresses posed by the state’s poorly funded pension system, substantial post-employment benefit obligations and above-average debt levels.6 The state’s high wealth levels, adequate reserves, prudent budget management practices, recent structural budget balance and proposed pension reform efforts supported S&P’s stable outlook for New Jersey’s GO credit quality insofar as the state continues to manage its structural budget imbalance proactively.
|
| 3. Source: Bureau of Labor Statistics. |
| 4. Source: Standard & Poor’s, “New Jersey; General Obligation,” RatingsDirect, 2/9/11. |
| 5. Source: Moody’s Investors Service, “Special Comment: 2010 State Debt Medians Report,” May 2010. |
| 6. This does not indicate S&P’s rating of the Fund. |
66 | Annual Report
Manager’s Discussion
We used various investment strategies during the 12 months under review as we sought to maximize tax-free income for shareholders. Please read the discussion on page 6 for details.
Thank you for your continued participation in Franklin New Jersey Tax-Free Income Fund. We intend to maintain our conservative, buy-and-hold investment strategy as we attempt to provide shareholders with high, current, tax-free income.
The foregoing information reflects our analysis, opinions and portfolio holdings as of February 28, 2011, the end of the reporting period. The way we implement our main investment strategies and the resulting portfolio holdings may change depending on factors such as market and economic conditions. These opinions may not be relied upon as investment advice or an offer for a particular security. The information is not a complete analysis of every aspect of any market, state, industry, security or the Fund. Statements of fact are from sources considered reliable, but the investment manager makes no representation or warranty as to their completeness or accuracy. Although historical performance is no guarantee of future results, these insights may help you understand our investment management philosophy.
Annual Report | 67
Performance Summary as of 2/28/11
Franklin New Jersey Tax-Free Income Fund
Your dividend income will vary depending on dividends or interest paid by securities in the Fund’s portfolio, adjusted for operating expenses of each class. Capital gain distributions are net profits realized from the sale of portfolio securities. The performance table and graphs do not reflect any taxes that a shareholder would pay on Fund dividends, capital gain distributions, if any, or any realized gains on the sale of Fund shares. Total return reflects reinvestment of the Fund’s dividends and capital gain distributions, if any, and any unrealized gains or losses.
| | | | | | | | |
| Price and Distribution Information | | | | | | |
| Class A (Symbol: FRNJX) | | | | Change | | 2/28/11 | | 2/28/10 |
| Net Asset Value (NAV) | | | -$ | 0.50 | $ | 11.49 | $ | 11.99 |
| Distributions (3/1/10–2/28/11) | | | | | | | | |
| Dividend Income | $ | 0.5192 | | | | | | |
| Long–Term Capital Gain | $ | 0.0035 | | | | | | |
| Total | $ | 0.5227 | | | | | | |
| Class B (Symbol: FNJBX) | | | | Change | | 2/28/11 | | 2/28/10 |
| Net Asset Value (NAV) | | | -$ | 0.51 | $ | 11.56 | $ | 12.07 |
| Distributions (3/1/10–2/28/11) | | | | | | | | |
| Dividend Income | $ | 0.4529 | | | | | | |
| Long–Term Capital Gain | $ | 0.0035 | | | | | | |
| Total | $ | 0.4564 | | | | | | |
| Class C (Symbol: FNIIX) | | | | Change | | 2/28/11 | | 2/28/10 |
| Net Asset Value (NAV) | | | -$ | 0.51 | $ | 11.60 | $ | 12.11 |
| Distributions (3/1/10–2/28/11) | | | | | | | | |
| Dividend Income | $ | 0.4511 | | | | | | |
| Long–Term Capital Gain | $ | 0.0035 | | | | | | |
| Total | $ | 0.4546 | | | | | | |
| Advisor Class (Symbol: FNJZX) | | | | Change | | 2/28/11 | | 2/28/10 |
| Net Asset Value (NAV) | | | -$ | 0.50 | $ | 11.49 | $ | 11.99 |
| Distributions (3/1/10–2/28/11) | | | | | | | | |
| Dividend Income | $ | 0.5315 | | | | | | |
| Long–Term Capital Gain | $ | 0.0035 | | | | | | |
| Total | $ | 0.5350 | | | | | | |
68 | Annual Report
Performance Summary (continued)
Performance
Cumulative total return excludes sales charges. Average annual total returns include maximum sales charges. Class A: 4.25% maximum initial sales charge; Class B: contingent deferred sales charge (CDSC) declining from 4% to 1% over six years, and eliminated thereafter; Class C: 1% CDSC in first year only; Advisor Class: no sales charges.
| | | | | | | | | | | |
| Class A | | | | 1-Year | | | 5-Year | | | 10-Year | |
| Cumulative Total Return1 | | | + | 0.11 | % | + | 17.19 | % | + | 52.89 | % |
| Average Annual Total Return2 | | | | -4.13 | % | + | 2.33 | % | + | 3.88 | % |
| Avg. Ann. Total Return (3/31/11)3 | | | | -5.39 | % | + | 2.26 | % | + | 3.69 | % |
| Distribution Rate4 | 4.34 | % | | | | | | | | | |
| Taxable Equivalent Distribution Rate5 | 7.33 | % | | | | | | | | | |
| 30-Day Standardized Yield6 | 3.90 | % | | | | | | | | | |
| Taxable Equivalent Yield5 | 6.59 | % | | | | | | | | | |
| Total Annual Operating Expenses7 | 0.63 | % | | | | | | | | | |
| Class B | | | | 1-Year | | | 5-Year | | | 10-Year | |
| Cumulative Total Return1 | | | | -0.52 | % | + | 13.92 | % | + | 46.45 | % |
| Average Annual Total Return2 | | | | -4.35 | % | + | 2.30 | % | + | 3.89 | % |
| Avg. Ann. Total Return (3/31/11)3 | | | | -5.59 | % | + | 2.22 | % | + | 3.69 | % |
| Distribution Rate4 | 3.99 | % | | | | | | | | | |
| Taxable Equivalent Distribution Rate5 | 6.74 | % | | | | | | | | | |
| 30-Day Standardized Yield6 | 3.54 | % | | | | | | | | | |
| Taxable Equivalent Yield5 | 5.98 | % | | | | | | | | | |
| Total Annual Operating Expenses7 | 1.18 | % | | | | | | | | | |
| Class C | | | | 1-Year | | | 5-Year | | | 10-Year | |
| Cumulative Total Return1 | | | | -0.53 | % | + | 14.03 | % | + | 44.71 | % |
| Average Annual Total Return2 | | | | -1.49 | % | + | 2.66 | % | + | 3.77 | % |
| Avg. Ann. Total Return (3/31/11)3 | | | | -2.68 | % | + | 2.58 | % | + | 3.59 | % |
| Distribution Rate4 | 3.96 | % | | | | | | | | | |
| Taxable Equivalent Distribution Rate5 | 6.69 | % | | | | | | | | | |
| 30-Day Standardized Yield6 | 3.55 | % | | | | | | | | | |
| Taxable Equivalent Yield5 | 6.00 | % | | | | | | | | | |
| Total Annual Operating Expenses7 | 1.18 | % | | | | | | | | | |
| Advisor Class8 | | | | 1-Year | | | 5-Year | | | 10-Year | |
| Cumulative Total Return1 | | | + | 0.21 | % | + | 17.49 | % | + | 53.29 | % |
| Average Annual Total Return2 | | | + | 0.21 | % | + | 3.28 | % | + | 4.36 | % |
| Avg. Ann. Total Return (3/31/11)3 | | | | -1.10 | % | + | 3.20 | % | + | 4.17 | % |
| Distribution Rate4 | 4.63 | % | | | | | | | | | |
| Taxable Equivalent Distribution Rate5 | 7.82 | % | | | | | | | | | |
| 30-Day Standardized Yield6 | 4.20 | % | | | | | | | | | |
| Taxable Equivalent Yield5 | 7.10 | % | | | | | | | | | |
| Total Annual Operating Expenses7 | 0.53 | % | | | | | | | | | |
Performance data represent past performance, which does not guarantee future results. Investment return and principal value will fluctuate, and you may have a gain or loss when you sell your shares. Current performance may differ from figures shown. For most recent month-end performance, go to franklintempleton.com or call (800) 342-5236.
Annual Report | 69
Performance Summary (continued)
Total Return Index Comparison for a Hypothetical $10,000 Investment
Total return represents the change in value of an investment over the periods shown. It includes any current, applicable, maximum sales charge, Fund expenses, account fees and reinvested distributions. The unmanaged index includes reinvestment of any income or distributions. It differs from the Fund in composition and does not pay management fees or expenses. One cannot invest directly in an index.
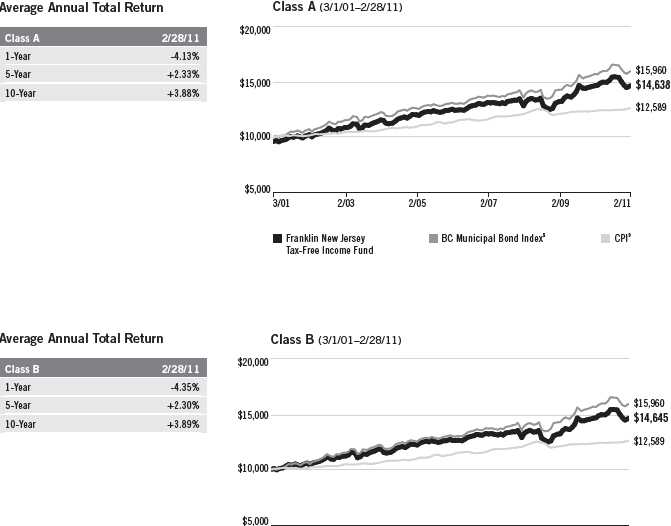
| | | | | |
| 3/01 | 2/03 | 2/05 | 2/07 | 2/09 | 2/11 |
| |
| |
| Franklin New Jersey | | BC Municipal Bond Index 9 | | CPI9 |
| Tax-Free Income Fund | | | | |
70 | Annual Report
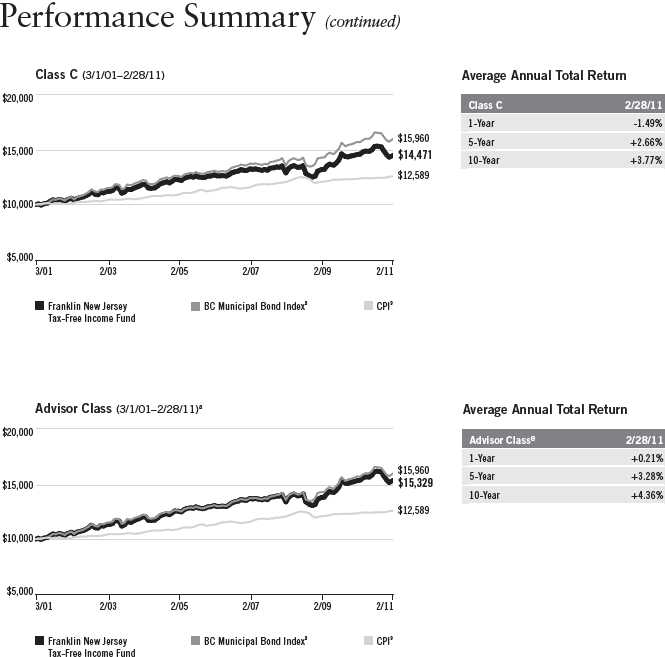
Annual Report | 71
Performance Summary (continued)
Endnotes
Because municipal bonds are sensitive to interest rate movements, the Fund’s yield and share price will fluctuate with market conditions. Bond prices generally move in the opposite direction of interest rates. Thus, as prices of bonds in the Fund adjust to a rise in interest rates, the Fund’s share price may decline. Since the Fund concentrates its investments in a single state, it is subject to greater risk of adverse economic and regulatory changes in that state than a geographically diversified fund. The manager applies various techniques and analyses in making investment decisions for the Fund, but there can be no guarantee that these decisions will produce the desired results. The Fund’s prospectus also includes a description of the main investment risks.
| |
Class B: Class C: | These shares have higher annual fees and expenses than Class A shares. Prior to 1/1/04, these shares were offered with an initial sales charge; thus actual total returns would have differed. These shares have higher annual fees and expenses than Class A shares. |
Advisor Class: | Shares are available to certain eligible investors as described in the prospectus. |
1. Cumulative total return represents the change in value of an investment over the periods indicated.
2. Average annual total return represents the average annual change in value of an investment over the periods indicated.
3. In accordance with SEC rules, we provide standardized average annual total return information through the latest calendar quarter.
4. Distribution rate is based on an annualization of the respective class’s current monthly dividend and the maximum offering price (NAV for Classes B, C and Advisor) per share on 2/28/11.
5. Taxable equivalent distribution rate and yield assume the published rates as of 12/28/10 for the maximum combined effective federal and New Jersey personal income tax rate of 40.83%, based on the federal income tax rate of 35.00%.
6. The 30-day standardized yield for the month ended 2/28/11 reflects an estimated yield to maturity (assuming all portfolio securities are held to maturity). It should be regarded as an estimate of the Fund’s rate of investment income, and it may not equal the Fund’s actual income distribution rate (which reflects the Fund’s past dividends paid to shareholders) or the income reported in the Fund’s financial statements.
7. Figures are as stated in the Fund’s prospectus current as of the date of this report. In periods of market volatility, assets may decline significantly, causing total annual Fund operating expenses to become higher than the figures shown.
8. Effective 7/1/08, the Fund began offering Advisor Class shares, which do not have sales charges or a Rule 12b-1 plan. Performance quotations for this class reflect the following methods of calculation: (a) For periods prior to 7/1/08, a restated figure is used based upon the Fund’s Class A performance, excluding the effect of Class A’s maximum initial sales charge, but reflecting the effect of the Class A Rule 12b-1 fees; and (b) for periods after 6/30/08, actual Advisor Class performance is used reflecting all charges and fees applicable to that class. Since 7/1/08 (commencement of sales), the cumulative and average annual total returns of Advisor Class shares were +9.78% and +3.57%.
9. Source: © 2011 Morningstar. The BC Municipal Bond Index is a market value-weighted index engineered for the long-term tax-exempt bond market. To be included in the index, bonds must be fixed rate, have at least one year to final maturity and be rated investment grade (Baa3/BBB- or higher) by at least two of the following agencies: Moody’s, Standard & Poor’s and Fitch. The Consumer Price Index (CPI), calculated by the U.S. Bureau of Labor Statistics, is a commonly used measure of the inflation rate.
72 | Annual Report
Your Fund’s Expenses
Franklin New Jersey Tax-Free Income Fund
As a Fund shareholder, you can incur two types of costs:
- Transaction costs, including sales charges (loads) on Fund purchases; and
- Ongoing Fund costs, including management fees, distribution and service (12b-1) fees, and other Fund expenses. All mutual funds have ongoing costs, sometimes referred to as operating expenses.
The following table shows ongoing costs of investing in the Fund and can help you understand these costs and compare them with those of other mutual funds. The table assumes a $1,000 investment held for the six months indicated.
Actual Fund Expenses
The first line (Actual) for each share class listed in the table provides actual account values and expenses. The “Ending Account Value” is derived from the Fund’s actual return, which includes the effect of Fund expenses.
You can estimate the expenses you paid during the period by following these steps. Of course, your account value and expenses will differ from those in this illustration:
| 1. | Divide your account value by $1,000. |
| | If an account had an $8,600 value, then $8,600 ÷ $1,000 = 8.6. |
| 2. | Multiply the result by the number under the heading “Expenses Paid During Period.” |
| | If Expenses Paid During Period were $7.50, then 8.6 x $7.50 = $64.50. |
In this illustration, the estimated expenses paid this period are $64.50.
Hypothetical Example for Comparison with Other Funds
Information in the second line (Hypothetical) for each class in the table can help you compare ongoing costs of investing in the Fund with those of other mutual funds. This information may not be used to estimate the actual ending account balance or expenses you paid during the period. The hypothetical “Ending Account Value” is based on the actual expense ratio for each class and an assumed 5% annual rate of return before expenses, which does not represent the Fund’s actual return. The figure under the heading “Expenses Paid During Period” shows the hypothetical expenses your account would have incurred under this scenario. You can compare this figure with the 5% hypothetical examples that appear in shareholder reports of other funds.
Annual Report | 73
Your Fund’s Expenses (continued)
Please note that expenses shown in the table are meant to highlight ongoing costs and do not reflect any transaction costs, such as sales charges. Therefore, the second line for each class is useful in comparing ongoing costs only, and will not help you compare total costs of owning different funds. In addition, if transaction costs were included, your total costs would have been higher. Please refer to the Fund prospectus for additional information on operating expenses.
| | | | | | |
| | | Beginning Account | | Ending Account | | Expenses Paid During |
| Class A | | Value 9/1/10 | | Value 2/28/11 | | Period* 9/1/10–2/28/11 |
| Actual | $ | 1,000 | $ | 950.30 | $ | 3.05 |
| Hypothetical (5% return before expenses) | $ | 1,000 | $ | 1,021.67 | $ | 3.16 |
| Class B | | | | | | |
| Actual | $ | 1,000 | $ | 947.20 | $ | 5.65 |
| Hypothetical (5% return before expenses) | $ | 1,000 | $ | 1,018.99 | $ | 5.86 |
| Class C | | | | | | |
| Actual | $ | 1,000 | $ | 947.30 | $ | 5.70 |
| Hypothetical (5% return before expenses) | $ | 1,000 | $ | 1,018.94 | $ | 5.91 |
| Advisor Class | | | | | | |
| Actual | $ | 1,000 | $ | 950.80 | $ | 2.56 |
| Hypothetical (5% return before expenses) | $ | 1,000 | $ | 1,022.17 | $ | 2.66 |
*Expenses are calculated using the most recent six-month expense ratio, annualized for each class (A: 0.63%; B: 1.17%; C: 1.18%; and Advisor: 0.53%), multiplied by the average account value over the period, multiplied by 181/365 to reflect the one-half year period.
74 | Annual Report
| | | | | | | | | | | | | | | |
| Franklin Tax-Free Trust | | | | | | | | | | | | | | | |
| Financial Highlights | | | | | | | | | | | | | | | |
| |
| Franklin Double Tax-Free Income Fund | | | | | | | | | | | | | | | |
| | | | | | Year Ended February 28, | | | | |
| Class A | | 2011 | | | 2010 | | | 2009 | | | 2008 | a | | 2007 | |
| Per share operating performance | | | | | | | | | | | | | | | |
| (for a share outstanding throughout the year) | | | | | | | | | | | | | | | |
| Net asset value, beginning of year | $ | 11.56 | | $ | 10.54 | | $ | 11.10 | | $ | 12.06 | | $ | 11.98 | |
| Income from investment operationsb: | | | | | | | | | | | | | | | |
| Net investment incomec | | 0.52 | | | 0.51 | | | 0.50 | | | 0.49 | | | 0.50 | |
| Net realized and unrealized gains (losses) | | (0.44 | ) | | 1.02 | | | (0.57 | ) | | (0.96 | ) | | 0.08 | |
| Total from investment operations | | 0.08 | | | 1.53 | | | (0.07 | ) | | (0.47 | ) | | 0.58 | |
| Less distributions from net investment income | | (0.52 | ) | | (0.51 | ) | | (0.49 | ) | | (0.49 | ) | | (0.50 | ) |
| Redemption feesd | | — | | | — | | | —e | | | —e | | | —e | |
| Net asset value, end of year | $ | 11.12 | | $ | 11.56 | | $ | 10.54 | | $ | 11.10 | | $ | 12.06 | |
| |
| Total returnf | | 0.56 | % | | 14.78 | % | | (0.62 | )% | | (4.05 | )% | | 4.97 | % |
| |
| Ratios to average net assets | | | | | | | | | | | | | | | |
| Expenses | | 0.67 | % | | 0.69 | % | | 0.68 | % | | 0.69 | % | | 0.70 | % |
| Net investment income | | 4.42 | % | | 4.64 | % | | 4.58 | % | | 4.14 | % | | 4.16 | % |
| |
| Supplemental data | | | | | | | | | | | | | | | |
| Net assets, end of year (000’s) | $ | 523,391 | | $ | 507,856 | | $ | 468,062 | | $ | 462,515 | | $ | 428,458 | |
| Portfolio turnover rate | | 12.85 | % | | 18.53 | % | | 14.45 | % | | 18.19 | % | | 10.88 | % |
|
| aFor the year ended February 29. |
| bThe amount shown for a share outstanding throughout the period may not correlate with the Statement of Operations for the period due to the timing of sales and repurchases of |
| the Fund shares in relation to income earned and/or fluctuating market value of the investments of the Fund. |
| cBased on average daily shares outstanding. |
| dEffective September 1, 2008, the redemption fee was eliminated. |
| eAmount rounds to less than $0.01 per share. |
| fTotal return does not reflect sales commissions or contingent deferred sales charges, if applicable. |
Annual Report | The accompanying notes are an integral part of these financial statements. | 75
| | | | | | | | | | | | | | | |
| Franklin Tax-Free Trust | | | | | | | | | | | | | | | |
| Financial Highlights (continued) | | | | | | | | | | | | | | | |
| |
| Franklin Double Tax-Free Income Fund | | | | | | | | | | | | | | | |
| | | | | | Year Ended February 28, | | | | |
| Class C | | 2011 | | | 2010 | | | 2009 | | | 2008 | a | | 2007 | |
| Per share operating performance | | | | | | | | | | | | | | | |
| (for a share outstanding throughout the year) | | | | | | | | | | | | | | | |
| Net asset value, beginning of year | $ | 11.61 | | $ | 10.58 | | $ | 11.14 | | $ | 12.11 | | $ | 12.01 | |
| Income from investment operationsb: | | | | | | | | | | | | | | | |
| Net investment incomec | | 0.45 | | | 0.45 | | | 0.44 | | | 0.43 | | | 0.43 | |
| Net realized and unrealized gains (losses) | | (0.44 | ) | | 1.03 | | | (0.57 | ) | | (0.97 | ) | | 0.10 | |
| Total from investment operations | | 0.01 | | | 1.48 | | | (0.13 | ) | | (0.54 | ) | | 0.53 | |
| Less distributions from net investment income | | (0.45 | ) | | (0.45 | ) | | (0.43 | ) | | (0.43 | ) | | (0.43 | ) |
| Redemption feesd | | — | | | — | | | —e | | | —e | | | —e | |
| Net asset value, end of year | $ | 11.17 | | $ | 11.61 | | $ | 10.58 | | $ | 11.14 | | $ | 12.11 | |
| |
| Total returnf | | (0.01 | )% | | 14.21 | % | | (1.17 | )% | | (4.64 | )% | | 4.55 | % |
| |
| Ratios to average net assets | | | | | | | | | | | | | | | |
| Expenses | | 1.22 | % | | 1.24 | % | | 1.23 | % | | 1.24 | % | | 1.24 | % |
| Net investment income | | 3.87 | % | | 4.09 | % | | 4.03 | % | | 3.59 | % | | 3.62 | % |
| |
| Supplemental data | | | | | | | | | | | | | | | |
| Net assets, end of year (000’s) | $ | 95,163 | | $ | 90,262 | | $ | 72,413 | | $ | 66,985 | | $ | 58,803 | |
| Portfolio turnover rate | | 12.85 | % | | 18.53 | % | | 14.45 | % | | 18.19 | % | | 10.88 | % |
|
| aFor the year ended February 29. |
| bThe amount shown for a share outstanding throughout the period may not correlate with the Statement of Operations for the period due to the timing of sales and repurchases of |
| the Fund shares in relation to income earned and/or fluctuating market value of the investments of the Fund. |
| cBased on average daily shares outstanding. |
| dEffective September 1, 2008, the redemption fee was eliminated. |
| eAmount rounds to less than $0.01 per share. |
| fTotal return does not reflect sales commissions or contingent deferred sales charges, if applicable. |
76 | The accompanying notes are an integral part of these financial statements. | Annual Report
| | | | | | |
| Franklin Tax-Free Trust | | | | | | |
| Financial Highlights (continued) | | | | | | |
| |
| Franklin Double Tax-Free Income Fund | | | | | | |
| | | Year Ended February 28, | |
| Advisor Class | | 2011 | | | 2010 | a |
| Per share operating performance | | | | | | |
| (for a share outstanding throughout the year) | | | | | | |
| Net asset value, beginning of year | $ | 11.57 | | $ | 10.78 | |
| Income from investment operationsb: | | | | | | |
| Net investment incomec | | 0.53 | | | 0.33 | |
| Net realized and unrealized gains (losses) | | (0.44 | ) | | 0.78 | |
| Total from investment operations | | 0.09 | | | 1.11 | |
| Less distributions from net investment income | | (0.53 | ) | | (0.32 | ) |
| Net asset value, end of year | $ | 11.13 | | $ | 11.57 | |
| |
| Total returnd | | 0.67 | % | | 10.38 | % |
| |
| Ratios to average net assetse | | | | | | |
| Expenses | | 0.57 | % | | 0.59 | % |
| Net investment income | | 4.52 | % | | 4.74 | % |
| |
| Supplemental data | | | | | | |
| Net assets, end of year (000’s) | $ | 4,104 | | $ | 2,538 | |
| Portfolio turnover rate | | 12.85 | % | | 18.53 | % |
|
| aFor the period July 15, 2009 (effective date) to February 28, 2010. |
| bThe amount shown for a share outstanding throughout the period may not correlate with the Statement of Operations for the period due to the timing of sales and repurchases of |
| the Fund shares in relation to income earned and/or fluctuating market value of the investments of the Fund. |
| cBased on average daily shares outstanding. |
| dTotal return is not annualized for periods less than one year. |
| eRatios are annualized for periods less than one year. |
Annual Report | The accompanying notes are an integral part of these financial statements. | 77
| | | | |
| Franklin Tax-Free Trust | | | | |
| |
| Statement of Investments, February 28, 2011 | | | | |
| |
| |
| Franklin Double Tax-Free Income Fund | | Principal Amount | | Value |
| Municipal Bonds 98.8% | | | | |
| U.S. Territories 98.8% | | | | |
| Guam 10.4% | | | | |
| Guam Education Financing Foundation COP, 5.00%, 10/01/23 | $ | 2,500,000 | $ | 2,396,225 |
| Guam Government Limited Obligation Revenue, Section 30, Series A, | | | | |
| 5.375%, 12/01/24 | | 5,195,000 | | 5,093,230 |
| 5.625%, 12/01/29 | | 3,850,000 | | 3,777,543 |
| 5.75%, 12/01/34 | | 10,430,000 | | 10,178,428 |
| Guam International Airport Authority Revenue, | | | | |
| Series A, NATL Insured, 5.25%, 10/01/20 | | 1,725,000 | | 1,736,885 |
| Series A, NATL Insured, 5.25%, 10/01/22 | | 700,000 | | 693,392 |
| Series B, NATL Insured, 5.25%, 10/01/22 | | 1,000,000 | | 990,560 |
| Series B, NATL Insured, 5.25%, 10/01/23 | | 1,000,000 | | 976,580 |
| Series C, NATL Insured, 5.25%, 10/01/21 | | 5,000,000 | | 5,002,150 |
| Series C, NATL Insured, 5.00%, 10/01/23 | | 5,000,000 | | 4,517,500 |
| Guam Power Authority Revenue, Refunding, Series A, | | | | |
| 5.50%, 10/01/30 | | 3,000,000 | | 2,936,520 |
| 5.50%, 10/01/40 | | 19,800,000 | | 18,384,498 |
| NATL Insured, 5.125%, 10/01/29 | | 1,975,000 | | 1,884,980 |
| NATL Insured, 5.25%, 10/01/34 | | 7,000,000 | | 6,316,730 |
| | | | | 64,885,221 |
| Puerto Rico 75.6% | | | | |
| Children’s Trust Fund Puerto Rico Tobacco Settlement Revenue, Asset-Backed Bonds, Refunding, | | | | |
| 5.50%, 5/15/39 | | 5,000,000 | | 3,979,500 |
| Puerto Rico Commonwealth Aqueduct and Sewer Authority Revenue, senior lien, Series A, | | | | |
| 6.00%, 7/01/38 | | 3,100,000 | | 2,910,218 |
| Assured Guaranty, 5.125%, 7/01/47 | | 25,925,000 | | 23,832,334 |
| Puerto Rico Commonwealth GO, | | | | |
| Public Improvement, Refunding, Series A, 5.50%, 7/01/18 | | 2,395,000 | | 2,523,061 |
| Public Improvement, Refunding, Series A, 5.50%, 7/01/32 | | 10,000,000 | | 9,670,300 |
| Public Improvement, Refunding, Series A, 6.00%, 7/01/40 | | 5,000,000 | | 4,871,700 |
| Public Improvement, Refunding, Series B, 5.25%, 7/01/32 | | 2,500,000 | | 2,260,325 |
| Public Improvement, Refunding, Series B, 5.75%, 7/01/38 | | 4,000,000 | | 3,819,640 |
| Public Improvement, Refunding, Series C, 6.00%, 7/01/39 | | 18,950,000 | | 18,494,442 |
| Public Improvement, Series A, 5.375%, 7/01/28 | | 1,300,000 | | 1,309,945 |
| Public Improvement, Series A, 6.00%, 7/01/38 | | 3,000,000 | | 2,944,380 |
| Public Improvement, Series A, FGIC Insured, 5.125%, 7/01/31 | | 3,315,000 | | 3,316,724 |
| Refunding, Series C, Sub Series C-7, NATL Insured, 6.00%, 7/01/27 | | 3,500,000 | | 3,610,460 |
| Refunding, Series C, Sub Series C-7, NATL Insured, 6.00%, 7/01/28 | | 1,195,000 | | 1,227,635 |
| Series A, 5.25%, 7/01/29 | | 4,600,000 | | 4,321,332 |
| Series A, 5.25%, 7/01/30 | | 8,575,000 | | 7,992,757 |
| Puerto Rico Commonwealth Highway and Transportation Authority Highway Revenue, | | | | |
| Refunding, Series AA-2, 5.30%, 7/01/35 | | 5,750,000 | | 5,147,803 |
| Refunding, Series CC, AGMC Insured, 5.25%, 7/01/32 | | 4,000,000 | | 3,855,560 |
| Refunding, Series CC, AGMC Insured, 5.25%, 7/01/34 | | 2,000,000 | | 1,896,840 |
| Series Y, Pre-Refunded, 5.50%, 7/01/36 | | 11,850,000 | | 14,160,750 |
78 | Annual Report
| | | | |
| Franklin Tax-Free Trust | | | | |
| |
| Statement of Investments, February 28, 2011 (continued) | | | | |
| |
| |
| Franklin Double Tax-Free Income Fund | | Principal Amount | | Value |
| Municipal Bonds (continued) | | | | |
| U.S. Territories (continued) | | | | |
| Puerto Rico (continued) | | | | |
| Puerto Rico Commonwealth Highway and Transportation Authority Transportation Revenue, | | | | |
| Refunding, Series H, 5.00%, 7/01/35 | $ | 20,000 | $ | 17,093 |
| Refunding, Series H, 5.45%, 7/01/35 | | 13,955,000 | | 12,692,770 |
| Refunding, Series M, 5.00%, 7/01/37 | | 5,455,000 | | 4,597,910 |
| Refunding, Series N, FGIC Insured, 5.25%, 7/01/39 | | 20,720,000 | | 18,031,994 |
| Series D, Pre-Refunded, 5.375%, 7/01/36 | | 6,990,000 | | 7,424,918 |
| Series H, Pre-Refunded, 5.00%, 7/01/35 | | 80,000 | | 87,909 |
| Series K, Pre-Refunded, 5.00%, 7/01/40 | | 9,500,000 | | 10,905,240 |
| Puerto Rico Commonwealth Infrastructure Financing Authority Special Tax Revenue, | | | | |
| Refunding, Series C, FGIC Insured, 5.50%, 7/01/22 | | 6,285,000 | | 6,455,198 |
| Series B, 5.00%, 7/01/37 | | 24,250,000 | | 20,353,677 |
| Series B, 5.00%, 7/01/41 | | 9,190,000 | | 7,393,631 |
| Puerto Rico Convention Center District Authority Hotel Occupancy Tax Revenue, Series A, | | | | |
| AMBAC Insured, 5.00%, 7/01/31 | | 20,000,000 | | 17,839,600 |
| Puerto Rico Electric Power Authority Power Revenue, | | | | |
| Refunding, Series SS, AGMC Insured, 5.00%, 7/01/30 | | 3,015,000 | | 2,974,358 |
| Refunding, Series UU, CIFG Insured, 5.00%, 7/01/26 | | 6,500,000 | | 6,230,770 |
| Series CCC, 5.25%, 7/01/27 | | 5,000,000 | | 4,892,400 |
| Series CCC, 5.25%, 7/01/28 | | 3,000,000 | | 2,910,150 |
| Series TT, 5.00%, 7/01/32 | | 10,800,000 | | 9,774,000 |
| Series TT, 5.00%, 7/01/37 | | 2,235,000 | | 1,909,450 |
| Series XX, 5.75%, 7/01/36 | | 15,000,000 | | 14,325,750 |
| Series XX, 5.25%, 7/01/40 | | 14,800,000 | | 12,925,432 |
| Puerto Rico HFAR, | | | | |
| Capital Fund Modernization, 5.125%, 12/01/27 | | 8,500,000 | | 8,502,040 |
| Capital Fund Program, 4.60%, 12/01/24 | | 3,425,000 | | 3,435,275 |
| Puerto Rico HFC, HMR, MBS, Series A, GNMA Secured, 5.20%, 12/01/33 | | 9,700,000 | | 9,701,746 |
| Puerto Rico Industrial Tourist Educational Medical and Environmental Control Facilities Financing | | | | |
| Authority Educational Facilities Revenue, University Plaza Project, Series A, NATL Insured, | | | | |
| 5.00%, 7/01/33 | | 6,000,000 | | 5,260,740 |
| Puerto Rico Industrial Tourist Educational Medical and Environmental Control Facilities | | | | |
| Financing Authority Hospital Revenue, | | | | |
| Dr. Pila Hospital Project, Refunding, FHA Insured, 6.125%, 8/01/25 | | 2,500,000 | | 2,507,075 |
| Dr. Pila Hospital Project, Refunding, FHA Insured, 6.25%, 8/01/32 | | 500,000 | | 501,410 |
| Hospital Auxilio Mutuo Obligation Group Project, Series A, NATL Insured, 6.25%, | | | | |
| 7/01/24 | | 8,445,000 | | 8,474,135 |
| Puerto Rico Industrial Tourist Educational Medical and Environmental Control Facilities | | | | |
| Financing Authority Industrial Revenue, | | | | |
| Guaynabo Municipal Government, 5.625%, 7/01/15 | | 4,025,000 | | 4,029,790 |
| Guaynabo Municipal Government, 5.625%, 7/01/22 | | 3,160,000 | | 3,160,916 |
| Guaynabo Warehouse, Series A, 5.15%, 7/01/19 | | 1,135,000 | | 1,160,821 |
| Guaynabo Warehouse, Series A, 5.20%, 7/01/24 | | 4,120,000 | | 4,203,389 |
| Puerto Rico Industrial Tourist Educational Medical and Environmental Control Facilities | | | | |
| Financing Authority Revenue, Ana G. Mendez University System Project, Refunding, 5.375%, | | | | |
| 12/01/21 | | 2,000,000 | | 1,967,020 |
| 2/01/29 | | 7,850,000 | | 7,084,232 |
Annual Report | 79
| | | | |
| Franklin Tax-Free Trust | | | | |
| |
| Statement of Investments, February 28, 2011 (continued) | | | | |
| |
| |
| Franklin Double Tax-Free Income Fund | | Principal Amount | | Value |
| Municipal Bonds (continued) | | | | |
| U.S. Territories (continued) | | | | |
| Puerto Rico (continued) | | | | |
| Puerto Rico Industrial Tourist Educational Medical and Environmental Control Facilities Revenue, | | | | |
| Cogeneration Facility, AES Puerto Rico Project, 6.625%, 6/01/26 | $ | 5,970,000 | $ | 5,988,209 |
| International American University of Puerto Rico Project, NATL Insured, 4.25%, | | | | |
| 10/01/24 | | 1,000,000 | | 868,490 |
| International American University of Puerto Rico Project, NATL Insured, 4.375%, | | | | |
| 10/01/25 | | 1,000,000 | | 875,590 |
| International American University of Puerto Rico Project, NATL Insured, 4.50%, | | | | |
| 10/01/29 | | 3,750,000 | | 3,137,963 |
| Puerto Rico Municipal Finance Agency GO, Series A, AGMC Insured, | | | | |
| 5.75%, 8/01/12 | | 7,500,000 | | 7,563,600 |
| 5.00%, 8/01/27 | | 3,500,000 | | 3,415,650 |
| 5.00%, 8/01/30 | | 3,500,000 | | 3,304,385 |
| Puerto Rico PBA Guaranteed Revenue, Government Facilities, | | | | |
| Refunding, Series M, 6.25%, 7/01/21 | | 5,000,000 | | 5,336,700 |
| Refunding, Series N, 5.00%, 7/01/32 | | 5,000,000 | | 4,418,850 |
| Refunding, Series N, 5.00%, 7/01/37 | | 10,000,000 | | 8,428,800 |
| Refunding, Series P, 6.50%, 7/01/30 | | 5,000,000 | | 5,350,700 |
| Refunding, Series P, 6.75%, 7/01/36 | | 5,000,000 | | 5,309,700 |
| Refunding, Series Q, 5.625%, 7/01/39 | | 8,985,000 | | 8,321,098 |
| Series D, Pre-Refunded, 5.375%, 7/01/33 | | 4,070,000 | | 4,323,235 |
| Series I, 5.25%, 7/01/33 | | 2,450,000 | | 2,216,981 |
| Series I, 5.00%, 7/01/36 | | 4,000,000 | | 3,390,360 |
| Series I, Pre-Refunded, 5.25%, 7/01/33 | | 50,000 | | 56,394 |
| Series I, Pre-Refunded, 5.375%, 7/01/34 | | 5,000,000 | | 5,659,650 |
| Puerto Rico Public FICO Revenue, Commonwealth Appropriation, Series E, Pre-Refunded, | | | | |
| 5.50%, 8/01/29 | | 5,000,000 | | 5,227,400 |
| Puerto Rico Sales Tax FICO Sales Tax Revenue, | | | | |
| Capital Appreciation, first sub., Series A, zero cpn. to 8/01/19, 6.25% thereafter, | | | | |
| 8/01/33 | | 7,000,000 | | 4,594,030 |
| first sub., Series A, 5.75%, 8/01/37 | | 1,000,000 | | 990,560 |
| first sub., Series A, 5.50%, 8/01/42 | | 3,500,000 | | 3,267,670 |
| first sub., Series A, 6.00%, 8/01/42 | | 17,850,000 | | 17,883,915 |
| first sub., Series C, 5.25%, 8/01/41 | | 2,500,000 | | 2,248,750 |
| Series A, 5.25%, 8/01/57 | | 15,000,000 | | 14,692,650 |
| | | | | 470,747,875 |
| U.S. Virgin Islands 12.8% | | | | |
| Virgin Islands HFA, SFR, Refunding, Series A, GNMA Secured, | | | | |
| 6.45%, 3/01/16 | | 55,000 | | 55,029 |
| 6.50%, 3/01/25 | | 225,000 | | 215,026 |
| Virgin Islands PFAR, | | | | |
| Gross Receipts Taxes Loan Note, Radian Insured, 5.00%, 10/01/26 | | 5,000,000 | | 4,914,850 |
| Gross Receipts Taxes Loan Note, Radian Insured, 5.00%, 10/01/33 | | 11,720,000 | | 10,468,890 |
| Gross Receipts Taxes Loan Note, Refunding, ACA Insured, 5.00%, 10/01/31 | | 2,500,000 | | 2,341,175 |
| Gross Receipts Taxes Loan Note, Refunding, BHAC Insured, 5.00%, 10/01/28 | | 3,695,000 | | 3,853,589 |
| Matching Fund Loan Note, sub. lien, Series B, 5.00%, 10/01/25 | | 7,665,000 | | 7,328,200 |
| Matching Fund Loan Note, sub. lien, Series B, 5.25%, 10/01/29 | | 3,525,000 | | 3,487,741 |
| senior lien, Capital Projects, Series A-1, 5.00%, 10/01/29 | | 1,000,000 | | 941,330 |
80 | Annual Report
| | | | |
| Franklin Tax-Free Trust | | | | |
| |
| Statement of Investments, February 28, 2011 (continued) | | | | |
| |
| |
| Franklin Double Tax-Free Income Fund | | Principal Amount | | Value |
| Municipal Bonds (continued) | | | | |
| U.S. Territories (continued) | | | | |
| U.S. Virgin Islands (continued) | | | | |
| Virgin Islands PFAR, (continued) | | | | |
| senior lien, Capital Projects, Series A-1, 5.00%, 10/01/39 | $ | 4,100,000 | $ | 3,383,484 |
| Virgin Islands Matching Fund Loan Note, Diageo Project, Series A, 6.75%, 10/01/37 | | 7,700,000 | | 7,865,088 |
| Virgin Islands Matching Fund Loan Note, senior lien, Series A, 5.25%, 10/01/24 | | 2,000,000 | | 2,010,900 |
| Virgin Islands Matching Fund Loan Note, Series A, 6.00%, 10/01/39 | | 5,500,000 | | 5,543,670 |
| Virgin Islands Port Authority Marine Revenue, Series A, AGMC Insured, | | | | |
| 5.25%, 9/01/18 | | 2,930,000 | | 2,946,584 |
| 5.00%, 9/01/23 | | 10,000,000 | | 9,817,900 |
| Virgin Islands Water and Power Authority Electric System Revenue, | | | | |
| Refunding, 5.30%, 7/01/21 | | 1,000,000 | | 1,000,490 |
| Refunding, Series A, 5.00%, 7/01/18 | | 1,750,000 | | 1,832,915 |
| Series A, 5.00%, 7/01/31 | | 3,000,000 | | 2,789,820 |
| Series B, AGMC Insured, 5.00%, 7/01/22 | | 2,250,000 | | 2,291,850 |
| Virgin Islands Water and Power Authority Water System Revenue, Refunding, | | | | |
| 5.25%, 7/01/12 | | 2,700,000 | | 2,707,209 |
| 5.50%, 7/01/17 | | 4,000,000 | | 4,004,320 |
| | | | | 79,800,060 |
| Total Municipal Bonds before Short Term Investments (Cost $642,602,524) | | | | 615,433,156 |
| Short Term Investments (Cost $400,000) 0.1% | | | | |
| Municipal Bonds 0.1% | | | | |
| U.S. Territories 0.1% | | | | |
| Puerto Rico 0.1% | | | | |
| aPuerto Rico Commonwealth GO, Public Improvement, Refunding, Series B, Daily VRDN and Put, | | | | |
| 0.15%, 7/01/32 | | 400,000 | | 400,000 |
| Total Investments (Cost $643,002,524) 98.9% | | | | 615,833,156 |
| Other Assets, less Liabilities 1.1% | | | | 6,824,340 |
| Net Assets 100.0% | | | $ | 622,657,496 |
| |
| |
| |
| See Abbreviations on page 206. | | | | |
| |
| aVariable rate demand notes (VRDNs) are tax-exempt obligations which contain a floating or variable interest rate adjustment formula and an unconditional right of demand to |
| receive payment of the principal balance plus accrued interest at specified dates. The coupon rate shown represents the rate at period end. | | |
Annual Report | The accompanying notes are an integral part of these financial statements. | 81
| | | | | | | | | | | | | | | |
| Franklin Tax-Free Trust | | | | | | | | | | | | | | | |
| Financial Highlights | | | | | | | | | | | | | | | |
| |
| Franklin Federal Intermediate-Term Tax-Free Income Fund | | | | | | | | | | | | | | | |
| | | | | | Year Ended February 28, | | | | |
| Class A | | 2011 | | | 2010 | | | 2009 | | | 2008 | a | | 2007 | |
| Per share operating performance | | | | | | | | | | | | | | | |
| (for a share outstanding throughout the year) | | | | | | | | | | | | | | | |
| Net asset value, beginning of year | $ | 11.59 | | $ | 10.99 | | $ | 11.04 | | $ | 11.47 | | $ | 11.42 | |
| Income from investment operationsb: | | | | | | | | | | | | | | | |
| Net investment incomec | | 0.40 | | | 0.43 | | | 0.43 | | | 0.42 | | | 0.42 | |
| Net realized and unrealized gains (losses) | | (0.15 | ) | | 0.61 | | | (0.05 | ) | | (0.43 | ) | | 0.05 | |
| Total from investment operations | | 0.25 | | | 1.04 | | | 0.38 | | | (0.01 | ) | | 0.47 | |
| Less distributions from net investment income | | (0.41 | ) | | (0.44 | ) | | (0.43 | ) | | (0.42 | ) | | (0.42 | ) |
| Redemption feesd | | — | | | — | | | —e | | | —e | | | —e | |
| Net asset value, end of year | $ | 11.43 | | $ | 11.59 | | $ | 10.99 | | $ | 11.04 | | $ | 11.47 | |
| |
| Total returnf | | 2.12 | % | | 9.61 | % | | 3.48 | % | | (0.11 | )% | | 4.22 | % |
| |
| Ratios to average net assets | | | | | | | | | | | | | | | |
| Expenses | | 0.66 | % | | 0.67 | % | | 0.68 | % | | 0.71 | % | | 0.69 | % |
| Net investment income | | 3.45 | % | | 3.76 | % | | 3.91 | % | | 3.67 | % | | 3.68 | % |
| |
| Supplemental data | | | | | | | | | | | | | | | |
| Net assets, end of year (000’s) | $ | 1,492,832 | | $ | 1,390,805 | | $ | 873,648 | | $ | 699,833 | | $ | 611,291 | |
| Portfolio turnover rate | | 10.11 | % | | 3.68 | % | | 13.05 | % | | 17.10 | % | | 8.94 | % |
|
| aFor the year ended February 29. |
| bThe amount shown for a share outstanding throughout the period may not correlate with the Statement of Operations for the period due to the timing of sales and repurchases of |
| the Fund shares in relation to income earned and/or fluctuating market value of the investments of the Fund. |
| cBased on average daily shares outstanding. |
| dEffective September 1, 2008, the redemption fee was eliminated. |
| eAmount rounds to less than $0.01 per share. |
| fTotal return does not reflect sales commissions or contingent deferred sales charges, if applicable. |
82 | The accompanying notes are an integral part of these financial statements. | Annual Report
| | | | | | | | | | | | | | | |
| Franklin Tax-Free Trust | | | | | | | | | | | | | | | |
| Financial Highlights (continued) | | | | | | | | | | | | | | | |
| |
| Franklin Federal Intermediate-Term Tax-Free Income Fund | | | | | | | | | | | | | | | |
| | | | | | Year Ended February 28, | | | | |
| Class C | | 2011 | | | 2010 | | | 2009 | | | 2008 | a | | 2007 | |
| Per share operating performance | | | | | | | | | | | | | | | |
| (for a share outstanding throughout the year) | | | | | | | | | | | | | | | |
| Net asset value, beginning of year | $ | 11.61 | | $ | 11.01 | | $ | 11.06 | | $ | 11.49 | | $ | 11.44 | |
| Income from investment operationsb: | | | | | | | | | | | | | | | |
| Net investment incomec | | 0.34 | | | 0.36 | | | 0.37 | | | 0.35 | | | 0.36 | |
| Net realized and unrealized gains (losses) | | (0.15 | ) | | 0.61 | | | (0.05 | ) | | (0.42 | ) | | 0.05 | |
| Total from investment operations | | 0.19 | | | 0.97 | | | 0.32 | | | (0.07 | ) | | 0.41 | |
| Less distributions from net investment income | | (0.34 | ) | | (0.37 | ) | | (0.37 | ) | | (0.36 | ) | | (0.36 | ) |
| Redemption feesd | | — | | | — | | | —e | | | —e | | | —e | |
| Net asset value, end of year | $ | 11.46 | | $ | 11.61 | | $ | 11.01 | | $ | 11.06 | | $ | 11.49 | |
| |
| Total returnf | | 1.63 | % | | 8.98 | % | | 2.90 | % | | (0.66 | )% | | 3.65 | % |
| |
| Ratios to average net assets | | | | | | | | | | | | | | | |
| Expenses | | 1.21 | % | | 1.22 | % | | 1.23 | % | | 1.26 | % | | 1.24 | % |
| Net investment income | | 2.90 | % | | 3.21 | % | | 3.36 | % | | 3.12 | % | | 3.13 | % |
| |
| Supplemental data | | | | | | | | | | | | | | | |
| Net assets, end of year (000’s) | $ | 357,180 | | $ | 257,249 | | $ | 91,164 | | $ | 34,763 | | $ | 28,510 | |
| Portfolio turnover rate | | 10.11 | % | | 3.68 | % | | 13.05 | % | | 17.10 | % | | 8.94 | % |
|
| aFor the year ended February 29. |
| bThe amount shown for a share outstanding throughout the period may not correlate with the Statement of Operations for the period due to the timing of sales and repurchases of |
| the Fund shares in relation to income earned and/or fluctuating market value of the investments of the Fund. |
| cBased on average daily shares outstanding. |
| dEffective September 1, 2008, the redemption fee was eliminated. |
| eAmount rounds to less than $0.01 per share. |
| fTotal return does not reflect sales commissions or contingent deferred sales charges, if applicable. |
Annual Report | The accompanying notes are an integral part of these financial statements. | 83
| | | | | | | | | |
| Franklin Tax-Free Trust | | | | | | | | | |
| Financial Highlights (continued) | | | | | | | | | |
| |
| Franklin Federal Intermediate-Term Tax-Free Income Fund | | | | | | | | | |
| | | Year Ended February 28, | |
| Advisor Class | | 2011 | | | 2010 | | | 2009 | a |
| Per share operating performance | | | | | | | | | |
| (for a share outstanding throughout the year) | | | | | | | | | |
| Net asset value, beginning of year | $ | 11.60 | | $ | 11.00 | | $ | 10.58 | |
| Income from investment operationsb: | | | | | | | | | |
| Net investment incomec | | 0.41 | | | 0.44 | | | 0.11 | |
| Net realized and unrealized gains (losses) | | (0.14 | ) | | 0.61 | | | 0.42 | |
| Total from investment operations | | 0.27 | | | 1.05 | | | 0.53 | |
| Less distributions from net investment income | | (0.42 | ) | | (0.45 | ) | | (0.11 | ) |
| Net asset value, end of year | $ | 11.45 | | $ | 11.60 | | $ | 11.00 | |
| |
| Total returnd | | 2.30 | % | | 9.70 | % | | 5.00 | % |
| |
| Ratios to average net assetse | | | | | | | | | |
| Expenses | | 0.56 | % | | 0.57 | % | | 0.58 | % |
| Net investment income | | 3.55 | % | | 3.86 | % | | 4.01 | % |
| |
| Supplemental data | | | | | | | | | |
| Net assets, end of year (000’s) | $ | 435,837 | | $ | 144,745 | | $ | 5,769 | |
| Portfolio turnover rate | | 10.11 | % | | 3.68 | % | | 13.05 | % |
|
| aFor the period December 1, 2008 (effective date) to February 28, 2009. |
| bThe amount shown for a share outstanding throughout the period may not correlate with the Statement of Operations for the period due to the timing of sales and repurchases of |
| the Fund shares in relation to income earned and/or fluctuating market value of the investments of the Fund. |
| cBased on average daily shares outstanding. |
| dTotal return is not annualized for periods less than one year. |
| eRatios are annualized for periods less than one year. |
84 | The accompanying notes are an integral part of these financial statements. | Annual Report
| | | | |
| Franklin Tax-Free Trust | | | | |
| |
| Statement of Investments, February 28, 2011 | | | | |
| |
| |
| Franklin Federal Intermediate-Term Tax-Free Income Fund | | Principal Amount | | Value |
| Municipal Bonds 98.4% | | | | |
| Alabama 3.1% | | | | |
| Alabama State Public School and College Authority Revenue, Capital Improvement, Refunding, | | | | |
| Series A, 5.00%, 5/01/19 | $ | 7,750,000 | $ | 8,715,030 |
| Alabama Water Pollution Control Authority Revenue, Revolving Fund Loan, Refunding, Series B, | | | | |
| AMBAC Insured, 4.625%, 8/15/13 | | 5,900,000 | | 5,975,756 |
| Chatom IDB Gulf Opportunity Zone Revenue, PowerSouth Energy, Refunding, Series A, Assured | | | | |
| Guaranty, 5.00%, | | | | |
| 8/01/20 | | 3,535,000 | | 3,924,026 |
| 8/01/21 | | 3,535,000 | | 3,882,561 |
| 8/01/22 | | 3,535,000 | | 3,827,168 |
| East Alabama Health Care Authority Health Care Facilities Revenue, | | | | |
| Mandatory Put 9/01/18, Series A, 5.25%, 9/01/36 | | 10,000,000 | | 9,969,400 |
| Mandatory Put 9/01/18, Series B, 5.50%, 9/01/33 | | 13,500,000 | | 13,866,660 |
| Tax Anticipation Bond, Series A, NATL Insured, 4.50%, 9/01/13 | | 1,925,000 | | 1,948,620 |
| Tax Anticipation Bond, Series A, NATL Insured, 4.625%, 9/01/14 | | 2,010,000 | | 2,030,100 |
| Tax Anticipation Bond, Series A, NATL Insured, 4.50%, 9/01/15 | | 2,100,000 | | 2,111,991 |
| Huntsville Health Care Authority Revenue, Series A, NATL Insured, | | | | |
| 5.00%, 6/01/17 | | 2,900,000 | | 3,021,191 |
| Pre-Refunded, 4.80%, 6/01/13 | | 2,400,000 | | 2,560,464 |
| Jefferson County GO, Capital Improvement wts., Series A, NATL Insured, 5.00%, 4/01/17 | | 2,195,000 | | 1,946,131 |
| Jefferson County Limited Obligation School wts. Revenue, Series A, 5.25%, 1/01/16 | | 2,000,000 | | 1,917,560 |
| University of Alabama General Revenue, Series A, NATL Insured, 5.00%, 7/01/15 | | 4,070,000 | | 4,479,035 |
| | | | | 70,175,693 |
| Alaska 0.2% | | | | |
| Matanuska-Susitna Borough Lease Revenue, Goose Creek Correctional Center, Assured | | | | |
| Guaranty, 5.00%, 9/01/19 | | 3,650,000 | | 4,086,284 |
| Arizona 7.0% | | | | |
| Arizona Board of Regents Arizona State University System Revenue, Series C, 5.75%, | | | | |
| 7/01/20 | | 500,000 | | 573,875 |
| 7/01/21 | | 500,000 | | 560,125 |
| Arizona Health Facilities Authority Revenue, | | | | |
| Banner Health, Series D, 5.50%, 1/01/22 | | 5,000,000 | | 5,275,750 |
| Banner Health, Series D, 5.00%, 1/01/23 | | 5,000,000 | | 5,042,800 |
| Series A, 5.00%, 1/01/22 | | 8,000,000 | | 8,140,960 |
| Arizona School Facilities Board COP, | | | | |
| 5.25%, 9/01/19 | | 10,000,000 | | 10,689,000 |
| Refunding, Series A-3, Assured Guaranty, 5.00%, 9/01/19 | | 16,185,000 | | 17,316,817 |
| Arizona School Facilities Board Revenue, Series B, NATL RE, FGIC Insured, 4.00%, | | | | |
| 9/01/13 | | 5,000,000 | | 5,216,050 |
| Arizona State COP, Department of Administration, | | | | |
| Series A, AGMC Insured, 5.00%, 10/01/19 | | 5,650,000 | | 6,048,212 |
| Series A, AGMC Insured, 5.25%, 10/01/21 | | 10,000,000 | | 10,550,300 |
| Series A, AGMC Insured, 5.25%, 10/01/22 | | 40,910,000 | | 42,775,496 |
| Series B, AGMC Insured, 5.00%, 10/01/20 | | 14,860,000 | | 15,691,714 |
| Arizona State University COP, Research Infrastructure Projects, AMBAC Insured, 5.25%, | | | | |
| 9/01/16 | | 2,505,000 | | 2,681,202 |
| Glendale IDAR, John C. Lincoln Health, Refunding, Series B, 5.00%, 12/01/18 | | 5,605,000 | | 5,460,728 |
Annual Report | 85
| | | | |
| Franklin Tax-Free Trust | | | | |
| |
| Statement of Investments, February 28, 2011 (continued) | | | | |
| |
| |
| Franklin Federal Intermediate-Term Tax-Free Income Fund | | Principal Amount | | Value |
| Municipal Bonds (continued) | | | | |
| Arizona (continued) | | | | |
| Maricopa County GO, School District No. 97, Deer Valley School Improvement, Series A, NATL | | | | |
| RE, FGIC Insured, 4.75%, 7/01/12 | $ | 4,000,000 | $ | 4,213,160 |
| Maricopa County Hospital Revenue, Sun Health Corp., Pre-Refunded, 5.00%, 4/01/18 | | 2,000,000 | | 2,270,760 |
| Mesa GO, Refunding, Series A, NATL RE, FGIC Insured, 4.20%, 7/01/16 | | 715,000 | | 732,460 |
| Phoenix Civic Improvement Corp. Airport Revenue, junior lien, Series A, 5.00%, | | | | |
| 7/01/19 | | 1,900,000 | | 2,072,691 |
| 7/01/20 | | 1,300,000 | | 1,416,155 |
| 7/01/21 | | 4,200,000 | | 4,500,426 |
| Scottsdale IDA Hospital Revenue, Scottsdale Healthcare, Refunding, Series A, 5.00%, | | | | |
| 9/01/21 | | 4,000,000 | | 4,039,800 |
| Tempe Arizona IDA Lease Revenue, State University Foundation, AMBAC Insured, 4.00%, | | | | |
| 7/01/15 | | 1,000,000 | | 1,002,600 |
| 7/01/16 | | 1,000,000 | | 987,680 |
| University Medical Center Corp. Hospital Revenue, 6.00%, 7/01/24 | | 2,000,000 | | 2,078,100 |
| | | | | 159,336,861 |
| Arkansas 0.2% | | | | |
| Arkansas State Development Finance Authority Revenue, State Agencies Facilities, Corrections, | | | | |
| Series B, AGMC Insured, 5.00%, | | | | |
| 11/01/17 | | 1,955,000 | | 2,126,493 |
| 11/01/19 | | 1,065,000 | | 1,148,315 |
| University of Arkansas University Revenues, Student Fee University of Arkansas at Fort Smith, | | | | |
| AGMC Insured, Pre-Refunded, 4.75%, 12/01/15 | | 2,295,000 | | 2,369,656 |
| | | | | 5,644,464 |
| California 11.2% | | | | |
| California Health Facilities Financing Authority Revenue, | | | | |
| Catholic Healthcare West, Series L, 5.125%, 7/01/22 | | 10,000,000 | | 10,082,200 |
| Providence Health and Services, Series C, 6.00%, 10/01/18 | | 500,000 | | 581,830 |
| Scripps Health, Series A, 5.00%, 10/01/21 | | 5,000,000 | | 5,091,300 |
| Sutter Health, Refunding, Series B, 5.00%, 8/15/22 | | 4,000,000 | | 4,041,920 |
| Sutter Health, Refunding, Series B, 5.25%, 8/15/23 | | 13,000,000 | | 13,232,180 |
| California State Department of Water Resources Power Supply Revenue, Series A, Pre-Refunded, | | | | |
| 5.125%, 5/01/18 | | 3,000,000 | | 3,196,080 |
| California State GO, | | | | |
| 5.50%, 4/01/21 | | 20,000,000 | | 22,081,800 |
| Refunding, 5.00%, 2/01/17 | | 3,000,000 | | 3,176,550 |
| Refunding, 5.00%, 8/01/21 | | 20,000,000 | | 21,064,400 |
| Various Purpose, 5.25%, 11/01/17 | | 10,000,000 | | 10,751,600 |
| Various Purpose, XLCA Insured, 5.00%, 11/01/22 | | 4,805,000 | | 5,020,408 |
| California State Public Works Board Lease Revenue, Various Capital Projects, | | | | |
| Series G, Sub Series G-1, 5.25%, 10/01/18 | | 5,605,000 | | 5,972,184 |
| Series G, Sub Series G-1, 5.25%, 10/01/19 | | 10,000,000 | | 10,564,900 |
| Series G, Sub Series G-1, 5.00%, 10/01/21 | | 15,055,000 | | 15,232,348 |
| Series I, 5.00%, 11/01/18 | | 4,000,000 | | 4,199,520 |
| Series I, 5.25%, 11/01/20 | | 5,000,000 | | 5,229,700 |
86 | Annual Report
| | | | | |
| | Franklin Tax-Free Trust | | | | |
| |
| | Statement of Investments, February 28, 2011 (continued) | | | | |
| |
| |
| | Franklin Federal Intermediate-Term Tax-Free Income Fund | | Principal Amount | | Value |
| | Municipal Bonds (continued) | | | | |
| | California (continued) | | | | |
| | California Statewide CDA Revenue, | | | | |
| | Enloe Medical Center, Series A, California Mortgage Insured, 5.25%, 8/15/19 | $ | 1,990,000 | $ | 2,087,391 |
| | Enloe Medical Center, Series A, California Mortgage Insured, 5.375%, 8/15/20 | | 1,650,000 | | 1,735,157 |
| | Sutter Health, Refunding, Series A, 5.25%, 8/15/24 | | 4,000,000 | | 4,023,560 |
| | El Dorado Irrigation District COP, Refunding, Series A, Assured Guaranty, | | | | |
| | 5.00%, 8/01/22 | | 2,610,000 | | 2,747,129 |
| | 5.25%, 8/01/23 | | 2,860,000 | | 3,041,667 |
| | Los Angeles Department of Water and Power Revenue, Refunding, Series B, 5.25%, | | | | |
| | 7/01/24 | | 17,000,000 | | 18,279,590 |
| | Los Angeles Department of Water and Power Waterworks Revenue, Refunding, Series B, NATL | | | | |
| | Insured, 4.25%, 7/01/17 | | 4,000,000 | | 4,141,600 |
| | Los Angeles Municipal Improvement Corp. Lease Revenue, Capital Equipment, Refunding, | | | | |
| | Series A, Assured Guaranty, | | | | |
| | 5.00%, 4/01/17 | | 3,215,000 | | 3,584,886 |
| | 5.25%, 4/01/18 | | 2,495,000 | | 2,828,407 |
| | 5.25%, 4/01/19 | | 3,180,000 | | 3,599,601 |
| | Los Angeles USD, GO, | | | | |
| | Election of 2004, Series F, FGIC Insured, 5.00%, 7/01/24 | | 6,700,000 | | 6,802,778 |
| | Series A, NATL Insured, 4.25%, 7/01/16 | | 2,500,000 | | 2,597,700 |
| | Series F, 5.00%, 7/01/22 | | 5,675,000 | | 5,970,554 |
| | Orange County Airport Revenue, 5.00%, | | | | |
| | 7/01/20 | | 3,465,000 | | 3,824,320 |
| | 7/01/21 | | 7,545,000 | | 8,202,622 |
| | San Francisco City and County COP, Multiple Capital Improvement Projects, Series A, | | | | |
| | 5.00%, 4/01/25 | | 4,000,000 | | 4,101,360 |
| | 5.25%, 4/01/26 | | 2,500,000 | | 2,584,650 |
| | San Joaquin Hills Transportation Corridor Agency Toll Road Revenue, Capital Appreciation, | | | | |
| | Refunding, Series A, 5.65%, 1/15/17 | | 3,000,000 | | 2,983,530 |
| | San Jose RDA Tax Allocation, Merged Area, Refunding, Series D, Assured Guaranty, 5.00%, | | | | |
| | 8/01/21 | | 10,000,000 | | 10,021,300 |
| | 8/01/22 | | 10,000,000 | | 9,854,400 |
| | Tulare Joint UHSD, GO, Election of 2004, Series A, NATL Insured, 5.00%, 8/01/16 | | 2,870,000 | | 3,100,719 |
| | Tuolumne Wind Project Authority Revenue, Tuolumne Co. Project, Series A, 5.25%, 1/01/23 | | 8,000,000 | | 8,424,000 |
| | Val Verde USD, COP, FGIC Insured, ETM, 5.00%, 1/01/15 | | 1,000,000 | | 1,127,320 |
| | | | | | 255,183,161 |
| | Colorado 1.8% | | | | |
| | Adams County PCR, Public Service Co. of Colorado Project, Refunding, Series A, NATL Insured, | | | | |
| | 4.375%, 9/01/17 | | 17,000,000 | | 16,554,600 |
| | Denver City and County Excise Tax Revenue, Refunding, Series A, AGMC Insured, 5.00%, | | | | |
| | 9/01/20 | | 10,090,000 | | 11,132,095 |
| E | -470 Public Highway Authority Revenue, Series D1, NATL Insured, 5.50%, 9/01/24 | | 8,000,000 | | 7,984,880 |
| | Public Authority for Colorado Energy Natural Gas Purchase Revenue, 5.75%, 11/15/18 | | 4,580,000 | | 4,817,840 |
| | | | | | 40,489,415 |
Annual Report | 87
| | | | | |
| | Franklin Tax-Free Trust | | | | |
| |
| | Statement of Investments, February 28, 2011 (continued) | | | | |
| |
| |
| | Franklin Federal Intermediate-Term Tax-Free Income Fund | | Principal Amount | | Value |
| | Municipal Bonds (continued) | | | | |
| | Florida 7.6% | | | | |
| | Broward County School Board COP, Series A, AGMC Insured, 5.00%, 7/01/16 | $ | 5,915,000 | $ | 6,369,154 |
| | Citizens Property Insurance Corp. Revenue, High-Risk Account, Senior Secured, Series A-1, | | | | |
| | 5.00%, 6/01/16 | | 40,415,000 | | 42,483,036 |
| | 5.25%, 6/01/17 | | 3,250,000 | | 3,430,050 |
| | 6.00%, 6/01/17 | | 5,000,000 | | 5,452,200 |
| | Collier County Capital Improvement Revenue, NATL RE, FGIC Insured, Pre-Refunded, 4.60%, | | | | |
| | 10/01/13 | | 1,000,000 | | 1,034,670 |
| | Collier County School Board COP, AGMC Insured, 5.00%, 2/15/22 | | 5,075,000 | | 5,267,748 |
| | Hillsborough County Capacity Assessment Special Assessment Revenue, NATL RE, FGIC | | | | |
| | Insured, 5.00%, 3/01/19 | | 5,000,000 | | 5,242,800 |
| | Hillsborough County IDA, PCR, Tampa Electric Co. Project, Series A, 5.65%, 5/15/18 | | 6,500,000 | | 7,197,190 |
| | Marion County Public Improvement Revenue, Refunding, NATL Insured, | | | | |
| | 4.20%, 12/01/12 | | 1,400,000 | | 1,443,498 |
| | 4.30%, 12/01/13 | | 1,800,000 | | 1,852,884 |
| | Miami-Dade County Aviation Revenue, Miami International Airport, Refunding, Series A, | | | | |
| | 4.25%, 10/01/18 | | 6,920,000 | | 7,173,964 |
| | 4.50%, 10/01/19 | | 4,805,000 | | 5,013,345 |
| | 5.00%, 10/01/21 | | 5,000,000 | | 5,248,200 |
| | 5.00%, 10/01/22 | | 5,890,000 | | 6,084,488 |
| | 5.25%, 10/01/23 | | 4,875,000 | | 5,072,047 |
| Miami | -Dade County School Board COP, Series A, Assured Guaranty, 5.00%, 2/01/23 | | 12,115,000 | | 12,522,185 |
| | Orange County School Board COP, Series B, NATL RE, FGIC Insured, 5.00%, | | | | |
| | 8/01/18 | | 5,150,000 | | 5,446,949 |
| | 8/01/19 | | 5,985,000 | | 6,273,417 |
| | Orlando Wastewater Services Revenue, Refunding, Series A, AMBAC Insured, 4.00%, | | | | |
| | 10/01/14 | | 5,000,000 | | 5,151,350 |
| | Palm Beach County School Board COP, Series E, NATL Insured, 5.00%, 8/01/21 | | 6,060,000 | | 6,410,026 |
| | Pasco County Solid Waste Disposal and Resource Recovery System Revenue, Series D, AGMC | | | | |
| | Insured, 5.00%, | | | | |
| | 10/01/22 | | 9,490,000 | | 9,962,222 |
| | 10/01/24 | | 10,455,000 | | 10,839,012 |
| | South Miami Health Facilities Authority Hospital Revenue, Baptist Health South Florida Group, | | | | |
| | 5.00%, 8/15/19 | | 5,000,000 | | 5,307,950 |
| | Tampa Bay Water Utility System Revenue, | | | | |
| | FGIC Insured, Pre-Refunded, 5.75%, 10/01/15 | | 1,000,000 | | 1,031,320 |
| | Series B, FGIC Insured, Pre-Refunded, 4.75%, 10/01/16 | | 3,400,000 | | 3,486,870 |
| | | | | | 174,796,575 |
| | Georgia 1.6% | | | | |
| | Atlanta Tax Allocation, Atlantic Station Project, Refunding, Assured Guaranty, 5.25%, | | | | |
| | 12/01/20 | | 1,500,000 | | 1,569,150 |
| | 12/01/21 | | 1,000,000 | | 1,039,010 |
| | Atlanta Water and Wastewater Revenue, Refunding, Series B, AGMC Insured, 5.00%, | | | | |
| | 11/01/20 | | 8,575,000 | | 9,255,684 |
| | 11/01/21 | | 9,230,000 | | 9,878,592 |
88 | Annual Report
| | | | |
| Franklin Tax-Free Trust | | | | |
| |
| Statement of Investments, February 28, 2011 (continued) | | | | |
| |
| |
| Franklin Federal Intermediate-Term Tax-Free Income Fund | | Principal Amount | | Value |
| Municipal Bonds (continued) | | | | |
| Georgia (continued) | | | | |
| Baldwin County Hospital Authority Revenue, Oconee Regional Medical Center, 5.30%, | | | | |
| 12/01/13 | $ | 1,020,000 | $ | 1,019,602 |
| Municipal Electric Authority Revenue, Series B, 5.00%, 1/01/20 | | 10,000,000 | | 11,098,200 |
| South Georgia Governmental Services Authority Revenue, NATL RE, FGIC Insured, 5.00%, | | | | |
| 1/01/16 | | 2,650,000 | | 2,846,524 |
| | | | | 36,706,762 |
| Illinois 5.3% | | | | |
| Chicago Board of Education GO, Dedicated Revenues, Refunding, Series B, AMBAC Insured, | | | | |
| 5.00%, 12/01/21 | | 16,015,000 | | 16,531,644 |
| Chicago GO, | | | | |
| Project and Refunding, Series A, AGMC Insured, 5.00%, 1/01/20 | | 22,490,000 | | 23,257,584 |
| Project and Refunding, Series A, AMBAC Insured, 5.00%, 1/01/21 | | 10,280,000 | | 10,529,701 |
| Refunding, Series A, 5.00%, 1/01/22 | | 10,935,000 | | 11,184,974 |
| Series A, 5.00%, 12/01/21 | | 5,500,000 | | 5,614,455 |
| Chicago O’Hare International Airport Revenue, | | | | |
| AGMC Insured, 5.25%, 1/01/22 | | 5,215,000 | | 5,623,074 |
| Refunding, Series B, AGMC Insured, 5.00%, 1/01/18 | | 10,670,000 | | 11,547,607 |
| Refunding, Series B, AGMC Insured, 5.00%, 1/01/20 | | 7,850,000 | | 8,150,655 |
| Illinois Finance Authority Revenue, Rush University Medical Center Obligation Group, Series A, | | | | |
| 6.75%, 11/01/24 | | 5,000,000 | | 5,379,500 |
| Illinois State GO, Refunding, AGMC Insured, 5.00%, 1/01/19 | | 12,000,000 | | 12,216,960 |
| Southwestern Illinois Development Authority Revenue, Local Government Program, Edwardsville | | | | |
| Community, AGMC Insured, 5.00%, 12/01/19 | | 11,005,000 | | 11,817,389 |
| | | | | 121,853,543 |
| Kentucky 0.9% | | | | |
| Kentucky Asset/Liability Commission Agency Fund Revenue, Project Notes, Federal Highway | | | | |
| Trust, First Series A, 5.00%, 9/01/20 | | 6,000,000 | | 6,732,000 |
| Kentucky Economic Development Finance Authority Hospital System Revenue, Appalachian | | | | |
| Regional Health Center Facility, Refunding and Improvement, 5.75%, 10/01/11 | | 1,500,000 | | 1,504,155 |
| Kentucky State Property and Buildings Commission Revenue, Project No. 87, Refunding, NATL | | | | |
| RE, FGIC Insured, 5.00%, 3/01/23 | | 11,000,000 | | 11,444,290 |
| Kentucky State Turnpike Authority Economic Development Road Revenue, 5.00%, 7/01/22 | | 1,000,000 | | 1,076,050 |
| | | | | 20,756,495 |
| Louisiana 2.4% | | | | |
| Jefferson Sales Tax District Special Sales Tax Revenue, Refunding, Series B, Assured Guaranty, | | | | |
| 5.00%, 12/01/21 | | 15,000,000 | | 16,327,650 |
| Louisiana State Citizens Property Insurance Corp. Assessment Revenue, Series B, AMBAC | | | | |
| Insured, 5.00%, 6/01/19 | | 20,000,000 | | 20,099,200 |
| New Orleans Aviation Board Revenue, Restructuring GARB, Refunding, Series A-1, Assured | | | | |
| Guaranty, 6.00%, 1/01/23 | | 2,000,000 | | 2,197,320 |
| New Orleans GO, Radian Insured, 5.00%, 12/01/25 | | 7,915,000 | | 7,784,719 |
| Orleans Parish Parishwide School District GO, Refunding, AGMC Insured, 5.00%, 9/01/18 | | 5,000,000 | | 5,528,850 |
| St. John the Baptist Parish EDR, USX Corp. Project, Refunding, 5.35%, 12/01/13 | | 4,000,000 | | 4,008,560 |
| | | | | 55,946,299 |
Annual Report | 89
| | | | |
| Franklin Tax-Free Trust | | | | |
| |
| Statement of Investments, February 28, 2011 (continued) | | | | |
| |
| |
| Franklin Federal Intermediate-Term Tax-Free Income Fund | | Principal Amount | | Value |
| Municipal Bonds (continued) | | | | |
| Maryland 0.5% | | | | |
| Maryland State EDC Student Housing Revenue, University of Maryland College Park Projects, | | | | |
| Refunding, CIFG Insured, 5.00%, | | | | |
| 6/01/19 | $ | 1,445,000 | $ | 1,479,073 |
| 6/01/20 | | 1,000,000 | | 1,008,660 |
| Maryland State Health and Higher Educational Facilities Authority Revenue, | | | | |
| Peninsula Regional Medical Center, 5.00%, 7/01/18 | | 1,600,000 | | 1,676,000 |
| Peninsula Regional Medical Center, 5.00%, 7/01/19 | | 1,430,000 | | 1,477,819 |
| Peninsula Regional Medical Center, 5.00%, 7/01/20 | | 1,000,000 | | 1,023,390 |
| Washington County Hospital, 5.25%, 1/01/22 | | 1,000,000 | | 978,130 |
| Washington County Hospital, 5.25%, 1/01/23 | | 1,250,000 | | 1,213,475 |
| Western Maryland Health, Refunding, Series A, NATL Insured, 5.00%, 1/01/19 | | 2,920,000 | | 3,031,719 |
| | | | | 11,888,266 |
| Massachusetts 0.8% | | | | |
| Massachusetts State Department of Transportation Metropolitan Highway System Revenue, | | | | |
| Contract Assistance, Series B, 5.00%, 1/01/20 | | 5,000,000 | | 5,666,600 |
| Senior, Refunding, Series B, 5.00%, 1/01/17 | | 5,000,000 | | 5,516,750 |
| Senior, Refunding, Series B, 5.00%, 1/01/18 | | 5,000,000 | | 5,506,000 |
| Massachusetts State Health and Educational Facilities Authority Revenue, CareGroup, | | | | |
| Series B-2, NATL Insured, 5.375%, 2/01/26 | | 1,720,000 | | 1,660,901 |
| | | | | 18,350,251 |
| Michigan 5.4% | | | | |
| Detroit GO, | | | | |
| Distribution State Aid, 5.00%, 11/01/19 | | 6,775,000 | | 7,251,079 |
| Distribution State Aid, 5.00%, 11/01/20 | | 6,000,000 | | 6,338,580 |
| Series A-1, NATL Insured, 5.00%, 4/01/19 | | 5,000,000 | | 4,534,150 |
| Series B, AGMC Insured, 5.00%, 4/01/18 | | 2,635,000 | | 2,478,929 |
| Series B, AGMC Insured, 5.00%, 4/01/19 | | 2,515,000 | | 2,319,333 |
| Michigan Municipal Bond Authority Revenue, | | | | |
| Local Government Loan Program, Group A, Refunding, Series B, AMBAC Insured, 5.00%, | | | | |
| 12/01/17 | | 1,000,000 | | 998,220 |
| Local Government Loan Program, Group A, Refunding, Series B, AMBAC Insured, 5.00%, | | | | |
| 12/01/18 | | 1,000,000 | | 986,050 |
| School District City of Detroit, AGMC Insured, 5.00%, 6/01/17 | | 10,000,000 | | 10,280,000 |
| Michigan State GO, Refunding, Series A, 5.25%, 11/01/22 | | 10,000,000 | | 10,728,600 |
| Michigan State HDA, SFMR, Series A, 5.00%, 12/01/19 | | 10,000,000 | | 10,195,500 |
| Michigan State Hospital Finance Authority Revenue, Trinity Health Credit Group, Mandatory | | | | |
| Put 12/01/17, Refunding, Series A, 6.00%, 12/01/34 | | 10,000,000 | | 11,438,000 |
| Michigan State Revenue, Grant Anticipation Bonds, AGMC Insured, 5.25%, 9/15/20 | | 7,500,000 | | 8,187,300 |
| Michigan State Strategic Fund Limited Obligation Revenue, | | | | |
| Detroit Edison Co. Exempt Facilities Project, Mandatory Put 8/01/16, Refunding, | | | | |
| Series ET-2, 5.50%, 8/01/29 | | 7,000,000 | | 7,619,710 |
| Michigan House of Representatives Facilities, Series A, Assured Guaranty, 5.25%, | | | | |
| 10/15/22 | | 4,000,000 | | 4,154,840 |
| Michigan House of Representatives Facilities, Series A, Assured Guaranty, 5.25%, | | | | |
| 10/15/23 | | 1,000,000 | | 1,027,090 |
90 | Annual Report
| | | | |
| Franklin Tax-Free Trust | | | | |
| |
| Statement of Investments, February 28, 2011 (continued) | | | | |
| |
| |
| Franklin Federal Intermediate-Term Tax-Free Income Fund | | Principal Amount | | Value |
| Municipal Bonds (continued) | | | | |
| Michigan (continued) | | | | |
| Royal Oak Hospital Finance Authority Hospital Revenue, William Beaumont Hospital, Refunding, | | | | |
| 6.25%, 9/01/14 | $ | 3,000,000 | $ | 3,324,330 |
| Saginaw-Midland Municipal Water Supply Corp. Revenue GO, Water Supply System, Refunding, | | | | |
| NATL Insured, 4.25%, 9/01/13 | | 1,245,000 | | 1,311,271 |
| South Lyon Community Schools GO, Refunding, NATL RE, FGIC Insured, 5.00%, 5/01/16 | | 3,040,000 | | 3,412,005 |
| Wayne State University Revenues, Refunding, Series A, 5.00%, | | | | |
| 11/15/18 | | 4,265,000 | | 4,723,658 |
| 11/15/19 | | 5,210,000 | | 5,779,141 |
| 11/15/20 | | 5,255,000 | | 5,746,659 |
| Wayne-Westland Community Schools GO, Refunding, | | | | |
| 4.50%, 5/01/12 | | 1,035,000 | | 1,075,593 |
| 4.625%, 5/01/13 | | 1,095,000 | | 1,167,237 |
| AGMC Insured, 5.00%, 5/01/16 | | 2,825,000 | | 3,034,643 |
| Wyandotte Electric Revenue, Refunding, Assured Guaranty, 5.00%, 10/01/17 | | 3,955,000 | | 4,267,010 |
| | | | | 122,378,928 |
| Minnesota 1.3% | | | | |
| Minneapolis GO, Various Purpose, Pre-Refunded, 5.00%, 12/01/17 | | 3,000,000 | | 3,104,310 |
| Minneapolis Special School District No. 001 COP, Refunding, Series B, NATL RE, FGIC Insured, | | | | |
| 4.625%, 2/01/17 | | 1,000,000 | | 1,001,970 |
| Minnesota Agricultural and Economic Development Board Revenue, Health Care Facilities, | | | | |
| Essentia, Series C-1, Assured Guaranty, | | | | |
| 5.00%, 2/15/21 | | 4,165,000 | | 4,475,667 |
| 5.00%, 2/15/22 | | 5,570,000 | | 5,903,699 |
| 5.25%, 2/15/23 | | 5,000,000 | | 5,322,900 |
| Mounds View ISD No. 621 GO, NATL Insured, 5.00%, | | | | |
| 2/01/14 | | 2,340,000 | | 2,423,351 |
| 2/01/15 | | 2,425,000 | | 2,511,378 |
| 2/01/16 | | 2,460,000 | | 2,547,625 |
| Ramsey County GO, Capital Improvement Plan, Series A, 4.75%, 2/01/15 | | 2,215,000 | | 2,276,799 |
| | | | | 29,567,699 |
| Missouri 1.1% | | | | |
| Hannibal IDA Health Facilities Revenue, Refunding, 5.00%, 3/01/19 | | 1,675,000 | | 1,677,194 |
| Jackson County Reorganized School District No. 7 Lee’s Summit GO, School Building, NATL | | | | |
| Insured, 5.00%, 3/01/16 | | 2,000,000 | | 2,206,700 |
| Missouri Joint Municipal Electric Utility Commission Power Project Revenue, Plum Point | | | | |
| Project, NATL Insured, 5.00%, | | | | |
| 1/01/17 | | 1,500,000 | | 1,555,170 |
| 1/01/19 | | 1,000,000 | | 1,020,980 |
| Southeast Missouri State University System Facilities Revenue, Refunding and Improvement, | | | | |
| NATL Insured, | | | | |
| 4.375%, 4/01/12 | | 335,000 | | 335,888 |
| 4.50%, 4/01/14 | | 545,000 | | 546,041 |
| 4.60%, 4/01/15 | | 1,360,000 | | 1,362,013 |
| 4.70%, 4/01/16 | | 1,165,000 | | 1,166,526 |
| Springfield Public Utility Revenue, NATL RE, FGIC Insured, 4.50%, 8/01/21 | | 15,245,000 | | 16,105,733 |
| | | | | 25,976,245 |
Annual Report | 91
| | | | |
| Franklin Tax-Free Trust | | | | |
| |
| Statement of Investments, February 28, 2011 (continued) | | | | |
| |
| |
| Franklin Federal Intermediate-Term Tax-Free Income Fund | | Principal Amount | | Value |
| Municipal Bonds (continued) | | | | |
| Nevada 1.8% | | | | |
| Clark County Airport Revenue, System, sub. lien, Series C, AGMC Insured, 5.00%, | | | | |
| 7/01/22 | $ | 5,000,000 | $ | 5,136,750 |
| 7/01/23 | | 15,000,000 | | 15,213,300 |
| Clark County School District GO, Refunding, Series A, NATL RE, FGIC Insured, 4.50%, | | | | |
| 6/15/19 | | 5,000,000 | | 5,382,700 |
| Clark County Water Reclamation District GO, | | | | |
| Series A, 5.25%, 7/01/21 | | 3,435,000 | | 3,803,026 |
| Series A, 5.25%, 7/01/22 | | 3,120,000 | | 3,393,749 |
| Series B, 5.25%, 7/01/21 | | 3,430,000 | | 3,797,490 |
| Series B, 5.25%, 7/01/22 | | 3,615,000 | | 3,932,180 |
| | | | | 40,659,195 |
| New Jersey 9.3% | | | | |
| New Jersey EDA Revenue, School Facilities Construction, Refunding, Series DD-1, 5.00%, | | | | |
| 12/15/18 | | 20,000,000 | | 21,160,600 |
| New Jersey State COP, Equipment Lease Purchase, Series A, | | | | |
| 5.25%, 6/15/22 | | 10,000,000 | | 10,569,800 |
| 5.25%, 6/15/23 | | 17,945,000 | | 18,853,196 |
| AMBAC Insured, 5.00%, 6/15/17 | | 5,000,000 | | 5,191,100 |
| New Jersey State Educational Facilities Authority Revenue, Kean University, Refunding, | | | | |
| Series A, 5.00%, 9/01/21 | | 6,000,000 | | 6,401,760 |
| New Jersey State GO, Refunding, Series Q, 5.00%, 8/15/21 | | 11,580,000 | | 12,742,053 |
| New Jersey State Higher Education Assistance Authority Student Loan Revenue, | | | | |
| Refunding, Series 1A, 5.00%, 12/01/17 | | 3,250,000 | | 3,491,930 |
| Refunding, Series 1A, 5.25%, 12/01/19 | | 2,500,000 | | 2,675,175 |
| Refunding, Series 1A, 4.75%, 12/01/21 | | 7,500,000 | | 7,526,100 |
| Refunding, Series 1A, 4.75%, 12/01/22 | | 10,000,000 | | 9,866,500 |
| Series A, 5.375%, 6/01/24 | | 15,000,000 | | 15,303,900 |
| New Jersey State Transportation Trust Fund Authority Revenue, Transportation System, | | | | |
| Refunding, Series A, 5.25%, 12/15/21 | | 10,000,000 | | 10,555,700 |
| Refunding, Series A, 5.50%, 12/15/22 | | 25,000,000 | | 26,698,500 |
| Refunding, Series A, Assured Guaranty, 5.50%, 12/15/22 | | 11,465,000 | | 12,243,932 |
| Series D, 5.00%, 12/15/18 | | 10,000,000 | | 10,580,300 |
| Series D, AGMC Insured, 5.00%, 6/15/19 | | 5,630,000 | | 5,860,549 |
| New Jersey State Turnpike Authority Turnpike Revenue, Series H, 5.00%, | | | | |
| 1/01/20 | | 10,000,000 | | 11,069,300 |
| 1/01/21 | | 20,000,000 | | 21,695,400 |
| | | | | 212,485,795 |
| New York 10.3% | | | | |
| Erie County IDA School Facility Revenue, City School District of the City of Buffalo Project, | | | | |
| Series A, | | | | |
| 5.00%, 5/01/22 | | 14,840,000 | | 15,895,866 |
| AGMC Insured, 5.75%, 5/01/22 | | 5,000,000 | | 5,599,350 |
| Liverpool Central School District GO, Refunding, AGMC Insured, 5.00%, 7/15/14 | | 1,560,000 | | 1,631,604 |
| Long Island Power Authority Electric System Revenue, General, | | | | |
| Refunding, Series A, NATL RE, FGIC Insured, 5.00%, 12/01/19 | | 7,000,000 | | 7,491,820 |
| Series E, NATL RE, FGIC Insured, 5.00%, 12/01/18 | | 8,500,000 | | 9,259,390 |
92 | Annual Report
| | | | |
| Franklin Tax-Free Trust | | | | |
| |
| Statement of Investments, February 28, 2011 (continued) | | | | |
| |
| |
| Franklin Federal Intermediate-Term Tax-Free Income Fund | | Principal Amount | | Value |
| Municipal Bonds (continued) | | | | |
| New York (continued) | | | | |
| MTA Commuter Facilities Revenue, Service Contract, Series R, ETM, 5.50%, 7/01/11 | $ | 2,215,000 | $ | 2,223,240 |
| MTA Revenue, Transportation, | | | | |
| Refunding, Series F, 5.00%, 11/15/15 | | 1,250,000 | | 1,375,475 |
| Series A, AGMC Insured, 5.00%, 11/15/20 | | 5,000,000 | | 5,321,250 |
| Series A, AGMC Insured, 5.50%, 11/15/20 | | 4,365,000 | | 4,943,144 |
| Series C, 5.00%, 11/15/16 | | 1,150,000 | | 1,272,176 |
| Series C, 5.75%, 11/15/18 | | 15,000,000 | | 16,901,850 |
| New York City GO, | | | | |
| Refunding, Series C, NATL Insured, 5.875%, 8/01/16 | | 5,000 | | 5,068 |
| Refunding, Series G, 5.00%, 8/01/21 | | 7,000,000 | | 7,568,890 |
| Refunding, Series H, 5.00%, 8/01/17 | | 4,330,000 | | 4,653,841 |
| Series D, 5.00%, 12/01/21 | | 5,000,000 | | 5,424,950 |
| Series F, 4.75%, 1/15/16 | | 1,550,000 | | 1,612,016 |
| Series F, Pre-Refunded, 4.75%, 1/15/16 | | 1,450,000 | | 1,559,838 |
| Series H, 5.00%, 8/01/16 | | 3,000,000 | | 3,245,760 |
| Series J, Sub Series J-1, AGMC Insured, 5.00%, 6/01/20 | | 10,000,000 | | 10,717,400 |
| Series O, 5.00%, 6/01/19 | | 5,000,000 | | 5,407,950 |
| New York City Health and Hospital Corp. Revenue, Health System, Series A, 5.00%, 2/15/18 | | 8,000,000 | | 8,719,040 |
| New York City Transitional Finance Authority Building Aid Revenue, Fiscal 2009, | | | | |
| Series S-3, 5.00%, 1/15/23 | | 5,000,000 | | 5,234,650 |
| Series S-4, 5.00%, 1/15/21 | | 4,665,000 | | 5,085,410 |
| New York City Transitional Finance Authority Revenue, | | | | |
| Future Tax Secured, Series C, Pre-Refunded, 4.50%, 2/15/13 | | 4,500,000 | | 4,679,595 |
| sub. bond, Future Tax Secured, Series C, 5.00%, 11/01/23 | | 12,805,000 | | 13,886,254 |
| New York State Dormitory Authority Revenue, Mortgage, St. Barnabas Hospital, Series B, FHA | | | | |
| Insured, 4.25%, 8/01/14 | | 2,355,000 | | 2,421,670 |
| New York State Dormitory Authority Revenues, | | | | |
| Non-State Supported Debt, School Districts Financing Program, Series A, Assured Guaranty, | | | | |
| 5.00%, 10/01/24 | | 5,000,000 | | 5,241,400 |
| State Supported Debt, City University System, Consolidated Fifth General Resolution, | | | | |
| Series A, NATL RE, FGIC Insured, 5.50%, 7/01/23 | | 7,915,000 | | 8,929,307 |
| State Supported Debt, Mental Health Services Facilities Improvement, Refunding, 5.50%, | | | | |
| 2/15/18 | | 10,000,000 | | 11,316,400 |
| State Supported Debt, Mental Health Services Facilities Improvement, Refunding, 5.00%, | | | | |
| 2/15/19 | | 3,245,000 | | 3,584,946 |
| State Supported Debt, Mental Health Services Facilities Improvement, Refunding, Series D, | | | | |
| NATL Insured, 5.00%, 8/15/17 | | 190,000 | | 190,002 |
| New York State Energy Research and Development Authority PCR, New York State Electric and | | | | |
| Gas Corp. Project, NATL Insured, 4.10%, 3/15/15 | | 7,000,000 | | 6,981,870 |
| New York State Local Government Assistance Corp., sub lien, Refunding, Series B, 5.00%, | | | | |
| 4/01/21 | | 12,000,000 | | 13,568,640 |
| New York State Thruway Authority General Revenue, Refunding, Series H, NATL RE, FGIC | | | | |
| Insured, 5.00%, 1/01/22 | | 10,000,000 | | 10,470,000 |
| New York State Thruway Authority Service Contract Revenue, Local Highway and Bridge, | | | | |
| Refunding, 5.00%, 4/01/19 | | 9,570,000 | | 10,593,511 |
Annual Report | 93
| | | | | |
| | Franklin Tax-Free Trust | | | | |
| |
| | Statement of Investments, February 28, 2011 (continued) | | | | |
| |
| |
| | Franklin Federal Intermediate-Term Tax-Free Income Fund | | Principal Amount | | Value |
| | Municipal Bonds (continued) | | | | |
| | New York (continued) | | | | |
| | New York State Urban Development Corp. Revenue, Service Contract, Refunding, Series A-1, | | | | |
| | 5.00%, 1/01/20 | $ | 6,500,000 | $ | 7,182,630 |
| | Rockland County Solid Waste Management Authority Revenue, Refunding, Series A, Assured | | | | |
| | Guaranty, 5.375%, 12/15/18 | | 5,365,000 | | 5,994,529 |
| | | | | | 236,190,732 |
| | North Carolina 3.1% | | | | |
| | Asheville Water System Revenue, AGMC Insured, Pre-Refunded, 5.25%, | | | | |
| | 8/01/15 | | 915,000 | | 933,712 |
| | 8/01/17 | | 1,020,000 | | 1,040,859 |
| | 8/01/19 | | 1,030,000 | | 1,051,064 |
| | Charlotte Water and Sewer System Revenue, 5.00%, 6/01/16 | | 4,000,000 | | 4,077,080 |
| | Charlotte-Mecklenburg Hospital Authority Health Care System Revenue, Carolinas HealthCare | | | | |
| | System, Series A, AGMC Insured, 5.00%, 1/15/22 | | 10,000,000 | | 10,406,400 |
| | North Carolina Eastern Municipal Power Agency Power System Revenue, | | | | |
| | Refunding, Series A, 5.00%, 1/01/21 | | 10,000,000 | | 10,746,600 |
| | Refunding, Series A, Assured Guaranty, 5.25%, 1/01/19 | | 15,000,000 | | 16,466,550 |
| | Series C, Assured Guaranty, 6.00%, 1/01/19 | | 2,500,000 | | 2,787,475 |
| | North Carolina Municipal Power Agency No. 1 Catawba Electric Revenue, Refunding, | | | | |
| | Series A, 5.25%, 1/01/20 | | 4,500,000 | | 4,988,790 |
| | Series B, 5.00%, 1/01/20 | | 8,000,000 | | 8,936,400 |
| | Oak Island Enterprise System Revenue, Assured Guaranty, 5.50%, 6/01/23 | | 1,735,000 | | 1,802,387 |
| | Wake County GO, Public Improvement, Pre-Refunded, 4.50%, 3/01/14 | | 6,400,000 | | 6,664,064 |
| | | | | | 69,901,381 |
| | Ohio 4.2% | | | | |
| | Akron GO, Various Purpose, Refunding and Improvement, NATL Insured, 4.125%, | | | | |
| | 12/01/14 | | 1,000,000 | | 1,044,660 |
| | Allen County GO, Refunding, AMBAC Insured, 4.75%, 12/01/17 | | 2,180,000 | | 2,230,903 |
| | American Municipal Power Inc. Revenue, Refunding, 5.25%, | | | | |
| | 2/15/20 | | 6,000,000 | | 6,462,360 |
| | 2/15/21 | | 11,500,000 | | 12,256,700 |
| | Cleveland Municipal School District GO, AGMC Insured, 5.00%, | | | | |
| | 12/01/14 | | 1,915,000 | | 2,112,341 |
| | 12/01/15 | | 1,510,000 | | 1,650,581 |
| | 12/01/16 | | 1,400,000 | | 1,517,936 |
| | Cuyahoga County EDR, Medical Mart Center, Series G, 5.00%, | | | | |
| | 12/01/20 | | 7,000,000 | | 7,866,390 |
| | 12/01/21 | | 7,300,000 | | 8,126,944 |
| | Hamilton City School District GO, School Improvement, AGMC Insured, 5.00%, 12/01/24 | | 5,000,000 | | 5,101,700 |
| | Lake Local School District Wood County GO, NATL Insured, | | | | |
| | 5.20%, 12/01/17 | | 375,000 | | 385,241 |
| Pre | -Refunded, 5.20%, 12/01/17 | | 2,190,000 | | 2,291,244 |
| | Lakewood City School District GO, School Improvement, Refunding, AGMC Insured, 4.50%, | | | | |
| | 12/01/22 | | 2,900,000 | | 3,031,921 |
| | Mason City School District GO, School Improvement, Refunding, NATL RE, FGIC Insured, | | | | |
| | 5.00%, 12/01/15 | | 2,670,000 | | 3,024,282 |
94 | Annual Report
| | | | |
| Franklin Tax-Free Trust | | | | |
| |
| Statement of Investments, February 28, 2011 (continued) | | | | |
| |
| |
| Franklin Federal Intermediate-Term Tax-Free Income Fund | | Principal Amount | | Value |
| Municipal Bonds (continued) | | | | |
| Ohio (continued) | | | | |
| Montgomery County Revenue, Miami Valley Hospital, Mandatory Put 11/15/14, Refunding, | | | | |
| Series B, 5.25%, 11/15/39 | $ | 4,000,000 | $ | 4,288,120 |
| Nordonia Hills City School District GO, School Improvement, Refunding, NATL RE, FGIC | | | | |
| Insured, 4.50%, 12/01/21 | | 2,360,000 | | 2,464,241 |
| Ohio State Building Authority Revenue, Refunding, Series C, 5.00%, 10/01/22 | | 5,780,000 | | 6,259,914 |
| University of Cincinnati General Receipts Revenue, Series C, Assured Guaranty, 5.00%, | | | | |
| 6/01/21 | | 11,810,000 | | 12,947,421 |
| 6/01/22 | | 11,675,000 | | 12,627,096 |
| Youngstown GO, AMBAC Insured, 6.125%, 12/01/15 | | 1,275,000 | | 1,346,719 |
| | | | | 97,036,714 |
| Oregon 1.4% | | | | |
| Deschutes County Hospital Facilities Authority Hospital Revenue, Cascade Healthcare, | | | | |
| Refunding, 7.375%, 1/01/23 | | 2,000,000 | | 2,268,360 |
| Oregon State Department of Administrative Services COP, Series A, NATL RE, FGIC Insured, | | | | |
| 5.00%, 11/01/19 | | 2,340,000 | | 2,547,558 |
| Oregon State Department of Transportation Highway User Tax Revenue, senior lien, Series A, | | | | |
| 5.00%, 11/15/22 | | 5,840,000 | | 6,372,433 |
| Portland Sewer System Revenue, second lien, | | | | |
| Refunding, Series A, 4.00%, 3/01/23 | | 8,000,000 | | 8,157,600 |
| Series B, NATL Insured, 5.00%, 6/15/18 | | 3,135,000 | | 3,499,130 |
| Series B, NATL Insured, 5.00%, 6/15/19 | | 3,290,000 | | 3,639,628 |
| Salem Water and Sewer Revenue, | | | | |
| NATL Insured, 4.10%, 6/01/16 | | 1,035,000 | | 1,076,421 |
| Refunding, AGMC Insured, 4.375%, 6/01/11 | | 2,160,000 | | 2,179,116 |
| Refunding, AGMC Insured, 4.50%, 6/01/12 | | 2,250,000 | | 2,347,403 |
| | | | | 32,087,649 |
| Pennsylvania 6.5% | | | | |
| Allegheny County Hospital Development Authority Revenue, University of Pittsburgh Medical | | | | |
| Center, | | | | |
| Series A, 5.00%, 5/15/19 | | 9,000,000 | | 9,734,490 |
| Series A, 5.00%, 5/15/20 | | 7,500,000 | | 8,042,250 |
| Series B, 5.00%, 6/15/18 | | 5,000,000 | | 5,227,300 |
| Allegheny County IDAR, Pollution Control, Refunding, Series A, AMBAC Insured, 4.35%, | | | | |
| 12/01/13 | | 5,000,000 | | 5,245,050 |
| Commonwealth Financing Authority Revenue, Series C-1, AGMC Insured, 5.00%, | | | | |
| 6/01/22 | | 4,130,000 | | 4,533,336 |
| 6/01/23 | | 4,345,000 | | 4,702,202 |
| Pennsylvania State Turnpike Commission Turnpike Revenue, | | | | |
| Refunding, Series C, Sub Series C-1, Assured Guaranty, 6.00%, 6/01/23 | | 10,000,000 | | 11,193,000 |
| Series B, 5.00%, 12/01/19 | | 32,230,000 | | 35,791,737 |
| Subordinated, Series A, Assured Guaranty, 5.00%, 6/01/22 | | 6,070,000 | | 6,409,374 |
| Philadelphia GO, Refunding, Series A, Assured Guaranty, 5.25%, 8/01/22 | | 20,000,000 | | 21,445,000 |
| Philadelphia Municipal Authority Revenue, Lease, 6.00%, 4/01/22 | | 7,065,000 | | 7,311,145 |
Annual Report | 95
| | | | |
| Franklin Tax-Free Trust | | | | |
| |
| Statement of Investments, February 28, 2011 (continued) | | | | |
| |
| |
| Franklin Federal Intermediate-Term Tax-Free Income Fund | | Principal Amount | | Value |
| Municipal Bonds (continued) | | | | |
| Pennsylvania (continued) | | | | |
| Philadelphia Water and Wastewater Revenue, | | | | |
| Refunding, Series A, AGMC Insured, 5.00%, 6/15/17 | $ | 10,000,000 | $ | 11,040,700 |
| Refunding, Series A, AGMC Insured, 5.00%, 6/15/18 | | 5,000,000 | | 5,539,250 |
| Refunding, Series A, AGMC Insured, 5.00%, 6/15/19 | | 5,000,000 | | 5,508,550 |
| Series A, 5.00%, 1/01/20 | | 1,210,000 | | 1,284,717 |
| Series A, 5.25%, 1/01/21 | | 3,655,000 | | 3,908,547 |
| Series A, 5.25%, 1/01/22 | | 2,330,000 | | 2,461,389 |
| | | | | 149,378,037 |
| South Carolina 1.7% | | | | |
| Piedmont Municipal Power Agency Electric Revenue, Refunding, | | | | |
| Series A-2, 5.00%, 1/01/22 | | 7,000,000 | | 7,174,370 |
| Series A-4, 5.00%, 1/01/20 | | 17,000,000 | | 18,161,610 |
| Rock Hill Utility System Revenue, Refunding and Improvement, Series A, AGMC Insured, | | | | |
| 4.00%, 1/01/14 | | 2,000,000 | | 2,089,780 |
| Scago Educational Facilities Corp. for Pickens School District Revenue, Pickens County Project, | | | | |
| AGMC Insured, 5.00%, 12/01/18 | | 5,000,000 | | 5,378,900 |
| South Carolina Jobs EDA Hospital Revenue, Palmetto Health, Refunding and Improvement, | | | | |
| 5.375%, 8/01/22 | | 6,000,000 | | 5,936,760 |
| | | | | 38,741,420 |
| Texas 4.3% | | | | |
| Brownsville Utility System Revenue, Refunding and Improvement, Series A, AGMC Insured, | | | | |
| 5.00%, 9/01/22 | | 8,455,000 | | 8,835,052 |
| Dallas County Utility and Reclamation District GO, Refunding, | | | | |
| Series A, AMBAC Insured, 5.15%, 2/15/21 | | 3,025,000 | | 3,082,294 |
| Series B, AMBAC Insured, 5.15%, 2/15/21 | | 8,025,000 | | 8,176,993 |
| Dallas ISD, GO, Refunding, PSF Guarantee, 4.25%, 2/15/21 | | 16,000,000 | | 17,363,200 |
| Dallas Waterworks and Sewer System Revenue, Refunding, AMBAC Insured, 4.50%, | | | | |
| 10/01/19 | | 10,000,000 | | 10,983,100 |
| Dallas-Fort Worth International Airport Revenue, Joint, Refunding, Series A, 5.00%, | | | | |
| 11/01/23 | | 1,500,000 | | 1,530,270 |
| 11/01/24 | | 1,000,000 | | 1,011,230 |
| Harris County Hospital District Revenue, senior lien, Refunding, Series A, NATL Insured, | | | | |
| 5.00%, 2/15/22 | | 4,165,000 | | 4,218,312 |
| Houston GO, Public Improvement, Refunding, Series A, 5.00%, 3/01/22 | | 10,000,000 | | 11,140,700 |
| Houston Hotel Occupancy Tax and Special Revenue, Convention and Entertainment, Series B, | | | | |
| AMBAC Insured, 5.00%, 9/01/11 | | 6,000,000 | | 6,097,080 |
| Laredo ISD Public Facility Corp. Lease Revenue, Series C, AMBAC Insured, 5.00%, | | | | |
| 8/01/19 | | 1,000,000 | | 1,007,160 |
| Sabine River Authority PCR, Southwestern Electric Co., Refunding, NATL Insured, 4.95%, | | | | |
| 3/01/18 | | 15,000,000 | | 15,401,100 |
| Tyler Health Facilities Development Corp. Hospital Revenue, East Texas Medical Center, | | | | |
| Refunding and Improvement, Series A, 5.25%, | | | | |
| 11/01/22 | | 5,000,000 | | 4,593,750 |
| 11/01/23 | | 5,000,000 | | 4,521,900 |
| | | | | 97,962,141 |
96 | Annual Report
| | | | |
| Franklin Tax-Free Trust | | | | |
| |
| Statement of Investments, February 28, 2011 (continued) | | | | |
| |
| |
| Franklin Federal Intermediate-Term Tax-Free Income Fund | | Principal Amount | | Value |
| Municipal Bonds (continued) | | | | |
| Utah 1.0% | | | | |
| Salt Lake County College Revenue, Refunding, 5.00%, 10/01/19 | $ | 2,585,000 | $ | 2,608,032 |
| Utah State Board of Regents Student Loan Revenue, Refunding, Series EE-2, 5.00%, | | | | |
| 11/01/20 | | 9,000,000 | | 9,965,790 |
| 11/01/21 | | 9,000,000 | | 9,790,110 |
| | | | | 22,363,932 |
| Virginia 1.3% | | | | |
| Virginia Beach Development Authority Public Facility Revenue, Refunding, Series B, 5.00%, | | | | |
| 8/01/19 | | 12,635,000 | | 14,561,711 |
| 8/01/20 | | 13,450,000 | | 15,438,986 |
| | | | | 30,000,697 |
| Washington 0.7% | | | | |
| Seattle Municipal Light and Power Revenue, Refunding and Improvement, Series B, 5.00%, | | | | |
| 2/01/19 | | 6,805,000 | | 7,824,185 |
| 2/01/20 | | 7,000,000 | | 8,028,440 |
| | | | | 15,852,625 |
| U.S. Territories 2.4% | | | | |
| Guam 0.1% | | | | |
| Guam Government Limited Obligation Revenue, Section 30, Series A, 5.50%, | | | | |
| 12/01/18 | | 1,540,000 | | 1,646,922 |
| 12/01/19 | | 1,025,000 | | 1,088,447 |
| | | | | 2,735,369 |
| Puerto Rico 2.3% | | | | |
| Puerto Rico Commonwealth GO, Public Improvement, Refunding, Series A, 5.50%, | | | | |
| 7/01/18 | | 8,455,000 | | 8,907,089 |
| Puerto Rico Commonwealth Highway and Transportation Authority Transportation Revenue, | | | | |
| Transport, Series K, 5.00%, 7/01/19 | | 5,000,000 | | 5,032,500 |
| Puerto Rico Commonwealth Infrastructure Financing Authority Special Tax Revenue, | | | | |
| Refunding, Series C, AMBAC Insured, 5.50%, 7/01/24 | | 10,000,000 | | 10,017,900 |
| Puerto Rico Electric Power Authority Power Revenue, Refunding, | | | | |
| Series DDD, 5.00%, 7/01/21 | | 8,745,000 | | 8,920,862 |
| Series SS, NATL Insured, 5.00%, 7/01/24 | | 10,000,000 | | 9,780,500 |
| Series ZZ, 5.25%, 7/01/19 | | 8,000,000 | | 8,480,800 |
| | | | | 51,139,651 |
| Total U.S. Territories | | | | 53,875,020 |
| Total Municipal Bonds before Short Term Investments | | | | |
| (Cost $2,216,826,853) | | | | 2,249,672,279 |
Annual Report | 97
| | | | | |
| Franklin Tax-Free Trust | | | | | |
| |
| Statement of Investments, February 28, 2011 (continued) | | | | | |
| |
| |
| Franklin Federal Intermediate-Term Tax-Free Income Fund | | Principal Amount | | Value | |
| Short Term Investments 1.9% | | | | | |
| Municipal Bonds 1.9% | | | | | |
| California 0.5% | | | | | |
| aCalifornia Infrastructure and Economic Development Bank Revenue, Pacific Gas and Electric | | | | | |
| Co., Refunding, Series A, Daily VRDN and Put, 0.17%, 11/01/26 | $ | 7,100,000 | $ | 7,100,000 | |
| aCalifornia PCFA, PCR, Pacific Gas and Electric Co., Refunding, | | | | | |
| Series C, Daily VRDN and Put, 0.22%, 11/01/26 | | 300,000 | | 300,000 | |
| Series F, Daily VRDN and Put, 0.17%, 11/01/26 | | 1,200,000 | | 1,200,000 | |
| aLos Angeles Department of Water and Power Revenue, Refunding, Series B, Sub Series B-3, | | | | | |
| Daily VRDN and Put, 0.23%, 7/01/34 | | 2,400,000 | | 2,400,000 | |
| | | | | 11,000,000 | |
| Colorado 0.1% | | | | | |
| aColorado Educational and Cultural Facilities Authority Revenue, National Jewish Federation | | | | | |
| Bond Program, Series A-7, Daily VRDN and Put, 0.21%, 7/01/29 | | 700,000 | | 700,000 | |
| Florida 0.6% | | | | | |
| aJacksonville Health Facilities Authority Hospital Revenue, | | | | | |
| Baptist Medical Center, Daily VRDN and Put, 0.27%, 8/15/34 | | 2,100,000 | | 2,100,000 | |
| Series A, Daily VRDN and Put, 0.20%, 8/15/33 | | 11,000,000 | | 11,000,000 | |
| | | | | 13,100,000 | |
| Kentucky 0.1% | | | | | |
| aKentucky Economic Development Finance Authority Hospital Facilities Revenue, Baptist | | | | | |
| Healthcare System, Refunding, Series B-2, Daily VRDN and Put, 0.18%, 8/15/38 | | 2,600,000 | | 2,600,000 | |
| Maryland 0.0%† | | | | | |
| aMaryland State EDC, EDR, U.S. Pharmacopeial Convention Inc. Project, Refunding, Series A, | | | | | |
| Daily VRDN and Put, 0.27%, 7/01/38 | | 695,000 | | 695,000 | |
| New York 0.4% | | | | | |
| aNew York City GO, Refunding, Series J, Sub Series J-4, Daily VRDN and Put, 0.22%, | | | | | |
| 8/01/25 | | 9,800,000 | | 9,800,000 | |
| North Carolina 0.1% | | | | | |
| aCharlotte-Mecklenburg Hospital Authority Health Care System Revenue, Carolinas HealthCare | | | | | |
| System, Refunding, Series B, Daily VRDN and Put, 0.19%, 1/15/26 | | 2,700,000 | | 2,700,000 | |
| Oregon 0.1% | | | | | |
| aMedford Hospital Facilities Authority Revenue, Rogue Valley Manor Project, Daily VRDN and | | | | | |
| Put, 0.21%, 8/15/37 | | 1,800,000 | | 1,800,000 | |
| Total Short Term Investments (Cost $42,395,000) | | | | 42,395,000 | |
| Total Investments (Cost $2,259,221,853) 100.3% | | | | 2,292,067,279 | |
| Other Assets, less Liabilities (0.3)% | | | | (6,218,366 | ) |
| Net Assets 100.0% | | | $ | 2,285,848,913 | |
| |
| |
| |
| See Abbreviations on page 206. | | | | | |
| |
| †Rounds to less than 0.1% of net assets. | | | | | |
| aVariable rate demand notes (VRDNs) are tax-exempt obligations which contain a floating or variable interest rate adjustment formula and an unconditional right of demand to | |
| receive payment of the principal balance plus accrued interest at specified dates. The coupon rate shown represents the rate at period end. | | | |
| |
| |
| |
| 98 | The accompanying notes are an integral part of these financial statements. | | | Annual Report | | | |
| | | | | | | | | | | | | | | |
| Franklin Tax-Free Trust | | | | | | | | | | | | | | | |
| Financial Highlights | | | | | | | | | | | | | | | |
| |
| Franklin Federal Limited-Term Tax-Free Income Fund | | | | | | | | | | | | | | | |
| | | | | | Year Ended February 28, | | | | |
| Class A | | 2011 | | | 2010 | | | 2009 | | | 2008 | a | | 2007 | |
| Per share operating performance | | | | | | | | | | | | | | | |
| (for a share outstanding throughout the year) | | | | | | | | | | | | | | | |
| Net asset value, beginning of year | $ | 10.35 | | $ | 10.11 | | $ | 9.96 | | $ | 9.93 | | $ | 9.91 | |
| Income from investment operationsb: | | | | | | | | | | | | | | | |
| Net investment incomec | | 0.21 | | | 0.24 | | | 0.27 | | | 0.31 | | | 0.29 | |
| Net realized and unrealized gains (losses) | | (0.05 | ) | | 0.25 | | | 0.16 | | | 0.05 | | | 0.02 | |
| Total from investment operations | | 0.16 | | | 0.49 | | | 0.43 | | | 0.36 | | | 0.31 | |
| Less distributions from net investment income | | (0.22 | ) | | (0.25 | ) | | (0.28 | ) | | (0.33 | ) | | (0.29 | ) |
| Redemption feesd | | — | | | — | | | —e | | | —e | | | —e | |
| Net asset value, end of year | $ | 10.29 | | $ | 10.35 | | $ | 10.11 | | $ | 9.96 | | $ | 9.93 | |
| |
| Total returnf | | 1.52 | % | | 4.86 | % | | 4.33 | % | | 3.64 | % | | 3.20 | % |
| |
| Ratios to average net assets | | | | | | | | | | | | | | | |
| Expenses before waiver and payments by affiliates | | 0.87 | % | | 0.92 | % | | 1.03 | % | | 1.19 | % | | 1.16 | % |
| Expenses net of waiver and payments by affiliates | | 0.50 | % | | 0.50 | % | | 0.53 | % | | 0.50 | % | | 0.50 | % |
| Net investment income | | 2.01 | % | | 2.33 | % | | 2.70 | % | | 3.12 | % | | 2.88 | % |
| |
| Supplemental data | | | | | | | | | | | | | | | |
| Net assets, end of year (000’s) | $ | 640,865 | | $ | 380,522 | | $ | 184,887 | | $ | 43,914 | | $ | 18,683 | |
| Portfolio turnover rate | | 7.40 | % | | 15.53 | % | | 12.69 | % | | 18.39 | % | | 57.74 | % |
|
| aFor the year ended February 29. |
| bThe amount shown for a share outstanding throughout the period may not correlate with the Statement of Operations for the period due to the timing of sales and repurchases of |
| the Fund shares in relation to income earned and/or fluctuating market value of the investments of the Fund. |
| cBased on average daily shares outstanding. |
| dEffective September 1, 2008, the redemption fee was eliminated. |
| eAmount rounds to less than $0.01 per share. |
| fTotal return does not reflect sales commissions or contingent deferred sales charges, if applicable. |
Annual Report | The accompanying notes are an integral part of these financial statements. | 99
| | | |
| Franklin Tax-Free Trust | | | |
| |
| Financial Highlights (continued) | | | |
| |
| Franklin Federal Limited-Term Tax-Free Income Fund | | | |
| | | Period Ended | |
| | | February 28, | |
| Advisor Class | | 2011 | a |
| Per share operating performance | | | |
| (for a share outstanding throughout the period) | | | |
| Net asset value, beginning of period | $ | 10.27 | |
| Income from investment operationsb: | | | |
| Net investment incomec | | 0.02 | |
| Net realized and unrealized gains (losses) | | 0.01 | |
| Total from investment operations | | 0.03 | |
| Less distributions from net investment income | | (0.01 | ) |
| Net asset value, end of period | $ | 10.29 | |
| |
| Total returnd | | 0.33 | % |
| |
| Ratios to average net assetse | | | |
| Expenses before waiver and payments by affiliates | | 0.72 | % |
| Expenses net of waiver and payments by affiliates | | 0.35 | % |
| Net investment income | | 2.16 | % |
| |
| Supplemental data | | | |
| Net assets, end of period (000’s) | $ | 29,056 | |
| Portfolio turnover rate | | 7.40 | % |
| |
| |
| aFor the period February 1, 2011 (effective date) to February 28, 2011. | | | |
| bThe amount shown for a share outstanding throughout the period may not correlate with the Statement of Operations for the period due to the timing of sales and repurchases of | |
| the Fund shares in relation to income earned and/or fluctuating market value of the investments of the Fund. | | | |
| cBased on average daily shares outstanding. | | | |
| dTotal return is not annualized for periods less than one year. | | | |
| eRatios are annualized for periods less than one year. | | | |
| . | | | |
| |
| |
| |
| |
| 100 | The accompanying notes are an integral part of these financial statements. | | | Annual Report | |
| | | | |
| Franklin Tax-Free Trust | | | | |
| |
| Statement of Investments, February 28, 2011 | | | | |
| |
| |
| Franklin Federal Limited-Term Tax-Free Income Fund | | Principal Amount | | Value |
| Municipal Bonds 82.9% | | | | |
| Alabama 0.7% | | | | |
| Alabama State University Revenue, General Tuition and Fee, Assured Guaranty, 5.00%, | | | | |
| 9/01/14 | $ | 665,000 | $ | 733,429 |
| 9/01/15 | | 700,000 | | 780,262 |
| 9/01/16 | | 730,000 | | 821,549 |
| East Alabama Health Care Authority Health Care Facilities Revenue, | | | | |
| Mandatory Put 9/01/13, Series B, 5.00%, 9/01/33 | | 1,000,000 | | 1,036,740 |
| Mandatory Put 9/01/18, Series A, 5.25%, 9/01/36 | | 1,000,000 | | 996,940 |
| | | | | 4,368,920 |
| Arizona 4.7% | | | | |
| Arizona State COP, Department of Administration, Series B, AGMC Insured, 5.00%, 10/01/15 | | 11,975,000 | | 12,986,648 |
| Phoenix Civic Improvement Corp. Excise Tax Revenue, Light Rail Project, AMBAC Insured, | | | | |
| 5.00%, 7/01/16 | | 17,000,000 | | 18,422,050 |
| | | | | 31,408,698 |
| California 11.3% | | | | |
| Alameda-Contra Costa Transit District COP, FHR Computer System Project, 4.00%, 8/01/12 | | 480,000 | | 497,510 |
| California Health Facilities Financing Authority Revenue, Sutter Health, Series A, 5.00%, | | | | |
| 8/15/12 | | 1,000,000 | | 1,049,570 |
| California State Economic Recovery GO, Series A, 5.25%, 7/01/13 | | 200,000 | | 217,282 |
| California State GO, Refunding, 5.00%, 4/01/15 | | 500,000 | | 547,760 |
| California State Public Works Board Lease Revenue, Various Capital Projects, Series G, | | | | |
| Sub Series G-1, 5.00%, 10/01/13 | | 10,685,000 | | 11,400,040 |
| California Statewide CDA, PCR, Southern California Edison Co., Mandatory Put 4/01/13, | | | | |
| Refunding, Series A, XLCA Insured, 4.10%, 4/01/28 | | 1,500,000 | | 1,534,185 |
| California Statewide CDA Revenue, | | | | |
| CHF-Irvine LLC, UCI East Campus Apartments, Phase II, 5.00%, 5/15/14 | | 1,000,000 | | 1,033,950 |
| Methodist Hospital of Southern California Project, FHA Insured, 5.50%, 2/01/13 | | 2,430,000 | | 2,597,160 |
| Fairfield-Suisun Sewer Revenue, Refunding, Assured Guaranty, 3.00%, 5/01/11 | | 1,000,000 | | 1,003,540 |
| Fontana PFA Lease Revenue, AMBAC Insured, 5.00%, 9/01/14 | | 375,000 | | 395,753 |
| Fontana USD, GO, | | | | |
| BAN, 4.00%, 12/01/12 | | 10,540,000 | | 10,806,135 |
| Capital Appreciation, BAN, zero cpn., 12/01/12 | | 5,000,000 | | 4,952,300 |
| Gilroy USD, GO, | | | | |
| BAN, Measure P, 5.00%, 4/01/13 | | 3,000,000 | | 3,191,070 |
| Capital Appreciation, BAN, Measure P, zero cpn., 4/01/13 | | 2,000,000 | | 1,890,820 |
| Hercules RDA Tax Allocation Revenue, Series A, AMBAC Insured, 5.00%, 8/01/14 | | 1,430,000 | | 1,377,033 |
| Imperial Community College District GO, Capital Appreciation Bonds, zero cpn., 8/01/14 | | 7,250,000 | | 6,344,402 |
| Los Angeles CRDA Community Redevelopment Financing Authority Revenue, Bunker Hill Project, | | | | |
| Series A, AGMC Insured, 5.00%, 12/01/13 | | 1,000,000 | | 1,087,810 |
| Northern California Power Agency Public Power Revenue, Hydroelectric Project No. 1, Refunding, | | | | |
| Series C, Assured Guaranty, 5.00%, 7/01/15 | | 1,000,000 | | 1,115,830 |
| Pacifica COP, AMBAC Insured, 4.50%, 1/01/13 | | 1,050,000 | | 1,098,017 |
| Palo Verde Community College District COP, AMBAC Insured, 5.00%, 1/01/15 | | 745,000 | | 806,045 |
| Rocklin Joint UHSD, GO, TRAN, 2.00%, 9/01/11 | | 10,000,000 | | 10,061,400 |
| Roseville City School District GO, TRAN, 2.00%, 9/01/11 | | 5,000,000 | | 5,030,700 |
| San Jose RDA Tax Allocation, Series A, 6.125%, 8/01/15 | | 3,000,000 | | 3,112,740 |
Annual Report | 101
| | | | | | |
| | Franklin Tax-Free Trust | | | | | |
| |
| | Statement of Investments, February 28, 2011 (continued) | | | | | |
| |
| |
| | Franklin Federal Limited-Term Tax-Free Income Fund | | | Principal Amount | | Value |
| | Municipal Bonds (continued) | | | | | |
| | California (continued) | | | | | |
| | Santa Clara County Financing Authority Revenue, El Camino Hospital, Series B, AMBAC Insured, | | | | | |
| | 5.00 | %, | | | | |
| | 2/01/14 | | $ | 1,000,000 | $ | 1,071,210 |
| | 2/01/15 | | | 1,025,000 | | 1,102,838 |
| | Southern California Public Power Authority Natural Gas Project Revenue, Project No. 1, Series A, | | | | | |
| | 5.00%, 11/01/15 | | | 1,000,000 | | 1,048,590 |
| | Tustin USD School Facilities ID No. 2002-1 GO, Capital Appreciation, Election of 2002, Series C, | | | | | |
| | AGMC Insured, zero cpn., 6/01/18 | | | 810,000 | | 601,522 |
| | West Kern Community College District COP, AMBAC Insured, 4.50%, 11/01/14 | | | 780,000 | | 832,541 |
| | | | | | | 75,807,753 |
| | Colorado 0.3% | | | | | |
| | Regional Transportation District COP, Transit Vehicles, Series A, AMBAC Insured, 5.00%, | | | | | |
| | 12/01/15 | | | 1,500,000 | | 1,651,200 |
| | Florida 5.8% | | | | | |
| | Citizens Property Insurance Corp. Revenue, High-Risk Account, | | | | | |
| | senior secured, Series A-1, Assured Guaranty, 5.50%, 6/01/16 | | | 5,000,000 | | 5,368,450 |
| | senior secured, Series A-1, 5.50%, 6/01/17 | | | 5,000,000 | | 5,344,950 |
| | senior secured, Series A-1, 6.00%, 6/01/17 | | | 5,000,000 | | 5,452,200 |
| | Florida State Hurricane Catastrophe Fund Finance Corp. Revenue, Series A, 4.25%, 7/01/14 | | | 4,000,000 | | 4,181,640 |
| | Florida State Turnpike Authority Turnpike Revenue, Department of Transportation, Refunding, | | | | | |
| | Series A, AGMC Insured, 5.00%, 7/01/15 | | | 12,625,000 | | 13,441,332 |
| Miami | -Dade County GO, 5.00%, 7/01/12 | | | 3,000,000 | | 3,161,520 |
| Miami | -Dade County Public Facilities Revenue, Jackson Health System, Assured Guaranty, 4.00%, | | | | | |
| | 6/01/16 | | | 1,580,000 | | 1,656,867 |
| | | | | | | 38,606,959 |
| | Georgia 1.0% | | | | | |
| | Atlanta Water and Wastewater Revenue, Refunding, Series B, AGMC Insured, 4.00%, | | | | | |
| | 11/01/15 | | | 6,390,000 | | 6,806,181 |
| | Illinois 5.3% | | | | | |
| | Chicago GO, Series A, 5.00%, 12/01/16 | | | 5,000,000 | | 5,336,000 |
| | Chicago Wastewater Transmission Revenue, Series A, BHAC Insured, | | | | | |
| | 5.00%, 1/01/16 | | | 1,425,000 | | 1,536,193 |
| | 5.50%, 1/01/17 | | | 1,000,000 | | 1,103,450 |
| | Dolton GO, Refunding, Series B, AGMC Insured, | | | | | |
| | 3.00%, 12/01/12 | | | 575,000 | | 581,831 |
| | 3.00%, 12/01/13 | | | 1,155,000 | | 1,171,736 |
| | 4.00%, 12/01/14 | | | 1,195,000 | | 1,246,899 |
| | 3.50%, 12/01/15 | | | 1,245,000 | | 1,267,871 |
| | Illinois State GO, | | | | | |
| | AGMC Insured, 5.50%, 5/01/15 | | | 5,000,000 | | 5,331,950 |
| | AGMC Insured, 5.00%, 9/01/16 | | | 9,000,000 | | 9,359,370 |
| | Refunding, AGMC Insured, 5.00%, 1/01/16 | | | 7,000,000 | | 7,319,830 |
| | Romeoville GO, Refunding, AGMC Insured, 4.00%, 12/30/11 | | | 1,260,000 | | 1,288,967 |
| | | | | | | 35,544,097 |
102 | Annual Report
| | | | |
| Franklin Tax-Free Trust | | | | |
| |
| Statement of Investments, February 28, 2011 (continued) | | | | |
| |
| |
| Franklin Federal Limited-Term Tax-Free Income Fund | | Principal Amount | | Value |
| Municipal Bonds (continued) | | | | |
| Indiana 0.7% | | | | |
| Indianapolis Thermal Energy System Revenue, Refunding, AGMC Insured, 4.00%, 10/01/14 | $ | 4,640,000 | $ | 4,937,331 |
| Louisiana 0.1% | | | | |
| Louisiana Local Government Environmental Facilities and CDA Revenue, Shreveport Utility | | | | |
| System Projects, NATL Insured, 4.00%, 12/01/14 | | 500,000 | | 524,625 |
| Massachusetts 0.3% | | | | |
| Massachusetts State Health and Educational Facilities Authority Revenue, Cape Cod Healthcare | | | | |
| Obligation, Assured Guaranty, 4.00%, | | | | |
| 11/15/13 | | 1,150,000 | | 1,196,265 |
| 11/15/15 | | 1,000,000 | | 1,032,850 |
| | | | | 2,229,115 |
| Michigan 5.5% | | | | |
| Charlevoix Public School District GO, School Building and Site, AGMC Insured, 3.00%, | | | | |
| 5/01/11 | | 800,000 | | 803,368 |
| Detroit GO, Distribution State Aid, 5.00%, | | | | |
| 11/01/16 | | 6,120,000 | | 6,692,648 |
| 11/01/17 | | 7,485,000 | | 8,109,623 |
| Jackson GO, Capital Appreciation Downtown Development, AGMC Insured, zero cpn., 6/01/16 | | 1,370,000 | | 1,097,151 |
| Michigan Municipal Bond Authority Revenue, Local Government Loan Program, Charter County of | | | | |
| Wayne Local Project, Series B, Assured Guaranty, 5.00%, 11/01/13 | | 4,000,000 | | 4,230,320 |
| Rochester Community School District GO, Refunding, AGMC Insured, 5.00%, 5/01/15 | | 4,795,000 | | 5,157,023 |
| Royal Oak Hospital Finance Authority Hospital Revenue, William Beaumont Hospital, Refunding, | | | | |
| Series W, 5.25%, 8/01/17 | | 7,000,000 | | 7,285,320 |
| Wyandotte Electric Revenue, Refunding, Assured Guaranty, 5.00%, 10/01/13 | | 3,355,000 | | 3,591,729 |
| | | | | 36,967,182 |
| Minnesota 2.6% | | | | |
| Farmington GO, Improvement, Series B, AGMC Insured, 3.50%, 2/01/14 | | 455,000 | | 482,027 |
| Minneapolis Health Care System Revenue, Fairview Health Services, Series A, 5.00%, | | | | |
| 11/15/12 | | 1,000,000 | | 1,056,250 |
| Minnesota Agricultural and Economic Development Board Revenue, Health Care Facilities, | | | | |
| Essentia, Series C-1, Assured Guaranty, 5.00%, 2/15/15 | | 1,335,000 | | 1,457,139 |
| Minnesota State Municipal Power Agency Electric Revenue, Series B, 4.00%, 10/01/13 | | 5,000,000 | | 5,118,450 |
| Northern Municipal Power Agency Electric System Revenue, Refunding, Series A, Assured | | | | |
| Guaranty, 5.00%, | | | | |
| 1/01/12 | | 2,000,000 | | 2,069,480 |
| 1/01/15 | | 5,000,000 | | 5,468,750 |
| Otsego GO, Water, Refunding, Series C, AGMC Insured, 2.00%, 12/01/16 | | 2,000,000 | | 1,953,660 |
| | | | | 17,605,756 |
| Mississippi 0.2% | | | | |
| Mississippi Development Bank Special Obligation Revenue, Jackson Public School District GO | | | | |
| Bond Project, AGMC Insured, 5.00%, | | | | |
| 4/01/11 | | 1,000,000 | | 1,003,120 |
| 4/01/12 | | 500,000 | | 522,765 |
| | | | | 1,525,885 |
Annual Report | 103
| | | | | |
| | Franklin Tax-Free Trust | | | | |
| |
| | Statement of Investments, February 28, 2011 (continued) | | | | |
| |
| |
| | Franklin Federal Limited-Term Tax-Free Income Fund | | Principal Amount | | Value |
| | Municipal Bonds (continued) | | | | |
| | Nebraska 0.6% | | | | |
| | University of Nebraska Facilities Corp. Lease Rent Revenue, UNMC Health Professions, 5.00%, | | | | |
| | 8/15/13 | $ | 4,000,000 | $ | 4,330,480 |
| | New Hampshire 0.5% | | | | |
| | New Hampshire State GO, Refunding, Series A, 5.00%, 7/01/18 | | 2,610,000 | | 3,046,235 |
| | New Jersey 7.9% | | | | |
| | Essex County Utilities Authority Solid Waste Revenue, Refunding, Assured Guaranty, 4.00%, | | | | |
| | 4/01/12 | | 2,045,000 | | 2,112,383 |
| | 4/01/13 | | 3,335,000 | | 3,448,657 |
| | New Jersey EDA Revenue, School Facilities Construction, Refunding, | | | | |
| | aSeries C, FRN, 2.06%, 2/01/18 | | 10,000,000 | | 9,940,800 |
| | Series DD-1, 5.00%, 12/15/16 | | 10,000,000 | | 10,740,700 |
| | New Jersey State GO, Refunding, | | | | |
| | Series N, AMBAC Insured, 5.50%, 7/15/14 | | 3,000,000 | | 3,357,810 |
| | Series Q, 5.00%, 8/15/18 | | 15,885,000 | | 17,912,561 |
| | New Jersey Transportation Trust Fund Authority Revenue, Transportation System, Refunding, | | | | |
| | Series A, AMBAC Insured, 5.50%, 12/15/14 | | 5,000,000 | | 5,498,200 |
| | | | | | 53,011,111 |
| | New Mexico 1.0% | | | | |
| | New Mexico Educational Assistance Foundation Revenue, Education Loan, Series A-1, 4.00%, | | | | |
| | 12/01/14 | | 2,000,000 | | 2,134,620 |
| | 12/01/15 | | 4,000,000 | | 4,279,680 |
| | | | | | 6,414,300 |
| | New York 9.3% | | | | |
| | Long Island Power Authority Electric System Revenue, Capital Appreciation, AGMC Insured, zero | | | | |
| | cpn., 6/01/12 | | 10,000,000 | | 9,882,800 |
| | Monroe County GO, Refunding, Series A, Assured Guaranty, 5.00%, 6/01/11 | | 2,135,000 | | 2,156,670 |
| | New York City GO, Refunding, Series G, 5.25%, 8/01/16 | | 9,010,000 | | 10,276,085 |
| | New York City HDC, MFHR, Mandatory Put 9/16/13, Series L-2, 2.00%, 5/01/45 | | 15,000,000 | | 15,011,100 |
| | New York City IDAR, Capital Appreciation, Yankee Stadium, Pilot, Assured Guaranty, zero cpn., | | | | |
| | 3/01/14 | | 5,335,000 | | 4,875,550 |
| | New York Local Government Assistance Corp. Revenue, senior lien, Refunding, Series A, 5.00%, | | | | |
| | 4/01/11 | | 300,000 | | 301,104 |
| | New York State Dormitory Authority Revenues, | | | | |
| Non | -State Supported Debt, Aids Long Term Health Care Facility, 5.00%, 11/01/11 | | 695,000 | | 697,252 |
| Non | -State Supported Debt, Fordham University, Series B, Assured Guaranty, 3.25%, | | | | |
| | 7/01/13 | | 610,000 | | 634,180 |
| Non | -State Supported Debt, Manhattan College, Series B, Radian Insured, 5.00%, 7/01/13 | | 840,000 | | 855,641 |
| Non | -State Supported Debt, Rochester General Hospital, Refunding, Radian Insured, 5.00%, | | | | |
| | 12/01/15 | | 100,000 | | 104,554 |
| | Non-State Supported Debt, School District Financing Program, Series A, AGMC Insured, | | | | |
| | 5.00%, 10/01/15 | | 1,000,000 | | 1,112,520 |
| | Non-State Supported Debt, School Districts Financing Program, Series A, Assured Guaranty, | | | | |
| | 3.75%, 10/01/14 | | 1,380,000 | | 1,453,678 |
| | State Supported Debt, AGMC Insured, 5.00%, 2/15/15 | | 1,000,000 | | 1,106,960 |
104 | Annual Report
| | | | |
| Franklin Tax-Free Trust | | | | |
| |
| Statement of Investments, February 28, 2011 (continued) | | | | |
| |
| |
| Franklin Federal Limited-Term Tax-Free Income Fund | | Principal Amount | | Value |
| Municipal Bonds (continued) | | | | |
| New York (continued) | | | | |
| New York State Environmental Facilities Corp. Special Obligation Revenue, Riverbank State Park, | | | | |
| Refunding, CIFG Insured, 5.00%, 4/01/16 | $ | 200,000 | $ | 225,022 |
| New York State Urban Development Corp. Revenue, Refunding, Series D, 5.00%, 1/01/15 | | 4,000,000 | | 4,422,840 |
| Poughkeepsie Town GO, Public Improvement, Refunding, AGMC Insured, 5.00%, 4/15/15 | | 250,000 | | 278,548 |
| St. Lawrence County IDA Civic Facility Revenue, St. Lawrence University, Series A, 5.00%, | | | | |
| 10/01/16 | | 6,000,000 | | 6,654,240 |
| Suffolk County IDA Civic Facility Revenue, Westhampton Free Associates Library, AMBAC Insured, | | | | |
| 3.25%, 6/15/12 | | 300,000 | | 309,129 |
| Syracuse GO, Public Improvement, Series A, AGMC Insured, 3.25%, 6/15/12 | | 725,000 | | 740,406 |
| Triborough Bridge and Tunnel Authority Revenues, Refunding, Series C, 5.00%, 11/15/12 | | 1,000,000 | | 1,070,410 |
| | | | | 62,168,689 |
| Ohio 7.1% | | | | |
| Akron COP, District Energy Project, 2.75%, 12/01/16 | | 1,895,000 | | 1,808,702 |
| Cleveland Airport System Revenue, Series C, Assured Guaranty, 5.00%, 1/01/16 | | 5,140,000 | | 5,536,294 |
| Ohio State Air Quality Development Authority Revenue, | | | | |
| Environmental Improvement, Buckeye Powerrecovery Zone Facility, 3.00%, 12/01/13 | | 1,085,000 | | 1,107,676 |
| Pollution Control, FirstEnergy Solutions Corp., Mandatory Put 6/03/13, Refunding, Series A, | | | | |
| 2.25%, 12/01/23 | | 8,000,000 | | 7,873,680 |
| Ohio State Department of Administrative Services COP, Administrative Knowledge System, | | | | |
| Series A, NATL Insured, 5.25%, 9/01/15 | | 6,205,000 | | 6,820,102 |
| Ohio State GO, | | | | |
| 3.00%, 5/01/13 | | 10,345,000 | | 10,768,007 |
| Refunding, 3.00%, 5/01/13 | | 4,655,000 | | 4,845,343 |
| Ohio State Higher Educational Facility Revenue, Otterbein College 2007 Project, CIFG Insured, | | | | |
| 4.50%, 12/01/11 | | 210,000 | | 216,168 |
| Toledo GO, | | | | |
| Capital Improvement, Refunding, Assured Guaranty, 3.25%, 12/01/14 | | 2,860,000 | | 2,960,014 |
| Limited Tax, Various Purpose Improvement, Refunding, Assured Guaranty, 3.00%, 12/01/11 | | 570,000 | | 578,943 |
| Limited Tax, Various Purpose Improvement, Refunding, Assured Guaranty, 3.00%, 12/01/12 | | 1,315,000 | | 1,353,884 |
| Limited Tax, Various Purpose Improvement, Refunding, Assured Guaranty, 3.00%, 12/01/13 | | 1,210,000 | | 1,249,349 |
| Limited Tax, Various Purpose Improvement, Refunding, Assured Guaranty, 3.00%, 12/01/14 | | 1,210,000 | | 1,248,551 |
| Limited Tax, Various Purpose Improvement, Refunding, Assured Guaranty, 3.00%, 12/01/15 | | 1,185,000 | | 1,213,464 |
| | | | | 47,580,177 |
| Oregon 0.6% | | | | |
| Oregon State Department of Administrative Services COP, Series A, 5.00%, 5/01/13 | | 4,000,000 | | 4,325,920 |
| Pennsylvania 4.6% | | | | |
| Pennsylvania Economic Development Financing Authority Exempt Facilities Revenue, PPL Energy | | | | |
| Supply LLC Project, Mandatory Put 9/01/15, Refunding, Series A, 3.00%, 12/01/38 | | 10,000,000 | | 10,004,200 |
| Philadelphia Water and Wastewater Revenue, Refunding, Series A, AGMC Insured, 5.00%, | | | | |
| 6/15/13 | | 10,000,000 | | 10,768,500 |
| South Fork Municipal Authority Hospital Revenue, Conemaugh Valley Memorial, Refunding, | | | | |
| Series A, Assured Guaranty, | | | | |
| 4.00%, 7/01/11 | | 1,000,000 | | 1,007,990 |
| 5.00%, 7/01/12 | | 1,000,000 | | 1,039,760 |
Annual Report | 105
| | | | |
| Franklin Tax-Free Trust | | | | |
| |
| Statement of Investments, February 28, 2011 (continued) | | | | |
| |
| |
| Franklin Federal Limited-Term Tax-Free Income Fund | | Principal Amount | | Value |
| Municipal Bonds (continued) | | | | |
| Pennsylvania (continued) | | | | |
| South Fork Municipal Authority Hospital Revenue, Conemaugh Valley Memorial, Refunding, | | | | |
| Series A, Assured Guaranty, (continued) | | | | |
| 5.00%, 7/01/13 | $ | 1,130,000 | $ | 1,190,048 |
| 5.00%, 7/01/14 | | 1,250,000 | | 1,324,900 |
| 4.00%, 7/01/15 | | 1,235,000 | | 1,264,541 |
| 5.00%, 7/01/16 | | 1,325,000 | | 1,410,834 |
| University of Pittsburgh of the Commonwealth System of Higher Education Revenue, University | | | | |
| Capital Project, Mandatory Put 9/15/13, Series A, 5.50%, 9/15/39 | | 2,500,000 | | 2,730,650 |
| | | | | 30,741,423 |
| South Carolina 1.1% | | | | |
| Piedmont Municipal Power Agency Electric Revenue, Refunding, Series A-2, 5.00%, 1/01/15 | | 4,000,000 | | 4,332,280 |
| Scago Educational Facilities Corp. for Pickens School District Revenue, Pickens County Project, | | | | |
| AGMC Insured, 5.00%, 12/01/14 | | 3,000,000 | | 3,274,260 |
| | | | | 7,606,540 |
| Tennessee 4.1% | | | | |
| Memphis Electric System Revenue, sub. note, Refunding, 5.00%, 12/01/15 | | 8,000,000 | | 9,108,160 |
| Memphis GO, BAN, Refunding, 4.00%, 5/01/12 | | 5,000,000 | | 5,180,950 |
| Metropolitan Nashville Airport Authority Airport Revenue, Refunding and Improvement, Series B, | | | | |
| 4.00%, 7/01/13 | | 2,880,000 | | 3,039,293 |
| Sevier County PBA Revenue, Local Government Public Improvement, Series VII-D-1, 5.00%, | | | | |
| 6/01/15 | | 9,000,000 | | 9,915,660 |
| | | | | 27,244,063 |
| Texas 3.2% | | | | |
| Brock ISD, GO, Capital Appreciation, PSF Guarantee, zero cpn., 8/15/16 | | 460,000 | | 402,831 |
| Dallas-Fort Worth International Airport Revenue, Joint, Refunding, Series A, 5.00%, 11/01/14 | | 3,235,000 | | 3,556,656 |
| Gulf Coast Waste Disposal Authority Environmental Facilities Revenue, BP Productions North | | | | |
| America, Mandatory Put 9/03/13, Refunding, 2.30%, 1/01/42 | | 10,000,000 | | 10,000,000 |
| Harris County Health Facilities Development Corp. Revenue, Christus Health, Series A-5, AGMC | | | | |
| Insured, 3.00%, 7/01/12 | | 1,500,000 | | 1,529,445 |
| Harris County Hospital District Revenue, senior lien, Refunding, Series A, NATL Insured, 5.00%, | | | | |
| 2/15/12 | | 745,000 | | 769,071 |
| Harris County MTA Lease Revenue COP, Series A, Assured Guaranty, 5.00%, 11/01/11 | | 2,200,000 | | 2,259,290 |
| San Antonio Water Revenue, System, Series A, AGMC Insured, 5.50%, 5/15/13 | | 500,000 | | 527,815 |
| Tarrant County Cultural Education Facilities Finance Corp. Revenue, Christus Health, Refunding, | | | | |
| Series A, Assured Guaranty, 5.75%, 7/01/18 | | 2,000,000 | | 2,154,080 |
| | | | | 21,199,188 |
| Washington 1.8% | | | | |
| Energy Northwest Electric Revenue, Project 1, Refunding, Series A, 5.00%, 7/01/11 | | 375,000 | | 380,655 |
| Greater Wenatchee Regional Events Center Public Facilities District Revenue, Revenue and | | | | |
| Special Tax, BAN, Series A, 5.25%, 12/01/11 | | 7,000,000 | | 7,025,200 |
| King County Housing Authority Revenue, Birch Creek Apartments Project, 4.40%, 5/01/18 | | 2,290,000 | | 2,352,197 |
| Snohomish County School District No. 2 Everett GO, Refunding, NATL RE, FGIC Insured, 5.00%, | | | | |
| 12/01/14 | | 250,000 | | 281,350 |
106 | Annual Report
| | | | |
| Franklin Tax-Free Trust | | | | |
| |
| Statement of Investments, February 28, 2011 (continued) | | | | |
| |
| |
| Franklin Federal Limited-Term Tax-Free Income Fund | | Principal Amount | | Value |
| Municipal Bonds (continued) | | | | |
| Washington (continued) | | | | |
| Washington State Health Care Facilities Authority Revenue, MultiCare Health System, | | | | |
| Series A, AGMC Insured, 4.00%, 8/15/13 | $ | 250,000 | $ | 261,650 |
| Series A, AGMC Insured, 4.00%, 8/15/14 | | 310,000 | | 325,695 |
| Series B, AGMC Insured, 4.00%, 8/15/13 | | 250,000 | | 261,650 |
| Series B, AGMC Insured, 4.00%, 8/15/14 | | 600,000 | | 630,378 |
| Series B, AGMC Insured, 4.00%, 8/15/15 | | 625,000 | | 654,831 |
| | | | | 12,173,606 |
| U.S. Territories 2.6% | | | | |
| Guam 0.1% | | | | |
| Guam Government Limited Obligation Revenue, Section 30, Series A, 5.00%, 12/01/12 | | 1,000,000 | | 1,048,160 |
| Puerto Rico 2.5% | | | | |
| Puerto Rico Commonwealth GO, Public Improvement, AGMC Insured, 5.50%, 7/01/15 | | 5,000,000 | | 5,437,900 |
| Puerto Rico Commonwealth Government Development Bank Revenue, Refunding, NATL Insured, | | | | |
| 4.75%, 12/01/15 | | 5,000,000 | | 5,035,450 |
| Puerto Rico Commonwealth Highway and Transportation Authority Highway Revenue, Refunding, | | | | |
| Series X, NATL Insured, 5.50%, 7/01/13 | | 580,000 | | 616,650 |
| Puerto Rico Electric Power Authority Power Revenue, Series WW, 5.25%, 7/01/13 | | 1,000,000 | | 1,065,520 |
| Puerto Rico Industrial Tourist Educational Medical and Environmental Control Facilities Financing | | | | |
| Authority Revenue, Ana G. Mendez University System Project, 5.00%, 3/01/11 | | 545,000 | | 545,000 |
| Puerto Rico Municipal Finance Agency GO, Series A, AGMC Insured, 5.75%, 8/01/12 | | 3,000,000 | | 3,025,440 |
| Puerto Rico PBA Guaranteed Revenue, Mandatory Put 7/01/17, Refunding, AMBAC Insured, | | | | |
| 5.50%, 7/01/35 | | 750,000 | | 776,235 |
| | | | | 16,502,195 |
| Total U.S. Territories | | | | 17,550,355 |
| Total Municipal Bonds before Short Term Investments (Cost $550,533,553) | | | | 555,375,789 |
| Short Term Investments 16.9% | | | | |
| Municipal Bonds 16.9% | | | | |
| California 1.5% | | | | |
| California State RAN, Series A-1, 3.00%, 5/25/11 | | 10,000,000 | | 10,048,700 |
| Colorado 2.6% | | | | |
| bColorado Educational and Cultural Facilities Authority Revenue, | | | | |
| National Jewish Federation Bond Program, Refunding, Series D-1, Daily VRDN and Put, | | | | |
| 0.21%, 7/01/36 | | 3,400,000 | | 3,400,000 |
| National Jewish Federation Bond Program, Series A-3, Daily VRDN and Put, 0.21%, | | | | |
| 2/01/35 | | 4,100,000 | | 4,100,000 |
| National Jewish Federation Bond Program, Series A-10, Daily VRDN and Put, 0.26%, | | | | |
| 9/01/37 | | 1,135,000 | | 1,135,000 |
| National Jewish Federation Bond Program, Series A-11, Daily VRDN and Put, 0.21%, | | | | |
| 8/01/27 | | 1,400,000 | | 1,400,000 |
| YMCA Rockies Project, Refunding, Daily VRDN and Put, 0.26%, 10/01/38 | | 4,100,000 | | 4,100,000 |
| bPitkin County IDR, Aspen Skiing Co. Project, Refunding, Series A, Daily VRDN and Put, 0.21%, | | | | |
| 4/01/16 | | 3,000,000 | | 3,000,000 |
| | | | | 17,135,000 |
Annual Report | 107
Franklin Tax-Free Trust
Statement of Investments, February 28, 2011 (continued)
| | | | |
| Franklin Federal Limited-Term Tax-Free Income Fund | | Principal Amount | | Value |
| Short Term Investments (continued) | | | | |
| Municipal Bonds (continued) | | | | |
| Florida 1.1% | | | | |
| bBroward County Educational Facilities Authority Revenue, Educational Facilities, Nova | | | | |
| Southeastern University, Refunding, Series C, Daily VRDN and Put, 0.20%, 4/01/24 | $ | 3,100,000 | $ | 3,100,000 |
| bFlorida State Municipal Power Agency Revenue, All Requirements Power Supply Project, | | | | |
| Refunding, Series C, Daily VRDN and Put, 0.26%, 10/01/35 | | 1,400,000 | | 1,400,000 |
| bJacksonville Health Facilities Authority Hospital Revenue, | | | | |
| Baptist Medical Center, Daily VRDN and Put, 0.27%, 8/15/34 | | 1,300,000 | | 1,300,000 |
| Series A, Daily VRDN and Put, 0.20%, 8/15/33 | | 1,600,000 | | 1,600,000 |
| | | | | 7,400,000 |
| Georgia 0.4% | | | | |
| bGainesville and Hall County Hospital Authority Revenue, Anticipation Certificates, Northeast | | | | |
| Georgia Health Care System, Refunding, Series A, Daily VRDN and Put, 0.21%, 5/15/26 | | 3,000,000 | | 3,000,000 |
| Kentucky 0.9% | | | | |
| bChristian County Assn. of County Leasing Trust Lease Program Revenue, Refunding, Series A, | | | | |
| Daily VRDN and Put, 0.19%, 4/01/37 | | 2,000,000 | | 2,000,000 |
| bKentucky Economic Development Finance Authority Hospital Facilities Revenue, Baptist | | | | |
| Healthcare System, Refunding, Series B-2, Daily VRDN and Put, 0.18%, 8/15/38 | | 3,300,000 | | 3,300,000 |
| bShelby County Lease Revenue, Series A, Daily VRDN and Put, 0.19%, 9/01/34 | | 1,000,000 | | 1,000,000 |
| | | | | 6,300,000 |
| Louisiana 0.1% | | | | |
| bLouisiana State Offshore Terminal Authority Deepwater Port Revenue, Loop Inc. Project, First | | | | |
| Stage, ACES, Refunding, Daily VRDN and Put, 0.20%, 9/01/17 | | 600,000 | | 600,000 |
| Michigan 3.5% | | | | |
| bEastern Michigan University Revenues, General, Refunding, Series A, Daily VRDN and Put, | | | | |
| 0.24%, 3/01/49 | | 13,800,000 | | 13,800,000 |
| bMichigan Higher Education Facilities Authority Revenue, Limited Obligation, University of Detroit | | | | |
| Mercy Project, Refunding, Daily VRDN and Put, 0.21%, 11/01/36 | | 9,390,000 | | 9,390,000 |
| | | | | 23,190,000 |
| Missouri 1.5% | | | | |
| bMissouri Development Finance Board Cultural Facilities Revenue, The Nelson Gallery Foundation, | | | | |
| Refunding, Series A, Daily VRDN and Put, 0.19%, 12/01/37 | | 2,900,000 | | 2,900,000 |
| bMissouri State Health and Educational Facilities Authority Educational Facilities Revenue, | | | | |
| St. Louis University, Series B, Daily VRDN and Put, 0.20%, 10/01/24 | | 3,200,000 | | 3,200,000 |
| The Washington University, Series B, Daily VRDN and Put, 0.17%, 2/15/33 | | 1,000,000 | | 1,000,000 |
| bMissouri State Health and Educational Facilities Authority Health Facilities Revenue, | | | | |
| Sisters Mercy Health, Refunding, Series A, Daily VRDN and Put, 0.19%, 6/01/16 | | 1,100,000 | | 1,100,000 |
| SSM Health Care, Series C, Daily VRDN and Put, 0.25%, 6/01/45 | | 1,700,000 | | 1,700,000 |
| | | | | 9,900,000 |
| New Hampshire 0.4% | | | | |
| bNew Hampshire Health and Education Facilities Authority Revenue, Dartmouth College, | | | | |
| Refunding, Series A, Daily VRDN and Put, 0.26%, 6/01/31 | | 3,000,000 | | 3,000,000 |
108 | Annual Report
| | | | |
| Franklin Tax-Free Trust | | | | |
| |
| Statement of Investments, February 28, 2011 (continued) | | | | |
| |
| |
| Franklin Federal Limited-Term Tax-Free Income Fund | | Principal Amount | | Value |
| Short Term Investments (continued) | | | | |
| Municipal Bonds (continued) | | | | |
| New Jersey 0.4% | | | | |
| bNew Jersey EDA Revenue, School Facilities Construction, Series R, Sub Series R-1, Daily VRDN | | | | |
| and Put, 0.19%, 9/01/31 | $ | 2,700,000 | $ | 2,700,000 |
| North Carolina 0.6% | | | | |
| bNorth Carolina Medical Care Commission Health Care Facilities Revenue, Cleveland County | | | | |
| Health, Daily VRDN and Put, 0.23%, 1/01/33 | | 3,700,000 | | 3,700,000 |
| Oregon 3.7% | | | | |
| bMedford Hospital Facilities Authority Revenue, Rogue Valley Manor Project, | | | | |
| Daily VRDN and Put, 0.21%, 8/15/37 | | 13,900,000 | | 13,900,000 |
| Refunding, Daily VRDN and Put, 0.19%, 8/15/32 | | 10,800,000 | | 10,800,000 |
| | | | | 24,700,000 |
| Texas 0.2% | | | | |
| Harris County Health Facilities Development Corp. Revenue, Christus Health, Series A-5, AGMC | | | | |
| Insured, 3.00%, 7/01/11 | | 1,245,000 | | 1,252,333 |
| Total Short Term Investments (Cost $112,911,949) | | | | 112,926,033 |
| Total Investments (Cost $663,445,502) 99.8% | | | | 668,301,822 |
| Other Assets, less Liabilities 0.2% | | | | 1,619,579 |
| Net Assets 100.0% | | | $ | 669,921,401 |
| |
| |
| See Abbreviations on page 206. | | | | |
| |
| aThe coupon rate shown represents the rate at period end. | | | | |
| bVariable rate demand notes (VRDNs) are tax-exempt obligations which contain a floating or variable interest rate adjustment formula and an unconditional right of demand to |
| receive payment of the principal balance plus accrued interest at specified dates. The coupon rate shown represents the rate at period end. | | |
| |
| |
| |
| |
| Annual Report | The accompanying notes are an integral part of these financial statements. | 109 |
| | | | | | | | | | | | | | | |
| Franklin Tax-Free Trust | | | | | | | | | | | | | |
| |
| Financial Highlights | | | | | | | | | | | | | | | |
| |
| Franklin High Yield Tax-Free Income Fund | | | | | | | | | | | | | | | |
| | | | | | Year Ended February 28, | | | | |
| Class A | | 2011 | | | 2010 | | | 2009 | | | 2008 | a | | 2007 | |
| Per share operating performance | | | | | | | | | | | | | | | |
| (for a share outstanding throughout the year) | | | | | | | | | | | | | | | |
| Net asset value, beginning of year | $ | 9.99 | | $ | 8.75 | | $ | 9.98 | | $ | 11.04 | | $ | 10.83 | |
| Income from investment operationsb: | | | | | | | | | | | | | | | |
| Net investment incomec | | 0.52 | | | 0.54 | | | 0.55 | | | 0.53 | | | 0.54 | |
| Net realized and unrealized gains (losses) | | (0.39 | ) | | 1.25 | | | (1.24 | ) | | (1.06 | ) | | 0.20 | |
| Total from investment operations | | 0.13 | | | 1.79 | | | (0.69 | ) | | (0.53 | ) | | 0.74 | |
| Less distributions from net investment income | | (0.52 | ) | | (0.55 | ) | | (0.54 | ) | | (0.53 | ) | | (0.53 | ) |
| Redemption feesd | | — | | | — | | | —e | | | —e | | | —e | |
| Net asset value, end of year | $ | 9.60 | | $ | 9.99 | | $ | 8.75 | | $ | 9.98 | | $ | 11.04 | |
| |
| Total returnf | | 1.19 | % | | 20.96 | % | | (7.09 | )% | | (5.03 | )% | | 6.99 | % |
| |
| Ratios to average net assets | | | | | | | | | | | | | | | |
| Expenses | | 0.63 | % | | 0.63 | % | | 0.63 | % | | 0.62 | % | | 0.62 | % |
| Net investment income | | 5.18 | % | | 5.66 | % | | 5.77 | % | | 4.98 | % | | 4.97 | % |
| |
| Supplemental data | | | | | | | | | | | | | | | |
| Net assets, end of year (000’s) | $ | 5,133,343 | | $ | 5,477,710 | | $ | 4,255,784 | | $ | 4,784,743 | | $ | 5,329,032 | |
| Portfolio turnover rate | | 18.18 | % | | 8.58 | % | | 19.10 | % | | 20.10 | % | | 10.90 | % |
| |
| |
| aFor the year ended February 29. | | | | | | | | | | | | | | | |
| bThe amount shown for a share outstanding throughout the period may not correlate with the Statement of Operations for the period due to the timing of sales and repurchases of | |
| the Fund shares in relation to income earned and/or fluctuating market value of the investments of the Fund. | | | | | | | | | | |
| cBased on average daily shares outstanding. | | | | | | | | | | | | | | | |
| dEffective September 1, 2008, the redemption fee was eliminated. | | | | | | | | | | | | | | | |
| eAmount rounds to less than $0.01 per share. | | | | | | | | | | | | | | | |
| fTotal return does not reflect sales commissions or contingent deferred sales charges, if applicable. | | | | | | | | | | | | | |
| |
| |
| |
| |
| 110 | The accompanying notes are an integral part of these financial statements. | | | | Annual Report | | | | |
| | | | | | | | | | | | | | | |
| Franklin Tax-Free Trust | | | | | | | | | | | | | |
| |
| Financial Highlights (continued) | | | | | | | | | | | | | | | |
| |
| Franklin High Yield Tax-Free Income Fund | | | | | | | | | | | | | |
| | | | | | Year Ended February 28, | | | | |
| Class B | | 2011 | | | 2010 | | | 2009 | | | 2008 | a | | 2007 | |
| Per share operating performance | | | | | | | | | | | | | | | |
| (for a share outstanding throughout the year) | | | | | | | | | | | | | | | |
| Net asset value, beginning of year | $ | 10.06 | | $ | 8.81 | | $ | 10.05 | | $ | 11.11 | | $ | 10.90 | |
| Income from investment operationsb: | | | | | | | | | | | | | | | |
| Net investment incomec | | 0.47 | | | 0.49 | | | 0.50 | | | 0.48 | | | 0.48 | |
| Net realized and unrealized gains (losses) | | (0.39 | ) | | 1.26 | | | (1.25 | ) | | (1.07 | ) | | 0.20 | |
| Total from investment operations | | 0.08 | | | 1.75 | | | (0.75 | ) | | (0.59 | ) | | 0.68 | |
| Less distributions from net investment income | | (0.46 | ) | | (0.50 | ) | | (0.49 | ) | | (0.47 | ) | | (0.47 | ) |
| Redemption feesd | | — | | | — | | | —e | | | —e | | | —e | |
| Net asset value, end of year | $ | 9.68 | | $ | 10.06 | | $ | 8.81 | | $ | 10.05 | | $ | 11.11 | |
| |
| Total returnf | | 0.72 | % | | 20.29 | % | | (7.66 | )% | | (5.53 | )% | | 6.36 | % |
| |
| Ratios to average net assets | | | | | | | | | | | | | | | |
| Expenses | | 1.18 | % | | 1.18 | % | | 1.18 | % | | 1.17 | % | | 1.17 | % |
| Net investment income | | 4.63 | % | | 5.11 | % | | 5.22 | % | | 4.43 | % | | 4.42 | % |
| |
| Supplemental data | | | | | | | | | | | | | | | |
| Net assets, end of year (000’s) | $ | 33,159 | | $ | 68,463 | | $ | 87,208 | | $ | 139,855 | | $ | 215,121 | |
| Portfolio turnover rate | | 18.18 | % | | 8.58 | % | | 19.10 | % | | 20.10 | % | | 10.90 | % |
| |
| |
| aFor the year ended February 29. | | | | | | | | | | | | | | | |
| bThe amount shown for a share outstanding throughout the period may not correlate with the Statement of Operations for the period due to the timing of sales and repurchases of | |
| the Fund shares in relation to income earned and/or fluctuating market value of the investments of the Fund. | | | | | | | | | | | | | |
| cBased on average daily shares outstanding. | | | | | | | | | | | | | | | |
| dEffective September 1, 2008, the redemption fee was eliminated. | | | | | | | | | | | | | |
| eAmount rounds to less than $0.01 per share. | | | | | | | | | | | | | | | |
| fTotal return does not reflect sales commissions or contingent deferred sales charges, if applicable. | | | | | | | | | | | | | |
| |
| |
| |
| |
| Annual Report | | | The accompanying notes are an integral part of these financial statements. | 111 | |
| | | | | | | | | | | | | | | | | |
| Franklin Tax-Free Trust | | | | | | | | | | | | | | | | | |
| |
| Financial Highlights (continued) | | | | | | | | | | | | | | | | | |
| |
| Franklin High Yield Tax-Free Income Fund | | | | | | | | | | | | | | | | | |
| | | | | | Year Ended February 28, | | | | |
| Class C | | 2011 | | | 2010 | | | | | 2009 | | | 2008 | a | | 2007 | |
| Per share operating performance | | | | | | | | | | | | | | | | | |
| (for a share outstanding throughout the year) | | | | | | | | | | | | | | | | | |
| Net asset value, beginning of year | $ | 10.12 | | $ | 8.86 | | $ | 10.10 | | $ | 11.16 | | $ | 10.95 | |
| Income from investment operationsb: | | | | | | | | | | | | | | | | | |
| Net investment incomec | | 0.47 | | | 0.49 | | | | | 0.50 | | | 0.48 | | | 0.49 | |
| Net realized and unrealized gains (losses) | | (0.40 | ) | | 1.27 | | | | | (1.25 | ) | | (1.07 | ) | | 0.19 | |
| Total from investment operations | | 0.07 | | | 1.76 | | | | | (0.75 | ) | | (0.59 | ) | | 0.68 | |
| Less distributions from net investment income | | (0.46 | ) | | (0.50 | ) | (0.49 | ) | | (0.47 | ) | | (0.47 | ) |
| Redemption feesd | | — | | | — | | | | | —e | | | —e | | | —e | |
| Net asset value, end of year | $ | 9.73 | | $ | 10.12 | | | $ | | 8.86 | | $ | 10.10 | | $ | 11.16 | |
| |
| Total returnf | | 0.59 | % | | 20.28 | % | | (7.62 | )% | | (5.51 | )% | | 6.34 | % |
| |
| Ratios to average net assets | | | | | | | | | | | | | | | | | |
| Expenses | | 1.18 | % | | 1.18 | % | | 1.18 | % | | 1.17 | % | | 1.17 | % |
| Net investment income | | 4.63 | % | | 5.11 | % | | 5.22 | % | | 4.43 | % | | 4.42 | % |
| |
| Supplemental data | | | | | | | | | | | | | | | | | |
| Net assets, end of year (000’s) | $ | 996,921 | | $ | 1,002,985 | | $ | 663,766 | | $ | 697,697 | | $ | 761,994 | |
| Portfolio turnover rate | | 18.18 | % | | 8.58 | % | | 19.10 | % | | 20.10 | % | | 10.90 | % |
| |
| |
| aFor the year ended February 29. | | | | | | | | | | | | | | | | | |
| bThe amount shown for a share outstanding throughout the period may not correlate with the Statement of Operations for the period due to the timing of sales and repurchases of | |
| the Fund shares in relation to income earned and/or fluctuating market value of the investments of the Fund. | | | | | | | | | | | | | | | |
| cBased on average daily shares outstanding. | | | | | | | | | | | | | | | | | |
| dEffective September 1, 2008, the redemption fee was eliminated. | | | | | | | | | | | | | | | | | |
| eAmount rounds to less than $0.01 per share. | | | | | | | | | | | | | | | | | |
| fTotal return does not reflect sales commissions or contingent deferred sales charges, if applicable. | | | | | | | | | | | | | | | |
| |
| |
| |
| |
| 112 | The accompanying notes are an integral part of these financial statements. | | | | Annual Report | | | | |
| | | | | | | | | | | | | | | |
| Franklin Tax-Free Trust | | | | | | | | | | | | | |
| |
| Financial Highlights (continued) | | | | | | | | | | | | | | | |
| |
| Franklin High Yield Tax-Free Income Fund | | | | | | | | | | | | | |
| | | | | | Year Ended February 28, | | | | |
| Advisor Class | | 2011 | | | 2010 | | | 2009 | | | 2008 | a | | 2007 | |
| Per share operating performance | | | | | | | | | | | | | | | |
| (for a share outstanding throughout the year) | | | | | | | | | | | | | | | |
| Net asset value, beginning of year | $ | 10.02 | | $ | 8.77 | | $ | 10.00 | | $ | 11.06 | | $ | 10.85 | |
| Income from investment operationsb: | | | | | | | | | | | | | | | |
| Net investment incomec | | 0.53 | | | 0.55 | | | 0.56 | | | 0.55 | | | 0.55 | |
| Net realized and unrealized gains (losses) | | (0.39 | ) | | 1.26 | | | (1.24 | ) | | (1.07 | ) | | 0.20 | |
| Total from investment operations | | 0.14 | | | 1.81 | | | (0.68 | ) | | (0.52 | ) | | 0.75 | |
| Less distributions from net investment income | | (0.53 | ) | | (0.56 | ) | | (0.55 | ) | | (0.54 | ) | | (0.54 | ) |
| Redemption feesd | | — | | | — | | | —e | | | —e | | | —e | |
| Net asset value, end of year | $ | 9.63 | | $ | 10.02 | | $ | 8.77 | | $ | 10.00 | | $ | 11.06 | |
| |
| Total return | | 1.29 | % | | 21.14 | % | | (6.99 | )% | | (4.94 | )% | | 7.08 | % |
| |
| Ratios to average net assets | | | | | | | | | | | | | | | |
| Expenses | | 0.53 | % | | 0.53 | % | | 0.53 | % | | 0.52 | % | | 0.52 | % |
| Net investment income | | 5.28 | % | | 5.76 | % | | 5.87 | % | | 5.08 | % | | 5.07 | % |
| |
| Supplemental data | | | | | | | | | | | | | | | |
| Net assets, end of year (000’s) | $ | 848,957 | | $ | 621,454 | | $ | 170,562 | | $ | 143,331 | | $ | 53,127 | |
| Portfolio turnover rate | | 18.18 | % | | 8.58 | % | | 19.10 | % | | 20.10 | % | | 10.90 | % |
| |
| |
| aFor the year ended February 29. | | | | | | | | | | | | | | | |
| bThe amount shown for a share outstanding throughout the period may not correlate with the Statement of Operations for the period due to the timing of sales and repurchases of | |
| the Fund shares in relation to income earned and/or fluctuating market value of the investments of the Fund. | | | | | | | | | | | | | |
| cBased on average daily shares outstanding. | | | | | | | | | | | | | | | |
| dEffective September 1, 2008, the redemption fee was eliminated. | | | | | | | | | | | | | |
| eAmount rounds to less than $0.01 per share. | | | | | | | | | | | | | | | |
| |
| |
| |
| |
| Annual Report | | | The accompanying notes are an integral part of these financial statements. | 113 | |
| | | | |
| Franklin Tax-Free Trust | | | | |
| |
| Statement of Investments, February 28, 2011 | | | | |
| |
| |
| Franklin High Yield Tax-Free Income Fund | | Principal Amount | | Value |
| Municipal Bonds 98.3% | | | | |
| Alabama 0.7% | | | | |
| Alabama State Port Authority Docks Facilities Revenue, Refunding, 6.00%, 10/01/40 | $ | 6,000,000 | $ | 5,893,740 |
| Camden IDB Exempt Facilities Revenue, Weyerhaeuser, | | | | |
| Series A, Pre-Refunded, 6.125%, 12/01/24 | | 3,000,000 | | 3,400,260 |
| Series B, Pre-Refunded, 6.375%, 12/01/24 | | 1,750,000 | | 1,974,963 |
| Courtland IDB Environmental Improvement Revenue, International Paper Co. Projects, | | | | |
| Refunding, Series B, 6.25%, 8/01/25 | | 2,500,000 | | 2,508,125 |
| Cullman County Health Care Authority GO, Refunding, 7.00%, 2/01/36 | | 7,500,000 | | 7,079,175 |
| Phenix City IDB Environmental Improvement Revenue, MeadWestvaco-Mead Coated Board | | | | |
| Project, Refunding, Series B, 6.10%, 5/15/30 | | 5,800,000 | | 5,810,611 |
| Prattville IDB Environmental Improvement Revenue, International Paper Co. Projects, Series A, | | | | |
| 9.25%, 3/01/33 | | 5,500,000 | | 6,606,490 |
| Prattville IDB PCR, Union Camp Corp. Project, Refunding, 5.30%, 9/01/28 | | 10,250,000 | | 9,766,815 |
| Selma IDBR, Gulf Opportunity Zone, International Paper Co., Series A, 5.80%, 5/01/34 | | 3,000,000 | | 2,906,910 |
| | | | | 45,947,089 |
| Alaska 0.1% | | | | |
| Alaska Industrial Development and Export Authority Power Revenue, Upper Lynn Canal | | | | |
| Regional Power, | | | | |
| 5.70%, 1/01/12 | | 380,000 | | 381,015 |
| 5.80%, 1/01/18 | | 1,495,000 | | 1,460,346 |
| 5.875%, 1/01/32 | | 5,730,000 | | 4,927,513 |
| | | | | 6,768,874 |
| Arizona 4.6% | | | | |
| Apache County IDA, | | | | |
| IDR, Tucson Electric Power Co. Project, Refunding, Series C, 5.85%, 3/01/26 | | 16,500,000 | | 16,502,805 |
| PCR, Tucson Electric Power Co. Project, Refunding, Series A, 5.85%, 3/01/28 | | 53,150,000 | | 53,150,531 |
| PCR, Tucson Electric Power Co. Project, Refunding, Series B, 5.875%, 3/01/33 | | 33,800,000 | | 33,247,032 |
| Arizona Health Facilities Authority Hospital System Revenue, John C. Lincoln Health Network, | | | | |
| Pre-Refunded, 6.375%, 12/01/37 | | 2,500,000 | | 2,765,125 |
| Casa Grande IDA Hospital Revenue, Casa Grande Regional Medical Center, Series A, 7.25%, | | | | |
| 12/01/32 | | 14,500,000 | | 12,883,250 |
| Downtown Phoenix Hotel Corp. Revenue, sub. bond, Series B, NATL RE, FGIC Insured, 5.00%, | | | | |
| 7/01/36 | | 10,000,000 | | 8,419,600 |
| Maricopa County IDA Health Facility Revenue, Catholic Healthcare West Project, Refunding, | | | | |
| Series A, | | | | |
| 5.50%, 7/01/26 | | 7,500,000 | | 7,533,300 |
| ACA Insured, 5.00%, 7/01/16 | | 4,305,000 | | 4,310,424 |
| Maricopa County PCC, PCR, | | | | |
| El Paso Electric Co. Project, Series A, 7.25%, 4/01/40 | | 20,000,000 | | 21,956,200 |
| Southern California Edison Co., Refunding, Series A, 5.00%, 6/01/35 | | 18,025,000 | | 17,337,887 |
| Various, Public Service Co., Palo Verde, Refunding, Series A, 6.25%, 1/01/38 | | 15,000,000 | | 15,107,850 |
| Navajo County PCC Revenue, Mandatory Put 6/01/16, Series D, 5.75%, 6/01/34 | | 10,750,000 | | 11,152,050 |
| Phoenix Civic Improvement Corp. Airport Revenue, | | | | |
| junior lien, Series A, 5.00%, 7/01/40 | | 24,000,000 | | 21,479,040 |
| senior lien, Series A, 5.00%, 7/01/38 | | 15,000,000 | | 14,290,800 |
114 | Annual Report
| | | | |
| Franklin Tax-Free Trust | | | | |
| |
| Statement of Investments, February 28, 2011 (continued) | | | | |
| |
| |
| Franklin High Yield Tax-Free Income Fund | | Principal Amount | | Value |
| Municipal Bonds (continued) | | | | |
| Arizona (continued) | | | | |
| Pima County IDAR, | | | | |
| Industrial Development, Tucson Electric Power Co., Series A, 6.375%, 9/01/29 | $ | 35,000,000 | $ | 35,373,800 |
| Tucson Electric Power Co. Project, Series A, 6.10%, 9/01/25 | | 10,140,000 | | 10,139,594 |
| Salt Verde Financial Corp. Senior Gas Revenue, | | | | |
| 5.25%, 12/01/24 | | 5,450,000 | | 5,202,843 |
| 5.25%, 12/01/25 | | 6,000,000 | | 5,684,340 |
| 5.00%, 12/01/37 | | 5,000,000 | | 4,211,300 |
| University Medical Center Corp. Hospital Revenue, | | | | |
| 6.00%, 7/01/24 | | 250,000 | | 259,763 |
| 6.25%, 7/01/29 | | 1,000,000 | | 1,027,300 |
| 5.00%, 7/01/35 | | 10,175,000 | | 8,764,643 |
| 6.50%, 7/01/39 | | 1,500,000 | | 1,556,400 |
| Yuma County IDA Water and Sewer Exempt Facility Revenue, Water and Sewer, Refunding, | | | | |
| Series A, 6.375%, 12/01/37 | | 15,500,000 | | 13,122,765 |
| | | | | 325,478,642 |
| Arkansas 0.3% | | | | |
| Arkansas State Development Finance Authority Industrial Facilities Revenue, Potlatch Corp. | | | | |
| Projects, Series A, 7.75%, 8/01/25 | | 3,800,000 | | 3,811,476 |
| Baxter County IDR, Aeroquip Corp. Project, Refunding, 5.80%, 10/01/13 | | 2,400,000 | | 2,552,112 |
| Calhoun County Solid Waste Disposal Revenue, Georgia-Pacific Corp. Project, 6.375%, | | | | |
| 11/01/26 | | 10,000,000 | | 9,984,200 |
| Warren Solid Waste Disposal Revenue, Potlatch Corp. Project, 7.00%, 4/01/12 | | 3,150,000 | | 3,225,789 |
| | | | | 19,573,577 |
| California 18.3% | | | | |
| ABAG 1915 Act Special Assessment, Windemere Ranch AD, 1999-1, Pre-Refunded, | | | | |
| 6.375%, 9/02/32 | | 9,735,000 | | 10,223,016 |
| Aliso Viejo CFD No. 2005-01 Special Tax, Glenwood at Aliso Viejo, 6.00%, 9/01/38 | | 5,200,000 | | 4,435,392 |
| Anaheim PFAR, Refunding, Series A-2, NATL RE, FGIC Insured, 4.75%, 9/01/29 | | 24,000,000 | | 21,621,840 |
| Azusa Special Tax, Escrow, CFD No. 2005-1, Improvement Area 1, 5.00%, 9/01/37 | | 5,385,000 | | 3,937,243 |
| Bay Area Toll Authority Toll Bridge Revenue, San Francisco Bay Area, Refunding, Series F-1, | | | | |
| 5.50%, 4/01/43 | | 29,765,000 | | 30,023,658 |
| Beaumont Financing Authority Local Agency Revenue, Improvement Area No. 19C, Series A, | | | | |
| 5.35%, 9/01/36 | | 3,680,000 | | 2,996,182 |
| Beaumont PFAR, Sewer Enterprise Project, Series A, Pre-Refunded, 6.90%, 9/01/23 | | 3,845,000 | | 4,468,544 |
| California County Tobacco Securitization Agency Tobacco Revenue, Asset-Backed, Alameda | | | | |
| County, 5.875%, 6/01/35 | | 3,700,000 | | 2,912,529 |
| California Health Facilities Financing Authority Revenue, | | | | |
| Children’s Hospital of Orange County, Series A, 6.50%, 11/01/24 | | 5,000,000 | | 5,386,800 |
| Children’s Hospital of Orange County, Series A, 6.50%, 11/01/38 | | 8,000,000 | | 8,184,960 |
| Marshall Medical Center, Series A, California Mortgage Insured, 5.00%, 11/01/24 | | 2,295,000 | | 2,259,152 |
| Marshall Medical Center, Series A, California Mortgage Insured, 5.00%, 11/01/29 | | 2,220,000 | | 2,017,936 |
| Marshall Medical Center, Series A, California Mortgage Insured, 5.00%, 11/01/33 | | 3,130,000 | | 2,702,066 |
| California HFAR, Home Mortgage, Series K, 4.70%, 8/01/31 | | 20,000,000 | | 16,194,000 |
Annual Report | 115
| | | | |
| Franklin Tax-Free Trust | | | | |
| |
| Statement of Investments, February 28, 2011 (continued) | | | | |
| |
| |
| Franklin High Yield Tax-Free Income Fund | | Principal Amount | | Value |
| Municipal Bonds (continued) | | | | |
| California (continued) | | | | |
| California Infrastructure and Economic Development Bank Revenue, Department of Social | | | | |
| Services Administration Building, AMBAC Insured, 5.00%, | | | | |
| 12/01/30 | $ | 10,300,000 | $ | 9,887,176 |
| 12/01/35 | | 5,000,000 | | 4,487,700 |
| California Municipal Finance Authority Revenue, Harbor Regional Center Project, 8.50%, | | | | |
| 11/01/39 | | 5,000,000 | | 5,429,500 |
| California State GO, | | | | |
| 5.25%, 11/01/40 | | 47,000,000 | | 44,629,790 |
| Refunding, 5.25%, 4/01/30 | | 50,000 | | 50,023 |
| Refunding, 5.25%, 4/01/32 | | 40,000 | | 39,596 |
| Various Purpose, 6.00%, 4/01/38 | | 28,725,000 | | 29,480,755 |
| Various Purpose, Refunding, 5.25%, 3/01/30 | | 70,000,000 | | 70,248,500 |
| Various Purpose, Refunding, 5.50%, 3/01/40 | | 60,000,000 | | 59,144,400 |
| California State Public Works Board Lease Revenue, Trustees of California State University, | | | | |
| Series J, 6.00%, | | | | |
| 11/01/29 | | 7,365,000 | | 7,703,127 |
| 11/01/34 | | 17,560,000 | | 17,593,540 |
| California Statewide CDA Revenue, | | | | |
| American Baptist Home West, Refunding, 6.00%, 10/01/29 | | 3,125,000 | | 2,957,656 |
| American Baptist Home West, Refunding, 6.25%, 10/01/39 | | 5,000,000 | | 4,708,850 |
| Elder Care Alliance, Series A, Pre-Refunded, 8.25%, 11/15/32 | | 13,090,000 | | 15,037,661 |
| Monterey Institute International, 5.50%, 7/01/31 | | 13,240,000 | | 13,397,821 |
| St. Joseph Health System, Series B, FGIC Insured, 5.75%, 7/01/47 | | 5,000,000 | | 4,682,900 |
| St. Joseph Health System, Series E, AGMC Insured, 5.25%, 7/01/47 | | 10,000,000 | | 9,212,100 |
| Sutter Health, Refunding, Series A, 5.00%, 11/15/43 | | 25,000,000 | | 20,921,250 |
| Thomas Jefferson School of Law, Refunding, Series A, 7.25%, 10/01/38 | | 11,730,000 | | 11,796,744 |
| California Statewide CDA Special Tax Revenue, CFD 2007-1, Orinda, 6.00%, 9/01/37 | | 10,000,000 | | 8,235,100 |
| Chabot-Las Positas Community College District GO, Capital Appreciation Bonds, Series C, | | | | |
| AMBAC Insured, zero cpn., | | | | |
| 8/01/33 | | 21,015,000 | | 4,486,702 |
| 8/01/34 | | 10,000,000 | | 1,979,400 |
| 8/01/43 | | 31,515,000 | | 3,294,578 |
| 8/01/45 | | 34,035,000 | | 3,095,483 |
| Chino CFD Special Tax, No. 03-3, Improvement Area 2, 5.00%, 9/01/36 | | 2,215,000 | | 1,583,836 |
| Chula Vista CFD Special Tax, | | | | |
| No. 07-I, Otay Ranch Village Eleven, 5.875%, 9/01/34 | | 3,050,000 | | 2,764,276 |
| No. 13-I, Otay Ranch Village Seven, 5.35%, 9/01/36 | | 2,345,000 | | 1,725,357 |
| El Dorado County CFD No. 2001-1 Special Tax, Promontory Specific Plan, 6.30%, | | | | |
| 9/01/31 | | 3,500,000 | | 3,175,550 |
| Foothill/Eastern Corridor Agency Toll Road Revenue, Capital Appreciation, Refunding, | | | | |
| 5.85%, 1/15/23 | | 35,000,000 | | 33,052,250 |
| zero cpn., 1/15/22 | | 49,115,000 | | 21,206,384 |
| zero cpn., 1/15/31 | | 4,000,000 | | 822,840 |
| zero cpn., 1/15/34 | | 4,500,000 | | 691,650 |
| zero cpn., 1/15/36 | | 4,000,000 | | 518,160 |
| Fullerton CFD No. 1 Special Tax, Amerige Heights, 6.20%, 9/01/32 | | 3,500,000 | | 3,391,080 |
116 | Annual Report
| | | | |
| Franklin Tax-Free Trust | | | | |
| |
| Statement of Investments, February 28, 2011 (continued) | | | | |
| |
| |
| Franklin High Yield Tax-Free Income Fund | | Principal Amount | | Value |
| Municipal Bonds (continued) | | | | |
| California (continued) | | | | |
| Golden State Tobacco Securitization Corp. Tobacco Settlement Revenue, | | | | |
| Asset-Backed, Senior Series A-1, 5.75%, 6/01/47 | $ | 8,500,000 | $ | 5,715,145 |
| Asset-Backed, Senior Series A-1, Refunding, 5.00%, 6/01/33 | | 1,460,000 | | 942,561 |
| Asset-Backed, Series A-3, Pre-Refunded, 7.875%, 6/01/42 | | 10,000,000 | | 11,519,400 |
| Enhanced, Asset-Backed, Refunding, Series A, 5.00%, 6/01/45 | | 30,750,000 | | 24,547,110 |
| Enhanced, Series A, AMBAC Insured, 5.00%, 6/01/45 | | 13,250,000 | | 10,577,210 |
| Lake Elsinore 1915 Act Special Assessment, AD No. 93-1, Limited Obligation, Refunding, | | | | |
| 7.00%, 9/02/30 | | 7,335,000 | | 7,311,821 |
| Lee Lake Water District CFD No. 3 Special Tax, Retreat, 5.95%, 9/01/34 | | 5,000,000 | | 4,193,100 |
| Livermore CFD Special Tax, No. 06-1, Shea Properties, 5.40%, 9/01/36 | | 6,595,000 | | 5,006,792 |
| Los Angeles Department of Airports Airport Revenue, | | | | |
| Los Angeles International Airport, senior bond, Series D, 5.00%, 5/15/40 | | 52,685,000 | | 49,308,418 |
| Senior, Los Angeles International Airport, Refunding, Series A, 5.00%, 5/15/40 | | 25,500,000 | | 23,865,705 |
| Los Angeles MFR, Refunding, | | | | |
| Series J-1B, 7.125%, 1/01/24 | | 80,000 | | 74,739 |
| Series J-1C, 7.125%, 1/01/24 | | 335,000 | | 297,946 |
| Series J-2B, 8.50%, 1/01/24 | | 400,000 | | 372,000 |
| aSeries J-2C, 8.50%, 1/01/24 | | 1,400,000 | | 1,244,208 |
| Los Angeles Regional Airports Improvement Corp. Lease Revenue, Facilities Sublease, Delta Air | | | | |
| Lines Inc., Los Angeles International Airport, Refunding, 6.35%, 11/01/25 | | 12,000,000 | | 11,280,240 |
| Los Angeles USD, GO, Series KRY, 5.25%, 7/01/34 | | 36,625,000 | | 36,427,225 |
| Los Angeles Wastewater System Revenue, Refunding, Series A, NATL Insured, 5.00%, | | | | |
| 6/01/30 | | 7,530,000 | | 7,563,734 |
| M-S-R Energy Authority Gas Revenue, | | | | |
| Series B, 6.125%, 11/01/29 | | 30,505,000 | | 30,789,917 |
| Series B, 7.00%, 11/01/34 | | 20,000,000 | | 22,049,200 |
| Series C, 6.50%, 11/01/39 | | 20,000,000 | | 20,742,600 |
| Murrieta 1915 Act Special Tax, CFD No. 2000-1, 6.375%, 9/01/30 | | 4,000,000 | | 3,838,680 |
| Poway USD Special Tax, | | | | |
| CFD No. 10, Area A, 6.10%, 9/01/31 | | 1,995,000 | | 1,858,582 |
| CFD No. 11, Area A, 5.375%, 9/01/28 | | 2,965,000 | | 2,708,972 |
| CFD No. 11, Area A, 5.375%, 9/01/34 | | 2,235,000 | | 1,893,939 |
| CFD No. 14, Del Sur, 5.25%, 9/01/36 | | 7,500,000 | | 6,101,250 |
| Rocklin Special Tax, CFD No. 10, Whitney, 5.00%, 9/01/35 | | 7,315,000 | | 5,342,657 |
| Romoland School District Special Tax, CFD No. 1, | | | | |
| Improvement Area 1, 5.35%, 9/01/28 | | 7,015,000 | | 6,226,093 |
| Improvement Area 1, 5.40%, 9/01/36 | | 6,175,000 | | 5,226,582 |
| Improvement Area 2, 5.35%, 9/01/38 | | 7,900,000 | | 5,927,133 |
| Roseville Special Tax, CFD No. 1, Westpark, 5.25%, 9/01/25 | | 1,550,000 | | 1,376,524 |
| San Francisco City and County COP, Multiple Capital Improvement Projects, Series A, 5.00%, | | | | |
| 4/01/29 | | 10,000,000 | | 9,882,400 |
| San Francisco City and County RDA Lease Revenue, George R. Moscone Center, zero cpn., | | | | |
| 7/01/12 | | 4,500,000 | | 4,435,515 |
| 7/01/13 | | 4,250,000 | | 4,098,997 |
| 7/01/14 | | 2,250,000 | | 2,098,215 |
| San Francisco Uptown Parking Corp. Parking Revenue, Union Square, NATL Insured, 6.00%, | | | | |
| 7/01/31 | | 8,920,000 | | 9,135,864 |
Annual Report | 117
| | | | |
| Franklin Tax-Free Trust | | | | |
| |
| Statement of Investments, February 28, 2011 (continued) | | | | |
| |
| |
| Franklin High Yield Tax-Free Income Fund | | Principal Amount | | Value |
| Municipal Bonds (continued) | | | | |
| California (continued) | | | | |
| San Joaquin Hills Transportation Corridor Agency Toll Road Revenue, | | | | |
| Capital Appreciation, Refunding, Series A, 5.60%, 1/15/16 | $ | 22,500,000 | $ | 22,612,275 |
| Capital Appreciation, Refunding, Series A, 5.65%, 1/15/17 | | 20,000,000 | | 19,890,200 |
| Capital Appreciation, Refunding, Series A, 5.75%, 1/15/23 | | 20,000,000 | | 18,723,600 |
| Capital Appreciation, Refunding, Series A, 5.75%, 1/15/24 | | 20,000,000 | | 18,572,200 |
| junior lien, ETM, zero cpn., 1/01/12 | | 30,100,000 | | 29,928,731 |
| junior lien, ETM, zero cpn., 1/01/24 | | 52,700,000 | | 31,667,957 |
| junior lien, ETM, zero cpn., 1/01/25 | | 45,200,000 | | 25,509,524 |
| junior lien, ETM, zero cpn., 1/01/26 | | 131,900,000 | | 70,496,593 |
| junior lien, ETM, zero cpn., 1/01/27 | | 139,100,000 | | 69,202,250 |
| senior lien, 5.00%, 1/01/33 | | 26,930,000 | | 20,601,450 |
| Saugus USD Special Tax, 6.00%, 9/01/33 | | 3,150,000 | | 2,944,021 |
| Seal Beach CFD No. 05-01 Special Tax, Pacific Gateway Business Center, 5.30%, 9/01/36 | | 2,000,000 | | 1,616,460 |
| South Bayside Waste Management Authority Solid Waste Enterprise Revenue, Shoreway | | | | |
| Environmental, Series A, 6.00%, 9/01/36 | | 7,740,000 | | 7,765,465 |
| Southern California Public Power Authority Natural Gas Project Revenue, Project No. 1, | | | | |
| Series A, 5.25%, 11/01/25 | | 1,000,000 | | 974,980 |
| Stockton 1915 Act Special Assessment, Limited Obligation, Mosher AD No. 2003-2, 6.30%, | | | | |
| 9/02/33 | | 6,000,000 | | 5,729,820 |
| Stockton PFA Lease Revenue, Capital Improvement Projects, Series A, | | | | |
| 6.75%, 9/01/29 | | 15,905,000 | | 15,821,976 |
| 7.00%, 9/01/38 | | 12,175,000 | | 12,130,683 |
| Stockton Special Tax, Spanos Park West CFD No. 2001-1, Pre-Refunded, 6.375%, 9/01/32 | | 4,100,000 | | 4,532,345 |
| Tustin CFD No. 06-01 Special Tax, Legacy/Columbus, Series A, 6.00%, 9/01/36 | | 20,000,000 | | 18,254,400 |
| Upland CFD No. 2003-2 Special Tax, San Antonio, Improvement Area 1, Series A, 6.00%, | | | | |
| 9/01/34 | | 6,520,000 | | 5,983,600 |
| | | | | 1,285,734,057 |
| Colorado 3.9% | | | | |
| Colorado State Health Facilities Authority Revenue, Hospital, Refunding, Series C, AGMC | | | | |
| Insured, 5.25%, 3/01/40 | | 20,000,000 | | 18,757,400 |
| Denver City and County Airport Revenue, Series D, 7.75%, 11/15/13 | | 280,000 | | 305,617 |
| Denver City and County Special Facilities Airport Revenue, United Airlines Project, Refunding, | | | | |
| Series A, 5.25%, 10/01/32 | | 27,365,000 | | 22,519,206 |
| Denver Convention Center Hotel Authority Revenue, senior bond, Refunding, XLCA Insured, | | | | |
| 5.00%, | | | | |
| 12/01/30 | | 15,000,000 | | 12,200,250 |
| 12/01/35 | | 15,000,000 | | 11,727,300 |
| Denver Health and Hospital Authority Healthcare Revenue, Series A, Pre-Refunded, 6.25%, | | | | |
| 12/01/33 | | 4,000,000 | | 4,744,920 |
| E-470 Public Highway Authority Revenue, | | | | |
| Capital Appreciation, Refunding, Series B, NATL Insured, zero cpn., 9/01/37 | | 15,720,000 | | 2,075,512 |
| Capital Appreciation, Refunding, Series B, NATL Insured, zero cpn., 9/01/38 | | 20,000,000 | | 2,439,800 |
| Capital Appreciation, Refunding, Series B, NATL Insured, zero cpn., 9/01/39 | | 30,000,000 | | 3,381,000 |
| Capital Appreciation, Series A, NATL Insured, zero cpn., 9/01/28 | | 15,000,000 | | 4,102,200 |
| Capital Appreciation, Series B, NATL Insured, zero cpn., 9/01/29 | | 10,000,000 | | 2,503,600 |
| Capital Appreciation, Series B, NATL Insured, zero cpn., 9/01/30 | | 17,300,000 | | 3,988,688 |
| Capital Appreciation, Series B, NATL Insured, zero cpn., 9/01/31 | | 10,000,000 | | 2,130,000 |
| Series C, 5.375%, 9/01/26 | | 5,000,000 | | 4,546,650 |
| |
| 118 | Annual Report | | | | |
| | | | | |
| | Franklin Tax-Free Trust | | | | |
| |
| | Statement of Investments, February 28, 2011 (continued) | | | | |
| |
| |
| | Franklin High Yield Tax-Free Income Fund | | Principal Amount | | Value |
| | Municipal Bonds (continued) | | | | |
| | Colorado (continued) | | | | |
| | Eagle County Airport Terminal Corp. Revenue, Series A, | | | | |
| | 7.00%, 5/01/21 | $ | 585,000 | $ | 589,709 |
| | 7.125%, 5/01/31 | | 1,215,000 | | 1,197,601 |
| | Eagle County Sports and Housing Facilities Revenue, Vail Associate Project, Refunding, 6.95%, | | | | |
| | 8/01/19 | | 41,200,000 | | 39,851,112 |
| | Littleton MFHR, Riverpoint, Series C, Pre-Refunded, 8.00%, 12/01/29 | | 2,550,000 | | 2,566,269 |
| | Public Authority for Colorado Energy Natural Gas Purchase Revenue, | | | | |
| | 6.125%, 11/15/23 | | 2,465,000 | | 2,606,540 |
| | 6.25%, 11/15/28 | | 12,500,000 | | 13,101,750 |
| | 6.50%, 11/15/38 | | 90,100,000 | | 93,645,435 |
| | Regional Transportation District COP, Series A, 5.00%, 6/01/25 | | 13,500,000 | | 13,718,835 |
| | Superior Metropolitan District No. 1 Special Revenue, Refunding, AMBAC Insured, 5.00%, | | | | |
| | 12/01/28 | | 7,640,000 | | 6,873,708 |
| | a,bVillages Castle Rock Metropolitan District No. 4 Revenue, Refunding, 8.50%, 6/01/31 | | 3,000,000 | | 2,779,110 |
| | | | | | 272,352,212 |
| | Connecticut 1.1% | | | | |
| | Connecticut State Development Authority PCR, | | | | |
| | Connecticut Light and Water, Refunding, Series A, 5.85%, 9/01/28 | | 53,825,000 | | 53,475,676 |
| | Western Massachusetts Electric Co., Refunding, Series A, 5.85%, 9/01/28 | | 12,500,000 | | 12,486,375 |
| | Connecticut State Development Authority Water Facility Revenue, Bridgeport Hydraulic Co. | | | | |
| | Project, 6.15%, 4/01/35 | | 3,000,000 | | 2,973,780 |
| | Connecticut State Health and Educational Facilities Authority Revenue, | | | | |
| | Sacred Heart University, Series C, 6.50%, 7/01/16 | | 280,000 | | 280,963 |
| | St. Mary’s Hospital, Refunding, Series E, 5.50%, 7/01/20 | | 5,650,000 | | 5,203,141 |
| | | | | | 74,419,935 |
| | District of Columbia 2.1% | | | | |
| | District of Columbia Ballpark Revenue, Series B-1, NATL RE, FGIC Insured, 5.00%, | | | | |
| | 2/01/35 | | 18,000,000 | | 15,978,960 |
| | District of Columbia Hospital Revenue, Children’s Hospital Obligation Group, Assured Guaranty, | | | | |
| | 5.25%, 7/15/38 | | 11,000,000 | | 10,231,100 |
| | District of Columbia Revenue, | | | | |
| | Capital Appreciation, Georgetown University, Growth and Income Securities, AMBAC | | | | |
| | Insured, zero cpn. to 3/31/18, 5.00% thereafter, 4/01/36 | | 27,105,000 | | 14,568,124 |
| | The Catholic University of America, Refunding, 5.00%, 10/01/34 | | 3,750,000 | | 3,443,775 |
| | Deed Tax, Series A, 5.00%, 6/01/40 | | 13,000,000 | | 11,152,570 |
| | Methodist Home Issue, 6.00%, 1/01/29 | | 4,750,000 | | 4,038,545 |
| | Methodist Home Issue, Series A, 7.375%, 1/01/30 | | 2,525,000 | | 2,473,137 |
| | Methodist Home Issue, Series A, 7.50%, 1/01/39 | | 4,150,000 | | 4,040,813 |
| | District of Columbia Tobacco Settlement FICO Revenue, | | | | |
| Asset | -Backed Bonds, Refunding, 6.50%, 5/15/33 | | 22,000,000 | | 21,246,500 |
| | Capital Appreciation, Asset-Backed Bonds, Series A, zero cpn., 6/15/46 | | 175,000,000 | | 5,687,500 |
| | Capital Appreciation, Asset-Backed Bonds, Series B, zero cpn., 6/15/46 | | 66,000,000 | | 1,483,680 |
| | Metropolitan Washington D.C. Airports Authority Dulles Toll Road Revenue, Capital | | | | |
| | Appreciation, second lien, Series C, Assured Guaranty, zero cpn. to 10/01/16, 6.50% | | | | |
| | thereafter, 10/01/41 | | 60,000,000 | | 43,239,000 |
Annual Report | 119
| | | | |
| Franklin Tax-Free Trust | | | | |
| |
| Statement of Investments, February 28, 2011 (continued) | | | | |
| |
| |
| Franklin High Yield Tax-Free Income Fund | | Principal Amount | | Value |
| Municipal Bonds (continued) | | | | |
| District of Columbia (continued) | | | | |
| Washington Convention and Sports Authority Dedicated Tax Revenue, senior lien, Convention | | | | |
| Center Hotel Project, Series A, 5.00%, 10/01/40 | $ | 10,000,000 | $ | 8,559,200 |
| | | | | 146,142,904 |
| Florida 5.6% | | | | |
| Bartram Springs CDD Special Assessment, Refunding, 4.75%, 5/01/34 | | 4,520,000 | | 3,382,813 |
| Brevard County Health Facilities Authority Health Care Facilities Revenue, Health First Inc. | | | | |
| Project, 7.00%, 4/01/39 | | 6,500,000 | | 6,915,155 |
| Brooks of Bonita Springs CDD Capital Improvement Revenue, 6.85%, 5/01/31 | | 1,285,000 | | 1,271,006 |
| Capital Region CDD Capital Improvement Revenue, Series A-2, 6.85%, 5/01/31 | | 2,165,000 | | 2,153,028 |
| Championsgate CDD Capital Improvement Revenue, Series A, 6.25%, 5/01/20 | | 2,040,000 | | 1,773,862 |
| Citizens Property Insurance Corp. Revenue, High-Risk Account, Senior Secured, Series A-1, | | | | |
| 6.00%, 6/01/17 | | 25,000,000 | | 27,261,000 |
| Citrus County Hospital Board Revenue, Citrus Memorial Hospital, Refunding, 6.375%, | | | | |
| 8/15/32 | | 10,550,000 | | 10,314,629 |
| East Homestead CDD Special Assessment Revenue, 5.45%, 5/01/36 | | 1,425,000 | | 1,145,287 |
| Escambia County Environmental Improvement Revenue, International Paper Co. Projects, | | | | |
| Series A, 9.50%, 3/01/33 | | 7,975,000 | | 9,704,379 |
| Florida State Board of Education Capital Outlay GO, Public Education, Refunding, Series D, | | | | |
| 6.00%, 6/01/23 | | 5,000,000 | | 6,090,650 |
| Halifax Hospital Medical Center Hospital Revenue, Refunding and Improvement, Series A, | | | | |
| 5.375%, 6/01/46 | | 18,000,000 | | 15,539,580 |
| Hillsborough County IDA, PCR, Tampa Electric Co. Project, Series A, 5.65%, 5/15/18 | | 6,500,000 | | 7,197,190 |
| Hillsborough County IDAR, Refunding, Series B, 5.25%, | | | | |
| 10/01/28 | | 1,500,000 | | 1,387,785 |
| 10/01/34 | | 7,250,000 | | 6,440,030 |
| Indian Trace CDD, GO, Water Management Special Benefit, sub. lien, Refunding, Series B, | | | | |
| 8.25%, 5/01/11 | | 2,440,000 | | 2,441,903 |
| Indian Trace Development District Special Assessment, Isles at Weston Project, 5.50%, | | | | |
| 5/01/33 | | 2,690,000 | | 2,181,967 |
| Indigo CDD Capital Improvement Revenue, Refunding, | | | | |
| Series A, 7.00%, 5/01/31 | | 865,000 | | 714,957 |
| aSeries C, 7.00%, 5/01/30 | | 4,460,000 | | 3,508,860 |
| Islands at Doral CDD Special Assessment, 6.125%, 5/01/24 | | 1,585,000 | | 1,546,453 |
| Lake Ashton CDD Revenue, Series A, 7.40%, 5/01/32 | | 1,355,000 | | 1,360,461 |
| Lakeland Retirement Community Revenue, first mortgage, Carpenters Estates, Accredited | | | | |
| Investors, Refunding, | | | | |
| 5.875%, 1/01/19 | | 1,350,000 | | 1,322,973 |
| 6.25%, 1/01/28 | | 1,230,000 | | 1,116,914 |
| 6.375%, 1/01/43 | | 2,250,000 | | 1,927,890 |
| Lee County Transportation Facilities Revenue, Sanibel Bridges and Causeway, Series B, CIFG | | | | |
| Insured, 5.00%, 10/01/30 | | 11,505,000 | | 11,251,660 |
| Mediterra North CDD Capital Improvement Revenue, Series A, 6.80%, 5/01/31 | | 7,345,000 | | 7,256,860 |
| Mediterra South CDD Capital Improvement Revenue, | | | | |
| 6.85%, 5/01/31 | | 2,210,000 | | 2,183,591 |
| Series B, 6.95%, 5/01/31 | | 6,665,000 | | 6,406,265 |
| a,cMediterranea CDD Special Assessment, Series A, 5.60%, 5/01/37 | | 1,480,000 | | 666,000 |
120 | Annual Report
| | | | | |
| | Franklin Tax-Free Trust | | | | |
| |
| | Statement of Investments, February 28, 2011 (continued) | | �� | | |
| |
| |
| | Franklin High Yield Tax-Free Income Fund | | Principal Amount | | Value |
| | Municipal Bonds (continued) | | | | |
| | Florida (continued) | | | | |
| | Miami-Dade County Aviation Revenue, Miami International Airport, Refunding, Series A, | | | | |
| | 5.50%, 10/01/41 | $ | 20,850,000 | $ | 19,843,779 |
| | Miami-Dade County Educational Facilities Authority Revenue, University of Miami, Refunding, | | | | |
| | Series B, AMBAC Insured, 5.25%, 4/01/27 | | 10,995,000 | | 10,772,461 |
| Miami | -Dade County Expressway Authority Toll System Revenue, Series A, 5.00%, 7/01/40 | | 30,270,000 | | 27,829,330 |
| Miami | -Dade County School Board COP, Series B, Assured Guaranty, 5.00%, 5/01/33 | | 14,310,000 | | 13,735,024 |
| | Midtown Miami Community Development Special Assessment Revenue, | | | | |
| | Series A, 6.25%, 5/01/37 | | 7,500,000 | | 6,601,425 |
| | Series B, 6.50%, 5/01/37 | | 3,875,000 | | 3,523,266 |
| | Mount Dora Country Club CDD Special Assessment Revenue, 7.75%, 5/01/13 | | 145,000 | | 145,528 |
| | North Sumter County Utility Dependent District Utility Revenue, Subordinated, 6.25%, | | | | |
| | 10/01/43 | | 6,865,000 | | 6,330,216 |
| | Northern Palm Beach County ID Revenue, Water Control and Improvement, Unit of | | | | |
| | Development No. 43, | | | | |
| | 6.10%, 8/01/21 | | 145,000 | | 138,752 |
| Pre | -Refunded, 6.10%, 8/01/21 | | 1,960,000 | | 2,023,994 |
| | Northern Palm Beach County ID Special Assessment, Water Control and Improvement Bonds, | | | | |
| | Unit of Development No. 46, Series A, 5.35%, 8/01/41 | | 800,000 | | 634,640 |
| | Orange County Health Facilities Authority Revenue, Hospital, Adventist Health System Inc., | | | | |
| Pre | -Refunded, 5.625%, 11/15/32 | | 10,000,000 | | 10,909,800 |
| | Orlando-Orange County Expressway Authority Revenue, Series C, 5.00%, 7/01/40 | | 21,000,000 | | 19,330,710 |
| | Palm Glades CDD Revenue, Special Assessment, Series A, 5.30%, 5/01/36 | | 1,200,000 | | 709,476 |
| | Parklands West CDD Revenue, Special Assessment, Series A, 6.90%, 5/01/32 | | 2,580,000 | | 2,463,952 |
| | Pelican Marsh CDD Special Assessment Revenue, Series A, | | | | |
| | 7.10%, 5/01/20 | | 2,470,000 | | 2,474,273 |
| | 7.20%, 5/01/31 | | 5,775,000 | | 5,776,733 |
| | Pensacola Airport Revenue, Airport Revenue Bonds, Refunding, 6.00%, 10/01/28 | | 7,000,000 | | 6,977,040 |
| | Poinciana CDD Special Assessment, Series A, 7.125%, 5/01/31 | | 9,795,000 | | 9,183,596 |
| | Port St. Lucie Utility Revenue, System, Refunding, Series A, NATL Insured, 5.00%, | | | | |
| | 9/01/29 | | 11,025,000 | | 11,247,705 |
| | a,cPortico CDD Capital Improvement Revenue, 5.45%, 5/01/37 | | 2,700,000 | | 1,232,739 |
| | a,cPortofino Landings CDD Special Assessment, Series A, 5.40%, 5/01/38 | | 2,795,000 | | 978,278 |
| | River Place St. Lucie CDD Special Assessment Revenue, Series A, 7.625%, | | | | |
| | 5/01/21 | | 940,000 | | 859,000 |
| | 5/01/30 | | 1,590,000 | | 1,371,152 |
| | Riverwood CDD Special Assessment Revenue, Series A, 7.75%, 5/01/14 | | 360,000 | | 363,906 |
| | Somerset County Revenue, Somerset CDD, 5.30%, 5/01/37 | | 7,400,000 | | 4,062,156 |
| | South Broward Hospital District Revenue, South Broward Hospital District Obligated Group, | | | | |
| | Refunding, | | | | |
| | 4.75%, 5/01/32 | | 11,235,000 | | 9,994,544 |
| | 5.00%, 5/01/36 | | 12,500,000 | | 11,262,250 |
| | South Miami Health Facilities Authority Hospital Revenue, Baptist Health South Florida Group, | | | | |
| | 5.00%, 8/15/32 | | 15,000,000 | | 13,847,850 |
| South | -Dade Venture CDD Special Assessment Revenue, 6.00%, 5/01/24 | | 2,350,000 | | 2,312,048 |
| | Stonegate CDD Special Assessment Revenue, 6.00%, 5/01/24 | | 1,930,000 | | 1,843,671 |
| | Tara CDD No. 1 Capital Improvement Revenue, Series A, 7.15%, 5/01/31 | | 1,200,000 | | 1,190,988 |
| | Venetian CDD Capital Improvement Revenue, Series A, 6.75%, 5/01/34 | | 7,955,000 | | 7,395,763 |
Annual Report | 121
| | | | |
| Franklin Tax-Free Trust | | | | |
| |
| Statement of Investments, February 28, 2011 (continued) | | | | |
| |
| |
| Franklin High Yield Tax-Free Income Fund | | Principal Amount | | Value |
| Municipal Bonds (continued) | | | | |
| Florida (continued) | | | | |
| Verandah East CDD Revenue, Capital Improvement, Series A, 5.40%, 5/01/37 | $ | 1,910,000 | $ | 958,820 |
| Verandah West CDD Revenue, Series A, 6.625%, 5/01/33 | | 8,000,000 | | 7,296,240 |
| Village CDD No. 8 Special Assessment Revenue, 6.375%, 5/01/38 | | 9,600,000 | | 9,222,528 |
| Village Center CDD Recreational Revenue, | | | | |
| sub. bond, Series B, 6.25%, 1/01/13 | | 1,790,000 | | 1,799,308 |
| Sub Series B, 8.25%, 1/01/17 | | 1,265,000 | | 1,267,732 |
| Sub Series C, 7.375%, 1/01/19 | | 1,845,000 | | 1,852,472 |
| Waterchase CDD Capital Improvement Revenue, Series A, Pre-Refunded, 6.70%, 5/01/32 | | 2,680,000 | | 2,731,268 |
| Waterlefe CDD Capital Improvement Revenue, Series A, 6.95%, 5/01/31 | | 1,065,000 | | 1,059,377 |
| Waters Edge CDD Capital Improvement Revenue, 5.30%, 5/01/36 | | 1,700,000 | | 1,282,446 |
| Westchase East CDD Capital Improvement Revenue, 7.10%, 5/01/21 | | 1,100,000 | | 1,084,259 |
| Winter Garden Village at Fowler Groves CDD Special Tax, 5.65%, 5/01/37 | | 1,920,000 | | 1,711,430 |
| | | | | 392,095,073 |
| Georgia 3.2% | | | | |
| Atlanta Airport Revenue, General, Series A, 5.00%, 1/01/40 | | 10,000,000 | | 9,431,900 |
| Atlanta Tax Allocation, Princeton Lakes Project, 5.50%, 1/01/31 | | 1,035,000 | | 878,612 |
| Atlanta Water and Wastewater Revenue, Refunding, | | | | |
| Series A, 6.25%, 11/01/34 | | 30,000,000 | | 31,341,900 |
| Series B, AGMC Insured, 5.25%, 11/01/34 | | 30,000,000 | | 29,796,900 |
| Baldwin County Hospital Authority Revenue, Oconee Regional Medical Center, 5.375%, | | | | |
| 12/01/28 | | 1,470,000 | | 1,180,836 |
| Burke County Development Authority PCR, Oglethorpe Power Corp., Vogtle Project, | | | | |
| Series C, 5.70%, 1/01/43 | | 55,000,000 | | 55,087,450 |
| Series E, 7.00%, 1/01/23 | | 25,000,000 | | 28,323,000 |
| Floyd County Development Authority Environmental Improvement Revenue, Temple-Inland Inc., | | | | |
| Refunding, 5.70%, 12/01/15 | | 1,575,000 | | 1,603,208 |
| Forsyth County Hospital Authority Revenue, Anticipation Certificate, Georgia Baptist Health | | | | |
| Care System Project, ETM, | | | | |
| 6.25%, 10/01/18 | | 5,070,000 | | 5,769,559 |
| 6.375%, 10/01/28 | | 8,000,000 | | 9,775,440 |
| Fulton County Residential Care Revenue, Lenbrook Project, Series A, 5.00%, 7/01/27 | | 5,000,000 | | 3,455,900 |
| Gainesville RDA Educational Facilities Revenue, Riverside Military Academy, Refunding, | | | | |
| 5.125%, 3/01/37 | | 6,500,000 | | 4,693,390 |
| Henry County Hospital Authority Revenue, Henry Medical Center Inc. Project, Refunding, NATL | | | | |
| Insured, 5.00%, 7/01/34 | | 15,000,000 | | 13,994,700 |
| Main Street Natural Gas Inc. Gas Project Revenue, Series A, 5.50%, | | | | |
| 9/15/25 | | 5,000,000 | | 4,970,250 |
| 9/15/28 | | 10,000,000 | | 9,304,500 |
| McDuffie County Development Authority Waste Disposal Revenue, Temple-Inland Forest | | | | |
| Products, 6.95%, 12/01/23 | | 5,120,000 | | 5,047,091 |
| Richmond County Development Authority Environmental Improvement Revenue, International | | | | |
| Paper Co. Project, Series A, 6.25%, 11/01/33 | | 7,000,000 | | 7,097,300 |
| Savannah EDA Revenue, Recovery Zone Facility, International Paper Co. Project, Series A, | | | | |
| 6.25%, 11/01/33 | | 4,865,000 | | 4,932,623 |
| | | | | 226,684,559 |
122 | Annual Report
| | | | |
| Franklin Tax-Free Trust | | | | |
| |
| Statement of Investments, February 28, 2011 (continued) | | | | |
| |
| |
| Franklin High Yield Tax-Free Income Fund | | Principal Amount | | Value |
| Municipal Bonds (continued) | | | | |
| Hawaii 0.1% | | | | |
| Hawaii State Department of Budget and Finance Special Purpose Revenue, Hawaiian Electric | | | | |
| Co. and Subsidiary, 6.50%, 7/01/39 | $ | 7,500,000 | $ | 7,556,625 |
| Idaho 0.8% | | | | |
| Idaho Health Facilities Authority Revenue, St. Luke’s Health System Project, Series A, 6.75%, | | | | |
| 11/01/37 | | 12,500,000 | | 13,177,500 |
| Idaho Housing & Finance Association EDR, TDF Facility Project-Recovery Zone Facility, | | | | |
| Series A, 7.00%, 2/01/36 | | 13,305,000 | | 13,149,331 |
| Nez Perce County PCR, | | | | |
| Potlatch 84, 7.00%, 12/01/14 | | 5,000,000 | | 5,262,300 |
| Potlatch Corp. Project, Refunding, 6.00%, 10/01/24 | | 22,500,000 | | 21,729,600 |
| | | | | 53,318,731 |
| Illinois 6.2% | | | | |
| Antioch Village Special Service Area No. 1 Special Tax, Deercrest Project, 6.625%, 3/01/33 | | 3,218,000 | | 2,473,805 |
| Bolingbrook Special Service Area No. 1 Special Tax, Augusta Village Project, Pre-Refunded, | | | | |
| 6.25%, 3/01/32 | | 3,588,000 | | 3,841,600 |
| 6.75%, 3/01/32 | | 5,163,000 | | 5,480,525 |
| Bolingbrook Special Service Area No. 2 Special Tax, Bloomfield West Project, Series A, | | | | |
| Pre-Refunded, | | | | |
| 6.625%, 3/01/31 | | 4,265,000 | | 4,350,300 |
| 7.00%, 3/01/31 | | 4,717,000 | | 4,811,340 |
| Bolingbrook Special Service Area No. 3 Special Tax, Lakewood Ridge Project, Pre-Refunded, | | | | |
| 7.05%, 3/01/31 | | 5,566,000 | | 5,677,320 |
| Bourbonnais Industrial Project Revenue, Olivet Nazarene University Project, | | | | |
| 6.00%, 11/01/35 | | 1,500,000 | | 1,520,700 |
| 5.50%, 11/01/40 | | 3,570,000 | | 3,280,366 |
| Bryant PCR, Central Illinois Light Co. Project, Refunding, NATL Insured, 5.90%, 8/01/23 | | 11,000,000 | | 11,029,260 |
| Cary Special Tax, Refunding, Radian Insured, 5.00%, 3/01/30 | | 3,035,000 | | 2,598,506 |
| Chicago Board of Education GO, Refunding, 5.00%, 12/01/31 | | 12,500,000 | | 11,954,750 |
| Chicago GO, Refunding, Series A, AGMC Insured, 5.00%, 1/01/27 | | 34,105,000 | | 32,704,990 |
| Chicago O’Hare International Airport Revenue, | | | | |
| 5.00%, 1/01/40 | | 20,430,000 | | 17,650,907 |
| General Airport Third Lien, Series A, NATL RE, FGIC Insured, 5.00%, 1/01/33 | | 15,000,000 | | 13,528,800 |
| Passenger Facility, Series B, 5.00%, 1/01/35 | | 12,555,000 | | 11,115,820 |
| Refunding, Series A, AGMC Insured, 5.00%, 1/01/38 | | 16,500,000 | | 14,289,165 |
| Cook County GO, Refunding, | | | | |
| Series A, 5.25%, 11/15/33 | | 8,720,000 | | 8,594,170 |
| Series G, 5.00%, 11/15/28 | | 50,000,000 | | 49,764,000 |
| Gilberts Special Service Area No. 9 Special Tax, Big Timber Project, Pre-Refunded, 7.75%, | | | | |
| 3/01/27 | | 6,000,000 | | 6,120,000 |
| Hampshire Special Service Area No. 14 Special Tax, Lakewood Crossing Subdivision, 5.95%, | | | | |
| 3/01/36 | | 7,785,000 | | 5,975,532 |
| Illinois Finance Authority Revenue, | | | | |
| Institute Technology, 6.50%, 2/01/23 | | 1,000,000 | | 941,520 |
| Institute Technology, 7.125%, 2/01/34 | | 1,500,000 | | 1,448,265 |
| Lutheran Hillside Village, Refunding, 5.25%, 2/01/37 | | 7,500,000 | | 6,356,925 |
| Navistar International, Recovery Zone Facility, 6.50%, 10/15/40 | | 8,500,000 | | 8,577,775 |
Annual Report | 123
| | | | |
| Franklin Tax-Free Trust | | | | |
| |
| Statement of Investments, February 28, 2011 (continued) | | | | |
| |
| |
| Franklin High Yield Tax-Free Income Fund | | Principal Amount | | Value |
| Municipal Bonds (continued) | | | | |
| Illinois (continued) | | | | |
| Illinois Finance Authority Revenue, (continued) | | | | |
| Resurrection Health Care, Series A, AGMC Insured, 5.25%, 5/15/29 | $ | 15,500,000 | $ | 15,126,140 |
| Riverside Health System, 6.25%, 11/15/35 | | 5,000,000 | | 5,059,600 |
| Roosevelt University Project, Refunding, 6.50%, 4/01/39 | | 15,000,000 | | 14,658,600 |
| Rush University Medical Center Obligation Group, Series B, 7.25%, 11/01/38 | | 10,000,000 | | 10,612,700 |
| Sherman Health System, Series A, 5.50%, 8/01/37 | | 17,240,000 | | 14,562,111 |
| Illinois Finance Authority Water Facility Revenue, American Water Capital Corp. Project, 5.25%, | | | | |
| 10/01/39 | | 6,050,000 | | 5,659,836 |
| 5/01/40 | | 7,000,000 | | 6,535,340 |
| Illinois Health Facilities Authority Revenue, Thorek Hospital and Medical Center, Refunding, | | | | |
| 5.375%, 8/15/28 | | 8,595,000 | | 7,903,962 |
| Illinois State Development Finance Authority PCR, Ameren Corp. and Central Illinois Public | | | | |
| Service Co., Refunding, Series A, 5.50%, 3/01/14 | | 3,515,000 | | 3,523,858 |
| Illinois State Finance Authority Student Housing Revenue, Normal LLC, Illinois State | | | | |
| University, 7.00%, 4/01/43 | | 7,500,000 | | 7,504,800 |
| Metropolitan Pier and Exposition Authority Dedicated State Tax Revenue, McCormick Place | | | | |
| Expansion Project, Series A, 5.50%, 6/15/50 | | 10,475,000 | | 9,851,318 |
| Metropolitan Pier and Exposition Authority Hospitality Facilities Revenue, McCormick Place | | | | |
| Convention Center, ETM, 7.00%, 7/01/26 | | 7,500,000 | | 9,929,250 |
| Minooka Special Assessment, Improvement, Prairie Ridge Project, 6.875%, 3/01/33 | | 3,000,000 | | 2,467,350 |
| Montgomery Special Assessment, Improvement, Lakewood Creek Project, Pre-Refunded, | | | | |
| 7.75%, 3/01/30 | | 4,632,000 | | 4,724,640 |
| Otter Creek Water Reclamation District Kane County GO, Separate Waterworks and Sewage | | | | |
| System, Refunding, XLCA Insured, 5.00%, 1/01/39 | | 4,500,000 | | 3,961,440 |
| Plano Special Service Area No. 2 Special Tax, Lakewood Springs Project, Series B, 6.375%, | | | | |
| 3/01/34 | | 7,820,000 | | 6,971,999 |
| Railsplitter Tobacco Settlement Authority Revenue, | | | | |
| 6.25%, 6/01/24 | | 6,000,000 | | 6,039,180 |
| Refunding, 6.00%, 6/01/28 | | 22,650,000 | | 22,101,417 |
| Southwestern Development Authority Revenue, Anderson Hospital, 5.625%, 8/15/29 | | 2,425,000 | | 2,184,319 |
| University of Illinois University Revenues, Auxiliary Facilities System, Refunding, NATL Insured, | | | | |
| 5.00%, 4/01/32 | | 22,430,000 | | 21,308,051 |
| Wauconda Special Service Area No. 1 Special Tax, Liberty Lakes Project, | | | | |
| 6.00%, 3/01/33 | | 4,451,000 | | 3,737,060 |
| 6.625%, 3/01/33 | | 5,213,000 | | 4,725,220 |
| Yorkville United City Special Service Area Special Tax, | | | | |
| No. 2003-101, Windett Ridge Project, 6.875%, 3/01/33 | | 3,393,000 | | 2,413,644 |
| No. 2004-104, MPI Grande Reserve Project, 6.375%, 3/01/34 | | 4,222,000 | | 3,028,570 |
| No. 2005-108, Autumn Creek Project, 6.00%, 3/01/36 | | 4,852,000 | | 3,483,785 |
| | | | | 432,160,531 |
| Indiana 1.1% | | | | |
| Delaware County Hospital Authority Hospital Revenue, Cardinal Health System, 5.25%, | | | | |
| 8/01/36 | | 5,000,000 | | 4,141,450 |
| Goshen Industrial Revenue, Greencroft Hospital Assn. Inc., Refunding, 5.75%, | | | | |
| 8/15/19 | | 3,000,000 | | 2,767,290 |
| 8/15/28 | | 5,000,000 | | 4,080,550 |
124 | Annual Report
| | | | |
| Franklin Tax-Free Trust | | | | |
| |
| Statement of Investments, February 28, 2011 (continued) | | | | |
| |
| |
| Franklin High Yield Tax-Free Income Fund | | Principal Amount | | Value |
| Municipal Bonds (continued) | | | | |
| Indiana (continued) | | | | |
| Indiana Health and Educational Facility Financing Authority Hospital Revenue, 5.50%, | | | | |
| 3/01/37 | $ | 8,000,000 | $ | 7,057,040 |
| Indiana Health and Educational Facility Financing Authority Revenue, Baptist Homes of | | | | |
| Indiana, Refunding, 5.25%, 11/15/35 | | 12,000,000 | | 10,553,040 |
| Indiana Health Facility Financing Authority Hospital Revenue, | | | | |
| 6.25%, 3/01/25 | | 5,900,000 | | 6,026,496 |
| 6.00%, 3/01/34 | | 12,000,000 | | 11,955,480 |
| Community Foundation Northwest Indiana, Refunding, Series A, 6.375%, 8/01/31 | | 11,740,000 | | 11,804,218 |
| Indiana Municipal Power Agency Power Supply System Revenue, Indiana Municipal Power | | | | |
| Agency, Series B, 6.00%, 1/01/39 | | 4,000,000 | | 4,077,080 |
| Jasper County PCR, Northern Indiana Public Service Co., Refunding, Series C, NATL Insured, | | | | |
| 5.60%, 11/01/16 | | 10,000,000 | | 10,656,800 |
| 5.85%, 4/01/19 | | 5,000,000 | | 5,337,550 |
| | | | | 78,456,994 |
| Iowa 0.1% | | | | |
| Iowa Higher Education Loan Authority Revenue, Private College Facility, Upper Iowa University | | | | |
| Project, Refunding, 6.00%, 9/01/39 | | 11,000,000 | | 10,823,010 |
| Kansas 0.1% | | | | |
| Kansas State Development Finance Authority Hospital Revenue, Adventist Health, Refunding, | | | | |
| 5.75%, 11/15/38 | | 6,250,000 | | 6,425,938 |
| Kentucky 1.4% | | | | |
| Kentucky Economic Development Finance Authority Health System Revenue, Norton | | | | |
| Healthcare Inc., | | | | |
| Refunding, Series C, NATL Insured, 6.10%, 10/01/22 | | 10,650,000 | | 11,170,785 |
| Refunding, Series C, NATL Insured, 6.15%, 10/01/27 | | 3,995,000 | | 4,127,794 |
| Series C, NATL Insured, Pre-Refunded, 6.10%, 10/01/22 | | 5,325,000 | | 6,072,151 |
| Series C, NATL Insured, Pre-Refunded, 6.15%, 10/01/27 | | 6,005,000 | | 6,855,188 |
| Kentucky Economic Development Finance Authority Hospital Facilities Revenue, Owensboro | | | | |
| Medical Health System, Refunding, Series A, 6.50%, 3/01/45 | | 17,500,000 | | 16,652,300 |
| Kentucky Economic Development Finance Authority Hospital System Revenue, Appalachian | | | | |
| Regional Health Center Facility, Refunding and Improvement, 5.875%, 10/01/22 | | 6,835,000 | | 5,994,637 |
| Kentucky Economic Development Finance Authority Louisville Arena Project Revenue, | | | | |
| Louisville Arena, Sub Series A-1, Assured Guaranty, 6.00%, 12/01/42 | | 5,000,000 | | 5,093,450 |
| Louisville and Jefferson County Metropolitan Government College Revenue, Improvement, | | | | |
| Bellarmie University Inc. Project, | | | | |
| 5.625%, 5/01/29 | | 5,555,000 | | 5,355,686 |
| 6.125%, 5/01/39 | | 5,000,000 | | 4,917,150 |
| Louisville and Jefferson County Metropolitan Government Health Facilities Revenue, Jewish | | | | |
| Hospital and St. Mary’s HealthCare Inc. Project, Refunding, 6.125%, 2/01/37 | | 11,500,000 | | 11,258,155 |
| Ohio County PCR, Big Rivers Electric Corp. Project, Refunding, Series A, 6.00%, 7/15/31 | | 7,500,000 | | 7,180,200 |
| Owen County Waterworks System Revenue, American Water Co. Project, Series A, | | | | |
| 6.25%, 6/01/39 | | 8,000,000 | | 8,101,760 |
| 5.375%, 6/01/40 | | 10,000,000 | | 9,206,600 |
| | | | | 101,985,856 |
Annual Report | 125
| | | | |
| Franklin Tax-Free Trust | | | | |
| |
| Statement of Investments, February 28, 2011 (continued) | | | | |
| |
| |
| Franklin High Yield Tax-Free Income Fund | | Principal Amount | | Value |
| Municipal Bonds (continued) | | | | |
| Louisiana 4.2% | | | | |
| Beauregard Parish Revenue, Boise Cascade Corp. Project, Refunding, 6.80%, 2/01/27 | $ | 13,990,000 | $ | 13,515,039 |
| Calcasieu Parish Inc. IDB, PCR, Gulf States Utilities Co. Project, Refunding, 6.75%, | | | | |
| 10/01/12 | | 2,665,000 | | 2,674,274 |
| Louisiana State Local Government Environmental Facilities and CDA Revenue, | | | | |
| Westlake Chemical Corp. Projects, 6.75%, 11/01/32 | | 41,250,000 | | 42,130,275 |
| Westlake Chemical Corp. Projects, Series A, 6.50%, 8/01/29 | | 9,000,000 | | 9,132,030 |
| Westlake Chemical Corp. Projects, Series A-2, 6.50%, 11/01/35 | | 8,000,000 | | 8,061,840 |
| Louisiana Public Facilities Authority Hospital Revenue, Franciscan Missionaries of Our Lady | | | | |
| Health System Project, 6.75%, 7/01/39 | | 10,000,000 | | 10,478,200 |
| Louisiana Public Facilities Authority Revenue, | | | | |
| Energy LLC Project, Refunding, 5.00%, 6/01/30 | | 8,500,000 | | 8,468,125 |
| Entergy Gulf States Louisiana, Refunding, Series A, 5.00%, 9/01/28 | | 25,000,000 | | 24,571,000 |
| FHA Insured Mortgage, Baton Rouge General Medical Center Project, NATL Insured, | | | | |
| 5.25%, 7/01/33 | | 20,000,000 | | 19,972,400 |
| Ochsner Clinic Foundation Project, Series B, 5.25%, 5/15/38 | | 10,000,000 | | 8,205,900 |
| Ochsner Clinic Foundation Project, Series B, 5.50%, 5/15/47 | | 10,000,000 | | 8,222,800 |
| Louisiana State Citizens Property Insurance Corp. Assessment Revenue, Series B, AMBAC | | | | |
| Insured, 5.00%, 6/01/22 | | 10,000,000 | | 9,592,100 |
| Louisiana State Gas and Fuels Tax Revenue, second lien, Series B, 5.00%, 5/01/45 | | 38,840,000 | | 37,243,288 |
| New Orleans GO, | | | | |
| Limited Tax, NATL Insured, 5.00%, 3/01/21 | | 5,000,000 | | 4,850,800 |
| Public Improvement, Series A, Radian Insured, 5.25%, 12/01/36 | | 13,480,000 | | 12,359,273 |
| Pointe Coupee Parish PCR, Gulf States Utilities Co. Project, Refunding, 6.70%, 3/01/13 | | 2,425,000 | | 2,433,366 |
| Rapides Finance Authority Revenue, Cleco Power LLC Project, Mandatory Put 10/01/11, | | | | |
| 6.00%, 10/01/38 | | 4,750,000 | | 4,857,683 |
| St. John the Baptist Parish Revenue, Marathon Oil Corp. Project, Series A, 5.125%, | | | | |
| 6/01/37 | | 72,500,000 | | 66,852,975 |
| | | | | 293,621,368 |
| Maine 0.1% | | | | |
| Rumford PCR, Boise Cascade Corp. Project, Refunding, 6.625%, 7/01/20 | | 4,800,000 | | 4,758,384 |
| Maryland 0.6% | | | | |
| Maryland State Community Development Administration Development Housing and CDR, | | | | |
| Housing, Series A, 5.875%, 7/01/16 | | 1,130,000 | | 1,130,463 |
| Maryland State EDC Port Facilities Revenue, CNX MarineTerminals Inc., Refunding, 5.75%, | | | | |
| 9/01/25 | | 10,600,000 | | 9,945,874 |
| Maryland State EDC Revenue, Chesapeake Bay Conference Center Project, senior lien, | | | | |
| Refunding, | | | | |
| Series A, 4.75%, 12/01/11 | | 355,000 | | 348,319 |
| Series A, 5.00%, 12/01/16 | | 3,000,000 | | 2,446,710 |
| Series A, 5.00%, 12/01/31 | | 10,000,000 | | 6,449,200 |
| Series B, 5.00%, 12/01/16 | | 600,000 | | 489,342 |
| Series B, 5.25%, 12/01/31 | | 2,000,000 | | 1,290,060 |
| Maryland State EDC, EDR, 5.75%, 6/01/35 | | 10,000,000 | | 9,261,600 |
126 | Annual Report
| | | | |
| Franklin Tax-Free Trust | | | | |
| |
| Statement of Investments, February 28, 2011 (continued) | | | | |
| |
| |
| Franklin High Yield Tax-Free Income Fund | | Principal Amount | | Value |
| Municipal Bonds (continued) | | | | |
| Maryland (continued) | | | | |
| Maryland State Health and Higher Educational Facilities Authority Revenue, | | | | |
| Anne Arundel Health System, Series A, 6.75%, 7/01/39 | $ | 3,000,000 | $ | 3,260,100 |
| Edenwald, Series A, 5.40%, 1/01/37 | | 1,200,000 | | 967,140 |
| Washington County Hospital, 6.00%, 1/01/43 | | 6,000,000 | | 5,552,820 |
| | | | | 41,141,628 |
| Massachusetts 0.9% | | | | |
| Massachusetts Bay Transportation Authority Revenue, General Transportation System, | | | | |
| Series A, 7.00%, 3/01/21 | | 2,000,000 | | 2,419,460 |
| Massachusetts State Development Finance Agency Revenue, | | | | |
| Berkshire Retirement Project, first mortgage, 5.60%, 7/01/19 | | 950,000 | | 939,350 |
| Berkshire Retirement Project, first mortgage, 5.625%, 7/01/29 | | 1,620,000 | | 1,462,860 |
| Curry College, Series A, ACA Insured, 5.00%, 3/01/36 | | 2,000,000 | | 1,668,280 |
| Loomis Community Project, first mortgage, Refunding, Series A, 5.625%, 7/01/15 | | 1,390,000 | | 1,388,457 |
| Loomis Community Project, first mortgage, Refunding, Series A, 5.75%, 7/01/23 | | 3,500,000 | | 3,290,630 |
| Massachusetts State Development Finance Agency Solid Waste Disposal Revenue, Mandatory | | | | |
| Put 5/01/19, Refunding, 5.75%, 12/01/42 | | 3,700,000 | | 3,836,123 |
| Massachusetts State Health and Educational Facilities Authority Revenue, St. Memorial | | | | |
| Medical Center, Refunding, Series A, 6.00%, 10/01/23 | | 5,315,000 | | 4,530,028 |
| Massachusetts State Special Obligation Dedicated Tax Revenue, Refunding, NATL RE, FGIC | | | | |
| Insured, 5.50%, 1/01/34 | | 40,000,000 | | 40,518,000 |
| | | | | 60,053,188 |
| Michigan 4.3% | | | | |
| Delta County EDC Environmental Improvement Revenue, Mead Escanaba Paper, Series A, | | | | |
| Pre-Refunded, 6.25%, 4/15/27 | | 10,500,000 | | 11,172,630 |
| Detroit City School District GO, School Building and Site Improvement, Series A, AGMC | | | | |
| Insured, 6.00%, 5/01/29 | | 15,900,000 | | 16,319,919 |
| Detroit GO, Distribution State Aid, 5.25%, 11/01/35 | | 23,000,000 | | 22,347,950 |
| Detroit Sewer Disposal System Revenue, second lien, | | | | |
| Series A, NATL Insured, 5.00%, 7/01/35 | | 25,750,000 | | 22,504,470 |
| Series B, Assured Guaranty, 5.00%, 7/01/36 | | 10,000,000 | | 8,708,200 |
| Series B, NATL Insured, 5.00%, 7/01/36 | | 3,000,000 | | 2,643,480 |
| Series B, NATL RE, FGIC Insured, 5.50%, 7/01/29 | | 5,000,000 | | 4,925,850 |
| Detroit Water Supply System Revenue, | | | | |
| Refunding, Series D, NATL Insured, 5.00%, 7/01/33 | | 20,430,000 | | 18,541,042 |
| second lien, Refunding, Series C, AGMC Insured, 5.00%, 7/01/33 | | 11,000,000 | | 10,046,300 |
| Garden City Hospital Finance Authority Hospital Revenue, Garden City Hospital Obligated | | | | |
| Group, Refunding, Series A, | | | | |
| 5.75%, 9/01/17 | | 530,000 | | 510,835 |
| 5.00%, 8/15/38 | | 5,250,000 | | 3,354,645 |
| Michigan State Building Authority Revenue, | | | | |
| Facilities Program, Refunding, Series I, 6.00%, 10/15/38 | | 6,000,000 | | 6,256,200 |
| Facilities Program, Refunding, Series I, AMBAC Insured, 5.00%, 10/15/33 | | 13,495,000 | | 12,564,250 |
| Facilities Program, Refunding, Series II, NATL Insured, 5.00%, 10/15/29 | | 16,585,000 | | 16,288,460 |
| Refunding, Series IA, NATL RE, FGIC Insured, 5.00%, 10/15/31 | | 9,500,000 | | 9,319,785 |
Annual Report | 127
| | | | | |
| | Franklin Tax-Free Trust | | | | |
| |
| | Statement of Investments, February 28, 2011 (continued) | | | | |
| |
| |
| | Franklin High Yield Tax-Free Income Fund | | Principal Amount | | Value |
| | Municipal Bonds (continued) | | | | |
| | Michigan (continued) | | | | |
| | Michigan State Hospital Finance Authority Revenue, | | | | |
| | Hospital, Oakwood Obligated Group, Refunding, Series A, 5.00%, 7/15/37 | $ | 3,680,000 | $ | 3,075,744 |
| | Marquette, 5.00%, 5/15/34 | | 6,000,000 | | 4,807,020 |
| | Memorial Healthcare Center, Refunding, 5.75%, 11/15/15 | | 1,000,000 | | 1,007,760 |
| | Mercy Health Services, Series Q, AMBAC Insured, ETM, 5.75%, 8/15/16 | | 7,310,000 | | 7,335,512 |
| Mid | -Michigan Obligation Group, Series A, 6.125%, 6/01/34 | | 4,065,000 | | 4,107,723 |
| | Michigan State Strategic Fund Limited Obligation Revenue, | | | | |
| | The Detroit Edison Co., Refunding, Series A, NATL Insured, 5.55%, 9/01/29 | | 1,015,000 | | 1,020,298 |
| | The Detroit Edison Co. Pollution Control Project, Refunding, Series C, 5.45%, 9/01/29 | | 11,000,000 | | 11,004,180 |
| | The Detroit Edison Co. Pollution Control Project, Refunding, Series C, XLCA Insured, | | | | |
| | 5.65%, 9/01/29 | | 10,000,000 | | 10,057,000 |
| | Dow Chemical, Mandatory Put 6/02/14, Refunding, Series A-1, 6.75%, 12/01/28 | | 2,800,000 | | 3,025,876 |
| | Dow Chemical, Refunding, Series B-2, 6.25%, 6/01/14 | | 20,050,000 | | 21,674,652 |
| | Michigan Tobacco Settlement Finance Authority Revenue, Tobacco Settlement Asset, Senior | | | | |
| | Series A, 6.00%, | | | | |
| | 6/01/34 | | 13,675,000 | | 10,047,159 |
| | 6/01/48 | | 10,000,000 | | 6,752,900 |
| | Royal Oak Hospital Finance Authority Hospital Revenue, William Beaumont Hospital, | | | | |
| | Refunding, | | | | |
| | 8.25%, 9/01/39 | | 20,000,000 | | 22,684,400 |
| | Series W, 6.00%, 8/01/39 | | 33,120,000 | | 31,352,054 |
| | Tawas City Hospital Finance Authority Revenue, Tawas St. Joseph’s Hospital Project, Series A, | | | | |
| | ETM, 5.60%, 2/15/13 | | 470,000 | | 476,369 |
| | | | | | 303,932,663 |
| | Minnesota 0.7% | | | | |
| | Hubbard County Solid Waste Disposal Revenue, Potlatch Corp. Project, 7.25%, 8/01/14 | | 9,000,000 | | 9,432,000 |
| | Mahtomedi Senior Housing Revenue, St. Andrews Village Project, Refunding, 5.75%, | | | | |
| | 12/01/40 | | 5,000,000 | | 4,094,450 |
| | Minneapolis and St. Paul Metropolitan Airports Commission Airport Revenue, sub. bond, | | | | |
| | Refunding, Series C, NATL RE, FGIC Insured, 5.00%, 1/01/31 | | 6,185,000 | | 6,062,599 |
| | Minneapolis Health Care Facility Revenue, | | | | |
| | Augustana Chapel View Homes, Series D, 5.875%, 6/01/35 | | 5,075,000 | | 3,647,149 |
| Jones | -Harrison Residence Project, 5.70%, 10/01/35 | | 1,000,000 | | 815,460 |
| | Minneapolis Health Care System Revenue, Fairview Health Services, Series A, | | | | |
| | 6.625%, 11/15/28 | | 11,000,000 | | 11,838,640 |
| | 6.75%, 11/15/32 | | 6,250,000 | | 6,693,937 |
| | Minnesota Agricultural and Economic Development Board Revenue, Health Care System, | | | | |
| | Refunding, Series A, 6.375%, 11/15/29 | | 175,000 | | 175,899 |
| | Minnesota State HFAR, Rental Housing, Refunding, Series D, NATL Insured, 5.95%, | | | | |
| | 2/01/18 | | 295,000 | | 295,080 |
| | St. Paul Housing and RDA Hospital Revenue, Healtheast Project, 6.00%, 11/15/35 | | 10,000,000 | | 8,663,700 |
| | | | | | 51,718,914 |
128 | Annual Report
| | | | | | |
| | Franklin Tax-Free Trust | | | | | |
| |
| | Statement of Investments, February 28, 2011 (continued) | | | | | |
| |
| |
| | Franklin High Yield Tax-Free Income Fund | | | Principal Amount | | Value |
| | Municipal Bonds (continued) | | | | | |
| | Mississippi 1.3% | | | | | |
| | Claiborne County PCR, Systems Energy Resources Inc. Project, Refunding, 6.20%, 2/01/26 | | $ | 33,300,000 | $ | 32,570,064 |
| | Lowndes County Solid Waste Disposal and PCR, Weyerhaeuser Co. Project, Refunding, Series B, | | | | | |
| | 6.70%, 4/01/22 | | | 18,875,000 | | 19,963,144 |
| | Warren County Gulf Opportunity Zone Revenue, International Paper Co. Project, Series A, | | | | | |
| | 5.50%, 9/01/31 | | | 20,000,000 | | 19,379,000 |
| | 6.50%, 9/01/32 | | | 10,000,000 | | 10,135,800 |
| | 5.80%, 5/01/34 | | | 7,000,000 | | 6,782,790 |
| | | | | | | 88,830,798 |
| | Missouri 0.4% | | | | | |
| | Lake of the Ozarks Community Board Corp. Bridge System Revenue, Refunding, 5.25%, | | | | | |
| | 12/01/20 | | | 8,350,000 | | 6,894,261 |
| | Missouri Joint Municipal Electric Utility Commission Power Project Revenue, Iatan 2 Project, | | | | | |
| | Series A, 6.00%, 1/01/39 | | | 11,000,000 | | 11,246,840 |
| | St. Louis Airport Revenue, Lambert, St. Louis International Airport, Series A-1, | | | | | |
| | 6.25%, 7/01/29 | | | 7,000,000 | | 7,117,250 |
| | 6.625%, 7/01/34 | | | 3,000,000 | | 3,054,330 |
| | West Plains IDA Hospital Revenue, Ozarks Medical Center, | | | | | |
| | 6.30%, 11/15/11 | | | 165,000 | | 166,374 |
| | 6.75%, 11/15/24 | | | 3,045,000 | | 2,857,032 |
| | Refunding, 5.50%, 11/15/12 | | | 210,000 | | 210,542 |
| | | | | | | 31,546,629 |
| | Montana 0.1% | | | | | |
| | Forsyth PCR, Puget Sound Energy, Refunding, Series A, AMBAC Insured, 5.00%, 3/01/31 | | | 10,220,000 | | 9,893,675 |
| | Nevada 1.0% | | | | | |
| | Clark County ID Special Assessment, | | | | | |
| | Local ID No. 128, The Summerlin Centre, Series A, 5.00%, 2/01/26 | | | 1,320,000 | | 936,091 |
| | Local ID No. 128, The Summerlin Centre, Series A, 5.05%, 2/01/31 | | | 1,035,000 | | 689,765 |
| | Local ID No. 132, Summerlin South Area, Villages 15A and 18, 6.875%, 2/01/21 | | | 3,540,000 | | 3,358,504 |
| | Local ID No. 142, Mountains Edge, 6.375%, 8/01/23 | | | 3,980,000 | | 3,710,116 |
| | Local ID No. 151, Summerlin-Mesa, 5.00%, 8/01/20 | | | 750,000 | | 576,105 |
| | Local ID No. 151, Summerlin-Mesa, 5.00%, 8/01/25 | | | 2,370,000 | | 1,627,384 |
| | Clark County IDR, Southwest Gas Corp. Project, Series D, AMBAC Insured, 5.55%, 12/01/38 | | | 7,260,000 | | 6,829,700 |
| | Henderson Health Care Facility Revenue, Catholic Healthcare West, Series A, 5.625%, | | | | | |
| | 7/01/24 | | | 7,000,000 | | 7,151,410 |
| | Henderson Local ID Special Assessment, | | | | | |
| No. T | -4C, Green Valley, Refunding, Series A, 5.90%, 11/01/18 | | | 3,025,000 | | 3,021,037 |
| No. T | -12, Series A | , 7.375%, 8/01/18 | | 28,345,000 | | 24,806,127 |
| No. T | -16, 4.90%, 3/01/16 | | | 1,355,000 | | 748,448 |
| No. T | -16, 5.00%, 3/01/18 | | | 970,000 | | 524,625 |
| No. T | -16, 5.00%, 3/01/19 | | | 960,000 | | 515,654 |
| No. T | -16, 5.10%, 3/01/22 | | | 1,445,000 | | 764,145 |
| No. T | -16, 5.125%, 3/01/25 | | | 1,530,000 | | 801,965 |
| No. T | -17, 5.00%, 9/01/15 | | | 710,000 | | 659,398 |
| No. T | -17, 5.00%, 9/01/16 | | | 725,000 | | 654,574 |
| No. T | -17, 5.00%, 9/01/25 | | | 1,355,000 | | 980,180 |
Annual Report | 129
| | | | | |
| | Franklin Tax-Free Trust | | | | |
| |
| | Statement of Investments, February 28, 2011 (continued) | | | | |
| |
| |
| | Franklin High Yield Tax-Free Income Fund | | Principal Amount | | Value |
| | Municipal Bonds (continued) | | | | |
| | Nevada (continued) | | | | |
| | Las Vegas Local Improvement Bonds Special Assessment, Special ID No. 607, 6.25%, | | | | |
| | 6/01/24 | $ | 4,815,000 | $ | 4,273,794 |
| | Las Vegas Special Assessment, ID No. 505, Elkhorn Springs, 8.00%, 9/15/13 | | 1,220,000 | | 1,244,559 |
| | Overton Power District No. 5 Special Obligation Revenue, 8.00%, 12/01/38 | | 7,500,000 | | 8,407,425 |
| | | | | | 72,281,006 |
| | New Hampshire 0.3% | | | | |
| | New Hampshire Higher Educational and Health Facilities Authority Revenue, | | | | |
| | Hillcrest Terrace, 7.50%, 7/01/24 | | 13,950,000 | | 13,111,187 |
| | New Hampshire Catholic Charities, Refunding, Series A, 5.75%, 8/01/11 | | 220,000 | | 220,198 |
| | New Hampshire State Business Finance Authority Revenue, Elliot Hospital Obligation Group, | | | | |
| | Series A, 6.125%, 10/01/39 | | 5,000,000 | | 4,807,700 |
| | | | | | 18,139,085 |
| | New Jersey 4.2% | | | | |
| | Hudson County Improvement Authority Solid Waste Systems Revenue, Refunding, Series A, | | | | |
| | 5.75%, 1/01/40 | | 5,000,000 | | 5,117,650 |
| | New Jersey EDA Lease Revenue, International Center for Public Health Project, University of | | | | |
| | Medicine and Dentistry, AMBAC Insured, 6.00%, 6/01/32 | | 9,965,000 | | 9,811,140 |
| | New Jersey EDA Revenue, | | | | |
| | Cigarette Tax, 5.50%, 6/15/24 | | 23,000,000 | | 21,012,800 |
| | Cigarette Tax, 5.50%, 6/15/31 | | 6,500,000 | | 5,613,010 |
| | Cigarette Tax, 5.75%, 6/15/34 | | 10,000,000 | | 8,802,700 |
| | first mortgage, Keswick Pines, Refunding, 5.75%, 1/01/24 | | 1,500,000 | | 1,249,050 |
| | first mortgage, Presbyterian, Series A, 6.25%, 11/01/20 | | 7,635,000 | | 6,913,264 |
| | Montclair State University, Provident Group, Montclair Properties LLC, Series A, 5.875%, | | | | |
| | 6/01/42 | | 5,000,000 | | 4,552,950 |
| | New Jersey EDA Special Facility Revenue, Continental Airlines Inc. Project, | | | | |
| | 6.625%, 9/15/12 | | 25,525,000 | | 25,754,725 |
| | 6.25%, 9/15/19 | | 32,000,000 | | 30,753,600 |
| | 6.40%, 9/15/23 | | 65,500,000 | | 62,621,275 |
| | New Jersey Health Care Facilities Financing Authority Revenue, | | | | |
| | Capital Appreciation, St. Barnabas Health Care System, Refunding, Series B, zero cpn., | | | | |
| | 7/01/33 | | 57,680,000 | | 11,097,055 |
| | Capital Appreciation, St. Barnabas Health Care System, Refunding, Series B, zero cpn., | | | | |
| | 7/01/34 | | 52,330,000 | | 9,288,052 |
| | Capital Appreciation, St. Barnabas Health Care System, Refunding, Series B, zero cpn., | | | | |
| | 7/01/35 | | 20,000,000 | | 3,280,800 |
| | South Jersey Hospital, 5.00%, 7/01/46 | | 6,000,000 | | 5,091,540 |
| | St. Joseph’s Healthcare System, 6.625%, 7/01/38 | | 25,000,000 | | 23,515,500 |
| | New Jersey State Transportation Trust Fund Authority Revenue, Transportation System, Series A, | | | | |
| | 6.00%, 12/15/38 | | 35,705,000 | | 37,909,784 |
| Pre | -Refunded, 6.00%, 12/15/38 | | 19,295,000 | | 24,090,193 |
| | Tobacco Settlement FICO Revenue, Capital Appreciation Bonds, Series 1B, zero cpn., | | | | |
| | 6/01/41 | | 40,000,000 | | 1,700,000 |
| | | | | | 298,175,088 |
130 | Annual Report
| | | | |
| Franklin Tax-Free Trust | | | | |
| |
| Statement of Investments, February 28, 2011 (continued) | | | | |
| |
| |
| Franklin High Yield Tax-Free Income Fund | | Principal Amount | | Value |
| Municipal Bonds (continued) | | | | |
| New Mexico 1.8% | | | | |
| Farmington PCR, Public Service Co. of New Mexico, San Juan Project, Refunding, | | | | |
| Series B, 5.90%, 6/01/40 | $ | 58,000,000 | $ | 55,884,740 |
| Series C, 5.90%, 6/01/40 | | 16,500,000 | | 15,898,245 |
| Series D, 5.90%, 6/01/40 | | 50,700,000 | | 48,850,971 |
| New Mexico State Hospital Equipment Loan Council Hospital Revenue, St. Vincent Hospital, | | | | |
| Series A, Radian Insured, Pre-Refunded, | | | | |
| 5.25%, 7/01/30 | | 4,360,000 | | 4,991,285 |
| 5.00%, 7/01/35 | | 3,470,000 | | 3,936,437 |
| | | | | 129,561,678 |
| New York 4.8% | | | | |
| Chautauqua County IDA Exempt Facility Revenue, NRG-Dunkirk Power Project, 5.875%, | | | | |
| 4/01/42 | | 7,000,000 | | 6,687,660 |
| Corinth IDA Environmental Improvement Revenue, International Paper Co. Project, Refunding, | | | | |
| Series A, 5.75%, 2/01/22 | | 2,000,000 | | 2,018,580 |
| Long Island Power Authority Electric System Revenue, General, Refunding, Series A, 6.00%, | | | | |
| 5/01/33 | | 12,500,000 | | 13,362,875 |
| MAC for City of Troy Revenue, Capital Appreciation, Series C, NATL Insured, zero cpn., | | | | |
| 7/15/21 | | 428,010 | | 276,486 |
| 1/15/22 | | 649,658 | | 404,412 |
| MTA Revenue, Transportation, | | | | |
| Refunding, Series D, 5.25%, 11/15/40 | | 10,000,000 | | 9,579,000 |
| Series F, 5.00%, 11/15/30 | | 7,000,000 | | 6,802,950 |
| New York City GO, | | | | |
| Refunding, Series H, 6.25%, 8/01/15 | | 20,000 | | 20,079 |
| Refunding, Series H, 6.125%, 8/01/25 | | 10,000 | | 10,029 |
| Refunding, Series J, 6.00%, 8/01/21 | | 5,000 | | 5,017 |
| Series B, 7.00%, 2/01/18 | | 115,000 | | 115,527 |
| Series D, 7.625%, 2/01/14 | | 5,000 | | 5,025 |
| Series F, 7.50%, 2/01/21 | | 85,000 | | 85,379 |
| Series G, 7.50%, 2/01/22 | | 10,000 | | 10,043 |
| New York City IDA Civic Facility Revenue, | | | | |
| Amboy Properties Corp. Project, Refunding, 6.75%, 6/01/20 | | 5,660,000 | | 5,158,184 |
| Series C, 6.80%, 6/01/28 | | 5,000,000 | | 5,159,200 |
| Staten Island University Hospital Project, Series C, 6.45%, 7/01/32 | | 1,440,000 | | 1,405,656 |
| New York City IDA Special Facility Revenue, | | | | |
| American Airlines Inc., JFK International Airport Project, 7.625%, 8/01/25 | | 20,000,000 | | 20,239,800 |
| American Airlines Inc., JFK International Airport Project, 7.75%, 8/01/31 | | 15,000,000 | | 15,580,950 |
| American Airlines Inc., JFK International Airport Project, Series A, 8.00%, 8/01/12 | | 30,000,000 | | 31,134,900 |
| British Airways PLC Project, 7.625%, 12/01/32 | | 15,550,000 | | 15,575,657 |
| New York City IDAR, | | | | |
| Liberty, 7 World Trade Center Project, Series A, 6.25%, 3/01/15 | | 45,000,000 | | 45,119,700 |
| Liberty, 7 World Trade Center Project, Series A, 6.50%, 3/01/35 | | 50,000,000 | | 47,058,500 |
| Liberty, 7 World Trade Center Project, Series B, 6.75%, 3/01/15 | | 5,000,000 | | 5,037,100 |
| Queens Baseball Stadium, Pilot, AMBAC Insured, 5.00%, 1/01/31 | | 9,500,000 | | 8,016,955 |
| New York City Municipal Water Finance Authority Water and Sewer System Revenue, Series E, | | | | |
| 5.00%, 6/15/34 | | 10,000,000 | | 10,001,400 |
Annual Report | 131
| | | | | |
| | Franklin Tax-Free Trust | | | | |
| |
| | Statement of Investments, February 28, 2011 (continued) | | | | |
| |
| |
| | Franklin High Yield Tax-Free Income Fund | | Principal Amount | | Value |
| | Municipal Bonds (continued) | | | | |
| | New York (continued) | | | | |
| | New York Liberty Development Corp. Liberty Revenue, Second Priority, Bank of America Tower | | | | |
| | at One Bryant Park Project, Class 3, Refunding, 6.375%, 7/15/49 | $ | 18,500,000 | $ | 18,485,015 |
| | New York State Dormitory Authority Revenues, Non-State Supported Debt, Orange Regional | | | | |
| | Medical Center, | | | | |
| | 6.125%, 12/01/29 | | 16,000,000 | | 15,504,640 |
| | 6.25%, 12/01/37 | | 30,000,000 | | 28,045,200 |
| | Port Authority of New York and New Jersey Special Obligation Revenue, Continental Airlines | | | | |
| | Inc., Eastern Project, La Guardia, 9.125%, 12/01/15 | | 21,695,000 | | 21,811,719 |
| | Utica IDA Civic Facility Revenue, Utica College Civic Facility, | | | | |
| | 6.75%, 12/01/21 | | 1,250,000 | | 1,236,688 |
| | 6.85%, 12/01/31 | | 2,000,000 | | 1,910,420 |
| | | | | | 335,864,746 |
| | North Carolina 0.3% | | | | |
| | Albemarle Hospital Authority Health Care Facilities Revenue, Refunding, 5.25%, 10/01/27 | | 4,500,000 | | 3,650,760 |
| | Columbus County Industrial Facilities and PCFA Revenue, International Paper Co. Projects, | | | | |
| | Recovery Zone Facility Bonds, Series B, 6.25%, 11/01/33 | | 4,000,000 | | 4,055,600 |
| | Series A, 6.25%, 11/01/33 | | 1,300,000 | | 1,318,070 |
| | North Carolina HFAR, SF, Series II, FHA Insured, 6.20%, | | | | |
| | 3/01/16 | | 710,000 | | 737,527 |
| | 9/01/17 | | 525,000 | | 525,042 |
| | North Carolina Medical Care Commission Health Care Facilities Revenue, Pennybyrn at | | | | |
| | Maryfield, Series A, | | | | |
| | 5.75%, 10/01/23 | | 3,625,000 | | 3,035,938 |
| | 6.00%, 10/01/23 | | 2,500,000 | | 2,139,500 |
| | North Carolina Medical Care Commission Retirement Facilities Revenue, first mortgage, | | | | |
| | United Methodist, Refunding, Series C, | | | | |
| | 5.25%, 10/01/24 | | 920,000 | | 843,677 |
| | 5.50%, 10/01/32 | | 1,600,000 | | 1,371,104 |
| | North Carolina Medical Care Commission Revenue, Series A, 6.125%, 10/01/35 | | 8,250,000 | | 6,296,812 |
| | | | | | 23,974,030 |
| | North Dakota 0.1% | | | | |
| | Ward County Health Care Facilities Revenue, Trinity Obligated Group, 5.125%, | | | | |
| | 7/01/25 | | 1,750,000 | | 1,637,580 |
| | 7/01/29 | | 2,500,000 | | 2,212,875 |
| | | | | | 3,850,455 |
| | Ohio 1.3% | | | | |
| | Bowling Green Student Housing Revenue, CFP I LLC, State University Project, 6.00%, | | | | |
| | 6/01/45 | | 6,750,000 | | 6,193,462 |
| | Buckeye Tobacco Settlement Financing Authority Revenue, | | | | |
| | Asset-Backed, Senior Capital Appreciation Turbo Term Bond, Series A-3, zero cpn. to | | | | |
| | 12/01/12, 6.25% thereafter, 6/01/37 | | 15,000,000 | | 9,331,650 |
| Asset | -Backed, Senior Current Interest Turbo Term Bond, Series A-2, 5.875%, 6/01/30 | | 22,500,000 | | 16,039,800 |
| Asset | -Backed, Senior Current Interest Turbo Term Bond, Series A-2, 5.75%, 6/01/34 | | 11,250,000 | | 7,550,887 |
| | Capital Appreciation, Asset-Backed, First Sub Series B, zero cpn., 6/01/47 | | 55,000,000 | | 955,900 |
132 | Annual Report
| | | | |
| Franklin Tax-Free Trust | | | | |
| |
| Statement of Investments, February 28, 2011 (continued) | | | | |
| |
| |
| Franklin High Yield Tax-Free Income Fund | | Principal Amount | | Value |
| Municipal Bonds (continued) | | | | |
| Ohio (continued) | | | | |
| Butler County Hospital Facilities Revenue, UC Health, 5.50%, 11/01/40 | $ | 10,000,000 | $ | 8,405,600 |
| Franklin County Health Care Facilities Revenue, | | | | |
| Ohio Presbyterian, Series A, Pre-Refunded, 7.125%, 7/01/29 | | 1,000,000 | | 1,030,720 |
| Presbyterian Retirement Services, Refunding, 5.50%, 7/01/17 | | 3,100,000 | | 3,101,612 |
| Presbyterian Retirement Services, Refunding, 5.50%, 7/01/21 | | 950,000 | | 941,080 |
| Miami County Hospital Facilities Revenue, Refunding and Improvement, Upper Valley Medical | | | | |
| Center, 5.25%, 5/15/26 | | 2,750,000 | | 2,618,853 |
| Ohio State Air Quality Development Authority Revenue, Environmental Improvement, Buckeye | | | | |
| Power Recovery Zone Facility, 6.00%, 12/01/40 | | 15,000,000 | | 14,632,800 |
| Scioto County Hospital Revenue, Southern Ohio Medical Center, Refunding, 5.75%, | | | | |
| 2/15/38 | | 17,000,000 | | 16,545,590 |
| Toledo Lucas County Port Authority Airport Revenue, Bax Global Project, Refunding, Series 1, | | | | |
| 6.25%, 11/01/13 | | 2,200,000 | | 2,261,490 |
| | | | | 89,609,444 |
| Oklahoma 0.1% | | | | |
| Oklahoma Development Finance Authority Revenue, Comanche County Hospital Project, | | | | |
| Series B, 6.60%, 7/01/31 | | 5,000,000 | | 4,960,750 |
| Tulsa Industrial Authority Revenue, Refunding, NATL Insured, 5.00%, 10/01/31 | | 5,325,000 | | 5,224,145 |
| | | | | 10,184,895 |
| Oregon 0.1% | | | | |
| Oregon Health and Science University Revenue, Series A, 5.75%, 7/01/39 | | 5,000,000 | | 5,048,950 |
| Pennsylvania 4.8% | | | | |
| Allegheny County Hospital Development Authority Revenue, West Pennsylvania Allegheny | | | | |
| Health System, Refunding, | | | | |
| 5.00%, 11/15/28 | | 8,360,000 | | 5,648,350 |
| 5.375%, 11/15/40 | | 70,000,000 | | 45,500,000 |
| Delaware County IDAR, Resource Recovery Facility, Refunding, Series A, | | | | |
| 6.10%, 7/01/13 | | 23,205,000 | | 23,218,923 |
| 6.20%, 7/01/19 | | 17,525,000 | | 17,355,007 |
| Lancaster County Hospital Authority Revenue, Brethren Village Project, Series A, | | | | |
| 6.375%, 7/01/30 | | 1,000,000 | | 902,940 |
| 6.50%, 7/01/40 | | 3,000,000 | | 2,694,450 |
| Northampton County General Purpose Authority Hospital Revenue, St. Luke’s Hospital Project, | | | | |
| Series A, 5.50%, 8/15/40 | | 15,000,000 | | 13,148,550 |
| Pennsylvania Economic Development Financing Authority Exempt Facilities Revenue, | | | | |
| Allegheny Energy Supply Co. LLC Project, 7.00%, 7/15/39 | | 60,000,000 | | 63,130,800 |
| Reliant Energy Seward LLC Project, Series A, Pre-Refunded, 6.75%, 12/01/36 | | 94,510,000 | | 98,641,978 |
| Pennsylvania Economic Development Financing Authority Water Facility Revenue, Aqua Inc. | | | | |
| Project, Series B, 5.00%, 12/01/43 | | 20,000,000 | | 19,220,600 |
| Pennsylvania State Turnpike Commission Turnpike Revenue, | | | | |
| Capital Appreciation, Series C, AGMC Insured, zero cpn. to 6/01/16, 6.25% thereafter, | | | | |
| 6/01/33 | | 5,000,000 | | 3,849,050 |
| Series B, 5.75%, 6/01/39 | | 20,000,000 | | 20,233,400 |
| Philadelphia Hospitals and Higher Education Facilities Authority Hospital Revenue, Temple | | | | |
| University Health System, Refunding, Series B, 5.50%, 7/01/26 | | 18,000,000 | | 16,106,940 |
Annual Report | 133
| | | | | |
| | Franklin Tax-Free Trust | | | | |
| |
| | Statement of Investments, February 28, 2011 (continued) | | | | |
| |
| |
| | Franklin High Yield Tax-Free Income Fund | | Principal Amount | | Value |
| | Municipal Bonds (continued) | | | | |
| | Pennsylvania (continued) | | | | |
| | Sayre Health Care Facilities Authority Revenue, Guthrie Healthcare System, Refunding, | | | | |
| | Series A, 5.75%, 12/01/21 | $ | 815,000 | $ | 830,200 |
| | Washington County IDA, PCR, West Pennsylvania Power Co., Series G, AMBAC Insured, | | | | |
| | 6.05%, 4/01/14 | | 5,025,000 | | 5,039,824 |
| | | | | | 335,521,012 |
| | Rhode Island 0.3% | | | | |
| | Rhode Island State Health and Educational Building Corp. Revenue, Hospital Financing, | | | | |
| | Lifespan Obligated Group, | | | | |
| Pre | -Refunded, 6.50%, 8/15/32 | | 8,000,000 | | 8,660,880 |
| | Refunding, NATL Insured, 5.75%, 5/15/23 | | 405,000 | | 405,053 |
| | Series A, 7.00%, 5/15/39 | | 8,200,000 | | 8,822,872 |
| | Tobacco Settlement FICO Revenue, Asset-Backed, Series B, zero cpn., 6/01/52 | | 90,000,000 | | 1,198,800 |
| | | | | | 19,087,605 |
| | South Carolina 0.9% | | | | |
| | Dorchester County School District No. 002 Installment Purchase Revenue, Growth Remedy | | | | |
| | Opportunities Tax Hike, 5.25%, 12/01/29 | | 16,500,000 | | 16,938,075 |
| | Greenville County School District Installment Purchase Revenue, Building Equity Sooner | | | | |
| | Tomorrow, 5.00%, 12/01/28 | | 10,000,000 | | 10,169,800 |
| | Lancaster Educational Assistance Program Inc. Revenue, School District of Lancaster County | | | | |
| | Project, 5.00%, 12/01/26 | | 15,015,000 | | 14,412,899 |
| | Scago Educational Facilities Corp. for Calhoun School District Revenue, School Project, Radian | | | | |
| | Insured, 5.00%, 12/01/26 | | 7,540,000 | | 6,686,547 |
| | Scago Educational Facilities Corp. for Williamsburg School District Revenue, Williamsburg | | | | |
| | County Project, Refunding, Radian Insured, 5.00%, 12/01/31 | | 2,000,000 | | 1,814,940 |
| | South Carolina Jobs EDA Student Housing Revenue, Coastal Housing Foundation, Series A, | | | | |
| | 6.50%, 4/01/42 | | 10,000,000 | | 10,019,700 |
| | | | | | 60,041,961 |
| | Tennessee 0.8% | | | | |
| | Johnson City Health and Educational Facilities Board Hospital Revenue, | | | | |
| | Capital Appreciation, First Mortgage, Refunding, Series A, NATL Insured, zero cpn., | | | | |
| | 7/01/27 | | 19,365,000 | | 6,306,987 |
| | Capital Appreciation, First Mortgage, Refunding, Series A, NATL Insured, zero cpn., | | | | |
| | 7/01/28 | | 19,400,000 | | 5,810,494 |
| | first mortgage, Mountain States Health, Refunding, Series A, NATL Insured, zero cpn., | | | | |
| | 7/01/29 | | 19,365,000 | | 5,353,067 |
| | first mortgage, Mountain States Health, Refunding, Series A, NATL Insured, zero cpn., | | | | |
| | 7/01/30 | | 19,370,000 | | 4,863,032 |
| | Knox County Health Educational and Housing Facilities Board Hospital Facilities Revenue, | | | | |
| | Capital Appreciation, Refunding and Improvement, Series A, AGMC Insured, zero cpn., | | | | |
| | 1/01/25 | | 5,000,000 | | 2,284,500 |
| | Capital Appreciation, Refunding and Improvement, Series A, AGMC Insured, zero cpn., | | | | |
| | 1/01/26 | | 2,610,000 | | 1,120,395 |
| | Covenant Health System, Refunding and Improvement, Series A, zero cpn., 1/01/37 | | 12,760,000 | | 2,224,323 |
| | Covenant Health System, Refunding and Improvement, Series A, zero cpn., 1/01/39 | | 13,755,000 | | 2,069,852 |
134 | Annual Report
| | | | |
| Franklin Tax-Free Trust | | | | |
| |
| Statement of Investments, February 28, 2011 (continued) | | | | |
| |
| |
| Franklin High Yield Tax-Free Income Fund | | Principal Amount | | Value |
| Municipal Bonds (continued) | | | | |
| Tennessee (continued) | | | | |
| Knox County Health Educational and Housing Facilities Board Revenue, University Health | | | | |
| System Inc., Refunding, 5.25%, 4/01/36 | $ | 23,475,000 | $ | 20,872,562 |
| Memphis-Shelby County Airport Authority Airport Revenue, Refunding, Series B, 5.75%, | | | | |
| 7/01/23 | | 5,000,000 | | 5,167,200 |
| 7/01/24 | | 3,500,000 | | 3,583,405 |
| | | | | 59,655,817 |
| Texas 6.1% | | | | |
| Angelina and Neches River Authority Waste Disposal Revenue, Temple-Inland Forest Products, | | | | |
| 6.95%, 5/01/23 | | 1,750,000 | | 1,725,833 |
| Austin Convention Enterprises Inc. Convention Center Revenue, first tier, Refunding, Series B, | | | | |
| 5.75%, 1/01/34 | | 7,000,000 | | 5,959,870 |
| Bexar County Health Facilities Development Corp. Revenue, Army Retirement Residence, | | | | |
| Refunding, 5.00%, | | | | |
| 7/01/27 | | 1,000,000 | | 892,800 |
| 7/01/33 | | 1,520,000 | | 1,278,335 |
| Brazos County Health Facilities Development Corp. Franciscan Services Corp. Revenue, | | | | |
| Obligation Group, St. Joseph Regional, 5.50%, 1/01/38 | | 5,250,000 | | 4,723,687 |
| Brazos River Authority PCR, | | | | |
| Texas Utilities Electric Company Project, Refunding, Series A, 7.70%, 4/01/33 | | 21,740,000 | | 7,747,701 |
| TXU Electric Co. Project, Refunding, Series A, 8.25%, 10/01/30 | | 45,000,000 | | 17,046,900 |
| TXU Electric Co. Project, Refunding, Series C, 7.70%, 3/01/32 | | 6,800,000 | | 2,417,264 |
| TXU Electric Co. Project, Refunding, Series D-1, 8.25%, 5/01/33 | | 17,000,000 | | 6,437,390 |
| TXU Energy Co. LLC Project, Mandatory Put 4/01/13, Refunding, Series A, 6.75%, | | | | |
| 4/01/38 | | 6,385,000 | | 4,698,977 |
| TXU Energy Co. LLC Project, Refunding, Series B, 6.30%, 7/01/32 | | 9,000,000 | | 3,065,670 |
| TXU Energy Co. LLC Project, Refunding, Series C, 6.75%, 10/01/38 | | 1,555,000 | | 529,664 |
| Brazos River Harbor Navigation District Brazoria County Environmental Revenue, | | | | |
| Dow Chemical Co. Project, Refunding, Series B-2, 4.95%, 5/15/33 | | 2,500,000 | | 2,309,700 |
| Mandatory Put 6/05/12, Refunding, 6.25%, 5/15/33 | | 5,000,000 | | 5,298,650 |
| Brownsville Utility System Revenue, Refunding and Improvement, Series A, AMBAC Insured, | | | | |
| 5.00%, 9/01/31 | | 2,000,000 | | 1,980,020 |
| Capital Area Cultural Education Facilities Finance Corp. Revenue, Roman Catholic Diocese, | | | | |
| Series B, 6.125%, 4/01/45 | | 10,000,000 | | 9,741,500 |
| Central Texas Regional Mobility Authority Revenue, | | | | |
| Capital Appreciation, Refunding, zero cpn., 1/01/35 | | 3,000,000 | | 504,930 |
| Capital Appreciation, Refunding, zero cpn., 1/01/37 | | 2,500,000 | | 360,525 |
| Capital Appreciation, Refunding, zero cpn., 1/01/38 | | 2,405,000 | | 320,947 |
| Capital Appreciation, Refunding, zero cpn., 1/01/39 | | 2,545,000 | | 314,206 |
| senior lien, Refunding, 5.75%, 1/01/25 | | 2,500,000 | | 2,396,300 |
| Coppell Special Assessment, Gateway Project, 8.70%, 3/01/12 | | 805,000 | | 813,436 |
| Dallas-Fort Worth International Airport Revenue, | | | | |
| Joint, Series B, NATL Insured, 6.00%, 11/01/23 | | 4,000,000 | | 4,005,440 |
| Joint, Series C, NATL Insured, 6.25%, 11/01/28 | | 3,250,000 | | 3,251,462 |
| Joint Improvement, Series A, 5.00%, 11/01/42 | | 12,000,000 | | 10,697,040 |
| Joint Improvement, Series A, 5.00%, 11/01/45 | | 50,000,000 | | 44,257,500 |
Annual Report | 135
| | | | |
| Franklin Tax-Free Trust | | | | |
| |
| Statement of Investments, February 28, 2011 (continued) | | | | |
| |
| |
| Franklin High Yield Tax-Free Income Fund | | Principal Amount | | Value |
| Municipal Bonds (continued) | | | | |
| Texas (continued) | | | | |
| El Paso Health Facilities Development Corp. Revenue, Senior Care Facilities, Bienvivir Senior | | | | |
| Health, Pre-Refunded, | | | | |
| 7.00%, 8/15/12 | $ | 225,000 | $ | 233,789 |
| 7.50%, 8/15/18 | | 2,300,000 | | 2,417,944 |
| 7.75%, 8/15/31 | | 3,000,000 | | 3,157,200 |
| Gulf Coast Waste Disposal Authority Waste Disposal Revenue, Valero Energy Corp. Project, | | | | |
| 6.65%, 4/01/32 | | 1,500,000 | | 1,501,425 |
| Harris County Health Facilities Development Corp. Hospital Revenue, Memorial Hermann | | | | |
| Healthcare System, Refunding, Series B, 7.25%, 12/01/35 | | 13,500,000 | | 14,653,170 |
| Houston Airport System Revenue, Special Facilities, Continental Airlines, Series E, 6.75%, | | | | |
| 7/01/21 | | 24,995,000 | | 24,790,791 |
| 7/01/29 | | 2,200,000 | | 2,145,616 |
| Lufkin Health Facilities Development Corp. Health System Revenue, Memorial Health System | | | | |
| of East Texas, | | | | |
| 5.50%, 2/15/32 | | 1,000,000 | | 840,220 |
| 5.50%, 2/15/37 | | 2,500,000 | | 2,048,925 |
| Refunding, 6.25%, 2/15/37 | | 5,000,000 | | 4,542,850 |
| Matagorda County Navigation District No. 1 PCR, Central Power and Light Co. Project, | | | | |
| Refunding, Series A, 6.30%, 11/01/29 | | 10,000,000 | | 10,089,500 |
| Matagorda County Navigation District No. 1 Revenue, | | | | |
| Centerpoint Energy Project, Refunding, 5.60%, 3/01/27 | | 12,000,000 | | 12,093,720 |
| Houston Lighting, Refunding, AMBAC Insured, 5.125%, 11/01/28 | | 7,000,000 | | 6,143,690 |
| North Texas Tollway Authority Revenue, | | | | |
| Capital Appreciation, System, first tier, Refunding, Series I, zero cpn. to 1/01/15, 6.50% | | | | |
| thereafter, 1/01/43 | | 25,000,000 | | 18,999,750 |
| System, first tier, Refunding, Series A, 5.625%, 1/01/33 | | 1,000,000 | | 985,700 |
| System, first tier, Refunding, Series A, 6.25%, 1/01/39 | | 12,500,000 | | 12,777,750 |
| System, first tier, Refunding, Series A, 5.75%, 1/01/48 | | 30,000,000 | | 28,632,600 |
| System, first tier, Refunding, Series B, 5.75%, 1/01/40 | | 11,680,000 | | 11,421,638 |
| System, first tier, Refunding, Series K-2, 6.00%, 1/01/38 | | 15,000,000 | | 15,091,500 |
| System, second tier, Refunding, Series F, 5.75%, 1/01/38 | | 20,000,000 | | 19,079,400 |
| Sabine River Authority PCR, TXU Electric Co. Project, | | | | |
| Mandatory Put 11/01/11, Refunding, Series B, 5.75%, 5/01/30 | | 18,645,000 | | 17,619,525 |
| Refunding, Series A, 5.80%, 7/01/22 | | 1,000,000 | | 330,930 |
| Refunding, Series B, 6.15%, 8/01/22 | | 13,115,000 | | 4,470,641 |
| Refunding, Series C, 5.20%, 5/01/28 | | 29,945,000 | | 10,228,913 |
| Sam Rayburn Municipal Power Agency Revenue, Refunding, 6.00%, | | | | |
| 10/01/16 | | 8,500,000 | | 8,790,020 |
| 10/01/21 | | 1,500,000 | | 1,520,595 |
| Tarrant County Cultural Education Facilities Finance Corp. Revenue, Texas Health Resources, | | | | |
| Refunding, 5.00%, 11/15/40 | | 15,225,000 | | 13,970,460 |
| Texas State Municipal Power Agency Revenue, sub. lien, Transmission, Refunding, 5.00%, | | | | |
| 9/01/40 | | 15,250,000 | | 14,440,835 |
| Texas State Turnpike Authority Central Turnpike System Revenue, Capital Appreciation, AMBAC | | | | |
| Insured, zero cpn., 8/15/32 | | 51,000,000 | | 11,325,060 |
| Trinity River Authority PCR, TXU Electric Co. Project, Refunding, 6.25%, 5/01/28 | | 445,000 | | 151,634 |
136 | Annual Report
| | | | | |
| | Franklin Tax-Free Trust | | | | |
| |
| | Statement of Investments, February 28, 2011 (continued) | | | | |
| |
| |
| | Franklin High Yield Tax-Free Income Fund | | Principal Amount | | Value |
| | Municipal Bonds (continued) | | | | |
| | Texas (continued) | | | | |
| | Tyler Health Facilities Development Corp. Hospital Revenue, | | | | |
| | East Texas Medical Center, Refunding and Improvement, Series A, 5.375%, 11/01/37 | $ | 8,000,000 | $ | 6,279,040 |
| | Mother Frances Hospital, Series B, 5.00%, 7/01/37 | | 3,400,000 | | 2,651,014 |
| | | | | | 426,201,592 |
| | Vermont 0.2% | | | | |
| | Vermont Educational and Health Buildings Financing Agency Revenue, Fletcher Allen Health, | | | | |
| | Series A, AMBAC Insured, 6.00%, 12/01/23 | | 15,000,000 | | 15,203,700 |
| | Virginia 0.3% | | | | |
| | James City County EDA Residential Care Facility Revenue, first mortgage, Williamsburg | | | | |
| | Landing, Series A, 5.35%, 9/01/26 | | 750,000 | | 651,353 |
| | Peninsula Ports Authority Coal Terminal Revenue, Dominion Terminal Associates, Refunding, | | | | |
| | 6.00%, 4/01/33 | | 9,500,000 | | 9,557,760 |
| | Tobacco Settlement FICO Revenue, | | | | |
| Asset | -Backed, Pre-Refunded, 5.50%, 6/01/26 | | 2,500,000 | | 2,743,900 |
| | Capital Appreciation Bonds, second sub., Refunding, Series D, zero cpn., 6/01/47 | | 50,000,000 | | 757,500 |
| | Senior Series B-1, 5.00%, 6/01/47 | | 6,250,000 | | 3,602,125 |
| | Virginia Beach Development Authority Residential Care Facility Mortgage Revenue, Westminster | | | | |
| | Canterbury Project, Refunding, | | | | |
| | 5.00%, 11/01/22 | | 1,000,000 | | 891,320 |
| | 5.25%, 11/01/26 | | 2,000,000 | | 1,719,440 |
| | 5.375%, 11/01/32 | | 1,000,000 | | 797,490 |
| | | | | | 20,720,888 |
| | Washington 2.0% | | | | |
| | Douglas County PUD No. 1 Wells Hydroelectric Revenue, Refunding, Series B, NATL RE, FGIC | | | | |
| | Insured, 5.00%, 9/01/35 | | 7,685,000 | | 7,536,064 |
| | FYI Properties Lease Revenue, Washington State District Project, 5.50%, | | | | |
| | 6/01/34 | | 11,935,000 | | 11,980,950 |
| | 6/01/39 | | 16,250,000 | | 16,064,750 |
| | Ocean Shores Local ID Tax Allocation, 7.25%, 2/01/31 | | 20,160,000 | | 20,456,352 |
| | Port of Seattle Revenue, Intermediate Lien, Refunding, Series B, 5.00%, 6/01/40 | | 17,000,000 | | 16,147,960 |
| | Skagit County Public Hospital District No. 1 Revenue, Skagit Valley Hospital, 5.75%, | | | | |
| | 12/01/32 | | 2,000,000 | | 1,813,500 |
| | 12/01/35 | | 5,355,000 | | 4,743,727 |
| | Snohomish County Public Hospital District No. 3 GO, AMBAC Insured, 5.00%, 12/01/31 | | 10,000,000 | | 8,865,400 |
| | Washington State Health Care Facilities Authority Revenue, | | | | |
| | Central Washington Health Services, 7.00%, 7/01/39 | | 8,500,000 | | 8,686,830 |
| | Fred Hutchinson Cancer Center, Refunding, Series A, 6.00%, 1/01/33 | | 7,500,000 | | 7,286,175 |
| | Kadlec Medical Center, Refunding, Series A, Assured Guaranty, 5.00%, 12/01/30 | | 4,000,000 | | 3,839,680 |
| | Providence Health and Services, Series A, FGIC Insured, Pre-Refunded, 5.00%, | | | | |
| | 10/01/36 | | 305,000 | | 357,100 |
| | Virginia Mason Medical, Series B, ACA Insured, 6.00%, 8/15/37 | | 30,000,000 | | 27,551,400 |
| | Washington State Higher Education Facilities Authority Revenue, Whitworth University Project, | | | | |
| | Refunding, 5.625%, 10/01/40 | | 5,235,000 | | 4,750,396 |
| | | | | | 140,080,284 |
Annual Report | 137
| | | | |
| Franklin Tax-Free Trust | | | | |
| |
| Statement of Investments, February 28, 2011 (continued) | | | | |
| |
| |
| Franklin High Yield Tax-Free Income Fund | | Principal Amount | | Value |
| Municipal Bonds (continued) | | | | |
| West Virginia 0.4% | | | | |
| County Commission of Harrison County Solid Waste Disposal Revenue, Allegheny Energy Supply | | | | |
| Co. LLC, Refunding, Series D, 5.50%, 10/15/37 | $ | 14,745,000 | $ | 12,576,011 |
| Pleasants County PCR, County Commission, Series F, 5.25%, 10/15/37 | | 16,250,000 | | 14,325,837 |
| | | | | 26,901,848 |
| Wisconsin 1.0% | | | | |
| Central Brown County Water Authority Water System Revenue, Refunding, AMBAC Insured, | | | | |
| 5.00%, 12/01/30 | | 11,205,000 | | 11,260,465 |
| Wisconsin Housing and EDA Home Ownership Revenue, Series E, 4.90%, 9/01/37 | | 20,235,000 | | 18,202,799 |
| Wisconsin Public Financial Authority, Adams-Columbia Cooperative, NATL Insured, 5.50%, | | | | |
| 12/01/40 | | 6,755,000 | | 6,705,418 |
| Wisconsin State General Fund Annual Appropriation Revenue, Series A, 6.00%, 5/01/33 | | 15,000,000 | | 16,108,200 |
| Wisconsin State Health and Educational Facilities Authority Revenue, | | | | |
| Fort Healthcare Inc. Project, 5.75%, 5/01/24 | | 5,000,000 | | 4,847,150 |
| New Castle Place Project, Series A, 7.00%, 12/01/31 | | 2,500,000 | | 1,862,350 |
| Thedacare Inc., AMBAC Insured, 5.00%, 12/15/30 | | 9,530,000 | | 8,618,074 |
| Thedacare Inc., Series A, 5.50%, 12/15/38 | | 5,000,000 | | 4,669,850 |
| | | | | 72,274,306 |
| Wyoming 0.3% | | | | |
| Campbell County Solid Waste Facilities Revenue, Basin Electric Power Cooperative, Series A, | | | | |
| 5.75%, 7/15/39 | | 5,500,000 | | 5,635,245 |
| dWest Park Hospital District Revenue, West Park Hospital Project, Series A, 7.00%, 6/01/40 | | 5,500,000 | | 5,503,135 |
| Wyoming Municipal Power Agency Power Supply Revenue, Series A, | | | | |
| 5.50%, 1/01/28 | | 1,350,000 | | 1,402,772 |
| 5.50%, 1/01/33 | | 2,360,000 | | 2,405,501 |
| 5.50%, 1/01/38 | | 2,810,000 | | 2,836,807 |
| 5.00%, 1/01/42 | | 1,000,000 | | 976,880 |
| 5.375%, 1/01/42 | | 2,750,000 | | 2,785,035 |
| | | | | 21,545,375 |
| U.S. Territories 4.9% | | | | |
| Guam 1.3% | | | | |
| Guam Government Department of Education COP, John F. Kennedy High School, Series A, | | | | |
| 6.625%, 12/01/30 | | 3,980,000 | | 3,874,928 |
| 6.875%, 12/01/40 | | 3,000,000 | | 2,873,580 |
| Guam Government GO, | | | | |
| Refunding, Series A, 5.125%, 11/15/27 | | 7,270,000 | | 6,491,310 |
| Refunding, Series A, 5.25%, 11/15/37 | | 37,000,000 | | 30,093,210 |
| Series A, 6.00%, 11/15/19 | | 8,000,000 | | 8,448,320 |
| Series A, 6.75%, 11/15/29 | | 10,000,000 | | 10,543,000 |
| Series A, 7.00%, 11/15/39 | | 15,000,000 | | 15,713,550 |
| Guam Government Waterworks Authority Water and Wastewater System Revenue, | | | | |
| 5.625%, 7/01/40 | | 4,000,000 | | 3,620,840 |
| Water, 6.00%, 7/01/25 | | 4,000,000 | | 4,008,640 |
| Water, 5.875%, 7/01/35 | | 8,000,000 | | 7,569,360 |
| | | | | 93,236,738 |
138 | Annual Report
| | | | |
| Franklin Tax-Free Trust | | | | |
| |
| Statement of Investments, February 28, 2011 (continued) | | | | |
| |
| |
| Franklin High Yield Tax-Free Income Fund | | Principal Amount | | Value |
| Municipal Bonds (continued) | | | | |
| U.S. Territories (continued) | | | | |
| Northern Mariana Islands 0.4% | | | | |
| Northern Mariana Islands Commonwealth GO, Refunding, Series B, 5.00%, 10/01/33 | $ | 25,000,000 | $ | 18,572,000 |
| Northern Mariana Islands Commonwealth Ports Authority Seaport Revenue, Series A, 6.60%, | | | | |
| 3/15/28 | | 7,235,000 | | 6,744,829 |
| | | | | 25,316,829 |
| Puerto Rico 2.5% | | | | |
| Children’s Trust Fund Puerto Rico Tobacco Settlement Revenue, Asset-Backed Bonds, | | | | |
| Refunding, | | | | |
| 5.50%, 5/15/39 | | 11,500,000 | | 9,152,850 |
| 5.625%, 5/15/43 | | 3,500,000 | | 2,689,260 |
| Puerto Rico Commonwealth Aqueduct and Sewer Authority Revenue, senior lien, Series A, | | | | |
| 6.00%, 7/01/44 | | 5,200,000 | | 4,833,608 |
| Puerto Rico Commonwealth Highway and Transportation Authority Transportation Revenue, | | | | |
| Refunding, Series N, FGIC Insured, 5.25%, 7/01/39 | | 7,000,000 | | 6,091,890 |
| Puerto Rico Electric Power Authority Power Revenue, Series XX, | | | | |
| 5.75%, 7/01/36 | | 4,510,000 | | 4,307,276 |
| 5.25%, 7/01/40 | | 20,500,000 | | 17,903,470 |
| Puerto Rico Industrial Tourist Educational Medical and Environmental Control Facilities | | | | |
| Revenue, Cogeneration Facility, AES Puerto Rico Project, 6.625%, 6/01/26 | | 1,365,000 | | 1,369,163 |
| Puerto Rico Sales Tax FICO Sales Tax Revenue, | | | | |
| Capital Appreciation, first sub., Series A, zero cpn. to 8/01/16, 6.75% thereafter, | | | | |
| 8/01/32 | | 53,000,000 | | 42,896,080 |
| Capital Appreciation, first sub., Series A, zero cpn. to 8/01/19, 6.25% thereafter, | | | | |
| 8/01/33 | | 36,500,000 | | 23,954,585 |
| first sub., Series A, 5.50%, 8/01/42 | | 42,000,000 | | 39,212,040 |
| first sub., Series C, 5.50%, 8/01/40 | | 25,000,000 | | 23,379,250 |
| | | | | 175,789,472 |
| U.S. Virgin Islands 0.7% | | | | |
| Virgin Islands PFAR, | | | | |
| Matching Fund Loan Note, sub. lien, Series B, 5.25%, 10/01/29 | | 5,750,000 | | 5,689,222 |
| senior lien, Capital Projects, Series A-1, 5.00%, 10/01/24 | | 555,000 | | 550,660 |
| senior lien, Refunding, Series B, 5.00%, 10/01/25 | | 1,500,000 | | 1,478,580 |
| sub. lien, Refunding, Series C, 5.00%, 10/01/19 | | 9,145,000 | | 9,613,224 |
| sub. lien, Refunding, Series C, 5.00%, 10/01/22 | | 10,000,000 | | 10,117,800 |
| Virgin Islands Matching Fund Loan Note, Diageo Project, Series A, 6.625%, 10/01/29 | | 18,380,000 | | 19,028,263 |
| | | | | 46,477,749 |
| Total U.S. Territories | | | | 340,820,788 |
| Total Municipal Bonds before Short Term Investments | | | | |
| (Cost $7,203,217,741) | | | | 6,896,166,407 |
| Short Term Investments 0.3% | | | | |
| Municipal Bonds 0.3% | | | | |
| Missouri 0.1% | | | | |
| eMissouri State Health and Educational Facilities Authority Health Facilities Revenue, SSM | | | | |
| Health Care, Series C, Daily VRDN and Put, 0.25%, 6/01/45 | | 3,500,000 | | 3,500,000 |
Annual Report | 139
| | | | | |
| Franklin Tax-Free Trust | | | | | |
| |
| Statement of Investments, February 28, 2011 (continued) | | | | | |
| |
| |
| Franklin High Yield Tax-Free Income Fund | | Principal Amount | | | Value |
| Short Term Investments (continued) | | | | | |
| Municipal Bonds (continued) | | | | | |
| New Jersey 0.1% | | | | | |
| eNew Jersey EDA Revenue, School Facilities Construction, Series R, Sub Series R-1, Daily | | | | | |
| VRDN and Put, 0.19%, 9/01/31 | $ | 7,700,000 | | $ | 7,700,000 |
| Ohio 0.0%† | | | | | |
| eCuyahoga County Revenue, Cleveland Clinic Health System Obligated Group, Series B, Sub | | | | | |
| Series B-1, Daily VRDN and Put, 0.18%, 1/01/39 | | 2,800,000 | | | 2,800,000 |
| Virginia 0.1% | | | | | |
| eVirginia Commonwealth University Revenue, General, Series B, AMBAC Insured, Daily VRDN | | | | | |
| and Put, 0.22%, 11/01/30 | | 4,700,000 | | | 4,700,000 |
| Total Short Term Investments (Cost $18,700,000) | | | | | 18,700,000 |
| Total Investments (Cost $7,221,917,741) 98.6% | | | | 6,914,866,407 |
| Other Assets, less Liabilities 1.4% | | | | | 97,514,157 |
| Net Assets 100.0% | | | $ | 7,012,380,564 |
| |
| |
| |
| See Abbreviations on page 206. | | | | | |
| |
| †Rounds to less than 0.1% of net assets. | | | | | |
| aSecurity has been deemed illiquid because it may not be able to be sold within seven days. At February 28, 2011, the aggregate value of these securities was $10,409,195, |
| representing 0.15% of net assets. | | | | | |
| bThe bond pays interest and/or principal based upon the issuer’s ability to pay, which may be less than the stated interest rate or principal paydown. | | | |
| cSee Note 6 regarding defaulted securities. | | | | | |
| dSecurity purchased on a when-issued basis. See Note 1(b). | | | | | |
| eVariable rate demand notes (VRDNs) are tax-exempt obligations which contain a floating or variable interest rate adjustment formula and an unconditional right of demand to |
| receive payment of the principal balance plus accrued interest at specified dates. The coupon rate shown represents the rate at period end. | | | |
| |
| |
| |
| |
| 140 | The accompanying notes are an integral part of these financial statements. | | | Annual Report | | | |
| | | | | | | | | | | | | | | |
| Franklin Tax-Free Trust | | | | | | | | | | | | | |
| |
| Financial Highlights | | | | | | | | | | | | | | | |
| |
| Franklin Insured Tax-Free Income Fund | | | | | | | | | | | | | | | |
| | | | | | Year Ended February 28, | | | | |
| Class A | | 2011 | | | 2010 | | | 2009 | | | 2008 | a | | 2007 | |
| Per share operating performance | | | | | | | | | | | | | | | |
| (for a share outstanding throughout the year) | | | | | | | | | | | | | | | |
| Net asset value, beginning of year | $ | 11.88 | | $ | 11.20 | | $ | 11.48 | | $ | 12.32 | | $ | 12.32 | |
| Income from investment operationsb: | | | | | | | | | | | | | | | |
| Net investment incomec | | 0.51 | | | 0.52 | | | 0.52 | | | 0.52 | | | 0.53 | |
| Net realized and unrealized gains (losses) | | (0.49 | ) | | 0.68 | | | (0.29 | ) | | (0.84 | ) | | 0.01 | |
| Total from investment operations | | 0.02 | | | 1.20 | | | 0.23 | | | (0.32 | ) | | 0.54 | |
| Less distributions from: | | | | | | | | | | | | | | | |
| Net investment income | | (0.51 | ) | | (0.52 | ) | | (0.51 | ) | | (0.52 | ) | | (0.53 | ) |
| Net realized gains | | — | | | — | | | — | | | (—)d | | | (0.01 | ) |
| Total distributions | | (0.51 | ) | | (0.52 | ) | | (0.51 | ) | | (0.52 | ) | | (0.54 | ) |
| Redemption feese | | — | | | — | | | —d | | | —d | | | —d | |
| Net asset value, end of year | $ | 11.39 | | $ | 11.88 | | $ | 11.20 | | $ | 11.48 | | $ | 12.32 | |
| |
| Total returnf | | 0.13 | % | | 10.93 | % | | 2.04 | % | | (2.70 | )% | | 4.51 | % |
| |
| Ratios to average net assets | | | | | | | | | | | | | | | |
| Expenses | | 0.63 | % | | 0.63 | % | | 0.63 | % | | 0.64 | % | | 0.63 | % |
| Net investment income | | 4.30 | % | | 4.46 | % | | 4.57 | % | | 4.28 | % | | 4.33 | % |
| |
| Supplemental data | | | | | | | | | | | | | | | |
| Net assets, end of year (000’s) | $ | 2,100,666 | | $ | 2,134,949 | | $ | 1,807,929 | | $ | 1,909,094 | | $ | 1,821,006 | |
| Portfolio turnover rate | | 17.09 | % | | 5.21 | % | | 15.12 | % | | 15.60 | % | | 6.75 | % |
| |
| |
| aFor the year ended February 29. | | | | | | | | | | | | | | | |
| bThe amount shown for a share outstanding throughout the period may not correlate with the Statement of Operations for the period due to the timing of sales and repurchases of | |
| the Fund shares in relation to income earned and/or fluctuating market value of the investments of the Fund. | | | | | | | | | | |
| cBased on average daily shares outstanding. | | | | | | | | | | | | | | | |
| dAmount rounds to less than $0.01 per share. | | | | | | | | | | | | | | | |
| eEffective September 1, 2008, the redemption fee was eliminated. | | | | | | | | | | | | | |
| fTotal return does not reflect sales commissions or contingent deferred sales charges, if applicable. | | | | | | | | | | | | | |
| |
| |
| |
| |
| Annual Report | | | The accompanying notes are an integral part of these financial statements. | 141 | |
| | | | | | | | | | | | | | | |
| Franklin Tax-Free Trust | | | | | | | | | | | | | | | |
| |
| Financial Highlights (continued) | | | | | | | | | | | | | | | |
| |
| Franklin Insured Tax-Free Income Fund | | | | | | | | | | | | | | | |
| | | | | | Year Ended February 28, | | | | |
| Class B | | 2011 | | | 2010 | | | 2009 | | | 2008 | a | | 2007 | |
| Per share operating performance | | | | | | | | | | | | | | | |
| (for a share outstanding throughout the year) | | | | | | | | | | | | | | | |
| Net asset value, beginning of year | $ | 11.94 | | $ | 11.26 | | $ | 11.53 | | $ | 12.37 | | $ | 12.37 | |
| Income from investment operationsb: | | | | | | | | | | | | | | | |
| Net investment incomec | | 0.44 | | | 0.46 | | | 0.46 | | | 0.45 | | | 0.46 | |
| Net realized and unrealized gains (losses) | | (0.48 | ) | | 0.68 | | | (0.28 | ) | | (0.83 | ) | | 0.01 | |
| Total from investment operations | | (0.04 | ) | | 1.14 | | | 0.18 | | | (0.38 | ) | | 0.47 | |
| Less distributions from: | | | | | | | | | | | | | | | |
| Net investment income | | (0.45 | ) | | (0.46 | ) | | (0.45 | ) | | (0.46 | ) | | (0.46 | ) |
| Net realized gains | | — | | | — | | | — | | | (—)d | | | (0.01 | ) |
| Total distributions | | (0.45 | ) | | (0.46 | ) | | (0.45 | ) | | (0.46 | ) | | (0.47 | ) |
| Redemption feese | | — | | | — | | | —d | | | —d | | | —d | |
| Net asset value, end of year | $ | 11.45 | | $ | 11.94 | | $ | 11.26 | | $ | 11.53 | | $ | 12.37 | |
| |
| Total returnf | | (0.43 | )% | | 10.27 | % | | 1.56 | % | | (3.22 | )% | | 3.93 | % |
| |
| Ratios to average net assets | | | | | | | | | | | | | | | |
| Expenses | | 1.18 | % | | 1.18 | % | | 1.18 | % | | 1.19 | % | | 1.18 | % |
| Net investment income | | 3.75 | % | | 3.91 | % | | 4.02 | % | | 3.73 | % | | 3.78 | % |
| |
| Supplemental data | | | | | | | | | | | | | | | |
| Net assets, end of year (000’s) | $ | 19,302 | | $ | 43,086 | | $ | 56,475 | | $ | 69,500 | | $ | 83,644 | |
| Portfolio turnover rate | | 17.09 | % | | 5.21 | % | | 15.12 | % | | 15.60 | % | | 6.75 | % |
| |
| |
| aFor the year ended February 29. | | | | | | | | | | | | | | | |
| bThe amount shown for a share outstanding throughout the period may not correlate with the Statement of Operations for the period due to the timing of sales and repurchases of | |
| the Fund shares in relation to income earned and/or fluctuating market value of the investments of the Fund. | | | | | | | | | | | | | |
| cBased on average daily shares outstanding. | | | | | | | | | | | | | | | |
| dAmount rounds to less than $0.01 per share. | | | | | | | | | | | | | | | |
| eEffective September 1, 2008, the redemption fee was eliminated. | | | | | | | | | | | | | | | |
| fTotal return does not reflect sales commissions or contingent deferred sales charges, if applicable. | | | | | | | | | | | | | |
| |
| |
| |
| |
| 142 | The accompanying notes are an integral part of these financial statements. | Annual Report | | | | | | | |
| | | | | | | | | | | | | | | |
| Franklin Tax-Free Trust | | | | | | | | | | | | | |
| |
| Financial Highlights (continued) | | | | | | | | | | | | | | | |
| |
| Franklin Insured Tax-Free Income Fund | | | | | | | | | | | | | | | |
| | | | | | Year Ended February 28, | | | | |
| Class C | | 2011 | | | 2010 | | | 2009 | | | 2008 | a | | 2007 | |
| Per share operating performance | | | | | | | | | | | | | | | |
| (for a share outstanding throughout the year) | | | | | | | | | | | | | | | |
| Net asset value, beginning of year | $ | 12.01 | | $ | 11.31 | | $ | 11.59 | | $ | 12.43 | | $ | 12.42 | |
| Income from investment operationsb: | | | | | | | | | | | | | | | |
| Net investment incomec | | 0.45 | | | 0.46 | | | 0.47 | | | 0.46 | | | 0.47 | |
| Net realized and unrealized gains (losses) | | (0.49 | ) | | 0.70 | | | (0.30 | ) | | (0.84 | ) | | 0.01 | |
| Total from investment operations | | (0.04 | ) | | 1.16 | | | 0.17 | | | (0.38 | ) | | 0.48 | |
| Less distributions from: | | | | | | | | | | | | | | | |
| Net investment income | | (0.44 | ) | | (0.46 | ) | | (0.45 | ) | | (0.46 | ) | | (0.46 | ) |
| Net realized gains | | — | | | — | | | — | | | (—)d | | | (0.01 | ) |
| Total distributions | | (0.44 | ) | | (0.46 | ) | | (0.45 | ) | | (0.46 | ) | | (0.47 | ) |
| Redemption feese | | — | | | — | | | —d | | | —d | | | —d | |
| Net asset value, end of year | $ | 11.53 | | $ | 12.01 | | $ | 11.31 | | $ | 11.59 | | $ | 12.43 | |
| |
| Total returnf | | (0.36 | )% | | 10.41 | % | | 1.46 | % | | (3.21 | )% | | 3.99 | % |
| |
| Ratios to average net assets | | | | | | | | | | | | | | | |
| Expenses | | 1.18 | % | | 1.18 | % | | 1.18 | % | | 1.19 | % | | 1.17 | % |
| Net investment income | | 3.75 | % | | 3.91 | % | | 4.02 | % | | 3.73 | % | | 3.79 | % |
| |
| Supplemental data | | | | | | | | | | | | | | | |
| Net assets, end of year (000’s) | $ | 385,479 | | $ | 339,444 | | $ | 196,085 | | $ | 148,054 | | $ | 141,913 | |
| Portfolio turnover rate | | 17.09 | % | | 5.21 | % | | 15.12 | % | | 15.60 | % | | 6.75 | % |
| |
| |
| aFor the year ended February 29. | | | | | | | | | | | | | | | |
| bThe amount shown for a share outstanding throughout the period may not correlate with the Statement of Operations for the period due to the timing of sales and repurchases of | |
| the Fund shares in relation to income earned and/or fluctuating market value of the investments of the Fund. | | | | | | | | | | | | | |
| cBased on average daily shares outstanding. | | | | | | | | | | | | | | | |
| dAmount rounds to less than $0.01 per share. | | | | | | | | | | | | | | | |
| eEffective September 1, 2008, the redemption fee was eliminated. | | | | | | | | | | | | | |
| fTotal return does not reflect sales commissions or contingent deferred sales charges, if applicable. | | | | | | | | | | | | | |
| |
| |
| |
| |
| Annual Report | | | The accompanying notes are an integral part of these financial statements. | 143 | |
| | | | | | | | | |
| Franklin Tax-Free Trust | | | | | | | | | |
| |
| Financial Highlights (continued) | | | | | | | | | |
| |
| Franklin Insured Tax-Free Income Fund | | | | | | | | | |
| | | Year Ended February 28, | |
| Advisor Class | | 2011 | | | 2010 | | | 2009 | a |
| Per share operating performance | | | | | | | | | |
| (for a share outstanding throughout the year) | | | | | | | | | |
| Net asset value, beginning of year | $ | 11.88 | | $ | 11.20 | | $ | 11.86 | |
| Income from investment operationsb: | | | | | | | | | |
| Net investment incomec | | 0.52 | | | 0.53 | | | 0.36 | |
| Net realized and unrealized gains (losses) | | (0.49 | ) | | 0.69 | | | (0.67 | ) |
| Total from investment operations | | 0.03 | | | 1.22 | | | (0.31 | ) |
| Less distributions from net investment income | | (0.52 | ) | | (0.54 | ) | | (0.35 | ) |
| Net asset value, end of year | $ | 11.39 | | $ | 11.88 | | $ | 11.20 | |
| |
| Total returnd | | 0.23 | % | | 11.04 | % | | (2.58 | )% |
| |
| Ratios to average net assetse | | | | | | | | | |
| Expenses | | 0.53 | % | | 0.53 | % | | 0.53 | % |
| Net investment income | | 4.40 | % | | 4.56 | % | | 4.67 | % |
| |
| Supplemental data | | | | | | | | | |
| Net assets, end of year (000’s) | $ | 21,855 | | $ | 9,408 | | $ | 1,417 | |
| Portfolio turnover rate | | 17.09 | % | | 5.21 | % | | 15.12 | % |
| |
| |
| aFor the period July 1, 2008 (effective date) to February 28, 2009. | | | | | | | | | |
| bThe amount shown for a share outstanding throughout the period may not correlate with the Statement of Operations for the period due to the timing of sales and repurchases of | |
| the Fund shares in relation to income earned and/or fluctuating market value of the investments of the Fund. | | | | | | | | | |
| cBased on average daily shares outstanding. | | | | | | | | | |
| dTotal return is not annualized for periods less than one year. | | | | | | | | | |
| eRatios are annualized for periods less than one year. | | | | | | | | | |
| |
| |
| |
| |
| 144 | The accompanying notes are an integral part of these financial statements. | | | Annual Report | | | | | | | |
| | | | |
| Franklin Tax-Free Trust | | | | |
| |
| Statement of Investments, February 28, 2011 | | | | |
| |
| |
| Franklin Insured Tax-Free Income Fund | | Principal Amount | | Value |
| Municipal Bonds 98.8% | | | | |
| Alabama 4.9% | | | | |
| Alabama Drinking Water Finance Authority Revenue, Revolving Fund Loan, Series A, AMBAC | | | | |
| Insured, 5.25%, 8/15/21 | $ | 2,490,000 | $ | 2,541,568 |
| Anniston Regional Medical Center Board Revenue, Series A, AMBAC Insured, 5.25%, | | | | |
| 6/01/18 | | 5,000,000 | | 5,001,300 |
| Bessemer GO, wts., XLCA Insured, 5.00%, 2/01/35 | | 2,000,000 | | 1,548,280 |
| Birmingham Airport Authority Airport Revenue, AGMC Insured, 5.50%, 7/01/40 | | 20,000,000 | | 19,883,000 |
| Birmingham Waterworks Board Water Revenue, Series A, Assured Guaranty, 5.25%, | | | | |
| 1/01/39 | | 5,000,000 | | 5,015,550 |
| Chatom IDB Gulf Opportunity Zone Revenue, PowerSouth Energy, Refunding, Series A, | | | | |
| Assured Guaranty, 5.00%, | | | | |
| 8/01/30 | | 5,250,000 | | 5,344,447 |
| 8/01/37 | | 5,000,000 | | 4,794,700 |
| Helena Utilities Board Water and Sewer Revenue, NATL Insured, Pre-Refunded, 5.25%, | | | | |
| 4/01/27 | | 3,260,000 | | 3,460,849 |
| 4/01/33 | | 4,890,000 | | 5,191,273 |
| Houston County Health Care Authority Revenue, Series A, AMBAC Insured, 5.125%, | | | | |
| 10/01/24 | | 5,855,000 | | 5,507,798 |
| 10/01/25 | | 6,065,000 | | 5,553,842 |
| Leeds Public Educational Building Authority Educational Facilities Revenue, Assured Guaranty, | | | | |
| 5.125%, 4/01/38 | | 10,865,000 | | 10,856,634 |
| Limestone County Water and Sewer Authority Water Revenue, AMBAC Insured, 5.00%, | | | | |
| 12/01/35 | | 9,100,000 | | 7,898,618 |
| Madison GO, wts., Refunding, XLCA Insured, 4.75%, 12/01/36 | | 10,000,000 | | 8,781,200 |
| Orange Beach Water Sewer and Fire Protection Authority Revenue, NATL Insured, 5.00%, | | | | |
| 5/15/35 | | 3,665,000 | | 3,472,734 |
| Pell City GO, wts., | | | | |
| Refunding, XLCA Insured, 5.00%, 2/01/24 | | 1,020,000 | | 1,041,308 |
| XLCA Insured, 5.00%, 2/01/34 | | 5,195,000 | | 4,577,782 |
| Phenix City Water and Sewer Revenue, wts., Series A, AGMC Insured, 5.00%, 8/15/40 | | 8,090,000 | | 7,882,896 |
| Tuscaloosa Public Educational Building Authority Student Housing Revenue, Ridgecrest | | | | |
| Student Housing LLC University of Alabama Ridgecrest Residential Project, Assured | | | | |
| Guaranty, 6.75%, 7/01/38 | | 5,000,000 | | 5,428,750 |
| University of Alabama at Birmingham Hospital Revenue, Refunding, Series A, AMBAC Insured, | | | | |
| 5.00%, 9/01/41 | | 5,000,000 | | 4,380,300 |
| University of Alabama University Revenues, General, University of Alabama at Birmingham, | | | | |
| NATL RE, FGIC Insured, Pre-Refunded, 5.25%, 10/01/27 | | 5,975,000 | | 6,144,869 |
| | | | | 124,307,698 |
| Alaska 0.4% | | | | |
| Alaska Energy Authority Power Revenue, Bradley Lake Project, Refunding, NATL Insured, | | | | |
| 6.25%, 7/01/21 | | 5,000 | | 5,016 |
| Matanuska-Susitna Borough Lease Revenue, Goose Creek Correctional Center, Assured | | | | |
| Guaranty, 6.00%, 9/01/32 | | 10,000,000 | | 10,792,900 |
| | | | | 10,797,916 |
Annual Report | 145
| | | | |
| Franklin Tax-Free Trust | | | | |
| |
| Statement of Investments, February 28, 2011 (continued) | | | | |
| |
| |
| Franklin Insured Tax-Free Income Fund | | Principal Amount | | Value |
| Municipal Bonds (continued) | | | | |
| Arizona 3.1% | | | | |
| Arizona State COP, Department of Administration, | | | | |
| Series A, AGMC Insured, 5.25%, 10/01/26 | $ | 8,500,000 | $ | 8,742,250 |
| Series A, AGMC Insured, 5.25%, 10/01/28 | | 10,000,000 | | 10,144,500 |
| Series A, AGMC Insured, 5.00%, 10/01/29 | | 5,000,000 | | 5,003,250 |
| Series B, AGMC Insured, 5.00%, 10/01/27 | | 8,000,000 | | 8,040,240 |
| Downtown Phoenix Hotel Corp. Revenue, | | | | |
| Senior Series A, FGIC Insured, 5.00%, 7/01/36 | | 15,000,000 | | 11,405,400 |
| sub. bond, Series B, NATL RE, FGIC Insured, 5.00%, 7/01/36 | | 6,450,000 | | 5,430,642 |
| Maricopa County IDA Hospital Facility Revenue, Samaritan Health Services, Series A, NATL | | | | |
| Insured, ETM, 7.00%, 12/01/16 | | 300,000 | | 356,124 |
| Pima County Sewer Revenue, System, Assured Guaranty, 5.00%, | | | | |
| 7/01/24 | | 10,000,000 | | 10,400,000 |
| 7/01/25 | | 7,000,000 | | 7,199,290 |
| Tucson Water Revenue, Series B, AGMC Insured, 5.00%, 7/01/32 | | 12,000,000 | | 12,089,760 |
| | | | | 78,811,456 |
| Arkansas 0.3% | | | | |
| Benton Regional Public Water Authority Water Revenue, Refunding and Improvement, XLCA | | | | |
| Insured, 5.00%, 10/01/35 | | 5,230,000 | | 5,001,763 |
| University of Arkansas University Revenues, Various Facility, Fayetteville Campus, AMBAC | | | | |
| Insured, 5.00%, 11/01/36 | | 3,205,000 | | 3,212,628 |
| | | | | 8,214,391 |
| California 7.5% | | | | |
| California State GO, | | | | |
| Refunding, AMBAC Insured, 5.00%, 2/01/33 | | 7,000,000 | | 6,570,200 |
| Refunding, NATL Insured, 5.00%, 2/01/31 | | 20,000,000 | | 19,434,200 |
| Refunding, NATL Insured, 5.00%, 10/01/32 | | 1,910,000 | | 1,829,665 |
| Various Purpose, 6.00%, 4/01/38 | | 30,000,000 | | 30,789,300 |
| Various Purpose, Refunding, NATL Insured, 4.75%, 3/01/35 | | 20,855,000 | | 18,368,041 |
| California State Public Works Board Lease Revenue, Various Capital Projects, Series G-1, | | | | |
| 5.25%, 10/01/24 | | 5,000,000 | | 5,282,450 |
| California State University Revenue, Systemwide, Series A, AGMC Insured, 5.00%, | | | | |
| 11/01/39 | | 10,000,000 | | 8,896,700 |
| Colton Joint USD, GO, Election of 2008, Series A, Assured Guaranty, 5.375%, 8/01/34 | | 10,000,000 | | 9,784,500 |
| East Side UHSD Santa Clara County GO, Election of 2008, Series B, Assured Guaranty, | | | | |
| 5.25%, 8/01/35 | | 23,800,000 | | 23,286,158 |
| Los Angeles USD, GO, Election of 2004, Series H, AGMC Insured, 5.00%, 7/01/32 | | 32,565,000 | | 31,688,350 |
| Montebello USD, GO, Election of 2004, Series A-1, Assured Guaranty, 5.25%, 8/01/34 | | 5,000,000 | | 4,973,100 |
| Oakland RDA Tax Allocation, Central District Redevelopment, Refunding, AMBAC Insured, | | | | |
| 5.50%, 2/01/14 | | 130,000 | | 131,450 |
| Richmond Joint Powers Financing Authority Revenue, Lease, Civic Center Project, Refunding, | | | | |
| Assured Guaranty, 5.75%, 8/01/29 | | 13,315,000 | | 13,900,328 |
| San Joaquin Hills Transportation Corridor Agency Toll Road Revenue, Refunding, Series A, | | | | |
| NATL Insured, 5.25%, 1/15/30 | | 4,000,000 | | 3,331,240 |
| San Jose RDA Tax Allocation, Merged Area, Refunding, Series D, Assured Guaranty, 5.00%, | | | | |
| 8/01/22 | | 10,000,000 | | 9,854,400 |
146 | Annual Report
| | | | | |
| | Franklin Tax-Free Trust | | | | |
| |
| | Statement of Investments, February 28, 2011 (continued) | | | | |
| |
| |
| | Franklin Insured Tax-Free Income Fund | | Principal Amount | | Value |
| | Municipal Bonds (continued) | | | | |
| | California (continued) | | | | |
| | Val Verde USD, COP, School Construction Project, | | | | |
| | Refunding, Series B, NATL RE, FGIC Insured, 5.00%, 1/01/35 | $ | 1,680,000 | $ | 1,331,652 |
| | Series B, FGIC Insured, Pre-Refunded, 5.00%, 1/01/35 | | 820,000 | | 924,402 |
| | | | | | 190,376,136 |
| | Colorado 2.8% | | | | |
| | Colorado Health Facilities Authority Revenue, | | | | |
| | Catholic Health Initiatives, Series C-7, AGMC Insured, 5.00%, 9/01/36 | | 20,000,000 | | 18,872,800 |
| | Health Facility Authority, Hospital, Refunding, Series B, AGMC Insured, 5.25%, | | | | |
| | 3/01/36 | | 10,000,000 | | 9,519,200 |
| | Colorado State Board of Governors University Enterprise System Revenue, Series A, NATL RE, | | | | |
| | FGIC Insured, 5.00%, 3/01/37 | | 10,000,000 | | 9,758,400 |
| | Denver City and County Airport Revenue, Series C, NATL Insured, ETM, 6.125%, | | | | |
| | 11/15/25 | | 3,590,000 | | 4,349,465 |
| | 11/15/25 | | 4,410,000 | | 4,423,274 |
| | Denver Convention Center Hotel Authority Revenue, senior bond, Refunding, XLCA Insured, | | | | |
| | 5.00%, 12/01/35 | | 15,000,000 | | 11,727,300 |
| | University of Colorado Hospital Authority Revenue, Refunding, Series A, AMBAC Insured, | | | | |
| | 5.20%, 11/15/17 | | 5,425,000 | | 5,437,586 |
| | 5.25%, 11/15/22 | | 7,800,000 | | 7,567,326 |
| | | | | | 71,655,351 |
| | Connecticut 0.2% | | | | |
| | Connecticut State Health and Educational Facilities Authority Revenue, Child Care Facilities | | | | |
| | Program, Series G, Assured Guaranty, 6.00%, 7/01/38 | | 5,000,000 | | 5,344,300 |
| | District of Columbia 0.8% | | | | |
| | District of Columbia HFA, RMR, Series 1, FGIC Insured, 7.75%, 9/01/16 | | 115,000 | | 115,235 |
| | District of Columbia Hospital Revenue, Children’s Hospital Obligation, Sub Series 1, AGMC | | | | |
| | Insured, 5.45%, 7/15/35 | | 19,790,000 | | 19,166,615 |
| | | | | | 19,281,850 |
| | Florida 11.6% | | | | |
| | Alachua County School Board COP, AMBAC Insured, | | | | |
| | 5.00%, 7/01/20 | | 495,000 | | 501,940 |
| Pre | -Refunded, 5.00%, 7/01/20 | | 505,000 | | 517,862 |
| | Brevard County Local Option Fuel Tax Revenue, NATL RE, FGIC Insured, 5.00%, | | | | |
| | 8/01/32 | | 12,440,000 | | 10,936,626 |
| | 8/01/37 | | 13,000,000 | | 10,725,910 |
| | Broward County HFAR, | | | | |
| | 5.65%, 11/01/22 | | 405,000 | | 405,170 |
| | 5.70%, 11/01/29 | | 225,000 | | 224,993 |
| | Broward County School Board COP, | | | | |
| | NATL Insured, 5.00%, 7/01/28 | | 2,000,000 | | 1,965,740 |
| | Series A, AGMC Insured, 5.00%, 7/01/22 | | 2,000,000 | | 2,027,180 |
| | Series A, AGMC Insured, 5.00%, 7/01/26 | | 2,850,000 | | 2,873,484 |
| | Series A, AGMC Insured, 5.00%, 7/01/30 | | 2,000,000 | | 1,925,500 |
| | Cape Coral Water and Sewer Revenue, AMBAC Insured, 5.00%, 10/01/36 | | 2,000,000 | | 1,761,380 |
Annual Report | 147
| | | | |
| Franklin Tax-Free Trust | | | | |
| |
| Statement of Investments, February 28, 2011 (continued) | | | | |
| |
| |
| Franklin Insured Tax-Free Income Fund | | Principal Amount | | Value |
| Municipal Bonds (continued) | | | | |
| Florida (continued) | | | | |
| Celebration CDD, Special Assessment, Series B, NATL Insured, 5.50%, 5/01/19 | $ | 180,000 | $ | 180,580 |
| Clearwater Water and Sewer Revenue, NATL RE, FGIC Insured, 5.00%, | | | | |
| 12/01/28 | | 11,050,000 | | 11,190,888 |
| 12/01/32 | | 13,665,000 | | 13,691,100 |
| Coral Gables Health Facilities Authority Hospital Revenue, Baptist Health South Florida | | | | |
| Obligated Group, AGMC Insured, Pre-Refunded, 5.00%, 8/15/29 | | 1,000,000 | | 1,129,490 |
| Dade County HFA, MFMR, Siesta Pointe Apartments, Series A, 5.75%, 9/01/29 | | 1,890,000 | | 1,890,000 |
| Destin Capital Improvement Revenue, NATL Insured, 5.00%, 8/01/27 | | 1,315,000 | | 1,266,463 |
| Escambia County Utilities Authority Utility System Revenue, | | | | |
| NATL RE, FGIC Insured, 5.00%, 1/01/31 | | 1,775,000 | | 1,746,369 |
| Refunding, Series B, NATL RE, FGIC Insured, 5.00%, 1/01/22 | | 2,000,000 | | 2,020,420 |
| Florida Gulf Coast University Financing Corp. Capital Improvement Revenue, Housing Project, | | | | |
| Series A, NATL Insured, 5.00%, 2/01/37 | | 10,000,000 | | 9,151,100 |
| Florida HFAR, Spinnaker Cove Apartments, Series G, AMBAC Insured, 6.50%, 7/01/36 | | 1,600,000 | | 1,494,784 |
| Florida HFC Revenue, | | | | |
| Housing, Logan’s Pointe Apartments, Series F-1, AGMC Insured, 5.90%, 12/01/19 | | 1,190,000 | | 1,198,401 |
| Marina Bay Apartments, Series S, AGMC Insured, 5.85%, 2/01/41 | | 1,070,000 | | 1,069,968 |
| Florida Intergovernmental Finance Commission Capital Revenue, Series A, AMBAC Insured, | | | | |
| 5.00%, 8/01/32 | | 3,570,000 | | 3,433,697 |
| Florida State Board of Education Capital Outlay GO, Public Education, | | | | |
| Refunding, Series E, NATL RE, FGIC Insured, 5.00%, 6/01/24 | | 5,000,000 | | 5,084,700 |
| Series B, NATL RE, FGIC Insured, 5.00%, 6/01/23 | | 5,395,000 | | 5,583,609 |
| Florida State Board of Education GO, | | | | |
| Series C, NATL Insured, 5.00%, 6/01/27 | | 4,245,000 | | 4,339,324 |
| Series F, NATL Insured, 5.00%, 6/01/28 | | 2,000,000 | | 2,037,240 |
| Florida State Correctional Privatization Commission COP, Series B, AMBAC Insured, 5.00%, | | | | |
| 8/01/25 | | 2,000,000 | | 2,043,900 |
| Florida State Department of Environmental Protection Preservation Revenue, Florida Forever, | | | | |
| Series A, NATL Insured, 5.00%, 7/01/21 | | 3,000,000 | | 3,119,430 |
| Greater Orlando Aviation Authority Orlando Airport Facilities Revenue, Series B, NATL RE, | | | | |
| FGIC Insured, 5.25%, 10/01/28 | | 2,500,000 | | 2,501,225 |
| Hernando County School Board COP, NATL Insured, 5.00%, 7/01/30 | | 1,150,000 | | 1,128,955 |
| Hillsborough County School Board COP, Master Lease Program, Refunding, Series A, NATL | | | | |
| Insured, 5.00%, 7/01/26 | | 1,670,000 | | 1,680,204 |
| Indian Trail Water Control District Improvement Revenue, NATL Insured, 5.75%, 8/01/16 | | 960,000 | | 963,523 |
| Jacksonville Capital Improvement Revenue, Refunding, Series C, AMBAC Insured, 5.00%, | | | | |
| 10/01/25 | | 4,000,000 | | 4,050,680 |
| Jacksonville Guaranteed Entitlement Revenue, Refunding and Improvement, NATL RE, FGIC | | | | |
| Insured, 5.00%, 10/01/32 | | 1,000,000 | | 986,970 |
| Jacksonville Sales Tax Revenue, | | | | |
| AMBAC Insured, 5.00%, 10/01/30 | | 5,000,000 | | 5,018,450 |
| Better Jacksonville, NATL Insured, 5.00%, 10/01/30 | | 1,500,000 | | 1,505,685 |
| Jacksonville Transportation Revenue, NATL Insured, | | | | |
| 5.00%, 10/01/26 | | 2,000,000 | | 2,011,700 |
| 5.25%, 10/01/29 | | 11,000,000 | | 11,197,120 |
| Lake County School Board COP, Series A, AMBAC Insured, 5.00%, 6/01/30 | | 2,080,000 | | 1,983,405 |
| Lee County Airport Revenue, Refunding, AGMC Insured, 5.00%, 10/01/33 | | 3,530,000 | | 3,310,822 |
148 | Annual Report
| | | | | |
| | Franklin Tax-Free Trust | | | | |
| |
| | Statement of Investments, February 28, 2011 (continued) | | | | |
| |
| |
| | Franklin Insured Tax-Free Income Fund | | Principal Amount | | Value |
| | Municipal Bonds (continued) | | | | |
| | Florida (continued) | | | | |
| | Lee Memorial Health System Hospital Revenue, Series A, AMBAC Insured, 5.00%, | | | | |
| | 4/01/32 | $ | 1,460,000 | $ | 1,260,316 |
| | 4/01/37 | | 11,000,000 | | 9,186,540 |
| | Leon County COP, AMBAC Insured, 5.00%, 7/01/25 | | 8,935,000 | | 8,963,413 |
| | Maitland CDA Revenue, AMBAC Insured, 5.00%, 7/01/34 | | 2,595,000 | | 2,511,519 |
| | Marion County Utility System Revenue, NATL RE, FGIC Insured, 5.00%, 12/01/31 | | 1,500,000 | | 1,494,135 |
| | Miami Beach Water and Sewer Revenue, AMBAC Insured, 5.00%, 9/01/30 | | 3,000,000 | | 3,000,000 |
| | Miami-Dade County Aviation Revenue, Miami International Airport, Hub of the Americas, | | | | |
| | Refunding, Series A, CIFG Insured, 5.00%, 10/01/38 | | 1,625,000 | | 1,335,490 |
| | Series B, NATL RE, FGIC Insured, 5.75%, 10/01/29 | | 2,500,000 | | 2,520,450 |
| | Series B, NATL RE, FGIC Insured, 5.00%, 10/01/30 | | 3,500,000 | | 3,294,550 |
| | Miami-Dade County GO, Building Better Communities Program, NATL RE, FGIC Insured, | | | | |
| | 5.00%, 7/01/33 | | 2,000,000 | | 2,013,780 |
| | Miami-Dade County Public Facilities Revenue, Jackson Health System, Series A, NATL Insured, | | | | |
| | 5.00%, 6/01/31 | | 1,650,000 | | 1,466,504 |
| Miami | -Dade County School Board COP, Series A, NATL RE, FGIC Insured, 5.00%, | | | | |
| | 5/01/25 | | 5,000,000 | | 4,934,800 |
| | 5/01/27 | | 10,775,000 | | 10,380,958 |
| Opa | -Locka Capital Improvement Revenue, NATL RE, FGIC Insured, 6.125%, 1/01/24 | | 1,000,000 | | 1,003,390 |
| | Orange County Health Facilities Authority Revenue, Hospital, Orlando Regional Healthcare | | | | |
| | System, Refunding, Series B, AGMC Insured, 5.00%, 12/01/32 | | 7,000,000 | | 6,774,110 |
| | Orange County School Board COP, Series A, NATL Insured, 5.00%, 8/01/27 | | 10,000,000 | | 10,104,000 |
| | Orlando-Orange County Expressway Authority Revenue, | | | | |
| | junior lien, NATL RE, FGIC Insured, 6.50%, 7/01/12 | | 225,000 | | 239,697 |
| | Series B, AMBAC Insured, 5.00%, 7/01/35 | | 20,000,000 | | 18,844,800 |
| | Osceola County HFA, MFHR, Tierra Vista Apartment Project, Series A, 5.70%, 12/01/17 | | 480,000 | | 480,288 |
| | Osceola County School Board COP, Series A, AMBAC Insured, Pre-Refunded, 5.25%, | | | | |
| | 6/01/27 | | 13,000,000 | | 13,892,450 |
| | Osceola County Tourist Development Tax Revenue, NATL RE, FGIC Insured, 5.00%, | | | | |
| | 10/01/32 | | 3,000,000 | | 2,960,910 |
| | Palm Beach County School Board COP, Series A, AMBAC Insured, Pre-Refunded, 5.125%, | | | | |
| | 8/01/24 | | 2,000,000 | | 2,059,420 |
| | Panama City Beach Utility Revenue, Refunding, AMBAC Insured, 5.00%, 6/01/32 | | 2,000,000 | | 1,923,880 |
| | Pasco County Guaranteed Entitlement Revenue, Refunding, AGMC Insured, 5.00%, | | | | |
| | 12/01/33 | | 2,185,000 | | 2,126,923 |
| | Pembroke Pines Public Improvement Revenue, | | | | |
| | Series A, AMBAC Insured, 5.00%, 10/01/29 | | 2,000,000 | | 1,961,960 |
| | Series B, AMBAC Insured, 5.00%, 10/01/34 | | 2,000,000 | | 1,919,680 |
| | Pinellas County Health Facilities Authority Revenue, Baycare Health System, AGMC Insured, | | | | |
| | 5.00%, 11/15/30 | | 4,000,000 | | 4,004,080 |
| | Pinellas County Sewer Revenue, AGMC Insured, 5.00%, 10/01/32 | | 3,000,000 | | 3,004,920 |
| | Polk County Public Facilities Revenue, NATL Insured, 5.00%, 12/01/33 | | 2,000,000 | | 1,915,980 |
| | Polk County Utility System Revenue, Series A, NATL RE, FGIC Insured, 5.00%, | | | | |
| | 10/01/30 | | 1,000,000 | | 1,005,160 |
| | 10/01/34 | | 2,000,000 | | 1,930,120 |
| | Port Orange GO, NATL Insured, 5.00%, 4/01/33 | | 1,755,000 | | 1,769,005 |
| | Port St. Lucie Utility Revenue, NATL Insured, 5.00%, 9/01/34 | | 8,420,000 | | 8,468,163 |
Annual Report | 149
| | | | |
| Franklin Tax-Free Trust | | | | |
| |
| Statement of Investments, February 28, 2011 (continued) | | | | |
| |
| |
| Franklin Insured Tax-Free Income Fund | | Principal Amount | | Value |
| Municipal Bonds (continued) | | | | |
| Florida (continued) | | | | |
| St. Lucie West Services District Utility Revenue, senior lien, NATL Insured, 6.125%, | | | | |
| 10/01/32 | $ | 2,240,000 | $ | 2,278,349 |
| Sumter County School District Revenue, Multi-District Loan Program, AGMC Insured, ETM, | | | | |
| 7.15%, 11/01/15 | | 245,000 | | 297,952 |
| Sunrise Utilities System Revenue, | | | | |
| AMBAC Insured, ETM, 5.20%, 10/01/22 | | 860,000 | | 979,127 |
| Refunding, AMBAC Insured, 5.20%, 10/01/22 | | 1,140,000 | | 1,247,342 |
| Tampa Bay Water Utility System Revenue, FGIC Insured, Pre-Refunded, 5.75%, 10/01/29 | | 2,000,000 | | 2,062,640 |
| Tavares Water and Sewer Revenue, AMBAC Insured, 5.50%, 10/01/30 | | 1,000,000 | | 1,001,350 |
| University of Central Florida Athletics Assn. Inc. COP, Series A, NATL RE, FGIC Insured, 5.00%, | | | | |
| 10/01/27 | | 1,000,000 | | 886,220 |
| 10/01/30 | | 1,485,000 | | 1,270,967 |
| Volusia County Educational Facility Authority Revenue, Educational Facilities, Embry-Riddle | | | | |
| Aeronautical University Project, Refunding, Series B, AMBAC Insured, 5.25%, 10/15/19 | | 3,500,000 | | 3,500,665 |
| | | | | 294,151,990 |
| Georgia 5.2% | | | | |
| Albany Dougherty Payroll Development Authority Revenue, Darton College Project, Assured | | | | |
| Guaranty, 5.75%, 6/15/41 | | 5,550,000 | | 5,561,322 |
| Athens Housing Authority Student Housing Lease Revenue, University of Georgia, | | | | |
| AMBAC Insured, Pre-Refunded, 5.00%, 12/01/33 | | 435,000 | | 465,715 |
| Refunding, AMBAC Insured, 5.00%, 12/01/33 | | 5,565,000 | | 5,218,245 |
| Atlanta Airport Revenue, General, Series A, AGMC Insured, 5.00%, 1/01/40 | | 9,215,000 | | 8,756,001 |
| Atlanta Water and Wastewater Revenue, | | | | |
| AGMC Insured, 5.00%, 11/01/37 | | 15,000,000 | | 14,136,000 |
| Refunding, Series B, AGMC Insured, 5.375%, 11/01/39 | | 23,000,000 | | 22,815,310 |
| Series A, NATL RE, FGIC Insured, 5.00%, 11/01/29 | | 4,750,000 | | 4,664,880 |
| Brunswick Water and Sewer Revenue, Refunding and Improvement, NATL Insured, 6.10%, | | | | |
| 10/01/14 | | 1,535,000 | | 1,719,707 |
| Bulloch County Development Authority Revenue, Assured Guaranty, 5.25%, 7/01/33 | | 14,825,000 | | 14,994,598 |
| Cherokee County Water and Sewer Authority Revenue, NATL Insured, 6.90%, 8/01/18 | | 15,000 | | 15,061 |
| Columbus Building Authority Lease Revenue, Series A, NATL RE, FGIC Insured, 5.00%, | | | | |
| 1/01/31 | | 3,500,000 | | 3,568,075 |
| Dahlonega Water and Wastewater Revenue, Series A, Assured Guaranty, 5.50%, 9/01/37 | | 6,450,000 | | 6,485,346 |
| East Point Building Authority Revenue, Water and Sewer Project, Series A, XLCA Insured, | | | | |
| 5.00%, 2/01/30 | | 11,360,000 | | 9,118,899 |
| Fulton County Development Authority Revenue, Georgia Institute of Technology Athletic Assn., | | | | |
| Refunding, AMBAC Insured, 5.125%, 10/01/32 | | 9,000,000 | | 8,414,640 |
| Georgia State Higher Education Facilities Authority Revenue, USG Real Estate Foundation III | | | | |
| LLC Project, Series A, Assured Guaranty, 5.00%, 6/15/38 | | 9,250,000 | | 8,749,390 |
| Medical Center Hospital Authority Revenue, Anticipation Certificates, Columbus Regional | | | | |
| Healthcare System, Refunding, AGMC Insured, 5.00%, 8/01/41 | | 7,500,000 | | 6,741,825 |
| Savannah EDA Revenue, SSU Community Development LLC Project, Series I, Assured | | | | |
| Guaranty, 5.75%, 6/15/41 | | 10,000,000 | | 10,135,400 |
| | | | | 131,560,414 |
150 | Annual Report
| | | | |
| Franklin Tax-Free Trust | | | | |
| |
| Statement of Investments, February 28, 2011 (continued) | | | | |
| |
| |
| Franklin Insured Tax-Free Income Fund | | Principal Amount | | Value |
| Municipal Bonds (continued) | | | | |
| Hawaii 0.1% | | | | |
| Hawaii County GO, Refunding and Improvement, Series A, NATL RE, FGIC Insured, 5.60%, | | | | |
| 5/01/12 | $ | 1,000,000 | $ | 1,056,310 |
| 5/01/13 | | 1,000,000 | | 1,097,860 |
| | | | | 2,154,170 |
| Illinois 5.9% | | | | |
| Chicago Board of Education GO, Refunding, Series C, Assured Guaranty, 5.25%, 12/01/26 | | 12,575,000 | | 12,573,994 |
| Chicago GO, Refunding, Series A, AGMC Insured, 5.00%, | | | | |
| 1/01/28 | | 29,885,000 | | 28,390,152 |
| 1/01/29 | | 13,345,000 | | 12,609,157 |
| 1/01/30 | | 6,200,000 | | 5,865,758 |
| Chicago O’Hare International Airport Revenue, | | | | |
| AGMC Insured, 5.25%, 1/01/35 | | 26,635,000 | | 25,651,902 |
| Refunding, Series A, AGMC Insured, 5.00%, 1/01/28 | | 24,915,000 | | 24,304,333 |
| Illinois Finance Authority Revenue, | | | | |
| Edward Hospital, Series A, AMBAC Insured, 5.50%, 2/01/40 | | 4,000,000 | | 3,625,440 |
| Southern Illinois HealthCare, AGMC Insured, 5.375%, 3/01/35 | | 8,500,000 | | 8,184,140 |
| Illinois Health Facilities Authority Revenue, Northwestern Medical Facility Foundation, | | | | |
| Refunding, NATL Insured, 5.125%, 11/15/28 | | 5,000,000 | | 4,307,750 |
| Illinois State GO, Refunding, AGMC Insured, 5.00%, 1/01/23 | | 10,000,000 | | 9,867,600 |
| Regional Transportation Authority Revenue, Series A, AMBAC Insured, 7.20%, 11/01/20 | | 290,000 | | 344,097 |
| Saline Valley Conservancy District Waterworks Revenue, Saline Valley Conservancy District, | | | | |
| Refunding, Series A, AMBAC Insured, 5.00%, 1/01/41 | | 7,000,000 | | 6,527,990 |
| St. Clair County School District No. 189 East St. Louis GO, Alternate Revenue Source, | | | | |
| Refunding, AMBAC Insured, 5.125%, 1/01/28 | | 7,135,000 | | 6,858,305 |
| | | | | 149,110,618 |
| Indiana 0.5% | | | | |
| Indiana Health and Educational Facilities Finance Authority Revenue, St. Francis, Series E, | | | | |
| AGMC Insured, 5.25%, 5/15/41 | | 3,750,000 | | 3,472,350 |
| Indianapolis Local Public Improvement Bond Bank Revenue, Waterworks Project, Series A, | | | | |
| Assured Guaranty, 5.50%, 1/01/38 | | 8,650,000 | | 8,864,780 |
| | | | | 12,337,130 |
| Kansas 0.6% | | | | |
| Overland Park Development Corp. Revenue, second tier, Overland Park Convention Center Hotel, | | | | |
| Refunding, Series B, AMBAC Insured, 5.125%, 1/01/32 | | 20,000,000 | | 16,105,600 |
| Kentucky 1.7% | | | | |
| Kentucky Economic Development Finance Authority Health System Revenue, Norton | | | | |
| Healthcare Inc., | | | | |
| Refunding, Series C, NATL Insured, 6.05%, 10/01/20 | | 8,505,000 | | 8,974,476 |
| Series C, NATL Insured, Pre-Refunded, 6.05%, 10/01/20 | | 4,255,000 | | 4,846,615 |
| Series C, NATL Insured, Pre-Refunded, 6.15%, 10/01/26 | | 12,195,000 | | 13,921,568 |
| Kentucky State Municipal Power Agency Power System Revenue, Prairie State Project, Series A, | | | | |
| NATL Insured, 5.00%, 9/01/37 | | 10,000,000 | | 9,280,300 |
| Louisville and Jefferson County Metropolitan Sewer District Sewer and Drain System Revenue, | | | | |
| Series A, NATL Insured, 5.50%, 5/15/34 | | 5,000,000 | | 5,090,500 |
| | | | | 42,113,459 |
Annual Report | 151
| | | | | |
| | Franklin Tax-Free Trust | | | | |
| |
| | Statement of Investments, February 28, 2011 (continued) | | | | |
| |
| |
| | Franklin Insured Tax-Free Income Fund | | Principal Amount | | Value |
| | Municipal Bonds (continued) | | | | |
| | Louisiana 2.8% | | | | |
| | Lafayette Public Trust Financing Authority Revenue, Ragin’ Cajun Facilities, Housing and | | | | |
| | Package Project, Assured Guaranty, | | | | |
| | 5.00%, 10/01/25 | $ | 5,500,000 | $ | 5,634,420 |
| | 5.50%, 10/01/41 | | 15,000,000 | | 14,694,900 |
| | Louisiana Local Government Environmental Facilities and CDA Revenue, | | | | |
| | LCTCS Facilities Corp. Project, Series B, Assured Guaranty, 5.00%, 10/01/26 | | 2,750,000 | | 2,782,395 |
| | Parking Facilities Corp. Garage Project, Series A, AMBAC Insured, 5.375%, 10/01/31 | | 5,480,000 | | 4,888,050 |
| | Louisiana Local Government Environmental Facilities and CDR, Southeastern Louisiana | | | | |
| | University, Series A, AGMC Insured, 5.00%, 10/01/40 | | 8,545,000 | | 8,030,591 |
| | Louisiana State Citizens Property Insurance Corp. Assessment Revenue, Series C-2, Assured | | | | |
| | Guaranty, 6.75%, 6/01/26 | | 21,000,000 | | 24,129,420 |
| | Louisiana State Gas and Fuels Tax Revenue, Series A, AMBAC Insured, 5.00%, 6/01/27 | | 10,000,000 | | 10,142,700 |
| | | | | | 70,302,476 |
| | Maine 1.0% | | | | |
| | Maine Educational Loan Authority Student Loan Revenue, A, Series A-3, Assured Guaranty, | | | | |
| | 5.875%, 12/01/39 | | 17,285,000 | | 17,457,331 |
| | Maine State Health and Higher Educational Facilities Authority Revenue, Series C, AGMC | | | | |
| | Insured, 6.20%, 7/01/25 | | 100,000 | | 100,209 |
| | Portland Airport Revenue, General, AGMC Insured, | | | | |
| | 5.25%, 1/01/35 | | 3,000,000 | | 3,003,960 |
| | 5.00%, 1/01/40 | | 6,000,000 | | 5,743,680 |
| | | | | | 26,305,180 |
| | Maryland 1.1% | | | | |
| | Baltimore Convention Center Hotel Revenue, Senior Series A, XLCA Insured, 5.00%, | | | | |
| | 9/01/32 | | 10,000,000 | | 8,126,900 |
| | Baltimore Project Revenue, Water Projects, Refunding, Series A, NATL RE, FGIC Insured, | | | | |
| | 5.125%, 7/01/42 | | 11,000,000 | | 11,018,040 |
| | Maryland State Health and Higher Educational Facilities Authority Revenue, | | | | |
| | LifeBridge Health, Refunding, Assured Guaranty, 5.00%, 7/01/34 | | 9,000,000 | | 8,722,260 |
| | University of Maryland Medical System, Series B, NATL RE, FGIC Insured, 7.00%, | | | | |
| | 7/01/22 | | 200,000 | | 229,786 |
| | | | | | 28,096,986 |
| | Massachusetts 3.1% | | | | |
| | Massachusetts State Development Finance Agency Revenue, Worcester Polytechnic Institute, | | | | |
| | NATL Insured, 5.00%, 9/01/47 | | 25,050,000 | | 23,234,877 |
| | Massachusetts State GO, Consolidated Loan, Series D, NATL Insured, | | | | |
| | ETM, 5.00%, 8/01/27 | | 3,535,000 | | 3,752,685 |
| Pre | -Refunded, 5.00%, 8/01/27 | | 855,000 | | 907,651 |
| | Massachusetts State Health and Educational Facilities Authority Revenue, | | | | |
| | CareGroup Issue, Refunding, Series A, NATL Insured, 5.00%, 7/01/25 | | 3,880,000 | | 3,659,694 |
| | CareGroup Issue, Series A, NATL Insured, Pre-Refunded, 5.00%, 7/01/25 | | 750,000 | | 835,065 |
| | Central New England Health, Series B, AMBAC Insured, 5.20%, 8/01/28 | | 4,415,000 | | 3,901,403 |
| | Emmanuel College, NATL Insured, 5.00%, 7/01/37 | | 21,685,000 | | 18,277,853 |
| | Harvard Pilgrim Health, Series A, AGMC Insured, 5.00%, 7/01/18 | | 3,000,000 | | 3,000,660 |
| | Simmons College, Series C, NATL Insured, 5.125%, 10/01/28 | | 4,260,000 | | 3,981,098 |
152 | Annual Report
| | | | |
| Franklin Tax-Free Trust | | | | |
| |
| Statement of Investments, February 28, 2011 (continued) | | | | |
| |
| |
| Franklin Insured Tax-Free Income Fund | | Principal Amount | | Value |
| Municipal Bonds (continued) | | | | |
| Massachusetts (continued) | | | | |
| Massachusetts State Water Resources Authority Revenue, Refunding, Series J, AGMC Insured, | | | | |
| 5.00%, 8/01/32 | $ | 16,250,000 | $ | 16,326,212 |
| | | | | 77,877,198 |
| Michigan 9.2% | | | | |
| Birmingham City School District GO, School Building and Site, AGMC Insured, 5.00%, | | | | |
| 11/01/33 | | 8,135,000 | | 8,191,213 |
| Central Michigan University Revenue, Series A, AMBAC Insured, 5.05%, 10/01/32 | | 8,650,000 | | 8,362,820 |
| Detroit City School District GO, School Building and Site Improvement, Series A, AGMC | | | | |
| Insured, Pre-Refunded, 5.125%, 5/01/31 | | 6,500,000 | | 6,848,335 |
| Detroit Public Improvements GO, Series A-1, NATL Insured, 5.00%, 4/01/21 | | 12,390,000 | | 10,659,241 |
| Detroit Sewer Disposal System Revenue, | | | | |
| second lien, Series B, NATL Insured, 5.00%, 7/01/36 | | 15,000,000 | | 13,217,400 |
| senior lien, Refunding, Series A, AGMC Insured, 5.00%, 7/01/32 | | 2,905,000 | | 2,640,935 |
| senior lien, Series A, FGIC Insured, Pre-Refunded, 5.125%, 7/01/31 | | 6,000,000 | | 6,093,360 |
| senior lien, Series B, AGMC Insured, 7.50%, 7/01/33 | | 6,000,000 | | 7,033,260 |
| Detroit Water Supply System Revenue, | | | | |
| second lien, Series B, AGMC Insured, 7.00%, 7/01/36 | | 5,000,000 | | 5,601,600 |
| senior lien, Series A, AGMC Insured, 5.00%, 7/01/34 | | 7,040,000 | | 6,342,054 |
| senior lien, Series A, FGIC Insured, Pre-Refunded, 5.25%, 7/01/33 | | 10,185,000 | | 10,340,729 |
| senior lien, Series A, NATL Insured, 5.00%, 7/01/34 | | 10,150,000 | | 9,214,373 |
| Jackson County Hospital Finance Authority Revenue, W.A. Foote Memorial Hospital, Refunding, | | | | |
| Series C, Assured Guaranty, 5.00%, 6/01/26 | | 15,000,000 | | 15,198,450 |
| Michigan Municipal Bond Authority Revenue, Clean Water State Revolving Fund, NATL Insured, | | | | |
| 5.00%, 10/01/23 | | 5,095,000 | | 5,191,194 |
| Michigan State Building Authority Revenue, Refunding, Series IA, | | | | |
| AGMC Insured, 5.00%, 10/15/36 | | 28,895,000 | | 27,510,641 |
| NATL RE, FGIC Insured, 5.00%, 10/15/36 | | 10,000,000 | | 9,209,500 |
| Michigan State Hospital Finance Authority Revenue, | | | | |
| Hospital, Botsford Obligated Group, Refunding, Series A, NATL Insured, 5.25%, 2/15/22 | | 2,000,000 | | 1,917,940 |
| Oakwood Obligated Group, Refunding, Series A, AGMC Insured, 5.00%, 8/15/31 | | 10,000,000 | | 9,688,500 |
| Sparrow Obligated Group, Refunding, NATL Insured, 5.00%, 11/15/36 | | 13,000,000 | | 11,230,830 |
| St. John’s Hospital, Refunding, Series A, AMBAC Insured, ETM, 6.00%, 5/15/13 | | 1,615,000 | | 1,651,935 |
| Trinity Health Credit Group, Series A, 6.50%, 12/01/33 | | 25,000,000 | | 26,315,250 |
| Michigan State Strategic Fund Limited Obligation Revenue, Detroit Edison Co. Pollution Control | | | | |
| Bonds Project, Refunding, Collateralized Series BB, AMBAC Insured, 7.00%, 5/01/21 | | 250,000 | | 290,082 |
| Michigan State Strategic Fund Resources Recovery Limited Obligation Revenue, Detroit | | | | |
| Education Exempt Facilities, Refunding, Series D, XLCA Insured, 5.25%, 12/15/32 | | 10,000,000 | | 9,684,000 |
| Michigan State Trunk Line Revenue, Series A, AGMC Insured, Pre-Refunded, 5.25%, | | | | |
| 11/01/30 | | 15,000,000 | | 15,482,850 |
| Royal Oak Hospital Finance Authority Hospital Revenue, William Beaumont Hospital, | | | | |
| Series M, NATL Insured, 5.25%, 11/15/31 | | 4,000,000 | | 3,537,320 |
| | | | | 231,453,812 |
| Minnesota 0.6% | | | | |
| Minneapolis and St. Paul Metropolitan Airports Commission Airport Revenue, sub. bond, | | | | |
| Refunding, Series A, AMBAC Insured, 5.00%, 1/01/35 | | 15,000,000 | | 14,142,450 |
Annual Report | 153
| | | | |
| Franklin Tax-Free Trust | | | | |
| |
| Statement of Investments, February 28, 2011 (continued) | | | | |
| |
| |
| Franklin Insured Tax-Free Income Fund | | Principal Amount | | Value |
| Municipal Bonds (continued) | | | | |
| Minnesota (continued) | | | | |
| Minnesota Agricultural and Economic Development Board Revenue, Health Care System, | | | | |
| Refunding, Series A, NATL Insured, 5.75%, 11/15/26 | $ | 180,000 | $ | 180,045 |
| Minnesota State HFAR, Rental Housing, Refunding, Series D, NATL Insured, 6.00%, | | | | |
| 2/01/22 | | 175,000 | | 175,096 |
| | | | | 14,497,591 |
| Mississippi 0.4% | | | | |
| Harrison County Wastewater Management District Revenue, Wastewater Treatment Facilities, | | | | |
| Series A, FGIC Insured, ETM, 8.50%, 2/01/13 | | 200,000 | | 220,160 |
| Mississippi Development Bank Special Obligation Revenue, Municipal Energy Agency, Series A, | | | | |
| XLCA Insured, 5.00%, 3/01/36 | | 10,915,000 | | 9,678,221 |
| | | | | 9,898,381 |
| Missouri 0.8% | | | | |
| Bi-State Development Agency Missouri-Illinois Metropolitan District Mass Transit Sales Tax | | | | |
| Revenue, Metrolink Cross County Extension, Assured Guaranty, 5.00%, 10/01/39 | | 6,000,000 | | 5,901,120 |
| Missouri State Health and Educational Facilities Authority Health Facilities Revenue, St. Luke’s | | | | |
| Health System, Series B, AGMC Insured, 5.50%, 11/15/35 | | 15,000,000 | | 15,054,750 |
| | | | | 20,955,870 |
| Nebraska 0.1% | | | | |
| Lancaster County Hospital Authority Revenue, Bryan Memorial Hospital Project No. 1, NATL | | | | |
| Insured, ETM, 6.70%, 6/01/22 | | 2,500,000 | | 3,061,925 |
| Nevada 1.1% | | | | |
| Clark County GO, Series A, AMBAC Insured, 6.50%, 6/01/17 | | 250,000 | | 296,345 |
| Clark County Passenger Facility Charge Revenue, Las Vegas, McCarran International Airport, | | | | |
| Series A, | | | | |
| AGMC Insured, 5.25%, 7/01/42 | | 5,000,000 | | 4,638,400 |
| Assured Guaranty, 5.25%, 7/01/39 | | 20,000,000 | | 18,794,000 |
| Reno Hospital Revenue, Washoe Medical Center, Refunding, Series C, AGMC Insured, 5.375%, | | | | |
| 6/01/39 | | 5,000,000 | | 4,564,100 |
| | | | | 28,292,845 |
| New Hampshire 0.2% | | | | |
| Manchester General Airport Revenue, General, Refunding, Series A, AGMC Insured, 5.125%, | | | | |
| 1/01/30 | | 6,000,000 | | 5,995,980 |
| New Jersey 2.1% | | | | |
| Essex County Improvement Authority Revenue, Garden State Cancer Center Project, AMBAC | | | | |
| Insured, 6.00%, 12/01/20 | | 2,100,000 | | 2,106,447 |
| Middlesex County COP, NATL Insured, 5.30%, 6/15/29 | | 3,575,000 | | 3,578,003 |
| New Brunswick Parking Authority Revenue, Guaranteed Parking, Series A, NATL Insured, | | | | |
| 5.00%, 9/01/34 | | 1,500,000 | | 1,473,540 |
| New Jersey EDA Revenue, | | | | |
| Motor Vehicle Surcharge Revenue, Series A, NATL Insured, 5.00%, 7/01/29 | | 3,450,000 | | 3,478,152 |
| Motor Vehicle Surcharge Revenue, Series A, NATL Insured, 5.00%, 7/01/34 | | 21,250,000 | | 19,967,350 |
| Municipal Rehabilitation, Series A, AMBAC Insured, 5.00%, 4/01/28 | | 4,000,000 | | 4,002,160 |
154 | Annual Report
| | | | |
| Franklin Tax-Free Trust | | | | |
| |
| Statement of Investments, February 28, 2011 (continued) | | | | |
| |
| |
| Franklin Insured Tax-Free Income Fund | | Principal Amount | | Value |
| Municipal Bonds (continued) | | | | |
| New Jersey (continued) | | | | |
| New Jersey State Transportation Trust Fund Authority Revenue, Transportation System, Series A, | | | | |
| 6.00%, 12/15/38 | $ | 9,620,000 | $ | 10,214,035 |
| Pre-Refunded, 6.00%, 12/15/38 | | 5,380,000 | | 6,717,038 |
| New Jersey State Turnpike Authority Turnpike Revenue, | | | | |
| Refunding, Series C, AMBAC Insured, 6.50%, 1/01/16 | | 50,000 | | 55,876 |
| Series C, AMBAC Insured, ETM, 6.50%, 1/01/16 | | 20,000 | | 22,494 |
| Series C, AMBAC Insured, Pre-Refunded, 6.50%, 1/01/16 | | 230,000 | | 258,676 |
| | | | | 51,873,771 |
| New York 3.5% | | | | |
| MTA Revenue, | | | | |
| Series B, NATL Insured, 5.00%, 11/15/28 | | 20,000,000 | | 19,721,200 |
| Transportation, Series A, AGMC Insured, 5.00%, 11/15/33 | | 20,000,000 | | 19,314,000 |
| MTA Service Contract Revenue, Series B, NATL Insured, 5.00%, 1/01/31 | | 7,000,000 | | 7,003,080 |
| New York City Transitional Finance Authority Revenue, | | | | |
| Future Tax Secured, Series A, NATL RE, FGIC Insured, 5.125%, 8/01/33 | | 14,590,000 | | 14,725,833 |
| Refunding, Series B, NATL Insured, 5.00%, 8/01/32 | | 2,230,000 | | 2,244,473 |
| New York State Dormitory Authority Revenue, Mental Health Services Facilities Improvement, | | | | |
| Series B, NATL Insured, Pre-Refunded, 5.25%, 8/15/31 | | 5,935,000 | | 6,066,994 |
| New York State Dormitory Authority Revenues, | | | | |
| State Supported Debt, Mental Health Services Facilities Improvement, Series B, NATL | | | | |
| Insured, 5.25%, 8/15/31 | | 5,530,000 | | 5,557,595 |
| State Supported Debt, Mental Health Services Facilities Improvement, Series B, NATL | | | | |
| Insured, Pre-Refunded, 5.25%, 8/15/31 | | 3,535,000 | | 3,613,618 |
| Vassar Brothers Hospital, AGMC Insured, 5.375%, 7/01/25 | | 4,000,000 | | 4,011,840 |
| Triborough Bridge and Tunnel Authority Revenues, Refunding, NATL Insured, 5.00%, | | | | |
| 11/15/32 | | 5,000,000 | | 5,006,900 |
| | | | | 87,265,533 |
| North Carolina 0.7% | | | | |
| Raleigh Combined Enterprise System Revenue, 5.00%, 3/01/40 | | 7,915,000 | | 7,983,148 |
| Raleigh-Durham Airport Authority Airport Revenue, Series A, NATL RE, FGIC Insured, | | | | |
| Pre-Refunded, 5.00%, | | | | |
| 11/01/25 | | 5,000,000 | | 5,087,800 |
| 11/01/31 | | 4,000,000 | | 4,070,240 |
| | | | | 17,141,188 |
| North Dakota 1.1% | | | | |
| Cass County Health Facilities Revenue, Health Care, Essentia Obligation, Series D, Assured | | | | |
| Guaranty, 5.00%, 2/15/40 | | 31,970,000 | | 28,698,510 |
| Ohio 2.6% | | | | |
| Akron Income Tax Revenue, Community Learning Centers, Series A, NATL RE, FGIC Insured, | | | | |
| 5.00%, 12/01/33 | | 5,000,000 | | 5,005,950 |
| Cleveland Airport System Revenue, Series A, AGMC Insured, 5.00%, 1/01/31 | | 13,780,000 | | 13,341,107 |
| Jefferson Area Local School District GO, School Facilities Construction and Improvement, | | | | |
| NATL RE, FGIC Insured, 5.00%, 12/01/31 | | 4,085,000 | | 4,092,434 |
Annual Report | 155
| | | | |
| Franklin Tax-Free Trust | | | | |
| |
| Statement of Investments, February 28, 2011 (continued) | | | | |
| |
| |
| Franklin Insured Tax-Free Income Fund | | Principal Amount | | Value |
| Municipal Bonds (continued) | | | | |
| Ohio (continued) | | | | |
| Lucas County Hospital Revenue, ProMedica Healthcare Obligated Group, Refunding, AMBAC | | | | |
| Insured, 5.375%, 11/15/29 | $ | 5,000,000 | $ | 4,864,550 |
| Ohio State Higher Educational Facility Commission Revenue, Summa Health System, 2010 | | | | |
| Project, Refunding, Assured Guaranty, 5.25%, 11/15/40 | | 15,000,000 | | 14,078,250 |
| Olentangy Local School District GO, School Facilities Construction and Improvement, Series A, | | | | |
| FGIC Insured, Pre-Refunded, 5.25%, 12/01/32 | | 11,450,000 | | 12,917,203 |
| Reynoldsburg City School District GO, School Facilities Construction and Improvement, AGMC | | | | |
| Insured, 5.00%, 12/01/31 | | 4,000,000 | | 4,044,600 |
| Springfield City School District GO, FGIC Insured, Pre-Refunded, 5.20%, 12/01/23 | | 3,860,000 | | 4,072,416 |
| Toledo City School District GO, School Facilities Improvement, Series B, NATL RE, FGIC | | | | |
| Insured, 5.00%, 12/01/32 | | 4,000,000 | | 4,033,360 |
| | | | | 66,449,870 |
| Oklahoma 0.0%† | | | | |
| McGee Creek Authority Water Revenue, NATL Insured, 6.00%, 1/01/23 | | 300,000 | | 323,790 |
| Oregon 0.5% | | | | |
| Medford Hospital Facilities Authority Revenue, Asante Health System, Series A, Assured | | | | |
| Guaranty, 5.00%, 8/15/40 | | 4,935,000 | | 4,516,660 |
| Oregon Health and Science University Revenue, | | | | |
| Refunding, Series B, NATL Insured, 5.25%, 7/01/15 | | 460,000 | | 461,270 |
| Series A, NATL Insured, 5.00%, 7/01/32 | | 8,000,000 | | 7,685,120 |
| | | | | 12,663,050 |
| Pennsylvania 4.0% | | | | |
| Allegheny County Sanitary Authority Sewer Revenue, AGMC Insured, 5.00%, | | | | |
| 6/01/25 | | 3,540,000 | | 3,669,670 |
| 6/01/26 | | 5,930,000 | | 6,118,870 |
| Centre County Hospital Authority Revenue, Hospital, Mount Nittany Medical Center Project, | | | | |
| Assured Guaranty, | | | | |
| 5.875%, 11/15/29 | | 1,000,000 | | 1,019,330 |
| 6.125%, 11/15/39 | | 3,000,000 | | 3,033,720 |
| 6.25%, 11/15/44 | | 2,500,000 | | 2,530,100 |
| Delaware River Port Authority Revenue, Series E, AGMC Insured, 5.00%, 1/01/40 | | 15,000,000 | | 14,930,850 |
| Lackawanna County GO, Series B, AGMC Insured, 5.00%, | | | | |
| 9/01/30 | | 8,100,000 | | 7,932,087 |
| 9/01/35 | | 7,500,000 | | 7,095,075 |
| Pennsylvania Convention Center Authority Revenue, Series A, FGIC Insured, ETM, 6.00%, | | | | |
| 9/01/19 | | 500,000 | | 603,270 |
| Pennsylvania State Public School Building Authority Lease Revenue, School District of | | | | |
| Philadelphia Project, Refunding, Series B, AGMC Insured, 4.75%, 6/01/30 | | 6,000,000 | | 5,895,600 |
| Pennsylvania State Turnpike Commission Turnpike Revenue, | | | | |
| Refunding, Series C, Sub Series C-1, Assured Guaranty, 6.25%, 6/01/38 | | 10,000,000 | | 10,582,800 |
| sub. bond, Series A, Assured Guaranty, 5.00%, 6/01/39 | | 10,000,000 | | 9,327,100 |
| Philadelphia Gas Works Revenue, 1998 General Ordinance, Fourth Series, AGMC Insured, | | | | |
| 5.00%, 8/01/32 | | 4,000,000 | | 3,912,400 |
| Philadelphia Water and Wastewater Revenue, | | | | |
| Series A, FGIC Insured, Pre-Refunded, 5.25%, 11/01/24 | | 2,000,000 | | 2,156,600 |
| Series C, AGMC Insured, 5.00%, 8/01/40 | | 7,000,000 | | 6,678,490 |
156 | Annual Report
| | | | |
| Franklin Tax-Free Trust | | | | |
| |
| Statement of Investments, February 28, 2011 (continued) | | | | |
| |
| |
| Franklin Insured Tax-Free Income Fund | | Principal Amount | | Value |
| Municipal Bonds (continued) | | | | |
| Pennsylvania (continued) | | | | |
| Pittsburgh Water and Sewer Authority Revenue, FGIC Insured, ETM, 7.25%, 9/01/14 | $ | 50,000 | $ | 55,955 |
| South Fork Municipal Authority Hospital Revenue, Conemaugh Valley Memorial, Refunding, | | | | |
| Series B, Assured Guaranty, 5.375%, 7/01/35 | | 15,000,000 | | 14,229,150 |
| | | | | 99,771,067 |
| Rhode Island 1.4% | | | | |
| Rhode Island State Clean Water Finance Agency Revenue, Cranston Wastewater Treatment | | | | |
| System, NATL Insured, 5.80%, 9/01/22 | | 7,785,000 | | 7,784,377 |
| Rhode Island State EDC Special Facility Revenue, first lien, Rhode Island Airport Corp. Project, | | | | |
| CIFG Insured, 5.00%, 7/01/31 | | 5,730,000 | | 5,247,591 |
| Rhode Island State Health and Educational Building Corp. Higher Education Facility Revenue, | | | | |
| University of Rhode Island, Auxiliary Enterprise, Series B, AGMC Insured, 5.00%, | | | | |
| 9/15/30 | | 7,535,000 | | 7,557,530 |
| 9/15/35 | | 4,500,000 | | 4,262,625 |
| 9/15/40 | | 10,270,000 | | 9,566,608 |
| Rhode Island State Health and Educational Building Corp. Revenue, Hospital Financing, | | | | |
| Lifespan Obligated Group, Refunding, NATL Insured, 5.75%, 5/15/23 | | 100,000 | | 100,013 |
| | | | | 34,518,744 |
| South Carolina 2.1% | | | | |
| Piedmont Municipal Power Agency Electric Revenue, Refunding, NATL RE, FGIC Insured, | | | | |
| 6.25%, 1/01/21 | | 200,000 | | 229,250 |
| Richland County Hospital Facilities Revenue, Community Provider, Pooled Loan Program, | | | | |
| Series A, AGMC Insured, ETM, 7.125%, 7/01/17 | | 1,735,000 | | 2,028,232 |
| Scago Educational Facilities Corp. for Pickens School District Revenue, Pickens County Project, | | | | |
| AGMC Insured, 5.00%, 12/01/31 | | 17,800,000 | | 17,707,618 |
| South Carolina Jobs EDA Hospital Facilities Revenue, Palmetto Health, Refunding, Series A, | | | | |
| AGMC Insured, 5.00%, 8/01/35 | | 20,000,000 | | 18,588,400 |
| South Carolina Jobs EDA Industrial Revenue, South Carolina Electric and Gas Co. Project, | | | | |
| Series A, AMBAC Insured, 5.20%, 11/01/27 | | 5,000,000 | | 5,071,900 |
| Spartanburg Waterworks Revenue, System, Assured Guaranty, 5.00%, 6/01/39 | | 6,000,000 | | 6,027,720 |
| Woodruff Roebuck Water District Water System Revenue, Improvement, Refunding, AGMC | | | | |
| Insured, 5.00%, 6/01/40 | | 3,000,000 | | 2,981,520 |
| | | | | 52,634,640 |
| South Dakota 0.3% | | | | |
| Brookings COP, Refunding, AMBAC Insured, 5.10%, 12/01/18 | | 5,000,000 | | 4,943,000 |
| South Dakota Lease Revenue, Series A, AGMC Insured, 6.75%, 12/15/16 | | 1,920,000 | | 2,139,456 |
| | | | | 7,082,456 |
| Tennessee 0.5% | | | | |
| Johnson City Health and Educational Facilities Board Hospital Revenue, | | | | |
| Medical Center Hospital, Refunding and Improvement, NATL Insured, ETM, 5.25%, | | | | |
| 7/01/28 | | 8,500,000 | | 8,510,030 |
| Series A, NATL Insured, Pre-Refunded, 5.125%, 7/01/25 | | 2,780,000 | | 2,785,671 |
| | | | | 11,295,701 |
Annual Report | 157
| | | | |
| Franklin Tax-Free Trust | | | | |
| |
| Statement of Investments, February 28, 2011 (continued) | | | | |
| |
| |
| Franklin Insured Tax-Free Income Fund | | Principal Amount | | Value |
| Municipal Bonds (continued) | | | | |
| Texas 6.0% | | | | |
| Austin Water and Wastewater System Revenue, | | | | |
| AGMC Insured, Pre-Refunded, 5.125%, 5/15/27 | $ | 9,800,000 | $ | 9,894,374 |
| AGMC Insured, Pre-Refunded, 5.25%, 5/15/31 | | 4,930,000 | | 4,978,708 |
| Refunding, AGMC Insured, 5.125%, 5/15/27 | | 1,325,000 | | 1,328,352 |
| Refunding, AGMC Insured, 5.25%, 5/15/31 | | 70,000 | | 70,078 |
| Coastal Bend Health Facilities Development Corp. Revenue, Series B, AMBAC Insured, ETM, | | | | |
| 6.30%, 1/01/17 | | 7,255,000 | | 8,095,782 |
| Dallas-Fort Worth International Airport Revenue, | | | | |
| Joint, Series A, NATL RE, FGIC Insured, 6.00%, 11/01/21 | | 2,210,000 | | 2,214,354 |
| Refunding and Improvement, Joint, Series A, NATL RE, FGIC Insured, 5.625%, | | | | |
| 11/01/21 | | 12,000,000 | | 12,166,920 |
| Greenville Electric Utility System Revenue, Greenville, AGMC Insured, 5.00%, 2/15/40 | | 5,825,000 | | 5,659,978 |
| Harris County Hospital District Revenue, senior lien, Refunding, Series A, NATL Insured, | | | | |
| 5.25%, 2/15/37 | | 10,250,000 | | 9,405,605 |
| Harris County Houston Sports Authority Revenue, senior lien, Series G, NATL Insured, 5.25%, | | | | |
| 11/15/30 | | 21,325,000 | | 19,014,436 |
| Laredo ISD Public Facility Corp. Lease Revenue, Series C, AMBAC Insured, 5.00%, 8/01/29 | | 1,000,000 | | 1,000,270 |
| Matagorda County Navigation District No. 1 Revenue, Houston Industries Inc. Project, | | | | |
| Refunding, | | | | |
| Series A, NATL Insured, 5.25%, 11/01/29 | | 3,185,000 | | 2,721,073 |
| Series B, NATL Insured, 5.15%, 11/01/29 | | 2,750,000 | | 2,483,745 |
| North Fort Bend Water Authority Water System Revenue, Assured Guaranty, 5.25%, | | | | |
| 12/15/34 | | 20,000,000 | | 20,378,800 |
| North Harris County Regional Water Authority Revenue, senior lien, NATL RE, FGIC Insured, | | | | |
| 5.00%, 12/15/33 | | 10,000,000 | | 9,878,700 |
| Palestine ISD, GO, School Building, Assured Guaranty, 5.50%, 2/15/39 | | 12,530,000 | | 12,829,217 |
| Pflugerville GO, NATL RE, FGIC Insured, Pre-Refunded, | | | | |
| 5.25%, 8/01/27 | | 3,320,000 | | 3,540,979 |
| 5.20%, 8/01/32 | | 3,000,000 | | 3,197,580 |
| Port Neches-Groves ISD, GO, School Building, Assured Guaranty, 5.00%, 2/15/34 | | 11,375,000 | | 11,328,590 |
| San Antonio Airport System Revenue, Improvement Sub Lien Passenger Facility Charge, | | | | |
| Refunding, AGMC Insured, 5.375%, 7/01/40 | | 5,000,000 | | 4,988,600 |
| Tarrant County Health Facilities Development Corp. Health Systems Revenue, Harris Methodist | | | | |
| Health System, NATL Insured, ETM, 6.00%, 9/01/24 | | 3,250,000 | | 3,941,113 |
| United ISD, GO, PSF Guarantee, 5.125%, 8/15/26 | | 3,000,000 | | 3,052,530 |
| | | | | 152,169,784 |
| Utah 0.0%† | | | | |
| Provo Electric System Revenue, Series A, AMBAC Insured, ETM, 10.375%, 9/15/15 | | 30,000 | | 36,573 |
| Virginia 0.7% | | | | |
| Chesterfield County EDA Revenue, Bon Secours Health, Series C-2, Assured Guaranty, 5.00%, | | | | |
| 11/01/42 | | 8,000,000 | | 7,413,920 |
| Front Royal and Warren County IDA Lease Revenue, School and Capital Improvement, Series B, | | | | |
| AGMC Insured, 5.00%, 4/01/35 | | 5,000,000 | | 5,001,200 |
| Middle River Regional Jail Authority Jail Facility Revenue, NATL Insured, 5.00%, 5/15/28 | | 3,510,000 | | 3,573,566 |
158 | Annual Report
| | | | |
| Franklin Tax-Free Trust | | | | |
| |
| Statement of Investments, February 28, 2011 (continued) | | | | |
| |
| |
| Franklin Insured Tax-Free Income Fund | | Principal Amount | | Value |
| Municipal Bonds (continued) | | | | |
| Virginia (continued) | | | | |
| Winchester IDA Educational Facilities Revenue, first mortgage, Shenandoah University Project, | | | | |
| NATL Insured, | | | | |
| 5.00%, 10/01/18 | $ | 1,000,000 | $ | 1,002,060 |
| 5.25%, 10/01/28 | | 1,420,000 | | 1,348,063 |
| | | | | 18,338,809 |
| Washington 2.1% | | | | |
| King County Sewer Revenue, Refunding, | | | | |
| Second Series, AGMC Insured, 5.00%, 1/01/36 | | 5,000,000 | | 4,992,600 |
| Series A, NATL RE, FGIC Insured, 5.00%, 1/01/35 | | 6,420,000 | | 6,422,375 |
| Snohomish County PUD No. 1 Electric Revenue, Generation System, FGIC Insured, ETM, | | | | |
| 6.65%, 1/01/16 | | 4,250,000 | | 4,933,528 |
| Washington State Health Care Facilities Authority Revenue, | | | | |
| MultiCare Health System, Series B, Assured Guaranty, 6.00%, 8/15/39 | | 1,500,000 | | 1,547,025 |
| Providence Health and Services, Refunding, Series D, AGMC Insured, 5.25%, 10/01/33 | | 18,000,000 | | 18,050,760 |
| Series B, NATL Insured, 5.00%, 2/15/27 | | 5,895,000 | | 5,233,640 |
| Swedish Health Services, Refunding, AMBAC Insured, 5.50%, 11/15/28 | | 13,000,000 | | 12,598,690 |
| | | | | 53,778,618 |
| West Virginia 0.5% | | | | |
| Shepherd University Board of Governors Revenue, Residence Facilities Projects, NATL Insured, | | | | |
| 5.00%, 6/01/35 | | 7,445,000 | | 7,200,730 |
| West Virginia State Water Development Authority Water Development Revenue, Loan Program II, | | | | |
| Refunding, Series C-II, NATL RE, FGIC Insured, 5.00%, 11/01/36 | | 5,000,000 | | 4,703,800 |
| | | | | 11,904,530 |
| Wisconsin 1.8% | | | | |
| Superior Limited Obligation Revenue, Midwest Energy Resources, Refunding, Series E, NATL | | | | |
| RE, FGIC Insured, 6.90%, 8/01/21 | | 3,000,000 | | 3,682,980 |
| Wisconsin State General Fund Annual Appropriation Revenue, Series A, 6.00%, 5/01/36 | | 20,000,000 | | 21,215,200 |
| Wisconsin State Health and Educational Facilities Authority Revenue, Aurora Medical Group | | | | |
| Incorporate Project, AGMC Insured, 5.75%, 11/15/25 | | 20,950,000 | | 20,971,788 |
| | | | | 45,869,968 |
| U.S. Territories 2.9% | | | | |
| Puerto Rico 2.0% | | | | |
| Puerto Rico Commonwealth Aqueduct and Sewer Authority Revenue, senior lien, Series A, | | | | |
| Assured Guaranty, 5.125%, 7/01/47 | | 10,000,000 | | 9,192,800 |
| Puerto Rico Commonwealth Highway and Transportation Authority Highway Revenue, | | | | |
| Refunding, Series CC, AGMC Insured, 5.25%, | | | | |
| 7/01/32 | | 5,000,000 | | 4,819,450 |
| 7/01/36 | | 8,870,000 | | 8,294,337 |
| Puerto Rico Sales Tax FICO Sales Tax Revenue, first sub., | | | | |
| Series A, Assured Guaranty, 5.00%, 8/01/40 | | 10,000,000 | | 9,261,000 |
| Series C, AGMC Insured, 5.125%, 8/01/42 | | 20,000,000 | | 18,574,000 |
| | | | | 50,141,587 |
Annual Report | 159
| | | | |
| Franklin Tax-Free Trust | | | | |
| |
| Statement of Investments, February 28, 2011 (continued) | | | | |
| |
| |
| Franklin Insured Tax-Free Income Fund | | Principal Amount | | Value |
| Municipal Bonds (continued) | | | | |
| U.S. Territories (continued) | | | | |
| U.S. Virgin Islands 0.9% | | | | |
| Virgin Islands PFAR, Matching Fund Loan Note, senior lien, AGMC Insured, 5.00%, | | | | |
| 10/01/29 | $ | 23,000,000 | $ | 22,455,360 |
| Total U.S. Territories | | | | 72,596,947 |
| Total Municipal Bonds before Short Term Investments | | | | |
| (Cost $2,572,968,648) | | | | 2,497,474,272 |
| Short Term Investments 0.2% | | | | |
| Municipal Bonds 0.2% | | | | |
| California 0.1% | | | | |
| aLos Angeles Department of Water and Power Revenue, Refunding, Series B, Sub-Series B-3, | | | | |
| Daily VRDN and Put, 0.23%, 7/01/34 | | 3,100,000 | | 3,100,000 |
| Florida 0.0%† | | | | |
| aFlorida State Municipal Power Agency Revenue, All Requirements Power Supply Project, | | | | |
| Refunding, Series C, Daily VRDN and Put, 0.26%, 10/01/35 | | 400,000 | | 400,000 |
| Ohio 0.1% | | | | |
| aCuyahoga County Revenue, Cleveland Clinic Health System Obligated Group, Series B, | | | | |
| Sub Series B-1, Daily VRDN and Put, 0.18%, 1/01/39 | | 2,120,000 | | 2,120,000 |
| Total Short Term Investments (Cost $5,620,000) | | | | 5,620,000 |
| Total Investments (Cost $2,578,588,648) 99.0% | | | | 2,503,094,272 |
| Other Assets, less Liabilities 1.0% | | | | 24,207,497 |
| Net Assets 100.0% | | | $ | 2,527,301,769 |
| |
| |
| See Abbreviations on page 206. | | | | |
| |
| †Rounds to less than 0.1% of net assets. | | | | |
| aVariable rate demand notes (VRDNs) are tax-exempt obligations which contain a floating or variable interest rate adjustment formula and an unconditional right of demand to |
| receive payment of the principal balance plus accrued interest at specified dates. The coupon rate shown represents the rate at period end. | | |
| |
| |
| |
| |
| 160 | The accompanying notes are an integral part of these financial statements. | | | Annual Report | | |
| | | | | | | | | | | | | | | |
| Franklin Tax-Free Trust | | | | | | | | | | | | | |
| |
| Financial Highlights | | | | | | | | | | | | | | | |
| |
| Franklin Massachusetts Tax-Free Income Fund | | | | | | | | | | | | | |
| | | | | | Year Ended February 28, | | | | |
| Class A | | 2011 | | | 2010 | | | 2009 | | | 2008 | a | | 2007 | |
| Per share operating performance | | | | | | | | | | | | | | | |
| (for a share outstanding throughout the year) | | | | | | | | | | | | | | | |
| Net asset value, beginning of year | $ | 11.60 | | $ | 10.94 | | $ | 11.20 | | $ | 11.96 | | $ | 11.92 | |
| Income from investment operationsb: | | | | | | | | | | | | | | | |
| Net investment incomec | | 0.47 | | | 0.49 | | | 0.49 | | | 0.49 | | | 0.49 | |
| Net realized and unrealized gains (losses) | | (0.46 | ) | | 0.66 | | | (0.27 | ) | | (0.76 | ) | | 0.04 | |
| Total from investment operations | | 0.01 | | | 1.15 | | | 0.22 | | | (0.27 | ) | | 0.53 | |
| Less distributions from: | | | | | | | | | | | | | | | |
| Net investment income | | (0.48 | ) | | (0.49 | ) | | (0.48 | ) | | (0.49 | ) | | (0.49 | ) |
| Net realized gains | | (0.02 | ) | | — | | | — | | | (—)d | | | — | |
| Total distributions | | (0.50 | ) | | (0.49 | ) | | (0.48 | ) | | (0.49 | ) | | (0.49 | ) |
| Redemption feese | | — | | | — | | | —d | | | —d | | | —d | |
| Net asset value, end of year | $ | 11.11 | | $ | 11.60 | | $ | 10.94 | | $ | 11.20 | | $ | 11.96 | |
| |
| Total returnf | | 0.01 | % | | 10.66 | % | | 2.00 | % | | (2.34 | )% | | 4.59 | % |
| |
| Ratios to average net assets | | | | | | | | | | | | | | | |
| Expenses | | 0.66 | % | | 0.67 | % | | 0.66 | % | | 0.66 | % | | 0.66 | % |
| Net investment income | | 4.06 | % | | 4.27 | % | | 4.38 | % | | 4.16 | % | | 4.16 | % |
| |
| Supplemental data | | | | | | | | | | | | | | | |
| Net assets, end of year (000’s) | $ | 439,506 | | $ | 494,372 | | $ | 445,680 | | $ | 450,957 | | $ | 467,299 | |
| Portfolio turnover rate | | 18.65 | % | | 6.61 | % | | 7.45 | % | | 22.03 | % | | 14.41 | % |
| |
| |
| aFor the year ended February 29. | | | | | | | | | | | | | | | |
| bThe amount shown for a share outstanding throughout the period may not correlate with the Statement of Operations for the period due to the timing of sales and repurchases of | |
| the Fund shares in relation to income earned and/or fluctuating market value of the investments of the Fund. | | | | | | | | | | | | | |
| cBased on average daily shares outstanding. | | | | | | | | | | | | | | | |
| dAmount rounds to less than $0.01 per share. | | | | | | | | | | | | | | | |
| eEffective September 1, 2008, the redemption fee was eliminated. | | | | | | | | | | | | | |
| fTotal return does not reflect sales commissions or contingent deferred sales charges, if applicable. | | | | | | | | | | | | | |
| |
| |
| |
| |
| Annual Report | | | The accompanying notes are an integral part of these financial statements. | 161 | |
| | | | | | | | | | | | | | | |
| Franklin Tax-Free Trust | | | | | | | | | | | | | | | |
| |
| Financial Highlights (continued) | | | | | | | | | | | | | | | |
| |
| Franklin Massachusetts Tax-Free Income Fund | | | | | | | | | | | | | | | |
| | | | | | Year Ended February 28, | | | | |
| Class C | | 2011 | | | 2010 | | | 2009 | | | 2008 | a | | 2007 | |
| Per share operating performance | | | | | | | | | | | | | | | |
| (for a share outstanding throughout the year) | | | | | | | | | | | | | | | |
| Net asset value, beginning of year | $ | 11.70 | | $ | 11.03 | | $ | 11.29 | | $ | 12.05 | | $ | 12.00 | |
| Income from investment operationsb: | | | | | | | | | | | | | | | |
| Net investment incomec | | 0.41 | | | 0.43 | | | 0.43 | | | 0.43 | | | 0.43 | |
| Net realized and unrealized gains (losses) | | (0.46 | ) | | 0.66 | | | (0.27 | ) | | (0.76 | ) | | 0.05 | |
| Total from investment operations | | (0.05 | ) | | 1.09 | | | 0.16 | | | (0.33 | ) | | 0.48 | |
| Less distributions from: | | | | | | | | | | | | | | | |
| Net investment income | | (0.41 | ) | | (0.42 | ) | | (0.42 | ) | | (0.43 | ) | | (0.43 | ) |
| Net realized gains | | (0.02 | ) | | — | | | — | | | (—)d | | | — | |
| Total distributions | | (0.43 | ) | | (0.42 | ) | | (0.42 | ) | | (0.43 | ) | | (0.43 | ) |
| Redemption feese | | — | | | — | | | —d | | | —d | | | —d | |
| Net asset value, end of year | $ | 11.22 | | $ | 11.70 | | $ | 11.03 | | $ | 11.29 | | $ | 12.05 | |
| |
| Total returnf | | (0.47 | )% | | 10.06 | % | | 1.42 | % | | (2.86 | )% | | 4.07 | % |
| |
| Ratios to average net assets | | | | | | | | | | | | | | | |
| Expenses | | 1.21 | % | | 1.22 | % | | 1.20 | % | | 1.22 | % | | 1.20 | % |
| Net investment income | | 3.51 | % | | 3.72 | % | | 3.84 | % | | 3.60 | % | | 3.62 | % |
| |
| Supplemental data | | | | | | | | | | | | | | | |
| Net assets, end of year (000’s) | $ | 83,046 | | $ | 83,397 | | $ | 68,027 | | $ | 61,157 | | $ | 59,247 | |
| Portfolio turnover rate | | 18.65 | % | | 6.61 | % | | 7.45 | % | | 22.03 | % | | 14.41 | % |
| |
| |
| aFor the year ended February 29. | | | | | | | | | | | | | | | |
| bThe amount shown for a share outstanding throughout the period may not correlate with the Statement of Operations for the period due to the timing of sales and repurchases of | |
| the Fund shares in relation to income earned and/or fluctuating market value of the investments of the Fund. | | | | | | | | | | | | | |
| cBased on average daily shares outstanding. | | | | | | | | | | | | | | | |
| dAmount rounds to less than $0.01 per share. | | | | | | | | | | | | | | | |
| eEffective September 1, 2008, the redemption fee was eliminated. | | | | | | | | | | | | | | | |
| fTotal return does not reflect sales commissions or contingent deferred sales charges, if applicable. | | | | | | | | | | | | | |
| |
| |
| |
| |
| 162 | The accompanying notes are an integral part of these financial statements. | Annual Report | | | | | | | |
| | | | | | |
| Franklin Tax-Free Trust | | | | |
| |
| Financial Highlights (continued) | | | | | | |
| |
| Franklin Massachusetts Tax-Free Income Fund | | | | |
| | | Year Ended February 28, | |
| Advisor Class | | 2011 | | | 2010 | a |
| Per share operating performance | | | | | | |
| (for a share outstanding throughout the year) | | | | | | |
| Net asset value, beginning of year | $ | 11.60 | | $ | 11.08 | |
| Income from investment operationsb: | | | | | | |
| Net investment incomec | | 0.48 | | | 0.33 | |
| Net realized and unrealized gains (losses) | | (0.46 | ) | | 0.52 | |
| Total from investment operations | | 0.02 | | | 0.85 | |
| Less distributions from: | | | | | | |
| Net investment income | | (0.49 | ) | | (0.33 | ) |
| Net realized gains | | (0.02 | ) | | — | |
| Total distributions | | (0.51 | ) | | (0.33 | ) |
| Net asset value, end of year | $ | 11.11 | | $ | 11.60 | |
| |
| Total returnd | | 0.12 | % | | 7.69 | % |
| |
| Ratios to average net assetse | | | | | | |
| Expenses | | 0.56 | % | | 0.57 | % |
| Net investment income | | 4.16 | % | | 4.37 | % |
| |
| Supplemental data | | | | | | |
| Net assets, end of year (000’s) | $ | 4,007 | | $ | 4,012 | |
| Portfolio turnover rate | | 18.65 | % | | 6.61 | % |
| |
| |
| aFor the period July 1, 2009 (effective date) to February 28, 2010. | | | | |
| bThe amount shown for a share outstanding throughout the period may not correlate with the Statement of Operations for the period due to the timing of sales and repurchases of | |
| the Fund shares in relation to income earned and/or fluctuating market value of the investments of the Fund. | | | | |
| cBased on average daily shares outstanding. | | | | | | |
| dTotal return is not annualized for periods less than one year. | | | | | | |
| eRatios are annualized for periods less than one year. | | | | | | |
| |
| |
| |
| |
| Annual Report | | | The accompanying notes are an integral part of these financial statements. | 163 | |
| | | | |
| Franklin Tax-Free Trust | | | | |
| |
| Statement of Investments, February 28, 2011 | | | | |
| |
| |
| Franklin Massachusetts Tax-Free Income Fund | | Principal Amount | | Value |
| Municipal Bonds 99.3% | | | | |
| Massachusetts 98.5% | | | | |
| Auburn GO, AMBAC Insured, 5.125%, 6/01/24 | $ | 1,465,000 | $ | 1,572,707 |
| Boston Convention Center Act of 1997 Revenue, Special Obligation, Series A, AMBAC Insured, | | | | |
| 5.00%, 5/01/27 | | 3,970,000 | | 4,000,013 |
| Boston GO, Series A, NATL Insured, Pre-Refunded, 5.00%, | | | | |
| 2/01/21 | | 3,000,000 | | 3,125,640 |
| 2/01/22 | | 2,940,000 | | 3,063,127 |
| Dudley-Charlton Regional School District GO, Series B, NATL RE, FGIC Insured, 5.25%, | | | | |
| 5/01/19 | | 3,140,000 | | 3,565,187 |
| Holyoke Gas and Electric Department Revenue, Series A, NATL Insured, 5.00%, 12/01/26 | | 9,805,000 | | 9,452,216 |
| Lowell GO, State Qualified, AMBAC Insured, Pre-Refunded, 5.00%, | | | | |
| 2/01/21 | | 1,330,000 | | 1,398,961 |
| 2/01/22 | | 1,405,000 | | 1,477,849 |
| Martha’s Vineyard Land Bank Revenue, AMBAC Insured, | | | | |
| 4.875%, 5/01/22 | | 2,000,000 | | 2,054,560 |
| 5.00%, 5/01/34 | | 7,000,000 | | 6,905,010 |
| Massachusetts Bay Transportation Authority Revenue, General Transportation System, Series C, | | | | |
| NATL RE, FGIC Insured, 5.25%, 3/01/15 | | 2,000,000 | | 2,268,100 |
| Massachusetts Bay Transportation Authority Sales Tax Revenue, senior bond, | | | | |
| Refunding, Series A, 5.25%, 7/01/29 | | 10,000,000 | | 11,021,200 |
| Refunding, Series A, 5.25%, 7/01/31 | | 3,725,000 | | 4,037,118 |
| Refunding, Series A, 5.25%, 7/01/33 | | 5,000,000 | | 5,341,450 |
| Series A, FGIC Insured, Pre-Refunded, 5.00%, 7/01/27 | | 5,000,000 | | 5,300,100 |
| Massachusetts Educational Financing Authority Education Loan Revenue, | | | | |
| Issue I, Refunding, Series A, 5.50%, 1/01/22 | | 3,000,000 | | 3,140,670 |
| Series I, 6.00%, 1/01/28 | | 11,495,000 | | 11,973,192 |
| Massachusetts State College Building Authority Project Revenue, | | | | |
| Refunding, Series A, XLCA Insured, 5.00%, 5/01/43 | | 2,000,000 | | 1,993,520 |
| Refunding, Series B, XLCA Insured, 5.50%, 5/01/39 | | 5,000,000 | | 5,289,050 |
| Series 1, NATL Insured, ETM, 5.375%, 5/01/23 | | 5,000,000 | | 5,032,650 |
| Series A, Assured Guaranty, 5.00%, 5/01/33 | | 10,000,000 | | 10,083,200 |
| Series B, 5.00%, 5/01/40 | | 4,625,000 | | 4,486,620 |
| Massachusetts State Department of Transportation Metropolitan Highway System Revenue, | | | | |
| Contract Assistance, Series B, 5.00%, 1/01/35 | | 27,000,000 | | 27,112,860 |
| Massachusetts State Development Finance Agency Revenue, | | | | |
| Boston University, Series T-1, AMBAC Insured, 5.00%, 10/01/35 | | 3,600,000 | | 3,461,976 |
| Boston University, Series T-1, AMBAC Insured, 5.00%, 10/01/39 | | 24,305,000 | | 22,762,119 |
| Brandeis University, Series K, NATL RE, FGIC Insured, 4.75%, 10/01/28 | | 2,000,000 | | 1,985,800 |
| Brandeis University, Series N, 5.00%, 10/01/39 | | 5,000,000 | | 4,675,750 |
| Massachusetts College of Pharmacy and Allied Health Sciences, Series E, Assured Guaranty, | | | | |
| 5.00%, 7/01/31 | | 5,000,000 | | 4,974,400 |
| Massachusetts College of Pharmacy and Allied Health Sciences, Series E, Assured Guaranty, | | | | |
| 5.00%, 7/01/37 | | 5,060,000 | | 4,831,642 |
| Massachusetts/Saltonstall Redevelopment Building Corp., Series A, NATL Insured, 5.125%, | | | | |
| 2/01/34 | | 22,400,000 | | 19,949,664 |
| Series A, AMBAC Insured, Pre-Refunded, 5.375%, 1/01/42 | | 4,000,000 | | 4,204,480 |
| Series A, GNMA Secured, Pre-Refunded, 6.90%, 10/20/41 | | 2,090,000 | | 2,280,127 |
| Series P, NATL Insured, 4.75%, 7/01/42 | | 11,000,000 | | 10,351,110 |
| Western New England College, Refunding, Series A, Assured Guaranty, 5.00%, 9/01/33 | | 12,200,000 | | 11,676,010 |
164 | Annual Report
| | | | |
| Franklin Tax-Free Trust | | | | |
| |
| Statement of Investments, February 28, 2011 (continued) | | | | |
| |
| |
| Franklin Massachusetts Tax-Free Income Fund | | Principal Amount | | Value |
| Municipal Bonds (continued) | | | | |
| Massachusetts (continued) | | | | |
| Massachusetts State Development Finance Agency Revenue, (continued) | | | | |
| WGBH Educational Foundation, Refunding, Series A, Assured Guaranty, 5.00%, 1/01/36 | $ | 15,945,000 | $ | 15,192,237 |
| Worcester Polytechnic Institute, Refunding, NATL Insured, 5.00%, 9/01/37 | | 12,850,000 | | 12,322,122 |
| Massachusetts State GO, | | | | |
| Consolidated Loan, Series A, AGMC Insured, Pre-Refunded, 5.00%, 3/01/24 | | 5,000,000 | | 5,684,350 |
| Consolidated Loan, Series C, AMBAC Insured, 5.00%, 8/01/37 | | 10,000,000 | | 10,037,600 |
| Consolidated Loan, Series C, FGIC Insured, Pre-Refunded, 5.25%, 11/01/30 | | 6,205,000 | | 6,669,320 |
| Consolidated Loan, Series D, NATL Insured, ETM, 5.00%, 8/01/27 | | 3,430,000 | | 3,641,219 |
| Consolidated Loan, Series D, NATL Insured, Pre-Refunded, 5.00%, 8/01/27 | | 965,000 | | 1,024,425 |
| NATL Insured, Pre-Refunded, 5.00%, 8/01/22 | | 4,100,000 | | 4,346,492 |
| Series C, FGIC Insured, Pre-Refunded, 5.25%, 11/01/30 | | 3,440,000 | | 3,697,415 |
| Massachusetts State Health and Educational Facilities Authority Revenue, | | | | |
| Boston College, Series N, NATL Insured, 5.125%, 6/01/33 | | 5,000,000 | | 5,027,450 |
| Cable Housing and Health Services, Series A, NATL Insured, 5.25%, 7/01/23 | | 1,000,000 | | 951,110 |
| Cape Cod Healthcare Obligation, Assured Guaranty, 6.00%, 11/15/28 | | 3,000,000 | | 3,213,660 |
| Cape Cod Healthcare Obligation, Assured Guaranty, 5.125%, 11/15/35 | | 3,150,000 | | 2,979,018 |
| Children’s Hospital, Series M, 5.25%, 12/01/39 | | 7,000,000 | | 6,907,320 |
| Clark Art Institute, 5.00%, 7/01/40 | | 10,000,000 | | 10,006,700 |
| Emmanuel College, NATL Insured, 5.00%, 7/01/37 | | 10,000,000 | | 8,428,800 |
| Harvard University, Series FF, 5.125%, 7/15/37 | | 1,350,000 | | 1,358,681 |
| Harvard University, Series FF, Pre-Refunded, 5.125%, 7/15/37 | | 300,000 | | 319,044 |
| Lesley University, Series A, Assured Guaranty, 5.25%, 7/01/39 | | 9,350,000 | | 9,267,533 |
| New England Medical Center Hospital, Series H, FGIC Insured, Pre-Refunded, 5.00%, | | | | |
| 5/15/22 | | 390,000 | | 411,017 |
| Partners Healthcare, Refunding, Series J1, 5.00%, 7/01/39 | | 4,345,000 | | 3,976,501 |
| Southcoast Health System Obligated Group, Series D, 5.00%, 7/01/39 | | 5,500,000 | | 4,814,040 |
| University of Massachusetts, Series C, NATL RE, FGIC Insured, 5.125%, 10/01/34 | | 3,000,000 | | 3,004,590 |
| University of Massachusetts, Worcester Campus, Series B, FGIC Insured, Pre-Refunded, | | | | |
| 5.25%, 10/01/31 | | 3,500,000 | | 3,598,490 |
| University of Massachusetts Project, Series C, NATL Insured, Pre-Refunded, 5.25%, | | | | |
| 10/01/31 | | 1,500,000 | | 1,609,110 |
| Wheelock College, Series B, NATL Insured, Pre-Refunded, 5.625%, 10/01/30 | | 1,770,000 | | 1,823,631 |
| Massachusetts State HFA, MFHR, Section 8 Assisted, Series A, ETM, 7.00%, 4/01/21 | | 430,000 | | 561,726 |
| Massachusetts State HFA Housing Revenue, | | | | |
| Series C, 5.125%, 12/01/39 | | 1,700,000 | | 1,596,657 |
| Series C, 5.35%, 12/01/49 | | 4,500,000 | | 4,275,405 |
| Series D, 5.05%, 6/01/40 | | 5,000,000 | | 4,858,250 |
| Massachusetts State Port Authority Revenue, | | | | |
| Series A, AGMC Insured, 4.50%, 7/01/32 | | 5,590,000 | | 5,338,562 |
| Series A, AGMC Insured, 4.50%, 7/01/37 | | 7,935,000 | | 7,281,156 |
| Series A, AMBAC Insured, 5.00%, 7/01/35 | | 12,000,000 | | 11,899,080 |
| US Airways Project, NATL Insured, 6.00%, 9/01/21 | | 4,700,000 | | 4,384,442 |
| US Airways Project, Series A, NATL Insured, 5.875%, 9/01/23 | | 4,500,000 | | 4,027,680 |
| Massachusetts State School Building Authority Dedicated Sales Tax Revenue, Series A, AMBAC | | | | |
| Insured, | | | | |
| 4.75%, 8/15/32 | | 15,000,000 | | 15,032,700 |
| 4.50%, 8/15/35 | | 8,700,000 | | 8,082,822 |
Annual Report | 165
| | | | |
| Franklin Tax-Free Trust | | | | |
| |
| Statement of Investments, February 28, 2011 (continued) | | | | |
| |
| |
| Franklin Massachusetts Tax-Free Income Fund | | Principal Amount | | Value |
| Municipal Bonds (continued) | | | | |
| Massachusetts (continued) | | | | |
| Massachusetts State Special Obligation Dedicated Tax Revenue, | | | | |
| FGIC Insured, Pre-Refunded, 5.25%, 1/01/29 | $ | 5,000,000 | $ | 5,567,200 |
| Refunding, NATL RE, FGIC Insured, 5.50%, 1/01/25 | | 15,900,000 | | 17,249,115 |
| Refunding, NATL RE, FGIC Insured, 5.50%, 1/01/34 | | 16,900,000 | | 17,118,855 |
| Massachusetts State Water Pollution Abatement Trust Revenue, Pool Program Bonds, | | | | |
| Series 6, 5.50%, 8/01/30 | | 2,620,000 | | 2,640,619 |
| Series 7, 5.125%, 2/01/31 | | 4,300,000 | | 4,314,706 |
| Series 7, Pre-Refunded, 5.125%, 2/01/31 | | 1,700,000 | | 1,731,739 |
| Massachusetts State Water Pollution Abatement Trust Water Pollution Abatement Revenue, | | | | |
| MWRA Program, Refunding, Sub Series A, 5.75%, 8/01/29 | | 250,000 | | 250,650 |
| Massachusetts State Water Resources Authority Revenue, | | | | |
| Refunding, Series J, AGMC Insured, 5.00%, 8/01/32 | | 9,000,000 | | 9,042,210 |
| Series A, AGMC Insured, 4.50%, 8/01/46 | | 5,325,000 | | 4,795,589 |
| Monson GO, AMBAC Insured, 5.25%, 11/01/23 | | 1,675,000 | | 1,791,446 |
| Plymouth County COP, Correctional Facility Project, Refunding, AMBAC Insured, 5.125%, | | | | |
| 10/01/18 | | 2,000,000 | | 2,005,080 |
| Salisbury GO, NATL Insured, Pre-Refunded, 5.30%, 3/15/27 | | 2,795,000 | | 2,964,209 |
| Shrewsbury GO, Municipal Purpose Loan, Pre-Refunded, 5.00%, 8/15/20 | | 2,075,000 | | 2,139,346 |
| Springfield GO, State Qualified Municipal Purpose Loan, AGMC Insured, 4.50%, 8/01/26 | | 2,000,000 | | 2,011,280 |
| Springfield Water and Sewer Commission Revenue, Series A, AMBAC Insured, Pre-Refunded, | | | | |
| 5.00%, 11/01/21 | | 2,775,000 | | 2,889,330 |
| University of Massachusetts Building Authority Project Revenue, Senior Series 1, AMBAC | | | | |
| Insured, Pre-Refunded, 5.25%, | | | | |
| 11/01/23 | | 2,155,000 | | 2,406,359 |
| 11/01/28 | | 5,035,000 | | 5,622,283 |
| 11/01/29 | | 3,000,000 | | 3,438,510 |
| Whitman Hanson Regional School District GO, Refunding, NATL RE, FGIC Insured, 5.00%, | | | | |
| 6/15/21 | | 1,960,000 | | 1,988,851 |
| Winthrop GO, AMBAC Insured, 5.00%, 11/01/20 | | 1,230,000 | | 1,255,215 |
| Worcester GO, Assured Guaranty, 5.00%, 11/01/37 | | 5,130,000 | | 5,047,971 |
| | | | | 518,768,996 |
| U.S. Territories 0.8% | | | | |
| Puerto Rico 0.8% | | | | |
| Puerto Rico Commonwealth Aqueduct and Sewer Authority Revenue, senior lien, Series A, | | | | |
| Assured Guaranty, 5.00%, 7/01/28 | | 4,000,000 | | 3,869,160 |
| Total Municipal Bonds before Short Term Investments (Cost $535,328,827) | | | | 522,638,156 |
166 | Annual Report
| | | | | |
| Franklin Tax-Free Trust | | | | | |
| |
| Statement of Investments, February 28, 2011 (continued) | | | | | |
| |
| Franklin Massachusetts Tax-Free Income Fund | Principal Amount | | | Value |
| Short Term Investments 0.1% | | | | | |
| Municipal Bonds 0.1% | | | | | |
| Massachusetts 0.1% | | | | | |
| aMassachusetts State Health and Educational Facilities Authority Revenue, | | | | | |
| Museum of Fine Arts, Series A-2, Daily VRDN and Put, 0.21%, 12/01/37 | $ | 100,000 | | $ | 100,000 |
| Tufts University, Refunding, Series N-1, Daily VRDN and Put, 0.21%, 8/15/40 | | 500,000 | | | 500,000 |
| Total Short Term Investments (Cost $600,000) | | | | | 600,000 |
| Total Investments (Cost $535,928,827) 99.4% | | | | 523,238,156 |
| Other Assets, less Liabilities 0.6% | | | | | 3,321,254 |
| Net Assets 100.0% | | | $ | 526,559,410 |
| |
| |
| See Abbreviations on page 206. | | | | | |
| aVariable rate demand notes (VRDNs) are tax-exempt obligations which contain a floating or variable interest rate adjustment formula and an unconditional right of demand to |
| receive payment of the principal balance plus accrued interest at specified dates. The coupon rate shown represents the rate at period end. | | | |
| |
| |
| |
| |
| Annual Report | The accompanying notes are an integral part of these financial statements. | 167 |
| | | | | | | | | | | | | | | |
| Franklin Tax-Free Trust | | | | | | | | | | | | | |
| |
| Financial Highlights | | | | | | | | | | | | | | | |
| |
| Franklin New Jersey Tax-Free Income Fund | | | | | | | | | | | | | | | |
| | | | | | Year Ended February 28, | | | | |
| Class A | | 2011 | | | 2010 | | | 2009 | | | 2008 | a | | 2007 | |
| Per share operating performance | | | | | | | | | | | | | | | |
| (for a share outstanding throughout the year) | | | | | | | | | | | | | | | |
| Net asset value, beginning of year | $ | 11.99 | | $ | 11.29 | | $ | 11.45 | | $ | 12.22 | | $ | 12.15 | |
| Income from investment operationsb: | | | | | | | | | | | | | | | |
| Net investment incomec | | 0.51 | | | 0.52 | | | 0.51 | | | 0.50 | | | 0.51 | |
| Net realized and unrealized gains (losses) | | (0.49 | ) | | 0.69 | | | (0.18 | ) | | (0.77 | ) | | 0.08 | |
| Total from investment operations | | 0.02 | | | 1.21 | | | 0.33 | | | (0.27 | ) | | 0.59 | |
| Less distributions from: | | | | | | | | | | | | | | | |
| Net investment income | | (0.52 | ) | | (0.51 | ) | | (0.49 | ) | | (0.50 | ) | | (0.52 | ) |
| Net realized gains | | (—)d | | | — | | | — | | | — | | | — | |
| Total distributions | | (0.52 | ) | | (0.51 | ) | | (0.49 | ) | | (0.50 | ) | | (0.52 | ) |
| Redemption feese | | — | | | — | | | —d | | | —d | | | —d | |
| Net asset value, end of year | $ | 11.49 | | $ | 11.99 | | $ | 11.29 | | $ | 11.45 | | $ | 12.22 | |
| |
| Total returnf | | 0.11 | % | | 10.87 | % | | 2.94 | % | | (2.29 | )% | | 4.96 | % |
| |
| Ratios to average net assets | | | | | | | | | | | | | | | |
| Expenses | | 0.63 | % | | 0.63 | % | | 0.63 | % | | 0.64 | % | | 0.64 | % |
| Net investment income | | 4.26 | % | | 4.42 | % | | 4.41 | % | | 4.17 | % | | 4.23 | % |
| |
| Supplemental data | | | | | | | | | | | | | | | |
| Net assets, end of year (000’s) | $ | 1,128,665 | | $ | 1,230,689 | | $ | 1,100,142 | | $ | 1,081,204 | | $ | 1,006,797 | |
| Portfolio turnover rate | | 12.97 | % | | 9.93 | % | | 10.97 | % | | 10.99 | % | | 3.65 | % |
| |
| |
| aFor the year ended February 29. | | | | | | | | | | | | | | | |
| bThe amount shown for a share outstanding throughout the period may not correlate with the Statement of Operations for the period due to the timing of sales and repurchases of | |
| the Fund shares in relation to income earned and/or fluctuating market value of the investments of the Fund. | | | | | | | | | | |
| cBased on average daily shares outstanding. | | | | | | | | | | | | | | | |
| dAmount rounds to less than $0.01 per share. | | | | | | | | | | | | | | | |
| eEffective September 1, 2008, the redemption fee was eliminated. | | | | | | | | | | | | | | | |
| fTotal return does not reflect sales commissions or contingent deferred sales charges, if applicable. | | | | | | | | | | | | | |
| |
| |
| |
| |
| 168 | The accompanying notes are an integral part of these financial statements. | | | | Annual Report | | | | |
| | | | | | | | | | | | | | | |
| Franklin Tax-Free Trust | | | | | | | | | | | | | |
| |
| Financial Highlights (continued) | | | | | | | | | | | | | | | |
| |
| Franklin New Jersey Tax-Free Income Fund | | | | | | | | | | | | | |
| | | | | | Year Ended February 28, | | | | |
| Class B | | 2011 | | | 2010 | | | 2009 | | | 2008 | a | | 2007 | |
| Per share operating performance | | | | | | | | | | | | | | | |
| (for a share outstanding throughout the year) | | | | | | | | | | | | | | | |
| Net asset value, beginning of year | $ | 12.07 | | $ | 11.36 | | $ | 11.52 | | $ | 12.28 | | $ | 12.22 | |
| Income from investment operationsb: | | | | | | | | | | | | | | | |
| Net investment incomec | | 0.45 | | | 0.46 | | | 0.44 | | | 0.44 | | | 0.45 | |
| Net realized and unrealized gains (losses) | | (0.51 | ) | | 0.69 | | | (0.17 | ) | | (0.76 | ) | | 0.06 | |
| Total from investment operations | | (0.06 | ) | | 1.15 | | | 0.27 | | | (0.32 | ) | | 0.51 | |
| Less distributions from: | | | | | | | | | | | | | | | |
| Net investment income | | (0.45 | ) | | (0.44 | ) | | (0.43 | ) | | (0.44 | ) | | (0.45 | ) |
| Net realized gains | | (—)d | | | — | | | — | | | — | | | — | |
| Total distributions | | (0.45 | ) | | (0.44 | ) | | (0.43 | ) | | (0.44 | ) | | (0.45 | ) |
| Redemption feese | | — | | | — | | | —d | | | —d | | | —d | |
| Net asset value, end of year | $ | 11.56 | | $ | 12.07 | | $ | 11.36 | | $ | 11.52 | | $ | 12.28 | |
| |
| Total returnf | | (0.52 | )% | | 10.30 | % | | 2.36 | % | | (2.73 | )% | | 4.28 | % |
| |
| Ratios to average net assets | | | | | | | | | | | | | | | |
| Expenses | | 1.17 | % | | 1.18 | % | | 1.18 | % | | 1.19 | % | | 1.19 | % |
| Net investment income | | 3.72 | % | | 3.87 | % | | 3.86 | % | | 3.62 | % | | 3.68 | % |
| |
| Supplemental data | | | | | | | | | | | | | | | |
| Net assets, end of year (000’s) | $ | 15,039 | | $ | 34,899 | | $ | 47,329 | | $ | 60,396 | | $ | 72,203 | |
| Portfolio turnover rate | | 12.97 | % | | 9.93 | % | | 10.97 | % | | 10.99 | % | | 3.65 | % |
| |
| |
| aFor the year ended February 29. | | | | | | | | | | | | | | | |
| bThe amount shown for a share outstanding throughout the period may not correlate with the Statement of Operations for the period due to the timing of sales and repurchases of | |
| the Fund shares in relation to income earned and/or fluctuating market value of the investments of the Fund. | | | | | | | | | | | | | |
| cBased on average daily shares outstanding. | | | | | | | | | | | | | | | |
| dAmount rounds to less than $0.01 per share. | | | | | | | | | | | | | | | |
| eEffective September 1, 2008, the redemption fee was eliminated. | | | | | | | | | | | | | |
| fTotal return does not reflect sales commissions or contingent deferred sales charges, if applicable. | | | | | | | | | | | | | |
| |
| |
| |
| |
| Annual Report | | | The accompanying notes are an integral part of these financial statements. | 169 | |
| | | | | | | | | | | | | | | |
| Franklin Tax-Free Trust | | | | | | | | | | | | | | | |
| |
| Financial Highlights (continued) | | | | | | | | | | | | | | | |
| |
| Franklin New Jersey Tax-Free Income Fund | | | | | | | | | | | | | | | |
| | | | | | Year Ended February 28, | | | | |
| Class C | | 2011 | | | 2010 | | | 2009 | | | 2008 | a | | 2007 | |
| Per share operating performance | | | | | | | | | | | | | | | |
| (for a share outstanding throughout the year) | | | | | | | | | | | | | | | |
| Net asset value, beginning of year | $ | 12.11 | | $ | 11.39 | | $ | 11.55 | | $ | 12.31 | | $ | 12.24 | |
| Income from investment operationsb: | | | | | | | | | | | | | | | |
| Net investment incomec | | 0.45 | | | 0.46 | | | 0.45 | | | 0.44 | | | 0.45 | |
| Net realized and unrealized gains (losses) | | (0.51 | ) | | 0.70 | | | (0.18 | ) | | (0.76 | ) | | 0.07 | |
| Total from investment operations | | (0.06 | ) | | 1.16 | | | 0.27 | | | (0.32 | ) | | 0.52 | |
| Less distributions from: | | | | | | | | | | | | | | | |
| Net investment income | | (0.45 | ) | | (0.44 | ) | | (0.43 | ) | | (0.44 | ) | | (0.45 | ) |
| Net realized gains | | (—)d | | | — | | | — | | | — | | | — | |
| Total distributions | | (0.45 | ) | | (0.44 | ) | | (0.43 | ) | | (0.44 | ) | | (0.45 | ) |
| Redemption feese | | — | | | — | | | —d | | | —d | | | —d | |
| Net asset value, end of year | $ | 11.60 | | $ | 12.11 | | $ | 11.39 | | $ | 11.55 | | $ | 12.31 | |
| |
| Total returnf | | (0.53 | )% | | 10.35 | % | | 2.35 | % | | (2.73 | )% | | 4.35 | % |
| |
| Ratios to average net assets | | | | | | | | | | | | | | | |
| Expenses | | 1.18 | % | | 1.18 | % | | 1.18 | % | | 1.19 | % | | 1.19 | % |
| Net investment income | | 3.71 | % | | 3.87 | % | | 3.86 | % | | 3.62 | % | | 3.68 | % |
| |
| Supplemental data | | | | | | | | | | | | | | | |
| Net assets, end of year (000’s) | $ | 276,916 | | $ | 292,947 | | $ | 207,945 | | $ | 166,918 | | $ | 158,706 | |
| Portfolio turnover rate | | 12.97 | % | | 9.93 | % | | 10.97 | % | | 10.99 | % | | 3.65 | % |
| |
| |
| aFor the year ended February 29. | | | | | | | | | | | | | | | |
| bThe amount shown for a share outstanding throughout the period may not correlate with the Statement of Operations for the period due to the timing of sales and repurchases of | |
| the Fund shares in relation to income earned and/or fluctuating market value of the investments of the Fund. | | | | | | | | | | | | | |
| cBased on average daily shares outstanding. | | | | | | | | | | | | | | | |
| dAmount rounds to less than $0.01 per share. | | | | | | | | | | | | | | | |
| eEffective September 1, 2008, the redemption fee was eliminated. | | | | | | | | | | | | | | | |
| fTotal return does not reflect sales commissions or contingent deferred sales charges, if applicable. | | | | | | | | | | | | | |
| |
| |
| |
| |
| 170 | The accompanying notes are an integral part of these financial statements. | Annual Report | | | | |
| | | | | | | | | |
| Franklin Tax-Free Trust | | | | | | | | | |
| Financial Highlights (continued) | | | | | | | | | |
| |
| Franklin New Jersey Tax-Free Income Fund | | | | | | | | | |
| | | Year Ended February 28, | |
| Advisor Class | | 2011 | | | 2010 | | | 2009 | a |
| Per share operating performance | | | | | | | | | |
| (for a share outstanding throughout the year) | | | | | | | | | |
| Net asset value, beginning of year | $ | 11.99 | | $ | 11.29 | | $ | 11.78 | |
| Income from investment operationsb: | | | | | | | | | |
| Net investment incomec | | 0.52 | | | 0.53 | | | 0.35 | |
| Net realized and unrealized gains (losses) | | (0.49 | ) | | 0.69 | | | (0.51 | ) |
| Total from investment operations | | 0.03 | | | 1.22 | | | (0.16 | ) |
| Less distributions from: | | | | | | | | | |
| Net investment income | | (0.53 | ) | | (0.52 | ) | | (0.33 | ) |
| Net realized gains | | (—)d | | | — | | | — | |
| Total distributions | | (0.53 | ) | | (0.52 | ) | | (0.33 | ) |
| Redemption feese | | — | | | — | | | —d | |
| Net asset value, end of year | $ | 11.49 | | $ | 11.99 | | $ | 11.29 | |
| |
| Total returnf | | 0.21 | % | | 10.98 | % | | (1.29 | )% |
| |
| Ratios to average net assetsg | | | | | | | | | |
| Expenses | | 0.53 | % | | 0.53 | % | | 0.53 | % |
| Net investment income | | 4.36 | % | | 4.52 | % | | 4.51 | % |
| |
| Supplemental data | | | | | | | | | |
| Net assets, end of year (000’s) | $ | 25,378 | | $ | 13,791 | | $ | 770 | |
| Portfolio turnover rate | | 12.97 | % | | 9.93 | % | | 10.97 | % |
|
| aFor the period July 1, 2008 (effective date) to February 28, 2009. |
| bThe amount shown for a share outstanding throughout the period may not correlate with the Statement of Operations for the period due to the timing of sales and repurchases of |
| the Fund shares in relation to income earned and/or fluctuating market value of the investments of the Fund. |
| cBased on average daily shares outstanding. |
| dAmount rounds to less than $0.01 per share. |
| eEffective September 1, 2008, the redemption fee was eliminated. |
| fTotal return is not annualized for periods less than one year. |
| gRatios are annualized for periods less than one year. |
Annual Report | The accompanying notes are an integral part of these financial statements. | 171
| | | | | |
| | Franklin Tax-Free Trust | | | | |
| |
| | Statement of Investments, February 28, 2011 | | | | |
| |
| |
| | Franklin New Jersey Tax-Free Income Fund | | Principal Amount | | Value |
| | Municipal Bonds 99.2% | | | | |
| | Delaware 0.7% | | | | |
| | Delaware River and Bay Authority Revenue, NATL Insured, 5.00%, 1/01/27 | $ | 10,000,000 | $ | 10,074,000 |
| | New Jersey 69.5% | | | | |
| | Atlantic County Improvement Authority Luxury Tax Revenue, Convention Center Project, NATL | | | | |
| | Insured, ETM, 7.40%, 7/01/16 | | 9,500,000 | | 10,913,125 |
| | Bergen County Improvement Authority School District Revenue GO, Wyckoff Township Board of | | | | |
| | Education Project, 5.00%, 4/01/32 | | 3,400,000 | | 3,494,452 |
| | Bergen County Utilities Authority Water PCR, System, AMBAC Insured, 5.00%, 12/15/31 | | 3,000,000 | | 3,039,210 |
| | Berhards Township School District GO, NATL Insured, | | | | |
| | 5.00%, 7/15/30 | | 1,680,000 | | 1,722,252 |
| Pre | -Refunded, 5.00%, 7/15/30 | | 8,358,000 | | 9,547,928 |
| | Cape May County Industrial PCFA Revenue, Atlantic City Electric Co., Refunding, Series A, | | | | |
| | NATL Insured, 6.80%, 3/01/21 | | 5,400,000 | | 6,482,538 |
| | Egg Harbor Township School District GO, NATL Insured, Pre-Refunded, 5.00%, | | | | |
| | 4/01/29 | | 3,195,000 | | 3,634,344 |
| | 4/01/30 | | 3,027,000 | | 3,443,243 |
| | Essex County Improvement Authority Lease Revenue, | | | | |
| | 6.00%, 11/01/25 | | 5,000,000 | | 4,975,450 |
| | 6.25%, 11/01/30 | | 1,690,000 | | 1,680,367 |
| | Higher Education Student Assistance Authority Student Loan Revenue, Series A, NATL Insured, | | | | |
| | 6.15%, 6/01/19 | | 1,150,000 | | 1,152,496 |
| | Hoboken GO, Parking Utility, Series A, FGIC Insured, 5.00%, 1/01/23 | | 4,315,000 | | 4,261,667 |
| | Hoboken Parking Authority Parking Revenue, AMBAC Insured, Pre-Refunded, 5.30%, | | | | |
| | 5/01/27 | | 3,600,000 | | 3,699,720 |
| | Hudson County Improvement Authority Lease Revenue, County Secured, County Services | | | | |
| | Building Project, AGMC Insured, 5.00%, 4/01/32 | | 3,895,000 | | 3,925,303 |
| | Hudson County Improvement Authority Parking Revenue, County-Guaranteed, Harrison Parking | | | | |
| | Facility Redevelopment Project, Series C, Assured Guaranty, 5.125%, 1/01/34 | | 2,000,000 | | 2,034,020 |
| | Middlesex County COP, NATL Insured, | | | | |
| | 5.00%, 8/01/31 | | 3,250,000 | | 3,255,363 |
| | zero cpn., 6/15/24 | | 1,000,000 | | 494,010 |
| | Middlesex County Improvement Authority Lease Revenue, County Guaranteed, Regional | | | | |
| | Educational Services Commission, 5.25%, 12/15/33 | | 3,000,000 | | 3,114,210 |
| | Middlesex County Improvement Authority Revenue, Administration Building Residential | | | | |
| | Project, FNMA Insured, | | | | |
| | 5.25%, 7/01/21 | | 750,000 | | 751,620 |
| | 5.35%, 7/01/34 | | 1,575,000 | | 1,548,099 |
| | Morristown Parking Authority Parking Revenue, NATL Insured, 5.00%, | | | | |
| | 8/01/30 | | 1,815,000 | | 1,861,936 |
| | 8/01/33 | | 2,630,000 | | 2,664,400 |
| | Mount Olive Township Board of Education GO, NATL Insured, Pre-Refunded, 5.00%, | | | | |
| | 7/15/29 | | 7,875,000 | | 8,884,417 |
| | New Jersey EDA Lease Revenue, International Center for Public Health Project, University of | | | | |
| | Medicine and Dentistry, AMBAC Insured, 6.00%, 6/01/32 | | 5,000,000 | | 4,922,800 |
| | New Jersey EDA Revenue, | | | | |
| | Cigarette Tax, 5.50%, 6/15/24 | | 5,000,000 | | 4,568,000 |
| | Cigarette Tax, 5.75%, 6/15/34 | | 5,000,000 | | 4,401,350 |
172 | Annual Report
| | | | |
| Franklin Tax-Free Trust | | | | |
| |
| Statement of Investments, February 28, 2011 (continued) | | | | |
| |
| |
| Franklin New Jersey Tax-Free Income Fund | | Principal Amount | | Value |
| Municipal Bonds (continued) | | | | |
| New Jersey (continued) | | | | |
| New Jersey EDA Revenue, (continued) | | | | |
| Montclair State University, Provident Group, Montclair Properties LLC, Series A, 5.875%, | | | | |
| 6/01/42 | $ | 16,000,000 | $ | 14,569,440 |
| Motor Vehicle Surcharge Revenue, Series A, NATL Insured, 5.00%, 7/01/27 | | 5,000,000 | | 5,066,900 |
| Motor Vehicle Surcharge Revenue, Series A, NATL Insured, 5.00%, 7/01/29 | | 12,500,000 | | 12,602,000 |
| Motor Vehicle Surcharge Revenue, Series A, NATL Insured, 5.00%, 7/01/34 | | 10,000,000 | | 9,396,400 |
| Municipal Rehabilitation, Series A, AMBAC Insured, 5.00%, 4/01/28 | | 16,240,000 | | 16,248,770 |
| School Facilities Construction, Refunding, Series K, NATL RE, FGIC Insured, 5.25%, | | | | |
| 12/15/21 | | 10,000,000 | | 10,555,700 |
| School Facilities Construction, Refunding, Series N-1, NATL RE, FGIC Insured, 5.50%, | | | | |
| 9/01/27 | | 8,660,000 | | 9,233,032 |
| School Facilities Construction, Series C, NATL Insured, 4.75%, 6/15/25 | | 16,500,000 | | 16,130,730 |
| School Facilities Construction, Series CC-2, 5.00%, 12/15/32 | | 7,280,000 | | 7,193,805 |
| School Facilities Construction, Series L, AGMC Insured, 5.00%, 3/01/30 | | 10,500,000 | | 10,507,455 |
| School Facilities Construction, Series O, 5.125%, 3/01/28 | | 5,000,000 | | 5,031,350 |
| School Facilities Construction, Series U, AMBAC Insured, 5.00%, 9/01/37 | | 5,000,000 | | 4,653,300 |
| School Facilities Construction, Series Y, 5.00%, 9/01/33 | | 6,000,000 | | 5,936,040 |
| School Facilities Construction, Series Z, Assured Guaranty, 5.50%, 12/15/34 | | 3,000,000 | | 3,072,180 |
| New Jersey EDA State Lease Revenue, Liberty State Park Lease Rental, Refunding, AMBAC | | | | |
| Insured, 5.75%, 3/15/20 | | 4,605,000 | | 4,619,137 |
| New Jersey EDA Water Facilities Revenue, | | | | |
| Hackensack Water Co. Project, Refunding, Series A, NATL Insured, 5.80%, 3/01/24 | | 1,000,000 | | 1,002,830 |
| New Jersey American Water Co., Refunding, Series A, 5.70%, 10/01/39 | | 10,000,000 | | 9,792,400 |
| New Jersey American Water Co., Refunding, Series B, 5.00%, 10/01/39 | | 8,750,000 | | 8,218,612 |
| New Jersey Health Care Facilities Financing Authority Revenue, | | | | |
| Atlantic City Medical Center, Pre-Refunded, 5.75%, 7/01/25 | | 2,170,000 | | 2,318,754 |
| Atlantic City Medical Center, Refunding, 5.75%, 7/01/25 | | 2,830,000 | | 2,856,715 |
| Atlantic Health System Hospital Corp., Series A, 5.00%, 7/01/27 | | 8,000,000 | | 7,816,240 |
| Atlanticare Regional Medical Center, 5.00%, 7/01/25 | | 4,605,000 | | 4,604,678 |
| Atlanticare Regional Medical Center, Refunding, 5.00%, 7/01/37 | | 19,490,000 | | 17,664,956 |
| Burdette Tomlin Memorial Hospital, 5.50%, 7/01/29 | | 5,725,000 | | 5,614,450 |
| Englewood Hospital, NATL Insured, 5.00%, 8/01/31 | | 9,275,000 | | 9,294,199 |
| Hackensack University Medical Center, Refunding, Assured Guaranty, 5.25%, 1/01/31 | | 5,000,000 | | 5,013,850 |
| Hackensack University Medical Center, Refunding, Assured Guaranty, 5.25%, 1/01/36 | | 5,000,000 | | 4,851,150 |
| Holy Name Hospital, 5.00%, 7/01/36 | | 5,000,000 | | 3,975,000 |
| Hunterdon Medical Center, Series A, 5.125%, 7/01/35 | | 2,000,000 | | 1,757,220 |
| Jersey City Medical Center, AMBAC Insured, 5.00%, 8/01/31 | | 4,250,000 | | 4,133,252 |
| Meridian Health System Obligated Group Issue, AGMC Insured, 5.25%, 7/01/29 | | 20,000,000 | | 20,000,800 |
| Meridian Health System Obligated Group Issue, Refunding, AGMC Insured, 5.375%, | | | | |
| 7/01/24 | | 6,500,000 | | 6,503,510 |
| Meridian Health System Obligated Group Issue, Tranche I, Assured Guaranty, 5.00%, | | | | |
| 7/01/38 | | 9,990,000 | | 9,657,133 |
| Meridian Health System Obligated Group Issue, Tranche II, Assured Guaranty, 5.00%, | | | | |
| 7/01/38 | | 13,975,000 | | 13,497,474 |
| Somerset Medical Center, 5.75%, 7/01/28 | | 11,000,000 | | 9,299,180 |
| South Jersey Hospital, 5.00%, 7/01/36 | | 10,000,000 | | 8,670,300 |
| South Jersey Hospital, 5.00%, 7/01/46 | | 27,200,000 | | 23,081,648 |
Annual Report | 173
| | | | |
| Franklin Tax-Free Trust | | | | |
| |
| Statement of Investments, February 28, 2011 (continued) | | | | |
| |
| |
| Franklin New Jersey Tax-Free Income Fund | | Principal Amount | | Value |
| Municipal Bonds (continued) | | | | |
| New Jersey (continued) | | | | |
| New Jersey Health Care Facilities Financing Authority Revenue, (continued) | | | | |
| South Jersey Hospital, Pre-Refunded, 5.875%, 7/01/21 | $ | 10,000,000 | $ | 10,702,000 |
| South Jersey Hospital, Pre-Refunded, 6.00%, 7/01/32 | | 18,600,000 | | 19,936,410 |
| Southern Ocean County Hospital, AGMC Insured, 5.00%, 7/01/27 | | 2,000,000 | | 1,932,720 |
| St. Barnabas Health Care System, Series A, 5.00%, 7/01/29 | | 12,000,000 | | 10,075,800 |
| St. Mary’s Hospital Passaic, Series 1, 5.00%, 3/01/26 | | 3,355,000 | | 3,367,044 |
| St. Mary’s Hospital Passaic, Series 1, 5.00%, 3/01/27 | | 3,345,000 | | 3,301,515 |
| St. Mary’s Hospital, ETM, 5.875%, 7/01/12 | | 1,045,000 | | 1,086,131 |
| St. Peter’s University Hospital, Refunding, Series A, 6.875%, 7/01/30 | | 1,500,000 | | 1,481,670 |
| Virtua Health, Assured Guaranty, 5.50%, 7/01/38 | | 10,000,000 | | 10,220,200 |
| New Jersey Health Care Facilities Financing Authority State Contract Revenue, Hospital Asset | | | | |
| Transformation Program, Series A, | | | | |
| 5.75%, 10/01/31 | | 10,000,000 | | 10,524,600 |
| 5.25%, 10/01/38 | | 15,000,000 | | 14,408,550 |
| New Jersey State COP, Equipment Lease Purchase, Series A, 5.25%, 6/15/29 | | 1,000,000 | | 1,005,250 |
| New Jersey State Educational Facilities Authority Revenue, | | | | |
| College of New Jersey, Refunding, Series D, AGMC Insured, 5.00%, 7/01/28 | | 5,940,000 | | 6,023,279 |
| College of New Jersey, Refunding, Series D, AGMC Insured, 5.00%, 7/01/35 | | 11,000,000 | | 10,968,540 |
| Kean University, Refunding, Series A, 5.50%, 9/01/36 | | 6,500,000 | | 6,570,265 |
| Kean University, Series B, NATL Insured, Pre-Refunded, 5.00%, 7/01/30 | | 5,240,000 | | 6,085,212 |
| Kean University, Series D, FGIC Insured, Pre-Refunded, 5.00%, 7/01/33 | | 10,000,000 | | 10,915,500 |
| Kean University, Series D, NATL RE, FGIC Insured, 5.00%, 7/01/39 | | 9,695,000 | | 8,946,061 |
| Montclair State University, Refunding, Series A, AMBAC Insured, 5.00%, 7/01/31 | | 10,000,000 | | 9,848,800 |
| Montclair State University, Refunding, Series A, AMBAC Insured, 5.00%, 7/01/36 | | 20,000,000 | | 18,620,800 |
| Montclair State University, Series J, 5.25%, 7/01/38 | | 2,000,000 | | 1,940,560 |
| New Jersey Institute of Technology, Refunding, Series H, 5.00%, 7/01/31 | | 4,000,000 | | 3,974,480 |
| Princeton University, Refunding, Series A, 5.00%, 7/01/30 | | 5,000,000 | | 5,178,500 |
| Princeton University, Refunding, Series E, 5.00%, 7/01/33 | | 5,000,000 | | 5,191,800 |
| Princeton University, Series D, Pre-Refunded, 5.00%, 7/01/29 | | 1,000,000 | | 1,126,730 |
| Ramapo College of New Jersey, Series D, AMBAC Insured, Pre-Refunded, 5.00%, | | | | |
| 7/01/25 | | 1,000,000 | | 1,014,980 |
| Ramapo College of New Jersey, Series D, NATL Insured, Pre-Refunded, 5.00%, 7/01/36 | | 6,745,000 | | 7,832,968 |
| Refunding, Series D, 5.00%, 7/01/27 | | 1,325,000 | | 1,232,502 |
| Refunding, Series D, 5.00%, 7/01/33 | | 1,000,000 | | 877,770 |
| Richard Stockton College, Refunding, Series A, 5.375%, 7/01/38 | | 5,000,000 | | 4,960,650 |
| Richard Stockton College, Refunding, Series F, AMBAC Insured, 5.00%, 7/01/28 | | 2,370,000 | | 2,381,732 |
| Rowan University, Refunding, Series C, NATL RE, FGIC Insured, 5.00%, 7/01/31 | | 1,505,000 | | 1,504,895 |
| Rowan University, Refunding, Series D, AMBAC Insured, 5.00%, 7/01/24 | | 1,755,000 | | 1,833,238 |
| Rowan University, Series C, FGIC Insured, Pre-Refunded, 5.00%, 7/01/31 | | 495,000 | | 507,524 |
| Rowan University, Series K, FGIC Insured, Pre-Refunded, 5.00%, 7/01/27 | | 1,000,000 | | 1,057,960 |
| Seton Hall University Project, Series G, AMBAC Insured, 5.00%, 7/01/26 | | 1,870,000 | | 1,872,917 |
| Seton Hall University, Refunding, Series E, 6.25%, 7/01/37 | | 5,000,000 | | 5,392,800 |
| Stevens Institute of Technology, Refunding, Series A, 5.00%, 7/01/34 | | 4,750,000 | | 4,141,145 |
| Stevens Institute of Technology, Refunding, Series I, 5.00%, 7/01/18 | | 590,000 | | 590,336 |
| Stevens Institute of Technology, Refunding, Series I, 5.00%, 7/01/28 | | 865,000 | | 812,408 |
| Stevens Institute of Technology, Series I, ETM, 5.00%, 7/01/18 | | 510,000 | | 511,464 |
| Stevens Institute of Technology, Series I, ETM, 5.00%, 7/01/28 | | 710,000 | | 710,873 |
| William Paterson University, Series C, Assured Guaranty, 5.00%, 7/01/38 | | 5,500,000 | | 5,217,245 |
174 | Annual Report
| | | | |
| Franklin Tax-Free Trust | | | | |
| |
| Statement of Investments, February 28, 2011 (continued) | | | | |
| |
| |
| Franklin New Jersey Tax-Free Income Fund | | Principal Amount | | Value |
| Municipal Bonds (continued) | | | | |
| New Jersey (continued) | | | | |
| New Jersey State Higher Education Assistance Authority Student Loan Revenue, | | | | |
| Refunding, Series 1A, 5.00%, 12/01/25 | $ | 4,150,000 | $ | 4,085,924 |
| Refunding, Series 1A, 5.00%, 12/01/26 | | 2,000,000 | | 1,950,900 |
| Refunding, Series 1A, 5.125%, 12/01/27 | | 5,000,000 | | 4,914,150 |
| Refunding, Series 1A, 5.25%, 12/01/28 | | 5,000,000 | | 4,937,100 |
| Series 2, 5.00%, 12/01/26 | | 4,125,000 | | 4,023,731 |
| Series 2, 5.00%, 12/01/27 | | 3,000,000 | | 2,907,150 |
| Series 2, 5.00%, 12/01/28 | | 2,955,000 | | 2,833,934 |
| Series 2, 5.00%, 12/01/30 | | 1,500,000 | | 1,425,825 |
| Series 2, 5.00%, 12/01/36 | | 1,000,000 | | 941,980 |
| Series A, 5.625%, 6/01/30 | | 14,500,000 | | 14,642,390 |
| Series A, Assured Guaranty, 6.125%, 6/01/30 | | 10,000,000 | | 10,302,100 |
| New Jersey State Housing and Mortgage Finance Agency MFHR, | | | | |
| Series A1, AGMC Insured, 6.35%, 11/01/31 | | 2,000,000 | | 2,000,960 |
| Series B, AGMC Insured, 6.25%, 11/01/26 | | 970,000 | | 970,698 |
| Series D, AGMC Insured, 5.50%, 5/01/22 | | 675,000 | | 677,815 |
| Series E1, AGMC Insured, 5.70%, 5/01/20 | | 2,595,000 | | 2,597,517 |
| Series E1, AGMC Insured, 5.75%, 5/01/25 | | 1,165,000 | | 1,165,944 |
| Series I, 5.75%, 11/01/38 | | 3,140,000 | | 3,149,954 |
| New Jersey State Housing and Mortgage Finance Agency Revenue, | | | | |
| Home Buyer, Series CC, NATL Insured, 5.875%, 10/01/31 | | 805,000 | | 805,298 |
| Series AA, 6.50%, 10/01/38 | | 7,285,000 | | 7,480,384 |
| New Jersey State Transportation Trust Fund Authority Revenue, | | | | |
| Capital Appreciation, Transportation System, Series A, zero cpn., 12/15/29 | | 5,000,000 | | 1,582,350 |
| Capital Appreciation, Transportation System, Series C, AGMC Insured, zero cpn., | | | | |
| 12/15/33 | | 10,000,000 | | 2,329,700 |
| Transportation System, Refunding, Series B, AMBAC Insured, 5.25%, 12/15/23 | | 15,000,000 | | 15,565,500 |
| Transportation System, Series A, 6.00%, 12/15/38 | | 16,110,000 | | 17,104,792 |
| Transportation System, Series A, AGMC Insured, 5.00%, 12/15/34 | | 15,000,000 | | 14,732,700 |
| Transportation System, Series A, AMBAC Insured, 5.00%, 12/15/34 | | 10,000,000 | | 9,821,800 |
| Transportation System, Series A, Pre-Refunded, 6.00%, 12/15/38 | | 8,890,000 | | 11,099,343 |
| Transportation System, Series A, zero cpn., 12/15/32 | | 10,000,000 | | 2,477,100 |
| Transportation System, Series B, NATL Insured, Pre-Refunded, 5.00%, 12/15/21 | | 5,000,000 | | 5,182,900 |
| New Jersey State Turnpike Authority Turnpike Revenue, | | | | |
| Growth and Income Securities, Series B, AMBAC Insured, zero cpn. to 1/01/15, 5.15% | | | | |
| thereafter, 1/01/35 | | 7,500,000 | | 5,921,100 |
| Refunding, Series I, 5.00%, 1/01/35 | | 5,000,000 | | 4,870,600 |
| Series A, AMBAC Insured, 5.00%, 1/01/30 | | 13,500,000 | | 13,563,855 |
| Series E, 5.25%, 1/01/40 | | 21,920,000 | | 21,821,579 |
| Series H, 5.00%, 1/01/36 | | 14,000,000 | | 13,554,240 |
| Newark Housing Authority Port Authority Revenue, Newark Marine Terminal, NATL Insured, | | | | |
| Pre-Refunded, | | | | |
| 5.00%, 1/01/26 | | 3,245,000 | | 3,600,198 |
| 5.50%, 1/01/27 | | 3,240,000 | | 3,639,654 |
| 5.50%, 1/01/28 | | 2,000,000 | | 2,246,700 |
| 5.00%, 1/01/34 | | 25,000,000 | | 27,736,500 |
Annual Report | 175
| | | | |
| Franklin Tax-Free Trust | | | | |
| |
| Statement of Investments, February 28, 2011 (continued) | | | | |
| |
| |
| Franklin New Jersey Tax-Free Income Fund | | Principal Amount | | Value |
| Municipal Bonds (continued) | | | | |
| New Jersey (continued) | | | | |
| North Hudson Sewer Authority New Jersey Sewer Revenue, Series C, NATL Insured, 5.00%, | | | | |
| 8/01/22 | $ | 1,000,000 | $ | 1,006,020 |
| 8/01/31 | | 1,000,000 | | 1,000,760 |
| Passaic County Improvement Authority Parking Facilities Revenue, | | | | |
| 200 Hospital Plaza Corp. Project, 5.00%, 5/01/42 | | 3,200,000 | | 3,082,464 |
| Paterson Parking Deck Project, Series A, AGMC Insured, 5.00%, 4/15/35 | | 1,375,000 | | 1,381,009 |
| Rutgers State University Revenue, Series F, 5.00%, 5/01/39 | | 20,000,000 | | 19,968,600 |
| Salem County PCFA, PCR, Atlantic City Electric, Refunding, Series A, 4.875%, 6/01/29 | | 5,000,000 | | 4,996,650 |
| South Jersey Transportation Authority Transportation System Revenue, AMBAC Insured, 5.00%, | | | | |
| 11/01/29 | | 12,000,000 | | 11,784,960 |
| Sussex County Municipal Utilities Authority Wastewater Facilities Revenue, Capital Appreciation, | | | | |
| Series B, AGMC Insured, zero cpn., | | | | |
| 12/01/35 | | 2,815,000 | | 682,356 |
| 12/01/36 | | 2,810,000 | | 638,432 |
| 12/01/37 | | 2,815,000 | | 597,540 |
| 12/01/38 | | 2,810,000 | | 561,382 |
| Tobacco Settlement FICO Revenue, Asset-Backed, Pre-Refunded, 6.00%, 6/01/37 | | 13,000,000 | | 13,884,130 |
| Union County Utilities Authority Solid Waste Revenue, Ogden Martin, Refunding, Series A, | | | | |
| AMBAC Insured, 5.35%, 6/01/23 | | 2,160,000 | | 2,044,570 |
| University of Medicine and Dentistry COP, | | | | |
| AMBAC Insured, 5.00%, 4/15/32 | | 2,000,000 | | 1,734,200 |
| NATL Insured, 5.00%, 6/15/36 | | 15,500,000 | | 13,035,345 |
| Series A, NATL Insured, 5.00%, 9/01/22 | | 1,700,000 | | 1,717,986 |
| University of Medicine and Dentistry Revenue, Series A, AMBAC Insured, 5.00%, | | | | |
| 12/01/24 | | 2,500,000 | | 2,368,775 |
| 12/01/31 | | 28,395,000 | | 24,653,959 |
| Upper Freehold Regional School District GO, NATL Insured, Pre-Refunded, 5.00%, 2/15/35 | | 8,730,000 | | 10,181,537 |
| | | | | 1,004,783,774 |
| New York 6.6% | | | | |
| Port Authority of New York and New Jersey Revenue, Consolidated, | | | | |
| One Hundred Fifty-Third Series, Refunding, 5.00%, 7/15/38 | | 8,850,000 | | 8,617,776 |
| One Hundred Forty-Eighth Series, AGMC Insured, 5.00%, 8/15/34 | | 10,000,000 | | 10,032,500 |
| One Hundred Forty-Eighth Series, AGMC Insured, 5.00%, 8/15/37 | | 5,000,000 | | 4,913,450 |
| One Hundred Forty-Fourth Series, 5.00%, 10/01/29 | | 5,000,000 | | 5,119,450 |
| One Hundred Forty-Ninth Series, 5.00%, 11/15/31 | | 10,000,000 | | 10,135,600 |
| One Hundred Sixtieth Series, Refunding, 5.00%, 9/15/36 | | 15,000,000 | | 14,682,150 |
| One Hundred Sixty-First Series, 5.00%, 10/15/33 | | 10,000,000 | | 10,062,100 |
| One Hundred Twenty-Fifth Series, AGMC Insured, 5.00%, 4/15/32 | | 23,950,000 | | 24,113,339 |
| Port Authority of New York and New Jersey Special Obligation Revenue, John F. Kennedy | | | | |
| International Air Terminal, NATL Insured, 5.75%, 12/01/22 | | 8,000,000 | | 7,891,840 |
| | | | | 95,568,205 |
| Pennsylvania 1.3% | | | | |
| Delaware River Joint Toll Bridge Commission Bridge Revenue, Series A, NATL Insured, 5.00%, | | | | |
| 7/01/35 | | 5,000,000 | | 4,822,350 |
| Delaware River Port Authority Revenue, Series E, 5.00%, 1/01/35 | | 14,000,000 | | 13,807,220 |
| | | | | 18,629,570 |
176 | Annual Report
| | | | |
| Franklin Tax-Free Trust | | | | |
| |
| Statement of Investments, February 28, 2011 (continued) | | | | |
| |
| |
| Franklin New Jersey Tax-Free Income Fund | | Principal Amount | | Value |
| Municipal Bonds (continued) | | | | |
| U.S. Territories 21.1% | | | | |
| Puerto Rico 20.8% | | | | |
| Puerto Rico Commonwealth Aqueduct and Sewer Authority Revenue, senior lien, Series A, | | | | |
| 6.00%, 7/01/44 | $ | 4,100,000 | $ | 3,811,114 |
| Puerto Rico Commonwealth GO, Public Improvement, | | | | |
| Refunding, AGMC Insured, 5.125%, 7/01/30 | | 8,350,000 | | 8,066,267 |
| Refunding, Series A-4, AGMC Insured, 5.00%, 7/01/31 | | 5,000,000 | | 4,682,050 |
| Series A, 5.00%, 7/01/29 | | 10,000,000 | | 9,492,900 |
| Series B, 5.00%, 7/01/35 | | 1,825,000 | | 1,559,718 |
| Series B, Pre-Refunded, 5.00%, 7/01/35 | | 3,175,000 | | 3,704,685 |
| Puerto Rico Commonwealth Highway and Transportation Authority Highway Revenue, | | | | |
| Refunding, Series CC, AGMC Insured, 5.25%, 7/01/34 | | 5,000,000 | | 4,742,100 |
| Puerto Rico Commonwealth Highway and Transportation Authority Transportation Revenue, | | | | |
| Refunding, Series N, NATL Insured, 5.25%, 7/01/32 | | 10,000,000 | | 9,250,400 |
| Series D, Pre-Refunded, 5.375%, 7/01/36 | | 5,000,000 | | 5,311,100 |
| Puerto Rico Commonwealth Infrastructure Financing Authority Special Tax Revenue, | | | | |
| 5.00%, 7/01/46 | | 14,200,000 | | 11,215,302 |
| Series B, 5.00%, 7/01/37 | | 8,000,000 | | 6,697,840 |
| Puerto Rico Electric Power Authority Power Revenue, | | | | |
| Series II, Pre-Refunded, 5.25%, 7/01/31 | | 13,000,000 | | 13,952,510 |
| Series RR, FGIC Insured, Pre-Refunded, 5.00%, 7/01/35 | | 30,000,000 | | 34,437,600 |
| Series TT, 5.00%, 7/01/32 | | 25,000,000 | | 22,625,000 |
| Series TT, 5.00%, 7/01/37 | | 17,925,000 | | 15,314,045 |
| Series WW, 5.50%, 7/01/38 | | 16,620,000 | | 15,138,826 |
| Series XX, 5.25%, 7/01/40 | | 17,000,000 | | 14,846,780 |
| Puerto Rico Industrial Tourist Educational Medical and Environmental Control Facilities | | | | |
| Financing Authority Educational Facilities Revenue, University Plaza Project, Series A, NATL | | | | |
| Insured, 5.00%, 7/01/33 | | 1,000,000 | | 876,790 |
| Puerto Rico PBA Guaranteed Revenue, Government Facilities, | | | | |
| Refunding, Series D, 5.375%, 7/01/33 | | 6,830,000 | | 6,403,671 |
| Refunding, Series N, 5.00%, 7/01/32 | | 20,000,000 | | 17,675,400 |
| Series D, Pre-Refunded, 5.375%, 7/01/33 | | 10,000,000 | | 10,622,200 |
| Puerto Rico Sales Tax FICO Sales Tax Revenue, first sub., | | | | |
| Series A, 5.75%, 8/01/37 | | 10,000,000 | | 9,905,600 |
| Series A, 5.375%, 8/01/39 | | 4,000,000 | | 3,676,040 |
| Series A, 5.50%, 8/01/42 | | 17,000,000 | | 15,871,540 |
| Series A, 6.00%, 8/01/42 | | 32,000,000 | | 32,060,800 |
| Series C, 5.50%, 8/01/40 | | 20,000,000 | | 18,703,400 |
| | | | | 300,643,678 |
| U.S. Virgin Islands 0.3% | | | | |
| Virgin Islands PFAR, Gross Receipts Taxes Loan Note, Radian Insured, 5.00%, 10/01/33 | | 5,000,000 | | 4,466,250 |
| Total U.S. Territories | | | | 305,109,928 |
| Total Municipal Bonds before Short Term Investments | | | | |
| (Cost $1,463,284,981) | | | | 1,434,165,477 |
Annual Report | 177
| | | | | |
| Franklin Tax-Free Trust | | | | | |
| |
| Statement of Investments, February 28, 2011 (continued) | | | | | |
| |
| Franklin New Jersey Tax-Free Income Fund | | Principal Amount | | | Value |
| Short Term Investments (Cost $2,200,000) 0.1% | | | | | |
| Municipal Bonds 0.1% | | | | | |
| New Jersey 0.1% | | | | | |
| aNew Jersey EDA Revenue, School Facilities Construction, Series R, Sub Series R-1, Daily VRDN | | | | | |
| and Put, 0.19%, 9/01/31 | $ | 2,200,000 | | $ | 2,200,000 |
| Total Investments (Cost $1,465,484,981) 99.3% | | | | | 1,436,365,477 |
| Other Assets, less Liabilities 0.7% | | | | | 9,631,945 |
| Net Assets 100.0% | | | $ | 1,445,997,422 |
| |
| |
| See Abbreviations on page 206. | | | | | |
| aVariable rate demand notes (VRDNs) are tax-exempt obligations which contain a floating or variable interest rate adjustment formula and an unconditional right of demand to |
| receive payment of the principal balance plus accrued interest at specified dates. The coupon rate shown represents the rate at period end. | | | |
178 | The accompanying notes are an integral part of these financial statements. | Annual Report
| | | | | | | | | | | | |
| Franklin Tax-Free Trust | | | | | | | | | | |
| |
| Financial Statements | | | | | | | | | | | | |
| |
| |
| Statements of Assets and Liabilities | | | | | | | | | | | | |
| February 28, 2011 | | | | | | | | | | | | |
| |
| | | Franklin | | | Franklin Federal | | | Franklin Federal | | | Franklin | |
| | | Double | | | Intermediate-Term | | | Limited-Term | | | High Yield | |
| | | Tax-Free | | | Tax-Free | | | Tax-Free | | | Tax-Free | |
| | | Income Fund | | | Income Fund | | | Income Fund | | | Income Fund | |
| Assets: | | | | | | | | | | | | |
| Investments in securities: | | | | | | | | | | | | |
| Cost | $ | 643,002,524 | | $ | 2,259,221,853 | | $ | 663,445,502 | | $ | 7,221,917,741 | |
| Value | $ | 615,833,156 | | $ | 2,292,067,279 | | $ | 668,301,822 | | $ | 6,914,866,407 | |
| Cash | | 1,127,691 | | | 11,837,129 | | | 10,046 | | | 36,033 | |
| Receivables: | | | | | | | | | | | | |
| Investment securities sold | | — | | | — | | | — | | | 7,912,727 | |
| Capital shares sold | | 738,353 | | | 7,084,505 | | | 1,841,722 | | | 18,583,053 | |
| Interest | | 7,213,418 | | | 26,849,394 | | | 5,913,447 | | | 114,102,637 | |
| Other assets | | 268 | | | 970 | | | 269 | | | 2,964 | |
| Total assets | | 624,912,886 | | | 2,337,839,277 | | | 676,067,306 | | | 7,055,503,821 | |
| Liabilities: | | | | | | | | | | | | |
| Payables: | | | | | | | | | | | | |
| Investment securities purchased | | — | | | — | | | — | | | 9,808,260 | |
| Capital shares redeemed | | 1,016,011 | | | 48,247,919 | | | 5,537,436 | | | 21,880,337 | |
| Affiliates | | 357,237 | | | 1,217,202 | | | 193,063 | | | 3,708,523 | |
| Distributions to shareholders | | 780,680 | | | 2,079,800 | | | 342,162 | | | 6,741,983 | |
| Accrued expenses and other liabilities | | 101,462 | | | 445,443 | | | 73,244 | | | 984,154 | |
| Total liabilities | | 2,255,390 | | | 51,990,364 | | | 6,145,905 | | | 43,123,257 | |
| Net assets, at value | $ | 622,657,496 | | $ | 2,285,848,913 | | $ | 669,921,401 | | $ | 7,012,380,564 | |
| Net assets consist of: | | | | | | | | | | | | |
| Paid-in capital | $ | 655,281,211 | | $ | 2,278,249,494 | | $ | 665,891,156 | | $ | 7,559,191,279 | |
| Undistributed net investment income (distributions | | | | | | | | | | | | |
| in excess of net investment income) | | 601,729 | | | (802,733 | ) | | (163,844 | ) | | 10,924,857 | |
| Net unrealized appreciation (depreciation) | | (27,169,368 | ) | | 32,845,426 | | | 4,856,320 | | | (307,051,334 | ) |
| Accumulated net realized gain (loss) | | (6,056,076 | ) | | (24,443,274 | ) | | (662,231 | ) | | (250,684,238 | ) |
| Net assets, at value | $ | 622,657,496 | | $ | 2,285,848,913 | | $ | 669,921,401 | | $ | 7,012,380,564 | |
Annual Report | The accompanying notes are an integral part of these financial statements. | 179
| | | | | | | | | | | | |
| Franklin Tax-Free Trust | | | | | | | | |
| |
| Financial Statements (continued) | | | | | | | | | | | | |
| |
| |
| Statements of Assets and Liabilities (continued) | | | | | | | | | | | | |
| February 28, 2011 | | | | | | | | | | | | |
| |
| | | | | Franklin | | | Franklin Federal | | Franklin Federal | | | Franklin |
| | | | | Double | | | Intermediate-Term | | Limited-Term | | | High Yield |
| | | | | Tax-Free | | | Tax-Free | | Tax-Free | | | Tax-Free |
| | | Income Fund | | | Income Fund | | Income Fund | | | Income Fund |
| Class A: | | | | | | | | | | | | |
| Net assets, at value | $ | 523,390,880 | $ | | 1,492,831,616 | $ | 640,865,353 | $ | | 5,133,343,227 |
| Shares outstanding | | | | 47,070,310 | | | 130,594,044 | | 62,260,639 | | | 534,727,860 |
| Net asset value per sharea | | | $ | 11.12 | | $ | 11.43 | $ | 10.29 | | $ | 9.60 |
| Maximum offering price per share (net asset value | | | | | | | | | | | | |
| per share ÷ 95.75%, 97.75%, 97.75% and | | | | | | | | | | | | |
| 95.75%, respectively) | | | $ | 11.61 | | $ | 11.69 | $ | 10.53 | | $ | 10.03 |
| Class B: | | | | | | | | | | | | |
| Net assets, at value | | | | | | | | | | $ | | 33,159,406 |
| Shares outstanding | | | | | | | | | | | | 3,427,251 |
| Net asset value and maximum offering price | | | | | | | | | | | | |
| per sharea | | | | | | | | | | | $ | 9.68 |
| Class C: | | | | | | | | | | | | |
| Net assets, at value | | $ | | 95,162,865 | $ | | 357,180,375 | | | $ | | 996,920,707 |
| Shares outstanding | | | | 8,522,423 | | | 31,168,912 | | | | | 102,414,478 |
| Net asset value and maximum offering price | | | | | | | | | | | | |
| per sharea | | | $ | 11.17 | | $ | 11.46 | | | | $ | 9.73 |
| Advisor Class: | | | | | | | | | | | | |
| Net assets, at value | | $ | | 4,103,751 | $ | | 435,836,922 | $ | 29,056,048 | $ | | 848,957,224 |
| Shares outstanding | | | | 368,710 | | | 38,063,395 | | 2,824,596 | | | 88,170,654 |
| Net asset value and maximum offering price | | | | | | | | | | | | |
| per share | | | $ | 11.13 | | $ | 11.45 | $ | 10.29 | | $ | 9.63 |
| |
| |
| aRedemption price is equal to net asset value less contingent deferred sales charges, if applicable. | | | | | | | | |
180 | The accompanying notes are an integral part of these financial statements. | Annual Report
| | | | | | | | | |
| Franklin Tax-Free Trust | | | | | | | | | |
| |
| Financial Statements (continued) | | | | | | | | | |
| |
| |
| Statements of Assets and Liabilities (continued) | | | | | | | | | |
| February 28, 2011 | | | | | | | | | |
| |
| | | | | | Franklin | | | Franklin | |
| | | Franklin | | | Massachusetts | | | New Jersey | |
| | | Insured Tax-Free | | | Tax-Free | | | Tax-Free | |
| | | Income Fund | | | Income Fund | | | Income Fund | |
| Assets: | | | | | | | | | |
| Investments in securities: | | | | | | | | | |
| Cost | $ | 2,578,588,648 | | $ | 535,928,827 | | $ | 1,465,484,981 | |
| Value | $ | 2,503,094,272 | | $ | 523,238,156 | | $ | 1,436,365,477 | |
| Cash | | 78,239 | | | 98,237 | | | 2,398 | |
| Receivables: | | | | | | | | | |
| Capital shares sold | | 4,133,864 | | | 236,519 | | | 1,781,010 | |
| Interest | | 32,993,215 | | | 6,153,281 | | | 16,153,420 | |
| Other assets | | 1,079 | | | 226 | | | 635 | |
| Total assets | | 2,540,300,669 | | | 529,726,419 | | | 1,454,302,940 | |
| Liabilities: | | | | | | | | | |
| Payables: | | | | | | | | | |
| Capital shares redeemed | | 8,294,351 | | | 2,197,123 | | | 6,124,620 | |
| Affiliates | | 1,382,853 | | | 304,628 | | | 821,398 | |
| Distributions to shareholders | | 3,021,639 | | | 583,159 | | | 1,144,456 | |
| Accrued expenses and other liabilities | | 300,057 | | | 82,099 | | | 215,044 | |
| Total liabilities | | 12,998,900 | | | 3,167,009 | | | 8,305,518 | |
| Net assets, at value | $ | 2,527,301,769 | | $ | 526,559,410 | | $ | 1,445,997,422 | |
| Net assets consist of: | | | | | | | | | |
| Paid-in capital | $ | 2,625,081,947 | | $ | 540,812,298 | | $ | 1,478,818,033 | |
| Undistributed net investment income (distributions in excess of net | | | | | | | | | |
| investment income) | | (510,886 | ) | | (270,471 | ) | | 1,458,728 | |
| Net unrealized appreciation (depreciation) | | (75,494,376 | ) | | (12,690,671 | ) | | (29,119,504 | ) |
| Accumulated net realized gain (loss) | | (21,774,916 | ) | | (1,291,746 | ) | | (5,159,835 | ) |
| Net assets, at value | $ | 2,527,301,769 | | $ | 526,559,410 | | $ | 1,445,997,422 | |
Annual Report | The accompanying notes are an integral part of these financial statements. | 181
Franklin Tax-Free Trust
Financial Statements (continued)
Statements of Assets and Liabilities (continued)
February 28, 2011
| | | | | | | | | |
| | | | | | | Franklin | | | Franklin |
| | | | Franklin | | | Massachusetts | | | New Jersey |
| | | | Insured Tax-Free | | | Tax-Free | | | Tax-Free |
| | | | Income Fund | | | Income Fund | | | Income Fund |
| Class A: | | | | | | | | | |
| Net assets, at value | $ | | 2,100,665,966 | $ | | 439,505,728 | $ | | 1,128,664,641 |
| Shares outstanding | | | 184,374,250 | | | 39,553,170 | | | 98,245,242 |
| Net asset value per sharea | | $ | 11.39 | | $ | 11.11 | | $ | 11.49 |
| Maximum offering price per share (net asset value | | | | | | | | | |
| per share ÷ 95.75%) | | $ | 11.90 | | $ | 11.60 | | $ | 12.00 |
| Class B: | | | | | | | | | |
| Net assets, at value | $ | | 19,301,760 | | | | $ | | 15,038,573 |
| Shares outstanding | | | 1,685,215 | | | | | | 1,300,772 |
| Net asset value and maximum offering price per sharea | | $ | 11.45 | | | | | $ | 11.56 |
| Class C: | | | | | | | | | |
| Net assets, at value | $ | | 385,479,190 | $ | | 83,046,217 | $ | | 276,916,169 |
| Shares outstanding | | | 33,433,846 | | | 7,404,089 | | | 23,864,120 |
| Net asset value and maximum offering price per sharea | | $ | 11.53 | | $ | 11.22 | | $ | 11.60 |
| Advisor Class: | | | | | | | | | |
| Net assets, at value | $ | | 21,854,853 | $ | | 4,007,465 | $ | | 25,378,039 |
| Shares outstanding | | | 1,918,599 | | | 360,794 | | | 2,208,379 |
| Net asset value and maximum offering price per share | | $ | 11.39 | | $ | 11.11 | | $ | 11.49 |
| |
| |
| aRedemption price is equal to net asset value less contingent deferred sales charges, if applicable. | | | | | | | | | |
182 | The accompanying notes are an integral part of these financial statements. | Annual Report
| | | | | | | | | | | | |
| Franklin Tax-Free Trust | | | | | | | | | | |
| |
| Financial Statements (continued) | | | | | | | | | | | | |
| |
| |
| Statements of Operations | | | | | | | | | | | | |
| for the year ended February 28, 2011 | | | | | | | | | | | | |
| |
| | | Franklin | | | Franklin Federal | | | Franklin Federal | | | Franklin | |
| | | Double | | | Intermediate- | | | Limited-Term | | | High Yield | |
| | | Tax-Free | | | Term Tax-Free | | | Tax-Free | | | Tax-Free | |
| | | Income Fund | | | Income Fund | | | Income Fund | | | Income Fund | |
| Investment income: | | | | | | | | | | | | |
| Interest | $ | 33,164,975 | | $ | 89,752,207 | | $ | 12,884,355 | | $ | 439,939,118 | |
| Expenses: | | | | | | | | | | | | |
| Management fees (Note 3a) | | 3,195,825 | | | 10,175,701 | | | 2,283,683 | | | 34,371,699 | |
| Administrative fees (Note 3b) | | — | | | — | | | 1,026,824 | | | — | |
| Distribution fees: (Note 3c) | | | | | | | | | | | | |
| Class A | | 546,360 | | | 1,503,611 | | | 747,694 | | | 5,472,230 | |
| Class B | | — | | | — | | | — | | | 338,218 | |
| Class C | | 659,536 | | | 2,216,289 | | | — | | | 6,998,924 | |
| Transfer agent fees (Note 3e) | | 339,259 | | | 1,403,091 | | | 155,977 | | | 4,105,365 | |
| Custodian fees | | 8,916 | | | 32,183 | | | 8,189 | | | 103,448 | |
| Reports to shareholders | | 47,711 | | | 179,500 | | | 24,021 | | | 500,001 | |
| Registration and filing fees | | 62,910 | | | 252,652 | | | 99,731 | | | 411,469 | |
| Professional fees | | 34,661 | | | 50,912 | | | 18,719 | | | 101,332 | |
| Trustees’ fees and expenses | | 3,679 | | | 11,813 | | | 2,631 | | | 43,093 | |
| Other | | 43,663 | | | 128,708 | | | 58,541 | | | 513,351 | |
| Total expenses | | 4,942,520 | | | 15,954,460 | | | 4,426,010 | | | 52,959,130 | |
| Expenses waived/paid by affiliates (Note 3f) | | — | | | — | | | (1,876,826 | ) | | — | |
| Net expenses | | 4,942,520 | | | 15,954,460 | | | 2,549,184 | | | 52,959,130 | |
| Net investment income | | 28,222,455 | | | 73,797,747 | | | 10,335,171 | | | 386,979,988 | |
| Realized and unrealized gains (losses): | | | | | | | | | | | | |
| Net realized gain (loss) from investments | | 312,982 | | | (13,763,031 | ) | | 16,647 | | | (23,576,190 | ) |
| Net change in unrealized appreciation (depreciation) on | | | | | | | | | | | | |
| investments | | (28,921,148 | ) | | (31,154,028 | ) | | (3,617,489 | ) | | (289,986,434 | ) |
| Net realized and unrealized gain (loss) | | (28,608,166 | ) | | (44,917,059 | ) | | (3,600,842 | ) | | (313,562,624 | ) |
| Net increase (decrease) in net assets resulting from | | | | | | | | | | | | |
| operations | $ | (385,711 | ) | $ | 28,880,688 | | $ | 6,734,329 | | $ | 73,417,364 | |
Annual Report | The accompanying notes are an integral part of these financial statements. | 183
| | | | | | | | | |
| Franklin Tax-Free Trust | | | | | | | | | |
| |
| Financial Statements (continued) | | | | | | | | | |
| |
| |
| Statements of Operations (continued) | | | | | | | | | |
| for the year ended February 28, 2011 | | | | | | | | | |
| |
| | | | | | Franklin | | | Franklin | |
| | | Franklin | | | Massachusetts | | | New Jersey | |
| | | Insured Tax-Free | | | Tax-Free | �� | | Tax-Free | |
| | | Income Fund | | | Income Fund | | | Income Fund | |
| Investment income: | | | | | | | | | |
| Interest | $ | 132,588,097 | | $ | 27,624,525 | | $ | 78,935,550 | |
| Expenses: | | | | | | | | | |
| Management fees (Note 3a) | | 12,397,879 | | | 2,877,769 | | | 7,508,862 | |
| Distribution fees: (Note 3c) | | | | | | | | | |
| Class A | | 2,236,650 | | | 493,119 | | | 1,259,233 | |
| Class B | | 210,576 | | | — | | | 162,680 | |
| Class C | | 2,658,969 | | | 579,602 | | | 2,013,149 | |
| Transfer agent fees (Note 3e) | | 1,120,015 | | | 218,261 | | | 679,629 | |
| Custodian fees | | 36,603 | | | 7,841 | | | 21,502 | |
| Reports to shareholders | | 140,139 | | | 30,137 | | | 77,141 | |
| Registration and filing fees | | 211,991 | | | 40,929 | | | 55,370 | |
| Professional fees | | 66,384 | | | 31,858 | | | 58,730 | |
| Trustees’ fees and expenses | | 15,298 | | | 3,383 | | | 9,294 | |
| Other | | 167,552 | | | 45,279 | | | 86,923 | |
| Total expenses | | 19,262,056 | | | 4,328,178 | | | 11,932,513 | |
| Net investment income | | 113,326,041 | | | 23,296,347 | | | 67,003,037 | |
| Realized and unrealized gains (losses): | | | | | | | | | |
| Net realized gain (loss) from investments | | (15,503,538 | ) | | 1,664,665 | | | (3,114,471 | ) |
| Net change in unrealized appreciation (depreciation) on investments | | (107,153,935 | ) | | (26,352,874 | ) | | (67,275,185 | ) |
| Net realized and unrealized gain (loss) | | (122,657,473 | ) | | (24,688,209 | ) | | (70,389,656 | ) |
| Net increase (decrease) in net assets resulting from operations | $ | (9,331,432 | ) | $ | (1,391,862 | ) | $ | (3,386,619 | ) |
184 | The accompanying notes are an integral part of these financial statements. | Annual Report
| | | | | | | | | | | | |
| Franklin Tax-Free Trust | | | | | | | | | | |
| |
| Financial Statements (continued) | | | | | | | | | | | | |
| |
| |
| Statements of Changes in Net Assets | | | | | | | | | | | | |
| |
| |
| | | | | | | | | Franklin Federal | |
| | | Franklin Double | | | Intermediate-Term | |
| | | Tax-Free Income Fund | | | Tax-Free Income Fund | |
| | | Year Ended February 28, | | | Year Ended February 28, | |
| | | 2011 | | | 2010 | | | 2011 | | | 2010 | |
| Increase (decrease) in net assets: | | | | | | | | | | | | |
| Operations: | | | | | | | | | | | | |
| Net investment income | $ | 28,222,455 | | $ | 25,304,901 | | $ | 73,797,747 | | $ | 49,955,383 | |
| Net realized gain (loss) from investments | | 312,982 | | | (3,751,188 | ) | | (13,763,031 | ) | | (224,628 | ) |
| Net change in unrealized appreciation | | | | | | | | | | | | |
| (depreciation) on investments | | (28,921,148 | ) | | 53,797,175 | | | (31,154,028 | ) | | 71,629,053 | |
| Net increase (decrease) in net assets | | | | | | | | | | | | |
| resulting from operations | | (385,711 | ) | | 75,350,888 | | | 28,880,688 | | | 121,359,808 | |
| Distributions to shareholders from: | | | | | | | | | | | | |
| Net investment income: | | | | | | | | | | | | |
| Class A | | (24,166,725 | ) | | (21,692,911 | ) | | (53,049,385 | ) | | (42,673,788 | ) |
| Class C | | (3,894,261 | ) | | (3,172,160 | ) | | (9,844,132 | ) | | (5,379,158 | ) |
| Advisor Class | | (167,143 | ) | | (56,202 | ) | | (11,072,357 | ) | | (2,705,120 | ) |
| Total distributions to shareholders | | (28,228,129 | ) | | (24,921,273 | ) | | (73,965,874 | ) | | (50,758,066 | ) |
| Capital share transactions: (Note 2) | | | | | | | | | | | | |
| Class A | | 39,034,570 | | | (3,335,572 | ) | | 124,524,455 | | | 459,010,683 | |
| Class C | | 9,694,824 | | | 10,670,149 | | | 106,955,876 | | | 157,438,425 | |
| Advisor Class | | 1,885,580 | | | 2,416,475 | | | 306,654,205 | | | 135,167,541 | |
| Total capital share transactions | | 50,614,974 | | | 9,751,052 | | | 538,134,536 | | | 751,616,649 | |
| Net increase (decrease) in net assets | | 22,001,134 | | | 60,180,667 | | | 493,049,350 | | | 822,218,391 | |
| Net assets: | | | | | | | | | | | | |
| Beginning of year | | 600,656,362 | | | 540,475,695 | | | 1,792,799,563 | | | 970,581,172 | |
| End of year | $ | 622,657,496 | | $ | 600,656,362 | | $ | 2,285,848,913 | | $ | 1,792,799,563 | |
| Undistributed net investment income | | | | | | | | | | | | |
| (distributions in excess of net investment | | | | | | | | | | | | |
| income) included in net assets: | | | | | | | | | | | | |
| End of year | $ | 601,729 | | $ | 456,117 | | $ | (802,733 | ) | $ | (853,001 | ) |
Annual Report | The accompanying notes are an integral part of these financial statements. | 185
| | | | | | | | | | | | |
| Franklin Tax-Free Trust | | | | | | | | | | |
| |
| Financial Statements (continued) | | | | | | | | | | | | |
| |
| |
| Statements of Changes in Net Assets (continued) | | | | | | | | | | |
| |
| |
| | | Franklin Federal Limited-Term | | | Franklin High Yield | |
| | | Tax-Free Income Fund | | | Tax-Free Income Fund | |
| | | Year Ended February 28, | | | Year Ended February 28, | |
| | | 2011 | | | 2010 | | | 2011 | | | 2010 | |
| Increase (decrease) in net assets: | | | | | | | | | | | | |
| Operations: | | | | | | | | | | | | |
| Net investment income | $ | 10,335,171 | | $ | 6,191,810 | | $ | 386,979,988 | | $ | 348,461,694 | |
| Net realized gain (loss) from investments | | 16,647 | | | (2,816 | ) | | (23,576,190 | ) | | (8,206,383 | ) |
| Net change in unrealized appreciation | | | | | | | | | | | | |
| (depreciation) on investments | | (3,617,489 | ) | | 6,454,025 | | | (289,986,434 | ) | | 818,536,691 | |
| Net increase (decrease) in net assets | | | | | | | | | | | | |
| resulting from operations | | 6,734,329 | | | 12,643,019 | | | 73,417,364 | | | 1,158,792,002 | |
| Distributions to shareholders from: | | | | | | | | | | | | |
| Net investment income: | | | | | | | | | | | | |
| Class A | | (10,545,034 | ) | | (6,244,991 | ) | | (289,445,580 | ) | | (284,270,838 | ) |
| Class B | | — | | | — | | | (2,397,988 | ) | | (4,239,652 | ) |
| Class C | | — | | | — | | | (48,557,165 | ) | | (42,845,055 | ) |
| Advisor Class | | (31,509 | ) | | — | | | (43,420,706 | ) | | (22,975,371 | ) |
| Total distributions to shareholders | | (10,576,543 | ) | | (6,244,991 | ) | | (383,821,439 | ) | | (354,330,916 | ) |
| Capital share transactions: (Note 2) | | | | | | | | | | | | |
| Class A | | 264,293,554 | | | 189,236,973 | | | (115,238,551 | ) | | 586,676,631 | |
| Class B | | — | | | — | | | (34,031,182 | ) | | (29,593,015 | ) |
| Class C | | — | | | — | | | 39,950,101 | | | 232,848,212 | |
| Advisor Class | | 28,948,443 | | | — | | | 261,492,931 | | | 398,897,599 | |
| Total capital share transactions | | 293,241,997 | | | 189,236,973 | | | 152,173,299 | | | 1,188,829,427 | |
| Net increase (decrease) in net assets | | 289,399,783 | | | 195,635,001 | | | (158,230,776 | ) | | 1,993,290,513 | |
| Net assets: | | | | | | | | | | | | |
| Beginning of year | | 380,521,618 | | | 184,886,617 | | | 7,170,611,340 | | | 5,177,320,827 | |
| End of year | $ | 669,921,401 | | $ | 380,521,618 | | $ | 7,012,380,564 | | $ | 7,170,611,340 | |
| Undistributed net investment income | | | | | | | | | | | | |
| (distributions in excess of net investment | | | | | | | | | | | | |
| income) included in net assets: | | | | | | | | | | | | |
| End of year | $ | (163,844 | ) | $ | 98,615 | | $ | 10,924,857 | | $ | 7,890,940 | |
186 | The accompanying notes are an integral part of these financial statements. | Annual Report
| | | | | | | | | | | | |
| Franklin Tax-Free Trust | | | | | | | | | | |
| |
| Financial Statements (continued) | | | | | | | | | | | | |
| |
| |
| Statements of Changes in Net Assets (continued) | | | | | | | | | | |
| |
| |
| | | Franklin Insured | | | Franklin Massachusetts | |
| | | Tax-Free Income Fund | | | Tax-Free Income Fund | |
| | | Year Ended February 28, | | | Year Ended February 28, | |
| | | 2011 | | | 2010 | | | 2011 | | | 2010 | |
| Increase (decrease) in net assets: | | | | | | | | | | | | |
| Operations: | | | | | | | | | | | | |
| Net investment income | $ | 113,326,041 | | $ | 101,014,156 | | $ | 23,296,347 | | $ | 23,031,236 | |
| Net realized gain (loss) from investments | | (15,503,538 | ) | | (1,552,121 | ) | | 1,664,665 | | | (698,207 | ) |
| Net change in unrealized appreciation | | | | | | | | | | | | |
| (depreciation) on investments | | (107,153,935 | ) | | 132,762,115 | | | (26,352,874 | ) | | 32,321,961 | |
| Net increase (decrease) in net assets | | | | | | | | | | | | |
| resulting from operations | | (9,331,432 | ) | | 232,224,150 | | | (1,391,862 | ) | | 54,654,990 | |
| Distributions to shareholders from: | | | | | | | | | | | | |
| Net investment income: | | | | | | | | | | | | |
| Class A | | (96,687,584 | ) | | (88,913,999 | ) | | (20,300,298 | ) | | (20,212,258 | ) |
| Class B | | (1,225,306 | ) | | (2,028,352 | ) | | — | | | — | |
| Class C | | (15,114,096 | ) | | (10,200,313 | ) | | (3,139,535 | ) | | (2,790,789 | ) |
| Advisor Class | | (637,789 | ) | | (345,196 | ) | | (192,010 | ) | | (76,262 | ) |
| Net realized gains: | | | | | | | | | | | | |
| Class A | | — | | | — | | | (879,262 | ) | | — | |
| Class C | | — | | | — | | | (164,138 | ) | | — | |
| Advisor Class | | — | | | — | | | (9,343 | ) | | — | |
| Total distributions to shareholders | | (113,664,775 | ) | | (101,487,860 | ) | | (24,684,586 | ) | | (23,079,309 | ) |
| Capital share transactions: (Note 2) | | | | | | | | | | | | |
| Class A | | 65,441,675 | | | 214,014,398 | | | (33,157,846 | ) | | 21,442,773 | |
| Class B | | (22,784,651 | ) | | (16,558,298 | ) | | — | | | — | |
| Class C | | 67,288,570 | | | 129,337,661 | | | 3,749,147 | | | 11,119,208 | |
| Advisor Class | | 13,465,558 | | | 7,450,151 | | | 263,361 | | | 3,936,799 | |
| Total capital share transactions | | 123,411,152 | | | 334,243,912 | | | (29,145,338 | ) | | 36,498,780 | |
| Net increase (decrease) in net assets | | 414,945 | | | 464,980,202 | | | (55,221,786 | ) | | 68,074,461 | |
| Net assets: | | | | | | | | | | | | |
| Beginning of year | | 2,526,886,824 | | | 2,061,906,622 | | | 581,781,196 | | | 513,706,735 | |
| End of year | $ | 2,527,301,769 | | $ | 2,526,886,824 | | $ | 526,559,410 | | $ | 581,781,196 | |
| Undistributed net investment income | | | | | | | | | | | | |
| (distributions in excess of net investment | | | | | | | | | | | | |
| income) included in net assets: | | | | | | | | | | | | |
| End of year | $ | (510,886 | ) | $ | (330,771 | ) | $ | (270,471 | ) | $ | 41,941 | |
Annual Report | The accompanying notes are an integral part of these financial statements. | 187
| | | | | | |
| Franklin Tax-Free Trust | | | | | | |
| |
| Financial Statements (continued) | | | | | | |
| |
| |
| Statements of Changes in Net Assets (continued) | | | | | | |
| |
| |
| | | Franklin New Jersey | |
| | | Tax-Free Income Fund | |
| | | Year Ended February 28, | |
| | | 2011 | | | 2010 | |
| Increase (decrease) in net assets: | | | | | | |
| Operations: | | | | | | |
| Net investment income | $ | 67,003,037 | | $ | 63,081,023 | |
| Net realized gain (loss) from investments | | (3,114,471 | ) | | 1,286,652 | |
| Net change in unrealized appreciation (depreciation) on investments | | (67,275,185 | ) | | 82,802,325 | |
| Net increase (decrease) in net assets resulting from operations | | (3,386,619 | ) | | 147,170,000 | |
| Distributions to shareholders from: | | | | | | |
| Net investment income: | | | | | | |
| Class A | | (54,611,175 | ) | | (50,323,389 | ) |
| Class B | | (952,368 | ) | | (1,587,698 | ) |
| Class C | | (11,540,273 | ) | | (9,266,851 | ) |
| Advisor Class | | (877,922 | ) | | (341,300 | ) |
| Net realized gains: | | | | | | |
| Class A | | (366,025 | ) | | — | |
| Class B | | (5,526 | ) | | — | |
| Class C | | (91,669 | ) | | — | |
| Advisor Class | | (7,967 | ) | | — | |
| Total distributions to shareholders | | (68,452,925 | ) | | (61,519,238 | ) |
| Capital share transactions: (Note 2) | | | | | | |
| Class A | | (46,593,985 | ) | | 61,986,632 | |
| Class B | | (19,247,662 | ) | | (15,049,955 | ) |
| Class C | | (1,722,226 | ) | | 70,973,653 | |
| Advisor Class | | 13,075,008 | | | 12,578,775 | |
| Total capital share transactions | | (54,488,865 | ) | | 130,489,105 | |
| Net increase (decrease) in net assets | | (126,328,409 | ) | | 216,139,867 | |
| Net assets: | | | | | | |
| Beginning of year | | 1,572,325,831 | | | 1,356,185,964 | |
| End of year | $ | 1,445,997,422 | | $ | 1,572,325,831 | |
| Undistributed net investment income included in net assets: | | | | | | |
| End of year | $ | 1,458,728 | | $ | 2,328,171 | |
188 | The accompanying notes are an integral part of these financial statements. | Annual Report
Franklin Tax-Free Trust
Notes to Financial Statements
1. ORGANIZATION AND SIGNIFICANT ACCOUNTING POLICIES
Franklin Tax-Free Trust (Trust) is registered under the Investment Company Act of 1940, as amended, (1940 Act) as an open-end investment company, consisting of twenty-four separate funds, seven of which are included in this report (Funds). The financial statements of the remaining funds in the Trust are presented separately. The classes of shares offered within each of the Funds are indicated below. Effective February 1, 2011, the Franklin Federal Limited-Term Tax-Free Income Fund began offering a new class of shares, Advisor Class. Each class of shares differs by its initial sales load, contingent deferred sales charges, distribution fees, voting rights on matters affecting a single class and its exchange privilege.
| |
| Class A & Advisor Class | Class A, Class C & Advisor Class |
| Franklin Federal Limited-Term Tax-Free Income Fund | Franklin Double Tax-Free Income Fund |
| | Franklin Federal Intermediate-Term Tax-Free Income Fund |
| | Franklin Massachusetts Tax-Free Income Fund |
| |
| Class A, Class B, Class C & Advisor Class | |
| Franklin High Yield Tax-Free Income Fund | |
| Franklin Insured Tax-Free Income Fund | |
| Franklin New Jersey Tax-Free Income Fund | |
The following summarizes the Funds’ significant accounting policies.
a. Financial Instrument Valuation
The Funds’ investments in securities and other financial instruments are carried at fair value daily. Fair value is the price that would be received to sell an asset or paid to transfer a liability in an orderly transaction between market participants on the measurement date. Under procedures approved by the Trust’s Board of Trustees, the Funds may utilize independent pricing services, quotations from securities and financial instrument dealers, and other market sources to determine fair value.
Debt securities generally trade in the over-the-counter market rather than on a securities exchange. The Funds’ pricing services use multiple valuation techniques to determine fair value. In instances where sufficient market activity exists, the pricing services may utilize a market-based approach through which quotes from market makers are used to determine fair value. In instances where sufficient market activity may not exist or is limited, the pricing services also utilize proprietary valuation models which may consider market characteristics such as benchmark yield curves, option-adjusted spreads, credit spreads, estimated default rates, coupon rates, anticipated timing of principal repayments, underlying collateral, and other unique security features in order to estimate the relevant cash flows, which are then discounted to calculate the fair value.
Annual Report | 189
Franklin Tax-Free Trust
Notes to Financial Statements (continued)
| 1. | ORGANIZATION AND SIGNIFICANT ACCOUNTING POLICIES (continued) |
| a. | Financial Instrument Valuation (continued) |
The Funds have procedures to determine the fair value of securities and other financial instruments for which market prices are not readily available or which may not be reliably priced. Under these procedures, the Funds primarily employ a market-based approach which may use related or comparable assets or liabilities, recent transactions, market multiples, book values, and other relevant information for the investment to determine the fair value of the investment. The Funds may also use an income-based valuation approach in which the anticipated future cash flows of the investment are discounted to calculate fair value. Discounts may also be applied due to the nature or duration of any restrictions on the disposition of the investments. Due to the inherent uncertainty of valuations of such investments, the fair values may differ significantly from the values that would have been used had an active market existed.
b. Securities Purchased on a When-Issued Basis
The Funds may purchase securities on a when-issued basis, with payment and delivery scheduled for a future date. These transactions are subject to market fluctuations and are subject to the risk that the value at delivery may be more or less than the trade date purchase price. Although the Funds will generally purchase these securities with the intention of holding the securities, they may sell the securities before the settlement date. Sufficient assets have been segregated for these securities.
c. Income Taxes
It is each fund’s policy to qualify as a regulated investment company under the Internal Revenue Code. Each fund intends to distribute to shareholders substantially all of its income and net realized gains to relieve it from federal income and excise taxes. As a result, no provision for U.S. federal income taxes is required. Each fund files U.S. income tax returns as well as tax returns in certain other jurisdictions. Each fund’s application of those tax rules is subject to its understanding. Each fund records a provision for taxes in its financial statements including penalties and interest, if any, for a tax position taken on a tax return (or expected to be taken) when it fails to meet the more likely than not (a greater than 50% probability) threshold and based on the technical merits, the tax position may not be sustained upon examination by the tax authorities. As of February 28, 2011, and for all open tax years, each fund has determined that no provision for income tax is required in each fund’s financial statements. Open tax years are those that remain subject to examination and are based on each tax jurisdiction statute of limitation. Each fund is not aware of any tax position for which it is reasonably possible that the total amounts of unrecognized tax effects will significantly change in the next twelve months.
190 | Annual Report
Franklin Tax-Free Trust
Notes to Financial Statements (continued)
| 1. | ORGANIZATION AND SIGNIFICANT ACCOUNTING POLICIES (continued) |
| d. | Security Transactions, Investment Income, Expenses and Distributions |
Security transactions are accounted for on trade date. Realized gains and losses on security transactions are determined on a specific identification basis. Interest income and estimated expenses are accrued daily. Amortization of premium and accretion of discount on debt securities are included in interest income. Dividends from net investment income are normally declared daily; these dividends may be reinvested or paid monthly to shareholders. Distributions from realized capital gains and other distributions, if any, are recorded on the ex-dividend date. Distributions to shareholders are determined according to income tax regulations (tax basis). Distributable earnings determined on a tax basis may differ from earnings recorded in accordance with accounting principles generally accepted in the United States of America. These differences may be permanent or temporary. Permanent differences are reclassified among capital accounts to reflect their tax character. These reclassifications have no impact on net assets or the results of operations. Temporary differences are not reclassified, as they may reverse in subsequent periods.
Common expenses incurred by the Trust are allocated among the funds based on the ratio of net assets of each fund to the combined net assets of the Trust. Fund specific expenses are charged directly to the fund that incurred the expense.
Realized and unrealized gains and losses and net investment income, not including class specific expenses, are allocated daily to each class of shares based upon the relative proportion of net assets of each class. Differences in per share distributions, by class, are generally due to differences in class specific expenses.
e. Insurance
The scheduled payments of interest and principal for each insured municipal security in the Trust are insured by either a new issue insurance policy or a secondary insurance policy. Some municipal securities in the Funds are secured by collateral guaranteed by an agency of the U.S. government. Insurance companies typically insure municipal bonds that tend to be of very high quality, with the majority of underlying municipal bonds rated A or better. However, there is a risk that in the event of an issuer default, the insurer may not be able to fulfill its obligations under the terms of the policy.
Depending on the type of coverage, premiums for insurance are either added to the cost basis of the security or paid by a third party.
f. Accounting Estimates
The preparation of financial statements in accordance with accounting principles generally accepted in the United States of America requires management to make estimates and assumptions that affect the reported amounts of assets and liabilities at the date of the financial statements and the amounts of income and expenses during the reporting period. Actual results could differ from those estimates.
Annual Report | 191
Franklin Tax-Free Trust
Notes to Financial Statements (continued)
| 1. | ORGANIZATION AND SIGNIFICANT ACCOUNTING POLICIES (continued) |
| g. | Guarantees and Indemnifications |
Under the Trust’s organizational documents, its officers and trustees are indemnified by the Trust against certain liabilities arising out of the performance of their duties to the Trust. Additionally, in the normal course of business, the Trust, on behalf of the Funds, enters into contracts with service providers that contain general indemnification clauses. The Trust’s maximum exposure under these arrangements is unknown as this would involve future claims that may be made against the Trust that have not yet occurred. Currently, the Trust expects the risk of loss to be remote.
2. SHARES OF BENEFICIAL INTEREST
At February 28, 2011, there were an unlimited number of shares authorized (without par value).
Transactions in the Funds’ shares were as follows:
| | | | | | | | | | | |
| | | | | | | | Franklin Federal | |
| | Franklin Double | | Intermediate-Term | |
| | Tax-Free Income Fund | | Tax-Free Income Fund | |
| | Shares | | | | Amount | | Shares | | | Amount | |
| Class A Shares: | | | | | | | | | | | |
| Year ended February 28, 2011 | | | | | | | | | | | |
| Shares sold | 12,293,945 | | $ | 144,158,642 | | 63,204,912 | | $ | 736,824,122 | |
| Shares issued in reinvestment of | | | | | | | | | | | |
| distributions | 1,601,287 | | | | 18,615,435 | | 3,388,266 | | | 39,394,126 | |
| Shares redeemed | (10,746,413 | ) | | | (123,739,507 | ) | (56,037,915 | ) | | (651,693,793 | ) |
| Net increase (decrease) | 3,148,819 | | | $ | 39,034,570 | | 10,555,263 | | $ | 124,524,455 | |
| Year ended February 28, 2010 | | | | | | | | | | | |
| Shares sold | 7,991,759 | | | $ | 88,642,025 | | 66,347,269 | | $ | 748,892,309 | |
| Shares issued in reinvestment of | | | | | | | | | | | |
| distributions | 1,450,733 | | | | 16,078,372 | | 2,684,864 | | | 30,420,972 | |
| Shares redeemed | (9,916,957 | ) | | | (108,055,969 | ) | (28,480,303 | ) | | (320,302,598 | ) |
| Net increase (decrease) | (474,465 | ) | | $ | (3,335,572 | ) | 40,551,830 | | $ | 459,010,683 | |
| Class C Shares: | | | | | | | | | | | |
| Year ended February 28, 2011 | | | | | | | | | | | |
| Shares sold | 2,941,997 | | | $ | 34,905,756 | | 18,135,107 | | $ | 212,081,002 | |
| Shares issued in reinvestment of | | | | | | | | | | | |
| distributions | 245,137 | | | | 2,860,927 | | 551,031 | | | 6,422,164 | |
| Shares redeemed | (2,440,739 | ) | | | (28,071,859 | ) | (9,670,299 | ) | | (111,547,290 | ) |
| Net increase (decrease) | 746,395 | | | $ | 9,694,824 | | 9,015,839 | | $ | 106,955,876 | |
| Year ended February 28, 2010 | | | | | | | | | | | |
| Shares sold | 1,989,310 | | | $ | 22,220,698 | | 16,109,032 | | $ | 182,788,883 | |
| Shares issued in reinvestment of | | | | | | | | | | | |
| distributions | 199,621 | | | | 2,222,422 | | 285,504 | | | 3,249,520 | |
| Shares redeemed | (1,255,900 | ) | | | (13,772,971 | ) | (2,520,193 | ) | | (28,599,978 | ) |
| Net increase (decrease) | 933,031 | | | $ | 10,670,149 | | 13,874,343 | | $ | 157,438,425 | |
192 | Annual Report
Franklin Tax-Free Trust
Notes to Financial Statements (continued)
| | | | | | | | | | | | | | | | | |
| 2. SHARES OF BENEFICIAL INTEREST (continued) | | | | | | | | | | | | | | | | |
| |
| | | | | | | | | Franklin Federal | | | | | |
| | Franklin Double | | Intermediate-Term | | | | | |
| | Tax-Free Income Fund | | Tax-Free Income Fund | | | | | |
| | Shares | | | | | Amount | | Shares | | | | Amount | | | | | |
| Advisor Class Shares: | | | | | | | | | | | | | | | | | |
| Year ended February 28, 2011 | | | | | | | | | | | | | | | | | |
| Shares sold | 320,102 | | | $ | | 3,820,012 | | 40,017,865 | | $ | 473,005,449 | | | | | |
| Shares issued in reinvestment of | | | | | | | | | | | | | | | | | |
| distributions | 2,605 | | | | | 29,711 | | 289,287 | | | | 3,344,425 | | | | | |
| Shares redeemed | (173,336 | ) | (1,964,143 | ) | (14,718,966 | ) | | | (169,695,669 | ) | | | | |
| Net increase (decrease) | 149,371 | | | $ | | 1,885,580 | | 25,588,186 | | $ | 306,654,205 | | | | | |
| Year ended February 28, 2010a | | | | | | | | | | | | | | | | | |
| Shares sold | 236,421 | | | $ | | 2,611,223 | | 13,942,484 | | $ | 158,042,416 | | | | | |
| Shares issued in reinvestment of | | | | | | | | | | | | | | | | | |
| distributions | 47 | | | | | 534 | | 27,790 | | | | 317,181 | | | | | |
| Shares redeemed | (17,129 | ) | (195,282 | ) | (2,019,454 | ) | | | (23,192,056 | ) | | | | |
| Net increase (decrease) | 219,339 | | | $ | | 2,416,475 | | 11,950,820 | | $ | 135,167,541 | | | | | |
| |
| aFor the period July 15, 2009 (effective date) to February 28, 2010 for the Franklin Double Tax-Free Income Fund. | | | | | | | | | |
| |
| | Franklin Federal | | Franklin | | | | | |
| | Limited-Term | | High Yield | | | | | |
| | Tax-Free Income Fund | | Tax-Free Income Fund | | | | | |
| | Shares | | | Amount | | Shares | | | | Amount | | | | | |
| Class A Shares: | | | | | | | | | | | | | | | | | |
| Year ended February 28, 2011 | | | | | | | | | | | | | | | | | |
| Shares sold | 47,804,572 | | $ | 494,798,400 | | 97,296,734 | | | $ | 977,100,810 | | | | | |
| Shares issued in reinvestment | | | | | | | | | | | | | | | | | |
| of distributions | 685,744 | | | | | 7,097,403 | | 19,020,088 | | | | 189,973,012 | | | | | |
| Shares redeemed | (23,004,978 | ) | | (237,602,249 | ) | (129,935,472 | ) | | (1,282,312,373 | ) | | |
| Net increase (decrease) | 25,485,338 | | $ | 264,293,554 | | (13,618,650 | ) | | $ | (115,238,551 | ) | | | | |
| Year ended February 28, 2010 | | | | | | | | | | | | | | | | | |
| Shares sold | 29,888,601 | | $ | 305,896,845 | | 117,986,688 | | $ | 1,119,081,032 | | | | | |
| Shares issued in reinvestment | | | | | | | | | | | | | | | | | |
| of distributions | 442,091 | | | | | 4,525,163 | | 18,699,057 | | | | 177,627,591 | | | | | |
| Shares redeemed | (11,838,520 | ) | | (121,185,035 | ) | (74,575,160 | ) | | | (710,031,992 | ) | | | | |
| Net increase (decrease) | 18,492,172 | | $ | 189,236,973 | | 62,110,585 | | | $ | 586,676,631 | | | | | |
| Class B Shares: | | | | | | | | | | | | | | | | | |
| Year ended February 28, 2011 | | | | | | | | | | | | | | | | | |
| Shares sold | | | | | | | | 87,916 | | | $ | 890,508 | | | | | |
| Shares issued in reinvestment | | | | | | | | | | | | | | | | | |
| of distributions | | | | | | | | 150,334 | | | | 1,518,140 | | | | | |
| Shares redeemed | | | | | | | | (3,614,227 | ) | | | (36,439,830 | ) | | | | |
| Net increase (decrease) | | | | | | | | (3,375,977 | ) | | $ | (34,031,182 | ) | | | | |
| Year ended February 28, 2010 | | | | | | | | | | | | | | | | | |
| Shares sold | | | | | | | | 370,865 | | | $ | 3,508,356 | | | | | |
| Shares issued in reinvestment | | | | | | | | | | | | | | | | | |
| of distributions | | | | | | | | 269,663 | | | | 2,563,555 | | | | | |
| Shares redeemed | | | | | | | | (3,730,649 | ) | | | (35,664,926 | ) | | | | |
| Net increase (decrease) | | | | | | | | (3,090,121 | ) | | $ | (29,593,015 | ) | | | | |
| | | | | | | | | | | | | | | Annual Report | | | | 193 |
Franklin Tax-Free Trust
Notes to Financial Statements (continued)
2. SHARES OF BENEFICIAL INTEREST (continued)
| | | | | | | | | | | | | | |
| | Franklin Federal | | Franklin | |
| | Limited-Term | | High Yield | |
| | Tax-Free Income Fund | | Tax-Free Income Fund | |
| | Shares | | | | | Amount | | Shares | | | | | Amount | |
| Class C Shares: | | | | | | | | | | | | | | |
| Year ended February 28, 2011 | | | | | | | | | | | | | | |
| Shares sold | | | | | | | | 25,557,425 | | $ | | | 261,096,346 | |
| Shares issued in reinvestment | | | | | | | | | | | | | | |
| of distributions | | | | | | | | 3,262,596 | | | | | 33,020,628 | |
| Shares redeemed | | | | | | | | (25,514,255 | ) | | | | (254,166,873 | ) |
| Net increase (decrease) | | | | | | | | 3,305,766 | | $ | | | 39,950,101 | |
| Year ended February 28, 2010 | | | | | | | | | | | | | | |
| Shares sold | | | | | | | | 33,253,253 | | $ | | | 320,639,435 | |
| Shares issued in reinvestment | | | | | | | | | | | | | | |
| of distributions | | | | | | | | 2,892,508 | | | | | 27,866,718 | |
| Shares redeemed | | | | | | | | (11,950,765 | ) | | | | (115,657,941 | ) |
| Net increase (decrease) | | | | | | | | 24,194,996 | | $ | | | 232,848,212 | |
| Advisor Class Shares: | | | | | | | | | | | | | | |
| Year ended February 28, 2011a | | | | | | | | | | | | | | |
| Shares sold | 2,946,576 | | $ | | | 30,202,812 | | 65,791,811 | | $ | | | 657,916,881 | |
| Shares issued in reinvestment | | | | | | | | | | | | | | |
| of distributions | 4 | | | | | 45 | | 2,870,710 | | | | | 28,789,706 | |
| Shares redeemed | (121,984 | ) | | | | (1,254,414 | ) | (42,531,719 | ) | | | | (425,213,656 | ) |
| Net increase (decrease) | 2,824,596 | | $ | | | 28,948,443 | | 26,130,802 | | $ | | | 261,492,931 | |
| Year ended February 28, 2010 | | | | | | | | | | | | | | |
| Shares sold | | | | | | | | 59,264,698 | | $ | | | 561,412,571 | |
| Shares issued in reinvestment | | | | | | | | | | | | | | |
| of distributions | | | | | | | | 1,348,347 | | | | | 13,040,176 | |
| Shares redeemed | | | | | | | | (18,016,271 | ) | | | | (175,555,148 | ) |
| Net increase (decrease) | | | | | | | | 42,596,774 | | $ | | | 398,897,599 | |
| |
| aFor the period February 1, 2011 (effective date) to February 28, 2011 for Franklin Federal Limited-Term Tax-Free Income Fund. | | | | |
| |
| | | | Franklin Insured | | Franklin Massachusetts | |
| | Tax-Free Income Fund | | Tax-Free Income Fund | |
| | Shares | | | Amount | | Shares | | | | | Amount | |
| Class A Shares: | | | | | | | | | | | | | | |
| Year ended February 28, 2011 | | | | | | | | | | | | | | |
| Shares sold | 40,461,619 | | $ | 480,681,602 | | 4,379,541 | | | | $ | 50,773,125 | |
| Shares issued in reinvestment | | | | | | | | | | | | | | |
| of distributions | 5,483,401 | | | 64,600,100 | | 1,136,796 | | | | | 13,046,272 | |
| Shares redeemed | (41,266,084 | ) | | (479,840,027) (8,578,736) | | | (96,977,243 | ) |
| Net increase (decrease) | 4,678,936 | | $ | 65,441,675 | | (3,062,399 | ) | $ | (33,157,846 | ) |
| Year ended February 28, 2010 | | | | | | | | | | | | | | |
| Shares sold | 37,711,031 | | $ | 439,557,977 | | 5,589,847 | | | | $ | 63,681,155 | |
| Shares issued in reinvestment | | | | | | | | | | | | | | |
| of distributions | 4,815,932 | | | 56,252,801 | | 1,050,740 | | | | | 11,958,727 | |
| Shares redeemed | (24,242,807 | ) | | (281,796,380) (4,772,512) | | | (54,197,109 | ) |
| Net increase (decrease) | 18,284,156 | | $ | 214,014,398 | | 1,868,075 | | | | $ | 21,442,773 | |
| |
| 194 | Annual Report | | | | | | | | | | | | | | |
| | | | | | | | | | | | | |
| Franklin Tax-Free Trust | | | | | | | | | |
| |
| Notes to Financial Statements (continued) | | | | | | | | | | | | |
| |
| |
| 2. SHARES OF BENEFICIAL INTEREST (continued) | | | | | | | | | | | | |
| |
| | Franklin Insured | | Franklin Massachusetts | | | | |
| | Tax-Free Income Fund | | Tax-Free Income Fund | | | | |
| | Shares | | | Amount | | Shares | | | Amount | | | | |
| Class B Shares: | | | | | | | | | | | | | |
| Year ended February 28, 2011 | | | | | | | | | | | | | |
| Shares sold | 46,629 | | $ | 553,521 | | | | | | | | | |
| Shares issued in reinvestment | | | | | | | | | | | | | |
| of distributions | 70,178 | | | 834,287 | | | | | | | | | |
| Shares redeemed | (2,039,586 | ) | | (24,172,459 | ) | | | | | | | | |
| Net increase (decrease) | (1,922,779 | ) | $ | (22,784,651 | ) | | | | | | | | |
| Year ended February 28, 2010 | | | | | | | | | | | | | |
| Shares sold | 232,330 | | $ | 2,716,768 | | | | | | | | | |
| Shares issued in reinvestment | | | | | | | | | | | | | |
| of distributions | 111,107 | | | 1,301,241 | | | | | | | | | |
| Shares redeemed | (1,752,344 | ) | | (20,576,307 | ) | | | | | | | | |
| Net increase (decrease) | (1,408,907 | ) | $ | (16,558,298 | ) | | | | | | | | |
| Class C Shares: | | | | | | | | | | | | | |
| Year ended February 28, 2011 | | | | | | | | | | | | | |
| Shares sold | 15,866,963 | | $ | 191,491,289 | | 1,477,347 | | $ | 17,369,988 | | | | |
| Shares issued in reinvestment | | | | | | | | | | | | | |
| of distributions | 895,703 | | | 10,660,143 | | 207,781 | | | 2,405,707 | | | | |
| Shares redeemed | (11,583,274 | ) | | (134,862,862 | ) | (1,407,681 | ) | | (16,026,548 | ) | | | |
| Net increase (decrease) | 5,179,392 | | $ | 67,288,570 | | 277,447 | | $ | 3,749,147 | | | | |
| Year ended February 28, 2010 | | | | | | | | | | | | | |
| Shares sold | 13,766,749 | | $ | 162,844,477 | | 1,820,204 | | $ | 20,948,250 | | | | |
| Shares issued in reinvestment | | | | | | | | | | | | | |
| of distributions | 573,630 | | | 6,784,479 | | 173,740 | | | 1,994,839 | | | | |
| Shares redeemed | (3,416,036 | ) | | (40,291,295 | ) | (1,034,991 | ) | | (11,823,881 | ) | | | |
| Net increase (decrease) | 10,924,343 | | $ | 129,337,661 | | 958,953 | | $ | 11,119,208 | | | | |
| Advisor Class Shares: | | | | | | | | | | | | | |
| Year ended February 28, 2011 | | | | | | | | | | | | | |
| Shares sold | 1,782,234 | | $ | 21,003,725 | | 304,882 | | $ | 3,519,329 | | | | |
| Shares issued in reinvestment | | | | | | | | | | | | | |
| of distributions | 26,203 | | | 303,387 | | 1,017 | | | 11,327 | | | | |
| Shares redeemed | (681,998 | ) | | (7,841,554 | ) | (291,047 | ) | | (3,267,295 | ) | | | |
| Net increase (decrease) | 1,126,439 | | $ | 13,465,558 | | 14,852 | | $ | 263,361 | | | | |
| Year ended February 28, 2010a | | | | | | | | | | | | | |
| Shares sold | 1,327,740 | | $ | 15,276,985 | | 392,659 | | $ | 4,478,842 | | | | |
| Shares issued in reinvestment | | | | | | | | | | | | | |
| of distributions | 6,463 | | | 75,797 | | 21 | | | 243 | | | | |
| Shares redeemed | (668,642 | ) | | (7,902,631 | ) | (46,738 | ) | | (542,286 | ) | | | |
| Net increase (decrease) | 665,561 | | $ | 7,450,151 | | 345,942 | | $ | 3,936,799 | | | | |
| |
| aFor the period July 1, 2009 (effective date) to February 28, 2010 for the Franklin Massachusetts Tax-Free Income Fund. | | | | | | | |
| |
| |
| |
| |
| | | | | | | | | | | | Annual Report | | | 195 |
| | | | | | |
| Franklin Tax-Free Trust | | | | | | |
| |
| Notes to Financial Statements (continued) | | | | | | |
| |
| |
| 2. SHARES OF BENEFICIAL INTEREST (continued) | | | | | | |
| |
| | Franklin New Jersey | |
| | Tax-Free Income Fund | |
| | Shares | | | | Amount | |
| Class A Shares: | | | | | | |
| Year ended February 28, 2011 | | | | | | |
| Shares sold | 20,185,765 | | $ | 242,001,145 | |
| Shares issued in reinvestment of distributions | 3,056,452 | | | | 36,523,792 | |
| Shares redeemed | (27,621,919 | ) | | | (325,118,922 | ) |
| Net increase (decrease) | (4,379,702 | ) | | $ | (46,593,985 | ) |
| Year ended February 28, 2010 | | | | | | |
| Shares sold | 20,715,015 | | $ | 243,577,335 | |
| Shares issued in reinvestment of distributions | 2,843,942 | | | | 33,483,508 | |
| Shares redeemed | (18,345,754 | ) | | | (215,074,211 | ) |
| Net increase (decrease) | 5,213,203 | | | $ | 61,986,632 | |
| Class B Shares: | | | | | | |
| Year ended February 28, 2011 | | | | | | |
| Shares sold | 9,060 | | | $ | 109,359 | |
| Shares issued in reinvestment of distributions | 57,866 | | | | 698,723 | |
| Shares redeemed | (1,658,524 | ) | | | (20,055,744 | ) |
| Net increase (decrease) | (1,591,598 | ) | | $ | (19,247,662 | ) |
| Year ended February 28, 2010 | | | | | | |
| Shares sold | 27,392 | | | $ | 321,314 | |
| Shares issued in reinvestment of distributions | 97,157 | | | | 1,148,484 | |
| Shares redeemed | (1,398,263 | ) | | | (16,519,753 | ) |
| Net increase (decrease) | (1,273,714 | ) | | $ | (15,049,955 | ) |
| Class C Shares: | | | | | | |
| Year ended February 28, 2011 | | | | | | |
| Shares sold | 6,003,031 | | | $ | 73,210,281 | |
| Shares issued in reinvestment of distributions | 674,149 | | | | 8,133,129 | |
| Shares redeemed | (7,012,230 | ) | | | (83,065,636 | ) |
| Net increase (decrease) | (335,050 | ) | | $ | (1,722,226 | ) |
| Year ended February 28, 2010 | | | | | | |
| Shares sold | 8,406,224 | | | $ | 99,993,322 | |
| Shares issued in reinvestment of distributions | 540,339 | | | | 6,429,957 | |
| Shares redeemed | (2,996,420 | ) | | | (35,449,626 | ) |
| Net increase (decrease) | 5,950,143 | | | $ | 70,973,653 | |
| Advisor Class Shares: | | | | | | |
| Year ended February 28, 2011 | | | | | | |
| Shares sold | 1,889,953 | | | $ | 22,850,704 | |
| Shares issued in reinvestment of distributions | 11,993 | | | | 139,920 | |
| Shares redeemed | (843,475 | ) | | | (9,915,616 | ) |
| Net increase (decrease) | 1,058,471 | | | $ | 13,075,008 | |
| Year ended February 28, 2010 | | | | | | |
| Shares sold | 1,243,557 | | | $ | 14,507,876 | |
| Shares issued in reinvestment of distributions | 2,466 | | | | 29,025 | |
| Shares redeemed | (164,268 | ) | | | (1,958,126 | ) |
| Net increase (decrease) | 1,081,755 | | | $ | 12,578,775 | |
196 | Annual Report
Franklin Tax-Free Trust
Notes to Financial Statements (continued)
3. TRANSACTIONS WITH AFFILIATES
Franklin Resources, Inc. is the holding company for various subsidiaries that together are referred to as Franklin Templeton Investments. Certain officers and trustees of the Funds are also officers and/or directors of the following subsidiaries:
| |
| Subsidiary | Affiliation |
| Franklin Advisers, Inc. (Advisers) | Investment manager |
| Franklin Templeton Services, LLC (FT Services) | Administrative manager |
| Franklin Templeton Distributors, Inc. (Distributors) | Principal underwriter |
| Franklin Templeton Investor Services, LLC (Investor Services) | Transfer agent |
a. Management Fees
The Funds, except the Franklin Federal Limited-Term Tax-Free Income Fund, pay an investment management fee to Advisers based on the month-end net assets of each of the funds as follows:
| | |
| Annualized Fee Rate | | Net Assets |
| 0.625 | % | Up to and including $100 million |
| 0.500 | % | Over $100 million, up to and including $250 million |
| 0.450 | % | Over $250 million, up to and including $7.5 billion |
| 0.440 | % | Over $7.5 billion, up to and including $10 billion |
| 0.430 | % | Over $10 billion, up to and including $12.5 billion |
| 0.420 | % | Over $12.5 billion, up to and including $15 billion |
| 0.400 | % | Over $15 billion, up to and including $17.5 billion |
| 0.380 | % | Over $17.5 billion, up to and including $20 billion |
| 0.360 | % | In excess of $20 billion |
The Franklin Federal Limited-Term Tax-Free Income Fund pays an investment management fee to Advisers based on the average daily net assets of the fund as follows:
| | |
| Annualized Fee Rate | | Net Assets |
| 0.500 | % | Up to and including $100 million |
| 0.450 | % | Over $100 million, up to and including $250 million |
| 0.425 | % | Over $250 million, up to and including $500 million |
| 0.400 | % | In excess of $500 million |
b. Administrative Fees
FT Services provides administrative services to the Funds. The Franklin Federal Limited-Term Tax-Free Income Fund pays an administrative fee to FT Services of 0.20% per year of its average daily net assets. Under an agreement with Advisers, the administrative fee for the Funds, except the Franklin Federal Limited-Term Tax-Free Income Fund, is paid by Advisers based on each fund’s average daily net assets, and is not an additional expense of the funds.
Annual Report | 197
Franklin Tax-Free Trust
Notes to Financial Statements (continued)
| 3. | TRANSACTIONS WITH AFFILIATES (continued) |
| c. | Distribution Fees |
The Trust’s Board of Trustees has adopted distribution plans for each share class, with the exception of Advisor Class shares, pursuant to Rule 12b-1 under the 1940 Act. Under the Funds’ Class A reimbursement distribution plans, the Funds reimburse Distributors for costs incurred in connection with the servicing, sale and distribution of each fund’s shares up to the maximum annual plan rate. Under the Class A reimbursement distribution plans, costs exceeding the maximum for the current plan year cannot be reimbursed in subsequent periods.
In addition, under the funds’ Class B and C compensation distribution plans, the funds pay Distributors for costs incurred in connection with the servicing, sale and distribution of each fund’s shares up to the maximum annual plan rate for each class.
The maximum annual plan rates, based on the average daily net assets, for each class, are as follows:
| | | | | | | | |
| | | | Franklin | | Franklin | | | |
| | Franklin | | Federal | | Federal | | Franklin | |
| | Double | | Intermediate- | | Limited-Term | | High Yield | |
| | Tax-Free | | Term Tax-Free | | Tax-Free | | Tax-Free | |
| | Income Fund | | Income Fund | | Income Fund | | Income Fund | |
| Reimbursement Plans: | | | | | | | | |
| Class A | 0.10 | % | 0.10 | % | 0.15 | % | 0.10 | % |
| Compensation Plans: | | | | | | | | |
| Class B | — | | — | | — | | 0.65 | % |
| Class C | 0.65 | % | 0.65 | % | — | | 0.65 | % |
| |
| | Franklin | | Franklin | | Franklin | | | |
| | Insured | | Massachusetts | | New Jersey | | | |
| | Tax-Free | | Tax-Free | | Tax-Free | | | |
| | Income Fund | | Income Fund | | Income Fund | | | |
| Reimbursement Plans: | | | | | | | | |
| Class A | 0.10 | % | 0.10 | % | 0.10 | % | | |
| Compensation Plans: | | | | | | | | |
| Class B | 0.65 | % | — | | 0.65 | % | | |
| Class C | 0.65 | % | 0.65 | % | 0.65 | % | | |
d. Sales Charges/Underwriting Agreements
Distributors has advised the Funds of the following commission transactions related to the sales and redemptions of the Funds’ shares for the year:
| | | | | | | | |
| | | | | Franklin | | Franklin | | |
| | | Franklin | | Federal | | Federal | | Franklin |
| | | Double | | Intermediate- | | Limited-Term | | High Yield |
| | | Tax-Free | | Term Tax-Free | | Tax-Free | | Tax-Free |
| | | Income Fund | | Income Fund | | Income Fund | | Income Fund |
| Sales charges retained net of commissions | | | | | | | | |
| paid to unaffiliated broker/dealers | $ | 409,914 | $ | 557,801 | $ | 167,481 | $ | 1,702,830 |
| Contingent deferred sales charges | | | | | | | | |
| retained | $ | 38,648 | $ | 226,426 | $ | 127,631 | $ | 366,903 |
| |
| 198 | Annual Report | | | | | | | | |
Franklin Tax-Free Trust
Notes to Financial Statements (continued)
| 3. | TRANSACTIONS WITH AFFILIATES (continued) |
| d. | Sales Charges/Underwriting Agreements (continued) |
| | | | | | |
| | | Franklin | | Franklin | | Franklin |
| | | Insured | | Massachusetts | | New Jersey |
| | | Tax-Free | | Tax-Free | | Tax-Free |
| | | Income Fund | | Income Fund | | Income Fund |
| Sales charges retained net of commissions | | | | | | |
| paid to unaffiliated broker/dealers | $ | 1,161,222 | $ | 109,997 | $ | 402,583 |
| Contingent deferred sales charges | | | | | | |
| retained | $ | 221,066 | $ | 10,869 | $ | 112,974 |
e. Transfer Agent Fees
For the year ended February 28, 2011, the Funds paid transfer agent fees as noted in the Statements of Operations of which the following amounts were retained by Investor Services:
| | | | | | | | |
| | | | | Franklin | | Franklin | | |
| | | Franklin | | Federal | | Federal | | Franklin |
| | | Double | | Intermediate- | | Limited-Term | | High Yield |
| | | Tax-Free | | Term Tax-Free | | Tax-Free | | Tax-Free |
| | | Income Fund | | Income Fund | | Income Fund | | Income Fund |
| Transfer agent fees | $ | 167,643 | $ | 514,848 | $ | 65,957 | $ | 1,904,139 |
| |
| | | Franklin | | Franklin | | Franklin | | |
| | | Insured | | Massachusetts | | New Jersey | | |
| | | Tax-Free | | Tax-Free | | Tax-Free | | |
| | | Income Fund | | Income Fund | | Income Fund | | |
| Transfer agent fees | $ | 589,703 | $ | 117,646 | $ | 357,388 | | |
| |
| f. Waiver and Expense Reimbursements | | | | | | | | |
FT Services and Advisers have contractually agreed in advance to waive or limit their respective fees and to assume as their own expense certain expenses otherwise payable by the Franklin Federal Limited-Term Tax-Free Income Fund so that the common expenses (i.e. a combination of management fees, administrative fees, and other expenses, but excluding distribution fees, and acquired fund fees and expenses) for each class of the fund does not exceed 0.35% (other than certain non-routine expenses or costs, including those relating to litigation, indemnification, reorganizations, and liquidations) until June 30, 2011.
Annual Report | 199
Franklin Tax-Free Trust
Notes to Financial Statements (continued)
4. INCOME TAXES
For tax purposes, capital losses may be carried over to offset future capital gains, if any. At February 28, 2011, the capital loss carryforwards were as follows:
| | | | | | |
| | | | | Franklin | | Franklin |
| | | Franklin | | Federal | | Federal |
| | | Double | | Intermediate- | | Limited-Term |
| | | Tax-Free | | Term Tax-Free | | Tax-Free |
| | | Income Fund | | Income Fund | | Income Fund |
| Capital loss carryforwards expiring in: | | | | | | |
| 2012 | $ | — | $ | 2,156,839 | $ | — |
| 2013 | | 200,921 | | 373,568 | | — |
| 2014 | | 152,458 | | 213,358 | | 320,719 |
| 2015 | | 134,018 | | 361,303 | | 321,499 |
| 2016 | | 503,897 | | 1,114,337 | | 17,957 |
| 2017 | | 944,001 | | 6,237,620 | | — |
| 2018 | | 2,690,894 | | 223,211 | | 567 |
| 2019 | | 853,373 | | 1,793,931 | | — |
| | $ | 5,479,562 | $ | 12,474,167 | $ | 660,742 |
| |
| | | Franklin | | Franklin | | |
| | | High Yield | | Insured | | |
| | | Tax-Free | | Tax-Free | | |
| | | Income Fund | | Income Fund | | |
| Capital loss carryforwards expiring in: | | | | | | |
| 2012 | $ | 50,621,589 | $ | — | | |
| 2013 | | 35,250,377 | | — | | |
| 2014 | | 7,711,279 | | — | | |
| 2016 | | 62,972,830 | | — | | |
| 2017 | | 15,478,643 | | 36,012 | | |
| 2018 | | 53,451,410 | | 5,518,185 | | |
| 2019 | | 583,369 | | — | | |
| | $ | 226,069,497 | $ | 5,554,197 | | |
During the year ended February 28, 2011, the funds utilized capital loss carryforwards as follows:
| | | | | | | |
| | Franklin Federal | | Franklin | | Franklin | | Franklin |
| | Limited-Term | | Insured | | Massachusetts | | New Jersey |
| | Tax-Free | | Tax-Free | | Tax-Free | | Tax-Free |
| | Income Fund | | Income Fund | | Income Fund | | Income Fund |
| $ | 16,669 | $ | 785,189 | $ | 1,947,218 | $ | 1,578,810 |
On February 28, 2011, the Franklin High Yield Tax-Free Income Fund had expired capital loss carryforwards of $131,377,453, which were reclassified to paid-in capital.
200 | Annual Report
Franklin Tax-Free Trust
Notes to Financial Statements (continued)
4. INCOME TAXES (continued)
For tax purposes, realized capital losses occurring subsequent to October 31 may be deferred and treated as occurring on the first day of the following fiscal year. At February 28, 2011, deferred losses were as follows:
| | | | | | | | | | | |
| | Franklin Federal | | Franklin Federal | | Franklin | | Franklin | | Franklin | | Franklin |
| | Intermediate-Term | | Limited-Term | | High Yield | | Insured | | Massachusetts | | New Jersey |
| | Tax-Free | | Tax-Free | | Tax-Free | | Tax-Free | | Tax-Free | | Tax-Free |
| | Income Fund | | Income Fund | | Income Fund | | Income Fund | | Income Fund | | Income Fund |
| $ | 11,969,107 | $ | 1,490 | $ | 23,774,120 | $ | 16,220,718 | $ | 1,320,299 | $ | 5,159,837 |
The tax character of distributions paid during the years ended February 28, 2011 and 2010, was as follows:
| | | | | | | | |
| | | | | | | Franklin Federal |
| | | Franklin Double | | Intermediate-Term |
| | | Tax-Free Income Fund | | Tax-Free Income Fund |
| | | 2011 | | 2010 | | 2011 | | 2010 |
| Distributions paid from | | | | | | | | |
| tax exempt income | $ | 28,228,129 | $ | 24,921,273 | $ | 73,965,874 | $ | 50,758,066 |
| |
| Franklin Federal |
|
| | | Limited-Term | | Franklin High Yield |
| | | Tax-Free Income Fund | | Tax-Free Income Fund |
| | | 2011 | | 2010 | | 2011 | | 2010 |
| Distributions paid from | | | | | | | | |
| tax exempt income | $ | 10,576,543 | $ | 6,244,991 | $ | 383,821,439 | $ | 354,330,916 |
| |
| | | Franklin Insured | | Franklin Massachusetts |
| | | Tax-Free Income Fund | | Tax-Free Income Fund |
| | | 2011 | | 2010 | | 2011 | | 2010 |
| Distributions paid from: | | | | | | | | |
| Tax exempt income | $ | 113,664,775 | $ | 101,487,860 | $ | 23,631,843 | $ | 23,079,309 |
| Long term capital gain | | — | | — | | 1,052,743 | | — |
| | $ | 113,664,775 | $ | 101,487,860 | $ | 24,684,586 | $ | 23,079,309 |
| |
| Franklin New Jersey Tax-Free |
|
| Income Fund |
| | | 2011 | | 2010 | | | | |
| Distributions paid from: | | | | | | | | |
| Tax exempt income | $ | 67,983,354 | $ | 61,519,238 | | | | |
| Long term capital gain | | 469,571 | | — | | | | |
| | $ | 68,452,925 | $ | 61,519,238 | | | | |
Annual Report | 201
Franklin Tax-Free Trust
Notes to Financial Statements (continued)
4. INCOME TAXES (continued)
At February 28, 2011, the cost of investments, net unrealized appreciation (depreciation), undistributed tax exempt and ordinary income and undistributed long term capital gains for income tax purposes were as follows:
| | | | | | | | | |
| | | Franklin | | | Franklin Federal | | | Franklin Federal | |
| | | Double | | | Intermediate- | | | Limited-Term | |
| | | Tax-Free | | | Term Tax-Free | | | Tax-Free | |
| | | Income Fund | | | Income Fund | | | Income Fund | |
| Cost of investments | $ | 643,498,439 | | $ | 2,259,102,442 | | $ | 663,436,756 | |
| |
| Unrealized appreciation | $ | 9,859,016 | | $ | 56,605,665 | | $ | 7,307,431 | |
| Unrealized depreciation | | (37,524,299 | ) | | (23,640,828 | ) | | (2,442,365 | ) |
| Net unrealized appreciation (depreciation) | $ | (27,665,283 | ) | $ | 32,964,837 | | $ | 4,865,066 | |
| |
| Undistributed tax exempt income | $ | 1,301,807 | | $ | 1,154,834 | | $ | 169,574 | |
| Undistributed ordinary income | | — | | | 2,821 | | | — | |
| Distributable earnings | $ | 1,301,807 | | $ | 1,157,655 | | $ | 169,574 | |
| |
| | | Franklin | | | Franklin | | | Franklin | |
| | | High Yield | | | Insured | | | Massachusetts | |
| | | Tax-Free | | | Tax-Free | | | Tax-Free | |
| | | Income Fund | | | Income Fund | | | Income Fund | |
| Cost of investments | $ | 7,214,187,504 | | $ | 2,578,445,498 | | $ | 535,854,684 | |
| |
| Unrealized appreciation | $ | 257,877,120 | | $ | 39,539,311 | | $ | 8,191,311 | |
| Unrealized depreciation | | (557,198,217 | ) | | (114,890,537 | ) | | (20,807,839 | ) |
| Net unrealized appreciation (depreciation) | $ | (299,321,097 | ) | $ | (75,351,226 | ) | $ | (12,616,528 | ) |
| |
| Undistributed tax exempt income | $ | 8,750,945 | | $ | 2,367,028 | | $ | 238,545 | |
| Undistributed ordinary income | | 345,036 | | | 575 | | | — | |
| Undistributed long term capital gains | | — | | | — | | | 28,554 | |
| Distributable earnings | $ | 9,095,981 | | $ | 2,367,603 | | $ | 267,099 | |
| |
| | | Franklin | | | | | | | |
| | | New Jersey | | | | | | | |
| | | Tax-Free | | | | | | | |
| | | Income Fund | | | | | | | |
| Cost of investments | $ | 1,465,262,236 | | | | | | | |
| |
| Unrealized appreciation | $ | 34,427,246 | | | | | | | |
| Unrealized depreciation | | (63,324,005 | ) | | | | | | |
| Net unrealized appreciation (depreciation) | $ | (28,896,759 | ) | | | | | | |
| |
| Undistributed tax exempt income | $ | 2,338,298 | | | | | | | |
| Undistributed ordinary income | | 42,143 | | | | | | | |
| Distributable earnings | $ | 2,380,441 | | | | | | | |
202 | Annual Report
Franklin Tax-Free Trust
Notes to Financial Statements (continued)
4. INCOME TAXES (continued)
Net investment income differs for financial statement and tax purposes primarily due to differing treatments of bond discounts, regulatory settlements and non-deductible expenses.
Net realized gains (losses) differ for financial statement and tax purposes primarily due to differing treatments of wash sales and bond discounts.
5. INVESTMENT TRANSACTIONS
Purchases and sales of investments (excluding short term securities) for the year ended February 28, 2011, were as follows:
| | | | | | | | |
| | | | | Franklin | | Franklin | | |
| | | Franklin | | Federal | | Federal | | Franklin |
| | | Double | | Intermediate- | | Limited-Term | | High Yield |
| | | Tax-Free | | Term Tax-Free | | Tax-Free | | Tax-Free |
| | | Income Fund | | Income Fund | | Income Fund | | Income Fund |
| Purchases | $ | 141,933,486 | $ | 783,205,658 | $ | 305,007,540 | $ | 1,747,246,931 |
| Sales | $ | 81,723,690 | $ | 213,993,730 | $ | 29,745,000 | $ | 1,334,821,562 |
| |
| | | Franklin | | Franklin | | Franklin | | |
| | | Insured | | Massachusetts | | New Jersey | | |
| | | Tax-Free | | Tax-Free | | Tax-Free | | |
| | | Income Fund | | Income Fund | | Income Fund | | |
| Purchases | $ | 606,745,109 | $ | 107,529,779 | $ | 205,501,515 | | |
| Sales | $ | 447,095,546 | $ | 133,054,392 | $ | 245,613,523 | | |
6. CREDIT RISK AND DEFAULTED SECURITIES
At February 28, 2011, the Franklin High Yield Tax-Free Income Fund had 24.60% of its portfolio invested in high yield, or other securities rated below investment grade. These securities may be more sensitive to economic conditions causing greater price volatility and are potentially subject to a greater risk of loss due to default than higher rated securities.
The Franklin High Yield Tax-Free Income Fund held defaulted securities and/or other securities for which the income has been deemed uncollectible. At February 28, 2011, the aggregate value of these securities represents less than 0.05% of the fund’s net assets. The fund discontinues accruing income on securities for which income has been deemed uncollectible and provides an estimate for losses on interest receivable. The securities have been identified on the accompanying Statement of Investments.
Annual Report | 203
Franklin Tax-Free Trust
Notes to Financial Statements (continued)
7. CONCENTRATION OF RISK
The Franklin Double Tax-Free Income Fund, Franklin Massachusetts Tax-Free Income Fund and Franklin New Jersey Tax-Free Income Fund invest a large percentage of their total assets in obligations of issuers within their respective state and U.S. territories. Such concentration may subject the funds to risks associated with industrial or regional matters, and economic, political or legal developments occurring within those states and U.S. territories. In addition, investments in these securities are sensitive to interest rate changes and credit risk of the issuer and may subject the funds to increased market volatility. The market for these investments may be limited, which may make them difficult to buy or sell.
8. CREDIT FACILITY
The Funds, together with other U.S. registered and foreign investment funds (collectively “Borrowers”), managed by Franklin Templeton Investments, are borrowers in a joint syndicated senior unsecured credit facility totaling $750 million (Global Credit Facility) which matures on January 20, 2012. This Global Credit Facility provides a source of funds to the Borrowers for temporary and emergency purposes, including the ability to meet future unanticipated or unusually large redemption requests.
Under the terms of the Global Credit Facility, the Funds shall, in addition to interest charged on any borrowings made by the Funds and other costs incurred by the Funds, pay their share of fees and expenses incurred in connection with the implementation and maintenance of the Global Credit Facility, based upon their relative share of the aggregate net assets of all of the Borrowers, including an annual commitment fee of 0.08% based upon the unused portion of the Global Credit Facility, which is reflected in other expenses on the Statements of Operations. During the year ended February 28, 2011, the Funds did not use the Global Credit Facility.
9. FAIR VALUE MEASUREMENTS
The Funds follow a fair value hierarchy that distinguishes between market data obtained from independent sources (observable inputs) and the Funds’ own market assumptions (unobservable inputs). These inputs are used in determining the value of the Funds’ investments and are summarized in the following fair value hierarchy:
- Level 1 – quoted prices in active markets for identical securities
- Level 2 – other significant observable inputs (including quoted prices for similar securi- ties, interest rates, prepayment speed, credit risk, etc.)
- Level 3 – significant unobservable inputs (including the Funds’ own assumptions in determining the fair value of investments)
204 | Annual Report
Franklin Tax-Free Trust
Notes to Financial Statements (continued)
9. FAIR VALUE MEASUREMENTS (continued)
The inputs or methodology used for valuing securities are not an indication of the risk associated with investing in those securities.
For movements between the levels within the fair value hierarchy, the Funds have adopted a policy of recognizing the transfers as of the date of the underlying event which caused the movement.
At February 28, 2011, all of the Funds’ investments in securities carried at fair value were in Level 2 inputs.
10. SUBSEQUENT EVENTS
The Funds have evaluated subsequent events through the issuance of the financial statements and determined that no events have occurred that require disclosure.
Annual Report | 205
| | | | |
| Franklin Tax-Free Trust | | |
| |
| Notes to Financial Statements (continued) | | |
| |
| |
| Abbreviations | | |
| |
| |
| Selected Portfolio | | |
| |
| 1915 Act | - | Improvement Bond Act of 1915 | ID | - Improvement District |
| ABAG | - | The Association of Bay Area Governments | IDA | - Industrial Development Authority/Agency |
| ACA | - | American Capital Access Holdings Inc. | IDAR | - Industrial Development Authority Revenue |
| ACES | - | Adjustable Convertible Exempt Security | IDB | - Industrial Development Bond/Board |
| AD | - | Assessment District | IDBR | - Industrial Development Board Revenue |
| AGMC | - | Assured Guaranty Municipal Corp. | IDR | - Industrial Development Revenue |
| AMBAC | - | American Municipal Bond Assurance Corp. | ISD | - Independent School District |
| BAN | - | Bond Anticipation Note | MAC | - Municipal Assistance Corp. |
| BHAC | - | Berkshire Hathaway Assurance Corp. | MBS | - Mortgage-Backed Security |
| CDA | - | Community Development Authority/Agency | MFHR | - Multi-Family Housing Revenue |
| CDD | - | Community Development District | MFMR | - Multi-Family Mortgage Revenue |
| CDR | - | Community Development Revenue | MFR | - Multi-Family Revenue |
| CFD | - | Community Facilities District | MTA | - Metropolitan Transit Authority |
| CIFG | - | CDC IXIS Financial Guaranty | NATL | - National Public Financial Guarantee Corp. |
| COP | - | Certificate of Participation | NATL RE | - National Public Financial Guarantee Corp. Reinsured |
| CRDA | - | Community Redevelopment Authority/Agency | PBA | - Public Building Authority |
| EDA | - | Economic Development Authority | PCC | - Pollution Control Corp. |
| EDC | - | Economic Development Corp. | PCFA | - Pollution Control Financing Authority |
| EDR | - | Economic Development Revenue | PCR | - Pollution Control Revenue |
| ETM | - | Escrow to Maturity | PFA | - Public Financing Authority |
| FGIC | - | Financial Guaranty Insurance Co. | PFAR | - Public Financing Authority Revenue |
| FHA | - | Federal Housing Authority/Agency | PSF | - Permanent School Fund |
| FICO | - | Financing Corp. | PUD | - Public Utility District |
| FNMA | - | Federal National Mortgage Association | RAN | - Revenue Anticipation Note |
| FRN | - | Floating Rate Note | RDA | - Redevelopment Agency/Authority |
| GARB | - | General Airport Revenue Bonds | RMR | - Residential Mortgage Revenue |
| GNMA | - | Government National Mortgage Association | SFMR | - Single Family Mortgage Revenue |
| GO | - | General Obligation | SF | - Single Family |
| HDA | - | Housing Development Authority/Agency | SFR | - Single Family Revenue |
| HDC | - | Housing Development Corp. | TRAN | - Tax and Revenue Anticipation Note |
| HFA | - | Housing Finance Authority/Agency | UHSD | - Unified/Union High School District |
| HFAR | - | Housing Finance Authority Revenue | USD | - Unified/Union School District |
| HFC | - | Housing Finance Corp. | XLCA | - XL Capital Assurance |
| HMR | - | Home Mortgage Revenue | | |
206 | Annual Report
Franklin Tax-Free Trust
Report of Independent Registered Public Accounting Firm
To the Board of Trustees and Shareholders of Franklin Tax-Free Trust
In our opinion, the accompanying statements of assets and liabilities, including the statements of investments, and the related statements of operations and of changes in net assets and the financial highlights present fairly, in all material respects, the financial position of Franklin Double Tax-Free Income Fund, Franklin Federal Intermediate-Term Tax-Free Income Fund, Franklin Federal Limited-Term Tax-Free Income Fund, Franklin High Yield Tax-Free Income Fund, Franklin Insured Tax-Free Income Fund, Franklin Massachusetts Tax-Free Income Fund and Franklin New Jersey Tax-Free Income Fund (separate portfolios of Franklin Tax-Free Trust, hereafter referred to as the “Funds”) at February 28, 2011, the results of each of their operations for the year then ended, the changes in each of their net assets for each of the two years in the period then ended and the financial highlights for each of the periods presented, in conformity with accounting principles generally accepted in the United States of America. These financial statements and financial highlights (hereafter referred to as “financial statements”) are the responsibility of the Funds’ management. Our responsibility is to express an opinion on these financial statements based on our audits. We conducted our audits of these financial statements in accordance with the standards of the Public Company Accounting Oversight Board (United States). Those standards require that we plan and perform the audit to obtain reasonable assurance about whether the financial statements are free of material misstatement. An audit includes examining, on a test basis, evidence supporting the amounts and disclosures in the financial statements, assessing the accounting principles used and significant estimates made by management, and evaluating the overall financial statement presentation. We believe that our audits, which included confirmation of securities at February 28, 2011 by correspondence with the custodian and brokers, provide a reasonable basis for our opinion.
PricewaterhouseCoopers LLP
San Francisco, California
April 18, 2011
Annual Report | 207
Franklin Tax-Free Trust
Tax Designation (unaudited)
Under Section 852(b)(3)(C) of the Internal Revenue Code (Code), the Franklin Massachusetts Tax-Free Income Fund and Franklin New Jersey Tax-Free Income Fund designates the maximum amount allowable but no less than $1,052,743 and $469,571, respectively as a long term capital gain dividend for the fiscal year ended February 28, 2011.
Under Section 852(b)(5)(A) of the Code, the Funds designate 100% of the distributions paid from net investment income as exempt-interest dividends for the fiscal year ended February 28, 2011. A portion of the Fund’s exempt-interest dividends may be subject to the federal alternative minimum tax. In January 2012, shareholders will be notified of amounts for use in preparing their 2011 income tax returns.
208 | Annual Report
Franklin Tax-Free Trust
Board Members and Officers
The name, year of birth and address of the officers and board members, as well as their affiliations, positions held with the Trust, principal occupations during the past five years and number of portfolios overseen in the Franklin Templeton Investments fund complex are shown below. Generally, each board member serves until that person’s successor is elected and qualified.
| | | | |
| Independent Board Members | | | |
| |
| |
| | | | Number of Portfolios in | |
| Name, Year of Birth | | Length of | Fund Complex Overseen | |
| and Address | Position | Time Served | by Board Member* | Other Directorships Held |
| Harris J. Ashton (1932) | Trustee | Since 1984 | 130 | Bar-S Foods (meat packing company) |
| One Franklin Parkway | | | | (1981-2010). |
| San Mateo, CA 94403-1906 | | | | |
| Principal Occupation During Past 5 Years: | | | |
| Director of various companies; and formerly, Director, RBC Holdings, Inc. (bank holding company) (until 2002); and President, Chief Executive |
| Officer and Chairman of the Board, General Host Corporation (nursery and craft centers) (until 1998). | |
| |
| Sam Ginn (1937) | Trustee | Since 2007 | 106 | ICO Global Communications |
| One Franklin Parkway | | | | (Holdings) Limited (satellite company). |
| San Mateo, CA 94403-1906 | | | | |
| Principal Occupation During Past 5 Years: | | | |
| Private investor; and formerly, Chairman of the Board, Vodafone AirTouch, PLC (wireless company); Chairman of the Board and Chief |
| Executive Officer, AirTouch Communications (cellular communications) (1993-1998) and Pacific Telesis Group (telephone holding company) |
| (1988-1994). | | | | |
| |
| Edith E. Holiday (1952) | Trustee | Since 1998 | 130 | Hess Corporation (exploration and |
| One Franklin Parkway | | | | refining of oil and gas), H.J. Heinz |
| San Mateo, CA 94403-1906 | | | | Company (processed foods and allied |
| | | | | products), RTI International Metals, |
| | | | | Inc. (manufacture and distribution |
| | | | | of titanium), Canadian National |
| | | | | Railway (railroad) and White |
| | | | | Mountains Insurance Group, Ltd. |
| | | | | (holding company). |
| Principal Occupation During Past 5 Years: | | | |
| Director or Trustee of various companies and trusts; and formerly, Assistant to the President of the United States and Secretary of the Cabinet |
| (1990-1993); General Counsel to the United States Treasury Department (1989-1990); and Counselor to the Secretary and Assistant Secretary, |
| Public Affairs and Public Liaison – United States Treasury Department (1988-1989). | |
| |
| J. Michael Luttig (1954) | Trustee | Since 2009 | 130 | Boeing Capital Corporation (aircraft |
| One Franklin Parkway | | | | financing). |
| San Mateo, CA 94403-1906 | | | | |
| Principal Occupation During Past 5 Years: | | | |
| Executive Vice President, General Counsel and member of Executive Council, The Boeing Company; and formerly, Federal Appeals Court |
| Judge, U.S. Court of Appeals for the Fourth Circuit (1991-2006). | | |
| |
| |
| |
| |
| | | | | Annual Report | 209 |
| | | | | |
| | | | | Number of Portfolios in | |
| Name, Year of Birth | | Length of | | Fund Complex Overseen | |
| and Address | Position | Time Served | | by Board Member* | Other Directorships Held |
| Frank A. Olson (1932) | Trustee | Since 2005 | | 130 | Hess Corporation (exploration and |
| One Franklin Parkway | | | | | refining of oil and gas). |
| San Mateo, CA 94403-1906 | | | | | |
| Principal Occupation During Past 5 Years: | | | | |
| Chairman Emeritus, The Hertz Corporation (car rental) (since 2000) (Chairman of the Board (1980-2000) and Chief Executive Officer |
| (1977-1999)); and formerly, Chairman of the Board, President and Chief Executive Officer, UAL Corporation (airlines). |
| |
| Larry D. Thompson (1945) | Trustee | Since 2007 | | 138 | Cbeyond, Inc. (business communi- |
| One Franklin Parkway | | | | | cations provider) and The Southern |
| San Mateo, CA 94403-1906 | | | | | Company (energy company). |
| Principal Occupation During Past 5 Years: | | | | |
| Senior Vice President – Government Affairs, General Counsel and Secretary, PepsiCo, Inc. (consumer products); and formerly, Director, Delta |
| Airlines (aviation) (2003-2005) and Providian Financial Corp. (credit card provider) (1997-2001); Senior Fellow of The Brookings Institution |
| (2003-2004); Visiting Professor, University of Georgia School of Law (2004); and Deputy Attorney General, U.S. Department of Justice |
| (2001-2003). | | | | | |
| |
| John B. Wilson (1959) | Lead | Trustee since | | 106 | None |
| One Franklin Parkway | Independent | 2007 and Lead | | | |
| San Mateo, CA 94403-1906 | Trustee | Independent | | | |
| | | Trustee | | | |
| | | since 2008 | | | |
| Principal Occupation During Past 5 Years: | | | | |
| President and Founder, Hyannis Port Capital, Inc. (real estate and private equity investing); serves on private and non-profit boards; and |
| formerly, Chief Operating Officer and Executive Vice President, Gap, Inc. (retail) (1996-2000); Chief Financial Officer and Executive Vice |
| President – Finance and Strategy, Staples, Inc. (office supplies) (1992-1996); Senior Vice President – Corporate Planning, Northwest Airlines, |
| Inc. (airlines) (1990-1992); and Vice President and Partner, Bain & Company (consulting firm) (1986-1990). |
| |
| |
| |
| Interested Board Members and Officers | | | |
| |
| | | | | Number of Portfolios in | |
| Name, Year of Birth | | Length of | | Fund Complex Overseen | |
| and Address | Position | Time Served | | by Board Member* | Other Directorships Held |
| **Charles B. Johnson (1933) | Trustee and | Trustee since | | 130 | None |
| One Franklin Parkway | Chairman of | 1984 | and | | |
| San Mateo, CA 94403-1906 | the Board | Chairman of the | | | |
| | | Board since 1993 | | | |
| Principal Occupation During Past 5 Years: | | | | |
| Chairman of the Board, Member – Office of the Chairman and Director, Franklin Resources, Inc.; and officer and/or director or trustee, |
| as the case may be, of some of the other subsidiaries of Franklin Resources, Inc. and of 41 of the investment companies in Franklin |
| Templeton Investments. | | | | | |
| |
| |
| |
| |
| 210 | Annual Report | | | | | |
| | | | |
| | | | Number of Portfolios in | |
| Name, Year of Birth | | Length of | Fund Complex Overseen | |
| and Address | Position | Time Served | by Board Member* | Other Directorships Held |
| **Gregory E. Johnson (1961) | Trustee | Since 2007 | 88 | None |
| One Franklin Parkway | | | | |
| San Mateo, CA 94403-1906 | | | | |
| Principal Occupation During Past 5 Years: | | | |
| Director, President and Chief Executive Officer, Franklin Resources, Inc.; and officer and/or director or trustee, as the case may be, of some |
| of the other subsidiaries of Franklin Resources, Inc. and of 33 of the investment companies in Franklin Templeton Investments. |
| |
| Sheila Amoroso (1959) | Vice President | Since 1999 | Not Applicable | Not Applicable |
| One Franklin Parkway | | | | |
| San Mateo, CA 94403-1906 | | | | |
| Principal Occupation During Past 5 Years: | | | |
| Senior Vice President, Franklin Advisers, Inc.; and officer of eight of the investment companies in Franklin Templeton Investments. |
| |
| Rafael R. Costas, Jr. (1965) | Vice President | Since 1999 | Not Applicable | Not Applicable |
| One Franklin Parkway | | | | |
| San Mateo, CA 94403-1906 | | | | |
| Principal Occupation During Past 5 Years: | | | |
| Senior Vice President, Franklin Advisers, Inc.; and officer of eight of the investment companies in Franklin Templeton Investments. |
| |
| James M. Davis (1952) | Chief | Chief Compliance | Not Applicable | Not Applicable |
| One Franklin Parkway | Compliance | Officer since 2004 | | |
| San Mateo, CA 94403-1906 | Officer and | and Vice | | |
| | Vice President | President – AML | | |
| | – AML | Compliance | | |
| | Compliance | since 2006 | | |
| Principal Occupation During Past 5 Years: | | | |
| Director, Global Compliance, Franklin Resources, Inc.; officer of some of the other subsidiaries of Franklin Resources, Inc. and of 45 of the |
| investment companies in Franklin Templeton Investments; and formerly, Director of Compliance, Franklin Resources, Inc. (1994-2001). |
| |
| Laura F. Fergerson (1962) | Chief | Since 2009 | Not Applicable | Not Applicable |
| One Franklin Parkway | Executive | | | |
| San Mateo, CA 94403-1906 | Officer – | | | |
| | Finance and | | | |
| | Administration | | | |
| Principal Occupation During Past 5 Years: | | | |
| Senior Vice President, Franklin Templeton Services, LLC; officer of 45 of the investment companies in Franklin Templeton Investments; and |
| formerly, Director and member of Audit and Valuation Committees, Runkel Funds, Inc. (2003-2004); Assistant Treasurer of most of the |
| investment companies in Franklin Templeton Investments (1997-2003); and Vice President, Franklin Templeton Services, LLC (1997-2003). |
| |
| Gaston Gardey (1967) | Treasurer, | Since 2009 | Not Applicable | Not Applicable |
| One Franklin Parkway | Chief Financial | | | |
| San Mateo, CA 94403-1906 | Officer and | | | |
| | Chief | | | |
| | Accounting | | | |
| | Officer | | | |
| Principal Occupation During Past 5 Years: | | | |
| Director Fund Accounting, Franklin Templeton Investments; and officer of 27 of the investment companies in Franklin Templeton Investments. |
| |
| |
| |
| |
| | | | | Annual Report | 211 |
| | | | |
| | | | Number of Portfolios in | |
| Name, Year of Birth | | Length of | Fund Complex Overseen | |
| and Address | Position | Time Served | by Board Member* | Other Directorships Held |
| Aliya S. Gordon (1973) | Vice President | Since 2009 | Not Applicable | Not Applicable |
| One Franklin Parkway | | | | |
| San Mateo, CA 94403-1906 | | | | |
| Principal Occupation During Past 5 Years: | | | |
| Senior Associate General Counsel, Franklin Templeton Investments; officer of 45 of the investment companies in Franklin Templeton |
| Investments; and formerly, Litigation Associate, Steefel, Levitt & Weiss, LLP (2000-2004). | |
| |
| David P. Goss (1947) | Vice President | Since 2000 | Not Applicable | Not Applicable |
| One Franklin Parkway | | | | |
| San Mateo, CA 94403-1906 | | | | |
| Principal Occupation During Past 5 Years: | | | |
| Senior Associate General Counsel, Franklin Templeton Investments; and officer and/or director, as the case maybe, of some of the other |
| subsidiaries of Franklin Resources, Inc. and of 45 of the investment companies in Franklin Templeton Investments. |
| |
| Steven J. Gray (1955) | Vice President | Since 2009 | Not Applicable | Not Applicable |
| One Franklin Parkway | | | | |
| San Mateo, CA 94403-1906 | | | | |
| Principal Occupation During Past 5 Years: | | | |
| Senior Associate General Counsel, Franklin Templeton Investments; Vice President, Franklin Templeton Distributors, Inc.; and officer of 45 of |
| the investment companies in Franklin Templeton Investments. | | |
| |
| Christopher J. Molumphy (1962) | President and | Since April 2010 | Not Applicable | Not Applicable |
| One Franklin Parkway | Chief | | | |
| San Mateo, CA 94403-1906 | Executive | | | |
| | Officer – | | | |
| | Investment | | | |
| | Management | | | |
| Principal Occupation During Past 5 Years: | | | |
| Director and Executive Vice President, Franklin Advisers, Inc.; Executive Vice President, Franklin Templeton Institutional, LLC; and officer of |
| some of the other subsidiaries of Franklin Resources, Inc. and of 22 of the investment companies in Franklin Templeton Investments. |
| |
| Robert C. Rosselot (1960) | Vice President | Since 2009 | Not Applicable | Not Applicable |
| 500 East Broward Blvd. | | | | |
| Suite 2100 | | | | |
| Fort Lauderdale, FL 33394-3091 | | | | |
| Principal Occupation During Past 5 Years: | | | |
| Senior Associate General Counsel, Franklin Templeton Investments; Assistant Secretary, Franklin Resources, Inc.; Vice President and |
| Secretary, Templeton Investment Counsel, LLC; Vice President, Secretary and Trust Officer, Fiduciary Trust International of the South; |
| and officer of 45 of the investment companies in Franklin Templeton Investments. | |
| |
| Karen L. Skidmore (1952) | Vice President | Since 2006 | Not Applicable | Not Applicable |
| One Franklin Parkway | and Secretary | | | |
| San Mateo, CA 94403-1906 | | | | |
| Principal Occupation During Past 5 Years: | | | |
| Senior Associate General Counsel, Franklin Templeton Investments; and officer of 45 of the investment companies in Franklin |
| Templeton Investments. | | | | |
| |
| |
| |
| |
| 212 | Annual Report | | | | |
| | | | |
| | | | Number of Portfolios in | |
| Name, Year of Birth | | Length of | Fund Complex Overseen | |
| and Address | Position | Time Served | by Board Member* | Other Directorships Held |
| Craig S. Tyle (1960) | Vice President | Since 2005 | Not Applicable | Not Applicable |
| One Franklin Parkway | | | | |
| San Mateo, CA 94403-1906 | | | | |
| Principal Occupation During Past 5 Years: | | | |
| General Counsel and Executive Vice President, Franklin Resources, Inc.; officer of some of the other subsidiaries of Franklin Resources, Inc. |
| and of 45 of the investment companies in Franklin Templeton Investments; and formerly, Partner, Shearman & Sterling, LLP (2004-2005); |
| and General Counsel, Investment Company Institute (ICI) (1997-2004). | | |
| |
| Thomas Walsh (1961) | Vice President | Since 1999 | Not Applicable | Not Applicable |
| One Franklin Parkway | | | | |
| San Mateo, CA 94403-1906 | | | | |
| Principal Occupation During Past 5 Years: | | | |
| Senior Vice President, Franklin Advisers, Inc.; and officer of eight of the investment companies in Franklin Templeton Investments. |
| |
| *We base the number of portfolios on each separate series of the U.S. registered investment companies within the Franklin Templeton Investments fund complex. These portfolios |
| have a common investment manager or affiliated investment managers. | | |
| **Charles B. Johnson is considered to be an interested person of the Trust under the federal securities laws due to his position as officer and director and major shareholder of |
| Franklin Resources, Inc. (Resources), which is the parent company of the Trust’s investment manager and distributor. Gregory E. Johnson is considered to be an interested person of |
| the Trust under the federal securities laws due to his position as an officer and director of Resources. | |
| Note 1: Charles B. Johnson is the father of Gregory E. Johnson. | | | |
| Note 2: Officer information is current as of the date of this report. It is possible that after this date, information about officers may change. |
| Note 3: Prior to February 28, 2011, Frank W.T. LaHaye ceased to be a trustee of the Trust. | | |
| |
| The Sarbanes-Oxley Act of 2002 and Rules adopted by the Securities and Exchange Commission require the Fund to disclose whether the Fund’s Audit Committee includes at |
| least one member who is an audit committee financial expert within the meaning of such Act and Rules. The Fund’s Board has determined that there is at least one such |
| financial expert on the Audit Committee and has designated John B. Wilson as its audit committee financial expert. The Board believes that Mr. Wilson qualifies as such an |
| expert in view of his extensive business background and experience, including service as chief financial officer of Staples, Inc. from 1992 to 1996. Mr. Wilson has been a |
| Member and Chairman of the Fund’s Audit Committee since 2007. As a result of such background and experience, the Board believes that Mr. Wilson has acquired an under- |
| standing of generally accepted accounting principles and financial statements, the general application of such principles in connection with the accounting estimates, |
| accruals and reserves, and analyzing and evaluating financial statements that present a breadth and level of complexity of accounting issues generally comparable to those |
| of the Fund, as well as an understanding of internal controls and procedures for financial reporting and an understanding of audit committee functions. Mr. Wilson is an |
| independent Board member as that term is defined under the relevant Securities and Exchange Commission Rules and Releases. |
| |
| The Statement of Additional Information (SAI) includes additional information about the board members and is available, without charge, upon request. Shareholders may |
| call (800) DIAL BEN/(800) 342-5236 to request the SAI. | | | |
Annual Report | 213
Franklin Tax-Free Trust
Shareholder Information
Board Review of Investment Management Agreement
At a meeting held March 1, 2011, the Board of Trustees (Board), including a majority of non-interested or independent Trustees, approved renewal of the investment management agreement for each of the separate tax-exempt funds within the Trust (Fund(s)). In reaching this decision, the Board took into account information furnished throughout the year at regular Board meetings, as well as information prepared specifically in connection with the annual renewal review process. Information furnished and discussed throughout the year included investment performance reports and related financial information for each Fund, as well as periodic reports on expenses, shareholder services, legal, compliance, pricing, and other services provided by the Investment Manager (Manager) and its affiliates. Information furnished specifically in connection with the renewal process included a report for each Fund prepared by Lipper, Inc. (Lipper), an independent organization, as well as additional material, including a Fund profitability analysis prepared by management. The Lipper reports compared each Fund’s investment performance and expenses with those of other mutual funds deemed comparable to the Fund as selected by Lipper. The Fund profitability analysis discussed the profitability to Franklin Templeton Investments from its overall U.S. fund operations, as well as on an individual fund-by-fund basis. Additional material accompanying such profitability analysis included information on a fund-by-fund basis listing portfolio managers and other accounts they manage, as well as information on management fees charged by the Manager and its affiliates to U.S. mutual funds and other accounts, including management’s explanation of differences where relevant. Such material also included a memorandum prepared by management describing project initiatives and capital investments relating to the services provided to the Funds by the Franklin Templeton Investments organization, as well as a memorandum relating to economies of scale and a comparative analysis concerning transfer agent fees charged each Fund.
In considering such materials, the independent Trustees received assistance and advice from and met separately with independent counsel. While the investment management agreements for all Funds were considered at the same Board meeting, the Board dealt with each Fund separately. In approving continuance of the investment management agreement for each Fund, the Board, including a majority of independent Trustees, determined that the existing management fee structure was fair and reasonable and that continuance of the investment management agreement was in the best interests of each Fund and its shareholders. While attention was given to all information furnished, the following discusses some primary factors relevant to the Board’s decision.
NATURE, EXTENT AND QUALITY OF SERVICES. The Board was satisfied with the nature and quality of the overall services provided by the Manager and its affiliates to the Funds and their shareholders. In addition to investment performance and expenses discussed later, the Board’s opinion was based, in part, upon periodic reports furnished it showing that the investment policies and restrictions for each Fund were consistently complied with as well as other reports periodically furnished the Board covering matters such as the compliance of portfolio managers and other management personnel with the code of ethics adopted throughout the Franklin Templeton fund complex, the adherence to fair value pricing procedures established by the Board, and the accuracy of net asset value calculations. The Board also noted the extent of benefits provided Fund
214 | Annual Report
Franklin Tax-Free Trust
Shareholder Information (continued)
Board Review of Investment Management Agreement (continued)
shareholders from being part of the Franklin Templeton family of funds, including the right to exchange investments between the same class of funds without a sales charge, the ability to reinvest Fund dividends into other funds and the right to combine holdings in other funds to obtain a reduced sales charge. Favorable consideration was given to management’s continuous efforts and expenditures in establishing back-up systems and recovery procedures to function in the event of a natural disaster, it being noted that such systems and procedures had functioned smoothly during the Florida hurricanes and blackouts experienced in previous years. Consideration was also given to the experience of each Fund’s portfolio management team, the number of accounts managed and general method of compensation. In this latter respect, the Board noted that a primary factor in management’s determination of a portfolio manager’s bonus compensation was the relative investment performance of the funds he or she managed and that a portion of such bonus was required to be invested in a predesignated list of funds within such person’s fund management area so as to be aligned with the interests of shareholders. The Board also took into account the quality of transfer agent and shareholder services provided Fund shareholders by an affiliate of the Manager and the continuous enhancements to the Franklin Templeton website. Particular attention was given to management’s conservative approach and diligent risk management procedures, including continuous monitoring of counterparty credit risk and attention given to derivatives and other complex instruments. The Board also took into account, among other things, management’s efforts in establishing a global credit facility for the benefit of the Funds and other accounts managed by Franklin Templeton Investments to provide a source of cash for temporary and emergency purposes or to meet unusual redemption requests as well as the strong financial position of the Manager’s parent company and its commitment to the mutual fund business as evidenced by its subsidization of money market funds.
INVESTMENT PERFORMANCE. The Board placed significant emphasis on the investment performance of each Fund in view of its importance to shareholders. While consideration was given to performance reports and discussions with portfolio managers at Board meetings throughout the year, particular attention in assessing performance was given to the Lipper reports furnished for the agreement renewals. The Lipper reports prepared for each individual Fund showed its investment performance or those of its Class A shares for Funds having multiple share classes, in comparison to a performance universe selected by Lipper. Comparative performance for each Fund was shown for the one-year period ended December 31, 2010, and for additional periods ended that date up to 10 years depending on when a particular Fund commenced operations. Investment performance was shown on an income return basis, as well as a total return basis for each Fund. The Lipper reports showed that the income return for each Fund was in the upper half of its Lipper performance universe during 2010, with most being in the highest or second-highest quintile of such universe during such year and on an annualized basis for the previous three-, five- and 10-year periods as well. The Lipper reports showed the total return for many of such Funds was below the median of their performance universe during 2010, but that the total return of all such Funds was good on a long-term basis with each having total returns above the median of its respective performance universe
Annual Report | 215
Franklin Tax-Free Trust
Shareholder Information (continued)
Board Review of Investment Management Agreement (continued)
during the previous 10-year period on an annualized basis. Franklin Federal Limited-Term Tax-Free Income Fund has not been in existence for 10 years, but its annualized five-year total return was in the highest or best performing quintile of its universe. Management explained that the one-year relative total return performance reflected the fact that the average maturity of investments in the portfolios of the Funds was generally longer than those of its performance universe peers. The Board expressed satisfaction with such performance, noting management’s explanation and the fact that the investment objective of each of the Funds is to obtain a high level of tax-exempt income.
COMPARATIVE EXPENSES. Consideration was given to the management fee and total expense ratios of each Fund in comparison with those of a group of funds selected by Lipper as its appropriate Lipper expense group. Lipper expense data is based upon information taken from each fund’s most recent annual report, which reflects historical asset levels that may be quite different from those currently existing, particularly in a period of market volatility. While recognizing such inherent limitation and the fact that expense ratios generally increase as assets decline and decrease as assets grow, the Board believed the independent analysis conducted by Lipper to be an appropriate measure of comparative expenses. In reviewing comparative costs, Lipper provides information on each Fund’s contractual investment management fee in comparison with the contractual investment management fee that would have been charged by other funds within its Lipper expense group assuming they were similar in size to the Fund, as well as the actual total expenses of the Fund in comparison with those of its Lipper expense group. The Lipper contractual investment management fee analysis includes an administrative charge as being part of the investment management fee, and total expenses, for comparative consistency, are shown by Lipper for Fund Class A shares for Funds having multiple share classes. The Lipper reports showed that the contractual investment management fee rates for each Fund were at or below the median of their respective Lipper expense groups, with the exception of Franklin Insured Tax-Free Income Fund and Franklin Federal Intermediate-Term Tax-Free Income Fund whose fee rates were within two basis points of their respective expense group medians, and Franklin Federal Limited-Term Tax-Free Income Fund, whose actual management fees were below its expense group median as a result of fee waivers. The Lipper reports further showed that the actual total expense rates for all Funds were below the median of their respective Lipper expense groups. Based on the above, the Board was satisfied with the investment management fee and total expenses of each Fund in comparison to its Lipper expense group as shown in the Lipper reports.
MANAGEMENT PROFITABILITY. The Board also considered the level of profits realized by the Manager and its affiliates in connection with the operation of each Fund. In this respect, the Board reviewed the Fund profitability analysis that addresses the overall profitability of Franklin Templeton’s U.S. fund business, as well as its profits in providing management and other services to each of the individual funds during the 12-month period ended September 30, 2010, being the most recent fiscal year-end for Franklin Resources, Inc., the manager’s parent. In reviewing the analysis, attention was given to the methodology followed in allocating costs to each Fund, it being recognized that allocation methodologies are inherently subjective and various allocation
216 | Annual Report
Franklin Tax-Free Trust
Shareholder Information (continued)
Board Review of Investment Management Agreement (continued)
methodologies may each be reasonable while producing different results. In this respect, the Board noted that while being continuously refined and reflecting changes in the Manager’s own cost accounting, such allocation methodology was consistent with that followed in profitability report presentations for the Funds made in prior years and that the Funds’ independent registered public accounting firm had been engaged by the Manager to review the reasonableness of the allocation methodologies solely for use by the Funds’ Board in reference to the profitability analysis. In reviewing and discussing such analysis, management discussed with the Board its belief that costs incurred in establishing the infrastructure necessary for the type of mutual fund operations conducted by the Manager and its affiliates may not be fully reflected in the expenses allocated to each Fund in determining its profitability, as well as the fact that the level of profits, to a certain extent, reflected operational cost savings and efficiencies initiated by management. The Board also took into account management’s expenditures in improving shareholder services provided the Funds, as well as the need to meet additional regulatory and compliance requirements resulting from the Sarbanes-Oxley Act and recent SEC and other regulatory requirements. In addition, the Board considered a third-party study comparing the profitability of the Manager’s parent on an overall basis to other publicly held managers broken down to show profitability from management operations exclusive of distribution expenses, as well as profitability including distribution expenses. The Board also considered the extent to which the Manager and its affiliates might derive ancillary benefits from fund operations, including revenues generated from transfer agent services. Based upon its consideration of all these factors, the Board determined that the level of profits realized by the Manager and its affiliates from providing services to each Fund was not excessive in view of the nature, quality and extent of services provided.
ECONOMIES OF SCALE. The Board also considered whether economies of scale are realized by the Manager as the Funds grow larger and the extent to which this is reflected in the level of management fees charged. While recognizing any precise determination is inherently subjective, the Board noted that based upon the Fund profitability analysis, it appears that as some Funds get larger, at some point economies of scale do result in the Manager realizing a larger profit margin on management services provided such Fund. The Board also noted that any economies of scale are shared with each of these Funds and their shareholders through management fee breakpoints existing in each of the Fund’s investment management agreements, so that as a Fund grows in size, its effective management fee rate declines. The fee structure under the investment management agreement with Franklin Federal Limited-Term Tax-Free Income Fund provides an initial fee of 0.70% on the first $100 million of assets; 0.65% on the next $150 million of assets; 0.625% on the next $250 million of assets; and 0.60% on assets in excess of $500 million. While the assets of such Fund at December 31, 2010, amounted to $658 million, its expenses continued to be subsidized through management fee waivers. The fee structure under the investment management agreement with each other Fund provides an initial fee of 0.625% on the first $100 million of assets; 0.50% on the next $150 million of assets; 0.45% on assets in excess of $250 million; with additional breakpoints beginning at 0.44% on assets in excess of $7.5 billion; 0.43% on assets in excess of $10 billion and continuing thereafter. In reviewing such structure, management stated its belief
Annual Report | 217
Franklin Tax-Free Trust
Shareholder Information (continued)
Board Review of Investment Management Agreement (continued)
that this fee structure reaches a relatively low rate quickly as a Fund grows and that such low rate, in effect, reflects anticipated economies of scale as a Fund’s assets increase. In support of such position, management pointed out the favorable effective management fee and total expense comparisons for each Fund within its Lipper expense group as previously discussed under “Comparative Expenses.” The Board believed that to the extent economies of scale may be realized by the Manager and its affiliates, the schedule of fees under the investment management agreement for each Fund provides a sharing of benefits with the Fund and its shareholders.
Proxy Voting Policies and Procedures
The Trust’s investment manager has established Proxy Voting Policies and Procedures (Policies) that the Trust uses to determine how to vote proxies relating to portfolio securities. Shareholders may view the Trust’s complete Policies online at franklintempleton.com. Alternatively, shareholders may request copies of the Policies free of charge by calling the Proxy Group collect at (954) 527-7678 or by sending a written request to: Franklin Templeton Companies, LLC, 500 East Broward Boulevard, Suite 1500, Fort Lauderdale, FL 33394, Attention: Proxy Group. Copies of the Trust’s proxy voting records are also made available online at franklintempleton.com and posted on the U.S. Securities and Exchange Commission’s website at sec.gov and reflect the most recent 12-month period ended June 30.
Quarterly Statement of Investments
The Trust files a complete statement of investments with the U.S. Securities and Exchange Commission for the first and third quarters for each fiscal year on Form N-Q. Shareholders may view the filed Form N-Q by visiting the Commission’s website at sec.gov. The filed form may also be viewed and copied at the Commission’s Public Reference Room in Washington, DC. Information regarding the operations of the Public Reference Room may be obtained by calling (800) SEC-0330.
Householding of Reports and Prospectuses
You will receive each Fund’s financial reports every six months as well as an annual updated summary prospectus (prospectus available upon request). To reduce Fund expenses, we try to identify related shareholders in a household and send only one copy of the financial reports and summary prospectus. This process, called “householding,” will continue indefinitely unless you instruct us otherwise. If you prefer not to have these documents householded, please call us at (800) 632-2301. At any time you may view current prospectuses/summary prospectuses and financial reports on our website. If you choose, you may receive these documents through electronic delivery.
218 | Annual Report
This page intentionally left blank.
This page intentionally left blank.


| | | | | | | |
| | Contents | | | | | |
| Shareholder Letter | 1 | Annual Report | | Franklin Kentucky | | Financial Highlights and | |
| | | Municipal Bond Market | | Tax-Free Income Fund | 35 | Statements of Investments | 86 |
| | | Overview | 4 | Franklin Louisiana | | Financial Statements | 153 |
| | | Investment Strategy and | | Tax-Free Income Fund | 42 | Notes to Financial Statements | 164 |
| | | Manager’s Discussion | 6 | Franklin Maryland | | Report of Independent | |
| | | Franklin Alabama | | Tax-Free Income Fund | 50 | Registered Public | |
| | | Tax-Free Income Fund | 7 | Franklin Missouri | | Accounting Firm | 181 |
| | | Franklin Florida | | Tax-Free Income Fund | 59 | Tax Designation | 182 |
| | | Tax-Free Income Fund | 16 | Franklin North Carolina | | Board Members and Officers | 183 |
| | | Franklin Georgia | | Tax-Free Income Fund | 68 | | |
| | | | | | | Shareholder Information | 188 |
| | | Tax-Free Income Fund | 26 | Franklin Virginia | | | |
| | | | | Tax-Free Income Fund | 77 | | |
Shareholder Letter
Dear Shareholder:
The 12-month period ended February 28, 2011, was typical of transitions between recessions and recoveries as the year under review endured pendulum swings in economic growth and investor sentiment. Although a 2.9% gross domestic product growth rate for 2010 reflected overall economic expansion, the road to that ultimate performance was, to say the least, bumpy and filled with anxiety.
The Great Recession may have been officially over in June 2009, but its effects still lingered, and the general consensus seemed to be that U.S. economic and employment growth will be tepid for a while. Unemployment climbed to a 9.8% peak before ending the Funds’ fiscal year at 8.9%; an improvement, certainly, but still an elevated level that accounts for considerable slack in the economy.1
Not all indicators moved in the same direction and at the same speed. While optimism among investors, economists and business leaders in the U.S. was beginning to firm up, a crisis of confidence in the eurozone erupted and undermined global equity markets throughout the summer. Investors worried about sovereign debt defaults and their potential effects on global economic growth. By the end of 2010, those fears had diminished, but the eurozone’s economic situation remained fragile.
In the U.S., the nascent economic recovery lacked momentum, so the Federal Reserve Board (Fed) embarked on a second round of economic stimulus using quantitative easing, or QE2, which comprised mostly more aggressive purchases of U.S. Treasury long-dated bonds. The Fed’s goal was to spur economic
1. Source: Bureau of Labor Statistics.
NOT FDIC INSURED | MAY LOSE VALUE | NO BANK GUARANTEE
Not part of the annual report | 1
Annual Report
Municipal Bond Market Overview
For the 12 months ended February 28, 2011, the municipal bond market posted a mild gain of 1.72% as measured by the Barclays Capital (BC) Municipal Bond Index, which tracks investment-grade municipal securities.1 The gain was noteworthy considering the same index endured a record five consecutive months of negative total returns from September 2010 through January 2011. In comparison during the same period, Treasuries returned +3.71%, according to the BC U.S. Treasury Index, which tracks various U.S. Treasury securities.1
For the first six months of the reporting period municipal bond performance was robust, supported by strong investor demand and generally low interest rates resulting in part from the Federal Reserve Board’s (Fed’s) accommodative stance. The market also benefited from lower-than-normal tax-exempt issuance due to the Build America Bonds (BAB) program. The BAB program allowed municipal issuers to sell their bonds in the taxable market and take advantage of a 35% federal government subsidy for all coupon payments made on those municipal bonds. Such taxable bonds, however, are not part of the Funds’ tax-free portfolios. This subsidy enabled municipalities to borrow at significantly lower net yields than they could otherwise obtain in the traditional tax-exempt municipal bond market, which dramatically reduced the supply of new tax-exempt bonds. Of the $433 billion in issuance for the year 2010, $275 billion, or 64%, was in the form of tax-exempt municipal bonds.2 For the year 2008 (prior to the BAB program), municipal issuance totaled $390 billion, with $341 billion, or 88%, in the form of tax-exempt municipal bonds.2
November, December and January were particularly challenging months for many fixed income markets as they pulled back sharply after the Fed announced its intention to implement a second round of quantitative easing (QE2) with a $600 billion bond buying program. During the three-month period the BC Municipal Bond Index: Long Component, which consists of 22-year and longer municipal securities, fell 8.58%, while the BC U.S. Treasury Index: Long Component, which tracks Treasuries with 10-year or longer maturities, dipped 7.07%.1
1. Source: © 2011 Morningstar. All Rights Reserved. The information contained herein: (1) is proprietary to Morningstar and/or its content providers; (2) may not be copied or distributed; and (3) is not warranted to be accurate, complete or timely. Neither Morningstar nor its content providers are responsible for any damages or losses arising from any use of this information. Past performance is no guarantee of future results.
2. Source: Thomson Reuters.
4 | Annual Report
Several factors contributed to municipal bond market weakness:
- The market seemed dissatisfied that the Fed indicated it would target bonds with maturities of 10 years or less, which contributed to a sell-off in bonds with maturities longer than 10 years.
- Some observers felt QE2 was unnecessary and might even ignite inflation, which contributed to weakness in shorter term bonds. The municipal bond market pulled back as yields generally rose. This was exacerbated as market concerns led to investor redemptions, forcing further sell-offs.
According to the Investment Company Institute, cash flows into munici- pal bond mutual funds during the reporting period first turned negative the week of November 10 and worsened in following weeks. - For most of calendar year 2010, market participants had expected the BAB program to be extended beyond 2010, and they began to anticipate a larger-than-normal supply of municipal bonds going into year-end.
This belief waned, however, as Republicans took over the majority of the House of Representatives and did not propose legislation that would continue the program. - Market participants feared municipalities would concentrate their bor- rowing needs in tax-free bonds during 2011 as they no longer had the option of using BABs. During the first two months of 2011, however, new-issue supply in the municipal bond market was almost 50% less than in the first two months of 2010, suggesting the fear of a large tax-exempt supply in 2011 may have been unwarranted.2
- In December, Congress enacted an extension of tax cuts for all Americans, which further reduced demand for tax-exempt municipal bonds.
- Some observers raised concerns about the ability of municipal market borrowers to meet their debt obligations. High-profile and repetitive media coverage of such comments created panic among some investors.
However, counterarguments citing the historically low level of municipal defaults alleviated these fears somewhat.
In February, reduced supply helped drive bond prices higher, and the market turned positive. Although the municipal bond market experienced recent, short-term volatility, we maintained a long-term perspective. In our view, the pullback in yields provided us opportunities to buy high-quality, essential use revenue and general obligation bonds at levels that may enhance the Funds’ income-earning potential.
The foregoing information reflects our analysis and opinions as of February 28, 2011, the end of the reporting period. The information is not a complete analysis of every aspect of any market, country, industry, security or fund. Statements of fact are from sources considered reliable.
Annual Report | 5
Investment Strategy and
Manager’s Discussion
We use a consistent, disciplined strategy in an effort to maximize tax-exempt income for our shareholders by seeking to maintain exposure to higher coupon securities. We generally employ a buy-and-hold approach and invest in securities we believe should provide the most relative value in the market. As we invest during different interest rate environments, each Fund’s portfolio becomes progressively more diversified with a broad range of securities. This broad diversification may help mitigate interest rate risk. We do not use leverage or exotic derivatives, nor do we use hedging techniques that could add volatility and contribute to underperformance in adverse markets. We generally stay fully invested to help maximize income distribution.
The mixture of our value-oriented philosophy of investing primarily for income and a positive-sloping municipal yield curve favored the use of longer term bonds. Consequently, we sought to purchase bonds from 15 to 30 years in maturity with good call features. We intend to maintain our conservative, buy-and-hold investment strategy as we attempt to provide shareholders with high, current, tax-free income.
We invite you to read your Fund report for more detailed performance and portfolio information. Thank you for your participation in Franklin Tax-Free Trust. We look forward to serving your future investment needs.
The foregoing information reflects our analysis, opinions and portfolio holdings as of February 28, 2011, the end of the reporting period. The way we implement our main investment strategies and the resulting portfolio holdings may change depending on factors such as market and economic conditions. These opinions may not be relied upon as investment advice or an offer for a particular security. The information is not a complete analysis of every aspect of any market, country, industry, security or fund. Statements of fact are from sources considered reliable, but the investment manager makes no representation or warranty as to their completeness or accuracy. Although historical performance is no guarantee of future results, these insights may help you understand our investment management philosophy.
6 | Annual Report
Franklin Alabama Tax-Free Income Fund
Your Fund’s Goal and Main Investments: Franklin Alabama Tax-Free Income Fund seeks to provide as high a level of income exempt from federal and Alabama personal income taxes as is consistent with prudent investment management and preservation of capital by investing at least 80% of its total assets in securities that pay interest free from such taxes.1
Performance data represent past performance, which does not guarantee future results. Investment return and principal value will fluctuate, and you may have a gain or loss when you sell your shares. Current performance may differ from figures shown. Please visit franklintempleton.com or call (800) 342-5236 for most recent month-end performance.
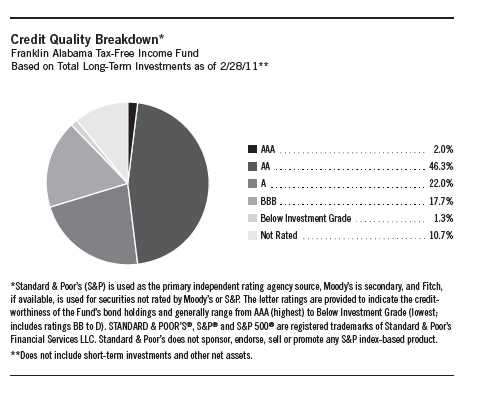
This annual report for Franklin Alabama Tax-Free Income Fund covers the fiscal year ended February 28, 2011.
Performance Overview
The Fund’s Class A share price, as measured by net asset value, decreased from $11.17 on February 28, 2010, to $10.66 on February 28, 2011. The
1. For investors subject to alternative minimum tax, a small portion of Fund dividends may be taxable. Distributions of capital gains are generally taxable. To avoid imposition of 28% backup withholding on all Fund distributions and redemption proceeds, U.S. investors must be properly certified on Form W-9 and non-U.S. investors on Form W-8BEN.
The dollar value, number of shares or principal amount, and names of all portfolio holdings are listed in the Fund’s Statement of Investments (SOI). The SOI begins on page 88.
Annual Report | 7
| | |
| Dividend Distributions* | | |
| Franklin Alabama Tax-Free Income Fund | | |
| | Dividend per Share |
| Month | Class A | Class C |
| March 2010 | 3.90 cents | 3.36 cents |
| April 2010 | 3.90 cents | 3.36 cents |
| May 2010 | 3.90 cents | 3.36 cents |
| June 2010 | 3.98 cents | 3.47 cents |
| July 2010 | 3.98 cents | 3.47 cents |
| August 2010 | 3.98 cents | 3.47 cents |
| September 2010 | 3.98 cents | 3.45 cents |
| October 2010 | 3.93 cents | 3.40 cents |
| November 2010 | 3.93 cents | 3.40 cents |
| December 2010 | 3.93 cents | 3.39 cents |
| January 2011 | 3.93 cents | 3.39 cents |
| February 2011 | 3.93 cents | 3.39 cents |
*Assumes shares were purchased and held for the entire accrual period, which differs from the calendar month. Since dividends accrue daily, your actual distributions will vary depending on the date you purchased your shares and any account activity. All Fund distributions will vary depending upon current market conditions, and past distributions are not indicative of future trends.
Fund’s Class A shares paid dividends totaling 47.57 cents per share for the same reporting period.2 The Performance Summary beginning on page 11 shows that at the end of this reporting period the Fund’s Class A shares’ distribution rate was 4.29% based on an annualization of the current 3.98 cent per share dividend and the maximum offering price of $11.13 on February 28, 2011. An investor in the 2011 maximum combined effective federal and Alabama personal income tax bracket of 38.25% would need to earn a distribution rate of 6.95% from a taxable investment to match the Fund’s Class A tax-free distribution rate. For the Fund’s Class C shares’ performance, please see the Performance Summary.
State Update
Alabama’s manufacturing-based economy faced economic challenges over the 12-month period, but showed some signs of improvement as it expanded
2. All Fund distributions will vary depending upon current market conditions, and past distributions are not indicative of future trends.
8 | Annual Report
and benefited from improved consumer demand and an influx of military and civilian employees. Heavily reliant on the auto industry, the state’s transportation equipment manufacturing jobs make up a large part of the state’s employment. During the summer, some of the state’s major auto plants such as those of Mercedes-Benz and Hyundai returned to a five-day work week after being forced to scale back during the recession. ThyssenKrupp also contributed to employment in the state with the completion of a steel plant the company expected should create 1,800 new jobs during the period.3 The mining and logging, professional and business services, and leisure and hospitality industries added jobs as well. Most significantly, the Base Realignment and Closure Commission (BRAC) consolidated several functions to Huntsville’s Redstone Arsenal, which was projected to bring 8,700 new civilian and military jobs to the state.3 Several sectors lost jobs over the reporting period, including construction and information. Alabama’s unemployment rate in February 2011 was 9.3%, compared with the 8.9% national rate.4
Throughout fiscal year 2010, Alabama adjusted its budget to offset the effects of declining sales and income taxes. In April 2010, Alabama adopted its 2011 budget and ordered 12% across-the-board cuts for the state’s general fund budget.3 Alabama faced a $65 million budget shortfall by December.5 State officials discussed using rainy day funds and trimming the general fund and education budgets. On a positive note, Alabama was one of only five states that projected a balanced budget for 2012 as state officials predicted an increase in revenues with the influx of new jobs, particularly those created by the BRAC consolidation. It is unclear, however, how the BP oil spill in the Gulf of Mexico will impact revenues. The state’s net-tax supported debt was 2.4% of personal income and $796 per capita, compared with the national medians of 2.5% and $936.6
Independent credit rating agency Standard & Poor’s assigned Alabama’s general obligation debt a rating of AA with a stable outlook.7 The rating and outlook reflected the state’s large, diverse economic base and its solid financial management policies such as mandated cutbacks to protect against revenue shortfalls.
| | |
| Portfolio Breakdown | | |
| Franklin Alabama Tax-Free Income Fund | |
| 2/28/11 | | |
| % of Total | |
| Long-Term Investments* | |
| Utilities | 29.5 | %** |
| Hospital & Health Care | 14.5 | % |
| General Obligation | 10.4 | % |
| Subject to Government Appropriations | 9.2 | % |
| Tax-Supported | 8.3 | % |
| Refunded | 8.2 | % |
| Higher Education | 7.9 | % |
| Transportation | 5.4 | % |
| Other Revenue | 2.4 | % |
| Corporate-Backed | 2.2 | % |
| Housing | 2.0 | % |
| |
| *Does not include short-term investments and other | |
| net assets. | | |
| **The Fund may invest more than 25% in municipal | |
| securities that finance similar types of projects such as | |
| utilities. A change that affects one project may affect | |
| all similar projects, thereby increasing market risk. | |
|
| 3. Source: Standard & Poor’s, “Alabama; General Obligation,” RatingsDirect, 5/10/10. |
| 4. Source: Bureau of Labor Statistics. |
| 5. Source: “State Faces Budget Shortfalls of $26.7 Billion,” The Wall Street Journal, 12/8/10. |
| 6. Source: Moody’s Investors Service, “Special Comment: 2010 State Debt Medians Report,” May 2010. |
| 7. This does not indicate Standard & Poor’s rating of the Fund. |
Annual Report | 9
Manager’s Discussion
We used various investment strategies during the 12 months under review as we sought to maximize tax-free income for shareholders. Please read the discussion on page 6 for details.
Thank you for your continued participation in Franklin Alabama Tax-Free Income Fund. We intend to maintain our conservative, buy-and-hold investment strategy as we attempt to provide shareholders with high, current, tax-free income.
The foregoing information reflects our analysis, opinions and portfolio holdings as of February 28, 2011, the end of the reporting period. The way we implement our main investment strategies and the resulting portfolio holdings may change depending on factors such as market and economic conditions. These opinions may not be relied upon as investment advice or an offer for a particular security. The information is not a complete analysis of every aspect of any market, state, industry, security or the Fund. Statements of fact are from sources considered reliable, but the investment manager makes no representation or warranty as to their completeness or accuracy. Although historical performance is no guarantee of future results, these insights may help you understand our investment management philosophy.
10 | Annual Report
Performance Summary as of 2/28/11
Franklin Alabama Tax-Free Income Fund
Your dividend income will vary depending on dividends or interest paid by securities in the Fund’s portfolio, adjusted for operating expenses of each class. Capital gain distributions are net profits realized from the sale of portfolio securities. The performance table and graphs do not reflect any taxes that a shareholder would pay on Fund dividends, capital gain distributions, if any, or any realized gains on the sale of Fund shares. Total return reflects reinvestment of the Fund’s dividends and capital gain distributions, if any, and any unrealized gains or losses.
| | | | | | | | |
| Price and Distribution Information | | | | | | |
| Class A (Symbol: FRALX) | | | | Change | | 2/28/11 | | 2/28/10 |
| Net Asset Value (NAV) | | | -$ | 0.51 | $ | 10.66 | $ | 11.17 |
| Distributions (3/1/10–2/28/11) | | | | | | | | |
| Dividend Income | $ | 0.4757 | | | | | | |
| Class C (Symbol: FALEX) | | | | Change | | 2/28/11 | | 2/28/10 |
| Net Asset Value (NAV) | | | -$ | 0.51 | $ | 10.77 | $ | 11.28 |
| Distributions (3/1/10–2/28/11) | | | | | | | | |
| Dividend Income | $ | 0.4118 | | | | | | |
Performance
Cumulative total return excludes sales charges. Average annual total returns include maximum sales charges. Class A: 4.25% maximum initial sales charge; Class C: 1% contingent deferred sales charge in first year only.
| | | | | | | | | | |
| Class A | | | 1-Year | | | 5-Year | | | 10-Year | |
| Cumulative Total Return1 | | | -0.38 | % | + | 14.86 | % | + | 49.88 | % |
| Average Annual Total Return2 | | | -4.65 | % | + | 1.92 | % | + | 3.68 | % |
| Avg. Ann. Total Return (3/31/11)3 | | | -5.56 | % | + | 1.83 | % | + | 3.53 | % |
| Distribution Rate4 | 4.29 | % | | | | | | | | |
| Taxable Equivalent Distribution Rate5 | 6.95 | % | | | | | | | | |
| 30-Day Standardized Yield6 | 4.10 | % | | | | | | | | |
| Taxable Equivalent Yield5 | 6.64 | % | | | | | | | | |
| Total Annual Operating Expenses7 | 0.71 | % | | | | | | | | |
| Class C | | | 1-Year | | | 5-Year | | | 10-Year | |
| Cumulative Total Return1 | | | -0.94 | % | + | 11.79 | % | + | 42.03 | % |
| Average Annual Total Return2 | | | -1.90 | % | + | 2.25 | % | + | 3.57 | % |
| Avg. Ann. Total Return (3/31/11)3 | | | -2.89 | % | + | 2.17 | % | + | 3.42 | % |
| Distribution Rate4 | 3.92 | % | | | | | | | | |
| Taxable Equivalent Distribution Rate5 | 6.35 | % | | | | | | | | |
| 30-Day Standardized Yield6 | 3.73 | % | | | | | | | | |
| Taxable Equivalent Yield5 | 6.04 | % | | | | | | | | |
| Total Annual Operating Expenses7 | 1.26 | % | | | | | | | | |
Performance data represent past performance, which does not guarantee future results. Investment return and principal value will fluctuate, and you may have a gain or loss when you sell your shares. Current performance may differ from figures shown. For most recent month-end performance, go to franklintempleton.com or call (800) 342-5236.
Annual Report | 11
Performance Summary (continued)
Total Return Index Comparison for a Hypothetical $10,000 Investment
Total return represents the change in value of an investment over the periods shown. It includes any current, applicable, maximum sales charge, Fund expenses, account fees and reinvested distributions. The unmanaged index includes reinvestment of any income or distributions. It differs from the Fund in composition and does not pay management fees or expenses. One cannot invest directly in an index.

| | | | | |
| 3/01 | 2/03 | 2/05 | 2/07 | 2/09 | 2/11 |
| Franklin Alabama Tax-Free Income Fund | BC Municipal Bond Index 8 | CPI8 |
12 | Annual Report
Performance Summary (continued)
Endnotes
Because municipal bonds are sensitive to interest rate movements, the Fund’s yield and share price will fluctuate with market conditions. Bond prices generally move in the opposite direction of interest rates. Thus, as prices of bonds in the Fund adjust to a rise in interest rates, the Fund’s share price may decline. Since the Fund concentrates its investments in a single state, it is subject to greater risk of adverse economic and regulatory changes in that state than a geographically diversified fund. The manager applies various techniques and analyses in making investment decisions for the Fund, but there can be no guarantee that these decisions will produce the desired results. The Fund’s prospectus also includes a description of the main investment risks.
| |
Class C: | Prior to 1/1/04, these shares were offered with an initial sales charge; thus actual total returns would have differed. These shares have higher annual fees and expenses than Class A shares. |
1. Cumulative total return represents the change in value of an investment over the periods indicated.
2. Average annual total return represents the average annual change in value of an investment over the periods indicated.
3. In accordance with SEC rules, we provide standardized average annual total return information through the latest calendar quarter.
4. Distribution rate is based on an annualization of the respective class’s current monthly dividend and the maximum offering price (NAV for Class C) per share on 2/28/11.
5. Taxable equivalent distribution rate and yield assume the published rates as of 12/28/10 for the maximum combined effective federal and Alabama personal income tax rate of 38.25%, based on the federal income tax rate of 35.00%.
6. The 30-day standardized yield for the month ended 2/28/11 reflects an estimated yield to maturity (assuming all portfolio securities are held to maturity). It should be regarded as an estimate of the Fund’s rate of investment income, and it may not equal the Fund’s actual income distribution rate (which reflects the Fund’s past dividends paid to shareholders) or the income reported in the Fund’s financial statements.
7. Figures are as stated in the Fund’s prospectus current as of the date of this report. In periods of market volatility, assets may decline significantly, causing total annual Fund operating expenses to become higher than the figures shown.
8. Source: © 2011 Morningstar. The BC Municipal Bond Index is a market value-weighted index engineered for the long-term tax-exempt bond market. To be included in the index, bonds must be fixed rate, have at least one year to final maturity and be rated investment grade (Baa3/BBB-or higher) by at least two of the following agencies: Moody’s, Standard & Poor’s and Fitch. The Consumer Price Index (CPI), calculated by the U.S. Bureau of Labor Statistics, is a commonly used measure of the inflation rate.
Annual Report | 13
Your Fund’s Expenses
Franklin Alabama Tax-Free Income Fund
As a Fund shareholder, you can incur two types of costs:
- Transaction costs, including sales charges (loads) on Fund purchases; and
- Ongoing Fund costs, including management fees, distribution and service (12b-1) fees, and other Fund expenses. All mutual funds have ongoing costs, sometimes referred to as operating expenses.
The following table shows ongoing costs of investing in the Fund and can help you understand these costs and compare them with those of other mutual funds. The table assumes a $1,000 investment held for the six months indicated.
Actual Fund Expenses
The first line (Actual) for each share class listed in the table provides actual account values and expenses. The “Ending Account Value” is derived from the Fund’s actual return, which includes the effect of Fund expenses.
You can estimate the expenses you paid during the period by following these steps. Of course, your account value and expenses will differ from those in this illustration:
| 1. | Divide your account value by $1,000. |
| | If an account had an $8,600 value, then $8,600 ÷ $1,000 = 8.6. |
| 2. | Multiply the result by the number under the heading “Expenses Paid During Period.” |
| | If Expenses Paid During Period were $7.50, then 8.6 x $7.50 = $64.50. |
In this illustration, the estimated expenses paid this period are $64.50.
Hypothetical Example for Comparison with Other Funds
Information in the second line (Hypothetical) for each class in the table can help you compare ongoing costs of investing in the Fund with those of other mutual funds. This information may not be used to estimate the actual ending account balance or expenses you paid during the period. The hypothetical “Ending Account Value” is based on the actual expense ratio for each class and an assumed 5% annual rate of return before expenses, which does not represent the Fund’s actual return. The figure under the heading “Expenses Paid During Period” shows the hypothetical expenses your account would have incurred under this scenario. You can compare this figure with the 5% hypothetical examples that appear in shareholder reports of other funds.
14 | Annual Report
Your Fund’s Expenses (continued)
Please note that expenses shown in the table are meant to highlight ongoing costs and do not reflect any transaction costs, such as sales charges. Therefore, the second line for each class is useful in comparing ongoing costs only, and will not help you compare total costs of owning different funds. In addition, if transaction costs were included, your total costs would have been higher. Please refer to the Fund prospectus for additional information on operating expenses.
| | | | | | |
| | | Beginning Account | | Ending Account | | Expenses Paid During |
| Class A | | Value 9/1/10 | | Value 2/28/11 | | Period* 9/1/10–2/28/11 |
| Actual | $ | 1,000 | $ | 951.20 | $ | 3.43 |
| Hypothetical (5% return before expenses) | $ | 1,000 | $ | 1,021.27 | $ | 3.56 |
| Class C | | | | | | |
| Actual | $ | 1,000 | $ | 949.00 | $ | 6.09 |
| Hypothetical (5% return before expenses) | $ | 1,000 | $ | 1,018.55 | $ | 6.31 |
*Expenses are calculated using the most recent six-month expense ratio, annualized for each class (A: 0.71% and C: 1.26%), multiplied by the average account value over the period, multiplied by 181/365 to reflect the one-half year period.
Annual Report | 15
Franklin Florida Tax-Free Income Fund
Your Fund’s Goal and Main Investments: Franklin Florida Tax-Free Income Fund seeks to provide as high a level of income exempt from federal income taxes, and any Florida personal income taxes, as is consistent with prudent investment management and preservation of capital by investing at least 80% of its total assets in securities that pay interest free from such taxes.1
Performance data represent past performance, which does not guarantee future results. Investment return and principal value will fluctuate, and you may have a gain or loss when you sell your shares. Current performance may differ from figures shown. Please visit franklintempleton.com or call (800) 342-5236 for most recent month-end performance.
| | |
| Credit Quality Breakdown* | | |
| Franklin Florida Tax-Free Income Fund | | |
| 2/28/11 | | |
| | % of Total | |
| Ratings | Long-Term Investments** | |
| AAA | 6.3 | % |
| AA | 38.3 | % |
| A | 24.6 | % |
| BBB | 20.1 | % |
| Below Investment Grade | 0.7 | % |
| Not Rated | 10.0 | % |
*Standard & Poor’s (S&P) is used as the primary independent rating agency source, Moody’s is secondary, and Fitch, if available, is used for securities not rated by Moody’s or S&P. The letter ratings are provided to indicate the credit-worthiness of the Fund’s bond holdings and generally range from AAA (highest) to Below Investment Grade (lowest; includes ratings BB to D).
**Does not include short-term investments and other net assets.
This annual report for Franklin Florida Tax-Free Income Fund covers the fiscal year ended February 28, 2011.
Performance Overview
The Fund’s Class A share price, as measured by net asset value, decreased from $11.45 on February 28, 2010, to $11.08 on February 28, 2011. The
1. For investors subject to alternative minimum tax, a small portion of Fund dividends may be taxable. Distributions of capital gains are generally taxable. To avoid imposition of 28% backup withholding on all Fund distributions and redemption proceeds, U.S. investors must be properly certified on Form W-9 and non-U.S. investors on Form W-8BEN.
The dollar value, number of shares or principal amount, and names of all portfolio holdings are listed in the Fund’s Statement of Investments (SOI). The SOI begins on page 94.
16 | Annual Report
| | | |
| Dividend Distributions* | | | |
| Franklin Florida Tax-Free Income Fund | | | |
| | Dividend per Share |
| Month | Class A | Class B | Class C |
| March 2010 | 4.47 cents | 3.94 cents | 3.92 cents |
| April 2010 | 4.47 cents | 3.94 cents | 3.92 cents |
| May 2010 | 4.47 cents | 3.94 cents | 3.92 cents |
| June 2010 | 4.38 cents | 3.87 cents | 3.86 cents |
| July 2010 | 4.38 cents | 3.87 cents | 3.86 cents |
| August 2010 | 4.38 cents | 3.87 cents | 3.86 cents |
| September 2010 | 4.38 cents | 3.86 cents | 3.84 cents |
| October 2010 | 4.38 cents | 3.86 cents | 3.84 cents |
| November 2010 | 4.38 cents | 3.86 cents | 3.84 cents |
| December 2010 | 4.38 cents | 3.84 cents | 3.82 cents |
| January 2011 | 4.38 cents | 3.84 cents | 3.82 cents |
| February 2011 | 4.38 cents | 3.84 cents | 3.82 cents |
*Assumes shares were purchased and held for the entire accrual period, which differs from the calendar month. Since dividends accrue daily, your actual distributions will vary depending on the date you purchased your shares and any account activity. All Fund distributions will vary depending upon current market conditions, and past distributions are not indicative of future trends.
Fund’s Class A shares paid dividends totaling 53.13 cents per share for the same period.2 The Performance Summary beginning on page 20 shows that at the end of this reporting period the Fund’s Class A shares’ distribution rate was 4.54% based on an annualization of the current 4.38 cent per share dividend and the maximum offering price of $11.57 on February 28, 2011. An investor in the 2011 maximum federal income tax bracket of 35.00% would need to earn a distribution rate of 6.98% from a taxable investment to match the Fund’s Class A tax-free distribution rate. For the Fund’s Class B and C shares’ performance, please see the Performance Summary. Dividend distributions during the year under review were affected by securities purchased in the prior period and by falling municipal bond rates in 2009 through November 2010. In addition, for most of the Fund’s fiscal year, investor demand was strong for municipal bonds in an environment of limited tax-exempt supply. These factors resulted in reduced income for the portfolio and caused dividends to decline.
2. All Fund distributions will vary depending upon current market conditions, and past distributions are not indicative of future trends.
Annual Report | 17
State Update
Florida enjoys a diverse economy with a strong tourist industry and has benefited from migration to the state for many years. The national recession, however, took a toll on migration and the state’s overall economy. Florida was one of the first states to fall into a housing crisis, and the real estate market downturn caused construction industry job losses over the period. The information and financial activities sectors shed employees as well. The state’s 11.5% unemployment rate was significantly higher than the 8.9% national average.3 Several sectors helped employment including mining and logging, leisure and hospitality, and education and health services.
Another economic challenge for Florida has been the Deepwater Horizon drill rig leased by energy company BP, which exploded and sank in the Gulf of Mexico, causing an oil spill that threatened the tourism industry. The state spent millions in mitigation grants from BP in clean-up campaigns and tourism marketing. Florida is monitoring the situation closely and will continue to spend additional grant money to assist with recovery.
Florida’s history of strong fiscal management helped stabilize its general fund revenues. Unlike many states, Florida ended fiscal year 2010 with a budget surplus of approximately $1.2 billion.4 But similar to most municipalities, the state fought ongoing challenges such as housing market weakness and reliance on economically sensitive sales tax. The slow economic recovery contributed to a significant $2.8 billion budget gap for the 2011 fiscal year. The governor closed the gap with one-time measures including federal stimulus funds, available trust funds and Indian gaming revenues. Spending reductions from corrections and health and human services also bridged the gap. In addition, the state reduced revenue estimates for fiscal year 2012 largely due to declining sales and corporate income taxes, as well as lower hospital and medical fees. Florida’s net tax-supported debt was 2.9% of personal income and $1,123 per capita, compared with the national medians of 2.5% and $936.5
Independent credit rating agency Standard & Poor’s assigned Florida’s general obligation bonds its highest rating of AAA with a negative outlook.6 The rating and outlook reflected the state’s continued economic and financial pressures, and its reliance on one-time measures to address budget imbalance. Florida’s strengths remain its quick response to declining revenues and strong reserves, although depleted over the past few years.
| | |
| Portfolio Breakdown | | |
| Franklin Florida Tax-Free Income Fund | |
| 2/28/11 | | |
| % of Total | |
| Long-Term Investments* | |
| Utilities | 22.5 | % |
| Transportation | 16.2 | % |
| Refunded | 11.5 | % |
| Subject to Government Appropriations | 11.3 | % |
| Hospital & Health Care | 10.0 | % |
| Tax-Supported | 9.3 | % |
| General Obligation | 7.8 | % |
| Other Revenue | 5.0 | % |
| Housing | 4.1 | % |
| Higher Education | 2.3 | % |
| |
| *Does not include short-term investments and other | |
| net assets. | | |
| |
| 3. Source: Bureau of Labor Statistics. | |
| 4. Source: Moody’s Investors Service, “Rating Update: Moody’s Affirms State of Florida General Obligation Bonds,” | |
| 8/10/10 | . |
| 5. Source: Moody’s Investors Service, “Special Comment | : 2010 State Debt Medians Report,” May 2010. |
| 6. This does not indicate Standard & Poor’s rating of the Fund. | |
18 | Annual Report
Manager’s Discussion
We used various investment strategies during the 12 months under review as we sought to maximize tax-free income for shareholders. Please read the discussion on page 6 for details.
Thank you for your continued participation in Franklin Florida Tax-Free Income Fund. We intend to maintain our conservative, buy-and-hold investment strategy as we attempt to provide shareholders with high, current, tax-free income.
The foregoing information reflects our analysis, opinions and portfolio holdings as of February 28, 2011, the end of the reporting period. The way we implement our main investment strategies and the resulting portfolio holdings may change depending on factors such as market and economic conditions. These opinions may not be relied upon as investment advice or an offer for a particular security. The information is not a complete analysis of every aspect of any market, state, industry, security or the Fund. Statements of fact are from sources considered reliable, but the investment manager makes no representation or warranty as to their completeness or accuracy. Although historical performance is no guarantee of future results, these insights may help you understand our investment management philosophy.
Annual Report | 19
Performance Summary as of 2/28/11
Franklin Florida Tax-Free Income Fund
Your dividend income will vary depending on dividends or interest paid by securities in the Fund’s portfolio, adjusted for operating expenses of each class. Capital gain distributions are net profits realized from the sale of portfolio securities. The performance table and graphs do not reflect any taxes that a shareholder would pay on Fund dividends, capital gain distributions, if any, or any realized gains on the sale of Fund shares. Total return reflects reinvestment of the Fund’s dividends and capital gain distributions, if any, and any unrealized gains or losses.
| | | | | | | | |
| Price and Distribution Information | | | | | | |
| Class A (Symbol: FRFLX) | | | | Change | | 2/28/11 | | 2/28/10 |
| Net Asset Value (NAV) | | | -$ | 0.37 | $ | 11.08 | $ | 11.45 |
| Distributions (3/1/10–2/28/11) | | | | | | | | |
| Dividend Income | $ | 0.5313 | | | | | | |
| Class B (Symbol: FRFBX) | | | | Change | | 2/28/11 | | 2/28/10 |
| Net Asset Value (NAV) | | | -$ | 0.38 | $ | 11.17 | $ | 11.55 |
| Distributions (3/1/10–2/28/11) | | | | | | | | |
| Dividend Income | $ | 0.4680 | | | | | | |
| Class C (Symbol: FRFIX) | | | | Change | | 2/28/11 | | 2/28/10 |
| Net Asset Value (NAV) | | | -$ | 0.38 | $ | 11.25 | $ | 11.63 |
| Distributions (3/1/10–2/28/11) | | | | | | | | |
| Dividend Income | $ | 0.4659 | | | | | | |
20 | Annual Report
Performance Summary (continued)
Performance
Cumulative total return excludes sales charges. Average annual total returns include maximum sales charges. Class A: 4.25% maximum initial sales charge; Class B: contingent deferred sales charge (CDSC) declining from 4% to 1% over six years, and eliminated thereafter; Class C: 1% CDSC in first year only.
| | | | | | | | | | | |
| Class A | | | | 1-Year | | | 5-Year | | | 10-Year | |
| Cumulative Total Return1 | | | + | 1.38 | % | + | 17.36 | % | + | 53.96 | % |
| Average Annual Total Return2 | | | | -2.94 | % | + | 2.36 | % | + | 3.96 | % |
| Avg. Ann. Total Return (3/31/11)3 | | | | -3.68 | % | + | 2.37 | % | + | 3.81 | % |
| Distribution Rate4 | 4.54 | % | | | | | | | | | |
| Taxable Equivalent Distribution Rate5 | 6.98 | % | | | | | | | | | |
| 30-Day Standardized Yield6 | 3.96 | % | | | | | | | | | |
| Taxable Equivalent Yield5 | 6.09 | % | | | | | | | | | |
| Total Annual Operating Expenses7 | 0.62 | % | | | | | | | | | |
| Class B | | | | 1-Year | | | 5-Year | | | 10-Year | |
| Cumulative Total Return1 | | | + | 0.73 | % | + | 14.16 | % | + | 47.68 | % |
| Average Annual Total Return2 | | | | -3.14 | % | + | 2.35 | % | + | 3.98 | % |
| Avg. Ann. Total Return (3/31/11)3 | | | | -3.77 | % | + | 2.35 | % | + | 3.81 | % |
| Distribution Rate4 | 4.19 | % | | | | | | | | | |
| Taxable Equivalent Distribution Rate5 | 6.45 | % | | | | | | | | | |
| 30-Day Standardized Yield6 | 3.61 | % | | | | | | | | | |
| Taxable Equivalent Yield5 | 5.55 | % | | | | | | | | | |
| Total Annual Operating Expenses7 | 1.17 | % | | | | | | | | | |
| Class C | | | | 1-Year | | | 5-Year | | | 10-Year | |
| Cumulative Total Return1 | | | + | 0.70 | % | + | 14.22 | % | + | 45.71 | % |
| Average Annual Total Return2 | | | | -0.26 | % | + | 2.70 | % | + | 3.84 | % |
| Avg. Ann. Total Return (3/31/11)3 | | | | -0.82 | % | + | 2.72 | % | + | 3.70 | % |
| Distribution Rate4 | 4.15 | % | | | | | | | | | |
| Taxable Equivalent Distribution Rate5 | 6.38 | % | | | | | | | | | |
| 30-Day Standardized Yield6 | 3.61 | % | | | | | | | | | |
| Taxable Equivalent Yield5 | 5.55 | % | | | | | | | | | |
| Total Annual Operating Expenses7 | 1.17 | % | | | | | | | | | |
Performance data represent past performance, which does not guarantee future results. Investment return and principal value will fluctuate, and you may have a gain or loss when you sell your shares. Current performance may differ from figures shown. For most recent month-end performance, go to franklintempleton.com or call (800) 342-5236.
Annual Report | 21
Performance Summary (continued)
Total Return Index Comparison for a Hypothetical $10,000 Investment
Total return represents the change in value of an investment over the periods shown. It includes any current, applicable, maximum sales charge, Fund expenses, account fees and reinvested distributions. The unmanaged index includes reinvestment of any income or distributions. It differs from the Fund in composition and does not pay management fees or expenses. One cannot invest directly in an index.
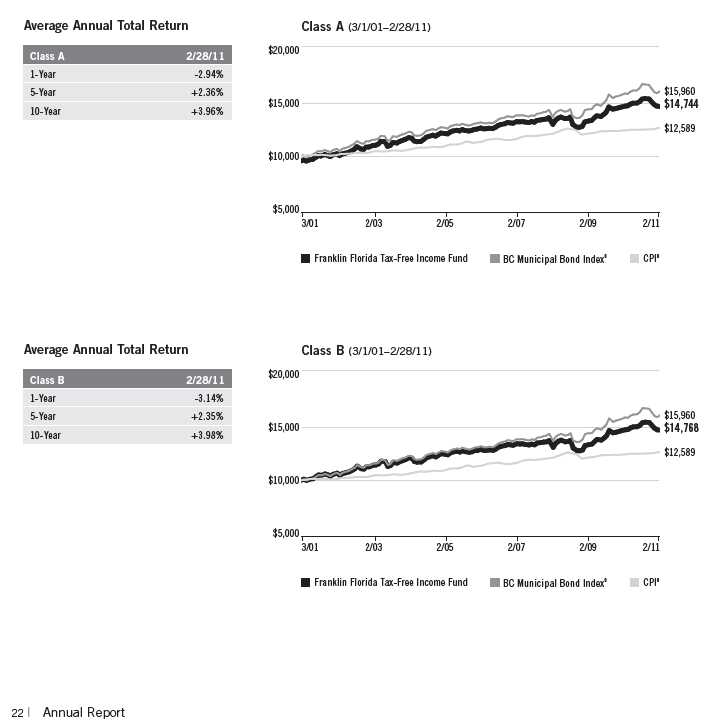
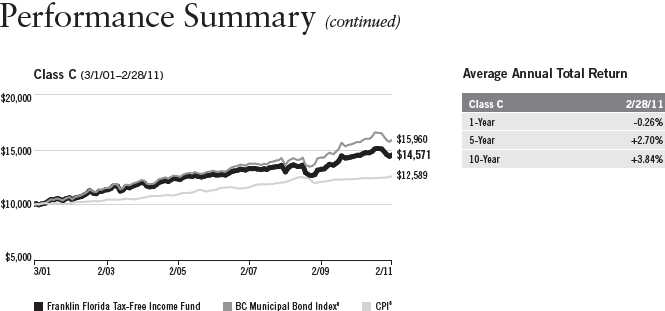
Endnotes
Because municipal bonds are sensitive to interest rate movements, the Fund’s yield and share price will fluctuate with market conditions. Bond prices generally move in the opposite direction of interest rates. Thus, as prices of bonds in the Fund adjust to a rise in interest rates, the Fund’s share price may decline. Since the Fund concentrates its investments in a single state, it is subject to greater risk of adverse economic and regulatory changes in that state than a geographically diversified fund. The manager applies various techniques and analyses in making investment decisions for the Fund, but there can be no guarantee that these decisions will produce the desired results. The Fund’s prospectus also includes a description of the main investment risks.
| |
Class B: Class C: | These shares have higher annual fees and expenses than Class A shares. Prior to 1/1/04, these shares were offered with an initial sales charge; thus actual total returns would have differed. These shares have higher annual fees and expenses than Class A shares. |
1. Cumulative total return represents the change in value of an investment over the periods indicated.
2. Average annual total return represents the average annual change in value of an investment over the periods indicated.
3. In accordance with SEC rules, we provide standardized average annual total return information through the latest calendar quarter.
4. Distribution rate is based on an annualization of the respective class’s current monthly dividend and the maximum offering price (NAV for Classes B and C) per share on 2/28/11.
5. Taxable equivalent distribution rate and yield assume the 2011 maximum federal income tax rate of 35.00%.
6. The 30-day standardized yield for the month ended 2/28/11 reflects an estimated yield to maturity (assuming all portfolio securities are held to maturity). It should be regarded as an estimate of the Fund’s rate of investment income, and it may not equal the Fund’s actual income distribution rate (which reflects the Fund’s past dividends paid to shareholders) or the income reported in the Fund’s financial statements.
7. Figures are as stated in the Fund’s prospectus current as of the date of this report. In periods of market volatility, assets may decline significantly, causing total annual Fund operating expenses to become higher than the figures shown.
8. Source: © 2011 Morningstar. The BC Municipal Bond Index is a market value-weighted index engineered for the long-term tax-exempt bond market. To be included in the index, bonds must be fixed rate, have at least one year to final maturity and be rated investment grade (Baa3/BBB- or higher) by at least two of the following agencies: Moody’s, Standard & Poor’s and Fitch. The Consumer Price Index (CPI), calculated by the U.S. Bureau of Labor Statistics, is a commonly used measure of the inflation rate.
Annual Report | 23
Your Fund’s Expenses
Franklin Florida Tax-Free Income Fund
As a Fund shareholder, you can incur two types of costs:
- Transaction costs, including sales charges (loads) on Fund purchases; and
- Ongoing Fund costs, including management fees, distribution and service (12b-1) fees, and other Fund expenses. All mutual funds have ongoing costs, sometimes referred to as operating expenses.
The following table shows ongoing costs of investing in the Fund and can help you understand these costs and compare them with those of other mutual funds. The table assumes a $1,000 investment held for the six months indicated.
Actual Fund Expenses
The first line (Actual) for each share class listed in the table provides actual account values and expenses. The “Ending Account Value” is derived from the Fund’s actual return, which includes the effect of Fund expenses.
You can estimate the expenses you paid during the period by following these steps. Of course, your account value and expenses will differ from those in this illustration:
| 1. | Divide your account value by $1,000. |
| | If an account had an $8,600 value, then $8,600 ÷ $1,000 = 8.6. |
| 2. | Multiply the result by the number under the heading “Expenses Paid During Period.” |
| | If Expenses Paid During Period were $7.50, then 8.6 x $7.50 = $64.50. |
In this illustration, the estimated expenses paid this period are $64.50.
Hypothetical Example for Comparison with Other Funds
Information in the second line (Hypothetical) for each class in the table can help you compare ongoing costs of investing in the Fund with those of other mutual funds. This information may not be used to estimate the actual ending account balance or expenses you paid during the period. The hypothetical “Ending Account Value” is based on the actual expense ratio for each class and an assumed 5% annual rate of return before expenses, which does not represent the Fund’s actual return. The figure under the heading “Expenses Paid During Period” shows the hypothetical expenses your account would have incurred under this scenario. You can compare this figure with the 5% hypothetical examples that appear in shareholder reports of other funds.
24 | Annual Report
Your Fund’s Expenses (continued)
Please note that expenses shown in the table are meant to highlight ongoing costs and do not reflect any transaction costs, such as sales charges. Therefore, the second line for each class is useful in comparing ongoing costs only, and will not help you compare total costs of owning different funds. In addition, if transaction costs were included, your total costs would have been higher. Please refer to the Fund prospectus for additional information on operating expenses.
| | | | | | |
| | | Beginning Account | | Ending Account | | Expenses Paid During |
| Class A | | Value 9/1/10 | | Value 2/28/11 | | Period* 9/1/10–2/28/11 |
| Actual | $ | 1,000 | $ | 970.00 | $ | 3.03 |
| Hypothetical (5% return before expenses) | $ | 1,000 | $ | 1,021.72 | $ | 3.11 |
| Class B | | | | | | |
| Actual | $ | 1,000 | $ | 966.70 | $ | 5.71 |
| Hypothetical (5% return before expenses) | $ | 1,000 | $ | 1,018.99 | $ | 5.86 |
| Class C | | | | | | |
| Actual | $ | 1,000 | $ | 966.80 | $ | 5.71 |
| Hypothetical (5% return before expenses) | $ | 1,000 | $ | 1,018.99 | $ | 5.86 |
*Expenses are calculated using the most recent six-month expense ratio, annualized for each class (A: 0.62%; B: 1.17%; and C: 1.17%), multiplied by the average account value over the period, multiplied by 181/365 to reflect the one-half year period.
Annual Report | 25
Franklin Georgia Tax-Free Income Fund
Your Fund’s Goal and Main Investments: Franklin Georgia Tax-Free Income Fund seeks to provide as high a level of income exempt from federal and Georgia personal income taxes as is consistent with prudent investment management and preservation of capital by investing at least 80% of its total assets in securities that pay interest free from such taxes.1
Performance data represent past performance, which does not guarantee future results. Investment return and principal value will fluctuate, and you may have a gain or loss when you sell your shares. Current performance may differ from figures shown. Please visit franklintempleton.com or call (800) 342-5236 for most recent month-end performance.
| | |
| Credit Quality Breakdown* | | |
| Franklin Georgia Tax-Free Income Fund | | |
| 2/28/11 | | |
| | % of Total | |
| Ratings | Long-Term Investments** | |
| AAA | 4.4 | % |
| AA | 53.2 | % |
| A | 27.8 | % |
| BBB | 8.9 | % |
| Below Investment Grade | 0.8 | % |
| Not Rated | 4.9 | % |
*Standard & Poor’s (S&P) is used as the primary independent rating agency source, Moody’s is secondary, and Fitch, if available, is used for securities not rated by Moody’s or S&P. The letter ratings are provided to indicate the credit-worthiness of the Fund’s bond holdings and generally range from AAA (highest) to Below Investment Grade (lowest; includes ratings BB to D).
**Does not include short-term investments and other net assets.
This annual report for Franklin Georgia Tax-Free Income Fund covers the fiscal year ended February 28, 2011.
Performance Overview
The Fund’s Class A share price, as measured by net asset value, decreased from $11.92 on February 28, 2010, to $11.47 on February 28, 2011. The Fund’s
1. For investors subject to alternative minimum tax, a small portion of Fund dividends may be taxable. Distributions of capital gains are generally taxable. To avoid imposition of 28% backup withholding on all Fund distributions and redemption proceeds, U.S. investors must be properly certified on Form W-9 and non-U.S. investors on Form W-8BEN.
The dollar value, number of shares or principal amount, and names of all portfolio holdings are listed in the Fund’s Statement of Investments (SOI). The SOI begins on page 103.
26 | Annual Report
| | |
| Dividend Distributions* | | |
| Franklin Georgia Tax-Free Income Fund | | |
| | Dividend per Share |
| Month | Class A | Class C |
| March 2010 | 4.12 cents | 3.54 cents |
| April 2010 | 4.12 cents | 3.54 cents |
| May 2010 | 4.12 cents | 3.54 cents |
| June 2010 | 4.12 cents | 3.58 cents |
| July 2010 | 4.12 cents | 3.58 cents |
| August 2010 | 4.12 cents | 3.58 cents |
| September 2010 | 4.12 cents | 3.56 cents |
| October 2010 | 4.07 cents | 3.51 cents |
| November 2010 | 4.07 cents | 3.51 cents |
| December 2010 | 4.07 cents | 3.48 cents |
| January 2011 | 4.07 cents | 3.48 cents |
| February 2011 | 4.07 cents | 3.48 cents |
*Assumes shares were purchased and held for the entire accrual period, which differs from the calendar month. Since dividends accrue daily, your actual distributions will vary depending on the date you purchased your shares and any account activity. All Fund distributions will vary depending upon current market conditions, and past distributions are not indicative of future trends.
Class A shares paid dividends totaling 49.52 cents per share for the same period.2 The Performance Summary beginning on page 30 shows that at the end of this reporting period the Fund’s Class A shares’ distribution rate was 4.24% based on an annualization of the current 4.23 cent per share dividend and the maximum offering price of $11.98 on February 28, 2011. An investor in the 2011 maximum combined effective federal and Georgia personal income tax bracket of 38.90% would need to earn a distribution rate of 6.94% from a taxable investment to match the Fund’s Class A tax-free distribution rate. For the Fund’s Class C shares’ performance, please see the Performance Summary. Dividend distributions during the year under review were affected by securities purchased in the prior period and by falling municipal bond rates in 2009 through November 2010. In addition, for most of the Fund’s fiscal year, investor demand was strong for municipal bonds in an environment of limited tax-exempt supply. These factors resulted in reduced income for the portfolio and caused dividends to decline.
2. All Fund distributions will vary depending upon current market conditions, and past distributions are not indicative of future trends.
Annual Report | 27
| | |
| Portfolio Breakdown | | |
| Franklin Georgia Tax-Free Income Fund | |
| 2/28/11 | | |
| % of Total | |
| Long-Term Investments* | |
| Utilities | 29.5 | %** |
| Hospital & Health Care | 16.5 | % |
| Subject to Government Appropriations | 14.2 | % |
| General Obligation | 10.4 | % |
| Higher Education | 7.5 | % |
| Transportation | 7.3 | % |
| Refunded | 6.1 | % |
| Tax-Supported | 5.4 | % |
| Housing | 2.5 | % |
| Corporate-Backed | 0.3 | % |
| Other Revenue | 0.3 | % |
| |
| *Does not include short-term investments and other | |
| net assets. | | |
| **The Fund may invest more than 25% in municipal | |
| securities that finance similar types of projects such as | |
| utilities. A change that affects one project may affect | |
| all similar projects, thereby increasing market risk. | |
State Update
Georgia’s diverse economy faced economic headwinds during the reporting period with stubborn unemployment and declining revenues. Several sectors lost jobs including construction, which remained weak as the housing market struggled. Financial activities companies contracted as well and were among the hardest hit during the 12-month period. The state’s unemployment rate was 10.2% in February, compared with the 8.9% national average.3 Some sectors added jobs such as education and health services, and professional and business services. The trade and transportation sector also benefited from Atlanta Hartsfield Airport, the world’s busiest airport. Home to many large employers such as UPS and Delta Airlines, Georgia is well positioned to attract in-migration if the economy continues to recover.
Georgia’s strong financial management provided the state with some cushion even with 9.2% lower revenues in fiscal year 2010 compared with the prior year.4 Heading into the 2011 fiscal year, state officials closed a budget gap through various strategies such as expenditure reductions, remaining American Reinvestment and Recovery Act stimulus funds, and revenue enhancements. Georgia’s net tax-supported debt was 3.3% of personal income and $1,120 per capita, compared with the national medians of 2.5% and $936.5
Independent credit rating agency Standard & Poor’s (S&P) assigned Georgia’s general obligation debt its highest rating of AAA with a stable outlook.6 The rating and outlook reflected S&P’s assessment the state was well positioned to recover in the medium term but will need to make additional expense reductions if revenues do not improve rapidly.
|
| 3. Source: Bureau of Labor Statistics. |
| 4. Source: Standard & Poor’s, “Summary, Georgia: General Obligation,” RatingsDirect, 10/4/10. |
| 5. Source: Moody’s Investors Service, “Special Comment: 2010 State Debt Medians Report,” May 2010. |
| 6. This does not indicate S&P’s rating of the Fund. |
28 | Annual Report
Manager’s Discussion
We used various investment strategies during the 12 months under review as we sought to maximize tax-free income for shareholders. Please read the discussion on page 6 for details.
Thank you for your continued participation in Franklin Georgia Tax-Free Income Fund. We intend to maintain our conservative, buy-and-hold investment strategy as we attempt to provide shareholders with high, current, tax-free income.
The foregoing information reflects our analysis, opinions and portfolio holdings as of February 28, 2011, the end of the reporting period. The way we implement our main investment strategies and the resulting portfolio holdings may change depending on factors such as market and economic conditions. These opinions may not be relied upon as investment advice or an offer for a particular security. The information is not a complete analysis of every aspect of any market, state, industry, security or the Fund. Statements of fact are from sources considered reliable, but the investment manager makes no representation or warranty as to their completeness or accuracy. Although historical performance is no guarantee of future results, these insights may help you understand our investment management philosophy.
Annual Report | 29
Performance Summary as of 2/28/11
Franklin Georgia Tax-Free Income Fund
Your dividend income will vary depending on dividends or interest paid by securities in the Fund’s portfolio, adjusted for operating expenses of each class. Capital gain distributions are net profits realized from the sale of portfolio securities. The performance table and graphs do not reflect any taxes that a shareholder would pay on Fund dividends, capital gain distributions, if any, or any realized gains on the sale of Fund shares. Total return reflects reinvestment of the Fund’s dividends and capital gain distributions, if any, and any unrealized gains or losses.
| | | | | | | | |
| Price and Distribution Information | | | | | | |
| Class A (Symbol: FTGAX) | | | | Change | | 2/28/11 | | 2/28/10 |
| Net Asset Value (NAV) | | | -$ | 0.45 | $ | 11.47 | $ | 11.92 |
| Distributions (3/1/10–2/28/11) | | | | | | | | |
| Dividend Income | $ | 0.4952 | | | | | | |
| Class C (Symbol: FGAIX) | | | | Change | | 2/28/11 | | 2/28/10 |
| Net Asset Value (NAV) | | | -$ | 0.45 | $ | 11.60 | $ | 12.05 |
| Distributions (3/1/10–2/28/11) | | | | | | | | |
| Dividend Income | $ | 0.4270 | | | | | | |
Performance
Cumulative total return excludes sales charges. Average annual total returns include maximum sales charges. Class A: 4.25% maximum initial sales charge; Class C: 1% contingent deferred sales charge in first year only.
| | | | | | | | | | | |
| Class A | | | | 1-Year | | | 5-Year | | | 10-Year | |
| Cumulative Total Return1 | | | + | 0.33 | % | + | 16.70 | % | + | 51.36 | % |
| Average Annual Total Return2 | | | | -3.94 | % | + | 2.24 | % | + | 3.78 | % |
| Avg. Ann. Total Return (3/31/11)3 | | | | -4.64 | % | + | 2.29 | % | + | 3.63 | % |
| Distribution Rate4 | 4.24 | % | | | | | | | | | |
| Taxable Equivalent Distribution Rate5 | 6.94 | % | | | | | | | | | |
| 30-Day Standardized Yield6 | 4.07 | % | | | | | | | | | |
| Taxable Equivalent Yield5 | 6.66 | % | | | | | | | | | |
| Total Annual Operating Expenses7 | 0.68 | % | | | | | | | | | |
| Class C | | | | 1-Year | | | 5-Year | | | 10-Year | |
| Cumulative Total Return1 | | | | -0.24 | % | + | 13.52 | % | + | 43.31 | % |
| Average Annual Total Return2 | | | | -1.21 | % | + | 2.57 | % | + | 3.66 | % |
| Avg. Ann. Total Return (3/31/11)3 | | | | -1.90 | % | + | 2.63 | % | + | 3.52 | % |
| Distribution Rate4 | 3.87 | % | | | | | | | | | |
| Taxable Equivalent Distribution Rate5 | 6.33 | % | | | | | | | | | |
| 30-Day Standardized Yield6 | 3.72 | % | | | | | | | | | |
| Taxable Equivalent Yield5 | 6.09 | % | | | | | | | | | |
| Total Annual Operating Expenses7 | 1.23 | % | | | | | | | | | |
Performance data represent past performance, which does not guarantee future results. Investment return and principal value will fluctuate, and you may have a gain or loss when you sell your shares. Current performance may differ from figures shown. For most recent month-end performance, go to franklintempleton.com or call (800) 342-5236.
30 | Annual Report
Performance Summary (continued)
Total Return Index Comparison for a Hypothetical $10,000 Investment
Total return represents the change in value of an investment over the periods shown. It includes any current, applicable, maximum sales charge, Fund expenses, account fees and reinvested distributions. The unmanaged index includes reinvestment of any income or distributions. It differs from the Fund in composition and does not pay management fees or expenses. One cannot invest directly in an index.
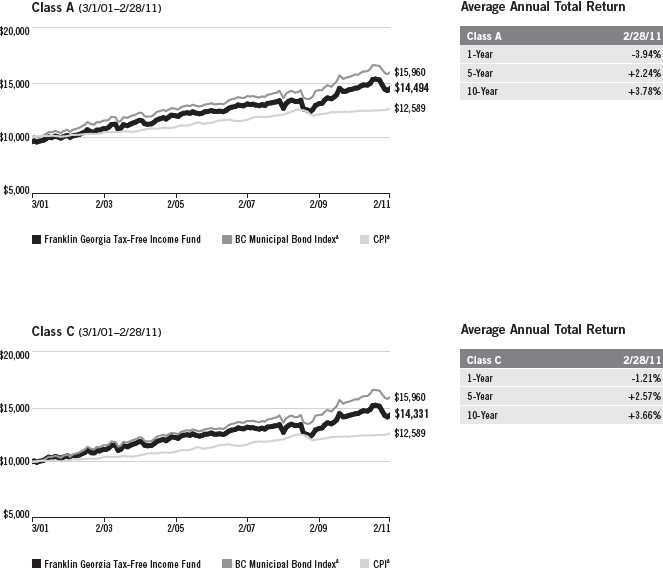
Annual Report | 31
Performance Summary (continued)
Endnotes
Because municipal bonds are sensitive to interest rate movements, the Fund’s yield and share price will fluctuate with market conditions. Bond prices generally move in the opposite direction of interest rates. Thus, as prices of bonds in the Fund adjust to a rise in interest rates, the Fund’s share price may decline. Since the fund concentrates its investments in a single state, it is subject to greater risk of adverse economic and regulatory changes in that state than a geographically diversified fund. The manager applies various techniques and analyses in making investment decisions for the Fund, but there can be no guarantee that these decisions will produce the desired results. The Fund’s prospectus also includes a description of the main investment risks.
| |
Class C: | Prior to 1/1/04, these shares were offered with an initial sales charge; thus actual total returns would have differed. These shares have higher annual fees and expenses than Class A shares. |
1. Cumulative total return represents the change in value of an investment over the periods indicated.
2. Average annual total return represents the average annual change in value of an investment over the periods indicated.
3. In accordance with SEC rules, we provide standardized average annual total return information through the latest calendar quarter.
4. Distribution rate is based on an annualization of the respective class’s current monthly dividend and the maximum offering price (NAV for Class C) per share on 2/28/11.
5. Taxable equivalent distribution rate and yield assume the published rates as of 12/28/10 for the maximum combined effective federal and Georgia personal income tax rate of 38.90%, based on the federal income tax rate of 35.00%.
6. The 30-day standardized yield for the month ended 2/28/11 reflects an estimated yield to maturity (assuming all portfolio securities are held to maturity). It should be regarded as an estimate of the Fund’s rate of investment income, and it may not equal the Fund’s actual income distribution rate (which reflects the Fund’s past dividends paid to shareholders) or the income reported in the Fund’s financial statements.
7. Figures are as stated in the Fund’s prospectus current as of the date of this report. In periods of market volatility, assets may decline significantly, causing total annual Fund operating expenses to become higher than the figures shown.
8. Source: © 2011 Morningstar. The BC Municipal Bond Index is a market value-weighted index engineered for the long-term tax-exempt bond market. To be included in the index, bonds must be fixed rate, have at least one year to final maturity and be rated investment grade (Baa3/BBB-or higher) by at least two of the following agencies: Moody’s, Standard & Poor’s and Fitch. The Consumer Price Index (CPI), calculated by the U.S. Bureau of Labor Statistics, is a commonly used measure of the inflation rate.
32 | Annual Report
Your Fund’s Expenses
Franklin Georgia Tax-Free Income Fund
As a Fund shareholder, you can incur two types of costs:
- Transaction costs, including sales charges (loads) on Fund purchases; and
- Ongoing Fund costs, including management fees, distribution and service (12b-1) fees, and other Fund expenses. All mutual funds have ongoing costs, sometimes referred to as operating expenses.
The following table shows ongoing costs of investing in the Fund and can help you understand these costs and compare them with those of other mutual funds. The table assumes a $1,000 investment held for the six months indicated.
Actual Fund Expenses
The first line (Actual) for each share class listed in the table provides actual account values and expenses. The “Ending Account Value” is derived from the Fund’s actual return, which includes the effect of Fund expenses.
You can estimate the expenses you paid during the period by following these steps. Of course, your account value and expenses will differ from those in this illustration:
| 1. | Divide your account value by $1,000. |
| | If an account had an $8,600 value, then $8,600 ÷ $1,000 = 8.6. |
| 2. | Multiply the result by the number under the heading “Expenses Paid During Period.” |
| | If Expenses Paid During Period were $7.50, then 8.6 x $7.50 = $64.50. |
In this illustration, the estimated expenses paid this period are $64.50.
Hypothetical Example for Comparison with Other Funds
Information in the second line (Hypothetical) for each class in the table can help you compare ongoing costs of investing in the Fund with those of other mutual funds. This information may not be used to estimate the actual ending account balance or expenses you paid during the period. The hypothetical “Ending Account Value” is based on the actual expense ratio for each class and an assumed 5% annual rate of return before expenses, which does not represent the Fund’s actual return. The figure under the heading “Expenses Paid During Period” shows the hypothetical expenses your account would have incurred under this scenario. You can compare this figure with the 5% hypothetical examples that appear in shareholder reports of other funds.
Annual Report | 33
Your Fund’s Expenses (continued)
Please note that expenses shown in the table are meant to highlight ongoing costs and do not reflect any transaction costs, such as sales charges. Therefore, the second line for each class is useful in comparing ongoing costs only, and will not help you compare total costs of owning different funds. In addition, if transaction costs were included, your total costs would have been higher. Please refer to the Fund prospectus for additional information on operating expenses.
| | | | | | |
| | | Beginning Account | | Ending Account | | Expenses Paid During |
| Class A | | Value 9/1/10 | | Value 2/28/11 | | Period* 9/1/10–2/28/11 |
| Actual | $ | 1,000 | $ | 951.40 | $ | 3.29 |
| Hypothetical (5% return before expenses) | $ | 1,000 | $ | 1,021.42 | $ | 3.41 |
| Class C | | | | | | |
| Actual | $ | 1,000 | $ | 948.40 | $ | 5.94 |
| Hypothetical (5% return before expenses) | $ | 1,000 | $ | 1,018.70 | $ | 6.16 |
*Expenses are calculated using the most recent six-month expense ratio, annualized for each class (A: 0.68% and C: 1.23%), multiplied by the average account value over the period, multiplied by 181/365 to reflect the one-half year period.
34 | Annual Report
Franklin Kentucky Tax-Free Income Fund
Your Fund’s Goal and Main Investments: Franklin Kentucky Tax-Free Income Fund seeks to provide as high a level of income exempt from federal and Kentucky personal income taxes as is consistent with prudent investment management and preservation of capital by investing at least 80% of its total assets in securities that pay interest free from such taxes.1
Performance data represent past performance, which does not guarantee future results. Investment return and principal value will fluctuate, and you may have a gain or loss when you sell your shares. Current performance may differ from figures shown. Please visit franklintempleton.com or call (800) 342-5236 for most recent month-end performance.
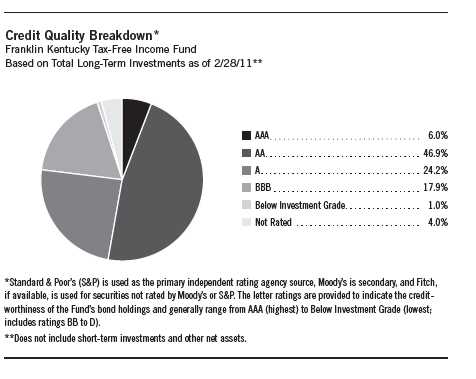
This annual report for Franklin Kentucky Tax-Free Income Fund covers the fiscal year ended February 28, 2011.
Performance Overview
The Fund’s Class A share price, as measured by net asset value, decreased from $11.15 on February 28, 2010, to $10.78 on February 28, 2011. The
1. For investors subject to alternative minimum tax, a small portion of Fund dividends may be taxable. Distributions of capital gains are generally taxable. To avoid imposition of 28% backup withholding on all Fund distributions and redemption proceeds, U.S. investors must be properly certified on Form W-9 and non-U.S. investors on Form W-8BEN.
The dollar value, number of shares or principal amount, and names of all portfolio holdings are listed in the Fund’s Statement of Investments (SOI). The SOI begins on page 109.
Annual Report | 35
| |
| Dividend Distributions* |
| Franklin Kentucky Tax-Free Income Fund |
| Class A | |
| Month | Dividend per Share |
| March 2010 | 3.80 cents |
| April 2010 | 3.80 cents |
| May 2010 | 3.80 cents |
| June 2010 | 3.75 cents |
| July 2010 | 3.75 cents |
| August 2010 | 3.75 cents |
| September 2010 | 3.75 cents |
| October 2010 | 3.75 cents |
| November 2010 | 3.75 cents |
| December 2010 | 3.75 cents |
| January 2011 | 3.75 cents |
| February 2011 | 3.75 cents |
| |
| *Assumes shares were purchased and held for the entire |
| accrual period, which differs from the calendar month. |
| Since dividends accrue daily, your actual distributions |
| will vary depending on the date you purchased your |
| shares and any account activity. All Fund distributions |
| will vary depending upon current market conditions, and |
| past distributions are not indicative of future trends. |
Fund’s Class A shares paid dividends totaling 45.42 cents per share for the same period.2 The Performance Summary beginning on page 38 shows that at the end of this reporting period the Fund’s Class A shares’ distribution rate was 4.05%. An investor in the 2011 maximum combined effective federal and Kentucky personal income tax bracket of 38.90% would need to earn a distribution rate of 6.63% from a taxable investment to match the Fund’s Class A tax-free distribution rate. Dividend distributions during the year under review were affected by securities purchased in the prior period and by falling municipal bond rates in 2009 through November 2010. In addition, for most of the Fund’s fiscal year, investor demand was strong for municipal bonds in an environment of limited tax-exempt supply. These factors resulted in reduced income for the portfolio and caused dividends to decline.
Commonwealth Update
Kentucky’s economy continued to show signs of stabilization during the reporting period. Although the local unemployment rate improved from 10.9% at the beginning of the reporting period to 10.4% by period-end, it was higher than the national 8.9% rate.3 Ford and Toyota are major employers, but the commonwealth’s diverse of array of manufacturing jobs helped protect local employment levels from recent weakness in the auto sector.
Kentucky’s budget for fiscal year 2011 relied on federal stimulus funds, debt restructuring and spending cuts. Lawmakers closed a $100 million budget gap by shifting funds earmarked for Medicaid spending in 2012 to the 2011 budget.4 In December 2010, the commonwealth reported that after five consecutive quarters of declines, general fund revenues had grown for three quarters due to improved revenue collections from coal severance and corporate income taxes. Kentucky’s net tax-supported debt was 5.4% of personal income and $1,685 per capita, compared with the national medians of 2.5% and $936.5
2. All Fund distributions will vary depending upon current market conditions, and past distributions are not indicative of future trends.
3. Source: Bureau of Labor Statistics.
4. Source: Standard & Poor’s, “Kentucky; General Obligation,” RatingsDirect, 2/23/11.
5. Source: Moody’s Investors Service, “Special Comment: 2010 State Debt Medians Report,” May 2010.
36 | Annual Report
Independent credit rating agency Standard & Poor’s assigned the commonwealth’s general obligation debt a rating of AA- with a stable outlook.6 The rating reflected Kentucky’s weakened economic base, good fiscal management practices and balanced budget. The outlook reflected the commonwealth’s willingness to make budget cuts to overcome financial hurdles.
Manager’s Discussion
We used various investment strategies during the 12 months under review as we sought to maximize tax-free income for shareholders. Please read the discussion on page 6 for details.
Thank you for your continued participation in Franklin Kentucky Tax-Free Income Fund. We intend to maintain our conservative, buy-and-hold investment strategy as we attempt to provide shareholders with high, current, tax-free income.
The foregoing information reflects our analysis, opinions and portfolio holdings as of February 28, 2011, the end of the reporting period. The way we implement our main investment strategies and the resulting portfolio holdings may change depending on factors such as market and economic conditions. These opinions may not be relied upon as investment advice or an offer for a particular security. The information is not a complete analysis of every aspect of any market, state, industry, security or the Fund. Statements of fact are from sources considered reliable, but the investment manager makes no representation or warranty as to their completeness or accuracy. Although historical performance is no guarantee of future results, these insights may help you understand our investment management philosophy.
6. This does not indicate Standard & Poor’s rating of the Fund.
| | |
| Portfolio Breakdown | | |
| Franklin Kentucky Tax-Free Income Fund | |
| 2/28/11 | | |
| % of Total | |
| Long-Term Investments* | |
| Utilities | 31.0 | %** |
| Subject to Government Appropriations | 19.4 | % |
| Refunded | 11.9 | % |
| Hospital & Health Care | 9.9 | % |
| General Obligation | 6.9 | % |
| Higher Education | 6.7 | % |
| Transportation | 5.5 | % |
| Housing | 3.4 | % |
| Other Revenue | 2.7 | % |
| Tax-Supported | 2.6 | % |
| |
| *Does not include short-term investments and other | |
| net assets. | | |
| **The Fund may invest more than 25% in municipal | |
| securities that finance similar types of projects such as | |
| utilities. A change that affects one project may affect | |
| all similar projects, thereby increasing market risk. | |
Annual Report | 37
Performance Summary as of 2/28/11
Franklin Kentucky Tax-Free Income Fund
Your dividend income will vary depending on dividends or interest paid by securities in the Fund’s portfolio, adjusted for operating expenses. Capital gain distributions are net profits realized from the sale of portfolio securities. The performance table and graph do not reflect any taxes that a shareholder would pay on Fund dividends, capital gain distributions, if any, or any realized gains on the sale of Fund shares. Total return reflects reinvestment of the Fund’s dividends and capital gain distributions, if any, and any unrealized gains or losses.
| | | | | | | | |
| Price and Distribution Information | | | | | | |
| Class A (Symbol: FRKYX) | | | | Change | | 2/28/11 | | 2/28/10 |
| Net Asset Value (NAV) | | | -$ | 0.37 | $ | 10.78 | $ | 11.15 |
| Distributions (3/1/10–2/28/11) | | | | | | | | |
| Dividend Income | $ | 0.4542 | | | | | | |
Performance
Cumulative total return excludes the sales charge. Average annual total returns include the maximum sales charge.
Class A: 4.25% maximum initial sales charge.
| | | | | | | | | | | |
| Class A | | | | 1-Year | | | 5-Year | | | 10-Year | |
| Cumulative Total Return1 | | | + | 0.72 | % | + | 16.52 | % | + | 50.62 | % |
| Average Annual Total Return2 | | | | -3.52 | % | + | 2.21 | % | + | 3.73 | % |
| Avg. Ann. Total Return (3/31/11)3 | | | | -4.01 | % | + | 2.24 | % | + | 3.57 | % |
| Distribution Rate4 | 4.05 | % | | | | | | | | | |
| Taxable Equivalent Distribution Rate5 | 6.63 | % | | | | | | | | | |
| 30-Day Standardized Yield6 | 3.48 | % | | | | | | | | | |
| Taxable Equivalent Yield5 | 5.70 | % | | | | | | | | | |
| Total Annual Operating Expenses7 | 0.76 | % | | | | | | | | | |
Performance data represent past performance, which does not guarantee future results. Investment return and principal value will fluctuate, and you may have a gain or loss when you sell your shares. Current performance may differ from figures shown. For most recent month-end performance, go to franklintempleton.com or call (800) 342-5236.
38 | Annual Report
Performance Summary (continued)
Total Return Index Comparison for a Hypothetical $10,000 Investment
Total return represents the change in value of an investment over the periods shown. It includes the current maximum sales charge, Fund expenses, account fees and reinvested distributions. The unmanaged index includes reinvestment of any income or distributions. It differs from the Fund in composition and does not pay management fees or expenses. One cannot invest directly in an index.
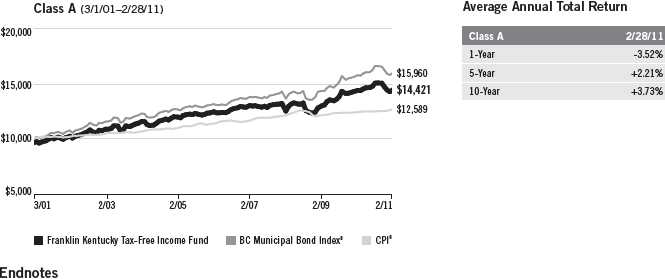
|
| Because municipal bonds are sensitive to interest rate movements, the Fund’s yield and share price will fluctu- |
| ate with market conditions. Bond prices generally move in the opposite direction of interest rates. Thus, as |
| prices of bonds in the Fund adjust to a rise in interest rates, the Fund’s share price may decline. Since the Fund |
| concentrates its investments in a single state, it is subject to greater risk of adverse economic and regulatory |
| changes in that state than a geographically diversified fund. The manager applies various techniques and |
| analyses in making investment decisions for the Fund, but there can be no guarantee that these decisions will |
| produce the desired results. The Fund’s prospectus also includes a description of the main investment risks. |
| |
| 1. Cumulative total return represents the change in value of an investment over the periods indicated. |
| 2. Average annual total return represents the average annual change in value of an investment over the periods |
| indicated. |
| 3. In accordance with SEC rules, we provide standardized average annual total return information through the latest |
| calendar quarter. |
| 4. Distribution rate is based on an annualization of the 3.80 cent per share current monthly dividend and the maxi- |
| mum offering price of $11.26 per share on 2/28/11. |
| 5. Taxable equivalent distribution rate and yield assume the published rates as of 12/28/10 for the maximum |
| combined effective federal and Kentucky personal income tax rate of 38.90%, based on the federal income tax rate |
| of 35.00%. |
| 6. The 30-day standardized yield for the month ended 2/28/11 reflects an estimated yield to maturity (assuming |
| all portfolio securities are held to maturity). It should be regarded as an estimate of the Fund’s rate of investment |
| income, and it may not equal the Fund’s actual income distribution rate (which reflects the Fund’s past dividends |
| paid to shareholders) or the income reported in the Fund’s financial statements. |
| 7. Figures are as stated in the Fund’s prospectus current as of the date of this report. In periods of market volatility, |
| assets may decline significantly, causing total annual Fund operating expenses to become higher than the figures |
| shown. |
| 8. Source: © 2011 Morningstar. The BC Municipal Bond Index is a market value-weighted index engineered for the |
| long-term tax-exempt bond market. To be included in the index, bonds must be fixed rate, have at least one year |
| to final maturity and be rated investment grade (Baa3/BBB- or higher) by at least two of the following agencies: |
| Moody’s, Standard & Poor’s and Fitch. The Consumer Price Index (CPI), calculated by the U.S. Bureau of Labor |
| Statistics, is a commonly used measure of the inflation rate. |
Annual Report | 39
Your Fund’s Expenses
Franklin Kentucky Tax-Free Income Fund
As a Fund shareholder, you can incur two types of costs:
- Transaction costs, including sales charges (loads) on Fund purchases; and
- Ongoing Fund costs, including management fees, distribution and service (12b-1) fees, and other Fund expenses. All mutual funds have ongoing costs, sometimes referred to as operating expenses.
The following table shows ongoing costs of investing in the Fund and can help you understand these costs and compare them with those of other mutual funds. The table assumes a $1,000 investment held for the six months indicated.
Actual Fund Expenses
The first line (Actual) for each share class listed in the table provides actual account values and expenses. The “Ending Account Value” is derived from the Fund’s actual return, which includes the effect of Fund expenses.
You can estimate the expenses you paid during the period by following these steps. Of course, your account value and expenses will differ from those in this illustration:
| 1. | Divide your account value by $1,000. |
| | If an account had an $8,600 value, then $8,600 ÷ $1,000 = 8.6. |
| 2. | Multiply the result by the number under the heading “Expenses Paid During Period.” |
| | If Expenses Paid During Period were $7.50, then 8.6 x $7.50 = $64.50. |
In this illustration, the estimated expenses paid this period are $64.50.
Hypothetical Example for Comparison with Other Funds
Information in the second line (Hypothetical) for each class in the table can help you compare ongoing costs of investing in the Fund with those of other mutual funds. This information may not be used to estimate the actual ending account balance or expenses you paid during the period. The hypothetical “Ending Account Value” is based on the actual expense ratio for each class and an assumed 5% annual rate of return before expenses, which does not represent the Fund’s actual return. The figure under the heading “Expenses Paid During Period” shows the hypothetical expenses your account would have incurred under this scenario. You can compare this figure with the 5% hypothetical examples that appear in shareholder reports of other funds.
40 | Annual Report
Your Fund’s Expenses (continued)
Please note that expenses shown in the table are meant to highlight ongoing costs and do not reflect any transaction costs, such as sales charges. Therefore, the second line for each class is useful in comparing ongoing costs only, and will not help you compare total costs of owning different funds. In addition, if transaction costs were included, your total costs would have been higher. Please refer to the Fund prospectus for additional information on operating expenses.
| | | | | | |
| | | Beginning Account | | Ending Account | | Expenses Paid During |
| Class A | | Value 9/1/10 | | Value 2/28/11 | | Period* 9/1/10–2/28/11 |
| Actual | $ | 1,000 | $ | 962.50 | $ | 3.60 |
| Hypothetical (5% return before expenses) | $ | 1,000 | $ | 1,021.12 | $ | 3.71 |
*Expenses are calculated using the most recent six-month annualized expense ratio of 0.74%, multiplied by the average account value over the period, multiplied by 181/365 to reflect the one-half year period.
Annual Report | 41
Franklin Louisiana Tax-Free Income Fund
Your Fund’s Goal and Main Investments: Franklin Louisiana Tax-Free Income Fund seeks to provide as high a level of income exempt from federal and Louisiana personal income taxes as is consistent with prudent investment management and preservation of capital by investing at least 80% of its total assets in securities that pay interest free from such taxes.1
Performance data represent past performance, which does not guarantee future results. Investment return and principal value will fluctuate, and you may have a gain or loss when you sell your shares. Current performance may differ from figures shown. Please visit franklintempleton.com or call (800) 342-5236 for most recent month-end performance.
| | |
| Credit Quality Breakdown* | | |
| Franklin Louisiana Tax-Free Income Fund | | |
| 2/28/11 | | |
| | % of Total | |
| Ratings | Long-Term Investments** | |
| AAA | 2.8 | % |
| AA | 30.0 | % |
| A | 34.1 | % |
| BBB | 25.8 | % |
| Below Investment Grade | 0.7 | % |
| Not Rated | 6.6 | % |
*Standard & Poor’s (S&P) is used as the primary independent rating agency source, Moody’s is secondary, and Fitch, if available, is used for securities not rated by Moody’s or S&P. The letter ratings are provided to indicate the credit-worthiness of the Fund’s bond holdings and generally range from AAA (highest) to Below Investment Grade (lowest; includes ratings BB to D).
**Does not include short-term investments and other net assets.
This annual report for Franklin Louisiana Tax-Free Income Fund covers the fiscal year ended February 28, 2011.
Performance Overview
The Fund’s Class A share price, as measured by net asset value, decreased from $11.28 on February 28, 2010, to $10.91 on February 28, 2011. The Fund’s Class A shares paid dividends totaling 47.82 cents per share for the same period.2 The Performance Summary beginning on page 45 shows that
1. For investors subject to alternative minimum tax, a small portion of Fund dividends may be taxable. Distributions of capital gains are generally taxable. To avoid imposition of 28% backup withholding on all Fund distributions and redemption proceeds, U.S. investors must be properly certified on Form W-9 and non-U.S. investors on Form W-8BEN.
2. All Fund distributions will vary depending upon current market conditions, and past distributions are not indicative of future trends.
The dollar value, number of shares or principal amount, and names of all portfolio holdings are listed in the Fund’s Statement of Investments (SOI). The SOI begins on page 115.
42 | Annual Report
| | |
| Dividend Distributions* | | |
| Franklin Louisiana Tax-Free Income Fund | | |
| | Dividend per Share |
| Month | Class A | Class C |
| March 2010 | 3.98 cents | 3.43 cents |
| April 2010 | 3.98 cents | 3.43 cents |
| May 2010 | 3.98 cents | 3.43 cents |
| June 2010 | 3.98 cents | 3.47cents |
| July 2010 | 3.98 cents | 3.47 cents |
| August 2010 | 3.98 cents | 3.47 cents |
| September 2010 | 3.98 cents | 3.46 cents |
| October 2010 | 3.93 cents | 3.41 cents |
| November 2010 | 3.93 cents | 3.41 cents |
| December 2010 | 3.93 cents | 3.37 cents |
| January 2011 | 3.93 cents | 3.37 cents |
| February 2011 | 3.93 cents | 3.37 cents |
*Assumes shares were purchased and held for the entire accrual period, which differs from the calendar month. Since dividends accrue daily, your actual distributions will vary depending on the date you purchased your shares and any account activity. All Fund distributions will vary depending upon current market conditions, and past distributions are not indicative of future trends.
at the end of this reporting period the Fund’s Class A shares’ distribution rate was 4.31% based on an annualization of the current 4.09 cent per share dividend and the maximum offering price of $11.39 on February 28, 2011. An investor in the 2011 maximum combined effective federal and Louisiana personal income tax bracket of 38.90% would need to earn a distribution rate of 7.05% from a taxable investment to match the Fund’s Class A tax-free distribution rate. For the Fund’s Class C shares’ performance, please see the Performance Summary. Dividend distributions during the year under review were affected by securities purchased in the prior period and by falling municipal bond rates in 2009 through November 2010. In addition, for most of the Fund’s fiscal year, investor demand was strong for municipal bonds in an environment of limited tax-exempt supply. These factors resulted in reduced income for the portfolio and caused dividends to decline.
State Update
During the reporting period, Louisiana enjoyed a stronger economy than many other states largely due to disaster relief funds. BP provided the state with financial aid to compensate for property damage, lost wages and commercial losses resulting from the Deepwater Horizon oil rig leak and the drilling moratorium that followed. Employment for the clean-up effort helped offset job
Annual Report | 43

losses caused by the leak. The state also continued to receive federal money for the post-Hurricane Katrina relief effort. By period-end, Louisiana’s unemployment rate reached 7.9%, which was lower than the 8.9% national rate.3
Louisiana balanced its fiscal year 2011 budget using one-time revenues, federal stimulus funds and spending reductions. Near period-end, lawmakers announced tax collections for fiscal year 2011 showed improvement from the same period a year earlier. The state faced a $1.6 billion budget gap in fiscal year 2012 resulting mainly from the expiration of federal stimulus funds and rising Medicaid costs.4 The governor’s budget proposal in March 2010 was expected to include expenditure reductions and asset sales. Louisiana’s net tax-supported debt was 3.6% of personal income and $1,271 per capita compared with the national medians of 2.5% and $936.5
Independent credit rating agency Moody’s Investors Service assigned the state’s general obligation bonds a rating of Aa2 with a stable outlook.6 The rating and outlook reflected Louisiana’s strong financial position and healthy liquidity in recent years, primarily due to federal disaster relief and stimulus funds, while taking into consideration dwindling federal assistance and uncertainty about the state’s post-disaster economic recovery.
Manager’s Discussion
We used various investment strategies during the 12 months under review as we sought to maximize tax-free income for shareholders. Please read the discussion on page 6 for details.
Thank you for your continued participation in Franklin Louisiana Tax-Free Income Fund. We intend to maintain our conservative, buy-and-hold investment strategy as we attempt to provide shareholders with high, current, tax-free income.
The foregoing information reflects our analysis, opinions and portfolio holdings as of February 28, 2011, the end of the reporting period. The way we implement our main investment strategies and the resulting portfolio holdings may change depending on factors such as market and economic conditions. These opinions may not be relied upon as investment advice or an offer for a particular security. The information is not a complete analysis of every aspect of any market, state, industry, security or the Fund. Statements of fact are from sources considered reliable, but the investment manager makes no representation or warranty as to their completeness or accuracy. Although historical performance is no guarantee of future results, these insights may help you understand our investment management philosophy.
3. Source: Bureau of Labor Statistics.
4. Source: Moody’s Investors Service, “New Issue: Moody’s Assigns Aa2 Rating to $300 Million State of Louisiana General Obligation Bonds Series 2011-A; Outlook is Stable,” 2/14/11.
5. Source: Moody’s Investors Service, “Special Comment: 2010 State Debt Medians Report,” May 2010.
6. This does not indicate Moody’s rating of the Fund.
44 | Annual Report
Performance Summary as of 2/28/11
Franklin Louisiana Tax-Free Income Fund
Your dividend income will vary depending on dividends or interest paid by securities in the Fund’s portfolio, adjusted for operating expenses of each class. Capital gain distributions are net profits realized from the sale of portfolio securities. The performance table and graphs do not reflect any taxes that a shareholder would pay on Fund dividends, capital gain distributions, if any, or any realized gains on the sale of Fund shares. Total return reflects reinvestment of the Fund’s dividends and capital gain distributions, if any, and any unrealized gains or losses.
| | | | | | | | |
| Price and Distribution Information | | | | | | |
| Class A (Symbol: FKLAX) | | | | Change | | 2/28/11 | | 2/28/10 |
| Net Asset Value (NAV) | | | -$ | 0.37 | $ | 10.91 | $ | 11.28 |
| Distributions (3/1/10–2/28/11) | | | | | | | | |
| Dividend Income | $ | 0.4782 | | | | | | |
| Class C (Symbol: FLAIX) | | | | Change | | 2/28/11 | | 2/28/10 |
| Net Asset Value (NAV) | | | -$ | 0.37 | $ | 11.04 | $ | 11.41 |
| Distributions (3/1/10–2/28/11) | | | | | | | | |
| Dividend Income | $ | 0.4137 | | | | | | |
Performance
Cumulative total return excludes sales charges. Average annual total returns include maximum sales charges. Class A: 4.25% maximum initial sales charge; Class C: 1% contingent deferred sales charge in first year only.
| | | | | | | | | | | |
| Class A | | | | 1-Year | | | 5-Year | | | 10-Year | |
| Cumulative Total Return1 | | | + | 0.92 | % | + | 17.37 | % | + | 52.00 | % |
| Average Annual Total Return2 | | | | -3.36 | % | + | 2.37 | % | + | 3.82 | % |
| Avg. Ann. Total Return (3/31/11)3 | | | | -4.08 | % | + | 2.37 | % | + | 3.69 | % |
| Distribution Rate4 | 4.31 | % | | | | | | | | | |
| Taxable Equivalent Distribution Rate5 | 7.05 | % | | | | | | | | | |
| 30-Day Standardized Yield6 | 4.31 | % | | | | | | | | | |
| Taxable Equivalent Yield5 | 7.05 | % | | | | | | | | | |
| Total Annual Operating Expenses7 | 0.69 | % | | | | | | | | | |
| Class C | | | | 1-Year | | | 5-Year | | | 10-Year | |
| Cumulative Total Return1 | | | + | 0.34 | % | + | 14.19 | % | + | 43.90 | % |
| Average Annual Total Return2 | | | | -0.63 | % | + | 2.69 | % | + | 3.71 | % |
| Avg. Ann. Total Return (3/31/11)3 | | | | -1.34 | % | + | 2.70 | % | + | 3.57 | % |
| Distribution Rate4 | 3.92 | % | | | | | | | | | |
| Taxable Equivalent Distribution Rate5 | 6.42 | % | | | | | | | | | |
| 30-Day Standardized Yield6 | 3.96 | % | | | | | | | | | |
| Taxable Equivalent Yield5 | 6.48 | % | | | | | | | | | |
| Total Annual Operating Expenses7 | 1.24 | % | | | | | | | | | |
Performance data represent past performance, which does not guarantee future results. Investment return and principal value will fluctuate, and you may have a gain or loss when you sell your shares. Current performance may differ from figures shown. For most recent month-end performance, go to franklintempleton.com or call (800) 342-5236.
Annual Report | 45
Performance Summary (continued)
Total Return Index Comparison for a Hypothetical $10,000 Investment
Total return represents the change in value of an investment over the periods shown. It includes any current, applicable, maximum sales charge, Fund expenses, account fees and reinvested distributions. The unmanaged index includes reinvestment of any income or distributions. It differs from the Fund in composition and does not pay management fees or expenses. One cannot invest directly in an index.

| | | | | |
| 3/01 | 2/03 | 2/05 | 2/07 | 2/09 | 2/11 |
| Franklin Louisiana Tax-Free Income Fund | BC Municipal Bond Index 8 | CPI8 |
46 | Annual Report
Performance Summary (continued)
Endnotes
Because municipal bonds are sensitive to interest rate movements, the Fund’s yield and share price will fluctuate with market conditions. Bond prices generally move in the opposite direction of interest rates. Thus, as prices of bonds in the Fund adjust to a rise in interest rates, the Fund’s share price may decline. Since the Fund concentrates its investments in a single state, it is subject to greater risk of adverse economic and regulatory changes in that state than a geographically diversified fund. The manager applies various techniques and analyses in making investment decisions for the Fund, but there can be no guarantee that these decisions will produce the desired results. The Fund’s prospectus also includes a description of the main investment risks.
| |
Class C: | Prior to 1/1/04, these shares were offered with an initial sales charge; thus actual total returns would have differed. These shares have higher annual fees and expenses than Class A shares. |
1. Cumulative total return represents the change in value of an investment over the periods indicated.
2. Average annual total return represents the average annual change in value of an investment over the periods indicated.
3. In accordance with SEC rules, we provide standardized average annual total return information through the latest calendar quarter.
4. Distribution rate is based on an annualization of the respective class’s current monthly dividend and the maximum offering price (NAV for Class C) per share on 2/28/11.
5. Taxable equivalent distribution rate and yield assume the published rates as of 12/28/10 for the maximum combined effective federal and Louisiana personal income tax rate of 38.90%, based on the federal income tax rate of 35.00%.
6. The 30-day standardized yield for the month ended 2/28/11 reflects an estimated yield to maturity (assuming all portfolio securities are held to maturity). It should be regarded as an estimate of the Fund’s rate of investment income, and it may not equal the Fund’s actual income distribution rate (which reflects the Fund’s past dividends paid to shareholders) or the income reported in the Fund’s financial statements.
7. Figures are as stated in the Fund’s prospectus current as of the date of this report. In periods of market volatility, assets may decline significantly, causing total annual Fund operating expenses to become higher than the figures shown.
8. Source: © 2011 Morningstar. The BC Municipal Bond Index is a market value-weighted index engineered for the long-term tax-exempt bond market. To be included in the index, bonds must be fixed rate, have at least one year to final maturity and be rated investment grade (Baa3/BBB-or higher) by at least two of the following agencies: Moody’s, Standard & Poor’s and Fitch. The Consumer Price Index (CPI), calculated by the U.S. Bureau of Labor Statistics, is a commonly used measure of the inflation rate.
Annual Report | 47
Your Fund’s Expenses
Franklin Louisiana Tax-Free Income Fund
As a Fund shareholder, you can incur two types of costs:
- Transaction costs, including sales charges (loads) on Fund purchases; and
- Ongoing Fund costs, including management fees, distribution and service (12b-1) fees, and other Fund expenses. All mutual funds have ongoing costs, sometimes referred to as operating expenses.
The following table shows ongoing costs of investing in the Fund and can help you understand these costs and compare them with those of other mutual funds. The table assumes a $1,000 investment held for the six months indicated.
Actual Fund Expenses
The first line (Actual) for each share class listed in the table provides actual account values and expenses. The “Ending Account Value” is derived from the Fund’s actual return, which includes the effect of Fund expenses.
You can estimate the expenses you paid during the period by following these steps. Of course, your account value and expenses will differ from those in this illustration:
| 1. | Divide your account value by $1,000. |
| | If an account had an $8,600 value, then $8,600 ÷ $1,000 = 8.6. |
| 2. | Multiply the result by the number under the heading “Expenses Paid During Period.” |
| | If Expenses Paid During Period were $7.50, then 8.6 x $7.50 = $64.50. |
In this illustration, the estimated expenses paid this period are $64.50.
Hypothetical Example for Comparison with Other Funds
Information in the second line (Hypothetical) for each class in the table can help you compare ongoing costs of investing in the Fund with those of other mutual funds. This information may not be used to estimate the actual ending account balance or expenses you paid during the period. The hypothetical “Ending Account Value” is based on the actual expense ratio for each class and an assumed 5% annual rate of return before expenses, which does not represent the Fund’s actual return. The figure under the heading “Expenses Paid During Period” shows the hypothetical expenses your account would have incurred under this scenario. You can compare this figure with the 5% hypothetical examples that appear in shareholder reports of other funds.
48 | Annual Report
Your Fund’s Expenses (continued)
Please note that expenses shown in the table are meant to highlight ongoing costs and do not reflect any transaction costs, such as sales charges. Therefore, the second line for each class is useful in comparing ongoing costs only, and will not help you compare total costs of owning different funds. In addition, if transaction costs were included, your total costs would have been higher. Please refer to the Fund prospectus for additional information on operating expenses.
| | | | | | |
| | | Beginning Account | | Ending Account | | Expenses Paid During |
| Class A | | Value 9/1/10 | | Value 2/28/11 | | Period* 9/1/10–2/28/11 |
| Actual | $ | 1,000 | $ | 957.30 | $ | 3.30 |
| Hypothetical (5% return before expenses) | $ | 1,000 | $ | 1,021.42 | $ | 3.41 |
| Class C | | | | | | |
| Actual | $ | 1,000 | $ | 954.20 | $ | 5.96 |
| Hypothetical (5% return before expenses) | $ | 1,000 | $ | 1,018.70 | $ | 6.16 |
*Expenses are calculated using the most recent six-month expense ratio, annualized for each class (A: 0.68% and C: 1.23%), multiplied by the average account value over the period, multiplied by 181/365 to reflect the one-half year period.
Annual Report | 49
Franklin Maryland Tax-Free Income Fund
Your Fund’s Goal and Main Investments: Franklin Maryland Tax-Free Income Fund seeks to provide as high a level of income exempt from federal and Maryland personal income taxes as is consistent with prudent investment management and preservation of capital by investing at least 80% of its total assets in securities that pay interest free from such taxes.1
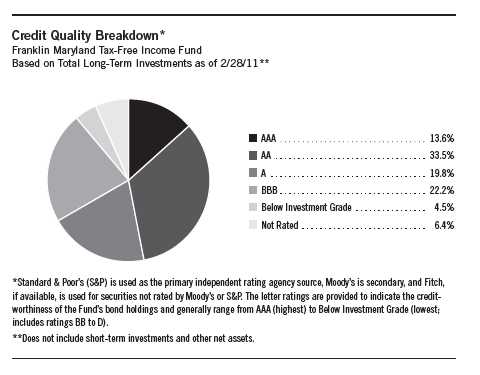
Performance data represent past performance, which does not guarantee future results. Investment return and principal value will fluctuate, and you may have a gain or loss when you sell your shares. Current performance may differ from figures shown. Please visit franklintempleton.com or call (800) 342-5236 for most recent month-end performance.
This annual report for Franklin Maryland Tax-Free Income Fund covers the fiscal year ended February 28, 2011.
Performance Overview
The Fund’s Class A share price, as measured by net asset value, decreased from $11.30 on February 28, 2010, to $10.91 on February 28, 2011. The
1. For investors subject to alternative minimum tax, a small portion of Fund dividends may be taxable. Distributions of capital gains are generally taxable. To avoid imposition of 28% backup withholding on all Fund distributions and redemption proceeds, U.S. investors must be properly certified on Form W-9 and non-U.S. investors on Form W-8BEN.
The dollar value, number of shares or principal amount, and names of all portfolio holdings are listed in the Fund’s Statement of Investments (SOI). The SOI begins on page 122.
50 | Annual Report
| | | |
| Dividend Distributions* | | | |
| Franklin Maryland Tax-Free Income Fund | | | |
| | | Dividend per Share |
| Month | Class A | Class C | Advisor Class |
| March 2010 | 4.00 cents | 3.45 cents | 4.08 cents |
| April 2010 | 4.00 cents | 3.45 cents | 4.08 cents |
| May 2010 | 4.00 cents | 3.45 cents | 4.08 cents |
| June 2010 | 4.00 cents | 3.48 cents | 4.09 cents |
| July 2010 | 4.00 cents | 3.48 cents | 4.09 cents |
| August 2010 | 4.00 cents | 3.48 cents | 4.09 cents |
| September 2010 | 3.85 cents | 3.31 cents | 3.95 cents |
| October 2010 | 3.80 cents | 3.26 cents | 3.90 cents |
| November 2010 | 3.70 cents | 3.16 cents | 3.80 cents |
| December 2010 | 3.70 cents | 3.14 cents | 3.79 cents |
| January 2011 | 3.70 cents | 3.14 cents | 3.79 cents |
| February 2011 | 3.70 cents | 3.14 cents | 3.79 cents |
*Assumes shares were purchased and held for the entire accrual period, which differs from the calendar month. Since dividends accrue daily, your actual distributions will vary depending on the date you purchased your shares and any account activity. All Fund distributions will vary depending upon current market conditions, and past distributions are not indicative of future trends.
Fund’s Class A shares paid dividends totaling 46.67 cents per share for the same period.2 The Performance Summary beginning on page 53 shows that at the end of this reporting period the Fund’s Class A shares’ distribution rate was 3.90% based on an annualization of the current 3.70 cent per share dividend and the maximum offering price of $11.39 on February 28, 2011. An investor in the 2011 maximum combined effective federal and Maryland state and local personal income tax bracket of 40.66% would need to earn a distribution rate of 6.57% from a taxable investment to match the Fund’s Class A tax-free distribution rate. For the Fund’s Class C and Advisor shares’ performance, please see the Performance Summary. Dividend distributions during the year under review were affected by securities purchased in the prior period and by falling municipal bond rates in 2009 through November 2010. In addition, for most of the Fund’s fiscal year, investor demand was strong for municipal bonds in an environment of limited tax-exempt supply. These factors resulted in reduced income for the portfolio and caused dividends to decline.
2. All Fund distributions will vary depending upon current market conditions, and past distributions are not indicative of future trends.
Annual Report | 51
| | |
| Portfolio Breakdown | | |
| Franklin Maryland Tax-Free Income Fund | |
| 2/28/11 | | |
| % of Total | |
| Long-Term Investments* | |
| Hospital & Health Care | 19.8 | % |
| General Obligation | 18.8 | % |
| Higher Education | 13.6 | % |
| Utilities | 12.8 | % |
| Transportation | 11.2 | % |
| Housing | 6.8 | % |
| Refunded | 6.3 | % |
| Tax-Supported | 5.1 | % |
| Other Revenue | 4.9 | % |
| Subject to Government Appropriations | 0.7 | % |
| |
| *Does not include short-term investments and other | |
| net assets. | | |
State Update
Maryland’s economy expanded at a healthy pace during the reporting period. The state’s diversified, broad-based economy helped shield local employment levels from the full effects of the recession. During the period, most employment sectors resumed job growth. The state’s unemployment rate, at 7.1% in February 2011, remained lower than the 8.9% national rate.3
Maryland’s adopted budget for fiscal year 2011 contained a $2 billion budget shortfall that lawmakers addressed through budget reductions and fund transfers.4 Near period-end, lawmakers announced a projected 4.6% increase in general fund revenues for fiscal year 2011 based on better-than-expected revenue collections.4 Despite this growth, the governor’s proposed budget for fiscal year 2012 projected a $1.4 billion shortfall caused by a long-term structural gap, which he would address with spending cuts, fund transfers and pension reform.4 Maryland’s net tax-supported debt was 3.4% of personal income and $1,608 per capita, compared with the national medians of 2.5% and $936.5
Independent credit rating agency Standard & Poor’s assigned Maryland’s general obligation bonds its highest rating of AAA with a stable outlook.6 This rating and outlook reflected the state’s diverse economy, strong wealth levels, and historically strong financial and debt management policies.
Manager’s Discussion
We used various investment strategies during the 12 months under review as we sought to maximize tax-free income for shareholders. Please read the discussion on page 6 for details.
Thank you for your continued participation in Franklin Maryland Tax-Free Income Fund. We intend to maintain our conservative, buy-and-hold investment strategy as we attempt to provide shareholders with high, current, tax-free income.
The foregoing information reflects our analysis, opinions and portfolio holdings as of February 28, 2011, the end of the reporting period. The way we implement our main investment strategies and the resulting portfolio holdings may change depending on factors such as market and economic conditions. These opinions may not be relied upon as investment advice or an offer for a particular security. The information is not a complete analysis of every aspect of any market, state, industry, security or the Fund. Statements of fact are from sources considered reliable, but the investment manager makes no representation or warranty as to their completeness or accuracy. Although historical performance is no guarantee of future results, these insights may help you understand our investment management philosophy.
| |
| 3. Source: Bureau of Labor Statistics. | |
| 4. Source: Moody’s Investors Service, “New Issue: Moody’s Assigns Aaa Rating to | $485 Million of Maryland G.O. Bonds,” |
| 2/18/11 | . |
| 5. Source: Moody’s Investors Service, “Special Comment | : 2010 State Debt Medians Report,” May 2010. |
| 6. This does not indicate Standard & Poor’s rating of the Fund. | |
52 | Annual Report
Performance Summary as of 2/28/11
Franklin Maryland Tax-Free Income Fund
Your dividend income will vary depending on dividends or interest paid by securities in the Fund’s portfolio, adjusted for operating expenses of each class. Capital gain distributions are net profits realized from the sale of portfolio securities. The performance table and graphs do not reflect any taxes that a shareholder would pay on Fund dividends, capital gain distributions, if any, or any realized gains on the sale of Fund shares. Total return reflects reinvestment of the Fund’s dividends and capital gain distributions, if any, and any unrealized gains or losses.
| | | | | | | | |
| Price and Distribution Information | | | | | | |
| Class A (Symbol: FMDTX) | | | | Change | | 2/28/11 | | 2/28/10 |
| Net Asset Value (NAV) | | | -$ | 0.39 | $ | 10.91 | $ | 11.30 |
| Distributions (3/1/10–2/28/11) | | | | | | | | |
| Dividend Income | $ | 0.4667 | | | | | | |
| Class C (Symbol: FMDIX) | | | | Change | | 2/28/11 | | 2/28/10 |
| Net Asset Value (NAV) | | | -$ | 0.38 | $ | 11.08 | $ | 11.46 |
| Distributions (3/1/10–2/28/11) | | | | | | | | |
| Dividend Income | $ | 0.4014 | | | | | | |
| Advisor Class (Symbol: n/a) | | | | Change | | 2/28/11 | | 2/28/10 |
| Net Asset Value (NAV) | | | -$ | 0.39 | $ | 10.91 | $ | 11.30 |
| Distributions (3/1/10–2/28/11) | | | | | | | | |
| Dividend Income | $ | 0.4776 | | | | | | |
Annual Report | 53
Performance Summary (continued)
Performance
Cumulative total return excludes sales charges. Average annual total returns include maximum sales charges. Class A: 4.25% maximum initial sales charge; Class C: 1% contingent deferred sales charge in first year only; Advisor Class: no sales charges.
| | | | | | | | | | | |
| Class A | | | | 1-Year | | | 5-Year | | | 10-Year | |
| Cumulative Total Return1 | | | + | 0.61 | % | + | 15.01 | % | + | 49.45 | % |
| Average Annual Total Return2 | | | | -3.65 | % | + | 1.95 | % | + | 3.65 | % |
| Avg. Ann. Total Return (3/31/11)3 | | | | -4.93 | % | + | 1.85 | % | + | 3.46 | % |
| Distribution Rate4 | 3.90 | % | | | | | | | | | |
| Taxable Equivalent Distribution Rate5 | 6.57 | % | | | | | | | | | |
| 30-Day Standardized Yield6 | 4.09 | % | | | | | | | | | |
| Taxable Equivalent Yield5 | 6.89 | % | | | | | | | | | |
| Total Annual Operating Expenses7 | 0.66 | % | | | | | | | | | |
| Class C | | | | 1-Year | | | 5-Year | | | 10-Year | |
| Cumulative Total Return1 | | | + | 0.12 | % | + | 11.96 | % | + | 41.61 | % |
| Average Annual Total Return2 | | | | -0.84 | % | + | 2.28 | % | + | 3.54 | % |
| Avg. Ann. Total Return (3/31/11)3 | | | | -2.22 | % | + | 2.19 | % | + | 3.35 | % |
| Distribution Rate4 | 3.49 | % | | | | | | | | | |
| Taxable Equivalent Distribution Rate5 | 5.88 | % | | | | | | | | | |
| 30-Day Standardized Yield6 | 3.73 | % | | | | | | | | | |
| Taxable Equivalent Yield5 | 6.29 | % | | | | | | | | | |
| Total Annual Operating Expenses7 | 1.21 | % | | | | | | | | | |
| Advisor Class8 | | | | 1-Year | | | 5-Year | | | 10-Year | |
| Cumulative Total Return1 | | | + | 0.71 | % | + | 15.17 | % | + | 49.66 | % |
| Average Annual Total Return2 | | | + | 0.71 | % | + | 2.87 | % | + | 4.11 | % |
| Avg. Ann. Total Return (3/31/11)3 | | | | -0.62 | % | + | 2.77 | % | + | 3.93 | % |
| Distribution Rate4 | 4.17 | % | | | | | | | | | |
| Taxable Equivalent Distribution Rate5 | 7.03 | % | | | | | | | | | |
| 30-Day Standardized Yield6 | 4.38 | % | | | | | | | | | |
| Taxable Equivalent Yield5 | 7.38 | % | | | | | | | | | |
| Total Annual Operating Expenses7 | 0.56 | % | | | | | | | | | |
Performance data represent past performance, which does not guarantee future results. Investment return and principal value will fluctuate, and you may have a gain or loss when you sell your shares. Current performance may differ from figures shown. For most recent month-end performance, go to franklintempleton.com or call (800) 342-5236.
54 | Annual Report
Performance Summary (continued)
Total Return Index Comparison for a Hypothetical $10,000 Investment
Total return represents the change in value of an investment over the periods shown. It includes any current, applicable, maximum sales charge, Fund expenses, account fees and reinvested distributions. The unmanaged index includes reinvestment of any income or distributions. It differs from the Fund in composition and does not pay management fees or expenses. One cannot invest directly in an index.
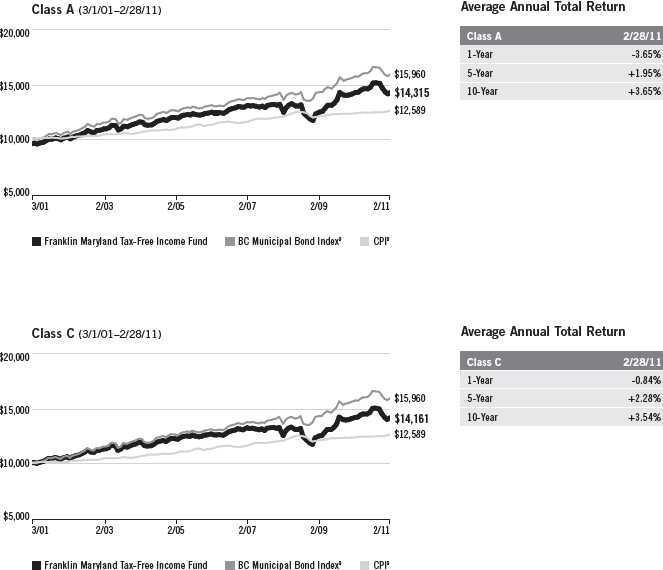
Annual Report | 55
Performance Summary (continued)
| | | |
| Average Annual Total Return | |
| |
| Advisor Class8 | | 2/28/11 | |
| 1-Year | + | 0.71 | % |
| 5-Year | + | 2.87 | % |
| 10-Year | + | 4.11 | % |
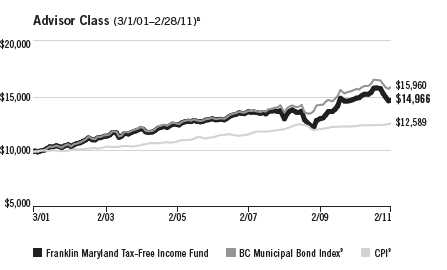
Endnotes
Because municipal bonds are sensitive to interest rate movements, the Fund’s yield and share price will fluctuate with market conditions. Bond prices generally move in the opposite direction of interest rates. Thus, as prices of bonds in the Fund adjust to a rise in interest rates, the Fund’s share price may decline. Since the Fund concentrates its investments in a single state, it is subject to greater risk of adverse economic and regulatory changes in that state than a geographically diversified fund. The manager applies various techniques and analyses in making investment decisions for the Fund, but there can be no guarantee that these decisions will produce the desired results. The Fund’s prospectus also includes a description of the main investment risks.
| |
| Class C: | Prior to 1/1/04, these shares were offered with an initial sales charge; thus actual total returns |
| | would have differed. These shares have higher annual fees and expenses than Class A shares. |
| |
| Advisor Class: | Shares are available to certain eligible investors as described in the prospectus. |
| |
| |
| 1. Cumulative total return represents the change in value of an investment over the periods indicated. |
| 2. Average annual total return represents the average annual change in value of an investment over the periods |
| indicated. | |
| 3. In accordance with SEC rules, we provide standardized average annual total return information through the latest |
| calendar quarter. |
| 4. Distribution rate is based on an annualization of the respective class’s current monthly dividend and the maxi- |
| mum offering price (NAV for Classes C and Advisor) per share on 2/28/11. |
| 5. Taxable equivalent distribution rate and yield assume the published rates as of 12/28/10 for the maximum com- |
| bined effective federal and Maryland state and local personal income tax rate of 40.66%, based on the federal |
| income tax rate of 35.00%. |
| 6. The 30-day standardized yield for the month ended 2/28/11 reflects an estimated yield to maturity (assuming all |
| portfolio securities are held to maturity). It should be regarded as an estimate of the Fund’s rate of investment |
| income, and it may not equal the Fund’s actual income distribution rate (which reflects the Fund’s past dividends |
| paid to shareholders) or the income reported in the Fund’s financial statements. |
| 7. Figures are as stated in the Fund’s prospectus current as of the date of this report. In periods of market volatility, |
| assets may decline significantly, causing total annual Fund operating expenses to become higher than the figures |
| shown. | |
| 8. Effective 7/1/09, the Fund began offering Advisor Class shares, which do not have sales charges or a Rule 12b-1 |
| plan. Performance quotations for this class reflect the following methods of calculation: (a) For periods prior to |
| 7/1/09, a restated figure is used based upon the Fund’s Class A performance, excluding the effect of Class A’s maxi- |
| mum initial sales charge, but reflecting the effect of the Class A Rule 12b-1 fees; and (b) for periods after 6/30/09, |
| actual Advisor Class performance is used reflecting all charges and fees applicable to that class. Since 7/1/09 |
| (commencement of sales), the cumulative and average annual total returns of Advisor Class shares were +9.60% |
| and +5.67%. | |
| 9. Source: © 2011 Morningstar. The BC Municipal Bond Index is a market value-weighted index engineered for the |
| long-term tax-exempt bond market. To be included in the index, bonds must be fixed rate, have at least one year |
| to final maturity and be rated investment grade (Baa3/BBB- or higher) by at least two of the following agencies: |
| Moody’s, Standard & Poor’s and Fitch. The Consumer Price Index (CPI), calculated by the U.S. Bureau of Labor |
| Statistics, is a commonly used measure of the inflation rate. |
56 | Annual Report
Your Fund’s Expenses
Franklin Maryland Tax-Free Income Fund
As a Fund shareholder, you can incur two types of costs:
- Transaction costs, including sales charges (loads) on Fund purchases; and
- Ongoing Fund costs, including management fees, distribution and service (12b-1) fees, and other Fund expenses. All mutual funds have ongoing costs, sometimes referred to as operating expenses.
The following table shows ongoing costs of investing in the Fund and can help you understand these costs and compare them with those of other mutual funds. The table assumes a $1,000 investment held for the six months indicated.
Actual Fund Expenses
The first line (Actual) for each share class listed in the table provides actual account values and expenses. The “Ending Account Value” is derived from the Fund’s actual return, which includes the effect of Fund expenses.
You can estimate the expenses you paid during the period by following these steps. Of course, your account value and expenses will differ from those in this illustration:
| 1. | Divide your account value by $1,000. |
| | If an account had an $8,600 value, then $8,600 ÷ $1,000 = 8.6. |
| 2. | Multiply the result by the number under the heading “Expenses Paid During Period.” |
| | If Expenses Paid During Period were $7.50, then 8.6 x $7.50 = $64.50. |
In this illustration, the estimated expenses paid this period are $64.50.
Hypothetical Example for Comparison with Other Funds
Information in the second line (Hypothetical) for each class in the table can help you compare ongoing costs of investing in the Fund with those of other mutual funds. This information may not be used to estimate the actual ending account balance or expenses you paid during the period. The hypothetical “Ending Account Value” is based on the actual expense ratio for each class and an assumed 5% annual rate of return before expenses, which does not represent the Fund’s actual return. The figure under the heading “Expenses Paid During Period” shows the hypothetical expenses your account would have incurred under this scenario. You can compare this figure with the 5% hypothetical examples that appear in shareholder reports of other funds.
Annual Report | 57
Your Fund’s Expenses (continued)
Please note that expenses shown in the table are meant to highlight ongoing costs and do not reflect any transaction costs, such as sales charges. Therefore, the second line for each class is useful in comparing ongoing costs only, and will not help you compare total costs of owning different funds. In addition, if transaction costs were included, your total costs would have been higher. Please refer to the Fund prospectus for additional information on operating expenses.
| | | | | | |
| | | Beginning Account | | Ending Account | | Expenses Paid During |
| Class A | | Value 9/1/10 | | Value 2/28/11 | | Period* 9/1/10–2/28/11 |
| Actual | $ | 1,000 | $ | 948.80 | $ | 3.14 |
| Hypothetical (5% return before expenses) | $ | 1,000 | $ | 1,021.57 | $ | 3.26 |
| Class C | | | | | | |
| Actual | $ | 1,000 | $ | 946.00 | $ | 5.79 |
| Hypothetical (5% return before expenses) | $ | 1,000 | $ | 1,018.84 | $ | 6.01 |
| Advisor Class | | | | | | |
| Actual | $ | 1,000 | $ | 949.20 | $ | 2.66 |
| Hypothetical (5% return before expenses) | $ | 1,000 | $ | 1,022.07 | $ | 2.76 |
*Expenses are calculated using the most recent six-month expense ratio, annualized for each class (A: 0.65%; C: 1.20%; and Advisor: 0.55%), multiplied by the average account value over the period, multiplied by 181/365 to reflect the one-half year period.
58 | Annual Report
Franklin Missouri Tax-Free Income Fund
Your Fund’s Goal and Main Investments: Franklin Missouri Tax-Free Income Fund seeks to provide as high a level of income exempt from federal and Missouri personal income taxes as is consistent with prudent investment management and preservation of capital by investing at least 80% of its total assets in securities that pay interest free from such taxes.1
Performance data represent past performance, which does not guarantee future results. Investment return and principal value will fluctuate, and you may have a gain or loss when you sell your shares. Current performance may differ from figures shown. Please visit franklintempleton.com or call (800) 342-5236 for most recent month-end performance.
| | |
| Credit Quality Breakdown* | | |
| Franklin Missouri Tax-Free Income Fund | | |
| 2/28/11 | | |
| | % of Total | |
| Ratings | Long-Term Investments** | |
| AAA | 14.4 | % |
| AA | 41.7 | % |
| A | 21.0 | % |
| BBB | 19.4 | % |
| Below Investment Grade | 0.8 | % |
| Not Rated | 2.7 | % |
*Standard & Poor’s (S&P) is used as the primary independent rating agency source, Moody’s is secondary, and Fitch, if available, is used for securities not rated by Moody’s or S&P. The letter ratings are provided to indicate the credit-worthiness of the Fund’s bond holdings and generally range from AAA (highest) to Below Investment Grade (lowest; includes ratings BB to D).
**Does not include short-term investments and other net assets.
This annual report for Franklin Missouri Tax-Free Income Fund covers the fiscal year ended February 28, 2011.
Performance Overview
The Fund’s Class A share price, as measured by net asset value, decreased from $11.98 on February 28, 2010, to $11.55 on February 28, 2011. The Fund’s Class A shares paid dividends totaling 50.57 cents per share for the same period.2 The Performance Summary beginning on page 62 shows that at the end of this reporting period the Fund’s Class A shares’ distribution rate
1. For investors subject to alternative minimum tax, a small portion of Fund dividends may be taxable. Distributions of capital gains are generally taxable. To avoid imposition of 28% backup withholding on all Fund distributions and redemption proceeds, U.S. investors must be properly certified on Form W-9 and non-U.S. investors on Form W-8BEN.
2. All Fund distributions will vary depending upon current market conditions, and past distributions are not indicative of future trends.
The dollar value, number of shares or principal amount, and names of all portfolio holdings are listed in the Fund’s Statement of Investments (SOI). The SOI begins on page 129.
Annual Report | 59
| | | |
| Dividend Distributions* | | | |
| Franklin Missouri Tax-Free Income Fund | | | |
| | | Dividend per Share |
| Month | Class A | Class C | Advisor Class |
| March 2010 | 4.23 cents | 3.64 cents | 4.31 cents |
| April 2010 | 4.23 cents | 3.64 cents | 4.31 cents |
| May 2010 | 4.23 cents | 3.64 cents | 4.31 cents |
| June 2010 | 4.23 cents | 3.69 cents | 4.34 cents |
| July 2010 | 4.23 cents | 3.69 cents | 4.34 cents |
| August 2010 | 4.23 cents | 3.69 cents | 4.34 cents |
| September 2010 | 4.23 cents | 3.67 cents | 4.33 cents |
| October 2010 | 4.17 cents | 3.61 cents | 4.27 cents |
| November 2010 | 4.12 cents | 3.56 cents | 4.22 cents |
| December 2010 | 4.12 cents | 3.54 cents | 4.22 cents |
| January 2011 | 4.12 cents | 3.54 cents | 4.22 cents |
| February 2011 | 4.12 cents | 3.54 cents | 4.22 cents |
*Assumes shares were purchased and held for the entire accrual period, which differs from the calendar month. Since dividends accrue daily, your actual distributions will vary depending on the date you purchased your shares and any account activity. All Fund distributions will vary depending upon current market conditions, and past distributions are not indicative of future trends.
was 4.25% based on an annualization of the current 4.27 cent per share dividend and the maximum offering price of $12.06 on February 28, 2011. An investor in the 2011 maximum combined effective federal and Missouri personal income tax bracket of 38.90% would need to earn a distribution rate of 6.96% from a taxable investment to match the Fund’s Class A tax-free distribution rate. For the Fund’s Class C and Advisor shares’ performance, please see the Performance Summary. Dividend distributions during the year under review were affected by securities purchased in the prior period and by falling municipal bond rates in 2009 through November 2010. In addition, for most of the Fund’s fiscal year, investor demand was strong for municipal bonds in an environment of limited tax-exempt supply. These factors resulted in reduced income for the portfolio and caused dividends to decline.
State Update
During the reporting period, Missouri’s economy was slowly starting to recover from the effects of the national recession. The state’s unemployment rate was
60 | Annual Report
close to the national rate for most of the period, and reached 9.4% by period-end, which was higher than the 8.9% national rate.3 Reflecting national trends, Missouri’s construction, information, and mining and logging sectors contracted during the period. In contrast, the education and health services, financial activities, and manufacturing sectors had gains.
Missouri’s lawmakers adopted the fiscal year 2011 budget on time. A decline in revenue collections forced the state to revise the budget downward from the previous fiscal year’s spending levels. Near period-end, the governor submitted a $23.1 billion budget proposal for fiscal year 2012 that contained workforce reductions and cuts to education spending.4 Missouri’s net tax-supported debt was 2.2% of personal income and $780 per capita, compared with the national medians of 2.5% and $936.5
Independent credit rating agency Standard & Poor’s (S&P) assigned Missouri’s general obligation debt a rating of AAA with a stable outlook.6 The rating and outlook reflected S&P’s assessment that the state will continue to maintain its strong and diverse economic base, high reserve levels and strong financial management with the power to make midyear budgetary cuts as needed.
Manager’s Discussion
We used various investment strategies during the 12 months under review as we sought to maximize tax-free income for shareholders. Please read the discussion on page 6 for details.
Thank you for your continued participation in Franklin Missouri Tax-Free Income Fund. We intend to maintain our conservative, buy-and-hold investment strategy as we attempt to provide shareholders with high, current, tax-free income.
The foregoing information reflects our analysis, opinions and portfolio holdings as of February 28, 2011, the end of the reporting period. The way we implement our main investment strategies and the resulting portfolio holdings may change depending on factors such as market and economic conditions. These opinions may not be relied upon as investment advice or an offer for a particular security. The information is not a complete analysis of every aspect of any market, state, industry, security or the Fund. Statements of fact are from sources considered reliable, but the investment manager makes no representation or warranty as to their completeness or accuracy. Although historical performance is no guarantee of future results, these insights may help you understand our investment management philosophy.
3. Source: Bureau of Labor Statistics.
4. Source: Columbia Missourian, “Update: Missouri Gov. Nixon Proposes Smaller State Budget,” 1/19/11. 5. Source: Moody’s Investors Service, “Special Comment: 2010 State Debt Medians Report,” May 2010. 6. This does not indicate S&P’s rating of the Fund.
| | |
| Portfolio Breakdown | | |
| Franklin Missouri Tax-Free Income Fund | |
| 2/28/11 | | |
| % of Total | |
| Long-Term Investments* | |
| Utilities | 21.0 | % |
| Hospital & Health Care | 16.1 | % |
| Tax-Supported | 12.4 | % |
| Higher Education | 10.7 | % |
| Transportation | 8.7 | % |
| Subject to Government Appropriations | 8.5 | % |
| Refunded | 8.2 | % |
| Other Revenue | 6.5 | % |
| General Obligation | 5.2 | % |
| Corporate-Backed | 1.7 | % |
| Housing | 1.0 | % |
| |
| *Does not include short-term investments and other | |
| net assets. | | |
Annual Report | 61
Performance Summary as of 2/28/11
Franklin Missouri Tax-Free Income Fund
Your dividend income will vary depending on dividends or interest paid by securities in the Fund’s portfolio, adjusted for operating expenses of each class. Capital gain distributions are net profits realized from the sale of portfolio securities. The performance table and graphs do not reflect any taxes that a shareholder would pay on Fund dividends, capital gain distributions, if any, or any realized gains on the sale of Fund shares. Total return reflects reinvestment of the Fund’s dividends and capital gain distributions, if any, and any unrealized gains or losses.
| | | | | | | | |
| Price and Distribution Information | | | | | | |
| Class A (Symbol: FRMOX) | | | | Change | | 2/28/11 | | 2/28/10 |
| Net Asset Value (NAV) | | | -$ | 0.43 | $ | 11.55 | $ | 11.98 |
| Distributions (3/1/10–2/28/11) | | | | | | | | |
| Dividend Income | $ | 0.5057 | | | | | | |
| Class C (Symbol: FMOIX) | | | | Change | | 2/28/11 | | 2/28/10 |
| Net Asset Value (NAV) | | | -$ | 0.43 | $ | 11.64 | $ | 12.07 |
| Distributions (3/1/10–2/28/11) | | | | | | | | |
| Dividend Income | $ | 0.4374 | | | | | | |
| Advisor Class (Symbol: FRMZX) | | | | Change | | 2/28/11 | | 2/28/10 |
| Net Asset Value (NAV) | | | -$ | 0.43 | $ | 11.55 | $ | 11.98 |
| Distributions (3/1/10–2/28/11) | | | | | | | | |
| Dividend Income | $ | 0.5175 | | | | | | |
62 | Annual Report
Performance Summary (continued)
Performance
Cumulative total return excludes sales charges. Average annual total returns include maximum sales charges. Class A: 4.25% maximum initial sales charge; Class C: 1% contingent deferred sales charge in first year only; Advisor Class: no sales charges.
| | | | | | | | | | | |
| Class A | | | | 1-Year | | | 5-Year | | | 10-Year | |
| Cumulative Total Return1 | | | + | 0.58 | % | + | 16.36 | % | + | 53.07 | % |
| Average Annual Total Return2 | | | | -3.68 | % | + | 2.18 | % | + | 3.90 | % |
| Avg. Ann. Total Return (3/31/11)3 | | | | -4.21 | % | + | 2.24 | % | + | 3.77 | % |
| Distribution Rate4 | 4.25 | % | | | | | | | | | |
| Taxable Equivalent Distribution Rate5 | 6.96 | % | | | | | | | | | |
| 30-Day Standardized Yield6 | 3.96 | % | | | | | | | | | |
| Taxable Equivalent Yield5 | 6.48 | % | | | | | | | | | |
| Total Annual Operating Expenses7 | 0.65 | % | | | | | | | | | |
| Class C | | | | 1-Year | | | 5-Year | | | 10-Year | |
| Cumulative Total Return1 | | | + | 0.01 | % | + | 13.18 | % | + | 45.01 | % |
| Average Annual Total Return2 | | | | -0.95 | % | + | 2.51 | % | + | 3.79 | % |
| Avg. Ann. Total Return (3/31/11)3 | | | | -1.47 | % | + | 2.58 | % | + | 3.65 | % |
| Distribution Rate4 | 3.89 | % | | | | | | | | | |
| Taxable Equivalent Distribution Rate5 | 6.37 | % | | | | | | | | | |
| 30-Day Standardized Yield6 | 3.60 | % | | | | | | | | | |
| Taxable Equivalent Yield5 | 5.89 | % | | | | | | | | | |
| Total Annual Operating Expenses7 | 1.20 | % | | | | | | | | | |
| Advisor Class8 | | | | 1-Year | | | 5-Year | | | 10-Year | |
| Cumulative Total Return1 | | | + | 0.68 | % | + | 16.53 | % | + | 53.29 | % |
| Average Annual Total Return2 | | | + | 0.68 | % | + | 3.11 | % | + | 4.36 | % |
| Avg. Ann. Total Return (3/31/11)3 | | | + | 0.23 | % | + | 3.19 | % | + | 4.24 | % |
| Distribution Rate4 | 4.53 | % | | | | | | | | | |
| Taxable Equivalent Distribution Rate5 | 7.41 | % | | | | | | | | | |
| 30-Day Standardized Yield6 | 4.24 | % | | | | | | | | | |
| Taxable Equivalent Yield5 | 6.94 | % | | | | | | | | | |
| Total Annual Operating Expenses7 | 0.55 | % | | | | | | | | | |
Performance data represent past performance, which does not guarantee future results. Investment return and principal value will fluctuate, and you may have a gain or loss when you sell your shares. Current performance may differ from figures shown. For most recent month-end performance, go to franklintempleton.com or call (800) 342-5236.
Annual Report | 63
Performance Summary (continued)
Total Return Index Comparison for a Hypothetical $10,000 Investment
Total return represents the change in value of an investment over the periods shown. It includes any current, applicable, maximum sales charge, Fund expenses, account fees and reinvested distributions. The unmanaged index includes reinvestment of any income or distributions. It differs from the Fund in composition and does not pay management fees or expenses. One cannot invest directly in an index.
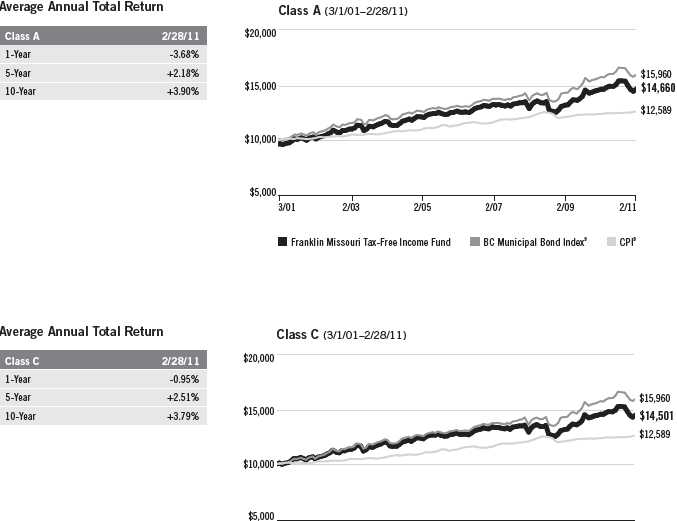
| | | | | |
| 3/01 | 2/03 | 2/05 | 2/07 | 2/09 | 2/11 |
| Franklin Missouri Tax-Free Income Fund | BC Municipal Bond Index 9 | CPI9 |
64 | Annual Report
Performance Summary (continued)

| | | |
| Average Annual Total Return | |
| |
| Advisor Class8 | | 2/28/11 | |
| 1-Year | + | 0.68 | % |
| 5-Year | + | 3.11 | % |
| 10-Year | + | 4.36 | % |
Because municipal bonds are sensitive to interest rate movements, the Fund’s yield and share price will fluctuate with market conditions. Bond prices generally move in the opposite direction of interest rates. Thus, as prices of bonds in the Fund adjust to a rise in interest rates, the Fund’s share price may decline. Since the Fund concentrates its investments in a single state, it is subject to greater risk of adverse economic and regulatory changes in that state than a geographically diversified fund. The manager applies various techniques and analyses in making investment decisions for the Fund, but there can be no guarantee that these decisions will produce the desired results. The Fund’s prospectus also includes a description of the main investment risks.
| |
| Class C: | Prior to 1/1/04, these shares were offered with an initial sales charge; thus actual total returns |
| | would have differed. These shares have higher annual fees and expenses than Class A shares. |
| |
| Advisor Class: | Shares are available to certain eligible investors as described in the prospectus. |
| |
| |
| 1. Cumulative total return represents the change in value of an investment over the periods indicated. |
| 2. Average annual total return represents the average annual change in value of an investment over the periods |
| indicated. | |
| 3. In accordance with SEC rules, we provide standardized average annual total return information through the latest |
| calendar quarter. |
| 4. Distribution rate is based on an annualization of the respective class’s current monthly dividend and the maxi- |
| mum offering price (NAV for Classes C and Advisor) per share on 2/28/11. |
| 5. Taxable equivalent distribution rate and yield assume the published rates as of 12/28/10 for the maximum com- |
| bined effective federal and Missouri personal income tax rate of 38.90%, based on the federal income tax rate of |
| 35.00%. | |
| 6. The 30-day standardized yield for the month ended 2/28/11 reflects an estimated yield to maturity (assuming all |
| portfolio securities are held to maturity). It should be regarded as an estimate of the Fund’s rate of investment |
| income, and it may not equal the Fund’s actual income distribution rate (which reflects the Fund’s past dividends |
| paid to shareholders) or the income reported in the Fund’s financial statements. |
| 7. Figures are as stated in the Fund’s prospectus current as of the date of this report. In periods of market volatility, |
| assets may decline significantly, causing total annual Fund operating expenses to become higher than the figures |
| shown. | |
| 8. Effective 7/1/09, the Fund began offering Advisor Class shares, which do not have sales charges or a Rule 12b-1 |
| plan. Performance quotations for this class reflect the following methods of calculation: (a) For periods prior to |
| 7/1/09, a restated figure is used based upon the Fund’s Class A performance, excluding the effect of Class A’s maxi- |
| mum initial sales charge, but reflecting the effect of the Class A Rule 12b-1 fees; and (b) for periods after 6/30/09, |
| actual Advisor Class performance is used reflecting all charges and fees applicable to that class. Since 7/1/09 |
| (commencement of sales), the cumulative and average annual total returns of Advisor Class shares were +8.11% |
| and +4.80%. | |
| 9. Source: © 2011 Morningstar. The BC Municipal Bond Index is a market value-weighted index engineered for the |
| long-term tax-exempt bond market. To be included in the index, bonds must be fixed rate, have at least one year |
| to final maturity and be rated investment grade (Baa3/BBB- or higher) by at least two of the following agencies: |
| Moody’s, Standard & Poor’s and Fitch. The Consumer Price Index (CPI), calculated by the U.S. Bureau of Labor |
| Statistics, is a commonly used measure of the inflation rate. |
Annual Report | 65
Your Fund’s Expenses
Franklin Missouri Tax-Free Income Fund
As a Fund shareholder, you can incur two types of costs:
- Transaction costs, including sales charges (loads) on Fund purchases; and
- Ongoing Fund costs, including management fees, distribution and service (12b-1) fees, and other Fund expenses. All mutual funds have ongoing costs, sometimes referred to as operating expenses.
The following table shows ongoing costs of investing in the Fund and can help you understand these costs and compare them with those of other mutual funds. The table assumes a $1,000 investment held for the six months indicated.
Actual Fund Expenses
The first line (Actual) for each share class listed in the table provides actual account values and expenses. The “Ending Account Value” is derived from the Fund’s actual return, which includes the effect of Fund expenses.
You can estimate the expenses you paid during the period by following these steps. Of course, your account value and expenses will differ from those in this illustration:
| 1. | Divide your account value by $1,000. |
| | If an account had an $8,600 value, then $8,600 ÷ $1,000 = 8.6. |
| 2. | Multiply the result by the number under the heading “Expenses Paid During Period.” |
| | If Expenses Paid During Period were $7.50, then 8.6 x $7.50 = $64.50. |
In this illustration, the estimated expenses paid this period are $64.50.
Hypothetical Example for Comparison with Other Funds
Information in the second line (Hypothetical) for each class in the table can help you compare ongoing costs of investing in the Fund with those of other mutual funds. This information may not be used to estimate the actual ending account balance or expenses you paid during the period. The hypothetical “Ending Account Value” is based on the actual expense ratio for each class and an assumed 5% annual rate of return before expenses, which does not represent the Fund’s actual return. The figure under the heading “Expenses Paid During Period” shows the hypothetical expenses your account would have incurred under this scenario. You can compare this figure with the 5% hypothetical examples that appear in shareholder reports of other funds.
66 | Annual Report
Your Fund’s Expenses (continued)
Please note that expenses shown in the table are meant to highlight ongoing costs and do not reflect any transaction costs, such as sales charges. Therefore, the second line for each class is useful in comparing ongoing costs only, and will not help you compare total costs of owning different funds. In addition, if transaction costs were included, your total costs would have been higher. Please refer to the Fund prospectus for additional information on operating expenses.
| | | | | | |
| | | Beginning Account | | Ending Account | | Expenses Paid During |
| Class A | | Value 9/1/10 | | Value 2/28/11 | | Period* 9/1/10–2/28/11 |
| Actual | $ | 1,000 | $ | 956.60 | $ | 3.10 |
| Hypothetical (5% return before expenses) | $ | 1,000 | $ | 1,021.62 | $ | 3.21 |
| Class C | | | | | | |
| Actual | $ | 1,000 | $ | 954.20 | $ | 5.77 |
| Hypothetical (5% return before expenses) | $ | 1,000 | $ | 1,018.89 | $ | 5.96 |
| Advisor Class | | | | | | |
| Actual | $ | 1,000 | $ | 956.30 | $ | 2.62 |
| Hypothetical (5% return before expenses) | $ | 1,000 | $ | 1,022.12 | $ | 2.71 |
*Expenses are calculated using the most recent six-month expense ratio, annualized for each class (A: 0.64%; C: 1.19%; and Advisor: 0.54%), multiplied by the average account value over the period, multiplied by 181/365 to reflect the one-half year period.
Annual Report | 67
Franklin North Carolina Tax-Free Income Fund
Your Fund’s Goal and Main Investments: Franklin North Carolina Tax-Free Income Fund seeks to provide as high a level of income exempt from federal and North Carolina personal income taxes as is consistent with prudent investment management and preservation of capital by investing at least 80% of its total assets in securities that pay interest free from such taxes.1
Performance data represent past performance, which does not guarantee future results. Investment return and principal value will fluctuate, and you may have a gain or loss when you sell your shares. Current performance may differ from figures shown. Please visit franklintempleton.com or call (800) 342-5236 for most recent month-end performance.
| | |
| Credit Quality Breakdown* | | |
| Franklin North Carolina Tax-Free Income Fund | | |
| 2/28/11 | | |
| | % of Total | |
| Ratings | Long-Term Investments** | |
| AAA | 17.4 | % |
| AA | 44.9 | % |
| A | 23.9 | % |
| BBB | 12.8 | % |
| Below Investment Grade | 0.1 | % |
| Not Rated | 0.9 | % |
*Standard & Poor’s (S&P) is used as the primary independent rating agency source, Moody’s is secondary, and Fitch, if available, is used for securities not rated by Moody’s or S&P. The letter ratings are provided to indicate the credit-worthiness of the Fund’s bond holdings and generally range from AAA (highest) to Below Investment Grade (lowest; includes ratings BB to D).
**Does not include short-term investments and other net assets.
This annual report for Franklin North Carolina Tax-Free Income Fund covers the fiscal year ended February 28, 2011.
Performance Overview
The Fund’s Class A share price, as measured by net asset value, decreased from $12.15 on February 28, 2010, to $11.73 on February 28, 2011. The Fund’s Class A shares paid dividends totaling 50.27 cents per share for the same period.2 The Performance Summary beginning on page 71 shows that at the end of this reporting period the Fund’s Class A shares’ distribution rate
1. For investors subject to alternative minimum tax, a small portion of Fund dividends may be taxable. Distributions of capital gains are generally taxable. To avoid imposition of 28% backup withholding on all Fund distributions and redemption proceeds, U.S. investors must be properly certified on Form W-9 and non-U.S. investors on Form W-8BEN.
2. All Fund distributions will vary depending upon current market conditions, and past distributions are not indicative of future trends.
The dollar value, number of shares or principal amount, and names of all portfolio holdings are listed in the Fund’s Statement of Investments (SOI). The SOI begins on page 138.
68 | Annual Report
| | | |
| Dividend Distributions* | | | |
| Franklin North Carolina Tax-Free Income Fund | | | |
| | | Dividend per Share |
| Month | Class A | Class C | Advisor Class |
| March 2010 | 4.22 cents | 3.63 cents | 4.32 cents |
| April 2010 | 4.22 cents | 3.63 cents | 4.32 cents |
| May 2010 | 4.22 cents | 3.63 cents | 4.32 cents |
| June 2010 | 4.22 cents | 3.67 cents | 4.32 cents |
| July 2010 | 4.22 cents | 3.67 cents | 4.32 cents |
| August 2010 | 4.22 cents | 3.67 cents | 4.32 cents |
| September 2010 | 4.22 cents | 3.64 cents | 4.32 cents |
| October 2010 | 4.13 cents | 3.55 cents | 4.23 cents |
| November 2010 | 4.08 cents | 3.50 cents | 4.18 cents |
| December 2010 | 4.08 cents | 3.49 cents | 4.18 cents |
| January 2011 | 4.08 cents | 3.49 cents | 4.18 cents |
| February 2011 | 4.08 cents | 3.49 cents | 4.18 cents |
*Assumes shares were purchased and held for the entire accrual period, which differs from the calendar month. Since dividends accrue daily, your actual distributions will vary depending on the date you purchased your shares and any account activity. All Fund distributions will vary depending upon current market conditions, and past distributions are not indicative of future trends.
was 4.03% based on an annualization of the current 4.11 cent per share dividend and the maximum offering price of $12.25 on February 28, 2011. An investor in the 2011 maximum combined effective federal and North Carolina personal income tax bracket of 40.04% would need to earn a distribution rate of 6.72% from a taxable investment to match the Fund’s Class A tax-free distribution rate. For the Fund’s Class C and Advisor shares’ performance, please see the Performance Summary. Dividend distributions during the year under review were affected by securities purchased in the prior period and by falling municipal bond rates in 2009 through November 2010. In addition, for most of the Fund’s fiscal year, investor demand was strong for municipal bonds in an environment of limited tax-exempt supply. These factors resulted in reduced income for the portfolio and caused dividends to decline.
State Update
North Carolina’s diverse economy showed modest signs of improvement as many sectors added jobs during the reporting period and unemployment trended down slightly. Manufacturing jobs, which make up nearly 11% of the state’s employment, showed positive growth by the end of the period. The professional and business services, leisure and hospitality, and financial activities
Annual Report | 69
| | |
| Portfolio Breakdown | | |
| Franklin North Carolina | | |
| Tax-Free Income Fund | | |
| 2/28/11 | | |
| % of Total | |
| Long-Term Investments* | |
| Utilities | 21.1 | % |
| Hospital & Health Care | 19.4 | % |
| Subject to Government Appropriations | 12.4 | % |
| General Obligation | 11.1 | % |
| Higher Education | 10.8 | % |
| Transportation | 9.0 | % |
| Tax-Supported | 6.8 | % |
| Refunded | 6.6 | % |
| Housing | 1.1 | % |
| Other Revenue | 0.9 | % |
| Corporate-Backed | 0.8 | % |
| |
| *Does not include short-term investments and other | |
| net assets. | | |
sectors boosted employment over the 12 months, while the construction and government sectors shed jobs. The state’s unemployment rate at period-end was 9.7%, compared with the 8.9% national rate.3
State revenues continued to decline over the period as economic weakness led to lower sales and income taxes. In June, the North Carolina General Assembly adjusted the 2010-2011 biennum budget down $703 million.4 To rebalance the budget, the state made $906 million in budget cuts mainly in health and human services, education and public safety.4 Federal stimulus funds were expected to contribute to balancing the budget as well. North Carolina’s budget cuts in fiscal year 2010 positioned the state to end the year with a 4% surplus.4 The state’s net tax-supported debt was 2.3% of personal income and $765 per capita, compared with the national medians of 2.5% and $936.5
Independent credit rating agency Moody’s Investors Service assigned North Carolina’s general obligation debt a rating of Aaa with a stable outlook.6 The rating and outlook reflected Moody’s assessment of the state’s prudent fiscal management and proactive responses to budget shortfalls.
Manager’s Discussion
We used various investment strategies during the 12 months under review as we sought to maximize tax-free income for shareholders. Please read the discussion on page 6 for details.
Thank you for your continued participation in Franklin North Carolina Tax-Free Income Fund. We intend to maintain our conservative, buy-and-hold investment strategy as we attempt to provide shareholders with high, current, tax-free income.
The foregoing information reflects our analysis, opinions and portfolio holdings as of February 28, 2011, the end of the reporting period. The way we implement our main investment strategies and the resulting portfolio holdings may change depending on factors such as market and economic conditions. These opinions may not be relied upon as investment advice or an offer for a particular security. The information is not a complete analysis of every aspect of any market, state, industry, security or the Fund. Statements of fact are from sources considered reliable, but the investment manager makes no representation or warranty as to their completeness or accuracy. Although historical performance is no guarantee of future results, these insights may help you understand our investment management philosophy.
3. Source: Bureau of Labor Statistics.
4. Source: Moody’s Investors Service, “New Issue: Moody’s Assigns Aaa Rating to North Carolina’s $333 Million General Obligation Bonds Series 2010,” 9/20/10.
5. Source: Moody’s Investors Service, “Special Comment: 2010 State Debt Medians Report,” May 2010.
6. This does not indicate Moody’s rating of the Fund.
70 | Annual Report
Performance Summary as of 2/28/11
Franklin North Carolina Tax-Free Income Fund
Your dividend income will vary depending on dividends or interest paid by securities in the Fund’s portfolio, adjusted for operating expenses of each class. Capital gain distributions are net profits realized from the sale of portfolio securities. The performance table and graphs do not reflect any taxes that a shareholder would pay on Fund dividends, capital gain distributions, if any, or any realized gains on the sale of Fund shares. Total return reflects reinvestment of the Fund’s dividends and capital gain distributions, if any, and any unrealized gains or losses.
| | | | | | | | |
| Price and Distribution Information | | | | | | |
| Class A (Symbol: FXNCX) | | | | Change | | 2/28/11 | | 2/28/10 |
| Net Asset Value (NAV) | | | -$ | 0.42 | $ | 11.73 | $ | 12.15 |
| Distributions (3/1/10–2/28/11) | | | | | | | | |
| Dividend Income | $ | 0.5027 | | | | | | |
| Class C (Symbol: FNCIX) | | | | Change | | 2/28/11 | | 2/28/10 |
| Net Asset Value (NAV) | | | -$ | 0.42 | $ | 11.88 | $ | 12.30 |
| Distributions (3/1/10–2/28/11) | | | | | | | | |
| Dividend Income | $ | 0.4331 | | | | | | |
| Advisor Class (Symbol: FNCZX) | | | | Change | | 2/28/11 | | 2/28/10 |
| Net Asset Value (NAV) | | | -$ | 0.42 | $ | 11.73 | $ | 12.15 |
| Distributions (3/1/10–2/28/11) | | | | | | | | |
| Dividend Income | $ | 0.5147 | | | | | | |
Annual Report | 71
Performance Summary (continued)
Performance
Cumulative total return excludes sales charges. Average annual total returns include maximum sales charges. Class A: 4.25% maximum initial sales charge; Class C: 1% contingent deferred sales charge in first year only; Advisor Class: no sales charges.
| | | | | | | | | | | |
| Class A | | | | 1-Year | | | 5-Year | | | 10-Year | |
| Cumulative Total Return1 | | | + | 0.63 | % | + | 17.57 | % | + | 54.37 | % |
| Average Annual Total Return2 | | | | -3.65 | % | + | 2.39 | % | + | 3.99 | % |
| Avg. Ann. Total Return (3/31/11)3 | | | | -4.41 | % | + | 2.42 | % | + | 3.86 | % |
| Distribution Rate4 | 4.03 | % | | | | | | | | | |
| Taxable Equivalent Distribution Rate5 | 6.72 | % | | | | | | | | | |
| 30-Day Standardized Yield6 | 3.96 | % | | | | | | | | | |
| Taxable Equivalent Yield5 | 6.60 | % | | | | | | | | | |
| Total Annual Operating Expenses7 | 0.64 | % | | | | | | | | | |
| Class C | | | | 1-Year | | | 5-Year | | | 10-Year | |
| Cumulative Total Return1 | | | + | 0.06 | % | + | 14.35 | % | + | 46.16 | % |
| Average Annual Total Return2 | | | | -0.91 | % | + | 2.72 | % | + | 3.87 | % |
| Avg. Ann. Total Return (3/31/11)3 | | | | -1.59 | % | + | 2.76 | % | + | 3.74 | % |
| Distribution Rate4 | 3.64 | % | | | | | | | | | |
| Taxable Equivalent Distribution Rate5 | 6.07 | % | | | | | | | | | |
| 30-Day Standardized Yield6 | 3.60 | % | | | | | | | | | |
| Taxable Equivalent Yield5 | 6.00 | % | | | | | | | | | |
| Total Annual Operating Expenses7 | 1.19 | % | | | | | | | | | |
| Advisor Class8 | | | | 1-Year | | | 5-Year | | | 10-Year | |
| Cumulative Total Return1 | | | + | 0.73 | % | + | 17.74 | % | + | 54.60 | % |
| Average Annual Total Return2 | | | + | 0.73 | % | + | 3.32 | % | + | 4.45 | % |
| Avg. Ann. Total Return (3/31/11)3 | | | + | 0.02 | % | + | 3.35 | % | + | 4.32 | % |
| Distribution Rate4 | 4.30 | % | | | | | | | | | |
| Taxable Equivalent Distribution Rate5 | 7.17 | % | | | | | | | | | |
| 30-Day Standardized Yield6 | 4.23 | % | | | | | | | | | |
| Taxable Equivalent Yield5 | 7.05 | % | | | | | | | | | |
| Total Annual Operating Expenses7 | 0.54 | % | | | | | | | | | |
Performance data represent past performance, which does not guarantee future results. Investment return and principal value will fluctuate, and you may have a gain or loss when you sell your shares. Current performance may differ from figures shown. For most recent month-end performance, go to franklintempleton.com or call (800) 342-5236.
72 | Annual Report
Performance Summary (continued)
Total Return Index Comparison for a Hypothetical $10,000 Investment
Total return represents the change in value of an investment over the periods shown. It includes any current, applicable, maximum sales charge, Fund expenses, account fees and reinvested distributions. The unmanaged index includes reinvestment of any income or distributions. It differs from the Fund in composition and does not pay management fees or expenses. One cannot invest directly in an index.

Annual Report | 73
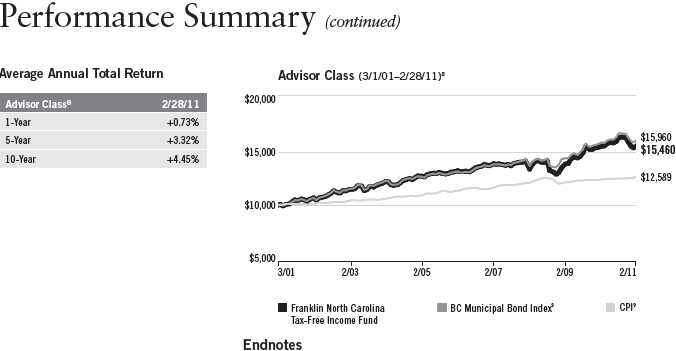
Because municipal bonds are sensitive to interest rate movements, the Fund’s yield and share price will fluctuate with market conditions. Bond prices generally move in the opposite direction of interest rates. Thus, as prices of bonds in the Fund adjust to a rise in interest rates, the Fund’s share price may decline. Since the Fund concentrates its investments in a single state, it is subject to greater risk of adverse economic and regulatory changes in that state than a geographically diversified fund. The manager applies various techniques and analyses in making investment decisions for the Fund, but there can be no guarantee that these decisions will produce the desired results. The Fund’s prospectus also includes a description of the main investment risks.
| |
| Class C: | Prior to 1/1/04, these shares were offered with an initial sales charge; thus actual total returns would |
| have differed. These shares have higher annual fees and expenses than Class A shares. |
| |
| Advisor Class: | Shares are available to certain eligible investors as described in the prospectus. |
1. Cumulative total return represents the change in value of an investment over the periods indicated.
2. Average annual total return represents the average annual change in value of an investment over the periods indicated.
3. In accordance with SEC rules, we provide standardized average annual total return information through the latest calendar quarter.
4. Distribution rate is based on an annualization of the respective class’s current monthly dividend and the maximum offering price (NAV for Classes C and Advisor) per share on 2/28/11.
5. Taxable equivalent distribution rate and yield assume the published rates as of 12/28/10 for the maximum combined effective federal and North Carolina personal income tax rate of 40.04%, based on the federal income tax rate of 35.00%.
6. The 30-day standardized yield for the month ended 2/28/11 reflects an estimated yield to maturity (assuming all portfolio securities are held to maturity). It should be regarded as an estimate of the Fund’s rate of investment income, and it may not equal the Fund’s actual income distribution rate (which reflects the Fund’s past dividends paid to shareholders) or the income reported in the Fund’s financial statements.
7. Figures are as stated in the Fund’s prospectus current as of the date of this report. In periods of market volatility, assets may decline significantly, causing total annual Fund operating expenses to become higher than the figures shown.
8. Effective 7/1/09, the Fund began offering Advisor Class shares, which do not have sales charges or a Rule 12b-1 plan. Performance quotations for this class reflect the following methods of calculation: (a) For periods prior to 7/1/09, a restated figure is used based upon the Fund’s Class A performance, excluding the effect of Class A’s maximum initial sales charge, but reflecting the effect of the Class A Rule 12b-1 fees; and (b) for periods after 6/30/09, actual Advisor Class performance is used reflecting all charges and fees applicable to that class. Since 7/1/09 (commencement of sales), the cumulative and average annual total returns of Advisor Class shares were +8.11% and +4.80%.
9. Source: © 2011 Morningstar. The BC Municipal Bond Index is a market value-weighted index engineered for the long-term tax-exempt bond market. To be included in the index, bonds must be fixed rate, have at least one year to final maturity and be rated investment grade (Baa3/BBB- or higher) by at least two of the following agencies: Moody’s, Standard & Poor’s and Fitch. The Consumer Price Index (CPI), calculated by the U.S. Bureau of Labor Statistics, is a commonly used measure of the inflation rate.
74 | Annual Report
Your Fund’s Expenses
Franklin North Carolina Tax-Free Income Fund
As a Fund shareholder, you can incur two types of costs:
- Transaction costs, including sales charges (loads) on Fund purchases; and
- Ongoing Fund costs, including management fees, distribution and service (12b-1) fees, and other Fund expenses. All mutual funds have ongoing costs, sometimes referred to as operating expenses.
The following table shows ongoing costs of investing in the Fund and can help you understand these costs and compare them with those of other mutual funds. The table assumes a $1,000 investment held for the six months indicated.
Actual Fund Expenses
The first line (Actual) for each share class listed in the table provides actual account values and expenses. The “Ending Account Value” is derived from the Fund’s actual return, which includes the effect of Fund expenses.
You can estimate the expenses you paid during the period by following these steps. Of course, your account value and expenses will differ from those in this illustration:
| 1. | Divide your account value by $1,000. |
| | If an account had an $8,600 value, then $8,600 ÷ $1,000 = 8.6. |
| 2. | Multiply the result by the number under the heading “Expenses Paid During Period.” |
| | If Expenses Paid During Period were $7.50, then 8.6 x $7.50 = $64.50. |
In this illustration, the estimated expenses paid this period are $64.50.
Hypothetical Example for Comparison with Other Funds
Information in the second line (Hypothetical) for each class in the table can help you compare ongoing costs of investing in the Fund with those of other mutual funds. This information may not be used to estimate the actual ending account balance or expenses you paid during the period. The hypothetical “Ending Account Value” is based on the actual expense ratio for each class and an assumed 5% annual rate of return before expenses, which does not represent the Fund’s actual return. The figure under the heading “Expenses Paid During Period” shows the hypothetical expenses your account would have incurred under this scenario. You can compare this figure with the 5% hypothetical examples that appear in shareholder reports of other funds.
Annual Report | 75
Your Fund’s Expenses (continued)
Please note that expenses shown in the table are meant to highlight ongoing costs and do not reflect any transaction costs, such as sales charges. Therefore, the second line for each class is useful in comparing ongoing costs only, and will not help you compare total costs of owning different funds. In addition, if transaction costs were included, your total costs would have been higher. Please refer to the Fund prospectus for additional information on operating expenses.
| | | | | | |
| | | Beginning Account | | Ending Account | | Expenses Paid During |
| Class A | | Value 9/1/10 | | Value 2/28/11 | | Period* 9/1/10–2/28/11 |
| Actual | $ | 1,000 | $ | 957.00 | $ | 3.11 |
| Hypothetical (5% return before expenses) | $ | 1,000 | $ | 1,021.62 | $ | 3.22 |
| Class C | | | | | | |
| Actual | $ | 1,000 | $ | 954.80 | $ | 5.77 |
| Hypothetical (5% return before expenses) | $ | 1,000 | $ | 1,018.89 | $ | 5.96 |
| Advisor Class | | | | | | |
| Actual | $ | 1,000 | $ | 957.50 | $ | 2.62 |
| Hypothetical (5% return before expenses) | $ | 1,000 | $ | 1,022.12 | $ | 2.71 |
*Expenses are calculated using the most recent six-month expense ratio, annualized for each class (A: 0.64%; C: 1.19%; and Advisor: 0.54%), multiplied by the average account value over the period, multiplied 181/365 to reflect the one-half year period.
76 | Annual Report
Franklin Virginia Tax-Free Income Fund
Your Fund’s Goal and Main Investments: Franklin Virginia Tax-Free Income Fund seeks to provide as high a level of income exempt from federal and Virginia personal income taxes as is consistent with prudent investment management and preservation of capital by investing at least 80% of its total assets in securities that pay interest free from such taxes.1
| | |
| Credit Quality Breakdown* | | |
| Franklin Virginia Tax-Free Income Fund | | |
| 2/28/11 | | |
| | % of Total | |
| Ratings | Long-Term Investments** | |
| AAA | 16.4 | % |
| AA | 40.5 | % |
| A | 26.0 | % |
| BBB | 15.5 | % |
| Below Investment Grade | 0.9 | % |
| Not Rated | 0.7 | % |
| |
| *Standard & Poor’s (S&P) is used as the primary independent rating agency source, Moody’s is secondary, and Fitch, | |
| if available, is used for securities not rated by Moody’s or S&P. The letter ratings are provided to indicate the credit- | |
| worthiness of the Fund’s bond holdings and generally range from AAA (highest) to Below Investment Grade (lowest; | |
| includes ratings BB to D). | | |
| **Does not include short-term investments and other net assets. | | |
Performance data represent past performance, which does not guarantee future results. Investment return and principal value will fluctuate, and you may have a gain or loss when you sell your shares. Current performance may differ from figures shown. Please visit franklintempleton.com or call (800) 342-5236 for most recent month-end performance.
This annual report for Franklin Virginia Tax-Free Income Fund covers the fiscal year ended February 28, 2011.
Performance Overview
The Fund’s Class A share price, as measured by net asset value, decreased from $11.63 on February 28, 2010, to $11.18 on February 28, 2011. The
|
| 1. For investors subject to alternative minimum tax, a small portion of Fund dividends may be taxable. Distributions |
| of capital gains are generally taxable. To avoid imposition of 28% backup withholding on all Fund distributions and |
| redemption proceeds, U.S. investors must be properly certified on Form W-9 and non-U.S. investors on Form W-8BEN. |
| |
| The dollar value, number of shares or principal amount, and names of all portfolio holdings are listed in the Fund’s |
| Statement of Investments (SOI). The SOI begins on page 148. |
Annual Report | 77
| | | |
| Dividend Distributions* | | | |
| Franklin Virginia Tax-Free Income Fund | | | |
| | | Dividend per Share |
| Month | Class A | Class C | Advisor Class |
| March 2010 | 4.05 cents | 3.49 cents | 4.13 cents |
| April 2010 | 4.05 cents | 3.49 cents | 4.13 cents |
| May 2010 | 4.05 cents | 3.49 cents | 4.13 cents |
| June 2010 | 4.05 cents | 3.52 cents | 4.14 cents |
| July 2010 | 4.05 cents | 3.52 cents | 4.14 cents |
| August 2010 | 4.05 cents | 3.52 cents | 4.14 cents |
| September 2010 | 4.05 cents | 3.50 cents | 4.15 cents |
| October 2010 | 3.96 cents | 3.41 cents | 4.06 cents |
| November 2010 | 3.96 cents | 3.41 cents | 4.06 cents |
| December 2010 | 3.96 cents | 3.40 cents | 4.07 cents |
| January 2011 | 3.96 cents | 3.40 cents | 4.07 cents |
| February 2011 | 3.96 cents | 3.40 cents | 4.07 cents |
*Assumes shares were purchased and held for the entire accrual period, which differs from the calendar month. Since dividends accrue daily, your actual distributions will vary depending on the date you purchased your shares and any account activity. All Fund distributions will vary depending upon current market conditions, and past distributions are not indicative of future trends.
Fund’s Class A shares paid dividends totaling 48.43 cents per share for the same period.2 The Performance Summary beginning on page 80 shows that at the end of this reporting period the Fund’s Class A shares’ distribution rate was 4.12% based on an annualization of the current 4.01 cent per share dividend and the maximum offering price of $11.68 on February 28, 2011. An investor in the 2011 maximum combined effective federal and Virginia personal income tax bracket of 38.74% would need to earn a distribution rate of 6.73% from a taxable investment to match the Fund’s Class A tax-free distribution rate. For the Fund’s Class C and Advisor shares’ performance, please see the Performance Summary. Dividend distributions during the year under review were affected by securities purchased in the prior period and by falling municipal bond rates in 2009 through November 2010. In addition, for most of the Fund’s fiscal year, investor demand was strong for municipal bonds in an environment of limited tax-exempt supply. These factors resulted in reduced income for the portfolio and caused dividends to decline.
2. All Fund distributions will vary depending upon current market conditions, and past distributions are not indicative of future trends.
78 | Annual Report
Commonwealth Update
Virginia’s economy grew at a faster pace than the national average during the reporting period. The commonwealth’s large military presence and its proximity to the nation’s capital protected local employment levels from the full brunt of the recession. Virginia’s unemployment rate remained below the national rate throughout the period, and reached 6.4% by period-end, compared with the 8.9% national rate.3 The information and leisure and hospitality sectors lost jobs during the period. In contrast, all other sectors had gains.
The commonwealth’s legislators unanimously agreed on a series of revisions to Virginia’s $80.2 billion biennial budget at period-end.4 Growth in income and sales tax collections prompted lawmakers to restore some of the funding that was cut from education, health care and other public services during the recession. Virginia’s net tax-supported debt was 2.1% of personal income and $895 per capita, compared with the national medians of 2.5% and $936.5
Independent credit rating agency Standard & Poor’s assigned Virginia’s general obligation debt its highest rating of AAA with a stable outlook.6 The rating and outlook reflected the commonwealth’s strong and broad-based economy, good financial position and conservative financial management.
Manager’s Discussion
We used various investment strategies during the 12 months under review as we sought to maximize tax-free income for shareholders. Please read the discussion on page 6 for details.
Thank you for your continued participation in Franklin Virginia Tax-Free Income Fund. We intend to maintain our conservative, buy-and-hold investment strategy as we attempt to provide shareholders with high, current, tax-free income.
The foregoing information reflects our analysis, opinions and portfolio holdings as of February 28, 2011, the end of the reporting period. The way we implement our main investment strategies and the resulting portfolio holdings may change depending on factors such as market and economic conditions. These opinions may not be relied upon as investment advice or an offer for a particular security. The information is not a complete analysis of every aspect of any market, state, industry, security or the Fund. Statements of fact are from sources considered reliable, but the investment manager makes no representation or warranty as to their completeness or accuracy. Although historical performance is no guarantee of future results, these insights may help you understand our investment management philosophy.
|
| 3. Source: Bureau of Labor Statistics. |
| 4. Source: The Virginian-Pilot, “State Budget Deal Reached; House, Senate Approve,” 2/27/11. |
| 5. Source: Moody’s Investors Service, “Special Comment: 2010 State Debt Medians Report,” May 2010. |
| 6. This does not indicate Standard & Poor’s rating of the Fund. |
| | |
| Portfolio Breakdown | | |
| Franklin Virginia Tax-Free Income Fund | |
| 2/28/11 | | |
| % of Total | |
| Long-Term Investments* | |
| Utilities | 17.9 | % |
| Transportation | 13.4 | % |
| Hospital & Health Care | 13.0 | % |
| Other Revenue | 12.3 | % |
| Higher Education | 9.6 | % |
| Refunded | 8.4 | % |
| General Obligation | 8.1 | % |
| Tax-Supported | 6.7 | % |
| Housing | 6.1 | % |
| Subject to Government Appropriations | 3.6 | % |
| Corporate-Backed | 0.9 | % |
| |
| *Does not include short-term investments and other | |
| net assets. | | |
Annual Report | 79
Performance Summary as of 2/28/11
Franklin Virginia Tax-Free Income Fund
Your dividend income will vary depending on dividends or interest paid by securities in the Fund’s portfolio, adjusted for operating expenses of each class. Capital gain distributions are net profits realized from the sale of portfolio securities. The performance table and graphs do not reflect any taxes that a shareholder would pay on Fund dividends, capital gain distributions, if any, or any realized gains on the sale of Fund shares. Total return reflects reinvestment of the Fund’s dividends and capital gain distributions, if any, and any unrealized gains or losses.
| | | | | | | | |
| Price and Distribution Information | | | | | | |
| Class A (Symbol: FRVAX) | | | | Change | | 2/28/11 | | 2/28/10 |
| Net Asset Value (NAV) | | | -$ | 0.45 | $ | 11.18 | $ | 11.63 |
| Distributions (3/1/10–2/28/11) | | | | | | | | |
| Dividend Income | $ | 0.4843 | | | | | | |
| Class C (Symbol: FVAIX) | | | | Change | | 2/28/11 | | 2/28/10 |
| Net Asset Value (NAV) | | | -$ | 0.45 | $ | 11.32 | $ | 11.77 |
| Distributions (3/1/10–2/28/11) | | | | | | | | |
| Dividend Income | $ | 0.4180 | | | | | | |
| Advisor Class (Symbol: FRVZX) | | | | Change | | 2/28/11 | | 2/28/10 |
| Net Asset Value (NAV) | | | -$ | 0.45 | $ | 11.18 | $ | 11.63 |
| Distributions (3/1/10–2/28/11) | | | | | | | | |
| Dividend Income | $ | 0.4958 | | | | | | |
80 | Annual Report
Performance Summary (continued)
Performance
Cumulative total return excludes sales charges. Average annual total returns include maximum sales charges. Class A: 4.25% maximum initial sales charge; Class C: 1% contingent deferred sales charge in first year only; Advisor Class: no sales charges.
| | | | | | | | | | | |
| Class A | | | | 1-Year | | | 5-Year | | | 10-Year | |
| Cumulative Total Return1 | | | + | 0.24 | % | + | 16.64 | % | + | 51.52 | % |
| Average Annual Total Return2 | | | | -4.05 | % | + | 2.23 | % | + | 3.79 | % |
| Avg. Ann. Total Return (3/31/11)3 | | | | -4.76 | % | + | 2.24 | % | + | 3.65 | % |
| Distribution Rate4 | 4.12 | % | | | | | | | | | |
| Taxable Equivalent Distribution Rate5 | 6.73 | % | | | | | | | | | |
| 30-Day Standardized Yield6 | 4.02 | % | | | | | | | | | |
| Taxable Equivalent Yield5 | 6.56 | % | | | | | | | | | |
| Total Annual Operating Expenses7 | 0.65 | % | | | | | | | | | |
| Class C | | | | 1-Year | | | 5-Year | | | 10-Year | |
| Cumulative Total Return1 | | | | -0.33 | % | + | 13.55 | % | + | 43.56 | % |
| Average Annual Total Return2 | | | | -1.29 | % | + | 2.57 | % | + | 3.68 | % |
| Avg. Ann. Total Return (3/31/11)3 | | | | -1.91 | % | + | 2.60 | % | + | 3.54 | % |
| Distribution Rate4 | 3.72 | % | | | | | | | | | |
| Taxable Equivalent Distribution Rate5 | 6.07 | % | | | | | | | | | |
| 30-Day Standardized Yield6 | 3.66 | % | | | | | | | | | |
| Taxable Equivalent Yield5 | 5.97 | % | | | | | | | | | |
| Total Annual Operating Expenses7 | 1.20 | % | | | | | | | | | |
| Advisor Class8 | | | | 1-Year | | | 5-Year | | | 10-Year | |
| Cumulative Total Return1 | | | + | 0.34 | % | + | 16.81 | % | + | 51.74 | % |
| Average Annual Total Return2 | | | + | 0.34 | % | + | 3.16 | % | + | 4.26 | % |
| Avg. Ann. Total Return (3/31/11)3 | | | | -0.31 | % | + | 3.18 | % | + | 4.12 | % |
| Distribution Rate4 | 4.40 | % | | | | | | | | | |
| Taxable Equivalent Distribution Rate5 | 7.18 | % | | | | | | | | | |
| 30-Day Standardized Yield6 | 4.31 | % | | | | | | | | | |
| Taxable Equivalent Yield5 | 7.04 | % | | | | | | | | | |
| Total Annual Operating Expenses7 | 0.55 | % | | | | | | | | | |
Performance data represent past performance, which does not guarantee future results. Investment return and principal value will fluctuate, and you may have a gain or loss when you sell your shares. Current performance may differ from figures shown. For most recent month-end performance, go to franklintempleton.com or call (800) 342-5236.
Annual Report | 81
Performance Summary (continued)
Total Return Index Comparison for a Hypothetical $10,000 Investment
Total return represents the change in value of an investment over the periods shown. It includes any current, applicable, maximum sales charge, Fund expenses, account fees and reinvested distributions. The unmanaged index includes reinvestment of any income or distributions. It differs from the Fund in composition and does not pay management fees or expenses. One cannot invest directly in an index.
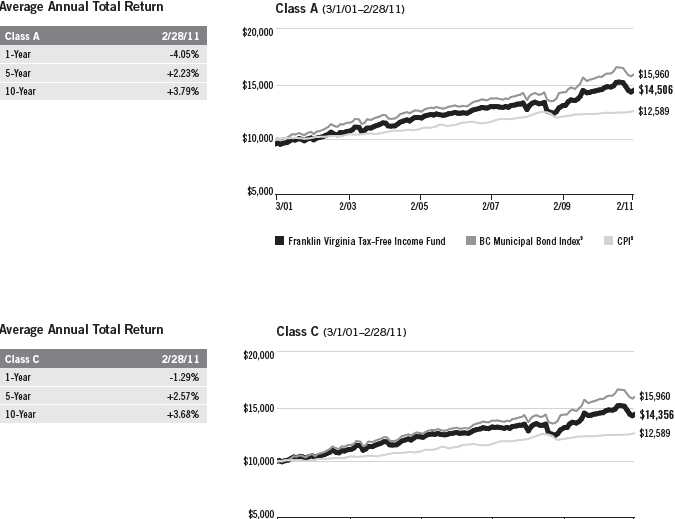
| | | | | |
| 3/01 | 2/03 | 2/05 | 2/07 | 2/09 | 2/11 |
| Franklin Virginia Tax-Free Income Fund | BC Municipal Bond Index 9 | CPI9 |
82 | Annual Report
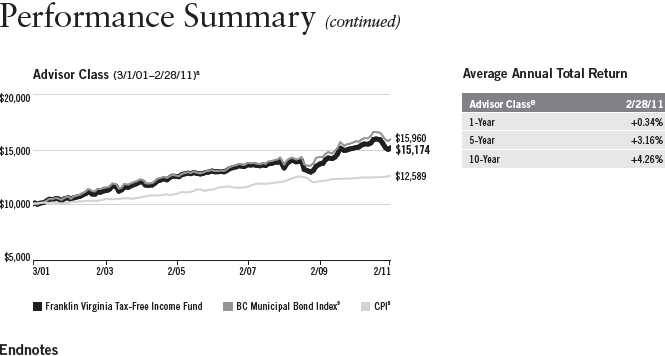
Because municipal bonds are sensitive to interest rate movements, the Fund’s yield and share price will fluctuate with market conditions. Bond prices generally move in the opposite direction of interest rates. Thus, as prices of bonds in the Fund adjust to a rise in interest rates, the Fund’s share price may decline. Since the Fund concentrates its investments in a single state, it is subject to greater risk of adverse economic and regulatory changes in that state than a geographically diversified fund. The manager applies various techniques and analyses in making investment decisions for the Fund, but there can be no guarantee that these decisions will produce the desired results. The Fund’s prospectus also includes a description of the main investment risks.
Class C: Prior to 1/1/04, these shares were offered with an initial sales charge; thus actual total returns
would have differed. These shares have higher annual fees and expenses than Class A shares.
Advisor Class: Shares are available to certain eligible investors as described in the prospectus.
1. Cumulative total return represents the change in value of an investment over the periods indicated.
2. Average annual total return represents the average annual change in value of an investment over the periods indicated.
3. In accordance with SEC rules, we provide standardized average annual total return information through the latest calendar quarter.
4. Distribution rate is based on an annualization of the respective class’s current monthly dividend and the maximum offering price (NAV for Classes C and Advisor) per share on 2/28/11.
5. Taxable equivalent distribution rate and yield assume the published rates as of 12/28/10 for the maximum combined effective federal and Virginia personal income tax rate of 38.74%, based on the federal income tax rate of 35.00%.
6. The 30-day standardized yield for the month ended 2/28/11 reflects an estimated yield to maturity (assuming all portfolio securities are held to maturity). It should be regarded as an estimate of the Fund’s rate of investment income, and it may not equal the Fund’s actual income distribution rate (which reflects the Fund’s past dividends paid to shareholders) or the income reported in the Fund’s financial statements.
7. Figures are as stated in the Fund’s prospectus current as of the date of this report. In periods of market volatility, assets may decline significantly, causing total annual Fund operating expenses to become higher than the figures shown.
8. Effective 7/1/09, the Fund began offering Advisor Class shares, which do not have sales charges or a Rule 12b-1 plan. Performance quotations for this class reflect the following methods of calculation: (a) For periods prior to 7/1/09, a restated figure is used based upon the Fund’s Class A performance, excluding the effect of Class A’s maximum initial sales charge, but reflecting the effect of the Class A Rule 12b-1 fees; and (b) for periods after 6/30/09, actual Advisor Class performance is used reflecting all charges and fees applicable to that class. Since 7/1/09 (commencement of sales), the cumulative and average annual total returns of Advisor Class shares were +7.62% and +4.51%.
9. Source: © 2011 Morningstar. The BC Municipal Bond Index is a market value-weighted index engineered for the long-term tax-exempt bond market. To be included in the index, bonds must be fixed rate, have at least one year to final maturity and be rated investment grade (Baa3/BBB- or higher) by at least two of the following agencies: Moody’s, Standard & Poor’s and Fitch. The Consumer Price Index (CPI), calculated by the U.S. Bureau of Labor Statistics, is a commonly used measure of the inflation rate.
Annual Report | 83
Your Fund’s Expenses
Franklin Virginia Tax-Free Income Fund
As a Fund shareholder, you can incur two types of costs:
- Transaction costs, including sales charges (loads) on Fund purchases; and
- Ongoing Fund costs, including management fees, distribution and service (12b-1) fees, and other Fund expenses. All mutual funds have ongoing costs, sometimes referred to as operating expenses.
The following table shows ongoing costs of investing in the Fund and can help you understand these costs and compare them with those of other mutual funds. The table assumes a $1,000 investment held for the six months indicated.
Actual Fund Expenses
The first line (Actual) for each share class listed in the table provides actual account values and expenses. The “Ending Account Value” is derived from the Fund’s actual return, which includes the effect of Fund expenses.
You can estimate the expenses you paid during the period by following these steps. Of course, your account value and expenses will differ from those in this illustration:
| 1. | Divide your account value by $1,000. |
| | If an account had an $8,600 value, then $8,600 ÷ $1,000 = 8.6. |
| 2. | Multiply the result by the number under the heading “Expenses Paid During Period.” |
| | If Expenses Paid During Period were $7.50, then 8.6 x $7.50 = $64.50. |
In this illustration, the estimated expenses paid this period are $64.50.
Hypothetical Example for Comparison with Other Funds
Information in the second line (Hypothetical) for each class in the table can help you compare ongoing costs of investing in the Fund with those of other mutual funds. This information may not be used to estimate the actual ending account balance or expenses you paid during the period. The hypothetical “Ending Account Value” is based on the actual expense ratio for each class and an assumed 5% annual rate of return before expenses, which does not represent the Fund’s actual return. The figure under the heading “Expenses Paid During Period” shows the hypothetical expenses your account would have incurred under this scenario. You can compare this figure with the 5% hypothetical examples that appear in shareholder reports of other funds.
84 | Annual Report
Your Fund’s Expenses (continued)
Please note that expenses shown in the table are meant to highlight ongoing costs and do not reflect any transaction costs, such as sales charges. Therefore, the second line for each class is useful in comparing ongoing costs only, and will not help you compare total costs of owning different funds. In addition, if transaction costs were included, your total costs would have been higher. Please refer to the Fund prospectus for additional information on operating expenses.
| | | | | | |
| | | Beginning Account | | Ending Account | | Expenses Paid During |
| Class A | | Value 9/1/10 | | Value 2/28/11 | | Period* 9/1/10–2/28/11 |
| Actual | $ | 1,000 | $ | 956.70 | $ | 3.10 |
| Hypothetical (5% return before expenses) | $ | 1,000 | $ | 1,021.62 | $ | 3.21 |
| Class C | | | | | | |
| Actual | $ | 1,000 | $ | 953.70 | $ | 5.76 |
| Hypothetical (5% return before expenses) | $ | 1,000 | $ | 1,018.89 | $ | 5.96 |
| Advisor Class | | | | | | |
| Actual | $ | 1,000 | $ | 957.30 | $ | 2.62 |
| Hypothetical (5% return before expenses) | $ | 1,000 | $ | 1,022.12 | $ | 2.71 |
*Expenses are calculated using the most recent six-month expense ratio, annualized for each class (A: 0.64%; C: 1.19%; and Advisor: 0.54%), multiplied by the average account value over the period, multiplied by 181/365 to reflect the one-half year period.
Annual Report | 85
| | | | | | | | | | | | | | | |
| Franklin Tax-Free Trust | | | | | | | | | | | | | | | |
| Financial Highlights | | | | | | | | | | | | | | | |
| |
| Franklin Alabama Tax-Free Income Fund | | | | | | | | | | | | | | | |
| | | | | | Year Ended February 28, | | | | |
| Class A | | 2011 | | | 2010 | | | 2009 | | | 2008 | a | | 2007 | |
| Per share operating performance | | | | | | | | | | | | | | | |
| (for a share outstanding throughout the year) | | | | | | | | | | | | | | | |
| Net asset value, beginning of year | $ | 11.17 | | $ | 10.59 | | $ | 10.84 | | $ | 11.51 | | $ | 11.49 | |
| Income from investment operationsb: | | | | | | | | | | | | | | | |
| Net investment incomec | | 0.47 | | | 0.48 | | | 0.48 | | | 0.47 | | | 0.48 | |
| Net realized and unrealized gains (losses) | | (0.50 | ) | | 0.58 | | | (0.26 | ) | | (0.67 | ) | | 0.02 | |
| Total from investment operations | | (0.03 | ) | | 1.06 | | | 0.22 | | | (0.20 | ) | | 0.50 | |
| Less distributions from net investment income | | (0.48 | ) | | (0.48 | ) | | (0.47 | ) | | (0.47 | ) | | (0.48 | ) |
| Redemption feesd | | — | | | — | | | —e | | | —e | | | —e | |
| Net asset value, end of year | $ | 10.66 | | $ | 11.17 | | $ | 10.59 | | $ | 10.84 | | $ | 11.51 | |
| |
| Total returnf | | (0.38 | )% | | 10.14 | % | | 2.18 | % | | (1.96 | )% | | 4.50 | % |
| |
| Ratios to average net assets | | | | | | | | | | | | | | | |
| Expenses | | 0.71 | % | | 0.71 | % | | 0.71 | % | | 0.71 | % | | 0.71 | % |
| Net investment income | | 4.25 | % | | 4.37 | % | | 4.40 | % | | 4.14 | % | | 4.23 | % |
| |
| Supplemental data | | | | | | | | | | | | | | | |
| Net assets, end of year (000’s) | $ | 226,863 | | $ | 244,860 | | $ | 218,937 | | $ | 230,439 | | $ | 244,272 | |
| Portfolio turnover rate | | 11.32 | % | | 7.80 | % | | 20.42 | % | | 16.92 | % | | 16.04 | % |
|
| aFor the year ended February 29. |
| bThe amount shown for a share outstanding throughout the period may not correlate with the Statement of Operations for the period due to the timing of sales and repurchases of |
| the Fund shares in relation to income earned and/or fluctuating market value of the investments of the Fund. |
| cBased on average daily shares outstanding. |
| dEffective September 1, 2008, the redemption fee was eliminated. |
| eAmount rounds to less than $0.01 per share. |
| fTotal return does not reflect sales commissions or contingent deferred sales charges, if applicable. |
86 | The accompanying notes are an integral part of these financial statements. | Annual Report
| | | | | | | | | | | | | | | |
| Franklin Tax-Free Trust | | | | | | | | | | | | | | | |
| Financial Highlights (continued) | | | | | | | | | | | | | | | |
| |
| Franklin Alabama Tax-Free Income Fund | | | | | | | | | | | | | | | |
| | | | | | Year Ended February 28, | | | | |
| Class C | | 2011 | | | 2010 | | | 2009 | | | 2008 | a | | 2007 | |
| Per share operating performance | | | | | | | | | | | | | | | |
| (for a share outstanding throughout the year) | | | | | | | | | | | | | | | |
| Net asset value, beginning of year | $ | 11.28 | | $ | 10.69 | | $ | 10.93 | | $ | 11.60 | | $ | 11.58 | |
| Income from investment operationsb: | | | | | | | | | | | | | | | |
| Net investment incomec | | 0.41 | | | 0.42 | | | 0.42 | | | 0.41 | | | 0.42 | |
| Net realized and unrealized gains (losses) | | (0.51 | ) | | 0.59 | | | (0.25 | ) | | (0.68 | ) | | 0.02 | |
| Total from investment operations | | (0.10 | ) | | 1.01 | | | 0.17 | | | (0.27 | ) | | 0.44 | |
| Less distributions from net investment income | | (0.41 | ) | | (0.42 | ) | | (0.41 | ) | | (0.40 | ) | | (0.42 | ) |
| Redemption feesd | | — | | | — | | | —e | | | —e | | | —e | |
| Net asset value, end of year | $ | 10.77 | | $ | 11.28 | | $ | 10.69 | | $ | 10.93 | | $ | 11.60 | |
| |
| Total returnf | | (0.94 | )% | | 9.54 | % | | 1.59 | % | | (2.39 | )% | | 3.89 | % |
| |
| Ratios to average net assets | | | | | | | | | | | | | | | |
| Expenses | | 1.26 | % | | 1.26 | % | | 1.26 | % | | 1.26 | % | | 1.26 | % |
| Net investment income | | 3.70 | % | | 3.82 | % | | 3.85 | % | | 3.59 | % | | 3.68 | % |
| |
| Supplemental data | | | | | | | | | | | | | | | |
| Net assets, end of year (000’s) | $ | 47,345 | | $ | 49,828 | | $ | 41,651 | | $ | 38,341 | | $ | 38,094 | |
| Portfolio turnover rate | | 11.32 | % | | 7.80 | % | | 20.42 | % | | 16.92 | % | | 16.04 | % |
|
| aFor the year ended February 29. |
| bThe amount shown for a share outstanding throughout the period may not correlate with the Statement of Operations for the period due to the timing of sales and repurchases of |
| the Fund shares in relation to income earned and/or fluctuating market value of the investments of the Fund. |
| cBased on average daily shares outstanding. |
| dEffective September 1, 2008, the redemption fee was eliminated. |
| eAmount rounds to less than $0.01 per share. |
| fTotal return does not reflect sales commissions or contingent deferred sales charges, if applicable. |
Annual Report | The accompanying notes are an integral part of these financial statements. | 87
| | | | |
| Franklin Tax-Free Trust | | | | |
| |
| Statement of Investments, February 28, 2011 | | | | |
| |
| |
| Franklin Alabama Tax-Free Income Fund | | Principal Amount | | Value |
| Municipal Bonds 98.5% | | | | |
| Alabama 80.3% | | | | |
| Alabama Drinking Water Finance Authority Revenue, Revolving Fund Loan, Series A, | | | | |
| AMBAC Insured, 5.25%, 8/15/24 | $ | 1,755,000 | $ | 1,782,764 |
| Alabama State Port Authority Docks Facilities Revenue, Refunding, 6.00%, 10/01/40 | | 3,000,000 | | 2,946,870 |
| Alabama Water Pollution Control Authority Revenue, Revolving Fund Loan, Series A, | | | | |
| AMBAC Insured, 5.00%, 8/15/23 | | 4,435,000 | | 4,358,319 |
| Alabaster Sewer Revenue, NATL Insured, 5.00%, 4/01/29 | | 2,055,000 | | 1,895,244 |
| Athens GO, wts., XLCA Insured, 5.00%, 2/01/36 | | 2,560,000 | | 2,447,514 |
| Auburn University General Fee Revenue, Auburn University, Series A, AGMC Insured, 5.00%, | | | | |
| 6/01/38 | | 5,000,000 | | 5,026,250 |
| Bessemer GO, wts., XLCA Insured, 5.00%, 2/01/35 | | 1,990,000 | | 1,540,539 |
| Bessemer Governmental Utility Services Corp. Water Supply Revenue, Refunding, Series A, | | | | |
| Assured Guaranty, 5.00%, 6/01/39 | | 3,825,000 | | 3,652,186 |
| Birmingham Southern College Private Educational Building Authority Tuition Revenue, | | | | |
| Refunding, 5.35%, 12/01/19 | | 900,000 | | 756,414 |
| Birmingham Special Care Facilities Financing Authority, Health Care Facility Revenue, | | | | |
| Children’s Hospital, Assured Guaranty, 6.00%, 6/01/39 | | 4,000,000 | | 4,149,520 |
| Birmingham Waterworks Board Water Revenue, Series A, Assured Guaranty, 5.25%, 1/01/39 | | 5,950,000 | | 5,968,504 |
| Butler County IDA Environmental Improvement Revenue, International Paper, Series A, 7.00%, | | | | |
| 9/01/32 | | 1,000,000 | | 1,028,690 |
| Butler County Public Education Cooperative District, Series A, XLCA Insured, 5.00%, | | | | |
| 7/01/37 | | 9,025,000 | | 7,353,028 |
| Central Elmore Water and Sewer Authority Revenue, Water, NATL Insured, 5.00%, 1/01/29 | | 4,290,000 | | 4,259,713 |
| Chatom IDB Gulf Opportunity Zone Revenue, PowerSouth Energy, Refunding, Series A, | | | | |
| Assured Guaranty, 5.00%, | | | | |
| 8/01/30 | | 5,250,000 | | 5,344,447 |
| 8/01/37 | | 5,000,000 | | 4,794,700 |
| Coffee County PBA Building Revenue, NATL Insured, 5.00%, 9/01/27 | | 2,145,000 | | 2,200,127 |
| DCH Health Care Authority Health Care Facilities Revenue, 5.125%, 6/01/36 | | 7,000,000 | | 6,087,830 |
| East Alabama Health Care Authority Health Care Facilities Revenue, Mandatory Put 9/01/18, | | | | |
| Series A, 5.25%, 9/01/36 | | 5,000,000 | | 4,984,700 |
| Series B, 5.50%, 9/01/33 | | 4,500,000 | | 4,622,220 |
| Etowah County Board of Education Special Tax, School wts., AGMC Insured, 5.00%, | | | | |
| 9/01/24 | | 4,235,000 | | 4,345,703 |
| 9/01/28 | | 2,000,000 | | 2,026,160 |
| 9/01/33 | | 2,500,000 | | 2,504,625 |
| aFairfield GO, wts., Refunding, AMBAC Insured, 5.00%, 2/01/29 | | 1,500,000 | | 1,234,860 |
| Fairfield IDB Environmental Improvement Revenue, USX Corp. Project, Refunding, 5.45%, | | | | |
| 9/01/14 | | 2,000,000 | | 2,003,640 |
| Franklin County GO, wts., Series B, AMBAC Insured, 5.125%, 10/01/33 | | 2,000,000 | | 2,023,720 |
| Houston County Health Care Authority Revenue, Refunding, Series A, AMBAC Insured, 5.25%, | | | | |
| 10/01/30 | | 5,000,000 | | 4,373,100 |
| Huntsville Health Care Authority Revenue, Series A, NATL Insured, Pre-Refunded, | | | | |
| 5.40%, 6/01/22 | | 4,000,000 | | 4,295,960 |
| 5.50%, 6/01/27 | | 3,820,000 | | 4,107,188 |
| Huntsville PBA Lease Revenue, Municipal Justice and Public Safety Center, Refunding and | | | | |
| Improvement, NATL Insured, 5.00%, 10/01/33 | | 8,000,000 | | 7,935,520 |
88 | Annual Report
| | | | |
| Franklin Tax-Free Trust | | | | |
| |
| Statement of Investments, February 28, 2011 (continued) | | | | |
| |
| |
| Franklin Alabama Tax-Free Income Fund | | Principal Amount | | Value |
| Municipal Bonds (continued) | | | | |
| Alabama (continued) | | | | |
| Jacksonville State University Revenue, Tuition and Fee, NATL Insured, 5.00%, 12/01/22 | $ | 3,000,000 | $ | 3,036,600 |
| Jefferson County Limited Obligation School wts. Revenue, Series A, 5.00%, 1/01/24 | | 2,000,000 | | 1,658,840 |
| Jefferson County Sewer Revenue, wts., ETM, 7.50%, 9/01/13 | | 200,000 | | 212,708 |
| Leeds Public Educational Building Authority Educational Facilities Revenue, Assured Guaranty, | | | | |
| 5.125%, 4/01/33 | | 7,410,000 | | 7,477,505 |
| Limestone County Water and Sewer Authority Water Revenue, | | | | |
| AMBAC Insured, 5.00%, 12/01/29 | | 1,540,000 | | 1,427,888 |
| AMBAC Insured, 5.00%, 12/01/31 | | 3,910,000 | | 3,533,741 |
| Assured Guaranty, 5.00%, 12/01/39 | | 3,750,000 | | 3,531,975 |
| Madison County Board of Education Capital Outlay GO, Tax Anticipation wts., Series A, | | | | |
| AMBAC Insured, 5.00%, 9/01/34 | | 1,000,000 | | 966,470 |
| Madison County Board of Education Capital Outlay Revenue, Tax Anticipation wts., | | | | |
| Assured Guaranty, 5.125%, 9/01/34 | | 600,000 | | 594,738 |
| Madison GO, wts., Refunding, XLCA Insured, 4.75%, 12/01/36 | | 2,455,000 | | 2,155,785 |
| Madison Water and Wastewater Board Water and Sewer Revenue, Refunding, Series A, | | | | |
| XLCA Insured, 4.75%, 12/01/31 | | 7,500,000 | | 7,230,900 |
| Marshall County Health Care Authority GO, Refunding, AMBAC Insured, 4.75%, 2/01/33 | | 3,000,000 | | 2,260,800 |
| Marshall County Health Care Authority Hospital Revenue, Series A, 5.75%, 1/01/32 | | 2,170,000 | | 2,061,305 |
| Mobile County Board School Commissioners GO, Capital Outlay wts., Series B, AMBAC Insured, | | | | |
| Pre-Refunded, 5.125%, 3/01/31 | | 4,980,000 | | 4,980,000 |
| Mobile GO, wts., 5.50%, 2/15/30 | | 2,000,000 | | 2,028,740 |
| Mobile Public Educational Building Authority Revenue, Limited Obligation School, Series A, | | | | |
| Assured Guaranty, 5.00%, 3/01/33 | | 6,500,000 | | 6,511,375 |
| Mobile Water and Sewer Commissioners Water and Sewer Revenue, Mobile Water, BHAC Insured, | | | | |
| 5.00%, 1/01/36 | | 10,000,000 | | 9,957,000 |
| Moulton Water Works Board Water Revenue, NATL Insured, 5.375%, 1/01/32 | | 1,935,000 | | 1,890,998 |
| Opelika Water Board Revenue, Assured Guaranty, 5.00%, 6/01/37 | | 3,000,000 | | 3,008,190 |
| Orange Beach Water Sewer and Fire Protection Authority Revenue, NATL Insured, 5.00%, | | | | |
| 5/15/35 | | 2,000,000 | | 1,895,080 |
| Phenix City Water and Sewer Revenue, wts., Series A, AGMC Insured, 5.00%, 8/15/40 | | 2,000,000 | | 1,948,800 |
| Selma IDBR, Gulf Opportunity Zone, International Paper Co., Series A, 5.80%, 5/01/34 | | 3,000,000 | | 2,906,910 |
| Sheffield GO, wts., AMBAC Insured, 5.125%, 5/01/33 | | 2,610,000 | | 2,482,110 |
| Tallassee GO, Water Gas and Sewer wts., AMBAC Insured, | | | | |
| 5.25%, 5/01/31 | | 465,000 | | 466,679 |
| Pre-Refunded, 5.25%, 5/01/31 | | 670,000 | | 681,973 |
| Troy Public Educational Building Authority Dormitory Revenue, Troy University Housing | | | | |
| LLC Project, Series A, CIFG Insured, 5.00%, 9/01/32 | | 5,000,000 | | 4,771,900 |
| Trussville GO, wts., Series A, NATL RE, FGIC Insured, 5.00%, 10/01/36 | | 4,740,000 | | 4,645,958 |
| Tuscaloosa Public Educational Building Authority Student Housing Revenue, Ridgecrest Student | | | | |
| Housing LLC University of Alabama Ridgecrest Residential Project, Assured Guaranty, 6.75%, | | | | |
| 7/01/38 | | 5,000,000 | | 5,428,750 |
| University of Alabama at Birmingham Hospital Revenue, Refunding, Series A, AMBAC Insured, | | | | |
| 5.00%, 9/01/41 | | 9,000,000 | | 7,884,540 |
| University of Montevallo Revenue, AGMC Insured, Pre-Refunded, 5.30%, 5/01/22 | | 1,940,000 | | 1,975,153 |
| University of North Alabama Revenue, Student Housing, NATL RE, FGIC Insured, 5.00%, | | | | |
| 11/01/29 | | 2,995,000 | | 2,987,602 |
Annual Report | 89
| | | | |
| Franklin Tax-Free Trust | | | | |
| |
| Statement of Investments, February 28, 2011 (continued) | | | | |
| |
| |
| Franklin Alabama Tax-Free Income Fund | | Principal Amount | | Value |
| Municipal Bonds (continued) | | | | |
| Alabama (continued) | | | | |
| University of South Alabama University Revenues, Facilities, Capital Improvement, | | | | |
| BHAC Insured, 5.00%, 8/01/38 | $ | 5,000,000 | $ | 4,854,550 |
| Valley Special Care Facilities Financing Authority Revenue, Lanier Memorial Hospital, Series A, | | | | |
| 5.65%, 11/01/22 | | 3,465,000 | | 2,632,672 |
| | | | | 220,138,290 |
| U.S. Territories 18.2% | | | | |
| Puerto Rico 18.2% | | | | |
| Puerto Rico Commonwealth Aqueduct and Sewer Authority Revenue, senior lien, Series A, | | | | |
| 6.00%, 7/01/38 | | 1,000,000 | | 938,780 |
| Puerto Rico Commonwealth GO, Public Improvement, | | | | |
| AGMC Insured, Pre-Refunded, 5.125%, 7/01/30 | | 1,885,000 | | 1,915,084 |
| Refunding, AGMC Insured, 5.25%, 7/01/27 | | 1,005,000 | | 1,004,940 |
| Refunding, AGMC Insured, 5.125%, 7/01/30 | | 1,115,000 | | 1,077,112 |
| Series A, 5.125%, 7/01/31 | | 3,550,000 | | 3,551,846 |
| Series A, Pre-Refunded, 5.125%, 7/01/31 | | 1,450,000 | | 1,473,142 |
| Puerto Rico Commonwealth Highway and Transportation Authority Transportation Revenue, | | | | |
| Refunding, | | | | |
| Series M, 5.00%, 7/01/46 | | 2,500,000 | | 2,062,700 |
| Series N, Assured Guaranty, 5.25%, 7/01/36 | | 10,335,000 | | 9,727,922 |
| Puerto Rico Electric Power Authority Power Revenue, | | | | |
| Series TT, 5.00%, 7/01/37 | | 3,000,000 | | 2,563,020 |
| Series WW, 5.50%, 7/01/38 | | 3,350,000 | | 3,051,448 |
| Series XX, 5.25%, 7/01/40 | | 7,500,000 | | 6,550,050 |
| Puerto Rico PBA Guaranteed Revenue, Government Facilities, | | | | |
| Refunding, Series D, 5.25%, 7/01/27 | | 760,000 | | 750,105 |
| Refunding, Series G, 5.00%, 7/01/26 | | 1,000,000 | | 977,940 |
| Series D, Pre-Refunded, 5.25%, 7/01/27 | | 2,305,000 | | 2,444,614 |
| Puerto Rico Sales Tax FICO Sales Tax Revenue, first sub., Series A, | | | | |
| 5.75%, 8/01/37 | | 2,000,000 | | 1,981,120 |
| 5.375%, 8/01/39 | | 1,500,000 | | 1,378,515 |
| 6.00%, 8/01/42 | | 8,500,000 | | 8,516,150 |
| Total U.S. Territories | | | | 49,964,488 |
| Total Municipal Bonds (Cost $281,831,348) 98.5% | | | | 270,102,778 |
| Other Assets, less Liabilities 1.5% | | | | 4,104,771 |
| Net Assets 100.0% | | | $ | 274,207,549 |
See Abbreviations on page 180.
aSecurity has been deemed illiquid because it may not be able to be sold within seven days. At February 28, 2011, the value of this security was $1,234,860, representing 0.45% of net assets.
90 | The accompanying notes are an integral part of these financial statements. | Annual Report
| | | | | | | | | | | | | | | | |
| Franklin Tax-Free Trust | | | | | | | | | | | | | |
| Financial Highlights | | | | | | | | | | | | | | | | |
| |
| Franklin Florida Tax-Free Income Fund | | | | | | | | | | | | | | | | |
| | | | | | | Year Ended February 28, | | | | |
| Class A | Class A | | 2011 | | | 2010 | | | 2009 | | | 2008 | a | | 2007 | |
| Per share operating performance | | | | | | | | | | | | | | | | |
| (for a share outstanding throughout the year) | | | | | | | | | | | | | | | | |
| Net asset value, beginning of year | | $ | 11.45 | | $ | 10.90 | | $ | 11.17 | | $ | 11.94 | | $ | 11.93 | |
| Income from investment operationsb: | | | | | | | | | | | | | | | | |
| Net investment incomec | | | 0.53 | | | 0.53 | | | 0.53 | | | 0.53 | | | 0.53 | |
| Net realized and unrealized gains (losses) | | | (0.37 | ) | | 0.55 | | | (0.27 | ) | | (0.74 | ) | | 0.02 | |
| Total from investment operations | | | 0.16 | | | 1.08 | | | 0.26 | | | (0.21 | ) | | 0.55 | |
| Less distributions from: | | | | | | | | | | | | | | | | |
| Net investment income | | | (0.53 | ) | | (0.53 | ) | | (0.52 | ) | | (0.53 | ) | | (0.54 | ) |
| Net realized gains | | | — | | | — | | | (0.01 | ) | | (0.03 | ) | | — | |
| Total distributions | | | (0.53 | ) | | (0.53 | ) | | (0.53 | ) | | (0.56 | ) | | (0.54 | ) |
| Redemption feesd | | | — | | | — | | | —e | | | —e | | | —e | |
| Net asset value, end of year | | $ | 11.08 | | $ | 11.45 | | $ | 10.90 | | $ | 11.17 | | $ | 11.94 | |
| |
| Total returnf | | | 1.38 | % | | 10.09 | % | | 2.37 | % | | (1.83 | )% | | 4.64 | % |
| |
| Ratios to average net assets | | | | | | | | | | | | | | | | |
| Expenses | | | 0.62 | % | | 0.62 | % | | 0.62 | % | | 0.61 | % | | 0.61 | % |
| Net investment income | | | 4.62 | % | | 4.74 | % | | 4.77 | % | | 4.51 | % | | 4.51 | % |
| |
| Supplemental data | | | | | | | | | | | | | | | | |
| Net assets, end of year (000’s) | | $ | 1,015,181 | | $ | 1,137,684 | | $ | 1,155,202 | | $ | 1,279,340 | | $ | 1,476,477 | |
| Portfolio turnover rate | | | 11.13 | % | | 9.22 | % | | 10.74 | % | | 6.85 | % | | 6.90 | % |
|
| aFor the year ended February 29. |
| bThe amount shown for a share outstanding throughout the period may not correlate with the Statement of Operations for the period due to the timing of sales and repurchases of |
| the Fund shares in relation to income earned and/or fluctuating market value of the investments of the Fund. |
| cBased on average daily shares outstanding. |
| dEffective September 1, 2008, the redemption fee was eliminated. |
| eAmount rounds to less than $0.01 per share. |
| fTotal return does not reflect sales commissions or contingent deferred sales charges, if applicable. |
Annual Report | The accompanying notes are an integral part of these financial statements. | 91
| | | | | | | | | | | | | | | |
| Franklin Tax-Free Trust | | | | | | | | | | | | | | | |
| Financial Highlights (continued) | | | | | | | | | | | | | | | |
| |
| Franklin Florida Tax-Free Income Fund | | | | | | | | | | | | | | | |
| | | | | | Year Ended February 28, | | | | |
| Class B | | 2011 | | | 2010 | | | 2009 | | | 2008 | a | | 2007 | |
| Per share operating performance | | | | | | | | | | | | | | | |
| (for a share outstanding throughout the year) | | | | | | | | | | | | | | | |
| Net asset value, beginning of year | $ | 11.55 | | $ | 10.99 | | $ | 11.25 | | $ | 12.02 | | $ | 12.01 | |
| Income from investment operationsb: | | | | | | | | | | | | | | | |
| Net investment incomec | | 0.47 | | | 0.48 | | | 0.47 | | | 0.47 | | | 0.47 | |
| Net realized and unrealized gains (losses) | | (0.38 | ) | | 0.55 | | | (0.26 | ) | | (0.75 | ) | | 0.01 | |
| Total from investment operations | | 0.09 | | | 1.03 | | | 0.21 | | | (0.28 | ) | | 0.48 | |
| Less distributions from: | | | | | | | | | | | | | | | |
| Net investment income | | (0.47 | ) | | (0.47 | ) | | (0.46 | ) | | (0.46 | ) | | (0.47 | ) |
| Net realized gains | | — | | | — | | | (0.01 | ) | | (0.03 | ) | | — | |
| Total distributions | | (0.47 | ) | | (0.47 | ) | | (0.47 | ) | | (0.49 | ) | | (0.47 | ) |
| Redemption feesd | | — | | | — | | | —e | | | —e | | | —e | |
| Net asset value, end of year | $ | 11.17 | | $ | 11.55 | | $ | 10.99 | | $ | 11.25 | | $ | 12.02 | |
| |
| Total returnf | | 0.73 | % | | 9.50 | % | | 1.89 | % | | (2.43 | )% | | 4.12 | % |
| |
| Ratios to average net assets | | | | | | | | | | | | | | | |
| Expenses | | 1.17 | % | | 1.17 | % | | 1.17 | % | | 1.16 | % | | 1.16 | % |
| Net investment income | | 4.07 | % | | 4.19 | % | | 4.22 | % | | 3.96 | % | | 3.96 | % |
| |
| Supplemental data | | | | | | | | | | | | | | | |
| Net assets, end of year (000’s) | $ | 12,059 | | $ | 26,305 | | $ | 36,536 | | $ | 47,654 | | $ | 59,481 | |
| Portfolio turnover rate | | 11.13 | % | | 9.22 | % | | 10.74 | % | | 6.85 | % | | 6.90 | % |
|
| aFor the year ended February 29. |
| bThe amount shown for a share outstanding throughout the period may not correlate with the Statement of Operations for the period due to the timing of sales and repurchases of |
| the Fund shares in relation to income earned and/or fluctuating market value of the investments of the Fund. |
| cBased on average daily shares outstanding. |
| dEffective September 1, 2008, the redemption fee was eliminated. |
| eAmount rounds to less than $0.01 per share. |
| fTotal return does not reflect sales commissions or contingent deferred sales charges, if applicable. |
92 | The accompanying notes are an integral part of these financial statements. | Annual Report
| | | | | | | | | | | | | | | |
| Franklin Tax-Free Trust | | | | | | | | | | | | | | | |
| Financial Highlights (continued) | | | | | | | | | | | | | | | |
| |
| Franklin Florida Tax-Free Income Fund | | | | | | | | | | | | | | | |
| | | | | | Year Ended February 28, | | | | |
| Class C | | 2011 | | | 2010 | | | 2009 | | | 2008 | a | | 2007 | |
| Per share operating performance | | | | | | | | | | | | | | | |
| (for a share outstanding throughout the year) | | | | | | | | | | | | | | | |
| Net asset value, beginning of year | $ | 11.63 | | $ | 11.06 | | $ | 11.32 | | $ | 12.09 | | $ | 12.07 | |
| Income from investment operationsb: | | | | | | | | | | | | | | | |
| Net investment incomec | | 0.47 | | | 0.48 | | | 0.48 | | | 0.47 | | | 0.48 | |
| Net realized and unrealized gains (losses) | | (0.38 | ) | | 0.56 | | | (0.27 | ) | | (0.75 | ) | | 0.01 | |
| Total from investment operations | | 0.09 | | | 1.04 | | | 0.21 | | | (0.28 | ) | | 0.49 | |
| Less distributions from: | | | | | | | | | | | | | | | |
| Net investment income | | (0.47 | ) | | (0.47 | ) | | (0.46 | ) | | (0.46 | ) | | (0.47 | ) |
| Net realized gains | | — | | | — | | | (0.01 | ) | | (0.03 | ) | | — | |
| Total distributions | | (0.47 | ) | | (0.47 | ) | | (0.47 | ) | | (0.49 | ) | | (0.47 | ) |
| Redemption feesd | | — | | | — | | | —e | | | —e | | | —e | |
| Net asset value, end of year | $ | 11.25 | | $ | 11.63 | | $ | 11.06 | | $ | 11.32 | | $ | 12.09 | |
| |
| Total returnf | | 0.70 | % | | 9.53 | % | | 1.86 | % | | (2.41 | )% | | 4.18 | % |
| |
| Ratios to average net assets | | | | | | | | | | | | | | | |
| Expenses | | 1.17 | % | | 1.17 | % | | 1.17 | % | | 1.16 | % | | 1.15 | % |
| Net investment income | | 4.07 | % | | 4.19 | % | | 4.22 | % | | 3.96 | % | | 3.97 | % |
| |
| Supplemental data | | | | | | | | | | | | | | | |
| Net assets, end of year (000’s) | $ | 112,199 | | $ | 119,496 | | $ | 109,884 | | $ | 115,863 | | $ | 136,712 | |
| Portfolio turnover rate | | 11.13 | % | | 9.22 | % | | 10.74 | % | | 6.85 | % | | 6.90 | % |
|
| aFor the year ended February 29. |
| bThe amount shown for a share outstanding throughout the period may not correlate with the Statement of Operations for the period due to the timing of sales and repurchases of |
| the Fund shares in relation to income earned and/or fluctuating market value of the investments of the Fund. |
| cBased on average daily shares outstanding. |
| dEffective September 1, 2008, the redemption fee was eliminated. |
| eAmount rounds to less than $0.01 per share. |
| fTotal return does not reflect sales commissions or contingent deferred sales charges, if applicable. |
Annual Report | The accompanying notes are an integral part of these financial statements. | 93
| | | | |
| Franklin Tax-Free Trust | | | | |
| |
| Statement of Investments, February 28, 2011 | | | | |
| |
| |
| Franklin Florida Tax-Free Income Fund | | Principal Amount | | Value |
| Municipal Bonds 98.8% | | | | |
| Florida 90.3% | | | | |
| Alachua County Health Facilities Authority Health Facilities Revenue, Shands Healthcare | | | | |
| Project, | | | | |
| Refunding, Series D-1, 6.50%, 12/01/19 | $ | 1,215,000 | $ | 1,340,558 |
| Refunding, Series D-1, 6.75%, 12/01/22 | | 1,000,000 | | 1,085,730 |
| Series D-2, 6.75%, 12/01/30 | | 5,000,000 | | 5,241,600 |
| Alachua County School Board COP, AMBAC Insured, | | | | |
| 5.00%, 7/01/21 | | 1,000,000 | | 1,013,950 |
| Pre-Refunded, 5.00%, 7/01/21 | | 1,000,000 | | 1,025,300 |
| Brevard County Health Facilities Authority Health Care Facilities Revenue, Health First Inc. | | | | |
| Project, | | | | |
| 7.00%, 4/01/39 | | 2,000,000 | | 2,127,740 |
| NATL Insured, 5.00%, 4/01/26 | | 5,000,000 | | 4,745,800 |
| Brevard County School Board COP, Refunding, Series A, AMBAC Insured, 5.40%, 7/01/11 | | 4,415,000 | | 4,467,009 |
| Broward County Educational Facilities Authority Revenue, Educational Facilities, Nova | | | | |
| Southeastern University, Refunding, Series B, 5.60%, 4/01/29 | | 3,180,000 | | 2,961,057 |
| Broward County HFA, | | | | |
| MFHR, Bridgewater Place Apartments Project, Series A, 5.45%, 10/01/34 | | 3,000,000 | | 2,781,120 |
| MFHR, Cross Keys Apartments Project, Series A, 5.80%, 10/01/33 | | 1,980,000 | | 1,940,855 |
| MFHR, Cross Keys Apartments Project, Series A, 5.85%, 4/01/39 | | 5,730,000 | | 5,493,809 |
| MFHR, Stirling Apartments Phase II, Series A, 5.35%, 10/01/29 | | 990,000 | | 916,037 |
| MFHR, Stirling Apartments Phase II, Series A, 5.40%, 4/01/39 | | 1,980,000 | | 1,776,733 |
| SFMR, Refunding, Series B, FHA Insured, zero cpn., 4/01/29 | | 195,000 | | 56,205 |
| Broward County HFAR, Series D, GNMA Secured, 7.375%, 6/01/21 | | 40,000 | | 40,048 |
| Broward County School Board COP, Series A, AGMC Insured, 5.00%, 7/01/26 | | 21,500,000 | | 21,677,160 |
| Broward County Water and Sewer Utility Revenue, Series A, 5.25%, 10/01/34 | | 2,200,000 | | 2,224,574 |
| Celebration CDD, Special Assessment, Series A, NATL Insured, 5.50%, 5/01/18 | | 1,095,000 | | 1,098,570 |
| Citizens Property Insurance Corp. Revenue, High-Risk Account, Senior Secured, Series A-1, | | | | |
| 6.00%, 6/01/17 | | 5,000,000 | | 5,452,200 |
| Citrus County Hospital Board Revenue, Citrus Memorial Hospital, Refunding, 6.25%, | | | | |
| 8/15/23 | | 8,115,000 | | 7,990,759 |
| Clearwater Water and Sewer Revenue, Series A, 5.25%, 12/01/39 | | 2,000,000 | | 2,005,400 |
| Crossing at Fleming Island CDD, Florida Special Assessment Revenue, Refunding, Series B, | | | | |
| NATL Insured, 5.80%, 5/01/16 | | 5,980,000 | | 5,987,116 |
| Dade County Aviation Revenue, Miami International Airport, Series C, AGMC Insured, 5.125%, | | | | |
| 10/01/27 | | 9,550,000 | | 9,552,197 |
| Duval County School Board COP, Master Lease Program, Series A, Assured Guaranty, 5.25%, | | | | |
| 7/01/35 | | 10,000,000 | | 9,653,100 |
| Enterprise CDD, Water and Sewer Revenue, NATL Insured, 5.50%, 5/01/26 | | 3,000,000 | | 3,019,110 |
| Escambia County Health Facilities Authority Health Facility Revenue, Baptist Hospital Inc. | | | | |
| Project, Series A, 6.00%, 8/15/36 | | 11,000,000 | | 10,140,350 |
| Escambia County HFA Dormitory Revenue, University of West Florida Foundation Inc. Project, | | | | |
| Refunding, NATL Insured, 5.00%, 6/01/31 | | 6,580,000 | | 5,538,386 |
| Florida HFAR, | | | | |
| Homeowner Mortgage, Series 1, NATL Insured, 5.625%, 7/01/17 | | 1,160,000 | | 1,161,276 |
| Reserve at Kanapaha, Series G, AMBAC Insured, 5.70%, 7/01/37 | | 5,000,000 | | 4,986,050 |
| Reserve at Northshore, Series H, AMBAC Insured, 5.70%, 5/01/37 | | 2,000,000 | | 1,994,440 |
94 | Annual Report
| | | | |
| Franklin Tax-Free Trust | | | | |
| |
| Statement of Investments, February 28, 2011 (continued) | | | | |
| |
| |
| Franklin Florida Tax-Free Income Fund | | Principal Amount | | Value |
| Municipal Bonds (continued) | | | | |
| Florida (continued) | | | | |
| Florida HFC Revenue, | | | | |
| Brenwood Trace Apartments, Series E-1, AGMC Insured, 5.65%, 6/01/19 | $ | 1,220,000 | $ | 1,226,063 |
| Brenwood Trace Apartments, Series E-1, AGMC Insured, 5.80%, 12/01/38 | | 4,860,000 | | 4,861,701 |
| Capital Appreciation, Homeowner Mortgage, Series 4, AGMC Insured, zero cpn., | | | | |
| 7/01/30 | | 1,575,000 | | 421,565 |
| Deer Meadows Apartments, Series R, FNMA Insured, 6.00%, 5/01/32 | | 3,415,000 | | 3,431,597 |
| Deferred Interest, Homeowner Mortgage, Series 1, NATL Insured, zero cpn., 7/01/17 | | 825,000 | | 576,667 |
| Deferred Interest, Homeowner Mortgage, Series 2, NATL Insured, zero cpn., 1/01/29 | | 8,290,000 | | 2,985,726 |
| Homeowner Mortgage, Series 4, AGMC Insured, 6.25%, 7/01/22 | | 1,030,000 | | 1,030,700 |
| Homeowner Mortgage, Series 4, GNMA Secured, 6.375%, 7/01/38 | | 3,935,000 | | 4,063,399 |
| Housing-Waverly Apartments, Series C-1, AGMC Insured, 6.50%, 7/01/40 | | 3,000,000 | | 3,029,580 |
| Florida Higher Educational Facilities Financing Authority Revenue, | | | | |
| Bethune Cookman University, Refunding, 5.375%, 7/01/32 | | 3,500,000 | | 3,352,020 |
| Nova Southeastern University, 6.375%, 4/01/31 | | 2,750,000 | | 2,745,188 |
| Rollins College Project, 5.00%, 12/01/37 | | 10,000,000 | | 9,342,800 |
| Florida Intergovernmental Finance Commission Capital Revenue, Series C-1, AMBAC Insured, | | | | |
| 5.00%, 2/01/21 | | 1,355,000 | | 1,358,171 |
| Florida Ports Financing Commission Revenue, State Transportation Trust Fund, Intermodal | | | | |
| Program, NATL RE, FGIC Insured, 5.50%, 10/01/23 | | 7,000,000 | | 7,045,220 |
| Florida State Board of Education Capital Outlay GO, Public Education, Refunding, | | | | |
| Series D, 6.00%, 6/01/23 | | 15,000,000 | | 18,271,950 |
| Series G, NATL RE, FGIC Insured, 5.00%, 6/01/31 | | 5,000,000 | | 5,031,250 |
| Florida State Board of Education GO, | | | | |
| Series A, 5.50%, 6/01/38 | | 10,000,000 | | 10,347,300 |
| Series F, NATL Insured, 5.00%, 6/01/28 | | 14,405,000 | | 14,673,221 |
| Florida State Board of Education Lottery Revenue, Series A, NATL RE, FGIC Insured, 5.00%, | | | | |
| 7/01/20 | | 6,000,000 | | 6,398,940 |
| Florida State Department of Environmental Protection Preservation Revenue, Florida Forever, | | | | |
| Series A, NATL Insured, 5.00%, 7/01/21 | | 4,000,000 | | 4,159,240 |
| Florida State Governmental Utility Authority Utility Revenue, Lehigh Utility System, Refunding, | | | | |
| 5.25%, 10/01/40 | | 5,000,000 | | 4,646,250 |
| Florida State Mid-Bay Bridge Authority Revenue, | | | | |
| Exchangeable, Refunding, Series D, 6.10%, 10/01/22 | | 7,485,000 | | 7,518,383 |
| Exchangeable, Series A, 5.95%, 10/01/13 | | 1,635,000 | | 1,635,670 |
| Exchangeable, Series D, ETM, 6.10%, 10/01/22 | | 3,545,000 | | 4,316,569 |
| Series A, AMBAC Insured, Pre-Refunded, zero cpn., 10/01/25 | | 9,845,000 | | 5,446,648 |
| Series A, AMBAC Insured, Pre-Refunded, zero cpn., 10/01/26 | | 2,500,000 | | 1,310,050 |
| Series A, ETM, 6.875%, 10/01/22 | | 6,000,000 | | 7,833,480 |
| Florida State Municipal Power Agency Revenue, | | | | |
| All Requirements Power Supply Project, Series A, 5.00%, 10/01/31 | | 6,000,000 | | 5,931,360 |
| All Requirements Power Supply Project, Series A, 6.25%, 10/01/31 | | 2,000,000 | | 2,159,540 |
| Stanton II Project, Refunding, AMBAC Insured, 5.00%, 10/01/26 | | 5,000,000 | | 5,027,650 |
| Stanton Project, Refunding, 5.50%, 10/01/19 | | 1,000,000 | | 1,122,640 |
| Florida State Turnpike Authority Turnpike Revenue, Department of Transportation, Refunding, | | | | |
| Series A, 5.00%, 7/01/35 | | 5,000,000 | | 4,855,750 |
| Fort Lauderdale Water and Sewer Revenue, | | | | |
| 5.00%, 9/01/35 | | 24,090,000 | | 24,209,245 |
| NATL Insured, 5.00%, 9/01/31 | | 8,315,000 | | 8,462,758 |
Annual Report | 95
| | | | | |
| | Franklin Tax-Free Trust | | | | |
| |
| | Statement of Investments, February 28, 2011 (continued) | | | | |
| |
| |
| | Franklin Florida Tax-Free Income Fund | | Principal Amount | | Value |
| | Municipal Bonds (continued) | | | | |
| | Florida (continued) | | | | |
| | Fort Pierce Capital Improvement Revenue, Refunding, Series A, Assured Guaranty, 6.00%, | | | | |
| | 9/01/32 | $ | 1,500,000 | $ | 1,585,125 |
| | Fort Pierce Utilities Authority Revenue, | | | | |
| | AMBAC Insured, 5.00%, 10/01/27 | | 7,000,000 | | 7,061,880 |
| | Capital Appreciation, Series B, AMBAC Insured, zero cpn., 10/01/20 | | 3,090,000 | | 1,971,018 |
| | Capital Appreciation, Series B, AMBAC Insured, zero cpn., 10/01/21 | | 2,585,000 | | 1,566,769 |
| | Capital Appreciation, Series B, AMBAC Insured, zero cpn., 10/01/22 | | 3,090,000 | | 1,762,196 |
| | Capital Appreciation, Series B, AMBAC Insured, zero cpn., 10/01/23 | | 3,060,000 | | 1,644,199 |
| | Capital Appreciation, Series B, AMBAC Insured, zero cpn., 10/01/24 | | 2,560,000 | | 1,293,747 |
| | Greater Orlando Aviation Authority Orlando Airport Facilities Revenue, | | | | |
| | Refunding, Series C, 5.00%, 10/01/39 | | 4,250,000 | | 3,986,075 |
| | Series A, 5.00%, 10/01/39 | | 5,000,000 | | 4,752,050 |
| | Halifax Hospital Medical Center Hospital Revenue, | | | | |
| | Refunding and Improvement, Series A, 5.00%, 6/01/38 | | 11,395,000 | | 9,580,118 |
| | Series B-1, AGMC Insured, 5.50%, 6/01/38 | | 10,000,000 | | 9,447,200 |
| | Hernando County School Board COP, NATL Insured, 5.00%, 7/01/35 | | 10,000,000 | | 8,933,000 |
| | Hialeah Housing Authority Revenue, Affordable Housing Program, Refunding, GNMA Secured, | | | | |
| | 5.30%, 12/20/18 | | 1,045,000 | | 1,049,420 |
| | Highlands County Health Facilities Authority Revenue, Adventist Health Systems, Series A, | | | | |
| Pre | -Refunded, 6.00%, 11/15/31 | | 16,000,000 | | 16,771,200 |
| | Hillsborough County Assessment Revenue, Capacity Assessment Special, AGMC Insured, | | | | |
| | 5.125%, 3/01/20 | | 1,000,000 | | 1,004,280 |
| | Hillsborough County Aviation Authority Revenue, Series B, Assured Guaranty, 5.00%, | | | | |
| | 10/01/33 | | 5,465,000 | | 5,348,978 |
| | 10/01/38 | | 6,725,000 | | 6,359,564 |
| | Hillsborough County IDA, PCR, Tampa Electric Co. Project, | | | | |
| | Refunding, 5.50%, 10/01/23 | | 16,000,000 | | 16,104,800 |
| | Series A, 5.65%, 5/15/18 | | 6,500,000 | | 7,197,190 |
| | Hillsborough County IDAR, Tampa General Hospital Project, Refunding, Series B, 5.40%, | | | | |
| | 10/01/28 | | 7,000,000 | | 6,589,940 |
| | Hillsborough County School Board COP, Master Lease Program, Series B, NATL Insured, | | | | |
| | 5.00%, 7/01/29 | | 10,000,000 | | 9,904,600 |
| | Jacksonville Capital Improvement Revenue, | | | | |
| | Refunding, Series C, AMBAC Insured, 5.00%, 10/01/25 | | 3,460,000 | | 3,503,838 |
| | Series A, AMBAC Insured, 5.00%, 10/01/30 | | 10,000,000 | | 10,016,100 |
| | Jacksonville Guaranteed Entitlement Revenue, Refunding and Improvement, NATL RE, | | | | |
| | FGIC Insured, 5.00%, 10/01/32 | | 17,250,000 | | 17,025,232 |
| | Jacksonville Sales Tax Revenue, AMBAC Insured, 5.00%, 10/01/23 | | 5,000,000 | | 5,058,750 |
| | Jacksonville Transportation Revenue, NATL Insured, | | | | |
| | 5.25%, 10/01/29 | | 17,955,000 | | 18,276,754 |
| | 5.00%, 10/01/31 | | 25,000,000 | | 24,808,500 |
| | Kissimmee Water and Sewer Revenue, AMBAC Insured, ETM, 6.00%, 10/01/15 | | 5,000,000 | | 5,017,550 |
| | Lake County School Board COP, Series A, AMBAC Insured, 5.00%, 6/01/30 | | 5,000,000 | | 4,767,800 |
| | Lakeland Electric and Water Revenue, Capital Appreciation, ETM, zero cpn., 10/01/14 | | 5,770,000 | | 5,448,265 |
| | Lakeland Hospital System Revenue, Lakeland Regional Health System, Pre-Refunded, | | | | |
| | 5.75%, 11/15/27 | | 6,925,000 | | 7,582,044 |
| | 5.50%, 11/15/32 | | 12,070,000 | | 13,164,387 |
96 | Annual Report
| | | | |
| Franklin Tax-Free Trust | | | | |
| |
| Statement of Investments, February 28, 2011 (continued) | | | | |
| |
| |
| Franklin Florida Tax-Free Income Fund | | Principal Amount | | Value |
| Municipal Bonds (continued) | | | | |
| Florida (continued) | | | | |
| Lee County Airport Revenue, | | | | |
| Refunding, AGMC Insured, 5.00%, 10/01/33 | $ | 5,000,000 | $ | 4,689,550 |
| Series A, AGMC Insured, 6.00%, 10/01/32 | | 11,405,000 | | 11,486,090 |
| Leesburg Hospital Revenue, Leesburg Regional Medical Center Project, 5.50%, 7/01/32 | | 4,150,000 | | 3,749,484 |
| Marion County Utility System Revenue, | | | | |
| NATL RE, FGIC Insured, 5.00%, 12/01/31 | | 5,000,000 | | 4,980,450 |
| Series A, NATL Insured, 5.00%, 12/01/28 | | 5,000,000 | | 5,068,700 |
| Melbourne Water and Sewer Revenue, Capital Appreciation, | | | | |
| FGIC Insured, ETM, zero cpn., 10/01/26 | | 1,500,000 | | 748,800 |
| Refunding, Series B, NATL RE, FGIC Insured, zero cpn., 10/01/22 | | 1,785,000 | | 955,635 |
| Refunding, Series B, NATL RE, FGIC Insured, zero cpn., 10/01/26 | | 4,500,000 | | 1,816,245 |
| Miami Beach Water and Sewer Revenue, AMBAC Insured, 5.00%, 9/01/30 | | 7,000,000 | | 7,000,000 |
| Miami Parking System Revenue, Refunding, Assured Guaranty, 5.00%, 10/01/39 | | 4,000,000 | | 3,829,880 |
| Miami Special Obligation, Marlins Stadium Project, Series A, AGMC Insured, 5.25%, | | | | |
| 7/01/35 | | 5,000,000 | | 4,749,550 |
| Miami Special Obligation Revenue, 5.625%, 1/01/39 | | 15,000,000 | | 14,418,300 |
| Miami-Dade County Aviation Revenue, Miami International Airport, | | | | |
| Hub of the Americas, Refunding, NATL RE, FGIC Insured, 5.375%, 10/01/27 | | 5,000,000 | | 4,916,350 |
| Hub of the Americas, Refunding, NATL RE, FGIC Insured, 5.375%, 10/01/32 | | 5,000,000 | | 4,704,900 |
| Hub of the Americas, Refunding, Series A, XLCA Insured, 5.00%, 10/01/37 | | 10,000,000 | | 8,247,700 |
| Refunding, Series A, 5.375%, 10/01/35 | | 7,500,000 | | 7,150,875 |
| Refunding, Series A, 5.50%, 10/01/36 | | 5,000,000 | | 4,826,850 |
| Miami-Dade County Expressway Authority Toll System Revenue, Series A, 5.00%, 7/01/40 | | 5,770,000 | | 5,304,765 |
| Miami-Dade County GO, Building Better Communities Program, Series B-1, 5.75%, | | | | |
| 7/01/33 | | 5,000,000 | | 5,271,200 |
| Miami-Dade County Health Facilities Authority Hospital Revenue, Miami Children’s Hospital, | | | | |
| Refunding, Series A, 6.125%, 8/01/42 | | 4,000,000 | | 3,915,160 |
| Miami-Dade County HFA, MFMR, Villa Esperanza Apartments Project, | | | | |
| 5.25%, 10/01/19 | | 425,000 | | 425,026 |
| 5.40%, 10/01/33 | | 1,490,000 | | 1,330,376 |
| Miami-Dade County Public Facilities Revenue, Jackson Health System, Series A, | | | | |
| NATL Insured, 5.00%, 6/01/35 | | 10,000,000 | | 8,675,900 |
| Miami-Dade County School Board COP, Assured Guaranty, 5.375%, 2/01/34 | | 5,000,000 | | 4,830,500 |
| Miami-Dade County Special Obligation Revenue, | | | | |
| Juvenile Courthouse Project, Series A, AMBAC Insured, 5.00%, 4/01/35 | | 5,000,000 | | 4,545,450 |
| sub. bond, Series B, NATL Insured, zero cpn., 10/01/36 | | 5,635,000 | | 913,828 |
| sub. bond, Series C, NATL Insured, zero cpn., 10/01/28 | | 8,305,000 | | 2,753,606 |
| sub. lien, Refunding, Series A, NATL Insured, zero cpn., 10/01/25 | | 22,365,000 | | 8,902,165 |
| Miami-Dade County Water and Sewer Revenue, AGMC Insured, 5.00%, 10/01/39 | | 10,000,000 | | 9,076,800 |
| North Sumter County Utility Dependent District Utility Revenue, 5.75%, 10/01/43 | | 5,000,000 | | 4,653,600 |
| Okaloosa County Water and Sewer Revenue, Refunding, AGMC Insured, 5.00%, 7/01/36 | | 10,000,000 | | 9,664,800 |
| Orange County Health Facilities Authority Revenue, Hospital, | | | | |
| Adventist Health System Inc., Pre-Refunded, 6.25%, 11/15/24 | | 5,500,000 | | 6,004,075 |
| Adventist Health System Inc., Pre-Refunded, 5.625%, 11/15/32 | | 15,000,000 | | 16,364,700 |
| Orlando Regional Healthcare System, Pre-Refunded, 6.00%, 12/01/29 | | 6,000,000 | | 6,554,760 |
| Orlando Regional Healthcare System, Refunding, Series B, AGMC Insured, 5.00%, | | | | |
| 12/01/32 | | 5,000,000 | | 4,838,650 |
| Orlando Regional Healthcare System, Refunding, Series C, 5.25%, 10/01/35 | | 4,000,000 | | 3,525,400 |
| Orlando Regional Healthcare System, Series B, 5.125%, 11/15/39 | | 5,000,000 | | 4,248,900 |
| |
| | | | | Annual Report | 97 |
| | | | | |
| | Franklin Tax-Free Trust | | | | |
| |
| | Statement of Investments, February 28, 2011 (continued) | | | | |
| |
| |
| | Franklin Florida Tax-Free Income Fund | | Principal Amount | | Value |
| | Municipal Bonds (continued) | | | | |
| | Florida (continued) | | | | |
| | Orange County School Board COP, Series A, | | | | |
| | Assured Guaranty, 5.50%, 8/01/34 | $ | 10,000,000 | $ | 10,059,600 |
| | NATL Insured, 5.00%, 8/01/27 | | 12,000,000 | | 12,124,800 |
| | Orange County Tourist Development Tax Revenue, Refunding, XLCA Insured, 5.00%, | | | | |
| | 10/01/31 | | 10,000,000 | | 9,835,500 |
| | Orlando Tourist Development Tax Revenue, 6th Cent Contract Payments, senior bond, | | | | |
| | Series A, Assured Guaranty, 5.25%, 11/01/38 | | 16,740,000 | | 14,777,235 |
| | Orlando-Orange County Expressway Authority Revenue, | | | | |
| | senior lien, AMBAC Insured, ETM, 7.625%, 7/01/18 | | 265,000 | | 328,316 |
| | Series B, AMBAC Insured, 5.00%, 7/01/35 | | 6,135,000 | | 5,780,642 |
| | Series C, 5.00%, 7/01/40 | | 10,755,000 | | 9,900,085 |
| | Osceola County Tourist Development Tax Revenue, NATL RE, FGIC Insured, 5.00%, | | | | |
| | 10/01/32 | | 10,000,000 | | 9,869,700 |
| | Palm Beach County HFA, MFR, Housing Winsor Park Apartments Project, Series A, 5.90%, | | | | |
| | 6/01/38 | | 970,000 | | 943,024 |
| | Palm Beach County HFAR, ACTS Retirement-Life Communities, 5.125%, 11/15/29 | | 3,650,000 | | 3,193,203 |
| | Palm Beach County Public Improvement Revenue, 5.00%, 5/01/33 | | 1,000,000 | | 1,010,730 |
| | Palm Beach County Solid Waste Authority Revenue, Improvement, Series B, 5.50%, | | | | |
| | 10/01/25 | | 5,000,000 | | 5,327,750 |
| | Palm Beach County Water and Sewer Revenue, 5.00%, 10/01/40 | | 5,000,000 | | 4,944,950 |
| | Panama City Beach Utility Revenue, | | | | |
| | Assured Guaranty, 5.00%, 6/01/39 | | 5,000,000 | | 4,788,200 |
| | Refunding, AMBAC Insured, 5.00%, 6/01/27 | | 4,450,000 | | 4,479,682 |
| | Refunding, AMBAC Insured, 5.00%, 6/01/32 | | 2,795,000 | | 2,688,622 |
| | Pinellas County Health Facilities Authority Revenue, Baycare Health System, AGMC Insured, | | | | |
| | 5.00%, 11/15/30 | | 11,500,000 | | 11,511,730 |
| | Port St. Lucie Utility Revenue, System, | | | | |
| | Capital Appreciation, NATL Insured, Pre-Refunded, zero cpn., 9/01/29 | | 20,000,000 | | 6,971,000 |
| | Capital Appreciation, Refunding, Series A, NATL Insured, zero cpn., 9/01/32 | | 5,000,000 | | 1,314,450 |
| | Capital Appreciation, Refunding, Series A, NATL Insured, zero cpn., 9/01/33 | | 5,000,000 | | 1,212,400 |
| | Refunding, Assured Guaranty, 5.25%, 9/01/35 | | 2,000,000 | | 1,972,860 |
| | Refunding, Series A, NATL Insured, 5.00%, 9/01/30 | | 10,000,000 | | 10,076,400 |
| | Sarasota Special Obligation Revenue, Capital Appreciation, Refunding, AMBAC Insured, | | | | |
| | zero cpn., | | | | |
| | 11/01/12 | | 1,780,000 | | 1,715,333 |
| | 11/01/15 | | 2,180,000 | | 1,796,865 |
| | South Broward Hospital District Revenue, | | | | |
| Pre | -Refunded, 5.60%, 5/01/27 | | 5,000,000 | | 5,339,050 |
| Pre | -Refunded, 5.625%, 5/01/32 | | 11,250,000 | | 12,016,125 |
| | South Broward Hospital District Obligated Group, Refunding, 5.00%, 5/01/36 | | 7,000,000 | | 6,306,860 |
| | South Florida Water Management District COP, AMBAC Insured, 5.00%, 10/01/31 | | 12,050,000 | | 11,836,835 |
| | South Lake County Hospital District Revenue, South Lake Hospital Inc., Refunding, 5.25%, | | | | |
| | 10/01/34 | | 5,000,000 | | 4,491,350 |
| | St. Johns County Water and Sewer Revenue, Capital Appreciation, AMBAC Insured, zero cpn., | | | | |
| | 6/01/22 | | 4,000,000 | | 2,293,920 |
| | 6/01/23 | | 4,255,000 | | 2,289,616 |
| | 6/01/24 | | 1,500,000 | | 759,255 |
| | 6/01/25 | | 2,130,000 | | 1,013,561 |
98 | Annual Report
| | | | |
| Franklin Tax-Free Trust | | | | |
| |
| Statement of Investments, February 28, 2011 (continued) | | | | |
| |
| |
| Franklin Florida Tax-Free Income Fund | | Principal Amount | | Value |
| Municipal Bonds (continued) | | | | |
| Florida (continued) | | | | |
| St. Lucie West Services District Utility Revenue, senior lien, NATL Insured, 6.125%, | | | | |
| 10/01/32 | $ | 10,000,000 | $ | 10,171,200 |
| St. Petersburg Public Utilities Revenue, Series A, 5.00%, 10/01/36 | | 3,180,000 | | 3,161,683 |
| Sunrise Utilities System Revenue, | | | | |
| AMBAC Insured, ETM, 5.20%, 10/01/22 | | 1,050,000 | | 1,195,446 |
| Refunding, AMBAC Insured, 5.20%, 10/01/22 | | 1,500,000 | | 1,641,240 |
| Tamarac Sales Tax Revenue, NATL RE, FGIC Insured, Pre-Refunded, 5.00%, 4/01/22 | | 2,490,000 | | 2,613,330 |
| Tamarac Utility System Revenue, Refunding, Assured Guaranty, 5.00%, 10/01/39 | | 1,585,000 | | 1,540,319 |
| Tampa Bay Water Regional Water Supply Authority Utility System Revenue, 5.00%, | | | | |
| 10/01/34 | | 8,000,000 | | 8,070,000 |
| 10/01/38 | | 14,340,000 | | 14,275,613 |
| Tampa Bay Water Utility System Revenue, Series B, NATL RE, FGIC Insured, 5.00%, | | | | |
| 10/01/31 | | 10,000,000 | | 10,008,600 |
| Tampa Sports Authority Revenue, Guaranteed Package, Tampa Bay Arena Project, | | | | |
| NATL Insured, | | | | |
| 6.00%, 10/01/15 | | 1,000,000 | | 1,037,520 |
| 6.05%, 10/01/20 | | 1,715,000 | | 1,823,542 |
| 6.10%, 10/01/26 | | 2,695,000 | | 2,803,096 |
| Tampa Water and Sewer Revenue, sub. lien, Series A, AMBAC Insured, ETM, 7.25%, | | | | |
| 10/01/16 | | 1,105,000 | | 1,290,419 |
| Viera East CDD Special Assessment, | | | | |
| Refunding, 7.00%, 5/01/26 | | 6,050,000 | | 5,846,660 |
| Series B, ETM, 6.75%, 5/01/14 | | 3,030,000 | | 3,299,306 |
| Village Center CDD Recreational Revenue, Series A, NATL Insured, 5.20%, 11/01/25 | | 10,000,000 | | 8,662,700 |
| Volusia County Educational Facility Authority Revenue, Educational Facilities, Embry-Riddle | | | | |
| Aeronautical University Project, Refunding, Series B, AMBAC Insured, 5.25%, 10/15/22 | | 2,000,000 | | 1,989,580 |
| West Lake CDD, Special Assessment Revenue, NATL Insured, 5.75%, 5/01/17 | | 1,280,000 | | 1,263,603 |
| West Palm Beach CRDA Revenue, Northwood Pleasant Community Redevelopment, 5.00%, | | | | |
| 3/01/35 | | 1,000,000 | | 842,760 |
| Winter Park Water and Sewer Revenue, Improvement, Refunding, 5.00%, 12/01/34 | | 2,000,000 | | 1,972,480 |
| | | | | 1,028,522,865 |
| U.S. Territories 8.5% | | | | |
| Puerto Rico 7.7% | | | | |
| Puerto Rico Commonwealth Aqueduct and Sewer Authority Revenue, senior lien, Series A, | | | | |
| 6.00%, 7/01/44 | | 2,100,000 | | 1,952,034 |
| Puerto Rico Commonwealth GO, Public Improvement, | | | | |
| Refunding, Series B, 6.00%, 7/01/39 | | 15,000,000 | | 14,837,250 |
| Series A, 5.00%, 7/01/29 | | 10,000,000 | | 9,492,900 |
| Series A, 5.00%, 7/01/33 | | 5,000,000 | | 4,344,600 |
| Puerto Rico Commonwealth Highway and Transportation Authority Transportation Revenue, | | | | |
| Refunding, Series A, NATL Insured, 5.00%, 7/01/38 | | 560,000 | | 471,581 |
| Refunding, Series K, 5.00%, 7/01/30 | | 5,000,000 | | 4,543,750 |
| Series G, 5.00%, 7/01/33 | | 1,500,000 | | 1,311,660 |
| Puerto Rico Commonwealth Infrastructure Financing Authority Special Tax Revenue, 5.00%, | | | | |
| 7/01/46 | | 9,690,000 | | 7,653,259 |
| Puerto Rico Electric Power Authority Power Revenue, Series XX, 5.25%, 7/01/40 | | 11,250,000 | | 9,825,075 |
| Puerto Rico Industrial Tourist Educational Medical and Environmental Control Facilities | | | | |
| Revenue, Cogeneration Facility, AES Puerto Rico Project, 6.625%, 6/01/26 | | 5,900,000 | | 5,917,995 |
| |
| | | | | Annual Report | 99 |
| | | | |
| Franklin Tax-Free Trust | | | | |
| |
| Statement of Investments, February 28, 2011 (continued) | | | | |
| |
| |
| Franklin Florida Tax-Free Income Fund | | Principal Amount | | Value |
| Municipal Bonds (continued) | | | | |
| U.S. Territories (continued) | | | | |
| Puerto Rico (continued) | | | | |
| Puerto Rico PBA Guaranteed Revenue, Government Facilities, | | | | |
| Refunding, Series D, 5.375%, 7/01/33 | $ | 1,210,000 | $ | 1,134,472 |
| Series I, 5.00%, 7/01/36 | | 5,000,000 | | 4,237,950 |
| Puerto Rico Sales Tax FICO Sales Tax Revenue, first sub., | | | | |
| Series A, 6.00%, 8/01/42 | | 8,000,000 | | 8,015,200 |
| Series C, 5.50%, 8/01/40 | | 15,000,000 | | 14,027,550 |
| | | | | 87,765,276 |
| U.S. Virgin Islands 0.8% | | | | |
| Virgin Islands PFAR, Gross Receipts Taxes Loan Note, Radian Insured, 5.00%, 10/01/33 | | 10,000,000 | | 8,932,500 |
| |
| Total U.S. Territories | | | | 96,697,776 |
| Total Municipal Bonds before Short Term Investments | | | | |
| (Cost $1,127,852,923) | | | | 1,125,220,641 |
| Short Term Investments 0.1% | | | | |
| Municipal Bonds 0.1% | | | | |
| Florida 0.1% | | | | |
| aFlorida State Municipal Power Agency Revenue, All Requirements Power Supply Project, | | | | |
| Refunding, Series C, Daily VRDN and Put, 0.26%, 10/01/35 | | 1,000,000 | | 1,000,000 |
| aJacksonville Health Facilities Authority Hospital Revenue, Baptist Medical Center, Daily VRDN | | | | |
| and Put, 0.27%, 8/15/34 | | 300,000 | | 300,000 |
| Total Short Term Investments (Cost $1,300,000) | | | | 1,300,000 |
| Total Investments (Cost $1,129,152,923) 98.9% | | | | 1,126,520,641 |
| Other Assets, less Liabilities 1.1% | | | | 12,918,402 |
| Net Assets 100.0% | | | $ | 1,139,439,043 |
See Abbreviations on page 180.
aVariable rate demand notes (VRDNs) are tax-exempt obligations which contain a floating or variable interest rate adjustment formula and an unconditional right of demand to receive payment of the principal balance plus accrued interest at specified dates. The coupon rate shown represents the rate at period end.
100 | The accompanying notes are an integral part of these financial statements. | Annual Report
| | | | | | | | | | | | | | | |
| Franklin Tax-Free Trust | | | | | | | | | | | | | | | |
| Financial Highlights | | | | | | | | | | | | | | | |
| |
| Franklin Georgia Tax-Free Income Fund | | | | | | | | | | | | | | | |
| | | | | | Year Ended February 28, | | | | |
| Class A | | 2011 | | | 2010 | | | 2009 | | | 2008 | a | | 2007 | |
| Per share operating performance | | | | | | | | | | | | | | | |
| (for a share outstanding throughout the year) | | | | | | | | | | | | | | | |
| Net asset value, beginning of year | $ | 11.92 | | $ | 11.24 | | $ | 11.36 | | $ | 12.20 | | $ | 12.13 | |
| Income from investment operationsb: | | | | | | | | | | | | | | | |
| Net investment incomec | | 0.50 | | | 0.50 | | | 0.49 | | | 0.49 | | | 0.50 | |
| Net realized and unrealized gains (losses) | | (0.45 | ) | | 0.68 | | | (0.11 | ) | | (0.84 | ) | | 0.06 | |
| Total from investment operations | | 0.05 | | | 1.18 | | | 0.38 | | | (0.35 | ) | | 0.56 | |
| Less distributions from net investment income | | (0.50 | ) | | (0.50 | ) | | (0.50 | ) | | (0.49 | ) | | (0.49 | ) |
| Redemption feesd | | — | | | — | | | — | | | —e | | | —e | |
| Net asset value, end of year | $ | 11.47 | | $ | 11.92 | | $ | 11.24 | | $ | 11.36 | | $ | 12.20 | |
| |
| Total returnf | | 0.33 | % | | 10.66 | % | | 3.38 | % | | (2.97 | )% | | 4.79 | % |
| |
| Ratios to average net assets | | | | | | | | | | | | | | | |
| Expenses | | 0.67 | % | | 0.68 | % | | 0.69 | % | | 0.72 | % | | 0.73 | % |
| Net investment income | | 4.18 | % | | 4.27 | % | | 4.33 | % | | 4.10 | % | | 4.13 | % |
| |
| Supplemental data | | | | | | | | | | | | | | | |
| Net assets, end of year (000’s) | $ | 361,875 | | $ | 365,223 | | $ | 308,087 | | $ | 253,104 | | $ | 220,989 | |
| Portfolio turnover rate | | 9.09 | % | | 9.61 | % | | 9.61 | % | | 8.00 | % | | 4.50 | % |
|
| aFor the year ended February 29. |
| bThe amount shown for a share outstanding throughout the period may not correlate with the Statement of Operations for the period due to the timing of sales and repurchases of |
| the Fund shares in relation to income earned and/or fluctuating market value of the investments of the Fund. |
| cBased on average daily shares outstanding. |
| dEffective September 1, 2008, the redemption fee was eliminated. |
| eAmount rounds to less than $0.01 per share. |
| fTotal return does not reflect sales commissions or contingent deferred sales charges, if applicable. |
Annual Report | The accompanying notes are an integral part of these financial statements. | 101
| | | | | | | | | | | | | | | |
| Franklin Tax-Free Trust | | | | | | | | | | | | | | | |
| Financial Highlights (continued) | | | | | | | | | | | | | | | |
| |
| Franklin Georgia Tax-Free Income Fund | | | | | | | | | | | | | | | |
| | | | | | Year Ended February 28, | | | | |
| Class C | | 2011 | | | 2010 | | | 2009 | | | 2008 | a | | 2007 | |
| Per share operating performance | | | | | | | | | | | | | | | |
| (for a share outstanding throughout the year) | | | | | | | | | | | | | | | |
| Net asset value, beginning of year | $ | 12.05 | | $ | 11.35 | | $ | 11.47 | | $ | 12.31 | | $ | 12.24 | |
| Income from investment operationsb: | | | | | | | | | | | | | | | |
| Net investment incomec | | 0.44 | | | 0.44 | | | 0.43 | | | 0.43 | | | 0.44 | |
| Net realized and unrealized gains (losses) | | (0.46 | ) | | 0.69 | | | (0.11 | ) | | (0.84 | ) | | 0.06 | |
| Total from investment operations | | (0.02 | ) | | 1.13 | | | 0.32 | | | (0.41 | ) | | 0.50 | |
| Less distributions from net investment income | | (0.43 | ) | | (0.43 | ) | | (0.44 | ) | | (0.43 | ) | | (0.43 | ) |
| Redemption feesd | | — | | | — | | | — | | | —e | | | —e | |
| Net asset value, end of year | $ | 11.60 | | $ | 12.05 | | $ | 11.35 | | $ | 11.47 | | $ | 12.31 | |
| |
| Total returnf | | (0.24 | )% | | 10.14 | % | | 2.78 | % | | (3.48 | )% | | 4.16 | % |
| |
| Ratios to average net assets | | | | | | | | | | | | | | | |
| Expenses | | 1.22 | % | | 1.23 | % | | 1.24 | % | | 1.27 | % | | 1.28 | % |
| Net investment income | | 3.63 | % | | 3.72 | % | | 3.78 | % | | 3.55 | % | | 3.58 | % |
| |
| Supplemental data | | | | | | | | | | | | | | | |
| Net assets, end of year (000’s) | $ | 106,356 | | $ | 101,641 | | $ | 68,721 | | $ | 52,087 | | $ | 50,700 | |
| Portfolio turnover rate | | 9.09 | % | | 9.61 | % | | 9.61 | % | | 8.00 | % | | 4.50 | % |
|
| aFor the year ended February 29. |
| bThe amount shown for a share outstanding throughout the period may not correlate with the Statement of Operations for the period due to the timing of sales and repurchases of |
| the Fund shares in relation to income earned and/or fluctuating market value of the investments of the Fund. |
| cBased on average daily shares outstanding. |
| dEffective September 1, 2008, the redemption fee was eliminated. |
| eAmount rounds to less than $0.01 per share. |
| fTotal return does not reflect sales commissions or contingent deferred sales charges, if applicable. |
102 | The accompanying notes are an integral part of these financial statements. | Annual Report
| | | | |
| Franklin Tax-Free Trust | | | | |
| |
| Statement of Investments, February 28, 2011 | | | | |
| |
| |
| Franklin Georgia Tax-Free Income Fund | | Principal Amount | | Value |
| Municipal Bonds 98.8% | | | | |
| Georgia 91.9% | | | | |
| Athens-Clarke County Unified Government Water and Sewer Revenue, | | | | |
| 5.625%, 1/01/33 | $ | 10,000,000 | $ | 10,499,100 |
| 5.50%, 1/01/38 | | 5,000,000 | | 5,124,150 |
| Atlanta Airport Passenger Facility Charge Revenue, General, sub. lien, | | | | |
| Refunding, Series C, AGMC Insured, 5.00%, 1/01/33 | | 5,000,000 | | 4,947,250 |
| Series J, AGMC Insured, 5.00%, 1/01/34 | | 5,000,000 | | 4,893,050 |
| Atlanta Airport Revenue, General, | | | | |
| Refunding, Series C, 6.00%, 1/01/30 | | 6,000,000 | | 6,398,520 |
| Series A, 5.00%, 1/01/40 | | 9,000,000 | | 8,488,710 |
| Atlanta Development Authority Educational Facilities Revenue, Science Park LLC Project, | | | | |
| 5.00%, 7/01/32 | | 3,000,000 | | 2,797,500 |
| Atlanta Development Authority Revenue, Tuff Yamacraw LLC Project, Refunding, Series A, | | | | |
| AMBAC Insured, 5.00%, 1/01/26 | | 2,555,000 | | 2,379,497 |
| Atlanta GO, Refunding, Assured Guaranty, 5.25%, 12/01/23 | | 2,000,000 | | 2,169,000 |
| Atlanta Public Safety and Judicial Facilities Authority Revenue, Public Safety Facility Project, | | | | |
| AGMC Insured, 5.00%, 12/01/26 | | 1,140,000 | | 1,181,336 |
| Atlanta Tax Allocation, Atlantic State Project, Refunding, Assured Guaranty, 5.00%, | | | | |
| 12/01/23 | | 1,000,000 | | 1,002,760 |
| Atlanta Urban Residential Finance Authority MFHR, Fulton Cotton Mill, GNMA Secured, | | | | |
| 6.00%, 5/20/17 | | 710,000 | | 710,156 |
| 6.125%, 5/20/27 | | 1,560,000 | | 1,483,139 |
| Atlanta Water and Wastewater Revenue, | | | | |
| Refunding, Series A, 6.00%, 11/01/28 | | 5,055,000 | | 5,351,779 |
| Refunding, Series A, NATL Insured, 5.00%, 11/01/33 | | 8,000,000 | | 7,614,080 |
| Series A, AGMC Insured, 5.50%, 11/01/27 | | 5,000,000 | | 5,132,000 |
| Augusta Water and Sewer Revenue, | | | | |
| AGMC Insured, 5.25%, 10/01/39 | | 3,000,000 | | 3,013,440 |
| Refunding, AGMC Insured, 5.00%, 10/01/32 | | 5,000,000 | | 5,017,850 |
| Baldwin County Hospital Authority Revenue, Oconee Regional Medical Center, | | | | |
| 5.25%, 12/01/22 | | 2,500,000 | | 2,191,550 |
| 5.375%, 12/01/28 | | 2,000,000 | | 1,606,580 |
| Bartow County Development Authority PCR, Georgia Power Co., First Series, 5.10%, 6/01/23 | | 5,000,000 | | 5,111,900 |
| Bleckley-Dodge County Joint Development Authority Student Housing Facilities Revenue, | | | | |
| MGC Real Estate Foundation II LLC Project, 5.00%, 7/01/33 | | 3,500,000 | | 3,242,400 |
| Brunswick and Glynn County Joint Water and Sewer Commission Revenue, Refunding, Series C, | | | | |
| AGMC Insured, 5.00%, 6/01/33 | | 2,045,000 | | 2,064,448 |
| Bulloch County Development Authority Lease Revenue, Georgia Southern University, | | | | |
| XLCA Insured, 5.00%, 8/01/27 | | 5,000,000 | | 5,021,550 |
| Burke County Development Authority PCR, Oglethorpe Power Corp., Vogtle Project, | | | | |
| Series B, 5.50%, 1/01/33 | | 5,000,000 | | 4,974,450 |
| Series E, 7.00%, 1/01/23 | | 5,000,000 | | 5,664,600 |
| Camden County Public Service Authority Revenue, St. Mary’s Project, Refunding, 4.50%, | | | | |
| 12/01/31 | | 1,200,000 | | 1,140,840 |
| 12/01/32 | | 1,000,000 | | 927,970 |
| Carroll City-County Hospital Authority Revenue, Anticipation Certificates, Tanner Medical Center | | | | |
| Inc. Project, | | | | |
| 5.00%, 7/01/40 | | 5,000,000 | | 4,530,850 |
| Assured Guaranty, 5.00%, 7/01/38 | | 5,000,000 | | 4,668,300 |
Annual Report | 103
| | | | |
| Franklin Tax-Free Trust | | | | |
| |
| Statement of Investments, February 28, 2011 (continued) | | | | |
| |
| |
| Franklin Georgia Tax-Free Income Fund | | Principal Amount | | Value |
| Municipal Bonds (continued) | | | | |
| Georgia (continued) | | | | |
| Cherokee County Water and Sewer Authority Revenue, | | | | |
| AGMC Insured, 5.00%, 8/01/35 | $ | 3,000,000 | $ | 3,005,400 |
| NATL Insured, 6.90%, 8/01/18 | | 10,000 | | 10,041 |
| Water and Sewer, Refunding, 5.00%, 8/01/28 | | 2,030,000 | | 2,145,406 |
| Clayton County Development Authority Revenue, Refunding, Series A, NATL Insured, 5.00%, | | | | |
| 8/01/23 | | 2,310,000 | | 2,437,859 |
| Clayton County Hospital Authority Revenue, Anticipation Certificates, Southern Regional Medical | | | | |
| Center, Refunding, Series A, | | | | |
| 5.00%, 8/01/30 | | 2,000,000 | | 1,977,880 |
| 5.25%, 8/01/35 | | 1,000,000 | | 970,500 |
| Clayton County MFHR, Pointe Clear Apartments Project, AGMC Insured, 5.70%, 7/01/23 | | 930,000 | | 930,353 |
| Cobb County Development Authority University Facilities Revenue, Kennesaw State University | | | | |
| Foundations Project, Series D, NATL Insured, 5.00%, 7/15/29 | | 5,000,000 | | 4,530,300 |
| Columbia County Water and Sewer Revenue, | | | | |
| AGMC Insured, Pre-Refunded, 5.00%, 6/01/24 | | 1,010,000 | | 1,133,129 |
| Refunding, 4.50%, 6/01/33 | | 4,015,000 | | 3,728,811 |
| Refunding, AGMC Insured, 5.00%, 6/01/24 | | 120,000 | | 125,732 |
| Columbus Water and Sewer Revenue, AGMC Insured, 5.00%, 5/01/29 | | 2,500,000 | | 2,548,775 |
| Coweta County Development Authority Revenue, Piedmont Healthcare Project, 5.00%, | | | | |
| 6/15/40 | | 5,000,000 | | 4,359,700 |
| Dahlonega Water and Wastewater Revenue, Series A, Assured Guaranty, | | | | |
| 5.25%, 9/01/30 | | 1,750,000 | | 1,737,330 |
| 5.50%, 9/01/37 | | 5,000,000 | | 5,027,400 |
| Decatur County School Building Authority Revenue, High School Project, AGMC Insured, 5.00%, | | | | |
| 10/01/32 | | 1,500,000 | | 1,490,145 |
| DeKalb County Public Safety and Judicial Facilities Authority Revenue, Public Safety and | | | | |
| Judicial Facility Project, 5.00%, 12/01/29 | | 2,000,000 | | 2,040,880 |
| DeKalb County School District COP, Georgia School Boards Assn. Inc., AMBAC Insured, 5.00%, | | | | |
| 12/01/27 | | 4,285,000 | | 4,411,793 |
| DeKalb County Water and Sewer Revenue, Refunding, Series B, AGMC Insured, 5.00%, | | | | |
| 10/01/35 | | 4,000,000 | | 4,069,280 |
| DeKalb Newton and Gwinnett Counties Joint Development Authority Revenue, Georgia Gwinnett | | | | |
| College Student Centre LLC Project, 5.50%, 7/01/34 | | 3,000,000 | | 2,745,960 |
| DeKalb Private Hospital Authority Revenue Anticipation Certificates, Children’s Healthcare, | | | | |
| Refunding, 5.25%, 11/15/39 | | 5,000,000 | | 4,883,650 |
| Douglasville-Douglas County Water and Sewer Authority Revenue, NATL Insured, 5.00%, | | | | |
| 6/01/29 | | 3,410,000 | | 3,471,687 |
| 6/01/32 | | 2,225,000 | | 2,246,204 |
| East Point Building Authority Revenue, Water and Sewer Project, Series A, XLCA Insured, | | | | |
| 5.00%, 2/01/34 | | 5,480,000 | | 4,186,556 |
| Fayette County PFAR, Criminal Justice Center Project, Refunding, 5.00%, 6/01/26 | | 3,000,000 | | 3,036,900 |
| Fayette County School District GO, AGMC Insured, | | | | |
| 4.75%, 3/01/21 | | 1,355,000 | | 1,429,457 |
| 4.95%, 3/01/25 | | 1,000,000 | | 1,032,560 |
| Forsyth County Water and Sewerage Authority Revenue, AGMC Insured, 5.00%, 4/01/32 | | 5,000,000 | | 5,134,150 |
| Fulton County Development Authority Revenue, | | | | |
| Georgia Tech Facilities Project, Series A, 5.00%, 6/01/41 | | 3,500,000 | | 3,446,065 |
| Georgia Tech Foundation Funding, Series A, 5.00%, 11/01/31 | | 3,000,000 | | 3,014,580 |
104 | Annual Report
| | | | |
| Franklin Tax-Free Trust | | | | |
| |
| Statement of Investments, February 28, 2011 (continued) | | | | |
| |
| |
| Franklin Georgia Tax-Free Income Fund | | Principal Amount | | Value |
| Municipal Bonds (continued) | | | | |
| Georgia (continued) | | | | |
| Fulton County Development Authority Revenue, (continued) | | | | |
| Georgia Tech Foundation Funding SAC II Project, Series A, 5.25%, 11/01/30 | $ | 5,000,000 | $ | 5,072,250 |
| Georgia Tech Foundation Inc., Series A, 5.00%, 11/01/27 | | 1,060,000 | | 1,132,886 |
| Georgia Tech Foundation Inc., Series A, 5.00%, 11/01/28 | | 1,200,000 | | 1,273,512 |
| Molecular Science Building Project, NATL Insured, 5.00%, 5/01/25 | | 2,240,000 | | 2,336,208 |
| Morehouse College Project, Refunding, AMBAC Insured, 5.00%, 12/01/27 | | 5,000,000 | | 5,033,750 |
| Piedmont Healthcare, Refunding, Series A, 5.25%, 6/15/37 | | 5,000,000 | | 4,605,650 |
| Tech Facilities Project, Refunding, Series A, 5.00%, 6/01/34 | | 4,000,000 | | 3,994,240 |
| Fulton County Water and Sewer Revenue, NATL RE, FGIC Insured, 5.00%, 1/01/30 | | 2,500,000 | | 2,520,800 |
| Gainesville and Hall County Hospital Authority Revenue, Anticipation Certificates, | | | | |
| Northeast Georgia Health System Inc. Project, Pre-Refunded, 5.50%, 5/15/31 | | 2,500,000 | | 2,525,700 |
| Northeast Georgia Healthcare Project, Series A, 5.375%, 2/15/40 | | 5,000,000 | | 4,553,950 |
| Georgia Municipal Assn. Inc. COP, City Court Atlanta Project, AMBAC Insured, 5.25%, | | | | |
| 12/01/26 | | 2,000,000 | | 1,953,780 |
| Georgia Municipal Electric Authority Power Revenue, Series W, | | | | |
| 6.60%, 1/01/18 | | 955,000 | | 1,089,512 |
| ETM, 6.60%, 1/01/18 | | 45,000 | | 50,325 |
| Georgia Municipal Gas Authority Gas Revenue, City of Toccoa Project, AMBAC Insured, 5.00%, | | | | |
| 6/01/24 | | 1,000,000 | | 1,000,800 |
| Georgia Private Colleges and Universities Authority Student Housing Revenue, Mercer Housing | | | | |
| Corp. Project, Series A, 6.00%, 6/01/24 | | 2,550,000 | | 2,472,786 |
| Georgia School Board Assn. Inc. COP, DeKalb County Public School Project, NATL Insured, | | | | |
| 5.00%, 12/01/25 | | 2,600,000 | | 2,528,448 |
| Georgia State GO, Series B, 5.00%, 7/01/28 | | 3,225,000 | | 3,434,238 |
| Georgia State HFAR, | | | | |
| MF, Lake Vista Apartments Project, Series A, AGMC Insured, 5.95%, 1/01/27 | | 1,000,000 | | 1,000,700 |
| SFM, Series A, 5.375%, 6/01/39 | | 1,950,000 | | 1,959,380 |
| SFM, Series C, 5.00%, 12/01/27 | | 1,000,000 | | 998,800 |
| Georgia State Higher Education Facilities Authority Revenue, USG Real Estate Foundation I LLC | | | | |
| Project, | | | | |
| 6.00%, 6/15/34 | | 5,000,000 | | 5,208,750 |
| Assured Guaranty, 5.625%, 6/15/38 | | 3,000,000 | | 3,032,730 |
| Glynn-Brunswick Memorial Hospital Authority Revenue, Anticipation Certificates, Southeast | | | | |
| Georgia Health System Project, Series A, 5.625%, 8/01/34 | | 5,000,000 | | 4,844,900 |
| Gwinnett County Development Authority COP, Gwinnett County Public Schools Project, | | | | |
| NATL Insured, Pre-Refunded, 5.00%, 1/01/24 | | 8,500,000 | | 9,430,410 |
| Refunding, NATL Insured, 5.25%, 1/01/22 | | 3,000,000 | | 3,408,750 |
| Refunding, NATL Insured, 5.25%, 1/01/24 | | 2,000,000 | | 2,244,560 |
| Gwinnett County Hospital Authority Revenue, Anticipation Certificates, Gwinnett Hospital System | | | | |
| Inc. Project, | | | | |
| Series B, NATL Insured, Pre-Refunded, 5.30%, 9/01/27 | | 3,750,000 | | 3,996,750 |
| Series D, AGMC Insured, 5.50%, 7/01/37 | | 4,000,000 | | 3,797,360 |
| Gwinnett County School District GO, | | | | |
| 5.00%, 2/01/32 | | 4,125,000 | | 4,263,517 |
| 5.00%, 2/01/36 | | 5,815,000 | | 5,899,550 |
| Pre-Refunded, 5.00%, 2/01/32 | | 875,000 | | 1,017,249 |
| Gwinnett County Water and Sewer Authority Revenue, Pre-Refunded, 5.25%, 8/01/25 | | 2,795,000 | | 2,983,076 |
Annual Report | 105
| | | | |
| Franklin Tax-Free Trust | | | | |
| |
| Statement of Investments, February 28, 2011 (continued) | | | | |
| |
| |
| Franklin Georgia Tax-Free Income Fund | | Principal Amount | | Value |
| Municipal Bonds (continued) | | | | |
| Georgia (continued) | | | | |
| Habersham County Hospital Authority Revenue, Anticipation Certificates, XLCA Insured, 5.00%, | | | | |
| 12/01/27 | $ | 2,015,000 | $ | 1,787,688 |
| Habersham County School District GO, NATL Insured, 5.00%, 4/01/28 | | 2,750,000 | | 2,825,515 |
| Henry County Hospital Authority Revenue, Henry Medical Center Inc. Project, Refunding, | | | | |
| AMBAC Insured, 6.00%, 7/01/29 | | 5,000,000 | | 5,004,550 |
| Hogansville Combined Public Utility System Revenue, Refunding, AGMC Insured, 6.00%, | | | | |
| 10/01/23 | | 3,300,000 | | 4,064,610 |
| Jackson County School District GO, NATL Insured, 5.00%, 3/01/25 | | 3,000,000 | | 3,158,400 |
| LaGrange-Troup County Hospital Authority Revenue, Series A, 5.50%, 7/01/38 | | 4,000,000 | | 3,982,840 |
| Lincoln County School District GO, 5.50%, 4/01/37 | | 2,200,000 | | 2,297,526 |
| Macon-Bibb Country Hospital Authority Revenue, Revenue Anticipation Certificates, Medical | | | | |
| Center of Georgia, 5.00%, 8/01/35 | | 5,000,000 | | 4,604,300 |
| Main Street Natural Gas Inc. Gas Project Revenue, Series A, 5.50%, 9/15/27 | | 5,000,000 | | 4,711,950 |
| Medical Center Hospital Authority Revenue, Anticipation Certificates, Columbus Regional | | | | |
| Healthcare System, | | | | |
| Assured Guaranty, 6.375%, 8/01/29 | | 4,000,000 | | 4,257,960 |
| Refunding, AGMC Insured, 5.00%, 8/01/41 | | 5,000,000 | | 4,494,550 |
| Metropolitan Atlanta Rapid Transit Authority Sales Tax Revenue, Third Indenture, Refunding, | | | | |
| Series B, AGMC Insured, 5.00%, 7/01/37 | | 10,000,000 | | 9,912,500 |
| Monroe County Development Authority PCR, Oglethorpe Power Co., Scherer Project, Refunding, | | | | |
| Series A, 6.80%, 1/01/12 | | 1,500,000 | | 1,559,895 |
| Municipal Electric Authority Revenue, | | | | |
| General Resolution Projects, sub. note, Refunding, Series D, 5.50%, 1/01/26 | | 5,000,000 | | 5,350,700 |
| Project 1, sub. bond, Series E, NATL Insured, 5.00%, 1/01/25 | | 2,315,000 | | 2,388,918 |
| Newton County IDAR, Georgia Perimeter College Foundation Real Estate Newton, CIFG Insured, | | | | |
| 5.00%, 6/01/24 | | 3,150,000 | | 3,204,967 |
| Paulding County GO, Courthouse, NATL RE, FGIC Insured, 5.00%, 2/01/32 | | 4,000,000 | | 4,106,800 |
| Paulding County School District GO, 5.00%, 2/01/33 | | 4,000,000 | | 4,028,280 |
| Peach County Development Authority Student Housing Facilities Revenue, Fort Valley State | | | | |
| University Foundation Property LLC, AMBAC Insured, 5.00%, 6/01/34 | | 3,000,000 | | 2,826,780 |
| Private Colleges and Universities Authority Revenue, | | | | |
| Emory University, Refunding, 5.00%, 9/01/35 | | 10,000,000 | | 10,027,400 |
| Emory University, Refunding, Series C, 5.25%, 9/01/39 | | 5,000,000 | | 5,071,800 |
| Mercer University Project, Refunding, Series A, 5.375%, 10/01/29 | | 2,000,000 | | 1,852,600 |
| Richmond County Development Authority Educational Facilities Revenue, Augusta State | | | | |
| University Jaguar Student Center, Series A, XLCA Insured, 5.00%, 7/01/29 | | 1,000,000 | | 989,290 |
| Richmond County Development Authority Solid Waste Disposal Revenue, International Paper Co. | | | | |
| Project, 5.80%, 12/01/20 | | 1,500,000 | | 1,502,955 |
| Rockdale County Water and Sewer Authority Revenue, AGMC Insured, 5.00%, 7/01/29 | | 4,000,000 | | 4,027,560 |
| Savannah EDA Revenue, Armstrong Center LLC Project, Series A, XLCA Insured, 5.00%, | | | | |
| 12/01/30 | | 1,500,000 | | 1,441,650 |
| South Fulton Municipal Regional Water and Sewer Authority Water Revenue, NATL Insured, | | | | |
| Pre-Refunded, 5.00%, 1/01/33 | | 3,500,000 | | 3,772,160 |
| Suwanee GO, NATL Insured, Pre-Refunded, 5.25%, 1/01/32 | | 3,000,000 | | 3,121,650 |
| Thomasville Hospital Authority Revenue, Anticipation Certificates, John D Archbold, | | | | |
| 5.25%, 11/01/35 | | 1,000,000 | | 899,380 |
| 5.375%, 11/01/40 | | 5,000,000 | | 4,544,200 |
| Upper Oconee Basin Water Authority Revenue, Refunding, NATL Insured, 5.00%, 7/01/26 | | 1,000,000 | | 1,040,530 |
106 | Annual Report
| | | | |
| Franklin Tax-Free Trust | | | | |
| |
| Statement of Investments, February 28, 2011 (continued) | | | | |
| |
| |
| Franklin Georgia Tax-Free Income Fund | | Principal Amount | | Value |
| Municipal Bonds (continued) | | | | |
| Georgia (continued) | | | | |
| Valdosta and Lowndes County Hospital Authority Revenue, Certificates, South Georgia Medical | | | | |
| Center Project, | | | | |
| 5.00%, 10/01/33 | $ | 2,000,000 | $ | 1,788,720 |
| AMBAC Insured, 5.25%, 10/01/27 | | 3,000,000 | | 3,004,170 |
| Walton County Water and Sewer Authority Revenue, | | | | |
| Hard Labor Creek Project, AGMC Insured, 5.00%, 2/01/33 | | 5,000,000 | | 5,069,750 |
| Oconee, Hard Creek Resources Project, AGMC Insured, 5.00%, 2/01/38 | | 3,845,000 | | 3,772,329 |
| Refunding and Improvement, NATL Insured, 6.00%, 2/01/21 | | 750,000 | | 752,940 |
| Ware County Hospital Authority Revenue, Anticipation Certificates, NATL Insured, 5.25%, | | | | |
| 3/01/25 | | 3,000,000 | | 2,821,410 |
| | | | | 430,391,778 |
| U.S. Territories 6.9% | | | | |
| Puerto Rico 6.9% | | | | |
| Puerto Rico Commonwealth GO, Public Improvement, Refunding, Series B, 6.00%, 7/01/39 | | 5,000,000 | | 4,945,750 |
| Puerto Rico Commonwealth Highway and Transportation Authority Transportation Revenue, | | | | |
| Refunding, Series L, NATL Insured, 5.25%, 7/01/35 | | 10,000,000 | | 8,859,500 |
| Puerto Rico Electric Power Authority Power Revenue, Series XX, 5.25%, 7/01/40 | | 5,000,000 | | 4,366,700 |
| Puerto Rico Sales Tax FICO Sales Tax Revenue, first sub., | | | | |
| Series A, 5.375%, 8/01/39 | | 10,000,000 | | 9,190,100 |
| Series C, 5.50%, 8/01/40 | | 5,000,000 | | 4,675,850 |
| Total U.S. Territories | | | | 32,037,900 |
| Total Municipal Bonds before Short Term Investments (Cost $467,771,742) | | | | 462,429,678 |
| Short Term Investments 0.2% | | | | |
| Municipal Bonds 0.2% | | | | |
| Georgia 0.2% | | | | |
| aGainesville and Hall County Hospital Authority Revenue, Anticipation Certificates, Northeast | | | | |
| Georgia Health Care System, Refunding, Series A, Daily VRDN and Put, 0.21%, 5/15/26 | | 800,000 | | 800,000 |
| U.S. Territories 0.0%† | | | | |
| Puerto Rico 0.0%† | | | | |
| aPuerto Rico Commonwealth GO, Public Improvement, Refunding, Series B, Daily VRDN and | | | | |
| Put, 0.15%, 7/01/32 | | 200,000 | | 200,000 |
| Total Short Term Investments (Cost $1,000,000) | | | | 1,000,000 |
| Total Investments (Cost $468,771,742) 99.0% | | | | 463,429,678 |
| Other Assets, less Liabilities 1.0% | | | | 4,801,944 |
| Net Assets 100.0% | | | $ | 468,231,622 |
| |
| |
| |
| See Abbreviations on page 180. | | | | |
| |
| †Rounds to less than 0.1% of net assets. | | | | |
| aVariable rate demand notes (VRDNs) are tax-exempt obligations which contain a floating or variable interest rate adjustment formula and an unconditional right of demand to |
| receive payment of the principal balance plus accrued interest at specified dates. The coupon rate shown represents the rate at period end. | | |
| |
| |
| |
| |
| Annual Report | The accompanying notes are an integral part of these financial statements. | 107 |
| | | | | | | | | | | | | | | |
| Franklin Tax-Free Trust | | | | | | | | | | | | | | | |
| Financial Highlights | | | | | | | | | | | | | | | |
| |
| Franklin Kentucky Tax-Free Income Fund | | | | | | | | | | | | | | | |
| | | | | | Year Ended February 28, | | | | |
| Class A | | 2011 | | | 2010 | | | 2009 | | | 2008 | a | | 2007 | |
| Per share operating performance | | | | | | | | | | | | | | | |
| (for a share outstanding throughout the year) | | | | | | | | | | | | | | | |
| Net asset value, beginning of year | $ | 11.15 | | $ | 10.50 | | $ | 10.57 | | $ | 11.44 | | $ | 11.39 | |
| Income from investment operationsb: | | | | | | | | | | | | | | | |
| Net investment incomec | | 0.45 | | | 0.46 | | | 0.47 | | | 0.45 | | | 0.45 | |
| Net realized and unrealized gains (losses) | | (0.37 | ) | | 0.66 | | | (0.08 | ) | | (0.87 | ) | | 0.06 | |
| Total from investment operations | | 0.08 | | | 1.12 | | | 0.39 | | | (0.42 | ) | | 0.51 | |
| Less distributions from net investment income | | (0.45 | ) | | (0.47 | ) | | (0.46 | ) | | (0.45 | ) | | (0.46 | ) |
| Redemption feesd | | — | | | — | | | — | | | —e | | | —e | |
| Net asset value, end of year | $ | 10.78 | | $ | 11.15 | | $ | 10.50 | | $ | 10.57 | | $ | 11.44 | |
| |
| Total returnf | | 0.72 | % | | 10.85 | % | | 3.76 | % | | (3.81 | )% | | 4.57 | % |
| |
| Ratios to average net assets | | | | | | | | | | | | | | | |
| Expenses before waiver and payments by affiliates | | 0.74 | % | | 0.76 | % | | 0.76 | % | | 0.76 | % | | 0.77 | % |
| Expenses net of waiver and payments by affiliates | | 0.74 | % | | 0.76 | % | | 0.76 | % | | 0.75 | % | | 0.75 | % |
| Net investment income | | 4.06 | % | | 4.25 | % | | 4.40 | % | | 4.05 | % | | 4.02 | % |
| |
| Supplemental data | | | | | | | | | | | | | | | |
| Net assets, end of year (000’s) | $ | 182,525 | | $ | 187,618 | | $ | 162,043 | | $ | 149,776 | | $ | 148,224 | |
| Portfolio turnover rate | | 13.17 | % | | 8.41 | % | | 10.40 | % | | 9.42 | % | | 2.28 | % |
|
| aFor the year ended February 29. |
| bThe amount shown for a share outstanding throughout the period may not correlate with the Statement of Operations for the period due to the timing of sales and repurchases of |
| the Fund shares in relation to income earned and/or fluctuating market value of the investments of the Fund. |
| cBased on average daily shares outstanding. |
| dEffective September 1, 2008, the redemption fee was eliminated. |
| eAmount rounds to less than $0.01 per share. |
| fTotal return does not reflect sales commissions or contingent deferred sales charges, if applicable. |
108 | The accompanying notes are an integral part of these financial statements. | Annual Report
| | | | |
| Franklin Tax-Free Trust | | | | |
| |
| Statement of Investments, February 28, 2011 | | | | |
| |
| |
| Franklin Kentucky Tax-Free Income Fund | | Principal Amount | | Value |
| Municipal Bonds 96.8% | | | | |
| Kentucky 85.5% | | | | |
| Bellevue GO, Public Project, Harbor Greene Project, XLCA Insured, 5.00%, 2/01/34 | $ | 1,065,000 | $ | 1,072,114 |
| Boone County GO, Public Project, Pre-Refunded, 5.00%, | | | | |
| 4/01/20 | | 1,310,000 | | 1,374,884 |
| 4/01/21 | | 1,000,000 | | 1,049,530 |
| Boone County PCR, Collateralized, Dayton Power and Light Co., Refunding, Series A, | | | | |
| FGIC Insured, 4.70%, 1/01/28 | | 3,000,000 | | 2,928,210 |
| Boone Florence Water Commission Water Supply Systems Revenue, Refunding, NATL RE, | | | | |
| FGIC Insured, Pre-Refunded, 5.00%, | | | | |
| 12/01/22 | | 1,200,000 | | 1,253,232 |
| 12/01/27 | | 2,000,000 | | 2,088,720 |
| Bowling Green GO, Project, Series A, 5.00%, 6/01/38 | | 5,000,000 | | 5,011,650 |
| Boyle County Revenue, Refunding and College Improvement, CIFG Insured, 5.00%, 6/01/32 | | 1,500,000 | | 1,511,085 |
| Campbell and Kenton Counties Sanitation District No. 1 Sanitation District Revenue, | | | | |
| NATL Insured, 5.00%, 8/01/37 | | 2,500,000 | | 2,505,325 |
| Series A, AGMC Insured, Pre-Refunded, 5.00%, 8/01/24 | | 2,000,000 | | 2,058,400 |
| Campbell County School District Finance Corp. School Building Revenue, AGMC Insured, 5.00%, | | | | |
| 8/01/26 | | 2,845,000 | | 2,949,867 |
| Christian County Hospital Revenue, Jennie Stuart Medical Center, Refunding, Assured Guaranty, | | | | |
| 5.50%, 2/01/36 | | 3,000,000 | | 3,003,240 |
| Fayette County School District Finance Corp. School Building Revenue, Series A, | | | | |
| AMBAC Insured, Pre-Refunded, 5.25%, 4/01/20 | | 2,160,000 | | 2,189,894 |
| Florence GO, Public Project, Series A, NATL RE, FGIC Insured, Pre-Refunded, 5.00%, | | | | |
| 11/01/32 | | 1,000,000 | | 1,053,350 |
| Greater Kentucky Housing Assistance Corp. Mortgage Revenue, Section 8 Assisted Projects, | | | | |
| Refunding, Series A, NATL Insured, 6.10%, 1/01/24 | | 290,000 | | 290,235 |
| Jefferson County Health Facilities Revenue, Jewish Hospital Healthcare Services Inc., Refunding, | | | | |
| AMBAC Insured, 5.75%, 1/01/26 | | 1,000,000 | | 999,990 |
| Jefferson County School District Finance Corp. School Building Revenue, Series A, NATL Insured, | | | | |
| 4.75%, 6/01/27 | | 2,440,000 | | 2,450,297 |
| Kentucky Area Development Districts Financing Trust Lease Acquisition Program COP, Series L, | | | | |
| XLCA Insured, 5.00%, 11/01/29 | | 1,000,000 | | 1,027,950 |
| Kentucky Area Development Districts Financing Trust Lease Program Revenue, City of Ewing, | | | | |
| Series A, 6.00%, 6/01/30 | | 255,000 | | 260,523 |
| Series C, 6.00%, 6/01/30 | | 1,145,000 | | 1,147,313 |
| Series E, 5.70%, 6/01/22 | | 75,000 | | 75,951 |
| Kentucky Asset/Liability Commission General Receipts Revenue, University of Kentucky, | | | | |
| Project Notes, NATL RE, FGIC Insured, 5.00%, 10/01/25 | | 3,000,000 | | 3,126,810 |
| Kentucky Economic Development Finance Authority Health System Revenue, Norton | | | | |
| Healthcare Inc., | | | | |
| Refunding, Series C, NATL Insured, 6.15%, 10/01/24 | | 160,000 | | 167,062 |
| Series C, NATL Insured, Pre-Refunded, 6.15%, 10/01/24 | | 245,000 | | 279,687 |
| Series C, NATL Insured, Pre-Refunded, 6.15%, 10/01/25 | | 935,000 | | 1,067,377 |
| Kentucky Economic Development Finance Authority Hospital System Revenue, Appalachian | | | | |
| Regional Health Center Facility, Refunding and Improvement, 5.875%, 10/01/22 | | 2,000,000 | | 1,754,100 |
| Kentucky Economic Development Finance Authority Revenue, Catholic Health, Refunding, | | | | |
| Series A, 5.00%, 5/01/29 | | 4,000,000 | | 3,948,040 |
| Kentucky Economic Finance Authority Louisville Arena Project Revenue, Louisville Arena, | | | | |
| Sub Series A-1, Assured Guaranty, 6.00%, 12/01/33 | | 2,000,000 | | 2,064,920 |
Annual Report | 109
| | | | |
| Franklin Tax-Free Trust | | | | |
| |
| Statement of Investments, February 28, 2011 (continued) | | | | |
| |
| |
| Franklin Kentucky Tax-Free Income Fund | | Principal Amount | | Value |
| Municipal Bonds (continued) | | | | |
| Kentucky (continued) | | | | |
| Kentucky Housing Corp. Conduit MFHR, Collateral Mortgage Loan, Country Place Apartments, | | | | |
| GNMA Secured, | | | | |
| 5.00%, 4/20/40 | $ | 2,280,000 | $ | 2,134,057 |
| 5.25%, 4/20/45 | | 1,850,000 | | 1,781,735 |
| Kentucky Housing Corp. Housing Revenue, Series A, 4.60%, 7/01/32 | | 2,000,000 | | 1,784,700 |
| Kentucky Infrastructure Authority Revenue, Series A, 5.00%, | | | | |
| 6/01/19 | | 1,140,000 | | 1,149,519 |
| 6/01/20 | | 1,250,000 | | 1,259,700 |
| 6/01/21 | | 1,190,000 | | 1,198,937 |
| Kentucky Rural Water Finance Corp. Public Project Revenue, Multimodal, Flexible Term Program, | | | | |
| Series A, 5.00%, 2/01/26 | | 1,055,000 | | 1,067,787 |
| Series I, 5.00%, 2/01/34 | | 1,500,000 | | 1,450,290 |
| Kentucky State Municipal Power Agency Power System Revenue, Prairie State Project, Series A, | | | | |
| NATL Insured, 5.00%, | | | | |
| 9/01/32 | | 5,000,000 | | 4,833,750 |
| 9/01/37 | | 4,250,000 | | 3,944,128 |
| Kentucky State Property and Buildings Commission Revenues, | | | | |
| Project No. 62, Refunding, Second Series, 5.25%, 10/01/18 | | 3,000,000 | | 3,010,530 |
| Project No. 69, Series A, AGMC Insured, Pre-Refunded, 5.00%, 8/01/21 | | 2,300,000 | | 2,344,183 |
| Project No. 77, NATL Insured, Pre-Refunded, 5.00%, 8/01/23 | | 1,100,000 | | 1,209,824 |
| Project No. 90, Refunding, 5.50%, 11/01/28 | | 5,000,000 | | 5,251,250 |
| Kentucky State Turnpike Authority Economic Development Road Revenue, Revitalization Projects, | | | | |
| Refunding, Series A, 5.00%, | | | | |
| 7/01/28 | | 1,000,000 | | 1,020,220 |
| 7/01/29 | | 1,000,000 | | 1,016,960 |
| Lawrenceburg Water and Sewer Revenue, NATL Insured, 5.00%, 10/01/28 | | 1,730,000 | | 1,682,615 |
| Lexington-Fayette Urban County Airport Board General Airport Revenue, Refunding, Series A, | | | | |
| 5.00%, 7/01/27 | | 4,000,000 | | 4,123,360 |
| Louisville and Jefferson County Metropolitan Government College Revenue, Bellarmine | | | | |
| University Project, Refunding and Improvement, Series A, 6.00%, 5/01/38 | | 2,500,000 | | 2,421,725 |
| Louisville and Jefferson County Metropolitan Government Health Facilities Revenue, Jewish | | | | |
| Hospital and St. Mary’s HealthCare Inc. Project, Refunding, 6.125%, 2/01/37 | | 2,000,000 | | 1,957,940 |
| Louisville and Jefferson County Metropolitan Government Industrial Building Revenue, Sisters of | | | | |
| Mercy, Cincinnati, 5.00%, 10/01/35 | | 1,500,000 | | 1,340,190 |
| Louisville and Jefferson County Metropolitan Sewer District Sewer and Drainage System Revenue, | | | | |
| Series A, | | | | |
| AMBAC Insured, 5.00%, 5/15/36 | | 3,000,000 | | 3,005,220 |
| NATL RE, FGIC Insured, 5.00%, 5/15/30 | | 2,420,000 | | 2,421,863 |
| NATL RE, FGIC Insured, 5.00%, 5/15/38 | | 3,000,000 | | 3,007,950 |
| Louisville and Jefferson County Student Housing Revenue, University of Louisville, Phase 3-A, | | | | |
| AMBAC Insured, 5.00%, 6/01/34 | | 3,755,000 | | 3,683,880 |
| Series A, AMBAC Insured, 5.00%, 6/01/25 | | 1,000,000 | | 1,025,660 |
| Louisville Parking Authority of River City Revenue, NATL Insured, 5.00%, 6/01/29 | | 3,290,000 | | 3,308,687 |
| Louisville Regional Airport Authority Airport System Revenue, AGMC Insured, 5.50%, | | | | |
| 7/01/38 | | 3,000,000 | | 2,799,420 |
| Murray Hospital Facilities Revenue, Murray, Calloway County Public Hospital, | | | | |
| 5.125%, 8/01/37 | | 3,000,000 | | 2,387,220 |
| 6.375%, 8/01/40 | | 2,500,000 | | 2,356,375 |
110 | Annual Report
| | | | |
| Franklin Tax-Free Trust | | | | |
| |
| Statement of Investments, February 28, 2011 (continued) | | | | |
| |
| |
| Franklin Kentucky Tax-Free Income Fund | | Principal Amount | | Value |
| Municipal Bonds (continued) | | | | |
| Kentucky (continued) | | | | |
| Northern Kentucky University COP, AMBAC Insured, Pre-Refunded, 5.00%, 12/01/27 | $ | 1,500,000 | $ | 1,614,075 |
| Northern Kentucky Water Service District Revenue, NATL Insured, 4.875%, 2/01/20 | | 1,270,000 | | 1,285,215 |
| Northern Water District Revenue, XLCA Insured, 4.25%, 2/01/29 | | 2,560,000 | | 2,267,981 |
| Oldham County School District Finance Corp. School Building Revenue, NATL Insured, 5.00%, | | | | |
| 5/01/24 | | 5,680,000 | | 5,823,023 |
| Owen County Waterworks System Revenue, American Water Co. Project, | | | | |
| Series A, 6.25%, 6/01/39 | | 2,000,000 | | 2,025,440 |
| Series A, 5.375%, 6/01/40 | | 2,000,000 | | 1,841,320 |
| Series B, 5.625%, 9/01/39 | | 2,000,000 | | 1,885,200 |
| Owensboro Electric Light and Power System Revenue, Refunding, Series C, AGMC Insured, | | | | |
| 5.00%, 1/01/22 | | 2,245,000 | | 2,509,573 |
| Paducah Electric Plant Board Revenue, Series A, Assured Guaranty, 5.25%, 10/01/35 | | 6,500,000 | | 6,508,190 |
| Princeton Electric Plant Board Revenue, Series A, Assured Guaranty, 5.00%, 11/01/37 | | 1,500,000 | | 1,497,705 |
| Pulaski County Public Properties Corp. First Mortgage Revenue, AOC Judicial Facility, Refunding, | | | | |
| 6.00%, 12/01/28 | | 1,000,000 | | 1,102,590 |
| Trimble County Environmental Facilities Revenue, Trimble County Environmental Facility, | | | | |
| AMBAC Insured, 6.00%, 3/01/37 | | 5,000,000 | | 4,718,100 |
| Refunding, AMBAC Insured, 4.60%, 6/01/33 | | 3,750,000 | | 3,397,613 |
| Warren County Hospital Facility Revenue, Community Hospital Corp. Project, Refunding, | | | | |
| Series A, 5.00%, 8/01/29 | | 1,000,000 | | 902,820 |
| | | | | 156,068,276 |
| U.S. Territories 11.3% | | | | |
| Puerto Rico 11.3% | | | | |
| Children’s Trust Fund Puerto Rico Tobacco Settlement Revenue, Asset-Backed Bonds, Refunding, | | | | |
| 5.375%, 5/15/33 | | 1,560,000 | | 1,340,399 |
| Puerto Rico Commonwealth GO, Public Improvement, Series A, | | | | |
| 5.125%, 7/01/31 | | 3,125,000 | | 3,126,625 |
| Pre-Refunded, 5.125%, 7/01/31 | | 1,875,000 | | 1,904,925 |
| Puerto Rico Commonwealth Highway and Transportation Authority Transportation Revenue, | | | | |
| Series D, Pre-Refunded, 5.375%, 7/01/36 | | 2,500,000 | | 2,655,550 |
| Series K, 5.00%, 7/01/27 | | 3,000,000 | | 2,787,540 |
| Puerto Rico PBA Guaranteed Revenue, Government Facilities, | | | | |
| Refunding, Series D, 5.25%, 7/01/36 | | 455,000 | | 399,581 |
| Refunding, Series N, 5.00%, 7/01/32 | | 3,000,000 | | 2,651,310 |
| Series D, Pre-Refunded, 5.25%, 7/01/36 | | 995,000 | | 1,055,267 |
| Puerto Rico Sales Tax FICO Sales Tax Revenue, first sub., Series C, 5.50%, 8/01/40 | | 5,000,000 | | 4,675,850 |
| Total U.S. Territories | | | | 20,597,047 |
| Total Municipal Bonds before Short Term Investments (Cost $179,303,804) | | | | 176,665,323 |
| Short Term Investments 2.2% | | | | |
| Municipal Bonds 2.2% | | | | |
| Kentucky 1.3% | | | | |
| aKentucky Economic Development Finance Authority Hospital Facilities Revenue, Baptist | | | | |
| Healthcare System, Refunding, Series B-2, Daily VRDN and Put, 0.18%, 8/15/38 | | 2,400,000 | | 2,400,000 |
Annual Report | 111
Franklin Tax-Free Trust
Statement of Investments, February 28, 2011 (continued)
| | | | |
| Franklin Kentucky Tax-Free Income Fund | | Principal Amount | | Value |
| Short Term Investments (continued) | | | | |
| Municipal Bonds (continued) | | | | |
| U.S. Territories 0.9% | | | | |
| Puerto Rico 0.9% | | | | |
| aPuerto Rico Commonwealth GO, Public Improvement, Refunding, Series B, Daily VRDN and | | | | |
| Put, 0.15%, 7/01/32 | $ | 1,700,000 | $ | 1,700,000 |
| Total Short Term Investments (Cost $4,100,000) | | | | 4,100,000 |
| Total Investments (Cost $183,403,804) 99.0% | | | | 180,765,323 |
| Other Assets, less Liabilities 1.0% | | | | 1,759,768 |
| Net Assets 100.0% | | | $ | 182,525,091 |
|
| See Abbreviations on page 180. |
| |
| aVariable rate demand notes (VRDNs) are tax-exempt obligations which contain a floating or variable interest rate adjustment formula and an unconditional right of demand to |
| receive payment of the principal balance plus accrued interest at specified dates. The coupon rate shown represents the rate at period end. |
112 | The accompanying notes are an integral part of these financial statements. | Annual Report
| | | | | | | | | | | | | | | |
| Franklin Tax-Free Trust | | | | | | | | | | | | | | | |
| Financial Highlights | | | | | | | | | | | | | | | |
| |
| Franklin Louisiana Tax-Free Income Fund | | | | | | | | | | | | | | | |
| | | | | | Year Ended February 28, | | | | |
| Class A | | 2011 | | | 2010 | | | 2009 | | | 2008 | a | | 2007 | |
| Per share operating performance | | | | | | | | | | | | | | | |
| (for a share outstanding throughout the year) | | | | | | | | | | | | | | | |
| Net asset value, beginning of year | $ | 11.28 | | $ | 10.43 | | $ | 10.74 | | $ | 11.61 | | $ | 11.52 | |
| Income from investment operationsb: | | | | | | | | | | | | | | | |
| Net investment incomec | | 0.48 | | | 0.48 | | | 0.48 | | | 0.47 | | | 0.48 | |
| Net realized and unrealized gains (losses) | | (0.37 | ) | | 0.85 | | | (0.32 | ) | | (0.87 | ) | | 0.10 | |
| Total from investment operations | | 0.11 | | | 1.33 | | | 0.16 | | | (0.40 | ) | | 0.58 | |
| Less distributions from net investment income | | (0.48 | ) | | (0.48 | ) | | (0.47 | ) | | (0.47 | ) | | (0.49 | ) |
| Redemption feesd | | — | | | — | | | — | | | —e | | | —e | |
| Net asset value, end of year | $ | 10.91 | | $ | 11.28 | | $ | 10.43 | | $ | 10.74 | | $ | 11.61 | |
| |
| Total returnf | | 0.92 | % | | 12.99 | % | | 1.53 | % | | (3.57 | )% | | 5.14 | % |
| |
| Ratios to average net assets | | | | | | | | | | | | | | | |
| Expenses | | 0.68 | % | | 0.69 | % | | 0.71 | % | | 0.71 | % | | 0.73 | % |
| Net investment income | | 4.26 | % | | 4.40 | % | | 4.45 | % | | 4.14 | % | | 4.22 | % |
| |
| Supplemental data | | | | | | | | | | | | | | | |
| Net assets, end of year (000’s) | $ | 323,109 | | $ | 327,368 | | $ | 266,905 | | $ | 234,314 | | $ | 220,927 | |
| Portfolio turnover rate | | 12.90 | % | | 4.45 | % | | 11.73 | % | | 11.57 | % | | 5.71 | % |
|
| aFor the year ended February 29. |
| bThe amount shown for a share outstanding throughout the period may not correlate with the Statement of Operations for the period due to the timing of sales and repurchases of |
| the Fund shares in relation to income earned and/or fluctuating market value of the investments of the Fund. |
| cBased on average daily shares outstanding. |
| dEffective September 1, 2008, the redemption fee was eliminated. |
| eAmount rounds to less than $0.01 per share. |
| fTotal return does not reflect sales commissions or contingent deferred sales charges, if applicable. |
Annual Report | The accompanying notes are an integral part of these financial statements. | 113
| | | | | | | | | | | | | | | | | |
| Franklin Tax-Free Trust | | | | | | | | | | | | | | | | | |
| |
| Financial Highlights (continued) | | | | | | | | | | | | | | | | | |
| |
| Franklin Louisiana Tax-Free Income Fund | | | | | | | | | | | | | | | | | |
| | | | | | Year Ended February 28, | | | | |
| Class C | | 2011 | | | 2010 | | | | | 2009 | | | 2008 | a | | 2007 | |
| Per share operating performance | | | | | | | | | | | | | | | | | |
| (for a share outstanding throughout the year) | | | | | | | | | | | | | | | | | |
| Net asset value, beginning of year | $ | 11.41 | | $ | 10.54 | | | | $ | 10.85 | | $ | 11.73 | | $ | 11.63 | |
| Income from investment operationsb: | | | | | | | | | | | | | | | | | |
| Net investment incomec | | 0.42 | | | 0.43 | | | | | 0.42 | | | 0.41 | | | 0.43 | |
| Net realized and unrealized gains (losses) | | (0.38 | ) | | 0.86 | | | | | (0.32 | ) | | (0.88 | ) | | 0.09 | |
| Total from investment operations | | 0.04 | | | 1.29 | | | | | 0.10 | | | (0.47 | ) | | 0.52 | |
| Less distributions from net investment income | | (0.41 | ) | | (0.42 | ) | | (0.41 | ) | | (0.41 | ) | | (0.42 | ) |
| Redemption feesd | | — | | | — | | | | | — | | | —e | | | —e | |
| Net asset value, end of year | $ | 11.04 | | $ | 11.41 | | | | $ | 10.54 | | $ | 10.85 | | $ | 11.73 | |
| |
| Total returnf | | 0.34 | % | | 12.44 | % | | | | 0.96 | % | | (4.16 | )% | | 4.61 | % |
| |
| Ratios to average net assets | | | | | | | | | | | | | | | | | |
| Expenses | | 1.23 | % | | 1.24 | % | | | | 1.26 | % | | 1.26 | % | | 1.28 | % |
| Net investment income | | 3.71 | % | | 3.85 | % | | | | 3.90 | % | | 3.59 | % | | 3.67 | % |
| |
| Supplemental data | | | | | | | | | | | | | | | | | |
| Net assets, end of year (000’s) | $ | 64,511 | | $ | 64,018 | | | | $ | 41,646 | | $ | 35,085 | | $ | 29,028 | |
| Portfolio turnover rate | | 12.90 | % | | 4.45 | % | | | | 11.73 | % | | 11.57 | % | | 5.71 | % |
| |
| |
| aFor the year ended February 29. | | | | | | | | | | | | | | | | | |
| bThe amount shown for a share outstanding throughout the period may not correlate with the Statement of Operations for the period due to the timing of sales and repurchases of | |
| the Fund shares in relation to income earned and/or fluctuating market value of the investments of the Fund. | | | | | | | | | | | | | | | |
| cBased on average daily shares outstanding. | | | | | | | | | | | | | | | | | |
| dEffective September 1, 2008, the redemption fee was eliminated. | | | | | | | | | | | | | | | | | |
| eAmount rounds to less than $0.01 per share. | | | | | | | | | | | | | | | | | |
| fTotal return does not reflect sales commissions or contingent deferred sales charges, if applicable. | | | | | | | | | | | | | | | |
| |
| |
| |
| |
| 114 | The accompanying notes are an integral part of these financial statements. | | | Annual Report | | | | | | | |
| | | | |
| Franklin Tax-Free Trust | | | | |
| |
| Statement of Investments, February 28, 2011 | | | | |
| |
| |
| Franklin Louisiana Tax-Free Income Fund | | Principal Amount | | Value |
| Municipal Bonds 98.0% | | | | |
| Louisiana 86.6% | | | | |
| Alexandria Sales and Use Tax Revenue, 5.00%, | | | | |
| 8/01/26 | $ | 1,710,000 | $ | 1,797,724 |
| 8/01/27 | | 1,790,000 | | 1,870,568 |
| 8/01/28 | | 1,875,000 | | 1,943,287 |
| Bossier City Utilities Revenue, BHAC Insured, 5.50%, 10/01/33 | | 5,000,000 | | 5,187,800 |
| Calcasieu Parish Public Trust Authority Student Lease Revenue, McNeese Student Housing | | | | |
| Project, NATL Insured, 5.25%, | | | | |
| 5/01/21 | | 1,505,000 | | 1,506,896 |
| 5/01/33 | | 2,500,000 | | 2,210,225 |
| De Soto Parish Environmental Improvement Revenue, International Paper Co. Project, Series A, | | | | |
| 5.65%, 12/01/21 | | 1,000,000 | | 1,001,980 |
| De Soto Parish PCR, Cleco Utility Group Inc. Project, Refunding, AMBAC Insured, 5.875%, | | | | |
| 9/01/29 | | 11,500,000 | | 11,537,375 |
| East Baton Rouge Mortgage Finance Authority SFMR, Mortgage Backed Securities Program, | | | | |
| Refunding, Series A-3, GNMA Secured, 5.00%, 10/01/28 | | 840,000 | | 834,011 |
| Series A-2, GNMA Secured, 5.10%, 10/01/40 | | 485,000 | | 484,534 |
| East Baton Rouge Parish Park and Recreation District GO, AGMC Insured, 5.00%, 5/01/25 | | 3,325,000 | | 3,438,216 |
| East Baton Rouge Parish Sales Tax Revenue, | | | | |
| Public Improvement, Refunding, Series A, AMBAC Insured, 5.00%, 2/01/24 | | 2,000,000 | | 2,065,100 |
| Road and Street Improvement, Assured Guaranty, 5.25%, 8/01/28 | | 1,000,000 | | 1,043,450 |
| Road and Street Improvement, Assured Guaranty, 5.50%, 8/01/30 | | 1,700,000 | | 1,783,878 |
| East Baton Rouge Parish Sewer Commission Revenue, Refunding, Series A, 5.25%, | | | | |
| 2/01/34 | | 2,500,000 | | 2,546,850 |
| 2/01/39 | | 6,500,000 | | 6,562,530 |
| England District Sub-District No. 1 Revenue, NATL RE, FGIC Insured, 5.00%, 8/15/19 | | 5,000,000 | | 5,370,450 |
| Greater New Orleans Expressway Commission Revenue, Refunding, AMBAC Insured, 5.00%, | | | | |
| 11/01/27 | | 5,000,000 | | 5,056,750 |
| Jefferson Parish Revenue, Public Improvement, 24th Judicial District Project, NATL Insured, | | | | |
| 5.00%, 4/01/29 | | 3,060,000 | | 3,078,054 |
| Jefferson Parish West Jefferson Park and Community Center Revenue, NATL Insured, 5.00%, | | | | |
| 10/01/29 | | 2,925,000 | | 3,011,668 |
| Lafayette Communications Systems Revenue, XLCA Insured, 5.25%, 11/01/27 | | 5,000,000 | | 5,052,800 |
| Lafayette Public Power Authority Electric Revenue, NATL Insured, 5.00%, 11/01/32 | | 5,000,000 | | 4,864,250 |
| Lafayette Public Trust Financing Authority Revenue, | | | | |
| Ragin’ Cajun Facilities Inc., Housing and Package Project, Assured Guaranty, 5.25%, | | | | |
| 10/01/30 | | 4,000,000 | | 4,078,240 |
| Ragin’ Cajun Facilities Inc. Project, Assured Guaranty, 5.75%, 10/01/29 | | 750,000 | | 784,553 |
| Ragin’ Cajun Facilities Inc. Project, Assured Guaranty, 6.00%, 10/01/34 | | 1,750,000 | | 1,822,468 |
| Ragin’ Cajun Facilities Inc. Project, Assured Guaranty, 6.00%, 10/01/38 | | 1,335,000 | | 1,378,254 |
| Ragin’ Cajun Facilities Inc. Project, NATL Insured, 5.00%, 10/01/22 | | 1,500,000 | | 1,556,475 |
| Lafayette Public Trust Financing Authority SFMR, Series A, FHA Insured, ETM, 7.20%, | | | | |
| 4/01/11 | | 30,000 | | 30,157 |
| Lafayette Utilities Revenue, | | | | |
| 5.00%, 11/01/33 | | 5,000,000 | | 4,860,950 |
| NATL Insured, 5.00%, 11/01/28 | | 5,000,000 | | 5,154,700 |
| Livingston Parish Waterworks Revenue, Ward Two Water District, AMBAC Insured, 5.125%, | | | | |
| 4/01/29 | | 2,200,000 | | 2,241,712 |
Annual Report | 115
| | | | |
| Franklin Tax-Free Trust | | | | |
| |
| Statement of Investments, February 28, 2011 (continued) | | | | |
| |
| |
| Franklin Louisiana Tax-Free Income Fund | | Principal Amount | | Value |
| Municipal Bonds (continued) | | | | |
| Louisiana (continued) | | | | |
| Louisiana HFA, SFMR, Home Ownership Program, | | | | |
| GO Zone, Series B-1, GNMA Secured, 5.00%, 12/01/32 | $ | 1,230,000 | $ | 1,229,274 |
| Series A, GNMA Secured, 5.50%, 6/01/40 | | 3,920,000 | | 3,984,484 |
| Series A-1, GNMA Secured, 5.45%, 12/01/20 | | 295,000 | | 298,490 |
| Series B, GNMA Secured, 6.125%, 12/01/33 | | 800,000 | | 832,368 |
| Louisiana Local Government Environmental Facilities and CDA Revenue, | | | | |
| Ascension Parish Library Projects, AMBAC Insured, 5.25%, 4/01/29 | | 1,000,000 | | 1,012,020 |
| Delgado Community College Foundation Project, NATL Insured, 6.00%, 10/01/29 | | 1,000,000 | | 1,008,700 |
| Delta Campus Facilities Corp. Project, Assured Guaranty, 5.50%, 10/01/27 | | 5,000,000 | | 5,262,100 |
| Denham Springs Sewer District No.1 Project, Assured Guaranty, 5.00%, 12/01/39 | | 3,750,000 | | 3,558,150 |
| Denham Springs Sewer Project, AMBAC Insured, 4.75%, 12/01/31 | | 3,000,000 | | 2,769,930 |
| East Ascension Consolidated Gravity Drainage District No. 1 Project, Refunding, | | | | |
| AMBAC Insured, 5.00%, 12/01/37 | | 5,370,000 | | 5,148,058 |
| East Ascension Consolidated Gravity Drainage District No. 1 Project, Refunding, | | | | |
| AMBAC Insured, 5.00%, 12/01/44 | | 8,870,000 | | 8,243,334 |
| Independence Stadium Project, Refunding, 5.25%, 3/01/30 | | 8,845,000 | | 8,860,390 |
| Jefferson Parish Project, Refunding, Series A, 5.375%, 4/01/31 | | 2,000,000 | | 2,043,920 |
| Jefferson Parking Garage Project, AMBAC Insured, 5.00%, 9/01/21 | | 2,215,000 | | 2,206,051 |
| Lake Charles Public Improvements Project, AMBAC Insured, 5.00%, 5/01/27 | | 5,000,000 | | 5,041,850 |
| LCTCS Facilities Corp. Project, Series B, Assured Guaranty, 5.00%, 10/01/27 | | 5,250,000 | | 5,282,550 |
| Livingston Parish Road Project, AMBAC Insured, 5.00%, 3/01/21 | | 3,540,000 | | 3,682,556 |
| Monroe Regional Airport Terminal Project, Assured Guaranty, 5.50%, 2/01/39 | | 2,000,000 | | 1,991,400 |
| NATL Insured, 5.00%, 12/01/26 | | 3,000,000 | | 3,032,220 |
| Parking Facilities Corp. Garage Project, Series A, AMBAC Insured, 5.375%, 10/01/26 | | 2,000,000 | | 1,836,560 |
| Parking Facilities Corp. Garage Project, Series A, AMBAC Insured, 5.375%, 10/01/31 | | 2,000,000 | | 1,783,960 |
| Shreveport Airport Cargo Project, Series C, Assured Guaranty, 6.75%, 1/01/24 | | 2,620,000 | | 2,813,723 |
| Shreveport Airport Cargo Project, Series C, Assured Guaranty, 7.00%, 1/01/33 | | 2,500,000 | | 2,594,050 |
| Southeastern Louisiana Student Housing University Facilities Inc. Project, Series A, | | | | |
| NATL Insured, 5.00%, 8/01/27 | | 3,000,000 | | 2,835,960 |
| Louisiana Public Facilities Authority Hospital Revenue, | | | | |
| Franciscan Missionaries of Our Lady Health System Project, 6.75%, 7/01/39 | | 3,500,000 | | 3,667,370 |
| Lafayette General Medical Center, Refunding, 5.50%, 11/01/40 | | 5,000,000 | | 4,534,200 |
| Touro Infirmary Project, Series A, 5.625%, 8/15/29 | | 3,500,000 | | 2,764,615 |
| Louisiana Public Facilities Authority Revenue, | | | | |
| Archdiocese of New Orleans Project, Refunding, CIFG Insured, 5.00%, 7/01/31 | | 5,000,000 | | 4,570,250 |
| Black and Gold Facilities Project, Series A, CIFG Insured, 5.00%, 7/01/30 | | 5,000,000 | | 4,082,900 |
| Centenary College Project, Refunding, 5.75%, 2/01/29 | | 7,300,000 | | 6,165,726 |
| CHRISTUS Health, Refunding, Series B, Assured Guaranty, 6.50%, 7/01/30 | | 5,000,000 | | 5,233,200 |
| Dillard University Project, Series A, AMBAC Insured, Pre-Refunded, 5.30%, 8/01/26 | | 1,540,000 | | 1,639,068 |
| Energy LLC Project, Refunding, 5.00%, 6/01/30 | | 5,000,000 | | 4,981,250 |
| FHA Insured Mortgage, Baton Rouge General Medical Center Project, NATL Insured, 5.25%, | | | | |
| 7/01/33 | | 5,000,000 | | 4,993,100 |
| Loyola University Project, 5.00%, 10/01/39 | | 5,000,000 | | 4,689,500 |
| MFHR, One Lakeshore Place Apartments Project, Refunding, Series A, GNMA Secured, | | | | |
| 6.40%, 7/20/20 | | 1,510,000 | | 1,457,226 |
| Ochsner Clinic Foundation Project, Refunding, Series A, 5.375%, 5/15/43 | | 5,000,000 | | 4,084,400 |
| Ochsner Clinic Foundation Project, Series B, 5.25%, 5/15/27 | | 3,990,000 | | 3,523,689 |
| Ochsner Clinic Foundation Project, Series B, ETM, 5.75%, 5/15/23 | | 2,500,000 | | 3,040,600 |
| Tulane University of Louisiana, Series A, AMBAC Insured, Pre-Refunded, 5.125%, | | | | |
| 7/01/27 | | 3,000,000 | | 3,180,900 |
| |
| 116 | Annual Report | | | | |
| | | | |
| Franklin Tax-Free Trust | | | | |
| |
| Statement of Investments, February 28, 2011 (continued) | | | | |
| |
| |
| Franklin Louisiana Tax-Free Income Fund | | Principal Amount | | Value |
| Municipal Bonds (continued) | | | | |
| Louisiana (continued) | | | | |
| Louisiana State Citizens Property Insurance Corp. Assessment Revenue, | | | | |
| Series B, AMBAC Insured, 5.00%, 6/01/23 | $ | 5,000,000 | $ | 4,719,350 |
| Series C-2, Assured Guaranty, 6.75%, 6/01/26 | | 5,000,000 | | 5,745,100 |
| Louisiana State Gas and Fuels Tax Revenue, Series A, | | | | |
| AGMC Insured, 5.00%, 5/01/31 | | 15,000,000 | | 15,244,350 |
| AMBAC Insured, 5.00%, 6/01/27 | | 3,500,000 | | 3,549,945 |
| NATL RE, FGIC Insured, 5.00%, 5/01/35 | | 2,300,000 | | 2,287,074 |
| Louisiana State GO, Match, Refunding, Series B, CIFG Insured, 5.00%, | | | | |
| 7/15/24 | | 3,475,000 | | 3,649,758 |
| 7/15/25 | | 1,765,000 | | 1,842,466 |
| Louisiana State Offshore Term Authority Deepwater Port Revenue, Loop LLC Project, Refunding, | | | | |
| 5.00%, 10/01/20 | | 5,000,000 | | 5,025,950 |
| Louisiana State University and Agricultural and Mechanical College Board Revenue, | | | | |
| AMBAC Insured, 5.00%, 7/01/22 | | 5,000,000 | | 5,205,300 |
| Auxiliary, NATL RE, FGIC Insured, 5.00%, 7/01/31 | | 3,000,000 | | 3,008,130 |
| Auxiliary, Series A, 5.00%, 7/01/40 | | 5,000,000 | | 4,699,900 |
| Auxiliary, Series B, AMBAC Insured, 5.00%, 7/01/27 | | 1,500,000 | | 1,521,915 |
| Monroe Sales Tax Increment Revenue, Economic Development Project, Garret Road, Refunding, | | | | |
| Assured Guaranty, | | | | |
| 5.375%, 3/01/24 | | 1,035,000 | | 1,075,510 |
| 5.50%, 3/01/25 | | 2,145,000 | | 2,228,634 |
| New Orleans Aviation Board Revenue, Restructuring GARB, Refunding, Series A-1, | | | | |
| Assured Guaranty, 6.00%, 1/01/23 | | 2,000,000 | | 2,197,320 |
| New Orleans GO, | | | | |
| Drainage Systems, AMBAC Insured, 5.00%, 12/01/18 | | 1,000,000 | | 1,002,620 |
| Public Improvement, AMBAC Insured, 5.25%, 12/01/29 | | 1,485,000 | | 1,446,865 |
| Public Improvement, FGIC Insured, 5.25%, 12/01/21 | | 1,295,000 | | 1,311,680 |
| Public Improvement, FGIC Insured, 5.125%, 12/01/26 | | 2,000,000 | | 1,973,280 |
| Radian Insured, 5.125%, 12/01/30 | | 10,055,000 | | 9,533,849 |
| Refunding, NATL Insured, 5.125%, 9/01/21 | | 2,000,000 | | 2,018,720 |
| New Orleans Sewage Service Revenue, Refunding, Assured Guaranty, 6.25%, 6/01/29 | | 500,000 | | 500,260 |
| Port New Orleans Board of Commissioners Port Facility Revenue, Refunding, Assured Guaranty, | | | | |
| 5.125%, 4/01/38 | | 5,000,000 | | 4,339,850 |
| Regional Transit Authority Sales Tax Revenue, Sales Tax, AGMC Insured, 5.00%, 12/01/30 | | 1,500,000 | | 1,501,035 |
| St. John the Baptist Parish EDR, USX Corp. Project, Refunding, 5.35%, 12/01/13 | | 2,500,000 | | 2,505,350 |
| St. John the Baptist Parish Revenue, Marathon Oil Corp. Project, Series A, 5.125%, 6/01/37 | | 5,000,000 | | 4,610,550 |
| St. Tammany Parish Utilities Revenue, Series B, | | | | |
| 5.50%, 8/01/35 | | 2,650,000 | | 2,669,212 |
| 5.00%, 8/01/44 | | 3,290,000 | | 3,020,812 |
| St. Tammany Public Trust Financing Authority SFMR, Series A, FHA Insured, ETM, 7.20%, | | | | |
| 7/01/11 | | 50,000 | | 51,134 |
| Terrebonne Parish Hospital Service District No. 1 Hospital Revenue, Terrebonne General Medical | | | | |
| Center Project, Refunding, AMBAC Insured, 5.50%, 4/01/33 | | 2,155,000 | | 2,098,496 |
| University of Louisiana System Board of Supervisors Revenue, Northwestern State University | | | | |
| Wellness, Recreation and Activity Center, AMBAC Insured, 5.10%, 4/01/24 | | 1,000,000 | | 966,620 |
| | | | | 335,667,032 |
Annual Report | 117
| | | | |
| Franklin Tax-Free Trust | | | | |
| |
| Statement of Investments, February 28, 2011 (continued) | | | | |
| |
| |
| Franklin Louisiana Tax-Free Income Fund | | Principal Amount | | Value |
| Municipal Bonds (continued) | | | | |
| U.S. Territories 11.4% | | | | |
| Puerto Rico 10.6% | | | | |
| Puerto Rico Commonwealth GO, Public Improvement, | | | | |
| Refunding, Series A-4, AGMC Insured, 5.25%, 7/01/30 | $ | 5,000,000 | $ | 4,904,450 |
| Series A, 5.00%, 7/01/33 | | 615,000 | | 534,386 |
| Puerto Rico Commonwealth Highway and Transportation Authority Transportation Revenue, | | | | |
| Refunding, Series L, NATL Insured, 5.25%, 7/01/35 | | 10,000,000 | | 8,859,500 |
| Puerto Rico Electric Power Authority Power Revenue, | | | | |
| Series CCC, 5.25%, 7/01/27 | | 5,000,000 | | 4,892,400 |
| Series WW, 5.25%, 7/01/33 | | 6,450,000 | | 5,918,971 |
| Puerto Rico Sales Tax FICO Sales Tax Revenue, first sub., | | | | |
| Series A, 5.50%, 8/01/42 | | 6,000,000 | | 5,601,720 |
| Series B, 6.375%, 8/01/39 | | 10,000,000 | | 10,324,100 |
| | | | | 41,035,527 |
| U.S. Virgin Islands 0.8% | | | | |
| Virgin Islands PFAR, Matching Fund Loan Note, sub. lien, Series B, 5.00%, 10/01/25 | | 3,500,000 | | 3,346,210 |
| Total U.S. Territories | | | | 44,381,737 |
| Total Municipal Bonds (Cost $387,955,883) 98.0% | | | | 380,048,769 |
| Other Assets, less Liabilities 2.0% | | | | 7,571,094 |
| Net Assets 100.0% | | | $ | 387,619,863 |
| |
| |
| |
| See Abbreviations on page 180. | | | | |
118 | The accompanying notes are an integral part of these financial statements. | Annual Report
| | | | | | | | | | | | | | | |
| Franklin Tax-Free Trust | | | | | | | | | | | | | |
| |
| Financial Highlights | | | | | | | | | | | | | | | |
| |
| Franklin Maryland Tax-Free Income Fund | | | | | | | | | | | | | | | |
| | | | | | Year Ended February 28, | | | | |
| Class A | | 2011 | | | 2010 | | | 2009 | | | 2008 | a | | 2007 | |
| Per share operating performance | | | | | | | | | | | | | | | |
| (for a share outstanding throughout the year) | | | | | | | | | | | | | | | |
| Net asset value, beginning of year | $ | 11.30 | | $ | 10.35 | | $ | 10.81 | | $ | 11.84 | | $ | 11.77 | |
| Income from investment operationsb: | | | | | | | | | | | | | | | |
| Net investment incomec | | 0.46 | | | 0.49 | | | 0.49 | | | 0.48 | | | 0.49 | |
| Net realized and unrealized gains (losses) | | (0.38 | ) | | 0.95 | | | (0.47 | ) | | (1.03 | ) | | 0.08 | |
| Total from investment operations | | 0.08 | | | 1.44 | | | 0.02 | | | (0.55 | ) | | 0.57 | |
| Less distributions from net investment income | | (0.47 | ) | | (0.49 | ) | | (0.48 | ) | | (0.48 | ) | | (0.50 | ) |
| Redemption feesd | | — | | | — | | | —e | | | —e | | | —e | |
| Net asset value, end of year | $ | 10.91 | | $ | 11.30 | | $ | 10.35 | | $ | 10.81 | | $ | 11.84 | |
| |
| Total returnf | | 0.61 | % | | 14.17 | % | | 0.20 | % | | (4.80 | )% | | 4.96 | % |
| |
| Ratios to average net assets | | | | | | | | | | | | | | | |
| Expenses | | 0.65 | % | | 0.66 | % | | 0.67 | % | | 0.67 | % | | 0.68 | % |
| Net investment income | | 4.06 | % | | 4.44 | % | | 4.56 | % | | 4.18 | % | | 4.21 | % |
| |
| Supplemental data | | | | | | | | | | | | | | | |
| Net assets, end of year (000’s) | $ | 471,729 | | $ | 511,636 | | $ | 426,218 | | $ | 417,427 | | $ | 410,890 | |
| Portfolio turnover rate | | 11.99 | % | | 7.33 | % | | 8.94 | % | | 10.28 | % | | 7.84 | % |
| |
| |
| aFor the year ended February 29. | | | | | | | | | | | | | | | |
| bThe amount shown for a share outstanding throughout the period may not correlate with the Statement of Operations for the period due to the timing of sales and repurchases of | |
| the Fund shares in relation to income earned and/or fluctuating market value of the investments of the Fund. | | | | | | | | | | | | | |
| cBased on average daily shares outstanding. | | | | | | | | | | | | | | | |
| dEffective September 1, 2008, the redemption fee was eliminated. | | | | | | | | | | | | | |
| eAmount rounds to less than $0.01 per share. | | | | | | | | | | | | | | | |
| fTotal return does not reflect sales commissions or contingent deferred sales charges, if applicable. | | | | | | | | | | | | | |
| |
| |
| |
| |
| Annual Report | | | The accompanying notes are an integral part of these financial statements. | 119 | |
| | | | | | | | | | | | | | | | | |
| Franklin Tax-Free Trust | | | | | | | | | | | | | | | | | |
| |
| Financial Highlights (continued) | | | | | | | | | | | | | | | | | |
| |
| Franklin Maryland Tax-Free Income Fund | | | | | | | | | | | | | | | | | |
| | | | | | Year Ended February 28, | | | | |
| Class C | | 2011 | | | 2010 | | | | | 2009 | | | 2008 | a | | 2007 | |
| Per share operating performance | | | | | | | | | | | | | | | | | |
| (for a share outstanding throughout the year) | | | | | | | | | | | | | | | | | |
| Net asset value, beginning of year | $ | 11.46 | | $ | 10.50 | | | | $ | 10.95 | | $ | 11.99 | | $ | 11.91 | |
| Income from investment operationsb: | | | | | | | | | | | | | | | | | |
| Net investment incomec | | 0.40 | | | 0.43 | | | | | 0.44 | | | 0.43 | | | 0.43 | |
| Net realized and unrealized gains (losses) | | (0.38 | ) | | 0.96 | | | | | (0.47 | ) | | (1.05 | ) | | 0.08 | |
| Total from investment operations | | 0.02 | | | 1.39 | | | | | (0.03 | ) | | (0.62 | ) | | 0.51 | |
| Less distributions from net investment income | | (0.40 | ) | | (0.43 | ) | | (0.42 | ) | | (0.42 | ) | | (0.43 | ) |
| Redemption feesd | | — | | | — | | | | | —e | | | —e | | | —e | |
| Net asset value, end of year | $ | 11.08 | | $ | 11.46 | | | | $ | 10.50 | | $ | 10.95 | | $ | 11.99 | |
| |
| Total returnf | | 0.12 | % | | 13.45 | % | | | | (0.26 | )% | | (5.35 | )% | | 4.42 | % |
| |
| Ratios to average net assets | | | | | | | | | | | | | | | | | |
| Expenses | | 1.20 | % | | 1.21 | % | | | | 1.22 | % | | 1.22 | % | | 1.23 | % |
| Net investment income | | 3.51 | % | | 3.89 | % | | | | 4.01 | % | | 3.63 | % | | 3.66 | % |
| |
| Supplemental data | | | | | | | | | | | | | | | | | |
| Net assets, end of year (000’s) | $ | 143,708 | | $ | 142,575 | | | | $ | 101,328 | | $ | 82,927 | | $ | 71,937 | |
| Portfolio turnover rate | | 11.99 | % | | 7.33 | % | | | | 8.94 | % | | 10.28 | % | | 7.84 | % |
| |
| |
| aFor the year ended February 29. | | | | | | | | | | | | | | | | | |
| bThe amount shown for a share outstanding throughout the period may not correlate with the Statement of Operations for the period due to the timing of sales and repurchases of | |
| the Fund shares in relation to income earned and/or fluctuating market value of the investments of the Fund. | | | | | | | | | | | | | | | |
| cBased on average daily shares outstanding. | | | | | | | | | | | | | | | | | |
| dEffective September 1, 2008, the redemption fee was eliminated. | | | | | | | | | | | | | | | | | |
| eAmount rounds to less than $0.01 per share. | | | | | | | | | | | | | | | | | |
| fTotal return does not reflect sales commissions or contingent deferred sales charges, if applicable. | | | | | | | | | | | | | | | |
| |
| |
| |
| |
| 120 | The accompanying notes are an integral part of these financial statements. | | | Annual Report | | | | | | | |
| | | | | | |
| Franklin Tax-Free Trust | | | | |
| |
| Financial Highlights (continued) | | | | | | |
| |
| Franklin Maryland Tax-Free Income Fund | | | | | | |
| | | Year Ended | |
| | | February 28, | |
| Advisor Class | | 2011 | | | 2010 | a |
| Per share operating performance | | | | | | |
| (for a share outstanding throughout the year) | | | | | | |
| Net asset value, beginning of year | $ | 11.30 | | $ | 10.69 | |
| Income from investment operationsb: | | | | | | |
| Net investment incomec | | 0.47 | | | 0.33 | |
| Net realized and unrealized gains (losses) | | (0.38 | ) | | 0.61 | |
| Total from investment operations | | 0.09 | | | 0.94 | |
| Less distributions from net investment income | | (0.48 | ) | | (0.33 | ) |
| Net asset value, end of year | $ | 10.91 | | $ | 11.30 | |
| |
| Total returnd | | 0.71 | % | | 8.83 | % |
| |
| Ratios to average net assetse | | | | | | |
| Expenses | | 0.55 | % | | 0.56 | % |
| Net investment income | | 4.16 | % | | 4.54 | % |
| |
| Supplemental data | | | | | | |
| Net assets, end of year (000’s) | $ | 6,245 | | $ | 3,504 | |
| Portfolio turnover rate | | 11.99 | % | | 7.33 | % |
| |
| |
| aFor the period July 1, 2009 (effective date) to February 28, 2010. | | | | |
| bThe amount shown for a share outstanding throughout the period may not correlate with the Statement of Operations for the period due to the timing of sales and repurchases of | |
| the Fund shares in relation to income earned and/or fluctuating market value of the investments of the Fund. | | | | |
| cBased on average daily shares outstanding. | | | | | | |
| dTotal return is not annualized for periods less than one year. | | | | | | |
| eRatios are annualized for periods less than one year. | | | | | | |
| |
| |
| |
| |
| Annual Report | | | The accompanying notes are an integral part of these financial statements. | 121 | |
| | | | |
| Franklin Tax-Free Trust | | | | |
| |
| Statement of Investments, February 28, 2011 | | | | |
| |
| |
| Franklin Maryland Tax-Free Income Fund | | Principal Amount | | Value |
| Municipal Bonds 99.0% | | | | |
| Maryland 75.1% | | | | |
| Anne Arundel County GO, Refunding, 4.625%, 3/01/32 | $ | 2,000,000 | $ | 2,012,680 |
| Anne Arundel County MFR, Glenview Gardens Apartments Project, Mandatory Put 1/01/27, | | | | |
| 5.00%, 1/01/28 | | 2,000,000 | | 1,952,220 |
| Baltimore Convention Center Hotel Revenue, Senior Series A, XLCA Insured, 5.25%, 9/01/39 | | 23,095,000 | | 18,687,319 |
| Baltimore County GO, Refunding, 4.00%, 8/01/28 | | 5,315,000 | | 5,275,297 |
| Baltimore County Metropolitan 68th District GO, Refunding, 5.00%, 8/01/32 | | 1,000,000 | | 1,017,960 |
| Baltimore Project Revenue, | | | | |
| sub. bond, Water Projects, Series A, 5.375%, 7/01/34 | | 750,000 | | 760,748 |
| sub. bond, Water Projects, Series A, 5.75%, 7/01/39 | | 1,250,000 | | 1,307,063 |
| Wastewater Projects, AGMC Insured, 5.00%, 7/01/37 | | 5,000,000 | | 4,999,650 |
| Wastewater Projects, Series A, AGMC Insured, 5.00%, 7/01/38 | | 5,000,000 | | 5,008,750 |
| Wastewater Projects, Series C, 5.125%, 7/01/34 | | 1,835,000 | | 1,871,627 |
| Wastewater Projects, Series C, 5.625%, 7/01/39 | | 2,965,000 | | 3,057,152 |
| Wastewater Projects, Series C, AMBAC Insured, 5.00%, 7/01/31 | | 2,855,000 | | 2,939,508 |
| Wastewater Projects, Series D, AMBAC Insured, 5.00%, 7/01/32 | | 2,120,000 | | 2,158,966 |
| Water Projects, Refunding, Series A, NATL RE, FGIC Insured, 5.125%, 7/01/42 | | 11,740,000 | | 11,759,254 |
| Water Projects, Series C, AMBAC Insured, 5.00%, 7/01/32 | | 5,000,000 | | 5,091,900 |
| Carroll County Revenue, Fairhaven and Copper Ridge, Refunding, Series A, Radian Insured, | | | | |
| 5.375%, 1/01/16 | | 2,000,000 | | 1,917,960 |
| 5.50%, 1/01/19 | | 1,000,000 | | 908,860 |
| 5.625%, 1/01/25 | | 2,000,000 | | 1,704,940 |
| Frederick County Educational Facilities Revenue, Mount St. Mary University, Refunding, | | | | |
| 5.625%, 9/01/38 | | 5,000,000 | | 4,306,500 |
| Frederick GO, Public Improvements, Series A, 5.00%, 3/01/34 | | 8,580,000 | | 8,813,204 |
| Maryland Environmental Services COP, Water and Waste Facilities, Series A, 6.70%, 6/01/11 | | 430,000 | | 431,896 |
| Maryland State Community Development Administration Department of Housing and CDR, | | | | |
| Housing, Refunding, Series A, 6.00%, 7/01/32 | | 4,000,000 | | 4,000,560 |
| Residential, Series B, 4.75%, 9/01/39 | | 5,335,000 | | 4,980,222 |
| Residential, Series C, 5.375%, 9/01/39 | | 10,000,000 | | 9,963,800 |
| Residential, Series C, 5.65%, 9/01/48 | | 6,215,000 | | 6,279,201 |
| Residential, Series D, 5.25%, 9/01/29 | | 2,550,000 | | 2,482,349 |
| Maryland State EDC, PCR, Potomac Electric Project, Refunding, 6.20%, 9/01/22 | | 10,000,000 | | 11,375,300 |
| Maryland State EDC Student Housing Revenue, | | | | |
| University of Maryland Baltimore County Project, Refunding, XLCA Insured, 5.00%, | | | | |
| 7/01/30 | | 3,245,000 | | 2,685,367 |
| University of Maryland Baltimore County Project, Refunding, XLCA Insured, 5.00%, | | | | |
| 7/01/35 | | 3,675,000 | | 2,944,741 |
| University of Maryland College Park Projects, Refunding, CIFG Insured, 5.00%, 6/01/25 | | 2,500,000 | | 2,328,225 |
| University of Maryland College Park Projects, Refunding, CIFG Insured, 5.00%, 6/01/28 | | 2,000,000 | | 1,812,620 |
| University of Maryland College Park Projects, Refunding, CIFG Insured, 5.00%, 6/01/33 | | 9,370,000 | | 8,133,254 |
| Maryland State EDC Utility Infrastructure Revenue, University College Park Project, | | | | |
| AMBAC Insured, Pre-Refunded, 5.00%, 7/01/19 | | 1,675,000 | | 1,700,376 |
| Maryland State GO, State and Local Facilities Loan, | | | | |
| Refunding, First Series C, 4.00%, 3/01/22 | | 9,000,000 | | 9,543,420 |
| Refunding, Third Series C, 4.00%, 11/01/19 | | 10,000,000 | | 11,022,100 |
| Third Series A, 5.00%, 11/01/21 | | 5,000,000 | | 5,823,900 |
122 | Annual Report
| | | | |
| Franklin Tax-Free Trust | | | | |
| |
| Statement of Investments, February 28, 2011 (continued) | | | | |
| |
| |
| Franklin Maryland Tax-Free Income Fund | | Principal Amount | | Value |
| Municipal Bonds (continued) | | | | |
| Maryland (continued) | | | | |
| Maryland State Health and Higher Educational Facilities Authority Revenue, | | | | |
| Anne Arundel Health System, Series A, 6.75%, 7/01/29 | $ | 2,000,000 | $ | 2,210,040 |
| Anne Arundel Health System, Series A, 6.75%, 7/01/39 | | 2,000,000 | | 2,173,400 |
| Anne Arundel Health System, Series A, Pre-Refunded, 5.125%, 7/01/34 | | 2,500,000 | | 2,818,250 |
| Anne Arundel Medical Center, AGMC Insured, 5.125%, 7/01/33 | | 8,365,000 | | 8,364,833 |
| Carroll County General Hospital, 6.00%, 7/01/26 | | 2,000,000 | | 2,023,420 |
| Carroll County General Hospital, 5.80%, 7/01/32 | | 5,000,000 | | 5,007,750 |
| Carroll Hospital Center, 5.00%, 7/01/40 | | 6,790,000 | | 6,054,236 |
| Catholic Health Initiatives, Series A, 6.00%, 12/01/20 | | 715,000 | | 720,212 |
| Edenwald, Series A, 5.40%, 1/01/31 | | 1,000,000 | | 844,850 |
| Helix Health Issue, AMBAC Insured, ETM, 5.00%, 7/01/27 | | 11,000,000 | | 12,537,690 |
| Johns Hopkins Medical Institutions, Series A, 5.00%, 5/15/37 | | 9,395,000 | | 9,192,820 |
| LifeBridge Health, Refunding, Assured Guaranty, 5.00%, 7/01/34 | | 10,945,000 | | 10,607,237 |
| LifeBridge Health, Refunding, Assured Guaranty, 4.75%, 7/01/38 | | 10,000,000 | | 9,042,300 |
| Loyola College, Series A, 5.00%, 10/01/40 | | 10,050,000 | | 9,473,230 |
| Maryland Institute College of Art, 5.00%, 6/01/35 | | 2,000,000 | | 1,766,900 |
| Maryland Institute College of Art, 5.00%, 6/01/36 | | 5,000,000 | | 4,406,600 |
| Maryland Institute College of Art, 5.00%, 6/01/40 | | 10,000,000 | | 8,677,500 |
| Maryland Institute College of Art, Pre-Refunded, 5.625%, 6/01/36 | | 3,600,000 | | 3,646,152 |
| Mercy Medical Center, Refunding, 5.625%, 7/01/31 | | 5,500,000 | | 5,036,020 |
| Mercy Medical Center, Series A, 5.00%, 7/01/37 | | 10,000,000 | | 7,961,100 |
| Parking, Johns Hopkins Medical Institutions, AMBAC Insured, 5.00%, 7/01/27 | | 655,000 | | 616,630 |
| Parking, Johns Hopkins Medical Institutions, AMBAC Insured, 5.00%, 7/01/34 | | 5,000,000 | | 4,347,850 |
| Parking, Johns Hopkins Medical Institutions, Refunding, Series B, AMBAC Insured, 5.00%, | | | | |
| 7/01/38 | | 6,200,000 | | 5,788,692 |
| Peninsula Regional Medical Center, 5.00%, 7/01/36 | | 6,625,000 | | 6,174,500 |
| Roland Park Place Project, Refunding, 5.625%, 7/01/18 | | 2,500,000 | | 2,454,975 |
| Roland Park Place Project, Refunding, 5.625%, 7/01/24 | | 2,680,000 | | 2,439,363 |
| The Johns Hopkins University Issue, Series A, 5.00%, 7/01/32 | | 29,000,000 | | 29,149,640 |
| The Johns Hopkins University Issue, Series A, 5.00%, 7/01/38 | | 5,805,000 | | 5,827,523 |
| Union Hospital Cecil County Issue, 5.00%, 7/01/35 | | 3,015,000 | | 2,780,704 |
| University of Maryland Medical System, Refunding, AMBAC Insured, 5.25%, 7/01/28 | | 15,000,000 | | 15,034,950 |
| University of Maryland Medical System, Series A, 5.00%, 7/01/41 | | 2,500,000 | | 2,277,600 |
| Washington County Hospital, 5.75%, 1/01/38 | | 2,500,000 | | 2,266,075 |
| Western Maryland Health, Refunding, Series A, NATL Insured, 4.75%, 7/01/36 | | 17,120,000 | | 14,731,075 |
| Maryland State Transportation Authority Lease Revenue, Metrorail Parking Project, | | | | |
| AMBAC Insured, 5.00%, 7/01/28 | | 3,975,000 | | 4,086,260 |
| Maryland State Transportation Authority Parking Revenue, AMBAC Insured, 5.00%, 3/01/27 | | 8,000,000 | | 8,104,160 |
| Maryland State Transportation Authority Transportation Facility Projects Revenue, | | | | |
| AGMC Insured, 5.00%, 7/01/27 | | 5,890,000 | | 6,104,926 |
| AGMC Insured, 5.00%, 7/01/31 | | 7,455,000 | | 7,656,658 |
| AGMC Insured, 5.00%, 7/01/32 | | 7,165,000 | | 7,247,612 |
| AGMC Insured, 5.00%, 7/01/34 | | 7,500,000 | | 7,625,850 |
| Series A, 5.00%, 7/01/23 | | 3,695,000 | | 4,003,311 |
| Montgomery County GO, Consolidated Public Improvement, Refunding, Series A, 4.00%, | | | | |
| 11/01/20 | | 10,000,000 | | 10,884,800 |
| 8/01/21 | | 10,000,000 | | 10,805,900 |
Annual Report | 123
| | | | |
| Franklin Tax-Free Trust | | | | |
| |
| Statement of Investments, February 28, 2011 (continued) | | | | |
| |
| |
| Franklin Maryland Tax-Free Income Fund | | Principal Amount | | Value |
| Municipal Bonds (continued) | | | | |
| Maryland (continued) | | | | |
| Morgan State University Maryland and Auxiliary Facilities Fees Revenue, Series A, NATL RE, | | | | |
| FGIC Insured, 5.00%, 7/01/32 | $ | 6,450,000 | $ | 6,483,282 |
| Prince George’s County GO, Consolidated Public Improvement, 4.40%, 9/15/22 | | 10,000,000 | | 10,250,600 |
| Prince George’s County IDA Lease Revenue, Upper Marlboro Justice, Series B, NATL Insured, | | | | |
| 4.75%, 6/30/30 | | 4,000,000 | | 4,006,720 |
| Westminster Education Facilities Revenue, McDaniel College Inc., Pre-Refunded, 5.50%, | | | | |
| 4/01/27 | | 425,000 | | 457,933 |
| 4/01/32 | | 1,500,000 | | 1,616,235 |
| | | | | 466,847,253 |
| District of Columbia 0.4% | | | | |
| Washington Metropolitan Area Transit Authority Gross Revenue, Transit, Series A, 5.125%, | | | | |
| 7/01/32 | | 2,500,000 | | 2,548,200 |
| U.S. Territories 23.5% | | | | |
| Puerto Rico 23.0% | | | | |
| Puerto Rico Commonwealth Aqueduct and Sewer Authority Revenue, senior lien, Series A, | | | | |
| 6.00%, 7/01/38 | | 2,100,000 | | 1,971,438 |
| Puerto Rico Commonwealth GO, Public Improvement, | | | | |
| AGMC Insured, Pre-Refunded, 5.25%, 7/01/27 | | 1,520,000 | | 1,544,882 |
| AGMC Insured, Pre-Refunded, 5.125%, 7/01/30 | | 4,360,000 | | 4,429,586 |
| Refunding, AGMC Insured, 5.25%, 7/01/27 | | 1,015,000 | | 1,014,939 |
| Refunding, AGMC Insured, 5.125%, 7/01/30 | | 2,870,000 | | 2,772,477 |
| Refunding, Series A, FGIC Insured, 5.50%, 7/01/21 | | 10,000,000 | | 10,325,400 |
| Refunding, Series A, FGIC Insured, 5.50%, 7/01/22 | | 5,000,000 | | 5,135,400 |
| Series A, 5.00%, 7/01/27 | | 6,250,000 | | 5,807,375 |
| Puerto Rico Commonwealth Highway and Transportation Authority Transportation Revenue, | | | | |
| Refunding, Series N, Assured Guaranty, 5.25%, 7/01/36 | | 5,000,000 | | 4,706,300 |
| Refunding, Series N, FGIC Insured, 5.25%, 7/01/39 | | 5,000,000 | | 4,351,350 |
| Series D, Pre-Refunded, 5.25%, 7/01/38 | | 5,000,000 | | 5,302,850 |
| Series G, 5.00%, 7/01/33 | | 2,170,000 | | 1,897,535 |
| Puerto Rico Convention Center District Authority Hotel Occupancy Tax Revenue, Series A, | | | | |
| AMBAC Insured, 5.00%, 7/01/31 | | 5,000,000 | | 4,459,900 |
| FGIC Insured, 5.00%, 7/01/24 | | 5,000,000 | | 4,774,700 |
| Puerto Rico Electric Power Authority Power Revenue, | | | | |
| Refunding, Series SS, AGMC Insured, 5.00%, 7/01/30 | | 10,000,000 | | 9,865,200 |
| Series II, Pre-Refunded, 5.25%, 7/01/31 | | 3,000,000 | | 3,219,810 |
| Series WW, 5.50%, 7/01/38 | | 5,000,000 | | 4,554,400 |
| Series XX, 5.25%, 7/01/40 | | 13,500,000 | | 11,790,090 |
| Puerto Rico HFAR, Capital Fund Modernization, 5.125%, 12/01/27 | | 4,250,000 | | 4,251,020 |
| Puerto Rico PBA Guaranteed Revenue, Government Facilities, | | | | |
| Refunding, Series D, 5.25%, 7/01/36 | | 520,000 | | 456,664 |
| Refunding, Series K, AGMC Insured, 5.25%, 7/01/27 | | 5,300,000 | | 5,310,229 |
| Refunding, Series N, 5.00%, 7/01/32 | | 5,000,000 | | 4,418,850 |
| Refunding, Series Q, 5.625%, 7/01/39 | | 5,000,000 | | 4,630,550 |
| Series D, Pre-Refunded, 5.25%, 7/01/36 | | 1,480,000 | | 1,569,644 |
124 | Annual Report
| | | | |
| Franklin Tax-Free Trust | | | | |
| |
| Statement of Investments, February 28, 2011 (continued) | | | | |
| |
| |
| Franklin Maryland Tax-Free Income Fund | | Principal Amount | | Value |
| Municipal Bonds (continued) | | | | |
| U.S. Territories (continued) | | | | |
| Puerto Rico (continued) | | | | |
| Puerto Rico Sales Tax FICO Sales Tax Revenue, first sub., | | | | |
| Series A, 5.75%, 8/01/37 | $ | 11,425,000 | $ | 11,317,148 |
| Series A, 6.00%, 8/01/42 | | 18,160,000 | | 18,194,504 |
| Series C, 5.25%, 8/01/41 | | 1,300,000 | | 1,169,350 |
| University of Puerto Rico Revenues, University System, Refunding, Series P, 5.00%, 6/01/30 | | 4,000,000 | | 3,614,320 |
| | | | | 142,855,911 |
| U.S. Virgin Islands 0.5% | | | | |
| Virgin Islands PFAR, | | | | |
| Gross Receipts Taxes Loan Note, Refunding, Series A, AGMC Insured, 5.00%, 10/01/22 | | 2,000,000 | | 2,045,240 |
| senior lien, Capital Projects, Series A-1, 5.00%, 10/01/29 | | 1,000,000 | | 941,330 |
| | | | | 2,986,570 |
| Total U.S. Territories | | | | 145,842,481 |
| Total Municipal Bonds before Short Term Investments (Cost $636,382,276) | | | | 615,237,934 |
| Short Term Investments 0.4% | | | | |
| Municipal Bonds 0.4% | | | | |
| Maryland 0.4% | | | | |
| aMaryland State EDC, EDR, U.S. Pharmacopeial Convention Inc. Project, Refunding, Series B, | | | | |
| Daily VRDN and Put, 0.27%, 7/01/38 | | 1,400,000 | | 1,400,000 |
| aMaryland State Health and Higher Educational Facilities Authority Revenue, Upper Chesapeake | | | | |
| Hospital, Refunding, Series A, Daily VRDN and Put, 0.27%, 1/01/43 | | 1,200,000 | | 1,200,000 |
| Total Short Term Investments (Cost $2,600,000) | | | | 2,600,000 |
| Total Investments (Cost $638,982,276) 99.4% | | | | 617,837,934 |
| Other Assets, less Liabilities 0.6% | | | | 3,843,646 |
| Net Assets 100.0% | | | $ | 621,681,580 |
See Abbreviations on page 180.
aVariable rate demand notes (VRDNs) are tax-exempt obligations which contain a floating or variable interest rate adjustment formula and an unconditional right of demand to receive payment of the principal balance plus accrued interest at specified dates. The coupon rate shown represents the rate at period end.
Annual Report | The accompanying notes are an integral part of these financial statements. | 125
| | | | | | | | | | | | | | | |
| Franklin Tax-Free Trust | | | | | | | | | | | | | | | |
| Financial Highlights | | | | | | | | | | | | | | | |
| |
| Franklin Missouri Tax-Free Income Fund | | | | | | | | | | | | | | | |
| | | | | | Year Ended February 28, | | | | |
| Class A | | 2011 | | | 2010 | | | 2009 | | | 2008 | a | | 2007 | |
| Per share operating performance | | | | | | | | | | | | | | | |
| (for a share outstanding throughout the year) | | | | | | | | | | | | | | | |
| Net asset value, beginning of year | $ | 11.98 | | $ | 11.28 | | $ | 11.52 | | $ | 12.37 | | $ | 12.31 | |
| Income from investment operationsb: | | | | | | | | | | | | | | | |
| Net investment incomec | | 0.50 | | | 0.51 | | | 0.52 | | | 0.51 | | | 0.52 | |
| Net realized and unrealized gains (losses) | | (0.42 | ) | | 0.70 | | | (0.25 | ) | | (0.85 | ) | | 0.06 | |
| Total from investment operations | | 0.08 | | | 1.21 | | | 0.27 | | | (0.34 | ) | | 0.58 | |
| Less distributions from net investment income | | (0.51 | ) | | (0.51 | ) | | (0.51 | ) | | (0.51 | ) | | (0.52 | ) |
| Redemption feesd | | — | | | — | | | —e | | | —e | | | —e | |
| Net asset value, end of year | $ | 11.55 | | $ | 11.98 | | $ | 11.28 | | $ | 11.52 | | $ | 12.37 | |
| |
| Total returnf | | 0.58 | % | | 10.93 | % | | 2.39 | % | | (2.86 | )% | | 4.85 | % |
| |
| Ratios to average net assets | | | | | | | | | | | | | | | |
| Expenses | | 0.64 | % | | 0.65 | % | | 0.65 | % | | 0.66 | % | | 0.66 | % |
| Net investment income | | 4.18 | % | | 4.37 | % | | 4.50 | % | | 4.24 | % | | 4.25 | % |
| |
| Supplemental data | | | | | | | | | | | | | | | |
| Net assets, end of year (000’s) | $ | 884,732 | | $ | 863,925 | | $ | 691,272 | | $ | 622,913 | | $ | 613,125 | |
| Portfolio turnover rate | | 9.18 | % | | 5.87 | % | | 12.44 | % | | 16.11 | % | | 19.77 | % |
|
| aFor the year ended February 29. |
| bThe amount shown for a share outstanding throughout the period may not correlate with the Statement of Operations for the period due to the timing of sales and repurchases of |
| the Fund shares in relation to income earned and/or fluctuating market value of the investments of the Fund. |
| cBased on average daily shares outstanding. |
| dEffective September 1, 2008, the redemption fee was eliminated. |
| eAmount rounds to less than $0.01 per share. |
| fTotal return does not reflect sales commissions or contingent deferred sales charges, if applicable. |
126 | The accompanying notes are an integral part of these financial statements. | Annual Report
| | | | | | | | | | | | | | | |
| Franklin Tax-Free Trust | | | | | | | | | | | | | | | |
| Financial Highlights (continued) | | | | | | | | | | | | | | | |
| |
| Franklin Missouri Tax-Free Income Fund | | | | | | | | | | | | | | | |
| | | | | | Year Ended February 28, | | | | |
| Class C | | 2011 | | | 2010 | | | 2009 | | | 2008 | a | | 2007 | |
| Per share operating performance | | | | | | | | | | | | | | | |
| (for a share outstanding throughout the year) | | | | | | | | | | | | | | | |
| Net asset value, beginning of year | $ | 12.07 | | $ | 11.35 | | $ | 11.60 | | $ | 12.45 | | $ | 12.39 | |
| Income from investment operationsb: | | | | | | | | | | | | | | | |
| Net investment incomec | | 0.44 | | | 0.45 | | | 0.46 | | | 0.45 | | | 0.45 | |
| Net realized and unrealized gains (losses) | | (0.43 | ) | | 0.72 | | | (0.26 | ) | | (0.86 | ) | | 0.06 | |
| Total from investment operations | | 0.01 | | | 1.17 | | | 0.20 | | | (0.41 | ) | | 0.51 | |
| Less distributions from net investment income | | (0.44 | ) | | (0.45 | ) | | (0.45 | ) | | (0.44 | ) | | (0.45 | ) |
| Redemption feesd | | — | | | — | | | —e | | | —e | | | —e | |
| Net asset value, end of year | $ | 11.64 | | $ | 12.07 | | $ | 11.35 | | $ | 11.60 | | $ | 12.45 | |
| |
| Total returnf | | 0.01 | % | | 10.44 | % | | 1.81 | % | | (3.45 | )% | | 4.25 | % |
| |
| Ratios to average net assets | | | | | | | | | | | | | | | |
| Expenses | | 1.19 | % | | 1.20 | % | | 1.20 | % | | 1.21 | % | | 1.21 | % |
| Net investment income | | 3.63 | % | | 3.82 | % | | 3.95 | % | | 3.69 | % | | 3.70 | % |
| |
| Supplemental data | | | | | | | | | | | | | | | |
| Net assets, end of year (000’s) | $ | 134,026 | | $ | 120,256 | | $ | 84,637 | | $ | 71,563 | | $ | 70,148 | |
| Portfolio turnover rate | | 9.18 | % | | 5.87 | % | | 12.44 | % | | 16.11 | % | | 19.77 | % |
|
| aFor the year ended February 29. |
| bThe amount shown for a share outstanding throughout the period may not correlate with the Statement of Operations for the period due to the timing of sales and repurchases of |
| the Fund shares in relation to income earned and/or fluctuating market value of the investments of the Fund. |
| cBased on average daily shares outstanding. |
| dEffective September 1, 2008, the redemption fee was eliminated. |
| eAmount rounds to less than $0.01 per share. |
| fTotal return does not reflect sales commissions or contingent deferred sales charges, if applicable. |
Annual Report | The accompanying notes are an integral part of these financial statements. | 127
| | | | | | |
| Franklin Tax-Free Trust | | | | | | |
| Financial Highlights (continued) | | | | | | |
| |
| Franklin Missouri Tax-Free Income Fund | | | | | | |
| | | Year Ended | |
| | | February 28, | |
| Advisor Class | | 2011 | | | 2010 | a |
| Per share operating performance | | | | | | |
| (for a share outstanding throughout the year) | | | | | | |
| Net asset value, beginning of year | $ | 11.98 | | $ | 11.48 | |
| Income from investment operationsb: | | | | | | |
| Net investment incomec | | 0.51 | | | 0.35 | |
| Net realized and unrealized gains (losses) | | (0.42 | ) | | 0.49 | |
| Total from investment operations | | 0.09 | | | 0.84 | |
| Less distributions from net investment income | | (0.52 | ) | | (0.34 | ) |
| Net asset value, end of year | $ | 11.55 | | $ | 11.98 | |
| |
| Total returnd | | 0.68 | % | | 7.37 | % |
| |
| Ratios to average net assetse | | | | | | |
| Expenses | | 0.54 | % | | 0.55 | % |
| Net investment income | | 4.28 | % | | 4.47 | % |
| |
| Supplemental data | | | | | | |
| Net assets, end of year (000’s) | $ | 37,557 | | $ | 12,860 | |
| Portfolio turnover rate | | 9.18 | % | | 5.87 | % |
|
| aFor the period July 1, 2009 (effective date) to February 28, 2010. |
| bThe amount shown for a share outstanding throughout the period may not correlate with the Statement of Operations for the period due to the timing of sales and repurchases of |
| the Fund shares in relation to income earned and/or fluctuating market value of the investments of the Fund. |
| cBased on average daily shares outstanding. |
| dTotal return is not annualized for periods less than one year. |
| eRatios are annualized for periods less than one year. |
128 | The accompanying notes are an integral part of these financial statements. | Annual Report
| | | | |
| Franklin Tax-Free Trust | | | | |
| |
| Statement of Investments, February 28, 2011 | | | | |
| |
| |
| Franklin Missouri Tax-Free Income Fund | | Principal Amount | | Value |
| Municipal Bonds 98.8% | | | | |
| Missouri 80.9% | | | | |
| Bi-State Development Agency Missouri-Illinois Metropolitan District Mass Transit Sales Tax | | | | |
| Revenue, Metrolink Cross County Extension, Assured Guaranty, 5.00%, | | | | |
| 10/01/35 | $ | 5,000,000 | $ | 4,971,800 |
| 10/01/39 | | 30,300,000 | | 29,800,656 |
| Bi-State Development Agency Missouri-Illinois Metropolitan District Revenue, Metrolink Cross | | | | |
| County Project, Series B, AGMC Insured, 5.00%, 10/01/32 | | 7,300,000 | | 7,304,964 |
| Boone County IDA Health Care Revenue, Retirement Center Project, GNMA Secured, 5.70%, | | | | |
| 10/20/22 | | 1,515,000 | | 1,532,468 |
| Cape Girardeau County IDA Health Care Facilities Revenue, | | | | |
| Southeast Missouri Hospital Assn., 5.00%, 6/01/36 | | 7,500,000 | | 6,324,825 |
| St. Francis Medical Center, Series A, 5.50%, 6/01/27 | | 6,350,000 | | 6,385,306 |
| St. Francis Medical Center, Series A, 5.50%, 6/01/32 | | 5,000,000 | | 4,999,550 |
| St. Francis Medical Center, Series A, 5.75%, 6/01/39 | | 3,150,000 | | 3,097,836 |
| Cape Girardeau County IDA Solid Waste Disposal Revenue, Procter and Gamble Paper | | | | |
| Products, 5.30%, 5/15/28 | | 6,875,000 | | 6,875,000 |
| Carroll County Public Water Supply District No. 1 Water System Revenue, Refunding, | | | | |
| 5.625%, 3/01/34 | | 1,000,000 | | 1,021,130 |
| 6.00%, 3/01/39 | | 1,000,000 | | 1,028,700 |
| Columbia Special Obligation Electric Utility Improvement Revenue, Annual Appropriation | | | | |
| Obligation, Series A, 5.75%, 10/01/33 | | 10,290,000 | | 11,136,558 |
| Curators of the University of Missouri System Facilities Revenue, | | | | |
| Series A, 5.00%, 11/01/33 | | 5,000,000 | | 5,113,300 |
| Series A, 5.00%, 11/01/35 | | 20,000,000 | | 20,201,800 |
| System Facilities, Refunding, Series A, 5.00%, 11/01/25 | | 5,750,000 | | 6,099,945 |
| System Facilities, Refunding, Series A, 5.00%, 11/01/26 | | 3,625,000 | | 3,824,883 |
| Florissant COP, NATL RE, FGIC Insured, 5.00%, 8/01/22 | | 1,285,000 | | 1,307,539 |
| Grandview COP, NATL RE, FGIC Insured, 5.00%, 1/01/23 | | 2,410,000 | | 2,454,489 |
| Hannibal IDA Health Facilities Revenue, Refunding, 5.00%, 3/01/22 | | 1,000,000 | | 959,950 |
| Independence School District GO, Missouri Direct Deposit Program, Series A, 5.00%, | | | | |
| 3/01/27 | | 3,300,000 | | 3,496,053 |
| 3/01/28 | | 3,000,000 | | 3,153,000 |
| 3/01/29 | | 3,000,000 | | 3,132,510 |
| Jackson County Reorganized School District No. 4 Blue Springs GO, Refunding and | | | | |
| Improvement, Series A, 5.00%, 3/01/29 | | 4,000,000 | | 4,122,200 |
| Jackson County Reorganized School District No. 7 Lee’s Summit GO, Missouri Direct Deposit | | | | |
| Program, Refunding and Improvement, AGMC Insured, 5.00%, 3/01/21 | | 5,700,000 | | 5,927,943 |
| Jackson County Special Obligation Revenue, | | | | |
| Harry S. Truman Sports Complex, AMBAC Insured, 5.00%, 12/01/28 | | 2,500,000 | | 2,504,775 |
| Harry S. Truman Sports Complex, AMBAC Insured, 5.00%, 12/01/29 | | 26,925,000 | | 26,472,660 |
| NATL Insured, 5.00%, 12/01/27 | | 3,105,000 | | 3,127,449 |
| Jefferson County Consolidated School District No. 006 Lease Participation COP, | | | | |
| AGMC Insured, 5.00%, 3/01/25 | | 1,050,000 | | 1,098,269 |
| Joplin IDA Health Facilities Revenue, Freeman Health Systems Project, | | | | |
| 5.50%, 2/15/29 | | 2,000,000 | | 1,853,660 |
| 5.75%, 2/15/35 | | 2,500,000 | | 2,296,425 |
| Kansas City IDAR, Kansas City Missouri IDA, AMBAC Insured, | | | | |
| 5.00%, 12/01/24 | | 4,470,000 | | 4,691,265 |
| 4.50%, 12/01/32 | | 8,250,000 | | 7,476,563 |
| 5.00%, 12/01/32 | | 15,000,000 | | 14,998,800 |
| |
| | | | | Annual Report | 129 |
| | | | |
| Franklin Tax-Free Trust | | | | |
| |
| Statement of Investments, February 28, 2011 (continued) | | | | |
| |
| |
| Franklin Missouri Tax-Free Income Fund | | Principal Amount | | Value |
| Municipal Bonds (continued) | | | | |
| Missouri (continued) | | | | |
| aKansas City Sanitation Sewer System Revenue, Series A, 5.25%, 1/01/34 | $ | 5,000,000 | $ | 5,141,750 |
| Kansas City Special Obligation Revenue, Arena Project, Refunding and Improvement, Series C, | | | | |
| 5.125%, 4/01/38 | | 10,000,000 | | 9,381,100 |
| Kansas City Special Obligation Tax Allocation, East Village Project, Series B, Assured Guaranty, | | | | |
| 5.00%, 4/15/31 | | 6,860,000 | | 7,049,748 |
| Kansas City Tax Increment Financing Commerce Tax Increment Revenue, Blue Parkway Town | | | | |
| Center Project, NATL Insured, 5.00%, 7/01/27 | | 1,730,000 | | 1,593,641 |
| Kansas City Water Revenue, Refunding and Improvement, Series A, 5.25%, 12/01/32 | | 12,725,000 | | 13,308,441 |
| Lake of the Ozarks Community Board Corp. Bridge System Revenue, Refunding, 5.25%, | | | | |
| 12/01/14 | | 535,000 | | 515,087 |
| 12/01/26 | | 800,000 | | 585,368 |
| Lee’s Summit IDAR, John Knox Village Project, Pre-Refunded, 5.70%, 8/15/22 | | 1,500,000 | | 1,624,920 |
| Lee’s Summit Water and Sewer Revenue, Series A, AMBAC Insured, 5.00%, 7/01/22 | | 1,995,000 | | 2,031,828 |
| Lincoln University Auxiliary System Revenue, Assured Guaranty, 5.125%, 6/01/37 | | 2,325,000 | | 2,232,488 |
| Metropolitan St. Louis Sewer District Wastewater System Revenue, | | | | |
| Series A, 5.75%, 5/01/38 | | 2,000,000 | | 2,131,980 |
| Series A, NATL Insured, 5.00%, 5/01/34 | | 24,730,000 | | 24,929,571 |
| Series C, NATL Insured, 5.00%, 5/01/36 | | 22,740,000 | | 22,930,334 |
| Missouri Development Finance Board Cultural Facilities Revenue, | | | | |
| Nelson Gallery Foundation, Series A, NATL Insured, 5.00%, 12/01/30 | | 9,500,000 | | 9,544,840 |
| Series B, 5.00%, 6/01/37 | | 28,435,000 | | 28,553,858 |
| Missouri Joint Municipal Electric Utility Commission Power Project Revenue, | | | | |
| Iatan 2 Project, Series A, 6.00%, 1/01/39 | | 15,750,000 | | 16,103,430 |
| Plum Point Project, NATL Insured, 5.00%, 1/01/28 | | 5,235,000 | | 4,873,523 |
| Plum Point Project, NATL Insured, 5.00%, 1/01/34 | | 34,945,000 | | 30,355,324 |
| Series A, AMBAC Insured, 5.00%, 1/01/42 | | 15,795,000 | | 14,270,151 |
| Missouri Southern State College Revenue, Auxiliary Enterprise System, NATL Insured, 5.50%, | | | | |
| 4/01/23 | | 1,200,000 | | 1,202,220 |
| Missouri State Board of Public Buildings State Office Building, Special Obligation, Series A, | | | | |
| 5.125%, 5/01/26 | | 3,960,000 | | 3,978,097 |
| Missouri State Development Finance Board Recreation Facilities Revenue, YMCA Greater | | | | |
| St. Louis Project, Series A, 5.40%, 9/01/18 | | 7,420,000 | | 7,420,000 |
| Missouri State Development Finance Board Solid Waste Disposal Revenue, Procter and Gamble | | | | |
| Paper Product, 5.20%, 3/15/29 | | 3,000,000 | | 2,996,460 |
| Missouri State Environmental Improvement and Energy Resources Authority PCR, St. Joseph | | | | |
| Light and Power Co. Project, Refunding, AMBAC Insured, 5.85%, 2/01/13 | | 2,100,000 | | 2,106,867 |
| Missouri State Environmental Improvement and Energy Resources Authority Water PCR, | | | | |
| State Revolving Fund, Series A, 6.55%, 7/01/14 | | 495,000 | | 497,099 |
| State Revolving Fund, Series A, 5.75%, 1/01/16 | | 105,000 | | 105,322 |
| State Revolving Fund, Series B, 5.80%, 1/01/15 | | 85,000 | | 85,263 |
| State Revolving Fund, Series B, 7.20%, 7/01/16 | | 650,000 | | 652,724 |
| State Revolving Fund, Series B, AGMC Insured, 6.05%, 7/01/16 | | 475,000 | | 476,553 |
| State Revolving Funds, Refunding, Series A, 5.00%, 1/01/23 | | 14,000,000 | | 15,661,240 |
| State Revolving Funds, Refunding, Series A, 5.00%, 1/01/24 | | 7,890,000 | | 8,775,416 |
| State Revolving Funds, Series B, 5.50%, 7/01/21 | | 60,000 | | 60,167 |
| Missouri State Environmental Improvement and Energy Resources Authority Water Pollution | | | | |
| Control and Drinking Water Revenue, State Revolving Funds Programs, Series A, 5.75%, | | | | |
| 1/01/29 | | 2,500,000 | | 2,830,875 |
130 | Annual Report
| | | | |
| Franklin Tax-Free Trust | | | | |
| |
| Statement of Investments, February 28, 2011 (continued) | | | | |
| |
| |
| Franklin Missouri Tax-Free Income Fund | | Principal Amount | | Value |
| Municipal Bonds (continued) | | | | |
| Missouri (continued) | | | | |
| Missouri State GO, Stormwater Control, Series A, Pre-Refunded, 5.00%, 6/01/26 | $ | 1,895,000 | $ | 1,916,887 |
| Missouri State Health and Educational Facilities Authority Educational Facilities Revenue, | | | | |
| The Washington University, Refunding, Series B, 5.00%, 3/01/30 | | 14,000,000 | | 14,010,920 |
| The Washington University, Series A, 5.00%, 11/15/37 | | 9,150,000 | | 9,151,189 |
| The Washington University, Series A, 5.375%, 3/15/39 | | 16,825,000 | | 17,457,452 |
| Webster University, NATL Insured, 5.30%, 4/01/27 | | 8,000,000 | | 7,999,440 |
| Missouri State Health and Educational Facilities Authority Health Facilities Revenue, | | | | |
| CoxHealth, 5.50%, 11/15/39 | | 14,325,000 | | 13,764,892 |
| Freeman Health Systems Project, 5.25%, 2/15/28 | | 2,750,000 | | 2,505,085 |
| Improvement, Jefferson Memorial Hospital, Refunding, Radian Insured, 5.00%, | | | | |
| 8/15/21 | | 4,585,000 | | 4,429,064 |
| Improvement, Jefferson Memorial Hospital, Refunding, Radian Insured, 5.25%, | | | | |
| 8/15/28 | | 4,900,000 | | 4,402,699 |
| Lake Regional Health System, Refunding, 5.00%, 2/15/24 | | 4,000,000 | | 3,881,200 |
| Lake Regional Health Systems Project, 5.60%, 2/15/25 | | 1,250,000 | | 1,251,975 |
| Lake Regional Health Systems Project, 5.70%, 2/15/34 | | 2,750,000 | | 2,711,830 |
| SSM Health Care, Series B, 5.00%, 6/01/30 | | 16,150,000 | | 15,549,704 |
| SSM Health Care, Series B, 5.00%, 6/01/34 | | 7,000,000 | | 6,640,060 |
| St. Luke’s Episcopal, 5.00%, 12/01/34 | | 7,500,000 | | 6,811,125 |
| St. Luke’s Episcopal, Presbyterian Hospital, AGMC Insured, 5.25%, 12/01/26 | | 8,500,000 | | 8,526,690 |
| St. Luke’s Health System, Series A, AGMC Insured, 5.50%, 11/15/35 | | 10,000,000 | | 10,036,500 |
| St. Luke’s Health System, Series B, AGMC Insured, 5.50%, 11/15/35 | | 6,725,000 | | 6,749,546 |
| Missouri State Health and Educational Facilities Authority Revenue, | | | | |
| Children’s Mercy Hospital, 5.625%, 5/15/39 | | 7,500,000 | | 7,297,800 |
| Educational Facilities, Washington University, Series A, 5.00%, 2/15/33 | | 15,125,000 | | 15,354,597 |
| Senior Living Facilities, Lutheran Senior, 5.375%, 2/01/35 | | 2,520,000 | | 2,245,194 |
| Senior Living Facilities, Lutheran Senior Services Projects, 5.50%, 2/01/42 | | 6,485,000 | | 5,742,208 |
| Senior Living Facilities, Lutheran Senior Services, Refunding, Series B, 5.125%, | | | | |
| 2/01/22 | | 3,400,000 | | 3,301,672 |
| Senior Living Facilities, Lutheran Senior Services, Refunding, Series B, 5.125%, | | | | |
| 2/01/27 | | 2,700,000 | | 2,509,488 |
| Senior Living Facilities, Lutheran Senior Services, Series A, 5.00%, 2/01/25 | | 1,500,000 | | 1,413,750 |
| Senior Living Facilities, Lutheran Senior Services, Series A, 5.375%, 2/01/35 | | 4,655,000 | | 4,142,066 |
| SSM Health Care, Series A, AMBAC Insured, Pre-Refunded, 5.25%, 6/01/28 | | 16,385,000 | | 16,743,831 |
| Missouri State Highways and Transit Commission State Road Revenue, | | | | |
| 5.00%, 5/01/20 | | 6,875,000 | | 7,884,937 |
| 5.00%, 5/01/21 | | 5,000,000 | | 5,676,300 |
| first lien, Series B, 5.00%, 5/01/24 | | 6,005,000 | | 6,426,671 |
| Series A, 5.00%, 5/01/24 | | 1,150,000 | | 1,268,910 |
| Missouri State Housing Development Commission SFMR, Homeownership Loan Program, | | | | |
| Series A-1, GNMA Secured, 4.75%, 9/01/32 | | 1,080,000 | | 1,070,896 |
| Series B, GNMA Secured, 6.45%, 9/01/27 | | 150,000 | | 150,179 |
| Series C, GNMA Secured, 5.00%, 3/01/32 | | 1,130,000 | | 1,143,018 |
| Series C-1, GNMA Secured, 5.90%, 9/01/25 | | 690,000 | | 696,169 |
| Series C-1, GNMA Secured, 5.95%, 3/01/28 | | 490,000 | | 490,142 |
| Series D, GNMA Secured, 4.70%, 3/01/35 | | 3,970,000 | | 3,756,851 |
| Monarch-Chesterfield Levee District Revenue, NATL Insured, 5.75%, 3/01/19 | | 1,920,000 | | 1,925,645 |
Annual Report | 131
| | | | | | |
| | Franklin Tax-Free Trust | | | | | |
| |
| | Statement of Investments, February 28, 2011 (continued) | | | | | |
| |
| |
| | Franklin Missouri Tax-Free Income Fund | | | Principal Amount | | Value |
| | Municipal Bonds (continued) | | | | | |
| | Missouri (continued) | | | | | |
| | North Kansas City Hospital Revenue, North Kansas City Hospital, Series A, AGMC Insured, | | | | | |
| | 5.00%, 11/15/20 | | $ | 1,000,000 | $ | 1,024,780 |
| | 5.00%, 11/15/21 | | | 1,000,000 | | 1,022,720 |
| | 5.00%, 11/15/22 | | | 1,000,000 | | 1,019,390 |
| | 5.00%, 11/15/28 | | | 1,965,000 | | 1,968,301 |
| | 5.125%, 11/15/33 | | | 2,755,000 | | 2,680,918 |
| | Pettis County School District 200 Sedalia Lease COP, Missouri State Assn. of Rural Education, | | | | | |
| | Assured Guaranty, 5.00%, 3/01/27 | | | 6,690,000 | | 6,981,818 |
| | Pulaski County IDA, MFHR, St. Robert Project, Series A, GNMA Secured, 6.00%, 8/20/39 | | | 1,600,000 | | 1,617,456 |
| | Riverside IDA, IDR, Riverside Horizons Project, Series A, ACA Insured, 5.00%, 5/01/20 | | | 1,500,000 | | 1,521,330 |
| | Riverside-Quindaro Bend Levee District of Platte County Levee Improvement Revenue, | | | | | |
| L | -385 Project, Refunding, Radian Insured, 5.00%, 3/01/27 | | | 5,000,000 | | 4,485,600 |
| | Springfield Missouri IDAR, Bethesda Living Centers, Refunding, Series A, | | | | | |
| | 5.625%, 8/15/18 | | | 2,735,000 | | 2,576,862 |
| | 5.70%, 8/15/28 | | | 5,250,000 | | 4,178,580 |
| | Springfield Public Building Corp. Leasehold Revenue, | | | | | |
| | Capital Improvement Program, AMBAC Insured, 5.00%, 3/01/24 | | | 2,600,000 | | 2,716,350 |
| | Springfield Branson Airport, Series A, AMBAC Insured, 5.00%, 7/01/36 | | | 5,000,000 | | 4,852,900 |
| | Springfield Public Utility Revenue, NATL RE, FGIC Insured, 4.75%, 8/01/34 | | | 3,000,000 | | 2,945,820 |
| | Springfield School District No. R-12 GO, Missouri Direct Deposit Program, AGMC Insured, | | | | | |
| | 5.00%, 3/01/26 | | | 5,000,000 | | 5,277,600 |
| | St. Charles County Public Water Supply District No. 2, COP, Missouri Project, Series A, | | | | | |
| | NATL Insured, 5.25%, 12/01/28 | | | 1,000,000 | | 1,003,760 |
| | St. Joseph IDA Special Obligation Revenue, Sewer System Improvements Project, 5.00%, | | | | | |
| | 4/01/27 | | | 2,655,000 | | 2,597,519 |
| | St. Louis Airport Revenue, | | | | | |
| | Airport Development Program, Series A, NATL Insured, Pre-Refunded, 5.25%, 7/01/31 | | | 18,000,000 | | 18,287,460 |
| | Lambert, Refunding, Series B, AGMC Insured, 5.00%, 7/01/25 | | | 9,420,000 | | 9,119,690 |
| | Lambert, St. Louis International Airport, Refunding, NATL Insured, 5.50%, 7/01/29 | | | 13,070,000 | | 12,362,129 |
| | Lambert, St. Louis International Airport, Refunding, Series A, AGMC Insured, 5.00%, | | | | | |
| | 7/01/23 | | | 14,615,000 | | 14,700,644 |
| | Lambert, St. Louis International Airport, Series A-1, 6.125%, 7/01/24 | | | 2,000,000 | | 2,075,680 |
| | Lambert, St. Louis International Airport, Series A-1, 6.625%, 7/01/34 | | | 5,000,000 | | 5,090,550 |
| | St. Louis County IDA Health Facilities Revenue, Mary Queen Healthcare, GNMA Secured, | | | | | |
| | 5.375%, 9/20/31 | | | 3,310,000 | | 3,319,731 |
| | St. Louis County IDA, MFHR, Lucas Hunt Village Project, GNMA Secured, 5.20%, 9/20/31 | | | 1,095,000 | | 1,095,000 |
| | St. Louis County IDAR, Bethesda Living Centers, Series B, 5.85%, 8/15/28 | | | 1,500,000 | | 1,215,030 |
| | St. Louis Municipal Finance Corp. Leasehold Revenue, | | | | | |
| | Carnahan Courthouse, Series A, FGIC Insured, Pre-Refunded, 5.125%, 2/15/27 | | | 4,750,000 | | 4,958,383 |
| | Convention Center Capital Improvement, Series B, Assured Guaranty, 5.375%, 7/15/38 | | | 22,725,000 | | 22,883,166 |
| | St. Louis Municipal Finance Corp. Recreation Sales Tax Leasehold Revenue, AMBAC Insured, | | | | | |
| | 5.00 | %, | | | | |
| | 2/15/32 | | | 8,075,000 | | 7,305,614 |
| | 2/15/37 | | | 7,800,000 | | 6,658,080 |
| | Taney County IDA Hospital Revenue, The Skaggs Community Hospital Assn., Refunding, | | | | | |
| | 5.30%, 5/15/18 | | | 3,000,000 | | 2,798,550 |
| | 5.40%, 5/15/28 | | | 1,500,000 | | 1,201,890 |
132 | Annual Report
| | | | | |
| | Franklin Tax-Free Trust | | | | |
| |
| | Statement of Investments, February 28, 2011 (continued) | | | | |
| |
| |
| | Franklin Missouri Tax-Free Income Fund | | Principal Amount | | Value |
| | Municipal Bonds (continued) | | | | |
| | Missouri (continued) | | | | |
| | Taney County Reorganized School District GO, No. R-V Hollister, AGMC Insured, Pre-Refunded, | | | | |
| | 5.00%, 3/01/20 | $ | 1,300,000 | $ | 1,390,142 |
| | University of Missouri Revenues, System Facilities, Refunding, Series B, 5.00%, 11/01/27 | | 7,865,000 | | 7,911,797 |
| | West Plains IDA Hospital Revenue, Ozarks Medical Center, Refunding, | | | | |
| | 5.50%, 11/15/12 | | 440,000 | | 441,135 |
| | 5.60%, 11/15/17 | | 1,700,000 | | 1,625,676 |
| | 5.65%, 11/15/22 | | 1,500,000 | | 1,335,480 |
| | | | | | 854,082,069 |
| | U.S. Territories 17.9% | | | | |
| | Puerto Rico 17.5% | | | | |
| | Puerto Rico Commonwealth GO, Public Improvement, Series A, | | | | |
| | 5.375%, 7/01/28 | | 1,975,000 | | 1,990,109 |
| | 5.125%, 7/01/31 | | 5,000,000 | | 5,002,600 |
| | 6.00%, 7/01/38 | | 6,250,000 | | 6,134,125 |
| | Puerto Rico Commonwealth Highway and Transportation Authority Highway Revenue, Series Y, | | | | |
| Pre | -Refunded, 5.50%, 7/01/36 | | 9,500,000 | | 11,352,500 |
| | Puerto Rico Commonwealth Highway and Transportation Authority Transportation Revenue, | | | | |
| | Refunding, Series N, Assured Guaranty, 5.50%, 7/01/26 | | 8,410,000 | | 8,736,813 |
| | Refunding, Series N, FGIC Insured, 5.25%, 7/01/39 | | 4,970,000 | | 4,325,242 |
| | Series D, Pre-Refunded, 5.375%, 7/01/36 | | 2,500,000 | | 2,655,550 |
| | Puerto Rico Electric Power Authority Power Revenue, | | | | |
| | Refunding, Series CCC, 5.00%, 7/01/28 | | 4,000,000 | | 3,733,200 |
| | Series CCC, 5.25%, 7/01/28 | | 8,000,000 | | 7,760,400 |
| | Series II, Pre-Refunded, 5.25%, 7/01/31 | | 10,000,000 | | 10,732,700 |
| | Series WW, 5.50%, 7/01/38 | | 5,730,000 | | 5,219,342 |
| | Series XX, 5.25%, 7/01/40 | | 33,750,000 | | 29,475,225 |
| | Puerto Rico Industrial Tourist Educational Medical and Environmental Control Facilities | | | | |
| | Financing Authority Industrial Revenue, Guaynabo Municipal Government, 5.625%, | | | | |
| | 7/01/22 | | 2,500,000 | | 2,500,725 |
| | Puerto Rico PBA Guaranteed Revenue, Government Facilities, | | | | |
| | Refunding, Series D, 5.375%, 7/01/33 | | 2,150,000 | | 2,015,797 |
| | Series D, Pre-Refunded, 5.375%, 7/01/33 | | 5,885,000 | | 6,251,165 |
| | Series I, 5.00%, 7/01/36 | | 14,450,000 | | 12,247,675 |
| | Series I, Pre-Refunded, 5.375%, 7/01/34 | | 10,000,000 | | 11,319,300 |
| | Puerto Rico Sales Tax FICO Sales Tax Revenue, first sub., | | | | |
| | Refunding, Series C, 5.375%, 8/01/36 | | 6,900,000 | | 6,556,173 |
| | Series A, 5.25%, 8/01/27 | | 5,000,000 | | 5,050,550 |
| | Series A, 5.50%, 8/01/37 | | 9,000,000 | | 8,497,710 |
| | Series A, 5.375%, 8/01/39 | | 2,000,000 | | 1,838,020 |
| | Series B, 6.375%, 8/01/39 | | 10,000,000 | | 10,324,100 |
| | Series C, 5.50%, 8/01/40 | | 15,000,000 | | 14,027,550 |
| | Series C, 5.25%, 8/01/41 | | 7,500,000 | | 6,746,250 |
| | | | | | 184,492,821 |
Annual Report | 133
| | | | | |
| Franklin Tax-Free Trust | | | | | |
| |
| Statement of Investments, February 28, 2011 (continued) | | | | | |
| |
| Franklin Missouri Tax-Free Income Fund | | Principal Amount | | | Value |
| Municipal Bonds (continued) | | | | | |
| U.S. Territories (continued) | | | | | |
| U.S. Virgin Islands 0.4% | | | | | |
| Virgin Islands PFAR, | | | | | |
| Matching Fund Loan Note, senior lien, Series A, 5.00%, 10/01/29 | $ | 2,500,000 | | $ | 2,400,525 |
| senior lien, Capital Projects, Series A-1, 5.00%, 10/01/39 | | 2,500,000 | | | 2,063,100 |
| | | | | | 4,463,625 |
| Total U.S. Territories | | | | | 188,956,446 |
| Total Municipal Bonds before Short Term Investments | | | | | |
| (Cost $1,065,760,032) | | | | | 1,043,038,515 |
| Short Term Investments (Cost $1,200,000) 0.1% | | | | | |
| Municipal Bonds 0.1% | | | | | |
| Missouri 0.1% | | | | | |
| bMissouri State Health and Educational Facilities Authority Educational Facilities Revenue, | | | | | |
| St. Louis University, Series B, Daily VRDN and Put, 0.20%, 10/01/24 | | 1,200,000 | | | 1,200,000 |
| Total Investments (Cost $1,066,960,032) 98.9% | | | | | 1,044,238,515 |
| Other Assets, less Liabilities 1.1% | | | | | 12,077,126 |
| Net Assets 100.0% | | | $ | 1,056,315,641 |
| |
| |
| See Abbreviations on page 180. | | | | | |
| |
| aA portion or all of the security purchased on a delayed delivery basis. | | | | | |
| bVariable rate demand notes (VRDNs) are tax-exempt obligations which contain a floating or variable interest rate adjustment formula and an unconditional right of demand to |
| receive payment of the principal balance plus accrued interest at specified dates. The coupon rate shown represents the rate at period end. | | | |
| |
| |
| |
| |
| 134 | The accompanying notes are an integral part of these financial statements. | | | Annual Report | | | |
| | | | | | | | | | | | | | | |
| Franklin Tax-Free Trust | | | | | | | | | | | | | |
| |
| Financial Highlights | | | | | | | | | | | | | | | |
| |
| Franklin North Carolina Tax-Free Income Fund | | | | | | | | | | | | | |
| | | | | | Year Ended February 28, | | | | |
| Class A | | 2011 | | | 2010 | | | 2009 | | | 2008 | a | | 2007 | |
| Per share operating performance | | | | | | | | | | | | | | | |
| (for a share outstanding throughout the year) | | | | | | | | | | | | | | | |
| Net asset value, beginning of year | $ | 12.15 | | $ | 11.37 | | $ | 11.46 | | $ | 12.38 | | $ | 12.31 | |
| Income from investment operationsb: | | | | | | | | | | | | | | | |
| Net investment incomec | | 0.49 | | | 0.51 | | | 0.51 | | | 0.50 | | | 0.51 | |
| Net realized and unrealized gains (losses) | | (0.41 | ) | | 0.77 | | | (0.11 | ) | | (0.92 | ) | | 0.08 | |
| Total from investment operations | | 0.08 | | | 1.28 | | | 0.40 | | | (0.42 | ) | | 0.59 | |
| Less distributions from net investment income | | (0.50 | ) | | (0.50 | ) | | (0.49 | ) | | (0.50 | ) | | (0.52 | ) |
| Redemption feesd | | — | | | — | | | —e | | | —e | | | —e | |
| Net asset value, end of year | $ | 11.73 | | $ | 12.15 | | $ | 11.37 | | $ | 11.46 | | $ | 12.38 | |
| |
| Total returnf | | 0.63 | % | | 11.47 | % | | 3.60 | % | | (3.55 | )% | | 4.89 | % |
| |
| Ratios to average net assets | | | | | | | | | | | | | | | |
| Expenses | | 0.63 | % | | 0.64 | % | | 0.64 | % | | 0.65 | % | | 0.66 | % |
| Net investment income | | 4.07 | % | | 4.25 | % | | 4.41 | % | | 4.11 | % | | 4.15 | % |
| |
| Supplemental data | | | | | | | | | | | | | | | |
| Net assets, end of year (000’s) | $ | 925,162 | | $ | 924,905 | | $ | 742,759 | | $ | 673,785 | | $ | 626,783 | |
| Portfolio turnover rate | | 9.56 | % | | 8.85 | % | | 7.09 | % | | 12.03 | % | | 9.79 | % |
| |
| |
| aFor the year ended February 29. | | | | | | | | | | | | | | | |
| bThe amount shown for a share outstanding throughout the period may not correlate with the Statement of Operations for the period due to the timing of sales and repurchases of | |
| the Fund shares in relation to income earned and/or fluctuating market value of the investments of the Fund. | | | | | | | | | | | | | |
| cBased on average daily shares outstanding. | | | | | | | | | | | | | | | |
| dEffective September 1, 2008, the redemption fee was eliminated. | | | | | | | | | | | | | |
| eAmount rounds to less than $0.01 per share. | | | | | | | | | | | | | | | |
| fTotal return does not reflect sales commissions or contingent deferred sales charges, if applicable. | | | | | | | | | | | | | |
| |
| |
| |
| |
| Annual Report | | | The accompanying notes are an integral part of these financial statements. | 135 | |
| | | | | | | | | | | | | | | | | |
| Franklin Tax-Free Trust | | | | | | | | | | | | | | | | | |
| |
| Financial Highlights (continued) | | | | | | | | | | | | | | | | | |
| |
| Franklin North Carolina Tax-Free Income Fund | | | | | | | | | | | | | | | | | |
| | | | | | Year Ended February 28, | | | | |
| Class C | | 2011 | | | 2010 | | | | | 2009 | | | 2008 | a | | 2007 | |
| Per share operating performance | | | | | | | | | | | | | | | | | |
| (for a share outstanding throughout the year) | | | | | | | | | | | | | | | | | |
| Net asset value, beginning of year | $ | 12.30 | | $ | 11.49 | | | | $ | 11.58 | | $ | 12.51 | | $ | 12.44 | |
| Income from investment operationsb: | | | | | | | | | | | | | | | | | |
| Net investment incomec | | 0.43 | | | 0.44 | | | | | 0.45 | | | 0.44 | | | 0.45 | |
| Net realized and unrealized gains (losses) | | (0.42 | ) | | 0.81 | | | | | (0.11 | ) | | (0.94 | ) | | 0.07 | |
| Total from investment operations | | 0.01 | | | 1.25 | | | | | 0.34 | | | (0.50 | ) | | 0.52 | |
| Less distributions from net investment income | | (0.43 | ) | | (0.44 | ) | | (0.43 | ) | | (0.43 | ) | | (0.45 | ) |
| Redemption feesd | | — | | | — | | | | | —e | | | —e | | | —e | |
| Net asset value, end of year | $ | 11.88 | | $ | 12.30 | | | | $ | 11.49 | | $ | 11.58 | | $ | 12.51 | |
| |
| Total returnf | | 0.06 | % | | 11.01 | % | | | | 2.99 | % | | (4.13 | )% | | 4.26 | % |
| |
| Ratios to average net assets | | | | | | | | | | | | | | | | | |
| Expenses | | 1.18 | % | | 1.19 | % | | | | 1.19 | % | | 1.20 | % | | 1.21 | % |
| Net investment income | | 3.52 | % | | 3.70 | % | | | | 3.86 | % | | 3.56 | % | | 3.60 | % |
| |
| Supplemental data | | | | | | | | | | | | | | | | | |
| Net assets, end of year (000’s) | $ | 237,607 | | $ | 224,584 | | | | $ | 151,193 | | $ | 123,593 | | $ | 117,566 | |
| Portfolio turnover rate | | 9.56 | % | | 8.85 | % | | | | 7.09 | % | | 12.03 | % | | 9.79 | % |
| |
| |
| aFor the year ended February 29. | | | | | | | | | | | | | | | | | |
| bThe amount shown for a share outstanding throughout the period may not correlate with the Statement of Operations for the period due to the timing of sales and repurchases of | |
| the Fund shares in relation to income earned and/or fluctuating market value of the investments of the Fund. | | | | | | | | | | | | | | | |
| cBased on average daily shares outstanding. | | | | | | | | | | | | | | | | | |
| dEffective September 1, 2008, the redemption fee was eliminated. | | | | | | | | | | | | | | | | | |
| eAmount rounds to less than $0.01 per share. | | | | | | | | | | | | | | | | | |
| fTotal return does not reflect sales commissions or contingent deferred sales charges, if applicable. | | | | | | | | | | | | | | | |
| |
| |
| |
| |
| 136 | The accompanying notes are an integral part of these financial statements. | | | Annual Report | | | | |
| | | | | | |
| Franklin Tax-Free Trust | | | | |
| |
| Financial Highlights (continued) | | | | | | |
| |
| Franklin North Carolina Tax-Free Income Fund | | | | |
| | | Year Ended | |
| | | February 28, | |
| Advisor Class | | 2011 | | | 2010 | a |
| Per share operating performance | | | | | | |
| (for a share outstanding throughout the year) | | | | | | |
| Net asset value, beginning of year | $ | 12.15 | | $ | 11.64 | |
| Income from investment operationsb: | | | | | | |
| Net investment incomec | | 0.50 | | | 0.35 | |
| Net realized and unrealized gains (losses) | | (0.41 | ) | | 0.50 | |
| Total from investment operations | | 0.09 | | | 0.85 | |
| Less distributions from net investment income | | (0.51 | ) | | (0.34 | ) |
| Net asset value, end of year | $ | 11.73 | | $ | 12.15 | |
| |
| Total returnd | | 0.73 | % | | 7.33 | % |
| |
| Ratios to average net assetse | | | | | | |
| Expenses | | 0.53 | % | | 0.54 | % |
| Net investment income | | 4.17 | % | | 4.35 | % |
| |
| Supplemental data | | | | | | |
| Net assets, end of year (000’s) | $ | 22,659 | | $ | 14,704 | |
| Portfolio turnover rate | | 9.56 | % | | 8.85 | % |
| |
| |
| aFor the period July 1, 2009 (effective date) to February 28, 2010. | | | | |
| bThe amount shown for a share outstanding throughout the period may not correlate with the Statement of Operations for the period due to the timing of sales and repurchases of | |
| the Fund shares in relation to income earned and/or fluctuating market value of the investments of the Fund. | | | | |
| cBased on average daily shares outstanding. | | | | | | |
| dTotal return is not annualized for periods less than one year. | | | | | | |
| eRatios are annualized for periods less than one year. | | | | | | |
| |
| |
| |
| |
| Annual Report | | | The accompanying notes are an integral part of these financial statements. | 137 | |
| | | | |
| Franklin Tax-Free Trust | | | | |
| |
| Statement of Investments, February 28, 2011 | | | | |
| |
| |
| Franklin North Carolina Tax-Free Income Fund | | Principal Amount | | Value |
| Municipal Bonds 98.5% | | | | |
| North Carolina 80.2% | | | | |
| Albemarle Hospital Authority Health Care Facilities Revenue, Refunding, 5.25%, 10/01/38 | $ | 7,600,000 | $ | 5,639,732 |
| Asheville Water System Revenue, | | | | |
| AGMC Insured, Pre-Refunded, 5.00%, 8/01/25 | | 1,000,000 | | 1,019,420 |
| NATL Insured, 5.00%, 8/01/32 | | 2,110,000 | | 2,141,101 |
| Brunswick County Enterprise System Revenue, Series A, AGMC Insured, 5.00%, | | | | |
| 4/01/27 | | 1,500,000 | | 1,530,345 |
| 4/01/28 | | 1,750,000 | | 1,780,362 |
| Buncombe County COP, NATL Insured, 5.00%, 4/01/22 | | 1,000,000 | | 1,052,080 |
| Cape Fear Public Utility Authority Water and Sewer System Revenue, 5.00%, 8/01/35 | | 21,000,000 | | 21,154,140 |
| Cary Combined Enterprise System Revenue, Refunding, Series 2007, 5.00%, 12/01/33 | | 5,405,000 | | 5,560,340 |
| Charlotte Airport Revenue, | | | | |
| Charlotte Douglas International Airport, Refunding, Series A, AMBAC Insured, 5.00%, | | | | |
| 7/01/32 | | 20,680,000 | | 20,385,103 |
| Charlotte Douglas International Airport, Refunding, Series A, AMBAC Insured, 5.00%, | | | | |
| 7/01/36 | | 13,085,000 | | 12,522,607 |
| Refunding, Series A, 5.50%, 7/01/34 | | 3,765,000 | | 3,836,196 |
| Series A, NATL Insured, 5.00%, 7/01/29 | | 5,000,000 | | 5,022,450 |
| Series A, NATL Insured, 5.00%, 7/01/34 | | 10,000,000 | | 9,678,300 |
| Charlotte COP, | | | | |
| Governmental Facilities Projects, Series G, 5.00%, 6/01/28 | | 3,000,000 | | 3,021,270 |
| Refunding, 5.00%, 6/01/33 | | 2,500,000 | | 2,517,925 |
| Refunding, Series C, 5.00%, 6/01/39 | | 6,000,000 | | 5,910,240 |
| Transit Projects, Phase II, Series E, 5.00%, 6/01/35 | | 6,000,000 | | 5,974,500 |
| Charlotte GO, Series C, 5.00%, 7/01/27 | | 2,010,000 | | 2,060,813 |
| Charlotte Storm Water Fee Revenue, | | | | |
| 5.00%, 6/01/35 | | 10,000,000 | | 10,137,300 |
| Refunding, 5.00%, 6/01/25 | | 1,000,000 | | 1,036,340 |
| Charlotte Water and Sewer System Revenue, | | | | |
| 5.125%, 6/01/26 | | 6,000,000 | | 6,097,740 |
| 5.00%, 7/01/38 | | 6,775,000 | | 6,890,920 |
| Refunding, Series B, 5.00%, 7/01/38 | | 10,000,000 | | 10,208,700 |
| Charlotte-Mecklenburg Hospital Authority Health Care System Revenue, | | | | |
| Carolinas HealthCare System, Refunding, Series A, 5.00%, 1/15/31 | | 3,865,000 | | 3,760,374 |
| Carolinas HealthCare System, Refunding, Series A, 5.25%, 1/15/34 | | 4,000,000 | | 3,911,200 |
| Carolinas HealthCare System, Series A, AGMC Insured, 5.00%, 1/15/23 | | 7,780,000 | | 8,141,459 |
| Refunding, 5.00%, 1/15/39 | | 15,000,000 | | 13,895,850 |
| Chatham County COP, AMBAC Insured, 5.00%, 6/01/34 | | 5,000,000 | | 4,892,000 |
| Columbus County Industrial Facilities and PCFA Revenue, International Paper Co. Projects, | | | | |
| 5.70%, 5/01/34 | | 2,500,000 | | 2,443,250 |
| Cumberland County Finance Corp. Installment Payment Revenue, Detention Center and | | | | |
| Mental Health, AGMC Insured, Pre-Refunded, 5.625%, 6/01/24 | | 5,000,000 | | 5,065,350 |
| Dare County COP, | | | | |
| AMBAC Insured, 5.125%, 6/01/21 | | 650,000 | | 667,277 |
| AMBAC Insured, 5.00%, 6/01/23 | | 3,000,000 | | 3,104,220 |
| AMBAC Insured, 5.00%, 6/01/29 | | 5,295,000 | | 5,316,604 |
| NATL RE, FGIC Insured, 5.00%, 6/01/23 | | 2,655,000 | | 2,785,015 |
| Dare County Utility System Revenue, 5.00%, 2/01/41 | | 5,000,000 | | 5,011,400 |
138 | Annual Report
| | | | |
| Franklin Tax-Free Trust | | | | |
| |
| Statement of Investments, February 28, 2011 (continued) | | | | |
| |
| |
| Franklin North Carolina Tax-Free Income Fund | | Principal Amount | | Value |
| Municipal Bonds (continued) | | | | |
| North Carolina (continued) | | | | |
| Durham County COP, Series A, 5.00%, 6/01/31 | $ | 4,000,000 | $ | 4,091,920 |
| Durham County Enterprise System Revenue, NATL Insured, 5.00%, 6/01/23 | | 1,670,000 | | 1,743,012 |
| Gastonia Combined Utilities System Revenue, AGMC Insured, 5.00%, 5/01/25 | | 1,000,000 | | 1,003,450 |
| Greensboro Enterprise System Revenue, Series A, Pre-Refunded, 5.125%, | | | | |
| 6/01/21 | | 390,000 | | 398,518 |
| 6/01/22 | | 350,000 | | 357,644 |
| Greensboro HDC, Mortgage Revenue, Refunding, Series A, NATL Insured, 6.70%, 1/01/24 | | 1,165,000 | | 1,165,012 |
| Greenville Utilities Commission Combined Enterprise System Revenue, Refunding, Series A, | | | | |
| AGMC Insured, 5.00%, 11/01/33 | | 6,000,000 | | 6,014,760 |
| Guilford County GO, Refunding, Series C, 5.00%, 2/01/22 | | 5,920,000 | | 6,725,594 |
| Halifax County Industrial Facilities and PCFA Revenue, Champion International Corp. Project, | | | | |
| 5.45%, 11/01/33 | | 4,000,000 | | 3,513,000 |
| Refunding, 6.45%, 11/01/29 | | 3,900,000 | | 3,902,067 |
| Harnett County COP, | | | | |
| AGMC Insured, 5.125%, 12/01/23 | | 1,000,000 | | 1,033,700 |
| Assured Guaranty, 5.00%, 6/01/28 | | 1,000,000 | | 1,031,270 |
| Assured Guaranty, 5.00%, 6/01/29 | | 500,000 | | 512,525 |
| High Point Combined Enterprise System Revenue, | | | | |
| AGMC Insured, 5.00%, 11/01/33 | | 5,000,000 | | 5,053,550 |
| NATL RE, FGIC Insured, 5.00%, 11/01/31 | | 11,000,000 | | 11,134,970 |
| Iredell County COP, Iredell County School Project, AGMC Insured, | | | | |
| 5.125%, 6/01/27 | | 4,000,000 | | 4,108,000 |
| 5.00%, 6/01/28 | | 1,000,000 | | 1,013,260 |
| Johnston Memorial Hospital Authority Mortgage Revenue, AGMC Insured, 5.25%, | | | | |
| 10/01/36 | | 7,000,000 | | 7,065,590 |
| Mecklenburg County COP, Series A, 5.00%, 2/01/28 | | 350,000 | | 358,950 |
| Mecklenburg County GO, Public Improvement, Series B, Pre-Refunded, 4.70%, 2/01/20 | | 3,000,000 | | 3,111,870 |
| Monroe COP, Assured Guaranty, 5.50%, | | | | |
| 3/01/34 | | 2,425,000 | | 2,484,825 |
| 3/01/39 | | 1,085,000 | | 1,100,396 |
| Nash Health Care System Health Care Facilities Revenue, AGMC Insured, 5.00%, | | | | |
| 11/01/30 | | 2,250,000 | | 2,141,640 |
| New Hanover County COP, New Hanover County Projects, AMBAC Insured, Pre-Refunded, | | | | |
| 5.00%, 12/01/22 | | 5,000,000 | | 5,221,800 |
| New Hanover County Hospital Revenue, New Hanover Regional Medical Center Project, | | | | |
| Refunding, Series B, AGMC Insured, | | | | |
| 5.00%, 10/01/27 | | 3,500,000 | | 3,526,565 |
| 5.125%, 10/01/31 | | 8,385,000 | | 8,462,897 |
| North Carolina Capital Facilities Finance Agency Educational Facilities Revenue, | | | | |
| Johnson and Wales University Project, Series A, XLCA Insured, 5.00%, 4/01/33 | | 3,000,000 | | 2,612,250 |
| Wake Forest University, 5.00%, 1/01/38 | | 12,200,000 | | 12,254,046 |
| North Carolina Capital Facilities Finance Agency Revenue, Duke University Project, | | | | |
| Refunding, Series A, 5.00%, 10/01/41 | | 11,080,000 | | 11,124,542 |
| Refunding, Series A, 5.00%, 10/01/44 | | 7,050,000 | | 7,073,547 |
| Refunding, Series B, 5.00%, 10/01/38 | | 9,950,000 | | 10,048,405 |
| Refunding, Series B, 4.75%, 7/01/42 | | 10,000,000 | | 9,667,200 |
| Series A, 5.00%, 10/01/39 | | 2,615,000 | | 2,632,599 |
| Series A, Pre-Refunded, 5.25%, 7/01/42 | | 10,000,000 | | 10,752,100 |
Annual Report | 139
| | | | |
| Franklin Tax-Free Trust | | | | |
| |
| Statement of Investments, February 28, 2011 (continued) | | | | |
| |
| |
| Franklin North Carolina Tax-Free Income Fund | | Principal Amount | | Value |
| Municipal Bonds (continued) | | | | |
| North Carolina (continued) | | | | |
| North Carolina Eastern Municipal Power Agency Power System Revenue, | | | | |
| Refunding, Series A, 6.50%, 1/01/18 | $ | 3,000,000 | $ | 3,558,240 |
| Refunding, Series A, 5.00%, 1/01/24 | | 10,000,000 | | 10,202,100 |
| Refunding, Series A, AMBAC Insured, 5.00%, 1/01/21 | | 11,555,000 | | 11,954,456 |
| Series C, 6.75%, 1/01/24 | | 3,500,000 | | 3,977,365 |
| North Carolina HFAR, | | | | |
| Home Ownership, Refunding, Series 12-C, 5.35%, 7/01/33 | | 10,000,000 | | 10,009,900 |
| SF, Refunding, Series DD, FHA Insured, 6.20%, 9/01/27 | | 435,000 | | 445,231 |
| SFR, Series AA, 6.25%, 3/01/17 | | 190,000 | | 190,015 |
| SFR, Series RR, FHA Insured, 5.85%, 9/01/28 | | 1,080,000 | | 1,080,140 |
| North Carolina Medical Care Commission Health Care Facilities Revenue, | | | | |
| Appalachian Regional Healthcare System, Refunding, Series A, 6.50%, 7/01/31 | | 5,000,000 | | 4,982,650 |
| Duke University Health System, Series A, 5.00%, 6/01/42 | | 19,650,000 | | 18,810,945 |
| FirstHealth Carolinas Project, Series A, 6.125%, 10/01/39 | | 11,315,000 | | 11,633,517 |
| FirstHealth Carolinas Project, Series C, 5.00%, 10/01/29 | | 5,000,000 | | 4,789,550 |
| Refunding, NATL RE, FGIC Insured, 5.00%, 1/01/33 | | 10,805,000 | | 10,227,257 |
| Rex Healthcare, Refunding, Series A, 5.00%, 7/01/30 | | 5,000,000 | | 4,790,400 |
| Scotland Memorial Hospital Project, Radian Insured, 5.50%, 10/01/19 | | 630,000 | | 630,328 |
| Scotland Memorial Hospital Project, Radian Insured, 5.50%, 10/01/29 | | 1,220,000 | | 1,184,047 |
| University Health System, Refunding, Series D, 6.25%, 12/01/33 | | 10,000,000 | | 10,422,000 |
| WakeMed Project, AMBAC Insured, 5.00%, 10/01/32 | | 4,205,000 | | 3,896,059 |
| WakeMed Project, Series A, Assured Guaranty, 5.625%, 10/01/29 | | 1,500,000 | | 1,529,805 |
| WakeMed Project, Series A, Assured Guaranty, 5.625%, 10/01/38 | | 6,000,000 | | 6,025,680 |
| WakeMed Project, Series A, Assured Guaranty, 5.875%, 10/01/38 | | 2,515,000 | | 2,545,934 |
| North Carolina Medical Care Commission Health Care System Facilities Revenue, Applachian | | | | |
| Regional Healthcare System, Refunding, Series A, 6.625%, 7/01/34 | | 6,000,000 | | 5,981,640 |
| North Carolina Medical Care Commission Health System Revenue, Mission Health | | | | |
| Combination, Refunding, AGMC Insured, 5.00%, 10/01/36 | | 5,000,000 | | 4,633,050 |
| North Carolina Medical Care Commission Hospital Revenue, | | | | |
| Annie Penn Memorial Hospital Project, ETM, 5.25%, 1/01/12 | | 370,000 | | 384,844 |
| Annie Penn Memorial Hospital Project, Pre-Refunded, 5.375%, 1/01/22 | | 1,920,000 | | 2,118,739 |
| Halifax Regional Medical Center Project, 5.00%, 8/15/24 | | 1,800,000 | | 1,469,070 |
| Mission-St. Joseph’s Health System Project, Refunding, NATL Insured, 5.125%, | | | | |
| 10/01/28 | | 1,770,000 | | 1,771,841 |
| North Carolina Baptist Hospital, Refunding, 5.00%, 6/01/34 | | 10,000,000 | | 9,460,400 |
| Southeastern Regional Medical Center, 6.25%, 6/01/29 | | 4,000,000 | | 4,002,480 |
| Southeastern Regional Medical Center, 5.375%, 6/01/32 | | 3,500,000 | | 3,197,810 |
| Transylvania Community Hospital Inc. Project, Refunding, 5.75%, 10/01/19 | | 1,090,000 | | 1,089,978 |
| North Carolina Medical Care Commission Revenue, | | | | |
| Betsy Johnson Project, AGMC Insured, 5.125%, 10/01/32 | | 4,500,000 | | 4,507,875 |
| Chatham Hospital Project, NATL Insured, 5.25%, 2/01/31 | | 4,450,000 | | 4,274,581 |
| Novant Health Obligation Group, NATL Insured, 5.00%, 11/01/39 | | 9,680,000 | | 8,550,925 |
| Rowan Regional Medical Center, AGMC Insured, 5.00%, 9/01/33 | | 25,970,000 | | 24,756,422 |
| North Carolina Municipal Power Agency No. 1 Catawba Electric Revenue, | | | | |
| Refunding, Series A, 5.00%, 1/01/26 | | 2,500,000 | | 2,581,550 |
| Refunding, Series A, 5.00%, 1/01/30 | | 4,670,000 | | 4,720,903 |
| Refunding, Series B, 5.00%, 1/01/21 | | 5,000,000 | | 5,493,350 |
| Series A, NATL Insured, 5.25%, 1/01/19 | | 5,000,000 | | 5,231,200 |
| Series A, NATL Insured, 5.25%, 1/01/20 | | 1,500,000 | | 1,558,170 |
| |
| 140 | Annual Report | | | | |
| | | | |
| Franklin Tax-Free Trust | | | | |
| |
| Statement of Investments, February 28, 2011 (continued) | | | | |
| |
| |
| Franklin North Carolina Tax-Free Income Fund | | Principal Amount | | Value |
| Municipal Bonds (continued) | | | | |
| North Carolina (continued) | | | | |
| North Carolina State Capital Improvement Limited Obligation Revenue, | | | | |
| Capital Improvement, Series A, AGMC Insured, 5.00%, 5/01/22 | $ | 6,595,000 | $ | 7,063,179 |
| Series A, 5.00%, 5/01/28 | | 5,000,000 | | 5,191,600 |
| North Carolina State COP, Western Carolina University Housing Project, AMBAC Insured, | | | | |
| 5.00%, 6/01/33 | | 1,500,000 | | 1,443,390 |
| North Carolina State GO, | | | | |
| Public Improvement, Series A, 5.00%, 5/01/23 | | 10,000,000 | | 11,266,700 |
| Public Improvement, Series A, 5.00%, 5/01/24 | | 23,370,000 | | 26,037,919 |
| Public Improvement, Series A, 4.50%, 3/01/26 | | 4,855,000 | | 5,027,741 |
| Refunding, Series B, 5.00%, 6/01/19 | | 5,000,000 | | 5,897,350 |
| North Carolina State Ports Authority Port Facilities Revenue, senior lien, Refunding, Series A, | | | | |
| 5.25%, 2/01/40 | | 6,000,000 | | 5,860,140 |
| North Carolina Turnpike Authority Triangle Expressway System Revenue, Series A, | | | | |
| Assured Guaranty, | | | | |
| 5.50%, 1/01/29 | | 6,400,000 | | 6,592,192 |
| 5.75%, 1/01/39 | | 12,120,000 | | 12,217,566 |
| Northern Hospital District of Surry County Health Care Facilities Revenue, | | | | |
| 6.00%, 10/01/28 | | 1,000,000 | | 977,660 |
| 6.25%, 10/01/38 | | 2,000,000 | | 1,974,000 |
| Oak Island Enterprise System Revenue, | | | | |
| Assured Guaranty, 6.00%, 6/01/34 | | 1,540,000 | | 1,577,006 |
| Assured Guaranty, 6.00%, 6/01/36 | | 1,000,000 | | 1,016,780 |
| Series A, NATL Insured, 5.00%, 6/01/33 | | 5,000,000 | | 4,570,800 |
| Onslow County Hospital Authority FHA Insured Mortgage Revenue, Onslow Memorial Hospital | | | | |
| Project, NATL Insured, 5.00%, | | | | |
| 4/01/31 | | 5,900,000 | | 5,739,461 |
| 10/01/34 | | 6,000,000 | | 5,727,960 |
| Onslow Water and Sewer Authority Combined Enterprise System Revenue, Series A, | | | | |
| NATL Insured, 5.00%, 6/01/33 | | 7,500,000 | | 7,459,575 |
| Pasquotank County COP, NATL Insured, 5.00%, 6/01/25 | | 1,400,000 | | 1,419,978 |
| Pitt County COP, School Facilities Project, Series B, AMBAC Insured, 5.00%, 4/01/29 | | 2,500,000 | | 2,502,025 |
| Pitt County Revenue, Assured Guaranty, 5.00%, 4/01/34 | | 1,000,000 | | 962,860 |
| Raleigh Combined Enterprise System Revenue, | | | | |
| 5.00%, 3/01/31 | | 10,360,000 | | 10,532,598 |
| 5.00%, 3/01/40 | | 11,915,000 | | 12,017,588 |
| Series A, 5.00%, 3/01/36 | | 6,000,000 | | 6,071,280 |
| Raleigh COP, Downtown Improvement Projects, Series A, 5.00%, 2/01/29 | | 6,070,000 | | 6,170,944 |
| Raleigh-Durham Airport Authority Airport Revenue, | | | | |
| Refunding, Series A, 5.00%, 5/01/36 | | 10,785,000 | | 10,617,293 |
| Series A, AMBAC Insured, 5.00%, 5/01/30 | | 14,060,000 | | 14,148,156 |
| Series A, NATL RE, FGIC Insured, Pre-Refunded, 5.00%, 11/01/31 | | 8,000,000 | | 8,140,480 |
| Rockingham County COP, Assured Guaranty, 5.00%, 4/01/32 | | 9,380,000 | | 9,435,154 |
| Union County COP, AMBAC Insured, 5.00%, 6/01/30 | | 5,000,000 | | 5,091,900 |
| University of North Carolina at Asheville Revenue, General, | | | | |
| Refunding, Series A, AMBAC Insured, 5.00%, 6/01/27 | | 790,000 | | 800,310 |
| Series A, AMBAC Insured, Pre-Refunded, 5.00%, 6/01/27 | | 410,000 | | 432,804 |
Annual Report | 141
| | | | |
| Franklin Tax-Free Trust | | | | |
| |
| Statement of Investments, February 28, 2011 (continued) | | | | |
| |
| |
| Franklin North Carolina Tax-Free Income Fund | | Principal Amount | | Value |
| Municipal Bonds (continued) | | | | |
| North Carolina (continued) | | | | |
| University of North Carolina at Chapel Hill Revenue, Board of Governors of the University of | | | | |
| North Carolina, General, | | | | |
| 5.00%, 12/01/28 | $ | 1,000,000 | $ | 1,023,070 |
| 5.00%, 12/01/31 | | 9,000,000 | | 9,279,810 |
| Refunding, Series A, 5.00%, 12/01/34 | | 11,460,000 | | 11,657,456 |
| Series A, 5.00%, 12/01/25 | | 4,000,000 | | 4,020,440 |
| University of North Carolina at Charlotte Revenue, General, Series B, AGMC Insured, 5.00%, | | | | |
| 4/01/32 | | 5,000,000 | | 5,078,300 |
| University of North Carolina at Greensboro Revenue, General, Series A, Assured Guaranty, | | | | |
| 5.00%, 4/01/34 | | 1,000,000 | | 1,007,890 |
| University of North Carolina at Wilmington COP, Student Housing Project, | | | | |
| Assured Guaranty, 5.00%, 6/01/32 | | 5,000,000 | | 4,980,150 |
| NATL RE, FGIC Insured, 5.00%, 6/01/26 | | 1,655,000 | | 1,667,777 |
| NATL RE, FGIC Insured, 5.00%, 6/01/27 | | 1,740,000 | | 1,747,030 |
| NATL RE, FGIC Insured, 5.00%, 6/01/29 | | 1,915,000 | | 1,894,529 |
| NATL RE, FGIC Insured, 5.00%, 6/01/37 | | 11,350,000 | | 10,397,848 |
| University of North Carolina System Pool Revenue, | | | | |
| AMBAC Insured, 5.00%, 4/01/29 | | 2,500,000 | | 2,534,025 |
| Series A, AMBAC Insured, 5.00%, 4/01/27 | | 785,000 | | 800,237 |
| Series A, AMBAC Insured, Pre-Refunded, 5.00%, 4/01/27 | | 1,315,000 | | 1,406,577 |
| Series A, Assured Guaranty, 5.00%, 10/01/33 | | 5,000,000 | | 5,053,200 |
| Series A, NATL Insured, 5.00%, 10/01/33 | | 2,000,000 | | 1,991,880 |
| Wake County GO, | | | | |
| Limited Obligation Bonds, Series 2009, 5.00%, 6/01/36 | | 5,000,000 | | 5,073,850 |
| Refunding, Series C, 5.00%, 3/01/25 | | 10,000,000 | | 11,386,600 |
| Wake County Industrial Facilities and PCFA Revenue, Carolina Power and Light Co. Project, | | | | |
| Refunding, 5.375%, 2/01/17 | | 8,000,000 | | 8,292,800 |
| Wake County Revenue, 5.00%, | | | | |
| 1/01/33 | | 10,820,000 | | 11,130,426 |
| 1/01/37 | | 12,000,000 | | 12,161,640 |
| Western Carolina University Research and Development Corp. COP, Western Carolina | | | | |
| University Student Housing, Assured Guaranty, 5.00%, 6/01/39 | | 5,000,000 | | 4,739,150 |
| Wilkes County COP, NATL Insured, 5.00%, | | | | |
| 6/01/31 | | 4,295,000 | | 4,302,516 |
| 6/01/36 | | 6,085,000 | | 5,832,047 |
| Wilmington COP, | | | | |
| AMBAC Insured, 5.00%, 9/01/29 | | 1,000,000 | | 1,011,810 |
| Refunding, Series A, AMBAC Insured, 5.00%, 6/01/32 | | 5,310,000 | | 5,333,789 |
| Series A, 5.00%, 6/01/33 | | 6,000,000 | | 6,006,780 |
| Series A, 5.00%, 6/01/38 | | 7,625,000 | | 7,414,397 |
| Wilmington Storm Water Fee Revenue, Refunding, AMBAC Insured, 5.00%, | | | | |
| 6/01/28 | | 700,000 | | 716,527 |
| 6/01/33 | | 1,000,000 | | 1,009,000 |
| Wilmington Water and Sewer System Revenue, Refunding, AGMC Insured, 5.00%, | | | | |
| 6/01/34 | | 3,565,000 | | 3,576,871 |
| Wilson COP, Public Facilities Project, Assured Guaranty, 5.00%, 5/01/33 | | 3,000,000 | | 2,975,970 |
142 | Annual Report
| | | | |
| Franklin Tax-Free Trust | | | | |
| |
| Statement of Investments, February 28, 2011 (continued) | | | | |
| |
| |
| Franklin North Carolina Tax-Free Income Fund | | Principal Amount | | Value |
| Municipal Bonds (continued) | | | | |
| North Carolina (continued) | | | | |
| Winston-Salem Water and Sewer System Revenue, | | | | |
| 5.00%, 6/01/39 | $ | 5,000,000 | $ | 5,077,250 |
| Pre-Refunded, 5.125%, 6/01/20 | | 2,500,000 | | 2,554,300 |
| Refunding, Series A, 5.00%, 6/01/32 | | 7,590,000 | | 7,814,892 |
| | | | | 950,219,067 |
| U.S. Territories 18.3% | | | | |
| Puerto Rico 17.9% | | | | |
| Children’s Trust Fund Puerto Rico Tobacco Settlement Revenue, Asset-Backed Bonds, | | | | |
| Refunding, 5.50%, 5/15/39 | | 7,000,000 | | 5,571,300 |
| Puerto Rico Commonwealth Aqueduct and Sewer Authority Revenue, senior lien, Series A, | | | | |
| 6.00%, 7/01/38 | | 2,100,000 | | 1,971,438 |
| Puerto Rico Commonwealth GO, | | | | |
| Public Improvement, AGMC Insured, Pre-Refunded, 5.125%, 7/01/30 | | 4,805,000 | | 4,881,688 |
| Public Improvement, Refunding, AGMC Insured, 5.125%, 7/01/30 | | 3,445,000 | | 3,327,939 |
| Public Improvement, Refunding, Series A, 5.50%, 7/01/32 | | 5,000,000 | | 4,835,150 |
| Public Improvement, Refunding, Series B, 6.00%, 7/01/39 | | 10,000,000 | | 9,891,500 |
| Public Improvement, Series A, 5.375%, 7/01/28 | | 4,925,000 | | 4,962,676 |
| Public Improvement, Series A, 5.125%, 7/01/31 | | 3,265,000 | | 3,266,698 |
| Public Improvement, Series A, Pre-Refunded, 5.375%, 7/01/28 | | 2,405,000 | | 2,445,356 |
| Public Improvement, Series A, Pre-Refunded, 5.125%, 7/01/31 | | 1,000,000 | | 1,015,960 |
| Series A, 5.00%, 7/01/26 | | 8,050,000 | | 7,548,888 |
| Series A, 5.25%, 7/01/37 | | 5,000,000 | | 4,375,250 |
| Puerto Rico Commonwealth Highway and Transportation Authority Transportation Revenue, | | | | |
| Refunding, Series A, NATL Insured, 5.00%, 7/01/38 | | 85,000 | | 71,579 |
| Refunding, Series D, AGMC Insured, 5.00%, 7/01/32 | | 3,060,000 | | 2,872,697 |
| Refunding, Series H, 5.00%, 7/01/35 | | 1,490,000 | | 1,273,414 |
| Series D, Pre-Refunded, 5.375%, 7/01/36 | | 5,000,000 | | 5,311,100 |
| Series D, Pre-Refunded, 5.25%, 7/01/38 | | 3,000,000 | | 3,181,710 |
| Series H, Pre-Refunded, 5.00%, 7/01/35 | | 2,790,000 | | 3,065,819 |
| Puerto Rico Convention Center District Authority Hotel Occupancy Tax Revenue, Series A, | | | | |
| AMBAC Insured, 5.00%, 7/01/31 | | 6,000,000 | | 5,351,880 |
| Puerto Rico Electric Power Authority Power Revenue, | | | | |
| Series NN, NATL Insured, Pre-Refunded, 5.00%, 7/01/32 | | 5,000,000 | | 5,494,300 |
| Series RR, FGIC Insured, Pre-Refunded, 5.00%, 7/01/35 | | 3,000,000 | | 3,443,760 |
| Series RR, XLCA Insured, Pre-Refunded, 5.00%, 7/01/30 | | 1,000,000 | | 1,147,920 |
| Series TT, 5.00%, 7/01/32 | | 10,100,000 | | 9,140,500 |
| Series WW, 5.50%, 7/01/38 | | 6,700,000 | | 6,102,896 |
| Series XX, 5.25%, 7/01/40 | | 15,600,000 | | 13,624,104 |
| Puerto Rico PBA Guaranteed Revenue, Government Facilities, | | | | |
| Refunding, Series D, 5.375%, 7/01/33 | | 1,790,000 | | 1,678,268 |
| Refunding, Series N, 5.00%, 7/01/32 | | 10,000,000 | | 8,837,700 |
| Refunding, Series P, 6.75%, 7/01/36 | | 5,000,000 | | 5,309,700 |
| Series D, Pre-Refunded, 5.375%, 7/01/33 | | 5,210,000 | | 5,534,166 |
| Series I, 5.00%, 7/01/36 | | 2,405,000 | | 2,038,454 |
Annual Report | 143
| | | | |
| Franklin Tax-Free Trust | | | | |
| |
| Statement of Investments, February 28, 2011 (continued) | | | | |
| |
| |
| Franklin North Carolina Tax-Free Income Fund | | Principal Amount | | Value |
| Municipal Bonds (continued) | | | | |
| U.S. Territories (continued) | | | | |
| Puerto Rico (continued) | | | | |
| Puerto Rico Sales Tax FICO Sales Tax Revenue, first sub., | | | | |
| Series A, 5.375%, 8/01/39 | $ | 20,000,000 | $ | 18,380,200 |
| Series A, 5.50%, 8/01/42 | | 5,750,000 | | 5,368,315 |
| Series A, 6.00%, 8/01/42 | | 45,750,000 | | 45,836,925 |
| Series C, 5.50%, 8/01/40 | | 5,000,000 | | 4,675,850 |
| | | | | 211,835,100 |
| U.S. Virgin Islands 0.4% | | | | |
| Virgin Islands PFAR, senior lien, Refunding, Series B, 5.00%, 10/01/25 | | 5,500,000 | | 5,421,460 |
| Total U.S. Territories | | | | 217,256,560 |
| Total Municipal Bonds before Short Term Investments | | | | |
| (Cost $1,187,862,974) | | | | 1,167,475,627 |
| Short Term Investments 0.4% | | | | |
| Municipal Bonds 0.4% | | | | |
| North Carolina 0.4% | | | | |
| aCharlotte-Mecklenburg Hospital Authority Health Care System Revenue, Carolinas HealthCare, | | | | |
| Refunding, Series B, Daily VRDN and Put, 0.19%, 1/15/26 | | 1,205,000 | | 1,205,000 |
| aNorth Carolina Medical Care Commission Hospital Revenue, Randolph Hospital, Refunding, | | | | |
| Daily VRDN and Put, 0.23%, 10/01/37 | | 4,000,000 | | 4,000,000 |
| Total Short Term Investments (Cost $5,205,000) | | | | 5,205,000 |
| Total Investments (Cost $1,193,067,974) 98.9% | | | | 1,172,680,627 |
| Other Assets, less Liabilities 1.1% | | | | 12,747,310 |
| Net Assets 100.0% | | | $ | 1,185,427,937 |
|
| See Abbreviations on page 180. |
| |
| aVariable rate demand notes (VRDNs) are tax-exempt obligations which contain a floating or variable interest rate adjustment formula and an unconditional right of demand to |
| receive payment of the principal balance plus accrued interest at specified dates. The coupon rate shown represents the rate at period end. |
144 | The accompanying notes are an integral part of these financial statements. | Annual Report
| | | | | | | | | | | | | | | |
| Franklin Tax-Free Trust | | | | | | | | | | | | | |
| |
| Financial Highlights | | | | | | | | | | | | | | | |
| |
| Franklin Virginia Tax-Free Income Fund | | | | | | | | | | | | | | | |
| | | | | | Year Ended February 28, | | | | |
| Class A | | 2011 | | | 2010 | | | 2009 | | | 2008 | a | | 2007 | |
| Per share operating performance | | | | | | | | | | | | | | | |
| (for a share outstanding throughout the year) | | | | | | | | | | | | | | | |
| Net asset value, beginning of year | $ | 11.63 | | $ | 10.95 | | $ | 11.12 | | $ | 11.85 | | $ | 11.85 | |
| Income from investment operationsb: | | | | | | | | | | | | | | | |
| Net investment incomec | | 0.48 | | | 0.49 | | | 0.49 | | | 0.49 | | | 0.50 | |
| Net realized and unrealized gains (losses) | | (0.45 | ) | | 0.68 | | | (0.18 | ) | | (0.73 | ) | | —d | |
| Total from investment operations | | 0.03 | | | 1.17 | | | 0.31 | | | (0.24 | ) | | 0.50 | |
| Less distributions from net investment income | | (0.48 | ) | | (0.49 | ) | | (0.48 | ) | | (0.49 | ) | | (0.50 | ) |
| Redemption feese | | — | | | — | | | —d | | | —d | | | —d | |
| Net asset value, end of year | $ | 11.18 | | $ | 11.63 | | $ | 10.95 | | $ | 11.12 | | $ | 11.85 | |
| |
| Total returnf | | 0.24 | % | | 10.82 | % | | 2.80 | % | | (2.13 | )% | | 4.37 | % |
| |
| Ratios to average net assets | | | | | | | | | | | | | | | |
| Expenses | | 0.64 | % | | 0.65 | % | | 0.66 | % | | 0.66 | % | | 0.66 | % |
| Net investment income | | 4.11 | % | | 4.27 | % | | 4.42 | % | | 4.18 | % | | 4.25 | % |
| |
| Supplemental data | | | | | | | | | | | | | | | |
| Net assets, end of year (000’s) | $ | 647,471 | | $ | 675,934 | | $ | 547,261 | | $ | 494,276 | | $ | 493,441 | |
| Portfolio turnover rate | | 16.44 | % | | 6.08 | % | | 8.75 | % | | 18.28 | % | | 8.51 | % |
| |
| |
| aFor the year ended February 29. | | | | | | | | | | | | | | | |
| bThe amount shown for a share outstanding throughout the period may not correlate with the Statement of Operations for the period due to the timing of sales and repurchases of | |
| the Fund shares in relation to income earned and/or fluctuating market value of the investments of the Fund. | | | | | | | | | | | | | |
| cBased on average daily shares outstanding. | | | | | | | | | | | | | | | |
| dAmount rounds to less than $0.01 per share. | | | | | | | | | | | | | | | |
| eEffective September 1, 2008, the redemption fee was eliminated. | | | | | | | | | | | | | |
| fTotal return does not reflect sales commissions or contingent deferred sales charges, if applicable. | | | | | | | | | | | | | |
| |
| |
| |
| |
| Annual Report | | | The accompanying notes are an integral part of these financial statements. | 145 | |
| | | | | | | | | | | | | | | |
| Franklin Tax-Free Trust | | | | | | | | | | | | | | | |
| Financial Highlights (continued) | | | | | | | | | | | | | | | |
| |
| Franklin Virginia Tax-Free Income Fund | | | | | | | | | | | | | | | |
| | | | | | Year Ended February 28, | | | | |
| Class C | | 2011 | | | 2010 | | | 2009 | | | 2008 | a | | 2007 | |
| Per share operating performance | | | | | | | | | | | | | | | |
| (for a share outstanding throughout the year) | | | | | | | | | | | | | | | |
| Net asset value, beginning of year | $ | 11.77 | | $ | 11.08 | | $ | 11.24 | | $ | 11.97 | | $ | 11.96 | |
| Income from investment operationsb: | | | | | | | | | | | | | | | |
| Net investment incomec | | 0.42 | | | 0.43 | | | 0.43 | | | 0.43 | | | 0.44 | |
| Net realized and unrealized gains (losses) | | (0.45 | ) | | 0.68 | | | (0.18 | ) | | (0.74 | ) | | 0.01 | |
| Total from investment operations | | (0.03 | ) | | 1.11 | | | 0.25 | | | (0.31 | ) | | 0.45 | |
| Less distributions from net investment income | | (0.42 | ) | | (0.42 | ) | | (0.41 | ) | | (0.42 | ) | | (0.44 | ) |
| Redemption feesd | | — | | | — | | | —e | | | —e | | | —e | |
| Net asset value, end of year | $ | 11.32 | | $ | 11.77 | | $ | 11.08 | | $ | 11.24 | | $ | 11.97 | |
| |
| Total returnf | | (0.33 | )% | | 10.18 | % | | 2.30 | % | | (2.65 | )% | | 3.84 | % |
| |
| Ratios to average net assets | | | | | | | | | | | | | | | |
| Expenses | | 1.19 | % | | 1.20 | % | | 1.21 | % | | 1.21 | % | | 1.20 | % |
| Net investment income | | 3.56 | % | | 3.72 | % | | 3.87 | % | | 3.63 | % | | 3.71 | % |
| |
| Supplemental data | | | | | | | | | | | | | | | |
| Net assets, end of year (000’s) | $ | 123,765 | | $ | 119,921 | | $ | 73,493 | | $ | 60,372 | | $ | 56,793 | |
| Portfolio turnover rate | | 16.44 | % | | 6.08 | % | | 8.75 | % | | 18.28 | % | | 8.51 | % |
|
| aFor the year ended February 29. |
| bThe amount shown for a share outstanding throughout the period may not correlate with the Statement of Operations for the period due to the timing of sales and repurchases of |
| the Fund shares in relation to income earned and/or fluctuating market value of the investments of the Fund. |
| cBased on average daily shares outstanding. |
| dEffective September 1, 2008, the redemption fee was eliminated. |
| eAmount rounds to less than $0.01 per share. |
| fTotal return does not reflect sales commissions or contingent deferred sales charges, if applicable. |
146 | The accompanying notes are an integral part of these financial statements. | Annual Report
| | | | | | |
| Franklin Tax-Free Trust | | | | | | |
| Financial Highlights (continued) | | | | | | |
| |
| Franklin Virginia Tax-Free Income Fund | | | | | | |
| | | Year Ended | |
| | | February 28, | |
| Advisor Class | | 2011 | | | 2010 | a |
| Per share operating performance | | | | | | |
| (for a share outstanding throughout the year) | | | | | | |
| Net asset value, beginning of year | $ | 11.63 | | $ | 11.15 | |
| Income from investment operationsb: | | | | | | |
| Net investment incomec | | 0.49 | | | 0.33 | |
| Net realized and unrealized gains (losses) | | (0.44 | ) | | 0.47 | |
| Total from investment operations | | 0.05 | | | 0.80 | |
| Less distributions from net investment income | | (0.50 | ) | | (0.32 | ) |
| Net asset value, end of year | $ | 11.18 | | $ | 11.63 | |
| |
| Total returnd | | 0.34 | % | | 7.26 | % |
| |
| Ratios to average net assetse | | | | | | |
| Expenses | | 0.54 | % | | 0.55 | % |
| Net investment income | | 4.21 | % | | 4.37 | % |
| |
| Supplemental data | | | | | | |
| Net assets, end of year (000’s) | $ | 11,030 | | $ | 7,601 | |
| Portfolio turnover rate | | 16.44 | % | | 6.08 | % |
|
| aFor the period July 1, 2009 (effective date) to February 28, 2010. |
| bThe amount shown for a share outstanding throughout the period may not correlate with the Statement of Operations for the period due to the timing of sales and repurchases of |
| the Fund shares in relation to income earned and/or fluctuating market value of the investments of the Fund. |
| cBased on average daily shares outstanding. |
| dTotal return is not annualized for periods less than one year. |
| eRatios are annualized for periods less than one year. |
Annual Report | The accompanying notes are an integral part of these financial statements. | 147
| | | | | |
| | Franklin Tax-Free Trust | | | | |
| |
| | Statement of Investments, February 28, 2011 | | | | |
| |
| |
| | Franklin Virginia Tax-Free Income Fund | | Principal Amount | | Value |
| | Municipal Bonds 98.9% | | | | |
| | Virginia 73.2% | | | | |
| | Abingdon IDA Hospital Facilities Revenue, Johnston Memorial Hospital, Refunding, 5.375%, | | | | |
| | 7/01/28 | $ | 5,000,000 | $ | 4,701,150 |
| | Bedford County IDA, IDR, Nekoosa Packaging Corp. Project, Refunding, | | | | |
| | 6.30%, 12/01/25 | | 2,000,000 | | 1,971,480 |
| | Series A, 6.55%, 12/01/25 | | 5,000,000 | | 5,006,900 |
| | Bristol Utility System Revenue, AGMC Insured, ETM, 5.00%, 7/15/21 | | 1,245,000 | | 1,421,541 |
| | Capital Region Airport Commission Airport Revenue, AGMC Insured, 5.00%, | | | | |
| | 7/01/31 | | 2,000,000 | | 2,030,500 |
| | 7/01/38 | | 5,895,000 | | 5,765,664 |
| | Caroline County IDA Lease Revenue, AMBAC Insured, 5.125%, 6/15/34 | | 1,000,000 | | 914,790 |
| | Charlotte County IDA Hospital Revenue, Halifax Regional Hospital Inc., 5.00%, 9/01/37 | | 2,500,000 | | 2,158,075 |
| | Chesapeake Toll Road Revenue, Expressway, Series A, 5.625%, | | | | |
| | 7/15/19 | | 2,640,000 | | 2,642,719 |
| | 7/15/32 | | 8,000,000 | | 7,585,440 |
| | Chesterfield County EDA, PCR, Virginia Electric and Power, Refunding, Series A, 5.00%, | | | | |
| | 5/01/23 | | 5,000,000 | | 5,245,500 |
| | Chesterfield County EDA Revenue, Bon Secours Health, | | | | |
| | Series C-1, AGMC Insured, 5.00%, 11/01/42 | | 4,000,000 | | 3,706,960 |
| | Series C-2, Assured Guaranty, 5.00%, 11/01/42 | | 8,000,000 | | 7,413,920 |
| | Dinwiddie County IDA Lease Revenue, Refunding, Series B, NATL Insured, 5.00%, 2/15/30 | | 1,410,000 | | 1,372,917 |
| | Fairfax County EDA Revenue, National Wildlife Federation, NATL Insured, 5.375%, 9/01/29 | | 8,000,000 | | 8,005,520 |
| | Fairfax County IDAR, Health Care, Inova Health System Project, | | | | |
| | Refunding, Series C, 5.00%, 5/15/25 | | 3,500,000 | | 3,563,385 |
| | Series A, 5.50%, 5/15/35 | | 10,000,000 | | 10,058,100 |
| | Fairfax County Water Authority Water Revenue, | | | | |
| Pre | -Refunded, 5.00%, 4/01/27 | | 2,830,000 | | 2,971,755 |
| | Refunding, 5.00%, 4/01/27 | | 11,420,000 | | 11,536,484 |
| | Front Royal and Warren County IDA Lease Revenue, School and Capital Improvement, Series B, | | | | |
| | AGMC Insured, 5.00%, | | | | |
| | 4/01/29 | | 5,115,000 | | 5,190,497 |
| | 4/01/35 | | 6,000,000 | | 6,001,440 |
| | Greater Richmond Convention Center Authority Hotel Tax Revenue, Refunding, NATL Insured, | | | | |
| | 5.00%, 6/15/30 | | 17,555,000 | | 17,004,651 |
| | Hampton Convention Center Revenue, Refunding, AMBAC Insured, | | | | |
| | 5.25%, 1/15/23 | | 3,000,000 | | 3,056,910 |
| | 5.125%, 1/15/28 | | 2,605,000 | | 2,623,964 |
| | 5.00%, 1/15/35 | | 7,600,000 | | 7,302,688 |
| | Hampton Roads Sanitation District Wastewater Revenue, Hampton Roads, | | | | |
| | 5.00%, 4/01/33 | | 10,000,000 | | 10,214,700 |
| | Refunding, 5.00%, 4/01/38 | | 16,000,000 | | 16,132,160 |
| | Harrisonburg IDAR, Hospital Facilities, Rockingham Memorial Hospital, AMBAC Insured, 5.00%, | | | | |
| | 8/15/42 | | 8,095,000 | | 6,955,791 |
| | 8/15/46 | | 15,000,000 | | 12,730,050 |
| | King George County IDA Lease Revenue, AGMC Insured, 5.00%, 3/01/32 | | 3,595,000 | | 3,625,773 |
| | Lexington IDA Educational Facilities Revenue, VMI Development Board Inc. Project, Series C, | | | | |
| | 5.00%, 12/01/36 | | 5,000,000 | | 5,041,900 |
| | Loudoun County IDA Hospital Revenue, Loudoun Hospital Center, Series A, Pre-Refunded, | | | | |
| | 6.10%, 6/01/32 | | 1,500,000 | | 1,614,840 |
148 | Annual Report
| | | | |
| Franklin Tax-Free Trust | | | | |
| |
| Statement of Investments, February 28, 2011 (continued) | | | | |
| |
| |
| Franklin Virginia Tax-Free Income Fund | | Principal Amount | | Value |
| Municipal Bonds (continued) | | | | |
| Virginia (continued) | | | | |
| Loudoun County Sanitation Authority Water and Sewer Revenue, 5.00%, 1/01/33 | $ | 15,060,000 | $ | 15,326,411 |
| Louisa IDA, PCR, Virginia Electric and Power Co. Project, Mandatory Put 12/01/11, Series C, | | | | |
| 5.00%, 11/01/35 | | 5,000,000 | | 5,139,550 |
| Manassas Park GO, Series A, CIFG Insured, 5.00%, 4/01/29 | | 5,545,000 | | 5,643,590 |
| Middle River Regional Jail Authority Jail Facility Revenue, NATL Insured, 5.00%, 5/15/28 | | 1,000,000 | | 1,018,110 |
| Montgomery County IDA Public Facilities Lease Revenue, Public Projects, 5.00%, 2/01/29 | | 6,500,000 | | 6,679,270 |
| Newport News EDA, EDR, Series A, 5.00%, 1/15/31 | | 5,870,000 | | 5,948,012 |
| Newport News Water Revenue, AGMC Insured, 5.00%, 6/01/37 | | 1,345,000 | | 1,359,270 |
| Norfolk Airport Authority Revenue, Series B, NATL RE, FGIC Insured, 5.125%, 7/01/31 | | 1,440,000 | | 1,336,061 |
| Norfolk Water Revenue, NATL Insured, 5.90%, 11/01/25 | | 5,000,000 | | 5,011,500 |
| Northwestern Regional Jail Authority Jail Facilities Revenue, NATL Insured, 5.00%, 7/01/33 | | 2,600,000 | | 2,439,138 |
| Orange County IDAR, Public Facility, Orange County Project, AMBAC Insured, Pre-Refunded, | | | | |
| 5.00%, 2/01/34 | | 1,000,000 | | 1,051,370 |
| Patrick County EDA Lease Revenue, School Projects, Assured Guaranty, 5.25%, 3/01/39 | | 6,435,000 | | 6,449,929 |
| Pittsylvania County GO, Series B, 5.75%, 2/01/30 | | 5,800,000 | | 6,237,900 |
| Powhatan County EDA Lease Revenue, Virginia Capital Projects, AMBAC Insured, 5.25%, | | | | |
| 7/15/33 | | 1,000,000 | | 1,006,670 |
| Prince William County IDA, MFHR, Remington Place Apartments Project, Series A-1, | | | | |
| AMBAC Insured, 6.00%, 12/01/33 | | 2,080,000 | | 1,860,830 |
| Prince William County Service Authority Water and Sewer System Revenue, Refunding, 5.00%, | | | | |
| 7/01/32 | | 1,750,000 | | 1,801,975 |
| Richmond IDA Student Housing Revenue, University Real Estate Foundation, 5.55%, | | | | |
| 1/01/31 | | 4,400,000 | | 4,420,856 |
| Richmond Public Facilities COP, 800 Megahertz Project, Series A, AMBAC Insured, 5.00%, | | | | |
| 8/01/22 | | 2,000,000 | | 2,010,060 |
| Richmond Public Utility Revenue, | | | | |
| AGMC Insured, 5.00%, 1/15/35 | | 3,500,000 | | 3,531,605 |
| AGMC Insured, Pre-Refunded, 5.00%, 1/15/33 | | 8,500,000 | | 8,842,465 |
| Refunding, 5.00%, 1/15/35 | | 11,495,000 | | 11,688,691 |
| Riverside Regional Jail Authority Jail Facility Revenue, NATL Insured, 5.00%, | | | | |
| 7/01/28 | | 7,000,000 | | 7,071,330 |
| 7/01/32 | | 22,000,000 | | 21,602,240 |
| Roanoke County EDA Lease Revenue, Public Facility Projects, Assured Guaranty, 5.125%, | | | | |
| 10/15/37 | | 10,000,000 | | 10,077,800 |
| Roanoke EDA Hospital Revenue, Carilion Clinic Obligation, Refunding, 5.00%, 7/01/33 | | 10,615,000 | | 9,943,814 |
| Roanoke IDA Hospital Revenue, Carilion Health System, Series B, Assured Guaranty, 5.00%, | | | | |
| 7/01/38 | | 10,000,000 | | 9,150,600 |
| Stafford County and Staunton IDAR, Virginia Municipal League Assn. Counties Program, | | | | |
| Series A, NATL Insured, 5.25%, 8/01/31 | | 5,000,000 | | 5,096,350 |
| Series C, NATL Insured, 5.00%, 8/01/35 | | 7,735,000 | | 7,429,158 |
| XLCA Insured, 5.00%, 8/01/37 | | 3,985,000 | | 3,600,726 |
| Stafford County EDA Hospital Facilities Revenue, Medicorp Health System Obligation, 5.25%, | | | | |
| 6/15/37 | | 5,000,000 | | 4,545,950 |
| University of Virginia Revenue, | | | | |
| General, 5.00%, 6/01/37 | | 8,935,000 | | 9,019,346 |
| General, Refunding, 5.00%, 6/01/40 | | 16,750,000 | | 16,982,490 |
| Series B, 5.00%, 6/01/33 | | 14,000,000 | | 14,164,780 |
| Virginia Beach Development Authority Public Facility Revenue, 5.00%, 7/15/27 | | 5,635,000 | | 5,909,932 |
Annual Report | 149
| | | | |
| Franklin Tax-Free Trust | | | | |
| |
| Statement of Investments, February 28, 2011 (continued) | | | | |
| |
| |
| Franklin Virginia Tax-Free Income Fund | | Principal Amount | | Value |
| Municipal Bonds (continued) | | | | |
| Virginia (continued) | | | | |
| Virginia College Building Authority Educational Facilities Revenue, | | | | |
| Liberty University Projects, 5.25%, 3/01/29 | $ | 2,860,000 | $ | 3,021,561 |
| Liberty University Projects, 5.00%, 3/01/41 | | 26,855,000 | | 26,363,553 |
| Public Higher Education Financing Program, Series A, 5.00%, 9/01/33 | | 4,010,000 | | 4,075,122 |
| Regent University Project, NATL Insured, Pre-Refunded, 5.125%, 10/01/21 | | 5,000,000 | | 5,140,050 |
| Regent University Project, NATL Insured, Pre-Refunded, 5.125%, 10/01/31 | | 4,050,000 | | 4,163,440 |
| Virginia Commonwealth Transportation Board Transportation Revenue, Northern Virginia | | | | |
| Transportation Program, Refunding, Series A, 5.00%, 5/15/27 | | 8,920,000 | | 9,047,021 |
| Virginia Port Authority Port Facility Revenue, | | | | |
| NATL Insured, 4.75%, 7/01/28 | | 1,500,000 | | 1,399,275 |
| Refunding, 5.00%, 7/01/40 | | 8,905,000 | | 8,809,716 |
| Virginia Small Business Financing Authority Healthcare Facilities Revenue, Sentara Healthcare, | | | | |
| Refunding, 5.00%, 11/01/40 | | 23,000,000 | | 22,138,650 |
| Virginia State HDA Revenue, Rental Housing, | | | | |
| Series B, 5.625%, 6/01/39 | | 7,240,000 | | 7,414,267 |
| Series B, 5.00%, 6/01/45 | | 3,050,000 | | 2,919,796 |
| Series E, 5.00%, 10/01/44 | | 6,540,000 | | 6,250,213 |
| Series F, 5.05%, 12/01/44 | | 12,125,000 | | 11,705,354 |
| Series F, 5.00%, 4/01/45 | | 2,125,000 | | 2,024,849 |
| Virginia State HDA, Commonwealth Mortgage Revenue, Series E, 6.375%, 1/01/36 | | 9,815,000 | | 10,212,311 |
| Virginia State Public School Authority Revenue, School Financing, Series C, Pre-Refunded, | | | | |
| 5.00%, 8/01/26 | | 5,000,000 | | 5,146,000 |
| Virginia State Public School Authority Special Obligation Fluvanna County Revenue, School | | | | |
| Financing, 6.00%, 12/01/32 | | 5,000,000 | | 5,377,150 |
| Virginia State Resources Authority Airports Revenue, Revolving Fund, Series A, 5.00%, | | | | |
| 8/01/27 | | 3,000,000 | | 3,001,020 |
| Virginia State Resources Authority Infrastructure Revenue, | | | | |
| Refunding, 5.00%, 11/01/40 | | 1,750,000 | | 1,753,868 |
| Senior Series A, 5.00%, 11/01/31 | | 5,000,000 | | 5,181,550 |
| Senior Series A, 5.00%, 11/01/36 | | 4,915,000 | | 4,984,793 |
| Virginia Pooled Financing Program, Senior Series, 5.00%, 11/01/33 | | 4,615,000 | | 4,678,918 |
| Virginia Pooled Financing Program, Senior Series A, 5.00%, 11/01/38 | | 1,600,000 | | 1,624,304 |
| Virginia Pooled Financing Program, Senior Series B, 5.00%, 11/01/32 | | 2,505,000 | | 2,606,954 |
| Virginia Pooled Financing Program, Senior Series, Pre-Refunded, 5.00%, 11/01/33 | | 385,000 | | 427,920 |
| Virginia State Resources Authority Water and Sewer System Revenue, Tuckahoe Service District | | | | |
| Project, 5.00%, 11/01/35 | | 1,125,000 | | 1,132,774 |
| Winchester IDA Hospital Revenue, Valley Health System Obligation, Series E, 5.625%, | | | | |
| 1/01/44 | | 3,350,000 | | 3,221,394 |
| | | | | 572,787,766 |
| District of Columbia 8.7% | | | | |
| Metropolitan Washington D.C. Airports Authority Airport System Revenue, | | | | |
| Refunding, BHAC Insured, 5.00%, 10/01/29 | | 3,000,000 | | 3,052,230 |
| Refunding, Series A, 5.00%, 10/01/35 | | 12,000,000 | | 11,620,080 |
| Refunding, Series A, AGMC Insured, 5.00%, 10/01/32 | | 10,000,000 | | 9,216,900 |
| Refunding, Series A, NATL RE, FGIC Insured, 5.00%, 10/01/25 | | 1,000,000 | | 997,910 |
| Refunding, Series C, 5.125%, 10/01/34 | | 6,450,000 | | 6,393,046 |
| Refunding, Series F-1, 5.00%, 10/01/31 | | 6,460,000 | | 6,503,734 |
| Series B, FGIC Insured, Pre-Refunded, 5.25%, 10/01/32 | | 6,655,000 | | 7,155,523 |
| |
| 150 | Annual Report | | | | |
| | | | |
| Franklin Tax-Free Trust | | | | |
| |
| Statement of Investments, February 28, 2011 (continued) | | | | |
| |
| |
| Franklin Virginia Tax-Free Income Fund | | Principal Amount | | Value |
| Municipal Bonds (continued) | | | | |
| District of Columbia (continued) | | | | |
| Metropolitan Washington D.C. Airports Authority Dulles Toll Road Revenue, first senior lien, | | | | |
| Series A, | | | | |
| 5.00%, 10/01/39 | $ | 10,000,000 | $ | 9,406,500 |
| 5.25%, 10/01/44 | | 12,000,000 | | 11,366,880 |
| Washington Metropolitan Area Transit Authority Gross Revenue, Transit, Series A, 5.125%, | | | | |
| 7/01/32 | | 2,000,000 | | 2,038,560 |
| | | | | 67,751,363 |
| U.S. Territories 17.0% | | | | |
| Puerto Rico 17.0% | | | | |
| Puerto Rico Commonwealth Aqueduct and Sewer Authority Revenue, senior lien, Series A, | | | | |
| 6.00%, 7/01/38 | | 1,100,000 | | 1,032,658 |
| Assured Guaranty, 5.00%, 7/01/28 | | 7,000,000 | | 6,771,030 |
| Puerto Rico Commonwealth GO, Public Improvement, | | | | |
| Refunding, Series B, 6.00%, 7/01/39 | | 5,000,000 | | 4,945,750 |
| Series A, 5.125%, 7/01/28 | | 5,000,000 | | 4,690,900 |
| Series A, 5.00%, 7/01/29 | | 8,000,000 | | 7,594,320 |
| Series A, 5.125%, 7/01/31 | | 3,315,000 | | 3,316,724 |
| Series A, 5.00%, 7/01/33 | | 900,000 | | 782,028 |
| Series A, 6.00%, 7/01/38 | | 5,000,000 | | 4,907,300 |
| Series A, Pre-Refunded, 5.00%, 7/01/33 | | 1,100,000 | | 1,207,404 |
| Puerto Rico Commonwealth Highway and Transportation Authority Highway Revenue, Series Y, | | | | |
| Pre-Refunded, 5.50%, 7/01/36 | | 4,500,000 | | 5,377,500 |
| Puerto Rico Commonwealth Highway and Transportation Authority Transportation Revenue, | | | | |
| Series D, Pre-Refunded, 5.375%, 7/01/36 | | 5,000,000 | | 5,311,100 |
| Series D, Pre-Refunded, 5.25%, 7/01/38 | | 3,000,000 | | 3,181,710 |
| Series G, 5.00%, 7/01/33 | | 1,695,000 | | 1,482,176 |
| Series G, Pre-Refunded, 5.00%, 7/01/33 | | 3,305,000 | | 3,631,732 |
| Puerto Rico Electric Power Authority Power Revenue, | | | | |
| Series RR, FGIC Insured, Pre-Refunded, 5.00%, 7/01/35 | | 3,000,000 | | 3,443,760 |
| Series RR, XLCA Insured, Pre-Refunded, 5.00%, 7/01/30 | | 1,000,000 | | 1,147,920 |
| Series TT, 5.00%, 7/01/32 | | 10,000,000 | | 9,050,000 |
| Series WW, 5.50%, 7/01/38 | | 6,700,000 | | 6,102,896 |
| Series XX, 5.25%, 7/01/40 | | 8,400,000 | | 7,336,056 |
| Puerto Rico Municipal Finance Agency GO, Series A, AGMC Insured, 5.00%, 8/01/27 | | 2,580,000 | | 2,517,822 |
| Puerto Rico PBA Guaranteed Revenue, Government Facilities, | | | | |
| Refunding, Series D, 5.375%, 7/01/33 | | 1,315,000 | | 1,232,918 |
| Refunding, Series N, 5.00%, 7/01/32 | | 5,000,000 | | 4,418,850 |
| Refunding, Series Q, 5.625%, 7/01/39 | | 5,000,000 | | 4,630,550 |
| Series D, Pre-Refunded, 5.375%, 7/01/33 | | 3,685,000 | | 3,914,281 |
| Puerto Rico Sales Tax FICO Sales Tax Revenue, first sub., | | | | |
| Series A, 5.375%, 8/01/39 | | 6,000,000 | | 5,514,060 |
| Series A, 6.00%, 8/01/42 | | 20,000,000 | | 20,038,000 |
| Series C, 5.50%, 8/01/40 | | 10,000,000 | | 9,351,700 |
| | | | | 132,931,145 |
| Total Municipal Bonds before Short Term Investments | | | | |
| (Cost $787,407,251) | | | | 773,470,274 |
Annual Report | 151
Franklin Tax-Free Trust
Statement of Investments, February 28, 2011 (continued)
| | | | |
| Franklin Virginia Tax-Free Income Fund | | Principal Amount | | Value |
| Short Term Investments 0.2% | | | | |
| Municipal Bonds 0.2% | | | | |
| Virginia 0.2% | | | | |
| aNorfolk Redevelopment and Housing Authority Revenue, Old Dominion University Project, | | | | |
| Refunding, Daily VRDN and Put, | | | | |
| 0.23%, 8/01/31 | $ | 400,000 | $ | 400,000 |
| 0.28%, 8/01/33 | | 1,300,000 | | 1,300,000 |
| Total Short Term Investments (Cost $1,700,000) | | | | 1,700,000 |
| Total Investments (Cost $789,107,251) 99.1% | | | | 775,170,274 |
| Other Assets, less Liabilities 0.9% | | | | 7,095,411 |
| Net Assets 100.0% | | | $ | 782,265,685 |
See Abbreviations on page 180.
aVariable rate demand notes (VRDNs) are tax-exempt obligations which contain a floating or variable interest rate adjustment formula and an unconditional right of demand to receive payment of the principal balance plus accrued interest at specified dates. The coupon rate shown represents the rate at period end.
152 | The accompanying notes are an integral part of these financial statements. | Annual Report
| | | | | | | | | | |
| Franklin Tax-Free Trust | | | | | | | | | | |
| |
| Financial Statements | | | | | | | | | | |
| |
| |
| Statements of Assets and Liabilities | | | | | | | | | | |
| February 28, 2011 | | | | | | | | | | |
| |
| |
| | | Franklin | | | | Franklin | | | Franklin | |
| | | Alabama | | | | Florida | | | Georgia | |
| | | Tax-Free | | | | Tax-Free | | | Tax-Free | |
| | | Income Fund | | | | Income Fund | | | Income Fund | |
| Assets: | | | | | | | | | | |
| Investments in securities: | | | | | | | | | | |
| Cost | $ | 281,831,348 | | $ | | 1,129,152,923 | | $ | 468,771,742 | |
| Value | $ | 270,102,778 | | $ | | 1,126,520,641 | | $ | 463,429,678 | |
| Cash | | 1,164,210 | | | | 56,036 | | | 7,717 | |
| Receivables: | | | | | | | | | | |
| Capital shares sold | | 120,664 | | | | 527,385 | | | 1,110,176 | |
| Interest | | 3,796,957 | | | | 17,481,741 | | | 5,531,334 | |
| Other assets | | 116 | | | | 485 | | | 196 | |
| Total assets | | 275,184,725 | | | | 1,144,586,288 | | | 470,079,101 | |
| Liabilities: | | | | | | | | | | |
| Payables: | | | | | | | | | | |
| Capital shares redeemed | | 535,374 | | | | 3,441,792 | | | 936,425 | |
| Affiliates | | 169,006 | | | | 606,421 | | | 283,352 | |
| Distributions to shareholders | | 215,087 | | | | 954,662 | | | 541,696 | |
| Accrued expenses and other liabilities | | 57,709 | | | | 144,370 | | | 86,006 | |
| Total liabilities | | 977,176 | | | | 5,147,245 | | | 1,847,479 | |
| Net assets, at value | $ | 274,207,549 | | $ | | 1,139,439,043 | | $ | 468,231,622 | |
| Net assets consist of: | | | | | | | | | | |
| Paid-in capital | $ | 286,054,575 | | $ | | 1,142,052,585 | | $ | 478,491,435 | |
| Undistributed net investment income | | 77,420 | | | | 442,136 | | | 31,411 | |
| Net unrealized appreciation (depreciation) | | (11,728,570 | ) | | | (2,632,282 | ) | | (5,342,064 | ) |
| Accumulated net realized gain (loss) | | (195,876 | ) | | | (423,396 | ) | | (4,949,160 | ) |
| Net assets, at value | $ | 274,207,549 | | $ | | 1,139,439,043 | | $ | 468,231,622 | |
| Class A: | | | | | | | | | | |
| Net assets, at value | $ | 226,862,712 | | $ | | 1,015,180,915 | | $ | 361,875,171 | |
| Shares outstanding | | 21,283,296 | | | | 91,639,343 | | | 31,552,054 | |
| Net asset value per sharea | $ | 10.66 | | | $ | 11.08 | | $ | 11.47 | |
| Maximum offering price per share (net asset value per share ÷ 95.75%) | $ | 11.13 | | | $ | 11.57 | | $ | 11.98 | |
| Class B: | | | | | | | | | | |
| Net assets, at value | | | | $ | | 12,059,044 | | | | |
| Shares outstanding | | | | | | 1,079,443 | | | | |
| Net asset value and maximum offering price per sharea | | | | | $ | 11.17 | | | | |
| Class C: | | | | | | | | | | |
| Net assets, at value | $ | 47,344,837 | | $ | | 112,199,084 | | $ | 106,356,451 | |
| Shares outstanding | | 4,396,897 | | | | 9,969,507 | | | 9,167,717 | |
| Net asset value and maximum offering price per sharea | $ | 10.77 | | | $ | 11.25 | | $ | 11.60 | |
| |
| |
| aRedemption price is equal to net asset value less contingent deferred sales charges, if applicable. | | | | | | | | | | |
Annual Report | The accompanying notes are an integral part of these financial statements. | 153
| | | | | | | | | |
| Franklin Tax-Free Trust | | | | | | | | | |
| |
| Financial Statements (continued) | | | | | | | | | |
| |
| |
| Statements of Assets and Liabilities (continued) | | | | | | | | | |
| February 28, 2011 | | | | | | | | | |
| |
| |
| | | Franklin | | | Franklin | | | Franklin | |
| | | Kentucky | | | Louisiana | | | Maryland | |
| | | Tax-Free | | | Tax-Free | | | Tax-Free | |
| | | Income Fund | | | Income Fund | | | Income Fund | |
| Assets: | | | | | | | | | |
| Investments in securities: | | | | | | | | | |
| Cost | $ | 183,403,804 | | $ | 387,955,883 | | $ | 638,982,276 | |
| Value | $ | 180,765,323 | | $ | 380,048,769 | | $ | 617,837,934 | |
| Cash | | 124,067 | | | 3,408,120 | | | 22,995 | |
| Receivables: | | | | | | | | | |
| Capital shares sold | | 641,653 | | | 495,295 | | | 476,903 | |
| Interest | | 2,362,836 | | | 5,253,055 | | | 7,377,808 | |
| Other assets | | 77 | | | 164 | | | 266 | |
| Total assets | | 183,893,956 | | | 389,205,403 | | | 625,715,906 | |
| Liabilities: | | | | | | | | | |
| Payables: | | | | | | | | | |
| Capital shares redeemed | | 1,080,331 | | | 983,119 | | | 3,119,014 | |
| Affiliates | | 103,469 | | | 227,199 | | | 374,681 | |
| Distributions to shareholders | | 138,253 | | | 305,379 | | | 438,721 | |
| Accrued expenses and other liabilities | | 46,812 | | | 69,843 | | | 101,910 | |
| Total liabilities | | 1,368,865 | | | 1,585,540 | | | 4,034,326 | |
| Net assets, at value | $ | 182,525,091 | | $ | 387,619,863 | | $ | 621,681,580 | |
| Net assets consist of: | | | | | | | | | |
| Paid-in capital | $ | 187,723,943 | | $ | 398,504,446 | | $ | 645,665,644 | |
| Undistributed net investment income (distributions in excess of | | | | | | | | | |
| net investment income) | | (60,939 | ) | | 236,567 | | | (10,600 | ) |
| Net unrealized appreciation (depreciation) | | (2,638,481 | ) | | (7,907,114 | ) | | (21,144,342 | ) |
| Accumulated net realized gain (loss) | | (2,499,432 | ) | | (3,214,036 | ) | | (2,829,122 | ) |
| Net assets, at value | $ | 182,525,091 | | $ | 387,619,863 | | $ | 621,681,580 | |
| Class A: | | | | | | | | | |
| Net assets, at value | $ | 182,525,091 | | $ | 323,109,050 | | $ | 471,728,622 | |
| Shares outstanding | | 16,939,578 | | | 29,626,835 | | | 43,244,902 | |
| Net asset value per sharea | $ | 10.78 | | $ | 10.91 | | $ | 10.91 | |
| Maximum offering price per share (net asset value per share ÷ 95.75%) | $ | 11.26 | | $ | 11.39 | | $ | 11.39 | |
| Class C: | | | | | | | | | |
| Net assets, at value | | | | $ | 64,510,813 | | $ | 143,707,601 | |
| Shares outstanding | | | | | 5,843,611 | | | 12,973,186 | |
| Net asset value and maximum offering price per sharea | | | | $ | 11.04 | | $ | 11.08 | |
| Advisor Class: | | | | | | | | | |
| Net assets, at value | | | | | | | $ | 6,245,357 | |
| Shares outstanding | | | | | | | | 572,448 | |
| Net asset value and maximum offering price per share | | | | | | | $ | 10.91 | |
| |
| aRedemption price is equal to net asset value less contingent deferred sales charges, if applicable. | | | | | | | | | |
154 | The accompanying notes are an integral part of these financial statements. | Annual Report
| | | | | | | | | |
| Franklin Tax-Free Trust | | | | | | | | | |
| |
| Financial Statements (continued) | | | | | | | | | |
| |
| |
| Statements of Assets and Liabilities (continued) | | | | | | | | | |
| February 28, 2011 | | | | | | | | | |
| |
| |
| | | Franklin | | | Franklin | | | Franklin | |
| | | Missouri | | | North Carolina | | | Virginia | |
| | | Tax-Free | | | Tax-Free | | | Tax-Free | |
| | | Income Fund | | | Income Fund | | | Income Fund | |
| Assets: | | | | | | | | | |
| Investments in securities: | | | | | | | | | |
| Cost | $ | 1,066,960,032 | | $ | 1,193,067,974 | | $ | 789,107,251 | |
| Value | $ | 1,044,238,515 | | $ | 1,172,680,627 | | $ | 775,170,274 | |
| Cash | | 49,180 | | | 22,017 | | | 518,705 | |
| Receivables: | | | | | | | | | |
| Investment securities sold | | 1,002,500 | | | — | | | — | |
| Capital shares sold | | 2,172,592 | | | 2,023,753 | | | 829,673 | |
| Interest | | 13,177,266 | | | 14,730,394 | | | 9,540,836 | |
| Other assets | | 442 | | | 501 | | | 333 | |
| Total assets | | 1,060,640,495 | | | 1,189,457,292 | | | 786,059,821 | |
| Liabilities: | | | | | | | | | |
| Payables: | | | | | | | | | |
| Investment securities purchased | | 1,018,260 | | | — | | | — | |
| Capital shares redeemed | | 1,770,875 | | | 2,317,366 | | | 2,652,847 | |
| Affiliates | | 565,385 | | | 674,204 | | | 438,957 | |
| Distributions to shareholders | | 824,085 | | | 866,141 | | | 590,277 | |
| Accrued expenses and other liabilities | | 146,249 | | | 171,644 | | | 112,055 | |
| Total liabilities | | 4,324,854 | | | 4,029,355 | | | 3,794,136 | |
| Net assets, at value | $ | 1,056,315,641 | | $ | 1,185,427,937 | | $ | 782,265,685 | |
| Net assets consist of: | | | | | | | | | |
| Paid-in capital | $ | 1,085,321,112 | | $ | 1,209,042,047 | | $ | 799,678,216 | |
| Undistributed net investment income | | 123,569 | | | 316,049 | | | 420,397 | |
| Net unrealized appreciation (depreciation) | | (22,721,517 | ) | | (20,387,347 | ) | | (13,936,977 | ) |
| Accumulated net realized gain (loss) | | (6,407,523 | ) | | (3,542,812 | ) | | (3,895,951 | ) |
| Net assets, at value | $ | 1,056,315,641 | | $ | 1,185,427,937 | | $ | 782,265,685 | |
| Class A: | | | | | | | | | |
| Net assets, at value | $ | 884,732,376 | | $ | 925,161,743 | | $ | 647,470,742 | |
| Shares outstanding | | 76,624,743 | | | 78,869,090 | | | 57,907,195 | |
| Net asset value per sharea | $ | 11.55 | | $ | 11.73 | | $ | 11.18 | |
| Maximum offering price per share (net asset value per share ÷ 95.75%) | $ | 12.06 | | $ | 12.25 | | $ | 11.68 | |
| Class C: | | | | | | | | | |
| Net assets, at value | $ | 134,025,827 | | $ | 237,606,996 | | $ | 123,764,515 | |
| Shares outstanding | | 11,519,175 | | | 20,002,962 | | | 10,929,956 | |
| Net asset value and maximum offering price per sharea | $ | 11.64 | | $ | 11.88 | | $ | 11.32 | |
| Advisor Class: | | | | | | | | | |
| Net assets, at value | $ | 37,557,438 | | $ | 22,659,198 | | $ | 11,030,428 | |
| Shares outstanding | | 3,251,484 | | | 1,931,733 | | | 986,443 | |
| Net asset value and maximum offering price per share | $ | 11.55 | | $ | 11.73 | | $ | 11.18 | |
| |
| aRedemption price is equal to net asset value less contingent deferred sales charges, if applicable. | | | | | | | | | |
| Annual Report | The accompanying notes are an integral part of these financial statements. | 155 | |
| | | | | | | | | |
| Franklin Tax-Free Trust | | | | | | | | | |
| |
| Financial Statements (continued) | | | | | | | | | |
| |
| |
| Statements of Operations | | | | | | | | | |
| for the year ended February 28, 2011 | | | | | | | | | |
| |
| |
| | | Franklin | | | Franklin | | | Franklin | |
| | | Alabama | | | Florida | | | Georgia | |
| | | Tax-Free | | | Tax-Free | | | Tax-Free | |
| | | Income Fund | | | Income Fund | | | Income Fund | |
| Investment income: | | | | | | | | | |
| Interest | $ | 14,725,165 | | $ | 65,618,038 | | $ | 23,742,824 | |
| Expenses: | | | | | | | | | |
| Management fees (Note 3a) | | 1,586,367 | | | 5,870,160 | | | 2,457,881 | |
| Distribution fees: (Note 3c) | | | | | | | | | |
| Class A | | 244,559 | | | 1,117,914 | | | 378,292 | |
| Class B | | — | | | 125,715 | | | — | |
| Class C | | 340,596 | | | 786,714 | | | 721,021 | |
| Transfer agent fees (Note 3e) | | 119,615 | | | 424,599 | | | 206,038 | |
| Custodian fees | | 3,940 | | | 16,862 | | | 6,811 | |
| Reports to shareholders | | 20,125 | | | 58,016 | | | 30,476 | |
| Registration and filing fees | | 13,650 | | | 31,947 | | | 18,195 | |
| Professional fees | | 26,689 | | | 33,885 | | | 32,064 | |
| Trustees’ fees and expenses | | 1,716 | | | 7,292 | | | 2,789 | |
| Other | | 25,783 | | | 73,386 | | | 41,414 | |
| Total expenses | | 2,383,040 | | | 8,546,490 | | | 3,894,981 | |
| Net investment income | | 12,342,125 | | | 57,071,548 | | | 19,847,843 | |
| Realized and unrealized gains (losses): | | | | | | | | | |
| Net realized gain (loss) from investments | | 559,052 | | | 3,612,172 | | | (860,182 | ) |
| Net change in unrealized appreciation (depreciation) on investments | | (14,702,014 | ) | | (44,846,841 | ) | | (19,943,272 | ) |
| Net realized and unrealized gain (loss) | | (14,142,962 | ) | | (41,234,669 | ) | | (20,803,454 | ) |
| Net increase (decrease) in net assets resulting from operations | $ | (1,800,837 | ) | $ | 15,836,879 | | $ | (955,611 | ) |
156 | The accompanying notes are an integral part of these financial statements. | Annual Report
| | | | | | | | | |
| Franklin Tax-Free Trust | | | | | | | | | |
| |
| Financial Statements (continued) | | | | | | | | | |
| |
| |
| Statements of Operations (continued) | | | | | | | | | |
| for the year ended February 28, 2011 | | | | | | | | | |
| |
| |
| | | Franklin | | | Franklin | | | Franklin | |
| | | Kentucky | | | Louisiana | | | Maryland | |
| | | Tax-Free | | | Tax-Free | | | Tax-Free | |
| | | Income Fund | | | Income Fund | | | Income Fund | |
| Investment income: | | | | | | | | | |
| Interest | $ | 9,274,736 | | $ | 20,356,173 | | $ | 31,668,513 | |
| Expenses: | | | | | | | | | |
| Management fees (Note 3a) | | 1,091,870 | | | 2,109,296 | | | 3,277,626 | |
| Distribution fees: (Note 3c) | | | | | | | | | |
| Class A | | 193,272 | | | 342,270 | | | 514,771 | |
| Class C | | — | | | 453,849 | | | 988,496 | |
| Transfer agent fees (Note 3e) | | 66,988 | | | 145,205 | | | 275,336 | |
| Custodian fees | | 2,629 | | | 5,633 | | | 9,309 | |
| Reports to shareholders | | 15,261 | | | 24,611 | | | 41,505 | |
| Registration and filing fees | | 7,345 | | | 16,749 | | | 24,736 | |
| Professional fees | | 28,641 | | | 31,327 | | | 36,007 | |
| Trustees’ fees and expenses | | 1,106 | | | 2,352 | | | 3,865 | |
| Other | | 24,743 | | | 37,231 | | | 42,183 | |
| Total expenses | | 1,431,855 | | | 3,168,523 | | | 5,213,834 | |
| Net investment income | | 7,842,881 | | | 17,187,650 | | | 26,454,679 | |
| Realized and unrealized gains (losses): | | | | | | | | | |
| Net realized gain (loss) from investments | | (395,785 | ) | | (1,008,979 | ) | | (1,059,863 | ) |
| Net change in unrealized appreciation (depreciation) on investments | | (6,445,198 | ) | | (14,008,946 | ) | | (23,092,979 | ) |
| Net realized and unrealized gain (loss) | | (6,840,983 | ) | | (15,017,925 | ) | | (24,152,842 | ) |
| Net increase (decrease) in net assets resulting from operations | $ | 1,001,898 | | $ | 2,169,725 | | $ | 2,301,837 | |
Annual Report | The accompanying notes are an integral part of these financial statements. | 157
| | | | | | | | | |
| Franklin Tax-Free Trust | | | | | | | | | |
| |
| Financial Statements (continued) | | | | | | | | | |
| |
| |
| Statements of Operations (continued) | | | | | | | | | |
| for the year ended February 28, 2011 | | | | | | | | | |
| |
| |
| | | Franklin | | | Franklin | | | Franklin | |
| | | Missouri | | | North Carolina | | | Virginia | |
| | | Tax-Free | | | Tax-Free | | | Tax-Free | |
| | | Income Fund | | | Income Fund | | | Income Fund | |
| Investment income: | | | | | | | | | |
| Interest | $ | 52,073,263 | | $ | 58,197,361 | | $ | 39,894,612 | |
| Expenses: | | | | | | | | | |
| Management fees (Note 3a) | | 5,141,312 | | | 5,845,667 | | | 4,031,201 | |
| Distribution fees: (Note 3c) | | | | | | | | | |
| Class A | | 912,619 | | | 968,582 | | | 699,876 | |
| Class C | | 887,083 | | | 1,621,361 | | | 846,161 | |
| Transfer agent fees (Note 3e) | | 444,455 | | | 484,152 | | | 328,518 | |
| Custodian fees | | 14,948 | | | 17,174 | | | 11,474 | |
| Reports to shareholders | | 63,624 | | | 68,090 | | | 47,034 | |
| Registration and filing fees | | 31,654 | | | 37,159 | | | 30,252 | |
| Professional fees | | 47,080 | | | 50,128 | | | 40,359 | |
| Trustees’ fees and expenses | | 6,098 | | | 7,020 | | | 4,794 | |
| Other | | 66,396 | | | 79,912 | | | 51,914 | |
| Total expenses | | 7,615,269 | | | 9,179,245 | | | 6,091,583 | |
| Net investment income | | 44,457,994 | | | 49,018,116 | | | 33,803,029 | |
| Realized and unrealized gains (losses): | | | | | | | | | |
| Net realized gain (loss) from investments | | (1,579,516 | ) | | (2,717,066 | ) | | (1,149,670 | ) |
| Net change in unrealized appreciation (depreciation) on investments | | (41,537,949 | ) | | (43,687,796 | ) | | (33,893,572 | ) |
| Net realized and unrealized gain (loss) | | (43,117,465 | ) | | (46,404,862 | ) | | (35,043,242 | ) |
| Net increase (decrease) in net assets resulting from operations | $ | 1,340,529 | | $ | 2,613,254 | | $ | (1,240,213 | ) |
158 | The accompanying notes are an integral part of these financial statements. | Annual Report
| | | | | | | | | | | | |
| Franklin Tax-Free Trust | | | | | | | | | | |
| |
| Financial Statements (continued) | | | | | | | | | | | | |
| |
| |
| Statements of Changes in Net Assets | | | | | | | | | | | | |
| |
| |
| | | Franklin Alabama | | | Franklin Florida | |
| | | Tax-Free Income Fund | | | Tax-Free Income Fund | |
| | | Year Ended February 28, | | | Year Ended February 28, | |
| | | 2011 | | | 2010 | | | 2011 | | | 2010 | |
| Increase (decrease) in net assets: | | | | | | | | | | | | |
| Operations: | | | | | | | | | | | | |
| Net investment income | $ | 12,342,125 | | $ | 12,058,895 | | $ | 57,071,548 | | $ | 60,840,013 | |
| Net realized gain (loss) from investments | | 559,052 | | | 534,431 | | | 3,612,172 | | | 157,722 | |
| Net change in unrealized appreciation (depreciation) | | | | | | | | | | | | |
| on investments | | (14,702,014 | ) | | 14,051,632 | | | (44,846,841 | ) | | 63,652,224 | |
| Net increase (decrease) in net assets resulting | | | | | | | | | | | | |
| from operations | | (1,800,837 | ) | | 26,644,958 | | | 15,836,879 | | | 124,649,959 | |
| Distributions to shareholders from: | | | | | | | | | | | | |
| Net investment income: | | | | | | | | | | | | |
| Class A | | (10,480,752 | ) | | (10,231,642 | ) | | (51,827,141 | ) | | (54,376,158 | ) |
| Class B | | — | | | — | | | (794,194 | ) | | (1,344,639 | ) |
| Class C | | (1,923,645 | ) | | (1,707,559 | ) | | (4,868,331 | ) | | (4,678,834 | ) |
| Total distributions to shareholders | | (12,404,397 | ) | | (11,939,201 | ) | | (57,489,666 | ) | | (60,399,631 | ) |
| Capital share transactions: (Note 2) | | | | | | | | | | | | |
| Class A | | (6,366,803 | ) | | 13,583,233 | | | (85,427,593 | ) | | (74,413,799 | ) |
| Class B | | — | | | — | | | (13,789,075 | ) | | (11,916,510 | ) |
| Class C | | 91,966 | | | 5,810,958 | | | (3,176,656 | ) | | 3,943,226 | |
| Total capital share transactions | | (6,274,837 | ) | | 19,394,191 | | | (102,393,324 | ) | | (82,387,083 | ) |
| Net increase (decrease) in net assets | | (20,480,071 | ) | | 34,099,948 | | | (144,046,111 | ) | | (18,136,755 | ) |
| Net assets: | | | | | | | | | | | | |
| Beginning of year | | 294,687,620 | | | 260,587,672 | | | 1,283,485,154 | | | 1,301,621,909 | |
| End of year | $ | 274,207,549 | | $ | 294,687,620 | | $ | 1,139,439,043 | | $ | 1,283,485,154 | |
| Undistributed net investment income included in | | | | | | | | | | | | |
| net assets: | | | | | | | | | | | | |
| End of year | $ | 77,420 | | $ | 135,791 | | $ | 442,136 | | $ | 867,024 | |
Annual Report | The accompanying notes are an integral part of these financial statements. | 159
| | | | | | | | | | | | |
| Franklin Tax-Free Trust | | | | | | | | | | |
| |
| Financial Statements (continued) | | | | | | | | | | | | |
| |
| |
| Statements of Changes in Net Assets (continued) | | | | | | | | | | |
| |
| |
| | | Franklin Georgia | | | Franklin Kentucky | |
| | | Tax-Free Income Fund | | | Tax-Free Income Fund | |
| | | Year Ended February 28, | | | Year Ended February 28, | |
| | | 2011 | | | 2010 | | | 2011 | | | 2010 | |
| Increase (decrease) in net assets: | | | | | | | | | | | | |
| Operations: | | | | | | | | | | | | |
| Net investment income | $ | 19,847,843 | | $ | 17,637,425 | | $ | 7,842,881 | | $ | 7,466,459 | |
| Net realized gain (loss) from investments | | (860,182 | ) | | 862,866 | | | (395,785 | ) | | 148,967 | |
| Net change in unrealized appreciation (depreciation) | | | | | | | | | | |
| on investments | | (19,943,272 | ) | | 23,458,112 | | | (6,445,198 | ) | | 10,240,124 | |
| Net increase (decrease) in net assets resulting | | | | | | | | | | |
| from operations | | (955,611 | ) | | 41,958,403 | | | 1,001,898 | | | 17,855,550 | |
| Distributions to shareholders from: | | | | | | | | | | | | |
| Net investment income: | | | | | | | | | | | | |
| Class A | | (15,755,590 | ) | | (14,483,261 | ) | | (7,892,172 | ) | | (7,552,788 | ) |
| Class C | | (3,932,258 | ) | | (3,113,797 | ) | | — | | | — | |
| Total distributions to shareholders | | (19,687,848 | ) | | (17,597,058 | ) | | (7,892,172 | ) | | (7,552,788 | ) |
| Capital share transactions: (Note 2) | | | | | | | | | | | | |
| Class A | | 12,506,046 | | | 37,588,955 | | | 1,797,192 | | | 15,272,154 | |
| Class C | | 9,505,152 | | | 28,105,588 | | | — | | | — | |
| Total capital share transactions | | 22,011,198 | | | 65,694,543 | | | 1,797,192 | | | 15,272,154 | |
| Net increase (decrease) in net assets | | 1,367,739 | | | 90,055,888 | | | (5,093,082 | ) | | 25,574,916 | |
| Net assets: | | | | | | | | | | | | |
| Beginning of year | | 466,863,883 | | | 376,807,995 | | | 187,618,173 | | | 162,043,257 | |
| End of year | $ | 468,231,622 | | $ | 466,863,883 | | $ | 182,525,091 | | $ | 187,618,173 | |
| Undistributed net investment income (distributions in | | | | | | | | | | | | |
| excess of net investment income) included in net assets: | | | | | | | | | | |
| End of year | $ | 31,411 | | $ | (160,812 | ) | $ | (60,939 | ) | $ | (35,949 | ) |
160 | The accompanying notes are an integral part of these financial statements. | Annual Report
| | | | | | | | | | | | |
| Franklin Tax-Free Trust | | | | | | | | | | |
| |
| Financial Statements (continued) | | | | | | | | | | | | |
| |
| |
| Statements of Changes in Net Assets (continued) | | | | | | | | | | |
| |
| |
| | | Franklin Louisiana | | | Franklin Maryland | |
| | | Tax-Free Income Fund | | | Tax-Free Income Fund | |
| | | Year Ended February 28, | | | Year Ended February 28, | |
| | | 2011 | | | 2010 | | | 2011 | | | 2010 | |
| Increase (decrease) in net assets: | | | | | | | | | | | | |
| Operations: | | | | | | | | | | | | |
| Net investment income | $ | 17,187,650 | | $ | 15,209,848 | | $ | 26,454,679 | | $ | 25,973,160 | |
| Net realized gain (loss) from investments | | (1,008,979 | ) | | 56,120 | | | (1,059,863 | ) | | (204,895 | ) |
| Net change in unrealized appreciation (depreciation) | | | | | | | | | | |
| on investments | | (14,008,946 | ) | | 26,509,024 | | | (23,092,979 | ) | | 50,949,719 | |
| Net increase (decrease) in net assets resulting | | | | | | | | | | |
| from operations | | 2,169,725 | | | 41,774,992 | | | 2,301,837 | | | 76,717,984 | |
| Distributions to shareholders from: | | | | | | | | | | | | |
| Net investment income: | | | | | | | | | | | | |
| Class A | | (14,527,675 | ) | | (13,117,728 | ) | | (21,247,663 | ) | | (21,259,949 | ) |
| Class C | | (2,531,060 | ) | | (2,020,800 | ) | | (5,297,649 | ) | | (4,736,365 | ) |
| Advisor Class | | — | | | — | | | (208,353 | ) | | (75,767 | ) |
| Total distributions to shareholders | | (17,058,735 | ) | | (15,138,528 | ) | | (26,753,665 | ) | | (26,072,081 | ) |
| Capital share transactions: (Note 2) | | | | | | | | | | | | |
| Class A | | 8,002,619 | | | 37,777,185 | | | (21,688,484 | ) | | 45,125,328 | |
| Class C | | 3,119,686 | | | 18,421,753 | | | 6,984,221 | | | 31,014,569 | |
| Advisor Class | | — | | | — | | | 3,121,875 | | | 3,384,838 | |
| Total capital share transactions | | 11,122,305 | | | 56,198,938 | | | (11,582,388 | ) | | 79,524,735 | |
| Net increase (decrease) in net assets | | (3,766,705 | ) | | 82,835,402 | | | (36,034,216 | ) | | 130,170,638 | |
| Net assets: | | | | | | | | | | | | |
| Beginning of year | | 391,386,568 | | | 308,551,166 | | | 657,715,796 | | | 527,545,158 | |
| End of year | $ | 387,619,863 | | $ | 391,386,568 | | $ | 621,681,580 | | $ | 657,715,796 | |
| Undistributed net investment income (distributions in | | | | | | | | | | | | |
| excess of net investment income) included in net assets: | | | | | | | | | | |
| End of year | $ | 236,567 | | $ | 85,562 | | $ | (10,600 | ) | $ | 25,269 | |
Annual Report | The accompanying notes are an integral part of these financial statements. | 161
| | | | | | | | | | | | |
| Franklin Tax-Free Trust | | | | | | | | | | |
| |
| Financial Statements (continued) | | | | | | | | | | | | |
| |
| |
| Statements of Changes in Net Assets (continued) | | | | | | | | | | | | |
| |
| |
| | | Franklin Missouri | | | Franklin North Carolina | |
| | | Tax-Free Income Fund | | | Tax-Free Income Fund | |
| | | Year Ended February 28, | | | Year Ended February 28, | |
| | | 2011 | | | 2010 | | | 2011 | | | 2010 | |
| Increase (decrease) in net assets: | | | | | | | | | | | | |
| Operations: | | | | | | | | | | | | |
| Net investment income | $ | 44,457,994 | | $ | 38,183,856 | | $ | 49,018,116 | | $ | 42,594,318 | |
| Net realized gain (loss) from investments | | (1,579,516 | ) | | (764,227 | ) | | (2,717,066 | ) | | 719,705 | |
| Net change in unrealized appreciation | | | | | | | | | | | | |
| (depreciation) on investments | | (41,537,949 | ) | | 52,661,164 | | | (43,687,796 | ) | | 64,550,561 | |
| Net increase (decrease) in net assets | | | | | | | | | | | | |
| resulting from operations | | 1,340,529 | | | 90,080,793 | | | 2,613,254 | | | 107,864,584 | |
| Distributions to shareholders from: | | | | | | | | | | | | |
| Net investment income: | | | | | | | | | | | | |
| Class A | | (38,583,403 | ) | | (33,916,976 | ) | | (40,110,705 | ) | | (35,297,547 | ) |
| Class C | | (4,946,630 | ) | | (3,852,713 | ) | | (8,775,546 | ) | | (6,751,344 | ) |
| Advisor Class | | (1,408,941 | ) | | (272,471 | ) | | (882,438 | ) | | (281,463 | ) |
| Total distributions to shareholders | | (44,938,974 | ) | | (38,042,160 | ) | | (49,768,689 | ) | | (42,330,354 | ) |
| Capital share transactions: (Note 2) | | | | | | | | | | | | |
| Class A | | 56,827,555 | | | 126,969,229 | | | 36,232,587 | | | 128,528,042 | |
| Class C | | 19,401,139 | | | 29,653,781 | | | 22,864,791 | | | 61,843,774 | |
| Advisor Class | | 26,644,321 | | | 12,471,062 | | | 9,292,935 | | | 14,335,846 | |
| Total capital share transactions | | 102,873,015 | | | 169,094,072 | | | 68,390,313 | | | 204,707,662 | |
| Net increase (decrease) in net assets | | 59,274,570 | | | 221,132,705 | | | 21,234,878 | | | 270,241,892 | |
| Net assets: | | | | | | | | | | | | |
| Beginning of year | | 997,041,071 | | | 775,908,366 | | | 1,164,193,059 | | | 893,951,167 | |
| End of year | $ | 1,056,315,641 | | $ | 997,041,071 | | $ | 1,185,427,937 | | $ | 1,164,193,059 | |
| Undistributed net investment income included in | | | | | | | | | | | | |
| net assets: | | | | | | | | | | | | |
| End of year | $ | 123,569 | | $ | 421,364 | | $ | 316,049 | | $ | 875,219 | |
162 | The accompanying notes are an integral part of these financial statements. | Annual Report
| | | | | | |
| Franklin Tax-Free Trust | | | | | | |
| |
| Financial Statements (continued) | | | | | | |
| |
| |
| Statements of Changes in Net Assets (continued) | | | | | | |
| |
| |
| | | Franklin Virginia | |
| | | Tax-Free Income Fund | |
| | | Year Ended February 28, | |
| | | 2011 | | | 2010 | |
| Increase (decrease) in net assets: | | | | | | |
| Operations: | | | | | | |
| Net investment income | $ | 33,803,029 | | $ | 29,871,645 | |
| Net realized gain (loss) from investments | | (1,149,670 | ) | | 1,105,432 | |
| Net change in unrealized appreciation (depreciation) on investments | | (33,893,572 | ) | | 39,779,725 | |
| Net increase (decrease) in net assets resulting from operations | | (1,240,213 | ) | | 70,756,802 | |
| Distributions to shareholders from: | | | | | | |
| Net investment income: | | | | | | |
| Class A | | (29,244,255 | ) | | (26,033,645 | ) |
| Class C | | (4,632,199 | ) | | (3,446,197 | ) |
| Advisor Class | | (395,377 | ) | | (165,671 | ) |
| Total distributions to shareholders | | (34,271,831 | ) | | (29,645,513 | ) |
| Capital share transactions: (Note 2) | | | | | | |
| Class A | | 813,146 | | | 93,091,016 | |
| Class C | | 9,478,809 | | | 41,116,780 | |
| Advisor Class | | 4,030,466 | | | 7,382,336 | |
| Total capital share transactions | | 14,322,421 | | | 141,590,132 | |
| Net increase (decrease) in net assets | | (21,189,623 | ) | | 182,701,421 | |
| Net assets: | | | | | | |
| Beginning of year | | 803,455,308 | | | 620,753,887 | |
| End of year | $ | 782,265,685 | | | 803,455,308 | |
| Undistributed net investment income included in net assets: | | | | | | |
| End of year | $ | 420,397 | | $ | 585,195 | |
Annual Report | The accompanying notes are an integral part of these financial statements. | 163
Franklin Tax-Free Trust
Notes to Financial Statements
1. ORGANIZATION AND SIGNIFICANT ACCOUNTING POLICIES
Franklin Tax-Free Trust (Trust) is registered under the Investment Company Act of 1940, as amended, (1940 Act) as an open-end investment company, consisting of twenty-four separate funds, nine of which are included in this report (Funds). The financial statements of the remaining funds in the Trust are presented separately. The classes of shares offered within each of the Funds are indicated below. Each class of shares differs by its initial sales load, contingent deferred sales charges, distribution fees, voting rights on matters affecting a single class and its exchange privilege.
| | |
| Class A | Class A & Class C | Class A, Class B & Class C |
| Franklin Kentucky Tax-Free | Franklin Alabama Tax-Free Income Fund | Franklin Florida Tax-Free Income Fund |
| Income Fund | Franklin Georgia Tax-Free Income Fund | |
| | Franklin Louisiana Tax-Free Income Fund | |
| |
| Class A, Class C & Advisor Class | |
| Franklin Maryland Tax-Free Income Fund | |
| Franklin Missouri Tax-Free Income Fund | |
| Franklin North Carolina Tax-Free Income Fund | |
| Franklin Virginia Tax-Free Income Fund | |
The following summarizes the Funds’ significant accounting policies.
a. Financial Instrument Valuation
The Funds’ investments in securities and other financial instruments are carried at fair value daily. Fair value is the price that would be received to sell an asset or paid to transfer a liability in an orderly transaction between market participants on the measurement date. Under procedures approved by the Trust’s Board of Trustees, the Funds may utilize independent pricing services, quotations from securities and financial instrument dealers, and other market sources to determine fair value.
Debt securities generally trade in the over-the-counter market rather than on a securities exchange. The Funds’ pricing services use multiple valuation techniques to determine fair value. In instances where sufficient market activity exists, the pricing services may utilize a market-based approach through which quotes from market makers are used to determine fair value. In instances where sufficient market activity may not exist or is limited, the pricing services also utilize proprietary valuation models which may consider market characteristics such as benchmark yield curves, option-adjusted spreads, credit spreads, estimated default rates, coupon rates, anticipated timing of principal repayments, underlying collateral, and other unique security features in order to estimate the relevant cash flows, which are then discounted to calculate the fair value.
The Funds have procedures to determine the fair value of securities and other financial instruments for which market prices are not readily available or which may not be reliably priced. Under these procedures, the Funds primarily employ a market-based approach which may use related or comparable assets or liabilities, recent transactions, market multiples, book values, and other relevant
164 | Annual Report
Franklin Tax-Free Trust
Notes to Financial Statements (continued)
| 1. | ORGANIZATION AND SIGNIFICANT ACCOUNTING POLICIES (continued) |
| a. | Financial Instrument Valuation (continued) |
information for the investment to determine the fair value of the investment. The Funds may also use an income-based valuation approach in which the anticipated future cash flows of the investment are discounted to calculate fair value. Discounts may also be applied due to the nature or duration of any restrictions on the disposition of the investments. Due to the inherent uncertainty of valuations of such investments, the fair values may differ significantly from the values that would have been used had an active market existed.
b. Securities Purchased on a Delayed Delivery Basis
The Funds may purchase securities on a delayed delivery basis, with payment and delivery scheduled for a future date. These transactions are subject to market fluctuations and are subject to the risk that the value at delivery may be more or less than the trade date purchase price. Although the Funds will generally purchase these securities with the intention of holding the securities, they may sell the securities before the settlement date. Sufficient assets have been segregated for these securities.
c. Income Taxes
It is each fund’s policy to qualify as a regulated investment company under the Internal Revenue Code. Each fund intends to distribute to shareholders substantially all of its income and net realized gains to relieve it from federal income and excise taxes. As a result, no provision for U.S. federal income taxes is required. Each fund files U.S. income tax returns as well as tax returns in certain other jurisdictions. Each fund’s application of those tax rules is subject to its understanding. Each fund records a provision for taxes in its financial statements including penalties and interest, if any, for a tax position taken on a tax return (or expected to be taken) when it fails to meet the more likely than not (a greater than 50% probability) threshold and based on the technical merits, the tax position may not be sustained upon examination by the tax authorities. As of February 28, 2011, and for all open tax years, each fund has determined that no provision for income tax is required in each fund’s financial statements. Open tax years are those that remain subject to examination and are based on each tax jurisdiction statute of limitation. Each fund is not aware of any tax position for which it is reasonably possible that the total amounts of unrecognized tax effects will significantly change in the next twelve months.
d. Security Transactions, Investment Income, Expenses and Distributions
Security transactions are accounted for on trade date. Realized gains and losses on security transactions are determined on a specific identification basis. Interest income and estimated expenses are accrued daily. Amortization of premium and accretion of discount on debt securities are included in interest income. Dividends from net investment income are normally declared daily; these dividends may be reinvested or paid monthly to shareholders. Distributions to shareholders are determined according to income tax regulations (tax basis). Distributable earnings determined on a tax basis may differ from earnings recorded in accordance with accounting principles generally accepted in the United States of America. These differences may be permanent or temporary.
Annual Report | 165
Franklin Tax-Free Trust
Notes to Financial Statements (continued)
| 1. | ORGANIZATION AND SIGNIFICANT ACCOUNTING POLICIES (continued) |
| d. | Security Transactions, Investment Income, Expenses and Distributions (continued) |
Permanent differences are reclassified among capital accounts to reflect their tax character. These reclassifications have no impact on net assets or the results of operations. Temporary differences are not reclassified, as they may reverse in subsequent periods.
Common expenses incurred by the Trust are allocated among the funds based on the ratio of net assets of each fund to the combined net assets of the Trust. Fund specific expenses are charged directly to the fund that incurred the expense.
Realized and unrealized gains and losses and net investment income, not including class specific expenses, are allocated daily to each class of shares based upon the relative proportion of net assets of each class. Differences in per share distributions, by class, are generally due to differences in class specific expenses.
e. Insurance
The scheduled payments of interest and principal for each insured municipal security in the Trust are insured by either a new issue insurance policy or a secondary insurance policy. Some municipal securities in the Funds are secured by collateral guaranteed by an agency of the U.S. government. Insurance companies typically insure municipal bonds that tend to be of very high quality, with the majority of underlying municipal bonds rated A or better. However, there is a risk that in the event of an issuer default, the insurer may not be able to fulfill its obligations under the terms of the policy.
Depending on the type of coverage, premiums for insurance are either added to the cost basis of the security or paid by a third party.
f. Accounting Estimates
The preparation of financial statements in accordance with accounting principles generally accepted in the United States of America requires management to make estimates and assumptions that affect the reported amounts of assets and liabilities at the date of the financial statements and the amounts of income and expenses during the reporting period. Actual results could differ from those estimates.
g. Guarantees and Indemnifications
Under the Trust’s organizational documents, its officers and trustees are indemnified by the Trust against certain liabilities arising out of the performance of their duties to the Trust. Additionally, in the normal course of business, the Trust, on behalf of the Funds, enters into contracts with service providers that contain general indemnification clauses. The Trust’s maximum exposure under these arrangements is unknown as this would involve future claims that may be made against the Trust that have not yet occurred. Currently, the Trust expects the risk of loss to be remote.
166 | Annual Report
Franklin Tax-Free Trust
Notes to Financial Statements (continued)
2. SHARES OF BENEFICIAL INTEREST
At February 28, 2011, there were an unlimited number of shares authorized (without par value).
Transactions in the Funds’ shares were as follows:
| | | | | | | | | | | |
| | Franklin Alabama | | Franklin Florida | |
| | Tax-Free Income Fund | | Tax-Free Income Fund | |
| | Shares | | | | Amount | | Shares | | | Amount | |
| Class A Shares: | | | | | | | | | | | |
| Year ended February 28, 2011 | | | | | | | | | | | |
| Shares sold | 2,430,196 | | $ | 27,156,174 | | 7,796,467 | | $ | 89,349,759 | |
| Shares issued in reinvestment of | | | | | | | | | | | |
| distributions | 600,264 | | | | 6,645,637 | | 2,378,541 | | | 27,083,568 | |
| Shares redeemed | (3,669,793 | ) | | | (40,168,614 | ) | (17,866,372 | ) | | (201,860,920 | ) |
| Net increase (decrease) | (639,333 | ) | | $ | (6,366,803 | ) | (7,691,364 | ) | $ | (85,427,593 | ) |
| Year ended February 28, 2010 | | | | | | | | | | | |
| Shares sold | 3,194,314 | | $ | 34,909,305 | | 6,192,831 | | $ | 69,836,195 | |
| Shares issued in reinvestment of | | | | | | | | | | | |
| distributions | 569,097 | | | | 6,257,983 | | 2,366,292 | | | 26,683,984 | |
| Shares redeemed | (2,514,329 | ) | | | (27,584,055 | ) | (15,182,679 | ) | | (170,933,978 | ) |
| Net increase (decrease) | 1,249,082 | | $ | 13,583,233 | | (6,623,556 | ) | $ | (74,413,799 | ) |
| Class B Shares: | | | | | | | | | | | |
| Year ended February 28, 2011 | | | | | | | | | | | |
| Shares sold | | | | | | | 1,127 | | $ | 12,926 | |
| Shares issued in reinvestment of | | | | | | | | | | | |
| distributions | | | | | | | 41,731 | | | 480,489 | |
| Shares redeemed | | | | | | | (1,241,617 | ) | | (14,282,490 | ) |
| Net increase (decrease) | | | | | | | (1,198,759 | ) | $ | (13,789,075 | ) |
| Year ended February 28, 2010 | | | | | | | | | | | |
| Shares sold | | | | | | | 44,446 | | $ | 505,105 | |
| Shares issued in reinvestment of | | | | | | | | | | | |
| distributions | | | | | | | 66,819 | | | 758,806 | |
| Shares redeemed | | | | | | | (1,158,314 | ) | | (13,180,421 | ) |
| Net increase (decrease) | | | | | | | (1,047,049 | ) | $ | (11,916,510 | ) |
| Class C Shares: | | | | | | | | | | | |
| Year ended February 28, 2011 | | | | | | | | | | | |
| Shares sold | 1,024,208 | | $ | 11,596,643 | | 1,927,671 | | $ | 22,467,498 | |
| Shares issued in reinvestment of | | | | | | | | | | | |
| distributions | 100,578 | | | | 1,124,486 | | 279,654 | | | 3,233,621 | |
| Shares redeemed | (1,146,900 | ) | | | (12,629,163 | ) | (2,516,740 | ) | | (28,877,775 | ) |
| Net increase (decrease) | (22,114 | ) | | $ | 91,966 | | (309,415 | ) | $ | (3,176,656 | ) |
| Year ended February 28, 2010 | | | | | | | | | | | |
| Shares sold | 893,859 | | | $ | 9,931,559 | | 1,681,216 | | $ | 19,228,136 | |
| Shares issued in reinvestment of | | | | | | | | | | | |
| distributions | 81,005 | | | | 899,157 | | 251,774 | | | 2,882,570 | |
| Shares redeemed | (453,057 | ) | | | (5,019,758 | ) | (1,590,766 | ) | | (18,167,480 | ) |
| Net increase (decrease) | 521,807 | | | $ | 5,810,958 | | 342,224 | | $ | 3,943,226 | |
Annual Report | 167
| | | | | | | | | | | |
| Franklin Tax-Free Trust | | | | | | | |
| |
| Notes to Financial Statements (continued) | | | | | | | | | | |
| |
| |
| 2. SHARES OF BENEFICIAL INTEREST (continued) | | | | | | | | | | |
| |
| | Franklin Georgia | | Franklin Kentucky | |
| | Tax-Free Income Fund | | Tax-Free Income Fund | |
| | Shares | | | Amount | | Shares | | | | Amount | |
| Class A Shares: | | | | | | | | | | | |
| Year ended February 28, 2011 | | | | | | | | | | | |
| Shares sold | 7,557,561 | | $ | 89,909,887 | | 2,554,610 | | $ | 28,518,214 | |
| Shares issued in reinvestment of | | | | | | | | | | | |
| distributions | 895,320 | | | 10,605,390 | | 497,627 | | | | 5,521,263 | |
| Shares redeemed | (7,530,580 | ) | | (88,009,231 | ) | (2,942,879 | ) | | | (32,242,285 | ) |
| Net increase (decrease) | 922,301 | | $ | 12,506,046 | | 109,358 | | | $ | 1,797,192 | |
| Year ended February 28, 2010 | | | | | | | | | | | |
| Shares sold | 7,606,763 | | $ | 88,769,407 | | 3,010,671 | | $ | 32,827,102 | |
| Shares issued in reinvestment of | | | | | | | | | | | |
| distributions | 789,605 | | | 9,232,979 | | 482,760 | | | | 5,280,562 | |
| Shares redeemed | (5,184,606 | ) | | (60,413,431 | ) | (2,093,755 | ) | | | (22,835,510 | ) |
| Net increase (decrease) | 3,211,762 | | $ | 37,588,955 | | 1,399,676 | | $ | 15,272,154 | |
| Class C Shares: | | | | | | | | | | | |
| Year ended February 28, 2011 | | | | | | | | | | | |
| Shares sold | 2,708,387 | | $ | 32,814,877 | | | | | | | |
| Shares issued in reinvestment of | | | | | | | | | | | |
| distributions | 215,734 | | | 2,585,078 | | | | | | | |
| Shares redeemed | (2,189,353 | ) | | (25,894,803 | ) | | | | | | |
| Net increase (decrease) | 734,768 | | $ | 9,505,152 | | | | | | | |
| Year ended February 28, 2010 | | | | | | | | | | | |
| Shares sold | 3,185,370 | | $ | 37,610,811 | | | | | | | |
| Shares issued in reinvestment of | | | | | | | | | | | |
| distributions | 170,754 | | | 2,018,280 | | | | | | | |
| Shares redeemed | (976,681 | ) | | (11,523,503 | ) | | | | | | |
| Net increase (decrease) | 2,379,443 | | $ | 28,105,588 | | | | | | | |
| |
| | Franklin Louisiana | | Franklin Maryland | |
| | Tax-Free Income Fund | | Tax-Free Income Fund | |
| | Shares | | | Amount | | Shares | | | | Amount | |
| Class A Shares: | | | | | | | | | | | |
| Year ended February 28, 2011 | | | | | | | | | | | |
| Shares sold | 6,087,837 | | $ | 68,955,387 | | 6,536,020 | | | $ | 74,321,699 | |
| Shares issued in reinvestment of | | | | | | | | | | | |
| distributions | 987,958 | | | 11,095,713 | | 1,278,826 | | | | 14,460,222 | |
| Shares redeemed | (6,473,148 | ) | | (72,048,481 | ) | (9,862,207 | ) | | (110,470,405 | ) |
| Net increase (decrease) | 602,647 | | $ | 8,002,619 | | (2,047,361 | ) | | $ | (21,688,484 | ) |
| Year ended February 28, 2010 | | | | | | | | | | | |
| Shares sold | 6,999,551 | | $ | 77,020,523 | | 8,370,619 | | | $ | 91,625,455 | |
| Shares issued in reinvestment of | | | | | | | | | | | |
| distributions | 869,127 | | | 9,573,490 | | 1,279,096 | | | | 14,051,746 | |
| Shares redeemed | (4,437,400 | ) | | (48,816,828 | ) | (5,527,263 | ) | | | (60,551,873 | ) |
| Net increase (decrease) | 3,431,278 | | $ | 37,777,185 | | 4,122,452 | | | $ | 45,125,328 | |
168 | Annual Report
| | | | | | | | | | | |
| Franklin Tax-Free Trust | | | | | | | |
| |
| Notes to Financial Statements (continued) | | | | | | | |
| |
| |
| 2. SHARES OF BENEFICIAL INTEREST (continued) | | | | | | | | | | |
| |
| | Franklin Louisiana | | Franklin Maryland | |
| | Tax-Free Income Fund | | Tax-Free Income Fund | |
| | Shares | | | Amount | | Shares | | | | Amount | |
| Class C Shares: | | | | | | | | | | | |
| Year ended February 28, 2011 | | | | | | | | | | | |
| Shares sold | 1,718,667 | | $ | 19,763,993 | | 2,925,702 | | | $ | 33,955,456 | |
| Shares issued in reinvestment of | | | | | | | | | | | |
| distributions | 163,115 | | | 1,854,979 | | 340,017 | | | | 3,901,368 | |
| Shares redeemed | (1,649,534 | ) | | (18,499,286 | ) | (2,731,997 | ) | | | (30,872,603 | ) |
| Net increase (decrease) | 232,248 | | $ | 3,119,686 | | 533,722 | | | $ | 6,984,221 | |
| Year ended February 28, 2010 | | | | | | | | | | | |
| Shares sold | 2,342,847 | | $ | 25,930,481 | | 3,915,496 | | | $ | 43,645,267 | |
| Shares issued in reinvestment of | | | | | | | | | | | |
| distributions | 125,796 | | | 1,402,043 | | 306,058 | | | | 3,413,630 | |
| Shares redeemed | (807,245 | ) | | (8,910,771 | ) | (1,435,208 | ) | | | (16,044,328 | ) |
| Net increase (decrease) | 1,661,398 | | $ | 18,421,753 | | 2,786,346 | | | $ | 31,014,569 | |
| Advisor Class Shares: | | | | | | | | | | | |
| Year ended February 28, 2011 | | | | | | | | | | | |
| Shares sold | | | | | | 443,988 | | | $ | 5,150,695 | |
| Shares issued in reinvestment of | | | | | | | | | | | |
| distributions | | | | | | 163 | | | | 1,844 | |
| Shares redeemed | | | | | | (181,916 | ) | | | (2,030,664 | ) |
| Net increase (decrease) | | | | | | 262,235 | | | $ | 3,121,875 | |
| Period ended February 28, 2010a | | | | | | | | | | | |
| Shares sold | | | | | | 360,297 | | | $ | 3,946,422 | |
| Shares issued in reinvestment of | | | | | | | | | | | |
| distributions | | | | | | 38 | | | | 426 | |
| Shares redeemed | | | | | | (50,122 | ) | | | (562,010 | ) |
| Net increase (decrease) | | | | | | 310,213 | | | $ | 3,384,838 | |
| |
| aFor the period July 1, 2009 (effective date) to February 28, 2010. | | | | | | | | | | |
| |
| | Franklin Missouri | | Franklin North Carolina | |
| | Tax-Free Income Fund | | Tax-Free Income Fund | |
| | Shares | | | Amount | | Shares | | | | Amount | |
| Class A Shares: | | | | | | | | | | | |
| Year ended February 28, 2011 | | | | | | | | | | | |
| Shares sold | 17,294,354 | | $ | 207,407,587 | | 16,111,498 | | $ | 195,669,089 | |
| Shares issued in reinvestment of | | | | | | | | | | | |
| distributions | 2,226,366 | | | 26,532,191 | | 2,441,639 | | | | 29,551,927 | |
| Shares redeemed | (15,008,215 | ) | | (177,112,223 | ) | (15,804,157 | ) | | | (188,988,429 | ) |
| Net increase (decrease) | 4,512,505 | | $ | 56,827,555 | | 2,748,980 | | | $ | 36,232,587 | |
| Year ended February 28, 2010 | | | | | | | | | | | |
| Shares sold | 16,410,008 | | $ | 192,426,477 | | 19,444,521 | | $ | 231,659,150 | |
| Shares issued in reinvestment of | | | | | | | | | | | |
| distributions | 1,884,075 | | | 22,130,531 | | 2,068,851 | | | | 24,680,150 | |
| Shares redeemed | (7,486,950 | ) | | (87,587,779 | ) | (10,743,937 | ) | | | (127,811,258 | ) |
| Net increase (decrease) | 10,807,133 | | $ | 126,969,229 | | 10,769,435 | | $ | 128,528,042 | |
Annual Report | 169
| | | | | | | | | | | |
| Franklin Tax-Free Trust | | | | | | | |
| |
| Notes to Financial Statements (continued) | | | | | | | | |
| |
| |
| 2. SHARES OF BENEFICIAL INTEREST (continued) | | | | | | | | | | |
| |
| | Franklin Missouri | | Franklin North Carolina | |
| | Tax-Free Income Fund | | Tax-Free Income Fund | |
| | Shares | | | Amount | | Shares | | | | Amount | |
| Class C Shares: | | | | | | | | | | | |
| Year ended February 28, 2011 | | | | | | | | | | | |
| Shares sold | 3,408,112 | | $ | 41,308,067 | | 5,786,102 | | | $ | 71,638,692 | |
| Shares issued in reinvestment of | | | | | | | | | | | |
| distributions | 295,955 | | | 3,553,090 | | 491,024 | | | | 6,016,205 | |
| Shares redeemed | (2,151,122 | ) | | (25,460,018 | ) | (4,540,028 | ) | | | (54,790,106 | ) |
| Net increase (decrease) | 1,552,945 | | $ | 19,401,139 | | 1,737,098 | | | $ | 22,864,791 | |
| Year ended February 28, 2010 | | | | | | | | | | | |
| Shares sold | 3,264,225 | | $ | 38,543,050 | | 6,646,075 | | | $ | 80,299,721 | |
| Shares issued in reinvestment of | | | | | | | | | | | |
| distributions | 225,317 | | | 2,667,150 | | 368,044 | | | | 4,445,308 | |
| Shares redeemed | (978,472 | ) | | (11,556,419 | ) | (1,901,431 | ) | | | (22,901,255 | ) |
| Net increase (decrease) | 2,511,070 | | $ | 29,653,781 | | 5,112,688 | | | $ | 61,843,774 | |
| Advisor Class Shares: | | | | | | | | | | | |
| Year ended February 28, 2011 | | | | | | | | | | | |
| Shares sold | 3,054,392 | | $ | 36,822,186 | | 1,694,968 | | | $ | 20,788,538 | |
| Shares issued in reinvestment of | | | | | | | | | | | |
| distributions | 5,105 | | | 60,583 | | 15,523 | | | | 185,425 | |
| Shares redeemed | (881,271 | ) | | (10,238,448 | ) | (989,039 | ) | | | (11,681,028 | ) |
| Net increase (decrease) | 2,178,226 | | $ | 26,644,321 | | 721,452 | | | $ | 9,292,935 | |
| Period ended February 28, 2010a | | | | | | | | | | | |
| Shares sold | 1,163,015 | | $ | 13,537,446 | | 1,323,519 | | | $ | 15,709,552 | |
| Shares issued in reinvestment of | | | | | | | | | | | |
| distributions | 121 | | | 1,453 | | 1,624 | | | | 19,704 | |
| Shares redeemed | (89,878 | ) | | (1,067,837 | ) | (114,862 | ) | | | (1,393,410 | ) |
| Net increase (decrease) | 1,073,258 | | $ | 12,471,062 | | 1,210,281 | | | $ | 14,335,846 | |
| |
| aFor the period July 1, 2009 (effective date) to February 28, 2010. | | | | | | | | | | |
| |
| | | | | | | Franklin Virginia | |
| | | | | | | Tax-Free Income Fund | |
| | | | | | | Shares | | | | Amount | |
| Class A Shares: | | | | | | | | | | | |
| Year ended February 28, 2011 | | | | | | | | | | | |
| Shares sold | | | | | | 11,404,276 | | $ | 132,618,687 | |
| Shares issued in reinvestment of distributions | | | | | 1,788,714 | | | | 20,678,908 | |
| Shares redeemed | | | | | | (13,393,163 | ) | | | (152,484,449 | ) |
| Net increase (decrease) | | | | | | (200,173 | ) | | $ | 813,146 | |
| Year ended February 28, 2010 | | | | | | | | | | | |
| Shares sold | | | | | | 13,264,509 | | $ | 151,342,336 | |
| Shares issued in reinvestment of distributions | | | | | 1,536,900 | | | | 17,548,808 | |
| Shares redeemed | | | | | | (6,662,941 | ) | | | (75,800,128 | ) |
| Net increase (decrease) | | | | | | 8,138,468 | | | $ | 93,091,016 | |
170 | Annual Report
| | | | | |
| Franklin Tax-Free Trust | | | | | |
| |
| Notes to Financial Statements (continued) | | | | | |
| |
| |
| 2. SHARES OF BENEFICIAL INTEREST (continued) | | | | | |
| |
| | Franklin Virginia | |
| | Tax-Free Income Fund | |
| | Shares | | | Amount | |
| Class C Shares: | | | | | |
| Year ended February 28, 2011 | | | | | |
| Shares sold | 2,750,122 | | $ | 32,428,726 | |
| Shares issued in reinvestment of distributions | 313,260 | | | 3,665,595 | |
| Shares redeemed | (2,320,364 | ) | | (26,615,512 | ) |
| Net increase (decrease) | 743,018 | | $ | 9,478,809 | |
| Year ended February 28, 2010 | | | | | |
| Shares sold | 4,215,845 | | $ | 48,767,356 | |
| Shares issued in reinvestment of distributions | 226,763 | | | 2,623,623 | |
| Shares redeemed | (890,652 | ) | | (10,274,199 | ) |
| Net increase (decrease) | 3,551,956 | | $ | 41,116,780 | |
| Advisor Class Shares: | | | | | |
| Year ended February 28, 2011 | | | | | |
| Shares sold | 604,109 | | $ | 7,055,655 | |
| Shares issued in reinvestment of distributions | 4,669 | | | 52,175 | |
| Shares redeemed | (275,723 | ) | | (3,077,364 | ) |
| Net increase (decrease) | 333,055 | | $ | 4,030,466 | |
| Period ended February 28, 2010a | | | | | |
| Shares sold | 716,053 | | $ | 8,110,227 | |
| Shares issued in reinvestment of distributions | 162 | | | 1,868 | |
| Shares redeemed | (62,827 | ) | | (729,759 | ) |
| Net increase (decrease) | 653,388 | | $ | 7,382,336 | |
| aFor the period July 1, 2009 (effective date) to February 28, 2010. | | | | | |
3. TRANSACTIONS WITH AFFILIATES
Franklin Resources, Inc. is the holding company for various subsidiaries that together are referred to as Franklin Templeton Investments. Certain officers and trustees of the Funds are also officers and/or directors of the following subsidiaries:
| |
| Subsidiary | Affiliation |
| Franklin Advisers, Inc. (Advisers) | Investment manager |
| Franklin Templeton Services, LLC (FT Services) | Administrative manager |
| Franklin Templeton Distributors, Inc. (Distributors) | Principal underwriter |
| Franklin Templeton Investor Services, LLC (Investor Services) | Transfer agent |
Annual Report | 171
Franklin Tax-Free Trust
Notes to Financial Statements (continued)
| 3. | TRANSACTIONS WITH AFFILIATES (continued) |
| a. | Management Fees |
The Funds pay an investment management fee to Advisers based on the month-end net assets of each of the Funds as follows:
| | |
| Annualized Fee Rate | | Net Assets |
| 0.625 | % | Up to and including $100 million |
| 0.500 | % | Over $100 million, up to and including $250 million |
| 0.450 | % | Over $250 million, up to and including $7.5 billion |
| 0.440 | % | Over $7.5 billion, up to and including $10 billion |
| 0.430 | % | Over $10 billion, up to and including $12.5 billion |
| 0.420 | % | Over $12.5 billion, up to and including $15 billion |
| 0.400 | % | Over $15 billion, up to and including $17.5 billion |
| 0.380 | % | Over $17.5 billion, up to and including $20 billion |
| 0.360 | % | In excess of $20 billion |
b. Administrative Fees
Under an agreement with Advisers, FT Services provides administrative services to the Funds. The fee is paid by Advisers based on average daily net assets, and is not an additional expense of the Funds.
c. Distribution Fees
The Trust’s Board of Trustees has adopted distribution plans for each share class, with the exception of Advisor Class shares, pursuant to Rule 12b-1 under the 1940 Act. Under the Funds’ Class A reimbursement distribution plans, the Funds reimburse Distributors for costs incurred in connection with the servicing, sale and distribution of the Funds’ shares up to the maximum annual plan rate. Under the Class A reimbursement distribution plans, costs exceeding the maximum for the current plan year cannot be reimbursed in subsequent periods.
In addition, under the funds’ Class B and C compensation distribution plans, the funds pay Distributors for costs incurred in connection with the servicing, sale and distribution of each fund’s shares up to the maximum annual plan rate for each class.
The maximum annual plan rates, based on the average daily net assets, for each class, are as follows:
| | | | | | | | |
| | Franklin | | Franklin | | Franklin | | Franklin | |
| | Alabama | | Florida | | Georgia | | Kentucky | |
| | Tax-Free | | Tax-Free | | Tax-Free | | Tax-Free | |
| | Income Fund | | Income Fund | | Income Fund | | Income Fund | |
| Reimbursement Plans: | | | | | | | | |
| Class A | 0.10 | % | 0.10 | % | 0.10 | % | 0.10 | % |
| Compensation Plans: | | | | | | | | |
| Class B | — | | 0.65 | % | — | | — | |
| Class C | 0.65 | % | 0.65 | % | 0.65 | % | — | |
172 | Annual Report
Franklin Tax-Free Trust
Notes to Financial Statements (continued)
| 3. | TRANSACTIONS WITH AFFILIATES (continued) |
| c. | Distribution Fees (continued) |
| | | | | | | | |
| | Franklin | | Franklin | | Franklin | | Franklin | |
| | Louisiana | | Maryland | | Missouri | | North Carolina | |
| | Tax-Free | | Tax-Free | | Tax-Free | | Tax-Free | |
| | Income Fund | | Income Fund | | Income Fund | | Income Fund | |
| Reimbursement Plans: | | | | | | | | |
| Class A | 0.10 | % | 0.10 | % | 0.10 | % | 0.10 | % |
| Compensation Plans: | | | | | | | | |
| Class C | 0.65 | % | 0.65 | % | 0.65 | % | 0.65 | % |
| |
| | Franklin | | | | | | | |
| | Virginia | | | | | | | |
| | Tax-Free | | | | | | | |
| | Income Fund | | | | | | | |
| Reimbursement Plans: | | | | | | | | |
| Class A | 0.10 | % | | | | | | |
| Compensation Plans: | | | | | | | | |
| Class C | 0.65 | % | | | | | | |
d. Sales Charges/Underwriting Agreements
Distributors has advised the Funds of the following commission transactions related to the sales and redemptions of the Funds’ shares for the year:
| | | | | | |
| | | Franklin | | Franklin | | Franklin |
| | | Alabama | | Florida | | Georgia |
| | | Tax-Free | | Tax-Free | | Tax-Free |
| | | Income Fund | | Income Fund | | Income Fund |
| Sales charges retained net of commissions paid to unaffiliated | | | | | | |
| broker/dealers | $ | 85,544 | $ | 167,559 | $ | 163,809 |
| Contingent deferred sales charges retained | $ | 14,958 | $ | 32,303 | $ | 39,729 |
| |
| | | Franklin | | Franklin | | Franklin |
| | | Kentucky | | Louisiana | | Maryland |
| | | Tax-Free | | Tax-Free | | Tax-Free |
| | | Income Fund | | Income Fund | | Income Fund |
| Sales charges retained net of commissions paid to unaffiliated | | | | | | |
| broker/dealers | $ | 93,250 | $ | 190,102 | $ | 172,258 |
| Contingent deferred sales charges retained | | — | $ | 35,050 | $ | 74,288 |
| |
| | | Franklin | | Franklin | | Franklin |
| | | Missouri | | North Carolina | | Virginia |
| | | Tax-Free | | Tax-Free | | Tax-Free |
| | | Income Fund | | Income Fund | | Income Fund |
| Sales charges retained net of commissions paid to unaffiliated | | | | | | |
| broker/dealers | $ | 656,668 | $ | 517,415 | $ | 312,010 |
| Contingent deferred sales charges retained | $ | 46,545 | $ | 70,366 | $ | 71,579 |
Annual Report | 173
Franklin Tax-Free Trust
Notes to Financial Statements (continued)
| 3. | TRANSACTIONS WITH AFFILIATES (continued) |
| e. | Transfer Agent Fees |
For the year ended February 28, 2011, the Funds paid transfer agent fees as noted in the Statements of Operations of which the following amounts were retained by Investor Services:
| | | | | | |
| | | Franklin | | Franklin | | Franklin |
| | | Alabama | | Florida | | Georgia |
| | | Tax-Free | | Tax-Free | | Tax-Free |
| | | Income Fund | | Income Fund | | Income Fund |
| Transfer agent fees | $ | 55,823 | $ | 228,243 | $ | 92,820 |
| |
| | | Franklin | | Franklin | | Franklin |
| | | Kentucky | | Louisiana | | Maryland |
| | | Tax-Free | | Tax-Free | | Tax-Free |
| | | Income Fund | | Income Fund | | Income Fund |
| Transfer agent fees | $ | 32,975 | $ | 62,929 | $ | 141,162 |
| |
| | | Franklin | | Franklin | | Franklin |
| | | Missouri | | North Carolina | | Virginia |
| | | Tax-Free | | Tax-Free | | Tax-Free |
| | | Income Fund | | Income Fund | | Income Fund |
| Transfer agent fees | $ | 211,376 | $ | 203,901 | $ | 170,643 |
4. INCOME TAXES
For tax purposes, capital losses may be carried over to offset future capital gains, if any. At February 28, 2011, the capital loss carryforwards were as follows:
| | | | | | |
| | | Franklin | | Franklin | | Franklin |
| | | Alabama | | Florida | | Georgia |
| | | Tax-Free | | Tax-Free | | Tax-Free |
| | | Income Fund | | Income Fund | | Income Fund |
| Capital loss carryforwards expiring in: | | | | | | |
| 2012 | $ | 195,876 | $ | — | $ | — |
| 2013 | | — | | — | | 177,766 |
| 2014 | | — | | — | | 51,012 |
| 2015 | | — | | — | | 125,659 |
| 2016 | | — | | — | | 414,407 |
| 2017 | | — | | — | | 2,923,290 |
| 2018 | | — | | 245,044 | | — |
| | $ | 195,876 | $ | 245,044 | $ | 3,692,134 |
174 | Annual Report
| | | | | | |
| Franklin Tax-Free Trust | | | | |
| |
| Notes to Financial Statements (continued) | | | | | | |
| |
| |
| 4. INCOME TAXES (continued) | | | | | | |
| |
| | | Franklin | | Franklin | | Franklin |
| | | Kentucky | | Louisiana | | Maryland |
| | | Tax-Free | | Tax-Free | | Tax-Free |
| | | Income Fund | | Income Fund | | Income Fund |
| Capital loss carryforwards expiring in: | | | | | | |
| 2012 | $ | 1,118,456 | $ | 999,689 | $ | — |
| 2013 | | 253,770 | | 240,220 | | — |
| 2014 | | 65,408 | | — | | — |
| 2016 | | 107,105 | | — | | — |
| 2017 | | 417,325 | | 42,728 | | 1,038,820 |
| 2018 | | — | | 782,096 | | 205,848 |
| | $ | 1,962,064 | $ | 2,064,733 | $ | 1,244,668 |
| |
| | | Franklin | | Franklin | | Franklin |
| | | Missouri | | North Carolina | | Virginia |
| | | Tax-Free | | Tax-Free | | Tax-Free |
| | | Income Fund | | Income Fund | | Income Fund |
| Capital loss carryforwards expiring in: | | | | | | |
| 2012 | $ | 1,619,914 | $ | — | $ | 569,948 |
| 2013 | | 1,384,535 | | — | | — |
| 2016 | | 776,667 | | — | | — |
| 2017 | | — | | — | | — |
| 2018 | | 760,455 | | 16,085 | | 1,530,757 |
| 2019 | | 835 | | — | | — |
| | $ | 4,542,406 | $ | 16,085 | $ | 2,100,705 |
During the year ended February 28, 2011, the Funds utilized capital loss carryforwards as follows:
| | | | | | | |
| | Franklin | | Franklin | | Franklin | | Franklin |
| | Alabama | | Florida | | Georgia | | Kentucky |
| | Tax-Free | | Tax-Free | | Tax-Free | | Tax-Free |
| | Income Fund | | Income Fund | | Income Fund | | Income Fund |
| $ | 578,061 | $ | 3,521,173 | $ | 351,457 | $ | 146,398 |
| |
| | Franklin | | Franklin | | Franklin | | Franklin |
| | Louisiana | | Maryland | | North Carolina | | Virginia |
| | Tax-Free | | Tax-Free | | Tax-Free | | Tax-Free |
| | Income Fund | | Income Fund | | Income Fund | | Income Fund |
| $ | 143,022 | $ | 533,984 | $ | 388,108 | $ | 666,613 |
On February 28, 2011, the Franklin Alabama Tax-Free Income Fund and the Franklin Missouri Tax-Free Income Fund had expired capital loss carryforwards of $226,573 and $196,258, respectively, which were reclassified to paid-in capital.
Annual Report | 175
Franklin Tax-Free Trust
Notes to Financial Statements (continued)
4. INCOME TAXES (continued)
For tax purposes, realized capital losses occurring subsequent to October 31 may be deferred and treated as occurring on the first day of the following fiscal year. At February 28, 2011, deferred losses were as follows:
| | | | | | | | | | |
| | | Franklin | | | Franklin | | | Franklin | | Franklin |
| | | Georgia | | | Kentucky | | | Louisiana | | Maryland |
| | | Tax-Free | | | Tax-Free | | | Tax-Free | | Tax-Free |
| | | Income Fund | | Income Fund | | | Income Fund | | Income Fund |
| Realized capital losses | $ | 1,211,570 | $ | 537,368 | | $ | 1,149,304 | $ | 1,584,457 |
| |
| | | Franklin | | | Franklin | | | Franklin | | |
| | | Missouri | | | North Carolina | | | Virginia | | |
| | | Tax-Free | | | Tax-Free | | | Tax-Free | | |
| | | Income Fund | | Income Fund | | | Income Fund | | |
| Realized capital losses | $ | 1,581,865 | $ | 3,113,908 | | $ | 1,795,244 | | |
| |
| The tax character of distributions paid during the years ended February 28, 2011 and 2010, |
| was as follows: | | | | | | | | | | |
| |
| | | Franklin Alabama | | | | | Franklin Florida |
| | | Tax-Free Income Fund | | | Tax-Free Income Fund |
| | | 2011 | 2010 | | | 2011 | | 2010 |
| Distributions paid from tax exempt | | | | | | | | | | |
| income | $ | 12,404,397 | $11,939,201 | $ | 57,489,666 | $ | 60,399,631 |
| |
| | | Franklin Georgia | | | | | Franklin Kentucky |
| | | Tax-Free Income Fund | | | Tax-Free Income Fund |
| | | 2011 | 2010 | | | 2011 | | 2010 |
| Distributions paid from tax exempt | | | | | | | | | | |
| income | $ | 19,687,848 | $17,597,058 | $ | 7,892,172 | $ | 7,552,788 |
| |
| | | Franklin Louisiana | | | | | Franklin Maryland |
| | | Tax-Free Income Fund | | | Tax-Free Income Fund |
| | | 2011 | 2010 | | | 2011 | | 2010 |
| Distributions paid from tax exempt | | | | | | | | | | |
| income | $ | 17,058,735 | $15,138,528 | $ | 26,753,665 | $ | 26,072,081 |
| |
| | | Franklin Missouri | | | | | Franklin North Carolina |
| | | Tax-Free Income Fund | | | Tax-Free Income Fund |
| | | 2011 | 2010 | | | 2011 | | 2010 |
| Distributions paid from tax exempt | | | | | | | | | | |
| income | $ | 44,938,974 | $38,042,160 | $ | 49,768,689 | $ | 42,330,354 |
| |
| | | Franklin Virginia | | | | | | | |
| | | Tax-Free Income Fund | | | | | |
| | | 2011 | 2010 | | | | | |
| Distributions paid from tax exempt | | | | | | | | | | |
| income | $ | 34,271,831 | $29,645,513 | | | | |
176 | Annual Report
Franklin Tax-Free Trust
Notes to Financial Statements (continued)
4. INCOME TAXES (continued)
At February 28, 2011, the cost of investments, net unrealized appreciation (depreciation) and undistributed tax exempt income for income tax purposes were as follows:
| | | | | | | | | | |
| | | Franklin | | | Franklin | | | | Franklin | |
| | | Alabama | | | Florida | | | | Georgia | |
| | | Tax-Free | | | Tax-Free | | | | Tax-Free | |
| | | Income Fund | | | Income Fund | | | | Income Fund | |
| Cost of investments | $ | 281,795,065 | | $ | 1,128,979,573 | | | $ | 468,750,976 | |
| |
| Unrealized appreciation | $ | 3,090,103 | | $ | 32,744,322 | | | $ | 9,594,724 | |
| Unrealized depreciation | | (14,782,390 | ) | | (35,203,254 | ) | | | (14,916,022 | ) |
| Net unrealized appreciation (depreciation) | $ | (11,692,287 | ) | $ | (2,458,932 | ) | | $ | (5,321,298 | ) |
| |
| Distributable earnings – undistributed tax exempt | | | | | | | | | | |
| income | $ | 256,220 | | $ | 1,045,093 | | | $ | 506,888 | |
| |
| | | Franklin | | | Franklin | | | | Franklin | |
| | | Kentucky | | | Louisiana | | | | Maryland | |
| | | Tax-Free | | | Tax-Free | | | | Tax-Free | |
| | | Income Fund | | | Income Fund | | | | Income Fund | |
| Cost of investments | $ | 183,401,136 | | $ | 387,923,306 | | | $ | 638,928,565 | |
| |
| Unrealized appreciation | $ | 2,714,536 | | $ | 6,309,863 | | | $ | 9,495,584 | |
| Unrealized depreciation | | (5,350,349 | ) | | (14,184,400 | ) | | | (30,586,215 | ) |
| Net unrealized appreciation (depreciation) | $ | (2,635,813 | ) | $ | (7,874,537 | ) | | $ | (21,090,631 | ) |
| |
| Distributable earnings – undistributed tax exempt | | | | | | | | | | |
| income | $ | 74,646 | | $ | 509,368 | | | $ | 374,411 | |
| |
| | | Franklin | | | Franklin | | | | Franklin | |
| | | Missouri | | | North Carolina | | | | Virginia | |
| | | Tax-Free | | | Tax-Free | | | | Tax-Free | |
| | | Income Fund | | | Income Fund | | | | Income Fund | |
| Cost of investments | $ | 1,067,108,059 | | $ | 1,193,389,725 | | $ | | 789,081,626 | |
| |
| Unrealized appreciation | $ | 15,541,357 | | $ | 13,937,912 | | $ | | 11,221,265 | |
| Unrealized depreciation | | (38,410,901 | ) | | (34,647,010 | ) | | | (25,132,617 | ) |
| Net unrealized appreciation (depreciation) | $ | (22,869,544 | ) | $ | (20,709,098 | ) | $ | | (13,911,352 | ) |
| |
| Distributable earnings - undistributed tax exempt | | | | | | | | | | |
| income | $ | 812,427 | | $ | 1,091,120 | | $ | | 985,048 | |
Net investment income differs for financial statement and tax purposes primarily due to differing treatments of bond discounts.
Net realized gains (losses) differ for financial statement and tax purposes primarily due to differing treatments of wash sales and bond discounts.
Annual Report | 177
Franklin Tax-Free Trust
Notes to Financial Statements (continued)
5. INVESTMENT TRANSACTIONS
Purchases and sales of investments (excluding short term securities) for the year ended February 28, 2011, were as follows:
| | | | | | |
| | | Franklin | | Franklin | | Franklin |
| | | Alabama | | Florida | | Georgia |
| | | Tax-Free | | Tax-Free | | Tax-Free |
| | | Income Fund | | Income Fund | | Income Fund |
| Purchases | $ | 32,740,333 | $ | 137,549,372 | $ | 67,472,005 |
| Sales | $ | 37,303,418 | $ | 247,394,242 | $ | 43,811,960 |
| |
| | | Franklin | | Franklin | | Franklin |
| | | Kentucky | | Louisiana | | Maryland |
| | | Tax-Free | | Tax-Free | | Tax-Free |
| | | Income Fund | | Income Fund | | Income Fund |
| Purchases | $ | 25,046,161 | $ | 62,031,857 | $ | 78,976,587 |
| Sales | $ | 24,105,865 | $ | 52,063,706 | $ | 84,478,716 |
| |
| | | Franklin | | Franklin | | Franklin |
| | | Missouri | | North Carolina | | Virginia |
| | | Tax-Free | | Tax-Free | | Tax-Free |
| | | Income Fund | | Income Fund | | Income Fund |
| Purchases | $ | 205,973,219 | $ | 203,156,100 | $ | 155,687,567 |
| Sales | $ | 97,343,999 | $ | 116,227,682 | $ | 135,218,761 |
6. CONCENTRATION OF RISK
Each of the funds invests a large percentage of its total assets in obligations of issuers within its respective state, U.S. territories, and the District of Columbia. Such concentration may subject the Funds to risks associated with industrial or regional matters, and economic, political or legal developments occurring within those states, U.S. territories, and the District of Columbia. In addition, investments in these securities are sensitive to interest rate changes and credit risk of the issuer and may subject the funds to increased market volatility. The market for these investments may be limited, which may make them difficult to buy or sell.
7. CREDIT FACILITY
The Funds, together with other U.S. registered and foreign investment funds (collectively “Borrowers”), managed by Franklin Templeton Investments, are borrowers in a joint syndicated senior unsecured credit facility totaling $750 million (Global Credit Facility) which matures on January 20, 2012. This Global Credit Facility provides a source of funds to the Borrowers for temporary and emergency purposes, including the ability to meet future unanticipated or unusually large redemption requests.
178 | Annual Report
Franklin Tax-Free Trust
Notes to Financial Statements (continued)
7. CREDIT FACILITY (continued)
Under the terms of the Global Credit Facility, the Funds shall, in addition to interest charged on any borrowings made by the Funds and other costs incurred by the Funds, pay their share of fees and expenses incurred in connection with the implementation and maintenance of the Global Credit Facility, based upon their relative share of the aggregate net assets of all of the Borrowers, including an annual commitment fee of 0.08% based upon the unused portion of the Global Credit Facility, which is reflected in other expenses on the Statements of Operations. During the year ended February 28, 2011, the Funds did not use the Global Credit Facility.
8. FAIR VALUE MEASUREMENTS
The Funds follow a fair value hierarchy that distinguishes between market data obtained from independent sources (observable inputs) and the Funds’ own market assumptions (unobservable inputs). These inputs are used in determining the value of the Funds’ investments and are summarized in the following fair value hierarchy:
- Level 1 – quoted prices in active markets for identical securities
- Level 2 – other significant observable inputs (including quoted prices for similar securities, interest rates, prepayment speed, credit risk, etc.)
- Level 3 – significant unobservable inputs (including the Funds’ own assumptions in determining the fair value of investments)
The inputs or methodology used for valuing securities are not an indication of the risk associated with investing in those securities.
For movements between the levels within the fair value hierarchy, the Funds have adopted a policy of recognizing the transfers as of the date of the underlying event which caused the movement.
At February 28, 2011, all of the Funds’ investments in securities carried at fair value were in Level 2 inputs.
9. SUBSEQUENT EVENTS
The Funds have evaluated subsequent events through the issuance of the financial statements and determined that no events have occurred that require disclosure.
Annual Report | 179
| | | |
| Franklin Tax-Free Trust | | |
| |
| Notes to Financial Statements (continued) | | |
| |
| |
| Abbreviations | | |
| |
| |
| Selected Portfolio | | |
| |
| ACA | - American Capital Access Holdings Inc. | IDA | -IndustrialDevelopment Authority/Agency |
| AGMC | - Assured Guaranty Municipal Corp. | IDAR | -IndustrialDevelopment Authority Revenue |
| AMBAC | - American Municipal Bond Assurance Corp. | IDB | -IndustrialDevelopment Bond/Board |
| BHAC | - Berkshire Hathaway Assurance Corp. | IDBR | -IndustrialDevelopment Board Revenue |
| CDA | - Community Development Authority/Agency | IDR | -IndustrialDevelopment Revenue |
| CDD | - Community Development District | MF | -Multi-Family |
| CDR | - Community Development Revenue | MFHR | -Multi-FamilyHousing Revenue |
| CIFG | - CDC IXIS Financial Guaranty | MFMR | -Multi-FamilyMortgage Revenue |
| COP | - Certificate of Participation | MFR | -Multi-FamilyRevenue |
| CRDA | - Community Redevelopment Authority/Agency | NATL RE | - National Public Financial Guarantee Corp. Reinsured |
| EDA | - Economic Development Authority | NATL | - National Public Financial Guarantee Corp. |
| EDC | - Economic Development Corp. | PBA | -PublicBuilding Authority |
| EDR | - Economic Development Revenue | PCFA | - Pollution Control Financing Authority |
| ETM | - Escrow to Maturity | PCR | - Pollution Control Revenue |
| FGIC | -FinancialGuaranty Insurance Co. | PFAR | -PublicFinancing Authority Revenue |
| FHA | - Federal Housing Authority/Agency | SF | -SingleFamily |
| FICO | -FinancingCorp. | SFM | -SingleFamily Mortgage |
| FNMA | - Federal National Mortgage Association | SFMR | -SingleFamily Mortgage Revenue |
| GARB | -GeneralAirport Revenue Bonds | SFR | -SingleFamily Revenue |
| GNMA | - Government National Mortgage Association | XLCA | - XL Capital Assurance |
| GO | -GeneralObligation | | |
| HDA | -HousingDevelopment Authority/Agency | | |
| HDC | -HousingDevelopment Corp. | | |
| HFA | -HousingFinance Authority/Agency | | |
| HFAR | -HousingFinance Authority Revenue | | |
| HFC | -HousingFinance Corp. | | |
180 | Annual Report
Franklin Tax-Free Trust
Report of Independent Registered Public Accounting Firm
To the Board of Trustees and Shareholders of Franklin Tax-Free Trust
In our opinion, the accompanying statements of assets and liabilities, including the statements of investments, and the related statements of operations and of changes in net assets and the financial highlights present fairly, in all material respects, the financial position of Franklin Alabama Tax-Free Income Fund, Franklin Florida Tax-Free Income Fund, Franklin Georgia Tax-Free Income Fund, Franklin Kentucky Tax-Free Income Fund, Franklin Louisiana Tax-Free Income Fund, Franklin Maryland Tax-Free Income Fund, Franklin Missouri Tax-Free Income Fund, Franklin North Carolina Tax-Free Income Fund and Franklin Virginia Tax-Free Income Fund (separate portfolios of Franklin Tax-Free Trust, hereafter referred to as the “Funds”) at February 28, 2011, the results of each of their operations for the year then ended, the changes in each of their net assets for each of the two years in the period then ended and the financial highlights for each of the periods presented, in conformity with accounting principles generally accepted in the United States of America. These financial statements and financial highlights (hereafter referred to as “financial statements”) are the responsibility of the Funds’ management. Our responsibility is to express an opinion on these financial statements based on our audits. We conducted our audits of these financial statements in accordance with the standards of the Public Company Accounting Oversight Board (United States). Those standards require that we plan and perform the audit to obtain reasonable assurance about whether the financial statements are free of material misstatement. An audit includes examining, on a test basis, evidence supporting the amounts and disclosures in the financial statements, assessing the accounting principles used and significant estimates made by management, and evaluating the overall financial statement presentation. We believe that our audits, which included confirmation of securities at February 28, 2011 by correspondence with the custodian and brokers, provide a reasonable basis for our opinion.
PricewaterhouseCoopers LLP
San Francisco, California
April 18, 2011
Annual Report | 181
Franklin Tax-Free Trust
Tax Designation (unaudited)
Under Section 852(b)(5)(A) of the Internal Revenue Code, the Funds designate 100% of the distributions paid from net investment income as exempt-interest dividends for the fiscal year ended February 28, 2011. A portion of the Fund’s exempt-interest dividends may be subject to the federal alternative minimum tax. In January 2012, shareholders will be notified of amounts for use in preparing their 2011 income tax returns.
182 | Annual Report
Franklin Tax-Free Trust
Board Members and Officers
The name, year of birth and address of the officers and board members, as well as their affiliations, positions held with the Trust, principal occupations during the past five years and number of portfolios overseen in the Franklin Templeton Investments fund complex are shown below. Generally, each board member serves until that person’s successor is elected and qualified.
| | | | |
| Independent Board Members | | | |
| |
| | | | Number of Portfolios in | |
| Name, Year of Birth | | Length of | Fund Complex Overseen | |
| and Address | Position | Time Served | by Board Member* | Other Directorships Held |
| Harris J. Ashton (1932) | Trustee | Since 1984 | 130 | Bar-S Foods (meat packing company) |
| One Franklin Parkway | | | | (1981-2010). |
| San Mateo, CA 94403-1906 | | | | |
| Principal Occupation During Past 5 Years: | | | |
| Director of various companies; and formerly, Director, RBC Holdings, Inc. (bank holding company) (until 2002); and President, Chief Executive |
| Officer and Chairman of the Board, General Host Corporation (nursery and craft centers) (until 1998). | |
| |
| Sam Ginn (1937) | Trustee | Since 2007 | 106 | ICO Global Communications |
| One Franklin Parkway | | | | (Holdings) Limited (satellite company). |
| San Mateo, CA 94403-1906 | | | | |
| Principal Occupation During Past 5 Years: | | | |
| Private investor; and formerly, Chairman of the Board, Vodafone AirTouch, PLC (wireless company); Chairman of the Board and Chief |
| Executive Officer, AirTouch Communications (cellular communications) (1993-1998) and Pacific Telesis Group (telephone holding company) |
| (1988-1994). | | | | |
| |
| Edith E. Holiday (1952) | Trustee | Since 1998 | 130 | Hess Corporation (exploration and |
| One Franklin Parkway | | | | refining of oil and gas), H.J. Heinz |
| San Mateo, CA 94403-1906 | | | | Company (processed foods and allied |
| | | | | products), RTI International Metals, |
| | | | | Inc. (manufacture and distribution |
| | | | | of titanium), Canadian National |
| | | | | Railway (railroad) and White |
| | | | | Mountains Insurance Group, Ltd. |
| | | | | (holding company). |
| Principal Occupation During Past 5 Years: | | | |
| Director or Trustee of various companies and trusts; and formerly, Assistant to the President of the United States and Secretary of the Cabinet |
| (1990-1993); General Counsel to the United States Treasury Department (1989-1990); and Counselor to the Secretary and Assistant Secretary, |
| Public Affairs and Public Liaison – United States Treasury Department (1988-1989). | |
| |
| J. Michael Luttig (1954) | Trustee | Since 2009 | 130 | Boeing Capital Corporation (aircraft |
| One Franklin Parkway | | | | financing). |
| San Mateo, CA 94403-1906 | | | | |
| Principal Occupation During Past 5 Years: | | | |
| Executive Vice President, General Counsel and member of Executive Council, The Boeing Company; and formerly, Federal Appeals Court |
| Judge, U.S. Court of Appeals for the Fourth Circuit (1991-2006). | | |
| |
| |
| |
| |
| | | | | Annual Report | 183 |
| | | | | |
| | | | | Number of Portfolios in | |
| Name, Year of Birth | | Length of | | Fund Complex Overseen | |
| and Address | Position | Time Served | | by Board Member* | Other Directorships Held |
| Frank A. Olson (1932) | Trustee | Since 2005 | | 130 | Hess Corporation (exploration and |
| One Franklin Parkway | | | | | refining of oil and gas). |
| San Mateo, CA 94403-1906 | | | | | |
| Principal Occupation During Past 5 Years: | | | | |
| Chairman Emeritus, The Hertz Corporation (car rental) (since 2000) (Chairman of the Board (1980-2000) and Chief Executive Officer |
| (1977-1999)); and formerly, Chairman of the Board, President and Chief Executive Officer, UAL Corporation (airlines). |
| |
| Larry D. Thompson (1945) | Trustee | Since 2007 | | 138 | Cbeyond, Inc. (business communi- |
| One Franklin Parkway | | | | | cations provider) and The Southern |
| San Mateo, CA 94403-1906 | | | | | Company (energy company). |
| Principal Occupation During Past 5 Years: | | | | |
| Senior Vice President – Government Affairs, General Counsel and Secretary, PepsiCo, Inc. (consumer products); and formerly, Director, Delta |
| Airlines (aviation) (2003-2005) and Providian Financial Corp. (credit card provider) (1997-2001); Senior Fellow of The Brookings Institution |
| (2003-2004); Visiting Professor, University of Georgia School of Law (2004); and Deputy Attorney General, U.S. Department of Justice |
| (2001-2003). | | | | | |
| |
| John B. Wilson (1959) | Lead | Trustee since | | 106 | None |
| One Franklin Parkway | Independent | 2007 and Lead | | | |
| San Mateo, CA 94403-1906 | Trustee | Independent | | | |
| | | Trustee since | | | |
| | | 2008 | | | |
| Principal Occupation During Past 5 Years: | | | | |
| President and Founder, Hyannis Port Capital, Inc. (real estate and private equity investing); serves on private and non-profit boards; and |
| formerly, Chief Operating Officer and Executive Vice President, Gap, Inc. (retail) (1996-2000); Chief Financial Officer and Executive Vice |
| President – Finance and Strategy, Staples, Inc. (office supplies) (1992-1996); Senior Vice President – Corporate Planning, Northwest Airlines, |
| Inc. (airlines) (1990-1992); and Vice President and Partner, Bain & Company (consulting firm) (1986-1990). |
| |
| |
| |
| Interested Board Members and Officers | | | |
| |
| | | | | Number of Portfolios in | |
| Name, Year of Birth | | Length of | | Fund Complex Overseen | |
| and Address | Position | Time Served | | by Board Member* | Other Directorships Held |
| **Charles B. Johnson (1933) | Trustee and | Trustee since | | 130 | None |
| One Franklin Parkway | Chairman of | 1984 | and | | |
| San Mateo, CA 94403-1906 | the Board | Chairman of the | | | |
| | | Board since 1993 | | | |
| Principal Occupation During Past 5 Years: | | | | |
| Chairman of the Board, Member – Office of the Chairman and Director, Franklin Resources, Inc.; and officer and/or director or trustee, |
| as the case may be, of some of the other subsidiaries of Franklin Resources, Inc. and of 41 of the investment companies in Franklin |
| Templeton Investments. | | | | | |
| |
| |
| |
| |
| 184 | Annual Report | | | | | |
| | | | |
| | | | Number of Portfolios in | |
| Name, Year of Birth | | Length of | Fund Complex Overseen | |
| and Address | Position | Time Served | by Board Member* | Other Directorships Held |
| **Gregory E. Johnson (1961) | Trustee | Since 2007 | 88 | None |
| One Franklin Parkway | | | | |
| San Mateo, CA 94403-1906 | | | | |
| Principal Occupation During Past 5 Years: | | | |
| Director, President and Chief Executive Officer, Franklin Resources, Inc.; and officer and/or director or trustee, as the case may be, of some |
| of the other subsidiaries of Franklin Resources, Inc. and of 33 of the investment companies in Franklin Templeton Investments. |
| |
| Sheila Amoroso (1959) | Vice President | Since 1999 | Not Applicable | Not Applicable |
| One Franklin Parkway | | | | |
| San Mateo, CA 94403-1906 | | | | |
| Principal Occupation During Past 5 Years: | | | |
| Senior Vice President, Franklin Advisers, Inc.; and officer of eight of the investment companies in Franklin Templeton Investments. |
| |
| Rafael R. Costas, Jr. (1965) | Vice President | Since 1999 | Not Applicable | Not Applicable |
| One Franklin Parkway | | | | |
| San Mateo, CA 94403-1906 | | | | |
| Principal Occupation During Past 5 Years: | | | |
| Senior Vice President, Franklin Advisers, Inc.; and officer of eight of the investment companies in Franklin Templeton Investments. |
| |
| James M. Davis (1952) | Chief | Chief Compliance | Not Applicable | Not Applicable |
| One Franklin Parkway | Compliance | Officer since 2004 | | |
| San Mateo, CA 94403-1906 | Officer and | and Vice | | |
| | Vice President | President – AML | | |
| | – AML | Compliance since | | |
| | Compliance | 2006 | | |
| Principal Occupation During Past 5 Years: | | | |
| Director, Global Compliance, Franklin Resources, Inc.; officer of some of the other subsidiaries of Franklin Resources, Inc. and of 45 of the |
| investment companies in Franklin Templeton Investments; and formerly, Director of Compliance, Franklin Resources, Inc. (1994-2001). |
| |
| Laura F. Fergerson (1962) | Chief | Since 2009 | Not Applicable | Not Applicable |
| One Franklin Parkway | Executive | | | |
| San Mateo, CA 94403-1906 | Officer – | | | |
| | Finance and | | | |
| | Administration | | | |
| Principal Occupation During Past 5 Years: | | | |
| Senior Vice President, Franklin Templeton Services, LLC; officer of 45 of the investment companies in Franklin Templeton Investments; and |
| formerly, Director and member of Audit and Valuation Committees, Runkel Funds, Inc. (2003-2004); Assistant Treasurer of most of the |
| investment companies in Franklin Templeton Investments (1997-2003); and Vice President, Franklin Templeton Services, LLC (1997-2003). |
| |
| Gaston Gardey (1967) | Treasurer, | Since 2009 | Not Applicable | Not Applicable |
| One Franklin Parkway | Chief Financial | | | |
| San Mateo, CA 94403-1906 | Officer and | | | |
| | Chief | | | |
| | Accounting | | | |
| | Officer | | | |
| Principal Occupation During Past 5 Years: | | | |
| Director Fund Accounting, Franklin Templeton Investments; and officer of 27 of the investment companies in Franklin Templeton Investments. |
| |
| |
| |
| |
| | | | | Annual Report | 185 |
| | | | |
| | | | Number of Portfolios in | |
| Name, Year of Birth | | Length of | Fund Complex Overseen | |
| and Address | Position | Time Served | by Board Member* | Other Directorships Held |
| Aliya S. Gordon (1973) | Vice President | Since 2009 | Not Applicable | Not Applicable |
| One Franklin Parkway | | | | |
| San Mateo, CA 94403-1906 | | | | |
| Principal Occupation During Past 5 Years: | | | |
| Senior Associate General Counsel, Franklin Templeton Investments; officer of 45 of the investment companies in Franklin Templeton |
| Investments; and formerly, Litigation Associate, Steefel, Levitt & Weiss, LLP (2000-2004). | |
| |
| David P. Goss (1947) | Vice President | Since 2000 | Not Applicable | Not Applicable |
| One Franklin Parkway | | | | |
| San Mateo, CA 94403-1906 | | | | |
| Principal Occupation During Past 5 Years: | | | |
| Senior Associate General Counsel, Franklin Templeton Investments; and officer and/or director, as the case maybe, of some of the other |
| subsidiaries of Franklin Resources, Inc. and of 45 of the investment companies in Franklin Templeton Investments. |
| |
| Steven J. Gray (1955) | Vice President | Since 2009 | Not Applicable | Not Applicable |
| One Franklin Parkway | | | | |
| San Mateo, CA 94403-1906 | | | | |
| Principal Occupation During Past 5 Years: | | | |
| Senior Associate General Counsel, Franklin Templeton Investments; Vice President, Franklin Templeton Distributors, Inc.; and officer of 45 of |
| the investment companies in Franklin Templeton Investments. | | |
| |
| Christopher J. Molumphy (1962) | President and | Since April 2010 | Not Applicable | Not Applicable |
| One Franklin Parkway | Chief | | | |
| San Mateo, CA 94403-1906 | Executive | | | |
| | Officer – | | | |
| | Investment | | | |
| | Management | | | |
| Principal Occupation During Past 5 Years: | | | |
| Director and Executive Vice President, Franklin Advisers, Inc.; Executive Vice President, Franklin Templeton Institutional, LLC; and officer of |
| some of the other subsidiaries of Franklin Resources, Inc. and of 22 of the investment companies in Franklin Templeton Investments. |
| |
| Robert C. Rosselot (1960) | Vice President | Since 2009 | Not Applicable | Not Applicable |
| 500 East Broward Blvd. | | | | |
| Suite 2100 | | | | |
| Fort Lauderdale, FL 33394-3091 | | | | |
| Principal Occupation During Past 5 Years: | | | |
| Senior Associate General Counsel, Franklin Templeton Investments; Assistant Secretary, Franklin Resources, Inc.; Vice President and |
| Secretary, Templeton Investment Counsel, LLC; Vice President, Secretary and Trust Officer, Fiduciary Trust International of the South; |
| and officer of 45 of the investment companies in Franklin Templeton Investments. | |
| |
| Karen L. Skidmore (1952) | Vice President | Since 2006 | Not Applicable | Not Applicable |
| One Franklin Parkway | and Secretary | | | |
| San Mateo, CA 94403-1906 | | | | |
| Principal Occupation During Past 5 Years: | | | |
| Senior Associate General Counsel, Franklin Templeton Investments; and officer of 45 of the investment companies in Franklin |
| Templeton Investments. | | | | |
| |
| |
| |
| |
| 186 | Annual Report | | | | |
| | | | |
| | | | Number of Portfolios in | |
| Name, Year of Birth | | Length of | Fund Complex Overseen | |
| and Address | Position | Time Served | by Board Member* | Other Directorships Held |
| Craig S. Tyle (1960) | Vice President | Since 2005 | Not Applicable | Not Applicable |
| One Franklin Parkway | | | | |
| San Mateo, CA 94403-1906 | | | | |
| Principal Occupation During Past 5 Years: | | | |
| General Counsel and Executive Vice President, Franklin Resources, Inc.; officer of some of the other subsidiaries of Franklin Resources, Inc. |
| and of 45 of the investment companies in Franklin Templeton Investments; and formerly, Partner, Shearman & Sterling, LLP (2004-2005); |
| and General Counsel, Investment Company Institute (ICI) (1997-2004). | | |
| |
| Thomas Walsh (1961) | Vice President | Since 1999 | Not Applicable | Not Applicable |
| One Franklin Parkway | | | | |
| San Mateo, CA 94403-1906 | | | | |
| Principal Occupation During Past 5 Years: | | | |
| Senior Vice President, Franklin Advisers, Inc.; and officer of eight of the investment companies in Franklin Templeton Investments. |
| |
| *We base the number of portfolios on each separate series of the U.S. registered investment companies within the Franklin Templeton Investments fund complex. These portfolios |
| have a common investment manager or affiliated investment managers. | | |
| **Charles B. Johnson is considered to be an interested person of the Trust under the federal securities laws due to his position as officer and director and major shareholder of |
| Franklin Resources, Inc. (Resources), which is the parent company of the Trust’s investment manager and distributor. Gregory E. Johnson is considered to be an interested person of |
| the Trust under the federal securities laws due to his position as an officer and director of Resources. | |
| Note 1: Charles B. Johnson is the father of Gregory E. Johnson. | | | |
| Note 2: Officer information is current as of the date of this report. It is possible that after this date, information about officers may change. |
| Note 3: Prior to February 28, 2011, Frank W.T. LaHaye ceased to be a trustee of the Trust. | | |
| |
| The Sarbanes-Oxley Act of 2002 and Rules adopted by the Securities and Exchange Commission require the Fund to disclose whether the Fund’s Audit Committee includes |
| at least one member who is an audit committee financial expert within the meaning of such Act and Rules. The Fund’s Board has determined that there is at least one such |
| financial expert on the Audit Committee and has designated John B. Wilson as its audit committee financial expert. The Board believes that Mr. Wilson qualifies as such an |
| expert in view of his extensive business background and experience, including service as chief financial officer of Staples, Inc. from 1992 to 1996. Mr. Wilson has been a |
| Member and Chairman of the Fund’s Audit Committee since 2007. As a result of such background and experience, the Board believes that Mr. Wilson has acquired an under- |
| standing of generally accepted accounting principles and financial statements, the general application of such principles in connection with the accounting estimates, |
| accruals and reserves, and analyzing and evaluating financial statements that present a breadth and level of complexity of accounting issues generally comparable to those |
| of the Fund, as well as an understanding of internal controls and procedures for financial reporting and an understanding of audit committee functions. Mr. Wilson is an |
| independent Board member as that term is defined under the relevant Securities and Exchange Commission Rules and Releases. |
| |
| The Statement of Additional Information (SAI) includes additional information about the board members and is available, without charge, upon request. Shareholders may |
| call (800) DIAL BEN/(800) 342-5236 to request the SAI. | | | |
Annual Report | 187
Franklin Tax-Free Trust
Shareholder Information
Board Review of Investment Management Agreement
At a meeting held March 1, 2011, the Board of Trustees (Board), including a majority of non-interested or independent Trustees, approved renewal of the investment management agreement for each of the separate tax-exempt funds within the Trust (Fund(s)). In reaching this decision, the Board took into account information furnished throughout the year at regular Board meetings, as well as information prepared specifically in connection with the annual renewal review process. Information furnished and discussed throughout the year included investment performance reports and related financial information for each Fund, as well as periodic reports on expenses, shareholder services, legal, compliance, pricing, and other services provided by the Investment Manager (Manager) and its affiliates. Information furnished specifically in connection with the renewal process included a report for each Fund prepared by Lipper, Inc. (Lipper), an independent organization, as well as additional material, including a Fund profitability analysis prepared by management. The Lipper reports compared each Fund’s investment performance and expenses with those of other mutual funds deemed comparable to the Fund as selected by Lipper. The Fund profitability analysis discussed the profitability to Franklin Templeton Investments from its overall U.S. fund operations, as well as on an individual fund-by-fund basis. Additional material accompanying such profitability analysis included information on a fund-by-fund basis listing portfolio managers and other accounts they manage, as well as information on management fees charged by the Manager and its affiliates to U.S. mutual funds and other accounts, including management’s explanation of differences where relevant. Such material also included a memorandum prepared by management describing project initiatives and capital investments relating to the services provided to the Funds by the Franklin Templeton Investments organization, as well as a memorandum relating to economies of scale and a comparative analysis concerning transfer agent fees charged each Fund.
In considering such materials, the independent Trustees received assistance and advice from and met separately with independent counsel. While the investment management agreements for all Funds were considered at the same Board meeting, the Board dealt with each Fund separately. In approving continuance of the investment management agreement for each Fund, the Board, including a majority of independent Trustees, determined that the existing management fee structure was fair and reasonable and that continuance of the investment management agreement was in the best interests of each Fund and its shareholders. While attention was given to all information furnished, the following discusses some primary factors relevant to the Board’s decision.
NATURE, EXTENT AND QUALITY OF SERVICES. The Board was satisfied with the nature and quality of the overall services provided by the Manager and its affiliates to the Funds and their shareholders. In addition to investment performance and expenses discussed later, the Board’s opinion was based, in part, upon periodic reports furnished it showing that the investment policies and restrictions for each Fund were consistently complied with as well as other reports periodically furnished the Board covering matters such as the compliance of portfolio managers and other management personnel with the code of ethics adopted throughout the Franklin Templeton fund complex, the adherence to fair value pricing procedures established by the Board, and the accuracy
188 | Annual Report
Franklin Tax-Free Trust
Shareholder Information (continued)
Board Review of Investment Management Agreement (continued)
of net asset value calculations. The Board also noted the extent of benefits provided Fund shareholders from being part of the Franklin Templeton family of funds, including the right to exchange investments between the same class of funds without a sales charge, the ability to reinvest Fund dividends into other funds and the right to combine holdings in other funds to obtain a reduced sales charge. Favorable consideration was given to management’s continuous efforts and expenditures in establishing back-up systems and recovery procedures to function in the event of a natural disaster, it being noted that such systems and procedures had functioned smoothly during the Florida hurricanes and blackouts experienced in previous years. Consideration was also given to the experience of each Fund’s portfolio management team, the number of accounts managed and general method of compensation. In this latter respect, the Board noted that a primary factor in management’s determination of a portfolio manager’s bonus compensation was the relative investment performance of the funds he or she managed and that a portion of such bonus was required to be invested in a predesignated list of funds within such person’s fund management area so as to be aligned with the interests of shareholders. The Board also took into account the quality of transfer agent and shareholder services provided Fund shareholders by an affiliate of the Manager and the continuous enhancements to the Franklin Templeton website. Particular attention was given to management’s conservative approach and diligent risk management procedures, including continuous monitoring of counterparty credit risk and attention given to derivatives and other complex instruments. The Board also took into account, among other things, management’s efforts in establishing a global credit facility for the benefit of the Funds and other accounts managed by Franklin Templeton Investments to provide a source of cash for temporary and emergency purposes or to meet unusual redemption requests as well as the strong financial position of the Manager’s parent company and its commitment to the mutual fund business as evidenced by its subsidization of money market funds.
INVESTMENT PERFORMANCE. The Board placed significant emphasis on the investment performance of each Fund in view of its importance to shareholders. While consideration was given to performance reports and discussions with portfolio managers at Board meetings throughout the year, particular attention in assessing performance was given to the Lipper reports furnished for the agreement renewals. The Lipper reports prepared for each individual Fund showed its investment performance or those of its Class A shares for Funds having multiple share classes, in comparison to a performance universe selected by Lipper. Comparative performance for each Fund was shown for the one-year period ended December 31, 2010, and for additional periods ended that date up to 10 years depending on when a particular Fund commenced operations. Investment performance was shown on an income return basis, as well as a total return basis for each Fund. The Lipper reports showed that the income return for each Fund was in the upper half of its Lipper performance universe during 2010, with most being in the highest or second-highest quintile of such universe during such year and on an annualized basis for the previous three-, five- and 10-year periods as well. The Lipper reports showed the total return for many of such Funds was below the median of their performance universe during 2010, but that the total return of all such Funds was good on a long-term basis with each having total returns above the median of its respective performance universe during the previous 10-year period on an annualized basis. Management explained that the
Annual Report | 189
Franklin Tax-Free Trust
Shareholder Information (continued)
Board Review of Investment Management Agreement (continued)
one-year relative total return performance reflected the fact that the average maturity of investments in the portfolios of the Funds was generally longer than those of its performance universe peers. The Board expressed satisfaction with such performance, noting management’s explanation and the fact that the investment objective of each of the Funds is to obtain a high level of tax-exempt income.
COMPARATIVE EXPENSES. Consideration was given to the management fee and total expense ratios of each Fund in comparison with those of a group of funds selected by Lipper as its appropriate Lipper expense group. Lipper expense data is based upon information taken from each fund’s most recent annual report, which reflects historical asset levels that may be quite different from those currently existing, particularly in a period of market volatility. While recognizing such inherent limitation and the fact that expense ratios generally increase as assets decline and decrease as assets grow, the Board believed the independent analysis conducted by Lipper to be an appropriate measure of comparative expenses. In reviewing comparative costs, Lipper provides information on each Fund’s contractual investment management fee in comparison with the contractual investment management fee that would have been charged by other funds within its Lipper expense group assuming they were similar in size to the Fund, as well as the actual total expenses of the Fund in comparison with those of its Lipper expense group. The Lipper contractual investment management fee analysis includes an administrative charge as being part of the investment management fee, and total expenses, for comparative consistency, are shown by Lipper for Fund Class A shares for Funds having multiple share classes. The Lipper reports showed that the contractual investment management fee rates for each Fund were at or below the median of their respective Lipper expense groups, with the exception of Franklin Kentucky Tax-Free Income Fund whose fee rate was within two basis points of its expense group median. The Lipper reports further showed that the actual total expense rates for all Funds were below the median of their respective Lipper expense groups. Based on the above, the Board was satisfied with the investment management fee and total expenses of each Fund in comparison to its Lipper expense group as shown in the Lipper reports.
MANAGEMENT PROFITABILITY. The Board also considered the level of profits realized by the Manager and its affiliates in connection with the operation of each Fund. In this respect, the Board reviewed the Fund profitability analysis that addresses the overall profitability of Franklin Templeton’s U.S. fund business, as well as its profits in providing management and other services to each of the individual funds during the 12-month period ended September 30, 2010, being the most recent fiscal year-end for Franklin Resources, Inc., the manager’s parent. In reviewing the analysis, attention was given to the methodology followed in allocating costs to each Fund, it being recognized that allocation methodologies are inherently subjective and various allocation methodologies may each be reasonable while producing different results. In this respect, the Board noted that while being continuously refined and reflecting changes in the Manager’s own cost accounting, such allocation methodology was consistent with that followed in profitability report presentations for the Funds made in prior years and that the Funds’ independent registered public accounting firm
190 | Annual Report
Franklin Tax-Free Trust
Shareholder Information (continued)
Board Review of Investment Management Agreement (continued)
had been engaged by the Manager to review the reasonableness of the allocation methodologies solely for use by the Funds’ Board in reference to the profitability analysis. In reviewing and discussing such analysis, management discussed with the Board its belief that costs incurred in establishing the infrastructure necessary for the type of mutual fund operations conducted by the Manager and its affiliates may not be fully reflected in the expenses allocated to each Fund in determining its profitability, as well as the fact that the level of profits, to a certain extent, reflected operational cost savings and efficiencies initiated by management. The Board also took into account management’s expenditures in improving shareholder services provided the Funds, as well as the need to meet additional regulatory and compliance requirements resulting from the Sarbanes-Oxley Act and recent SEC and other regulatory requirements. In addition, the Board considered a third-party study comparing the profitability of the Manager’s parent on an overall basis to other publicly held managers broken down to show profitability from management operations exclusive of distribution expenses, as well as profitability including distribution expenses. The Board also considered the extent to which the Manager and its affiliates might derive ancillary benefits from fund operations, including revenues generated from transfer agent services. Based upon its consideration of all these factors, the Board determined that the level of profits realized by the Manager and its affiliates from providing services to each Fund was not excessive in view of the nature, quality and extent of services provided.
ECONOMIES OF SCALE. The Board also considered whether economies of scale are realized by the Manager as the Funds grow larger and the extent to which this is reflected in the level of management fees charged. While recognizing any precise determination is inherently subjective, the Board noted that based upon the Fund profitability analysis, it appears that as some Funds get larger, at some point economies of scale do result in the Manager realizing a larger profit margin on management services provided such Fund. The Board also noted that any economies of scale are shared with each of these Funds and their shareholders through management fee breakpoints existing in each of the Fund’s investment management agreements, so that as a Fund grows in size, its effective management fee rate declines. The fee structure under the investment management agreement with each Fund provides an initial fee of 0.625% on the first $100 million of assets; 0.50% on the next $150 million of assets; 0.45% on assets in excess of $250 million; with additional breakpoints beginning at 0.44% on assets in excess of $7.5 billion; 0.43% on assets in excess of $10 billion and continuing thereafter. In reviewing such structure, management stated its belief that this fee structure reaches a relatively low rate quickly as a Fund grows and that such low rate, in effect, reflects anticipated economies of scale as a Fund’s assets increase. In support of such position, management pointed out the favorable effective management fee and total expense comparisons for each Fund within its Lipper expense group as previously discussed under “Comparative Expenses.” The Board believed that to the extent economies of scale may be realized by the Manager and its affiliates, the schedule of fees under the investment management agreement for each Fund provides a sharing of benefits with the Fund and its shareholders.
Annual Report | 191
Franklin Tax-Free Trust
Shareholder Information (continued)
Proxy Voting Policies and Procedures
The Trust’s investment manager has established Proxy Voting Policies and Procedures (Policies) that the Trust uses to determine how to vote proxies relating to portfolio securities. Shareholders may view the Trust’s complete Policies online at franklintempleton.com. Alternatively, shareholders may request copies of the Policies free of charge by calling the Proxy Group collect at (954) 527-7678 or by sending a written request to: Franklin Templeton Companies, LLC, 500 East Broward Boulevard, Suite 1500, Fort Lauderdale, FL 33394, Attention: Proxy Group. Copies of the Trust’s proxy voting records are also made available online at franklintempleton.com and posted on the U.S. Securities and Exchange Commission’s website at sec.gov and reflect the most recent 12-month period ended June 30.
Quarterly Statement of Investments
The Trust files a complete statement of investments with the U.S. Securities and Exchange Commission for the first and third quarters for each fiscal year on Form N-Q. Shareholders may view the filed Form N-Q by visiting the Commission’s website at sec.gov. The filed form may also be viewed and copied at the Commission’s Public Reference Room in Washington, DC. Information regarding the operations of the Public Reference Room may be obtained by calling (800) SEC-0330.
Householding of Reports and Prospectuses
You will receive each Fund’s financial reports every six months as well as an annual updated summary prospectus (prospectus available upon request). To reduce Fund expenses, we try to identify related shareholders in a household and send only one copy of the financial reports and summary prospectus. This process, called “householding,” will continue indefinitely unless you instruct us otherwise. If you prefer not to have these documents householded, please call us at (800) 632-2301. At any time you may view current prospectuses/summary prospectuses and financial reports on our website. If you choose, you may receive these documents through electronic delivery.
192 | Annual Report

| | | | | | | |
| | Contents | | | | | |
| Shareholder Letter | 1 | Annual Report | | Franklin Michigan Tax-Free | | Financial Highlights and | |
| | | Municipal Bond Market | | Income Fund | 40 | Statements of Investments | 95 |
| | | Overview | 4 | Franklin Minnesota Tax-Free | | Financial Statements | 180 |
| | | Investment Strategy and | | Income Fund | 51 | Notes to Financial Statements | 190 |
| | | Manager’s Discussion | 6 | Franklin Ohio Tax-Free | | Report of Independent | |
| | | Franklin Arizona | | Income Fund | 62 | Registered Public | |
| | | Tax-Free Income Fund | 7 | Franklin Oregon | | Accounting Firm | 206 |
| | | Franklin Colorado | | Tax-Free Income Fund | 73 | Tax Designation | 207 |
| | | Tax-Free Income Fund | 18 | Franklin Pennsylvania | | Board Members and Officers | 208 |
| | | Franklin Connecticut | | Tax-Free Income Fund | 84 | | |
| | | | | | | Shareholder Information | 213 |
| | | Tax-Free Income Fund | 29 | | | | |
Shareholder Letter
Dear Shareholder:
The 12-month period ended February 28, 2011, was typical of transitions between recessions and recoveries as the year under review endured pendulum swings in economic growth and investor sentiment. Although a 2.9% gross domestic product growth rate for 2010 reflected overall economic expansion, the road to that ultimate performance was, to say the least, bumpy and filled with anxiety.
The Great Recession may have been officially over in June 2009, but its effects still lingered, and the general consensus seemed to be that U.S. economic and employment growth will be tepid for a while. Unemployment climbed to a 9.8% peak before ending the Funds’ fiscal year at 8.9%; an improvement, certainly, but still an elevated level that accounts for considerable slack in the economy.1
Not all indicators moved in the same direction and at the same speed. While optimism among investors, economists and business leaders in the U.S. was beginning to firm up, a crisis of confidence in the eurozone erupted and undermined global equity markets throughout the summer. Investors worried about sovereign debt defaults and their potential effects on global economic growth. By the end of 2010, those fears had diminished, but the eurozone’s economic situation remained fragile.
In the U.S., the nascent economic recovery lacked momentum, so the Federal Reserve Board (Fed) embarked on a second round of economic stimulus using quantitative easing, or QE2, which comprised mostly more aggressive purchases of U.S. Treasury long-dated bonds. The Fed’s goal was to spur economic growth
1. Source: Bureau of Labor Statistics.
NOT FDIC INSURED | MAY LOSE VALUE | NO BANK GUARANTEE
Not part of the annual report | 1
Annual Report
Municipal Bond Market Overview
For the 12 months ended February 28, 2011, the municipal bond market posted a mild gain of 1.72% as measured by the Barclays Capital (BC) Municipal Bond Index, which tracks investment-grade municipal securities.1 The gain was noteworthy considering the same index endured a record five consecutive months of negative total returns from September 2010 through January 2011. In comparison during the same period, Treasuries returned +3.71%, according to the BC U.S. Treasury Index, which tracks various U.S. Treasury securities.1
For the first six months of the reporting period municipal bond performance was robust, supported by strong investor demand and generally low interest rates resulting in part from the Federal Reserve Board’s (Fed’s) accommodative stance. The market also benefited from lower-than-normal tax-exempt issuance due to the Build America Bonds (BAB) program. The BAB program allowed municipal issuers to sell their bonds in the taxable market and take advantage of a 35% federal government subsidy for all coupon payments made on those municipal bonds. Such taxable bonds, however, are not part of the Funds’ tax-free portfolios. This subsidy enabled municipalities to borrow at significantly lower net yields than they could otherwise obtain in the traditional tax-exempt municipal bond market, which dramatically reduced the supply of new tax-exempt bonds. Of the $433 billion in issuance for the year 2010, $275 billion, or 64%, was in the form of tax-exempt municipal bonds.2 For the year 2008 (prior to the BAB program), municipal issuance totaled $390 billion, with $341 billion, or 88%, in the form of tax-exempt municipal bonds.2
November, December and January were particularly challenging months for many fixed income markets as they pulled back sharply after the Fed announced its intention to implement a second round of quantitative easing (QE2) with a $600 billion bond buying program. During the three-month period the BC Municipal Bond Index: Long Component, which consists of 22-year and longer municipal securities, fell 8.58%, while the BC U.S. Treasury Index: Long Component, which tracks Treasuries with 10-year or longer maturities, dipped 7.07%.1
1. Source: © 2011 Morningstar. All Rights Reserved. The information contained herein: (1) is proprietary to Morningstar and/or its content providers; (2) may not be copied or distributed; and (3) is not warranted to be accurate, complete or timely. Neither Morningstar nor its content providers are responsible for any damages or losses arising from any use of this information. Past performance is no guarantee of future results.
2. Source: Thomson Reuters.
4 | Annual Report
Several factors contributed to municipal bond market weakness:
- The market seemed dissatisfied that the Fed indicated it would target bonds with maturities of 10 years or less, which contributed to a sell-off in bonds with maturities longer than 10 years.
- Some observers felt QE2 was unnecessary and might even ignite inflation, which contributed to weakness in shorter term bonds. The municipal bond market pulled back as yields generally rose. This was exacerbated as market concerns led to investor redemptions, forcing further sell-offs.
According to the Investment Company Institute, cash flows into munici- pal bond mutual funds during the reporting period first turned negative the week of November 10 and worsened in following weeks. - For most of calendar year 2010, market participants had expected the BAB program to be extended beyond 2010, and they began to anticipate a larger-than-normal supply of municipal bonds going into year-end.
This belief waned, however, as Republicans took over the majority of the House of Representatives and did not propose legislation that would continue the program. - Market participants feared municipalities would concentrate their bor- rowing needs in tax-free bonds during 2011 as they no longer had the option of using BABs. During the first two months of 2011, however, new-issue supply in the municipal bond market was almost 50% less than in the first two months of 2010, suggesting the fear of a large tax- exempt supply in 2011 may have been unwarranted.2
- In December, Congress enacted an extension of tax cuts for all Americans, which further reduced demand for tax-exempt municipal bonds.
- Some observers raised concerns about the ability of municipal market borrowers to meet their debt obligations. High-profile and repetitive media coverage of such comments created panic among some investors.
However, counterarguments citing the historically low level of municipal defaults alleviated these fears somewhat.
In February, reduced supply helped drive bond prices higher, and the market turned positive. Although the municipal bond market experienced recent, short-term volatility, we maintained a long-term perspective. In our view, the pullback in yields provided us opportunities to buy high-quality, essential use revenue and general obligation bonds at levels that may enhance the Funds’ income-earning potential.
The foregoing information reflects our analysis and opinions as of February 28, 2011, the end of the reporting period. The information is not a complete analysis of every aspect of any market, country, industry, security or fund. Statements of fact are from sources considered reliable.
Annual Report | 5
Investment Strategy and
Manager’s Discussion
We use a consistent, disciplined strategy in an effort to maximize tax-exempt income for our shareholders by seeking to maintain exposure to higher coupon securities. We generally employ a buy-and-hold approach and invest in securities we believe should provide the most relative value in the market. As we invest during different interest rate environments, each Fund’s portfolio becomes progressively more diversified with a broad range of securities. This broad diversification may help mitigate interest rate risk. We do not use leverage or exotic derivatives, nor do we use hedging techniques that could add volatility and contribute to underperformance in adverse markets. We generally stay fully invested to help maximize income distribution.
The mixture of our value-oriented philosophy of investing primarily for income and a positive-sloping municipal yield curve favored the use of longer term bonds. Consequently, we sought to purchase bonds from 15 to 30 years in maturity with good call features. We intend to maintain our conservative, buy-and-hold investment strategy as we attempt to provide shareholders with high, current, tax-free income.
We invite you to read your Fund report for more detailed performance and portfolio information. Thank you for your participation in Franklin Tax-Free Trust. We look forward to serving your future investment needs.
The foregoing information reflects our analysis, opinions and portfolio holdings as of February 28, 2011, the end of the reporting period. The way we implement our main investment strategies and the resulting portfolio holdings may change depending on factors such as market and economic conditions. These opinions may not be relied upon as investment advice or an offer for a particular security. The information is not a complete analysis of every aspect of any market, country, industry, security or fund. Statements of fact are from sources considered reliable, but the investment manager makes no representation or warranty as to their completeness or accuracy. Although historical performance is no guarantee of future results, these insights may help you understand our investment management philosophy.
6 | Annual Report
Franklin Arizona Tax-Free Income Fund
Your Fund’s Goal and Main Investments: Franklin Arizona Tax-Free Income Fund
seeks to provide as high a level of income exempt from federal and Arizona personal income taxes as is consistent with prudent investment management and preservation of capital by investing at least 80% of its net assets in securities that pay interest free from such taxes.1
Performance data represent past performance, which does not guarantee future results. Investment return and principal value will fluctuate, and you may have a gain or loss when you sell your shares. Current performance may differ from figures shown. Please visit franklintempleton.com or call (800) 342-5236 for most recent month-end performance.
| | |
| Credit Quality Breakdown* | | |
| Franklin Arizona Tax-Free Income Fund | | |
| 2/28/11 | | |
| | % of Total | |
| Ratings | Long-Term Investments** | |
| AAA | 7.3 | % |
| AA | 42.3 | % |
| A | 27.3 | % |
| BBB | 17.6 | % |
| Below Investment Grade | 0.5 | % |
| Not Rated | 5.0 | % |
*Standard & Poor’s (S&P) is used as the primary independent rating agency source, Moody’s is secondary, and Fitch, if available, is used for securities not rated by Moody’s or S&P. The letter ratings are provided to indicate the credit-worthiness of the Fund’s bond holdings and generally range from AAA (highest) to Below Investment Grade (lowest; includes ratings BB to D). STANDARD & POOR’S®, S&P® and S&P 500® are registered trademarks of Standard & Poor’s Financial Services LLC. Standard & Poor’s does not sponsor, endorse, sell or promote any S&P index-based product.
**Does not include short-term investments and other net assets.
This annual report for Franklin Arizona Tax-Free Income Fund covers the fiscal year ended February 28, 2011.
Performance Overview
The Fund’s Class A share price, as measured by net asset value, decreased from $10.78 on February 28, 2010, to $10.30 on February 28, 2011. The Fund’s
1. For investors subject to alternative minimum tax, a small portion of Fund dividends may be taxable. Distributions of capital gains are generally taxable. To avoid imposition of 28% backup withholding on all Fund distributions and redemption proceeds, U.S. investors must be properly certified on Form W-9 and non-U.S. investors on Form W-8BEN.
The dollar value, number of shares or principal amount, and names of all portfolio holdings are listed in the Fund’s Statement of Investments (SOI). The SOI begins on page 99.
Annual Report | 7
| | | | |
| Dividend Distributions* | | | | |
| Franklin Arizona Tax-Free Income Fund | | | |
| | | Dividend per Share | |
| Month | Class A | Class B | Class C | Advisor Class |
| March 2010 | 4.00 cents | 3.49 cents | 3.48 cents | 4.09 cents |
| April 2010 | 4.00 cents | 3.49 cents | 3.48 cents | 4.09 cents |
| May 2010 | 4.00 cents | 3.49 cents | 3.48 cents | 4.09 cents |
| June 2010 | 4.00 cents | 3.53 cents | 3.50 cents | 4.09 cents |
| July 2010 | 4.00 cents | 3.53 cents | 3.50 cents | 4.09 cents |
| August 2010 | 4.00 cents | 3.53 cents | 3.50 cents | 4.09 cents |
| September 2010 | 4.00 cents | 3.50 cents | 3.50 cents | 4.09 cents |
| October 2010 | 3.94 cents | 3.44 cents | 3.44 cents | 4.03 cents |
| November 2010 | 3.90 cents | 3.40 cents | 3.40 cents | 3.99 cents |
| December 2010 | 3.90 cents | 3.39 cents | 3.37 cents | 3.99 cents |
| January 2011 | 3.90 cents | 3.39 cents | 3.37 cents | 3.99 cents |
| February 2011 | 3.90 cents | 3.39 cents | 3.37 cents | 3.99 cents |
*Assumes shares were purchased and held for the entire accrual period, which differs from the calendar month. Since dividends accrue daily, your actual distributions will vary depending on the date you purchased your shares and any account activity. All Fund distributions will vary depending upon current market conditions, and past distributions are not indicative of future trends.
Class A shares paid dividends totaling 47.82 cents per share for the same period.2 The Performance Summary beginning on page 11 shows that at the end of this reporting period the Fund’s Class A shares’ distribution rate was 4.44% based on an annualization of the current 3.98 cent per share dividend and the maximum offering price of $10.76 on February 28, 2011. An investor in the 2011 maximum combined effective federal and Arizona personal income tax bracket of 37.95% would need to earn a distribution rate of 7.16% from a taxable investment to match the Fund’s Class A tax-free distribution rate. For the Fund’s Class B, C and Advisor shares’ performance, please see the Performance Summary. Dividend distributions during the year under review were affected by securities purchased in the prior period and by falling municipal bond rates in 2009 through November 2010. In addition, for most of the Fund’s fiscal year, investor demand was strong for municipal bonds in an environment of limited tax-exempt supply. These factors resulted in reduced income for the portfolio and caused dividends to decline.
2. All Fund distributions will vary depending upon current market conditions, and past distributions are not indicative of future trends.
8 | Annual Report
State Update
After years of strong growth that outpaced the national average, Arizona’s economy slowed significantly. As the country began to recover from the Great Recession, so did Arizona, but at a slower, more uneven pace. Toward period-end, some areas of the state’s economy showed improvement, but a weak housing market and a foreclosure rate that ranked among the nation’s highest continued to take its toll. Job losses in the construction and financial activities sectors persisted, but were offset by gains in the education and health services sector and leisure and hospitality sector. Although Arizona’s unemployment rate declined from the 26-year high of 10.4% set in November and December 2009 to 9.6% in February 2011, it remained higher than the 8.9% national rate.3 Arizona’s strong population growth benefited its economy and finances but pressured state services such as education, public safety, and health and human services.
During the annual reporting period, Arizona weathered significant financial challenges that included weak revenue performance, significant budget deficits and imbalance, and tightening liquidity. Four continuous years of revenue declines have depleted reserves as the state struggled to balance its budget. The initial 2011 budget enacted in March 2010 had an estimated gap of more than $3 billion that was closed with spending cuts and significant use of one-time solutions, including federal stimulus funds, deficit bond issuance, and three ballot measures that were voted upon in November 2010.4 Two of the ballot measures failed, requiring a midyear budget revision; the proposed solution was based on further one-time measures that included a loan from the First Things First program, deferral of education payments, and reallocation of federal job funds to K-12 education. Voters passed a ballot measure for a 1% sales tax increase for three years, which should provide additional annual revenue estimated at more than $900 million.4
Arizona does not issue general obligation bonds but instead issues appropriation-backed lease debt and revenue bonds. The state’s debt levels remained near national state debt medians, with state net tax-supported debt at 2.3% of personal income and $736 per capita, compared with the 2.5% and $936 national medians.5 Debt levels were expected to increase as the state issued additional bonds for 2011 budget relief. In February 2011, independent credit
3. Source: Bureau of Labor Statistics.
4. Source: Moody’s Investors Service, “Rating Update: Moody’s Changes Arizona’s Outlook to Negative from Stable; Aa3 Issuer Rating and Ratings on State Appropriation-Backed Debt and Certificates of Participation Affirmed,” 2/9/11.
5. Source: Moody’s Investors Service, “Special Comment: 2010 State Debt Medians Report,” May 2010.
Annual Report | 9
| | |
| Portfolio Breakdown | | |
| Franklin Arizona Tax-Free Income Fund | |
| 2/28/11 | | |
| % of Total | |
| Long-Term Investments* | |
| Utilities | 21.6 | % |
| Hospital & Health Care | 19.5 | % |
| Higher Education | 11.8 | % |
| Subject to Government Appropriations | 10.7 | % |
| Other Revenue | 9.8 | % |
| Refunded | 8.5 | % |
| Tax-Supported | 7.4 | % |
| Transportation | 5.4 | % |
| General Obligation | 4.6 | % |
| Housing | 0.7 | % |
| |
| *Does not include short-term investments and other | |
| net assets. | | |
rating agency Moody’s Investors Service affirmed Arizona’s issuer rating of Aa3 and changed the state’s outlook from stable to negative.6 The rating reflected Arizona’s moderate but increasing debt levels, significant reliance on nonrecur-ring resources to balance state budgets, slower revenue growth and tightened liquidity. However, Moody’s also cited the state’s prospects for long-term economic growth that could again outpace the nation’s and a pension-funded ratio higher than the national state median. The negative outlook reflected the challenges the state will face as it enters fiscal year 2012 when federal stimulus programs expire. To balance the budget, state officials may try to rely heavily on a potential law change or a Medicaid support waiver, given the reduced capacity for expenditure reductions and constitutional limitations on financial flexibility. Due to the significant housing market downturn, Moody’s projected that economic recovery in Arizona could take longer than in most states.
Manager’s Discussion
We used various investment strategies during the 12 months under review as we sought to maximize tax-free income for shareholders. Please read the discussion on page 6 for details.
Thank you for your continued participation in Franklin Arizona Tax-Free Income Fund. We intend to maintain our conservative, buy-and-hold investment strategy as we attempt to provide shareholders with high, current, tax-free income.
The foregoing information reflects our analysis, opinions and portfolio holdings as of February 28, 2011, the end of the reporting period. The way we implement our main investment strategies and the resulting portfolio holdings may change depending on factors such as market and economic conditions. These opinions may not be relied upon as investment advice or an offer for a particular security. The information is not a complete analysis of every aspect of any market, state, industry, security or the Fund. Statements of fact are from sources considered reliable, but the investment manager makes no representation or warranty as to their completeness or accuracy. Although historical performance is no guarantee of future results, these insights may help you understand our investment management philosophy.
6. This does not indicate Moody’s rating of the Fund.
10 | Annual Report
Performance Summary as of 2/28/11
Franklin Arizona Tax-Free Income Fund
Your dividend income will vary depending on dividends or interest paid by securities in the Fund’s portfolio, adjusted for operating expenses of each class. Capital gain distributions are net profits realized from the sale of portfolio securities. The performance table and graphs do not reflect any taxes that a shareholder would pay on Fund dividends, capital gain distributions, if any, or any realized gains on the sale of Fund shares. Total return reflects reinvestment of the Fund’s dividends and capital gain distributions, if any, and any unrealized gains or losses.
| | | | | | | | |
| Price and Distribution Information | | | | | | |
| Class A (Symbol: FTAZX) | | | | Change | | 2/28/11 | | 2/28/10 |
| Net Asset Value (NAV) | | | -$ | 0.48 | $ | 10.30 | $ | 10.78 |
| Distributions (3/1/10–2/28/11) | | | | | | | | |
| Dividend Income | $ | 0.4782 | | | | | | |
| Class B (Symbol: FBAZX) | | | | Change | | 2/28/11 | | 2/28/10 |
| Net Asset Value (NAV) | | | -$ | 0.48 | $ | 10.37 | $ | 10.85 |
| Distributions (3/1/10–2/28/11) | | | | | | | | |
| Dividend Income | $ | 0.4184 | | | | | | |
| Class C (Symbol: FAZIX) | | | | Change | | 2/28/11 | | 2/28/10 |
| Net Asset Value (NAV) | | | -$ | 0.47 | $ | 10.44 | $ | 10.91 |
| Distributions (3/1/10–2/28/11) | | | | | | | | |
| Dividend Income | $ | 0.4166 | | | | | | |
| Advisor Class (Symbol: n/a) | | | | Change | | 2/28/11 | | 2/28/10 |
| Net Asset Value (NAV) | | | -$ | 0.48 | $ | 10.32 | $ | 10.80 |
| Distributions (3/1/10–2/28/11) | | | | | | | | |
| Dividend Income | $ | 0.4891 | | | | | | |
Annual Report | 11
Performance Summary (continued)
Performance
Cumulative total return excludes sales charges. Average annual total returns include maximum sales charges. Class A: 4.25% maximum initial sales charge; Class B: contingent deferred sales charge (CDSC) declining from 4% to 1% over six years, and eliminated thereafter; Class C: 1% CDSC in first year only; Advisor Class: no sales charges.
| | | | | | | | | | | |
| Class A | | | | 1-Year | | | 5-Year | | | 10-Year | |
| Cumulative Total Return1 | | | | -0.09 | % | + | 15.97 | % | + | 50.43 | % |
| Average Annual Total Return2 | | | | -4.34 | % | + | 2.12 | % | + | 3.72 | % |
| Avg. Ann. Total Return (3/31/11)3 | | | | -4.68 | % | + | 2.19 | % | + | 3.61 | % |
| Distribution Rate4 | 4.44 | % | | | | | | | | | |
| Taxable Equivalent Distribution Rate5 | 7.16 | % | | | | | | | | | |
| 30-Day Standardized Yield6 | 4.21 | % | | | | | | | | | |
| Taxable Equivalent Yield5 | 6.78 | % | | | | | | | | | |
| Total Annual Operating Expenses7 | 0.63 | % | | | | | | | | | |
| Class B | | | | 1-Year | | | 5-Year | | | 10-Year | |
| Cumulative Total Return1 | | | | -0.64 | % | + | 12.85 | % | + | 44.15 | % |
| Average Annual Total Return2 | | | | -4.46 | % | + | 2.11 | % | + | 3.72 | % |
| Avg. Ann. Total Return (3/31/11)3 | | | | -4.77 | % | + | 2.19 | % | + | 3.61 | % |
| Distribution Rate4 | 4.10 | % | | | | | | | | | |
| Taxable Equivalent Distribution Rate5 | 6.61 | % | | | | | | | | | |
| 30-Day Standardized Yield6 | 3.85 | % | | | | | | | | | |
| Taxable Equivalent Yield5 | 6.20 | % | | | | | | | | | |
| Total Annual Operating Expenses7 | 1.17 | % | | | | | | | | | |
| Class C | | | | 1-Year | | | 5-Year | | | 10-Year | |
| Cumulative Total Return1 | | | | -0.56 | % | + | 12.94 | % | + | 42.75 | % |
| Average Annual Total Return2 | | | | -1.51 | % | + | 2.46 | % | + | 3.62 | % |
| Avg. Ann. Total Return (3/31/11)3 | | | | -1.92 | % | + | 2.55 | % | + | 3.50 | % |
| Distribution Rate4 | 4.06 | % | | | | | | | | | |
| Taxable Equivalent Distribution Rate5 | 6.54 | % | | | | | | | | | |
| 30-Day Standardized Yield6 | 3.85 | % | | | | | | | | | |
| Taxable Equivalent Yield5 | 6.20 | % | | | | | | | | | |
| Total Annual Operating Expenses7 | 1.18 | % | | | | | | | | | |
| Advisor Class8 | | | | 1-Year | | | 5-Year | | | 10-Year | |
| Cumulative Total Return1 | | | + | 0.02 | % | + | 16.48 | % | + | 51.10 | % |
| Average Annual Total Return2 | | | + | 0.02 | % | + | 3.10 | % | + | 4.21 | % |
| Avg. Ann. Total Return (3/31/11)3 | | | | -0.32 | % | + | 3.18 | % | + | 4.11 | % |
| Distribution Rate4 | 4.72 | % | | | | | | | | | |
| Taxable Equivalent Distribution Rate5 | 7.61 | % | | | | | | | | | |
| 30-Day Standardized Yield6 | 4.48 | % | | | | | | | | | |
| Taxable Equivalent Yield5 | 7.22 | % | | | | | | | | | |
| Total Annual Operating Expenses7 | 0.53 | % | | | | | | | | | |
Performance data represent past performance, which does not guarantee future results. Investment return and principal value will fluctuate, and you may have a gain or loss when you sell your shares. Current performance may differ from figures shown. For most recent month-end performance, go to franklintempleton.com or call (800) 342-5236.
12 | Annual Report
Performance Summary (continued)
Total Return Index Comparison for a Hypothetical $10,000 Investment
Total return represents the change in value of an investment over the periods shown. It includes any current, applicable, maximum sales charge, Fund expenses, account fees and reinvested distributions. The unmanaged index includes reinvestment of any income or distributions. It differs from the Fund in composition and does not pay management fees or expenses. One cannot invest directly in an index.

Annual Report | 13

| | | | | |
| 3/01 | 2/03 | 2/05 | 2/07 | 2/09 | 2/11 |
| Franklin Arizona Tax-Free Income Fund | BC Municipal Bond Index 9 | CPI9 |
14 | Annual Report
Performance Summary (continued)
Endnotes
Because municipal bonds are sensitive to interest rate movements, the Fund’s yield and share price will fluctuate with market conditions. Bond prices generally move in the opposite direction of interest rates. Thus, as prices of bonds in the Fund adjust to a rise in interest rates, the Fund’s share price may decline. Since the Fund concentrates its investments in a single state, it is subject to greater risk of adverse economic and regulatory changes in that state than a geographically diversified fund. The manager applies various techniques and analyses in making investment decisions for the Fund, but there can be no guarantee that these decisions will produce the desired results. The Fund’s prospectus also includes a description of the main investment risks.
| |
| Class B: | These shares have higher annual fees and expenses than Class A shares. |
| Class C: | Prior to 1/1/04, these shares were offered with an initial sales charge; thus actual total returns would have differed. These shares |
| | have higher annual fees and expenses than Class A shares. |
| Advisor Class: | Shares are available to certain eligible investors as described in the prospectus. |
1. Cumulative total return represents the change in value of an investment over the periods indicated.
2. Average annual total return represents the average annual change in value of an investment over the periods indicated.
3. In accordance with SEC rules, we provide standardized average annual total return information through the latest calendar quarter.
4. Distribution rate is based on an annualization of the respective class’s current monthly dividend and the maximum offering price (NAV for Classes B, C and Advisor) per share on 2/28/11.
5. Taxable equivalent distribution rate and yield assume the published rates as of 12/28/10 for the maximum combined effective federal and Arizona personal income tax rate of 37.95%, based on the federal income tax rate of 35.00%.
6. The 30-day standardized yield for the month ended 2/28/11 reflects an estimated yield to maturity (assuming all portfolio securities are held to maturity). It should be regarded as an estimate of the Fund’s rate of investment income, and it may not equal the Fund’s actual income distribution rate (which reflects the Fund’s past dividends paid to shareholders) or the income reported in the Fund’s financial statements.
7. Figures are as stated in the Fund’s prospectus current as of the date of this report. In periods of market volatility, assets may decline significantly, causing total annual Fund operating expenses to become higher than the figures shown.
8. Effective 7/1/08, the Fund began offering Advisor Class shares, which do not have sales charges or a Rule 12b-1 plan. Performance quotations for this class reflect the following methods of calculation: (a) For periods prior to 7/1/08, a restated figure is used based upon the Fund’s Class A performance, excluding the effect of Class A’s maximum initial sales charge, but reflecting the effect of the Class A Rule 12b-1 fees; and (b) for periods after 6/30/08, actual Advisor Class performance is used reflecting all charges and fees applicable to that class. Since 7/1/08 (commencement of sales), the cumulative and average annual total returns of Advisor Class shares were +9.75% and +3.55%.
9. Source: © 2011 Morningstar. The BC Municipal Bond Index is a market value-weighted index engineered for the long-term tax-exempt bond market. To be included in the index, bonds must be fixed rate, have at least one year to final maturity and be rated investment grade (Baa3/BBB-or higher) by at least two of the following agencies: Moody’s, Standard & Poor’s and Fitch. The Consumer Price Index (CPI), calculated by the U.S. Bureau of Labor Statistics, is a commonly used measure of the inflation rate.
Annual Report | 15
Your Fund’s Expenses
Franklin Arizona Tax-Free Income Fund
As a Fund shareholder, you can incur two types of costs:
- Transaction costs, including sales charges (loads) on Fund purchases; and
- Ongoing Fund costs, including management fees, distribution and service (12b-1) fees, and other Fund expenses. All mutual funds have ongoing costs, sometimes referred to as operating expenses.
The following table shows ongoing costs of investing in the Fund and can help you understand these costs and compare them with those of other mutual funds. The table assumes a $1,000 investment held for the 12 months indicated.
Actual Fund Expenses
The first line (Actual) for each share class listed in the table provides actual account values and expenses. The “Ending Account Value” is derived from the Fund’s actual return, which includes the effect of Fund expenses.
You can estimate the expenses you paid during the period, by following these steps. Of course, your account value and expenses will differ from those in this illustration:
| 1. | Divide your account value by $1,000. |
| | If an account had an $8,600 value, then $8,600 ÷ $1,000 = 8.6. |
| 2. | Multiply the result by the number under the heading “Expenses Paid During Period.” |
| | If Expenses Paid During Period were $7.50, then 8.6 x $7.50 = $64.50. |
In this illustration, the estimated expenses paid this period are $64.50.
Hypothetical Example for Comparison with Other Funds
Information in the second line (Hypothetical) for each class in the table can help you compare ongoing costs of investing in the Fund with those of other mutual funds. This information may not be used to estimate the actual ending account balance or expenses you paid during the period. The hypothetical “Ending Account Value” is based on the actual expense ratio for each class and an assumed 5% annual rate of return before expenses, which does not represent the Fund’s actual return. The figure under the heading “Expenses Paid During Period” shows the hypothetical expenses your account would have incurred under this scenario. You can compare this figure with the 5% hypothetical examples that appear in shareholder reports of other funds.
16 | Annual Report
Your Fund’s Expenses (continued)
Please note that expenses shown in the table are meant to highlight ongoing costs and do not reflect any transaction costs, such as sales charges. Therefore, the second line for each class is useful in comparing ongoing costs only, and will not help you compare total costs of owning different funds. In addition, if transaction costs were included, your total costs would have been higher. Please refer to the Fund prospectus for additional information on operating expenses.
| | | | | | |
| | | Beginning Account | | Ending Account | | Expenses Paid During |
| Class A | | Value 9/1/10 | | Value 2/28/11 | | Period* 9/1/10–2/28/11 |
| Actual | $ | 1,000 | $ | 947.90 | $ | 3.04 |
| Hypothetical (5% return before expenses) | $ | 1,000 | $ | 1,021.67 | $ | 3.16 |
| Class B | | | | | | |
| Actual | $ | 1,000 | $ | 945.60 | $ | 5.64 |
| Hypothetical (5% return before expenses) | $ | 1,000 | $ | 1,018.99 | $ | 5.86 |
| Class C | | | | | | |
| Actual | $ | 1,000 | $ | 945.90 | $ | 5.69 |
| Hypothetical (5% return before expenses) | $ | 1,000 | $ | 1,018.94 | $ | 5.91 |
| Advisor Class | | | | | | |
| Actual | $ | 1,000 | $ | 948.50 | $ | 2.56 |
| Hypothetical (5% return before expenses) | $ | 1,000 | $ | 1,022.17 | $ | 2.66 |
*Expenses are calculated using the most recent six-month expense ratio, annualized for each class (A: 0.63%; B: 1.17%; C: 1.18%; and Advisor: 0.53%), multiplied by the average account value over the period, multiplied by 181/365 to reflect the one-half year period.
Annual Report | 17
Franklin Colorado Tax-Free Income Fund
Your Fund’s Goal and Main Investments: Franklin Colorado Tax-Free Income Fund seeks to provide as high a level of income exempt from federal and Colorado personal income taxes as is consistent with prudent investment management and preservation of capital by investing at least 80% of its net assets in securities that pay interest free from such taxes.1
Performance data represent past performance, which does not guarantee future results. Investment return and principal value will fluctuate, and you may have a gain or loss when you sell your shares. Current performance may differ from figures shown. Please visit franklintempleton.com or call (800) 342-5236 for most recent month-end performance.
| | |
| Credit Quality Breakdown* | | |
| Franklin Colorado Tax-Free Income Fund | | |
| 2/28/11 | | |
| | % of Total | |
| Ratings | Long-Term Investments** | |
| AAA | 0.9 | % |
| AA | 41.8 | % |
| A | 30.6 | % |
| BBB | 21.6 | % |
| Not Rated | 5.1 | % |
*Standard & Poor’s (S&P) is used as the primary independent rating agency source, Moody’s is secondary, and Fitch, if available, is used for securities not rated by Moody’s or S&P. The letter ratings are provided to indicate the credit-worthiness of the Fund’s bond holdings and generally range from AAA (highest) to Below Investment Grade (lowest; includes ratings BB to D).
**Does not include short-term investments and other net assets.
This annual report for Franklin Colorado Tax-Free Income Fund covers the fiscal year ended February 28, 2011.
Performance Overview
The Fund’s Class A share price, as measured by net asset value, decreased from $11.65 on February 28, 2010, to $11.09 on February 28, 2011. The Fund’s Class A shares paid dividends totaling 50.57 cents per share for the same period.2 The Performance Summary beginning on page 22 shows that at the
1. For investors subject to alternative minimum tax, a small portion of Fund dividends may be taxable. Distributions of capital gains are generally taxable. To avoid imposition of 28% backup withholding on all Fund distributions and redemption proceeds, U.S. investors must be properly certified on Form W-9 and non-U.S. investors on Form W-8BEN.
2. All Fund distributions will vary depending upon current market conditions, and past distributions are not indicative of future trends.
The dollar value, number of shares or principal amount, and names of all portfolio holdings are listed in the Fund’s Statement of Investments (SOI). The SOI begins on page 108.
18 | Annual Report
| | | |
| Dividend Distributions* | | | |
| Franklin Colorado Tax-Free Income Fund | | | |
| | | Dividend per Share |
| Month | Class A | Class C | Advisor Class |
| March 2010 | 4.25 cents | 3.69 cents | 4.35 cents |
| April 2010 | 4.25 cents | 3.69 cents | 4.35 cents |
| May 2010 | 4.25 cents | 3.69 cents | 4.35 cents |
| June 2010 | 4.20 cents | 3.67 cents | 4.30 cents |
| July 2010 | 4.20 cents | 3.67 cents | 4.30 cents |
| August 2010 | 4.20 cents | 3.67 cents | 4.30 cents |
| September 2010 | 4.20 cents | 3.65 cents | 4.29 cents |
| October 2010 | 4.17 cents | 3.62 cents | 4.26 cents |
| November 2010 | 4.13 cents | 3.58 cents | 4.22 cents |
| December 2010 | 4.13 cents | 3.56 cents | 4.23 cents |
| January 2011 | 4.13 cents | 3.56 cents | 4.23 cents |
| February 2011 | 4.13 cents | 3.56 cents | 4.23 cents |
*Assumes shares were purchased and held for the entire accrual period, which differs from the calendar month. Since dividends accrue daily, your actual distributions will vary depending on the date you purchased your shares and any account activity. All Fund distributions will vary depending upon current market conditions, and past distributions are not indicative of future trends.
end of this reporting period the Fund’s Class A shares’ distribution rate was 4.46% based on an annualization of the current 4.30 cent per share dividend and the maximum offering price of $11.58 on February 28, 2011. An investor in the 2011 maximum combined effective federal and Colorado personal income tax bracket of 38.01% would need to earn a distribution rate of 7.19% from a taxable investment to match the Fund’s Class A tax-free distribution rate. For the Fund’s Class C and Advisor shares’ performance, please see the Performance Summary. Dividend distributions during the year under review were affected by securities purchased in the prior period and by falling municipal bond rates in 2009 through November 2010. In addition, for most of the Fund’s fiscal year, investor demand was strong for municipal bonds in an environment of limited tax-exempt supply. These factors resulted in reduced income for the portfolio and caused dividends to decline.
State Update
Colorado’s broad and diverse economy continued to outpace the national economy as it recovered from the recession. Statewide income levels, retail trade and per capita retail spending were above national averages. The housing market showed signs of stabilization after four years of declining residential permit activity. The state’s relatively strong economy continued to attract net
Annual Report | 19
| | |
| Portfolio Breakdown | | |
| Franklin Colorado Tax-Free Income Fund | |
| 2/28/11 | | |
| % of Total | |
| Long-Term Investments* | |
| Hospital & Health Care | 20.0 | % |
| Utilities | 16.8 | % |
| Tax-Supported | 15.8 | % |
| Higher Education | 12.0 | % |
| Refunded | 10.1 | % |
| Subject to Government Appropriations | 9.2 | % |
| General Obligation | 6.5 | % |
| Other Revenue | 4.6 | % |
| Transportation | 3.8 | % |
| Housing | 1.2 | % |
| |
| *Does not include short-term investments and other | |
| net assets. | | |
in-migration, which resulted in a significant working-age population and income levels higher than the national average. The construction, information and financial activities sectors lost jobs, while the education and health services, mining and logging, and leisure and hospitality sectors added jobs. In February 2011, the state’s unemployment rate rose to a historical high of 9.3%, compared with the 8.9% national rate.3
Fiscal year 2010 was challenging for Colorado as revenues continued to decline, although at a slower pace than in fiscal year 2009. Quarterly forecasts and preliminary actual results for fiscal year 2010 were revised downward, and the state implemented budgetary actions that included spending cuts, use of federal stimulus funds and suspension of certain tax exemptions. The state’s timely actions to address fiscal year 2010 revenue declines resulted in a 2.9% general fund reserve, which was well above its 2.0% requirement.4 The fiscal year 2011 budget has been adjusted several times since it was enacted, despite the state’s initial projection of a modest revenue recovery, due to weak employment and income figures, modest sales and use tax growth and only slightly declining corporate tax revenues. In December 2010, the Office of State Planning and Budgeting revised its projected 2011 gross general fund revenues to $6.8 billion, a 5.7% increase over fiscal year 2010.4 Officials attributed the overall improved projection to increases in individual income, sales and use tax revenues. Changes in state tax exemptions, laws and accounting rules were projected to contribute to revenue. In February 2011, the governor submitted a revised budget package to the Joint Budget Committee that included general fund revenue and expenditure reductions to meet the new 4.0% reserve requirement.5
Colorado’s constitution prohibits the state from issuing general obligation debt, which resulted in very low debt levels. Colorado’s net tax-supported debt was $400 per capita and 1.0% of personal income, compared with the $936 and 2.5% national medians.6 Independent credit rating agency Standard & Poor’s assigned Colorado an issuer rating of AA with a stable outlook.7 The rating and outlook reflected the state’s relatively strong economic fundamentals despite the challenging national economic environment and financial performance that led to strong cash reserves at the state’s fiscal year-end. The outlook also recognized the state’s financial flexibility and willingness to revise its budget as revenues slowed or declined.
|
| 3. Source: Bureau of Labor Statistics. |
| 4. Source: Office of State Planning and Budgeting, “December 2010 Revenue Forecast,” 12/20/10. |
| 5. Source: Office of the Governor, “Governor Hickenlooper’s Budget Package for FY2010-11 and FY2011-12,” 2/15/11. |
| 6. Source: Moody’s Investors Service, “Special Comment: 2010 State Debt Medians Report,” May 2010. |
| 7. This does not indicate Standard & Poor’s rating of the Fund. |
20 | Annual Report
Manager’s Discussion
We used various investment strategies during the 12 months under review as we sought to maximize tax-free income for shareholders. Please read the discussion on page 6 for details.
Thank you for your continued participation in Franklin Colorado Tax-Free Income Fund. We intend to maintain our conservative, buy-and-hold investment strategy as we attempt to provide shareholders with high, current, tax-free income.
The foregoing information reflects our analysis, opinions and portfolio holdings as of February 28, 2011, the end of the reporting period. The way we implement our main investment strategies and the resulting portfolio holdings may change depending on factors such as market and economic conditions. These opinions may not be relied upon as investment advice or an offer for a particular security. The information is not a complete analysis of every aspect of any market, state, industry, security or the Fund. Statements of fact are from sources considered reliable, but the investment manager makes no representation or warranty as to their completeness or accuracy. Although historical performance is no guarantee of future results, these insights may help you understand our investment management philosophy.
Annual Report | 21
Performance Summary as of 2/28/11
Franklin Colorado Tax-Free Income Fund
Your dividend income will vary depending on dividends or interest paid by securities in the Fund’s portfolio, adjusted for operating expenses of each class. Capital gain distributions are net profits realized from the sale of portfolio securities. The performance table and graphs do not reflect any taxes that a shareholder would pay on Fund dividends, capital gain distributions, if any, or any realized gains on the sale of Fund shares. Total return reflects reinvestment of the Fund’s dividends and capital gain distributions, if any, and any unrealized gains or losses.
| | | | | | | | |
| Price and Distribution Information | | | | | | |
| Class A (Symbol: FRCOX) | | | | Change | | 2/28/11 | | 2/28/10 |
| Net Asset Value (NAV) | | | -$ | 0.56 | $ | 11.09 | $ | 11.65 |
| Distributions (3/1/10–2/28/11) | | | | | | | | |
| Dividend Income | $ | 0.5057 | | | | | | |
| Class C (Symbol: FCOIX) | | | | Change | | 2/28/11 | | 2/28/10 |
| Net Asset Value (NAV) | | | -$ | 0.56 | $ | 11.20 | $ | 11.76 |
| Distributions (3/1/10–2/28/11) | | | | | | | | |
| Dividend Income | $ | 0.4392 | | | | | | |
| Advisor Class (Symbol: FCOZX) | | | | Change | | 2/28/11 | | 2/28/10 |
| Net Asset Value (NAV) | | | -$ | 0.56 | $ | 11.09 | $ | 11.65 |
| Distributions (3/1/10–2/28/11) | | | | | | | | |
| Dividend Income | $ | 0.5174 | | | | | | |
22 | Annual Report
Performance Summary (continued)
Performance
Cumulative total return excludes sales charges. Average annual total returns include maximum sales charges. Class A: 4.25% maximum initial sales charge; Class C: 1% contingent deferred sales charge in first year only; Advisor Class: no sales charges.
| | | | | | | | | | |
| Class A | | | 1-Year | | | 5-Year | | | 10-Year | |
| Cumulative Total Return1 | | | -0.55 | % | + | 14.97 | % | + | 49.90 | % |
| Average Annual Total Return2 | | | -4.80 | % | + | 1.95 | % | + | 3.68 | % |
| Avg. Ann. Total Return (3/31/11)3 | | | -5.59 | % | + | 1.96 | % | + | 3.54 | % |
| Distribution Rate4 | 4.46 | % | | | | | | | | |
| Taxable Equivalent Distribution Rate5 | 7.19 | % | | | | | | | | |
| 30-Day Standardized Yield6 | 4.21 | % | | | | | | | | |
| Taxable Equivalent Yield5 | 6.79 | % | | | | | | | | |
| Total Annual Operating Expenses7 | 0.66 | % | | | | | | | | |
| Class C | | | 1-Year | | | 5-Year | | | 10-Year | |
| Cumulative Total Return1 | | | -1.11 | % | + | 11.90 | % | + | 42.07 | % |
| Average Annual Total Return2 | | | -2.06 | % | + | 2.27 | % | + | 3.57 | % |
| Avg. Ann. Total Return (3/31/11)3 | | | -2.94 | % | + | 2.29 | % | + | 3.42 | % |
| Distribution Rate4 | 4.08 | % | | | | | | | | |
| Taxable Equivalent Distribution Rate5 | 6.58 | % | | | | | | | | |
| 30-Day Standardized Yield6 | 3.85 | % | | | | | | | | |
| Taxable Equivalent Yield5 | 6.21 | % | | | | | | | | |
| Total Annual Operating Expenses7 | 1.21 | % | | | | | | | | |
| Advisor Class8 | | | 1-Year | | | 5-Year | | | 10-Year | |
| Cumulative Total Return1 | | | -0.45 | % | + | 15.16 | % | + | 50.14 | % |
| Average Annual Total Return2 | | | -0.45 | % | + | 2.86 | % | + | 4.15 | % |
| Avg. Ann. Total Return (3/31/11)3 | | | -1.27 | % | + | 2.88 | % | + | 4.01 | % |
| Distribution Rate4 | 4.76 | % | | | | | | | | |
| Taxable Equivalent Distribution Rate5 | 7.68 | % | | | | | | | | |
| 30-Day Standardized Yield6 | 4.50 | % | | | | | | | | |
| Taxable Equivalent Yield5 | 7.26 | % | | | | | | | | |
| Total Annual Operating Expenses7 | 0.56 | % | | | | | | | | |
Performance data represent past performance, which does not guarantee future results. Investment return and principal value will fluctuate, and you may have a gain or loss when you sell your shares. Current performance may differ from figures shown. For most recent month-end performance, go to franklintempleton.com or call (800) 342-5236.
Annual Report | 23
Performance Summary (continued)
Total Return Index Comparison for a Hypothetical $10,000 Investment
Total return represents the change in value of an investment over the periods shown. It includes any current, applicable, maximum sales charge, Fund expenses, account fees and reinvested distributions. The unmanaged index includes reinvestment of any income or distributions. It differs from the Fund in composition and does not pay management fees or expenses. One cannot invest directly in an index.

| | | | | |
| 3/01 | 2/03 | 2/05 | 2/07 | 2/09 | 2/11 |
| |
| |
| Franklin Colorado | | BC Municipal Bond Index 9 | | CPI9 |
| Tax-Free Income Fund | | | | |
24 | Annual Report
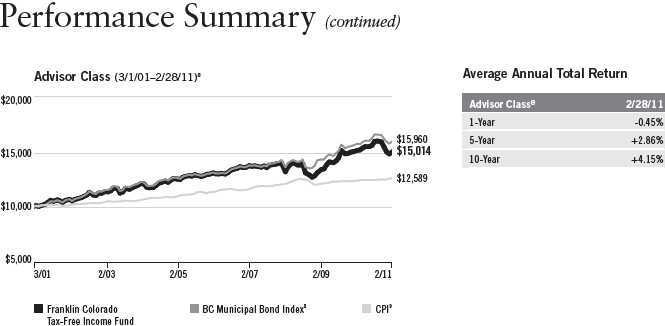
Annual Report | 25
Performance Summary (continued)
Endnotes
Because municipal bonds are sensitive to interest rate movements, the Fund’s yield and share price will fluctuate with market conditions. Bond prices generally move in the opposite direction of interest rates. Thus, as prices of bonds in the Fund adjust to a rise in interest rates, the Fund’s share price may decline. Since the Fund concentrates its investments in a single state, it is subject to greater risk of adverse economic and regulatory changes in that state than a geographically diversified fund. The manager applies various techniques and analyses in making investment decisions for the Fund, but there can be no guarantee that these decisions will produce the desired results. The Fund’s prospectus also includes a description of the main investment risks.
| |
| Class C: | Prior to 1/1/04, these shares were offered with an initial sales charge; thus actual total returns would have differed. These shares |
| | have higher annual fees and expenses than Class A shares. |
| |
| Advisor Class: | Shares are available to certain eligible investors as described in the prospectus. |
1. Cumulative total return represents the change in value of an investment over the periods indicated.
2. Average annual total return represents the average annual change in value of an investment over the periods indicated.
3. In accordance with SEC rules, we provide standardized average annual total return information through the latest calendar quarter.
4. Distribution rate is based on an annualization of the respective class’s current monthly dividend and the maximum offering price (NAV for Classes C and Advisor) per share on 2/28/11.
5. Taxable equivalent distribution rate and yield assume the published rates as of 12/28/10 for the maximum combined effective federal and Colorado personal income tax rate of 38.01%, based on the federal income tax rate of 35.00%.
6. The 30-day standardized yield for the month ended 2/28/11 reflects an estimated yield to maturity (assuming all portfolio securities are held to maturity). It should be regarded as an estimate of the Fund’s rate of investment income, and it may not equal the Fund’s actual income distribution rate (which reflects the Fund’s past dividends paid to shareholders) or the income reported in the Fund’s financial statements.
7. Figures are as stated in the Fund’s prospectus current as of the date of this report. In periods of market volatility, assets may decline significantly, causing total annual Fund operating expenses to become higher than the figures shown.
8. Effective 7/15/09, the Fund began offering Advisor Class shares, which do not have sales charges or a Rule 12b-1 plan. Performance quotations for this class reflect the following methods of calculation: (a) For periods prior to 7/15/09, a restated figure is used based upon the Fund’s Class A performance, excluding the effect of Class A’s maximum initial sales charge, but reflecting the effect of the Class A Rule 12b-1 fees; and (b) for periods after 7/14/09, actual Advisor Class performance is used reflecting all charges and fees applicable to that class. Since 7/15/09 (commencement of sales), the cumulative and average annual total returns of Advisor Class shares were +6.31% and +3.84%.
9. Source: © 2011 Morningstar. The BC Municipal Bond Index is a market value-weighted index engineered for the long-term tax-exempt bond market. To be included in the index, bonds must be fixed rate, have at least one year to final maturity and be rated investment grade (Baa3/BBB- or higher) by at least two of the following agencies: Moody’s, Standard & Poor’s and Fitch. The Consumer Price Index (CPI), calculated by the U.S. Bureau of Labor Statistics, is a commonly used measure of the inflation rate.
26 | Annual Report
Your Fund’s Expenses
Franklin Colorado Tax-Free Income Fund
As a Fund shareholder, you can incur two types of costs:
- Transaction costs, including sales charges (loads) on Fund purchases; and
- Ongoing Fund costs, including management fees, distribution and service (12b-1) fees, and other Fund expenses. All mutual funds have ongoing costs, sometimes referred to as operating expenses.
The following table shows ongoing costs of investing in the Fund and can help you understand these costs and compare them with those of other mutual funds. The table assumes a $1,000 investment held for the 12 months indicated.
Actual Fund Expenses
The first line (Actual) for each share class listed in the table provides actual account values and expenses. The “Ending Account Value” is derived from the Fund’s actual return, which includes the effect of Fund expenses.
You can estimate the expenses you paid during the period by following these steps. Of course, your account value and expenses will differ from those in this illustration:
| 1. | Divide your account value by $1,000. |
| | If an account had an $8,600 value, then $8,600 ÷ $1,000 = 8.6. |
| 2. | Multiply the result by the number under the heading “Expenses Paid During Period.” |
| | If Expenses Paid During Period were $7.50, then 8.6 x $7.50 = $64.50. |
In this illustration, the estimated expenses paid this period are $64.50.
Hypothetical Example for Comparison with Other Funds
Information in the second line (Hypothetical) for each class in the table can help you compare ongoing costs of investing in the Fund with those of other mutual funds. This information may not be used to estimate the actual ending account balance or expenses you paid during the period. The hypothetical “Ending Account Value” is based on the actual expense ratio for each class and an assumed 5% annual rate of return before expenses, which does not represent the Fund’s actual return. The figure under the heading “Expenses Paid During Period” shows the hypothetical expenses your account would have incurred under this scenario. You can compare this figure with the 5% hypothetical examples that appear in shareholder reports of other funds.
Annual Report | 27
Your Fund’s Expenses (continued)
Please note that expenses shown in the table are meant to highlight ongoing costs and do not reflect any transaction costs, such as sales charges. Therefore, the second line for each class is useful in comparing ongoing costs only, and will not help you compare total costs of owning different funds. In addition, if transaction costs were included, your total costs would have been higher. Please refer to the Fund prospectus for additional information on operating expenses.
| | | | | | |
| | | Beginning Account | | Ending Account | | Expenses Paid During |
| Class A | | Value 9/1/10 | | Value 2/28/11 | | Period* 9/1/10–2/28/11 |
| Actual | $ | 1,000 | $ | 943.80 | $ | 3.18 |
| Hypothetical (5% return before expenses) | $ | 1,000 | $ | 1,021.52 | $ | 3.31 |
| Class C | | | | | | |
| Actual | $ | 1,000 | $ | 941.60 | $ | 5.83 |
| Hypothetical (5% return before expenses) | $ | 1,000 | $ | 1,018.79 | $ | 6.06 |
| Advisor Class | | | | | | |
| Actual | $ | 1,000 | $ | 944.30 | $ | 2.70 |
| Hypothetical (5% return before expenses) | $ | 1,000 | $ | 1,022.02 | $ | 2.81 |
*Expenses are calculated using the most recent six-month expense ratio, annualized for each class (A: 0.66%; C: 1.21%; and Advisor: 0.56%), multiplied by the average account value over the period, multiplied by 181/365 to reflect the one-half year period.
28 | Annual Report
Franklin Connecticut Tax-Free Income Fund
Your Fund’s Goal and Main Investments: Franklin Connecticut Tax-Free Income Fund seeks to provide as high a level of income exempt from federal and Connecticut personal income taxes as is consistent with prudent investment management and preservation of capital by investing at least 80% of its net assets in securities that pay interest free from such taxes.1
Performance data represent past performance, which does not guarantee future results. Investment return and principal value will fluctuate, and you may have a gain or loss when you sell your shares. Current performance may differ from figures shown. Please visit franklintempleton.com or call (800) 342-5236 for most recent month-end performance.
| | |
| Credit Quality Breakdown* | | |
| Franklin Connecticut Tax-Free Income Fund | | |
| 2/28/11 | | |
| | % of Total | |
| Ratings | Long-Term Investments** | |
| AAA | 17.8 | % |
| AA | 23.6 | % |
| A | 28.5 | % |
| BBB | 24.7 | % |
| Below Investment Grade | 0.9 | % |
| Not Rated | 4.5 | % |
*Standard & Poor’s (S&P) is used as the primary independent rating agency source, Moody’s is secondary, and Fitch, if available, is used for securities not rated by Moody’s or S&P. The letter ratings are provided to indicate the credit-worthiness of the Fund’s bond holdings and generally range from AAA (highest) to Below Investment Grade (lowest; includes ratings BB to D).
**Does not include short-term investments and other net assets.
This annual report for Franklin Connecticut Tax-Free Income Fund covers the fiscal year ended February 28, 2011.
Performance Overview
The Fund’s Class A share price, as measured by net asset value, decreased from $10.88 on February 28, 2010, to $10.45 on February 28, 2011. The Fund’s
1. For investors subject to alternative minimum tax, a small portion of Fund dividends may be taxable. Distributions of capital gains are generally taxable. To avoid imposition of 28% backup withholding on all Fund distributions and redemption proceeds, U.S. investors must be properly certified on Form W-9 and non-U.S. investors on Form W-8BEN.
The dollar value, number of shares or principal amount, and names of all portfolio holdings are listed in the Fund’s Statement of Investments (SOI). The SOI begins on page 116.
Annual Report | 29
| | | |
| Dividend Distributions* | | | |
| Franklin Connecticut Tax-Free Income Fund | | | |
| | | Dividend per Share |
| Month | Class A | Class C | Advisor Class |
| March 2010 | 3.78 cents | 3.25 cents | 3.87 cents |
| April 2010 | 3.78 cents | 3.25 cents | 3.87 cents |
| May 2010 | 3.78 cents | 3.25 cents | 3.87 cents |
| June 2010 | 3.78 cents | 3.30 cents | 3.88 cents |
| July 2010 | 3.78 cents | 3.30 cents | 3.88 cents |
| August 2010 | 3.78 cents | 3.30 cents | 3.88 cents |
| September 2010 | 3.78 cents | 3.28 cents | 3.87 cents |
| October 2010 | 3.70 cents | 3.20 cents | 3.79 cents |
| November 2010 | 3.70 cents | 3.20 cents | 3.79 cents |
| December 2010 | 3.70 cents | 3.16 cents | 3.79 cents |
| January 2011 | 3.70 cents | 3.16 cents | 3.79 cents |
| February 2011 | 3.70 cents | 3.16 cents | 3.79 cents |
*Assumes shares were purchased and held for the entire accrual period, which differs from the calendar month. Since dividends accrue daily, your actual distributions will vary depending on the date you purchased your shares and any account activity. All Fund distributions will vary depending upon current market conditions, and past distributions are not indicative of future trends.
Class A shares paid dividends totaling 45.22 cents per share for the same period.2 The Performance Summary beginning on page 33 shows that at the end of this reporting period the Fund’s Class A shares’ distribution rate was 4.12% based on an annualization of the 3.75 cent per share dividend and the maximum offering price of $10.91 on February 28, 2011. An investor in the 2011 maximum combined effective federal and Connecticut personal income tax bracket of 39.23% would need to earn a distribution rate of 6.78% from a taxable investment to match the Fund’s Class A tax-free distribution rate. For the Fund’s Class C and Advisor shares’ performance, please see the Performance Summary. Dividend distributions during the year under review were affected by securities purchased in the prior period and by falling municipal bond rates in 2009 through November 2010. In addition, for most of the Fund’s fiscal year, investor demand was strong for municipal bonds in an environment of limited tax-exempt supply. These factors resulted in reduced income for the portfolio and caused dividends to decline.
2. All Fund distributions will vary depending upon current market conditions, and past distributions are not indicative of future trends.
30 | Annual Report
State Update
Connecticut’s sizable and well-diversified economy began to recover from the national recession at a moderate pace, but faster than the national average. Although the state’s housing market remained weak, it showed signs of improvement as foreclosures registered one of the nation’s largest annual declines. The state outpaced the nation in tax revenue growth for two consecutive quarters, as it continued to enjoy high wealth and income levels. Connecticut’s above-average reliance on economically sensitive sectors such as real estate and financial services, while contributing to the state’s wealth during economic expansions, caused heavy job losses in the construction, financial activities and information sectors during the recession and through most of the reporting period. Continued improvement of the state’s economy resulted in declines for only three employment sectors — mining and logging, information and government. All other sectors posted gains, led by construction and professional and business services. Although Connecticut’s unemployment rate doubled since mid-2007 to 9.0% in February 2011, it remained in line with the 8.9% national rate.3
Connecticut is the nation’s wealthiest state, and its personal income, capital gains and sales tax receipts generally contribute significantly to its biennial budget. The state closed its fiscal year 2010 budget with a $449.4 million surplus created by using federal stimulus funds and the state’s emergency Rainy Day Fund, delaying payment to its pension fund, and achieving modest gains in tax revenue toward the end of the fiscal year.4 State officials indicated they would use this surplus to finance fiscal year 2011 budget requirements and reduce planned deficit financing. The fiscal year 2011 budget continued the fiscal year 2010 formula of using federal stimulus funds, one-time resources, spending cuts and revenue enhancements to balance the budget but with a heavier reliance on one-time resources including budget reserve funds and deficit bonds. Revenue enhancements included income tax increases for high-wage earners, a cigarette tax increase and a corporate tax surcharge.
Connecticut’s debt levels were among the nation’s highest, with net tax-supported debt at 8.7% of personal income and $4,859 per capita, compared with the 2.5% and $936 national medians.5 Independent credit rating agency Standard & Poor’s (S&P) assigned the state’s general obligation bonds a rating of AA with a stable outlook.6 The rating and outlook reflected S&P’s concern
3. Source: Bureau of Labor Statistics.
4. Source: State of Connecticut, Office of the State Comptroller Press Release, “State Closes Books on 2010 Fiscal Year with $449.4 Million Surplus,” 9/1/10.
5. Source: Moody’s Investors Service, “Special Comment: 2010 State Debt Medians Report,” May 2010.
6. This does not indicate S&P’s rating of the Fund.
Portfolio Breakdown
Franklin Connecticut Tax-Free Income Fund 2/28/11
|
| % of Total |
| Long-Term Investments* |
| | |
| Higher Education | 26.5 | %** |
| Utilities | 15.5 | % |
| Hospital & Health Care | 14.4 | % |
| Other Revenue | 11.6 | % |
| General Obligation | 7.7 | % |
| Refunded | 7.7 | % |
| Housing | 7.5 | % |
| Tax-Supported | 5.8 | % |
| Subject to Government Appropriations | 2.6 | % |
| Transportation | 0.7 | % |
*Does not include short-term investments and other net assets.
**The Fund may invest more than 25% in municipal securities that finance similar types of projects such as higher education. A change that affects one project may affect all similar projects, thereby increasing market risk.
Annual Report | 31
about the state’s history of highly cyclical budget performance, high debt level, unfunded pension liabilities, and the challenges the state would face when federal stimulus programs expire in 2012. S&P noted, however, that the state has faced revenue volatility and high leverage in the past but has historically managed such budget pressures as the state benefits from high income levels, a diverse economic base and legal flexibility to enhance state revenues.
Manager’s Discussion
We used various investment strategies during the 12 months under review as we sought to maximize tax-free income for shareholders. Please read the discussion on page 6 for details.
Thank you for your continued participation in Franklin Connecticut Tax-Free Income Fund. We intend to maintain our conservative, buy-and-hold investment strategy as we attempt to provide shareholders with high, current, tax-free income.
The foregoing information reflects our analysis, opinions and portfolio holdings as of February 28, 2011, the end of the reporting period. The way we implement our main investment strategies and the resulting portfolio holdings may change depending on factors such as market and economic conditions. These opinions may not be relied upon as investment advice or an offer for a particular security. The information is not a complete analysis of every aspect of any market, state, industry, security or the Fund. Statements of fact are from sources considered reliable, but the investment manager makes no representation or warranty as to their completeness or accuracy. Although historical performance is no guarantee of future results, these insights may help you understand our investment management philosophy.
32 | Annual Report
Performance Summary as of 2/28/11
Franklin Connecticut Tax-Free Income Fund
Your dividend income will vary depending on dividends or interest paid by securities in the Fund’s portfolio, adjusted for operating expenses of each class. Capital gain distributions are net profits realized from the sale of portfolio securities. The performance table and graphs do not reflect any taxes that a shareholder would pay on Fund dividends, capital gain distributions, if any, or any realized gains on the sale of Fund shares. Total return reflects reinvestment of the Fund’s dividends and capital gain distributions, if any, and any unrealized gains or losses.
| | | | | | | | |
| Price and Distribution Information | | | | | | |
| Class A (Symbol: FXCTX) | | | | Change | | 2/28/11 | | 2/28/10 |
| Net Asset Value (NAV) | | | -$ | 0.43 | $ | 10.45 | $ | 10.88 |
| Distributions (3/1/10–2/28/11) | | | | | | | | |
| Dividend Income | $ | 0.4522 | | | | | | |
| Class C (Symbol: FCTIX) | | | | Change | | 2/28/11 | | 2/28/10 |
| Net Asset Value (NAV) | | | -$ | 0.42 | $ | 10.52 | $ | 10.94 |
| Distributions (3/1/10–2/28/11) | | | | | | | | |
| Dividend Income | $ | 0.3905 | | | | | | |
| Advisor Class (Symbol: FCNZX) | | | | Change | | 2/28/11 | | 2/28/10 |
| Net Asset Value (NAV) | | | -$ | 0.42 | $ | 10.45 | $ | 10.87 |
| Distributions (3/1/10–2/28/11) | | | | | | | | |
| Dividend Income | $ | 0.4634 | | | | | | |
Annual Report | 33
Performance Summary (continued)
Performance
Cumulative total return excludes sales charges. Average annual total returns include maximum sales charges. Class A: 4.25% maximum initial sales charge; Class C: 1% contingent deferred sales charge in first year only; Advisor Class: no sales charges.
| | | | | | | | | | | |
| Class A | | | | 1-Year | | | 5-Year | | | 10-Year | |
| Cumulative Total Return1 | | | + | 0.13 | % | + | 16.31 | % | + | 52.48 | % |
| Average Annual Total Return2 | | | | -4.10 | % | + | 2.18 | % | + | 3.86 | % |
| Avg. Ann. Total Return (3/31/11)3 | | | | -5.12 | % | + | 2.14 | % | + | 3.68 | % |
| Distribution Rate4 | 4.12 | % | | | | | | | | | |
| Taxable Equivalent Distribution Rate5 | 6.78 | % | | | | | | | | | |
| 30-Day Standardized Yield6 | 4.05 | % | | | | | | | | | |
| Taxable Equivalent Yield5 | 6.66 | % | | | | | | | | | |
| Total Annual Operating Expenses7 | 0.68 | % | | | | | | | | | |
| Class C | | | | 1-Year | | | 5-Year | | | 10-Year | |
| Cumulative Total Return1 | | | | -0.34 | % | + | 13.25 | % | + | 44.54 | % |
| Average Annual Total Return2 | | | | -1.30 | % | + | 2.52 | % | + | 3.75 | % |
| Avg. Ann. Total Return (3/31/11)3 | | | | -2.52 | % | + | 2.45 | % | + | 3.56 | % |
| Distribution Rate4 | 3.76 | % | | | | | | | | | |
| Taxable Equivalent Distribution Rate5 | 6.19 | % | | | | | | | | | |
| 30-Day Standardized Yield6 | 3.68 | % | | | | | | | | | |
| Taxable Equivalent Yield5 | 6.06 | % | | | | | | | | | |
| Total Annual Operating Expenses7 | 1.23 | % | | | | | | | | | |
| Advisor Class8 | | | | 1-Year | | | 5-Year | | | 10-Year | |
| Cumulative Total Return1 | | | + | 0.33 | % | + | 16.49 | % | + | 52.73 | % |
| Average Annual Total Return2 | | | + | 0.33 | % | + | 3.10 | % | + | 4.33 | % |
| Avg. Ann. Total Return (3/31/11)3 | | | | -0.92 | % | + | 3.05 | % | + | 4.13 | % |
| Distribution Rate4 | 4.40 | % | | | | | | | | | |
| Taxable Equivalent Distribution Rate5 | 7.24 | % | | | | | | | | | |
| 30-Day Standardized Yield6 | 4.33 | % | | | | | | | | | |
| Taxable Equivalent Yield5 | 7.12 | % | | | | | | | | | |
| Total Annual Operating Expenses7 | 0.58 | % | | | | | | | | | |
Performance data represent past performance, which does not guarantee future results. Investment return and principal value will fluctuate, and you may have a gain or loss when you sell your shares. Current performance may differ from figures shown. For most recent month-end performance, go to franklintempleton.com or call (800) 342-5236.
34 | Annual Report
Performance Summary (continued)
Total Return Index Comparison for a Hypothetical $10,000 Investment
Total return represents the change in value of an investment over the periods shown. It includes any current, applicable, maximum sales charge, Fund expenses, account fees and reinvested distributions. The unmanaged index includes reinvestment of any income or distributions. It differs from the Fund in composition and does not pay management fees or expenses. One cannot invest directly in an index.
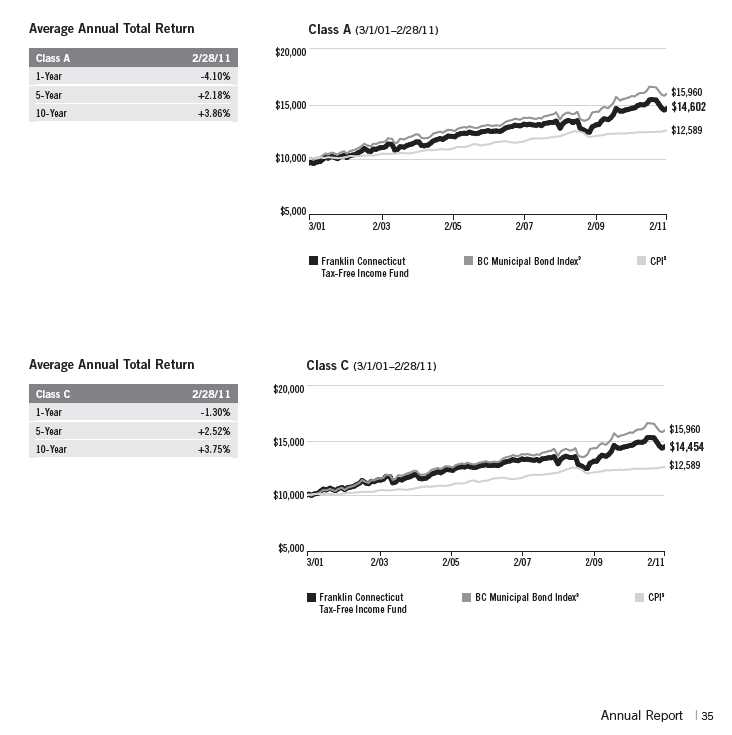
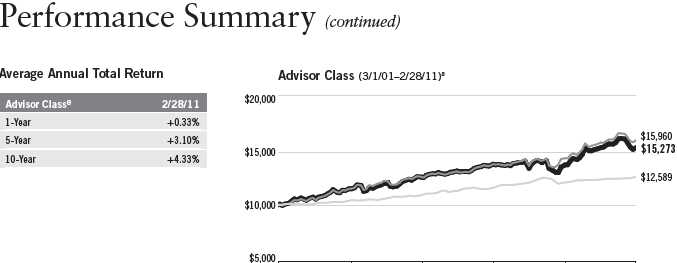
| | | | | |
| 3/01 | 2/03 | 2/05 | 2/07 | 2/09 | 2/11 |
| |
| |
| Franklin Connecticut | | BC Municipal Bond Index 9 | | CPI9 |
| Tax-Free Income Fund | | | | |
36 | Annual Report
Performance Summary (continued)
Endnotes
Because municipal bonds are sensitive to interest rate movements, the Fund’s yield and share price will fluctuate with market conditions. Bond prices generally move in the opposite direction of interest rates. Thus, as prices of bonds in the Fund adjust to a rise in interest rates, the Fund’s share price may decline. Since the Fund concentrates its investments in a single state, it is subject to greater risk of adverse economic and regulatory changes in that state than a geographically diversified fund. The manager applies various techniques and analyses in making investment decisions for the Fund, but there can be no guarantee that these decisions will produce the desired results. The Fund’s prospectus also includes a description of the main investment risks.
| |
| Class C: | Prior to 1/1/04, these shares were offered with an initial sales charge; thus actual total returns would have differed. These shares |
| | have higher annual fees and expenses than Class A shares. |
| |
| Advisor Class: | Shares are available to certain eligible investors as described in the prospectus. |
1. Cumulative total return represents the change in value of an investment over the periods indicated.
2. Average annual total return represents the average annual change in value of an investment over the periods indicated.
3. In accordance with SEC rules, we provide standardized average annual total return information through the latest calendar quarter.
4. Distribution rate is based on an annualization of the respective class’s current monthly dividend and the maximum offering price (NAV for Classes C and Advisor) per share on 2/28/11.
5. Taxable equivalent distribution rate and yield assume the published rates as of 12/28/10 for the maximum combined effective federal and Connecticut personal income tax rate of 39.23%, based on the federal income tax rate of 35.00%.
6. The 30-day standardized yield for the month ended 2/28/11 reflects an estimated yield to maturity (assuming all portfolio securities are held to maturity). It should be regarded as an estimate of the Fund’s rate of investment income, and it may not equal the Fund’s actual income distribution rate (which reflects the Fund’s past dividends paid to shareholders) or the income reported in the Fund’s financial statements.
7. Figures are as stated in the Fund’s prospectus current as of the date of this report. In periods of market volatility, assets may decline significantly, causing total annual Fund operating expenses to become higher than the figures shown.
8. Effective 7/15/09, the Fund began offering Advisor Class shares, which do not have sales charges or a Rule 12b-1 plan. Performance quotations for this class reflect the following methods of calculation: (a) For periods prior to 7/15/09, a restated figure is used based upon the Fund’s Class A performance, excluding the effect of Class A’s maximum initial sales charge, but reflecting the effect of the Class A Rule 12b-1 fees; and (b) for periods after 7/14/09, actual Advisor Class performance is used reflecting all charges and fees applicable to that class. Since 7/15/09 (commencement of sales), the cumulative and average annual total returns of Advisor Class shares were +7.13% and +4.33%.
9. Source: © 2011 Morningstar. The BC Municipal Bond Index is a market value-weighted index engineered for the long-term tax-exempt bond market. To be included in the index, bonds must be fixed rate, have at least one year to final maturity and be rated investment grade (Baa3/BBB- or higher) by at least two of the following agencies: Moody’s, Standard & Poor’s and Fitch. The Consumer Price Index (CPI), calculated by the U.S. Bureau of Labor Statistics, is a commonly used measure of the inflation rate.
Annual Report | 37
Your Fund’s Expenses
Franklin Connecticut Tax-Free Income Fund
As a Fund shareholder, you can incur two types of costs:
- Transaction costs, including sales charges (loads) on Fund purchases; and
- Ongoing Fund costs, including management fees, distribution and service (12b-1) fees, and other Fund expenses. All mutual funds have ongoing costs, sometimes referred to as operating expenses.
The following table shows ongoing costs of investing in the Fund and can help you understand these costs and compare them with those of other mutual funds. The table assumes a $1,000 investment held for the 12 months indicated.
Actual Fund Expenses
The first line (Actual) for each share class listed in the table provides actual account values and expenses. The “Ending Account Value” is derived from the Fund’s actual return, which includes the effect of Fund expenses.
You can estimate the expenses you paid during the period by following these steps. Of course, your account value and expenses will differ from those in this illustration:
| 1. | Divide your account value by $1,000. |
| | If an account had an $8,600 value, then $8,600 ÷ $1,000 = 8.6. |
| 2. | Multiply the result by the number under the heading “Expenses Paid During Period.” |
| | If Expenses Paid During Period were $7.50, then 8.6 x $7.50 = $64.50. |
In this illustration, the estimated expenses paid this period are $64.50.
Hypothetical Example for Comparison with Other Funds
Information in the second line (Hypothetical) for each class in the table can help you compare ongoing costs of investing in the Fund with those of other mutual funds. This information may not be used to estimate the actual ending account balance or expenses you paid during the period. The hypothetical “Ending Account Value” is based on the actual expense ratio for each class and an assumed 5% annual rate of return before expenses, which does not represent the Fund’s actual return. The figure under the heading “Expenses Paid During Period” shows the hypothetical expenses your account would have incurred under this scenario. You can compare this figure with the 5% hypothetical examples that appear in shareholder reports of other funds.
38 | Annual Report
Your Fund’s Expenses (continued)
Please note that expenses shown in the table are meant to highlight ongoing costs and do not reflect any transaction costs, such as sales charges. Therefore, the second line for each class is useful in comparing ongoing costs only, and will not help you compare total costs of owning different funds. In addition, if transaction costs were included, your total costs would have been higher. Please refer to the Fund prospectus for additional information on operating expenses.
| | | | | | |
| | | Beginning Account | | Ending Account | | Expenses Paid During |
| Class A | | Value 9/1/10 | | Value 2/28/11 | | Period* 9/1/10–2/28/11 |
| Actual | $ | 1,000 | $ | 952.50 | $ | 3.20 |
| Hypothetical (5% return before expenses) | $ | 1,000 | $ | 1,021.52 | $ | 3.31 |
| Class C | | | | | | |
| Actual | $ | 1,000 | $ | 950.10 | $ | 5.85 |
| Hypothetical (5% return before expenses) | $ | 1,000 | $ | 1,018.79 | $ | 6.06 |
| Advisor Class | | | | | | |
| Actual | $ | 1,000 | $ | 953.00 | $ | 2.71 |
| Hypothetical (5% return before expenses) | $ | 1,000 | $ | 1,022.02 | $ | 2.81 |
*Expenses are calculated using the most recent six-month expense ratio, annualized for each class (A: 0.66%; C: 1.21%; and Advisor: 0.56%), multiplied by the average account value over the period, multiplied by 181/365 to reflect the one-half year period.
Annual Report | 39
Franklin Michigan Tax-Free Income Fund
Your Fund’s Goal and Main Investments: Franklin Michigan Tax-Free Income Fund seeks to provide as high a level of income exempt from federal and Michigan personal income taxes as is consistent with prudent investment management and preservation of capital by investing at least 80% of its total assets in securities that pay interest free from such taxes.1
Performance data represent past performance, which does not guarantee future results. Investment return and principal value will fluctuate, and you may have a gain or loss when you sell your shares. Current performance may differ from figures shown. Please visit franklintempleton.com or call (800) 342-5236 for most recent month-end performance.
| | |
| Credit Quality Breakdown* | | |
| Franklin Michigan Tax-Free Income Fund | | |
| 2/28/11 | | |
| | % of Total | |
| Ratings | Long-Term Investments** | |
| AAA | 4.0 | % |
| AA | 59.3 | % |
| A | 32.2 | % |
| BBB | 3.3 | % |
| Below Investment Grade | 0.3 | % |
| Not Rated | 0.9 | % |
*Standard & Poor’s (S&P) is used as the primary independent rating agency source, Moody’s is secondary, and Fitch, if available, is used for securities not rated by Moody’s or S&P. The letter ratings are provided to indicate the credit-worthiness of the Fund’s bond holdings and generally range from AAA (highest) to Below Investment Grade (lowest; includes ratings BB to D).
**Does not include short-term investments and other net assets.
This annual report for Franklin Michigan Tax-Free Income Fund covers the fiscal year ended February 28, 2011.
Performance Overview
The Fund’s Class A share price, as measured by net asset value, decreased from $11.97 on February 28, 2010, to $11.52 on February 28, 2011. The Fund’s
1. For investors subject to alternative minimum tax, a small portion of Fund dividends may be taxable. Distributions of capital gains are generally taxable. To avoid imposition of 28% backup withholding on all Fund distributions and redemption proceeds, U.S. investors must be properly certified on Form W-9 and non-U.S. investors on Form W-8BEN.
The dollar value, number of shares or principal amount, and names of all portfolio holdings are listed in the Fund’s Statement of Investments (SOI). The SOI begins on page 124.
40 | Annual Report
| | | | |
| Dividend Distributions* | | | | |
| Franklin Michigan Tax-Free Income Fund | | | |
| | | Dividend per Share | |
| Month | Class A | Class B | Class C | Advisor Class |
| March 2010 | 4.33 cents | 3.78 cents | 3.76 cents | 4.42 cents |
| April 2010 | 4.33 cents | 3.78 cents | 3.76 cents | 4.42 cents |
| May 2010 | 4.33 cents | 3.78 cents | 3.76 cents | 4.42 cents |
| June 2010 | 4.33 cents | 3.80 cents | 3.79 cents | 4.43 cents |
| July 2010 | 4.33 cents | 3.80 cents | 3.79 cents | 4.43 cents |
| August 2010 | 4.33 cents | 3.80 cents | 3.79 cents | 4.43 cents |
| September 2010 | 4.21 cents | 3.66 cents | 3.65 cents | 4.32 cents |
| October 2010 | 4.14 cents | 3.59 cents | 3.58 cents | 4.25 cents |
| November 2010 | 4.14 cents | 3.59 cents | 3.58 cents | 4.25 cents |
| December 2010 | 4.14 cents | 3.58 cents | 3.55 cents | 4.24 cents |
| January 2011 | 4.14 cents | 3.58 cents | 3.55 cents | 4.24 cents |
| February 2011 | 4.14 cents | 3.58 cents | 3.55 cents | 4.24 cents |
*Assumes shares were purchased and held for the entire accrual period, which differs from the calendar month. Since dividends accrue daily, your actual distributions will vary depending on the date you purchased your shares and any account activity. All Fund distributions will vary depending upon current market conditions, and past distributions are not indicative of future trends.
Class A shares paid dividends totaling 51.16 cents per share for the same period.2 The Performance Summary beginning on page 44 shows that at the end of this reporting period the Fund’s Class A shares’ distribution rate was 4.18% based on an annualization of the current 4.19 cent per share dividend and the maximum offering price of $12.03 on February 28, 2011. An investor in the 2011 maximum combined effective federal and Michigan personal income tax bracket of 37.83% would need to earn a distribution rate of 6.72% from a taxable investment to match the Fund’s Class A tax-free distribution rate. For the Fund’s Class B, C and Advisor shares’ performance, please see the Performance Summary. Dividend distributions during the year under review were affected by securities purchased in the prior period and by falling municipal bond rates in 2009 through November 2010. In addition, for most of the Fund’s fiscal year, investor demand was strong for municipal bonds in an environment of limited tax-exempt supply. These factors resulted in reduced income for the portfolio and caused dividends to decline.
2. All Fund distributions will vary depending upon current market conditions, and past distributions are not indicative of future trends.
Annual Report | 41
| | |
| Portfolio Breakdown | | |
| Franklin Michigan Tax-Free Income Fund | |
| 2/28/11 | | |
| % of Total | |
| Long-Term Investments* | |
| General Obligation | 24.9 | % |
| Refunded | 22.3 | % |
| Utilities | 13.1 | % |
| Hospital & Health Care | 11.5 | % |
| Higher Education | 10.9 | % |
| Subject to Government Appropriations | 6.4 | % |
| Tax-Supported | 6.1 | % |
| Transportation | 3.9 | % |
| Housing | 0.6 | % |
| Other Revenue | 0.3 | % |
| |
| *Does not include short-term investments and other | |
| net assets. | | |
State Update
Michigan’s economic base diversified modestly as it began to recover from a sustained economic downturn caused primarily by continued housing weakness and the U.S. auto industry’s restructuring. Although Michigan’s new foreclosure activities declined toward period-end, its foreclosure totals ranked among the nation’s top 10. The U.S. auto industry, while remaining weak by historical standards, stabilized during the reporting period as Michigan-based Ford Motor, Chrysler Group and General Motors, which emerged from bankruptcy in November 2010 and staged the biggest initial public offering in global history, reported improved sales for February 2011. Recent economic improvements resulted in sizable job gains in the manufacturing, construction, and professional and business services sectors. All other sectors posted gains, with the exception of government and leisure and hospitality. Although Michigan’s unemployment rate continued to decline from the 26-year high of 14.1% set in August and September 2009 to 10.4% in February 2011, it remained significantly higher than the 8.9% national rate.3
Like most states, Michigan struggled to balance its budget as economic challenges continued and tax revenues declined. Unlike most states, however, Michigan did not have the benefit of recovering from the 2001 recession before the Great Recession started. The state demonstrated strong financial management by maintaining positive general fund balances throughout two recessions and the major restructuring of the U.S. auto industry. Through controlled spending, federal stimulus funds and state fund transfers, Michigan closed its fiscal year 2010 budget with a positive general fund balance that was slightly better than forecast. The adopted fiscal year 2011 budget was revised several times and balanced through nonrecurring measures consisting primarily of federal stimulus funds and recurring measures that were primarily spending cuts. As the economy improved, the state raised revenue estimates for fiscal years 2011 and 2012, marking the first increase in several years. As a result, the state also increased its estimated general fund balance for fiscal year 2011. In February 2011, the governor presented his fiscal years 2012 and 2013 budget recommendation to the legislature. Due to the end of federal stimulus programs, fiscal year 2012 would open with a significant gap, which the governor proposed to close through recurring measures including expenditure reductions and tax system restructuring.
3. Source: Bureau of Labor Statistics.
42 | Annual Report
Michigan maintained relatively low debt levels despite suffering the worst economic decline in the nation. The state’s net tax-supported debt was 2.1% of personal income and $748 per capita, compared with the 2.5% and $936 national medians.4 Independent credit rating agency Moody’s Investors Service affirmed its Aa2 rating and stable outlook on Michigan’s general obligation bonds.5 The rating and outlook reflected Michigan’s adequately funded pensions and strong management practices in addressing economic and budgetary challenges caused by the decline of the U.S. auto industry. In addition, Moody’s noted that despite prolonged economic challenges and stagnant revenue trends, the state has maintained positive fund balances.
Manager’s Discussion
We used various investment strategies during the 12 months under review as we sought to maximize tax-free income for shareholders. Please read the discussion on page 6 for details.
Thank you for your continued participation in Franklin Michigan Tax-Free Income Fund. We intend to maintain our conservative, buy-and-hold investment strategy as we attempt to provide shareholders with high, current, tax-free income.
The foregoing information reflects our analysis, opinions and portfolio holdings as of February 28, 2011, the end of the reporting period. The way we implement our main investment strategies and the resulting portfolio holdings may change depending on factors such as market and economic conditions. These opinions may not be relied upon as investment advice or an offer for a particular security. The information is not a complete analysis of every aspect of any market, state, industry, security or the Fund. Statements of fact are from sources considered reliable, but the investment manager makes no representation or warranty as to their completeness or accuracy. Although historical performance is no guarantee of future results, these insights may help you understand our investment management philosophy.
4. Source: Moody’s Investors Service, “Special Comment: 2010 State Debt Medians Report,” May 2010.
5. This does not indicate Moody’s rating of the Fund.
Annual Report | 43
Performance Summary as of 2/28/11
Franklin Michigan Tax-Free Income Fund
Your dividend income will vary depending on dividends or interest paid by securities in the Fund’s portfolio, adjusted for operating expenses of each class. Capital gain distributions are net profits realized from the sale of portfolio securities. The performance table and graphs do not reflect any taxes that a shareholder would pay on Fund dividends, capital gain distributions, if any, or any realized gains on the sale of Fund shares. Total return reflects reinvestment of the Fund’s dividends and capital gain distributions, if any, and any unrealized gains or losses.
| | | | | | | | |
| Price and Distribution Information | | | | | | |
| Class A (Symbol: FTTMX) | | | | Change | | 2/28/11 | | 2/28/10 |
| Net Asset Value (NAV) | | | -$ | 0.45 | $ | 11.52 | $ | 11.97 |
| Distributions (3/1/10–2/28/11) | | | | | | | | |
| Dividend Income | $ | 0.5116 | | | | | | |
| Long-Term Capital Gain | $ | 0.0156 | | | | | | |
| Total | $ | 0.5272 | | | | | | |
| Class B (Symbol: FBMIX) | | | | Change | | 2/28/11 | | 2/28/10 |
| Net Asset Value (NAV) | | | -$ | 0.45 | $ | 11.58 | $ | 12.03 |
| Distributions (3/1/10–2/28/11) | | | | | | | | |
| Dividend Income | $ | 0.4456 | | | | | | |
| Long-Term Capital Gain | $ | 0.0156 | | | | | | |
| Total | $ | 0.4612 | | | | | | |
| Class C (Symbol: FRMTX) | | | | Change | | 2/28/11 | | 2/28/10 |
| Net Asset Value (NAV) | | | -$ | 0.45 | $ | 11.66 | $ | 12.11 |
| Distributions (3/1/10–2/28/11) | | | | | | | | |
| Dividend Income | $ | 0.4435 | | | | | | |
| Long-Term Capital Gain | $ | 0.0156 | | | | | | |
| Total | $ | 0.4591 | | | | | | |
| Advisor Class (Symbol: n/a) | | | | Change | | 2/28/11 | | 2/28/10 |
| Net Asset Value (NAV) | | | -$ | 0.45 | $ | 11.54 | $ | 11.99 |
| Distributions (3/1/10–2/28/11) | | | | | | | | |
| Dividend Income | $ | 0.5236 | | | | | | |
| Long-Term Capital Gain | $ | 0.0156 | | | | | | |
| Total | $ | 0.5392 | | | | | | |
44 | Annual Report
Performance Summary (continued)
Performance
Cumulative total return excludes sales charges. Average annual total returns include maximum sales charges. Class A: 4.25% maximum initial sales charge; Class B: contingent deferred sales charge (CDSC) declining from 4% to 1% over six years, and eliminated thereafter; Class C: 1% CDSC in first year only; Advisor Class: no sales charges.
| | | | | | | | | | | |
| Class A | | | | 1-Year | | | 5-Year | | | 10-Year | |
| Cumulative Total Return1 | | | + | 0.62 | % | + | 17.05 | % | + | 50.86 | % |
| Average Annual Total Return2 | | | | -3.65 | % | + | 2.31 | % | + | 3.74 | % |
| Avg. Ann. Total Return (3/31/11)3 | | | | -4.13 | % | + | 2.31 | % | + | 3.60 | % |
| Distribution Rate4 | 4.18 | % | | | | | | | | | |
| Taxable Equivalent Distribution Rate5 | 6.72 | % | | | | | | | | | |
| 30-Day Standardized Yield6 | 3.59 | % | | | | | | | | | |
| Taxable Equivalent Yield5 | 5.77 | % | | | | | | | | | |
| Total Annual Operating Expenses7 | 0.63 | % | | | | | | | | | |
| Class B | | | | 1-Year | | | 5-Year | | | 10-Year | |
| Cumulative Total Return1 | | | + | 0.06 | % | + | 13.80 | % | + | 44.40 | % |
| Average Annual Total Return2 | | | | -3.79 | % | + | 2.28 | % | + | 3.74 | % |
| Avg. Ann. Total Return (3/31/11)3 | | | | -4.17 | % | + | 2.30 | % | + | 3.60 | % |
| Distribution Rate4 | 3.81 | % | | | | | | | | | |
| Taxable Equivalent Distribution Rate5 | 6.13 | % | | | | | | | | | |
| 30-Day Standardized Yield6 | 3.21 | % | | | | | | | | | |
| Taxable Equivalent Yield5 | 5.16 | % | | | | | | | | | |
| Total Annual Operating Expenses7 | 1.18 | % | | | | | | | | | |
| Class C | | | | 1-Year | | | 5-Year | | | 10-Year | |
| Cumulative Total Return1 | | | + | 0.04 | % | + | 13.85 | % | + | 42.80 | % |
| Average Annual Total Return2 | | | | -0.92 | % | + | 2.63 | % | + | 3.63 | % |
| Avg. Ann. Total Return (3/31/11)3 | | | | -1.39 | % | + | 2.63 | % | + | 3.49 | % |
| Distribution Rate4 | 3.78 | % | | | | | | | | | |
| Taxable Equivalent Distribution Rate5 | 6.08 | % | | | | | | | | | |
| 30-Day Standardized Yield6 | 3.21 | % | | | | | | | | | |
| Taxable Equivalent Yield5 | 5.16 | % | | | | | | | | | |
| Total Annual Operating Expenses7 | 1.18 | % | | | | | | | | | |
| Advisor Class8 | | | | 1-Year | | | 5-Year | | | 10-Year | |
| Cumulative Total Return1 | | | + | 0.72 | % | + | 17.54 | % | + | 51.49 | % |
| Average Annual Total Return2 | | | + | 0.72 | % | + | 3.28 | % | + | 4.24 | % |
| Avg. Ann. Total Return (3/31/11)3 | | | + | 0.23 | % | + | 3.29 | % | + | 4.09 | % |
| Distribution Rate4 | 4.44 | % | | | | | | | | | |
| Taxable Equivalent Distribution Rate5 | 7.14 | % | | | | | | | | | |
| 30-Day Standardized Yield6 | 3.84 | % | | | | | | | | | |
| Taxable Equivalent Yield5 | 6.18 | % | | | | | | | | | |
| Total Annual Operating Expenses7 | 0.53 | % | | | | | | | | | |
Performance data represent past performance, which does not guarantee future results. Investment return and principal value will fluctuate, and you may have a gain or loss when you sell your shares. Current performance may differ from figures shown. For most recent month-end performance, go to franklintempleton.com or call (800) 342-5236.
Annual Report | 45
Performance Summary (continued)
Total Return Index Comparison for a Hypothetical $10,000 Investment
Total return represents the change in value of an investment over the periods shown. It includes any current, applicable, maximum sales charge, Fund expenses, account fees and reinvested distributions. The unmanaged index includes reinvestment of any income or distributions. It differs from the Fund in composition and does not pay management fees or expenses. One cannot invest directly in an index.
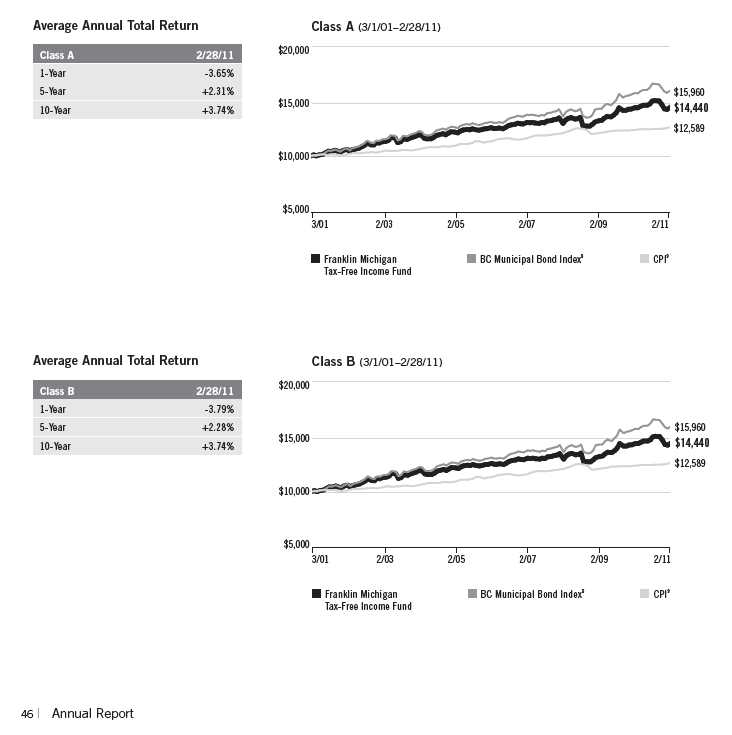
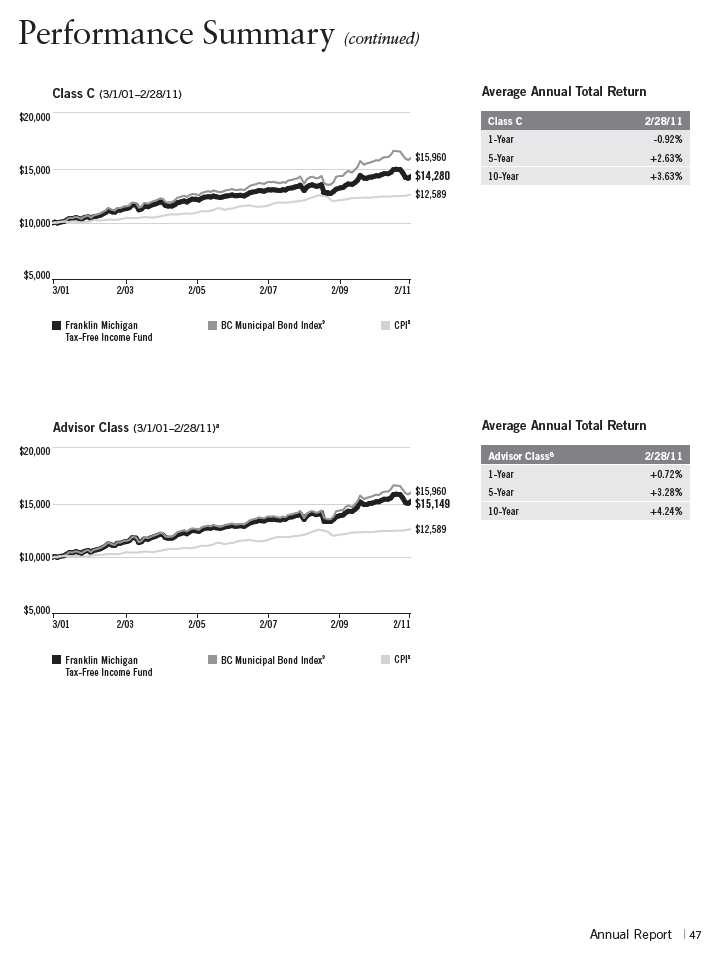
Performance Summary (continued)
Endnotes
Because municipal bonds are sensitive to interest rate movements, the Fund’s yield and share price will fluctuate with market conditions. Bond prices generally move in the opposite direction of interest rates. Thus, as prices of bonds in the Fund adjust to a rise in interest rates, the Fund’s share price may decline. Since the Fund concentrates its investments in a single state, it is subject to greater risk of adverse economic and regulatory changes in that state than a geographically diversified fund. The manager applies various techniques and analyses in making investment decisions for the Fund, but there can be no guarantee that these decisions will produce the desired results. The Fund’s prospectus also includes a description of the main investment risks.
| |
Class B: Class C: | These shares have higher annual fees and expenses than Class A shares. Prior to 1/1/04, these shares were offered with an initial sales charge; thus actual total returns would have differed. These shares have higher annual fees and expenses than Class A shares. |
Advisor Class: | Shares are available to certain eligible investors as described in the prospectus. |
1. Cumulative total return represents the change in value of an investment over the periods indicated.
2. Average annual total return represents the average annual change in value of an investment over the periods indicated.
3. In accordance with SEC rules, we provide standardized average annual total return information through the latest calendar quarter.
4. Distribution rate is based on an annualization of the respective class’s current monthly dividend and the maximum offering price (NAV for Classes B, C and Advisor) per share on 2/28/11.
5. Taxable equivalent distribution rate and yield assume the published rates as of 12/28/10 for the maximum combined effective federal and Michigan personal income tax rate of 37.83%, based on the federal income tax rate of 35.00%.
6. The 30-day standardized yield for the month ended 2/28/11 reflects an estimated yield to maturity (assuming all portfolio securities are held to maturity). It should be regarded as an estimate of the Fund’s rate of investment income, and it may not equal the Fund’s actual income distribution rate (which reflects the Fund’s past dividends paid to shareholders) or the income reported in the Fund’s financial statements.
7. Figures are as stated in the Fund’s prospectus current as of the date of this report. In periods of market volatility, assets may decline significantly, causing total annual Fund operating expenses to become higher than the figures shown.
8. Effective 7/1/08, the Fund began offering Advisor Class shares, which do not have sales charges or a Rule 12b-1 plan. Performance quotations for this class reflect the following methods of calculation: (a) For periods prior to 7/1/08, a restated figure is used based upon the Fund’s Class A performance, excluding the effect of Class A’s maximum initial sales charge, but reflecting the effect of the Class A Rule 12b-1 fees; and (b) for periods after 6/30/08, actual Advisor Class performance is used reflecting all charges and fees applicable to that class. Since 7/1/08 (commencement of sales), the cumulative and average annual total returns of Advisor Class shares were +8.88% and +3.25%.
9. Source: © 2011 Morningstar. The BC Municipal Bond Index is a market value-weighted index engineered for the long-term tax-exempt bond market. To be included in the index, bonds must be fixed rate, have at least one year to final maturity and be rated investment grade (Baa3/BBB- or higher) by at least two of the following agencies: Moody’s, Standard & Poor’s and Fitch. The Consumer Price Index (CPI), calculated by the U.S. Bureau of Labor Statistics, is a commonly used measure of the inflation rate.
48 | Annual Report
Your Fund’s Expenses
Franklin Michigan Tax-Free Income Fund
As a Fund shareholder, you can incur two types of costs:
- Transaction costs, including sales charges (loads) on Fund purchases; and
- Ongoing Fund costs, including management fees, distribution and service (12b-1) fees, and other Fund expenses. All mutual funds have ongoing costs, sometimes referred to as operating expenses.
The following table shows ongoing costs of investing in the Fund and can help you understand these costs and compare them with those of other mutual funds. The table assumes a $1,000 investment held for the 12 months indicated.
Actual Fund Expenses
The first line (Actual) for each share class listed in the table provides actual account values and expenses. The “Ending Account Value” is derived from the Fund’s actual return, which includes the effect of Fund expenses.
You can estimate the expenses you paid during the period by following these steps. Of course, your account value and expenses will differ from those in this illustration:
| 1. | Divide your account value by $1,000. |
| | If an account had an $8,600 value, then $8,600 ÷ $1,000 = 8.6. |
| 2. | Multiply the result by the number under the heading “Expenses Paid During Period.” |
| | If Expenses Paid During Period were $7.50, then 8.6 x $7.50 = $64.50. |
In this illustration, the estimated expenses paid this period are $64.50.
Hypothetical Example for Comparison with Other Funds
Information in the second line (Hypothetical) for each class in the table can help you compare ongoing costs of investing in the Fund with those of other mutual funds. This information may not be used to estimate the actual ending account balance or expenses you paid during the period. The hypothetical “Ending Account Value” is based on the actual expense ratio for each class and an assumed 5% annual rate of return before expenses, which does not represent the Fund’s actual return. The figure under the heading “Expenses Paid During Period” shows the hypothetical expenses your account would have incurred under this scenario. You can compare this figure with the 5% hypothetical examples that appear in shareholder reports of other funds.
Annual Report | 49
Your Fund’s Expenses (continued)
Please note that expenses shown in the table are meant to highlight ongoing costs and do not reflect any transaction costs, such as sales charges. Therefore, the second line for each class is useful in comparing ongoing costs only, and will not help you compare total costs of owning different funds. In addition, if transaction costs were included, your total costs would have been higher. Please refer to the Fund prospectus for additional information on operating expenses.
| | | | | | |
| | | Beginning Account | | Ending Account | | Expenses Paid During |
| Class A | | Value 9/1/10 | | Value 2/28/11 | | Period* 9/1/10–2/28/11 |
| Actual | $ | 1,000 | $ | 964.10 | $ | 3.12 |
| Hypothetical (5% return before expenses) | $ | 1,000 | $ | 1,021.62 | $ | 3.21 |
| Class B | | | | | | |
| Actual | $ | 1,000 | $ | 961.60 | $ | 5.74 |
| Hypothetical (5% return before expenses) | $ | 1,000 | $ | 1,018.94 | $ | 5.91 |
| Class C | | | | | | |
| Actual | $ | 1,000 | $ | 961.80 | $ | 5.79 |
| Hypothetical (5% return before expenses) | $ | 1,000 | $ | 1,018.89 | $ | 5.96 |
| Advisor Class | | | | | | |
| Actual | $ | 1,000 | $ | 964.70 | $ | 2.63 |
| Hypothetical (5% return before expenses) | $ | 1,000 | $ | 1,022.12 | $ | 2.71 |
*Expenses are calculated using the most recent six-month expense ratio, annualized for each class (A: 0.64%; B: 1.18%; C: 1.19%; and Advisor: 0.54%), multiplied by the average account value over the period, multiplied by 181/365 to reflect the one-half year period.
50 | Annual Report
Franklin Minnesota Tax-Free Income Fund
Your Fund’s Goal and Main Investments: Franklin Minnesota Tax-Free Income Fund seeks to provide as high a level of income exempt from federal and Minnesota personal income taxes as is consistent with prudent investment management and preservation of capital by investing at least 80% of its total assets in securities that pay interest free from such taxes.1
Performance data represent past performance, which does not guarantee future results. Investment return and principal value will fluctuate, and you may have a gain or loss when you sell your shares. Current performance may differ from figures shown. Please visit franklintempleton.com or call (800) 342-5236 for most recent month-end performance.
| | |
| Credit Quality Breakdown* | | |
| Franklin Minnesota Tax-Free Income Fund | | |
| 2/28/11 | | |
| | % of Total | |
| Ratings | Long-Term Investments** | |
| AAA | 26.9 | % |
| AA | 55.4 | % |
| A | 15.9 | % |
| BBB | 1.7 | % |
| Not Rated | 0.1 | % |
*Standard & Poor’s (S&P) is used as the primary independent rating agency source, Moody’s is secondary, and Fitch, if available, is used for securities not rated by Moody’s or S&P. The letter ratings are provided to indicate the credit-worthiness of the Fund’s bond holdings and generally range from AAA (highest) to Below Investment Grade (lowest; includes ratings BB to D).
**Does not include short-term investments and other net assets.
This annual report for Franklin Minnesota Tax-Free Income Fund covers the fiscal year ended February 28, 2011.
Performance Overview
The Fund’s Class A share price, as measured by net asset value, decreased from $12.20 on February 28, 2010, to $11.92 on February 28, 2011. The Fund’s
1. For investors subject to alternative minimum tax, a small portion of Fund dividends may be taxable. Distributions of capital gains are generally taxable. To avoid imposition of 28% backup withholding on all Fund distributions and redemption proceeds, U.S. investors must be properly certified on Form W-9 and non-U.S. investors on Form W-8BEN.
The dollar value, number of shares or principal amount, and names of all portfolio holdings are listed in the Fund’s Statement of Investments (SOI). The SOI begins on page 134.
Annual Report | 51
| | | |
| Dividend Distributions* | | | |
| Franklin Minnesota Tax-Free Income Fund | | | |
| | | Dividend per Share |
| Month | Class A | Class C | Advisor Class |
| March 2010 | 3.92 cents | 3.34 cents | 4.02 cents |
| April 2010 | 3.92 cents | 3.34 cents | 4.02 cents |
| May 2010 | 3.92 cents | 3.34 cents | 4.02 cents |
| June 2010 | 3.87 cents | 3.31 cents | 3.97 cents |
| July 2010 | 3.87 cents | 3.31 cents | 3.97 cents |
| August 2010 | 3.87 cents | 3.31 cents | 3.97 cents |
| September 2010 | 3.87 cents | 3.30 cents | 3.97 cents |
| October 2010 | 3.74 cents | 3.17 cents | 3.84 cents |
| November 2010 | 3.74 cents | 3.17 cents | 3.84 cents |
| December 2010 | 3.74 cents | 3.15 cents | 3.84 cents |
| January 2011 | 3.74 cents | 3.15 cents | 3.84 cents |
| February 2011 | 3.74 cents | 3.15 cents | 3.84 cents |
*Assumes shares were purchased and held for the entire accrual period, which differs from the calendar month. Since dividends accrue daily, your actual distributions will vary depending on the date you purchased your shares and any account activity. All Fund distributions will vary depending upon current market conditions, and past distributions are not indicative of future trends.
Class A shares paid dividends totaling 46.19 cents per share for the same period.2 The Performance Summary beginning on page 55 shows that at the end of this reporting period the Fund’s Class A shares’ distribution rate was 3.67% based on an annualization of the current 3.81 cent per share dividend and the maximum offering price of $12.45 on February 28, 2011. An investor in the 2011 maximum combined effective federal and Minnesota personal income tax bracket of 40.10% would need to earn a distribution rate of 6.13% from a taxable investment to match the Fund’s Class A tax-free distribution rate. For the Fund’s Class C and Advisor shares’ performance, please see the Performance Summary. Dividend distributions during the year under review were affected by securities purchased in the prior period and by falling municipal bond rates in 2009 through November 2010. In addition, for most of the Fund’s fiscal year, investor demand was strong for municipal bonds in an environment of limited tax-exempt supply. These factors resulted in reduced income for the portfolio and caused dividends to decline.
2. All Fund distributions will vary depending upon current market conditions, and past distributions are not indicative of future trends.
52 | Annual Report
State Update
Minnesota’s diverse economy continued its modest recovery from the national recession at a faster pace than the national averages in certain areas. Income and effective buying income levels remained higher than the national averages, and the state outpaced the nation in tax revenue growth for three consecutive quarters. The prolonged weakness of the real estate market and homebuilding supply industry resulted in construction job losses. The financial activities, information and government sectors also experienced job losses. However, the state’s broad employment base provided an anchor for job growth, with gains registered in other sectors, including mining and logging, manufacturing, and professional and business services. Minnesota’s 6.7% unemployment rate in February 2011 was significantly lower than the 8.9% national rate.3
The state’s strong fiscal management and proactive responses to revenue volatility were stabilizing forces as economic challenges continued during the reporting period. The 2010-2011 biennium began with a $4.6 billion budget deficit.4 After the governor vetoed tax legislation, the enacted budget contained an unresolved shortfall, which the state closed through the use of budget reserves, legislative spending cuts and executive actions including payment shifts and unallotments. In response to the Minnesota Supreme Court’s May 2010 ruling that overturned the governor’s unallotment action, the state legislature approved most of the governor’s actions and closed the revised $3.4 billion budget gap through a combination of federal stimulus funds, spending reductions, fund transfers, payment deferrals and reserve reductions.5 Minnesota closed its fiscal year 2010 budget with a $67 million general fund balance and in November 2010 revised its 2010-2011 biennial revenue and spending forecasts, resulting in a projected $399 million general fund balance.5 A December 2010 federal tax compromise, which included an employee payroll tax reduction and a delay in the scheduled capital gains tax rate increase, provided an immediate boost to the state’s economic outlook. As a result of increased revenues, in February 2011 the state revised its general fund balance for the current biennial budget to $663 million and raised its revenue forecasts for the 2012-2013 biennium.6 Recognizing the volatility of capital gains income, which accounted for most of the state’s improved revenue forecast, state officials continued to restrain expenditures.
|
| 3. Source: Bureau of Labor Statistics. |
| 4. Source: Standard & Poor’s, “Minnesota Housing Finance Agency; Appropriations; General Obligation,” |
| RatingsDirect, 1/31/11. |
| 5. Source: Minnesota Management & Budget, “Minnesota Financial Report,” November 2010. |
| 6. Source: Minnesota Management & Budget, “Minnesota Financial Report,” February 2011. |
| | |
| Portfolio Breakdown | | |
| Franklin Minnesota Tax-Free Income Fund | |
| 2/28/11 | | |
| % of Total | |
| Long-Term Investments* | |
| General Obligation | 34.6 | % |
| Hospital & Health Care | 19.2 | % |
| Utilities | 14.7 | % |
| Higher Education | 7.2 | % |
| Tax-Supported | 6.0 | % |
| Transportation | 5.9 | % |
| Housing | 4.2 | % |
| Refunded | 3.2 | % |
| Subject to Government Appropriations | 3.1 | % |
| Other Revenue | 1.9 | % |
| |
| *Does not include short-term investments and other | |
| net assets. | | |
Annual Report | 53
Minnesota’s debt levels remained moderate and in line with national averages. The state’s net tax-supported debt was 2.4% of personal income and $1,037 per capita, compared with the national medians of 2.5% and $936.7 Independent credit rating agency Standard & Poor’s (S&P) affirmed Minnesota’s AAA general obligation rating with a stable outlook.8 The rating and outlook reflected the state’s historically strong internal control policies that kept debt levels manageable, proactive response to recent revenue declines and adequate reserve levels. In addition, S&P noted that the state has a long track record of strong financial management practices and proven ability to weather fiscal challenges, restore structural balance and rebuild its reserves.
Manager’s Discussion
We used various investment strategies during the 12 months under review as we sought to maximize tax-free income for shareholders. Please read the discussion on page 6 for details.
Thank you for your continued participation in Franklin Minnesota Tax-Free Income Fund. We intend to maintain our conservative, buy-and-hold investment strategy as we attempt to provide shareholders with high, current, tax-free income.
The foregoing information reflects our analysis, opinions and portfolio holdings as of February 28, 2011, the end of the reporting period. The way we implement our main investment strategies and the resulting portfolio holdings may change depending on factors such as market and economic conditions. These opinions may not be relied upon as investment advice or an offer for a particular security. The information is not a complete analysis of every aspect of any market, state, industry, security or the Fund. Statements of fact are from sources considered reliable, but the investment manager makes no representation or warranty as to their completeness or accuracy. Although historical performance is no guarantee of future results, these insights may help you understand our investment management philosophy.
7. Source: Moody’s Investors Service, “Special Comment: 2010 State Debt Medians Report,” May 2010.
8. This does not indicate S&P’s rating of the Fund.
54 | Annual Report
Performance Summary as of 2/28/11
Franklin Minnesota Tax-Free Income Fund
Your dividend income will vary depending on dividends or interest paid by securities in the Fund’s portfolio, adjusted for operating expenses of each class. Capital gain distributions are net profits realized from the sale of portfolio securities. The performance table and graphs do not reflect any taxes that a shareholder would pay on Fund dividends, capital gain distributions, if any, or any realized gains on the sale of Fund shares. Total return reflects reinvestment of the Fund’s dividends and capital gain distributions, if any, and any unrealized gains or losses.
| | | | | | | | |
| Price and Distribution Information | | | | | | |
| Class A (Symbol: FMINX) | | | | Change | | 2/28/11 | | 2/28/10 |
| Net Asset Value (NAV) | | | -$ | 0.28 | $ | 11.92 | $ | 12.20 |
| Distributions (3/1/10–2/28/11) | | | | | | | | |
| Dividend Income | $ | 0.4619 | | | | | | |
| Class C (Symbol: FMNIX) | | | | Change | | 2/28/11 | | 2/28/10 |
| Net Asset Value (NAV) | | | -$ | 0.28 | $ | 12.02 | $ | 12.30 |
| Distributions (3/1/10–2/28/11) | | | | | | | | |
| Dividend Income | $ | 0.3927 | | | | | | |
| Advisor Class (Symbol: n/a) | | | | Change | | 2/28/11 | | 2/28/10 |
| Net Asset Value (NAV) | | | -$ | 0.28 | $ | 11.92 | $ | 12.20 |
| Distributions (3/1/10–2/28/11) | | | | | | | | |
| Dividend Income | $ | 0.4739 | | | | | | |
Annual Report | 55
Performance Summary (continued)
Performance
Cumulative total return excludes sales charges. Average annual total returns include maximum sales charges. Class A: 4.25% maximum initial sales charge; Class C: 1% contingent deferred sales charge in first year only; Advisor Class: no sales charges.
| | | | | | | | | | | |
| Class A | | | | 1-Year | | | 5-Year | | | 10-Year | |
| Cumulative Total Return1 | | | + | 1.49 | % | + | 20.28 | % | + | 53.44 | % |
| Average Annual Total Return2 | | | | -2.81 | % | + | 2.86 | % | + | 3.92 | % |
| Avg. Ann. Total Return (3/31/11)3 | | | | -2.89 | % | + | 2.94 | % | + | 3.79 | % |
| Distribution Rate4 | 3.67 | % | | | | | | | | | |
| Taxable Equivalent Distribution Rate5 | 6.13 | % | | | | | | | | | |
| 30-Day Standardized Yield6 | 3.49 | % | | | | | | | | | |
| Taxable Equivalent Yield5 | 5.83 | % | | | | | | | | | |
| Total Annual Operating Expenses7 | 0.65 | % | | | | | | | | | |
| Class C | | | | 1-Year | | | 5-Year | | | 10-Year | |
| Cumulative Total Return1 | | | + | 0.99 | % | + | 17.04 | % | + | 45.40 | % |
| Average Annual Total Return2 | | | + | 0.01 | % | + | 3.20 | % | + | 3.81 | % |
| Avg. Ann. Total Return (3/31/11)3 | | | | -0.11 | % | + | 3.27 | % | + | 3.67 | % |
| Distribution Rate4 | 3.28 | % | | | | | | | | | |
| Taxable Equivalent Distribution Rate5 | 5.48 | % | | | | | | | | | |
| 30-Day Standardized Yield6 | 3.10 | % | | | | | | | | | |
| Taxable Equivalent Yield5 | 5.18 | % | | | | | | | | | |
| Total Annual Operating Expenses7 | 1.20 | % | | | | | | | | | |
| Advisor Class8 | | | | 1-Year | | | 5-Year | | | 10-Year | |
| Cumulative Total Return1 | | | + | 1.59 | % | + | 20.48 | % | + | 53.69 | % |
| Average Annual Total Return2 | | | + | 1.59 | % | + | 3.80 | % | + | 4.39 | % |
| Avg. Ann. Total Return (3/31/11)3 | | | + | 1.54 | % | + | 3.87 | % | + | 4.26 | % |
| Distribution Rate4 | 3.93 | % | | | | | | | | | |
| Taxable Equivalent Distribution Rate5 | 6.56 | % | | | | | | | | | |
| 30-Day Standardized Yield6 | 3.76 | % | | | | | | | | | |
| Taxable Equivalent Yield5 | 6.28 | % | | | | | | | | | |
| Total Annual Operating Expenses7 | 0.55 | % | | | | | | | | | |
Performance data represent past performance, which does not guarantee future results. Investment return and principal value will fluctuate, and you may have a gain or loss when you sell your shares. Current performance may differ from figures shown. For most recent month-end performance, go to franklintempleton.com or call (800) 342-5236.
56 | Annual Report
Performance Summary (continued)
Total Return Index Comparison for a Hypothetical $10,000 Investment
Total return represents the change in value of an investment over the periods shown. It includes any current, applicable, maximum sales charge, Fund expenses, account fees and reinvested distributions. The unmanaged index includes reinvestment of any income or distributions. It differs from the Fund in composition and does not pay management fees or expenses. One cannot invest directly in an index.


| | | | | |
| 3/01 | 2/03 | 2/05 | 2/07 | 2/09 | 2/11 |
| |
| |
| Franklin Minnesota | | BC Municipal Bond Index 9 | | CPI9 |
| Tax-Free Income Fund | | | | |
58 | Annual Report
Performance Summary (continued)
Endnotes
Because municipal bonds are sensitive to interest rate movements, the Fund’s yield and share price will fluctuate with market conditions. Bond prices generally move in the opposite direction of interest rates. Thus, as prices of bonds in the Fund adjust to a rise in interest rates, the Fund’s share price may decline. Since the Fund concentrates its investments in a single state, it is subject to greater risk of adverse economic and regulatory changes in that state than a geographically diversified fund. The manager applies various techniques and analyses in making investment decisions for the Fund, but there can be no guarantee that these decisions will produce the desired results. The Fund’s prospectus also includes a description of the main investment risks.
| |
| Class C: | Prior to 1/1/04, these shares were offered with an initial sales charge; thus actual total returns would have differed. These shares |
| | have higher annual fees and expenses than Class A shares. |
| |
| Advisor Class: | Shares are available to certain eligible investors as described in the prospectus. |
1. Cumulative total return represents the change in value of an investment over the periods indicated.
2. Average annual total return represents the average annual change in value of an investment over the periods indicated.
3. In accordance with SEC rules, we provide standardized average annual total return information through the latest calendar quarter.
4. Distribution rate is based on an annualization of the respective class’s current monthly dividend and the maximum offering price (NAV for Classes C and Advisor) per share on 2/28/11.
5. Taxable equivalent distribution rate and yield assume the published rates as of 12/28/10 for the maximum combined effective federal and Minnesota personal income tax rate of 40.10%, based on the federal income tax rate of 35.00%.
6. The 30-day standardized yield for the month ended 2/28/11 reflects an estimated yield to maturity (assuming all portfolio securities are held to maturity). It should be regarded as an estimate of the Fund’s rate of investment income, and it may not equal the Fund’s actual income distribution rate (which reflects the Fund’s past dividends paid to shareholders) or the income reported in the Fund’s financial statements.
7. Figures are as stated in the Fund’s prospectus current as of the date of this report. In periods of market volatility, assets may decline significantly, causing total annual Fund operating expenses to become higher than the figures shown.
8. Effective 7/1/09, the Fund began offering Advisor Class shares, which do not have sales charges or a Rule 12b-1 plan. Performance quotations for this class reflect the following methods of calculation: (a) For periods prior to 7/1/09, a restated figure is used based upon the Fund’s Class A performance, excluding the effect of Class A’s maximum initial sales charge, but reflecting the effect of the Class A Rule 12b-1 fees; and (b) for periods after 6/30/09, actual Advisor Class performance is used reflecting all charges and fees applicable to that class. Since 7/1/09 (commencement of sales), the cumulative and average annual total returns of Advisor Class shares were +6.81% and +4.04%.
9. Source: © 2011 Morningstar. The BC Municipal Bond Index is a market value-weighted index engineered for the long-term tax-exempt bond market. To be included in the index, bonds must be fixed rate, have at least one year to final maturity and be rated investment grade (Baa3/BBB- or higher) by at least two of the following agencies: Moody’s, Standard & Poor’s and Fitch. The Consumer Price Index (CPI), calculated by the U.S. Bureau of Labor Statistics, is a commonly used measure of the inflation rate.
Annual Report | 59
Your Fund’s Expenses
Franklin Minnesota Tax-Free Income Fund
As a Fund shareholder, you can incur two types of costs:
- Transaction costs, including sales charges (loads) on Fund purchases; and
- Ongoing Fund costs, including management fees, distribution and service (12b-1) fees, and other Fund expenses. All mutual funds have ongoing costs, sometimes referred to as operating expenses.
The following table shows ongoing costs of investing in the Fund and can help you understand these costs and compare them with those of other mutual funds. The table assumes a $1,000 investment held for the six months indicated.
Actual Fund Expenses
The first line (Actual) for each share class listed in the table provides actual account values and expenses. The “Ending Account Value” is derived from the Fund’s actual return, which includes the effect of Fund expenses.
You can estimate the expenses you paid during the period by following these steps. Of course, your account value and expenses will differ from those in this illustration:
| 1. | Divide your account value by $1,000. |
| | If an account had an $8,600 value, then $8,600 ÷ $1,000 = 8.6. |
| 2. | Multiply the result by the number under the heading “Expenses Paid During Period.” |
| | If Expenses Paid During Period were $7.50, then 8.6 x $7.50 = $64.50. |
In this illustration, the estimated expenses paid this period are $64.50.
Hypothetical Example for Comparison with Other Funds
Information in the second line (Hypothetical) for each class in the table can help you compare ongoing costs of investing in the Fund with those of other mutual funds. This information may not be used to estimate the actual ending account balance or expenses you paid during the period. The hypothetical “Ending Account Value” is based on the actual expense ratio for each class and an assumed 5% annual rate of return before expenses, which does not represent the Fund’s actual return. The figure under the heading “Expenses Paid During Period” shows the hypothetical expenses your account would have incurred under this scenario. You can compare this figure with the 5% hypothetical examples that appear in shareholder reports of other funds.
60 | Annual Report
Your Fund’s Expenses (continued)
Please note that expenses shown in the table are meant to highlight ongoing costs and do not reflect any transaction costs, such as sales charges. Therefore, the second line for each class is useful in comparing ongoing costs only, and will not help you compare total costs of owning different funds. In addition, if transaction costs were included, your total costs would have been higher. Please refer to the Fund prospectus for additional information on operating expenses.
| | | | | | |
| | | Beginning Account | | Ending Account | | Expenses Paid During |
| Class A | | Value 9/1/10 | | Value 2/28/11 | | Period* 9/1/10–2/28/11 |
| Actual | $ | 1,000 | $ | 968.50 | $ | 3.17 |
| Hypothetical (5% return before expenses) | $ | 1,000 | $ | 1,021.57 | $ | 3.26 |
| Class C | | | | | | |
| Actual | $ | 1,000 | $ | 966.00 | $ | 5.85 |
| Hypothetical (5% return before expenses) | $ | 1,000 | $ | 1,018.84 | $ | 6.01 |
| Advisor Class | | | | | | |
| Actual | $ | 1,000 | $ | 968.20 | $ | 2.68 |
| Hypothetical (5% return before expenses) | $ | 1,000 | $ | 1,022.07 | $ | 2.76 |
*Expenses are calculated using the most recent six-month expense ratio, annualized for each class (A: 0.65%; C: 1.20%; and Advisor: 0.55%), multiplied by the average account value over the period, multiplied 181/365 to reflect the one-half year period.
Annual Report | 61
Franklin Ohio Tax-Free Income Fund
Your Fund’s Goal and Main Investments: Franklin Ohio Tax-Free Income Fund seeks to provide as high a level of income exempt from federal and Ohio personal income taxes as is consistent with prudent investment management and preservation of capital by investing at least 80% of its total assets in securities that pay interest free from such taxes.1
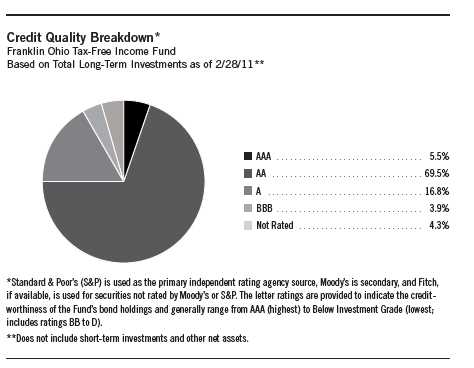
Performance data represent past performance, which does not guarantee future results. Investment return and principal value will fluctuate, and you may have a gain or loss when you sell your shares. Current performance may differ from figures shown. Please visit franklintempleton.com or call (800) 342-5236 for most recent month-end performance.
This annual report for Franklin Ohio Tax-Free Income Fund covers the fiscal year ended February 28, 2011.
Performance Overview
The Fund’s Class A share price, as measured by net asset value, decreased from $12.50 on February 28, 2010, to $11.99 on February 28, 2011. The Fund’s
|
| 1. For investors subject to alternative minimum tax, a small portion of Fund dividends may be taxable. Distributions |
| of capital gains are generally taxable. To avoid imposition of 28% backup withholding on all Fund distributions and |
| redemption proceeds, U.S. investors must be properly certified on Form W-9 and non-U.S. investors on Form W-8BEN. |
| |
| The dollar value, number of shares or principal amount, and names of all portfolio holdings are listed in the Fund’s |
| Statement of Investments (SOI). The SOI begins on page 145. |
62 | Annual Report
| | | | |
| Dividend Distributions* | | | | |
| Franklin Ohio Tax-Free Income Fund | | | |
| | | Dividend per Share | |
| Month | Class A | Class B | Class C | Advisor Class |
| March 2010 | 4.20 cents | 3.62 cents | 3.61 cents | 4.31 cents |
| April 2010 | 4.20 cents | 3.62 cents | 3.61 cents | 4.31 cents |
| May 2010 | 4.20 cents | 3.62 cents | 3.61 cents | 4.31 cents |
| June 2010 | 4.20 cents | 3.66 cents | 3.63 cents | 4.30 cents |
| July 2010 | 4.20 cents | 3.66 cents | 3.63 cents | 4.30 cents |
| August 2010 | 4.20 cents | 3.66 cents | 3.63 cents | 4.30 cents |
| September 2010 | 4.20 cents | 3.63 cents | 3.61 cents | 4.30 cents |
| October 2010 | 4.20 cents | 3.63 cents | 3.61 cents | 4.30 cents |
| November 2010 | 4.20 cents | 3.63 cents | 3.61 cents | 4.30 cents |
| December 2010 | 4.20 cents | 3.59 cents | 3.60 cents | 4.31 cents |
| January 2011 | 4.20 cents | 3.59 cents | 3.60 cents | 4.31 cents |
| February 2011 | 4.20 cents | 3.59 cents | 3.60 cents | 4.31 cents |
*Assumes shares were purchased and held for the entire accrual period, which differs from the calendar month. Since dividends accrue daily, your actual distributions will vary depending on the date you purchased your shares and any account activity. All Fund distributions will vary depending upon current market conditions, and past distributions are not indicative of future trends.
Class A shares paid dividends totaling 50.74 cents per share for the same period.2 The Performance Summary beginning on page 66 shows that at the end of this reporting period the Fund’s Class A shares’ distribution rate was 4.12% based on an annualization of the current 4.30 cent per share dividend and the maximum offering price of $12.52 on February 28, 2011. An investor in the 2011 maximum combined effective federal and Ohio personal income tax bracket of 38.85% would need to earn a distribution rate of 6.74% from a taxable investment to match the Fund’s Class A tax-free distribution rate. For the Fund’s Class B, C and Advisor shares’ performance, please see the Performance Summary.
State Update
Ohio’s broad and diverse economy continued to recover from the Great Recession at a slower pace than the nation. Due to years of below-average economic growth, state wealth and personal income remained below national averages. Continued housing market weakness and new foreclosures that ranked among the nation’s highest resulted in construction job losses during
2. All Fund distributions will vary depending upon current market conditions, and past distributions are not indicative of future trends.
Annual Report | 63
| | |
| Portfolio Breakdown | | |
| Franklin Ohio Tax-Free Income Fund | | |
| 2/28/11 | | |
| % of Total | |
| Long-Term Investments* | |
| General Obligation | 24.0 | % |
| Refunded | 18.9 | % |
| Higher Education | 12.6 | % |
| Hospital & Health Care | 12.3 | % |
| Utilities | 10.5 | % |
| Tax-Supported | 7.4 | % |
| Transportation | 5.6 | % |
| Subject to Government Appropriations | 4.1 | % |
| Other Revenue | 4.0 | % |
| Housing | 0.6 | % |
| |
| *Does not include short-term investments and other | |
| net assets. | | |
the recession and through most of the reporting period. Recent economic improvements reversed this trend, however, and toward period-end the construction sector showed some job gains. The manufacturing sector, which was the primary area of job loss during the recession and remained a major contributor to the state’s gross domestic product, strengthened as regional and national manufacturing activities improved. All other employment sectors showed gains, with the exception of information, financial activities and government. The state’s unemployment rate declined from 10.6% at the beginning of the period to 9.2% in February 2011, compared with the 8.9% national average.3
The state has a history of strong fiscal management and had implemented timely budget revisions in the past two years as revenues declined. State officials balanced the 2010-2011 biennial budget through spending cuts, revenue enhancements and significant use of nonrecurring measures, including federal stimulus funds and state reserves. For the first time in its history, Ohio restructured its debt to balance its biennial budget. The state closed the first year of the 2010-2011 biennium with a $139.1 million general revenue fund (GRF) budgetary balance, which was approximately $53 million lower than the estimate.4 As the state’s economy continued to improve, tax revenues increased, with higher total receipts for the first seven months of fiscal year 2011 than the same period in fiscal year 2010, leading state officials to project a greater GRF ending balance for fiscal year 2011.
Ohio’s debt levels were moderate, with rapid amortization despite its debt restructuring to balance the 2010-2011 biennial budget. The state’s net-tax supported debt was $933 per capita and 2.6% of personal income, compared with the national medians of $936 and 2.5%.5 Independent credit rating agency Standard & Poor’s affirmed Ohio’s AA+ general obligation rating with a negative outlook.6 The rating reflected the state’s vast and diverse economic base, strong management of its capital and debt program, and a track record of taking proactive and timely steps in managing budget shortfalls. The negative outlook reflected the state’s reliance on nonrecurring sources and reduced financial flexibility after depleting its budget stabilization reserve, leaving the state with limited options to address future budgetary challenges.
|
| 3. Source: Bureau of Labor Statistics. |
| 4. Source: Standard & Poor’s, “Summary: Ohio; General Obligation,” RatingsDirect, 2/4/11. |
| 5. Source: Moody’s Investors Service, “Special Comment: 2010 State Debt Medians Report,” May 2010. |
| 6. This does not indicate Standard & Poor’s rating of the Fund. |
64 | Annual Report
Manager’s Discussion
We used various investment strategies during the 12 months under review as we sought to maximize tax-free income for shareholders. Please read the discussion on page 6 for details.
Thank you for your continued participation in Franklin Ohio Tax-Free Income Fund. We intend to maintain our conservative, buy-and-hold investment strategy as we attempt to provide shareholders with high, current, tax-free income.
The foregoing information reflects our analysis, opinions and portfolio holdings as of February 28, 2011, the end of the reporting period. The way we implement our main investment strategies and the resulting portfolio holdings may change depending on factors such as market and economic conditions. These opinions may not be relied upon as investment advice or an offer for a particular security. The information is not a complete analysis of every aspect of any market, state, industry, security or the Fund. Statements of fact are from sources considered reliable, but the investment manager makes no representation or warranty as to their completeness or accuracy. Although historical performance is no guarantee of future results, these insights may help you understand our investment management philosophy.
Annual Report | 65
Performance Summary as of 2/28/11
Franklin Ohio Tax-Free Income Fund
Your dividend income will vary depending on dividends or interest paid by securities in the Fund’s portfolio, adjusted for operating expenses of each class. Capital gain distributions are net profits realized from the sale of portfolio securities. The performance table and graphs do not reflect any taxes that a shareholder would pay on Fund dividends, capital gain distributions, if any, or any realized gains on the sale of Fund shares. Total return reflects reinvestment of the Fund’s dividends and capital gain distributions, if any, and any unrealized gains or losses.
| | | | | | | | |
| Price and Distribution Information | | | | | | |
| Class A (Symbol: FTOIX) | | | | Change | | 2/28/11 | | 2/28/10 |
| Net Asset Value (NAV) | | | -$ | 0.51 | $ | 11.99 | $ | 12.50 |
| Distributions (3/1/10–2/28/11) | | | | | | | | |
| Dividend Income | $ | 0.5074 | | | | | | |
| Class B (Symbol: FBOIX) | | | | Change | | 2/28/11 | | 2/28/10 |
| Net Asset Value (NAV) | | | -$ | 0.51 | $ | 12.04 | $ | 12.55 |
| Distributions (3/1/10–2/28/11) | | | | | | | | |
| Dividend Income | $ | 0.4381 | | | | | | |
| Class C (Symbol: FOITX) | | | | Change | | 2/28/11 | | 2/28/10 |
| Net Asset Value (NAV) | | | -$ | 0.51 | $ | 12.11 | $ | 12.62 |
| Distributions (3/1/10–2/28/11) | | | | | | | | |
| Dividend Income | $ | 0.4366 | | | | | | |
| Advisor Class (Symbol: FROZX) | | | | Change | | 2/28/11 | | 2/28/10 |
| Net Asset Value (NAV) | | | -$ | 0.51 | $ | 11.99 | $ | 12.50 |
| Distributions (3/1/10–2/28/11) | | | | | | | | |
| Dividend Income | $ | 0.5200 | | | | | | |
66 | Annual Report
Performance Summary (continued)
Performance
Cumulative total return excludes sales charges. Average annual total returns include maximum sales charges. Class A: 4.25% maximum initial sales charge; Class B: contingent deferred sales charge (CDSC) declining from 4% to 1% over six years, and eliminated thereafter; Class C: 1% CDSC in first year only; Advisor Class: no sales charges.
| | | | | | | | | | | |
| Class A | | | | 1-Year | | | 5-Year | | | 10-Year | |
| Cumulative Total Return1 | | | | -0.06 | % | + | 17.12 | % | + | 51.52 | % |
| Average Annual Total Return2 | | | | -4.27 | % | + | 2.32 | % | + | 3.79 | % |
| Avg. Ann. Total Return (3/31/11)3 | | | | -4.96 | % | + | 2.31 | % | + | 3.62 | % |
| Distribution Rate4 | 4.12 | % | | | | | | | | | |
| Taxable Equivalent Distribution Rate5 | 6.74 | % | | | | | | | | | |
| 30-Day Standardized Yield6 | 3.51 | % | | | | | | | | | |
| Taxable Equivalent Yield5 | 5.74 | % | | | | | | | | | |
| Total Annual Operating Expenses7 | 0.64 | % | | | | | | | | | |
| Class B | | | | 1-Year | | | 5-Year | | | 10-Year | |
| Cumulative Total Return1 | | | | -0.62 | % | + | 13.97 | % | + | 45.19 | % |
| Average Annual Total Return2 | | | | -4.45 | % | + | 2.31 | % | + | 3.80 | % |
| Avg. Ann. Total Return (3/31/11)3 | | | | -5.12 | % | + | 2.27 | % | + | 3.62 | % |
| Distribution Rate4 | 3.75 | % | | | | | | | | | |
| Taxable Equivalent Distribution Rate5 | 6.13 | % | | | | | | | | | |
| 30-Day Standardized Yield6 | 3.14 | % | | | | | | | | | |
| Taxable Equivalent Yield5 | 5.14 | % | | | | | | | | | |
| Total Annual Operating Expenses7 | 1.19 | % | | | | | | | | | |
| Class C | | | | 1-Year | | | 5-Year | | | 10-Year | |
| Cumulative Total Return1 | | | | -0.63 | % | + | 13.94 | % | + | 43.50 | % |
| Average Annual Total Return2 | | | | -1.59 | % | + | 2.64 | % | + | 3.68 | % |
| Avg. Ann. Total Return (3/31/11)3 | | | | -2.18 | % | + | 2.63 | % | + | 3.52 | % |
| Distribution Rate4 | 3.72 | % | | | | | | | | | |
| Taxable Equivalent Distribution Rate5 | 6.08 | % | | | | | | | | | |
| 30-Day Standardized Yield6 | 3.14 | % | | | | | | | | | |
| Taxable Equivalent Yield5 | 5.14 | % | | | | | | | | | |
| Total Annual Operating Expenses7 | 1.19 | % | | | | | | | | | |
| Advisor Class8 | | | | 1-Year | | | 5-Year | | | 10-Year | |
| Cumulative Total Return1 | | | + | 0.04 | % | + | 17.43 | % | + | 51.92 | % |
| Average Annual Total Return2 | | | + | 0.04 | % | + | 3.27 | % | + | 4.27 | % |
| Avg. Ann. Total Return (3/31/11)3 | | | | -0.66 | % | + | 3.25 | % | + | 4.10 | % |
| Distribution Rate4 | 4.40 | % | | | | | | | | | |
| Taxable Equivalent Distribution Rate5 | 7.22 | % | | | | | | | | | |
| 30-Day Standardized Yield6 | 3.78 | % | | | | | | | | | |
| Taxable Equivalent Yield5 | 6.18 | % | | | | | | | | | |
| Total Annual Operating Expenses7 | 0.54 | % | | | | | | | | | |
Performance data represent past performance, which does not guarantee future results. Investment return and principal value will fluctuate, and you may have a gain or loss when you sell your shares. Current performance may differ from figures shown. For most recent month-end performance, go to franklintempleton.com or call (800) 342-5236.
Annual Report | 67
Performance Summary (continued)
Total Return Index Comparison for a Hypothetical $10,000 Investment
Total return represents the change in value of an investment over the periods shown. It includes any current, applicable, maximum sales charge, Fund expenses, account fees and reinvested distributions. The unmanaged index includes reinvestment of any income or distributions. It differs from the Fund in composition and does not pay management fees or expenses. One cannot invest directly in an index.

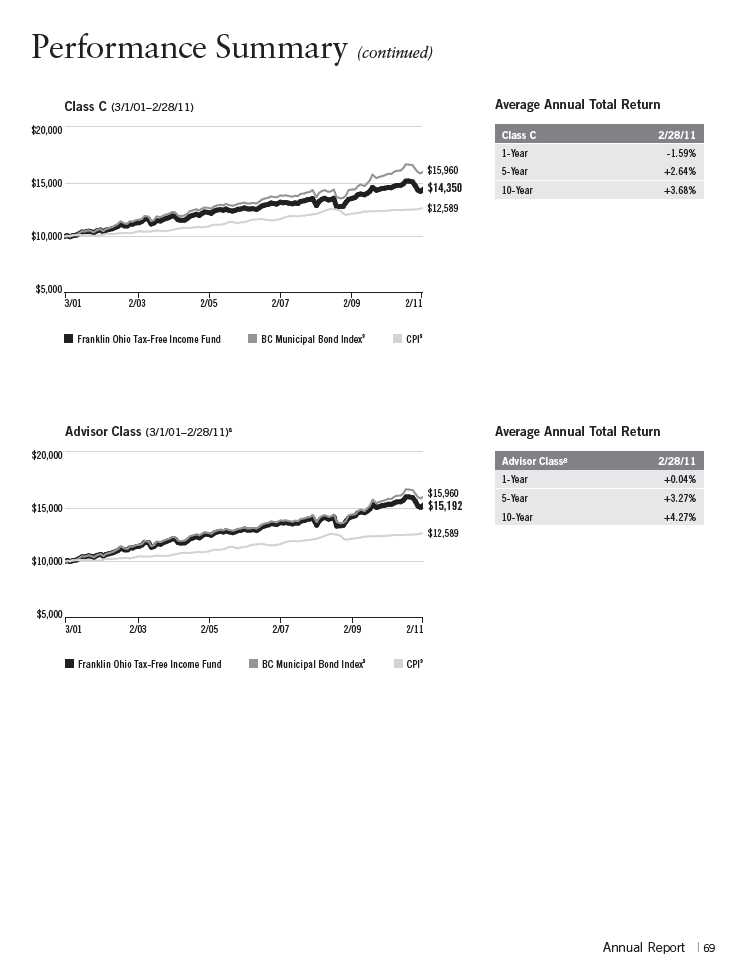
Performance Summary (continued)
Endnotes
Because municipal bonds are sensitive to interest rate movements, the Fund’s yield and share price will fluctuate with market conditions. Bond prices generally move in the opposite direction of interest rates. Thus, as prices of bonds in the Fund adjust to a rise in interest rates, the Fund’s share price may decline. Since the Fund concentrates its investments in a single state, it is subject to greater risk of adverse economic and regulatory changes in that state than a geographically diversified fund. The manager applies various techniques and analyses in making investment decisions for the Fund, but there can be no guarantee that these decisions will provide the desired results. The Fund’s prospectus also includes a description of the main investment risks.
| |
Class B: Class C: | These shares have higher annual fees and expenses than Class A shares. Prior to 1/1/04, these shares were offered with an initial sales charge; thus actual total returns would have differed. These shares have higher annual fees and expenses than Class A shares. |
Advisor Class: | Shares are available to certain eligible investors as described in the prospectus. |
1. Cumulative total return represents the change in value of an investment over the periods indicated.
2. Average annual total return represents the average annual change in value of an investment over the periods indicated.
3. In accordance with SEC rules, we provide standardized average annual total return information through the latest calendar quarter.
4. Distribution rate is based on an annualization of the respective class’s current monthly dividend and the maximum offering price (NAV for Classes B, C and Advisor) per share on 2/28/11.
5. Taxable equivalent distribution rate and yield assume the published rates as of 12/28/10 for the maximum combined effective federal and Ohio personal income tax rate of 38.85%, based on the federal income tax rate of 35.00%.
6. The 30-day standardized yield for the month ended 2/28/11 reflects an estimated yield to maturity (assuming all portfolio securities are held to maturity). It should be regarded as an estimate of the Fund’s rate of investment income, and it may not equal the Fund’s actual income distribution rate (which reflects the Fund’s past dividends paid to shareholders) or the income reported in the Fund’s financial statements.
7. Figures are as stated in the Fund’s prospectus current as of the date of this report. In periods of market volatility, assets may decline significantly, causing total annual Fund operating expenses to become higher than the figures shown.
8. Effective 7/1/08, the Fund began offering Advisor Class shares, which do not have sales charges or a Rule 12b-1 plan. Performance quotations for this class reflect the following methods of calculation: (a) For periods prior to 7/1/08, a restated figure is used based upon the Fund’s Class A performance, excluding the effect of Class A’s maximum initial sales charge, but reflecting the effect of the Class A Rule 12b-1 fees; and (b) for periods after 6/30/08, actual Advisor Class performance is used reflecting all charges and fees applicable to that class. Since 7/1/08 (commencement of sales), the cumulative and average annual total returns of Advisor Class shares were +9.46% and +3.45%.
9. Source: © 2011 Morningstar. The BC Municipal Bond Index is a market value-weighted index engineered for the long-term tax-exempt bond market. To be included in the index, bonds must be fixed rate, have at least one year to final maturity and be rated investment grade (Baa3/BBB- or higher) by at least two of the following agencies: Moody’s, Standard & Poor’s and Fitch. The Consumer Price Index (CPI), calculated by the U.S. Bureau of Labor Statistics, is a commonly used measure of the inflation rate.
70 | Annual Report
Your Fund’s Expenses
Franklin Ohio Tax-Free Income Fund
As a Fund shareholder, you can incur two types of costs:
- Transaction costs, including sales charges (loads) on Fund purchases; and
- Ongoing Fund costs, including management fees, distribution and service (12b-1) fees, and other Fund expenses. All mutual funds have ongoing costs, sometimes referred to as operating expenses.
The following table shows ongoing costs of investing in the Fund and can help you understand these costs and compare them with those of other mutual funds. The table assumes a $1,000 investment held for the six months indicated.
Actual Fund Expenses
The first line (Actual) for each share class listed in the table provides actual account values and expenses. The “Ending Account Value” is derived from the Fund’s actual return, which includes the effect of Fund expenses.
You can estimate the expenses you paid during the period by following these steps. Of course, your account value and expenses will differ from those in this illustration:
| 1. | Divide your account value by $1,000. |
| | If an account had an $8,600 value, then $8,600 ÷ $1,000 = 8.6. |
| 2. | Multiply the result by the number under the heading “Expenses Paid During Period.” |
| | If Expenses Paid During Period were $7.50, then 8.6 x $7.50 = $64.50. |
In this illustration, the estimated expenses paid this period are $64.50.
Hypothetical Example for Comparison with Other Funds
Information in the second line (Hypothetical) for each class in the table can help you compare ongoing costs of investing in the Fund with those of other mutual funds. This information may not be used to estimate the actual ending account balance or expenses you paid during the period. The hypothetical “Ending Account Value” is based on the actual expense ratio for each class and an assumed 5% annual rate of return before expenses, which does not represent the Fund’s actual return. The figure under the heading “Expenses Paid During Period” shows the hypothetical expenses your account would have incurred under this scenario. You can compare this figure with the 5% hypothetical examples that appear in shareholder reports of other funds.
Annual Report | 71
Your Fund’s Expenses (continued)
Please note that expenses shown in the table are meant to highlight ongoing costs and do not reflect any transaction costs, such as sales charges. Therefore, the second line for each class is useful in comparing ongoing costs only, and will not help you compare total costs of owning different funds. In addition, if transaction costs were included, your total costs would have been higher. Please refer to the Fund prospectus for additional information on operating expenses.
| | | | | | |
| | | Beginning Account | | Ending Account | | Expenses Paid During |
| Class A | | Value 9/1/10 | | Value 2/28/11 | | Period* 9/1/10–2/28/11 |
| Actual | $ | 1,000 | $ | 957.80 | $ | 3.11 |
| Hypothetical (5% return before expenses) | $ | 1,000 | $ | 1,021.62 | $ | 3.21 |
| Class B | | | | | | |
| Actual | $ | 1,000 | $ | 955.20 | $ | 5.77 |
| Hypothetical (5% return before expenses) | $ | 1,000 | $ | 1,018.89 | $ | 5.96 |
| Class C | | | | | | |
| Actual | $ | 1,000 | $ | 954.70 | $ | 5.77 |
| Hypothetical (5% return before expenses) | $ | 1,000 | $ | 1,018.89 | $ | 5.96 |
| Advisor Class | | | | | | |
| Actual | $ | 1,000 | $ | 958.30 | $ | 2.62 |
| Hypothetical (5% return before expenses) | $ | 1,000 | $ | 1,022.12 | $ | 2.71 |
*Expenses are calculated using the most recent six-month expense ratio, annualized for each class (A: 0.64%; B: 1.19%; C: 1.19%; and Advisor: 0.54%), multiplied by the average account value over the period, multiplied by 181/365 to reflect the one-half year period.
72 | Annual Report
Franklin Oregon Tax-Free Income Fund
Your Fund’s Goal and Main Investments: Franklin Oregon Tax-Free Income Fund
seeks to provide as high a level of income exempt from federal and Oregon personal income taxes as is consistent with prudent investment management and preservation of capital by investing at least 80% of its net assets in securities that pay interest free from such taxes.1
Performance data represent past performance, which does not guarantee future results. Investment return and principal value will fluctuate, and you may have a gain or loss when you sell your shares. Current performance may differ from figures shown. Please visit franklintempleton.com or call (800) 342-5236 for most recent month-end performance.
| | |
| Credit Quality Breakdown* | | |
| Franklin Oregon Tax-Free Income Fund | | |
| 2/28/11 | | |
| | % of Total | |
| Ratings | Long-Term Investments** | |
| AAA | 13.6 | % |
| AA | 47.3 | % |
| A | 21.3 | % |
| BBB | 16.2 | % |
| Below Investment Grade | 0.1 | % |
| Not Rated | 1.5 | % |
*Standard & Poor’s (S&P) is used as the primary independent rating agency source, Moody’s is secondary, and Fitch, if available, is used for securities not rated by Moody’s or S&P. The letter ratings are provided to indicate the credit-worthiness of the Fund’s bond holdings and generally range from AAA (highest) to Below Investment Grade (lowest; includes ratings BB to D).
**Does not include short-term investments and other net assets.
This annual report for Franklin Oregon Tax-Free Income Fund covers the fiscal year ended February 28, 2011.
Performance Overview
The Fund’s Class A share price, as measured by net asset value, decreased from $11.87 on February 28, 2010, to $11.48 on February 28, 2011. The Fund’s
1. For investors subject to alternative minimum tax, a small portion of Fund dividends may be taxable. Distributions of capital gains are generally taxable. To avoid imposition of 28% backup withholding on all Fund distributions and redemption proceeds, U.S. investors must be properly certified on Form W-9 and non-U.S. investors on Form W-8BEN.
The dollar value, number of shares or principal amount, and names of all portfolio holdings are listed in the Fund’s Statement of Investments (SOI). The SOI begins on page 160.
Annual Report | 73
| | | |
| Dividend Distributions* | | | |
| Franklin Oregon Tax-Free Income Fund | | | |
| | | Dividend per Share |
| Month | Class A | Class C | Advisor Class |
| March 2010 | 4.01 cents | 3.44 cents | 4.11 cents |
| April 2010 | 4.01 cents | 3.44 cents | 4.11 cents |
| May 2010 | 4.01 cents | 3.44 cents | 4.11 cents |
| June 2010 | 4.25 cents | 3.70 cents | 4.35 cents |
| July 2010 | 4.25 cents | 3.70 cents | 4.35 cents |
| August 2010 | 4.25 cents | 3.70 cents | 4.35 cents |
| September 2010 | 4.25 cents | 3.69 cents | 4.36 cents |
| October 2010 | 4.25 cents | 3.69 cents | 4.36 cents |
| November 2010 | 4.25 cents | 3.69 cents | 4.36 cents |
| December 2010 | 4.25 cents | 3.67 cents | 4.35 cents |
| January 2011 | 4.25 cents | 3.67 cents | 4.35 cents |
| February 2011 | 4.25 cents | 3.67 cents | 4.35 cents |
*Assumes shares were purchased and held for the entire accrual period, which differs from the calendar month. Since dividends accrue daily, your actual distributions will vary depending on the date you purchased your shares and any account activity. All Fund distributions will vary depending upon current market conditions, and past distributions are not indicative of future trends.
Class A shares paid dividends totaling 50.62 cents per share for the same period.2 The Performance Summary beginning on page 77 shows that at the end of this reporting period the Fund’s Class A shares’ distribution rate was 4.25% based on an annualization of the current 4.25 cent per share dividend and the maximum offering price of $11.99 on February 28, 2011. An investor in the 2011 maximum combined effective federal and Oregon personal income tax bracket of 42.15% would need to earn a distribution rate of 7.35% from a taxable investment to match the Fund’s Class A tax-free distribution rate. For the Fund’s Class C and Advisor shares’ performance, please see the Performance Summary.
State Update
Oregon began to recover from the Great Recession at a slower pace than the national average. The state’s unique dependence on personal income taxes
2. All Fund distributions will vary depending upon current market conditions, and past distributions are not indicative of future trends.
74 | Annual Report
posed challenges for Oregon as slow job growth weighed on tax collection revenues. Continued improvement of the state’s economy toward period-end resulted in declines for only one employment sector, financial activities. All other employment sectors showed gains, led by mining and logging and professional and business services. The state’s 10.2% unemployment rate was higher than the 8.9% national rate in February 2011.3
The state’s sound financial management, reinforced by strong executive authority to reduce expenditures, supported the state as revenue declines impacted the budget. State officials closed a $3.8 billion gap in the enacted 2009-2011 biennium budget through a combination of federal stimulus funds, the state’s own reserves, reduced expenditures and new revenues.4 The legislature and voters approved personal and corporate income tax increases. However, the state’s slow economic recovery produced weak personal and corporate tax receipts that caused the latest revenue forecast to decline significantly from the budget enacted in June 2009. To rebalance the budget and get the state on track to end the 2009-2011 biennium with an operating surplus, the governor made broad general fund expenditure reductions. In February 2011, the governor presented his 2011-2013 biennium balanced budget proposal to the legislature. The proposal limited expenditure growth to a level below the estimated $1.2 billion revenue growth.4 Unlike the 2009-2011 biennium budget, the 2011-2013 biennium proposal would not rely on nonrecurring resources to balance the budget.
Oregon’s debt levels were significantly higher than national averages. The state’s net tax-supported debt was 5.2% of personal income and $1,859 per capita, compared with the 2.5% and $936 national medians.5 Independent credit rating agency Moody’s Investors Service assigned Oregon’s general obligation bonds a rating of Aa1 with a stable outlook.6 The rating and outlook reflected the state’s maintenance of moderate reserves, effective voter initiative management to balance the budget and sufficiently funded pension systems. Moody’s expected Oregon’s debt levels to rise slightly but remain manageable.
| | |
| Portfolio Breakdown | | |
| Franklin Oregon Tax-Free Income Fund | |
| 2/28/11 | | |
| % of Total | |
| Long-Term Investments* | |
| General Obligation | 24.1 | % |
| Hospital & Health Care | 18.6 | % |
| Refunded | 13.5 | % |
| Transportation | 9.4 | % |
| Tax-Supported | 8.4 | % |
| Utilities | 8.2 | % |
| Subject to Government Appropriations | 5.6 | % |
| Higher Education | 5.1 | % |
| Other Revenue | 4.3 | % |
| Housing | 2.0 | % |
| Corporate-Backed | 0.8 | % |
| |
| *Does not include short-term investments and other | |
| net assets. | | |
|
| 3. Source: Bureau of Labor Statistics. |
| 4. Source: Moody’s Investors Service, “New Issue: Moody’s Assigns Aa1 Rating to $43 Million State of Oregon General |
| Obligation Alternate Energy Project Bonds,” 3/7/11. |
| 5. Source: Moody’s Investors Service, “Special Comment: 2010 State Debt Medians Report,” May 2010. |
| 6. This does not indicate Moody’s rating of the Fund. |
Annual Report | 75
Manager’s Discussion
We used various investment strategies during the 12 months under review as we sought to maximize tax-free income for shareholders. Please read the discussion on page 6 for details.
Thank you for your continued participation in Franklin Oregon Tax-Free Income Fund. We intend to maintain our conservative, buy-and-hold investment strategy as we attempt to provide shareholders with high, current, tax-free income.
The foregoing information reflects our analysis, opinions and portfolio holdings as of February 28, 2011, the end of the reporting period. The way we implement our main investment strategies and the resulting portfolio holdings may change depending on factors such as market and economic conditions. These opinions may not be relied upon as investment advice or an offer for a particular security. The information is not a complete analysis of every aspect of any market, state, industry, security or the Fund. Statements of fact are from sources considered reliable, but the investment manager makes no representation or warranty as to their completeness or accuracy. Although historical performance is no guarantee of future results, these insights may help you understand our investment management philosophy.
76 | Annual Report
Performance Summary as of 2/28/11
Franklin Oregon Tax-Free Income Fund
Your dividend income will vary depending on dividends or interest paid by securities in the Fund’s portfolio, adjusted for operating expenses of each class. Capital gain distributions are net profits realized from the sale of portfolio securities. The performance table and graphs do not reflect any taxes that a shareholder would pay on Fund dividends, capital gain distributions, if any, or any realized gains on the sale of Fund shares. Total return reflects reinvestment of the Fund’s dividends and capital gain distributions, if any, and any unrealized gains or losses.
| | | | | | | | |
| Price and Distribution Information | | | | | | |
| Class A (Symbol: FRORX) | | | | Change | | 2/28/11 | | 2/28/10 |
| Net Asset Value (NAV) | | | -$ | 0.39 | $ | 11.48 | $ | 11.87 |
| Distributions (3/1/10–2/28/11) | | | | | | | | |
| Dividend Income | $ | 0.5062 | | | | | | |
| Class C (Symbol: FORIX) | | | | Change | | 2/28/11 | | 2/28/10 |
| Net Asset Value (NAV) | | | -$ | 0.38 | $ | 11.62 | $ | 12.00 |
| Distributions (3/1/10–2/28/11) | | | | | | | | |
| Dividend Income | $ | 0.4381 | | | | | | |
| Advisor Class (Symbol: FOFZX) | | | | Change | | 2/28/11 | | 2/28/10 |
| Net Asset Value (NAV) | | | -$ | 0.39 | $ | 11.48 | $ | 11.87 |
| Distributions (3/1/10–2/28/11) | | | | | | | | |
| Dividend Income | $ | 0.5185 | | | | | | |
Annual Report | 77
Performance Summary (continued)
Performance
Cumulative total return excludes sales charges. Average annual total returns include maximum sales charges. Class A: 4.25% maximum initial sales charge; Class C: 1% contingent deferred sales charge in first year only; Advisor Class: no sales charges.
| | | | | | | | | | | |
| Class A | | | | 1-Year | | | 5-Year | | | 10-Year | |
| Cumulative Total Return1 | | | + | 0.94 | % | + | 19.14 | % | + | 55.77 | % |
| Average Annual Total Return2 | | | | -3.37 | % | + | 2.67 | % | + | 4.08 | % |
| Avg. Ann. Total Return (3/31/11)3 | | | | -3.89 | % | + | 2.74 | % | + | 3.95 | % |
| Distribution Rate4 | 4.25 | % | | | | | | | | | |
| Taxable Equivalent Distribution Rate5 | 7.35 | % | | | | | | | | | |
| 30-Day Standardized Yield6 | 3.67 | % | | | | | | | | | |
| Taxable Equivalent Yield5 | 6.34 | % | | | | | | | | | |
| Total Annual Operating Expenses7 | 0.64 | % | | | | | | | | | |
| Class C | | | | 1-Year | | | 5-Year | | | 10-Year | |
| Cumulative Total Return1 | | | + | 0.44 | % | + | 15.97 | % | + | 47.68 | % |
| Average Annual Total Return2 | | | | -0.53 | % | + | 3.01 | % | + | 3.98 | % |
| Avg. Ann. Total Return (3/31/11)3 | | | | -1.12 | % | + | 3.06 | % | + | 3.82 | % |
| Distribution Rate4 | 3.87 | % | | | | | | | | | |
| Taxable Equivalent Distribution Rate5 | 6.69 | % | | | | | | | | | |
| 30-Day Standardized Yield6 | 3.29 | % | | | | | | | | | |
| Taxable Equivalent Yield5 | 5.69 | % | | | | | | | | | |
| Total Annual Operating Expenses7 | 1.19 | % | | | | | | | | | |
| Advisor Class8 | | | | 1-Year | | | 5-Year | | | 10-Year | |
| Cumulative Total Return1 | | | + | 1.04 | % | + | 19.33 | % | + | 56.01 | % |
| Average Annual Total Return2 | | | + | 1.04 | % | + | 3.60 | % | + | 4.55 | % |
| Avg. Ann. Total Return (3/31/11)3 | | | + | 0.52 | % | + | 3.67 | % | + | 4.42 | % |
| Distribution Rate4 | 4.54 | % | | | | | | | | | |
| Taxable Equivalent Distribution Rate5 | 7.85 | % | | | | | | | | | |
| 30-Day Standardized Yield6 | 3.90 | % | | | | | | | | | |
| Taxable Equivalent Yield5 | 6.74 | % | | | | | | | | | |
| Total Annual Operating Expenses7 | 0.54 | % | | | | | | | | | |
Performance data represent past performance, which does not guarantee future results. Investment return and principal value will fluctuate, and you may have a gain or loss when you sell your shares. Current performance may differ from figures shown. For most recent month-end performance, go to franklintempleton.com or call (800) 342-5236.
78 | Annual Report
Performance Summary (continued)
Total Return Index Comparison for a Hypothetical $10,000 Investment
Total return represents the change in value of an investment over the periods shown. It includes any current, applicable, maximum sales charge, Fund expenses, account fees and reinvested distributions. The unmanaged index includes reinvestment of any income or distributions. It differs from the Fund in composition and does not pay management fees or expenses. One cannot invest directly in an index.

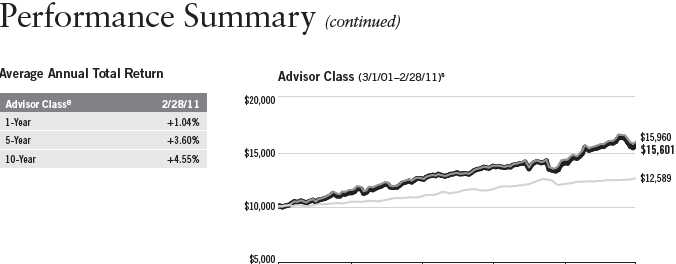
| | | | | |
| 3/01 | 2/03 | 2/05 | 2/07 | 2/09 | 2/11 |
| Franklin Oregon Tax-Free Income Fund | BC Municipal Bond Index 9 | CPI9 |
80 | Annual Report
Performance Summary (continued)
Endnotes
Because municipal bonds are sensitive to interest rate movements, the Fund’s yield and share price will fluctuate with market conditions. Bond prices generally move in the opposite direction of interest rates. Thus, as prices of bonds in the Fund adjust to a rise in interest rates, the Fund’s share price may decline. Since the Fund concentrates its investments in a single state, it is subject to greater risk of adverse economic and regulatory changes in that state than a geographically diversified fund. The manager applies various techniques and analyses in making investment decisions for the Fund, but there can be no guarantee that these decisions will produce the desired results. The Fund’s prospectus also includes a description of the main investment risks.
| |
| Class C: | Prior to 1/1/04, these shares were offered with an initial sales charge; thus actual total returns would have differed. These shares |
| | have higher annual fees and expenses than Class A shares. |
| |
| Advisor Class: | Shares are available to certain eligible investors as described in the prospectus. |
1. Cumulative total return represents the change in value of an investment over the periods indicated.
2. Average annual total return represents the average annual change in value of an investment over the periods indicated.
3. In accordance with SEC rules, we provide standardized average annual total return information through the latest calendar quarter.
4. Distribution rate is based on an annualization of the respective class’s current monthly dividend and the maximum offering price (NAV for Classes C and Advisor) per share on 2/28/11.
5. Taxable equivalent distribution rate and yield assume the published rates as of 12/28/10 for the maximum combined effective federal and Oregon personal income tax rate of 42.15%, based on the federal income tax rate of 35.00%.
6. The 30-day standardized yield for the month ended 2/28/11 reflects an estimated yield to maturity (assuming all portfolio securities are held to maturity). It should be regarded as an estimate of the Fund’s rate of investment income, and it may not equal the Fund’s actual income distribution rate (which reflects the Fund’s past dividends paid to shareholders) or the income reported in the Fund’s financial statements.
7. Figures are as stated in the Fund’s prospectus current as of the date of this report. In periods of market volatility, assets may decline significantly, causing total annual Fund operating expenses to become higher than the figures shown.
8. Effective 7/15/09, the Fund began offering Advisor Class shares, which do not have sales charges or a Rule 12b-1 plan. Performance quotations for this class reflect the following methods of calculation: (a) For periods prior to 7/15/09, a restated figure is used based upon the Fund’s Class A performance, excluding the effect of Class A’s maximum initial sales charge, but reflecting the effect of the Class A Rule 12b-1 fees; and (b) for periods after 7/14/09, actual Advisor Class performance is used reflecting all charges and fees applicable to that class. Since 7/15/09 (commencement of sales), the cumulative and average annual total returns of Advisor Class shares were +7.60% and +4.61%.
9. Source: © 2011 Morningstar. The BC Municipal Bond Index is a market value-weighted index engineered for the long-term tax-exempt bond market. To be included in the index, bonds must be fixed rate, have at least one year to final maturity and be rated investment grade (Baa3/BBB- or higher) by at least two of the following agencies: Moody’s, Standard & Poor’s and Fitch. The Consumer Price Index (CPI), calculated by the U.S. Bureau of Labor Statistics, is a commonly used measure of the inflation rate.
Annual Report | 81
Your Fund’s Expenses
Franklin Oregon Tax-Free Income Fund
As a Fund shareholder, you can incur two types of costs:
- Transaction costs, including sales charges (loads) on Fund purchases; and
- Ongoing Fund costs, including management fees, distribution and service (12b-1) fees, and other Fund expenses. All mutual funds have ongoing costs, sometimes referred to as operating expenses.
The following table shows ongoing costs of investing in the Fund and can help you understand these costs and compare them with those of other mutual funds. The table assumes a $1,000 investment held for the six months indicated.
Actual Fund Expenses
The first line (Actual) for each share class listed in the table provides actual account values and expenses. The “Ending Account Value” is derived from the Fund’s actual return, which includes the effect of Fund expenses.
You can estimate the expenses you paid during the period by following these steps. Of course, your account value and expenses will differ from those in this illustration:
| 1. | Divide your account value by $1,000. |
| | If an account had an $8,600 value, then $8,600 ÷ $1,000 = 8.6. |
| 2. | Multiply the result by the number under the heading “Expenses Paid During Period.” |
| | If Expenses Paid During Period were $7.50, then 8.6 x $7.50 = $64.50. |
In this illustration, the estimated expenses paid this period are $64.50.
Hypothetical Example for Comparison with Other Funds
Information in the second line (Hypothetical) for each class in the table can help you compare ongoing costs of investing in the Fund with those of other mutual funds. This information may not be used to estimate the actual ending account balance or expenses you paid during the period. The hypothetical “Ending Account Value” is based on the actual expense ratio for each class and an assumed 5% annual rate of return before expenses, which does not represent the Fund’s actual return. The figure under the heading “Expenses Paid During Period” shows the hypothetical expenses your account would have incurred under this scenario. You can compare this figure with the 5% hypothetical examples that appear in shareholder reports of other funds.
82 | Annual Report
Your Fund’s Expenses (continued)
Please note that expenses shown in the table are meant to highlight ongoing costs and do not reflect any transaction costs, such as sales charges. Therefore, the second line for each class is useful in comparing ongoing costs only, and will not help you compare total costs of owning different funds. In addition, if transaction costs were included, your total costs would have been higher. Please refer to the Fund prospectus for additional information on operating expenses.
| | | | | | |
| | | Beginning Account | | Ending Account | | Expenses Paid During |
| Class A | | Value 9/1/10 | | Value 2/28/11 | | Period* 9/1/10– 2/28/11 |
| Actual | $ | 1,000 | $ | 960.00 | $ | 3.06 |
| Hypothetical (5% return before expenses) | $ | 1,000 | $ | 1,021.67 | $ | 3.16 |
| Class C | | | | | | |
| Actual | $ | 1,000 | $ | 957.70 | $ | 5.73 |
| Hypothetical (5% return before expenses) | $ | 1,000 | $ | 1,018.94 | $ | 5.91 |
| Advisor Class | | | | | | |
| Actual | $ | 1,000 | $ | 960.50 | $ | 2.58 |
| Hypothetical (5% return before expenses) | $ | 1,000 | $ | 1,022.17 | $ | 2.66 |
*Expenses are calculated using the most recent six-month expense ratio, annualized for each class (A: 0.63%; C: 1.18%; and Advisor: 0.53%), multiplied by the average account value over the period, multiplied by 181/365 to reflect the one-half year period.
Annual Report | 83
Franklin Pennsylvania Tax-Free Income Fund
Your Fund’s Goal and Main Investments: Franklin Pennsylvania Tax-Free Income Fund seeks to provide as high a level of income exempt from federal and Pennsylvania personal income taxes as is consistent with prudent investment management and preservation of capital by investing at least 80% of its net assets in securities that pay interest free from such taxes.1
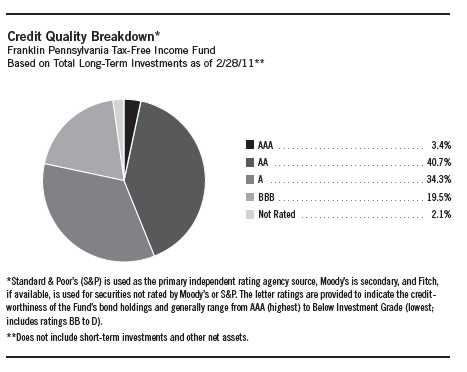
Performance data represent past performance, which does not guarantee future results. Investment return and principal value will fluctuate, and you may have a gain or loss when you sell your shares. Current performance may differ from figures shown. Please visit franklintempleton.com or call (800) 342-5236 for most recent month-end performance.
|
| This annual report for Franklin Pennsylvania Tax-Free Income Fund covers |
| AA |
| the fiscal year ended February 28, 2011. |
| |
| AAA |
Performance Overview
The Fund’s Class A share price, as measured by net asset value, decreased from $10.27 on February 28, 2010, to $9.83 on February 28, 2011. The Fund’s
1. For investors subject to alternative minimum tax, a small portion of Fund dividends may be taxable. Distributions of capital gains are generally taxable. To avoid imposition of 28% backup withholding on all Fund distributions and redemption proceeds, U.S. investors must be properly certified on Form W-9 and non-U.S. investors on Form W-8BEN.
The dollar value, number of shares or principal amount, and names of all portfolio holdings are listed in the Fund’s Statement of Investments (SOI). The SOI begins on page 172.
84 | Annual Report
| | | | |
| Dividend Distributions* | | | | |
| Franklin Pennsylvania Tax-Free Income Fund | | | |
| | | Dividend per Share | |
| Month | Class A | Class B | Class C | Advisor Class |
| March 2010 | 3.72 cents | 3.24 cents | 3.23 cents | 3.80 cents |
| April 2010 | 3.72 cents | 3.24 cents | 3.23 cents | 3.80 cents |
| May 2010 | 3.72 cents | 3.24 cents | 3.23 cents | 3.80 cents |
| June 2010 | 3.72 cents | 3.29 cents | 3.24 cents | 3.80 cents |
| July 2010 | 3.72 cents | 3.29 cents | 3.24 cents | 3.80 cents |
| August 2010 | 3.72 cents | 3.29 cents | 3.24 cents | 3.80 cents |
| September 2010 | 3.72 cents | 3.24 cents | 3.23 cents | 3.81 cents |
| October 2010 | 3.69 cents | 3.21 cents | 3.20 cents | 3.78 cents |
| November 2010 | 3.64 cents | 3.16 cents | 3.15 cents | 3.73 cents |
| December 2010 | 3.64 cents | 3.13 cents | 3.15 cents | 3.72 cents |
| January 2011 | 3.64 cents | 3.13 cents | 3.15 cents | 3.72 cents |
| February 2011 | 3.64 cents | 3.13 cents | 3.15 cents | 3.72 cents |
*Assumes shares were purchased and held for the entire accrual period, which differs from the calendar month. Since dividends accrue daily, your actual distributions will vary depending on the date you purchased your shares and any account activity. All Fund distributions will vary depending upon current market conditions, and past distributions are not indicative of future trends.
Class A shares paid dividends totaling 44.55 cents per share for the same period.2 The Performance Summary beginning on page 88 shows that at the end of this reporting period the Fund’s Class A shares’ distribution rate was 4.31% based on an annualization of the current 3.69 cent per share dividend and the maximum offering price of $10.27 on February 28, 2011. An investor in the 2011 maximum combined effective federal and Pennsylvania personal income tax bracket of 37.00% would need to earn a distribution rate of 6.84% from a taxable investment to match the Fund’s Class A tax-free distribution rate. For the Fund’s Class B, C and Advisor shares’ performance, please see the Performance Summary. Dividend distributions during the year under review were affected by securities purchased in the prior period and by falling municipal bond rates in 2009 through November 2010. In addition, for most of the Fund’s fiscal year, investor demand was strong for municipal bonds in an environment of limited tax-exempt supply. These factors resulted in reduced income for the portfolio and caused dividends to decline.
2. All Fund distributions will vary depending upon current market conditions, and past distributions are not indicative of future trends.
Annual Report | 85
| | |
| Portfolio Breakdown | | |
| Franklin Pennsylvania Tax-Free Income Fund | |
| 2/28/11 | | |
| % of Total | |
| Long-Term Investments* | |
| Higher Education | 22.0 | % |
| General Obligation | 21.6 | % |
| Hospital & Health Care | 13.0 | % |
| Utilities | 10.3 | % |
| Refunded | 9.8 | % |
| Transportation | 8.1 | % |
| Tax-Supported | 6.0 | % |
| Housing | 3.3 | % |
| Other Revenue | 3.0 | % |
| Subject to Government Appropriations | 2.1 | % |
| Corporate-Backed | 0.8 | % |
| |
| *Does not include short-term investments and other | |
| net assets. | | |
Commonwealth Update
Pennsylvania’s broad, diverse economy outperformed the national economy as it emerged from the Great Recession. Anchored by its large health care and higher education sectors, its wealth levels remained slightly above national averages. The commonwealth weathered the housing market crisis relatively well, with lower foreclosure rates and relatively more stable home prices than most states. New housing starts rebounded in 2010 and were projected to grow further in 2011. Continued improvement of the commonwealth’s economy resulted in declines for only two employment sectors, information and government. All other sectors showed gains, led by construction and mining and logging. The commonwealth’s unemployment rate was 8.0% in February 2011, compared with the 8.9% national rate.3
The commonwealth has a strong governance structure and a history of timely budget revisions when necessary. Due to continued general fund tax revenue declines, the commonwealth ended fiscal year 2010 with a general fund balance shortfall of $294 million.4 Although an improvement from fiscal year 2009, it demonstrated the fiscal stress the commonwealth faced, especially with its budget reserves exhausted. The enacted fiscal year 2011 budget, which reflected modest general fund tax revenue growth compared to the previous year, was balanced through spending cuts, federal stimulus funds, other nonrecurring measures and a projected $70 million from a proposed new tax on natural gas extraction.5 The new tax was not enacted, but given the size of the commonwealth’s fiscal year 2011 budget, closing the $70 million gap through other measures should be manageable. An improving economy contributed to better-than-forecast tax revenues as of November 2010. However, due to the effects of the recession, the commonwealth sought to establish safety net programs. In January 2011, the new governor requested the Budget Office to assess spending reduction options for the current fiscal year and directed the secretary of the budget to allocate $364.3 million of fiscal year 2011 appropriations into budgetary reserve.6
3. Source: Bureau of Labor Statistics.
4. Source: Governor’s Office of the Budget, “Comprehensive Annual Financial Report,” 6/30/10.
5. Source: Moody’s Investors Service, “New Issue: Moody’s Assigns Aa1 Rating to $1 Billion Pennsylvania General Obligation Bonds,” 11/8/10.
6. Source: Zogby, Charles B., Secretary, Office of the Budget, 1/28/11.
86 | Annual Report
Pennsylvania’s debt levels remained moderate and in line with national averages. The commonwealth’s net tax-supported debt was 2.4% of personal income and $938 per capita, compared with the 2.5% and $936 national medians.7 Independent credit rating agency Moody’s Investors Service assigned Pennsylvania’s general obligation bonds a rating of Aa1 with a negative outlook.8 The rating reflected the commonwealth’s moderate debt levels, the relative strength of its economy, and a governance structure that allows it to make swift budget revisions when needed. The negative outlook reflected the commonwealth’s negative fund balance and the challenges it would face in rebuilding reserves and reaching a long-term structural balance as it copes with the end of federal stimulus programs and an impending increase in pension contributions.
Manager’s Discussion
We used various investment strategies during the 12 months under review as we sought to maximize tax-free income for shareholders. Please read the discussion on page 6 for details.
Thank you for your continued participation in Franklin Pennsylvania Tax-Free Income Fund. We intend to maintain our conservative, buy-and-hold investment strategy as we attempt to provide shareholders with high, current, tax-free income.
The foregoing information reflects our analysis, opinions and portfolio holdings as of February 28, 2011, the end of the reporting period. The way we implement our main investment strategies and the resulting portfolio holdings may change depending on factors such as market and economic conditions. These opinions may not be relied upon as investment advice or an offer for a particular security. The information is not a complete analysis of every aspect of any market, state, industry, security or the Fund. Statements of fact are from sources considered reliable, but the investment manager makes no representation or warranty as to their completeness or accuracy. Although historical performance is no guarantee of future results, these insights may help you understand our investment management philosophy.
7. Source: Moody’s Investors Service, “Special Comment: 2010 State Debt Medians Report,” May 2010.
8. This does not indicate Moody’s rating of the Fund.
Annual Report | 87
Performance Summary as of 2/28/11
Franklin Pennsylvania Tax-Free Income Fund
Your dividend income will vary depending on dividends or interest paid by securities in the Fund’s portfolio, adjusted for operating expenses of each class. Capital gain distributions are net profits realized from the sale of portfolio securities. The performance table and graphs do not reflect any taxes that a shareholder would pay on Fund dividends, capital gain distributions, if any, or any realized gains on the sale of Fund shares. Total return reflects reinvestment of the Fund’s dividends and capital gain distributions, if any, and any unrealized gains or losses.
| | | | | | | | |
| Price and Distribution Information | | | | | | |
| Class A (Symbol: FRPAX) | | | | Change | | 2/28/11 | | 2/28/10 |
| Net Asset Value (NAV) | | | -$ | 0.44 | $ | 9.83 | $ | 10.27 |
| Distributions (3/1/10–2/28/11) | | | | | | | | |
| Dividend Income | $ | 0.4455 | | | | | | |
| Class B (Symbol: FBPTX) | | | | Change | | 2/28/11 | | 2/28/10 |
| Net Asset Value (NAV) | | | -$ | 0.44 | $ | 9.86 | $ | 10.30 |
| Distributions (3/1/10–2/28/11) | | | | | | | | |
| Dividend Income | $ | 0.3884 | | | | | | |
| Class C (Symbol: FRPTX) | | | | Change | | 2/28/11 | | 2/28/10 |
| Net Asset Value (NAV) | | | -$ | 0.44 | $ | 9.92 | $ | 10.36 |
| Distributions (3/1/10–2/28/11) | | | | | | | | |
| Dividend Income | $ | 0.3868 | | | | | | |
| Advisor Class (Symbol: FPFZX) | | | | Change | | 2/28/11 | | 2/28/10 |
| Net Asset Value (NAV) | | | -$ | 0.44 | $ | 9.83 | $ | 10.27 |
| Distributions (3/1/10–2/28/11) | | | | | | | | |
| Dividend Income | $ | 0.4554 | | | | | | |
88 | Annual Report
Performance Summary (continued)
Performance
Cumulative total return excludes sales charges. Average annual total returns include maximum sales charges. Class A: 4.25% maximum initial sales charge; Class B: contingent deferred sales charge (CDSC) declining from 4% to 1% over six years, and eliminated thereafter; Class C: 1% CDSC in first year only; Advisor Class: no sales charges.
| | | | | | | | | | | |
| Class A | | | | 1-Year | | | 5-Year | | | 10-Year | |
| Cumulative Total Return1 | | | | -0.02 | % | + | 17.02 | % | + | 52.38 | % |
| Average Annual Total Return2 | | | | -4.30 | % | + | 2.31 | % | + | 3.85 | % |
| Avg. Ann. Total Return (3/31/11)3 | | | | -4.93 | % | + | 2.30 | % | + | 3.69 | % |
| Distribution Rate4 | 4.31 | % | | | | | | | | | |
| Taxable Equivalent Distribution Rate5 | 6.84 | % | | | | | | | | | |
| 30-Day Standardized Yield6 | 4.02 | % | | | | | | | | | |
| Taxable Equivalent Yield5 | 6.38 | % | | | | | | | | | |
| Total Annual Operating Expenses7 | 0.65 | % | | | | | | | | | |
| Class B | | | | 1-Year | | | 5-Year | | | 10-Year | |
| Cumulative Total Return1 | | | | -0.58 | % | + | 13.79 | % | + | 45.99 | % |
| Average Annual Total Return2 | | | | -4.40 | % | + | 2.27 | % | + | 3.86 | % |
| Avg. Ann. Total Return (3/31/11)3 | | | | -5.10 | % | + | 2.28 | % | + | 3.69 | % |
| Distribution Rate4 | 3.99 | % | | | | | | | | | |
| Taxable Equivalent Distribution Rate5 | 6.33 | % | | | | | | | | | |
| 30-Day Standardized Yield6 | 3.67 | % | | | | | | | | | |
| Taxable Equivalent Yield5 | 5.83 | % | | | | | | | | | |
| Total Annual Operating Expenses7 | 1.20 | % | | | | | | | | | |
| Class C | | | | 1-Year | | | 5-Year | | | 10-Year | |
| Cumulative Total Return1 | | | | -0.58 | % | + | 13.88 | % | + | 44.17 | % |
| Average Annual Total Return2 | | | | -1.54 | % | + | 2.63 | % | + | 3.73 | % |
| Avg. Ann. Total Return (3/31/11)3 | | | | -2.26 | % | + | 2.64 | % | + | 3.57 | % |
| Distribution Rate4 | 3.94 | % | | | | | | | | | |
| Taxable Equivalent Distribution Rate5 | 6.25 | % | | | | | | | | | |
| 30-Day Standardized Yield6 | 3.67 | % | | | | | | | | | |
| Taxable Equivalent Yield5 | 5.83 | % | | | | | | | | | |
| Total Annual Operating Expenses7 | 1.20 | % | | | | | | | | | |
| Advisor Class8 | | | | 1-Year | | | 5-Year | | | 10-Year | |
| Cumulative Total Return1 | | | + | 0.08 | % | + | 17.20 | % | + | 52.61 | % |
| Average Annual Total Return2 | | | + | 0.08 | % | + | 3.23 | % | + | 4.32 | % |
| Avg. Ann. Total Return (3/31/11)3 | | | | -0.67 | % | + | 3.23 | % | + | 4.15 | % |
| Distribution Rate4 | 4.59 | % | | | | | | | | | |
| Taxable Equivalent Distribution Rate5 | 7.29 | % | | | | | | | | | |
| 30-Day Standardized Yield6 | 4.31 | % | | | | | | | | | |
| Taxable Equivalent Yield5 | 6.84 | % | | | | | | | | | |
| Total Annual Operating Expenses7 | 0.55 | % | | | | | | | | | |
Performance data represent past performance, which does not guarantee future results. Investment return and principal value will fluctuate, and you may have a gain or loss when you sell your shares. Current performance may differ from figures shown. For most recent month-end performance, go to franklintempleton.com or call (800) 342-5236.
Annual Report | 89
Performance Summary (continued)
Total Return Index Comparison for a Hypothetical $10,000 Investment
Total return represents the change in value of an investment over the periods shown. It includes any current, applicable, maximum sales charge, Fund expenses, account fees and reinvested distributions. The unmanaged index includes reinvestment of any income or distributions. It differs from the Fund in composition and does not pay management fees or expenses. One cannot invest directly in an index.
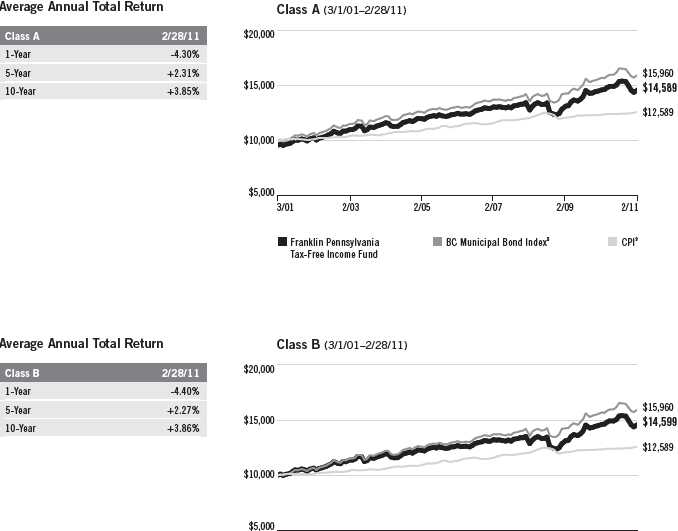
| | | | | |
| 3/01 | 2/03 | 2/05 | 2/07 | 2/09 | 2/11 |
| |
| |
| Franklin Pennsylvania | | BC Municipal Bond Index 9 | | CPI9 |
| Tax-Free Income Fund | | | | |
90 | Annual Report
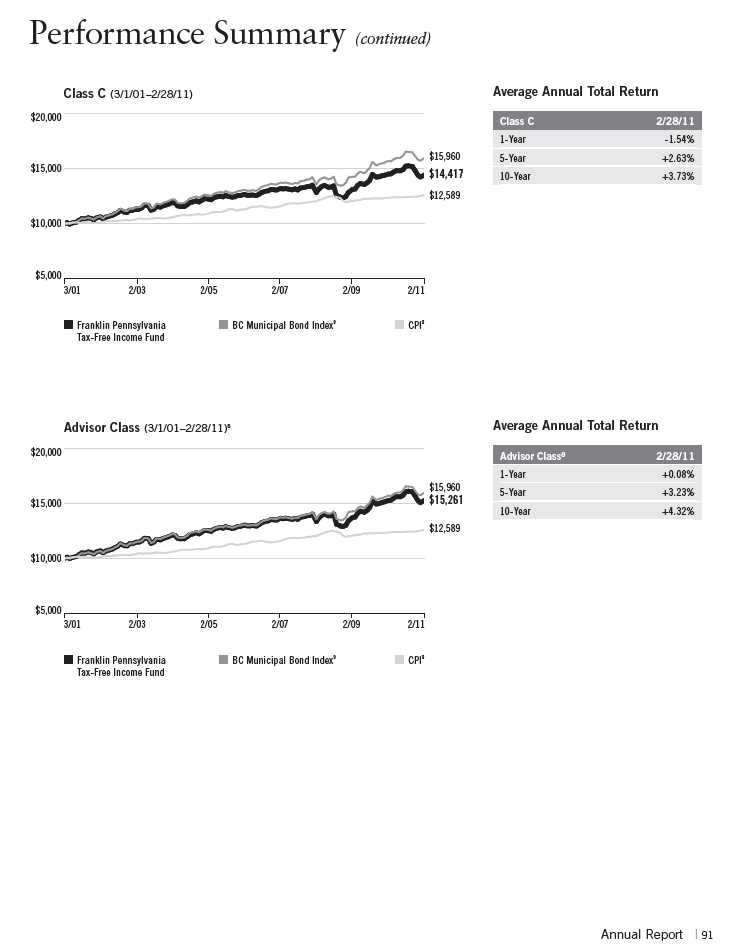
Performance Summary (continued)
Endnotes
Because municipal bonds are sensitive to interest rate movements, the Fund’s yield and share price will fluctuate with market conditions. Bond prices generally move in the opposite direction of interest rates. Thus, as prices of bonds in the Fund adjust to a rise in interest rates, the Fund’s share price may decline. Since the Fund concentrates its investments in a single state, it is subject to greater risk of adverse economic and regulatory changes in that state than a geographically diversified fund. The manager applies various techniques and analyses in making investment decisions for the Fund, but there can be no guarantee that these decisions will produce the desired results. The Fund’s prospectus also includes a description of the main investment risks.
| |
| Class B: | These shares have higher annual fees and expenses than Class A shares. |
| Class C: | Prior to 1/1/04, these shares were offered with an initial sales charge; thus actual total returns would have differed. These shares |
| | have higher annual fees and expenses than Class A shares. |
| Advisor Class: | Shares are available to certain eligible investors as described in the prospectus. |
|
| 1. Cumulative total return represents the change in value of an investment over the periods indicated. |
| 2. Average annual total return represents the average annual change in value of an investment over the periods indicated. |
| 3. In accordance with SEC rules, we provide standardized average annual total return information through the latest calendar quarter. |
| 4. Distribution rate is based on an annualization of the respective class’s current monthly dividend and the maximum offering price (NAV for |
| Classes B, C and Advisor) per share on 2/28/11. |
| 5. Taxable equivalent distribution rate and yield assume the published rates as of 12/28/10 for the maximum combined effective federal and |
| Pennsylvania personal income tax rate of 37.00%, based on the federal income tax rate of 35.00%. |
| 6. The 30-day standardized yield for the month ended 2/28/11 reflects an estimated yield to maturity (assuming all portfolio securities are held to |
| maturity). It should be regarded as an estimate of the Fund’s rate of investment income, and it may not equal the Fund’s actual income distribution |
| rate (which reflects the Fund’s past dividends paid to shareholders) or the income reported in the Fund’s financial statements. |
| 7. Figures are as stated in the Fund’s prospectus current as of the date of this report. In periods of market volatility, assets may decline significantly, |
| causing total annual Fund operating expenses to become higher than the figures shown. |
| 8. Effective 7/15/09, the Fund began offering Advisor Class shares, which do not have sales charges or a Rule 12b-1 plan. Performance quotations |
| for this class reflect the following methods of calculation: (a) For periods prior to 7/15/09, a restated figure is used based upon the Fund’s Class A |
| performance, excluding the effect of Class A’s maximum initial sales charge, but reflecting the effect of the Class A Rule 12b-1 fees; and (b) for peri- |
| ods after 7/14/09, actual Advisor Class performance is used reflecting all charges and fees applicable to that class. Since 7/15/09 (commencement |
| of sales), the cumulative and average annual total returns of Advisor Class shares were +6.50% and +3.95%. |
| 9. Source: © 2011 Morningstar. The BC Municipal Bond Index is a market value-weighted index engineered for the long-term tax-exempt bond |
| market. To be included in the index, bonds must be fixed rate, have at least one year to final maturity and be rated investment grade (Baa3/BBB- or |
| higher) by at least two of the following agencies: Moody’s, Standard & Poor’s and Fitch. The Consumer Price Index (CPI), calculated by the U.S. |
| Bureau of Labor Statistics, is a commonly used measure of the inflation rate. |
92 | Annual Report
Your Fund’s Expenses
Franklin Pennsylvania Tax-Free Income Fund
As a Fund shareholder, you can incur two types of costs:
- Transaction costs, including sales charges (loads) on Fund purchases; and
- Ongoing Fund costs, including management fees, distribution and service (12b-1) fees, and other Fund expenses. All mutual funds have ongoing costs, sometimes referred to as operating expenses.
The following table shows ongoing costs of investing in the Fund and can help you understand these costs and compare them with those of other mutual funds. The table assumes a $1,000 investment held for the six months indicated.
Actual Fund Expenses
The first line (Actual) for each share class listed in the table provides actual account values and expenses. The “Ending Account Value” is derived from the Fund’s actual return, which includes the effect of Fund expenses.
You can estimate the expenses you paid during the period by following these steps. Of course, your account value and expenses will differ from those in this illustration:
| 1. | Divide your account value by $1,000. |
| | If an account had an $8,600 value, then $8,600 ÷ $1,000 = 8.6. |
| 2. | Multiply the result by the number under the heading “Expenses Paid During Period.” |
| | If Expenses Paid During Period were $7.50, then 8.6 x $7.50 = $64.50. |
In this illustration, the estimated expenses paid this period are $64.50.
Hypothetical Example for Comparison with Other Funds
Information in the second line (Hypothetical) for each class in the table can help you compare ongoing costs of investing in the Fund with those of other mutual funds. This information may not be used to estimate the actual ending account balance or expenses you paid during the period. The hypothetical “Ending Account Value” is based on the actual expense ratio for each class and an assumed 5% annual rate of return before expenses, which does not represent the Fund’s actual return. The figure under the heading “Expenses Paid During Period” shows the hypothetical expenses your account would have incurred under this scenario. You can compare this figure with the 5% hypothetical examples that appear in shareholder reports of other funds.
Annual Report | 93
Your Fund’s Expenses (continued)
Please note that expenses shown in the table are meant to highlight ongoing costs and do not reflect any transaction costs, such as sales charges. Therefore, the second line for each class is useful in comparing ongoing costs only, and will not help you compare total costs of owning different funds. In addition, if transaction costs were included, your total costs would have been higher. Please refer to the Fund prospectus for additional information on operating expenses.
| | | | | | |
| | | Beginning Account | | Ending Account | | Expenses Paid During |
| Class A | | Value 9/1/10 | | Value 2/28/11 | | Period* 9/1/10– 2/28/11 |
| Actual | $ | 1,000 | $ | 950.50 | $ | 3.10 |
| Hypothetical (5% return before expenses) | $ | 1,000 | $ | 1,021.62 | $ | 3.21 |
| Class B | | | | | | |
| Actual | $ | 1,000 | $ | 946.90 | $ | 5.74 |
| Hypothetical (5% return before expenses) | $ | 1,000 | $ | 1,018.89 | $ | 5.96 |
| Class C | | | | | | |
| Actual | $ | 1,000 | $ | 947.30 | $ | 5.75 |
| Hypothetical (5% return before expenses) | $ | 1,000 | $ | 1,018.89 | $ | 5.96 |
| Advisor Class | | | | | | |
| Actual | $ | 1,000 | $ | 950.90 | $ | 2.61 |
| Hypothetical (5% return before expenses) | $ | 1,000 | $ | 1,022.12 | $ | 2.71 |
*Expenses are calculated using the most recent six-month expense ratio, annualized for each class (A: 0.64%; B: 1.19%; C: 1.19%; and Advisor: 0.54%), multiplied by the average account value over the period, multiplied by 181/365 to reflect the one-half year period.
94 | Annual Report
| | | | | | | | | | | | | | | |
| Franklin Tax-Free Trust | | | | | | | | | | | | | | | |
| Financial Highlights | | | | | | | | | | | | | | | |
| |
| Franklin Arizona Tax-Free Income Fund | | | | | | | | | | | | | | | |
| | | | | | Year Ended February 28, | | | | |
| Class A | | 2011 | | | 2010 | | | 2009 | | | 2008 | a | | 2007 | |
| Per share operating performance | | | | | | | | | | | | | | | |
| (for a share outstanding throughout the year) | | | | | | | | | | | | | | | |
| Net asset value, beginning of year | $ | 10.78 | | $ | 10.18 | | $ | 10.30 | | $ | 11.16 | | $ | 11.09 | |
| Income from investment operationsb: | | | | | | | | | | | | | | | |
| Net investment incomec | | 0.47 | | | 0.48 | | | 0.47 | | | 0.47 | | | 0.48 | |
| Net realized and unrealized gains (losses) | | (0.47 | ) | | 0.60 | | | (0.12 | ) | | (0.86 | ) | | 0.06 | |
| Total from investment operations | | — | | | 1.08 | | | 0.35 | | | (0.39 | ) | | 0.54 | |
| Less distributions from net investment income | | (0.48 | ) | | (0.48 | ) | | (0.47 | ) | | (0.47 | ) | | (0.47 | ) |
| Redemption feesd | | — | | | — | | | —e | | | —e | | | —e | |
| Net asset value, end of year | $ | 10.30 | | $ | 10.78 | | $ | 10.18 | | $ | 10.30 | | $ | 11.16 | |
| |
| Total returnf | | (0.09 | )% | | 10.84 | % | | 3.42 | % | | (3.62 | )% | | 5.05 | % |
| |
| Ratios to average net assets | | | | | | | | | | | | | | | |
| Expenses | | 0.62 | % | | 0.63 | % | | 0.62 | % | | 0.63 | % | | 0.63 | % |
| Net investment income | | 4.40 | % | | 4.55 | % | | 4.61 | % | | 4.29 | % | | 4.32 | % |
| |
| Supplemental data | | | | | | | | | | | | | | | |
| Net assets, end of year (000’s) | $ | 844,627 | | $ | 982,080 | | $ | 920,248 | | $ | 914,411 | | $ | 928,840 | |
| Portfolio turnover rate | | 13.61 | % | | 8.37 | % | | 21.01 | % | | 16.53 | % | | 6.56 | % |
|
| aFor the year ended February 29. |
| bThe amount shown for a share outstanding throughout the period may not correlate with the Statement of Operations for the period due to the timing of sales and repurchases of |
| the Fund shares in relation to income earned and/or fluctuating market value of the investments of the Fund. |
| cBased on average daily shares outstanding. |
| dEffective September 1, 2008, the redemption fee was eliminated. |
| eAmount rounds to less than $0.01 per share. |
| fTotal return does not reflect sales commissions or contingent deferred sales charges, if applicable. |
Annual Report | The accompanying notes are an integral part of these financial statements. | 95
| | | | | | | | | | | | | | | |
| Franklin Tax-Free Trust | | | | | | | | | | | | | | | |
| Financial Highlights (continued) | | | | | | | | | | | | | | | |
| |
| Franklin Arizona Tax-Free Income Fund | | | | | | | | | | | | | | | |
| | | | | | Year Ended February 28, | | | | |
| Class B | | 2011 | | | 2010 | | | 2009 | | | 2008 | a | | 2007 | |
| Per share operating performance | | | | | | | | | | | | | | | |
| (for a share outstanding throughout the year) | | | | | | | | | | | | | | | |
| Net asset value, beginning of year | $ | 10.85 | | $ | 10.24 | | $ | 10.36 | | $ | 11.22 | | $ | 11.15 | |
| Income from investment operationsb: | | | | | | | | | | | | | | | |
| Net investment incomec | | 0.42 | | | 0.43 | | | 0.42 | | | 0.41 | | | 0.42 | |
| Net realized and unrealized gains (losses) | | (0.48 | ) | | 0.61 | | | (0.13 | ) | | (0.86 | ) | | 0.06 | |
| Total from investment operations | | (0.06 | ) | | 1.04 | | | 0.29 | | | (0.45 | ) | | 0.48 | |
| Less distributions from net investment income | | (0.42 | ) | | (0.43 | ) | | (0.41 | ) | | (0.41 | ) | | (0.41 | ) |
| Redemption feesd | | — | | | — | | | —e | | | —e | | | —e | |
| Net asset value, end of year | $ | 10.37 | | $ | 10.85 | | $ | 10.24 | | $ | 10.36 | | $ | 11.22 | |
| |
| Total returnf | | (0.64 | )% | | 10.28 | % | | 2.84 | % | | (4.12 | )% | | 4.45 | % |
| |
| Ratios to average net assets | | | | | | | | | | | | | | | |
| Expenses | | 1.17 | % | | 1.17 | % | | 1.17 | % | | 1.18 | % | | 1.17 | % |
| Net investment income | | 3.85 | % | | 4.01 | % | | 4.06 | % | | 3.74 | % | | 3.78 | % |
| |
| Supplemental data | | | | | | | | | | | | | | | |
| Net assets, end of year (000’s) | $ | 4,645 | | $ | 8,833 | | $ | 14,276 | | $ | 17,854 | | $ | 21,061 | |
| Portfolio turnover rate | | 13.61 | % | | 8.37 | % | | 21.01 | % | | 16.53 | % | | 6.56 | % |
|
| aFor the year ended February 29. |
| bThe amount shown for a share outstanding throughout the period may not correlate with the Statement of Operations for the period due to the timing of sales and repurchases of |
| the Fund shares in relation to income earned and/or fluctuating market value of the investments of the Fund. |
| cBased on average daily shares outstanding. |
| dEffective September 1, 2008, the redemption fee was eliminated. |
| eAmount rounds to less than $0.01 per share. |
| fTotal return does not reflect sales commissions or contingent deferred sales charges, if applicable. |
96 | The accompanying notes are an integral part of these financial statements. | Annual Report
| | | | | | | | | | | | | | | |
| Franklin Tax-Free Trust | | | | | | | | | | | | | | | |
| Financial Highlights (continued) | | | | | | | | | | | | | | | |
| |
| Franklin Arizona Tax-Free Income Fund | | | | | | | | | | | | | | | |
| | | | | | Year Ended February 28, | | | | |
| Class C | | 2011 | | | 2010 | | | 2009 | | | 2008 | a | | 2007 | |
| Per share operating performance | | | | | | | | | | | | | | | |
| (for a share outstanding throughout the year) | | | | | | | | | | | | | | | |
| Net asset value, beginning of year | $ | 10.91 | | $ | 10.29 | | $ | 10.41 | | $ | 11.27 | | $ | 11.20 | |
| Income from investment operationsb: | | | | | | | | | | | | | | | |
| Net investment incomec | | 0.42 | | | 0.43 | | | 0.42 | | | 0.41 | | | 0.42 | |
| Net realized and unrealized gains (losses) | | (0.47 | ) | | 0.62 | | | (0.13 | ) | | (0.86 | ) | | 0.06 | |
| Total from investment operations | | (0.05 | ) | | 1.05 | | | 0.29 | | | (0.45 | ) | | 0.48 | |
| Less distributions from net investment income | | (0.42 | ) | | (0.43 | ) | | (0.41 | ) | | (0.41 | ) | | (0.41 | ) |
| Redemption feesd | | — | | | — | | | —e | | | —e | | | —e | |
| Net asset value, end of year | $ | 10.44 | | $ | 10.91 | | $ | 10.29 | | $ | 10.41 | | $ | 11.27 | |
| |
| Total returnf | | (0.56 | )% | | 10.32 | % | | 2.82 | % | | (4.11 | )% | | 4.42 | % |
| |
| Ratios to average net assets | | | | | | | | | | | | | | | |
| Expenses | | 1.17 | % | | 1.18 | % | | 1.17 | % | | 1.18 | % | | 1.18 | % |
| Net investment income | | 3.85 | % | | 4.00 | % | | 4.06 | % | | 3.74 | % | | 3.77 | % |
| |
| Supplemental data | | | | | | | | | | | | | | | |
| Net assets, end of year (000’s) | $ | 99,856 | | $ | 109,679 | | $ | 78,805 | | $ | 64,441 | | $ | 58,386 | |
| Portfolio turnover rate | | 13.61 | % | | 8.37 | % | | 21.01 | % | | 16.53 | % | | 6.56 | % |
|
| aFor the year ended February 29. |
| bThe amount shown for a share outstanding throughout the period may not correlate with the Statement of Operations for the period due to the timing of sales and repurchases of |
| the Fund shares in relation to income earned and/or fluctuating market value of the investments of the Fund. |
| cBased on average daily shares outstanding. |
| dEffective September 1, 2008, the redemption fee was eliminated. |
| eAmount rounds to less than $0.01 per share. |
| fTotal return does not reflect sales commissions or contingent deferred sales charges, if applicable. |
Annual Report | The accompanying notes are an integral part of these financial statements. | 97
| | | | | | | | | |
| Franklin Tax-Free Trust | | | | | | | | | |
| |
| Financial Highlights (continued) | | | | | | | | | |
| |
| Franklin Arizona Tax-Free Income Fund | | | | | | | | | |
| | | Year Ended February 28, | |
| Advisor Class | | 2011 | | | 2010 | | | 2009 | a |
| Per share operating performance | | | | | | | | | |
| (for a share outstanding throughout the year) | | | | | | | | | |
| Net asset value, beginning of year | $ | 10.80 | | $ | 10.18 | | $ | 10.64 | |
| Income from investment operationsb: | | | | | | | | | |
| Net investment incomec | | 0.49 | | | 0.50 | | | 0.33 | |
| Net realized and unrealized gains (losses) | | (0.48 | ) | | 0.62 | | | (0.47 | ) |
| Total from investment operations | | 0.01 | | | 1.12 | | | (0.14 | ) |
| Less distributions from net investment income | | (0.49 | ) | | (0.50 | ) | | (0.32 | ) |
| Redemption feesd | | — | | | — | | | —e | |
| Net asset value, end of year | $ | 10.32 | | $ | 10.80 | | $ | 10.18 | |
| |
| Total returnf | | 0.02 | % | | 11.15 | % | | (1.28 | )% |
| |
| Ratios to average net assetsg | | | | | | | | | |
| Expenses | | 0.52 | % | | 0.53 | % | | 0.52 | % |
| Net investment income | | 4.50 | % | | 4.65 | % | | 4.71 | % |
| |
| Supplemental data | | | | | | | | | |
| Net assets, end of year (000’s) | $ | 5,697 | | $ | 4,530 | | $ | 5 | |
| Portfolio turnover rate | | 13.61 | % | | 8.37 | % | | 21.01 | % |
| |
| |
| aFor the period July 1, 2008 (effective date) to February 28, 2009. | | | | | | | | | |
| bThe amount shown for a share outstanding throughout the period may not correlate with the Statement of Operations for the period due to the timing of sales and repurchases of | |
| the Fund shares in relation to income earned and/or fluctuating market value of the investments of the Fund. | | | | | | | | | |
| cBased on average daily shares outstanding. | | | | | | | | | |
| dEffective September 1, 2008, the redemption fee was eliminated. | | | | | | | | | |
| eAmount rounds to less than $0.01 per share. | | | | | | | | | |
| fTotal return is not annualized for periods less than one year. | | | | | | | | | |
| gRatios are annualized for periods less than one year. | | | | | | | | | |
98 | The accompanying notes are an integral part of these financial statements. | Annual Report
| | | | |
| Franklin Tax-Free Trust | | | | |
| |
| Statement of Investments, February 28, 2011 | | | | |
| |
| |
| Franklin Arizona Tax-Free Income Fund | | Principal Amount | | Value |
| Municipal Bonds 98.9% | | | | |
| Arizona 89.5% | | | | |
| Arizona Board of Regents Arizona State University System Revenue, Series C, 6.00%, | | | | |
| 7/01/26 | $ | 2,500,000 | $ | 2,692,900 |
| 7/01/27 | | 3,000,000 | | 3,212,310 |
| 7/01/28 | | 3,350,000 | | 3,567,951 |
| Arizona Health Facilities Authority Healthcare Education Facilities Revenue, Kirksville College, | | | | |
| 5.125%, 1/01/30 | | 2,250,000 | | 2,091,263 |
| Arizona Health Facilities Authority Hospital System Revenue, | | | | |
| John C. Lincoln Health Network, Pre-Refunded, 5.75%, 12/01/32 | | 3,280,000 | | 3,592,387 |
| Phoenix Baptist Hospital, NATL Insured, ETM, 6.25%, 9/01/11 | | 245,000 | | 248,653 |
| Arizona Health Facilities Authority Revenue, Banner Health, | | | | |
| Refunding, Series D, BHAC Insured, 5.50%, 1/01/38 | | 15,000,000 | | 15,024,151 |
| Series A, 5.00%, 1/01/35 | | 10,000,000 | | 9,178,100 |
| Series D, 5.50%, 1/01/38 | | 17,500,000 | | 16,996,875 |
| Arizona School Facilities Board COP, 5.50%, 9/01/23 | | 10,000,000 | | 10,378,900 |
| Arizona State COP, Department of Administration, | | | | |
| Series A, AGMC Insured, 5.25%, 10/01/26 | | 8,500,000 | | 8,742,250 |
| Series A, AGMC Insured, 5.00%, 10/01/29 | | 5,855,000 | | 5,858,806 |
| Series B, AGMC Insured, 5.00%, 10/01/28 | | 5,000,000 | | 5,028,800 |
| Series B, AGMC Insured, 5.00%, 10/01/29 | | 5,580,000 | | 5,583,794 |
| Arizona State Lottery Revenue, Series A, AGMC Insured, 5.00%, | | | | |
| 7/01/28 | | 15,540,000 | | 15,571,857 |
| 7/01/29 | | 10,000,000 | | 9,940,000 |
| Arizona State Municipal Financing Program COP, Refunding, Series 14, AMBAC Insured, | | | | |
| 5.00%, 8/01/33 | | 1,000,000 | | 1,003,200 |
| Arizona State University COP, | | | | |
| Downtown Campus/Mercado Project, Series A, NATL Insured, 5.80%, 7/01/24 | | 1,350,000 | | 1,354,023 |
| Research Infrastructure Projects, AMBAC Insured, 5.00%, 9/01/30 | | 17,250,000 | | 16,975,552 |
| Arizona State University Revenues, NATL RE, FGIC Insured, 5.00%, | | | | |
| 7/01/23 | | 2,890,000 | | 2,955,083 |
| 7/01/25 | | 2,250,000 | | 2,285,978 |
| Arizona Tourism and Sports Authority Tax Revenue, Multipurpose Stadium Facility, Series A, | | | | |
| NATL Insured, 5.00%, 7/01/28 | | 7,000,000 | | 6,740,300 |
| Downtown Phoenix Hotel Corp. Revenue, | | | | |
| Senior Series A, FGIC Insured, 5.00%, 7/01/40 | | 15,785,000 | | 11,748,775 |
| sub. bond, Series B, NATL RE, FGIC Insured, 5.00%, 7/01/36 | | 18,995,000 | | 15,993,030 |
| sub. bond, Series B, NATL RE, FGIC Insured, 5.00%, 7/01/40 | | 12,845,000 | | 10,637,587 |
| Gilbert Public Facilities Municipal Property Corp. Revenue, 5.50%, 7/01/28 | | 10,000,000 | | 10,489,200 |
| Gilbert Water Resource Municipal Property Corp. Water System Development Fee and Water | | | | |
| Revenue, sub. lien, NATL Insured, 5.00%, 10/01/29 | | 25,000,000 | | 24,849,500 |
| Glendale IDA Hospital Revenue, John C. Lincoln Health, Refunding, | | | | |
| 5.00%, 12/01/32 | | 4,025,000 | | 3,339,140 |
| 5.00%, 12/01/42 | | 12,870,000 | | 10,103,593 |
| Series B, 5.00%, 12/01/37 | | 3,000,000 | | 2,410,050 |
Annual Report | 99
| | | | |
| Franklin Tax-Free Trust | | | | |
| |
| Statement of Investments, February 28, 2011 (continued) | | | | |
| |
| |
| Franklin Arizona Tax-Free Income Fund | | Principal Amount | | Value |
| Municipal Bonds (continued) | | | | |
| Arizona (continued) | | | | |
| Glendale IDAR, Midwestern University, | | | | |
| 5.00%, 5/15/35 | $ | 5,000,000 | $ | 4,425,650 |
| 5.125%, 5/15/40 | | 10,000,000 | | 8,891,100 |
| Refunding, 5.00%, 5/15/31 | | 7,080,000 | | 6,677,360 |
| Glendale Water and Sewer Revenue, sub. lien, AMBAC Insured, 5.00%, 7/01/23 | | 2,000,000 | | 2,077,760 |
| Glendale Western Loop 101 Public Facilities Corp. Excise Tax Revenue, third lien, | | | | |
| Series A, 6.25%, 7/01/38 | | 10,000,000 | | 10,293,100 |
| Goodyear Community Facilities Utilities District No. 1 GO, AMBAC Insured, 5.00%, 7/15/32 | | 7,945,000 | | 7,771,004 |
| Greater Arizona Development Authority Infrastructure Revenue, Series B, NATL Insured, 5.00%, | | | | |
| 8/01/35 | | 9,090,000 | | 7,963,931 |
| Marana Municipal Property Corp. Municipal Facilities Revenue, | | | | |
| Refunding, NATL Insured, 5.25%, 7/01/22 | | 1,100,000 | | 1,106,776 |
| Series A, 5.00%, 7/01/28 | | 3,000,000 | | 3,008,910 |
| Maricopa County Hospital Revenue, Sun Health Corp., Pre-Refunded, 5.00%, 4/01/35 | | 12,090,000 | | 13,613,824 |
| Maricopa County IDA, MFHR, | | | | |
| Senior National Health Facilities II, Project A, AGMC Insured, ETM, 5.50%, 1/01/18 | | 2,000,000 | | 2,236,460 |
| Western Groves Apartments, Series A-1, AMBAC Insured, 5.30%, 12/01/22 | | 1,650,000 | | 1,515,624 |
| Maricopa County IDA Health Facility Revenue, | | | | |
| Catholic Healthcare West Project, Refunding, Series A, 5.00%, 7/01/16 | | 2,365,000 | | 2,367,980 |
| Catholic Healthcare West Project, Refunding, Series A, 5.375%, 7/01/23 | | 7,000,000 | | 7,096,180 |
| Catholic Healthcare West Project, Refunding, Series A, 5.50%, 7/01/26 | | 13,950,000 | | 14,011,938 |
| Catholic Healthcare West Project, Refunding, Series A, 6.00%, 7/01/39 | | 4,860,000 | | 4,852,953 |
| Catholic Healthcare West Project, Refunding, Series A, ACA Insured, 5.00%, 7/01/16 | | 1,180,000 | | 1,181,487 |
| Catholic Healthcare West Project, Refunding, Series A, ACA Insured, 5.00%, 7/01/21 | | 9,600,000 | | 9,601,536 |
| Mayo Clinic, 5.00%, 11/15/36 | | 25,750,000 | | 24,325,510 |
| Maricopa County IDA Hospital Facility Revenue, | | | | |
| Mayo Clinic Hospital, 5.25%, 11/15/37 | | 16,000,000 | | 15,661,280 |
| Mayo Clinic Hospital, AMBAC Insured, 5.25%, 11/15/37 | | 5,000,000 | | 4,894,150 |
| Samaritan Health Services, Series A, NATL Insured, ETM, 7.00%, 12/01/16 | | 1,890,000 | | 2,243,581 |
| Maricopa County IDA Senior Living Healthcare Revenue, Immanuel Care, Refunding, Series A, | | | | |
| GNMA Secured, 5.00%, 8/20/35 | | 1,725,000 | | 1,654,482 |
| Maricopa County PCC, PCR, | | | | |
| El Paso Electric Co. Project, Series A, 7.25%, 2/01/40 | | 10,000,000 | | 10,962,000 |
| Public Service Co. Palo Verde Project, Series A, AMBAC Insured, 5.05%, 5/01/29 | | 11,500,000 | | 10,502,375 |
| Southern California Edison Co., Refunding, Series A, 5.00%, 6/01/35 | | 795,000 | | 764,695 |
| Southern California Edison Co., Refunding, Series B, 5.00%, 6/01/35 | | 14,745,000 | | 14,182,921 |
| Various, Public Service Co., Palo Verde, Refunding, Series A, 6.25%, 1/01/38 | | 5,000,000 | | 5,035,950 |
| Maricopa County USD No. 89 Dysart GO, School Improvement, Project 06, Series B, | | | | |
| AGMC Insured, 5.00%, 7/01/27 | | 5,015,000 | | 5,162,591 |
| McAllister Academic Village LLC Revenue, Arizona State University Hassayampa, Refunding, | | | | |
| 5.25%, 7/01/33 | | 5,000,000 | | 4,896,650 |
| 5.00%, 7/01/38 | | 5,000,000 | | 4,601,950 |
| Assured Guaranty, 5.25%, 7/01/33 | | 2,525,000 | | 2,505,128 |
| Assured Guaranty, 5.00%, 7/01/38 | | 3,825,000 | | 3,571,250 |
100 | Annual Report
| | | | | |
| Franklin Tax-Free Trust | | | | | |
| |
| Statement of Investments, February 28, 2011 (continued) | | | | | |
| |
| |
| Franklin Arizona Tax-Free Income Fund | | | Principal Amount | | Value |
| Municipal Bonds (continued) | | | | | |
| Arizona (continued) | | | | | |
| Mesa Utility System Revenue, NATL Insured, Pre-Refunded, 5.00%, 7/01/26 | | $ | 10,000,000 | $ | 11,267,300 |
| Navajo County PCC Revenue, Mandatory Put 6/01/16, Series E, 5.75%, 6/01/34 | | | 6,000,000 | | 6,224,400 |
| Navajo County School District GO, School Improvement, Project 2008, Assured Guaranty, | | | | | |
| 5.50%, 7/01/28 | | | 1,045,000 | | 1,081,596 |
| Nogales Municipal Development Authority Inc. GO, NATL Insured, 5.00%, 6/01/36 | | | 6,075,000 | | 5,489,066 |
| Northern Arizona University COP, Northern Arizona University Research Projects, | | | | | |
| AMBAC Insured, 5.00%, 9/01/30 | | | 2,000,000 | | 1,871,460 |
| Northern Arizona University System Revenues, 5.00%, 6/01/38 | | | 5,000,000 | | 4,602,450 |
| Phoenix Civic Improvement Corp. Airport Revenue, | | | | | |
| junior lien, Series A, 5.00%, 7/01/40 | | | 10,000,000 | | 8,949,600 |
| senior lien, Series A, 5.00%, 7/01/38 | | | 10,000,000 | | 9,527,200 |
| senior lien, Series B, NATL RE, FGIC Insured, 5.25%, 7/01/22 | | | 3,000,000 | | 3,022,710 |
| senior lien, Series B, NATL RE, FGIC Insured, 5.25%, 7/01/23 | | | 5,000,000 | | 5,025,700 |
| senior lien, Series B, NATL RE, FGIC Insured, 5.25%, 7/01/27 | | | 15,250,000 | | 15,262,352 |
| Phoenix Civic Improvement Corp. Distribution Revenue, Capital Appreciation, Civic Plaza, | | | | | |
| Series B, NATL RE, FGIC Insured, zero cpn. to 7/01/13, 5.50% thereafter, | | | | | |
| 7/01/27 | | | 3,945,000 | | 3,746,093 |
| 7/01/28 | | | 2,000,000 | | 1,848,100 |
| 7/01/29 | | | 2,000,000 | | 1,832,080 |
| 7/01/36 | | | 5,000,000 | | 4,205,000 |
| 7/01/37 | | | 7,000,000 | | 5,918,220 |
| Phoenix Civic Improvement Corp. Excise Tax Revenue, Subordinated, Civic Plaza Expansion | | | | | |
| Project, Series A, NATL RE, FGIC Insured, 5.00%, | | | | | |
| 7/01/35 | | | 5,550,000 | | 5,265,341 |
| 7/01/41 | | | 5,000,000 | | 4,674,600 |
| Phoenix Civic Improvement Corp. Wastewater System Revenue, | | | | | |
| junior lien, Refunding, AGMC Insured, 5.00%, 7/01/37 | | | 10,515,000 | | 10,385,350 |
| junior lien, Refunding, NATL RE, FGIC Insured, 5.00%, 7/01/20 | | | 9,710,000 | | 9,793,700 |
| junior lien, Refunding, NATL RE, FGIC Insured, 5.125%, 7/01/21 | | | 10,000,000 | | 10,085,900 |
| junior lien, Refunding, NATL RE, FGIC Insured, 5.00%, 7/01/24 | | | 7,050,000 | | 7,083,346 |
| junior lien, Refunding, NATL RE, FGIC Insured, 5.00%, 7/01/28 | | | 2,000,000 | | 2,028,620 |
| junior lien, Refunding, NATL RE, FGIC Insured, 5.00%, 7/01/29 | | | 3,405,000 | | 3,446,371 |
| senior lien, Refunding, 5.50%, 7/01/24 | | | 2,500,000 | | 2,731,400 |
| Phoenix Civic Improvement Corp. Water System Revenue, junior lien, | | | | | |
| Refunding, NATL RE, FGIC Insured, 5.00%, 7/01/26 | | | 3,250,000 | | 3,281,363 |
| Series A, 5.00%, 7/01/39 | | | 14,780,000 | | 14,813,994 |
| Phoenix GO, Various Purpose, Series B, 5.00%, 7/01/27 | | | 8,360,000 | | 8,685,622 |
| Phoenix HFC Mortgage Revenue, Section 8 Assisted Projects, Refunding, Series A, | | | | | |
| NATL Insured, 6.90%, 1/01/23 | | | 960,000 | | 961,027 |
| Phoenix IDA Government Office Lease Revenue, Capitol Mall LLC II Project, AMBAC Insured, | | | | | |
| 5.00 | %, | | | | |
| 9/15/21 | | | 4,300,000 | | 4,333,927 |
| 9/15/28 | | | 4,000,000 | | 3,872,880 |
Annual Report | 101
| | | | |
| Franklin Tax-Free Trust | | | | |
| |
| Statement of Investments, February 28, 2011 (continued) | | | | |
| |
| |
| Franklin Arizona Tax-Free Income Fund | | Principal Amount | | Value |
| Municipal Bonds (continued) | | | | |
| Arizona (continued) | | | | |
| Phoenix IDA Student Housing Revenue, Downtown Phoenix Student Housing LLC, | | | | |
| Series A, AMBAC Insured, 5.00%, 7/01/37 | $ | 18,200,000 | $ | 12,704,874 |
| Series C, AMBAC Insured, 5.00%, 7/01/37 | | 9,350,000 | | 6,026,075 |
| Pima County IDA Lease Revenue, | | | | |
| Metro Police Facility, Nevada Project, Series A, 5.375%, 7/01/39 | | 2,000,000 | | 1,914,420 |
| Metro Police Facility, Nevada Project, Series A, 5.50%, 7/01/39 | | 7,500,000 | | 7,310,325 |
| Pima County Arizona, 5.125%, 9/01/27 | | 8,655,000 | | 8,697,842 |
| Pima County Arizona, 5.00%, 9/01/39 | | 15,000,000 | | 13,458,900 |
| Pinal County Electric District No. 4 Electric System Revenue, 6.00%, | | | | |
| 12/01/23 | | 525,000 | | 525,263 |
| 12/01/28 | | 740,000 | | 712,576 |
| 12/01/38 | | 1,150,000 | | 1,053,055 |
| Rio Nuevo Multipurpose Facilities District Excise Tax Revenue, sub. lien, Assured Guaranty, | | | | |
| 6.50%, 7/15/24 | | 4,220,000 | | 4,696,396 |
| Salt River Project Agricultural Improvement and Power District Electric System Revenue, | | | | |
| Salt River Project, Series A, 5.00%, 1/01/37 | | 14,000,000 | | 14,016,800 |
| Salt River Project, Series A, 5.00%, 1/01/39 | | 5,000,000 | | 4,977,300 |
| Series A, 5.00%, 1/01/38 | | 7,000,000 | | 6,968,780 |
| Salt Verde Financial Corp. Senior Gas Revenue, 5.00%, | | | | |
| 12/01/32 | | 10,000,000 | | 8,683,600 |
| 12/01/37 | | 10,000,000 | | 8,422,600 |
| San Luis Civic Improvement Corp. Municipal Facilities Excise Tax Revenue, XLCA Insured, | | | | |
| 5.00%, 7/01/38 | | 8,650,000 | | 7,495,917 |
| Scottsdale GO, Refunding, 5.00%, 7/01/22 | | 3,000,000 | | 3,059,460 |
| Scottsdale IDA Hospital Revenue, Scottsdale Healthcare, Refunding, Series A, | | | | |
| 5.25%, 9/01/30 | | 5,000,000 | | 4,840,000 |
| Scottsdale Municipal Property Corp. Excise Tax Revenue, | | | | |
| 5.00%, 7/01/36 | | 6,270,000 | | 6,311,382 |
| Water and Sewer Improvements Project, 5.00%, 7/01/33 | | 10,660,000 | | 10,890,469 |
| Show Low IDA Hospital Revenue, Navapache Regional Medical Center, Radian Insured, 5.00%, | | | | |
| 12/01/30 | | 5,160,000 | | 4,594,516 |
| 12/01/35 | | 2,000,000 | | 1,736,740 |
| Tempe Arizona IDA Lease Revenue, State University Foundation, AMBAC Insured, 5.00%, | | | | |
| 7/01/28 | | 4,275,000 | | 3,864,942 |
| 7/01/34 | | 11,510,000 | | 9,742,294 |
| Tolleson IDA, MFR, Copper Cove Project, Series A, GNMA Secured, | | | | |
| 5.40%, 11/20/22 | | 1,090,000 | | 1,103,036 |
| 5.45%, 11/20/32 | | 1,285,000 | | 1,287,133 |
| Tucson Airport Authority Inc. Revenue, sub. lien, AMBAC Insured, 5.35%, 6/01/31 | | 10,000,000 | | 9,144,300 |
| Tucson IDA Lease Revenue, University of Arizona/Marshall Foundation, Series A, | | | | |
| AMBAC Insured, 5.00%, 7/15/32 | | 1,000,000 | | 916,250 |
| Tucson Water Revenue, System, Refunding, 5.00%, | | | | |
| 7/01/28 | | 1,230,000 | | 1,269,655 |
| 7/01/29 | | 1,765,000 | | 1,813,273 |
102 | Annual Report
| | | | |
| Franklin Tax-Free Trust | | | | |
| |
| Statement of Investments, February 28, 2011 (continued) | | | | |
| |
| |
| Franklin Arizona Tax-Free Income Fund | | Principal Amount | | Value |
| Municipal Bonds (continued) | | | | |
| Arizona (continued) | | | | |
| University Medical Center Corp. Hospital Revenue, | | | | |
| 5.00%, 7/01/35 | $ | 7,000,000 | $ | 6,029,730 |
| 6.50%, 7/01/39 | | 4,750,000 | | 4,928,600 |
| University of Arizona COP, University of Arizona Projects, Series B, AMBAC Insured, 5.00%, | | | | |
| 6/01/26 | | 7,070,000 | | 7,181,918 |
| 6/01/28 | | 7,000,000 | | 7,054,110 |
| 6/01/31 | | 5,565,000 | | 5,557,543 |
| Yavapai County IDA Hospital Facility Revenue, Yavapai Regional Medical Center, | | | | |
| Series A, 6.00%, 8/01/33 | | 2,000,000 | | 1,966,020 |
| Series B, 5.625%, 8/01/33 | | 2,315,000 | | 2,170,752 |
| Series B, 5.625%, 8/01/37 | | 12,435,000 | | 11,541,297 |
| | | | | 854,237,005 |
| U.S. Territories 9.4% | | | | |
| Puerto Rico 9.4% | | | | |
| Children’s Trust Fund Puerto Rico Tobacco Settlement Revenue, Asset-Backed Bonds, | | | | |
| Refunding, 5.50%, 5/15/39 | | 5,000,000 | | 3,979,500 |
| Puerto Rico Commonwealth GO, | | | | |
| Public Improvement, Series A, 5.375%, 7/01/28 | | 3,355,000 | | 3,380,666 |
| Series A, 5.25%, 7/01/37 | | 10,000,000 | | 8,750,500 |
| Puerto Rico Industrial Tourist Educational Medical and Environmental Control Facilities | | | | |
| Financing Authority Hospital Revenue, | | | | |
| Dr. Pila Hospital Project, Refunding, FHA Insured, 5.875%, 8/01/12 | | 500,000 | | 501,635 |
| Hospital Auxilio Mutuo Obligation Group Project, Series A, NATL Insured, 6.25%, | | | | |
| 7/01/24 | | 2,790,000 | | 2,799,625 |
| Puerto Rico PBA Guaranteed Revenue, Government Facilities, | | | | |
| Refunding, Series D, 5.375%, 7/01/33 | | 8,190,000 | | 7,678,780 |
| Series I, Pre-Refunded, 5.375%, 7/01/34 | | 40,000,000 | | 45,277,200 |
| Puerto Rico Public FICO Revenue, Commonwealth Appropriation, Series E, Pre-Refunded, | | | | |
| 5.50%, 8/01/29 | | 3,660,000 | | 3,826,457 |
| Puerto Rico Sales Tax FICO Sales Tax Revenue, first sub., | | | | |
| Series A, 5.50%, 8/01/37 | | 6,000,000 | | 5,665,140 |
| Series A, 5.50%, 8/01/42 | | 1,000,000 | | 933,620 |
| Series C, 5.25%, 8/01/41 | | 8,040,000 | | 7,231,980 |
| Total U.S. Territories | | | | 90,025,103 |
| Total Municipal Bonds before Short Term Investments | | | | |
| (Cost $981,467,267) | | | | 944,262,108 |
Annual Report | 103
Franklin Tax-Free Trust
Statement of Investments, February 28, 2011 (continued)
| | | | |
| Franklin Arizona Tax-Free Income Fund | | Principal Amount | | Value |
| Short Term Investments (Cost $790,000) 0.1% | | | | |
| Municipal Bonds 0.1% | | | | |
| U.S. Territories 0.1% | | | | |
| Puerto Rico 0.1% | | | | |
| aPuerto Rico Commonwealth GO, Public Improvement, Refunding, Series B, Daily VRDN and | | | | |
| Put, 0.15%, 7/01/32 | $ | 790,000 | $ | 790,000 |
| Total Investments (Cost $982,257,267) 99.0% | | | | 945,052,108 |
| Other Assets, less Liabilities 1.0% | | | | 9,773,648 |
| Net Assets 100.0% | | | $ | 954,825,756 |
|
| See Abbreviations on page 205. |
| |
| aVariable rate demand notes (VRDNs) are tax-exempt obligations which contain a floating or variable interest rate adjustment formula and an unconditional right of demand to |
| receive payment of the principal balance plus accrued interest at specified dates. The coupon rate shown represents the rate at period end. |
104 | The accompanying notes are an integral part of these financial statements. | Annual Report
| | | | | | | | | | | | | | | |
| Franklin Tax-Free Trust | | | | | | | | | | | | | | | |
| |
| Financial Highlights | | | | | | | | | | | | | | | |
| |
| Franklin Colorado Tax-Free Income Fund | | | | | | | | | | | | | | | |
| | | | | | Year Ended February 28, | | | | |
| Class A | | 2011 | | | 2010 | | | 2009 | | | 2008 | a | | 2007 | |
| Per share operating performance | | | | | | | | | | | | | | | |
| (for a share outstanding throughout the year) | | | | | | | | | | | | | | | |
| Net asset value, beginning of year | $ | 11.65 | | $ | 10.79 | | $ | 11.14 | | $ | 12.10 | | $ | 12.03 | |
| Income from investment operationsb: | | | | | | | | | | | | | | | |
| Net investment incomec | | 0.51 | | | 0.51 | | | 0.51 | | | 0.51 | | | 0.51 | |
| Net realized and unrealized gains (losses) | | (0.56 | ) | | 0.87 | | | (0.35 | ) | | (0.97 | ) | | 0.08 | |
| Total from investment operations | | (0.05 | ) | | 1.38 | | | 0.16 | | | (0.46 | ) | | 0.59 | |
| Less distributions from net investment income | | (0.51 | ) | | (0.52 | ) | | (0.51 | ) | | (0.50 | ) | | (0.52 | ) |
| Redemption feesd | | — | | | — | | | —e | | | —e | | | —e | |
| Net asset value, end of year | $ | 11.09 | | $ | 11.65 | | $ | 10.79 | | $ | 11.14 | | $ | 12.10 | |
| |
| Total returnf | | (0.55 | )% | | 12.97 | % | | 1.43 | % | | (3.94 | )% | | 5.04 | % |
| |
| Ratios to average net assets | | | | | | | | | | | | | | | |
| Expenses | | 0.65 | % | | 0.66 | % | | 0.66 | % | | 0.67 | % | | 0.68 | % |
| Net investment income | | 4.35 | % | | 4.49 | % | | 4.62 | % | | 4.27 | % | | 4.31 | % |
| |
| Supplemental data | | | | | | | | | | | | | | | |
| Net assets, end of year (000’s) | $ | 530,056 | | $ | 565,222 | | $ | 465,136 | | $ | 444,475 | | $ | 426,482 | |
| Portfolio turnover rate | | 22.47 | % | | 9.78 | % | | 11.01 | % | | 22.57 | % | | 15.20 | % |
| |
| |
| aFor the year ended February 29. | | | | | | | | | | | | | | | |
| bThe amount shown for a share outstanding throughout the period may not correlate with the Statement of Operations for the period due to the timing of sales and repurchases of | |
| the Fund shares in relation to income earned and/or fluctuating market value of the investments of the Fund. | | | | | | | | | | | | | |
| cBased on average daily shares outstanding. | | | | | | | | | | | | | | | |
| dEffective September 1, 2008, the redemption fee was eliminated. | | | | | | | | | | | | | | | |
| eAmount rounds to less than $0.01 per share. | | | | | | | | | | | | | | | |
| fTotal return does not reflect sales commissions or contingent deferred sales charges, if applicable. | | | | | | | | | | | | | |
Annual Report | The accompanying notes are an integral part of these financial statements. | 105
| | | | | | | | | | | | | | | |
| Franklin Tax-Free Trust | | | | | | | | | | | | | | | |
| |
| Financial Highlights (continued) | | | | | | | | | | | | | | | |
| |
| Franklin Colorado Tax-Free Income Fund | | | | | | | | | | | | | | | |
| | | | | | Year Ended February 28, | | | | |
| Class C | | 2011 | | | 2010 | | | 2009 | | | 2008 | a | | 2007 | |
| Per share operating performance | | | | | | | | | | | | | | | |
| (for a share outstanding throughout the year) | | | | | | | | | | | | | | | |
| Net asset value, beginning of year | $ | 11.76 | | $ | 10.88 | | $ | 11.22 | | $ | 12.19 | | $ | 12.12 | |
| Income from investment operationsb: | | | | | | | | | | | | | | | |
| Net investment incomec | | 0.44 | | | 0.45 | | | 0.46 | | | 0.44 | | | 0.45 | |
| Net realized and unrealized gains (losses) | | (0.56 | ) | | 0.88 | | | (0.35 | ) | | (0.97 | ) | | 0.07 | |
| Total from investment operations | | (0.12 | ) | | 1.33 | | | 0.11 | | | (0.53 | ) | | 0.52 | |
| Less distributions from net investment income | | (0.44 | ) | | (0.45 | ) | | (0.45 | ) | | (0.44 | ) | | (0.45 | ) |
| Redemption feesd | | — | | | — | | | —e | | | —e | | | —e | |
| Net asset value, end of year | $ | 11.20 | | $ | 11.76 | | $ | 10.88 | | $ | 11.22 | | $ | 12.19 | |
| |
| Total returnf | | (1.11 | )% | | 12.43 | % | | 0.94 | % | | (4.52 | )% | | 4.43 | % |
| |
| Ratios to average net assets | | | | | | | | | | | | | | | |
| Expenses | | 1.20 | % | | 1.21 | % | | 1.21 | % | | 1.22 | % | | 1.23 | % |
| Net investment income | | 3.80 | % | | 3.94 | % | | 4.07 | % | | 3.72 | % | | 3.76 | % |
| |
| Supplemental data | | | | | | | | | | | | | | | |
| Net assets, end of year (000’s) | $ | 106,536 | | $ | 118,648 | | $ | 69,302 | | $ | 56,146 | | $ | 50,938 | |
| Portfolio turnover rate | | 22.47 | % | | 9.78 | % | | 11.01 | % | | 22.57 | % | | 15.20 | % |
| |
| |
| aFor the year ended February 29. | | | | | | | | | | | | | | | |
| bThe amount shown for a share outstanding throughout the period may not correlate with the Statement of Operations for the period due to the timing of sales and repurchases of | |
| the Fund shares in relation to income earned and/or fluctuating market value of the investments of the Fund. | | | | | | | | | | | | | |
| cBased on average daily shares outstanding. | | | | | | | | | | | | | | | |
| dEffective September 1, 2008, the redemption fee was eliminated. | | | | | | | | | | | | | | | |
| eAmount rounds to less than $0.01 per share. | | | | | | | | | | | | | | | |
| fTotal return does not reflect sales commissions or contingent deferred sales charges, if applicable. | | | | | | | | | | | | | |
106 | The accompanying notes are an integral part of these financial statements. | Annual Report
| | | | | | |
| Franklin Tax-Free Trust | | | | | | |
| |
| Financial Highlights (continued) | | | | | | |
| |
| Franklin Colorado Tax-Free Income Fund | | | | | | |
| | | Year Ended | |
| | | February 28, | |
| Advisor Class | | 2011 | | | 2010 | a |
| Per share operating performance | | | | | | |
| (for a share outstanding throughout the year) | | | | | | |
| Net asset value, beginning of year | $ | 11.65 | | $ | 11.22 | |
| Income from investment operationsb: | | | | | | |
| Net investment incomec | | 0.52 | | | 0.33 | |
| Net realized and unrealized gains (losses) | | (0.56 | ) | | 0.43 | |
| Total from investment operations | | (0.04 | ) | | 0.76 | |
| Less distributions from net investment income | | (0.52 | ) | | (0.33 | ) |
| Net asset value, end of year | $ | 11.09 | | $ | 11.65 | |
| |
| Total returnd | | (0.45 | )% | | 6.79 | % |
| |
| Ratios to average net assetse | | | | | | |
| Expenses | | 0.55 | % | | 0.56 | % |
| Net investment income | | 4.45 | % | | 4.59 | % |
| |
| Supplemental data | | | | | | |
| Net assets, end of year (000’s) | $ | 13,304 | | $ | 11,066 | |
| Portfolio turnover rate | | 22.47 | % | | 9.78 | % |
| |
| |
| aFor the period July 15, 2009 (effective date) to February 28, 2010. | | | | | | |
| bThe amount shown for a share outstanding throughout the period may not correlate with the Statement of Operations for the period due to the timing of sales and repurchases of | |
| the Fund shares in relation to income earned and/or fluctuating market value of the investments of the Fund. | | | | | | |
| cBased on average daily shares outstanding. | | | | | | |
| dTotal return is not annualized for periods less than one year. | | | | | | |
| eRatios are annualized for periods less than one year. | | | | | | |
Annual Report | The accompanying notes are an integral part of these financial statements. | 107
| | | | |
| Franklin Tax-Free Trust | | | | |
| |
| Statement of Investments, February 28, 2011 | | | | |
| |
| |
| Franklin Colorado Tax-Free Income Fund | | Principal Amount | | Value |
| Municipal Bonds 98.6% | | | | |
| Colorado 88.1% | | | | |
| Adams County Revenue, Platte Valley Medical Center, Refunding, NATL Insured, | | | | |
| 5.00%, 2/01/31 | $ | 10,000,000 | $ | 9,474,200 |
| Adams State College Auxiliary Facilities Revenue, Improvement, Series A, 5.50%, | | | | |
| 5/15/34 | | 2,000,000 | | 2,054,260 |
| 5/15/39 | | 2,150,000 | | 2,195,322 |
| Arapahoe County Water and Wastewater GO, Refunding, Series A, NATL Insured, 5.125%, | | | | |
| 12/01/32 | | 15,000,000 | | 14,437,500 |
| Aurora COP, Refunding, Series A, 5.00%, 12/01/30 | | 5,680,000 | | 5,727,598 |
| Aurora Hospital Revenue, Children’s Hospital Assn., 5.00%, 12/01/40 | | 5,000,000 | | 4,540,500 |
| Aurora Water Improvement Revenue, first lien, Series A, AMBAC Insured, 5.00%, | | | | |
| 8/01/36 | | 5,880,000 | | 5,858,773 |
| 8/01/39 | | 10,000,000 | | 9,917,100 |
| Baca Grande Water and Sanitation District GO, Improvement, Refunding, Assured Guaranty, | | | | |
| 5.00%, 12/01/40 | | 2,500,000 | | 2,285,950 |
| Bell Mountain Ranch Metropolitan District GO, Refunding, AGMC Insured, 5.00%, 12/01/39 | | 3,160,000 | | 2,827,315 |
| Boulder County Development Revenue, University Corp. of Atmospheric Research, NATL Insured, | | | | |
| 5.00%, 9/01/33 | | 1,500,000 | | 1,439,370 |
| Boulder Larimer and Weld Counties Vrain Valley School District RE-1J GO, 5.00%, 12/15/33 | | 5,300,000 | | 5,450,997 |
| Boulder Valley School District No. RE-2 Boulder GO, 5.00%, 12/01/34 | | 6,000,000 | | 6,146,160 |
| Bowles Metropolitan District GO, Refunding, AGMC Insured, 5.00%, 12/01/33 | | 2,500,000 | | 2,398,150 |
| Brighton Water Activity Enterprise Revenue, Water System Project, Series A, Assured Guaranty, | | | | |
| 5.25%, 12/01/34 | | 5,380,000 | | 5,477,701 |
| Broadlands Metropolitan District No. 2 GO, Refunding, NATL Insured, 5.25%, 12/01/34 | | 8,655,000 | | 8,810,098 |
| Broomfield Sales and Use Tax Revenue, Refunding and Improvement, Series A, AMBAC Insured, | | | | |
| 5.00%, 12/01/27 | | 10,000,000 | | 10,067,300 |
| Broomfield Sewer Activity Enterprise Sewer and Wastewater Revenue, AMBAC Insured, 5.00%, | | | | |
| 12/01/31 | | 7,500,000 | | 7,523,025 |
| Colorado Department of Transportation COP, NATL Insured, 5.00%, 6/15/34 | | 6,915,000 | | 6,830,153 |
| Colorado Educational and Cultural Facilities Authority Revenue, | | | | |
| Alexander Dawson School, 5.00%, 2/15/40 | | 5,280,000 | | 4,620,211 |
| James Irwin Charter School, Refunding and Improvement, CIFG Insured, 5.00%, 8/01/37 | | 6,060,000 | | 5,592,713 |
| Student Housing, Campus Village Apartments, Refunding, 5.50%, 6/01/38 | | 9,000,000 | | 8,456,220 |
| Student Housing, University of Colorado Foundation Project, AMBAC Insured, Pre-Refunded, | | | | |
| 5.00%, 7/01/27 | | 6,545,000 | | 6,915,316 |
| Student Housing, University of Colorado Foundation Project, AMBAC Insured, Pre-Refunded, | | | | |
| 5.00%, 7/01/32 | | 10,005,000 | | 10,571,083 |
| Colorado Health Facilities Authority Revenue, | | | | |
| Evangelical Lutheran Project, 5.25%, 6/01/31 | | 4,000,000 | | 3,672,640 |
| Evangelical Lutheran Project, Series A, 5.25%, 6/01/34 | | 3,500,000 | | 3,152,660 |
| Hospital, Longmont United Hospital Project, Refunding, Series B, Radian Insured, 5.00%, | | | | |
| 12/01/25 | | 3,050,000 | | 2,718,313 |
| Hospital, Longmont United Hospital Project, Refunding, Series B, Radian Insured, 5.00%, | | | | |
| 12/01/26 | | 3,205,000 | | 2,830,400 |
| Hospital, Longmont United Hospital Project, Refunding, Series B, Radian Insured, 5.00%, | | | | |
| 12/01/27 | | 3,365,000 | | 2,941,313 |
| Hospital, Longmont United Hospital Project, Refunding, Series B, Radian Insured, 5.00%, | | | | |
| 12/01/30 | | 3,000,000 | | 2,509,050 |
| Portercare Adventist Health, Pre-Refunded, 6.625%, 11/15/26 | | 2,500,000 | | 2,633,225 |
| Portercare Adventist Health, Pre-Refunded, 6.50%, 11/15/31 | | 5,500,000 | | 5,788,310 |
108 | Annual Report
| | | | |
| Franklin Tax-Free Trust | | | | |
| |
| Statement of Investments, February 28, 2011 (continued) | | | | |
| |
| |
| Franklin Colorado Tax-Free Income Fund | | Principal Amount | | Value |
| Municipal Bonds (continued) | | | | |
| Colorado (continued) | | | | |
| Colorado HFAR, | | | | |
| MF, Project II, Series A-2, 5.30%, 10/01/23 | $ | 1,645,000 | $ | 1,650,182 |
| MF, Project II, Series A-2, 5.375%, 10/01/32 | | 3,605,000 | | 3,608,569 |
| MFH Insured Mortgage, Series A-2, FHA Insured, 6.00%, 10/01/28 | | 235,000 | | 235,000 |
| MFH Insured Mortgage, Series C-3, 6.05%, 10/01/32 | | 475,000 | | 475,247 |
| Colorado School of Mines Enterprises Revenue, Refunding and Improvement, Series A, | | | | |
| 5.25%, 12/01/37 | | 2,000,000 | | 2,009,940 |
| Colorado Springs Hospital Revenue, | | | | |
| 6.375%, 12/15/30 | | 3,785,000 | | 3,757,218 |
| Refunding, 6.25%, 12/15/33 | | 5,000,000 | | 5,063,400 |
| Colorado Springs Public Facilities Authority COP, U.S. Olympic Committee Project, | | | | |
| Assured Guaranty, 5.00%, 11/01/39 | | 11,305,000 | | 10,524,277 |
| Colorado Springs Utilities Revenue, | | | | |
| Refunding, 4.00%, 11/15/27 | | 1,960,000 | | 1,841,146 |
| Refunding, 4.00%, 11/15/29 | | 5,285,000 | | 4,820,396 |
| Refunding, Series A, 5.00%, 11/15/27 | | 1,000,000 | | 1,048,080 |
| Series D-1, 5.25%, 11/15/33 | | 5,000,000 | | 5,188,200 |
| sub. lien, System Improvement, Series B, 5.00%, 11/15/33 | | 3,000,000 | | 3,002,790 |
| Colorado State Board of Governors University Enterprise System Revenue, Series A, | | | | |
| 5.00%, 3/01/34 | | 2,250,000 | | 2,258,820 |
| 5.00%, 3/01/39 | | 7,200,000 | | 7,114,464 |
| NATL RE, FGIC Insured, 5.00%, 3/01/37 | | 13,000,000 | | 12,685,920 |
| Colorado State COP, University of Colorado Denver Health Sciences Center Fitzsimons Academic | | | | |
| Facility Project, Series B, NATL Insured, 5.00%, 11/01/30 | | 5,000,000 | | 4,981,050 |
| Colorado State Health Facilities Authority Revenue, | | | | |
| Catholic Health Initiatives, Refunding, Series A, 5.00%, 7/01/39 | | 5,000,000 | | 4,478,350 |
| Catholic Health Initiatives, Series D, 6.125%, 10/01/28 | | 2,500,000 | | 2,695,075 |
| Catholic Health Initiatives, Series D, 6.25%, 10/01/33 | | 2,000,000 | | 2,104,480 |
| Evangelical Lutheran Good Samaritan Society Project, Refunding, Series A, 6.125%, | | | | |
| 6/01/38 | | 4,500,000 | | 4,509,315 |
| Hospital, NCMC Inc. Project, Series A, AGMC Insured, 5.50%, 5/15/30 | | 7,900,000 | | 8,066,532 |
| Hospital, Refunding, Series C, AGMC Insured, 5.25%, 3/01/40 | | 5,000,000 | | 4,689,350 |
| Parkview Medical Center Inc. Project, Series A, 5.00%, 9/01/37 | | 8,000,000 | | 6,841,840 |
| Poudre Valley Health Care Inc. and Medical Center of the Rockies, Refunding, Series A, | | | | |
| AGMC Insured, 5.20%, 3/01/31 | | 10,000,000 | | 9,926,300 |
| Refunding, 6.00%, 10/01/35 | | 5,500,000 | | 5,328,125 |
| Refunding, 5.00%, 1/01/40 | | 12,500,000 | | 11,245,125 |
| Valley View Hospital Assn. Project, Refunding, 5.75%, 5/15/36 | | 2,000,000 | | 1,831,200 |
| Yampa Valley Medical Center Project, Refunding, 5.125%, 9/15/29 | | 4,000,000 | | 3,474,440 |
| Colorado State Higher Education Capital Construction Lease Purchase Financing Program COP, | | | | |
| 5.50%, 11/01/27 | | 5,245,000 | | 5,498,229 |
| Pre-Refunded, 5.50%, 11/01/27 | | 2,030,000 | | 2,479,056 |
| Colorado Water Resources and Power Development Authority Clean Water Revenue, Series A, | | | | |
| 6.15%, 9/01/11 | | 35,000 | | 35,153 |
| 6.30%, 9/01/14 | | 25,000 | | 25,098 |
Annual Report | 109
| | | | |
| Franklin Tax-Free Trust | | | | |
| |
| Statement of Investments, February 28, 2011 (continued) | | | | |
| |
| |
| Franklin Colorado Tax-Free Income Fund | | Principal Amount | | Value |
| Municipal Bonds (continued) | | | | |
| Colorado (continued) | | | | |
| Colorado Water Resources and Power Development Authority Water Resources Revenue, | | | | |
| Arapahoe County Water Improvement, Series E, NATL Insured, 5.00%, 12/01/35 | $ | 10,000,000 | $ | 9,015,100 |
| East Cherry Creek Valley Water Sanitary District, NATL Insured, 5.00%, 11/15/30 | | 1,590,000 | | 1,582,002 |
| Parker Water and Sanitary District, NATL Insured, 5.00%, 9/01/30 | | 5,000,000 | | 4,743,350 |
| Commerce City COP, AMBAC Insured, 5.00%, 12/15/37 | | 13,975,000 | | 12,582,810 |
| Denver City and County Airport Revenue, | | | | |
| Refunding, Series A, AMBAC Insured, 5.625%, 11/15/23 | | 4,500,000 | | 4,505,715 |
| Series B, Pre-Refunded, 5.50%, 11/15/33 | | 5,000,000 | | 5,624,950 |
| Series D, 7.75%, 11/15/13 | | 455,000 | | 496,628 |
| Denver Convention Center Hotel Authority Revenue, senior bond, Refunding, XLCA Insured, | | | | |
| 5.00%, 12/01/30 | | 14,500,000 | | 11,793,575 |
| Denver Health and Hospital Authority Healthcare Revenue, | | | | |
| 5.50%, 12/01/30 | | 1,500,000 | | 1,373,085 |
| 5.625%, 12/01/40 | | 4,000,000 | | 3,623,840 |
| Refunding, Series A, 5.25%, 12/01/31 | | 9,250,000 | | 7,998,752 |
| Series A, Pre-Refunded, 6.00%, 12/01/23 | | 1,000,000 | | 1,041,040 |
| Series A, Pre-Refunded, 6.00%, 12/01/31 | | 5,400,000 | | 5,621,616 |
| Series A, Pre-Refunded, 6.25%, 12/01/33 | | 3,250,000 | | 3,855,248 |
| Dove Valley Metropolitan District Arapahoe County GO, Refunding, AGMC Insured, 5.00%, | | | | |
| 11/01/35 | | 4,375,000 | | 4,289,600 |
| E-470 Public Highway Authority Revenue, | | | | |
| 5.25%, 9/01/25 | | 2,500,000 | | 2,297,425 |
| Capital Appreciation, Series A, NATL Insured, zero cpn., 9/01/33 | | 3,000,000 | | 544,740 |
| Capital Appreciation, Series B, NATL Insured, zero cpn., 9/01/32 | | 7,800,000 | | 1,534,260 |
| Capital Appreciation, Series B, NATL Insured, zero cpn., 9/01/34 | | 14,075,000 | | 2,358,407 |
| El Paso County Mortgage Revenue, Stetson Meadows, Series A, GNMA Secured, 5.25%, | | | | |
| 12/20/32 | | 1,890,000 | | 1,856,150 |
| Erie Wastewater Enterprise Revenue, Series A, Assured Guaranty, 5.00%, | | | | �� |
| 12/01/33 | | 2,860,000 | | 2,817,758 |
| 12/01/37 | | 5,120,000 | | 4,887,245 |
| Erie Water Enterprise Revenue, Series A, AGMC Insured, 5.00%, 12/01/32 | | 10,000,000 | | 10,050,400 |
| Fort Lewis College Board Trustees Enterprise Revenue, Series B-1, NATL RE, FGIC Insured, | | | | |
| 5.00%, 10/01/37 | | 12,830,000 | | 11,651,436 |
| Gunnison Watershed School District No. RE-1J GO, 5.25%, 12/01/33 | | 1,240,000 | | 1,303,463 |
| Mesa State College Auxiliary Facilities Enterprise Revenue, | | | | |
| Pre-Refunded, 6.00%, 5/15/38 | | 7,000,000 | | 8,687,840 |
| Refunding, Series A, 5.00%, 5/15/33 | | 3,455,000 | | 3,463,948 |
| Mesa State College College Enterprise Revenue, BHAC Insured, 5.125%, 5/15/37 | | 5,765,000 | | 5,300,917 |
| Park Creek Metropolitan District Revenue, Senior Property Tax Support, Refunding and | | | | |
| Improvement, Assured Guaranty, 6.375%, 12/01/37 | | 7,000,000 | | 7,459,970 |
| Poudre Tech Metropolitan District Unlimited Property Tax Supported Revenue, Refunding and | | | | |
| Improvement, Series A, AGMC Insured, 5.00%, 12/01/39 | | 7,435,000 | | 7,618,942 |
| Public Authority for Colorado Energy Natural Gas Purchase Revenue, 6.50%, 11/15/38 | | 9,900,000 | | 10,289,565 |
| Rangeview Library District COP, Rangeview Library District Projects, Assured Guaranty, | | | | |
| 5.00%, 12/15/30 | | 4,115,000 | | 4,023,688 |
| Regional Transportation District COP, Series A, 5.375%, 6/01/31 | | 13,000,000 | | 13,120,510 |
110 | Annual Report
| | | | |
| Franklin Tax-Free Trust | | | | |
| |
| Statement of Investments, February 28, 2011 (continued) | | | | |
| |
| |
| Franklin Colorado Tax-Free Income Fund | | Principal Amount | | Value |
| Municipal Bonds (continued) | | | | |
| Colorado (continued) | | | | |
| Regional Transportation District Sales Tax Revenue, | | | | |
| 5.00%, 11/01/38 | $ | 10,000,000 | $ | 9,881,200 |
| FasTracks Project, Series A, AMBAC Insured, 5.00%, 11/01/31 | | 14,150,000 | | 14,350,930 |
| Thornton Development Authority Tax Increment Revenue, North Washington Street Urban | | | | |
| Renewal, NATL Insured, 5.00%, 12/01/29 | | 6,100,000 | | 6,203,578 |
| Thornton Water Enterprise Revenue, NATL Insured, 5.00%, 12/01/29 | | 7,010,000 | | 7,189,806 |
| Triview Metropolitan District GO, Refunding, 5.00%, 11/01/34 | | 10,855,000 | | 10,123,807 |
| University of Colorado COP, Series A, AMBAC Insured, Pre-Refunded, 5.00%, 6/01/33 | | 3,570,000 | | 3,889,444 |
| University of Colorado Enterprise System Revenue, | | | | |
| Series A, 5.375%, 6/01/38 | | 3,000,000 | | 3,046,650 |
| University of Colorado Regents, NATL Insured, 5.00%, 6/01/32 | | 3,000,000 | | 3,022,170 |
| University of Colorado Hospital Authority Revenue, | | | | |
| Refunding, 6.00%, 11/15/29 | | 5,000,000 | | 5,108,150 |
| Series A, 5.00%, 11/15/37 | | 2,000,000 | | 1,744,980 |
| Series A, 5.25%, 11/15/39 | | 3,000,000 | | 2,696,370 |
| Series A, Pre-Refunded, 5.60%, 11/15/25 | | 1,900,000 | | 1,969,388 |
| University of Northern Colorado Revenue, Auxiliary Facilities Systems, Refunding and | | | | |
| Improvement, AMBAC Insured, 5.00%, 6/01/31 | | 3,000,000 | | 3,000,930 |
| Western State College Revenues, 5.00%, | | | | |
| 5/15/34 | | 2,000,000 | | 1,935,840 |
| 5/15/39 | | 2,000,000 | | 1,890,180 |
| Westminster Building Authority COP, NATL Insured, Pre-Refunded, 5.25%, 12/01/22 | | 5,000 | | 5,181 |
| | | | | 572,827,872 |
| U.S. Territories 10.5% | | | | |
| Guam 0.8% | | | | |
| Guam Government Limited Obligation Revenue, Section 30, Series A, | | | | |
| 5.375%, 12/01/24 | | 2,000,000 | | 1,960,820 |
| 5.75%, 12/01/34 | | 3,565,000 | | 3,479,012 |
| | | | | 5,439,832 |
| Puerto Rico 9.4% | | | | |
| Puerto Rico Commonwealth Highway and Transportation Authority Highway Revenue, Refunding, | | | | |
| Series AA-2, 5.30%, 7/01/35 | | 5,000,000 | | 4,476,350 |
| Puerto Rico Commonwealth Highway and Transportation Authority Transportation Revenue, | | | | |
| Refunding, Series H, 5.45%, 7/01/35 | | 1,470,000 | | 1,337,039 |
| Puerto Rico Commonwealth Infrastructure Financing Authority Special Tax Revenue, | | | | |
| Series B, 5.00%, 7/01/41 | | 8,490,000 | | 6,830,460 |
| Puerto Rico Electric Power Authority Power Revenue, Series XX, 5.25%, 7/01/40 | | 13,910,000 | | 12,148,159 |
| Puerto Rico Industrial Tourist Educational Medical and Environmental Control Facilities | | | | |
| Financing Authority Industrial Revenue, Guaynabo Municipal Government, 5.625%, | | | | |
| 7/01/22 | | 1,335,000 | | 1,335,387 |
| Puerto Rico PBA Guaranteed Revenue, Government Facilities, | | | | |
| Refunding, Series D, 5.375%, 7/01/33 | | 2,120,000 | | 1,987,670 |
| Series I, Pre-Refunded, 5.375%, 7/01/34 | | 5,000,000 | | 5,659,650 |
| Puerto Rico Sales Tax FICO Sales Tax Revenue, first sub., | | | | |
| Series A, 5.50%, 8/01/37 | | 5,000,000 | | 4,720,950 |
| Series A, 5.50%, 8/01/42 | | 3,000,000 | | 2,800,860 |
Annual Report | 111
| | | | |
| Franklin Tax-Free Trust | | | | |
| |
| Statement of Investments, February 28, 2011 (continued) | | | | |
| |
| |
| Franklin Colorado Tax-Free Income Fund | | Principal Amount | | Value |
| Municipal Bonds (continued) | | | | |
| U.S. Territories (continued) | | | | |
| Puerto Rico (continued) | | | | |
| Puerto Rico Sales Tax FICO Sales Tax Revenue, first sub., (continued) | | | | |
| Series B, 6.375%, 8/01/39 | $ | 10,000,000 | $ | 10,324,100 |
| Series C, 5.50%, 8/01/40 | | 10,000,000 | | 9,351,700 |
| | | | | 60,972,325 |
| U.S. Virgin Islands 0.3% | | | | |
| Virgin Islands PFAR, Matching Fund Loan, sub. lien, Series B, 5.25%, 10/01/29 | | 1,800,000 | | 1,780,974 |
| Total U.S. Territories | | | | 68,193,131 |
| Total Municipal Bonds before Short Term Investments | | | | |
| (Cost $660,456,682) | | | | 641,021,003 |
| Short Term Investments 0.4% | | | | |
| Municipal Bonds 0.4% | | | | |
| Colorado 0.4% | | | | |
| aColorado Educational and Cultural Facilities Authority Revenue, National Jewish Federation | | | | |
| Bond Program, | | | | |
| Refunding, Series A-8, Daily VRDN and Put, 0.21%, 9/01/35 | | 1,700,000 | | 1,700,000 |
| Series A-7, Daily VRDN and Put, 0.21%, 7/01/29 | | 700,000 | | 700,000 |
| Total Short Term Investments (Cost $2,400,000) | | | | 2,400,000 |
| Total Investments (Cost $662,856,682) 99.0% | | | | 643,421,003 |
| Other Assets, less Liabilities 1.0% | | | | 6,474,738 |
| Net Assets 100.0% | | | $ | 649,895,741 |
See Abbreviations on page 205.
aVariable rate demand notes (VRDNs) are tax-exempt obligations which contain a floating or variable interest rate adjustment formula and an unconditional right of demand to receive payment of the principal balance plus accrued interest at specified dates. The coupon rate shown represents the rate at period end.
112 | The accompanying notes are an integral part of these financial statements. | Annual Report
| | | | | | | | | | | | | | | |
| Franklin Tax-Free Trust | | | | | | | | | | | | | |
| |
| Financial Highlights | | | | | | | | | | | | | | | |
| |
| Franklin Connecticut Tax-Free Income Fund | | | | | | | | | | | | | |
| | | | | | Year Ended February 28, | | | | |
| Class A | | 2011 | | | 2010 | | | 2009 | | | 2008 | a | | 2007 | |
| Per share operating performance | | | | | | | | | | | | | | | |
| (for a share outstanding throughout the year) | | | | | | | | | | | | | | | |
| Net asset value, beginning of year | $ | 10.88 | | $ | 10.18 | | $ | 10.39 | | $ | 11.13 | | $ | 11.10 | |
| Income from investment operationsb: | | | | | | | | | | | | | | | |
| Net investment incomec | | 0.45 | | | 0.46 | | | 0.46 | | | 0.45 | | | 0.46 | |
| Net realized and unrealized gains (losses) | | (0.43 | ) | | 0.69 | | | (0.22 | ) | | (0.73 | ) | | 0.04 | |
| Total from investment operations | | 0.02 | | | 1.15 | | | 0.24 | | | (0.28 | ) | | 0.50 | |
| Less distributions from net investment income | | (0.45 | ) | | (0.45 | ) | | (0.45 | ) | | (0.46 | ) | | (0.47 | ) |
| Redemption feesd | | — | | | — | | | —e | | | —e | | | —e | |
| Net asset value, end of year | $ | 10.45 | | $ | 10.88 | | $ | 10.18 | | $ | 10.39 | | $ | 11.13 | |
| |
| Total returnf | | 0.13 | % | | 11.50 | % | | 2.31 | % | | (2.66 | )% | | 4.61 | % |
| |
| Ratios to average net assets | | | | | | | | | | | | | | | |
| Expenses | | 0.66 | % | | 0.68 | % | | 0.68 | % | | 0.69 | % | | 0.70 | % |
| Net investment income | | 4.12 | % | | 4.29 | % | | 4.39 | % | | 4.16 | % | | 4.21 | % |
| |
| Supplemental data | | | | | | | | | | | | | | | |
| Net assets, end of year (000’s) | $ | 367,664 | | $ | 405,070 | | $ | 338,345 | | $ | 315,908 | | $ | 305,258 | |
| Portfolio turnover rate | | 15.40 | % | | 3.67 | % | | 9.72 | % | | 13.47 | % | | 11.18 | % |
| |
| |
| aFor the year ended February 29. | | | | | | | | | | | | | | | |
| bThe amount shown for a share outstanding throughout the period may not correlate with the Statement of Operations for the period due to the timing of sales and repurchases of | |
| the Fund shares in relation to income earned and/or fluctuating market value of the investments of the Fund. | | | | | | | �� | | | | | | |
| cBased on average daily shares outstanding. | | | | | | | | | | | | | | | |
| dEffective September 1, 2008, the redemption fee was eliminated. | | | | | | | | | | | | | |
| eAmount rounds to less than $0.01 per share. | | | | | | | | | | | | | | | |
| fTotal return does not reflect sales commissions or contingent deferred sales charges, if applicable. | | | | | | | | | | | | | |
| |
| |
| |
| |
| Annual Report | | | The accompanying notes are an integral part of these financial statements. | 113 | |
| | | | | | | | | | | | | | | |
| Franklin Tax-Free Trust | | | | | | | | | | | | | | | |
| |
| Financial Highlights (continued) | | | | | | | | | | | | | | | |
| |
| Franklin Connecticut Tax-Free Income Fund | | | | | | | | | | | | | | | |
| | | | | | Year Ended February 28, | | | | |
| Class C | | 2011 | | | 2010 | | | 2009 | | | 2008 | a | | 2007 | |
| Per share operating performance | | | | | | | | | | | | | | | |
| (for a share outstanding throughout the year) | | | | | | | | | | | | | | | |
| Net asset value, beginning of year | $ | 10.94 | | $ | 10.24 | | $ | 10.44 | | $ | 11.19 | | $ | 11.15 | |
| Income from investment operationsb: | | | | | | | | | | | | | | | |
| Net investment incomec | | 0.39 | | | 0.40 | | | 0.40 | | | 0.40 | | | 0.41 | |
| Net realized and unrealized gains (losses) | | (0.42 | ) | | 0.69 | | | (0.21 | ) | | (0.75 | ) | | 0.04 | |
| Total from investment operations | | (0.03 | ) | | 1.09 | | | 0.19 | | | (0.35 | ) | | 0.45 | |
| Less distributions from net investment income | | (0.39 | ) | | (0.39 | ) | | (0.39 | ) | | (0.40 | ) | | (0.41 | ) |
| Redemption feesd | | — | | | — | | | —e | | | —e | | | —e | |
| Net asset value, end of year | $ | 10.52 | | $ | 10.94 | | $ | 10.24 | | $ | 10.44 | | $ | 11.19 | |
| |
| Total returnf | | (0.34 | )% | | 10.83 | % | | 1.83 | % | | (3.28 | )% | | 4.10 | % |
| |
| Ratios to average net assets | | | | | | | | | | | | | | | |
| Expenses | | 1.21 | % | | 1.23 | % | | 1.23 | % | | 1.24 | % | | 1.25 | % |
| Net investment income | | 3.57 | % | | 3.74 | % | | 3.84 | % | | 3.61 | % | | 3.66 | % |
| |
| Supplemental data | | | | | | | | | | | | | | | |
| Net assets, end of year (000’s) | $ | 90,659 | | $ | 94,058 | | $ | 70,541 | | $ | 55,126 | | $ | 52,623 | |
| Portfolio turnover rate | | 15.40 | % | | 3.67 | % | | 9.72 | % | | 13.47 | % | | 11.18 | % |
| |
| |
| aFor the year ended February 29. | | | | | | | | | | | | | | | |
| bThe amount shown for a share outstanding throughout the period may not correlate with the Statement of Operations for the period due to the timing of sales and repurchases of | |
| the Fund shares in relation to income earned and/or fluctuating market value of the investments of the Fund. | | | | | | | | | | | | | |
| cBased on average daily shares outstanding. | | | | | | | | | | | | | | | |
| dEffective September 1, 2008, the redemption fee was eliminated. | | | | | | | | | | | | | | | |
| eAmount rounds to less than $0.01 per share. | | | | | | | | | | | | | | | |
| fTotal return does not reflect sales commissions or contingent deferred sales charges, if applicable. | | | | | | | | | | | | | |
114 | The accompanying notes are an integral part of these financial statements. | Annual Report
| | | | | | |
| Franklin Tax-Free Trust | | | | | | |
| Financial Highlights (continued) | | | | | | |
| |
| Franklin Connecticut Tax-Free Income Fund | | | | | | |
| | | Year Ended | |
| | | February 28, | |
| Advisor Class | | 2011 | | | 2010 | a |
| Per share operating performance | | | | | | |
| (for a share outstanding throughout the year) | | | | | | |
| Net asset value, beginning of year | $ | 10.87 | | $ | 10.45 | |
| Income from investment operationsb: | | | | | | |
| Net investment incomec | | 0.46 | | | 0.29 | |
| Net realized and unrealized gains (losses) | | (0.42 | ) | | 0.41 | |
| Total from investment operations | | 0.04 | | | 0.70 | |
| Less distributions from net investment income | | (0.46 | ) | | (0.28 | ) |
| Net asset value, end of year | $ | 10.45 | | $ | 10.87 | |
| |
| Total returnd | | 0.33 | % | | 6.78 | % |
| |
| Ratios to average net assetse | | | | | | |
| Expenses | | 0.56 | % | | 0.58 | % |
| Net investment income | | 4.22 | % | | 4.39 | % |
| |
| Supplemental data | | | | | | |
| Net assets, end of year (000’s) | $ | 19,295 | | $ | 11,030 | |
| Portfolio turnover rate | | 15.40 | % | | 3.67 | % |
|
| aFor the period July 15, 2009 (effective date) to February 28, 2010. |
| bThe amount shown for a share outstanding throughout the period may not correlate with the Statement of Operations for the period due to the timing of sales and repurchases of |
| the Fund shares in relation to income earned and/or fluctuating market value of the investments of the Fund. |
| cBased on average daily shares outstanding. |
| dTotal return is not annualized for periods less than one year. |
| eRatios are annualized for periods less than one year. |
Annual Report | The accompanying notes are an integral part of these financial statements. | 115
| | | | |
| Franklin Tax-Free Trust | | | | |
| |
| Statement of Investments, February 28, 2011 | | | | |
| |
| |
| Franklin Connecticut Tax-Free Income Fund | | Principal Amount | | Value |
| Municipal Bonds 99.0% | | | | |
| Connecticut 74.4% | | | | |
| Connecticut State Airport Revenue, Bradley International Airport, Series A, NATL RE, | | | | |
| FGIC Insured, 5.125%, 10/01/26 | $ | 3,000,000 | $ | 2,995,080 |
| Connecticut State Development Authority First Mortgage Gross Revenue, Health Care Project, | | | | |
| Church Homes Inc. Project, Refunding, 5.80%, 4/01/21 | | 4,000,000 | | 3,820,640 |
| Connecticut Baptist Homes Inc. Project, Refunding, Radian Insured, 5.625%, 9/01/22 | | 2,000,000 | | 1,867,500 |
| The Elim Park Baptist Home Inc. Project, 5.75%, 12/01/23 | | 750,000 | | 747,248 |
| The Elim Park Baptist Home Inc. Project, Refunding, Series A, 5.375%, 12/01/18 | | 1,075,000 | | 1,075,312 |
| Connecticut State Development Authority PCR, | | | | |
| Connecticut Light and Water, Refunding, Series A, 5.85%, 9/01/28 | | 5,500,000 | | 5,464,305 |
| United Illuminating Co. Project, Mandatory Put 2/01/12, 5.75%, 6/01/26 | | 1,000,000 | | 1,030,810 |
| Connecticut State Development Authority Solid Waste Disposal Facilities Revenue, | | | | |
| PSEG Power LLC Project, Series A, 5.75%, 11/01/37 | | 5,000,000 | | 4,658,700 |
| Connecticut State Development Authority Water Facility Revenue, Bridgeport Hydraulic Co. | | | | |
| Project, 6.15%, 4/01/35 | | 1,000,000 | | 991,260 |
| Connecticut State GO, | | | | |
| Series A, 5.00%, 2/15/29 | | 10,000,000 | | 10,542,700 |
| Series B, Pre-Refunded, 5.00%, 6/15/20 | | 5,000,000 | | 5,066,200 |
| Series B, Pre-Refunded, 5.00%, 6/15/22 | | 1,000,000 | | 1,057,350 |
| Series C, AGMC Insured, 5.00%, 6/01/26 | | 5,000,000 | | 5,258,300 |
| Connecticut State Health and Educational Facilities Authority Revenue, | | | | |
| Ascension Health Senior Credit Group, Series A, 5.00%, 11/15/40 | | 18,520,000 | | 17,665,302 |
| Brunswick School, Series A, NATL Insured, 5.00%, 7/01/29 | | 5,000,000 | | 4,718,750 |
| Canterbury School, Series B, Radian Insured, 5.00%, 7/01/36 | | 1,000,000 | | 877,600 |
| Child Care Facilities Program, Series C, AMBAC Insured, 5.625%, 7/01/29 | | 1,215,000 | | 1,215,838 |
| Child Care Facilities Program, Series E, AMBAC Insured, 5.00%, 7/01/31 | | 1,000,000 | | 984,880 |
| Child Care Facilities Program, Series G, Assured Guaranty, 6.00%, 7/01/28 | | 2,250,000 | | 2,479,185 |
| Danbury Hospital Issue, Refunding, Series G, AMBAC Insured, 5.75%, 7/01/29 | | 3,500,000 | | 3,358,145 |
| Eastern Connecticut Health Network, Refunding, Series A, Radian Insured, 6.00%, | | | | |
| 7/01/25 | | 2,965,000 | | 2,928,293 |
| Eastern Connecticut Health Network, Refunding, Series C, Radian Insured, 5.125%, | | | | |
| 7/01/30 | | 2,500,000 | | 2,124,525 |
| Fairfield University, Series M, 5.00%, 7/01/26 | | 450,000 | | 453,816 |
| Fairfield University, Series M, 5.00%, 7/01/34 | | 1,000,000 | | 949,760 |
| Fairfield University, Series N, 5.00%, 7/01/29 | | 7,000,000 | | 6,974,590 |
| Hartford University, Series G, Radian Insured, 5.25%, 7/01/26 | | 5,000,000 | | 4,665,100 |
| Horace Bushnell Memorial Hall, Series A, NATL Insured, 5.625%, 7/01/29 | | 1,000,000 | | 1,007,390 |
| Hospital for Special Care, Series C, Radian Insured, 5.25%, 7/01/37 | | 2,500,000 | | 2,105,475 |
| Loomis Chafee School, Series G, 5.00%, 7/01/30 | | 3,000,000 | | 3,008,910 |
| Loomis Chafee School, Series G, 5.00%, 7/01/38 | | 6,285,000 | | 5,944,667 |
| Lutheran General Health Care System, ETM, 7.375%, 7/01/19 | | 350,000 | | 423,560 |
| Miss Porter’s School Issue, Series B, AMBAC Insured, 5.00%, 7/01/26 | | 1,730,000 | | 1,800,376 |
| Miss Porter’s School Issue, Series B, AMBAC Insured, 5.00%, 7/01/36 | | 4,415,000 | | 4,267,009 |
| New Horizons Village Project, 7.30%, 11/01/16 | | 2,580,000 | | 2,591,378 |
| New Money, Series O, 5.00%, 7/01/35 | | 4,000,000 | | 3,810,440 |
| New Money, Series O, 5.00%, 7/01/40 | | 5,000,000 | | 4,658,250 |
| Norwich Free Academy, Series A, AMBAC Insured, 5.00%, 7/01/34 | | 1,675,000 | | 1,676,407 |
| Quinnipiac University, Series H, AMBAC Insured, 5.00%, 7/01/36 | | 8,000,000 | | 7,425,760 |
| Quinnipiac University, Series J, NATL Insured, 5.00%, 7/01/37 | | 15,000,000 | | 13,883,550 |
| Renbrook School, Series A, AMBAC Insured, 5.00%, 7/01/37 | | 1,170,000 | | 1,011,875 |
| |
| 116 | Annual Report | | | | |
| | | | |
| Franklin Tax-Free Trust | | | | |
| |
| Statement of Investments, February 28, 2011 (continued) | | | | |
| |
| |
| Franklin Connecticut Tax-Free Income Fund | | Principal Amount | | Value |
| Municipal Bonds (continued) | | | | |
| Connecticut (continued) | | | | |
| Connecticut State Health and Educational Facilities Authority Revenue, (continued) | | | | |
| Sacred Heart University, Refunding, Series E, Radian Insured, 5.00%, 7/01/28 | $ | 4,000,000 | $ | 3,652,800 |
| Sacred Heart University, Series C, 6.50%, 7/01/16 | | 170,000 | | 170,585 |
| Sacred Heart University, Series C, 6.625%, 7/01/26 | | 785,000 | | 787,622 |
| Salisbury School, Series C, Assured Guaranty, 5.00%, 7/01/38 | | 5,000,000 | | 4,904,700 |
| Series B, NATL Insured, 5.00%, 7/01/33 | | 2,000,000 | | 1,865,380 |
| St. Mary’s Hospital, Refunding, Series E, 5.50%, 7/01/20 | | 4,615,000 | | 4,250,000 |
| Stamford Hospital, Series I, 5.00%, 7/01/30 | | 7,000,000 | | 6,780,340 |
| The William W. Backus Hospital, Series F, AGMC Insured, 5.00%, 7/01/28 | | 1,500,000 | | 1,516,410 |
| The William W. Backus Hospital, Series F, AGMC Insured, 5.125%, 7/01/35 | | 4,025,000 | | 3,923,651 |
| Trinity College, Refunding, Series J, NATL Insured, 4.50%, 7/01/37 | | 2,000,000 | | 1,749,480 |
| Trinity College, Series G, AMBAC Insured, Pre-Refunded, 5.00%, 7/01/31 | | 5,425,000 | | 5,561,384 |
| Trinity College, Series H, NATL Insured, 5.00%, 7/01/26 | | 1,855,000 | | 1,882,677 |
| Village Families and Children, Series A, AMBAC Insured, 5.00%, 7/01/32 | | 1,000,000 | | 827,120 |
| Wesleyan University, 5.00%, 7/01/39 | | 10,000,000 | | 9,894,700 |
| Westminster School, Series E, XLCA Insured, 5.00%, 7/01/37 | | 10,660,000 | | 10,237,224 |
| Yale University, Series A-2, 5.00%, 7/01/40 | | 13,000,000 | | 13,270,920 |
| Yale University, Series Y-1, 5.00%, 7/01/35 | | 15,000,000 | | 15,202,650 |
| Yale University, Series Z-1, 5.00%, 7/01/42 | | 10,000,000 | | 10,158,100 |
| Yale-New Haven Hospital, Series J-1, AMBAC Insured, 5.00%, 7/01/31 | | 12,500,000 | | 12,365,500 |
| Connecticut State HFA Housing Mortgage Finance Program Revenue, | | | | |
| 5.20%, 11/15/34 | | 1,770,000 | | 1,788,691 |
| 5.30%, 11/15/39 | | 2,390,000 | | 2,381,061 |
| Sub Series C-1, 4.85%, 11/15/34 | | 3,260,000 | | 3,141,466 |
| Sub Series C-1, 4.95%, 11/15/39 | | 6,190,000 | | 5,969,079 |
| Sub Series D-2, 5.00%, 5/15/31 | | 5,000,000 | | 4,955,700 |
| Connecticut State HFAR, | | | | |
| Housing Mortgage Finance Program, Series E, Sub Series E-4, 5.05%, 5/15/28 | | 4,650,000 | | 4,651,814 |
| Housing Mortgage Finance Program, Series F, Sub Series F-2, 5.875%, 11/15/33 | | 3,170,000 | | 3,181,951 |
| Housing Mortgage Finance Program, Series F, Sub Series F-2, 6.00%, 11/15/38 | | 1,295,000 | | 1,299,843 |
| Special Obligation, Special Needs Housing, Series 1, AMBAC Insured, 5.00%, 6/15/22 | | 1,000,000 | | 1,031,040 |
| Special Obligation, Special Needs Housing, Series 1, AMBAC Insured, 5.00%, 6/15/32 | | 1,000,000 | | 958,220 |
| State Supported Special Obligation, Series 10, 5.00%, 6/15/28 | | 420,000 | | 433,188 |
| State Supported Special Obligation, Series 13, 5.00%, 6/15/40 | | 1,500,000 | | 1,490,745 |
| Connecticut State Higher Education Supplemental Loan Authority Revenue, | | | | |
| CHESLA Loan Program, Series A, 5.05%, 11/15/27 | | 970,000 | | 991,864 |
| Family Education Loan Program, Series A, AMBAC Insured, 6.00%, 11/15/18 | | 520,000 | | 525,938 |
| Family Education Loan Program, Series A, NATL Insured, 5.50%, 11/15/17 | | 365,000 | | 372,661 |
| Connecticut State Revenue, Revolving Fund, Series A, 5.00%, | | | | |
| 7/01/26 | | 6,025,000 | | 6,379,390 |
| 7/01/27 | | 4,060,000 | | 4,290,770 |
| Connecticut State Special Tax Obligation Revenue, Transportation Infrastructure, | | | | |
| Series A, AGMC Insured, Pre-Refunded, 5.375%, 10/01/18 | | 1,000,000 | | 1,029,150 |
| Series B, AMBAC Insured, 5.00%, 12/01/22 | | 1,000,000 | | 1,029,910 |
| Series B, AMBAC Insured, Pre-Refunded, 5.00%, 12/01/20 | | 5,000,000 | | 5,380,250 |
Annual Report | 117
| | | | |
| Franklin Tax-Free Trust | | | | |
| |
| Statement of Investments, February 28, 2011 (continued) | | | | |
| |
| |
| Franklin Connecticut Tax-Free Income Fund | | Principal Amount | | Value |
| Municipal Bonds (continued) | | | | |
| Connecticut (continued) | | | | |
| Greater New Haven Water Pollution Control Authority Regional Water Revenue, | | | | |
| Refunding, Series A, NATL Insured, 5.00%, 11/15/24 | $ | 3,315,000 | $ | 3,384,284 |
| Refunding, Series A, NATL Insured, 5.00%, 8/15/35 | | 1,000,000 | | 952,540 |
| Series A, AGMC Insured, 5.00%, 11/15/37 | | 3,000,000 | | 2,876,100 |
| New Haven GO, | | | | |
| Series A, Assured Guaranty, 5.00%, 3/01/29 | | 1,000,000 | | 1,025,160 |
| Series C, NATL Insured, ETM, 5.00%, 11/01/22 | | 25,000 | | 26,449 |
| Series C, NATL Insured, Pre-Refunded, 5.00%, 11/01/22 | | 2,975,000 | | 3,201,844 |
| South Central Regional Water Authority Water System Revenue, | | | | |
| Eighteenth Series B, NATL Insured, 5.25%, 8/01/29 | | 1,000,000 | | 1,045,610 |
| Eighteenth Series B, NATL Insured, 5.25%, 8/01/32 | | 1,000,000 | | 1,017,690 |
| Eighteenth Series B-1, NATL Insured, 5.00%, 8/01/26 | | 3,500,000 | | 3,603,705 |
| Refunding, Twenty-second Series, AGMC Insured, 5.00%, 8/01/38 | | 5,000,000 | | 4,819,200 |
| Series A, NATL Insured, 5.00%, 8/01/33 | | 5,000,000 | | 5,005,400 |
| University of Connecticut Revenue, Student Fee, | | | | |
| Refunding, Series A, NATL RE, FGIC Insured, 5.00%, 11/15/26 | | 10,000,000 | | 10,292,300 |
| Series A, 5.00%, 5/15/23 | | 10,000,000 | | 10,232,400 |
| | | | | 355,352,892 |
| U.S. Territories 24.6% | | | | |
| Puerto Rico 24.2% | | | | |
| Children’s Trust Fund Puerto Rico Tobacco Settlement Revenue, Asset-Backed Bonds, | | | | |
| Refunding, 5.50%, 5/15/39 | | 4,000,000 | | 3,183,600 |
| Puerto Rico Commonwealth Aqueduct and Sewer Authority Revenue, senior lien, Series A, | | | | |
| 6.00%, 7/01/44 | | 1,000,000 | | 929,540 |
| Assured Guaranty, 5.00%, 7/01/28 | | 2,000,000 | | 1,934,580 |
| Puerto Rico Commonwealth GO, Public Improvement, | | | | |
| Refunding, AGMC Insured, 5.125%, 7/01/30 | | 835,000 | | 806,627 |
| Refunding, Series B, 6.00%, 7/01/39 | | 10,000,000 | | 9,891,500 |
| Series A, 5.00%, 7/01/29 | | 1,000,000 | | 949,290 |
| Series A, 5.125%, 7/01/31 | | 3,195,000 | | 3,196,662 |
| Series A, 5.00%, 7/01/33 | | 465,000 | | 404,048 |
| Series A, 5.00%, 7/01/34 | | 280,000 | | 242,225 |
| Series A, FGIC Insured, Pre-Refunded, 5.00%, 7/01/32 | | 1,000,000 | | 1,060,710 |
| Series A, Pre-Refunded, 5.00%, 7/01/33 | | 535,000 | | 587,237 |
| Series B, 5.00%, 7/01/35 | | 1,895,000 | | 1,619,543 |
| Series B, Pre-Refunded, 5.00%, 7/01/35 | | 3,105,000 | | 3,623,007 |
| Puerto Rico Commonwealth Highway and Transportation Authority Transportation Revenue, | | | | |
| Refunding, Series A, 5.00%, 7/01/38 | | 120,000 | | 101,053 |
| Series G, 5.00%, 7/01/33 | | 400,000 | | 349,776 |
| Series G, Pre-Refunded, 5.00%, 7/01/33 | | 600,000 | | 659,316 |
| Puerto Rico Commonwealth Infrastructure Financing Authority Special Tax Revenue, | | | | |
| 5.00%, 7/01/46 | | 6,790,000 | | 5,362,810 |
| Puerto Rico Convention Center District Authority Hotel Occupancy Tax Revenue, Series A, | | | | |
| AMBAC Insured, 5.00%, 7/01/31 | | 5,000,000 | | 4,459,900 |
118 | Annual Report
Franklin Tax-Free Trust
Statement of Investments, February 28, 2011 (continued)
| | | | |
| Franklin Connecticut Tax-Free Income Fund | | Principal Amount | | Value |
| Municipal Bonds (continued) | | | | |
| U.S. Territories (continued) | | | | |
| Puerto Rico (continued) | | | | |
| Puerto Rico Electric Power Authority Power Revenue, | | | | |
| Series II, Pre-Refunded, 5.25%, 7/01/31 | $ | 1,000,000 | $ | 1,073,270 |
| Series RR, XLCA Insured, Pre-Refunded, 5.00%, 7/01/30 | | 1,000,000 | | 1,147,920 |
| Series TT, 5.00%, 7/01/32 | | 18,500,000 | | 16,742,500 |
| Series WW, 5.50%, 7/01/38 | | 6,700,000 | | 6,102,896 |
| Series XX, 5.25%, 7/01/40 | | 1,000,000 | | 873,340 |
| Puerto Rico HFAR, Capital Fund Modernization, 5.125%, 12/01/27 | | 4,250,000 | | 4,251,020 |
| Puerto Rico Industrial Tourist Educational Medical and Environmental Control Facilities | | | | |
| Financing Authority Educational Facilities Revenue, University Plaza Project, Series A, | | | | |
| NATL Insured, 5.00%, 7/01/33 | | 1,000,000 | | 876,790 |
| Puerto Rico Industrial Tourist Educational Medical and Environmental Control Facilities | | | | |
| Financing Authority Industrial Revenue, Guaynabo Warehouse, Series A, 5.15%, 7/01/19 | | 3,320,000 | | 3,395,530 |
| Puerto Rico PBA Guaranteed Revenue, Government Facilities, | | | | |
| Refunding, Series D, 5.375%, 7/01/33 | | 1,995,000 | | 1,870,472 |
| Series D, Pre-Refunded, 5.375%, 7/01/33 | | 6,005,000 | | 6,378,631 |
| Series I, 5.00%, 7/01/36 | | 1,000,000 | | 847,590 |
| Puerto Rico Sales Tax FICO Sales Tax Revenue, first sub., | | | | |
| Series A, 6.00%, 8/01/42 | | 22,000,000 | | 22,041,800 |
| Series C, 5.50%, 8/01/40 | | 5,000,000 | | 4,675,850 |
| University of Puerto Rico Revenues, University System, Refunding, | | | | |
| Series P, 5.00%, 6/01/26 | | 5,000,000 | | 4,689,800 |
| Series Q, 5.00%, 6/01/36 | | 1,500,000 | | 1,271,685 |
| | | | | 115,600,518 |
| U.S. Virgin Islands 0.4% | | | | |
| Virgin Islands PFAR, senior lien, Capital Projects, Series A-1, 5.00%, 10/01/29 | | 1,000,000 | | 941,330 |
| Virgin Islands Water and Power Authority Electric System Revenue, Refunding, 5.30%, | | | | |
| 7/01/21 | | 1,000,000 | | 1,000,490 |
| | | | | 1,941,820 |
| Total U.S. Territories | | | | 117,542,338 |
| Total Municipal Bonds before Short Term Investments | | | | |
| (Cost $486,681,302) | | | | 472,895,230 |
| Short Term Investments (Cost $500,000) 0.1% | | | | |
| Municipal Bonds 0.1% | | | | |
| Connecticut 0.1% | | | | |
| aConnecticut State Health and Educational Facilities Authority Revenue, Greater Hartford YMCA, | | | | |
| Series B, Daily VRDN and Put, 0.26%, 7/01/38 | | 500,000 | | 500,000 |
| Total Investments (Cost $487,181,302) 99.1% | | | | 473,395,230 |
| Other Assets, less Liabilities 0.9% | | | | 4,222,680 |
| Net Assets 100.0% | | | $ | 477,617,910 |
| |
| See Abbreviations on page 205. | | | | |
aVariable rate demand notes (VRDNs) are tax-exempt obligations which contain a floating or variable interest rate adjustment formula and an unconditional right of demand to receive payment of the principal balance plus accrued interest at specified dates. The coupon rate shown represents the rate at period end.
Annual Report | The accompanying notes are an integral part of these financial statements. | 119
| | | | | | | | | | | | | | | |
| Franklin Tax-Free Trust | | | | | | | | | | | | | |
| Financial Highlights | | | | | | | | | | | | | | | |
| |
| Franklin Michigan Tax-Free Income Fund | | | | | | | | | | | | | | | |
| | | | | | Year Ended February 28, | | | | |
| Class A | | 2011 | | | 2010 | | | 2009 | | | 2008 | a | | 2007 | |
| Per share operating performance | | | | | | | | | | | | | | | |
| (for a share outstanding throughout the year) | | | | | | | | | | | | | | | |
| Net asset value, beginning of year | $ | 11.97 | | $ | 11.48 | | $ | 11.71 | | $ | 12.24 | | $ | 12.27 | |
| Income from investment operationsb: | | | | | | | | | | | | | | | |
| Net investment incomec | | 0.51 | | | 0.52 | | | 0.51 | | | 0.51 | | | 0.53 | |
| Net realized and unrealized gains (losses) | | (0.43 | ) | | 0.49 | | | (0.23 | ) | | (0.51 | ) | | (0.01 | ) |
| Total from investment operations | | 0.08 | | | 1.01 | | | 0.28 | | | — | | | 0.52 | |
| Less distributions from: | | | | | | | | | | | | | | | |
| Net investment income | | (0.51 | ) | | (0.52 | ) | | (0.51 | ) | | (0.52 | ) | | (0.53 | ) |
| Net realized gains | | (0.02 | ) | | — | | | — | | | (0.01 | ) | | (0.02 | ) |
| Total distributions | | (0.53 | ) | | (0.52 | ) | | (0.51 | ) | | (0.53 | ) | | (0.55 | ) |
| Redemption feesd | | — | | | — | | | —e | | | —e | | | —e | |
| Net asset value, end of year | $ | 11.52 | | $ | 11.97 | | $ | 11.48 | | $ | 11.71 | | $ | 12.24 | |
| |
| Total returnf | | 0.62 | % | | 8.92 | % | | 2.41 | % | | (0.06 | )% | | 4.35 | % |
| |
| Ratios to average net assets | | | | | | | | | | | | | | | |
| Expenses | | 0.63 | % | | 0.63 | % | | 0.63 | % | | 0.64 | % | | 0.64 | % |
| Net investment income | | 4.27 | % | | 4.40 | % | | 4.40 | % | | 4.25 | % | | 4.34 | % |
| |
| Supplemental data | | | | | | | | | | | | | | | |
| Net assets, end of year (000’s) | $ | 1,204,877 | | $ | 1,345,427 | | $ | 1,318,955 | | $ | 1,294,052 | | $ | 1,260,755 | |
| Portfolio turnover rate | | 10.74 | % | | 5.47 | % | | 16.08 | % | | 13.00 | % | | 7.97 | % |
|
| aFor the year ended February 29. |
| bThe amount shown for a share outstanding throughout the period may not correlate with the Statement of Operations for the period due to the timing of sales and repurchases of |
| the Fund shares in relation to income earned and/or fluctuating market value of the investments of the Fund. |
| cBased on average daily shares outstanding. |
| dEffective September 1, 2008, the redemption fee was eliminated. |
| eAmount rounds to less than $0.01 per share. |
| fTotal return does not reflect sales commissions or contingent deferred sales charges, if applicable. |
120 | The accompanying notes are an integral part of these financial statements. | Annual Report
| | | | | | | | | | | | | | | |
| Franklin Tax-Free Trust | | | | | | | | | | | | | | | |
| Financial Highlights (continued) | | | | | | | | | | | | | | | |
| |
| Franklin Michigan Tax-Free Income Fund | | | | | | | | | | | | | | | |
| | | | | | Year Ended February 28, | | | | |
| Class B | | 2011 | | | 2010 | | | 2009 | | | 2008 | a | | 2007 | |
| Per share operating performance | | | | | | | | | | | | | | | |
| (for a share outstanding throughout the year) | | | | | | | | | | | | | | | |
| Net asset value, beginning of year | $ | 12.03 | | $ | 11.54 | | $ | 11.77 | | $ | 12.30 | | $ | 12.33 | |
| Income from investment operationsb: | | | | | | | | | | | | | | | |
| Net investment incomec | | 0.44 | | | 0.46 | | | 0.45 | | | 0.45 | | | 0.46 | |
| Net realized and unrealized gains (losses) | | (0.42 | ) | | 0.48 | | | (0.24 | ) | | (0.52 | ) | | (0.01 | ) |
| Total from investment operations | | 0.02 | | | 0.94 | | | 0.21 | | | (0.07 | ) | | 0.45 | |
| Less distributions from: | | | | | | | | | | | | | | | |
| Net investment income | | (0.45 | ) | | (0.45 | ) | | (0.44 | ) | | (0.45 | ) | | (0.46 | ) |
| Net realized gains | | (0.02 | ) | | — | | | — | | | (0.01 | ) | | (0.02 | ) |
| Total distributions | | (0.47 | ) | | (0.45 | ) | | (0.44 | ) | | (0.46 | ) | | (0.48 | ) |
| Redemption feesd | | — | | | — | | | —e | | | —e | | | —e | |
| Net asset value, end of year | $ | 11.58 | | $ | 12.03 | | $ | 11.54 | | $ | 11.77 | | $ | 12.30 | |
| |
| Total returnf | | 0.06 | % | | 8.28 | % | | 1.84 | % | | (0.61 | )% | | 3.77 | % |
| |
| Ratios to average net assets | | | | | | | | | | | | | | | |
| Expenses | | 1.18 | % | | 1.18 | % | | 1.18 | % | | 1.19 | % | | 1.19 | % |
| Net investment income | | 3.72 | % | | 3.85 | % | | 3.85 | % | | 3.70 | % | | 3.79 | % |
| |
| Supplemental data | | | | | | | | | | | | | | | |
| Net assets, end of year (000’s) | $ | 7,490 | | $ | 17,892 | | $ | 30,625 | | $ | 39,466 | | $ | 45,664 | |
| Portfolio turnover rate | | 10.74 | % | | 5.47 | % | | 16.08 | % | | 13.00 | % | | 7.97 | % |
|
| aFor the year ended February 29. |
| bThe amount shown for a share outstanding throughout the period may not correlate with the Statement of Operations for the period due to the timing of sales and repurchases of |
| the Fund shares in relation to income earned and/or fluctuating market value of the investments of the Fund. |
| cBased on average daily shares outstanding. |
| dEffective September 1, 2008, the redemption fee was eliminated. |
| eAmount rounds to less than $0.01 per share. |
| fTotal return does not reflect sales commissions or contingent deferred sales charges, if applicable. |
Annual Report | The accompanying notes are an integral part of these financial statements. | 121
| | | | | | | | | | | | | | | |
| Franklin Tax-Free Trust | | | | | | | | | | | | | | | |
| Financial Highlights (continued) | | | | | | | | | | | | | | | |
| |
| Franklin Michigan Tax-Free Income Fund | | | | | | | | | | | | | | | |
| | | | | | Year Ended February 28, | | | | |
| Class C | | 2011 | | | 2010 | | | 2009 | | | 2008 | a | | 2007 | |
| Per share operating performance | | | | | | | | | | | | | | | |
| (for a share outstanding throughout the year) | | | | | | | | | | | | | | | |
| Net asset value, beginning of year | $ | 12.11 | | $ | 11.61 | | $ | 11.83 | | $ | 12.36 | | $ | 12.39 | |
| Income from investment operationsb: | | | | | | | | | | | | | | | |
| Net investment incomec | | 0.45 | | | 0.46 | | | 0.45 | | | 0.45 | | | 0.47 | |
| Net realized and unrealized gains (losses) | | (0.44 | ) | | 0.49 | | | (0.23 | ) | | (0.52 | ) | | (0.02 | ) |
| Total from investment operations | | 0.01 | | | 0.95 | | | 0.22 | | | (0.07 | ) | | 0.45 | |
| Less distributions from: | | | | | | | | | | | | | | | |
| Net investment income | | (0.44 | ) | | (0.45 | ) | | (0.44 | ) | | (0.45 | ) | | (0.46 | ) |
| Net realized gains | | (0.02 | ) | | — | | | — | | | (0.01 | ) | | (0.02 | ) |
| Total distributions | | (0.46 | ) | | (0.45 | ) | | (0.44 | ) | | (0.46 | ) | | (0.48 | ) |
| Redemption feesd | | — | | | — | | | —e | | | —e | | | —e | |
| Net asset value, end of year | $ | 11.66 | | $ | 12.11 | | $ | 11.61 | | $ | 11.83 | | $ | 12.36 | |
| |
| Total returnf | | 0.04 | % | | 8.31 | % | | 1.91 | % | | (0.61 | )% | | 3.74 | % |
| |
| Ratios to average net assets | | | | | | | | | | | | | | | |
| Expenses | | 1.18 | % | | 1.18 | % | | 1.18 | % | | 1.19 | % | | 1.19 | % |
| Net investment income | | 3.72 | % | | 3.85 | % | | 3.85 | % | | 3.70 | % | | 3.79 | % |
| |
| Supplemental data | | | | | | | | | | | | | | | |
| Net assets, end of year (000’s) | $ | 180,024 | | $ | 195,638 | | $ | 173,295 | | $ | 131,079 | | $ | 126,535 | |
| Portfolio turnover rate | | 10.74 | % | | 5.47 | % | | 16.08 | % | | 13.00 | % | | 7.97 | % |
|
| aFor the year ended February 29. |
| bThe amount shown for a share outstanding throughout the period may not correlate with the Statement of Operations for the period due to the timing of sales and repurchases of |
| the Fund shares in relation to income earned and/or fluctuating market value of the investments of the Fund. |
| cBased on average daily shares outstanding. |
| dEffective September 1, 2008, the redemption fee was eliminated. |
| eAmount rounds to less than $0.01 per share. |
| fTotal return does not reflect sales commissions or contingent deferred sales charges, if applicable. |
122 | The accompanying notes are an integral part of these financial statements. | Annual Report
| | | | | | | | | |
| Franklin Tax-Free Trust | | | | | | | | | |
| Financial Highlights (continued) | | | | | | | | | |
| |
| Franklin Michigan Tax-Free Income Fund | | | | | | | | | |
| | | Year Ended February 28, | |
| Advisor Class | | 2011 | | | 2010 | | | 2009 | a |
| Per share operating performance | | | | | | | | | |
| (for a share outstanding throughout the year) | | | | | | | | | |
| Net asset value, beginning of year | $ | 11.99 | | $ | 11.49 | | $ | 11.95 | |
| Income from investment operationsb: | | | | | | | | | |
| Net investment incomec | | 0.52 | | | 0.53 | | | 0.35 | |
| Net realized and unrealized gains (losses) | | (0.43 | ) | | 0.50 | | | (0.47 | ) |
| Total from investment operations | | 0.09 | | | 1.03 | | | (0.12 | ) |
| Less distributions from: | | | | | | | | | |
| Net investment income | | (0.52 | ) | | (0.53 | ) | | (0.34 | ) |
| Net realized gains | | (0.02 | ) | | — | | | — | |
| Total distributions | | (0.54 | ) | | (0.53 | ) | | (0.34 | ) |
| Net asset value, end of year | $ | 11.54 | | $ | 11.99 | | $ | 11.49 | |
| |
| Total returnd | | 0.72 | % | | 9.11 | % | | (0.92 | )% |
| |
| Ratios to average net assetse | | | | | | | | | |
| Expenses | | 0.53 | % | | 0.53 | % | | 0.53 | % |
| Net investment income | | 4.37 | % | | 4.50 | % | | 4.50 | % |
| |
| Supplemental data | | | | | | | | | |
| Net assets, end of year (000’s) | $ | 7,567 | | $ | 3,486 | | $ | 769 | |
| Portfolio turnover rate | | 10.74 | % | | 5.47 | % | | 16.08 | % |
|
| aFor the period July 1, 2008 (effective date) to February 28, 2009. |
| bThe amount shown for a share outstanding throughout the period may not correlate with the Statement of Operations for the period due to the timing of sales and repurchases of |
| the Fund shares in relation to income earned and/or fluctuating market value of the investments of the Fund. |
| cBased on average daily shares outstanding. |
| dTotal return is not annualized for periods less than one year. |
| eRatios are annualized for periods less than one year. |
Annual Report | The accompanying notes are an integral part of these financial statements. | 123
| | | | |
| Franklin Tax-Free Trust | | | | |
| |
| Statement of Investments, February 28, 2011 | | | | |
| |
| |
| Franklin Michigan Tax-Free Income Fund | | Principal Amount | | Value |
| Municipal Bonds 98.1% | | | | |
| Michigan 89.8% | | | | |
| Adrian City School District GO, AGMC Insured, Pre-Refunded, 5.00%, | | | | |
| 5/01/26 | $ | 1,960,000 | $ | 2,196,160 |
| 5/01/29 | | 2,125,000 | | 2,381,041 |
| 5/01/34 | | 6,690,000 | | 7,496,078 |
| Allen Park Brownfield RDA, GO, Limited Redevelopment, Tax Increment, AMBAC Insured, | | | | |
| 5.00%, 5/01/32 | | 7,300,000 | | 6,454,879 |
| Allendale Public School District GO, School Building and Site, | | | | |
| FGIC Insured, Pre-Refunded, 5.125%, 5/01/27 | | 6,450,000 | | 6,799,525 |
| FGIC Insured, Pre-Refunded, 5.125%, 5/01/32 | | 5,490,000 | | 5,787,503 |
| Series A, AGMC Insured, 5.00%, 5/01/37 | | 11,810,000 | | 11,088,527 |
| Avondale School District GO, School Building and Site, AGMC Insured, Pre-Refunded, | | | | |
| 5.00%, 5/01/29 | | 9,000,000 | | 9,826,470 |
| Battle Creek School District GO, School Building and Site, AGMC Insured, 5.00%, | | | | |
| 5/01/31 | | 4,000,000 | | 4,069,720 |
| 5/01/34 | | 10,165,000 | | 10,185,635 |
| Bay City School District GO, School Building and Site, AGMC Insured, 5.00%, 5/01/31 | | 6,000,000 | | 6,007,680 |
| Brown City Community School District GO, Building and Site, FGIC Insured, Pre-Refunded, | | | | |
| 5.00%, 5/01/31 | | 3,200,000 | | 3,297,728 |
| Caledonia Community Schools GO, NATL Insured, 5.00%, 5/01/26 | | 3,665,000 | | 3,703,446 |
| Carman-Ainsworth Community School District GO, | | | | |
| FGIC Insured, Pre-Refunded, 5.00%, 5/01/27 | | 1,550,000 | | 1,628,973 |
| NATL RE, FGIC Insured, 5.00%, 5/01/27 | | 1,400,000 | | 1,406,020 |
| Central Michigan University Revenue, | | | | |
| General, AMBAC Insured, 5.00%, 10/01/34 | | 8,905,000 | | 8,269,450 |
| Series A, AMBAC Insured, 5.05%, 10/01/32 | | 10,000,000 | | 9,668,000 |
| Detroit City School District GO, School Building and Site Improvement, | | | | |
| Series A, AGMC Insured, 6.00%, 5/01/29 | | 10,000,000 | | 10,264,100 |
| Series A, AGMC Insured, Pre-Refunded, 5.125%, 5/01/31 | | 38,330,000 | | 40,384,105 |
| Series A, FGIC Insured, Pre-Refunded, 5.00%, 5/01/23 | | 2,650,000 | | 2,884,366 |
| Series B, FGIC Insured, 5.00%, 5/01/25 | | 2,000,000 | | 2,005,540 |
| Detroit GO, | | | | |
| Distribution State Aid, 5.00%, 11/01/30 | | 5,000,000 | | 4,877,450 |
| Distribution State Aid, 5.25%, 11/01/35 | | 5,000,000 | | 4,858,250 |
| Series A, Assured Guaranty, 5.00%, 4/01/28 | | 5,000,000 | | 4,178,500 |
| Detroit Public Improvements GO, Series A-1, NATL Insured, 5.00%, 4/01/20 | | 10,610,000 | | 9,331,495 |
| Detroit Sewer Disposal System Revenue, | | | | |
| second lien, Series A, NATL Insured, 5.125%, 7/01/33 | | 18,790,000 | | 17,016,976 |
| senior lien, Refunding, Series A, AGMC Insured, 5.00%, 7/01/32 | | 5,960,000 | | 5,418,236 |
| senior lien, Series B, AGMC Insured, 7.50%, 7/01/33 | | 6,000,000 | | 7,033,260 |
| Detroit Water Supply System Revenue, | | | | |
| FGIC Insured, ETM, 6.25%, 7/01/12 | | 475,000 | | 495,387 |
| second lien, Refunding, Series C, AGMC Insured, 5.00%, 7/01/33 | | 20,000,000 | | 18,266,000 |
| second lien, Series B, FGIC Insured, Pre-Refunded, 5.50%, 7/01/33 | | 20,000,000 | | 20,532,000 |
| second lien, Series B, NATL Insured, 5.00%, 7/01/34 | | 8,875,000 | | 8,004,096 |
| second lien, Series B, NATL Insured, Pre-Refunded, 5.00%, 7/01/34 | | 5,270,000 | | 5,765,275 |
| senior lien, Refunding, Series B, BHAC Insured, 5.25%, 7/01/35 | | 17,500,000 | | 16,316,650 |
| senior lien, Series A, AGMC Insured, 5.00%, 7/01/34 | | 38,740,000 | | 34,899,316 |
| senior lien, Series A, FGIC Insured, Pre-Refunded, 5.25%, 7/01/33 | | 4,880,000 | | 4,954,615 |
124 | Annual Report
| | | | | |
| | Franklin Tax-Free Trust | | | | |
| |
| | Statement of Investments, February 28, 2011 (continued) | | | | |
| |
| |
| | Franklin Michigan Tax-Free Income Fund | | Principal Amount | | Value |
| | Municipal Bonds (continued) | | | | |
| | Michigan (continued) | | | | |
| | Detroit Water Supply System Revenue, (continued) | | | | |
| | senior lien, Series A, NATL Insured, 5.00%, 7/01/27 | $ | 4,930,000 | $ | 4,875,474 |
| | senior lien, Series A, NATL RE, FGIC Insured, 5.00%, 7/01/30 | | 11,400,000 | | 10,700,154 |
| | senior lien, Series A, NATL RE, FGIC Insured, Pre-Refunded, 5.25%, 7/01/33 | | 4,745,000 | | 4,820,778 |
| | Detroit/Wayne County Stadium Authority Revenue, NATL RE, FGIC Insured, 5.25%, | | | | |
| | 2/01/27 | | 5,500,000 | | 5,406,610 |
| | Eastern Michigan University Revenues, Series A, FGIC Insured, Pre-Refunded, 5.00%, | | | | |
| | 6/01/28 | | 6,730,000 | | 7,347,949 |
| | 6/01/33 | | 14,700,000 | | 16,049,754 |
| | Eaton Rapids Public Schools GO, School Building and Site, AGMC Insured, | | | | |
| | 5.00%, 5/01/26 | | 2,700,000 | | 2,760,750 |
| | 5.00%, 5/01/29 | | 820,000 | | 834,325 |
| Pre | -Refunded, 5.00%, 5/01/29 | | 1,930,000 | | 2,159,342 |
| | Farmington Hills EDC Revenue, Botsford Continuing Care, Series A, NATL Insured, 5.75%, | | | | |
| | 2/15/25 | | 100,000 | | 96,105 |
| | Fennville Public Schools GO, School Building and Site, | | | | |
| | FGIC Insured, Pre-Refunded, 5.00%, 5/01/30 | | 1,115,000 | | 1,249,346 |
| | FGIC Insured, Pre-Refunded, 5.00%, 5/01/34 | | 3,250,000 | | 3,641,593 |
| | NATL RE, FGIC Insured, 5.00%, 5/01/30 | | 2,085,000 | | 2,121,425 |
| | Ferris State University Revenue, NATL RE, FGIC Insured, 5.25%, | | | | |
| | 10/01/26 | | 1,500,000 | | 1,500,825 |
| | 10/01/31 | | 3,255,000 | | 3,255,521 |
| | Fowlerville Community School District GO, NATL RE, FGIC Insured, 5.00%, | | | | |
| | 5/01/30 | | 1,990,000 | | 2,015,970 |
| | 5/01/34 | | 8,145,000 | | 8,111,280 |
| | Fraser Public School District GO, School Building and Site, AGMC Insured, 5.00%, | | | | |
| | 5/01/30 | | 8,520,000 | | 8,579,810 |
| | Genesee County GO, Water Supply System, AMBAC Insured, 5.00%, 11/01/30 | | 4,000,000 | | 3,906,760 |
| | Grand Blanc Community Schools GO, School Building and Site, AGMC Insured, 5.00%, | | | | |
| | 5/01/28 | | 4,250,000 | | 4,278,093 |
| | Grand Rapids Building Authority Revenue, Series A, AMBAC Insured, | | | | |
| | 5.00%, 10/01/28 | | 3,590,000 | | 3,621,269 |
| Pre | -Refunded, 5.00%, 10/01/28 | | 2,410,000 | | 2,577,832 |
| | Grand Rapids Sanitation Sewer System Revenue, NATL Insured, 5.00%, 1/01/30 | | 4,900,000 | | 4,971,981 |
| | Grand Rapids Water Supply Revenue, Assured Guaranty, 5.10%, 1/01/39 | | 3,000,000 | | 3,013,230 |
| | Grand Valley State University Revenue, General, | | | | |
| | 5.75%, 12/01/34 | | 1,500,000 | | 1,535,145 |
| | Refunding, Series A, AGMC Insured, 5.00%, 12/01/28 | | 17,165,000 | | 17,487,359 |
| | Refunding, Series A, AGMC Insured, 5.00%, 12/01/33 | | 8,570,000 | | 8,477,530 |
| | Hazel Park School District GO, AGMC Insured, 5.00%, | | | | |
| | 5/01/27 | | 9,000,000 | | 9,073,170 |
| | 5/01/32 | | 12,475,000 | | 12,514,670 |
| | HealthSource Saginaw Inc. Saginaw County GO, NATL Insured, 5.00%, 5/01/29 | | 4,145,000 | | 4,189,683 |
| | Huron School District GO, AGMC Insured, Pre-Refunded, | | | | |
| | 5.25%, 5/01/21 | | 1,500,000 | | 1,511,940 |
| | 5.375%, 5/01/26 | | 2,500,000 | | 2,520,400 |
Annual Report | 125
| | | | |
| Franklin Tax-Free Trust | | | | |
| |
| Statement of Investments, February 28, 2011 (continued) | | | | |
| |
| |
| Franklin Michigan Tax-Free Income Fund | | Principal Amount | | Value |
| Municipal Bonds (continued) | | | | |
| Michigan (continued) | | | | |
| Jackson Brownfield RDAR, | | | | |
| FGIC Insured, Pre-Refunded, 5.25%, 6/01/26 | $ | 2,820,000 | $ | 2,980,120 |
| FGIC Insured, Pre-Refunded, 5.375%, 6/01/30 | | 5,830,000 | | 6,170,064 |
| NATL RE, FGIC Insured, 5.125%, 6/01/22 | | 2,290,000 | | 2,328,083 |
| NATL RE, FGIC Insured, 5.125%, 6/01/24 | | 1,215,000 | | 1,231,208 |
| Jackson County Hospital Finance Authority Revenue, W.A. Foote Memorial Hospital, | | | | |
| Refunding, Series C, Assured Guaranty, 5.00%, 6/01/26 | | 10,000,000 | | 10,132,300 |
| Jackson Public Schools GO, School Building and Site, Refunding, AGMC Insured, | | | | |
| 5.00%, 5/01/34 | | 6,620,000 | | 6,539,037 |
| Kalamazoo Hospital Finance Authority Hospital Facility Revenue, | | | | |
| Borgess Medical Center, Series A, AMBAC Insured, ETM, 5.625%, 6/01/14 | | 3,295,000 | | 3,401,725 |
| Bronson Methodist Hospital, Refunding, Assured Guaranty, 5.25%, 5/15/36 | | 10,000,000 | | 9,250,400 |
| Bronson Methodist Hospital, Refunding, Series B, AGMC Insured, 5.00%, 5/15/26 | | 7,000,000 | | 6,962,620 |
| L’Anse Creuse Public Schools GO, School Building and Site, AGMC Insured, 5.00%, | | | | |
| 5/01/35 | | 10,000,000 | | 9,712,600 |
| Lake Superior State University Revenue, Refunding, AMBAC Insured, 5.25%, 11/15/31 | | 3,320,000 | | 3,124,120 |
| Lapeer Community Schools GO, School Building and Site, AGMC Insured, 5.00%, | | | | |
| 5/01/33 | | 4,400,000 | | 4,239,884 |
| 5/01/37 | | 4,325,000 | | 4,066,495 |
| Lenawee County Hospital Finance Authority Hospital Revenue, | | | | |
| Lenawee Health Alliance, Refunding, Series A, AMBAC Insured, 5.20%, 7/01/19 | | 2,115,000 | | 2,120,541 |
| Promedical Healthcare, Refunding, Series B, 6.00%, 11/15/35 | | 5,000,000 | | 5,086,350 |
| Marysville Public School District GO, School Building and Site, Refunding, AGMC Insured, | | | | |
| 5.00%, 5/01/35 | | 5,000,000 | | 4,776,950 |
| Michigan Municipal Bond Authority Revenue, Clean Water State Revolving Fund, 5.00%, | | | | |
| 10/01/24 | | 11,355,000 | | 11,811,017 |
| Michigan State Building Authority Revenue, | | | | |
| Facilities Program, Refunding, Series I, 6.25%, 10/15/38 | | 15,000,000 | | 15,872,850 |
| Facilities Program, Refunding, Series I, AGMC Insured, 5.00%, 10/15/24 | | 5,000,000 | | 5,012,700 |
| Facilities Program, Refunding, Series I, AMBAC Insured, 5.00%, 10/15/33 | | 4,450,000 | | 4,143,084 |
| Refunding, AMBAC Insured, 5.00%, 10/15/33 | | 21,000,000 | | 19,551,630 |
| Refunding, Series IA, AGMC Insured, 5.00%, 10/15/31 | | 15,530,000 | | 15,235,396 |
| Refunding, Series IA, AGMC Insured, 5.00%, 10/15/32 | | 10,000,000 | | 9,691,100 |
| Refunding, Series IA, AGMC Insured, 5.00%, 10/15/36 | | 1,000,000 | | 952,090 |
| Refunding, Series IA, NATL RE, FGIC Insured, 5.00%, 10/15/36 | | 5,000,000 | | 4,604,750 |
| Michigan State Comprehensive Transportation Revenue, Refunding, AGMC Insured, 5.00%, | | | | |
| 5/15/26 | | 4,740,000 | | 4,819,916 |
| 5/15/31 | | 8,000,000 | | 8,021,200 |
| Michigan State HDA Rental Housing Revenue, | | | | |
| Refunding, Series A, AMBAC Insured, 6.00%, 4/01/16 | | 65,000 | | 65,049 |
| Series A, 5.25%, 10/01/46 | | 10,155,000 | | 9,360,270 |
| Michigan State Hospital Finance Authority Revenue, | | | | |
| Hospital, Sparrow Obligated Group, Refunding, 5.00%, 11/15/31 | | 10,000,000 | | 8,902,800 |
| Hospital, Sparrow Obligated Group, Refunding, NATL Insured, 5.00%, 11/15/31 | | 8,500,000 | | 7,567,380 |
| Hospital, Sparrow Obligated Group, Refunding, NATL Insured, 5.00%, 11/15/36 | | 6,165,000 | | 5,326,005 |
| Mercy Health Services, Series Q, AMBAC Insured, ETM, 5.375%, 8/15/26 | | 6,000,000 | | 6,012,900 |
| Mercy Health Services, Series R, AMBAC Insured, ETM, 5.375%, 8/15/26 | | 1,750,000 | | 1,753,763 |
126 | Annual Report
| | | | |
| Franklin Tax-Free Trust | | | | |
| |
| Statement of Investments, February 28, 2011 (continued) | | | | |
| |
| |
| Franklin Michigan Tax-Free Income Fund | | Principal Amount | | Value |
| Municipal Bonds (continued) | | | | |
| Michigan (continued) | | | | |
| Michigan State Hospital Finance Authority Revenue, (continued) | | | | |
| Mercy Health Services, Series U, ETM, 5.75%, 8/15/26 | $ | 300,000 | $ | 300,993 |
| Mercy Health Services, Series W, AGMC Insured, ETM, 5.25%, 8/15/27 | | 8,605,000 | | 8,629,438 |
| Mid-Michigan Health, AMBAC Insured, 5.00%, 4/15/24 | | 7,065,000 | | 6,827,192 |
| Mid-Michigan Health, AMBAC Insured, 5.00%, 4/15/32 | | 1,000,000 | | 878,800 |
| Mid-Michigan Obligation Group, Refunding, Series A, AGMC Insured, 5.375%, | | | | |
| 6/01/27 | | 7,500,000 | | 7,501,725 |
| Mid-Michigan Obligation Group, Series A, 6.125%, 6/01/39 | | 5,000,000 | | 5,023,500 |
| Oakwood Obligated Group, Refunding, Series A, AGMC Insured, 5.125%, 8/15/25 | | 7,500,000 | | 7,501,725 |
| Sparrow Obligated Group, Refunding, NATL Insured, 5.00%, 11/15/36 | | 12,465,000 | | 10,768,638 |
| St. John’s Health System, Refunding, Series A, AMBAC Insured, ETM, 5.125%, | | | | |
| 5/15/17 | | 14,500,000 | | 14,543,355 |
| St. John’s Hospital, Refunding, Series A, AMBAC Insured, ETM, 6.00%, 5/15/13 | | 2,240,000 | | 2,291,229 |
| St. John’s Hospital, Refunding, Series A, AMBAC Insured, ETM, 6.25%, 5/15/14 | | 9,545,000 | | 10,365,679 |
| Trinity Health Credit Group, Series A, 6.50%, 12/01/33 | | 25,000,000 | | 26,315,250 |
| Michigan State Revenue, Grant Antic Bonds, AGMC Insured, 5.25%, 9/15/27 | | 10,000,000 | | 10,334,500 |
| Michigan State Strategic Fund Limited Obligation Revenue, | | | | |
| Detroit Edison Co. Exempt Facilities Project, Mandatory Put 8/01/16, Refunding, | | | | |
| Series ET-2, 5.50%, 8/01/29 | | 10,000,000 | | 10,885,300 |
| Detroit Edison Co. Pollution Control Bonds Project, Refunding, Collateralized Series AA, | | | | |
| NATL RE, FGIC Insured, 6.95%, 5/01/11 | | 5,000,000 | | 5,040,300 |
| Detroit Edison Co. Pollution Control Bonds Project, Refunding, Collateralized Series BB, | | | | |
| AMBAC Insured, 7.00%, 5/01/21 | | 3,000,000 | | 3,480,990 |
| Michigan State Strategic Fund Resources Recovery Limited Obligation Revenue, Detroit | | | | |
| Education Exempt Facilities, Refunding, Series D, XLCA Insured, 5.25%, 12/15/32 | | 12,350,000 | | 11,959,740 |
| Michigan State Trunk Line Revenue, Series A, AGMC Insured, Pre-Refunded, 5.25%, | | | | |
| 11/01/30 | | 19,680,000 | | 20,313,499 |
| Michigan State University Revenues, General, Refunding, Series C, 5.00%, 2/15/44 | | 24,630,000 | | 24,511,037 |
| Michigan Technological University Revenue, General, Series A, NATL Insured, | | | | |
| 5.00%, 10/01/34 | | 3,675,000 | | 3,595,179 |
| Otsego Public Schools District GO, School Building and Site, AGMC Insured, Pre-Refunded, | | | | |
| 5.00%, 5/01/34 | | 9,835,000 | | 11,020,019 |
| Oxford Area Community School District GO, AGMC Insured, Pre-Refunded, 5.00%, | | | | |
| 5/01/26 | | 5,425,000 | | 5,588,835 |
| 5/01/31 | | 4,865,000 | | 5,011,923 |
| Pennfield School District GO, School Building and Site, | | | | |
| FGIC Insured, Pre-Refunded, 5.00%, 5/01/29 | | 645,000 | | 722,716 |
| FGIC Insured, Pre-Refunded, 5.00%, 5/01/34 | | 2,500,000 | | 2,801,225 |
| NATL RE, FGIC Insured, Pre-Refunded, 5.00%, 5/01/29 | | 505,000 | | 565,847 |
| Pinckney Community Schools GO, Refunding, AGMC Insured, 5.00%, 5/01/26 | | 2,955,000 | | 2,990,105 |
| Pontiac General Building Authority GO, FGIC Insured, Pre-Refunded, 5.375%, | | | | |
| 6/01/23 | | 1,620,000 | | 1,714,495 |
| 6/01/27 | | 2,635,000 | | 2,788,700 |
| Port Huron GO, Limited Tax, AMBAC Insured, 5.00%, 10/01/22 | | 1,600,000 | | 1,617,136 |
| River Rouge School District GO, Refunding, NATL RE, FGIC Insured, 5.00%, 5/01/22 | | 6,575,000 | | 6,731,419 |
Annual Report | 127
| | | | |
| Franklin Tax-Free Trust | | | | |
| |
| Statement of Investments, February 28, 2011 (continued) | | | | |
| |
| |
| Franklin Michigan Tax-Free Income Fund | | Principal Amount | | Value |
| Municipal Bonds (continued) | | | | |
| Michigan (continued) | | | | |
| Rockford Public Schools GO, School Building and Site, AGMC Insured, 5.00%, 5/01/33 | $ | 8,220,000 | $ | 8,111,085 |
| Royal Oak Hospital Finance Authority Hospital Revenue, William Beaumont Hospital, | | | | |
| Refunding, 8.25%, 9/01/39 | | 10,000,000 | | 11,342,200 |
| Series M, NATL Insured, 5.25%, 11/15/31 | | 12,750,000 | | 11,275,207 |
| Series M, NATL Insured, 5.25%, 11/15/35 | | 17,600,000 | | 14,831,520 |
| Saginaw City School District GO, School Building and Site, AGMC Insured, 5.00%, | | | | |
| 5/01/38 | | 10,555,000 | | 10,554,261 |
| Saginaw Valley State University Revenue, General, Refunding, AGMC Insured, 5.00%, | | | | |
| 7/01/28 | | 7,050,000 | | 7,267,563 |
| South Redford School District GO, School Building and Site, NATL Insured, 5.00%, | | | | |
| 5/01/30 | | 3,500,000 | | 3,544,310 |
| Southfield Library Building Authority GO, Refunding, NATL Insured, 5.00%, 5/01/30 | | 6,535,000 | | 6,677,267 |
| Southfield Public Schools GO, Refunding, NATL Insured, 4.75%, 5/01/29 | | 9,040,000 | | 8,963,431 |
| Sparta Area Schools GO, School Building and Site, FGIC Insured, Pre-Refunded, 5.00%, | | | | |
| 5/01/30 | | 2,730,000 | | 3,058,938 |
| Sturgis Public School District GO, Refunding, NATL RE, FGIC Insured, 5.00%, 5/01/30 | | 4,715,000 | | 4,776,484 |
| Taylor Brownfield RDA, GO, Tax Increment, Series A, NATL Insured, 5.00%, | | | | |
| 5/01/29 | | 2,900,000 | | 2,577,897 |
| 5/01/34 | | 3,945,000 | | 3,294,746 |
| Taylor Tax Increment Finance Authority Revenue, AGMC Insured, 5.00%, 5/01/21 | | 2,595,000 | | 2,602,214 |
| Thornapple Kellogg School GO, School Building and Site, | | | | |
| AGMC Insured, Pre-Refunded, 5.00%, 5/01/23 | | 965,000 | | 1,036,574 |
| AGMC Insured, Pre-Refunded, 5.00%, 5/01/28 | | 6,250,000 | | 6,713,563 |
| Refunding, AGMC Insured, 5.00%, 5/01/23 | | 3,035,000 | | 3,260,106 |
| Trenton Public Schools School District GO, School Building and Site, AGMC Insured, 5.00%, | | | | |
| 5/01/31 | | 4,575,000 | | 4,615,809 |
| 5/01/38 | | 8,150,000 | | 7,913,731 |
| Van Dyke Public Schools GO, School Building and Site, AGMC Insured, 5.00%, 5/01/34 | | 5,000,000 | | 4,768,850 |
| Warren Consolidated School District GO, AGMC Insured, 4.875%, 5/01/22 | | 8,910,000 | | 9,049,976 |
| Warren Water and Sewer Revenue, AGMC Insured, Pre-Refunded, 5.125%, 11/01/23 | | 2,450,000 | | 2,527,665 |
| Wayne Charter County GO, | | | | |
| Airport Hotel, Detroit Metropolitan Wayne County Airport, Series A, NATL Insured, | | | | |
| 5.25%, 12/01/25 | | 17,000,000 | | 16,690,770 |
| Airport Hotel, Detroit Metropolitan Wayne County Airport, Series A, NATL Insured, | | | | |
| 5.00%, 12/01/30 | | 10,750,000 | | 9,548,042 |
| Building Improvement, Series A, 6.75%, 11/01/39 | | 4,965,000 | | 4,974,036 |
| Capital Improvement, Series A, AGMC Insured, 5.00%, 2/01/34 | | 7,640,000 | | 7,476,504 |
| Capital Improvement, Series A, AGMC Insured, 5.00%, 2/01/38 | | 12,135,000 | | 11,699,839 |
| Wayne County Airport Authority Revenue, Detroit Metropolitan Airport, Refunding, NATL RE, | | | | |
| FGIC Insured, 5.00%, | | | | |
| 12/01/27 | | 9,910,000 | | 9,294,787 |
| 12/01/28 | | 10,170,000 | | 9,409,996 |
| Wayne State University Revenues, General, | | | | |
| AMBAC Insured, 5.00%, 11/15/30 | | 2,925,000 | | 2,953,665 |
| Refunding, AGMC Insured, 5.00%, 11/15/28 | | 23,550,000 | | 24,061,506 |
| Refunding, AGMC Insured, 5.00%, 11/15/35 | | 22,435,000 | | 21,752,527 |
128 | Annual Report
| | | | | |
| | Franklin Tax-Free Trust | | | | |
| |
| | Statement of Investments, February 28, 2011 (continued) | | | | |
| |
| |
| | Franklin Michigan Tax-Free Income Fund | | Principal Amount | | Value |
| | Municipal Bonds (continued) | | | | |
| | Michigan (continued) | | | | |
| | West Ottawa Public School District GO, School Building Site, Refunding, NATL Insured, | | | | |
| | 5.00%, 5/01/32 | $ | 6,025,000 | $ | 5,901,307 |
| | Western Michigan University Revenues, General, AGMC Insured, 5.00%, | | | | |
| | 11/15/28 | | 5,500,000 | | 5,636,565 |
| | 11/15/32 | | 6,410,000 | | 6,455,767 |
| | Western Townships Utilities Authority GO, Sewer Disposal System, NATL RE, FGIC Insured, | | | | |
| | 4.75%, 1/01/23 | | 8,500,000 | | 8,586,955 |
| | Whitmore Lake Public School District GO, NATL RE, FGIC Insured, 5.00%, 5/01/32 | | 9,375,000 | | 9,402,937 |
| | Willow Run Community Schools GO, AGMC Insured, 5.00%, 5/01/31 | | 12,550,000 | | 12,561,797 |
| | Wyoming Sewer Disposal System Revenue, Refunding, NATL Insured, 5.00%, 6/01/27 | | 5,700,000 | | 5,775,639 |
| | Ypsilanti Community Utilities GO, Sanitation Sewer System No. 3, NATL RE, FGIC Insured, | | | | |
| | 5.00%, 5/01/32 | | 1,765,000 | | 1,742,196 |
| Pre | -Refunded, 5.00%, 5/01/32 | | 4,300,000 | | 4,529,405 |
| | Zeeland Public Schools GO, Refunding, NATL RE, FGIC Insured, 5.00%, 5/01/25 | | 3,350,000 | | 3,425,476 |
| | | | | | 1,257,048,524 |
| | U.S. Territories 8.3% | | | | |
| | Puerto Rico 8.3% | | | | |
| | Puerto Rico Commonwealth Highway and Transportation Authority Transportation Revenue, | | | | |
| | Refunding, Series D, AGMC Insured, 5.00%, 7/01/32 | | 11,945,000 | | 11,213,847 |
| | Series D, AGMC Insured, Pre-Refunded, 5.00%, 7/01/32 | | 8,055,000 | | 8,544,019 |
| | Puerto Rico Electric Power Authority Power Revenue, Series RR, FGIC Insured, Pre-Refunded, | | | | |
| | 5.00%, 7/01/35 | | 14,000,000 | | 16,070,880 |
| | Puerto Rico Sales Tax FICO Sales Tax Revenue, first sub., | | | | |
| | Series A, 5.375%, 8/01/39 | | 9,000,000 | | 8,271,090 |
| | Series A, 6.00%, 8/01/42 | | 25,000,000 | | 25,047,500 |
| | Series B, 6.375%, 8/01/39 | | 10,000,000 | | 10,324,100 |
| | Series C, 5.50%, 8/01/40 | | 15,000,000 | | 14,027,550 |
| | Series C, 5.25%, 8/01/41 | | 25,445,000 | | 22,887,777 |
| | | | | | 116,386,763 |
| | Total Municipal Bonds before Short Term Investments | | | | |
| | (Cost $1,388,186,501) | | | | 1,373,435,287 |
| | Short Term Investments 0.8% | | | | |
| | Municipal Bonds 0.8% | | | | |
| | Michigan 0.5% | | | | |
| | aEastern Michigan University Revenues, General, Refunding, Series A, Daily VRDN | | | | |
| | and Put, 0.24%, 3/01/49 | | 3,500,000 | | 3,500,000 |
| | aMichigan Higher Education Facilities Authority Revenue, Limited Obligation, University of | | | | |
| | Detroit Mercy Project, Refunding, Daily VRDN and Put, 0.21%, 11/01/36 | | 3,500,000 | | 3,500,000 |
| | | | | | 7,000,000 |
Annual Report | 129
Franklin Tax-Free Trust
Statement of Investments, February 28, 2011 (continued)
| | | | |
| Franklin Michigan Tax-Free Income Fund | | Principal Amount | | Value |
| Short Term Investments (continued) | | | | |
| Municipal Bonds (continued) | | | | |
| U.S. Territories 0.3% | | | | |
| Puerto Rico 0.3% | | | | |
| aPuerto Rico Commonwealth GO, Public Improvement, Refunding, Series B, Daily VRDN | | | | |
| and Put, 0.15%, 7/01/32 | $ | 3,640,000 | $ | 3,640,000 |
| Total Short Term Investments (Cost $10,640,000) | | | | 10,640,000 |
| Total Investments (Cost $1,398,826,501) 98.9% | | | | 1,384,075,287 |
| Other Assets, less Liabilities 1.1% | | | | 15,883,810 |
| Net Assets 100.0% | | | $ | 1,399,959,097 |
See Abbreviations on page 205.
aVariable rate demand notes (VRDNs) are tax-exempt obligations which contain a floating or variable interest rate adjustment formula and an unconditional right of demand to receive payment of the principal balance plus accrued interest at specified dates. The coupon rate shown represents the rate at period end.
130 | The accompanying notes are an integral part of these financial statements. | Annual Report
| | | | | | | | | | | | | | | |
| Franklin Tax-Free Trust | | | | | | | | | | | | | | | |
| Financial Highlights | | | | | | | | | | | | | | | |
| |
| Franklin Minnesota Tax-Free Income Fund | | | | | | | | | | | | | | | |
| | | | | | Year Ended February 28, | | | | |
| Class A | | 2011 | | | 2010 | | | 2009 | | | 2008 | a | | 2007 | |
| Per share operating performance | | | | | | | | | | | | | | | |
| (for a share outstanding throughout the year) | | | | | | | | | | | | | | | |
| Net asset value, beginning of year | $ | 12.20 | | $ | 11.80 | | $ | 11.51 | | $ | 12.16 | | $ | 12.13 | |
| Income from investment operationsb: | | | | | | | | | | | | | | | |
| Net investment incomec | | 0.46 | | | 0.48 | | | 0.48 | | | 0.50 | | | 0.50 | |
| Net realized and unrealized gains (losses) | | (0.28 | ) | | 0.40 | | | 0.30 | | | (0.65 | ) | | 0.03 | |
| Total from investment operations | | 0.18 | | | 0.88 | | | 0.78 | | | (0.15 | ) | | 0.53 | |
| Less distributions from net investment income | | (0.46 | ) | | (0.48 | ) | | (0.49 | ) | | (0.50 | ) | | (0.50 | ) |
| Redemption feesd | | — | | | — | | | —e | | | —e | | | —e | |
| Net asset value, end of year | $ | 11.92 | | $ | 12.20 | | $ | 11.80 | | $ | 11.51 | | $ | 12.16 | |
| |
| Total returnf | | 1.49 | % | | 7.54 | % | | 6.90 | % | | (1.34 | )% | | 4.50 | % |
| |
| Ratios to average net assets | | | | | | | | | | | | | | | |
| Expenses | | 0.65 | % | | 0.65 | % | | 0.66 | % | | 0.67 | % | | 0.66 | % |
| Net investment income | | 3.80 | % | | 3.96 | % | | 4.17 | % | | 4.14 | % | | 4.15 | % |
| |
| Supplemental data | | | | | | | | | | | | | | | |
| Net assets, end of year (000’s) | $ | 754,018 | | $ | 768,806 | | $ | 653,812 | | $ | 545,977 | | $ | 539,643 | |
| Portfolio turnover rate | | 14.56 | % | | 10.24 | % | | 21.67 | % | | 9.99 | % | | 14.24 | % |
|
| aFor the year ended February 29. |
| bThe amount shown for a share outstanding throughout the period may not correlate with the Statement of Operations for the period due to the timing of sales and repurchases of |
| the Fund shares in relation to income earned and/or fluctuating market value of the investments of the Fund. |
| cBased on average daily shares outstanding. |
| dEffective September 1, 2008, the redemption fee was eliminated. |
| eAmount rounds to less than $0.01 per share. |
| fTotal return does not reflect sales commissions or contingent deferred sales charges, if applicable. |
Annual Report | The accompanying notes are an integral part of these financial statements. | 131
| | | | | | | | | | | | | | | |
| Franklin Tax-Free Trust | | | | | | | | | | | | | | | |
| Financial Highlights (continued) | | | | | | | | | | | | | | | |
| |
| Franklin Minnesota Tax-Free Income Fund | | | | | | | | | | | | | | | |
| | | | | | Year Ended February 28, | | | | |
| Class C | | 2011 | | | 2010 | | | 2009 | | | 2008 | a | | 2007 | |
| Per share operating performance | | | | | | | | | | | | | | | |
| (for a share outstanding throughout the year) | | | | | | | | | | | | | | | |
| Net asset value, beginning of year | $ | 12.30 | | $ | 11.89 | | $ | 11.60 | | $ | 12.24 | | $ | 12.22 | |
| Income from investment operationsb: | | | | | | | | | | | | | | | |
| Net investment incomec | | 0.40 | | | 0.41 | | | 0.42 | | | 0.43 | | | 0.44 | |
| Net realized and unrealized gains (losses) | | (0.29 | ) | | 0.41 | | | 0.29 | | | (0.64 | ) | | 0.01 | |
| Total from investment operations | | 0.11 | | | 0.82 | | | 0.71 | | | (0.21 | ) | | 0.45 | |
| Less distributions from net investment income | | (0.39 | ) | | (0.41 | ) | | (0.42 | ) | | (0.43 | ) | | (0.43 | ) |
| Redemption feesd | | — | | | — | | | —e | | | —e | | | —e | |
| Net asset value, end of year | $ | 12.02 | | $ | 12.30 | | $ | 11.89 | | $ | 11.60 | | $ | 12.24 | |
| |
| Total returnf | | 0.99 | % | | 6.97 | % | | 6.26 | % | | (1.78 | )% | | 3.81 | % |
| |
| Ratios to average net assets | | | | | | | | | | | | | | | |
| Expenses | | 1.20 | % | | 1.20 | % | | 1.21 | % | | 1.22 | % | | 1.21 | % |
| Net investment income | | 3.25 | % | | 3.41 | % | | 3.62 | % | | 3.59 | % | | 3.60 | % |
| |
| Supplemental data | | | | | | | | | | | | | | | |
| Net assets, end of year (000’s) | $ | 195,123 | | $ | 170,676 | | $ | 102,212 | | $ | 70,318 | | $ | 64,873 | |
| Portfolio turnover rate | | 14.56 | % | | 10.24 | % | | 21.67 | % | | 9.99 | % | | 14.24 | % |
|
| aFor the year ended February 29. |
| bThe amount shown for a share outstanding throughout the period may not correlate with the Statement of Operations for the period due to the timing of sales and repurchases of |
| the Fund shares in relation to income earned and/or fluctuating market value of the investments of the Fund. |
| cBased on average daily shares outstanding. |
| dEffective September 1, 2008, the redemption fee was eliminated. |
| eAmount rounds to less than $0.01 per share. |
| fTotal return does not reflect sales commissions or contingent deferred sales charges, if applicable. |
132 | The accompanying notes are an integral part of these financial statements. | Annual Report
| | | | | | |
| Franklin Tax-Free Trust | | | | | | |
| Financial Highlights (continued) | | | | | | |
| |
| Franklin Minnesota Tax-Free Income Fund | | | | | | |
| | | Year Ended | |
| | | February 28, | |
| Advisor Class | | 2011 | | | 2010 | a |
| Per share operating performance | | | | | | |
| (for a share outstanding throughout the year) | | | | | | |
| Net asset value, beginning of year | $ | 12.20 | | $ | 11.91 | |
| Income from investment operationsb: | | | | | | |
| Net investment incomec | | 0.48 | | | 0.33 | |
| Net realized and unrealized gains (losses) | | (0.29 | ) | | 0.28 | |
| Total from investment operations | | 0.19 | | | 0.61 | |
| Less distributions from net investment income | | (0.47 | ) | | (0.32 | ) |
| Net asset value, end of year | $ | 11.92 | | $ | 12.20 | |
| |
| Total returnd | | 1.59 | % | | 5.14 | % |
| |
| Ratios to average net assetse | | | | | | |
| Expenses | | 0.55 | % | | 0.55 | % |
| Net investment income | | 3.90 | % | | 4.06 | % |
| |
| Supplemental data | | | | | | |
| Net assets, end of year (000’s) | $ | 10,854 | | $ | 4,451 | |
| Portfolio turnover rate | | 14.56 | % | | 10.24 | % |
|
| aFor the period July 1, 2009 (effective date) to February 28, 2010. |
| bThe amount shown for a share outstanding throughout the period may not correlate with the Statement of Operations for the period due to the timing of sales and repurchases of |
| the Fund shares in relation to income earned and/or fluctuating market value of the investments of the Fund. |
| cBased on average daily shares outstanding. |
| dTotal return is not annualized for periods less than one year. |
| eRatios are annualized for periods less than one year. |
Annual Report | The accompanying notes are an integral part of these financial statements. | 133
| | | | |
| Franklin Tax-Free Trust | | | | |
| |
| Statement of Investments, February 28, 2011 | | | | |
| |
| |
| Franklin Minnesota Tax-Free Income Fund | | Principal Amount | | Value |
| Municipal Bonds 99.4% | | | | |
| Minnesota 95.8% | | | | |
| Anoka County Housing and RDA, GO, Housing Development, Refunding, AMBAC | | | | |
| Insured, 4.875%, 2/01/24 | $ | 2,195,000 | $ | 2,291,141 |
| Anoka County Regional Railroad Authority GO, Limited Tax, Series A, XLCA Insured, | | | | |
| 4.50%, 2/01/32 | | 11,125,000 | | 11,094,740 |
| Anoka-Hennepin ISD No. 11 GO, School Building, Refunding, Series A, Assured Guaranty, | | | | |
| 5.00%, 2/01/20 | | 5,870,000 | | 6,673,662 |
| Bemidji GO, Sales Tax, Refunding, 5.25%, 2/01/38 | | 12,055,000 | | 12,604,226 |
| Bloomington ISD No. 271 GO, School Building, Refunding, Series C, AGMC Insured, | | | | |
| 4.50%, 2/01/23 | | 2,500,000 | | 2,600,375 |
| Blue Earth County EDA Public Project Lease Revenue, Series A, NATL Insured, | | | | |
| 4.50%, 12/01/24 | | 1,055,000 | | 1,079,582 |
| Brainerd ISD No. 181 GO, School Building, Refunding, Series A, 4.00%, | | | | |
| 2/01/19 | | 5,025,000 | | 5,487,451 |
| 2/01/20 | | 5,025,000 | | 5,427,904 |
| 2/01/21 | | 4,035,000 | | 4,302,561 |
| Brooklyn Center ISD No. 286 GO, FGIC Insured, 5.00%, 2/01/22 | | 1,000,000 | | 1,035,620 |
| Byron ISD No. 531 GO, School Building, Series A, NATL RE, FGIC Insured, 5.00%, 2/01/24 | | 2,015,000 | | 2,109,342 |
| Cambridge ISD No. 911 GO, Series A, NATL Insured, 4.25%, 2/01/24 | | 1,235,000 | | 1,251,401 |
| Cass Lake ISD No. 115 GO, NATL RE, FGIC Insured, Pre-Refunded, 5.00%, 2/01/22 | | 3,805,000 | | 4,046,732 |
| Centennial ISD No. 012 GO, Series A, AGMC Insured, 5.00%, 2/01/21 | | 1,000,000 | | 1,035,620 |
| Chaska ISD No. 112 GO, School Building, Series A, NATL Insured, 4.50%, 2/01/28 | | 15,000,000 | | 15,256,500 |
| Chisago County GO, Capital Improvement, Series A, NATL Insured, 4.75%, 2/01/26 | | 2,415,000 | | 2,487,353 |
| Dakota County CDA Governmental Housing Development GO, Senior Housing Facilities, | | | | |
| Series A, 5.125%, 1/01/35 | | 2,625,000 | | 2,649,518 |
| Duluth ISD No. 709 COP, Full Term Certificates, Series B, | | | | |
| 4.75%, 2/01/25 | | 8,445,000 | | 8,685,851 |
| AGMC Insured, 5.00%, 2/01/28 | | 18,890,000 | | 19,614,054 |
| Eagan GO, Recreational Facilities, Series A, NATL Insured, 5.00%, 2/01/21 | | 3,075,000 | | 3,184,531 |
| Elk River ISD No. 728 GO, School Building, Refunding, Series A, AGMC Insured, 4.25%, | | | | |
| 2/01/23 | | 5,000,000 | | 5,131,300 |
| 2/01/24 | | 6,265,000 | | 6,379,587 |
| Ely Housing and RDAR, Housing Development, Series A, XLCA Insured, 4.50%, 11/01/41 | | 2,530,000 | | 2,558,867 |
| Farmington ISD No. 192 GO, School Building, | | | | |
| Refunding, Series A, AGMC Insured, 4.50%, 2/01/24 | | 5,015,000 | | 5,170,766 |
| Series B, AGMC Insured, 5.00%, 2/01/23 | | 3,000,000 | | 3,170,940 |
| Series B, AGMC Insured, 4.75%, 2/01/27 | | 16,075,000 | | 16,506,131 |
| Fergus Falls ISD No. 544 GO, School Building, Series A, AGMC Insured, 5.00%, 1/01/25 | | 1,655,000 | | 1,770,287 |
| Fridley ISD No. 014 GO, Alternative Facilities, Series A, AGMC Insured, 4.375%, 2/01/27 | | 2,040,000 | | 2,051,016 |
| Hastings ISD No. 200 GO, Refunding, Series A, AGMC Insured, 4.50%, 2/01/22 | | 2,700,000 | | 2,782,863 |
| Hennepin County Regional Railroad Authority GO, Limited Tax, Refunding, Series A, 4.00%, | | | | |
| 12/01/27 | | 2,475,000 | | 2,459,927 |
| 12/01/28 | | 2,590,000 | | 2,528,695 |
| 12/01/30 | | 2,535,000 | | 2,421,356 |
134 | Annual Report
| | | | |
| Franklin Tax-Free Trust | | | | |
| |
| Statement of Investments, February 28, 2011 (continued) | | | | |
| |
| |
| Franklin Minnesota Tax-Free Income Fund | | Principal Amount | | Value |
| Municipal Bonds (continued) | | | | |
| Minnesota (continued) | | | | |
| Hennepin County Sales Tax Revenue, | | | | |
| first lien, Ballpark Project, Series A, 4.75%, 12/15/37 | $ | 25,000,000 | $ | 24,811,000 |
| second lien, Ballpark Project, Series B, 5.00%, 12/15/17 | | 1,740,000 | | 1,977,232 |
| second lien, Ballpark Project, Series B, 5.00%, 12/15/21 | | 5,000,000 | | 5,446,000 |
| Hibbing Health Care Facilities Revenue, The Duluth Clinic Ltd., AGMC Insured, Pre-Refunded, | | | | |
| 5.00%, 11/01/25 | | 8,000,000 | | 8,891,840 |
| Hopkins ISD No. 270 GO, FGIC Insured, 5.125%, 2/01/22 | | 3,880,000 | | 4,022,590 |
| Lake Superior ISD No. 381 GO, Series A, AGMC Insured, 5.00%, 4/01/23 | | 4,195,000 | | 4,483,490 |
| Lakeville ISD No. 194 GO, | | | | |
| School Building, Refunding, Series B, Assured Guaranty, 5.00%, 2/01/16 | | 5,405,000 | | 6,143,539 |
| School Building, Refunding, Series B, Assured Guaranty, 5.00%, 2/01/17 | | 5,750,000 | | 6,542,005 |
| School Building, Refunding, Series D, 4.25%, 2/01/24 | | 7,000,000 | | 7,221,690 |
| Series A, FGIC Insured, 5.00%, 2/01/23 | | 10,180,000 | | 10,824,801 |
| Metropolitan Council Minneapolis-St. Paul Metropolitan Area GO, Wastewater, Series B, 4.50%, | | | | |
| 12/01/26 | | 5,000,000 | | 5,122,000 |
| Minneapolis and St. Paul Housing and RDA Health Care Facilities Revenue, Children’s | | | | |
| Hospitals and Clinics, Series A-1, AGMC Insured, 5.00%, 8/15/34 | | 1,000,000 | | 990,430 |
| Minneapolis and St. Paul Metropolitan Airports Commission Airport Revenue, senior bond, | | | | |
| Refunding, Series A, | | | | |
| 5.00%, 1/01/35 | | 13,795,000 | | 13,642,565 |
| AMBAC Insured, 5.00%, 1/01/20 | | 5,400,000 | | 5,793,984 |
| BHAC Insured, 5.00%, 1/01/23 | | 14,800,000 | | 15,491,308 |
| BHAC Insured, 5.00%, 1/01/26 | | 10,000,000 | | 10,232,600 |
| Minneapolis CDA and St. Paul Housing and RDAR, Health Care Facilities, Carondelet, Series B, | | | | |
| BIG Insured, Pre-Refunded, 8.875%, 11/01/15 | | 425,000 | | 448,843 |
| Minneapolis GO, Various Purpose, | | | | |
| Pre-Refunded, 5.125%, 12/01/28 | | 3,000,000 | | 3,107,070 |
| Refunding, 4.00%, 12/01/25 | | 4,500,000 | | 4,548,150 |
| Minneapolis Health Care System Revenue, Fairview Health Services, | | | | |
| Series B, Assured Guaranty, 6.50%, 11/15/38 | | 35,000,000 | | 36,967,000 |
| Series D, AMBAC Insured, 5.00%, 11/15/34 | | 12,645,000 | | 11,351,543 |
| Minneapolis Special School District No. 001 COP, | | | | |
| Refunding, Series A, NATL Insured, 4.50%, 2/01/21 | | 2,715,000 | | 2,825,338 |
| Series A, AGMC Insured, 5.00%, 2/01/21 | | 1,950,000 | | 1,995,728 |
| Minnesota Agricultural and Economic Development Board Revenue, | | | | |
| Evangelical Lutheran Good Samaritan, Society Project, AMBAC Insured, 5.15%, | | | | |
| 12/01/22 | | 4,575,000 | | 4,585,339 |
| Health Care Facilities, Essentia, Series C-1, Assured Guaranty, 5.00%, 2/15/30 | | 14,600,000 | | 14,528,898 |
| Health Care System, Refunding, Series A, NATL Insured, 5.75%, 11/15/26 | | 365,000 | | 365,091 |
| Series E, Assured Guaranty, 5.00%, 2/15/37 | | 20,600,000 | | 19,319,916 |
| Minnesota Public Facilities Authority Clean Water Revenue, Series A, Pre-Refunded, 5.00%, | | | | |
| 3/01/24 | | 6,900,000 | | 8,076,657 |
| Minnesota Public Facilities Authority Revolving Fund Revenue, Series C, 5.00%, 3/01/26 | | 16,530,000 | | 18,148,122 |
| Minnesota Public Facilities Authority State Revenue, Refunding, Series A, 5.00%, 3/01/24 | | 22,010,000 | | 25,558,452 |
Annual Report | 135
| | | | |
| Franklin Tax-Free Trust | | | | |
| |
| Statement of Investments, February 28, 2011 (continued) | | | | |
| |
| |
| Franklin Minnesota Tax-Free Income Fund | | Principal Amount | | Value |
| Municipal Bonds (continued) | | | | |
| Minnesota (continued) | | | | |
| Minnesota State 911 Revenue, Public Safety Radio Communication System, Assured Guaranty, | | | | |
| 4.50%, 6/01/22 | $ | 3,000,000 | $ | 3,228,690 |
| 4.50%, 6/01/23 | | 1,000,000 | | 1,062,930 |
| 4.50%, 6/01/24 | | 3,745,000 | | 3,934,272 |
| 5.00%, 6/01/24 | | 5,000,000 | | 5,416,100 |
| Minnesota State Colleges and University Revenue, Fund, Series A, | | | | |
| 4.50%, 10/01/26 | | 5,770,000 | | 5,798,388 |
| a5.00%, 10/01/28 | | 2,135,000 | | 2,222,172 |
| 4.625%, 10/01/29 | | 6,615,000 | | 6,631,008 |
| NATL Insured, 5.00%, 10/01/22 | | 1,745,000 | | 1,843,435 |
| NATL Insured, 5.00%, 10/01/23 | | 1,825,000 | | 1,911,487 |
| NATL Insured, 5.00%, 10/01/24 | | 1,900,000 | | 1,983,543 |
| NATL Insured, 5.00%, 10/01/25 | | 1,155,000 | | 1,188,229 |
| NATL Insured, 5.00%, 10/01/26 | | 1,715,000 | | 1,758,612 |
| NATL Insured, 5.00%, 10/01/32 | | 5,540,000 | | 5,575,788 |
| Minnesota State GO, | | | | |
| Highway and Various Purpose, 5.00%, 8/01/23 | | 3,000,000 | | 3,272,520 |
| Highway and Various Purpose, AGMC Insured, 5.00%, 8/01/22 | | 1,000,000 | | 1,103,560 |
| Highway and Various Purpose, AGMC Insured, 5.00%, 8/01/25 | | 10,000,000 | | 10,747,400 |
| NATL Insured, 5.00%, 6/01/26 | | 10,000,000 | | 10,618,900 |
| Various Purpose, Refunding, Series H, 5.00%, 11/01/27 | | 2,500,000 | | 2,711,825 |
| Various Purposes, Series A, 4.25%, 12/01/27 | | 5,000,000 | | 5,069,100 |
| Various Purposes, Series A, 4.50%, 12/01/28 | | 15,540,000 | | 15,957,560 |
| Minnesota State HFAR, | | | | |
| Nonprofit Housing State Appropriation, 4.00%, 8/01/29 | | 3,675,000 | | 3,339,583 |
| Nonprofit Housing State Appropriation, 5.00%, 8/01/31 | | 2,225,000 | | 2,270,168 |
| Rental Housing, Refunding, Series D, NATL Insured, 5.90%, 8/01/15 | | 690,000 | | 690,449 |
| Rental Housing, Refunding, Series D, NATL Insured, 5.95%, 2/01/18 | | 200,000 | | 200,054 |
| Rental Housing, Refunding, Series D, NATL Insured, 6.00%, 2/01/22 | | 220,000 | | 220,121 |
| Residential Housing Finance, Series E, 4.90%, 7/01/29 | | 11,680,000 | | 11,457,613 |
| Residential Housing Finance, Series E, 5.10%, 1/01/40 | | 11,145,000 | | 10,752,919 |
| Minnesota State Higher Education Facilities Authority Revenue, | | | | |
| Carleton College, Series D, 5.00%, 3/01/40 | | 4,000,000 | | 4,013,040 |
| Macalester College, Series 7-I, 5.00%, 6/01/35 | | 5,000,000 | | 5,025,350 |
| St. John’s University, Series 5-I, NATL Insured, Pre-Refunded, 5.25%, 10/01/21 | | 1,750,000 | | 1,797,688 |
| St. John’s University, Series 5-I, NATL Insured, Pre-Refunded, 5.25%, 10/01/26 | | 1,500,000 | | 1,540,875 |
| St. Olaf College, Series 7-F, 4.25%, 10/01/22 | | 1,475,000 | | 1,531,920 |
| St. Olaf College, Series 7-F, 3.50%, 10/01/24 | | 1,570,000 | | 1,464,025 |
| St. Olaf College, Series 7-F, 4.50%, 10/01/30 | | 3,500,000 | | 3,446,135 |
| University of St. Thomas, Series 6-X, 5.00%, 4/01/29 | | 2,250,000 | | 2,300,760 |
| University of St. Thomas, Series 6-X, 5.25%, 4/01/39 | | 10,000,000 | | 10,113,600 |
| University of St. Thomas, Series 7-A, 5.00%, 10/01/29 | | 5,420,000 | | 5,583,684 |
| University of St. Thomas, Series 7-A, 5.00%, 10/01/39 | | 4,485,000 | | 4,464,548 |
| Minnesota State Municipal Power Agency Electric Revenue, Series A, 5.25%, 10/01/35 | | 12,000,000 | | 11,836,440 |
136 | Annual Report
| | | | |
| Franklin Tax-Free Trust | | | | |
| |
| Statement of Investments, February 28, 2011 (continued) | | | | |
| |
| |
| Franklin Minnesota Tax-Free Income Fund | | Principal Amount | | Value |
| Municipal Bonds (continued) | | | | |
| Minnesota (continued) | | | | |
| Minnesota State Public Facilities Authority Clean Water Revenue, Series B, 4.75%, | | | | |
| 3/01/27 | $ | 5,000,000 | $ | 5,208,950 |
| Minnetonka MFHR, Cedar Hills Project, Refunding, Series A, GNMA Secured, | | | | |
| 5.90%, 10/20/19 | | 1,750,000 | | 1,753,553 |
| 5.95%, 10/20/29 | | 5,955,000 | | 5,978,999 |
| Moorhead ISD No. 152 GO, School Building, Refunding, 4.25%, 4/01/22 | | 3,000,000 | | 3,084,480 |
| Mounds View ISD No. 621 GO, | | | | |
| Alternate Facility, Refunding, Series A, 5.00%, 2/01/21 | | 1,510,000 | | 1,762,563 |
| Alternate Facility, Refunding, Series A, 5.00%, 2/01/22 | | 1,600,000 | | 1,837,760 |
| School Building, Refunding, Series A, 4.00%, 2/01/20 | | 1,000,000 | | 1,070,670 |
| New Brighton GO, Tax Increment, Series A, NATL Insured, 5.00%, 2/01/32 | | 5,110,000 | | 5,190,738 |
| North Branch Water System Revenue, | | | | |
| AGMC Insured, 4.75%, 8/01/27 | | 1,500,000 | | 1,547,595 |
| Series A, AGMC Insured, 5.00%, 8/01/33 | | 1,325,000 | | 1,333,056 |
| Northern Municipal Power Agency Electric System Revenue, | | | | |
| Refunding, Series A, Assured Guaranty, 5.00%, 1/01/21 | | 1,505,000 | | 1,602,389 |
| Series A, AMBAC Insured, 5.00%, 1/01/26 | | 2,000,000 | | 2,033,400 |
| Northfield ISD No. 659 GO, School Building, Refunding, Series A, 4.00%, 2/01/20 | | 3,420,000 | | 3,804,271 |
| Norwood Young America EDA Revenue, Housing Harbor at Peace Village Project, Series B, | | | | |
| XLCA Insured, 4.625%, 8/01/40 | | 1,125,000 | | 1,097,573 |
| Osseo ISD No. 279 GO, Series A, AGMC Insured, 5.00%, 2/01/20 | | 3,000,000 | | 3,106,860 |
| Pine City Health Care and Housing Revenue, North Branch, Series A, GNMA Secured, 5.00%, | | | | |
| 10/20/38 | | 4,280,000 | | 4,118,558 |
| Pipestone-Jasper ISD No. 2689 GO, Refunding, Series A, AGMC Insured, 5.00%, 3/01/20 | | 1,595,000 | | 1,695,118 |
| Plymouth Health Facilities Revenue, Westhealth Project, Series A, AGMC Insured, | | | | |
| 6.25%, 6/01/16 | | 1,600,000 | | 1,605,872 |
| 6.125%, 6/01/24 | | 1,815,000 | | 1,821,008 |
| Prior Lake ISD No. 719 GO, Series C, NATL Insured, 5.00%, | | | | |
| 2/01/21 | | 2,000,000 | | 2,107,160 |
| 2/01/23 | | 6,025,000 | | 6,347,819 |
| Robbinsdale ISD No. 281 GO, | | | | |
| Refunding, Series A, NATL Insured, 4.50%, 2/01/22 | | 3,000,000 | | 3,088,530 |
| School Building, Refunding, Series A, 4.00%, 2/01/22 | | 2,020,000 | | 2,175,237 |
| Rochester Health Care Facilities Revenue, Mayo Clinic, | | | | |
| Series D, 5.00%, 11/15/38 | | 10,000,000 | | 10,057,900 |
| Series E, 5.00%, 11/15/38 | | 20,000,000 | | 20,115,800 |
| Rush City ISD No. 139 GO, School Building, NATL Insured, | | | | |
| 5.00%, 2/01/21 | | 1,680,000 | | 1,772,450 |
| 5.125%, 2/01/26 | | 4,245,000 | | 4,479,876 |
| Sauk Rapids ISD No. 047 GO, School Building, Refunding, Series A, AGMC Insured, | | | | |
| 5.00%, 2/01/22 | | 2,200,000 | | 2,342,538 |
| 4.50%, 2/01/25 | | 2,175,000 | | 2,218,130 |
| Scott County GO, Capital Improvement, Series A, AMBAC Insured, 5.00%, 12/01/27 | | 5,590,000 | | 5,958,101 |
| South Washington County ISD No. 833 GO, Series B, AGMC Insured, 5.00%, 2/01/23 | | 4,000,000 | | 4,142,480 |
Annual Report | 137
| | | | |
| Franklin Tax-Free Trust | | | | |
| |
| Statement of Investments, February 28, 2011 (continued) | | | | |
| |
| |
| Franklin Minnesota Tax-Free Income Fund | | Principal Amount | | Value |
| Municipal Bonds (continued) | | | | |
| Minnesota (continued) | | | | |
| Southern Minnesota Municipal Power Agency Power Supply System Revenue, | | | | |
| Capital Appreciation, Refunding, Series A, NATL Insured, zero cpn., 1/01/19 | $ | 5,875,000 | $ | 4,409,364 |
| Capital Appreciation, Refunding, Series A, NATL Insured, zero cpn., 1/01/20 | | 14,035,000 | | 9,971,446 |
| Capital Appreciation, Refunding, Series A, NATL Insured, zero cpn., 1/01/23 | | 4,000,000 | | 2,376,720 |
| Capital Appreciation, Refunding, Series A, NATL Insured, zero cpn., 1/01/26 | | 5,000,000 | | 2,456,850 |
| Capital Appreciation, Refunding, Series A, NATL Insured, zero cpn., 1/01/27 | | 6,600,000 | | 3,048,606 |
| Capital Appreciation, Refunding, Series C, AMBAC Insured, zero cpn., 1/01/18 | | 15,935,000 | | 12,565,385 |
| Refunding, Series A, 5.00%, 1/01/21 | | 1,000,000 | | 1,090,440 |
| Refunding, Series A, 5.00%, 1/01/22 | | 2,060,000 | | 2,218,682 |
| Refunding, Series A, 5.50%, 1/01/24 | | 1,000,000 | | 1,090,780 |
| Refunding, Series A, 5.25%, 1/01/30 | | 2,000,000 | | 2,068,560 |
| Series A, NATL Insured, Pre-Refunded, 5.75%, 1/01/18 | | 1,000,000 | | 1,068,400 |
| Spring Lake Park ISD No. 16 GO, School Building, Series A, AGMC Insured, 5.00%, | | | | |
| 2/01/29 | | 4,025,000 | | 4,177,266 |
| St. Cloud Health Care Revenue, CentraCare Health System Project, | | | | |
| Assured Guaranty, 5.375%, 5/01/31 | | 1,000,000 | | 1,028,180 |
| Assured Guaranty, 5.50%, 5/01/39 | | 27,200,000 | | 27,393,392 |
| Series A, 5.125%, 5/01/30 | | 19,000,000 | | 18,423,730 |
| St. Michael ISD No. 885 GO, | | | | |
| AGMC Insured, 5.00%, 2/01/23 | | 3,300,000 | | 3,417,546 |
| School Building, Refunding, AGMC Insured, 5.00%, 2/01/24 | | 2,735,000 | | 2,859,142 |
| School Building, Series A, AGMC Insured, 4.75%, 2/01/29 | | 5,000,000 | | 5,060,950 |
| St. Paul Housing and RDA Health Care Revenue, Allina Health System, | | | | |
| Refunding, Series A-1, 5.25%, 11/15/29 | | 5,000,000 | | 5,013,450 |
| Series A, NATL Insured, 5.00%, 11/15/22 | | 5,000,000 | | 5,148,750 |
| St. Paul ISD No. 625 GO, School Building, Series A, AGMC Insured, 5.00%, | | | | |
| 2/01/24 | | 1,615,000 | | 1,714,936 |
| 2/01/25 | | 1,675,000 | | 1,765,048 |
| 2/01/26 | | 1,745,000 | | 1,829,441 |
| St. Paul Sales Tax Revenue, sub. bond, Series A, XLCA Insured, 5.00%, 11/01/30 | | 7,360,000 | | 7,405,043 |
| University of Minnesota Revenue, Series A, | | | | |
| 5.25%, 4/01/29 | | 1,000,000 | | 1,074,100 |
| 5.125%, 4/01/34 | | 1,000,000 | | 1,038,470 |
| Upsala ISD No. 487 GO, School Building, FGIC Insured, 5.00%, | | | | |
| 2/01/22 | | 1,140,000 | | 1,212,424 |
| 2/01/28 | | 2,400,000 | | 2,550,144 |
| Waconia ISD No. 110 GO, School Building, Refunding, Series B, 4.125%, 2/01/22 | | 5,340,000 | | 5,588,043 |
| Watertown ISD No. 111 GO, Series A, AGMC Insured, 5.00%, 2/01/24 | | 2,725,000 | | 2,865,610 |
| West St. Paul ISD No. 197 GO, School Building, Series B, 5.00%, | | | | |
| 2/01/21 | | 3,340,000 | | 3,543,974 |
| 2/01/22 | | 3,500,000 | | 3,688,650 |
| Western Minnesota Municipal Power Agency Revenue, | | | | |
| NATL Insured, 5.00%, 1/01/26 | | 8,565,000 | | 8,640,286 |
| Series A, AGMC Insured, 5.00%, 1/01/36 | | 6,000,000 | | 5,907,300 |
| Series A, NATL Insured, 5.00%, 1/01/30 | | 7,200,000 | | 7,215,696 |
138 | Annual Report
| | | | |
| Franklin Tax-Free Trust | | | | |
| |
| Statement of Investments, February 28, 2011 (continued) | | | | |
| |
| |
| Franklin Minnesota Tax-Free Income Fund | | Principal Amount | | Value |
| Municipal Bonds (continued) | | | | |
| Minnesota (continued) | | | | |
| Willmar GO, Rice Memorial Hospital Project, AGMC Insured, 5.00%, | | | | |
| 2/01/22 | $ | 2,550,000 | $ | 2,636,292 |
| 2/01/25 | | 3,000,000 | | 3,070,680 |
| 2/01/32 | | 5,415,000 | | 5,426,480 |
| | | | | 919,917,301 |
| U.S. Territories 3.6% | | | | |
| Puerto Rico 3.4% | | | | |
| Puerto Rico Commonwealth GO, Public Improvement, | | | | |
| AGMC Insured, Pre-Refunded, 5.125%, 7/01/30 | | 580,000 | | 589,257 |
| Refunding, AGMC Insured, 5.00%, 7/01/23 | | 955,000 | | 955,640 |
| Refunding, AGMC Insured, 5.125%, 7/01/30 | | 420,000 | | 405,728 |
| Puerto Rico Commonwealth Highway and Transportation Authority Highway Revenue, Series Y, | | | | |
| AGMC Insured, 6.25%, 7/01/21 | | 10,000,000 | | 11,423,200 |
| Puerto Rico Electric Power Authority Power Revenue, Refunding, | | | | |
| Series SS, NATL Insured, 5.00%, 7/01/25 | | 5,000,000 | | 4,850,350 |
| Series VV, NATL RE, FGIC Insured, 5.25%, 7/01/30 | | 5,000,000 | | 4,771,850 |
| Puerto Rico Municipal Finance Agency GO, Series A, AGMC Insured, | | | | |
| 5.75%, 8/01/12 | | 5,000,000 | | 5,042,400 |
| 5.00%, 8/01/30 | | 1,000,000 | | 944,110 |
| Puerto Rico PBA Guaranteed Revenue, Government Facilities, Refunding, Series F, | | | | |
| XLCA Insured, 5.25%, 7/01/25 | | 2,500,000 | | 2,428,750 |
| Puerto Rico Public Finance Corp. Revenue, Commonwealth Appropriation, Series E, | | | | |
| AMBAC Insured, ETM, 5.50%, | | | | |
| 8/01/27 | | 375,000 | | 427,095 |
| 8/01/27 | | 625,000 | | 719,825 |
| | | | | 32,558,205 |
| U.S. Virgin Islands 0.2% | | | | |
| Virgin Islands PFAR, Gross Receipts Taxes Loan Note, AGMC Insured, 5.25%, | | | | |
| 10/01/20 | | 1,160,000 | | 1,208,244 |
| 10/01/21 | | 1,000,000 | | 1,037,200 |
| | | | | 2,245,444 |
| Total U.S. Territories | | | | 34,803,649 |
| Total Municipal Bonds before Short Term Investments | | | | |
| (Cost $940,574,394) | | | | 954,720,950 |
Annual Report | 139
Franklin Tax-Free Trust
Statement of Investments, February 28, 2011 (continued)
| | | | |
| Franklin Minnesota Tax-Free Income Fund | | Principal Amount | | Value |
| Short Term Investments (Cost $1,600,000) 0.2% | | | | |
| Municipal Bonds 0.2% | | | | |
| Minnesota 0.2% | | | | |
| bMinneapolis and St. Paul Housing and RDA Health Care System Revenue, Allina Health System, | | | | |
| Refunding, Series B-2, Daily VRDN and Put, 0.19%, 11/15/35 | $ | 1,600,000 | $ | 1,600,000 |
| Total Investments (Cost $942,174,394) 99.6% | | | | 956,320,950 |
| Other Assets, less Liabilities 0.4% | | | | 3,674,444 |
| Net Assets 100.0% | | | $ | 959,995,394 |
See Abbreviations on page 205.
aSecurity purchased on a delayed delivery basis. See Note 1(b).
bVariable rate demand notes (VRDNs) are tax-exempt obligations which contain a floating or variable interest rate adjustment formula and an unconditional right of demand to receive payment of the principal balance plus accrued interest at specified dates. The coupon rate shown represents the rate at period end.
140 | The accompanying notes are an integral part of these financial statements. | Annual Report
| | | | | | | | | | | | | | | |
| Franklin Tax-Free Trust | | | | | | | | | | | | | |
| Financial Highlights | | | | | | | | | | | | | | | |
| |
| Franklin Ohio Tax-Free Income Fund | | | | | | | | | | | | | | | |
| | | | | | Year Ended February 28, | | | | |
| Class A | | 2011 | | | 2010 | | | 2009 | | | 2008 | a | | 2007 | |
| Per share operating performance | | | | | | | | | | | | | | | |
| (for a share outstanding throughout the year) | | | | | | | | | | | | | | | |
| Net asset value, beginning of year | $ | 12.50 | | $ | 12.08 | | $ | 11.91 | | $ | 12.64 | | $ | 12.60 | |
| Income from investment operationsb: | | | | | | | | | | | | | | | |
| Net investment incomec | | 0.51 | | | 0.51 | | | 0.51 | | | 0.51 | | | 0.52 | |
| Net realized and unrealized gains (losses) | | (0.51 | ) | | 0.42 | | | 0.17 | | | (0.73 | ) | | 0.04 | |
| Total from investment operations | | — | | | 0.93 | | | 0.68 | | | (0.22 | ) | | 0.56 | |
| Less distributions from: | | | | | | | | | | | | | | | |
| Net investment income | | (0.51 | ) | | (0.51 | ) | | (0.51 | ) | | (0.51 | ) | | (0.52 | ) |
| Net realized gains | | — | | | — | | | — | | | (—)d | | | (—)d | |
| Total distributions | | (0.51 | ) | | (0.51 | ) | | (0.51 | ) | | (0.51 | ) | | (0.52 | ) |
| Redemption feese | | — | | | — | | | —d | | | —d | | | —d | |
| Net asset value, end of year | $ | 11.99 | | $ | 12.50 | | $ | 12.08 | | $ | 11.91 | | $ | 12.64 | |
| |
| Total returnf | | (0.06 | )% | | 7.82 | % | | 5.83 | % | | (1.82 | )% | | 4.61 | % |
| |
| Ratios to average net assets | | | | | | | | | | | | | | | |
| Expenses | | 0.63 | % | | 0.64 | % | | 0.64 | % | | 0.65 | % | | 0.65 | % |
| Net investment income | | 4.08 | % | | 4.10 | % | | 4.26 | % | | 4.11 | % | | 4.17 | % |
| |
| Supplemental data | | | | | | | | | | | | | | | |
| Net assets, end of year (000’s) | $ | 1,227,868 | | $ | 1,314,090 | | $ | 1,144,463 | | $ | 1,010,704 | | $ | 980,493 | |
| Portfolio turnover rate | | 18.67 | % | | 4.17 | % | | 11.12 | % | | 16.47 | % | | 10.55 | % |
|
| aFor the year ended February 29. |
| bThe amount shown for a share outstanding throughout the period may not correlate with the Statement of Operations for the period due to the timing of sales and repurchases of |
| the Fund shares in relation to income earned and/or fluctuating market value of the investments of the Fund. |
| cBased on average daily shares outstanding. |
| dAmount rounds to less than $0.01 per share. |
| eEffective September 1, 2008, the redemption fee was eliminated. |
| fTotal return does not reflect sales commissions or contingent deferred sales charges, if applicable. |
Annual Report | The accompanying notes are an integral part of these financial statements. | 141
| | | | | | | | | | | | | | | |
| Franklin Tax-Free Trust | | | | | | | | | | | | | | | |
| Financial Highlights (continued) | | | | | | | | | | | | | | | |
| |
| Franklin Ohio Tax-Free Income Fund | | | | | | | | | | | | | | | |
| | | | | | Year Ended February 28, | | | | |
| Class B | | 2011 | | | 2010 | | | 2009 | | | 2008 | a | | 2007 | |
| Per share operating performance | | | | | | | | | | | | | | | |
| (for a share outstanding throughout the year) | | | | | | | | | | | | | | | |
| Net asset value, beginning of year | $ | 12.55 | | $ | 12.13 | | $ | 11.96 | | $ | 12.69 | | $ | 12.64 | |
| Income from investment operationsb: | | | | | | | | | | | | | | | |
| Net investment incomec | | 0.44 | | | 0.44 | | | 0.45 | | | 0.44 | | | 0.45 | |
| Net realized and unrealized gains (losses) | | (0.51 | ) | | 0.42 | | | 0.16 | | | (0.73 | ) | | 0.06 | |
| Total from investment operations | | (0.07 | ) | | 0.86 | | | 0.61 | | | (0.29 | ) | | 0.51 | |
| Less distributions from: | | | | | | | | | | | | | | | |
| Net investment income | | (0.44 | ) | | (0.44 | ) | | (0.44 | ) | | (0.44 | ) | | (0.46 | ) |
| Net realized gains | | — | | | — | | | — | | | (—)d | | | (—)d | |
| Total distributions | | (0.44 | ) | | (0.44 | ) | | (0.44 | ) | | (0.44 | ) | | (0.46 | ) |
| Redemption feese | | — | | | — | | | —d | | | —d | | | —d | |
| Net asset value, end of year | $ | 12.04 | | $ | 12.55 | | $ | 12.13 | | $ | 11.96 | | $ | 12.69 | |
| |
| Total returnf | | (0.62 | )% | | 7.21 | % | | 5.22 | % | | (2.35 | )% | | 4.11 | % |
| |
| Ratios to average net assets | | | | | | | | | | | | | | | |
| Expenses | | 1.18 | % | | 1.19 | % | | 1.19 | % | | 1.20 | % | | 1.20 | % |
| Net investment income | | 3.53 | % | | 3.55 | % | | 3.71 | % | | 3.56 | % | | 3.62 | % |
| |
| Supplemental data | | | | | | | | | | | | | | | |
| Net assets, end of year (000’s) | $ | 11,692 | | $ | 27,577 | | $ | 36,629 | | $ | 42,638 | | $ | 51,897 | |
| Portfolio turnover rate | | 18.67 | % | | 4.17 | % | | 11.12 | % | | 16.47 | % | | 10.55 | % |
|
| aFor the year ended February 29. |
| bThe amount shown for a share outstanding throughout the period may not correlate with the Statement of Operations for the period due to the timing of sales and repurchases of |
| the Fund shares in relation to income earned and/or fluctuating market value of the investments of the Fund. |
| cBased on average daily shares outstanding. |
| dAmount rounds to less than $0.01 per share. |
| eEffective September 1, 2008, the redemption fee was eliminated. |
| fTotal return does not reflect sales commissions or contingent deferred sales charges, if applicable. |
142 | The accompanying notes are an integral part of these financial statements. | Annual Report
| | | | | | | | | | | | | | | |
| Franklin Tax-Free Trust | | | | | | | | | | | | | | | |
| Financial Highlights (continued) | | | | | | | | | | | | | | | |
| |
| Franklin Ohio Tax-Free Income Fund | | | | | | | | | | | | | | | |
| | | | | | Year Ended February 28, | | | | |
| Class C | | 2011 | | | 2010 | | | 2009 | | | 2008 | a | | 2007 | |
| Per share operating performance | | | | | | | | | | | | | | | |
| (for a share outstanding throughout the year) | | | | | | | | | | | | | | | |
| Net asset value, beginning of year | $ | 12.62 | | $ | 12.19 | | $ | 12.02 | | $ | 12.75 | | $ | 12.70 | |
| Income from investment operationsb: | | | | | | | | | | | | | | | |
| Net investment incomec | | 0.44 | | | 0.44 | | | 0.45 | | | 0.45 | | | 0.46 | |
| Net realized and unrealized gains (losses) | | (0.51 | ) | | 0.43 | | | 0.16 | | | (0.74 | ) | | 0.04 | |
| Total from investment operations | | (0.07 | ) | | 0.87 | | | 0.61 | | | (0.29 | ) | | 0.50 | |
| Less distributions from: | | | | | | | | | | | | | | | |
| Net investment income | | (0.44 | ) | | (0.44 | ) | | (0.44 | ) | | (0.44 | ) | | (0.45 | ) |
| Net realized gains | | — | | | — | | | — | | | (—)d | | | (—)d | |
| Total distributions | | (0.44 | ) | | (0.44 | ) | | (0.44 | ) | | (0.44 | ) | | (0.45 | ) |
| Redemption feese | | — | | | — | | | —d | | | —d | | | —d | |
| Net asset value, end of year | $ | 12.11 | | $ | 12.62 | | $ | 12.19 | | $ | 12.02 | | $ | 12.75 | |
| |
| Total returnf | | (0.63 | )% | | 7.24 | % | | 5.19 | % | | (2.34 | )% | | 4.08 | % |
| |
| Ratios to average net assets | | | | | | | | | | | | | | | |
| Expenses | | 1.18 | % | | 1.19 | % | | 1.19 | % | | 1.20 | % | | 1.20 | % |
| Net investment income | | 3.53 | % | | 3.55 | % | | 3.71 | % | | 3.56 | % | | 3.62 | % |
| |
| Supplemental data | | | | | | | | | | | | | | | |
| Net assets, end of year (000’s) | $ | 309,921 | | $ | 287,586 | | $ | 201,779 | | $ | 158,124 | | $ | 143,804 | |
| Portfolio turnover rate | | 18.67 | % | | 4.17 | % | | 11.12 | % | | 16.47 | % | | 10.55 | % |
|
| aFor the year ended February 29. |
| bThe amount shown for a share outstanding throughout the period may not correlate with the Statement of Operations for the period due to the timing of sales and repurchases of the |
| Fund shares in relation to income earned and/or fluctuating market value of the investments of the Fund. |
| cBased on average daily shares outstanding. |
| dAmount rounds to less than $0.01 per share. |
| eEffective September 1, 2008, the redemption fee was eliminated. |
| fTotal return does not reflect sales commissions or contingent deferred sales charges, if applicable. |
Annual Report | The accompanying notes are an integral part of these financial statements. | 143
| | | | | | | | | |
| Franklin Tax-Free Trust | | | | | | | | | |
| Financial Highlights (continued) | | | | | | | | | |
| |
| Franklin Ohio Tax-Free Income Fund | | | | | | | | | |
| | | Year Ended February 28, | |
| Advisor Class | | 2011 | | | 2010 | | | 2009 | a |
| Per share operating performance | | | | | | | | | |
| (for a share outstanding throughout the year) | | | | | | | | | |
| Net asset value, beginning of year | $ | 12.50 | | $ | 12.08 | | $ | 12.27 | |
| Income from investment operationsb: | | | | | | | | | |
| Net investment incomec | | 0.52 | | | 0.52 | | | 0.35 | |
| Net realized and unrealized gains (losses) | | (0.51 | ) | | 0.42 | | | (0.19 | ) |
| Total from investment operations | | 0.01 | | | 0.94 | | | 0.16 | |
| Less distributions from net investment income | | (0.52 | ) | | (0.52 | ) | | (0.35 | ) |
| Net asset value, end of year | $ | 11.99 | | $ | 12.50 | | $ | 12.08 | |
| |
| Total returnd | | 0.04 | % | | 7.93 | % | | 1.37 | % |
| |
| Ratios to average net assetse | | | | | | | | | |
| Expenses | | 0.53 | % | | 0.54 | % | | 0.54 | % |
| Net investment income | | 4.18 | % | | 4.20 | % | | 4.36 | % |
| |
| Supplemental data | | | | | | | | | |
| Net assets, end of year (000’s) | $ | 18,878 | | $ | 13,367 | | $ | 352 | |
| Portfolio turnover rate | | 18.67 | % | | 4.17 | % | | 11.12 | % |
|
| aFor the period July 1, 2008 (effective date) to February 28, 2009. |
| bThe amount shown for a share outstanding throughout the period may not correlate with the Statement of Operations for the period due to the timing of sales and repurchases of |
| the Fund shares in relation to income earned and/or fluctuating market value of the investments of the Fund. |
| cBased on average daily shares outstanding. |
| dTotal return is not annualized for periods less than one year. |
| eRatios are annualized for periods less than one year. |
144 | The accompanying notes are an integral part of these financial statements. | Annual Report
| | | | |
| Franklin Tax-Free Trust | | | | |
| |
| Statement of Investments, February 28, 2011 | | | | |
| |
| |
| Franklin Ohio Tax-Free Income Fund | | Principal Amount | | Value |
| Municipal Bonds 99.1% | | | | |
| Ohio 93.7% | | | | |
| Akron Bath Copley Joint Township Hospital District Revenue, Hospital Improvement | | | | |
| Children’s Hospital Center, AGMC Insured, 5.00%, 11/15/22 | $ | 5,000,000 | $ | 5,052,400 |
| Akron COP, District Energy Project, 5.00%, 12/01/30 | | 10,865,000 | | 10,238,632 |
| Akron GO, Improvement, NATL RE, FGIC Insured, 5.00%, | | | | |
| 12/01/20 | | 2,150,000 | | 2,261,220 |
| 12/01/21 | | 2,255,000 | | 2,363,150 |
| 12/01/22 | | 1,185,000 | | 1,235,801 |
| Akron Income Tax Revenue, Community Learning Centers, Series A, 4.50%, 12/01/33 | | 15,000,000 | | 13,856,700 |
| NATL RE, FGIC Insured, 5.00%, 12/01/22 | | 2,460,000 | | 2,546,494 |
| NATL RE, FGIC Insured, 5.00%, 12/01/24 | | 3,200,000 | | 3,280,512 |
| NATL RE, FGIC Insured, 5.00%, 12/01/33 | | 18,005,000 | | 18,026,426 |
| Akron Waterworks Revenue, Refunding and Improvement, System Mortgage, | | | | |
| Assured Guaranty, 5.00%, 3/01/34 | | 1,000,000 | | 975,970 |
| Allen County Hospital Facilities Revenue, Catholic Healthcare, Refunding, Series A, 5.25%, | | | | |
| 6/01/38 | | 15,000,000 | | 14,169,450 |
| American Municipal Power-Ohio Inc. Revenue, Prairie State Energy Campus Project, | | | | |
| Refunding, Series A, | | | | |
| Assured Guaranty, 5.25%, 2/15/33 | | 30,000,000 | | 30,172,500 |
| BHAC Insured, 5.00%, 2/15/38 | | 22,000,000 | | 21,458,800 |
| Anthony Wayne Local School District GO, | | | | |
| Refunding, AGMC Insured, 5.00%, 12/01/24 | | 3,200,000 | | 3,271,456 |
| School Facilities Construction and Improvement, Refunding, AGMC Insured, 5.65%, | | | | |
| 12/01/21 | | 645,000 | | 659,835 |
| Austintown Local School District GO, School Improvement, AGMC Insured, 5.125%, | | | | |
| 12/01/30 | | 7,715,000 | | 7,886,890 |
| Avon Local School District GO, School Improvement, NATL Insured, Pre-Refunded, 5.25%, | | | | |
| 12/01/23 | | 1,000,000 | | 1,115,620 |
| 12/01/29 | | 2,295,000 | | 2,560,348 |
| Bluffton Exempted Village School District GO, Library Construction Improvement, | | | | |
| AMBAC Insured, 5.50%, 12/01/28 | | 1,190,000 | | 1,099,786 |
| Bowling Green MFHR, Village Apartments, Refunding, Series A, GNMA Secured, | | | | |
| 5.40%, 9/20/36 | | 2,940,000 | | 2,947,791 |
| Brookfield Local School District GO, School Facilities Improvement, AGMC Insured, | | | | |
| 5.25%, 1/15/36 | | 1,300,000 | | 1,317,862 |
| Brookville Local School District GO, AGMC Insured, Pre-Refunded, | | | | |
| 5.25%, 12/01/22 | | 1,075,000 | | 1,199,292 |
| 5.00%, 12/01/31 | | 3,000,000 | | 3,326,610 |
| Butler County GO, Limited Tax, Various Purpose, Refunding, NATL RE, FGIC Insured, | | | | |
| 5.00%, 12/01/26 | | 2,130,000 | | 2,220,461 |
| Butler County Transportation ID Revenue, Highway Improvement, XLCA Insured, | | | | |
| 5.00%, 12/01/31 | | 40,000 | | 40,730 |
| Canal Winchester Local School District GO, Capital Appreciation, NATL Insured, zero cpn., | | | | |
| 12/01/32 | | 1,455,000 | | 438,741 |
| 12/01/33 | | 2,000,000 | | 557,020 |
| Central Local School District GO, Classroom Facilities, AGMC Insured, 5.75%, 12/01/22 | | 1,555,000 | | 1,573,567 |
Annual Report | 145
| | | | | | |
| | Franklin Tax-Free Trust | | | | | |
| |
| | Statement of Investments, February 28, 2011 (continued) | | | | | |
| |
| |
| | Franklin Ohio Tax-Free Income Fund | | | Principal Amount | | Value |
| | Municipal Bonds (continued) | | | | | |
| | Ohio (continued) | | | | | |
| | Chillicothe City School District GO, Capital Appreciation, Refunding, NATL RE, FGIC Insured, | | | | | |
| | zero cpn., | | | | | |
| | 12/01/22 | | $ | 1,905,000 | $ | 1,072,553 |
| | 12/01/23 | | | 1,905,000 | | 1,007,307 |
| | 12/01/24 | | | 1,905,000 | | 944,251 |
| | Cincinnati City School District COP, School Improvement Project, Refunding, AGMC Insured, | | | | | |
| | 5.00 | %, | | | | |
| | 12/15/26 | | | 7,310,000 | | 7,546,405 |
| | 12/15/27 | | | 7,000,000 | | 7,193,970 |
| | Cincinnati City School District GO, | | | | | |
| | Classroom Facilities Construction and Improvement, AGMC Insured, Pre-Refunded, | | | | | |
| | 5.00%, 12/01/27 | | | 2,500,000 | | 2,772,175 |
| | Classroom Facilities Construction and Improvement, Refunding, NATL RE, FGIC Insured, | | | | | |
| | 5.25%, 12/01/27 | | | 14,900,000 | | 15,931,080 |
| | Classroom Facilities Construction and Improvement, Refunding, NATL RE, FGIC Insured, | | | | | |
| | 5.25%, 12/01/28 | | | 5,000,000 | | 5,303,300 |
| | School Improvement, AGMC Insured, Pre-Refunded, 5.00%, 12/01/22 | | | 9,510,000 | | 10,233,235 |
| | Cincinnati Technical College Revenue, AMBAC Insured, | | | | | |
| | 5.25%, 10/01/23 | | | 2,510,000 | | 2,480,332 |
| | 5.00%, 10/01/28 | | | 2,715,000 | | 2,469,102 |
| | Cleveland Airport System Revenue, | | | | | |
| | Series A, AGMC Insured, 5.00%, 1/01/31 | | | 20,215,000 | | 19,571,152 |
| | Series C, AGMC Insured, 5.00%, 1/01/26 | | | 9,500,000 | | 9,504,085 |
| | Series C, AGMC Insured, 5.00%, 1/01/31 | | | 11,250,000 | | 10,891,687 |
| | Series C, Assured Guaranty, 5.00%, 1/01/27 | | | 28,385,000 | | 28,260,106 |
| | Cleveland Municipal School District GO, AGMC Insured, 5.00%, 12/01/27 | | | 4,000,000 | | 4,101,960 |
| | Cleveland Public Power System Revenue, | | | | | |
| | Capital Appreciation, Series B-1, NATL Insured, zero cpn., 11/15/38 | | | 10,000,000 | | 1,746,400 |
| | Series B, NATL Insured, 5.00%, 11/15/28 | | | 2,000,000 | | 1,995,200 |
| | Series B, NATL Insured, 5.00%, 11/15/38 | | | 10,000,000 | | 9,469,000 |
| | Cleveland State University General Receipt Revenue, NATL RE, FGIC Insured, 5.25%, | | | | | |
| | 6/01/24 | | | 1,000,000 | | 1,033,920 |
| | Cleveland Waterworks Revenue, Series K, FGIC Insured, Pre-Refunded, 5.00%, | | | | | |
| | 1/01/22 | | | 2,075,000 | | 2,153,975 |
| | 1/01/23 | | | 4,285,000 | | 4,448,087 |
| | 1/01/25 | | | 8,150,000 | | 8,460,189 |
| | Cleveland-Cuyahoga County Port Authority Cultural Facility Revenue, The Cleveland | | | | | |
| | Museum Art Project, 5.00%, 10/01/22 | | | 10,485,000 | | 11,355,570 |
| | Cleveland-Cuyahoga County Port Authority Revenue, Student Housing, Euclid Avenue | | | | | |
| | Housing Corp., Fenn Project, AMBAC Insured, 5.00%, | | | | | |
| | 8/01/25 | | | 2,440,000 | | 1,980,304 |
| | 8/01/28 | | | 2,145,000 | | 1,678,934 |
| | Columbus City School District GO, Linden Elementary Construction, AGMC Insured, | | | | | |
| Pre | -Refunded, 5.00%, 12/01/28 | | | 900,000 | | 931,293 |
| | Crawford County GO, AMBAC Insured, Pre-Refunded, 5.25%, 12/01/31 | | | 1,330,000 | | 1,450,072 |
146 | Annual Report
| | | | | |
| Franklin Tax-Free Trust | | | | | |
| |
| Statement of Investments, February 28, 2011 (continued) | | | | | |
| |
| |
| Franklin Ohio Tax-Free Income Fund | | | Principal Amount | | Value |
| Municipal Bonds (continued) | | | | | |
| Ohio (continued) | | | | | |
| Cuyahoga Community College District General Receipts Revenue, Series A, AMBAC Insured, | | | | | |
| 5.00 | %, | | | | |
| 12/01/22 | | $ | 1,000,000 | $ | 1,050,370 |
| 12/01/32 | | | 3,000,000 | | 3,017,340 |
| Cuyahoga County EDR, Medical Mart Center, Series G, 5.00%, 12/01/27 | | | 15,000,000 | | 15,585,450 |
| Cuyahoga County Utility System Revenue, Medical Center Co. Project, | | | | | |
| Improvement, AMBAC Insured, 5.125%, 2/15/28 | | | 1,000,000 | | 1,002,420 |
| Refunding and Improvement, Series B, NATL Insured, 6.10%, 8/15/15 | | | 2,945,000 | | 2,954,365 |
| Darke County GO, Real Estate Acquisition and Improvement, NATL RE, FGIC Insured, | | | | | |
| 5.125%, 12/01/27 | | | 1,020,000 | | 947,804 |
| Dayton City School District GO, School Facilities Construction and Improvement, Series A, | | | | | |
| NATL RE, FGIC Insured, | | | | | |
| 4.75%, 12/01/25 | | | 9,400,000 | | 9,492,966 |
| 5.00%, 12/01/29 | | | 8,275,000 | | 8,328,456 |
| Deerfield Township Tax Increment Revenue, Refunding, Series B, NATL Insured, | | | | | |
| 5.00%, 12/01/25 | | | 1,000,000 | | 1,003,570 |
| Delaware General Income Tax Special Obligation, 4.75%, 12/01/37 | | | 4,000,000 | | 3,719,440 |
| Dublin City School District GO, Capital Appreciation, NATL RE, FGIC Insured, zero cpn., | | | | | |
| 12/01/16 | | | 4,635,000 | | 3,955,231 |
| Eastlake GO, Capital Facilities, NATL Insured, 5.00%, 12/01/27 | | | 1,950,000 | | 1,967,687 |
| Eaton City School District GO, FGIC Insured, Pre-Refunded, 5.00%, 12/01/25 | | | 1,250,000 | | 1,357,425 |
| Edgewood City School District GO, School Improvement, Refunding, AGMC Insured, | | | | | |
| 5.00%, 12/01/24 | | | 2,220,000 | | 2,317,858 |
| Fairborn City School District GO, School Improvement, Refunding, AGMC Insured, 5.00%, | | | | | |
| 12/01/23 | | | 1,205,000 | | 1,264,913 |
| 12/01/24 | | | 1,265,000 | | 1,323,633 |
| 12/01/25 | | | 1,330,000 | | 1,382,070 |
| Fairfield County GO, NATL RE, FGIC Insured, Pre-Refunded, 5.00%, 12/01/20 | | | 1,600,000 | | 1,748,784 |
| Fairless Local School District GO, Capital Appreciation, Various Purpose School Facilities, | | | | | |
| AGMC Insured, 5.00%, 12/01/28 | | | 2,085,000 | | 2,113,961 |
| Field Local School District GO, School Facilities Construction and Improvement, AMBAC | | | | | |
| Insured, 5.00%, 12/01/27 | | | 1,290,000 | | 1,162,342 |
| Franklin County Convention Facilities Authority Revenue, Tax and Lease Revenue Anticipation | | | | | |
| Bonds, Refunding, AMBAC Insured, 5.00%, 12/01/24 | | | 7,255,000 | | 7,581,185 |
| Franklin County Hospital Revenue, | | | | | |
| Improvement, Nationwide Children’s Hospital, 5.25%, 11/01/40 | | | 15,000,000 | | 14,222,700 |
| OhioHealth Corp., Refunding, Series C, NATL Insured, 5.00%, 5/15/33 | | | 5,250,000 | | 5,025,667 |
| The Children’s Hospital Project, Series C, NATL RE, FGIC Insured, 5.00%, 5/01/35 | | | 10,000,000 | | 9,488,800 |
| Garfield Heights GO, Various Purpose, Refunding and Improvement, NATL RE, FGIC Insured, | | | | | |
| 5.00%, 12/01/27 | | | 2,655,000 | | 2,616,317 |
| Georgetown Exempted Village School District GO, Classroom Facilities, AGMC Insured, | | | | | |
| 5.125%, 12/01/31 | | | 1,000,000 | | 1,028,880 |
| Graham Local School District GO, School Improvement, Refunding, NATL Insured, | | | | | |
| 5.00%, 12/01/33 | | | 6,055,000 | | 5,973,560 |
| Grand Valley Local School District GO, Classroom Facilities Improvement, NATL RE, | | | | | |
| FGIC Insured, 5.00%, 12/01/24 | | | 1,300,000 | | 1,311,570 |
Annual Report | 147
| | | | | |
| | Franklin Tax-Free Trust | | | | |
| |
| | Statement of Investments, February 28, 2011 (continued) | | | | |
| |
| |
| | Franklin Ohio Tax-Free Income Fund | | Principal Amount | | Value |
| | Municipal Bonds (continued) | | | | |
| | Ohio (continued) | | | | |
| | Greater Cleveland Regional Transit Authority GO, Capital Improvement, Series A, | | | | |
| | NATL Insured, Pre-Refunded, 5.125%, 12/01/21 | $ | 1,750,000 | $ | 1,811,793 |
| | Green Community Learning Centers Income Tax Revenue, NATL Insured, 5.00%, | | | | |
| | 12/01/27 | | 1,205,000 | | 1,232,040 |
| | 12/01/28 | | 1,265,000 | | 1,289,162 |
| | 12/01/32 | | 2,675,000 | | 2,700,305 |
| | Greene County GO, AMBAC Insured, Pre-Refunded, 5.00%, | | | | |
| | 12/01/22 | | 1,475,000 | | 1,587,174 |
| | 12/01/28 | | 2,620,000 | | 2,819,251 |
| | Greene County Hospital Facility Revenue, Kettering Health Network, 5.50%, 4/01/39 | | 12,930,000 | | 12,139,977 |
| | Greene County Water System Revenue, Governmental Enterprise, NATL Insured, | | | | |
| Pre | -Refunded, 5.25%, 12/01/21 | | 5,400,000 | | 5,649,534 |
| | Guernsey County GO, Refunding, NATL RE, FGIC Insured, 5.00%, 12/01/23 | | 2,690,000 | | 2,657,370 |
| | Hamilton City School District GO, School Improvement, AGMC Insured, 5.00%, 12/01/26 | | 2,240,000 | | 2,271,002 |
| | Hamilton County Convention Facilities Authority Revenue, | | | | |
| | NATL RE, FGIC Insured, 5.00%, 12/01/28 | | 5,400,000 | | 5,477,058 |
| | second lien, FGIC Insured, Pre-Refunded, 5.00%, 12/01/33 | | 7,235,000 | | 8,117,019 |
| | Hamilton County Hospital Facilities Revenue, Cincinnati Children’s Hospital, Series J, | | | | |
| | NATL RE, FGIC Insured, 5.25%, 5/15/34 | | 5,000,000 | | 4,447,300 |
| | Hamilton County Sales Tax Revenue, | | | | |
| | Refunding, Series A, Assured Guaranty, 5.00%, 12/01/32 | | 10,000,000 | | 9,804,300 |
| | Refunding, Series B, AMBAC Insured, 5.25%, 12/01/32 | | 3,965,000 | | 3,939,267 |
| | Refunding, Series B, AMBAC Insured, 5.60%, 12/01/32 | | 245,000 | | 245,061 |
| | sub. bond, Refunding, Series A, AGMC Insured, 5.00%, 12/01/32 | | 35,080,000 | | 34,393,484 |
| | Hamilton County Sewer System Revenue, | | | | |
| | Improvement, Series A, NATL Insured, Pre-Refunded, 5.25%, 12/01/21 | | 1,000,000 | | 1,036,240 |
| | Metropolitan Sewer District Improvement, Series B, NATL Insured, 5.00%, 12/01/30 | | 4,000,000 | | 4,086,040 |
| | Hamilton County Student Housing Revenue, Stratford Heights Project, University of Cincinnati, | | | | |
| | Refunding, AGMC Insured, | | | | |
| | 5.00%, 6/01/30 | | 7,000,000 | | 7,040,670 |
| | 4.75%, 6/01/39 | | 7,000,000 | | 6,419,700 |
| | Hamilton GO, One Renaissance Center, Series A, AMBAC Insured, 5.25%, | | | | |
| | 11/01/18 | | 1,010,000 | | 1,034,291 |
| | 11/01/19 | | 1,015,000 | | 1,038,670 |
| | 11/01/20 | | 1,120,000 | | 1,144,483 |
| | 11/01/21 | | 1,180,000 | | 1,204,780 |
| | Hilliard School District GO, | | | | |
| | Capital Appreciation, School Construction, Refunding, NATL Insured, zero cpn., | | | | |
| | 12/01/19 | | 2,190,000 | | 1,598,919 |
| | Capital Appreciation, School Construction, Refunding, NATL Insured, zero cpn., | | | | |
| | 12/01/20 | | 4,525,000 | | 3,111,661 |
| | School Improvement, Series A, NATL RE, FGIC Insured, 5.25%, 12/01/28 | | 3,010,000 | | 3,062,585 |
| | Huber Heights City School District GO, School Improvement, Refunding, 5.00%, | | | | |
| | 12/01/33 | | 4,500,000 | | 4,524,975 |
| | 12/01/36 | | 5,000,000 | | 4,921,350 |
| | Huber Heights Water System Revenue, Refunding and Improvement, NATL Insured, 5.00%, | | | | |
| | 12/01/27 | | 3,205,000 | | 3,295,990 |
| | 12/01/30 | | 2,250,000 | | 2,281,117 |
| | Hudson City School District COP, NATL Insured, 5.00%, 6/01/34 | | 6,720,000 | | 6,673,834 |
| |
| | 148 | Annual Report | | | | |
| | | | | | |
| | Franklin Tax-Free Trust | | | | | |
| |
| | Statement of Investments, February 28, 2011 (continued) | | | | | |
| |
| |
| | Franklin Ohio Tax-Free Income Fund | | | Principal Amount | | Value |
| | Municipal Bonds (continued) | | | | | |
| | Ohio (continued) | | | | | |
| | Independence Local School District GO, NATL RE, FGIC Insured, 5.25%, 12/01/21 | | $ | 1,390,000 | $ | 1,445,350 |
| | Ironton City School District GO, Refunding, NATL Insured, 5.00%, 12/01/34 | | | 5,130,000 | | 5,004,264 |
| | Jackson Center Local School District Shelby County GO, Facilities Construction and | | | | | |
| | Improvement, NATL Insured, 5.00%, 12/01/28 | | | 1,175,000 | | 1,188,607 |
| | Jonathan Alder Local School District GO, School Facilities Construction and Improvement, | | | | | |
| | NATL Insured, Pre-Refunded, | | | | | |
| | 4.75%, 12/01/22 | | | 1,105,000 | | 1,185,256 |
| | 5.00%, 12/01/27 | | | 6,195,000 | | 6,671,767 |
| | 5.00%, 12/01/30 | | | 3,320,000 | | 3,575,507 |
| | Kenston Local School District GO, School Improvement, NATL Insured, 5.00%, | | | | | |
| | 12/01/24 | | | 2,380,000 | | 2,435,073 |
| | 12/01/25 | | | 2,500,000 | | 2,549,775 |
| | Kent State University Revenues, General Receipts, Series B, Assured Guaranty, 4.25%, | | | | | |
| | 5/01/31 | | | 3,395,000 | | 3,010,279 |
| | Kettering City School District GO, School Improvement, AGMC Insured, Pre-Refunded, | | | | | |
| | 5.00 | %, | | | | |
| | 12/01/28 | | | 2,970,000 | | 3,332,073 |
| | 12/01/31 | | | 2,595,000 | | 2,911,356 |
| | Keystone Local School District Lorain County GO, School Improvement, AGMC Insured, | | | | | |
| | 5.00%, 12/01/30 | | | 6,170,000 | | 6,267,301 |
| | Kings Local School District GO, School Improvement, NATL Insured, 5.00%, 12/01/33 | | | 10,000,000 | | 10,056,100 |
| | Lake Local School District Wood County GO, NATL Insured, Pre-Refunded, | | | | | |
| | 5.30%, 12/01/21 | | | 1,575,000 | | 1,648,978 |
| | 5.375%, 12/01/25 | | | 1,900,000 | | 1,990,307 |
| | Lakewood City School District GO, | | | | | |
| | NATL RE, FGIC Insured, 5.00%, 12/01/30 | | | 9,170,000 | | 9,390,630 |
| | NATL RE, FGIC Insured, 4.50%, 12/01/34 | | | 6,000,000 | | 5,593,200 |
| | School Improvement, AGMC Insured, Pre-Refunded, 5.125%, 12/01/31 | | | 21,900,000 | | 24,960,087 |
| | School Improvement, Refunding, AGMC Insured, 4.50%, 12/01/31 | | | 2,220,000 | | 2,158,550 |
| | Lakota Local School District GO, | | | | | |
| | AGMC Insured, 5.00%, 12/01/29 | | | 5,000,000 | | 5,124,700 |
| | Refunding, Series A, NATL RE, FGIC Insured, 5.25%, 12/01/26 | | | 2,000,000 | | 2,267,240 |
| | Lancaster Wastewater System Improvement Revenue, Assured Guaranty, 4.75%, 12/01/33 | | | 4,000,000 | | 3,864,760 |
| | Licking County Joint Vocational School District GO, School Facilities Construction and | | | | | |
| | Improvement, NATL Insured, | | | | | |
| | 4.75%, 12/01/23 | | | 1,180,000 | | 1,197,688 |
| Pre | -Refunded, 5.00%, 12/01/21 | | | 2,200,000 | | 2,367,310 |
| Pre | -Refunded, 4.75%, 12/01/23 | | | 1,050,000 | | 1,126,262 |
| | Licking Heights Local School District GO, School Facilities Construction and Improvement, | | | | | |
| | Refunding, Series A, NATL Insured, 5.00%, | | | | | |
| | 12/01/24 | | | 2,085,000 | | 2,166,357 |
| | 12/01/25 | | | 2,215,000 | | 2,286,567 |
| | 12/01/26 | | | 2,345,000 | | 2,411,575 |
| | Little Miami Local School District GO, | | | | | |
| | Refunding, AGMC Insured, 4.50%, 12/01/34 | | | 20,255,000 | | 18,251,780 |
| | School Improvement, AGMC Insured, Pre-Refunded, 5.00%, 12/01/34 | | | 4,000,000 | | 4,678,800 |
Annual Report | 149
| | | | | |
| | Franklin Tax-Free Trust | | | | |
| |
| | Statement of Investments, February 28, 2011 (continued) | | | | |
| |
| |
| | Franklin Ohio Tax-Free Income Fund | | Principal Amount | | Value |
| | Municipal Bonds (continued) | | | | |
| | Ohio (continued) | | | | |
| | Logan Hocking Local School District GO, Construction and Improvement, NATL Insured, | | | | |
| Pre | -Refunded, 5.00%, | | | | |
| | 12/01/22 | $ | 1,200,000 | $ | 1,241,724 |
| | 12/01/29 | | 1,000,000 | | 1,034,770 |
| | London City School District GO, School Facilities Construction and Improvement, | | | | |
| | FGIC Insured, Pre-Refunded, 5.00%, | | | | |
| | 12/01/22 | | 700,000 | | 724,066 |
| | 12/01/29 | | 1,500,000 | | 1,551,570 |
| | Lorain County GO, Sewer System Improvement, NATL Insured, 5.00%, 12/01/19 | | 1,640,000 | | 1,691,545 |
| | Lorain County Hospital Revenue, Catholic Healthcare Partners, Refunding, | | | | |
| | Series C-1, AGMC Insured, 5.00%, 4/01/33 | | 19,410,000 | | 18,343,032 |
| | Series C-2, AGMC Insured, 5.00%, 4/01/33 | | 8,000,000 | | 7,560,240 |
| | Louisville City School District GO, NATL RE, FGIC Insured, Pre-Refunded, 5.00%, | | | | |
| | 12/01/24 | | 3,500,000 | | 3,620,330 |
| | Lucas County GO, Various Purpose, | | | | |
| | 4.50%, 10/01/35 | | 10,685,000 | | 9,749,849 |
| | 5.00%, 10/01/40 | | 5,000,000 | | 4,886,550 |
| | Lucas County Hospital Revenue, ProMedica Healthcare Obligated Group, Refunding, AMBAC | | | | |
| | Insured, 5.375%, 11/15/29 | | 750,000 | | 729,683 |
| | Mad River Local School District GO, Classroom Facilities, FGIC Insured, Pre-Refunded, | | | | |
| | 5.125%, 12/01/24 | | 4,180,000 | | 4,472,851 |
| | Madeira City School District GO, School Improvement, Refunding, AGMC Insured, | | | | |
| | 5.25%, 12/01/32 | | 9,605,000 | | 10,224,042 |
| | Mahoning County Career and Technical Center Board of Education COP, Series B, 4.75%, | | | | |
| | 12/01/36 | | 3,500,000 | | 3,306,065 |
| | Mahoning County Hospital Facilities Revenue, Western Reserve Care, NATL Insured, | | | | |
| | ETM, 5.50%, 10/15/25 | | 4,750,000 | | 5,499,502 |
| | Maple Heights City School District GO, School Facilities Improvement, 5.00%, 1/15/37 | | 10,000,000 | | 9,884,900 |
| | Marion County GO, AMBAC Insured, Pre-Refunded, 5.05%, 12/01/31 | | 1,500,000 | | 1,566,510 |
| | Martins Ferry City School District GO, School Facilities Construction and Improvement, | | | | |
| | AGMC Insured, 5.00%, 12/01/32 | | 3,610,000 | | 3,664,836 |
| | Marysville Exempted Village School District COP, School Facilities Project, NATL Insured, | | | | |
| Pre | -Refunded, 5.25%, | | | | |
| | 12/01/28 | | 2,120,000 | | 2,440,014 |
| | 12/01/30 | | 2,650,000 | | 3,050,017 |
| | Marysville Exempted Village School District GO, | | | | |
| | Capital Appreciation, Refunding, NATL Insured, zero cpn., 12/01/20 | | 1,000,000 | | 649,380 |
| | Capital Appreciation, Refunding, NATL Insured, zero cpn., 12/01/21 | | 1,000,000 | | 614,100 |
| | Refunding, NATL Insured, 5.00%, 12/01/29 | | 1,000,000 | | 1,008,400 |
| | School Improvement, Refunding, AGMC Insured, 5.00%, 12/01/29 | | 5,500,000 | | 5,606,535 |
| | Marysville Wastewater Treatment System Revenue, | | | | |
| | Assured Guaranty, 4.25%, 12/01/27 | | 1,170,000 | | 1,111,968 |
| | Assured Guaranty, 4.75%, 12/01/47 | | 5,000,000 | | 4,330,100 |
| | first mortgage, NATL Insured, Pre-Refunded, 5.00%, 12/01/35 | | 4,780,000 | | 5,514,829 |
| | Refunding, Assured Guaranty, 4.75%, 12/01/46 | | 14,205,000 | | 12,445,569 |
150 | Annual Report
| | | | | |
| | Franklin Tax-Free Trust | | | | |
| |
| | Statement of Investments, February 28, 2011 (continued) | | | | |
| |
| |
| | Franklin Ohio Tax-Free Income Fund | | Principal Amount | | Value |
| | Municipal Bonds (continued) | | | | |
| | Ohio (continued) | | | | |
| | Marysville Water System Mortgage Revenue, AMBAC Insured, | | | | |
| | 5.00%, 12/01/32 | $ | 1,250,000 | $ | 1,244,975 |
| | 4.50%, 12/01/38 | | 2,500,000 | | 2,164,850 |
| | Mason City School District GO, School Improvement, AGMC Insured, Pre-Refunded, 5.00%, | | | | |
| | 12/01/31 | | 5,000,000 | | 5,609,550 |
| | Maumee City School District GO, School Facilities Construction and Improvement, AGMC | | | | |
| | Insured, 5.00%, 12/01/27 | | 3,610,000 | | 3,702,741 |
| | Medina GO, 5.00%, 12/01/22 | | 1,100,000 | | 1,139,919 |
| | Medina School District COP, School Facilities Project, Assured Guaranty, 5.25%, | | | | |
| | 12/01/31 | | 5,725,000 | | 5,962,358 |
| | Miami University General Receipts Revenue, Refunding, AMBAC Insured, 5.00%, | | | | |
| | 12/01/22 | | 1,675,000 | | 1,729,471 |
| | Middletown City School District GO, FGIC Insured, Pre-Refunded, 5.00%, 12/01/31 | | 5,000,000 | | 5,537,150 |
| | Milford Exempted Village School District GO, School Improvement, AGMC Insured, | | | | |
| Pre | -Refunded, 5.00%, 12/01/22 | | 2,000,000 | | 2,068,760 |
| | Minerva Local School District GO, Classroom Facilities, NATL Insured, Pre-Refunded, | | | | |
| | 5.30%, 12/01/29 | | 1,300,000 | | 1,404,442 |
| | Monroe Local School District GO, | | | | |
| | AMBAC Insured, Pre-Refunded, 5.00%, 12/01/23 | | 1,000,000 | | 1,076,050 |
| | School Improvement, Refunding, AMBAC Insured, 4.50%, 12/01/29 | | 5,115,000 | | 4,975,667 |
| | Montgomery County Revenue, Catholic Health Initiatives, | | | | |
| | Refunding, Series A, 5.50%, 5/01/34 | | 12,500,000 | | 12,547,875 |
| | Refunding, Series A, 5.00%, 5/01/39 | | 10,000,000 | | 9,101,400 |
| | Series C-1, AGMC Insured, 5.00%, 10/01/41 | | 10,000,000 | | 9,361,500 |
| | Morley Library District GO, Lake County District Library, Library Improvement, | | | | |
| | AMBAC Insured, 4.75%, 12/01/21 | | 1,000,000 | | 1,014,650 |
| | Mount Healthy City School District GO, School Improvement, AGMC Insured, 5.00%, | | | | |
| | 12/01/31 | | 1,430,000 | | 1,455,983 |
| | New Albany Community Authority Community Facilities Revenue, Refunding, Series B, | | | | |
| | AMBAC Insured, | | | | |
| | 5.125%, 10/01/21 | | 3,000,000 | | 3,059,010 |
| | 5.20%, 10/01/24 | | 5,000,000 | | 5,079,950 |
| | New Lexington HDC Mortgage Revenue, Lincoln Park, Refunding, Series A, NATL Insured, | | | | |
| | 5.85%, 1/01/21 | | 660,000 | | 660,660 |
| | Newark City School District GO, School Improvement, Series A, NATL RE, FGIC Insured, | | | | |
| | 5.00%, 12/01/33 | | 5,000,000 | | 4,932,750 |
| | Ohio Capital Corp. HMR, Refunding, Series G, NATL Insured, 6.35%, 7/01/22 | | 470,000 | | 470,273 |
| | Ohio Center for Local Government Capital Asset Financing Program Fractionalized Interests | | | | |
| | GO, AGMC Insured, | | | | |
| | 4.875%, 12/01/18 | | 1,255,000 | | 1,314,462 |
| | 5.25%, 12/01/23 | | 1,410,000 | | 1,466,456 |
| | Ohio HFA Capital Fund Revenue, Series A, AGMC Insured, 5.00%, 4/01/27 | | 5,545,000 | | 5,588,140 |
| | Ohio State Air Quality Development Authority Revenue, | | | | |
| | Environmental Improvement, Buckeye Power Recovery Zone Facility, 6.00%, 12/01/40 | | 6,020,000 | | 5,872,630 |
| | Ohio Power Co., Refunding, Series C, AMBAC Insured, 5.15%, 5/01/26 | | 9,075,000 | | 8,565,983 |
| | Pollution Control, Dayton Power and Light Co., Refunding, Series B, BHAC Insured, | | | | |
| | 4.80%, 1/01/34 | | 28,270,000 | | 26,839,538 |
Annual Report | 151
| | | | |
| Franklin Tax-Free Trust | | | | |
| |
| Statement of Investments, February 28, 2011 (continued) | | | | |
| |
| |
| Franklin Ohio Tax-Free Income Fund | | Principal Amount | | Value |
| Municipal Bonds (continued) | | | | |
| Ohio (continued) | | | | |
| Ohio State Building Authority Revenue, State Facilities, | | | | |
| Administration Building Fund Project, Series A, AGMC Insured, Pre-Refunded, | | | | |
| 5.00%, 4/01/22 | $ | 3,100,000 | $ | 3,253,543 |
| Adult Correction, Series A, AGMC Insured, 5.00%, 4/01/24 | | 5,390,000 | | 5,588,729 |
| Ohio State Department of Transportation COP, Panhandle Rail Line Project, AGMC Insured, | | | | |
| 6.50%, 4/15/12 | | 385,000 | | 386,636 |
| Ohio State GO, Common Schools, Series B, Pre-Refunded, 4.625%, 9/15/22 | | 5,000,000 | | 5,218,150 |
| Ohio State Higher Educational Facility Commission Revenue, | | | | |
| Denison University Project, 4.00%, 11/01/29 | | 6,220,000 | | 5,629,909 |
| FGIC Insured, Pre-Refunded, 5.00%, 5/01/23 | | 8,460,000 | | 9,189,167 |
| Higher Educational Facility, Xavier University Project, CIFG Insured, Pre-Refunded, | | | | |
| 5.00%, 5/01/23 | | 3,385,000 | | 3,860,897 |
| Higher Educational Facility, Xavier University Project, CIFG Insured, Pre-Refunded, | | | | |
| 5.00%, 5/01/24 | | 2,000,000 | | 2,281,180 |
| Kenyon College Project, Refunding, 5.25%, 7/01/44 | | 25,000,000 | | 23,362,750 |
| Summa Health System, 2010 Project, Refunding, Assured Guaranty, 5.25%, 11/15/40 | | 21,805,000 | | 20,465,083 |
| University Hospital, BHAC Insured, 4.75%, 1/15/36 | | 10,000,000 | | 8,972,900 |
| University Hospital, BHAC Insured, 4.75%, 1/15/46 | | 15,000,000 | | 13,067,700 |
| University Hospital, BHAC Insured, 5.25%, 1/15/46 | | 13,500,000 | | 12,778,290 |
| University of Dayton Project, XLCA Insured, 5.00%, 12/01/34 | | 8,500,000 | | 8,179,295 |
| Xavier University, 5.00%, 5/01/40 | | 14,500,000 | | 13,294,615 |
| Ohio State Higher Educational Facility Revenue, | | | | |
| Case Western Reserve University Project, Refunding, NATL Insured, 5.00%, | | | | |
| 12/01/44 | | 7,500,000 | | 7,250,400 |
| Case Western Reserve University Project, Series A, AMBAC Insured, 5.00%, | | | | |
| 12/01/34 | | 4,000,000 | | 3,928,760 |
| Otterbein College Project, CIFG Insured, 5.00%, 12/01/25 | | 2,205,000 | | 2,224,272 |
| Otterbein College Project, CIFG Insured, 5.00%, 12/01/35 | | 3,225,000 | | 2,942,038 |
| Ohio State University General Receipts Athens Revenue, NATL Insured, 5.00%, | | | | |
| 12/01/24 | | 2,155,000 | | 2,217,840 |
| Ohio State University General Receipts Revenue, | | | | |
| Series A, Pre-Refunded, 5.125%, 12/01/31 | | 2,500,000 | | 2,695,550 |
| State University of Ohio, Series B, NATL Insured, 5.00%, 6/01/33 | | 4,315,000 | | 4,335,583 |
| State University of Ohio, Series B, NATL Insured, Pre-Refunded, 5.00%, 6/01/33 | | 940,000 | | 1,027,411 |
| Ohio State Water Development Authority Revenue, Drinking Water Fund, Leverage, | | | | |
| Pre-Refunded, 5.00%, 6/01/23 | | 2,255,000 | | 2,428,545 |
| Olentangy Local School District GO, | | | | |
| AGMC Insured, 5.00%, 12/01/25 | | 45,000 | | 45,615 |
| AGMC Insured, 4.50%, 12/01/33 | | 10,000,000 | | 9,428,300 |
| AGMC Insured, Pre-Refunded, 5.00%, 12/01/25 | | 1,790,000 | | 1,889,560 |
| AGMC Insured, Pre-Refunded, 5.00%, 12/01/30 | | 3,910,000 | | 4,127,474 |
| AGMC Insured, Pre-Refunded, 5.00%, 12/01/30 | | 1,745,000 | | 2,027,009 |
| Refunding, AGMC Insured, 5.00%, 12/01/30 | | 90,000 | | 90,490 |
| Refunding, Series A, AGMC Insured, 4.50%, 12/01/32 | | 11,300,000 | | 10,815,343 |
| School Facilities Construction and Improvement, Refunding, Assured Guaranty, 5.00%, | | | | |
| 12/01/36 | | 7,505,000 | | 7,522,487 |
| School Facilities Construction and Improvement, Series A, FGIC Insured, Pre-Refunded, | | | | |
| 5.25%, 12/01/32 | | 11,200,000 | | 12,635,168 |
152 | Annual Report
| | | | | |
| | Franklin Tax-Free Trust | | | | |
| |
| | Statement of Investments, February 28, 2011 (continued) | | | | |
| |
| |
| | Franklin Ohio Tax-Free Income Fund | | Principal Amount | | Value |
| | Municipal Bonds (continued) | | | | |
| | Ohio (continued) | | | | |
| | Ottawa and Glandorf Local School District GO, School Facilities Construction and | | | | |
| | Improvement, NATL Insured, Pre-Refunded, 5.25%, 12/01/23 | $ | 2,175,000 | $ | 2,349,826 |
| | Pickerington Local School District GO, School Facilities Construction and Improvement, | | | | |
| | FGIC Insured, Pre-Refunded, 5.00%, 12/01/28 | | 3,000,000 | | 3,103,140 |
| | Plain Local School District GO, NATL RE, FGIC Insured, 6.00%, 12/01/25 | | 800,000 | | 806,208 |
| | Plainesville City School District GO, School Improvement, NATL RE, FGIC Insured, 5.00%, | | | | |
| | 12/01/28 | | 2,515,000 | | 2,538,742 |
| | Princeton City School District GO, NATL Insured, Pre-Refunded, 5.00%, | | | | |
| | 12/01/25 | | 1,700,000 | | 1,885,079 |
| | 12/01/26 | | 2,725,000 | | 3,021,671 |
| | 12/01/30 | | 2,260,000 | | 2,506,046 |
| | Ravenna City School District GO, School Improvement, AGMC Insured, 5.00%, 1/15/31 | | 1,710,000 | | 1,748,629 |
| | Reynoldsburg City School District GO, School Facilities Construction, AGMC Insured, 5.00%, | | | | |
| | 12/01/32 | | 3,000,000 | | 3,050,820 |
| | Rittman Exempted Village School District GO, School Improvement, AGMC Insured, | | | | |
| Pre | -Refunded, 5.125%, 12/01/31 | | 1,000,000 | | 1,057,170 |
| | Ross County Hospital Revenue, Facilities, Adena Health System, Refunding, Assured | | | | |
| | Guaranty, 5.25%, 12/01/38 | | 15,000,000 | | 13,828,650 |
| | Shaker Heights GO, Urban Renewal, Refunding, AMBAC Insured, | | | | |
| | 5.00%, 12/01/21 | | 1,225,000 | | 1,275,887 |
| | 5.25%, 12/01/26 | | 725,000 | | 746,576 |
| | Shawnee State University Revenue, NATL Insured, 5.00%, 6/01/28 | | 5,780,000 | | 5,317,889 |
| | Sidney City School District GO, School Improvement, | | | | |
| | FGIC Insured, Pre-Refunded, 5.125%, 12/01/28 | | 1,425,000 | | 1,536,464 |
| | Series B, FGIC Insured, Pre-Refunded, 5.25%, 12/01/23 | | 1,780,000 | | 1,862,948 |
| | Series B, FGIC Insured, Pre-Refunded, 5.25%, 12/01/28 | | 1,000,000 | | 1,046,600 |
| | Springboro Community City School District GO, Refunding, AGMC Insured, 5.25%, | | | | |
| | 12/01/27 | | 5,175,000 | | 5,483,430 |
| | 12/01/28 | | 2,000,000 | | 2,113,920 |
| | Springboro Sewer System Revenue, Mortgage, NATL Insured, 5.00%, 6/01/27 | | 1,095,000 | | 1,046,787 |
| | St. Mary’s City School District GO, School Facilities Construction and Improvement, | | | | |
| | AGMC Insured, 5.00%, 12/01/35 | | 3,500,000 | | 3,296,160 |
| | Steubenville City School District GO, School Facilities Construction and Improvement, | | | | |
| | Capital Appreciation, NATL Insured, 5.60%, 12/01/22 | | 1,500,000 | | 1,524,240 |
| | Streetsboro City School District GO, School Improvement, NATL Insured, Pre-Refunded, | | | | |
| | 5.00%, 12/01/25 | | 2,500,000 | | 2,585,000 |
| | Summit County GO, Sanitary Sewer System Improvement, FGIC Insured, Pre-Refunded, | | | | |
| | 5.25%, 12/01/21 | | 4,505,000 | | 4,713,176 |
| | Swanton Local School District GO, School Improvement, FGIC Insured, Pre-Refunded, | | | | |
| | 5.25%, 12/01/25 | | 1,895,000 | | 1,981,109 |
| | Sycamore Community City School District COP, Blue Ash Elementary School Project, AMBAC | | | | |
| | Insured, 5.125%, 12/01/25 | | 1,000,000 | | 1,004,450 |
| | Sylvania City School District GO, | | | | |
| | Refunding, NATL RE, FGIC Insured, 5.00%, 12/01/22 | | 1,550,000 | | 1,586,580 |
| | School Improvement, Assured Guaranty, 5.25%, 12/01/36 | | 7,660,000 | | 7,736,447 |
| | Various Purpose, FGIC Insured, Pre-Refunded, 5.30%, 12/01/20 | | 2,225,000 | | 2,328,640 |
Annual Report | 153
| | | | |
| Franklin Tax-Free Trust | | | | |
| |
| Statement of Investments, February 28, 2011 (continued) | | | | |
| |
| |
| Franklin Ohio Tax-Free Income Fund | | Principal Amount | | Value |
| Municipal Bonds (continued) | | | | |
| Ohio (continued) | | | | |
| Toledo City School District GO, School Facilities Improvement, | | | | |
| 5.375%, 12/01/35 | $ | 4,565,000 | $ | 4,644,111 |
| AGMC Insured, 5.00%, 12/01/23 | | 1,500,000 | | 1,546,410 |
| Series B, NATL RE, FGIC Insured, 5.00%, 12/01/27 | | 1,925,000 | | 1,954,433 |
| Toledo GO, | | | | |
| Capital Improvement, Refunding, Assured Guaranty, 5.00%, 12/01/29 | | 2,500,000 | | 2,528,050 |
| Limited Tax, Various Purpose Improvement, Refunding, AGMC Insured, 5.00%, | | | | |
| 12/01/28 | | 3,000,000 | | 3,071,850 |
| Toledo Sewer System Revenue, AMBAC Insured, 5.00%, | | | | |
| 11/15/22 | | 1,000,000 | | 1,030,720 |
| 11/15/23 | | 1,000,000 | | 1,025,810 |
| Toledo Special Obligation, Industrial Development, Vehicle Storage Project, AMBAC Insured, | | | | |
| 5.25%, 12/01/26 | | 1,500,000 | | 1,545,570 |
| Toledo Waterworks Revenue, NATL Insured, 5.00%, 11/15/30 | | 6,425,000 | | 6,526,643 |
| Trenton Water System Revenue, Improvement, AGMC Insured, 5.125%, 12/01/34 | | 2,750,000 | | 2,804,642 |
| Tri-Valley Local School District GO, | | | | |
| FGIC Insured, Pre-Refunded, 5.25%, 12/01/29 | | 7,225,000 | | 7,639,932 |
| NATL RE, FGIC Insured, Pre-Refunded, 5.25%, 12/01/29 | | 1,305,000 | | 1,379,946 |
| Trotwood-Madison City School District GO, School Improvement, FGIC Insured, Pre-Refunded, | | | | |
| 5.375%, 12/01/22 | | 1,685,000 | | 1,824,097 |
| Trumbull County GO, Refunding, NATL Insured, 5.20%, 12/01/20 | | 1,475,000 | | 1,533,322 |
| Twinsburg GO, | | | | |
| Golf Course, Refunding, FGIC Insured, Pre-Refunded, 5.00%, 12/01/21 | | 1,000,000 | | 1,034,380 |
| Park Land and Conservation, NATL RE, FGIC Insured, Pre-Refunded, 5.00%, 12/01/21 | | 1,000,000 | | 1,034,380 |
| Union County GO, NATL Insured, Pre-Refunded, 5.00%, 12/01/33 | | 2,895,000 | | 3,214,347 |
| University of Akron General Receipts Revenue, | | | | |
| NATL RE, FGIC Insured, 4.75%, 1/01/25 | | 1,080,000 | | 1,084,752 |
| NATL RE, FGIC Insured, 5.00%, 1/01/28 | | 1,475,000 | | 1,477,980 |
| NATL RE, FGIC Insured, 5.00%, 1/01/35 | | 5,250,000 | | 5,037,900 |
| Series A, AGMC Insured, 5.00%, 1/01/33 | | 6,030,000 | | 6,046,884 |
| Series B, AGMC Insured, 5.00%, 1/01/38 | | 19,000,000 | | 18,532,790 |
| University of Cincinnati COP, Jefferson Avenue Residence Hall, NATL Insured, 5.125%, | | | | |
| 6/01/28 | | 6,620,000 | | 6,619,470 |
| University of Cincinnati General Receipts Revenue, | | | | |
| AMBAC Insured, 5.00%, 6/01/31 | | 1,350,000 | | 1,351,013 |
| Refunding, Series F, 5.00%, 6/01/32 | | 5,805,000 | | 5,766,977 |
| Refunding, Series F, 5.00%, 6/01/34 | | 5,000,000 | | 4,845,950 |
| Refunding, Series G, NATL Insured, 5.00%, 6/01/28 | | 8,575,000 | | 8,711,685 |
| Series A, AMBAC Insured, 5.00%, 6/01/23 | | 1,845,000 | | 1,913,025 |
| Series A, AMBAC Insured, 5.00%, 6/01/24 | | 1,940,000 | | 1,997,172 |
| Series A, AMBAC Insured, 5.00%, 6/01/25 | | 2,005,000 | | 2,054,283 |
| Series C, AGMC Insured, 5.00%, 6/01/31 | | 8,000,000 | | 8,096,320 |
| Series C, Assured Guaranty, 5.00%, 6/01/30 | | 1,500,000 | | 1,524,330 |
| Series G, NATL Insured, 5.00%, 6/01/29 | | 3,410,000 | | 3,450,613 |
| University of Toledo General Receipts Revenue, Refunding, Series A, AMBAC Insured, 4.50%, | | | | |
| 6/01/30 | | 10,000,000 | | 9,330,100 |
| Upper Scioto Valley Local School District GO, School Facilities Construction and Improvement, | | | | |
| NATL RE, FGIC Insured, 5.25%, 12/01/25 | | 1,160,000 | | 1,134,294 |
154 | Annual Report
| | | | |
| Franklin Tax-Free Trust | | | | |
| |
| Statement of Investments, February 28, 2011 (continued) | | | | |
| |
| |
| Franklin Ohio Tax-Free Income Fund | | Principal Amount | | Value |
| Municipal Bonds (continued) | | | | |
| Ohio (continued) | | | | |
| Van Wert City School District GO, School Improvement, | | | | |
| FGIC Insured, Pre-Refunded, 5.00%, 12/01/27 | $ | 3,295,000 | $ | 3,539,588 |
| FGIC Insured, Pre-Refunded, 5.00%, 12/01/30 | | 2,500,000 | | 2,685,575 |
| NATL RE, FGIC Insured, Pre-Refunded, 5.00%, 12/01/27 | | 1,510,000 | | 1,622,087 |
| Warren City School District GO, School Improvement, NATL RE, FGIC Insured, 5.00%, | | | | |
| 12/01/28 | | 3,000,000 | | 3,072,810 |
| Waterville GO, Refunding, NATL Insured, 5.05%, 12/01/26 | | 1,085,000 | | 1,103,217 |
| West Chester Township GO, AMBAC Insured, Pre-Refunded, 5.00%, 12/01/25 | | 1,500,000 | | 1,552,155 |
| Westerville City School District GO, Refunding, XLCA Insured, 5.00%, 12/01/27 | | 3,820,000 | | 3,974,099 |
| Wheelersburg Local School District GO, School Improvement, AGMC Insured, 5.00%, | | | | |
| 12/01/32 | | 1,400,000 | | 1,425,046 |
| Youngstown State University General Receipts Revenue, Assured Guaranty, | | | | |
| 5.25%, 12/15/29 | | 4,000,000 | | 4,152,000 |
| 5.50%, 12/15/33 | | 4,225,000 | | 4,366,495 |
| Zanesville City School District GO, School Improvement, NATL Insured, | | | | |
| 4.75%, 12/01/22 | | 5,500,000 | | 5,657,410 |
| 4.75%, 12/01/26 | | 3,250,000 | | 3,304,372 |
| 5.05%, 12/01/29 | | 3,500,000 | | 3,569,405 |
| | | | | 1,469,009,956 |
| U.S. Territories 5.4% | | | | |
| Puerto Rico 4.0% | | | | |
| Puerto Rico Commonwealth GO, Public Improvement, Series A, FGIC Insured, Pre-Refunded, | | | | |
| 5.00%, 7/01/32 | | 10,000,000 | | 10,607,100 |
| Puerto Rico Commonwealth Government Development Bank Revenue, Refunding, NATL | | | | |
| Insured, 4.75%, 12/01/15 | | 6,500,000 | | 6,546,085 |
| Puerto Rico Commonwealth Highway and Transportation Authority Transportation Revenue, | | | | |
| Refunding, Series N, AGMC Insured, 5.50%, 7/01/29 | | 14,000,000 | | 14,291,620 |
| Puerto Rico Electric Power Authority Power Revenue, Refunding, Series VV, NATL RE, | | | | |
| FGIC Insured, 5.25%, 7/01/30 | | 5,000,000 | | 4,771,850 |
| Puerto Rico Municipal Finance Agency GO, Series A, AGMC Insured, 5.75%, 8/01/12 | | 3,500,000 | | 3,529,680 |
| Puerto Rico Public Finance Corp. Revenue, Commonwealth Appropriation, Series E, ETM, | | | | |
| 6.00%, 8/01/26 | | 9,140,000 | | 11,097,331 |
| Puerto Rico Sales Tax FICO Sales Tax Revenue, Capital Appreciation, | | | | |
| Refunding, Series A, NATL Insured, zero cpn., 8/01/43 | | 50,000,000 | | 5,582,500 |
| Refunding, Series A, NATL Insured, zero cpn., 8/01/44 | | 47,550,000 | | 4,945,676 |
| Series A, AMBAC Insured, zero cpn., 8/01/54 | | 20,000,000 | | 1,026,000 |
| | | | | 62,397,842 |
| U.S. Virgin Islands 1.4% | | | | |
| Virgin Islands PFAR, Matching Fund Loan Note, senior lien, AGMC Insured, 5.00%, | | | | |
| 10/01/29 | | 23,340,000 | | 22,787,309 |
| Total U.S. Territories | | | | 85,185,151 |
| Total Municipal Bonds before Short Term Investments | | | | |
| (Cost $1,565,365,500) | | | | 1,554,195,107 |
Annual Report | 155
Franklin Tax-Free Trust
Statement of Investments, February 28, 2011 (continued)
| | | | |
| Franklin Ohio Tax-Free Income Fund | | Principal Amount | | Value |
| Short Term Investments 0.2% | | | | |
| Municipal Bonds 0.2% | | | | |
| Ohio 0.2% | | | | |
| aCuyahoga County Revenue, Cleveland Clinic Health System Obligated Group, Series B, | | | | |
| Sub Series B-1, Daily VRDN and Put, 0.18%, 1/01/39 | $ | 3,000,000 | $ | 3,000,000 |
| Sub Series B-3, Daily VRDN and Put, 0.18%, 1/01/39 | | 300,000 | | 300,000 |
| Total Short Term Investments (Cost $3,300,000) | | | | 3,300,000 |
| Total Investments (Cost $1,568,665,500) 99.3% | | | | 1,557,495,107 |
| Other Assets, less Liabilities 0.7% | | | | 10,863,465 |
| Net Assets 100.0% | | | $ | 1,568,358,572 |
See Abbreviations on page 205.
aVariable rate demand notes (VRDNs) are tax-exempt obligations which contain a floating or variable interest rate adjustment formula and an unconditional right of demand to receive payment of the principal balance plus accrued interest at specified dates. The coupon rate shown represents the rate at period end.
156 | The accompanying notes are an integral part of these financial statements. | Annual Report
| | | | | | | | | | | | | | | |
| Franklin Tax-Free Trust | | | | | | | | | | | | | | | |
| Financial Highlights | | | | | | | | | | | | | | | |
| |
| Franklin Oregon Tax-Free Income Fund | | | | | | | | | | | | | | | |
| | | | | | Year Ended February 28, | | | | |
| Class A | | 2011 | | | 2010 | | | 2009 | | | 2008 | a | | 2007 | |
| Per share operating performance | | | | | | | | | | | | | | | |
| (for a share outstanding throughout the year) | | | | | | | | | | | | | | | |
| Net asset value, beginning of year | $ | 11.87 | | $ | 11.21 | | $ | 11.25 | | $ | 11.93 | | $ | 11.89 | |
| Income from investment operationsb: | | | | | | | | | | | | | | | |
| Net investment incomec | | 0.49 | | | 0.49 | | | 0.50 | | | 0.49 | | | 0.48 | |
| Net realized and unrealized gains (losses) | | (0.37 | ) | | 0.66 | | | (0.06 | ) | | (0.69 | ) | | 0.04 | |
| Total from investment operations | | 0.12 | | | 1.15 | | | 0.44 | | | (0.20 | ) | | 0.52 | |
| Less distributions from net investment income | | (0.51 | ) | | (0.49 | ) | | (0.48 | ) | | (0.48 | ) | | (0.48 | ) |
| Redemption feesd | | — | | | — | | | —e | | | —e | | | —e | |
| Net asset value, end of year | $ | 11.48 | | $ | 11.87 | | $ | 11.21 | | $ | 11.25 | | $ | 11.93 | |
| |
| Total returnf | | 0.94 | % | | 10.47 | % | | 4.02 | % | | (1.74 | )% | | 4.53 | % |
| |
| Ratios to average net assets | | | | | | | | | | | | | | | |
| Expenses | | 0.63 | % | | 0.64 | % | | 0.64 | % | | 0.64 | % | | 0.65 | % |
| Net investment income | | 4.11 | % | | 4.26 | % | | 4.40 | % | | 4.17 | % | | 4.19 | % |
| |
| Supplemental data | | | | | | | | | | | | | | | |
| Net assets, end of year (000’s) | $ | 946,755 | | $ | 954,860 | | $ | 787,595 | | $ | 719,647 | | $ | 686,892 | |
| Portfolio turnover rate | | 8.19 | % | | 9.79 | % | | 10.00 | % | | 5.30 | % | | 4.86 | % |
|
| aFor the year ended February 29. |
| bThe amount shown for a share outstanding throughout the period may not correlate with the Statement of Operations for the period due to the timing of sales and repurchases of |
| the Fund shares in relation to income earned and/or fluctuating market value of the investments of the Fund. |
| cBased on average daily shares outstanding. |
| dEffective September 1, 2008, the redemption fee was eliminated. |
| eAmount rounds to less than $0.01 per share. |
| fTotal return does not reflect sales commissions or contingent deferred sales charges, if applicable. |
Annual Report | The accompanying notes are an integral part of these financial statements. | 157
| | | | | | | | | | | | | | | |
| Franklin Tax-Free Trust | | | | | | | | | | | | | | | |
| Financial Highlights (continued) | | | | | | | | | | | | | | | |
| |
| Franklin Oregon Tax-Free Income Fund | | | | | | | | | | | | | | | |
| | | | | | Year Ended February 28, | | | | |
| Class C | | 2011 | | | 2010 | | | 2009 | | | 2008 | a | | 2007 | |
| Per share operating performance | | | | | | | | | | | | | | | |
| (for a share outstanding throughout the year) | | | | | | | | | | | | | | | |
| Net asset value, beginning of year | $ | 12.00 | | $ | 11.33 | | $ | 11.36 | | $ | 12.05 | | $ | 12.00 | |
| Income from investment operationsb: | | | | | | | | | | | | | | | |
| Net investment incomec | | 0.43 | | | 0.44 | | | 0.44 | | | 0.43 | | | 0.43 | |
| Net realized and unrealized gains (losses) | | (0.37 | ) | | 0.66 | | | (0.05 | ) | | (0.70 | ) | | 0.04 | |
| Total from investment operations | | 0.06 | | | 1.10 | | | 0.39 | | | (0.27 | ) | | 0.47 | |
| Less distributions from net investment income | | (0.44 | ) | | (0.43 | ) | | (0.42 | ) | | (0.42 | ) | | (0.42 | ) |
| Redemption feesd | | — | | | — | | | —e | | | —e | | | —e | |
| Net asset value, end of year | $ | 11.62 | | $ | 12.00 | | $ | 11.33 | | $ | 11.36 | | $ | 12.05 | |
| |
| Total returnf | | 0.44 | % | | 9.85 | % | | 3.50 | % | | (2.34 | )% | | 3.99 | % |
| |
| Ratios to average net assets | | | | | | | | | | | | | | | |
| Expenses | | 1.18 | % | | 1.19 | % | | 1.19 | % | | 1.19 | % | | 1.20 | % |
| Net investment income | | 3.56 | % | | 3.71 | % | | 3.85 | % | | 3.62 | % | | 3.64 | % |
| |
| Supplemental data | | | | | | | | | | | | | | | |
| Net assets, end of year (000’s) | $ | 196,909 | | $ | 195,473 | | $ | 123,099 | | $ | 96,802 | | $ | 91,743 | |
| Portfolio turnover rate | | 8.19 | % | | 9.79 | % | | 10.00 | % | | 5.30 | % | | 4.86 | % |
|
| aFor the year ended February 29. |
| bThe amount shown for a share outstanding throughout the period may not correlate with the Statement of Operations for the period due to the timing of sales and repurchases of |
| the Fund shares in relation to income earned and/or fluctuating market value of the investments of the Fund. |
| cBased on average daily shares outstanding. |
| dEffective September 1, 2008, the redemption fee was eliminated. |
| eAmount rounds to less than $0.01 per share. |
| fTotal return does not reflect sales commissions or contingent deferred sales charges, if applicable. |
158 | The accompanying notes are an integral part of these financial statements. | Annual Report
| | | | | | |
| Franklin Tax-Free Trust | | | | | | |
| Financial Highlights (continued) | | | | | | |
| |
| Franklin Oregon Tax-Free Income Fund | | | | | | |
| | | Year Ended | |
| | | February 28, | |
| Advisor Class | | 2011 | | | 2010 | a |
| Per share operating performance | | | | | | |
| (for a share outstanding throughout the year) | | | | | | |
| Net asset value, beginning of year | $ | 11.87 | | $ | 11.44 | |
| Income from investment operationsb: | | | | | | |
| Net investment incomec | | 0.50 | | | 0.32 | |
| Net realized and unrealized gains (losses) | | (0.37 | ) | | 0.42 | |
| Total from investment operations | | 0.13 | | | 0.74 | |
| Less distributions from net investment income | | (0.52 | ) | | (0.31 | ) |
| Net asset value, end of year | $ | 11.48 | | $ | 11.87 | |
| |
| Total returnd | | 1.04 | % | | 6.49 | % |
| |
| Ratios to average net assetse | | | | | | |
| Expenses | | 0.53 | % | | 0.54 | % |
| Net investment income | | 4.21 | % | | 4.36 | % |
| |
| Supplemental data | | | | | | |
| Net assets, end of year (000’s) | $ | 14,482 | | $ | 6,412 | |
| Portfolio turnover rate | | 8.19 | % | | 9.79 | % |
|
| aFor the period July 15, 2009 (effective date) to February 28, 2010. |
| bThe amount shown for a share outstanding throughout the period may not correlate with the Statement of Operations for the period due to the timing of sales and repurchases of |
| the Fund shares in relation to income earned and/or fluctuating market value of the investments of the Fund. |
| cBased on average daily shares outstanding. |
| dTotal return is not annualized for periods less than one year. |
| eRatios are annualized for periods less than one year. |
Annual Report | The accompanying notes are an integral part of these financial statements. | 159
| | | | |
| Franklin Tax-Free Trust | | | | |
| |
| Statement of Investments, February 28, 2011 | | | | |
| |
| |
| Franklin Oregon Tax-Free Income Fund | | Principal Amount | | Value |
| Municipal Bonds 99.9% | | | | |
| Oregon 82.2% | | | | |
| Albany Water Revenue, Refunding, NATL RE, FGIC Insured, 5.00%, 8/01/33 | $ | 5,990,000 | $ | 5,863,311 |
| Beaverton School District GO, | | | | |
| AGMC Insured, 4.125%, 6/01/26 | | 1,315,000 | | 1,305,374 |
| Washington County School District No. 48J, Assured Guaranty, 5.00%, 6/01/31 | | 1,280,000 | | 1,318,259 |
| Washington County School District No. 48J, Assured Guaranty, 5.125%, 6/01/36 | | 1,000,000 | | 1,011,650 |
| Benton County Hospital Facilities Authority Revenue, Samaritan Health, Refunding, 5.125%, | | | | |
| 10/01/28 | | 1,525,000 | | 1,489,544 |
| Chemeketa Community College District GO, 5.00%, | | | | |
| 6/15/25 | | 1,500,000 | | 1,606,605 |
| 6/15/26 | | 2,615,000 | | 2,778,647 |
| Clackamas County Canby School District No. 86 GO, AGMC Insured, 5.00%, | | | | |
| 6/15/23 | | 1,000,000 | | 1,055,060 |
| 6/15/25 | | 1,000,000 | | 1,044,960 |
| Clackamas County Hospital Facility Authority Revenue, | | | | |
| Gross Willamette Falls Project, Refunding, 5.375%, 4/01/22 | | 2,125,000 | | 2,020,174 |
| Gross Willamette Falls Project, Refunding, 5.125%, 4/01/26 | | 1,000,000 | | 876,030 |
| Legacy Health System, Series A, 5.50%, 7/15/35 | | 6,525,000 | | 6,524,543 |
| Willamette Falls Hospital Project, 6.00%, 4/01/19 | | 1,000,000 | | 1,002,890 |
| Clackamas County Oregon Trail School District No. 46 GO, 5.00%, 6/15/32 | | 6,855,000 | | 6,994,294 |
| Clackamas County School District No. 12 North Clackamas GO, | | | | |
| Series A, AGMC Insured, 4.75%, 6/15/31 | | 2,250,000 | | 2,266,875 |
| Series B, AGMC Insured, zero cpn. to 6/15/11, 5.00% thereafter, 6/15/27 | | 25,000,000 | | 25,341,750 |
| Clackamas County School District No. 46 Oregon Trail GO, | | | | |
| Capital Appreciation, Refunding, zero cpn., 6/15/37 | | 12,130,000 | | 2,712,996 |
| Capital Appreciation, Refunding, zero cpn., 6/15/38 | | 12,495,000 | | 2,632,821 |
| Refunding, Series A, 5.00%, 6/15/28 | | 2,210,000 | | 2,299,505 |
| Refunding, Series A, 5.00%, 6/15/29 | | 2,655,000 | | 2,751,350 |
| Clackamas County School District No. 7J Lake Oswego GO, Refunding, AGMC Insured, 5.25%, | | | | |
| 6/01/25 | | 3,075,000 | | 3,528,870 |
| Clackamas Education Service District GO, AMBAC Insured, 4.125%, 6/01/36 | | 1,000,000 | | 861,520 |
| Columbia and Washington Counties School District NO. 47J Vernonia GO, 5.00%, 6/15/35 | | 5,175,000 | | 5,302,098 |
| Columbia Gorge Community College District GO, NATL Insured, 5.00%, 6/15/22 | | 1,000,000 | | 1,060,770 |
| Coos County School District No. 13 GO, AGMC Insured, | | | | |
| 5.00%, 6/15/22 | | 55,000 | | 56,365 |
| Pre-Refunded, 5.00%, 6/15/22 | | 2,465,000 | | 2,608,019 |
| The Dalles GO, Refunding, Assured Guaranty, 5.00%, 6/01/29 | | 1,600,000 | | 1,671,296 |
| Deschutes and Jefferson Counties School District No. 2J Redmond GO, | | | | |
| 5.50%, 6/15/34 | | 5,000,000 | | 5,272,300 |
| Series A, NATL RE, FGIC Insured, 5.00%, 6/15/21 | | 1,000,000 | | 1,055,310 |
| Deschutes County Administrative School District No. 1 GO, Series A, AGMC Insured, | | | | |
| Pre-Refunded, 5.125%, 6/15/21 | | 3,500,000 | | 3,547,565 |
| Deschutes County Hospital Facilities Authority Hospital Revenue, Cascade Healthcare, | | | | |
| Refunding, 8.25%, 1/01/38 | | 20,000,000 | | 23,658,800 |
| Series B, AMBAC Insured, 5.375%, 1/01/35 | | 7,000,000 | | 6,766,830 |
| Emerald Peoples Utility District Revenue, Refunding, Series A, AGMC Insured, 5.25%, | | | | |
| 11/01/21 | | 1,000,000 | | 1,067,670 |
| Eugene Electric Utility Revenue, Refunding, 5.00%, 8/01/33 | | 10,060,000 | | 10,146,315 |
160 | Annual Report
| | | | | |
| | Franklin Tax-Free Trust | | | | |
| |
| | Statement of Investments, February 28, 2011 (continued) | | | | |
| |
| |
| | Franklin Oregon Tax-Free Income Fund | | Principal Amount | | Value |
| | Municipal Bonds (continued) | | | | |
| | Oregon (continued) | | | | |
| | Forest Grove Revenue, Campus Improvement, Pacific University Project, Refunding, | | | | |
| | 6.00%, 5/01/30 | $ | 4,000,000 | $ | 3,919,400 |
| | 6.375%, 5/01/39 | | 12,000,000 | | 12,013,920 |
| | Gresham Stormwater Revenue, FGIC Insured, Pre-Refunded, 5.30%, 5/01/21 | | 1,190,000 | | 1,199,675 |
| | High Desert Education Service District GO, AMBAC Insured, 4.50%, 6/01/30 | | 1,010,000 | | 907,919 |
| | Hillsboro GO, AMBAC Insured, 5.00%, 6/01/29 | | 5,360,000 | | 5,452,621 |
| | Hillsboro Hospital Facility Authority Revenue, Hospital Tuality Healthcare Project, Radian | | | | |
| | Insured, 5.375%, | | | | |
| | 10/01/26 | | 2,000,000 | | 1,878,360 |
| | 10/01/31 | | 2,000,000 | | 1,788,180 |
| | Independence GO, City Hall Project, AGMC Insured, 5.00%, | | | | |
| | 6/15/35 | | 2,110,000 | | 2,101,011 |
| | 6/15/40 | | 3,975,000 | | 3,920,542 |
| | Jackson County Airport Revenue, Series A, XLCA Insured, 5.25%, | | | | |
| | 12/01/27 | | 1,000,000 | | 965,360 |
| | 12/01/32 | | 1,000,000 | | 915,130 |
| | 12/01/37 | | 1,475,000 | | 1,308,753 |
| | Jackson County School District No. 4 GO, AGMC Insured, | | | | |
| | 5.00%, 6/15/20 | | 1,450,000 | | 1,461,832 |
| Pre | -Refunded, 5.00%, 6/15/20 | | 550,000 | | 557,359 |
| | Jackson County School District No. 549C Medford GO, | | | | |
| | 5.00%, 6/15/33 | | 3,225,000 | | 3,275,923 |
| | 5.00%, 6/15/34 | | 5,000,000 | | 5,051,300 |
| | Series B, AGMC Insured, 5.00%, 12/15/32 | | 5,765,000 | | 5,877,475 |
| | Jackson County School District No. 6 Central Point GO, Refunding, AGMC Insured, 4.75%, | | | | |
| | 6/15/20 | | 2,005,000 | | 2,105,511 |
| | Jackson County School District No. 9 Eagle Point GO, Pre-Refunded, 5.00%, | | | | |
| | 6/15/20 | | 1,680,000 | | 1,702,478 |
| | 6/15/21 | | 1,500,000 | | 1,520,070 |
| | Keizer Special Assessment, Keizer Station Area A Local, 5.20%, 6/01/31 | | 3,170,000 | | 3,183,029 |
| | Klamath Falls Intercommunity Hospital Authority Revenue, Merle West Medical Center Project, | | | | |
| Pre | -Refunded, 6.25%, 9/01/31 | | 3,290,000 | | 3,600,839 |
| | Refunding, 6.25%, 9/01/31 | | 1,960,000 | | 1,694,577 |
| | Refunding, Assured Guaranty, 5.00%, 9/01/36 | | 5,000,000 | | 4,205,200 |
| | Lake Oswego GO, Refunding, Series A, 5.00%, 12/01/31 | | 6,400,000 | | 6,653,696 |
| | Lane and Douglas Counties School District No. 45J3 GO, South Lane District, Refunding, | | | | |
| | AGMC Insured, 4.75%, 6/15/25 | | 3,510,000 | | 3,546,785 |
| | Lane County GO, Series A, 5.00%, | | | | |
| | 11/01/27 | | 1,650,000 | | 1,729,035 |
| | 11/01/28 | | 1,240,000 | | 1,291,212 |
| | Lane County Metropolitan Wastewater Management Commission Revenue, | | | | |
| | 5.25%, 11/01/28 | | 5,000,000 | | 5,230,550 |
| | NATL RE, FGIC Insured, 4.75%, 11/01/26 | | 1,615,000 | | 1,645,394 |
| | Lane County School District No. 19 Springfield GO, AGMC Insured, zero cpn., | | | | |
| | 6/15/27 | | 5,580,000 | | 2,371,388 |
| | 6/15/28 | | 2,000,000 | | 793,400 |
| | 6/15/29 | | 1,925,000 | | 713,347 |
Annual Report | 161
| | | | |
| Franklin Tax-Free Trust | | | | |
| |
| Statement of Investments, February 28, 2011 (continued) | | | | |
| |
| |
| Franklin Oregon Tax-Free Income Fund | | Principal Amount | | Value |
| Municipal Bonds (continued) | | | | |
| Oregon (continued) | | | | |
| Lane County School District No. 52 Bethel GO, Refunding, AGMC Insured, 5.00%, | | | | |
| 6/15/20 | $ | 5,700,000 | $ | 5,850,936 |
| Lebanon GO, AMBAC Insured, 5.00%, | | | | |
| 6/01/25 | | 1,635,000 | | 1,707,005 |
| 6/01/27 | | 1,675,000 | | 1,731,096 |
| Linn County Community School District No. 9 GO, Lebanon, FGIC Insured, Pre-Refunded, | | | | |
| 5.55%, 6/15/21 | | 1,155,000 | | 1,275,813 |
| 5.60%, 6/15/30 | | 9,495,000 | | 10,498,906 |
| Linn County School District No. 55 GO, Sweet Home, AGMC Insured, Pre-Refunded, 5.00%, | | | | |
| 6/15/29 | | 1,000,000 | | 1,013,380 |
| Medford Hospital Facilities Authority Revenue, Asante Health System, | | | | |
| Refunding, Assured Guaranty, 5.125%, 8/15/40 | | 25,000,000 | | 23,709,250 |
| Series A, Assured Guaranty, 5.00%, 8/15/40 | | 10,050,000 | | 9,198,061 |
| Multnomah County Hospital Facilities Authority Revenue, Adventis Health System-West, | | | | |
| Series A, 5.125%, 9/01/40 | | 5,500,000 | | 5,193,045 |
| Multnomah County School District No. 7 Reynolds GO, Refunding, 5.00%, 6/01/35 | | 6,605,000 | | 6,623,890 |
| Multnomah-Clackamas Counties Centennial School District No. 28-302 GO, FGIC Insured, | | | | |
| Pre-Refunded, 5.00%, 6/15/21 | | 5,000,000 | | 5,066,900 |
| Multnomah-Clackamas Counties Centennial School District No. 28-JT GO, Capital | | | | |
| Appreciation, AMBAC Insured, zero cpn., 6/01/16 | | 2,260,000 | | 1,829,719 |
| Northern Wasco County Peoples Utilities District Hydroelectric Revenue, McNary Dam Fishway | | | | |
| Project, 5.20%, 12/01/24 | | 5,000,000 | | 5,012,800 |
| Ontario Hospital Facility Authority Revenue, Trinity Health, Series E, 5.00%, 12/01/37 | | 6,460,000 | | 6,139,842 |
| Oregon Coast Community College District GO, NATL Insured, 5.00%, 6/15/23 | | 3,745,000 | | 3,962,922 |
| Oregon Health and Science University Revenue, | | | | |
| Capital Appreciation, Refunding, Series A, NATL Insured, zero cpn., 7/01/21 | | 11,480,000 | | 6,868,714 |
| Series A, 5.875%, 7/01/33 | | 2,500,000 | | 2,561,750 |
| Series A, 5.75%, 7/01/39 | | 13,175,000 | | 13,303,983 |
| Series A, NATL Insured, 5.00%, 7/01/32 | | 24,750,000 | | 23,775,840 |
| Oregon State Department of Administrative Services COP, | | | | |
| AGMC Insured, 4.625%, 5/01/30 | | 7,795,000 | | 7,548,912 |
| Refunding, Series B, AGMC Insured, 5.00%, 5/01/21 | | 1,805,000 | | 1,876,496 |
| Refunding, Series B, AMBAC Insured, 5.00%, 5/01/26 | | 7,500,000 | | 7,595,100 |
| Series A, 5.25%, 5/01/39 | | 3,800,000 | | 3,783,090 |
| Series A, AGMC Insured, 5.00%, 5/01/23 | | 2,695,000 | | 2,776,389 |
| Series A, AGMC Insured, 5.00%, 5/01/30 | | 13,205,000 | | 13,263,102 |
| Series B, NATL RE, FGIC Insured, 5.00%, 11/01/30 | | 20,100,000 | | 20,198,088 |
| Series C, 5.00%, 11/01/34 | | 8,000,000 | | 7,847,120 |
| Oregon State Department of Administrative Services Lottery Revenue, | | | | |
| Oregon Administration, Lottery, Series A, AGMC Insured, 5.00%, 4/01/25 | | 5,000,000 | | 5,248,000 |
| Oregon Administration, Lottery, Series A, AGMC Insured, 5.00%, 4/01/27 | | 2,000,000 | | 2,081,700 |
| Series A, 5.00%, 4/01/27 | | 17,880,000 | | 18,813,157 |
| Series A, 5.00%, 4/01/28 | | 18,225,000 | | 19,061,892 |
| Series A, 5.00%, 4/01/29 | | 1,750,000 | | 1,819,475 |
162 | Annual Report
| | | | |
| Franklin Tax-Free Trust | | | | |
| |
| Statement of Investments, February 28, 2011 (continued) | | | | |
| |
| |
| Franklin Oregon Tax-Free Income Fund | | Principal Amount | | Value |
| Municipal Bonds (continued) | | | | |
| Oregon (continued) | | | | |
| Oregon State Department of Transportation Highway User Tax Revenue, | | | | |
| Refunding, Series A, 5.00%, 11/15/25 | $ | 1,295,000 | $ | 1,351,734 |
| Refunding, Series A, 5.00%, 11/15/29 | | 3,330,000 | | 3,374,622 |
| senior lien, Series A, 5.00%, 11/15/29 | | 3,085,000 | | 3,168,295 |
| senior lien, Series A, 4.50%, 11/15/32 | | 21,000,000 | | 19,991,790 |
| senior lien, Series A, 5.00%, 11/15/33 | | 10,850,000 | | 10,878,101 |
| Series A, 5.00%, 11/15/28 | | 15,000,000 | | 15,252,000 |
| Series A, Pre-Refunded, 5.125%, 11/15/23 | | 5,000,000 | | 5,390,050 |
| Oregon State EDR, Georgia-Pacific Corp. Project, Series CLVII, 6.35%, 8/01/25 | | 7,910,000 | | 7,909,051 |
| Oregon State Facilities Authority Revenue, | | | | |
| College Inn Student Housing Project, senior lien, Series A, XLCA Insured, 5.00%, 7/01/35 | | 3,660,000 | | 2,635,895 |
| Legacy Health System, Refunding, Series A, 5.00%, 3/15/30 | | 1,500,000 | | 1,439,490 |
| Limited College Project, Refunding, Series A, 5.00%, 10/01/31 | | 2,000,000 | | 1,889,380 |
| Limited College Project, Refunding, Series A, 5.00%, 10/01/34 | | 1,000,000 | | 921,950 |
| Limited College Project, Refunding, Series A, 5.25%, 10/01/40 | | 2,250,000 | | 2,099,880 |
| Peacehealth, Refunding, Series A, 5.00%, 11/01/39 | | 32,050,000 | | 29,380,876 |
| aReed College Project, Refunding, Series A, 5.00%, 7/01/29 | | 1,500,000 | | 1,562,325 |
| aReed College Project, Refunding, Series A, 4.75%, 7/01/32 | | 2,000,000 | | 2,005,860 |
| aReed College Project, Refunding, Series A, 5.125%, 7/01/41 | | 10,000,000 | | 10,099,000 |
| Samaritan Health Services, Refunding, Series A, 5.25%, 10/01/40 | | 7,500,000 | | 7,050,375 |
| University of Portland Projects, Series A, 5.00%, 4/01/32 | | 6,545,000 | | 6,077,687 |
| Willamette University Projects, Series A, NATL RE, FGIC Insured, Pre-Refunded, 5.00%, | | | | |
| 10/01/35 | | 5,210,000 | | 5,998,794 |
| Oregon State GO, | | | | |
| Alternative Energy Project, Series B, 6.00%, 10/01/26 | | 1,680,000 | | 1,907,119 |
| Elderly and Disabled Housing, Series A, 6.00%, 8/01/15 | | 755,000 | | 755,929 |
| Elderly and Disabled Housing, Series A, 6.00%, 8/01/21 | | 375,000 | | 375,259 |
| Elderly and Disabled Housing, Series A, 5.375%, 8/01/28 | | 1,270,000 | | 1,245,324 |
| Elderly and Disabled Housing, Series A, 4.70%, 8/01/42 | | 3,150,000 | | 2,671,043 |
| Elderly and Disabled Housing, Series B, 6.10%, 8/01/17 | | 1,185,000 | | 1,186,078 |
| Elderly and Disabled Housing, Series B, 6.25%, 8/01/23 | | 1,690,000 | | 1,691,352 |
| State Board of Higher Education, Refunding, Series A, 5.00%, 8/01/30 | | 1,705,000 | | 1,750,353 |
| State Board of Higher Education, Refunding, Series A, 4.50%, 8/01/37 | | 1,500,000 | | 1,405,260 |
| State Board of Higher Education, Refunding, Series A, 5.00%, 8/01/38 | | 6,225,000 | | 6,371,785 |
| State Board of Higher Education, Refunding, Series B, 5.00%, 8/01/38 | | 1,500,000 | | 1,535,370 |
| State Board of Higher Education, Refunding, Series E, 5.00%, 8/01/29 | | 7,745,000 | | 7,932,274 |
| State Board of Higher Education, Series A, 5.00%, 8/01/31 | | 1,695,000 | | 1,748,376 |
| State Board of Higher Education, Series A, 5.00%, 8/01/34 | | 5,000,000 | | 5,168,600 |
| State Board of Higher Education, Series A, 5.00%, 8/01/36 | | 2,715,000 | | 2,749,535 |
| State Board of Higher Education, Series A, 5.00%, 8/01/37 | | 5,555,000 | | 5,643,047 |
| State Board of Higher Education, Series A, Pre-Refunded, 5.00%, 8/01/31 | | 2,000,000 | | 2,038,420 |
| State Board of Higher Education, Series A, Pre-Refunded, 5.00%, 8/01/35 | | 6,000,000 | | 6,945,420 |
| State Board of Higher Education, Series B, 5.00%, 8/01/38 | | 5,000,000 | | 5,117,900 |
| State Board of Higher Education, Series C, 5.00%, 8/01/37 | | 1,115,000 | | 1,132,673 |
| Veterans’ Welfare, Series 92B, 4.625%, 12/01/38 | | 5,330,000 | | 4,840,866 |
Annual Report | 163
| | | | |
| Franklin Tax-Free Trust | | | | |
| |
| Statement of Investments, February 28, 2011 (continued) | | | | |
| |
| |
| Franklin Oregon Tax-Free Income Fund | | Principal Amount | | Value |
| Municipal Bonds (continued) | | | | |
| Oregon (continued) | | | | |
| Oregon State Health Housing Educational and Cultural Facilities Authority Revenue, | | | | |
| Peacehealth, AMBAC Insured, 5.00%, 11/15/26 | $ | 5,500,000 | $ | 5,509,350 |
| Reed College Project, Series A, 5.75%, 7/01/32 | | 10,735,000 | | 10,903,969 |
| Oregon State Housing and Community Services Department Mortgage Revenue, SFM Program, | | | | |
| Refunding, Series G, 5.35%, 7/01/30 | | 5,350,000 | | 5,432,069 |
| Series C, 4.75%, 7/01/42 | | 5,920,000 | | 5,509,862 |
| Philomath School District No. 17J Benton and Polk Counties GO, Series B, zero cpn., | | | | |
| 6/15/31 | | 1,000,000 | | 351,620 |
| Port Astoria PCR, James River Project, Refunding, 6.55%, 2/01/15 | | 945,000 | | 948,175 |
| Port of Portland International Airport Revenue, | | | | |
| Portland International Airport, Refunding, Series D, NATL RE, FGIC Insured, 5.00%, | | | | |
| 7/01/23 | | 3,000,000 | | 3,003,990 |
| Portland International Airport, Series 7-B, NATL Insured, Pre-Refunded, 7.10%, | | | | |
| 7/01/21 | | 2,800,000 | | 2,944,228 |
| Series Nineteen, 5.50%, 7/01/38 | | 23,000,000 | | 23,639,860 |
| Portland Community College District GO, Series B, Pre-Refunded, 5.00%, 6/01/21 | | 6,290,000 | | 6,361,832 |
| Portland EDR, Broadway Project, Refunding, Series A, 6.50%, 4/01/35 | | 5,000,000 | | 5,353,050 |
| Portland GO, Limited Tax, | | | | |
| Series A, 5.00%, 6/01/24 | | 10,000,000 | | 10,025,500 |
| Series A, NATL Insured, 5.125%, 6/01/30 | | 6,315,000 | | 6,108,184 |
| Series B, zero cpn., 6/01/21 | | 1,000,000 | | 663,820 |
| Portland Housing Authority MFR, Housing, Lovejoy Station Apartments Project, NATL Insured, | | | | |
| 6.00%, 7/01/33 | | 2,000,000 | | 1,990,060 |
| Portland MFR, | | | | |
| Civic Stadium Housing Project, Series A, 6.00%, 3/01/17 | | 755,000 | | 757,945 |
| Housing Garden Park Estates Project, Series A, GNMA Secured, 5.875%, 3/20/37 | | 3,065,000 | | 3,038,641 |
| Portland River District Urban Renewal and Redevelopment Revenue, Series A, AMBAC | | | | |
| Insured, 5.00%, 6/15/21 | | 3,000,000 | | 3,087,780 |
| Portland Sewer System Revenue, | | | | |
| first lien, Series A, AGMC Insured, 5.00%, 10/01/24 | | 6,235,000 | | 6,553,234 |
| second lien, Refunding, Series A, AGMC Insured, 5.00%, 6/01/23 | | 2,500,000 | | 2,602,650 |
| second lien, Series A, 5.00%, 3/01/34 | | 25,270,000 | | 25,561,868 |
| second lien, Series B, NATL Insured, 5.00%, 6/15/28 | | 5,105,000 | | 5,316,041 |
| Portland Urban Renewal and Redevelopment Revenue, Interstate Corridor, Refunding, | | | | |
| Series A, NATL RE, FGIC Insured, 5.00%, | | | | |
| 6/15/24 | | 1,295,000 | | 1,286,220 |
| 6/15/25 | | 2,385,000 | | 2,332,435 |
| Portland Urban Renewal and Redevelopment Tax Allocation, | | | | |
| Convention Center, Series A, AMBAC Insured, 5.50%, 6/15/20 | | 3,000,000 | | 3,038,640 |
| Lents Town Center, Series B, 5.00%, 6/15/27 | | 2,500,000 | | 2,501,650 |
| Lents Town Center, Series B, 5.00%, 6/15/28 | | 1,175,000 | | 1,164,178 |
| Lents Town Center, Series B, 4.75%, 6/15/29 | | 1,000,000 | | 936,030 |
| Lents Town Center, Series B, 5.00%, 6/15/30 | | 1,800,000 | | 1,760,634 |
| North Macadam, Series B, 5.00%, 6/15/29 | | 4,500,000 | | 4,420,305 |
| North Macadam, Series B, 5.00%, 6/15/30 | | 4,725,000 | | 4,593,598 |
164 | Annual Report
| | | | |
| Franklin Tax-Free Trust | | | | |
| |
| Statement of Investments, February 28, 2011 (continued) | | | | |
| |
| |
| Franklin Oregon Tax-Free Income Fund | | Principal Amount | | Value |
| Municipal Bonds (continued) | | | | |
| Oregon (continued) | | | | |
| Portland Water System Revenue, | | | | |
| NATL Insured, 4.50%, 10/01/27 | $ | 1,000,000 | $ | 1,005,850 |
| NATL Insured, 4.50%, 10/01/28 | | 3,895,000 | | 3,885,496 |
| second lien, Series A, NATL Insured, 4.375%, 10/01/25 | | 3,415,000 | | 3,440,954 |
| Redmond Airport GO, Terminal Expansion Project, 5.00%, 6/01/39 | | 1,000,000 | | 921,930 |
| Redmond Airport Revenue, 6.25%, 6/01/39 | | 1,010,000 | | 998,001 |
| Redmond GO, Series C, NATL Insured, 5.00%, 6/01/33 | | 1,260,000 | | 1,185,773 |
| Salem Hospital Facility Authority Revenue, | | | | |
| Salem Hospital Project, Series A, 5.00%, 8/15/27 | | 11,000,000 | | 10,687,380 |
| Salem Hospital Project, Series A, 5.00%, 8/15/36 | | 9,000,000 | | 8,082,000 |
| Series A, 5.75%, 8/15/23 | | 10,000,000 | | 10,595,300 |
| Salem-Keizer School District No. 24J GO, Series B, zero cpn., 6/15/30 | | 8,500,000 | | 2,870,280 |
| Southwestern Community College District GO, NATL Insured, Pre-Refunded, 5.00%, | | | | |
| 6/01/28 | | 1,100,000 | | 1,230,361 |
| Sunrise Water Authority Water Revenue, sub. lien, | | | | |
| Series B, XLCA Insured, 5.00%, 9/01/25 | | 1,160,000 | | 1,114,772 |
| XLCA Insured, 5.00%, 3/01/25 | | 1,660,000 | | 1,596,621 |
| Tillamook and Yamhill Counties School District No. 101 Nestucca Valley GO, AGMC Insured, | | | | |
| 5.00%, 6/15/25 | | 1,560,000 | | 1,636,409 |
| Tri-County Metropolitan Transportation District Revenue, Series A, 4.75%, 9/01/29 | | 15,305,000 | | 15,626,864 |
| Washington and Clackamas Counties Tigard-Tualatin School District No. 23J GO, NATL | | | | |
| Insured, Pre-Refunded, 5.00%, 6/15/22 | | 7,000,000 | | 7,401,450 |
| Washington Clackamas and Yamhill Counties School District No. 88J GO, | | | | |
| Deferred Interest, Series A, NATL Insured, zero cpn., 6/15/26 | | 6,850,000 | | 3,201,142 |
| Deferred Interest, Series A, NATL Insured, zero cpn., 6/15/29 | | 3,110,000 | | 1,195,080 |
| Deferred Interest, Series A, NATL Insured, zero cpn., 6/15/30 | | 3,260,000 | | 1,148,433 |
| Series A, NATL Insured, zero cpn., 6/15/27 | | 7,090,000 | | 3,107,689 |
| Sherwood, Series A, NATL Insured, zero cpn., 6/15/28 | | 2,960,000 | | 1,214,784 |
| Sherwood, Series A, NATL Insured, zero cpn., 12/15/31 | | 3,515,000 | | 1,123,746 |
| Sherwood, Series B, NATL Insured, 4.50%, 12/15/31 | | 2,900,000 | | 2,808,447 |
| Washington County Clean Water Services Sewer Revenue, senior lien, NATL RE, FGIC Insured, | | | | |
| 5.00%, 10/01/19 | | 3,905,000 | | 3,972,596 |
| Washington County GO, Obligations, | | | | |
| Refunding, 4.375%, 6/01/26 | | 1,000,000 | | 1,020,800 |
| Series A, Pre-Refunded, 5.00%, 6/01/26 | | 10,000,000 | | 10,114,200 |
| Washington County School District No. 48J Beaverton GO, Pre-Refunded, 5.00%, | | | | |
| 6/01/22 | | 4,155,000 | | 4,388,760 |
| Yamhill County McMinnville School District No. 40 GO, AGMC Insured, 5.00%, 6/15/28 | | 4,000,000 | | 4,179,360 |
| | | | | 951,459,044 |
| U.S. Territories 17.7% | | | | |
| Guam 0.3% | | | | |
| Guam Government Limited Obligation Revenue, Section 30, Series A, 5.625%, | | | | |
| 12/01/24 | | 840,000 | | 845,393 |
| 12/01/29 | | 3,250,000 | | 3,188,835 |
| | | | | 4,034,228 |
Annual Report | 165
| | | | |
| Franklin Tax-Free Trust | | | | |
| |
| Statement of Investments, February 28, 2011 (continued) | | | | |
| |
| |
| Franklin Oregon Tax-Free Income Fund | | Principal Amount | | Value |
| Municipal Bonds (continued) | | | | |
| U.S. Territories (continued) | | | | |
| Puerto Rico 17.3% | | | | |
| Children’s Trust Fund Puerto Rico Tobacco Settlement Revenue, Asset-Backed Bonds, | | | | |
| Refunding, 5.625%, 5/15/43 | $ | 10,000,000 | $ | 7,683,600 |
| Puerto Rico Commonwealth GO, | | | | |
| Public Improvement, Refunding, Series A, 5.50%, 7/01/32 | | 15,000,000 | | 14,505,450 |
| Public Improvement, Series A, 5.00%, 7/01/29 | | 10,000,000 | | 9,492,900 |
| Public Improvement, Series A, 5.125%, 7/01/31 | | 9,885,000 | | 9,890,140 |
| Public Improvement, Series A, 5.375%, 7/01/33 | | 10,000,000 | | 9,375,800 |
| Public Improvement, Series A, Pre-Refunded, 5.125%, 7/01/31 | | 5,115,000 | | 5,196,635 |
| Refunding, Series C, Sub Series C-7, NATL Insured, 6.00%, 7/01/28 | | 4,500,000 | | 4,622,895 |
| Puerto Rico Commonwealth Highway and Transportation Authority Highway Revenue, Series Y, | | | | |
| Pre-Refunded, 5.50%, 7/01/36 | | 13,000,000 | | 15,535,000 |
| Puerto Rico Commonwealth Highway and Transportation Authority Transportation Revenue, | | | | |
| Refunding, Series N, FGIC Insured, 5.25%, 7/01/39 | | 10,000,000 | | 8,702,700 |
| Series D, Pre-Refunded, 5.375%, 7/01/36 | | 10,000,000 | | 10,622,200 |
| Puerto Rico Convention Center District Authority Hotel Occupancy Tax Revenue, Series A, | | | | |
| AMBAC Insured, 5.00%, 7/01/31 | | 6,250,000 | | 5,574,875 |
| Puerto Rico Electric Power Authority Power Revenue, | | | | |
| Series II, AGMC Insured, Pre-Refunded, 5.125%, 7/01/26 | | 9,150,000 | | 9,805,232 |
| Series II, Pre-Refunded, 5.25%, 7/01/31 | | 12,000,000 | | 12,879,240 |
| Series RR, FGIC Insured, Pre-Refunded, 5.00%, 7/01/35 | | 10,000,000 | | 11,479,200 |
| Series WW, 5.25%, 7/01/33 | | 9,690,000 | | 8,892,222 |
| Puerto Rico PBA Guaranteed Revenue, Government Facilities, Refunding, Series M-3, NATL | | | | |
| Insured, 6.00%, 7/01/25 | | 15,000,000 | | 15,450,000 |
| Puerto Rico Public FICO Revenue, Commonwealth Appropriation, Series E, Pre-Refunded, | | | | |
| 5.50%, 8/01/29 | | 5,000,000 | | 5,227,400 |
| Puerto Rico Sales Tax FICO Sales Tax Revenue, | | | | |
| Capital Appreciation, first sub., Series A, zero cpn. to 8/01/16, 6.75% thereafter, | | | | |
| 8/01/32 | | 20,000,000 | | 16,187,200 |
| first sub., Series A, 5.375%, 8/01/39 | | 9,000,000 | | 8,271,090 |
| first sub., Series A, 6.50%, 8/01/44 | | 10,000,000 | | 10,392,700 |
| | | | | 199,786,479 |
| U.S. Virgin Islands 0.1% | | | | |
| Virgin Islands Water and Power Authority Electric System Revenue, Refunding, 5.30%, | | | | |
| 7/01/21 | | 1,400,000 | | 1,400,686 |
| Total U.S. Territories | | | | 205,221,393 |
| Total Municipal Bonds before Short Term Investments | | | | |
| (Cost $1,157,617,871) | | | | 1,156,680,437 |
166 | Annual Report
Franklin Tax-Free Trust
Statement of Investments, February 28, 2011 (continued)
| | | | | |
| Franklin Oregon Tax-Free Income Fund | | Principal Amount | | Value | |
| Short Term Investments 0.6% | | | | | |
| Municipal Bonds 0.6% | | | | | |
| Oregon 0.6% | | | | | |
| bMedford Hospital Facilities Authority Revenue, Rogue Valley Manor Project, | | | | | |
| Daily VRDN and Put, 0.21%, 8/15/37 | $ | 4,300,000 | $ | 4,300,000 | |
| Refunding, Daily VRDN and Put, 0.19%, 8/15/32 | | 1,500,000 | | 1,500,000 | |
| bOregon State Health Housing Educational and Cultural Facilities Authority Revenue, | | | | | |
| Peacehealth, Daily VRDN and Put, 0.18%, 12/01/15 | | 1,700,000 | | 1,700,000 | |
| Total Short Term Investments (Cost $7,500,000) | | | | 7,500,000 | |
| Total Investments (Cost $1,165,117,871) 100.5% | | | | 1,164,180,437 | |
| Other Assets, less Liabilities (0.5)% | | | | (6,034,537 | ) |
| Net Assets 100.0% | | | $ | 1,158,145,900 | |
See Abbreviations on page 205.
aSecurity purchased on a when-issued basis. See Note 1(b).
bVariable rate demand notes (VRDNs) are tax-exempt obligations which contain a floating or variable interest rate adjustment formula and an unconditional right of demand to receive payment of the principal balance plus accrued interest at specified dates. The coupon rate shown represents the rate at period end.
Annual Report | The accompanying notes are an integral part of these financial statements. | 167
| | | | | | | | | | | | | | | |
| Franklin Tax-Free Trust | | | | | | | | | | | | | | | |
| Financial Highlights | | | | | | | | | | | | | | | |
| |
| Franklin Pennsylvania Tax-Free Income Fund | | | | | | | | | | | | | | | |
| | | | | | Year Ended February 28, | | | | |
| Class A | | 2011 | | | 2010 | | | 2009 | | | 2008 | a | | 2007 | |
| Per share operating performance | | | | | | | | | | | | | | | |
| (for a share outstanding throughout the year) | | | | | | | | | | | | | | | |
| Net asset value, beginning of year | $ | 10.27 | | $ | 9.65 | | $ | 9.82 | | $ | 10.47 | | $ | 10.44 | |
| Income from investment operationsb: | | | | | | | | | | | | | | | |
| Net investment incomec | | 0.44 | | | 0.45 | | | 0.44 | | | 0.44 | | | 0.44 | |
| Net realized and unrealized gains (losses) | | (0.43 | ) | | 0.62 | | | (0.18 | ) | | (0.65 | ) | | 0.04 | |
| Total from investment operations | | 0.01 | | | 1.07 | | | 0.26 | | | (0.21 | ) | | 0.48 | |
| Less distributions from net investment income | | (0.45 | ) | | (0.45 | ) | | (0.43 | ) | | (0.44 | ) | | (0.45 | ) |
| Redemption feesd | | — | | | — | | | —e | | | —e | | | —e | |
| Net asset value, end of year | $ | 9.83 | | $ | 10.27 | | $ | 9.65 | | $ | 9.82 | | $ | 10.47 | |
| |
| Total returnf | | (0.02 | )% | | 11.22 | % | | 2.72 | % | | (2.16 | )% | | 4.71 | % |
| |
| Ratios to average net assets | | | | | | | | | | | | | | | |
| Expenses | | 0.64 | % | | 0.65 | % | | 0.65 | % | | 0.66 | % | | 0.66 | % |
| Net investment income | | 4.28 | % | | 4.43 | % | | 4.53 | % | | 4.24 | % | | 4.26 | % |
| |
| Supplemental data | | | | | | | | | | | | | | | |
| Net assets, end of year (000’s) | $ | 1,003,723 | | $ | 1,016,824 | | $ | 820,227 | | $ | 770,164 | | $ | 747,279 | |
| Portfolio turnover rate | | 13.15 | % | | 12.88 | % | | 11.50 | % | | 16.68 | % | | 6.99 | % |
|
| aFor the year ended February 29. |
| bThe amount shown for a share outstanding throughout the period may not correlate with the Statement of Operations for the period due to the timing of sales and repurchases of |
| the Fund shares in relation to income earned and/or fluctuating market value of the investments of the Fund. |
| cBased on average daily shares outstanding. |
| dEffective September 1, 2008, the redemption fee was eliminated. |
| eAmount rounds to less than $0.01 per share. |
| fTotal return does not reflect sales commissions or contingent deferred sales charges, if applicable. |
168 | The accompanying notes are an integral part of these financial statements. | Annual Report
| | | | | | | | | | | | | | | |
| Franklin Tax-Free Trust | | | | | | | | | | | | | | | |
| Financial Highlights (continued) | | | | | | | | | | | | | | | |
| |
| Franklin Pennsylvania Tax-Free Income Fund | | | | | | | | | | | | | | | |
| | | | | | Year Ended February 28, | | | | |
| Class B | | 2011 | | | 2010 | | | 2009 | | | 2008 | a | | 2007 | |
| Per share operating performance | | | | | | | | | | | | | | | |
| (for a share outstanding throughout the year) | | | | | | | | | | | | | | | |
| Net asset value, beginning of year | $ | 10.30 | | $ | 9.68 | | $ | 9.86 | | $ | 10.51 | | $ | 10.47 | |
| Income from investment operationsb: | | | | | | | | | | | | | | | |
| Net investment incomec | | 0.38 | | | 0.39 | | | 0.39 | | | 0.38 | | | 0.39 | |
| Net realized and unrealized gains (losses) | | (0.43 | ) | | 0.62 | | | (0.19 | ) | | (0.65 | ) | | 0.04 | |
| Total from investment operations | | (0.05 | ) | | 1.01 | | | 0.20 | | | (0.27 | ) | | 0.43 | |
| Less distributions from net investment income | | (0.39 | ) | | (0.39 | ) | | (0.38 | ) | | (0.38 | ) | | (0.39 | ) |
| Redemption feesd | | — | | | — | | | —e | | | —e | | | —e | |
| Net asset value, end of year | $ | 9.86 | | $ | 10.30 | | $ | 9.68 | | $ | 9.86 | | $ | 10.51 | |
| |
| Total returnf | | (0.58 | )% | | 10.58 | % | | 2.04 | % | | (2.68 | )% | | 4.22 | % |
| |
| Ratios to average net assets | | | | | | | | | | | | | | | |
| Expenses | | 1.19 | % | | 1.20 | % | | 1.20 | % | | 1.21 | % | | 1.21 | % |
| Net investment income | | 3.73 | % | | 3.88 | % | | 3.98 | % | | 3.69 | % | | 3.71 | % |
| |
| Supplemental data | | | | | | | | | | | | | | | |
| Net assets, end of year (000’s) | $ | 11,618 | | $ | 21,977 | | $ | 30,177 | | $ | 37,339 | | $ | 43,897 | |
| Portfolio turnover rate | | 13.15 | % | | 12.88 | % | | 11.50 | % | | 16.68 | % | | 6.99 | % |
|
| aFor the year ended February 29. |
| bThe amount shown for a share outstanding throughout the period may not correlate with the Statement of Operations for the period due to the timing of sales and repurchases of |
| the Fund shares in relation to income earned and/or fluctuating market value of the investments of the Fund. |
| cBased on average daily shares outstanding. |
| dEffective September 1, 2008, the redemption fee was eliminated. |
| eAmount rounds to less than $0.01 per share. |
| fTotal return does not reflect sales commissions or contingent deferred sales charges, if applicable. |
Annual Report | The accompanying notes are an integral part of these financial statements. | 169
| | | | | | | | | | | | | | | |
| Franklin Tax-Free Trust | | | | | | | | | | | | | | | |
| Financial Highlights (continued) | | | | | | | | | | | | | | | |
| |
| Franklin Pennsylvania Tax-Free Income Fund | | | | | | | | | | | | | | | |
| | | | | | Year Ended February 28, | | | | |
| Class C | | 2011 | | | 2010 | | | 2009 | | | 2008 | a | | 2007 | |
| Per share operating performance | | | | | | | | | | | | | | | |
| (for a share outstanding throughout the year) | | | | | | | | | | | | | | | |
| Net asset value, beginning of year | $ | 10.36 | | $ | 9.73 | | $ | 9.90 | | $ | 10.55 | | $ | 10.51 | |
| Income from investment operationsb: | | | | | | | | | | | | | | | |
| Net investment incomec | | 0.39 | | | 0.39 | | | 0.39 | | | 0.38 | | | 0.39 | |
| Net realized and unrealized gains (losses) | | (0.44 | ) | | 0.63 | | | (0.18 | ) | | (0.65 | ) | | 0.04 | |
| Total from investment operations | | (0.05 | ) | | 1.02 | | | 0.21 | | | (0.27 | ) | | 0.43 | |
| Less distributions from net investment income | | (0.39 | ) | | (0.39 | ) | | (0.38 | ) | | (0.38 | ) | | (0.39 | ) |
| Redemption feesd | | — | | | — | | | —e | | | —e | | | —e | |
| Net asset value, end of year | $ | 9.92 | | $ | 10.36 | | $ | 9.73 | | $ | 9.90 | | $ | 10.55 | |
| |
| Total returnf | | (0.58 | )% | | 10.62 | % | | 2.13 | % | | (2.68 | )% | | 4.19 | % |
| |
| Ratios to average net assets | | | | | | | | | | | | | | | |
| Expenses | | 1.19 | % | | 1.20 | % | | 1.20 | % | | 1.21 | % | | 1.21 | % |
| Net investment income | | 3.73 | % | | 3.88 | % | | 3.98 | % | | 3.69 | % | | 3.71 | % |
| |
| Supplemental data | | | | | | | | | | | | | | | |
| Net assets, end of year (000’s) | $ | 237,907 | | $ | 217,322 | | $ | 135,480 | | $ | 107,286 | | $ | 100,495 | |
| Portfolio turnover rate | | 13.15 | % | | 12.88 | % | | 11.50 | % | | 16.68 | % | | 6.99 | % |
|
| aFor the year ended February 29. |
| bThe amount shown for a share outstanding throughout the period may not correlate with the Statement of Operations for the period due to the timing of sales and repurchases of |
| the Fund shares in relation to income earned and/or fluctuating market value of the investments of the Fund. |
| cBased on average daily shares outstanding. |
| dEffective September 1, 2008, the redemption fee was eliminated. |
| eAmount rounds to less than $0.01 per share. |
| fTotal return does not reflect sales commissions or contingent deferred sales charges, if applicable. |
170 | The accompanying notes are an integral part of these financial statements. | Annual Report
| | | | | | |
| Franklin Tax-Free Trust | | | | | | |
| Financial Highlights (continued) | | | | | | |
| |
| Franklin Pennsylvania Tax-Free Income Fund | | | | | | |
| | | Year Ended | |
| | | February 28, | |
| Advisor Class | | 2011 | | | 2010 | a |
| Per share operating performance | | | | | | |
| (for a share outstanding throughout the year) | | | | | | |
| Net asset value, beginning of year | $ | 10.27 | | $ | 9.92 | |
| Income from investment operationsb: | | | | | | |
| Net investment incomec | | 0.45 | | | 0.29 | |
| Net realized and unrealized gains (losses) | | (0.43 | ) | | 0.34 | |
| Total from investment operations | | 0.02 | | | 0.63 | |
| Less distributions from net investment income | | (0.46 | ) | | (0.28 | ) |
| Net asset value, end of year | $ | 9.83 | | $ | 10.27 | |
| |
| Total returnd | | 0.08 | % | | 6.42 | % |
| |
| Ratios to average net assetse | | | | | | |
| Expenses | | 0.54 | % | | 0.55 | % |
| Net investment income | | 4.38 | % | | 4.53 | % |
| |
| Supplemental data | | | | | | |
| Net assets, end of year (000’s) | $ | 18,933 | | $ | 6,832 | |
| Portfolio turnover rate | | 13.15 | % | | 12.88 | % |
|
| aFor the period July 15, 2009 (effective date) to February 28, 2010. |
| bThe amount shown for a share outstanding throughout the period may not correlate with the Statement of Operations for the period due to the timing of sales and repurchases of |
| the Fund shares in relation to income earned and/or fluctuating market value of the investments of the Fund. |
| cBased on average daily shares outstanding. |
| dTotal return is not annualized for periods less than one year. |
| eRatios are annualized for periods less than one year. |
Annual Report | The accompanying notes are an integral part of these financial statements. | 171
| | | | |
| Franklin Tax-Free Trust | | | | |
| |
| Statement of Investments, February 28, 2011 | | | | |
| |
| |
| Franklin Pennsylvania Tax-Free Income Fund | | Principal Amount | | Value |
| Municipal Bonds 100.5% | | | | |
| Pennsylvania 88.9% | | | | |
| Allegheny County COP, AMBAC Insured, 5.00%, 12/01/28 | $ | 4,000,000 | $ | 3,944,160 |
| Allegheny County GO, | | | | |
| NATL Insured, Pre-Refunded, 5.00%, 11/01/27 | | 1,000,000 | | 1,074,170 |
| Notes, Series C-60, AGMC Insured, 5.00%, 11/01/27 | | 3,000,000 | | 3,028,560 |
| Series C-61, Assured Guaranty, 5.00%, 12/01/33 | | 5,000,000 | | 4,867,100 |
| aSeries C-65, 5.375%, 5/01/31 | | 5,000,000 | | 5,001,550 |
| Allegheny County Higher Education Building Authority University Revenue, Duquesne | | | | |
| University, | | | | |
| 5.00%, 3/01/28 | | 3,000,000 | | 2,993,190 |
| 5.00%, 3/01/33 | | 1,300,000 | | 1,249,703 |
| Series A, 5.50%, 3/01/31 | | 3,000,000 | | 3,041,430 |
| Series A, XLCA Insured, 5.00%, 3/01/29 | | 5,000,000 | | 4,976,500 |
| Series A, XLCA Insured, 5.00%, 3/01/33 | | 5,630,000 | | 5,412,175 |
| Allegheny County Hospital Development Authority Revenue, 5.625%, 8/15/39 | | 12,000,000 | | 11,741,400 |
| Allegheny County IDAR, | | | | |
| County Guaranteed, Refunding, Series B, NATL Insured, 5.00%, 11/01/29 | | 1,485,000 | | 1,489,826 |
| County Guaranteed, Series B, NATL Insured, Pre-Refunded, 5.00%, 11/01/29 | | 7,515,000 | | 8,078,850 |
| Series A, NATL Insured, Pre-Refunded, 5.00%, 11/01/29 | | 5,000,000 | | 5,375,150 |
| Allegheny County Port Authority Special Revenue, Transportation, Refunding, NATL RE, FGIC | | | | |
| Insured, 5.00%, | | | | |
| 3/01/25 | | 13,250,000 | | 13,382,500 |
| 3/01/29 | | 16,500,000 | | 16,665,000 |
| Allegheny County Residential Finance Authority Mortgage Revenue, SFM, Refunding, | | | | |
| Series DD-1, GNMA Secured, 5.35%, 11/01/19 | | 245,000 | | 245,056 |
| Series DD-2, GNMA Secured, 5.40%, 11/01/29 | | 1,075,000 | | 1,064,938 |
| Allegheny County Sanitation Authority Sewer Revenue, | | | | |
| AGMC Insured, 5.00%, 6/01/40 | | 10,000,000 | | 9,729,600 |
| NATL RE, FGIC Insured, 5.00%, 12/01/37 | | 6,745,000 | | 6,401,545 |
| Refunding, Series A, NATL Insured, 5.00%, 12/01/30 | | 7,000,000 | | 7,008,260 |
| Allegheny Valley School District GO, NATL Insured, 5.00%, 11/01/28 | | 1,550,000 | | 1,580,520 |
| Allentown Parking Authority Parking Revenue, AGMC Insured, 5.00%, 11/15/35 | | 2,430,000 | | 2,359,360 |
| Armstrong County GO, | | | | |
| NATL Insured, Pre-Refunded, 5.40%, 6/01/31 | | 1,490,000 | | 1,508,282 |
| Refunding, NATL Insured, 5.40%, 6/01/31 | | 1,010,000 | | 1,010,313 |
| Bethel Park School District GO, 5.10%, 8/01/33 | | 3,600,000 | | 3,693,924 |
| Bethlehem Area School District GO, AGMC Insured, 5.25%, 1/15/26 | | 6,605,000 | | 6,870,389 |
| Blair County Hospital Authority Revenue, Altoona Regulation Health System, 6.00%, | | | | |
| 11/15/39 | | 6,890,000 | | 6,607,648 |
| Bucks County IDAR, AMBAC Insured, 5.125%, 9/15/31 | | 3,675,000 | | 3,649,569 |
| Bucks County Water and Sewer Authority Sewer System Revenue, Refunding, Series A, | | | | |
| Assured Guaranty, 5.00%, 12/01/35 | | 2,500,000 | | 2,482,250 |
| Butler Area School District GO, AGMC Insured, Pre-Refunded, 5.00%, 4/01/31 | | 4,000,000 | | 4,482,440 |
| Butler County Hospital Authority Hospital Revenue, Butler Health System Project, 7.25%, | | | | |
| 7/01/39 | | 4,500,000 | | 4,894,695 |
| Catasauqua Area School District GO, Refunding, AGMC Insured, 5.00%, 2/15/36 | | 6,000,000 | | 5,841,360 |
| Centennial School District Bucks County GO, Series A, 5.00%, 12/15/37 | | 5,855,000 | | 5,886,090 |
172 | Annual Report
| | | | |
| Franklin Tax-Free Trust | | | | |
| |
| Statement of Investments, February 28, 2011 (continued) | | | | |
| |
| |
| Franklin Pennsylvania Tax-Free Income Fund | | Principal Amount | | Value |
| Municipal Bonds (continued) | | | | |
| Pennsylvania (continued) | | | | |
| Centre County Hospital Authority Revenue, Hospital, Mount Nittany Medical Center Project, | | | | |
| Assured Guaranty, | | | | |
| 5.875%, 11/15/29 | $ | 1,000,000 | $ | 1,019,330 |
| 6.125%, 11/15/39 | | 3,200,000 | | 3,235,968 |
| 6.25%, 11/15/44 | | 2,500,000 | | 2,530,100 |
| Commonwealth Financing Authority Revenue, Series B, 5.00%, 6/01/32 | | 5,000,000 | | 5,018,000 |
| Connellsville Area School District GO, Series B, AGMC Insured, 5.00%, 11/15/37 | | 1,000,000 | | 976,870 |
| Cumberland County Municipal Authority College Revenue, Dickinson College, Assn. of | | | | |
| Independent Colleges and Universities of Pennsylvania Financing Program, | | | | |
| Series GG1, NATL Insured, 5.00%, 5/01/34 | | 7,610,000 | | 7,229,120 |
| Series HH1, 5.00%, 11/01/39 | | 1,200,000 | | 1,159,164 |
| Dauphin County General Authority Health System Revenue, Pinnacle Health System Project, | | | | |
| Refunding, Series A, 6.00%, 6/01/36 | | 10,000,000 | | 9,732,900 |
| Dauphin County General Authority Hospital Revenue, Hapsco-Western Hospital Project, | | | | |
| Series B, NATL Insured, ETM, 6.25%, 7/01/16 | | 3,965,000 | | 4,386,678 |
| Deer Lakes School District GO, Assured Guaranty, 5.50%, 4/01/39 | | 7,500,000 | | 7,711,275 |
| Delaware County Authority College Revenue, | | | | |
| 5.00%, 11/15/40 | | 3,000,000 | | 2,963,190 |
| Cabrini College, Refunding, Radian Insured, 5.875%, 7/01/29 | | 1,140,000 | | 1,142,736 |
| Eastern College, Series C, 5.625%, 10/01/28 | | 2,210,000 | | 2,095,345 |
| Delaware County Authority Hospital Revenue, Crozer Keystone Obligation, Group A, 5.00%, | | | | |
| 12/15/31 | | 5,000,000 | | 3,894,550 |
| Delaware County Authority Revenue, Health Facilities, Mercy Health Corp. Project, ETM, | | | | |
| 6.00%, 12/15/26 | | 10,800,000 | | 12,272,904 |
| Delaware County Authority University Revenue, Neumann University, | | | | |
| 5.00%, 10/01/25 | | 1,250,000 | | 1,143,238 |
| 5.25%, 10/01/31 | | 1,250,000 | | 1,129,050 |
| Delaware Valley Regional Finance Authority Local Government Revenue, Series B, AMBAC | | | | |
| Insured, 5.60%, 7/01/17 | | 5,000,000 | | 5,454,700 |
| Erie County Hospital Authority Revenue, Hamot Health Foundation, CIFG Insured, 5.00%, | | | | |
| 11/01/35 | | 6,000,000 | | 5,082,480 |
| Erie GO, Series E, FGIC Insured, 5.25%, 11/15/25 | | 5,000,000 | | 4,835,550 |
| Erie Higher Education Building Authority College Revenue, Mercyhurst College, 5.50%, | | | | |
| 3/15/38 | | 2,000,000 | | 1,819,900 |
| Erie Parking Authority Parking Facilities Revenue, Guaranteed, Refunding, AGMC Insured, | | | | |
| 5.125%, 9/01/32 | | 4,250,000 | | 4,236,273 |
| Erie Water Authority Revenue, AGMC Insured, 5.00%, 12/01/43 | | 7,000,000 | | 6,581,680 |
| Franklin County IDAR, Chambersburg Hospital Project, 5.375%, 7/01/42 | | 7,500,000 | | 6,899,925 |
| General Authority of South Central Revenue, Assn. of Independent Colleges and Universities, | | | | |
| York Colleges of Pennsylvania Project, | | | | |
| a5.75%, 11/01/41 | | 9,500,000 | | 9,324,630 |
| XLCA Insured, 5.00%, 5/01/37 | | 1,090,000 | | 991,137 |
| Greater Johnstown School District GO, Series C, NATL Insured, 5.125%, 8/01/25 | | 3,605,000 | | 3,634,669 |
| Hazleton Health Services Authority Hospital Revenue, Hazleton General Hospital, 5.50%, | | | | |
| 7/01/27 | | 1,500,000 | | 1,264,155 |
| Johnstown RDA Sewer Revenue, Series A, AGMC Insured, Pre-Refunded, 5.00%, 8/15/34 | | 1,825,000 | | 2,064,623 |
Annual Report | 173
| | | | | |
| | Franklin Tax-Free Trust | | | | |
| |
| | Statement of Investments, February 28, 2011 (continued) | | | | |
| |
| |
| | Franklin Pennsylvania Tax-Free Income Fund | | Principal Amount | | Value |
| | Municipal Bonds (continued) | | | | |
| | Pennsylvania (continued) | | | | |
| | Lackawanna County GO, Series B, AGMC Insured, 5.00%, | | | | |
| | 9/01/30 | $ | 8,100,000 | $ | 7,932,087 |
| | 9/01/35 | | 7,500,000 | | 7,095,075 |
| | Lancaster County Hospital Authority Revenue, Health Center, Willow Valley Retirement Project, | | | | |
| | 5.875%, 6/01/21 | | 1,000,000 | | 1,003,760 |
| | Lancaster Parking Authority Parking Revenue, Guaranteed, Series A, AMBAC Insured, 5.00%, | | | | |
| | 12/01/32 | | 1,700,000 | | 1,649,425 |
| | 12/01/35 | | 2,500,000 | | 2,354,400 |
| | Latrobe IDAR, St. Vincent College Project, 5.70%, 5/01/31 | | 1,500,000 | | 1,445,940 |
| | Lehigh County General Purpose Authority Revenues, | | | | |
| | Lehigh Valley Hospital, Health Network, Series B, AGMC Insured, 5.25%, 7/01/19 | | 2,750,000 | | 2,793,038 |
| | Muhlenberg College Project, 5.25%, 2/01/34 | | 1,500,000 | | 1,501,845 |
| | Lehigh County General Purpose Hospital Revenue, Lehigh Valley Health, Series B, AGMC | | | | |
| | Insured, 5.00%, 7/01/35 | | 11,250,000 | | 10,716,863 |
| | Luzerne County IDA Facility Revenue, Pennsylvania American Water Co., Refunding, 5.50%, | | | | |
| | 12/01/39 | | 10,000,000 | | 9,828,900 |
| | Lycoming County Authority College Revenue, Pennsylvania College of Technology, | | | | |
| | AMBAC Insured, 5.25%, 5/01/32 | | 5,030,000 | | 4,547,321 |
| | Refunding, AMBAC Insured, 5.35%, 7/01/26 | | 2,400,000 | | 2,367,720 |
| | Lycoming County Authority Health System Revenue, Susquehanna Health System Project, | | | | |
| | Refunding, Series A, 5.75%, 7/01/39 | | 20,000,000 | | 18,210,800 |
| | Marple Newtown School District GO, AGMC Insured, 5.00%, 6/01/31 | | 11,225,000 | | 11,513,931 |
| | McKeesport Municipal Authority Sewer Revenue, 5.75%, 12/15/39 | | 5,000,000 | | 4,815,900 |
| | Mercer County GO, NATL RE, FGIC Insured, 5.00%, 10/01/31 | | 2,000,000 | | 1,949,740 |
| | Monroe County Hospital Authority Revenue, Hospital, Pocono Medical Center, | | | | |
| | 5.00%, 1/01/27 | | 1,000,000 | | 902,690 |
| | 5.125%, 1/01/37 | | 2,000,000 | | 1,708,620 |
| | 5.25%, 1/01/43 | | 2,000,000 | | 1,705,600 |
| | Montgomery County GO, 5.00%, 9/15/22 | | 3,335,000 | | 3,377,988 |
| | Montgomery County Higher Education and Health Authority Revenue, Arcadia University, | | | | |
| | 5.625%, 4/01/40 | | 5,750,000 | | 5,350,490 |
| | Montgomery County IDA Retirement Community Revenue, ACTS Retirement-Life Communities | | | | |
| | Inc. Obligated Group, | | | | |
| | 5.25%, 11/15/28 | | 5,000,000 | | 4,523,050 |
| | Refunding, Series B, 5.00%, 11/15/22 | | 1,000,000 | | 939,110 |
| | Montgomery County IDAR, FHA Insured, 5.375%, 8/01/38 | | 5,000,000 | | 4,904,850 |
| | Montour School District GO, AGMC Insured, 5.00%, | | | | |
| | 4/01/32 | | 5,000,000 | | 5,052,000 |
| | 4/01/37 | | 12,500,000 | | 12,302,625 |
| | Norristown Area School District GO, FGIC Insured, Pre-Refunded, 5.00%, 9/01/27 | | 5,000,000 | | 5,418,850 |
| | Northampton Borough Municipal Authority Water Revenue, NATL Insured, | | | | |
| | 5.00%, 5/15/34 | | 445,000 | | 434,222 |
| Pre | -Refunded, 5.00%, 5/15/34 | | 1,955,000 | | 2,193,412 |
| | Northampton County General Purpose Authority Hospital Revenue, St. Luke’s Hospital Project, | | | | |
| | Series A, 5.50%, 8/15/35 | | 10,000,000 | | 8,917,300 |
| | Series B, 5.50%, 8/15/33 | | 2,200,000 | | 1,951,422 |
174 | Annual Report
| | | | |
| Franklin Tax-Free Trust | | | | |
| |
| Statement of Investments, February 28, 2011 (continued) | | | | |
| |
| |
| Franklin Pennsylvania Tax-Free Income Fund | | Principal Amount | | Value |
| Municipal Bonds (continued) | | | | |
| Pennsylvania (continued) | | | | |
| Northampton County General Purpose Authority Revenue, | | | | |
| Higher Education, Lehigh University, 5.00%, 11/15/39 | $ | 20,000,000 | $ | 19,728,400 |
| Lafayette College, Refunding, 5.00%, 11/01/34 | | 20,000,000 | | 19,916,200 |
| Northeastern York School District GO, Series B, NATL RE, FGIC Insured, 5.00%, | | | | |
| 4/01/30 | | 1,000,000 | | 1,009,350 |
| 4/01/31 | | 2,000,000 | | 2,010,320 |
| Norwin School District GO, | | | | |
| AGMC Insured, 5.00%, 4/01/37 | | 10,000,000 | | 9,771,600 |
| AGMC Insured, Pre-Refunded, 5.00%, 4/01/35 | | 3,000,000 | | 3,478,050 |
| Series A, NATL Insured, 5.00%, 4/01/30 | | 1,000,000 | | 999,940 |
| Owen J. Roberts School District GO, AGMC Insured, 5.00%, 9/01/36 | | 2,710,000 | | 2,686,857 |
| Pennsbury School District GO, FGIC Insured, Pre-Refunded, 5.00%, 1/15/22 | | 2,835,000 | | 3,008,133 |
| Pennsylvania Economic Development Financing Authority Exempt Facilities Revenue, | | | | |
| Allegheny Energy Supply Co. LLC Project, 7.00%, 7/15/39 | | 10,000,000 | | 10,521,800 |
| Pennsylvania Economic Development Financing Authority Revenue, Lincoln University, | | | | |
| Series A, NATL RE, FGIC Insured, 5.00%, 6/01/33 | | 3,325,000 | | 3,195,325 |
| Pennsylvania Economic Development Financing Authority Water Facility Revenue, | | | | |
| American Water Co. Project, 6.20%, 4/01/39 | | 10,000,000 | | 10,293,500 |
| Aqua Inc. Project, Series B, 5.00%, 12/01/43 | | 25,000,000 | | 24,025,750 |
| Pennsylvania HFA, SFMR, Refunding, Series 105C, 4.875%, 10/01/34 | | 25,000,000 | | 23,067,750 |
| Pennsylvania State GO, | | | | |
| Second Series, 5.00%, 4/15/23 | | 10,000,000 | | 10,940,600 |
| Second Series A, 5.00%, 8/01/25 | | 5,000,000 | | 5,315,000 |
| Pennsylvania State Higher Educational Facilities Authority College and University Revenues, | | | | |
| Drexel University, NATL Insured, 5.75%, 5/01/22 | | 3,095,000 | | 3,101,592 |
| Pennsylvania State Higher Educational Facilities Authority Revenue, | | | | |
| Bryn Mawr College, Refunding, AMBAC Insured, 5.00%, 12/01/37 | | 5,000,000 | | 4,977,700 |
| Drexel University, Series A, 5.00%, 5/01/20 | | 1,485,000 | | 1,524,932 |
| Drexel University, Series A, 5.20%, 5/01/29 | | 750,000 | | 753,615 |
| Drexel University, Series A, NATL Insured, 5.00%, 5/01/37 | | 25,525,000 | | 23,564,935 |
| Edinboro University Foundation, 6.00%, 7/01/43 | | 3,500,000 | | 3,360,070 |
| La Salle University, Series A, 5.00%, 5/01/37 | | 2,500,000 | | 2,071,875 |
| Philadelphia University, Refunding, 5.00%, 6/01/30 | | 2,295,000 | | 1,985,450 |
| St. Joseph’s University, Series A, 5.00%, 11/01/40 | | 15,000,000 | | 13,482,300 |
| State System of Higher Education, NATL Insured, 5.00%, 6/15/37 | | 7,000,000 | | 6,918,730 |
| Temple University, Refunding, NATL Insured, 5.00%, 4/01/28 | | 5,000,000 | | 5,107,650 |
| Temple University, Refunding, NATL Insured, 5.00%, 4/01/33 | | 10,000,000 | | 10,066,400 |
| Thomas Jefferson University, 5.00%, 3/01/40 | | 14,950,000 | | 13,913,516 |
| Trustees of the University of Pennsylvania, Refunding, Series C, 5.00%, 7/15/38 | | 5,000,000 | | 5,021,100 |
| aTrustees of the University of Pennsylvania, Series A, 5.00%, 9/01/41 | | 7,000,000 | | 7,027,300 |
| aUniversity of Pennsylvania Health System, 5.75%, 8/15/41 | | 3,950,000 | | 3,965,247 |
| University of Pennsylvania Health System, Refunding, Series B, 6.00%, 8/15/26 | | 5,000,000 | | 5,310,850 |
| University of Pittsburgh Medical Center, Series E, 5.00%, 5/15/31 | | 13,000,000 | | 12,095,460 |
| University Sciences Philadelphia, Assured Guaranty, 5.00%, 11/01/32 | | 5,000,000 | | 4,966,950 |
| University Sciences Philadelphia, Refunding, Series A, XLCA Insured, 5.00%, | | | | |
| 11/01/36 | | 8,315,000 | | 7,811,527 |
| Widener University, 5.00%, 7/15/31 | | 500,000 | | 456,985 |
| Widener University, 5.00%, 7/15/39 | | 5,750,000 | | 5,113,130 |
Annual Report | 175
| | | | |
| Franklin Tax-Free Trust | | | | |
| |
| Statement of Investments, February 28, 2011 (continued) | | | | |
| |
| |
| Franklin Pennsylvania Tax-Free Income Fund | | Principal Amount | | Value |
| Municipal Bonds (continued) | | | | |
| Pennsylvania (continued) | | | | |
| Pennsylvania State Higher Educational Facilities Authority Student Housing Revenue, | | | | |
| University Properties Inc., 5.00%, 7/01/42 | $ | 5,500,000 | $ | 4,376,900 |
| Pennsylvania State Public School Building Authority Community College Revenue, Community | | | | |
| College Philadelphia Project, 6.00%, 6/15/28 | | 5,000,000 | | 5,246,400 |
| Pennsylvania State Public School Building Authority Lease Revenue, School District of | | | | |
| Philadelphia Project, | | | | |
| AGMC Insured, Pre-Refunded, 5.00%, 6/01/33 | | 15,000,000 | | 16,394,850 |
| Refunding, Series B, AGMC Insured, 4.75%, 6/01/30 | | 5,000,000 | | 4,913,000 |
| Pennsylvania State Public School Building Authority Revenue, | | | | |
| Career Institute of Technology, NATL RE, FGIC Insured, 5.00%, 11/15/28 | | 1,000,000 | | 1,012,390 |
| Central Montgomery County Area, NATL RE, FGIC Insured, 5.00%, 5/15/24 | | 2,500,000 | | 2,568,950 |
| Pennsylvania State Turnpike Commission Oil Franchise Tax Revenue, Series B, NATL Insured, | | | | |
| 5.00%, 12/01/24 | | 1,655,000 | | 1,673,040 |
| Pre-Refunded, 5.00%, 12/01/31 | | 5,000,000 | | 5,544,350 |
| Pennsylvania State Turnpike Commission Turnpike Revenue, | | | | |
| 5.125%, 12/01/40 | | 16,860,000 | | 15,636,133 |
| Refunding, Series C, Sub Series C-1, Assured Guaranty, 6.25%, 6/01/38 | | 5,000,000 | | 5,291,400 |
| Series A, AMBAC Insured, 5.00%, 12/01/34 | | 5,000,000 | | 4,910,950 |
| Series C1, 5.00%, 12/01/40 | | 5,000,000 | | 4,550,350 |
| Series R, AMBAC Insured, 5.00%, 12/01/26 | | 2,000,000 | | 2,028,060 |
| Series R, AMBAC Insured, 5.00%, 12/01/30 | | 11,125,000 | | 11,189,302 |
| sub. bond, Series A, Assured Guaranty, 5.00%, 6/01/39 | | 20,000,000 | | 18,654,200 |
| Pennsylvania State University Revenue, 5.00%, 9/01/35 | | 1,000,000 | | 1,007,190 |
| Philadelphia Airport Revenue, Series A, AGMC Insured, 5.00%, 6/15/40 | | 5,000,000 | | 4,714,050 |
| Philadelphia Authority for IDR, | | | | |
| Cultural and Commercial Corridors Program, Series A, NATL RE, FGIC Insured, 5.00%, | | | | |
| 12/01/23 | | 6,205,000 | | 6,129,733 |
| Cultural and Commercial Corridors Program, Series A, NATL RE, FGIC Insured, 5.00%, | | | | |
| 12/01/25 | | 5,690,000 | | 5,527,721 |
| International Apartments Temple University, Series A, 5.625%, 6/15/42 | | 4,000,000 | | 3,519,440 |
| Series B, AMBAC Insured, 5.25%, 7/01/31 | | 2,000,000 | | 1,752,640 |
| Philadelphia Gas Works Revenue, | | | | |
| Ninth Series, 5.25%, 8/01/40 | | 3,500,000 | | 3,125,955 |
| Twelfth Series B, NATL Insured, ETM, 7.00%, 5/15/20 | | 755,000 | | 921,228 |
| Philadelphia GO, | | | | |
| Refunding, Series A, Assured Guaranty, 5.125%, 8/01/25 | | 5,000,000 | | 5,118,100 |
| Refunding, Series A, Assured Guaranty, 5.25%, 8/01/26 | | 5,000,000 | | 5,167,950 |
| Series B, Assured Guaranty, 7.125%, 7/15/38 | | 10,000,000 | | 10,954,200 |
| Philadelphia Hospitals and Higher Education Facilities Authority Hospital Revenue, Temple | | | | |
| University Health System, Refunding, Series A, | | | | |
| 5.50%, 7/01/30 | | 5,000,000 | | 4,413,650 |
| 5.00%, 7/01/34 | | 5,000,000 | | 3,988,650 |
| Philadelphia Housing Authority Capital Fund Program Revenue, Series A, AGMC Insured, | | | | |
| 5.00%, 12/01/21 | | 5,000,000 | | 5,146,900 |
| Philadelphia IDA Lease Revenue, Series B, AGMC Insured, Pre-Refunded, 5.125%, | | | | |
| 10/01/26 | | 12,000,000 | | 12,452,280 |
176 | Annual Report
| | | | |
| Franklin Tax-Free Trust | | | | |
| |
| Statement of Investments, February 28, 2011 (continued) | | | | |
| |
| |
| Franklin Pennsylvania Tax-Free Income Fund | | Principal Amount | | Value |
| Municipal Bonds (continued) | | | | |
| Pennsylvania (continued) | | | | |
| Philadelphia Municipal Authority Revenue, Lease, 6.50%, | | | | |
| 4/01/34 | $ | 3,250,000 | $ | 3,315,163 |
| 4/01/39 | | 2,500,000 | | 2,540,600 |
| Philadelphia RDAR, Neighborhood Transformation, Series C, NATL RE, FGIC Insured, 5.00%, | | | | |
| 4/15/31 | | 14,565,000 | | 13,567,297 |
| Philadelphia School District GO, | | | | |
| Series D, FGIC Insured, Pre-Refunded, 5.125%, 6/01/34 | | 5,000,000 | | 5,629,400 |
| Series E, 6.00%, 9/01/38 | | 5,000,000 | | 5,176,650 |
| Philadelphia Water and Wastewater Revenue, | | | | |
| Series A, 5.25%, 1/01/36 | | 3,000,000 | | 2,930,610 |
| Series A, AGMC Insured, 5.00%, 7/01/29 | | 11,645,000 | | 11,680,168 |
| Series A, AGMC Insured, 5.00%, 7/01/35 | | 3,330,000 | | 3,216,147 |
| Series A, NATL RE, FGIC Insured, 5.00%, 11/01/31 | | 2,765,000 | | 2,733,230 |
| Series C, AGMC Insured, 5.00%, 8/01/35 | | 7,000,000 | | 6,760,390 |
| Pine Richland School District Pennsylvania GO, Assured Guaranty, 5.00%, 3/01/39 | | 20,130,000 | | 19,920,447 |
| Pittsburgh Urban RDA Mortgage Revenue, Series C, GNMA Secured, 5.70%, 4/01/30 | | 1,295,000 | | 1,295,052 |
| Pittsburgh Water and Sewer Authority Revenue, FGIC Insured, ETM, 7.25%, 9/01/14 | | 610,000 | | 682,645 |
| Reading GO, AGMC Insured, 6.00%, 11/01/28 | | 2,000,000 | | 2,136,340 |
| Sayre Health Care Facilities Authority Revenue, Guthrie Healthcare System, | | | | |
| Refunding, Series A, 5.875%, 12/01/31 | | 555,000 | | 557,720 |
| Series A, Pre-Refunded, 5.875%, 12/01/31 | | 1,945,000 | | 2,043,145 |
| Scranton School District GO, | | | | |
| Series A, AGMC Insured, 5.00%, 7/15/38 | | 5,430,000 | | 5,413,601 |
| Series C, AGMC Insured, 5.00%, 7/15/38 | | 5,000,000 | | 4,984,900 |
| Scranton-Lackawanna Health and Welfare Authority Revenue, University of Scranton, XLCA | | | | |
| Insured, 5.00%, 11/01/37 | | 8,125,000 | | 7,440,144 |
| Seneca Valley School District GO, NATL Insured, Pre-Refunded, 5.375%, 1/01/21 | | 2,000,000 | | 2,082,300 |
| Snyder County Higher Education Authority University Revenue, Susquehanna University | | | | |
| Project, 5.00%, 1/01/38 | | 4,000,000 | | 3,763,560 |
| South Fork Municipal Authority Hospital Revenue, Conemaugh Valley Memorial, Refunding, | | | | |
| Series B, Assured Guaranty, 5.375%, 7/01/35 | | 10,000,000 | | 9,486,100 |
| Southcentral General Authority Revenue, WellSpan Health Obligated Group, | | | | |
| NATL Insured, ETM, 5.25%, 5/15/31 | | 1,875,000 | | 1,905,656 |
| NATL Insured, Pre-Refunded, 5.25%, 5/15/31 | | 8,125,000 | | 8,286,525 |
| Refunding, Series A, 6.00%, 6/01/25 | | 10,000,000 | | 10,726,100 |
| Southern Lehigh School District GO, Series A, FGIC Insured, Pre-Refunded, 5.00%, | | | | |
| 9/01/25 | | 6,900,000 | | 7,366,026 |
| Southmoreland School District GO, NATL Insured, 5.00%, 4/01/27 | | 5,025,000 | | 5,140,022 |
| State Public School Building Authority College Revenue, | | | | |
| Delaware County Community College Project, AGMC Insured, 5.00%, 10/01/32 | | 1,000,000 | | 993,430 |
| Westmoreland County Community College, NATL RE, FGIC Insured, 5.25%, 10/15/22 | | 2,170,000 | | 2,217,415 |
| State Public School Building Authority School Revenue, Harrisburg School District Project, | | | | |
| Series A, Assured Guaranty, 5.00%, 11/15/33 | | 5,000,000 | | 4,899,900 |
| Susquehanna Area Regional Airport Authority Airport System Revenue, | | | | |
| Refunding, Series A, AMBAC Insured, 5.00%, 1/01/28 | | 2,000,000 | | 1,665,060 |
| Series A, 6.50%, 1/01/38 | | 4,000,000 | | 3,781,920 |
Annual Report | 177
| | | | |
| Franklin Tax-Free Trust | | | | |
| |
| Statement of Investments, February 28, 2011 (continued) | | | | |
| |
| |
| Franklin Pennsylvania Tax-Free Income Fund | | Principal Amount | | Value |
| Municipal Bonds (continued) | | | | |
| Pennsylvania (continued) | | | | |
| University of Pittsburgh of the Commonwealth System of Higher Education Revenue, | | | | |
| University Capital Project, | | | | |
| Refunding, Series C, 5.00%, 9/15/35 | $ | 5,000,000 | $ | 5,010,250 |
| Series B, 5.00%, 9/15/31 | | 10,000,000 | | 10,252,400 |
| Upper St. Clair Township School District GO, | | | | |
| AGMC Insured, Pre-Refunded, 5.00%, 7/15/28 | | 465,000 | | 489,789 |
| Refunding, AGMC Insured, 5.00%, 7/15/28 | | 535,000 | | 540,173 |
| Washington County GO, | | | | |
| Refunding, Series A, AMBAC Insured, 5.125%, 9/01/27 | | 4,295,000 | | 4,350,105 |
| Series A, AMBAC Insured, Pre-Refunded, 5.125%, 9/01/27 | | 705,000 | | 753,927 |
| Washington County IDA College Revenue, Washington Jefferson College, Refunding, | | | | |
| 5.25%, 11/01/30 | | 7,525,000 | | 7,546,145 |
| 5.00%, 11/01/36 | | 8,470,000 | | 7,748,102 |
| West Allegheny School District GO, Refunding, Series D, NATL RE, FGIC Insured, 4.75%, | | | | |
| 9/01/19 | | 2,000,000 | | 2,026,960 |
| 9/01/20 | | 3,805,000 | | 3,848,111 |
| West Mifflin Area School District GO, AGMC Insured, 5.125%, 4/01/31 | | 1,000,000 | | 1,017,230 |
| Whitehall Coplay School District GO, Series A, AGMC Insured, 5.375%, 11/15/34 | | 6,000,000 | | 6,141,240 |
| Wilkes-Barre Finance Authority Revenue, Wilkes University Project, Refunding, 5.00%, | | | | |
| 3/01/37 | | 4,500,000 | | 3,909,150 |
| Wyoming Area School District GO, Refunding, Series A, NATL Insured, 5.00%, 9/01/26 | | 5,005,000 | | 5,109,104 |
| | | | | 1,130,452,817 |
| U.S. Territories 11.6% | | | | |
| Puerto Rico 10.8% | | | | |
| Puerto Rico Commonwealth Aqueduct and Sewer Authority Revenue, senior lien, Series A, | | | | |
| 6.00%, 7/01/44 | | 2,100,000 | | 1,952,034 |
| Puerto Rico Commonwealth GO, | | | | |
| Public Improvement, Refunding, Series A-4, AGMC Insured, 5.25%, 7/01/30 | | 5,000,000 | | 4,904,450 |
| Public Improvement, Series A, 5.00%, 7/01/29 | | 4,000,000 | | 3,797,160 |
| Public Improvement, Series A, 5.00%, 7/01/33 | | 13,960,000 | | 12,130,123 |
| Public Improvement, Series A, Pre-Refunded, 5.00%, 7/01/33 | | 7,000,000 | | 7,683,480 |
| Series A, 5.00%, 7/01/28 | | 5,000,000 | | 4,596,800 |
| Series A, 5.25%, 7/01/37 | | 10,000,000 | | 8,750,500 |
| Puerto Rico Commonwealth Infrastructure Financing Authority Special Tax Revenue, Series B, | | | | |
| 5.00%, 7/01/37 | | 7,010,000 | | 5,868,982 |
| Puerto Rico Electric Power Authority Power Revenue, | | | | |
| Series TT, 5.00%, 7/01/32 | | 5,100,000 | | 4,615,500 |
| Series XX, 5.25%, 7/01/40 | | 14,000,000 | | 12,226,760 |
| Puerto Rico PBA Guaranteed Revenue, Government Facilities, Series I, 5.00%, 7/01/36 | | 5,950,000 | | 5,043,161 |
| Puerto Rico Sales Tax FICO Sales Tax Revenue, first sub., | | | | |
| Series A, 5.375%, 8/01/39 | | 20,000,000 | | 18,380,200 |
| Series A, 6.00%, 8/01/42 | | 34,000,000 | | 34,064,599 |
| Series C, 5.50%, 8/01/40 | | 15,000,000 | | 14,027,550 |
| | | | | 138,041,299 |
178 | Annual Report
| | | | | | |
| Franklin Tax-Free Trust | | | | | | |
| |
| Statement of Investments, February 28, 2011 (continued) | | | | | | |
| |
| |
| Franklin Pennsylvania Tax-Free Income Fund | | Principal Amount | | | Value | |
| Municipal Bonds (continued) | | | | | | |
| U.S. Territories (continued) | | | | | | |
| U.S. Virgin Islands 0.8% | | | | | | |
| Virgin Islands PFAR, | | | | | | |
| Gross Receipts Taxes Loan Note, Radian Insured, 5.00%, 10/01/33 | $ | 5,000,000 | | $ | 4,466,250 | |
| senior lien, Refunding, Series B, 5.00%, 10/01/25 | | 5,500,000 | | | 5,421,460 | |
| | | | | | 9,887,710 | |
| Total U.S. Territories | | | | | 147,929,009 | |
| Total Municipal Bonds before Short Term Investments | | | | | | |
| (Cost $1,305,312,234) | | | | | 1,278,381,826 | |
| Short Term Investments (Cost $4,400,000) 0.3% | | | | | | |
| Municipal Bonds 0.3% | | | | | | |
| Pennsylvania 0.3% | | | | | | |
| bGeisinger Authority Health System Revenue, Geisinger Health System, Daily VRDN and Put, | | | | | | |
| 0.22%, 11/15/32 | | 4,400,000 | | | 4,400,000 | |
| Total Investments (Cost $1,309,712,234) 100.8% | | | | | 1,282,781,826 | |
| Other Assets, less Liabilities (0.8)% | | | | | (10,600,946 | ) |
| Net Assets 100.0% | | | $ | 1,272,180,880 | |
| |
| |
| See Abbreviations on page 205. | | | | | | |
| |
| aSecurity purchased on a when-issued basis. See Note 1(b). | | | | | | |
| bVariable rate demand notes (VRDNs) are tax-exempt obligations which contain a floating or variable interest rate adjustment formula and an unconditional right of demand to | |
| receive payment of the principal balance plus accrued interest at specified dates. The coupon rate shown represents the rate at period end. | | | | |
Annual Report | The accompanying notes are an integral part of these financial statements. | 179
| | | | | | | | | | | | |
| Franklin Tax-Free Trust | | | | | | | | | | |
| |
| Financial Statements | | | | | | | | | | | | |
| |
| |
| Statements of Assets and Liabilities | | | | | | | | | | | | |
| February 28, 2011 | | | | | | | | | | | | |
| |
| | | Franklin | | | Franklin | | | Franklin | | | Franklin | |
| | | Arizona | | | Colorado | | | Connecticut | | | Michigan | |
| | | Tax-Free | | | Tax-Free | | | Tax-Free | | | Tax-Free | |
| | | Income Fund | | | Income Fund | | | Income Fund | | | Income Fund | |
| Assets: | | | | | | | | | | | | |
| Investments in securities: | | | | | | | | | | | | |
| Cost | $ | 982,257,267 | | $ | 662,856,682 | | $ | 487,181,302 | | $ | 1,398,826,501 | |
| Value | $ | 945,052,108 | | $ | 643,421,003 | | $ | 473,395,230 | | $ | 1,384,075,287 | |
| Cash | | 100,416 | | | 22,396 | | | 514,101 | | | 1,292,741 | |
| Receivables: | | | | | | | | | | | | |
| Investment securities sold | | 1,868,692 | | | — | | | — | | | — | |
| Capital shares sold | | 540,431 | | | 648,764 | | | 561,335 | | | 952,597 | |
| Interest | | 10,913,777 | | | 8,931,987 | | | 4,893,088 | | | 19,110,347 | |
| Other assets | | 413 | | | 282 | | | 209 | | | 597 | |
| Total assets | | 958,475,837 | | | 653,024,432 | | | 479,363,963 | | | 1,405,431,569 | |
| Liabilities: | | | | | | | | | | | | |
| Payables: | | | | | | | | | | | | |
| Capital shares redeemed | | 1,840,386 | | | 1,844,535 | | | 1,024,001 | | | 2,872,238 | |
| Affiliates | | 509,985 | | | 368,271 | | | 281,535 | | | 772,832 | |
| Distributions to shareholders | | 1,176,729 | | | 800,032 | | | 358,735 | | | 1,615,541 | |
| Accrued expenses and other liabilities | | 122,981 | | | 115,853 | | | 81,782 | | | 211,861 | |
| Total liabilities | | 3,650,081 | | | 3,128,691 | | | 1,746,053 | | | 5,472,472 | |
| Net assets, at value | $ | 954,825,756 | | $ | 649,895,741 | | $ | 477,617,910 | | $ | 1,399,959,097 | |
| Net assets consist of: | | | | | | | | | | | | |
| Paid-in capital | $ | 1,007,564,388 | | $ | 681,535,633 | | $ | 495,160,950 | | $ | 1,420,897,006 | |
| Undistributed net investment income (distributions in | | | | | | | | | | | | |
| excess of net investment income) | | (336,463 | ) | | (207,209 | ) | | 276,746 | | | (395,849 | ) |
| Net unrealized appreciation (depreciation) | | (37,205,159 | ) | | (19,435,679 | ) | | (13,786,072 | ) | | (14,751,214 | ) |
| Accumulated net realized gain (loss) | | (15,197,010 | ) | | (11,997,004 | ) | | (4,033,714 | ) | | (5,790,846 | ) |
| Net assets, at value | $ | 954,825,756 | | $ | 649,895,741 | | $ | 477,617,910 | | $ | 1,399,959,097 | |
180 | The accompanying notes are an integral part of these financial statements. | Annual Report
| | | | | | | | | | | |
| Franklin Tax-Free Trust | | | | | | | | |
| |
| Financial Statements (continued) | | | | | | | | | | | |
| |
| |
| Statements of Assets and Liabilities (continued) | | | | | | | | | | | |
| February 28, 2011 | | | | | | | | | | | |
| |
| | | | Franklin | | Franklin | | | Franklin | | | Franklin |
| | | | Arizona | | Colorado | | | Connecticut | | | Michigan |
| | | | Tax-Free | | Tax-Free | | | Tax-Free | | | Tax-Free |
| | | | Income Fund | | Income Fund | | | Income Fund | | | Income Fund |
| Class A: | | | | | | | | | | | |
| Net assets, at value | $ | | 844,627,057 | $ | 530,056,409 | $ | | 367,664,468 | $ | | 1,204,877,234 |
| Shares outstanding | | | 81,970,612 | | 47,782,991 | | | 35,172,179 | | | 104,586,887 |
| Net asset value per sharea | | $ | 10.30 | $ | 11.09 | | $ | 10.45 | | $ | 11.52 |
| Maximum offering price per share (net asset value | | | | | | | | | | | |
| per share ÷ 95.75%) | | $ | 10.76 | $ | 11.58 | | $ | 10.91 | | $ | 12.03 |
| Class B: | | | | | | | | | | | |
| Net assets, at value | $ | | 4,645,045 | | �� | | | | $ | | 7,490,204 |
| Shares outstanding | | | 447,842 | | | | | | | | 646,588 |
| Net asset value and maximum offering price per sharea | | $ | 10.37 | | | | | | | $ | 11.58 |
| Class C: | | | | | | | | | | | |
| Net assets, at value | $ | | 99,856,385 | $ | 106,535,799 | $ | | 90,658,500 | $ | | 180,024,398 |
| Shares outstanding | | | 9,569,051 | | 9,515,439 | | | 8,618,607 | | | 15,436,223 |
| Net asset value and maximum offering price per sharea | | $ | 10.44 | $ | 11.20 | | $ | 10.52 | | $ | 11.66 |
| Advisor Class: | | | | | | | | | | | |
| Net assets, at value | $ | | 5,697,269 | $ | 13,303,533 | $ | | 19,294,942 | $ | | 7,567,261 |
| Shares outstanding | | | 551,890 | | 1,199,484 | | | 1,846,957 | | | 655,652 |
| Net asset value and maximum offering price per share | | $ | 10.32 | $ | 11.09 | | $ | 10.45 | | $ | 11.54 |
| |
| |
| aRedemption price is equal to net asset value less contingent deferred sales charges, if applicable. | | | | | | | | |
Annual Report | The accompanying notes are an integral part of these financial statements. | 181
| | | | | | | | | | | | |
| Franklin Tax-Free Trust | | | | | | | | | | |
| |
| Financial Statements (continued) | | | | | | | | | | | | |
| |
| |
| Statements of Assets and Liabilities (continued) | | | | | | | | | | | | |
| February 28, 2011 | | | | | | | | | | | | |
| |
| | | Franklin | | | Franklin | | | Franklin | | | Franklin | |
| | | Minnesota | | | Ohio | | | Oregon | | | Pennsylvania | |
| | | Tax-Free | | | Tax-Free | | | Tax-Free | | | Tax-Free | |
| | | Income Fund | | | Income Fund | | | Income Fund | | | Income Fund | |
| Assets: | | | | | | | | | | | | |
| Investments in securities: | | | | | | | | | | | | |
| Cost | $ | 942,174,394 | | $ | 1,568,665,500 | | $ | 1,165,117,871 | | $ | 1,309,712,234 | |
| Value | $ | 956,320,950 | | $ | 1,557,495,107 | | $ | 1,164,180,437 | | $ | 1,282,781,826 | |
| Cash | | 81,190 | | | 162,113 | | | 33,115 | | | 1,080,646 | |
| Receivables: | | | | | | | | | | | | |
| Capital shares sold | | 912,922 | | | 1,383,788 | | | 1,130,936 | | | 1,392,317 | |
| Interest | | 9,231,784 | | | 18,786,307 | | | 13,047,221 | | | 18,206,647 | |
| Other assets | | 401 | | | 674 | | | 492 | | | 544 | |
| Total assets | | 966,547,247 | | | 1,577,827,989 | | | 1,178,392,201 | | | 1,303,461,980 | |
| Liabilities: | | | | | | | | | | | | |
| Payables: | | | | | | | | | | | | |
| Investment securities purchased | | 2,184,876 | | | — | | | 13,543,195 | | | 24,797,219 | |
| Capital shares redeemed | | 2,708,257 | | | 6,564,171 | | | 5,008,403 | | | 4,062,061 | |
| Affiliates | | 555,046 | | | 903,771 | | | 641,073 | | | 727,091 | |
| Distributions to shareholders | | 963,918 | | | 1,771,384 | | | 901,914 | | | 1,509,506 | |
| Accrued expenses and other liabilities | | 139,756 | | | 230,091 | | | 151,716 | | | 185,223 | |
| Total liabilities | | 6,551,853 | | | 9,469,417 | | | 20,246,301 | | | 31,281,100 | |
| Net assets, at value | $ | 959,995,394 | | $ | 1,568,358,572 | | $ | 1,158,145,900 | | $ | 1,272,180,880 | |
| Net assets consist of: | | | | | | | | | | | | |
| Paid-in capital | $ | 950,683,370 | | $ | 1,592,830,702 | | $ | 1,163,241,240 | | $ | 1,306,447,307 | |
| Undistributed net investment income (distributions | | | | | | | | | | | | |
| in excess of net investment income) | | (152,973 | ) | | 86,765 | | | 979,887 | | | 262,957 | |
| Net unrealized appreciation (depreciation) | | 14,146,556 | | | (11,170,393 | ) | | (937,434 | ) | | (26,930,408 | ) |
| Accumulated net realized gain (loss) | | (4,681,559 | ) | | (13,388,502 | ) | | (5,137,793 | ) | | (7,598,976 | ) |
| Net assets, at value | $ | 959,995,394 | | $ | 1,568,358,572 | | $ | 1,158,145,900 | | $ | 1,272,180,880 | |
182 | The accompanying notes are an integral part of these financial statements. | Annual Report
| | | | | | | | | | | |
| Franklin Tax-Free Trust | | | | | | | | | |
| |
| Financial Statements (continued) | | | | | | | | | | | |
| |
| |
| Statements of Assets and Liabilities (continued) | | | | | | | | | | | |
| February 28, 2011 | | | | | | | | | | | |
| |
| | | Franklin | | | Franklin | | | Franklin | | | Franklin |
| | | Minnesota | | | Ohio | | | Oregon | | | Pennsylvania |
| | | Tax-Free | | | Tax-Free | | | Tax-Free | | | Tax-Free |
| | | Income Fund | | | Income Fund | | | Income Fund | | | Income Fund |
| Class A: | | | | | | | | | | | |
| Net assets, at value | $ | 754,018,196 | $ | | 1,227,868,033 | $ | | 946,754,726 | $ | | 1,003,723,422 |
| Shares outstanding | | 63,261,136 | | | 102,439,059 | | | 82,482,920 | | | 102,155,317 |
| Net asset value per sharea | $ | 11.92 | | $ | 11.99 | | $ | 11.48 | | $ | 9.83 |
| Maximum offering price per share (net asset value | | | | | | | | | | | |
| per share ÷ 95.75%) | $ | 12.45 | | $ | 12.52 | | $ | 11.99 | | $ | 10.27 |
| Class B: | | | | | | | | | | | |
| Net assets, at value | | | $ | | 11,691,663 | | | | $ | | 11,617,863 |
| Shares outstanding | | | | | 971,266 | | | | | | 1,178,138 |
| Net asset value and maximum offering price | | | | | | | | | | | |
| per sharea | | | | $ | 12.04 | | | | | $ | 9.86 |
| Class C: | | | | | | | | | | | |
| Net assets, at value | $ | 195,123,462 | $ | | 309,921,232 | $ | | 196,909,493 | $ | | 237,906,728 |
| Shares outstanding | | 16,226,492 | | | 25,587,078 | | | 16,951,897 | | | 23,979,363 |
| Net asset value and maximum offering price | | | | | | | | | | | |
| per sharea | $ | 12.02 | | $ | 12.11 | | $ | 11.62 | | $ | 9.92 |
| Advisor Class: | | | | | | | | | | | |
| Net assets, at value | $ | 10,853,736 | $ | | 18,877,644 | $ | | 14,481,681 | $ | | 18,932,867 |
| Shares outstanding | | 910,339 | | | 1,574,771 | | | 1,261,014 | | | 1,925,828 |
| Net asset value and maximum offering price | | | | | | | | | | | |
| per share | $ | 11.92 | | $ | 11.99 | | $ | 11.48 | | $ | 9.83 |
| |
| |
| aRedemption price is equal to net asset value less contingent deferred sales charges, if applicable. | | | | | | | | | |
Annual Report | The accompanying notes are an integral part of these financial statements. | 183
| | | | | | | | | | | | |
| Franklin Tax-Free Trust | | | | | | | | | | | | |
| |
| Financial Statements (continued) | | | | | | | | | | | | |
| |
| |
| Statements of Operations | | | | | | | | | | | | |
| for the year ended February 28, 2011 | | | | | | | | | | | | |
| |
| | | Franklin | | | Franklin | | | Franklin | | | Franklin | |
| | | Arizona | | | Colorado | | | Connecticut | | | Michigan | |
| | | Tax-Free | | | Tax-Free | | | Tax-Free | | | Tax-Free | |
| | | Income Fund | | | Income Fund | | | Income Fund | | | Income Fund | |
| Investment income: | | | | | | | | | | | | |
| Interest | $ | 54,704,771 | | $ | 36,141,186 | | $ | 25,358,617 | | $ | 75,378,516 | |
| Expenses: | | | | | | | | | | | | |
| Management fees (Note 3a) | | 5,127,961 | | | 3,496,728 | | | 2,638,897 | | | 7,153,408 | |
| Distribution fees: (Note 3c) | | | | | | | | | | | | |
| Class A | | 962,718 | | | 582,039 | | | 417,937 | | | 1,317,777 | |
| Class B | | 44,427 | | | — | | | — | | | 82,952 | |
| Class C | | 734,157 | | | 825,207 | | | 652,247 | | | 1,306,560 | |
| Transfer agent fees (Note 3e) | | 347,456 | | | 316,237 | | | 190,013 | | | 698,766 | |
| Custodian fees | | 14,586 | | | 9,662 | | | 7,217 | | | 20,655 | |
| Reports to shareholders | | 51,478 | | | 45,584 | | | 30,054 | | | 93,508 | |
| Registration and filing fees | | 47,117 | | | 36,991 | | | 27,590 | | | 58,981 | |
| Professional fees | | 39,044 | | | 36,606 | | | 35,300 | | | 68,239 | |
| Trustees’ fees and expenses | | 6,348 | | | 4,138 | | | 3,041 | | | 14,643 | |
| Other | | 71,220 | | | 52,871 | | | 46,623 | | | 90,662 | |
| Total expenses | | 7,446,512 | | | 5,406,063 | | | 4,048,919 | | | 10,906,151 | |
| Net investment income | | 47,258,259 | | | 30,735,123 | | | 21,309,698 | | | 64,472,365 | |
| Realized and unrealized gains (losses): | | | | | | | | | | | | |
| Net realized gain (loss) from investments | | 1,048,500 | | | (4,495,947 | ) | | (1,099,825 | ) | | (3,861,712 | ) |
| Net change in unrealized appreciation (depreciation) | | | | | | | | | | | | |
| on investments | | (49,272,524 | ) | | (32,750,510 | ) | | (21,360,841 | ) | | (54,180,505 | ) |
| Net realized and unrealized gain (loss) | | (48,224,024 | ) | | (37,246,457 | ) | | (22,460,666 | ) | | (58,042,217 | ) |
| Net increase (decrease) in net assets resulting from operations | $ | (965,765 | ) | $ | (6,511,334 | ) | $ | (1,150,968 | ) | $ | 6,430,148 | |
184 | The accompanying notes are an integral part of these financial statements. | Annual Report
| | | | | | | | | | | | |
| Franklin Tax-Free Trust | | | | | | | | | | |
| |
| Financial Statements (continued) | | | | | | | | | | | | |
| |
| |
| Statements of Operations (continued) | | | | | | | | | | | | |
| for the year ended February 28, 2011 | | | | | | | | | | | | |
| |
| | | Franklin | | | Franklin | | | Franklin | | | Franklin | |
| | | Minnesota | | | Ohio | | | Oregon | | | Pennsylvania | |
| | | Tax-Free | | | Tax-Free | | | Tax-Free | | | Tax-Free | |
| | | Income Fund | | | Income Fund | | | Income Fund | | | Income Fund | |
| Investment income: | | | | | | | | | | | | |
| Interest | $ | 44,338,217 | | $ | 79,965,801 | | $ | 57,742,946 | | $ | 66,615,165 | |
| Expenses: | | | | | | | | | | | | |
| Management fees (Note 3a) | | 4,754,407 | | | 7,896,396 | | | 5,749,424 | | | 6,363,323 | |
| Distribution fees: (Note 3c) | | | | | | | | | | | | |
| Class A | | 793,463 | | | 1,335,576 | | | 994,517 | | | 1,056,337 | |
| Class B | | — | | | 129,190 | | | — | | | 113,248 | |
| Class C | | 1,292,278 | | | 2,118,081 | | | 1,392,186 | | | 1,606,052 | |
| Transfer agent fees (Note 3e) | | 447,900 | | | 768,995 | | | 433,055 | | | 636,698 | |
| Custodian fees | | 13,861 | | | 22,986 | | | 16,725 | | | 18,693 | |
| Reports to shareholders | | 63,867 | | | 103,494 | | | 65,944 | | | 90,856 | |
| Registration and filing fees | | 56,007 | | | 73,812 | | | 40,570 | | | 52,064 | |
| Professional fees | | 42,635 | | | 59,747 | | | 49,836 | | | 51,817 | |
| Trustees’ fees and expenses | | 5,667 | | | 9,734 | | | 6,929 | | | 7,675 | |
| Other | | 76,693 | | | 134,867 | | | 83,417 | | | 85,342 | |
| Total expenses | | 7,546,778 | | | 12,652,878 | | | 8,832,603 | | | 10,082,105 | |
| Net investment income | | 36,791,439 | | | 67,312,923 | | | 48,910,343 | | | 56,533,060 | |
| Realized and unrealized gains (losses): | | | | | | | | | | | | |
| Net realized gain (loss) from investments | | (878,425 | ) | | (2,727,289 | ) | | (1,495,125 | ) | | (2,472,245 | ) |
| Net change in unrealized appreciation (depreciation) | | | | | | | | | | | | |
| on investments | | (24,832,974 | ) | | (72,931,646 | ) | | (41,145,974 | ) | | (60,689,224 | ) |
| Net realized and unrealized gain (loss) | | (25,711,399 | ) | | (75,658,935 | ) | | (42,641,099 | ) | | (63,161,469 | ) |
| Net increase (decrease) in net assets resulting from | | | | | | | | | | | | |
| operations | $ | 11,080,040 | | $ | (8,346,012 | ) | $ | 6,269,244 | | $ | (6,628,409 | ) |
Annual Report | The accompanying notes are an integral part of these financial statements. | 185
| | | | | | | | | | | | | |
| Franklin Tax-Free Trust | | | | | | | | | | | |
| |
| Financial Statements (continued) | | | | | | | | | | | | | |
| |
| |
| Statements of Changes in Net Assets | | | | | | | | | | | | | |
| |
| |
| | | Franklin Arizona | | | | Franklin Colorado | |
| | | Tax-Free Income Fund | | | Tax-Free Income Fund | |
| | | Year Ended February 28, | | | Year Ended February 28, | |
| | | 2011 | | | | 2010 | | | 2011 | | | 2010 | |
| Increase (decrease) in net assets: | | | | | | | | | | | | | |
| Operations: | | | | | | | | | | | | | |
| Net investment income | $ | 47,258,259 | | $ | 48,462,184 | | $ | 30,735,123 | | $ | 27,330,870 | |
| Net realized gain (loss) from investments | | 1,048,500 | | | | 471,301 | | | (4,495,947 | ) | | (2,007,681 | ) |
| Net change in unrealized appreciation | | | | | | | | | | | | | |
| (depreciation) on investments | | (49,272,524 | ) | | 60,709,625 | | | (32,750,510 | ) | | 47,793,095 | |
| Net increase (decrease) in net assets | | | | | | | | | | | | | |
| resulting from operations | | (965,765 | ) | | 109,643,110 | | | (6,511,334 | ) | | 73,116,284 | |
| Distributions to shareholders from: | | | | | | | | | | | | | |
| Net investment income: | | | | | | | | | | | | | |
| Class A | | (42,908,671 | ) | | (44,354,634 | ) | | (25,361,863 | ) | | (23,629,346 | ) |
| Class B | | (267,630 | ) | | | (475,572 | ) | | — | | | — | |
| Class C | | (4,327,459 | ) | | | (3,808,835 | ) | | (4,755,861 | ) | | (3,657,907 | ) |
| Advisor Class | | (242,094 | ) | | | (100,591 | ) | | (561,553 | ) | | (256,588 | ) |
| Total distributions to shareholders | | (47,745,854 | ) | | (48,739,632 | ) | | (30,679,277 | ) | | (27,543,841 | ) |
| Capital share transactions: (Note 2) | | | | | | | | | | | | | |
| Class A | | (94,867,528 | ) | | | 7,004,893 | | | (5,691,497 | ) | | 61,406,089 | |
| Class B | | (3,945,331 | ) | | | (6,160,267 | ) | | — | | | — | |
| Class C | | (4,358,967 | ) | | 25,629,866 | | | (5,183,561 | ) | | 42,805,349 | |
| Advisor Class | | 1,587,681 | | | | 4,408,655 | | | 3,024,687 | | | 10,714,746 | |
| Total capital share transactions | | (101,584,145 | ) | | 30,883,147 | | | (7,850,371 | ) | | 114,926,184 | |
| Net increase (decrease) in net assets | | (150,295,764 | ) | | 91,786,625 | | | (45,040,982 | ) | | 160,498,627 | |
| Net assets: | | | | | | | | | | | | | |
| Beginning of year | | 1,105,121,520 | | | 1,013,334,895 | | | 694,936,723 | | | 534,438,096 | |
| End of year | $ | 954,825,756 | | $ | 1,105,121,520 | | $ | 649,895,741 | | $ | 694,936,723 | |
| Undistributed net investment income | | | | | | | | | | | | | |
| (distributions in excess of net investment | | | | | | | | | | | | | |
| income) included in net assets: | | | | | | | | | | | | | |
| End of year | $ | (336,463 | ) | | $ | 63,413 | | $ | (207,209 | ) | $ | (253,678 | ) |
186 | The accompanying notes are an integral part of these financial statements. | Annual Report
| | | | | | | | | | | | |
| Franklin Tax-Free Trust | | | | | | | | | | |
| |
| Financial Statements (continued) | | | | | | | | | | | | |
| |
| |
| Statements of Changes in Net Assets (continued) | | | | | | | | | | | | |
| |
| |
| | | Franklin Connecticut | | | Franklin Michigan | |
| | | Tax-Free Income Fund | | | Tax-Free Income Fund | |
| | | Year Ended February 28, | | | Year Ended February 28, | |
| | | 2011 | | | 2010 | | | 2011 | | | 2010 | |
| Increase (decrease) in net assets: | | | | | | | | | | | | |
| Operations: | | | | | | | | | | | | |
| Net investment income | $ | 21,309,698 | | $ | 19,151,296 | | $ | 64,472,365 | | $ | 66,946,745 | |
| Net realized gain (loss) from investments | | (1,099,825 | ) | | 196,305 | | | (3,861,712 | ) | | 987,385 | |
| Net change in unrealized appreciation | | | | | | | | | | | | |
| (depreciation) on investments | | (21,360,841 | ) | | 28,939,594 | | | (54,180,505 | ) | | 63,316,102 | |
| Net increase (decrease) in net assets | | | | | | | | | | | | |
| resulting from operations | | (1,150,968 | ) | | 48,287,195 | | | 6,430,148 | | | 131,250,232 | |
| Distributions to shareholders from: | | | | | | | | | | | | |
| Net investment income: | | | | | | | | | | | | |
| Class A | | (17,281,237 | ) | | (15,724,815 | ) | | (56,741,331 | ) | | (58,640,678 | ) |
| Class B | | — | | | — | | | (481,699 | ) | | (943,183 | ) |
| Class C | | (3,578,844 | ) | | (3,014,176 | ) | | (7,408,118 | ) | | (7,016,292 | ) |
| Advisor Class | | (638,484 | ) | | (188,687 | ) | | (263,234 | ) | | (101,994 | ) |
| Net realized gains: | | | | | | | | | | | | |
| Class A | | — | | | — | | | (1,716,476 | ) | | — | |
| Class B | | — | | | — | | | (13,056 | ) | | — | |
| Class C | | — | | | — | | | (266,157 | ) | | — | |
| Advisor Class | | — | | | — | | | (10,386 | ) | | — | |
| Total distributions to shareholders | | (21,498,565 | ) | | (18,927,678 | ) | | (66,900,457 | ) | | (66,702,147 | ) |
| Capital share transactions: (Note 2) | | | | | | | | | �� | | | |
| Class A | | (20,090,133 | ) | | 42,790,870 | | | (89,067,491 | ) | | (29,191,851 | ) |
| Class B | | — | | | — | | | (10,048,737 | ) | | (13,843,494 | ) |
| Class C | | 987,423 | | | 18,249,273 | | | (7,342,306 | ) | | 14,669,706 | |
| Advisor Class | | 9,212,280 | | | 10,872,072 | | | 4,444,674 | | | 2,616,284 | |
| Total capital share transactions | | (9,890,430 | ) | | 71,912,215 | | | (102,013,860 | ) | | (25,749,355 | ) |
| Net increase (decrease) in net assets | | (32,539,963 | ) | | 101,271,732 | | | (162,484,169 | ) | | 38,798,730 | |
| Net assets: | | | | | | | | | | | | |
| Beginning of year | | 510,157,873 | | | 408,886,141 | | | 1,562,443,266 | | | 1,523,644,536 | |
| End of year | $ | 477,617,910 | | $ | 510,157,873 | | $ | 1,399,959,097 | | $ | 1,562,443,266 | |
| Undistributed net investment income | | | | | | | | | | | | |
| (distributions in excess of net investment | | | | | | | | | | | | |
| income) included in net assets: | | | | | | | | | | | | |
| End of year | $ | 276,746 | | $ | 365,951 | | $ | (395,849 | ) | $ | (77,088 | ) |
Annual Report | The accompanying notes are an integral part of these financial statements. | 187
| | | | | | | | | | | | |
| Franklin Tax-Free Trust | | | | | | | | | | |
| |
| Financial Statements (continued) | | | | | | | | | | | | |
| |
| |
| Statements of Changes in Net Assets (continued) | | | | | | | | | | | | |
| |
| |
| | | Franklin Minnesota | | | Franklin Ohio | |
| | | Tax-Free Income Fund | | | Tax-Free Income Fund | |
| | | Year Ended February 28, | | | Year Ended February 28, | |
| | | 2011 | | | 2010 | | | 2011 | | | 2010 | |
| Increase (decrease) in net assets: | | | | | | | | | | | | |
| Operations: | | | | | | | | | | | | |
| Net investment income | $ | 36,791,439 | | $ | 32,885,018 | | $ | 67,312,923 | | $ | 60,519,136 | |
| Net realized gain (loss) from investments | | (878,425 | ) | | 397,336 | | | (2,727,289 | ) | | 785,265 | |
| Net change in unrealized appreciation | | | | | | | | | | | | |
| (depreciation) on investments | | (24,832,974 | ) | | 26,917,175 | | | (72,931,646 | ) | | 49,023,694 | |
| Net increase (decrease) in net assets | | | | | | | | | | | | |
| resulting from operations | | 11,080,040 | | | 60,199,529 | | | (8,346,012 | ) | | 110,328,095 | |
| Distributions to shareholders from: | | | | | | | | | | | | |
| Net investment income: | | | | | | | | | | | | |
| Class A | | (30,119,952 | ) | | (28,107,979 | ) | | (54,667,437 | ) | | (50,726,485 | ) |
| Class B | | — | | | — | | | (702,235 | ) | | (1,163,652 | ) |
| Class C | | (6,345,392 | ) | | (4,433,588 | ) | | (11,343,783 | ) | | (8,457,941 | ) |
| Advisor Class | | (221,787 | ) | | (100,107 | ) | | (676,675 | ) | | (305,454 | ) |
| Total distributions to shareholders | | (36,687,131 | ) | | (32,641,674 | ) | | (67,390,130 | ) | | (60,653,532 | ) |
| Capital share transactions: (Note 2) | | | | | | | | | | | | |
| Class A | | 5,303,215 | | | 91,670,785 | | | (27,569,424 | ) | | 129,036,411 | |
| Class B | | — | | | — | | | (15,208,855 | ) | | (10,240,350 | ) |
| Class C | | 29,914,307 | | | 64,299,400 | | | 37,855,705 | | | 78,124,241 | |
| Advisor Class | | 6,451,269 | | | 4,381,568 | | | 6,397,863 | | | 12,800,876 | |
| Total capital share transactions | | 41,668,791 | | | 160,351,753 | | | 1,475,289 | | | 209,721,178 | |
| Net increase (decrease) in net assets | | 16,061,700 | | | 187,909,608 | | | (74,260,853 | ) | | 259,395,741 | |
| Net assets: | | | | | | | | | | | | |
| Beginning of year | | 943,933,694 | | | 756,024,086 | | | 1,642,619,425 | | | 1,383,223,684 | |
| End of year | $ | 959,995,394 | | $ | 943,933,694 | | $ | 1,568,358,572 | | $ | 1,642,619,425 | |
| Undistributed net investment income (distributions | | | | | | | | | | | | |
| in excess of net investment income) included in | | | | | | | | | | | | |
| net assets: | | | | | | | | | | | | |
| End of year | $ | (152,973 | ) | $ | (245,707 | ) | $ | 86,765 | | $ | (48,665 | ) |
188 | The accompanying notes are an integral part of these financial statements. | Annual Report
| | | | | | | | | | | | |
| Franklin Tax-Free Trust | | | | | | | | | | |
| |
| Financial Statements (continued) | | | | | | | | | | | | |
| |
| |
| Statements of Changes in Net Assets (continued) | | | | | | | | | | |
| |
| |
| | | Franklin Oregon | | | Franklin Pennsylvania | |
| | | Tax-Free Income Fund | | | Tax-Free Income Fund | |
| | | Year Ended February 28, | | | Year Ended February 28, | |
| | | 2011 | | | 2010 | | | 2011 | | | 2010 | |
| Increase (decrease) in net assets: | | | | | | | | | | | | |
| Operations: | | | | | | | | | | | | |
| Net investment income | $ | 48,910,343 | | $ | 43,249,698 | | $ | 56,533,060 | | $ | 48,305,870 | |
| Net realized gain (loss) from investments | | (1,495,125 | ) | | 409,254 | | | (2,472,245 | ) | | (3,602,648 | ) |
| Net change in unrealized appreciation | | | | | | | | | | | | |
| (depreciation) on investments | | (41,145,974 | ) | | 57,465,171 | | | (60,689,224 | ) | | 70,449,288 | |
| Net increase (decrease) in net assets | | | | | | | | | | | | |
| resulting from operations | | 6,269,244 | | | 101,124,123 | | | (6,628,409 | ) | | 115,152,510 | |
| Distributions to shareholders from: | | | | | | | | | | | | |
| Net investment income: | | | | | | | | | | | | |
| Class A | | (42,479,548 | ) | | (37,077,945 | ) | | (46,812,660 | ) | | (40,280,732 | ) |
| Class B | | — | | | — | | | (663,318 | ) | | (1,038,347 | ) |
| Class C | | (7,825,347 | ) | | (5,730,892 | ) | | (9,229,481 | ) | | (6,616,521 | ) |
| Advisor Class | | (467,897 | ) | | (129,067 | ) | | (569,083 | ) | | (139,679 | ) |
| Total distributions to shareholders | | (50,772,792 | ) | | (42,937,904 | ) | | (57,274,542 | ) | | (48,075,279 | ) |
| Capital share transactions: (Note 2) | | | | | | | | | | | | |
| Class A | | 27,575,883 | | | 117,909,588 | | | 36,943,473 | | | 141,610,847 | |
| Class B | | — | | | — | | | (9,774,820 | ) | | (9,927,119 | ) |
| Class C | | 9,483,838 | | | 63,727,864 | | | 32,717,670 | | | 71,652,632 | |
| Advisor Class | | 8,845,402 | | | 6,227,144 | | | 13,242,282 | | | 6,657,402 | |
| Total capital share transactions | | 45,905,123 | | | 187,864,596 | | | 73,128,605 | | | 209,993,762 | |
| Net increase (decrease) in net assets | | 1,401,575 | | | 246,050,815 | | | 9,225,654 | | | 277,070,993 | |
| Net assets: | | | | | | | | | | | | |
| Beginning of year | | 1,156,744,325 | | | 910,693,510 | | | 1,262,955,226 | | | 985,884,233 | |
| End of year | $ | 1,158,145,900 | | $ | 1,156,744,325 | | $ | 1,272,180,880 | | $ | 1,262,955,226 | |
| Undistributed net investment income included in | | | | | | | | | | | | |
| net assets: | | | | | | | | | | | | |
| End of year | $ | 979,887 | | $ | 2,521,506 | | $ | 262,957 | | $ | 766,851 | |
Annual Report | The accompanying notes are an integral part of these financial statements. | 189
Franklin Tax-Free Trust
Notes to Financial Statements
1. ORGANIZATION AND SIGNIFICANT ACCOUNTING POLICIES
Franklin Tax-Free Trust (Trust) is registered under the Investment Company Act of 1940, as amended, (1940 Act) as an open-end investment company, consisting of twenty-four separate funds, eight of which are included in this report (Funds). The financial statements of the remaining funds in the Trust are presented separately. The classes of shares offered within each of the Funds are indicated below. Each class of shares differs by its initial sales load, contingent deferred sales charges, distribution fees, voting rights on matters affecting a single class and its exchange privilege.
| |
| Class A, Class C & Advisor Class | Class A, Class B, Class C & Advisor Class |
| Franklin Colorado Tax-Free Income Fund | Franklin Arizona Tax-Free Income Fund |
| Franklin Connecticut Tax-Free Income Fund | Franklin Michigan Tax-Free Income Fund |
| Franklin Minnesota Tax-Free Income Fund | Franklin Ohio Tax-Free Income Fund |
| Franklin Oregon Tax-Free Income Fund | Franklin Pennsylvania Tax-Free Income Fund |
The following summarizes the Funds’ significant accounting policies.
a. Financial Instrument Valuation
The Funds’ investments in securities and other financial instruments are carried at fair value daily. Fair value is the price that would be received to sell an asset or paid to transfer a liability in an orderly transaction between market participants on the measurement date. Under procedures approved by the Trust’s Board of Trustees, the Funds may utilize independent pricing services, quotations from securities and financial instrument dealers, and other market sources to determine fair value.
Debt securities generally trade in the over-the-counter market rather than on a securities exchange. The Funds’ pricing services use multiple valuation techniques to determine fair value. In instances where sufficient market activity exists, the pricing services may utilize a market-based approach through which quotes from market makers are used to determine fair value. In instances where sufficient market activity may not exist or is limited, the pricing services also utilize proprietary valuation models which may consider market characteristics such as benchmark yield curves, option-adjusted spreads, credit spreads, estimated default rates, coupon rates, anticipated timing of principal repayments, underlying collateral, and other unique security features in order to estimate the relevant cash flows, which are then discounted to calculate the fair value.
The Funds have procedures to determine the fair value of securities and other financial instruments for which market prices are not readily available or which may not be reliably priced. Under these procedures, the Funds primarily employ a market-based approach which may use related or comparable assets or liabilities, recent transactions, market multiples, book values, and other relevant information for the investment to determine the fair value of the investment. The Funds may also use an income-based valuation approach in which the anticipated future
190 | Annual Report
Franklin Tax-Free Trust
Notes to Financial Statements (continued)
| 1. | ORGANIZATION AND SIGNIFICANT ACCOUNTING POLICIES (continued) |
| a. | Financial Instrument Valuation (continued) |
cash flows of the investment are discounted to calculate fair value. Discounts may also be applied due to the nature or duration of any restrictions on the disposition of the investments. Due to the inherent uncertainty of valuations of such investments, the fair values may differ significantly from the values that would have been used had an active market existed.
b. Securities Purchased on a When-Issued and Delayed Delivery Basis
The Funds may purchase securities on a when-issued and delayed delivery basis, with payment and delivery scheduled for a future date. These transactions are subject to market fluctuations and are subject to the risk that the value at delivery may be more or less than the trade date purchase price. Although the Funds will generally purchase these securities with the intention of holding the securities, they may sell the securities before the settlement date. Sufficient assets have been segregated for these securities.
c. Income Taxes
It is each fund’s policy to qualify as a regulated investment company under the Internal Revenue Code. Each fund intends to distribute to shareholders substantially all of its income and net realized gains to relieve it from federal income and excise taxes. As a result, no provision for U.S. federal income taxes is required. Each fund files U.S. income tax returns as well as tax returns in certain other jurisdictions. Each fund’s application of those tax rules is subject to its understanding. Each fund records a provision for taxes in its financial statements including penalties and interest, if any, for a tax position taken on a tax return (or expected to be taken) when it fails to meet the more likely than not (a greater than 50% probability) threshold and based on the technical merits, the tax position may not be sustained upon examination by the tax authorities. As of February 28, 2011, and for all open tax years, each fund has determined that no provision for income tax is required in each fund’s financial statements. Open tax years are those that remain subject to examination and are based on each tax jurisdiction statute of limitation. Each fund is not aware of any tax position for which it is reasonably possible that the total amounts of unrecognized tax effects will significantly change in the next twelve months.
d. Security Transactions, Investment Income, Expenses and Distributions
Security transactions are accounted for on trade date. Realized gains and losses on security transactions are determined on a specific identification basis. Interest income and estimated expenses are accrued daily. Amortization of premium and accretion of discount on debt securities are included in interest income. Dividends from net investment income are normally declared daily; these dividends may be reinvested or paid monthly to shareholders. Distributions from realized capital gains and other distributions, if any, are recorded on the ex-dividend date. Distributions to shareholders are determined according to income tax regulations (tax basis). Distributable earnings determined on a tax basis may differ from earnings recorded in accordance with accounting principles generally accepted in the United States of America. These
Annual Report | 191
Franklin Tax-Free Trust
Notes to Financial Statements (continued)
| 1. | ORGANIZATION AND SIGNIFICANT ACCOUNTING POLICIES (continued) |
| d. | Security Transactions, Investment Income, Expenses and Distributions (continued) |
differences may be permanent or temporary. Permanent differences are reclassified among capital accounts to reflect their tax character. These reclassifications have no impact on net assets or the results of operations. Temporary differences are not reclassified, as they may reverse in subsequent periods.
Common expenses incurred by the Trust are allocated among the funds based on the ratio of net assets of each fund to the combined net assets of the Trust. Fund specific expenses are charged directly to the fund that incurred the expense.
Realized and unrealized gains and losses and net investment income, not including class specific expenses, are allocated daily to each class of shares based upon the relative proportion of net assets of each class. Differences in per share distributions, by class, are generally due to differences in class specific expenses.
e. Insurance
The scheduled payments of interest and principal for each insured municipal security in the Trust are insured by either a new issue insurance policy or a secondary insurance policy. Some municipal securities in the Funds are secured by collateral guaranteed by an agency of the U.S. government. Insurance companies typically insure municipal bonds that tend to be of very high quality, with the majority of underlying municipal bonds rated A or better. However, there is a risk that in the event of an issuer default, the insurer may not be able to fulfill its obligations under the terms of the policy.
Depending on the type of coverage, premiums for insurance are either added to the cost basis of the security or paid by a third party.
f. Accounting Estimates
The preparation of financial statements in accordance with accounting principles generally accepted in the United States of America requires management to make estimates and assumptions that affect the reported amounts of assets and liabilities at the date of the financial statements and the amounts of income and expenses during the reporting period. Actual results could differ from those estimates.
g. Guarantees and Indemnifications
Under the Trust’s organizational documents, its officers and trustees are indemnified by the Trust against certain liabilities arising out of the performance of their duties to the Trust. Additionally, in the normal course of business, the Trust, on behalf of the Funds, enters into
192 | Annual Report
Franklin Tax-Free Trust
Notes to Financial Statements (continued)
| 1. | ORGANIZATION AND SIGNIFICANT ACCOUNTING POLICIES (continued) |
| g. | Guarantees and Indemnifications (continued) |
contracts with service providers that contain general indemnification clauses. The Trust’s maximum exposure under these arrangements is unknown as this would involve future claims that may be made against the Trust that have not yet occurred. Currently, the Trust expects the risk of loss to be remote.
2. SHARES OF BENEFICIAL INTEREST
At February 28, 2011, there were an unlimited number of shares authorized (without par value).
Transactions in the Funds’ shares were as follows:
| | | | | | | | | | | | |
| | Franklin Arizona | | Franklin Colorado | |
| | Tax-Free Income Fund | | Tax-Free Income Fund | |
| | Shares | | | | Amount | | Shares | | | | Amount | |
| Class A Shares: | | | | | | | | | | | | |
| Year ended February 28, 2011 | | | | | | | | | | | | |
| Shares sold | 11,611,244 | | $ | 124,494,223 | | 8,534,066 | | | $ | 99,601,606 | |
| Shares issued in reinvestment | | | | | | | | | | | | |
| of distributions | 2,426,611 | | | | 25,975,943 | | 1,509,903 | | | | 17,449,117 | |
| Shares redeemed | (23,187,262 | ) | | | (245,337,694 | ) | (10,762,019 | ) | | | (122,742,220 | ) |
| Net increase (decrease) | (9,149,407 | ) | | $ | (94,867,528 | ) | (718,050 | ) | | $ | (5,691,497 | ) |
| Year ended February 28, 2010 | | | | | | | | | | | | |
| Shares sold | 12,693,078 | | $ | 134,207,912 | | 10,274,097 | | $ | 116,715,622 | |
| Shares issued in reinvestment | | | | | | | | | | | | |
| of distributions | 2,507,684 | | | | 26,545,956 | | 1,347,355 | | | | 15,361,480 | |
| Shares redeemed | (14,493,804 | ) | | | (153,748,975 | ) | (6,231,805 | ) | | | (70,671,013 | ) |
| Net increase (decrease) | 706,958 | | | $ | 7,004,893 | | 5,389,647 | | | $ | 61,406,089 | |
| Class B Shares: | | | | | | | | | | | | |
| Year ended February 28, 2011 | | | | | | | | | | | | |
| Shares sold | 27,168 | | | $ | 297,021 | | | | | | | |
| Shares issued in reinvestment | | | | | | | | | | | | |
| of distributions | 14,523 | | | | 156,725 | | | | | | | |
| Shares redeemed | (408,278 | ) | | | (4,399,077 | ) | | | | | | |
| Net increase (decrease) | (366,587 | ) | | $ | (3,945,331 | ) | | | | | | |
| Year ended February 28, 2010 | | | | | | | | | | | | |
| Shares sold | 12,821 | | | $ | 136,815 | | | | | | | |
| Shares issued in reinvestment | | | | | | | | | | | | |
| of distributions | 27,591 | | | | 292,764 | | | | | | | |
| Shares redeemed | (620,272 | ) | | | (6,589,846 | ) | | | | | | |
| Net increase (decrease) | (579,860 | ) | | $ | (6,160,267 | ) | | | | | | |
Annual Report | 193
| | | | | | | | | | | |
| Franklin Tax-Free Trust | | | | | | | |
| |
| Notes to Financial Statements (continued) | | | | | | | | |
| |
| |
| 2. SHARES OF BENEFICIAL INTEREST (continued) | | | | | | | | | | |
| |
| | Franklin Arizona | | Franklin Colorado | |
| | Tax-Free Income Fund | | Tax-Free Income Fund | |
| | Shares | | | Amount | | Shares | | | | Amount | |
| Class C Shares: | | | | | | | | | | | |
| Year ended February 28, 2011 | | | | | | | | | | | |
| Shares sold | 2,265,210 | | $ | 24,826,899 | | 2,962,651 | | | $ | 34,998,856 | |
| Shares issued in reinvestment | | | | | | | | | | | |
| of distributions | 275,440 | | | 2,983,757 | | 320,548 | | | | 3,739,948 | |
| Shares redeemed | (3,027,577 | ) | | (32,169,623 | ) | (3,861,020 | ) | | | (43,922,365 | ) |
| Net increase (decrease) | (486,927 | ) | $ | (4,358,967 | ) | (577,821 | ) | | $ | (5,183,561 | ) |
| Year ended February 28, 2010 | | | | | | | | | | | |
| Shares sold | 3,490,469 | | $ | 37,323,922 | | 4,522,462 | | | $ | 52,013,630 | |
| Shares issued in reinvestment | | | | | | | | | | | |
| of distributions | 242,579 | | | 2,602,178 | | 237,644 | | | | 2,737,499 | |
| Shares redeemed | (1,332,759 | ) | | (14,296,234 | ) | (1,038,198 | ) | | | (11,945,780 | ) |
| Net increase (decrease) | 2,400,289 | | $ | 25,629,866 | | 3,721,908 | | | $ | 42,805,349 | |
| Advisor Class Shares: | | | | | | | | | | | |
| Year ended February 28, 2011 | | | | | | | | | | | |
| Shares sold | 512,669 | | $ | 5,602,573 | | 574,694 | | | $ | 6,713,466 | |
| Shares issued in reinvestment | | | | | | | | | | | |
| of distributions | 6,498 | | | 68,858 | | 4,159 | | | | 46,532 | |
| Shares redeemed | (386,863 | ) | | (4,083,750 | ) | (329,158 | ) | | | (3,735,311 | ) |
| Net increase (decrease) | 132,304 | | $ | 1,587,681 | | 249,695 | | | $ | 3,024,687 | |
| Year ended February 28, 2010a | | | | | | | | | | | |
| Shares sold | 465,317 | | $ | 4,904,066 | | 1,106,041 | | | $ | 12,505,231 | |
| Shares issued in reinvestment | | | | | | | | | | | |
| of distributions | 1,341 | | | 14,414 | | 70 | | | | 812 | |
| Shares redeemed | (47,542 | ) | | (509,825 | ) | (156,322 | ) | | | (1,791,297 | ) |
| Net increase (decrease) | 419,116 | | $ | 4,408,655 | | 949,789 | | | $ | 10,714,746 | |
| |
| aFor the period July 15, 2009 (effective date) to February 28, 2010, for the Franklin Colorado Tax-Free Income Fund. | | | | | |
| |
| | Franklin Connecticut | | Franklin Michigan | |
| | Tax-Free Income Fund | | Tax-Free Income Fund | |
| | Shares | | | Amount | | Shares | | | | Amount | |
| Class A Shares: | | | | | | | | | | | |
| Year ended February 28, 2011 | | | | | | | | | | | |
| Shares sold | 7,311,102 | | $ | 79,511,741 | | 11,226,069 | | $ | 133,487,446 | |
| Shares issued in reinvestment | | | | | | | | | | | |
| of distributions | 991,339 | | | 10,755,858 | | 3,283,713 | | | | 38,899,504 | |
| Shares redeemed | (10,362,701 | ) | | (110,357,732 | ) | (22,307,808 | ) | | | (261,454,441 | ) |
| Net increase (decrease) | (2,060,260 | ) | $ | (20,090,133 | ) | (7,798,026 | ) | | $ | (89,067,491 | ) |
| Year ended February 28, 2010 | | | | | | | | | | | |
| Shares sold | 8,457,084 | | $ | 90,194,787 | | 11,886,273 | | $ | 140,284,064 | |
| Shares issued in reinvestment | | | | | | | | | | | |
| of distributions | 886,050 | | | 9,438,927 | | 3,214,545 | | | | 37,989,621 | |
| Shares redeemed | (5,343,140 | ) | | (56,842,844 | ) | (17,609,236 | ) | | | (207,465,536 | ) |
| Net increase (decrease) | 3,999,994 | | $ | 42,790,870 | | (2,508,418 | ) | | $ | (29,191,851 | ) |
194 | Annual Report
| | | | | | | | | | |
| Franklin Tax-Free Trust | | | | | | |
| |
| Notes to Financial Statements (continued) | | | | | | | |
| |
| |
| 2. SHARES OF BENEFICIAL INTEREST (continued) | | | | | | | | | |
| |
| | Franklin Connecticut | | Franklin Michigan | |
| | Tax-Free Income Fund | | Tax-Free Income Fund | |
| | Shares | | | Amount | | Shares | | | Amount | |
| Class B Shares: | | | | | | | | | | |
| Year ended February 28, 2011 | | | | | | | | | | |
| Shares sold | | | | | | 6,635 | | $ | 78,903 | |
| Shares issued in reinvestment | | | | | | | | | | |
| of distributions | | | | | | 28,303 | | | 338,431 | |
| Shares redeemed | | | | | | (875,089 | ) | | (10,466,071 | ) |
| Net increase (decrease) | | | | | | (840,151 | ) | $ | (10,048,737 | ) |
| Year ended February 28, 2010 | | | | | | | | | | |
| Shares sold | | | | | | 9,498 | | $ | 111,105 | |
| Shares issued in reinvestment | | | | | | | | | | |
| of distributions | | | | | | 55,387 | | | 656,266 | |
| Shares redeemed | | | | | | (1,232,200 | ) | | (14,610,865 | ) |
| Net increase (decrease) | | | | | | (1,167,315 | ) | $ | (13,843,494 | ) |
| Class C Shares: | | | | | | | | | | |
| Year ended February 28, 2011 | | | | | | | | | | |
| Shares sold | 2,457,435 | | $ | 27,112,368 | | 3,771,530 | | $ | 45,678,078 | |
| Shares issued in reinvestment | | | | | | | | | | |
| of distributions | 218,789 | | | 2,388,954 | | 463,002 | | | 5,549,071 | |
| Shares redeemed | (2,652,942 | ) | | (28,513,899 | ) | (4,952,648 | ) | | (58,569,455 | ) |
| Net increase (decrease) | 23,282 | | $ | 987,423 | | (718,116 | ) | $ | (7,342,306 | ) |
| Year ended February 28, 2010 | | | | | | | | | | |
| Shares sold | 2,666,498 | | $ | 28,518,935 | | 4,084,189 | | $ | 48,807,096 | |
| Shares issued in reinvestment | | | | | | | | | | |
| of distributions | 185,796 | | | 1,991,695 | | 417,054 | | | 4,985,346 | |
| Shares redeemed | (1,147,228 | ) | | (12,261,357 | ) | (3,277,517 | ) | | (39,122,736 | ) |
| Net increase (decrease) | 1,705,066 | | $ | 18,249,273 | | 1,223,726 | | $ | 14,669,706 | |
| Advisor Class Shares: | | | | | | | | | | |
| Year ended February 28, 2011 | | | | | | | | | | |
| Shares sold | 1,486,160 | | $ | 16,229,056 | | 564,518 | | $ | 6,776,763 | |
| Shares issued in reinvestment | | | | | | | | | | |
| of distributions | 6,296 | | | 66,373 | | 5,558 | | | 64,703 | |
| Shares redeemed | (660,039 | ) | | (7,083,149 | ) | (205,129 | ) | | (2,396,792 | ) |
| Net increase (decrease) | 832,417 | | $ | 9,212,280 | | 364,947 | | $ | 4,444,674 | |
| Year ended February 28, 2010a | | | | | | | | | | |
| Shares sold | 1,317,481 | | $ | 14,155,332 | | 301,110 | | $ | 3,538,457 | |
| Shares issued in reinvestment | | | | | | | | | | |
| of distributions | 147 | | | 1,595 | | 500 | | | 5,958 | |
| Shares redeemed | (303,088 | ) | | (3,284,855 | ) | (77,806 | ) | | (928,131 | ) |
| Net increase (decrease) | 1,014,540 | | $ | 10,872,072 | | 223,804 | | $ | 2,616,284 | |
aFor the period July 15, 2009 (effective date) to February 28, 2010 for the Franklin Connecticut Tax-Free Income Fund.
Annual Report | 195
| | | | | | | | | | | | |
| Franklin Tax-Free Trust | | | | | | | |
| |
| Notes to Financial Statements (continued) | | | | | | | | |
| |
| |
| 2. SHARES OF BENEFICIAL INTEREST (continued) | | | | | | | | | | | |
| |
| | Franklin Minnesota | | Franklin Ohio | |
| | Tax-Free Income Fund | | Tax-Free Income Fund | |
| | Shares | | | | Amount | | Shares | | | | Amount | |
| Class A Shares: | | | | | | | | | | | | |
| Year ended February 28, 2011 | | | | | | | | | | | | |
| Shares sold | 10,914,685 | | $ | 133,261,358 | | 17,095,312 | | $ | 212,766,451 | |
| Shares issued in reinvestment | | | | | | | | | | | | |
| of distributions | 1,804,094 | | | | 21,890,477 | | 3,225,465 | | | | 39,845,648 | |
| Shares redeemed | (12,473,788 | ) | | | (149,848,620 | ) | (23,011,849 | ) | | | (280,181,523 | ) |
| Net increase (decrease) | 244,991 | | | $ | 5,303,215 | | (2,691,072 | ) | | $ | (27,569,424 | ) |
| Year ended February 28, 2010 | | | | | | | | | | | | |
| Shares sold | 13,441,424 | | $ | 162,227,348 | | 20,139,038 | | $ | 249,409,233 | |
| Shares issued in reinvestment | | | | | | | | | | | | |
| of distributions | 1,587,293 | | | | 19,173,994 | | 2,882,344 | | | | 35,726,254 | |
| Shares redeemed | (7,435,457 | ) | | | (89,730,557 | ) | (12,620,955 | ) | | | (156,099,076 | ) |
| Net increase (decrease) | 7,593,260 | | | $ | 91,670,785 | | 10,400,427 | | $ | 129,036,411 | |
| Class B Shares: | | | | | | | | | | | | |
| Year ended February 28, 2011 | | | | | | | | | | | | |
| Shares sold | | | | | | | 18,160 | | | $ | 229,651 | |
| Shares issued in reinvestment | | | | | | | | | | | | |
| of distributions | | | | | | | 43,289 | | | | 538,999 | |
| Shares redeemed | | | | | | | (1,287,553 | ) | | | (15,977,505 | ) |
| Net increase (decrease) | | | | | | | (1,226,104 | ) | | $ | (15,208,855 | ) |
| Year ended February 28, 2010 | | | | | | | | | | | | |
| Shares sold | | | | | | | 20,976 | | | $ | 258,053 | |
| Shares issued in reinvestment | | | | | | | | | | | | |
| of distributions | | | | | | | 67,842 | | | | 843,195 | |
| Shares redeemed | | | | | | | (911,329 | ) | | | (11,341,598 | ) |
| Net increase (decrease) | | | | | | | (822,511 | ) | | $ | (10,240,350 | ) |
| Class C Shares: | | | | | | | | | | | | |
| Year ended February 28, 2011 | | | | | | | | | | | | |
| Shares sold | 5,466,751 | | | $ | 67,373,672 | | 8,376,188 | | $ | 105,879,896 | |
| Shares issued in reinvestment | | | | | | | | | | | | |
| of distributions | 395,327 | | | | 4,836,073 | | 687,538 | | | | 8,571,726 | |
| Shares redeemed | (3,509,383 | ) | | | (42,295,438 | ) | (6,259,145 | ) | | | (76,595,917 | ) |
| Net increase (decrease) | 2,352,695 | | | $ | 29,914,307 | | 2,804,581 | | | $ | 37,855,705 | |
| Year ended February 28, 2010 | | | | | | | | | | | | |
| Shares sold | 6,126,237 | | | $ | 74,645,880 | | 7,938,848 | | | $ | 99,369,344 | |
| Shares issued in reinvestment | | | | | | | | | | | | |
| of distributions | 253,689 | | | | 3,091,524 | | 496,115 | | | | 6,210,680 | |
| Shares redeemed | (1,102,981 | ) | | | (13,438,004 | ) | (2,199,150 | ) | | | (27,455,783 | ) |
| Net increase (decrease) | 5,276,945 | | | $ | 64,299,400 | | 6,235,813 | | | $ | 78,124,241 | |
196 | Annual Report
| | | | | | | | | | | | |
| Franklin Tax-Free Trust | | | | | | | |
| |
| Notes to Financial Statements (continued) | | | | | | | | |
| |
| |
| 2. SHARES OF BENEFICIAL INTEREST (continued) | | | | | | | | | | | |
| |
| | Franklin Minnesota | | Franklin Ohio | |
| | Tax-Free Income Fund | | Tax-Free Income Fund | |
| | Shares | | | | Amount | | Shares | | | | Amount | |
| Advisor Class Shares: | | | | | | | | | | | | |
| Year ended February 28, 2011 | | | | | | | | | | | | |
| Shares sold | 623,170 | | | $ | 7,397,563 | | 983,536 | | | $ | 12,181,534 | |
| Shares issued in reinvestment | | | | | | | | | | | | |
| of distributions | 2,122 | | | | 25,612 | | 9,715 | | | | 117,554 | |
| Shares redeemed | (79,702 | ) | | | (971,906 | ) | (487,913 | ) | | | (5,901,225 | ) |
| Net increase (decrease) | 545,590 | | | $ | 6,451,269 | | 505,338 | | | $ | 6,397,863 | |
| Year ended February 28, 2010a | | | | | | | | | | | | |
| Shares sold | 451,329 | | | $ | 5,435,791 | | 1,194,735 | | | $ | 14,728,066 | |
| Shares issued in reinvestment | | | | | | | | | | | | |
| of distributions | 58 | | | | 707 | | 1,630 | | | | 20,233 | |
| Shares redeemed | (86,638 | ) | | | (1,054,930 | ) | (156,086 | ) | | | (1,947,423 | ) |
| Net increase (decrease) | 364,749 | | | $ | 4,381,568 | | 1,040,279 | | | $ | 12,800,876 | |
| |
| aFor the period July 1, 2009 (effective date) to February 28, 2010 for the Franklin Minnesota Tax-Free Income Fund. | | | | | |
| |
| | Franklin Oregon | | Franklin Pennsylvania | |
| | Tax-Free Income Fund | | Tax-Free Income Fund | |
| | Shares | | | | Amount | | Shares | | | | Amount | |
| Class A Shares: | | | | | | | | | | | | |
| Year ended February 28, 2011 | | | | | | | | | | | | |
| Shares sold | 15,686,913 | | $ | 186,972,619 | | 22,147,627 | | $ | 227,986,068 | |
| Shares issued in reinvestment | | | | | | | | | | | | |
| of distributions | 2,690,314 | | | | 31,802,077 | | 3,079,880 | | | | 31,423,006 | |
| Shares redeemed | (16,345,936 | ) | | | (191,198,813 | ) | (22,098,908 | ) | | | (222,465,601 | ) |
| Net increase (decrease) | 2,031,291 | | | $ | 27,575,883 | | 3,128,599 | | | $ | 36,943,473 | |
| Year ended February 28, 2010 | | | | | | | | | | | | |
| Shares sold | 16,304,964 | | $ | 189,113,883 | | 21,756,734 | | $ | 219,416,349 | |
| Shares issued in reinvestment | | | | | | | | | | | | |
| of distributions | 2,338,185 | | | | 27,187,860 | | 2,570,792 | | | | 25,885,964 | |
| Shares redeemed | (8,476,619 | ) | | | (98,392,155 | ) | (10,336,327 | ) | | | (103,691,466 | ) |
| Net increase (decrease) | 10,166,530 | | $ | 117,909,588 | | 13,991,199 | | $ | 141,610,847 | |
| Class B Shares: | | | | | | | | | | | | |
| Year ended February 28, 2011 | | | | | | | | | | | | |
| Shares sold | | | | | | | 27,364 | | | $ | 284,103 | |
| Shares issued in reinvestment | | | | | | | | | | | | |
| of distributions | | | | | | | 43,806 | | | | 450,242 | |
| Shares redeemed | | | | | | | (1,025,877 | ) | | | (10,509,165 | ) |
| Net increase (decrease) | | | | | | | (954,707 | ) | | $ | (9,774,820 | ) |
| Year ended February 28, 2010 | | | | | | | | | | | | |
| Shares sold | | | | | | | 15,147 | | | $ | 154,176 | |
| Shares issued in reinvestment | | | | | | | | | | | | |
| of distributions | | | | | | | 66,366 | | | | 668,594 | |
| Shares redeemed | | | | | | | (1,066,395 | ) | | | (10,749,889 | ) |
| Net increase (decrease) | | | | | | | (984,882 | ) | | $ | (9,927,119 | ) |
Annual Report | 197
| | | | | | | | | | |
| Franklin Tax-Free Trust | | | | | | |
| |
| Notes to Financial Statements (continued) | | | | | | | |
| |
| |
| 2. SHARES OF BENEFICIAL INTEREST (continued) | | | | | | | | | |
| |
| | Franklin Oregon | | Franklin Pennsylvania | |
| | Tax-Free Income Fund | | Tax-Free Income Fund | |
| | Shares | | | Amount | | Shares | | | Amount | |
| Class C Shares: | | | | | | | | | | |
| Year ended February 28, 2011 | | | | | | | | | | |
| Shares sold | 5,130,612 | | $ | 61,943,115 | | 7,400,045 | | $ | 77,076,028 | |
| Shares issued in reinvestment | | | | | | | | | | |
| of distributions | 494,285 | | | 5,912,355 | | 630,293 | | | 6,488,804 | |
| Shares redeemed | (4,958,641 | ) | | (58,371,632 | ) | (5,023,541 | ) | | (50,847,162 | ) |
| Net increase (decrease) | 666,256 | | $ | 9,483,838 | | 3,006,797 | | $ | 32,717,670 | |
| Year ended February 28, 2010 | | | | | | | | | | |
| Shares sold | 6,565,810 | | $ | 77,192,328 | | 8,509,665 | | $ | 86,482,377 | |
| Shares issued in reinvestment | | | | | | | | | | |
| of distributions | 360,226 | | | 4,241,147 | | 439,460 | | | 4,469,284 | |
| Shares redeemed | (1,509,031 | ) | | (17,705,611 | ) | (1,902,094 | ) | | (19,299,029 | ) |
| Net increase (decrease) | 5,417,005 | | $ | 63,727,864 | | 7,047,031 | | $ | 71,652,632 | |
| Advisor Class Shares: | | | | | | | | | | |
| Year ended February 28, 2011 | | | | | | | | | | |
| Shares sold | 1,160,522 | | $ | 13,892,174 | | 1,600,293 | | $ | 16,648,834 | |
| Shares issued in reinvestment | | | | | | | | | | |
| of distributions | 16,040 | | | 186,232 | | 16,070 | | | 159,667 | |
| Shares redeemed | (455,624 | ) | | (5,233,004 | ) | (355,672 | ) | | (3,566,219 | ) |
| Net increase (decrease) | 720,938 | | $ | 8,845,402 | | 1,260,691 | | $ | 13,242,282 | |
| Year ended February 28, 2010a | | | | | | | | | | |
| Shares sold | 577,308 | | $ | 6,667,530 | | 760,831 | | $ | 7,638,231 | |
| Shares issued in reinvestment | | | | | | | | | | |
| of distributions | 435 | | | 5,145 | | 323 | | | 3,303 | |
| Shares redeemed | (37,667 | ) | | (445,531 | ) | (96,017 | ) | | (984,132 | ) |
| Net increase (decrease) | 540,076 | | $ | 6,227,144 | | 665,137 | | $ | 6,657,402 | |
| aFor the period July 15, 2009 (effective date) to February 28, 2010. | | | | | | | | | |
3. TRANSACTIONS WITH AFFILIATES
Franklin Resources, Inc. is the holding company for various subsidiaries that together are referred to as Franklin Templeton Investments. Certain officers and trustees of the Funds are also officers and/or directors of the following subsidiaries:
| |
| Subsidiary | Affiliation |
| Franklin Advisers, Inc. (Advisers) | Investment manager |
| Franklin Templeton Services, LLC (FT Services) | Administrative manager |
| Franklin Templeton Distributors, Inc. (Distributors) | Principal underwriter |
| Franklin Templeton Investor Services, LLC (Investor Services) | Transfer agent |
198 | Annual Report
Franklin Tax-Free Trust
Notes to Financial Statements (continued)
| 3. | TRANSACTIONS WITH AFFILIATES (continued) |
| a. | Management Fees |
The Funds pay an investment management fee to Advisers based on the month-end net assets of each of the Funds as follows:
| | |
| Annualized Fee Rate | | Net Assets |
| 0.625 | % | Up to and including $100 million |
| 0.500 | % | Over $100 million, up to and including $250 million |
| 0.450 | % | Over $250 million, up to and including $7.5 billion |
| 0.440 | % | Over $7.5 billion, up to and including $10 billion |
| 0.430 | % | Over $10 billion, up to and including $12.5 billion |
| 0.420 | % | Over $12.5 billion, up to and including $15 billion |
| 0.400 | % | Over $15 billion, up to and including $17.5 billion |
| 0.380 | % | Over $17.5 billion, up to and including $20 billion |
| 0.360 | % | In excess of $20 billion |
b. Administrative Fees
Under an agreement with Advisers, FT Services provides administrative services to the Funds. The fee is paid by Advisers based on average daily net assets, and is not an additional expense of the Funds.
c. Distribution Fees
The Trust’s Board of Trustees has adopted distribution plans for each share class, with the exception of Advisor Class shares, pursuant to Rule 12b-1 under the 1940 Act. Under the Funds’ Class A reimbursement distribution plans, the Funds reimburse Distributors for costs incurred in connection with the servicing, sale and distribution of the Funds’ shares up to the maximum annual plan rate. Under the Class A reimbursement distribution plans, costs exceeding the maximum for the current plan year cannot be reimbursed in subsequent periods.
In addition, under the funds’ Class B and C compensation distribution plans, the funds pay Distributors for costs incurred in connection with the servicing, sale and distribution of each fund’s shares up to the maximum annual plan rate for each class.
The maximum annual plan rates, based on the average daily net assets, for each class, are as follows:
| | | | | | | | |
| | Franklin | | Franklin | | Franklin | | Franklin | |
| | Arizona | | Colorado | | Connecticut | | Michigan | |
| | Tax-Free | | Tax-Free | | Tax-Free | | Tax-Free | |
| | Income Fund | | Income Fund | | Income Fund | | Income Fund | |
| Reimbursement Plans: | | | | | | | | |
| Class A | 0.10 | % | 0.10 | % | 0.10 | % | 0.10 | % |
| Compensation Plans: | | | | | | | | |
| Class B | 0.65 | % | — | | — | | 0.65 | % |
| Class C | 0.65 | % | 0.65 | % | 0.65 | % | 0.65 | % |
Annual Report | 199
Franklin Tax-Free Trust
Notes to Financial Statements (continued)
| 3. | TRANSACTIONS WITH AFFILIATES (continued) |
| c. | Distribution Fees (continued) |
| | | | | | | | |
| | Franklin | | Franklin | | Franklin | | Franklin | |
| | Minnesota | | Ohio | | Oregon | | Pennsylvania | |
| | Tax-Free | | Tax-Free | | Tax-Free | | Tax-Free | |
| | Income Fund | | Income Fund | | Income Fund | | Income Fund | |
| Reimbursement Plans: | | | | | | | | |
| Class A | 0.10 | % | 0.10 | % | 0.10 | % | 0.10 | % |
| Compensation Plans: | | | | | | | | |
| Class B | — | | 0.65 | % | — | | 0.65 | % |
| Class C | 0.65 | % | 0.65 | % | 0.65 | % | 0.65 | % |
d. Sales Charges/Underwriting Agreements
Distributors has advised the Funds of the following commission transactions related to the sales and redemptions of the Funds’ shares for the year:
| | | | | | | | |
| | | Franklin | | Franklin | | Franklin | | Franklin |
| | | Arizona | | Colorado | | Connecticut | | Michigan |
| | | Tax-Free | | Tax-Free | | Tax-Free | | Tax-Free |
| | | Income Fund | | Income Fund | | Income Fund | | Income Fund |
| Sales charges retained net of commissions | | | | | | | | |
| paid to unaffiliated broker/dealers | $ | 273,049 | $ | 252,589 | $ | 158,809 | $ | 341,921 |
| Contingent deferred sales charges retained | $ | 60,926 | $ | 65,076 | $ | 65,063 | $ | 60,816 |
| |
| | | Franklin | | Franklin | | Franklin | | Franklin |
| | | Minnesota | | Ohio | | Oregon | | Pennsylvania |
| | | Tax-Free | | Tax-Free | | Tax-Free | | Tax-Free |
| | | Income Fund | | Income Fund | | Income Fund | | Income Fund |
| Sales charges retained net of commissions | | | | | | | | |
| paid to unaffiliated broker/dealers | $ | 280,886 | $ | 580,135 | $ | 552,425 | $ | 600,903 |
| Contingent deferred sales charges retained | $ | 46,081 | $ | 120,391 | $ | 58,867 | $ | 74,258 |
e. Transfer Agent Fees
For the year ended February 28, 2011, the Funds paid transfer agent fees as noted in the Statements of Operations of which the following amounts were retained by Investor Services:
| | | | | | | | |
| | | Franklin | | Franklin | | Franklin | | Franklin |
| | | Arizona | | Colorado | | Connecticut | | Michigan |
| | | Tax-Free | | Tax-Free | | Tax-Free | | Tax-Free |
| | | Income Fund | | Income Fund | | Income Fund | | Income Fund |
| Transfer agent fees | $ | 178,333 | $ | 139,611 | $ | 101,150 | $ | 414,104 |
| |
| | | Franklin | | Franklin | | Franklin | | Franklin |
| | | Minnesota | | Ohio | | Oregon | | Pennsylvania |
| | | Tax-Free | | Tax-Free | | Tax-Free | | Tax-Free |
| | | Income Fund | | Income Fund | | Income Fund | | Income Fund |
| Transfer agent fees | $ | 232,815 | $ | 402,759 | $ | 214,998 | $ | 352,812 |
200 | Annual Report
Franklin Tax-Free Trust
Notes to Financial Statements (continued)
4. INCOME TAXES
For tax purposes, capital losses may be carried over to offset future capital gains, if any.
At February 28, 2011, the capital loss carryforwards were as follows:
| | | | | | | | |
| | | Franklin | | Franklin | | Franklin | | Franklin |
| | | Arizona | | Colorado | | Connecticut | | Minnesota |
| | | Tax-Free | | Tax-Free | | Tax-Free | | Tax-Free |
| | | Income Fund | | Income Fund | | Income Fund | | Income Fund |
| Capital loss carryforwards expiring in: | | | | | | | | |
| 2012 | $ | 11,755,514 | $ | 4,695,674 | $ | 2,178,971 | $ | — |
| 2014 | | 2,638,564 | | — | | — | | — |
| 2015 | | 659,023 | | — | | — | | 502,103 |
| 2017 | | — | | — | | — | | 1,004,796 |
| 2018 | | — | | 2,700,288 | | — | | 286,131 |
| 2019 | | — | | 1,448,482 | | — | | — |
| | $ | 15,053,101 | $ | 8,844,444 | $ | 2,178,971 | $ | 1,793,030 |
| |
| | | Franklin | | Franklin | | Franklin | | |
| | | Ohio | | Oregon | | Pennsylvania | | |
| | | Tax-Free | | Tax-Free | | Tax-Free | | |
| | | Income Fund | | Income Fund | | Income Fund | | |
| Capital loss carryforwards expiring in: | | | | | | | | |
| 2012 | $ | — | $ | 2,111,354 | $ | — | | |
| 2013 | | — | | — | | 577,446 | | |
| 2016 | | — | | 972,134 | | — | | |
| 2017 | | 264,319 | | — | | — | | |
| 2018 | | — | | — | | 3,499,532 | | |
| | $ | 264,319 | $ | 3,083,488 | $ | 4,076,978 | | |
During the year ended February 28, 2011, the funds utilized capital loss carryforwards as follows:
| | | | | | | | | | | |
| | Franklin | | Franklin | | Franklin | | Franklin | | Franklin | | Franklin |
| | Arizona | | Connecticut | | Minnesota | | Ohio | | Oregon | | Pennsylvania |
| | Tax-Free | | Tax-Free | | Tax-Free | | Tax-Free | | Tax-Free | | Tax-Free |
| | Income Fund | | Income Fund | | Income Fund | | Income Fund | | Income Fund | | Income Fund |
| $ | 1,201,940 | $ | 712,473 | $ | 972,897 | $ | 2,839,370 | $ | 155,474 | $ | 298,769 |
On February 28, 2011, the Franklin Colorado Tax-Free Income Fund had expired capital loss carryforwards of $81,665, which were reclassified to paid-in capital.
For tax purposes, realized capital losses occurring subsequent to October 31 may be deferred and treated as occurring on the first day of the following fiscal year. At February 28, 2011, deferred losses were as follows:
| | | | | | | | | | | | | |
| | Franklin | | Franklin | | Franklin | | Franklin | | Franklin | | Franklin | | Franklin |
| | Colorado | | Connecticut | | Michigan | | Minnesota | | Ohio | | Oregon | | Pennsylvania |
| | Tax-Free | | Tax-Free | | Tax-Free | | Tax-Free | | Tax-Free | | Tax-Free | | Tax-Free |
| | Income Fund | | Income Fund | | Income Fund | | Income Fund | | Income Fund | | Income Fund | | Income Fund |
| $ | 3,137,145 | $ | 1,812,225 | $ | 5,705,678 | $ | 1,807,976 | $ | 5,731,367 | $ | 1,991,570 | $ | 2,781,432 |
Annual Report | 201
Franklin Tax-Free Trust
Notes to Financial Statements (continued)
4. INCOME TAXES (continued)
The tax character of distributions paid during the years ended February 28, 2011 and 2010, was as follows:
| | | | | | | | |
| | | Franklin Arizona | | Franklin Colorado |
| | | Tax-Free Income Fund | | Tax-Free Income Fund |
| | | 2011 | | 2010 | | 2011 | | 2010 |
| Distributions paid from | | | | | | | | |
| tax exempt income | $ | 47,745,854 | $ | 48,739,632 | $ | 30,679,277 | $ | 27,543,841 |
| |
| | | Franklin Connecticut | | Franklin Michigan |
| | | Tax-Free Income Fund | | Tax-Free Income Fund |
| | | 2011 | | 2010 | | 2011 | | 2010 |
| Distributions paid from: | | | | | | | | |
| Tax exempt income | $ | 21,498,565 | $ | 18,927,678 | $ | 64,894,382 | $ | 66,702,147 |
| Long term capital gain | | — | | — | | 2,006,075 | | — |
| | $ | 21,498,565 | $ | 18,927,678 | $ | 66,900,457 | $ | 66,702,147 |
| |
| | | Franklin Minnesota | | Franklin Ohio |
| | | Tax-Free Income Fund | | Tax-Free Income Fund |
| | | 2011 | | 2010 | | 2011 | | 2010 |
| Distributions paid from | | | | | | | | |
| tax exempt income | $ | 36,687,131 | $ | 32,641,674 | $ | 67,390,130 | $ | 60,653,532 |
| |
| | | Franklin Oregon | | Franklin Pennsylvania |
| | | Tax-Free Income Fund | | Tax-Free Income Fund |
| | | 2011 | | 2010 | | 2011 | | 2010 |
| Distributions paid from | | | | | | | | |
| tax exempt income | $ | 50,772,792 | $ | 42,937,904 | $ | 57,274,542 | $ | 48,075,279 |
At February 28, 2011, the cost of investments, net unrealized appreciation (depreciation), and undistributed tax exempt income for income tax purposes were as follows:
| | | | | | | | | | | | |
| | | Franklin | | | Franklin | | | Franklin | | | Franklin | |
| | | Arizona | | | Colorado | | | Connecticut | | | Michigan | |
| | | Tax-Free | | | Tax-Free | | | Tax-Free | | | Tax-Free | |
| | | Income Fund | | | Income Fund | | | Income Fund | | | Income Fund | |
| Cost of investments | $ | 982,117,129 | | $ | 662,810,080 | | $ | 487,203,041 | | $ | 1,398,604,639 | |
| |
| Unrealized appreciation | $ | 18,677,483 | | $ | 12,797,082 | | $ | 5,249,534 | | $ | 31,731,589 | |
| Unrealized depreciation | | (55,742,504 | ) | | (32,186,159 | ) | | (19,057,345 | ) | | (46,260,941 | ) |
| Net unrealized appreciation | | | | | | | | | | | | |
| (depreciation) | $ | (37,065,021 | ) | $ | (19,389,077 | ) | $ | (13,807,811 | ) | $ | (14,529,352 | ) |
| |
| Distributable earnings – | | | | | | | | | | | | |
| undistributed tax exempt | | | | | | | | | | | | |
| income | $ | 556,219 | | $ | 530,809 | | $ | 615,060 | | $ | 912,664 | |
202 | Annual Report
| | | | | | | | | | | | | |
| Franklin Tax-Free Trust | | | | | | | |
| |
| Notes to Financial Statements (continued) | | | | | | | |
| |
| |
| 4. INCOME TAXES (continued) | | | | | | | | | | | | | |
| |
| | | Franklin | | | | Franklin | | | Franklin | | | Franklin | |
| | | Minnesota | | | | Ohio | | | Oregon | | | Pennsylvania | |
| | | Tax-Free | | | | Tax-Free | | | Tax-Free | | | Tax-Free | |
| | | Income Fund | | | | Income Fund | | | Income Fund | | | Income Fund | |
| Cost of investments | $ | 943,110,375 | | $ | 1,575,614,145 | | $ | 1,165,052,048 | | $ | 1,310,310,275 | |
| |
| Unrealized appreciation | $ | 23,838,754 | | | $ | 32,411,333 | | $ | 31,728,278 | | $ | 22,936,988 | |
| Unrealized depreciation | | (10,628,179 | ) | | | (50,530,371 | ) | | (32,599,889 | ) | | (50,465,437 | ) |
| Net unrealized appreciation | | | | | | | | | | | | | |
| (depreciation) | $ | 13,210,575 | | | $ | (18,119,038 | ) | $ | (871,611 | ) | $ | (27,528,449 | ) |
| |
| Distributable earnings – | | | | | | | | | | | | | |
| undistributed tax exempt | | | | | | | | | | | | | |
| income | $ | 666,373 | | | $ | 1,413,976 | | $ | 1,753,246 | | $ | 1,629,940 | |
Net investment income differs for financial statement and tax purposes primarily due to differing treatment of bond discounts.
Net realized gains (losses) differ for financial statement and tax purposes primarily due to differing treatments of wash sales and bond discounts.
5. INVESTMENT TRANSACTIONS
Purchases and sales of investments (excluding short term securities) for the year ended February 28, 2011, were as follows:
| | | | | | | | |
| | | Franklin | | Franklin | | Franklin | | Franklin |
| | | Arizona | | Colorado | | Connecticut | | Michigan |
| | | Tax-Free | | Tax-Free | | Tax-Free | | Tax-Free |
| | | Income Fund | | Income Fund | | Income Fund | | Income Fund |
| Purchases | $ | 146,556,302 | $ | 161,854,123 | $ | 79,994,862 | $ | 161,814,585 |
| Sales | $ | 247,700,759 | $ | 158,904,652 | $ | 89,318,733 | $ | 264,221,602 |
| |
| | | Franklin | | Franklin | | Franklin | | Franklin |
| | | Minnesota | | Ohio | | Oregon | | Pennsylvania |
| | | Tax-Free | | Tax-Free | | Tax-Free | | Tax-Free |
| | | Income Fund | | Income Fund | | Income Fund | | Income Fund |
| Purchases | $ | 190,231,004 | $ | 332,824,178 | $ | 162,897,920 | $ | 288,568,638 |
| Sales | $ | 143,325,100 | $ | 312,408,949 | $ | 96,455,773 | $ | 174,914,872 |
Annual Report | 203
Franklin Tax-Free Trust
Notes to Financial Statements (continued)
6. CONCENTRATION OF RISK
Each of the funds invests a large percentage of its total assets in obligations of issuers within its respective state and U.S. territories. Such concentration may subject the Funds to risks associated with industrial or regional matters, and economic, political or legal developments occurring within those states and U.S. territories. In addition, investments in these securities are sensitive to interest rate changes and credit risk of the issuer and may subject the funds to increased market volatility. The market for these investments may be limited, which may make them difficult to buy or sell.
7. CREDIT FACILITY
The Funds, together with other U.S. registered and foreign investment funds (collectively “Borrowers”), managed by Franklin Templeton Investments, are borrowers in a joint syndicated senior unsecured credit facility totaling $750 million (Global Credit Facility) which matures on January 20, 2012. This Global Credit Facility provides a source of funds to the Borrowers for temporary and emergency purposes, including the ability to meet future unanticipated or unusually large redemption requests.
Under the terms of the Global Credit Facility, the Funds shall, in addition to interest charged on any borrowings made by the Funds and other costs incurred by the Funds, pay their share of fees and expenses incurred in connection with the implementation and maintenance of the Global Credit Facility, based upon their relative share of the aggregate net assets of all of the Borrowers, including an annual commitment fee of 0.08% based upon the unused portion of the Global Credit Facility, which is reflected in other expenses on the Statements of Operations. During the year ended February 28, 2011, the Funds did not use the Global Credit Facility.
8. FAIR VALUE MEASUREMENTS
The Funds follow a fair value hierarchy that distinguishes between market data obtained from independent sources (observable inputs) and the Funds’ own market assumptions (unobservable inputs). These inputs are used in determining the value of the Funds’ investments and are summarized in the following fair value hierarchy:
- Level 1 – quoted prices in active markets for identical securities
- Level 2 – other significant observable inputs (including quoted prices for similar securities, interest rates, prepayment speed, credit risk, etc.)
- Level 3 – significant unobservable inputs (including the Funds’ own assumptions in determining the fair value of investments)
The inputs or methodology used for valuing securities are not an indication of the risk associated with investing in those securities.
204 | Annual Report
Franklin Tax-Free Trust
Notes to Financial Statements (continued)
8. FAIR VALUE MEASUREMENTS (continued)
For movements between the levels within the fair value hierarchy, the Funds have adopted a policy of recognizing the transfers as of the date of the underlying event which caused the movement.
At February 28, 2011, all of the Funds’ investments in securities carried at fair value were in Level 2 inputs.
9. SUBSEQUENT EVENTS
The Funds have evaluated subsequent events through the issuance of the financial statements and determined that no events have occurred that require disclosure.
| | | |
| ABBREVIATIONS | | |
| |
| Selected Portfolio | | |
| |
| ACA | - American Capital Access Holdings Inc. | HFAR | - Housing Finance Authority Revenue |
| AGMC | - Assured Guaranty Municipal Corp. | HFC | - Housing Finance Corp. |
| AMBAC | - American Municipal Bond Assurance | HMR | - Home Mortgage Revenue |
| | Corp. | ID | - Improvement District |
| BHAC | - Berkshire Hathaway Assurance Corp. | IDA | - Industrial Development Authority/Agency |
| BIG | - Bond Investors Guaranty Insurance Co. | IDAR | - Industrial Development Authority Revenue |
| | (acquired by MBIA in 1989 and no longer | IDR | - Industrial Development Revenue |
| | does business under this name; on | | |
| | February 18, 2009, most MBIA Insured | ISD | - Independent School District |
| | were replaced with NATL Insured through | MF | - Multi-Family |
| | a spin-off) | MFH | - Multi-Family Housing |
| CDA | - Community Development Authority/Agency | MFHR | - Multi-Family Housing Revenue |
| CIFG | - CDC IXIS Financial Guaranty | MFR | - Multi-Family Revenue |
| COP | - Certificate of Participation | NATL | - National Public Financial Guarantee Corp. |
| EDA | - Economic Development Authority | NATL RE | - National Public Financial Guarantee Corp. |
| EDC | - Economic Development Corp. | | Reinsured |
| EDR | - Economic Development Revenue | PBA | - Public Building Authority |
| ETM | - Escrow to Maturity | PCC | - Pollution Control Corp. |
| FGIC | - Financial Guaranty Insurance Co. | PCR | - Pollution Control Revenue |
| FHA | - Federal Housing Authority/Agency | PFAR | - Public Financing Authority Revenue |
| FICO | - Financing Corp. | RDA | - Redevelopment Agency/Authority |
| GNMA | - Government National Mortgage | RDAR | - Redevelopment Agency Revenue |
| | Association | SFM | - Single Family Mortgage |
| GO | - General Obligation | SFMR | - Single Family Mortgage Revenue |
| HDA | - Housing Development Authority/Agency | USD | - Unified/Union School District |
| HDC | - Housing Development Corp. | XLCA | - XL Capital Assurance |
| HFA | - Housing Finance Authority/Agency | | |
Annual Report | 205
Franklin Tax-Free Trust
Report of Independent Registered Public Accounting Firm
To the Board of Trustees and Shareholders of Franklin Tax-Free Trust
In our opinion, the accompanying statements of assets and liabilities, including the statements of investments, and the related statements of operations and of changes in net assets and the financial highlights present fairly, in all material respects, the financial position of Franklin Arizona Tax-Free Income Fund, Franklin Colorado Tax-Free Income Fund, Franklin Connecticut Tax-Free Income Fund, Franklin Michigan Tax-Free Income Fund, Franklin Minnesota Tax-Free Income Fund, Franklin Ohio Tax-Free Income Fund, Franklin Oregon Tax-Free Income Fund, and Franklin Pennsylvania Tax-Free Income Fund (separate portfolios of Franklin Tax-Free Trust, hereafter referred to as the “Funds”) at February 28, 2011, the results of each of their operations for the year then ended, the changes in each of their net assets for each of the two years in the period then ended and the financial highlights for each of the periods presented, in conformity with accounting principles generally accepted in the United States of America. These financial statements and financial highlights (hereafter referred to as “financial statements”) are the responsibility of the Funds’ management. Our responsibility is to express an opinion on these financial statements based on our audits. We conducted our audits of these financial statements in accordance with the standards of the Public Company Accounting Oversight Board (United States). Those standards require that we plan and perform the audit to obtain reasonable assurance about whether the financial statements are free of material misstatement. An audit includes examining, on a test basis, evidence supporting the amounts and disclosures in the financial statements, assessing the accounting principles used and significant estimates made by management, and evaluating the overall financial statement presentation. We believe that our audits, which included confirmation of securities at February 28, 2011 by correspondence with the custodian and brokers, provide a reasonable basis for our opinion.
PricewaterhouseCoopers LLP
San Francisco, California
April 18, 2011
206 | Annual Report
Franklin Tax-Free Trust
Tax Designation (unaudited)
Under Section 852(b)(5)(A) of the Internal Revenue Code, the Funds designate 100% of the distributions paid from net investment income as exempt-interest dividends for the fiscal year ended February 28, 2011. A portion of the Fund’s exempt-interest dividends may be subject to the federal alternative minimum tax. In January 2012, shareholders will be notified of amounts for use in preparing their 2011 income tax returns.
Annual Report | 207
Franklin Tax-Free Trust
Board Members and Officers
The name, year of birth and address of the officers and board members, as well as their affiliations, positions held with the Trust, principal occupations during the past five years and number of portfolios overseen in the Franklin Templeton Investments fund complex are shown below. Generally, each board member serves until that person’s successor is elected and qualified.
Independent Board Members
| | | | |
| | | | Number of Portfolios in | |
| Name, Year of Birth | | Length of | Fund Complex Overseen | |
| and Address | Position | Time Served | by Board Member* | Other Directorships Held |
| Harris J. Ashton (1932) | Trustee | Since 1984 | 130 | Bar-S Foods (meat packing company) |
| One Franklin Parkway | | | | (1981-2010). |
| San Mateo, CA 94403-1906 | | | | |
| Principal Occupation During Past 5 Years: | | | |
| Director of various companies; and formerly, Director, RBC Holdings, Inc. (bank holding company) (until 2002); and President, Chief Executive |
| Officer and Chairman of the Board, General Host Corporation (nursery and craft centers) (until 1998). | |
| |
| Sam Ginn (1937) | Trustee | Since 2007 | 106 | ICO Global Communications |
| One Franklin Parkway | | | | (Holdings) Limited (satellite company). |
| San Mateo, CA 94403-1906 | | | | |
| Principal Occupation During Past 5 Years: | | | |
| Private investor; and formerly, Chairman of the Board, Vodafone AirTouch, PLC (wireless company); Chairman of the Board and Chief |
| Executive Officer, AirTouch Communications (cellular communications) (1993-1998) and Pacific Telesis Group (telephone holding company) |
| (1988-1994). | | | | |
| |
| Edith E. Holiday (1952) | Trustee | Since 1998 | 130 | Hess Corporation (exploration and |
| One Franklin Parkway | | | | refining of oil and gas), H.J. Heinz |
| San Mateo, CA 94403-1906 | | | | Company (processed foods and allied |
| | | | | products), RTI International Metals, |
| | | | | Inc. (manufacture and distribution |
| | | | | of titanium), Canadian National |
| | | | | Railway (railroad) and White |
| | | | | Mountains Insurance Group, Ltd. |
| | | | | (holding company). |
| Principal Occupation During Past 5 Years: | | | |
| Director or Trustee of various companies and trusts; and formerly, Assistant to the President of the United States and Secretary of the Cabinet |
| (1990-1993); General Counsel to the United States Treasury Department (1989-1990); and Counselor to the Secretary and Assistant Secretary, |
| Public Affairs and Public Liaison – United States Treasury Department (1988-1989). | |
| |
| J. Michael Luttig (1954) | Trustee | Since 2009 | 130 | Boeing Capital Corporation (aircraft |
| One Franklin Parkway | | | | financing). |
| San Mateo, CA 94403-1906 | | | | |
| Principal Occupation During Past 5 Years: | | | |
| Executive Vice President, General Counsel and member of Executive Council, The Boeing Company; and formerly, Federal Appeals Court |
| Judge, U.S. Court of Appeals for the Fourth Circuit (1991-2006). | | |
| |
| |
| |
| |
| 208 | Annual Report | | | | |
| | | | | |
| | | | | Number of Portfolios in | |
| Name, Year of Birth | | Length of | | Fund Complex Overseen | |
| and Address | Position | Time Served | | by Board Member* | Other Directorships Held |
| Frank A. Olson (1932) | Trustee | Since 2005 | | 130 | Hess Corporation (exploration and |
| One Franklin Parkway | | | | | refining of oil and gas). |
| San Mateo, CA 94403-1906 | | | | | |
| Principal Occupation During Past 5 Years: | | | | |
| Chairman Emeritus, The Hertz Corporation (car rental) (since 2000) (Chairman of the Board (1980-2000) and Chief Executive Officer |
| (1977-1999)); and formerly, Chairman of the Board, President and Chief Executive Officer, UAL Corporation (airlines). |
| |
| Larry D. Thompson (1945) | Trustee | Since 2007 | | 138 | Cbeyond, Inc. (business communi- |
| One Franklin Parkway | | | | | cations provider) and The Southern |
| San Mateo, CA 94403-1906 | | | | | Company (energy company). |
| Principal Occupation During Past 5 Years: | | | | |
| Senior Vice President – Government Affairs, General Counsel and Secretary, PepsiCo, Inc. (consumer products); and formerly, Director, Delta |
| Airlines (aviation) (2003-2005) and Providian Financial Corp. (credit card provider) (1997-2001); Senior Fellow of The Brookings Institution |
| (2003-2004); Visiting Professor, University of Georgia School of Law (2004); and Deputy Attorney General, U.S. Department of Justice |
| (2001-2003). | | | | | |
| |
| John B. Wilson (1959) | Lead | Trustee since | | 106 | None |
| One Franklin Parkway | Independent | 2007 and Lead | | | |
| San Mateo, CA 94403-1906 | Trustee | Independent | | | |
| | | Trustee | | | |
| | | since 2008 | | | |
| Principal Occupation During Past 5 Years: | �� | | | |
| President and Founder, Hyannis Port Capital, Inc. (real estate and private equity investing); serves on private and non-profit boards; and |
| formerly, Chief Operating Officer and Executive Vice President, Gap, Inc. (retail) (1996-2000); Chief Financial Officer and Executive Vice |
| President – Finance and Strategy, Staples, Inc. (office supplies) (1992-1996); Senior Vice President – Corporate Planning, Northwest Airlines, |
| Inc. (airlines) (1990-1992); and Vice President and Partner, Bain & Company (consulting firm) (1986-1990). |
| |
| |
| |
| Interested Board Members and Officers | | | |
| |
| | | | | Number of Portfolios in | |
| Name, Year of Birth | | Length of | | Fund Complex Overseen | |
| and Address | Position | Time Served | | by Board Member* | Other Directorships Held |
| **Charles B. Johnson (1933) | Trustee and | Trustee since | | 130 | None |
| One Franklin Parkway | Chairman of | 1984 | and | | |
| San Mateo, CA 94403-1906 | the Board | Chairman of the | | | |
| | | Board since 1993 | | | |
| Principal Occupation During Past 5 Years: | | | | |
| Chairman of the Board, Member – Office of the Chairman and Director, Franklin Resources, Inc.; and officer and/or director or trustee, |
| as the case may be, of some of the other subsidiaries of Franklin Resources, Inc. and of 41 of the investment companies in Franklin |
| Templeton Investments. | | | | | |
| |
| |
| |
| |
| | | | | | Annual Report | 209 |
| | | | |
| | | | Number of Portfolios in | |
| Name, Year of Birth | | Length of | Fund Complex Overseen | |
| and Address | Position | Time Served | by Board Member* | Other Directorships Held |
| **Gregory E. Johnson (1961) | Trustee | Since 2007 | 88 | None |
| One Franklin Parkway | | | | |
| San Mateo, CA 94403-1906 | | | | |
| Principal Occupation During Past 5 Years: | | | |
| Director, President and Chief Executive Officer, Franklin Resources, Inc.; and officer and/or director or trustee, as the case may be, of some |
| of the other subsidiaries of Franklin Resources, Inc. and of 33 of the investment companies in Franklin Templeton Investments. |
| |
| Sheila Amoroso (1959) | Vice President | Since 1999 | Not Applicable | Not Applicable |
| One Franklin Parkway | | | | |
| San Mateo, CA 94403-1906 | | | | |
| Principal Occupation During Past 5 Years: | | | |
| Senior Vice President, Franklin Advisers, Inc.; and officer of eight of the investment companies in Franklin Templeton Investments. |
| |
| Rafael R. Costas, Jr. (1965) | Vice President | Since 1999 | Not Applicable | Not Applicable |
| One Franklin Parkway | | | | |
| San Mateo, CA 94403-1906 | | | | |
| Principal Occupation During Past 5 Years: | | | |
| Senior Vice President, Franklin Advisers, Inc.; and officer of eight of the investment companies in Franklin Templeton Investments. |
| |
| James M. Davis (1952) | Chief | Chief Compliance | Not Applicable | Not Applicable |
| One Franklin Parkway | Compliance | Officer since 2004 | | |
| San Mateo, CA 94403-1906 | Officer and | and Vice | | |
| | Vice President | President – AML | | |
| | – AML | Compliance | | |
| | Compliance | since 2006 | | |
| Principal Occupation During Past 5 Years: | | | |
| Director, Global Compliance, Franklin Resources, Inc.; officer of some of the other subsidiaries of Franklin Resources, Inc. and of 45 of the |
| investment companies in Franklin Templeton Investments; and formerly, Director of Compliance, Franklin Resources, Inc. (1994-2001). |
| |
| Laura F. Fergerson (1962) | Chief | Since 2009 | Not Applicable | Not Applicable |
| One Franklin Parkway | Executive | | | |
| San Mateo, CA 94403-1906 | Officer – | | | |
| | Finance and | | | |
| | Administration | | | |
| Principal Occupation During Past 5 Years: | | | |
| Senior Vice President, Franklin Templeton Services, LLC; officer of 45 of the investment companies in Franklin Templeton Investments; and |
| formerly, Director and member of Audit and Valuation Committees, Runkel Funds, Inc. (2003-2004); Assistant Treasurer of most of the |
| investment companies in Franklin Templeton Investments (1997-2003); and Vice President, Franklin Templeton Services, LLC (1997-2003). |
| |
| Gaston Gardey (1967) | Treasurer, | Since 2009 | Not Applicable | Not Applicable |
| One Franklin Parkway | Chief Financial | | | |
| San Mateo, CA 94403-1906 | Officer and | | | |
| | Chief | | | |
| | Accounting | | | |
| | Officer | | | |
| Principal Occupation During Past 5 Years: | | | |
| Director Fund Accounting, Franklin Templeton Investments; and officer of 27 of the investment companies in Franklin Templeton Investments. |
| |
| |
| |
| |
| 210 | Annual Report | | | | |
| | | | |
| | | | Number of Portfolios in | |
| Name, Year of Birth | | Length of | Fund Complex Overseen | |
| and Address | Position | Time Served | by Board Member* | Other Directorships Held |
| Aliya S. Gordon (1973) | Vice President | Since 2009 | Not Applicable | Not Applicable |
| One Franklin Parkway | | | | |
| San Mateo, CA 94403-1906 | | | | |
| Principal Occupation During Past 5 Years: | | | |
| Senior Associate General Counsel, Franklin Templeton Investments; officer of 45 of the investment companies in Franklin Templeton |
| Investments; and formerly, Litigation Associate, Steefel, Levitt & Weiss, LLP (2000-2004). | |
| |
| David P. Goss (1947) | Vice President | Since 2000 | Not Applicable | Not Applicable |
| One Franklin Parkway | | | | |
| San Mateo, CA 94403-1906 | | | | |
| Principal Occupation During Past 5 Years: | | | |
| Senior Associate General Counsel, Franklin Templeton Investments; and officer and/or director, as the case maybe, of some of the other |
| subsidiaries of Franklin Resources, Inc. and of 45 of the investment companies in Franklin Templeton Investments. |
| |
| Steven J. Gray (1955) | Vice President | Since 2009 | Not Applicable | Not Applicable |
| One Franklin Parkway | | | | |
| San Mateo, CA 94403-1906 | | | | |
| Principal Occupation During Past 5 Years: | | | |
| Senior Associate General Counsel, Franklin Templeton Investments; Vice President, Franklin Templeton Distributors, Inc.; and officer of 45 of |
| the investment companies in Franklin Templeton Investments. | | |
| |
| Christopher J. Molumphy (1962) | President and | Since April 2010 | Not Applicable | Not Applicable |
| One Franklin Parkway | Chief | | | |
| San Mateo, CA 94403-1906 | Executive | | | |
| | Officer – | | | |
| | Investment | | | |
| | Management | | | |
| Principal Occupation During Past 5 Years: | | | |
| Director and Executive Vice President, Franklin Advisers, Inc.; Executive Vice President, Franklin Templeton Institutional, LLC; and officer of |
| some of the other subsidiaries of Franklin Resources, Inc. and of 22 of the investment companies in Franklin Templeton Investments. |
| |
| Robert C. Rosselot (1960) | Vice President | Since 2009 | Not Applicable | Not Applicable |
| 500 East Broward Blvd. | | | | |
| Suite 2100 | | | | |
| Fort Lauderdale, FL 33394-3091 | | | | |
| Principal Occupation During Past 5 Years: | | | |
| Senior Associate General Counsel, Franklin Templeton Investments; Assistant Secretary, Franklin Resources, Inc.; Vice President and |
| Secretary, Templeton Investment Counsel, LLC; Vice President, Secretary and Trust Officer, Fiduciary Trust International of the South; |
| and officer of 45 of the investment companies in Franklin Templeton Investments. | |
| |
| Karen L. Skidmore (1952) | Vice President | Since 2006 | Not Applicable | Not Applicable |
| One Franklin Parkway | and Secretary | | | |
| San Mateo, CA 94403-1906 | | | | |
| Principal Occupation During Past 5 Years: | | | |
| Senior Associate General Counsel, Franklin Templeton Investments; and officer of 45 of the investment companies in Franklin |
| Templeton Investments. | | | | |
| |
| |
| |
| |
| | | | | Annual Report | 211 |
| | | | |
| | | | Number of Portfolios in | |
| Name, Year of Birth | | Length of | Fund Complex Overseen | |
| and Address | Position | Time Served | by Board Member* | Other Directorships Held |
| Craig S. Tyle (1960) | Vice President | Since 2005 | Not Applicable | Not Applicable |
| One Franklin Parkway | | | | |
| San Mateo, CA 94403-1906 | | | | |
| Principal Occupation During Past 5 Years: | | | |
| General Counsel and Executive Vice President, Franklin Resources, Inc.; officer of some of the other subsidiaries of Franklin Resources, Inc. |
| and of 45 of the investment companies in Franklin Templeton Investments; and formerly, Partner, Shearman & Sterling, LLP (2004-2005); |
| and General Counsel, Investment Company Institute (ICI) (1997-2004). | | |
| |
| Thomas Walsh (1961) | Vice President | Since 1999 | Not Applicable | Not Applicable |
| One Franklin Parkway | | | | |
| San Mateo, CA 94403-1906 | | | | |
| Principal Occupation During Past 5 Years: | | | |
| Senior Vice President, Franklin Advisers, Inc.; and officer of eight of the investment companies in Franklin Templeton Investments. |
| |
| *We base the number of portfolios on each separate series of the U.S. registered investment companies within the Franklin Templeton Investments fund complex. These portfolios |
| have a common investment manager or affiliated investment managers. | | |
| **Charles B. Johnson is considered to be an interested person of the Trust under the federal securities laws due to his position as officer and director and major shareholder of |
| Franklin Resources, Inc. (Resources), which is the parent company of the Trust’s investment manager and distributor. Gregory E. Johnson is considered to be an interested person of |
| the Trust under the federal securities laws due to his position as an officer and director of Resources. | |
| Note 1: Charles B. Johnson is the father of Gregory E. Johnson. | | | |
| Note 2: Officer information is current as of the date of this report. It is possible that after this date, information about officers may change. |
| Note 3: Prior to February 28, 2011, Frank W.T. LaHaye ceased to be a trustee of the Trust. | | |
| |
| The Sarbanes-Oxley Act of 2002 and Rules adopted by the Securities and Exchange Commission require the Fund to disclose whether the Fund’s Audit Committee includes at |
| least one member who is an audit committee financial expert within the meaning of such Act and Rules. The Fund’s Board has determined that there is at least one such |
| financial expert on the Audit Committee and has designated John B. Wilson as its audit committee financial expert. The Board believes that Mr. Wilson qualifies as such an |
| expert in view of his extensive business background and experience, including service as chief financial officer of Staples, Inc. from 1992 to 1996. Mr. Wilson has been a |
| Member and Chairman of the Fund’s Audit Committee since 2007. As a result of such background and experience, the Board believes that Mr. Wilson has acquired an under- |
| standing of generally accepted accounting principles and financial statements, the general application of such principles in connection with the accounting estimates, |
| accruals and reserves, and analyzing and evaluating financial statements that present a breadth and level of complexity of accounting issues generally comparable to those |
| of the Fund, as well as an understanding of internal controls and procedures for financial reporting and an understanding of audit committee functions. Mr. Wilson is an |
| independent Board member as that term is defined under the relevant Securities and Exchange Commission Rules and Releases. |
| |
| The Statement of Additional Information (SAI) includes additional information about the board members and is available, without charge, upon request. Shareholders may |
| call (800) DIAL BEN/(800) 342-5236 to request the SAI. | | | |
Franklin Tax-Free Trust
Shareholder Information
Board Review of Investment Management Agreement
At a meeting held March 1, 2011, the Board of Trustees (Board), including a majority of non-interested or independent Trustees, approved renewal of the investment management agreement for each of the separate tax-exempt funds within the Trust (Fund(s)). In reaching this decision, the Board took into account information furnished throughout the year at regular Board meetings, as well as information prepared specifically in connection with the annual renewal review process. Information furnished and discussed throughout the year included investment performance reports and related financial information for each Fund, as well as periodic reports on expenses, shareholder services, legal, compliance, pricing, and other services provided by the Investment Manager (Manager) and its affiliates. Information furnished specifically in connection with the renewal process included a report for each Fund prepared by Lipper, Inc. (Lipper), an independent organization, as well as additional material, including a Fund profitability analysis prepared by management. The Lipper reports compared each Fund’s investment performance and expenses with those of other mutual funds deemed comparable to the Fund as selected by Lipper. The Fund profitability analysis discussed the profitability to Franklin Templeton Investments from its overall U.S. fund operations, as well as on an individual fund-by-fund basis. Additional material accompanying such profitability analysis included information on a fund-by-fund basis listing portfolio managers and other accounts they manage, as well as information on management fees charged by the Manager and its affiliates to U.S. mutual funds and other accounts, including management’s explanation of differences where relevant. Such material also included a memorandum prepared by management describing project initiatives and capital investments relating to the services provided to the Funds by the Franklin Templeton Investments organization, as well as a memorandum relating to economies of scale and a comparative analysis concerning transfer agent fees charged each Fund.
In considering such materials, the independent Trustees received assistance and advice from and met separately with independent counsel. While the investment management agreements for all Funds were considered at the same Board meeting, the Board dealt with each Fund separately. In approving continuance of the investment management agreement for each Fund, the Board, including a majority of independent Trustees, determined that the existing management fee structure was fair and reasonable and that continuance of the investment management agreement was in the best interests of each Fund and its shareholders. While attention was given to all information furnished, the following discusses some primary factors relevant to the Board’s decision.
NATURE, EXTENT AND QUALITY OF SERVICES. The Board was satisfied with the nature and quality of the overall services provided by the Manager and its affiliates to the Funds and their shareholders. In addition to investment performance and expenses discussed later, the Board’s opinion was based, in part, upon periodic reports furnished it showing that the investment policies and restrictions for each Fund were consistently complied with as well as other reports periodically furnished the Board covering matters such as the compliance of portfolio managers and other management personnel with the code of ethics adopted throughout the Franklin Templeton fund
Annual Report | 213
Franklin Tax-Free Trust
Shareholder Information (continued)
Board Review of Investment Management Agreement (continued)
complex, the adherence to fair value pricing procedures established by the Board, and the accuracy of net asset value calculations. The Board also noted the extent of benefits provided Fund shareholders from being part of the Franklin Templeton family of funds, including the right to exchange investments between the same class of funds without a sales charge, the ability to reinvest Fund dividends into other funds and the right to combine holdings in other funds to obtain a reduced sales charge. Favorable consideration was given to management’s continuous efforts and expenditures in establishing back-up systems and recovery procedures to function in the event of a natural disaster, it being noted that such systems and procedures had functioned smoothly during the Florida hurricanes and blackouts experienced in previous years. Consideration was also given to the experience of each Fund’s portfolio management team, the number of accounts managed and general method of compensation. In this latter respect, the Board noted that a primary factor in management’s determination of a portfolio manager’s bonus compensation was the relative investment performance of the funds he or she managed and that a portion of such bonus was required to be invested in a predesignated list of funds within such person’s fund management area so as to be aligned with the interests of shareholders. The Board also took into account the quality of transfer agent and shareholder services provided Fund shareholders by an affiliate of the Manager and the continuous enhancements to the Franklin Templeton website. Particular attention was given to management’s conservative approach and diligent risk management procedures, including continuous monitoring of counterparty credit risk and attention given to derivatives and other complex instruments. The Board also took into account, among other things, management’s efforts in establishing a global credit facility for the benefit of the Funds and other accounts managed by Franklin Templeton Investments to provide a source of cash for temporary and emergency purposes or to meet unusual redemption requests as well as the strong financial position of the Manager’s parent company and its commitment to the mutual fund business as evidenced by its subsidization of money market funds.
INVESTMENT PERFORMANCE. The Board placed significant emphasis on the investment performance of each Fund in view of its importance to shareholders. While consideration was given to performance reports and discussions with portfolio managers at Board meetings throughout the year, particular attention in assessing performance was given to the Lipper reports furnished for the agreement renewals. The Lipper reports prepared for each individual Fund showed its investment performance or those of its Class A shares for Funds having multiple share classes, in comparison to a performance universe selected by Lipper. Comparative performance for each Fund was shown for the one-year period ended December 31, 2010, and for additional periods ended that date up to 10 years depending on when a particular Fund commenced operations. Investment performance was shown on an income return basis, as well as a total return basis for each Fund. The Lipper reports showed that the income return for each Fund was in the upper half of its Lipper performance universe during 2010, with most being in the highest or second-highest quin-tile of such universe during such year and on an annualized basis for the previous three-, five- and 10-year periods as well. The Lipper reports showed the total return for many of such Funds was
214 | Annual Report
Franklin Tax-Free Trust
Shareholder Information (continued)
Board Review of Investment Management Agreement (continued)
below the median of their performance universe during 2010, but that the total return of all such Funds was good on a long-term basis with each having total returns above the median of its respective performance universe during the previous 10-year period on an annualized basis. Management explained that the one-year relative total return performance reflected the fact that the average maturity of investments in the portfolios of the Funds was generally longer than those of its performance universe peers. The Board expressed satisfaction with such performance, noting management’s explanation and the fact that the investment objective of each of the Funds is to obtain a high level of tax-exempt income.
COMPARATIVE EXPENSES. Consideration was given to the management fee and total expense ratios of each Fund in comparison with those of a group of funds selected by Lipper as its appropriate Lipper expense group. Lipper expense data is based upon information taken from each fund’s most recent annual report, which reflects historical asset levels that may be quite different from those currently existing, particularly in a period of market volatility. While recognizing such inherent limitation and the fact that expense ratios generally increase as assets decline and decrease as assets grow, the Board believed the independent analysis conducted by Lipper to be an appropriate measure of comparative expenses. In reviewing comparative costs, Lipper provides information on each Fund’s contractual investment management fee in comparison with the contractual investment management fee that would have been charged by other funds within its Lipper expense group assuming they were similar in size to the Fund, as well as the actual total expenses of the Fund in comparison with those of its Lipper expense group. The Lipper contractual investment management fee analysis includes an administrative charge as being part of the investment management fee, and total expenses, for comparative consistency, are shown by Lipper for Fund Class A shares for Funds having multiple share classes. The Lipper reports showed that the contractual investment management fee rates for each Fund were at or below the median of their respective Lipper expense groups. The Lipper reports further showed that the actual total expense rates for all Funds were below the median of their respective Lipper expense groups. Based on the above, the Board was satisfied with the investment management fee and total expenses of each Fund in comparison to its Lipper expense group as shown in the Lipper reports.
MANAGEMENT PROFITABILITY. The Board also considered the level of profits realized by the Manager and its affiliates in connection with the operation of each Fund. In this respect, the Board reviewed the Fund profitability analysis that addresses the overall profitability of Franklin Templeton’s U.S. fund business, as well as its profits in providing management and other services to each of the individual funds during the 12-month period ended September 30, 2010, being the most recent fiscal year-end for Franklin Resources, Inc., the manager’s parent. In reviewing the analysis, attention was given to the methodology followed in allocating costs to each Fund, it being recognized that allocation methodologies are inherently subjective and various allocation methodologies may each be reasonable while producing different results. In this respect, the Board noted that while being continuously refined and reflecting changes in the Manager’s own
Annual Report | 215
Franklin Tax-Free Trust
Shareholder Information (continued)
Board Review of Investment Management Agreement (continued)
cost accounting, such allocation methodology was consistent with that followed in profitability report presentations for the Funds made in prior years and that the Funds’ independent registered public accounting firm had been engaged by the Manager to review the reasonableness of the allocation methodologies solely for use by the Funds’ Board in reference to the profitability analysis. In reviewing and discussing such analysis, management discussed with the Board its belief that costs incurred in establishing the infrastructure necessary for the type of mutual fund operations conducted by the Manager and its affiliates may not be fully reflected in the expenses allocated to each Fund in determining its profitability, as well as the fact that the level of profits, to a certain extent, reflected operational cost savings and efficiencies initiated by management. The Board also took into account management’s expenditures in improving shareholder services provided the Funds, as well as the need to meet additional regulatory and compliance requirements resulting from the Sarbanes-Oxley Act and recent SEC and other regulatory requirements. In addition, the Board considered a third-party study comparing the profitability of the Manager’s parent on an overall basis to other publicly held managers broken down to show profitability from management operations exclusive of distribution expenses, as well as profitability including distribution expenses. The Board also considered the extent to which the Manager and its affiliates might derive ancillary benefits from fund operations, including revenues generated from transfer agent services. Based upon its consideration of all these factors, the Board determined that the level of profits realized by the Manager and its affiliates from providing services to each Fund was not excessive in view of the nature, quality and extent of services provided.
ECONOMIES OF SCALE. The Board also considered whether economies of scale are realized by the Manager as the Funds grow larger and the extent to which this is reflected in the level of management fees charged. While recognizing any precise determination is inherently subjective, the Board noted that based upon the Fund profitability analysis, it appears that as some Funds get larger, at some point economies of scale do result in the Manager realizing a larger profit margin on management services provided such Fund. The Board also noted that any economies of scale are shared with each of these Funds and their shareholders through management fee breakpoints existing in each of the Fund’s investment management agreements, so that as a Fund grows in size, its effective management fee rate declines. The fee structure under the investment management agreement with each Fund provides an initial fee of 0.625% on the first $100 million of assets; 0.50% on the next $150 million of assets; 0.45% on assets in excess of $250 million; with additional breakpoints beginning at 0.44% on assets in excess of $7.5 billion; 0.43% on assets in excess of $10 billion and continuing thereafter. In reviewing such structure, management stated its belief that this fee structure reaches a relatively low rate quickly as a Fund grows and that such low rate, in effect, reflects anticipated economies of scale as a Fund’s assets increase. In support of such position, management pointed out the favorable effective management fee and total expense comparisons for each Fund within its Lipper expense group as previously discussed under “Comparative Expenses.” The Board believed that to the extent economies of scale may be realized by the Manager and its affiliates, the schedule of fees under the investment management agreement for each Fund provides a sharing of benefits with the Fund and its shareholders.
216 | Annual Report
Franklin Tax-Free Trust
Shareholder Information (continued)
Proxy Voting Policies and Procedures
The Trust’s investment manager has established Proxy Voting Policies and Procedures (Policies) that the Trust uses to determine how to vote proxies relating to portfolio securities. Shareholders may view the Trust’s complete Policies online at franklintempleton.com. Alternatively, shareholders may request copies of the Policies free of charge by calling the Proxy Group collect at (954) 527-7678 or by sending a written request to: Franklin Templeton Companies, LLC, 500 East Broward Boulevard, Suite 1500, Fort Lauderdale, FL 33394, Attention: Proxy Group. Copies of the Trust’s proxy voting records are also made available online at franklintempleton.com and posted on the U.S. Securities and Exchange Commission’s website at sec.gov and reflect the most recent 12-month period ended June 30.
Quarterly Statement of Investments
The Trust files a complete statement of investments with the U.S. Securities and Exchange Commission for the first and third quarters for each fiscal year on Form N-Q. Shareholders may view the filed Form N-Q by visiting the Commission’s website at sec.gov. The filed form may also be viewed and copied at the Commission’s Public Reference Room in Washington, DC. Information regarding the operations of the Public Reference Room may be obtained by calling (800) SEC-0330.
Householding of Reports and Prospectuses
You will receive each Fund’s financial reports every six months as well as an annual updated summary prospectus (prospectus available upon request). To reduce Fund expenses, we try to identify related shareholders in a household and send only one copy of the financial reports and summary prospectus. This process, called “householding,” will continue indefinitely unless you instruct us otherwise. If you prefer not to have these documents householded, please call us at (800) 632-2301. At any time you may view current prospectuses/summary prospectuses and financial reports on our website. If you choose, you may receive these documents through electronic delivery.
Annual Report | 217
This page intentionally left blank.
This page intentionally left blank.
This page intentionally left blank.
Item 2. Code of Ethics.
(a) The Registrant has adopted a code of ethics that applies to its principal executive officers and principal financial and accounting officer.
| (c) | N/A |
| (d) | N/A |
| (f) | Pursuant to Item 12(a)(1), the Registrant is attaching as an |
exhibit a copy of its code of ethics that applies to its principal executive officers and principal financial and accounting officer.
Item 3. Audit Committee Financial Expert.
(a)(1) The Registrant has an audit committee financial expert serving on its audit committee.
(2) The audit committee financial expert is John B. Wilson, and he is "independent" as defined under the relevant Securities and Exchange Commission Rules and Releases.
2
Item 4. Principal Account Fees and Services.
(a) Audit Fees
The aggregate fees paid to the principal accountant for professional services rendered by the principal accountant for the audit of the registrant’s annual financial statements or for services that are normally provided by the principal accountant in connection with statutory and regulatory filings or engagements were $776,871 for the fiscal year ended February 28, 2011 and $845,026 for the fiscal year ended February 28, 2010.
(b) Audit-Related Fees
There were no fees paid to the principal accountant for assurance and related services rendered by the principal accountant to the registrant that are reasonably related to the performance of the audit of the registrant's financial statements and are not reported under paragraph (a) of Item 4.
There were no fees paid to the principal accountant for assurance and related services rendered by the principal accountant to the registrant's investment adviser and any entity controlling, controlled by or under common control with the investment adviser that provides ongoing services to the registrant that are reasonably related to the performance of the audit of their financial statements.
(c) Tax Fees
There were no fees paid to the principal accountant for professional services rendered by the principal accountant to the registrant for tax compliance, tax advice and tax planning.
The aggregate fees paid to the principal accountant for professional services rendered by the principal accountant to the registrant’s investment adviser and any entity controlling, controlled by or under common control with the investment adviser that provides ongoing services to the registrant for tax compliance, tax advice and tax planning were $60,000 for the fiscal year ended February 28, 2011 and $2,000 for the fiscal year ended February 28, 2010. The services for which these fees were paid included technical tax consultation for capital gain tax reporting to foreign governments, application of local country tax laws to investments, and derivative instruments.
(d) All Other Fees
The aggregate fees paid to the principal accountant for products and services rendered by the principal accountant to the registrant not reported in paragraphs (a)-(c) of Item 4 were $12,442 for the fiscal year ended February 28, 2011 and $0 for the fiscal year ended February 28, 2010. The services for which these fees were paid included review of materials provided to the fund Board in connection with the investment management contract renewal process.
The aggregate fees paid to the principal accountant for products and services rendered by the principal accountant to the registrant’s investment adviser and any entity controlling, controlled by or under common control with the investment adviser that provides ongoing services to the registrant other than services reported in paragraphs
| (a) | -(c) of Item 4 were $132,358 for the fiscal year ended February 28, |
3
2011 and $0 for the fiscal year ended February 28, 2010. The services for which these fees were paid included review of materials provided to the fund Board in connection with the investment management contract renewal process.
(e) (1) The registrant’s audit committee is directly responsible for approving the services to be provided by the auditors, including:
| (i) | pre-approval of all audit and audit related services; |
| (ii) | pre-approval of all non-audit related services to be |
provided to the Fund by the auditors;
(iii) pre-approval of all non-audit related services to be provided to the registrant by the auditors to the registrant’s investment adviser or to any entity that controls, is controlled by or is under common control with the registrant’s investment adviser and that provides ongoing services to the registrant where the non-audit services relate directly to the operations or financial reporting of the registrant; and
(iv) establishment by the audit committee, if deemed necessary or appropriate, as an alternative to committee pre-approval of services to be provided by the auditors, as required by paragraphs (ii) and (iii) above, of policies and procedures to permit such services to be pre-approved by other means, such as through establishment of guidelines or by action of a designated member or members of the committee; provided the policies and procedures are detailed as to the particular service and the committee is informed of each service and such policies and procedures do not include delegation of audit committee responsibilities, as contemplated under the Securities Exchange Act of 1934, to management; subject, in the case of (ii) through (iv), to any waivers, exceptions or exemptions that may be available under applicable law or rules.
(e) (2) None of the services provided to the registrant described in paragraphs (b)-(d) of Item 4 were approved by the audit committee pursuant to paragraph (c)(7)(i)(C) of Rule 2-01 of regulation S-X.
| (f) | No disclosures are required by this Item 4(f). |
| (g) | The aggregate non-audit fees paid to the principal accountant for |
services rendered by the principal accountant to the registrant and the registrant’s investment adviser and any entity controlling, controlled by or under common control with the investment adviser that provides ongoing services to the registrant were $204,800 for the fiscal year ended February 28, 2011 and $2,000 for the fiscal year ended February 28, 2010.
(h) The registrant’s audit committee of the board has considered whether the provision of non-audit services that were rendered to the registrant’s investment adviser (not including any sub-adviser whose role is primarily portfolio management and is subcontracted with or overseen by another investment adviser), and any entity controlling, controlled by, or under common control with the investment adviser that provides ongoing services to the registrant that were not pre-approved
4
pursuant to paragraph (c)(7)(ii) of Rule 2-01 of Regulation S-X is compatible with maintaining the principal accountant’s independence.
Item 5. Audit Committee of Listed Registrants. N/A
Item 6. Schedule of Investments. N/A
Item 7. Disclosure of Proxy Voting Policies and Procedures for Closed-End Management Investment Companies. N/A
Item 8. Portfolio Managers of Closed-End Management Investment Companies. N/A
Item 9. Purchases of Equity Securities by Closed-End Management Investment Company and Affiliated Purchasers. N/A
Item 10. Submission of Matters to a Vote of Security Holders.
There have been no changes to the procedures by which shareholders may recommend nominees to the Registrant's Board of Trustees that would require disclosure herein.
Item 11. Controls and Procedures.
(a) Evaluation of Disclosure Controls and Procedures. The Registrant maintains disclosure controls and procedures that are designed to ensure that information required to be disclosed in the Registrant’s filings under the Securities Exchange Act of 1934 and the Investment Company Act of 1940 is recorded, processed, summarized and reported within the periods specified in the rules and forms of the Securities and Exchange Commission. Such information is accumulated and communicated to the Registrant’s management, including its principal executive officer and principal financial officer, as appropriate, to allow timely decisions regarding required disclosure. The Registrant’s management, including the principal executive officer and the principal financial officer, recognizes that any set of controls and procedures, no matter how well designed and operated, can provide only reasonable assurance of achieving the desired control objectives.
Within 90 days prior to the filing date of this Shareholder Report on Form N-CSR, the Registrant had carried out an evaluation, under the supervision and with the participation of the Registrant’s management, including the Registrant’s principal executive officer and the Registrant’s principal financial officer, of the effectiveness of the design and operation of the Registrant’s disclosure controls and procedures. Based on such evaluation, the Registrant’s principal executive officer and principal financial officer concluded that the Registrant’s disclosure controls and procedures are effective.
5
(b) Changes in Internal Controls. There have been no significant changes in the Registrant’s internal controls or in other factors that could significantly affect the internal controls subsequent to the date of their evaluation in connection with the preparation of this Shareholder Report on Form N-CSR.
Item 12. Exhibits.
(a)(1) Code of Ethics
(a)(2) Certifications pursuant to Section 302 of the Sarbanes-Oxley Act of 2002 of Laura F. Fergerson, Chief Executive Officer - Finance and Administration, and Gaston Gardey, Chief Financial Officer and Chief Accounting Officer
(b) Certifications pursuant to Section 906 of the Sarbanes-Oxley Act of 2002 of Laura F. Fergerson, Chief Executive Officer - Finance and Administration, and Gaston Gardey, Chief Financial Officer and Chief Accounting Officer
6
SIGNATURES
Pursuant to the requirements of the Securities Exchange Act of 1934 and the Investment Company Act of 1940, the registrant has duly caused this report to be signed on its behalf by the undersigned, thereunto duly authorized.
FRANKLIN TAX-FREE TRUST
By /s/LAURA F. FERGERSON
Laura F. Fergerson
Chief Executive Officer –
Finance and Administration
Date April 27, 2011
Pursuant to the requirements of the Securities Exchange Act of 1934 and the Investment Company Act of 1940, this report has been signed below by the following persons on behalf of the registrant and in the capacities and on the dates indicated.
By /s/LAURA F. FERGERSON
Laura F. Fergerson
Chief Executive Officer –
Finance and Administration
Date April 27, 2011
By /s/GASTON GARDEY
Gaston Gardey
Chief Financial Officer and
Chief Accounting Officer
Date April 27, 2011
7