
FRANKLIN TAX-FREE TRUST


| 1
Annual Report
Municipal Bond Market Overview
For the 12 months ended February 29, 2012, the municipal bond market posted healthy gains as measured by the +12.42% return of the Barclays Capital (BC) Municipal Bond Index, which tracks investment-grade securities.1 Over the reporting period municipal bonds generally outperformed Treasuries, which returned +9.60% according to the BC U.S. Treasury Index, which tracks various U.S. Treasury securities.1
During the reporting period, domestic and global events affected the municipal bond market. Domestically, the Federal Reserve Board’s (Fed’s) commitment to maintain an accommodative monetary policy stance with historically low interest rates supported the municipal market. The market was further supported by an extended period of low supply, thus reducing the availability of bonds to meet investor demand. In Europe, several countries struggled with financial challenges that resulted in a flight to quality benefiting the U.S. Treasury market, as well as the municipal bond market.
From a credit perspective, on August 2, 2011, the U.S. raised its debt ceiling and avoided defaulting on its debt obligations. Independent credit rating agency Standard & Poor’s (S&P) lowered the country’s long-term Treasury bond rating to AA+ from AAA, citing political risks and a rising debt burden.2 All municipal bonds backed by the U.S. government or government-sponsored enterprises (GSEs) were also downgraded along with the country’s rating and those of GSEs. S&P’s downgrade of U.S. Treasury securities led to the review of more than 11,000 municipal credits supported by federal programs and agency escrows. Primarily, prerefunded municipal bonds and housing bonds tied to federal subsidy programs were affected by the downgrade, although they generally still carried high-grade ratings. Furthermore, on July 19, 2011, independent credit rating agency Moody’s Investors Service placed five Aaa-rated states on its watch list for potential rating cuts partly based on their dependency on federal funding. After the debt ceiling was raised, Moody’s reconfirmed the Aaa rating to states and public finance issuers previously identified as directly or indirectly linked to the U.S. government.2 The same credits are currently assigned a negative outlook based on the identification of certain shared characteristics.
1. Source: © 2012 Morningstar. All Rights Reserved. The information contained herein: (1) is proprietary to Morningstar and/or its content providers; (2) may not be copied or distributed; and (3) is not warranted to be accurate, complete or timely. Neither Morningstar nor its content providers are responsible for any damages or losses arising from any use of this information. Past performance is no guarantee of future results.
2. These do not indicate ratings of the Funds.
4 | Annual Report
Congress enacted the Budget Control Act of 2011 with the potential to reduce the federal deficit by approximately $2 trillion by 2021. While the plan of action is unknown, one can expect reduced federal funding, which would impact state and local programs dependent on federal subsidies. State and local officials may need to reevaluate current budget forecasts and the potential effects. Despite facing fiscal restraints and broad budget cuts to achieve balance, many states continued to show mild growth in revenues, and the actual default rate for municipal bonds was very low.
At period-end, we maintained our positive view of the municipal bond market. We believe municipal bonds continue to be an attractive asset class among fixed income securities, and we intend to follow our solid discipline of investing to maximize income while seeking value in the municipal bond market.
The foregoing information reflects our analysis and opinions as of February 29, 2012, the end of the reporting period. The information is not a complete analysis of every aspect of any market, country, industry, security or fund. Statements of fact are from sources considered reliable.
Annual Report | 5
Investment Strategy and
Manager’s Discussion
Investment Strategy
We use a consistent, disciplined strategy in an effort to maximize tax-exempt income for our shareholders by seeking to maintain exposure to higher coupon securities while balancing risk and return within each Fund’s range of allowable investments. We generally employ a buy-and-hold approach and invest in securities we believe should provide the most relative value in the market. As we invest during different interest rate environments, each Fund’s portfolio remains diversified with a broad range of securities. This broad diversification may help mitigate interest rate risk. We do not use leverage or exotic derivatives, nor do we use hedging techniques that could add volatility and contribute to underperformance in adverse markets. We generally stay fully invested to help maximize income distribution.
Manager’s Discussion
Based on the combination of our value-oriented philosophy of investing primarily for income and a positive-sloping municipal yield curve, we favored the use of longer term bonds. Consistent with our strategy, we sought to purchase bonds from 15 to 30 years in maturity with good call features. We believe our conservative, buy-and-hold investment strategy can help us achieve high, current, tax-free income for shareholders.
We invite you to read your Fund report for more detailed performance and portfolio information. Thank you for your participation in Franklin Tax-Free Trust. We look forward to serving your future investment needs.
The foregoing information reflects our analysis, opinions and portfolio holdings as of February 29, 2012, the end of the reporting period. The way we implement our main investment strategies and the resulting portfolio holdings may change depending on factors such as market and economic conditions. These opinions may not be relied upon as investment advice or an offer for a particular security. The information is not a complete analysis of every aspect of any market, country, industry, security or fund. Statements of fact are from sources considered reliable, but the investment manager makes no representation or warranty as to their completeness or accuracy. Although historical performance is no guarantee of future results, these insights may help you understand our investment management philosophy.
6 | Annual Report
Franklin Alabama Tax-Free Income Fund
Your Fund’s Goal and Main Investments: Franklin Alabama Tax-Free Income Fund
seeks to provide as high a level of income exempt from federal and Alabama personal income taxes as is consistent with prudent investment management and preservation of capital by investing at least 80% of its total assets in securities that pay interest free from such taxes.1
Performance data represent past performance, which does not guarantee future results. Investment return and principal value will fluctuate, and you may have a gain or loss when you sell your shares. Current performance may differ from figures shown. Please visit franklintempleton.com or call (800) 342-5236 for most recent month-end performance.
We are pleased to bring you Franklin Alabama Tax-Free Income Fund’s annual report for the fiscal year ended February 29, 2012.
Performance Overview
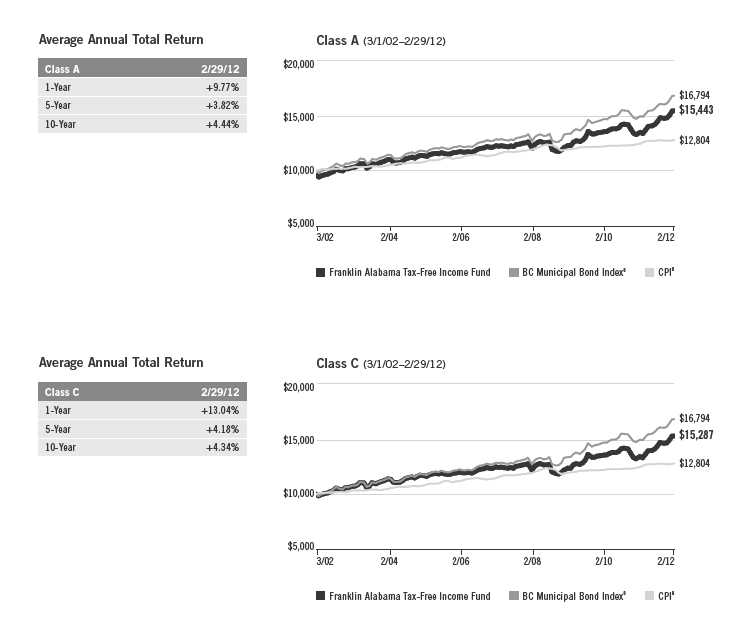
The Fund’s Class A share price, as measured by net asset value, increased from $10.66 on February 28, 2011, to $11.71 on February 29, 2012. The Fund’s Class A shares paid dividends totaling 47.61 cents per share for the
1. For investors subject to alternative minimum tax, a small portion of Fund dividends may be taxable. Distributions of capital gains are generally taxable. To avoid imposition of 28% backup withholding on all Fund distributions and redemption proceeds, U.S. investors must be properly certified on Form W-9 and non-U.S. investors on Form W-8BEN.
The dollar value, number of shares or principal amount, and names of all portfolio holdings are listed in the Fund’s Statement of Investments (SOI). The SOI begins on page 93.
Annual Report | 7
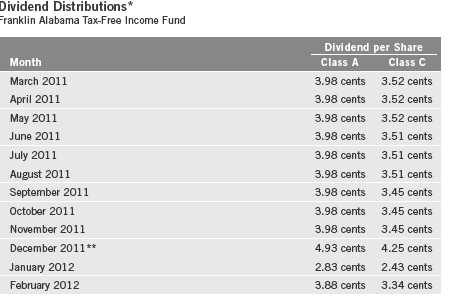
*Assumes shares were purchased and held for the entire accrual period, which differs from the calendar month. Since dividends accrue daily, your actual distributions will vary depending on the date you purchased your shares and any account activity. All Fund distributions will vary depending upon current market conditions, and past distributions are not indicative of future trends.
**The December per-share dividend distribution consisted of payments on 12/21/11 and 12/30/11 for each class as follows: Class A, 3.88 cents and 1.05 cents, and Class C, 3.34 cents and 0.91 cents.
same period.2 The Performance Summary beginning on page 11 shows that at the end of this reporting period the Fund’s Class A shares’ distribution rate was 3.71% based on an annualization of the current 3.78 cent per share dividend and the maximum offering price of $12.23 on February 29, 2012. An investor in the 2012 maximum combined effective federal and Alabama personal income tax bracket of 38.25% would need to earn a distribution rate of 6.01% from a taxable investment to match the Fund’s Class A tax-free distribution rate. For the Fund’s Class C shares’ performance, please see the Performance Summary. The reduction in dividend distributions from the start to the end of the period under review reflected generally declining interest rates. Additionally, investor demand was strong for municipal bonds in an environment of limited tax-exempt supply. These factors resulted in reduced income for the portfolio and caused dividends to decline overall.
2. All Fund distributions will vary depending upon current market conditions, and past distributions are not indicative of future trends.
8 | Annual Report
State Update
Alabama’s manufacturing-reliant economy had mixed results over the 12-month reporting period. Heavily dependent on the auto industry, the state’s transportation equipment manufacturing jobs make up a large part of the state’s employment. Early in the reporting period, manufacturers slashed local production levels after the earthquake and tsunami in Japan severely disrupted supplier operations and caused a parts shortage. U.S. auto sales slumped in July largely due to consumer uncertainty over the economy and the debate over the federal debt limit. Later in the year, however, the Honda plant in Lincoln ramped up production levels to meet improved market demand. Mercedes-Benz announced capital investment plans to prepare its Vance plant for production of a completely new model. In October, Carpenter Technology Corporation announced it had selected Limestone County as the site for its new $500 million steel plant. GE Aviation broke ground on a jet engine component factory in Auburn, while Pharmavite, a maker of dietary supplements, began construction on a manufacturing and distribution facility in Opelika. Jefferson County, after years of struggling with bad debts and dwindling financial resources, filed for Chapter 9 bankruptcy protection in November, the largest filing of its kind in U.S. history. Alabama’s 7.6% unemployment rate in February 2012 was significantly lower than the 8.3% national rate.3
Alabama has two major operating funds, the Education Trust Fund, which is the main source of dollars for public schools and colleges, and the General Fund, which is a major source of funding for Medicaid, prisons and other noneducation government programs. In fiscal year 2011 both funds shrank as growth in appropriations and obligations outpaced growth in receipts. Without the support of federal stimulus dollars and one-time withdrawals from the state reserve, and in the face of declining revenues, state officials estimated a shortfall for the General Fund in fiscal year 2013. As the legislative session began in February 2012, lawmakers began the difficult and contentious process of deciding where to cut funding. The state’s net-tax supported debt was 2.6% of personal income and $856 per capita, compared with the national medians of 2.8% and $1,066.4
Independent credit rating agency Standard Poor’s (S&P) affirmed its AA rating and stable outlook for the state’s general obligation debt.5 The rating and outlook reflected S&P’s expectations of continued expansion in the manufacturing sector and appropriate policy responses to potential revenue shortfalls.
3. Source: Bureau of Labor Statistics.
4. Source: Moody’s Investors Service, “Special Comment: 2011 State Debt Medians Report,” 6/3/11.
5. This does not indicate S&P’s rating of the Fund.
Annual Report | 9
Manager’s Discussion
We used various investment strategies during the 12 months under review as we sought to maximize tax-free income for shareholders. Please read the discussion on page 6 for details.
Thank you for your continued participation in Franklin Alabama Tax-Free Income Fund. We believe our conservative, buy-and-hold investment strategy can help us achieve high, current, tax-free income for shareholders.
The foregoing information reflects our analysis, opinions and portfolio holdings as of February 29, 2012, the end of the reporting period. The way we implement our main investment strategies and the resulting portfolio holdings may change depending on factors such as market and economic conditions. These opinions may not be relied upon as investment advice or an offer for a particular security. The information is not a complete analysis of every aspect of any market, state, industry, security or the Fund. Statements of fact are from sources considered reliable, but the investment manager makes no representation or warranty as to their completeness or accuracy. Although historical performance is no guarantee of future results, these insights may help you understand our investment management philosophy.
10 | Annual Report
Performance Summary as of 2/29/12
Franklin Alabama Tax-Free Income Fund
Your dividend income will vary depending on dividends or interest paid by securities in the Fund’s portfolio, adjusted for operating expenses of each class. Capital gain distributions are net profits realized from the sale of portfolio securities. The performance table and graphs do not reflect any taxes that a shareholder would pay on Fund dividends, capital gain distributions, if any, or any realized gains on the sale of Fund shares. Total return reflects reinvestment of the Fund’s dividends and capital gain distributions, if any, and any unrealized gains or losses.
| | | | | | | | |
| Price and Distribution Information | | | | | | |
| Class A (Symbol: FRALX) | | | | Change | | 2/29/12 | | 2/28/11 |
| Net Asset Value (NAV) | | | +$ | 1.05 | $ | 11.71 | $ | 10.66 |
| Distributions (3/1/11–2/29/12) | | | | | | | | |
| Dividend Income | $ | 0.4761 | | | | | | |
| Class C (Symbol: FALEX) | | | | Change | | 2/29/12 | | 2/28/11 |
| Net Asset Value (NAV) | | | +$ | 1.07 | $ | 11.84 | $ | 10.77 |
| Distributions (3/1/11–2/29/12) | | | | | | | | |
| Dividend Income | $ | 0.4156 | | | | | | |
Performance
Cumulative total return excludes sales charges. Average annual total returns include maximum sales charges. Class A: 4.25% maximum initial sales charge; Class C: 1% contingent deferred sales charge in first year only.
| | | | | | | | | | | |
| Class A | | | | 1-Year | | | 5-Year | | | 10-Year | |
| Cumulative Total Return1 | | | + | 14.61 | % | + | 25.98 | % | + | 61.31 | % |
| Average Annual Total Return2 | | | + | 9.77 | % | + | 3.82 | % | + | 4.44 | % |
| Avg. Ann. Total Return (3/31/12)3 | | | + | 10.32 | % | + | 3.83 | % | + | 4.58 | % |
| Distribution Rate4 | 3.71 | % | | | | | | | | | |
| Taxable Equivalent Distribution Rate5 | 6.01 | % | | | | | | | | | |
| 30-Day Standardized Yield6 | 2.97 | % | | | | | | | | | |
| Taxable Equivalent Yield5 | 4.81 | % | | | | | | | | | |
| Total Annual Operating Expenses7 | 0.71 | % | | | | | | | | | |
| Class C | | | | 1-Year | | | 5-Year | | | 10-Year | |
| Cumulative Total Return1 | | | + | 14.04 | % | + | 22.72 | % | + | 52.87 | % |
| Average Annual Total Return2 | | | + | 13.04 | % | + | 4.18 | % | + | 4.34 | % |
| Avg. Ann. Total Return (3/31/12)3 | | | + | 13.66 | % | + | 4.18 | % | + | 4.47 | % |
| Distribution Rate4 | 3.25 | % | | | | | | | | | |
| Taxable Equivalent Distribution Rate5 | 5.26 | % | | | | | | | | | |
| 30-Day Standardized Yield6 | 2.56 | % | | | | | | | | | |
| Taxable Equivalent Yield5 | 4.15 | % | | | | | | | | | |
| Total Annual Operating Expenses7 | 1.26 | % | | | | | | | | | |
Performance data represent past performance, which does not guarantee future results. Investment return and principal value will fluctuate, and you may have a gain or loss when you sell your shares. Current performance may differ from figures shown. For most recent month-end performance, go to franklintempleton.com or call (800) 342-5236.
Annual Report | 11
Performance Summary (continued)
Total Return Index Comparison for a Hypothetical $10,000 Investment
Total return represents the change in value of an investment over the periods shown. It includes any current, applicable, maximum sales charge, Fund expenses, account fees and reinvested distributions. The unmanaged index includes reinvestment of any income or distributions. It differs from the Fund in composition and does not pay management fees or expenses. One cannot invest directly in an index.
12 | Annual Report
Performance Summary (continued)
Endnotes
All investments involve risks, including possible loss of principal. Because municipal bonds are sensitive to interest rate movements, the Fund’s yield and share price will fluctuate with market conditions. Bond prices generally move in the opposite direction of interest rates. Thus, as prices of bonds in the Fund adjust to a rise in interest rates, the Fund’s share price may decline. Changes in the financial strength of a bond issuer or in a bond’s credit rating may affect its value. The Fund is actively managed but there is no guarantee that the manager’s investment decisions will produce the desired results. Since the Fund concentrates its investments in a single state, it is subject to greater risk of adverse economic and regulatory changes in that state than a geographically diversified fund. The Fund’s prospectus also includes a description of the main investment risks.
| |
Class C: | Prior to 1/1/04, these shares were offered with an initial sales charge; thus actual total returns would have differed. These shares have higher annual fees and expenses than Class A shares. |
1. Cumulative total return represents the change in value of an investment over the periods indicated.
2. Average annual total return represents the average annual change in value of an investment over the periods indicated.
3. In accordance with SEC rules, we provide standardized average annual total return information through the latest calendar quarter.
4. Distribution rate is based on an annualization of the respective class’s current monthly dividend and the maximum offering price (NAV for Class C) per share on 2/29/12.
5. Taxable equivalent distribution rate and yield assume the published rates as of 12/28/11 for the maximum combined effective federal and Alabama personal income tax rate of 38.25%, based on the federal income tax rate of 35.00%.
6. The 30-day standardized yield for the month ended 2/29/12 reflects an estimated yield to maturity (assuming all portfolio securities are held to maturity). It should be regarded as an estimate of the Fund’s rate of investment income, and it may not equal the Fund’s actual income distribution rate (which reflects the Fund’s past dividends paid to shareholders) or the income reported in the Fund’s financial statements.
7. Figures are as stated in the Fund’s prospectus current as of the date of this report. In periods of market volatility, assets may decline significantly, causing total annual Fund operating expenses to become higher than the figures shown.
8. Source: © 2012 Morningstar. The BC Municipal Bond Index is a market value-weighted index engineered for the long-term tax-exempt bond market. To be included in the index, bonds must be fixed rate, have at least one year to final maturity and be rated investment grade (Baa3/BBB-or higher) by at least two of the following agencies: Moody’s, Standard & Poor’s and Fitch. The Consumer Price Index (CPI), calculated by the U.S. Bureau of Labor Statistics, is a commonly used measure of the inflation rate.
Annual Report | 13
Your Fund’s Expenses
Franklin Alabama Tax-Free Income Fund
As a Fund shareholder, you can incur two types of costs:
- Transaction costs, including sales charges (loads) on Fund purchases; and
- Ongoing Fund costs, including management fees, distribution and service (12b-1) fees, and other Fund expenses. All mutual funds have ongoing costs, sometimes referred to as operating expenses.
The following table shows ongoing costs of investing in the Fund and can help you understand these costs and compare them with those of other mutual funds. The table assumes a $1,000 investment held for the six months indicated.
Actual Fund Expenses
The first line (Actual) for each share class listed in the table provides actual account values and expenses. The “Ending Account Value” is derived from the Fund’s actual return, which includes the effect of Fund expenses.
You can estimate the expenses you paid during the period by following these steps. Of course, your account value and expenses will differ from those in this illustration:
1. Divide your account value by $1,000.
If an account had an $8,600 value, then $8,600 ÷ $1,000 = 8.6.
| 2. | Multiply the result by the number under the heading “Expenses Paid During Period.” |
| | If Expenses Paid During Period were $7.50, then 8.6 x $7.50 = $64.50. |
In this illustration, the estimated expenses paid this period are $64.50.
Hypothetical Example for Comparison with Other Funds
Information in the second line (Hypothetical) for each class in the table can help you compare ongoing costs of investing in the Fund with those of other mutual funds. This information may not be used to estimate the actual ending account balance or expenses you paid during the period. The hypothetical “Ending Account Value” is based on the actual expense ratio for each class and an assumed 5% annual rate of return before expenses, which does not represent the Fund’s actual return. The figure under the heading “Expenses Paid During Period” shows the hypothetical expenses your account would have incurred under this scenario. You can compare this figure with the 5% hypothetical examples that appear in shareholder reports of other funds.
14 | Annual Report
Your Fund’s Expenses (continued)
Please note that expenses shown in the table are meant to highlight ongoing costs and do not reflect any transaction costs, such as sales charges. Therefore, the second line for each class is useful in comparing ongoing costs only, and will not help you compare total costs of owning different funds. In addition, if transaction costs were included, your total costs would have been higher. Please refer to the Fund prospectus for additional information on operating expenses.
| | | | | | |
| | | Beginning Account | | Ending Account | | Expenses Paid During |
| Class A | | Value 9/1/11 | | Value 2/29/12 | | Period* 9/1/11–2/29/12 |
| Actual | $ | 1,000 | $ | 1,068.00 | $ | 3.65 |
| Hypothetical (5% return before expenses) | $ | 1,000 | $ | 1,021.33 | $ | 3.57 |
| Class C | | | | | | |
| Actual | $ | 1,000 | $ | 1,066.20 | $ | 6.47 |
| Hypothetical (5% return before expenses) | $ | 1,000 | $ | 1,018.60 | $ | 6.32 |
*Expenses are calculated using the most recent six-month expense ratio, annualized for each class (A: 0.71% and C: 1.26%), multiplied by the average account value over the period, multiplied by 182/366 to reflect the one-half year period.
Annual Report | 15
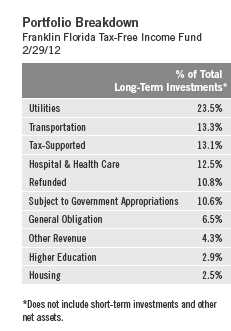
Franklin Florida Tax-Free Income Fund
Your Fund’s Goal and Main Investments: Franklin Florida Tax-Free Income Fund seeks to provide as high a level of income exempt from federal income taxes and any Florida personal income taxes as is consistent with prudent investment management and preservation of capital by investing at least 80% of its total assets in securities that pay interest free from such taxes.1

Performance data represent past performance, which does not guarantee future results. Investment return and principal value will fluctuate, and you may have a gain or loss when you sell your shares. Current performance may differ from figures shown. Please visit franklintempleton.com or call (800) 342-5236 for most recent month-end performance.
We are pleased to bring you Franklin Florida Tax-Free Income Fund’s annual report for the fiscal year ended February 29, 2012.
Performance Overview
The Fund’s Class A share price, as measured by net asset value, increased from $11.08 on February 28, 2011, to $11.88 on February 29, 2012. The Fund’s Class A shares paid dividends totaling 52.80 cents per share for the
1. For investors subject to alternative minimum tax, a small portion of Fund dividends may be taxable. Distributions of capital gains are generally taxable. To avoid imposition of 28% backup withholding on all Fund distributions and redemption proceeds, U.S. investors must be properly certified on Form W-9 and non-U.S. investors on Form W-8BEN.
The dollar value, number of shares or principal amount, and names of all portfolio holdings are listed in the Fund’s Statement of Investments (SOI). The SOI begins on page 99.
16 | Annual Report
| | | |
| Dividend Distributions* | | | |
| Franklin Florida Tax-Free Income Fund | | | |
| | Dividend per Share |
| Month | Class A | Class B | Class C |
| March 2011 | 4.38 cents | 3.90 cents | 3.89 cents |
| April 2011 | 4.38 cents | 3.90 cents | 3.89 cents |
| May 2011 | 4.38 cents | 3.90 cents | 3.89 cents |
| June 2011 | 4.40 cents | 3.92 cents | 3.91 cents |
| July 2011 | 4.40 cents | 3.92 cents | 3.91 cents |
| August 2011 | 4.40 cents | 3.92 cents | 3.91 cents |
| September 2011 | 4.40 cents | 3.87 cents | 3.86 cents |
| October 2011 | 4.40 cents | 3.87 cents | 3.86 cents |
| November 2011 | 4.40 cents | 3.87 cents | 3.86 cents |
| December 2011** | 5.53 cents | 4.84 cents | 4.83 cents |
| January 2012 | 3.17 cents | 2.78 cents | 2.77 cents |
| February 2012 | 4.35 cents | 3.81 cents | 3.80 cents |
*Assumes shares were purchased and held for the entire accrual period, which differs from the calendar month. Since dividends accrue daily, your actual distributions will vary depending on the date you purchased your shares and any account activity. All Fund distributions will vary depending upon current market conditions, and past distributions are not indicative of future trends.
**The December per-share dividend distribution consisted of payments on 12/21/11 and 12/30/11 for each class as follows: Class A, 4.35 cents and 1.18 cents; Class B, 3.81 cents and 1.03 cents; and Class C, 3.80 cents and 1.03 cents.
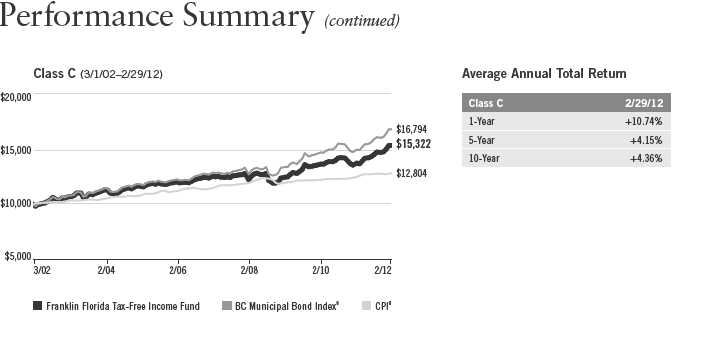
same period.2 The Performance Summary beginning on page 20 shows that at the end of this reporting period the Fund’s Class A shares’ distribution rate was 4.18% based on an annualization of the current 4.32 cent per share dividend and the maximum offering price of $12.41 on February 29, 2012. An investor in the 2012 maximum federal income tax bracket of 35.00% would need to earn a distribution rate of 6.43% from a taxable investment to match the Fund’s Class A tax-free distribution rate. For the Fund’s Class B and C shares’ performance, please see the Performance Summary. The reduction in dividend distributions from the start to the end of the period under review reflected generally declining interest rates. Additionally, investor demand was strong for municipal bonds in an environment of limited tax-exempt supply. These factors resulted in reduced income for the portfolio and caused dividends to decline overall.
2. All Fund distributions will vary depending upon current market conditions, and past distributions are not indicative of future trends.
Annual Report | 17
State Update
Florida’s large, diverse economy continued to recover during the 12-month reporting period, albeit at a slower pace than the nation’s. The state’s housing market showed signs of improvement, with existing home sales volume and building permits growing in 2011. However, a large excess housing inventory remained, median home prices declined, and the state’s foreclosure rate remained among the nation’s highest. Construction employment continued to decline. The government and mining and logging sectors also experienced job losses. All other sectors contributed to job growth, led by leisure and hospitality, professional and business services, and education and health services. Although Florida’s unemployment rate improved from a December 2010 historical high of 12.0% to 9.4% at period-end, it was significantly higher than the 8.3% national average.3
The state’s enacted fiscal year 2012 budget is structurally balanced and has replenished reserve levels. At the January 2012 revenue estimating conference, state officials revised upward their general revenue forecast for fiscal year 2012 due to increased collections. Additionally, the state revised its projected fiscal year 2012 unappropriated general fund ending balance to reflect better-than-expected fiscal year 2011 final results. Based on the January estimating conference, the state expects to close fiscal year 2012 with a sizable fund balance and total reserves. Due to the continued challenges to the state’s economy, however, state officials revised downward their fiscal year 2013 forecast. The governor’s fiscal year 2013 budget proposal was significantly lower than the fiscal year 2012 budget, with spending cuts consisting largely of Medicaid rate adjustments, completion of transportation projects and personnel reductions.
Florida’s net tax-supported debt was 3.0% of personal income and $1,150 per capita, compared with the national medians of 2.8% and $1,066.4 Independent credit rating agency Standard & Poor’s assigned Florida’s general obligation bonds its highest rating of AAA with a stable outlook.5 The rating and outlook reflected the state’s significant progress in restoring structural budget balance in response to economic challenges and budgetary pressures, strong reserves, moderately high but manageable debt burden, and good income levels.
3. Source: Bureau of Labor Statistics.
4. Source: Moody’s Investors Service, “Special Comment: 2011 State Debt Medians Report,” 6/3/11.
5. This does not indicate Standard & Poor’s rating of the Fund.
18 | Annual Report
Manager’s Discussion
We used various investment strategies during the 12 months under review as we sought to maximize tax-free income for shareholders. Please read the discussion on page 6 for details.
Thank you for your continued participation in Franklin Florida Tax-Free Income Fund. We believe our conservative, buy-and-hold investment strategy can help us achieve high, current, tax-free income for shareholders.
The foregoing information reflects our analysis, opinions and portfolio holdings as of February 29, 2012, the end of the reporting period. The way we implement our main investment strategies and the resulting portfolio holdings may change depending on factors such as market and economic conditions. These opinions may not be relied upon as investment advice or an offer for a particular security. The information is not a complete analysis of every aspect of any market, state, industry, security or the Fund. Statements of fact are from sources considered reliable, but the investment manager makes no representation or warranty as to their completeness or accuracy. Although historical performance is no guarantee of future results, these insights may help you understand our investment management philosophy.
Annual Report | 19
Performance Summary as of 2/29/12
Franklin Florida Tax-Free Income Fund
Your dividend income will vary depending on dividends or interest paid by securities in the Fund’s portfolio, adjusted for operating expenses of each class. Capital gain distributions are net profits realized from the sale of portfolio securities. The performance table and graphs do not reflect any taxes that a shareholder would pay on Fund dividends, capital gain distributions, if any, or any realized gains on the sale of Fund shares. Total return reflects reinvestment of the Fund’s dividends and capital gain distributions, if any, and any unrealized gains or losses.
| | | | | | | | |
| Price and Distribution Information | | | | | | |
| Class A (Symbol: FRFLX) | | | | Change | | 2/29/12 | | 2/28/11 |
| Net Asset Value (NAV) | | | +$ | 0.80 | $ | 11.88 | $ | 11.08 |
| Distributions (3/1/11–2/29/12) | | | | | | | | |
| Dividend Income | $ | 0.5280 | | | | | | |
| Class B (Symbol: FRFBX) | | | | Change | | 2/29/12 | | 2/28/11 |
| Net Asset Value (NAV) | | | +$ | 0.81 | $ | 11.98 | $ | 11.17 |
| Distributions (3/1/11–2/29/12) | | | | | | | | |
| Dividend Income | $ | 0.4666 | | | | | | |
| Class C (Symbol: FRFIX) | | | | Change | | 2/29/12 | | 2/28/11 |
| Net Asset Value (NAV) | | | +$ | 0.83 | $ | 12.08 | $ | 11.25 |
| Distributions (3/1/11–2/29/12) | | | | | | | | |
| Dividend Income | $ | 0.4654 | | | | | | |
20 | Annual Report
Performance Summary (continued)
Performance
Cumulative total return excludes sales charges. Average annual total returns include maximum sales charges. Class A: 4.25% maximum initial sales charge; Class B: contingent deferred sales charge (CDSC) declining from 4% to 1% over six years, and eliminated thereafter; Class C: 1% CDSC in first year only.
| | | | | | | | | | | |
| Class A | | | | 1-Year | | | 5-Year | | | 10-Year | |
| Cumulative Total Return1 | | | + | 12.26 | % | + | 25.91 | % | + | 61.79 | % |
| Average Annual Total Return2 | | | + | 7.51 | % | + | 3.81 | % | + | 4.47 | % |
| Avg. Ann. Total Return (3/31/12)3 | | | + | 7.92 | % | + | 3.82 | % | + | 4.64 | % |
| Distribution Rate4 | 4.18 | % | | | | | | | | | |
| Taxable Equivalent Distribution Rate5 | 6.43 | % | | | | | | | | | |
| 30-Day Standardized Yield6 | 2.99 | % | | | | | | | | | |
| Taxable Equivalent Yield5 | 4.60 | % | | | | | | | | | |
| Total Annual Operating Expenses7 | 0.62 | % | | | | | | | | | |
| Class B | | | | 1-Year | | | 5-Year | | | 10-Year | |
| Cumulative Total Return1 | | | + | 11.66 | % | + | 22.42 | % | + | 55.00 | % |
| Average Annual Total Return2 | | | + | 7.66 | % | + | 3.79 | % | + | 4.48 | % |
| Avg. Ann. Total Return (3/31/12)3 | | | + | 8.13 | % | + | 3.80 | % | + | 4.65 | % |
| Distribution Rate4 | 3.75 | % | | | | | | | | | |
| Taxable Equivalent Distribution Rate5 | 5.77 | % | | | | | | | | | |
| 30-Day Standardized Yield6 | 2.58 | % | | | | | | | | | |
| Taxable Equivalent Yield5 | 3.97 | % | | | | | | | | | |
| Total Annual Operating Expenses7 | 1.17 | % | | | | | | | | | |
| Class C | | | | 1-Year | | | 5-Year | | | 10-Year | |
| Cumulative Total Return1 | | | + | 11.74 | % | + | 22.52 | % | + | 53.22 | % |
| Average Annual Total Return2 | | | + | 10.74 | % | + | 4.15 | % | + | 4.36 | % |
| Avg. Ann. Total Return (3/31/12)3 | | | + | 11.02 | % | + | 4.14 | % | + | 4.53 | % |
| Distribution Rate4 | 3.72 | % | | | | | | | | | |
| Taxable Equivalent Distribution Rate5 | 5.72 | % | | | | | | | | | |
| 30-Day Standardized Yield6 | 2.59 | % | | | | | | | | | |
| Taxable Equivalent Yield5 | 3.98 | % | | | | | | | | | |
| Total Annual Operating Expenses7 | 1.17 | % | | | | | | | | | |
Performance data represent past performance, which does not guarantee future results. Investment return and principal value will fluctuate, and you may have a gain or loss when you sell your shares. Current performance may differ from figures shown. For most recent month-end performance, go to franklintempleton.com or call (800) 342-5236.
Annual Report | 21
Performance Summary (continued)
Total Return Index Comparison for a Hypothetical $10,000 Investment
Total return represents the change in value of an investment over the periods shown. It includes any current, applicable, maximum sales charge, Fund expenses, account fees and reinvested distributions. The unmanaged index includes reinvestment of any income or distributions. It differs from the Fund in composition and does not pay management fees or expenses. One cannot invest directly in an index.

22 | Annual Report
Endnotes
All investments involve risks, including possible loss of principal. Because municipal bonds are sensitive to interest rate movements, the Fund’s yield and share price will fluctuate with market conditions. Bond prices generally move in the opposite direction of interest rates. Thus, as prices of bonds in the Fund adjust to a rise in interest rates, the Fund’s share price may decline. Changes in the financial strength of a bond issuer or in a bond’s credit rating may affect its value. The Fund is actively managed but there is no guarantee that the manager’s investment decisions will produce the desired results. Since the Fund concentrates its investments in a single state, it is subject to greater risk of adverse economic and regulatory changes in that state than a geographically diversified fund. The Fund’s prospectus also includes a description of the main investment risks.
Class B: These shares have higher annual fees and expenses than Class A shares.
Class C: Prior to 1/1/04, these shares were offered with an initial sales charge; thus actual total returns would
have differed. These shares have higher annual fees and expenses than Class A shares.
1. Cumulative total return represents the change in value of an investment over the periods indicated.
2. Average annual total return represents the average annual change in value of an investment over the periods indicated.
3. In accordance with SEC rules, we provide standardized average annual total return information through the latest calendar quarter.
4. Distribution rate is based on an annualization of the respective class’s current monthly dividend and the maximum offering price (NAV for Classes B and C) per share on 2/29/12.
5. Taxable equivalent distribution rate and yield assume the 2012 maximum federal income tax rate of 35.00%.
6. The 30-day standardized yield for the month ended 2/29/12 reflects an estimated yield to maturity (assuming all portfolio securities are held to maturity). It should be regarded as an estimate of the Fund’s rate of investment income, and it may not equal the Fund’s actual income distribution rate (which reflects the Fund’s past dividends paid to shareholders) or the income reported in the Fund’s financial statements.
7. Figures are as stated in the Fund’s prospectus current as of the date of this report. In periods of market volatility, assets may decline significantly, causing total annual Fund operating expenses to become higher than the figures shown.
8. Source: © 2012 Morningstar. The BC Municipal Bond Index is a market value-weighted index engineered for the long-term tax-exempt bond market. To be included in the index, bonds must be fixed rate, have at least one year to final maturity and be rated investment grade (Baa3/BBB- or higher) by at least two of the following agencies: Moody’s, Standard & Poor’s and Fitch. The Consumer Price Index (CPI), calculated by the U.S. Bureau of Labor Statistics, is a commonly used measure of the inflation rate.
Annual Report | 23
Your Fund’s Expenses
Franklin Florida Tax-Free Income Fund
As a Fund shareholder, you can incur two types of costs:
- Transaction costs, including sales charges (loads) on Fund purchases; and
- Ongoing Fund costs, including management fees, distribution and service (12b-1) fees, and other Fund expenses. All mutual funds have ongoing costs, sometimes referred to as operating expenses.
The following table shows ongoing costs of investing in the Fund and can help you understand these costs and compare them with those of other mutual funds. The table assumes a $1,000 investment held for the six months indicated.
Actual Fund Expenses
The first line (Actual) for each share class listed in the table provides actual account values and expenses. The “Ending Account Value” is derived from the Fund’s actual return, which includes the effect of Fund expenses.
You can estimate the expenses you paid during the period by following these steps. Of course, your account value and expenses will differ from those in this illustration:
| 1. | Divide your account value by $1,000. |
| | If an account had an $8,600 value, then $8,600 ÷ $1,000 = 8.6. |
| 2. | Multiply the result by the number under the heading “Expenses Paid During Period.” |
| | If Expenses Paid During Period were $7.50, then 8.6 x $7.50 = $64.50. |
In this illustration, the estimated expenses paid this period are $64.50.
Hypothetical Example for Comparison with Other Funds
Information in the second line (Hypothetical) for each class in the table can help you compare ongoing costs of investing in the Fund with those of other mutual funds. This information may not be used to estimate the actual ending account balance or expenses you paid during the period. The hypothetical “Ending Account Value” is based on the actual expense ratio for each class and an assumed 5% annual rate of return before expenses, which does not represent the Fund’s actual return. The figure under the heading “Expenses Paid During Period” shows the hypothetical expenses your account would have incurred under this scenario. You can compare this figure with the 5% hypothetical examples that appear in shareholder reports of other funds.
24 | Annual Report
Your Fund’s Expenses (continued)
Please note that expenses shown in the table are meant to highlight ongoing costs and do not reflect any transaction costs, such as sales charges. Therefore, the second line for each class is useful in comparing ongoing costs only, and will not help you compare total costs of owning different funds. In addition, if transaction costs were included, your total costs would have been higher. Please refer to the Fund prospectus for additional information on operating expenses.
| | | | | | |
| | | Beginning Account | | Ending Account | | Expenses Paid During |
| Class A | | Value 9/1/11 | | Value 2/29/12 | | Period* 9/1/11–2/29/12 |
| Actual | $ | 1,000 | $ | 1,061.00 | $ | 3.18 |
| Hypothetical (5% return before expenses) | $ | 1,000 | $ | 1,021.78 | $ | 3.12 |
| Class B | | | | | | |
| Actual | $ | 1,000 | $ | 1,057.60 | $ | 6.04 |
| Hypothetical (5% return before expenses) | $ | 1,000 | $ | 1,019.00 | $ | 5.92 |
| Class C | | | | | | |
| Actual | $ | 1,000 | $ | 1,057.90 | $ | 6.04 |
| Hypothetical (5% return before expenses) | $ | 1,000 | $ | 1,019.00 | $ | 5.92 |
*Expenses are calculated using the most recent six-month expense ratio, annualized for each class (A: 0.62%; B: 1.18%; and C: 1.18%), multiplied by the average account value over the period, multiplied by 182/366 to reflect the one-half year period.
Annual Report | 25
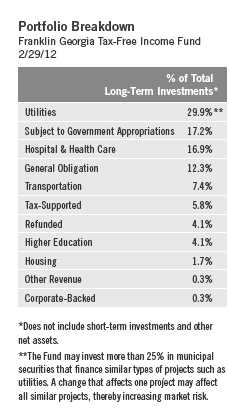
Franklin Georgia Tax-Free Income Fund
Your Fund’s Goal and Main Investments: Franklin Georgia Tax-Free Income Fund
seeks to provide as high a level of income exempt from federal and Georgia personal income taxes as is consistent with prudent investment management and preservation of capital by investing at least 80% of its total assets in securities that pay interest free from such taxes.1
Performance data represent past performance, which does not guarantee future results. Investment return and principal value will fluctuate, and you may have a gain or loss when you sell your shares. Current performance may differ from figures shown. Please visit franklintempleton.com or call (800) 342-5236 for most recent month-end performance.
| | |
| Credit Quality Breakdown* | | |
| Franklin Georgia Tax-Free Income Fund | | |
| 2/29/12 | | |
| | % of Total | |
| Ratings | Long-Term Investments** | |
| AAA | 6.0 | % |
| AA | 54.0 | % |
| A | 28.6 | % |
| BBB | 8.0 | % |
| Below Investment Grade | 0.8 | % |
| Not Rated | 2.6 | % |
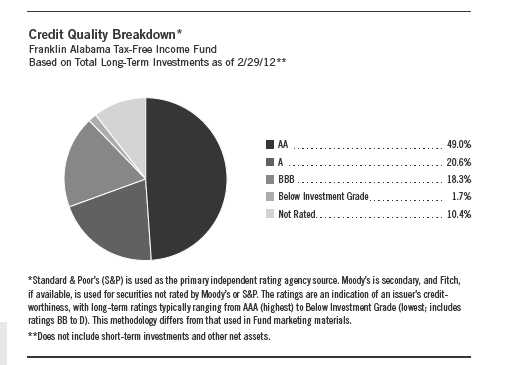
*Standard & Poor’s (S&P) is used as the primary independent rating agency source. Moody’s is secondary, and Fitch, if available, is used for securities not rated by Moody’s or S&P. The ratings are an indication of an issuer’s credit-worthiness, with long-term ratings typically ranging from AAA (highest) to Below Investment Grade (lowest; includes ratings BB to D). This methodology differs from that used in Fund marketing materials.
**Does not include short-term investments and other net assets.
We are pleased to bring you Franklin Georgia Tax-Free Income Fund’s annual report for the fiscal year ended February 29, 2012.
Performance Overview
The Fund’s Class A share price, as measured by net asset value, increased from $11.47 on February 28, 2011, to $12.49 on February 29, 2012. The Fund’s Class A shares paid dividends totaling 50.49 cents per share for the
1. For investors subject to alternative minimum tax, a small portion of Fund dividends may be taxable. Distributions of capital gains are generally taxable. To avoid imposition of 28% backup withholding on all Fund distributions and redemption proceeds, U.S. investors must be properly certified on Form W-9 and non-U.S. investors on Form W-8BEN.
The dollar value, number of shares or principal amount, and names of all portfolio holdings are listed in the Fund’s Statement of Investments (SOI). The SOI begins on page 108.
26 | Annual Report
| | |
| Dividend Distributions* | | |
| Franklin Georgia Tax-Free Income Fund | | |
| | Dividend per Share |
| Month | Class A | Class C |
| March 2011 | 4.23 cents | 3.74 cents |
| April 2011 | 4.23 cents | 3.74 cents |
| May 2011 | 4.23 cents | 3.74 cents |
| June 2011 | 4.23 cents | 3.72 cents |
| July 2011 | 4.23 cents | 3.72 cents |
| August 2011 | 4.23 cents | 3.72 cents |
| September 2011 | 4.23 cents | 3.66 cents |
| October 2011 | 4.23 cents | 3.66 cents |
| November 2011 | 4.23 cents | 3.66 cents |
| December 2011** | 5.44 cents | 4.68 cents |
| January 2012 | 2.80 cents | 2.40 cents |
| February 2012 | 4.12 cents | 3.54 cents |
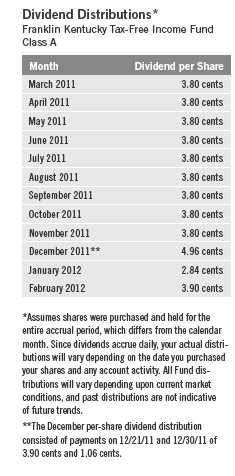
*Assumes shares were purchased and held for the entire accrual period, which differs from the calendar month. Since dividends accrue daily, your actual distributions will vary depending on the date you purchased your shares and any account activity. All Fund distributions will vary depending upon current market conditions, and past distributions are not indicative of future trends.
**The December per-share dividend distribution consisted of payments on 12/20/11 and 12/30/11 for each class as follows: Class A, 4.12 cents and 1.32 cents, and Class C, 3.54 cents and 1.14 cents.
same period.2 The Performance Summary beginning on page 30 shows that at the end of this reporting period the Fund’s Class A shares’ distribution rate was 3.61% based on an annualization of the current 3.92 cent per share dividend and the maximum offering price of $13.04 on February 29, 2012. An investor in the 2012 maximum combined effective federal and Georgia personal income tax bracket of 38.90% would need to earn a distribution rate of 5.91% from a taxable investment to match the Fund’s Class A tax-free distribution rate. For the Fund’s Class C shares’ performance, please see the Performance Summary. The reduction in dividend distributions from the start to the end of the period under review reflected generally declining interest rates. Additionally, investor demand was strong for municipal bonds in an environment of limited tax-exempt supply. These factors resulted in reduced income for the portfolio and caused dividends to decline overall.
2. All Fund distributions will vary depending upon current market conditions, and past distributions are not indicative of future trends.
Annual Report | 27
State Update
Georgia’s economic recovery lagged the nation’s during the reporting period, with continued job losses and high unemployment despite generally improving personal income. The state’s housing market showed little signs of improvement, with home prices declining at a faster rate than the national average and the state’s foreclosure rate among the nation’s highest. The construction sector continued to shed jobs during the period. The information and mining and logging sectors also experienced large job losses. The professional and business services sector and education and health services sector led job gains. The state’s unemployment rate improved from a December 2010 historical high of 10.4% to 9.1% at period-end, but remained higher than the 8.3% national average.3
The state has a good budget management framework and strong financial management practices. The executive branch has broad authority to adjust appropriations and has a history of making politically challenging revenue and expenditure decisions to maintain budget balance during the fiscal year. Georgia’s fiscal year 2012 budget was structurally balanced without the use of nonrecurring revenues and with recurring revenues used to cover recurring expenditures. Although all budget areas increased except for education and debt service, the total spending increase was only slightly larger than the amended fiscal year 2011 budget. The governor’s fiscal year 2013 budget proposal, which forecast moderate revenue growth, is larger than the fiscal year 2012 budget. Most of the additional funding is appropriated for student enrollment growth, filling Medicaid shortfalls and the state health benefit plan, and making required retirement plan payments. To remain balanced, the proposed budget included base spending reductions by most agencies as well as consolidation of some agencies.
Georgia’s net tax-supported debt was 3.3% of personal income and $1,103 per capita, compared with the national medians of 2.8% and $1,066.4 Independent credit rating agency Standard &Poor’s assigned Georgia’s general obligation debt its highest rating of AAA with a stable outlook.5 The rating and outlook reflected the state’s well-diversified economy that remains well positioned to recover in the medium term, history of restoring fiscal balance by making difficult decisions, and revenue shortfall reserve that is being replenished.
3. Source: Bureau of Labor Statistics.
4. Source: Moody’s Investors Service, “Special Comment: 2011 State Debt Medians Report,” 6/3/11.
5. This does not indicate Standard & Poor’s rating of the Fund.

Manager’s Discussion
We used various investment strategies during the 12 months under review as we sought to maximize tax-free income for shareholders. Please read the discussion on page 6 for details.
Thank you for your continued participation in Franklin Georgia Tax-Free Income Fund. We believe our conservative, buy-and-hold investment strategy can help us achieve high, current, tax-free income for shareholders.
The foregoing information reflects our analysis, opinions and portfolio holdings as of February 29, 2012, the end of the reporting period. The way we implement our main investment strategies and the resulting portfolio holdings may change depending on factors such as market and economic conditions. These opinions may not be relied upon as investment advice or an offer for a particular security. The information is not a complete analysis of every aspect of any market, state, industry, security or the Fund. Statements of fact are from sources considered reliable, but the investment manager makes no representation or warranty as to their completeness or accuracy. Although historical performance is no guarantee of future results, these insights may help you understand our investment management philosophy.
Annual Report | 29
Performance Summary as of 2/29/12
Franklin Georgia Tax-Free Income Fund
Your dividend income will vary depending on dividends or interest paid by securities in the Fund’s portfolio, adjusted for operating expenses of each class. Capital gain distributions are net profits realized from the sale of portfolio securities. The performance table and graphs do not reflect any taxes that a shareholder would pay on Fund dividends, capital gain distributions, if any, or any realized gains on the sale of Fund shares. Total return reflects reinvestment of the Fund’s dividends and capital gain distributions, if any, and any unrealized gains or losses.
| | | | | | | | |
| Price and Distribution Information | | | | | | |
| Class A (Symbol: FTGAX) | | | | Change | | 2/29/12 | | 2/28/11 |
| Net Asset Value (NAV) | | | +$ | 1.02 | $ | 12.49 | $ | 11.47 |
| Distributions (3/1/11–2/29/12) | | | | | | | | |
| Dividend Income | $ | 0.5049 | | | | | | |
| Class C (Symbol: FGAIX) | | | | Change | | 2/29/12 | | 2/28/11 |
| Net Asset Value (NAV) | | | +$ | 1.04 | $ | 12.64 | $ | 11.60 |
| Distributions (3/1/11–2/29/12) | | | | | | | | |
| Dividend Income | $ | 0.4398 | | | | | | |
Performance
Cumulative total return excludes sales charges. Average annual total returns include maximum sales charges. Class A: 4.25% maximum initial sales charge; Class C: 1% contingent deferred sales charge in first year only.
| | | | | | | | | | | |
| Class A | | | | 1-Year | | | 5-Year | | | 10-Year | |
| Cumulative Total Return1 | | | + | 13.57 | % | + | 26.48 | % | + | 61.93 | % |
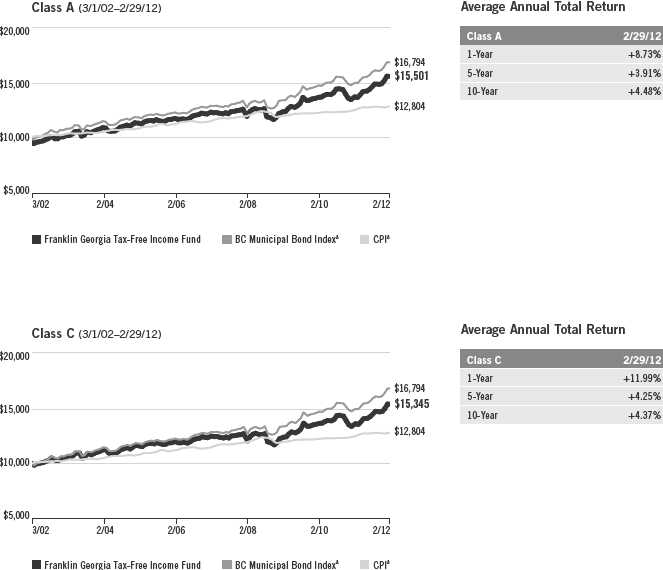
| Average Annual Total Return2 | | | + | 8.73 | % | + | 3.91 | % | + | 4.48 | % |
| Avg. Ann. Total Return (3/31/12)3 | | | + | 8.69 | % | + | 3.87 | % | + | 4.60 | % |
| Distribution Rate4 | 3.61 | % | | | | | | | | | |
| Taxable Equivalent Distribution Rate5 | 5.91 | % | | | | | | | | | |
| 30-Day Standardized Yield6 | 2.53 | % | | | | | | | | | |
| Taxable Equivalent Yield5 | 4.14 | % | | | | | | | | | |
| Total Annual Operating Expenses7 | 0.67 | % | | | | | | | | | |
| Class C | | | | 1-Year | | | 5-Year | | | 10-Year | |
| Cumulative Total Return1 | | | + | 12.99 | % | + | 23.13 | % | + | 53.45 | % |
| Average Annual Total Return2 | | | + | 11.99 | % | + | 4.25 | % | + | 4.37 | % |
| Avg. Ann. Total Return (3/31/12)3 | | | + | 11.88 | % | + | 4.21 | % | + | 4.49 | % |
| Distribution Rate4 | 3.16 | % | | | | | | | | | |
| Taxable Equivalent Distribution Rate5 | 5.17 | % | | | | | | | | | |
| 30-Day Standardized Yield6 | 2.09 | % | | | | | | | | | |
| Taxable Equivalent Yield5 | 3.42 | % | | | | | | | | | |
| Total Annual Operating Expenses7 | 1.22 | % | | | | | | | | | |
Performance data represent past performance, which does not guarantee future results. Investment return and principal value will fluctuate, and you may have a gain or loss when you sell your shares. Current performance may differ from figures shown. For most recent month-end performance, go to franklintempleton.com or call (800) 342-5236.
30 | Annual Report
Performance Summary (continued)
Total Return Index Comparison for a Hypothetical $10,000 Investment
Total return represents the change in value of an investment over the periods shown. It includes any current, applicable, maximum sales charge, Fund expenses, account fees and reinvested distributions. The unmanaged index includes reinvestment of any income or distributions. It differs from the Fund in composition and does not pay management fees or expenses. One cannot invest directly in an index.
Annual Report | 31
Performance Summary (continued)
Endnotes
All investments involve risks, including possible loss of principal. Because municipal bonds are sensitive to interest rate movements, the Fund’s yield and share price will fluctuate with market conditions. Bond prices generally move in the opposite direction of interest rates. Thus, as prices of bonds in the Fund adjust to a rise in interest rates, the Fund’s share price may decline. Changes in the financial strength of a bond issuer or in a bond’s credit rating may affect its value. The Fund is actively managed but there is no guarantee that the manager’s investment decisions will produce the desired results. Since the Fund concentrates its investments in a single state, it is subject to greater risk of adverse economic and regulatory changes in that state than a geographically diversified fund. The Fund’s prospectus also includes a description of the main investment risks.
| |
Class C: | Prior to 1/1/04, these shares were offered with an initial sales charge; thus actual total returns would have differed. These shares have higher annual fees and expenses than Class A shares. |
1. Cumulative total return represents the change in value of an investment over the periods indicated.
2. Average annual total return represents the average annual change in value of an investment over the periods indicated.
3. In accordance with SEC rules, we provide standardized average annual total return information through the latest calendar quarter.
4. Distribution rate is based on an annualization of the respective class’s current monthly dividend and the maximum offering price (NAV for Class C) per share on 2/29/12.
5. Taxable equivalent distribution rate and yield assume the published rates as of 12/28/11 for the maximum combined effective federal and Georgia personal income tax rate of 38.90%, based on the federal income tax rate of 35.00%.
6. The 30-day standardized yield for the month ended 2/29/12 reflects an estimated yield to maturity (assuming all portfolio securities are held to maturity). It should be regarded as an estimate of the Fund’s rate of investment income, and it may not equal the Fund’s actual income distribution rate (which reflects the Fund’s past dividends paid to shareholders) or the income reported in the Fund’s financial statements.
7. Figures are as stated in the Fund’s prospectus current as of the date of this report. In periods of market volatility, assets may decline significantly, causing total annual Fund operating expenses to become higher than the figures shown.
8. Source: © 2012 Morningstar. The BC Municipal Bond Index is a market value-weighted index engineered for the long-term tax-exempt bond market. To be included in the index, bonds must be fixed rate, have at least one year to final maturity and be rated investment grade (Baa3/BBB-or higher) by at least two of the following agencies: Moody’s, Standard & Poor’s and Fitch. The Consumer Price Index (CPI), calculated by the U.S. Bureau of Labor Statistics, is a commonly used measure of the inflation rate.
32 | Annual Report
Your Fund’s Expenses
Franklin Georgia Tax-Free Income Fund
As a Fund shareholder, you can incur two types of costs:
- Transaction costs, including sales charges (loads) on Fund purchases; and
- Ongoing Fund costs, including management fees, distribution and service (12b-1) fees, and other Fund expenses. All mutual funds have ongoing costs, sometimes referred to as operating expenses.
The following table shows ongoing costs of investing in the Fund and can help you understand these costs and compare them with those of other mutual funds. The table assumes a $1,000 investment held for the six months indicated.
Actual Fund Expenses
The first line (Actual) for each share class listed in the table provides actual account values and expenses. The “Ending Account Value” is derived from the Fund’s actual return, which includes the effect of Fund expenses.
You can estimate the expenses you paid during the period by following these steps. Of course, your account value and expenses will differ from those in this illustration:
| 1. | Divide your account value by $1,000. |
| | If an account had an $8,600 value, then $8,600 ÷ $1,000 = 8.6. |
| 2. | Multiply the result by the number under the heading “Expenses Paid During Period.” |
| | If Expenses Paid During Period were $7.50, then 8.6 x $7.50 = $64.50. |
In this illustration, the estimated expenses paid this period are $64.50.
Hypothetical Example for Comparison with Other Funds
Information in the second line (Hypothetical) for each class in the table can help you compare ongoing costs of investing in the Fund with those of other mutual funds. This information may not be used to estimate the actual ending account balance or expenses you paid during the period. The hypothetical “Ending Account Value” is based on the actual expense ratio for each class and an assumed 5% annual rate of return before expenses, which does not represent the Fund’s actual return. The figure under the heading “Expenses Paid During Period” shows the hypothetical expenses your account would have incurred under this scenario. You can compare this figure with the 5% hypothetical examples that appear in shareholder reports of other funds.
Annual Report | 33
Your Fund’s Expenses (continued)
Please note that expenses shown in the table are meant to highlight ongoing costs and do not reflect any transaction costs, such as sales charges. Therefore, the second line for each class is useful in comparing ongoing costs only, and will not help you compare total costs of owning different funds. In addition, if transaction costs were included, your total costs would have been higher. Please refer to the Fund prospectus for additional information on operating expenses.
| | | | | | |
| | | Beginning Account | | Ending Account | | Expenses Paid During |
| Class A | | Value 9/1/11 | | Value 2/29/12 | | Period* 9/1/11–2/29/12 |
| Actual | $ | 1,000 | $ | 1,064.00 | $ | 3.44 |
| Hypothetical (5% return before expenses) | $ | 1,000 | $ | 1,021.53 | $ | 3.37 |
| Class C | | | | | | |
| Actual | $ | 1,000 | $ | 1,061.10 | $ | 6.25 |
| Hypothetical (5% return before expenses) | $ | 1,000 | $ | 1,018.80 | $ | 6.12 |
*Expenses are calculated using the most recent six-month expense ratio, annualized for each class (A: 0.67% and C: 1.22%), multiplied by the average account value over the period, multiplied by 182/366 to reflect the one-half year period.
34 | Annual Report
Franklin Kentucky Tax-Free Income Fund
Your Fund’s Goal and Main Investments: Franklin Kentucky Tax-Free Income Fund seeks to provide as high a level of income exempt from federal and Kentucky personal income taxes as is consistent with prudent investment management and preservation of capital by investing at least 80% of its total assets in securities that pay interest free from such taxes.1

Performance data represent past performance, which does not guarantee future results. Investment return and principal value will fluctuate, and you may have a gain or loss when you sell your shares. Current performance may differ from figures shown. Please visit franklintempleton.com or call (800) 342-5236 for most recent month-end performance.
We are pleased to bring you Franklin Kentucky Tax-Free Income Fund’s annual report for the fiscal year ended February 29, 2012.
Performance Overview
The Fund’s Class A share price, as measured by net asset value, increased from $10.78 on February 28, 2011, to $11.62 on February 29, 2012. The Fund’s Class A shares paid dividends totaling 46.09 cents per share for the
1. For investors subject to alternative minimum tax, a small portion of Fund dividends may be taxable. Distributions of capital gains are generally taxable. To avoid imposition of 28% backup withholding on all Fund distributions and redemption proceeds, U.S. investors must be properly certified on Form W-9 and non-U.S. investors on Form W-8BEN.
The dollar value, number of shares or principal amount, and names of all portfolio holdings are listed in the Fund’s Statement of Investments (SOI). The SOI begins on page 114.
Annual Report | 35
same period.2 The Performance Summary beginning on page 38 shows that at the end of this reporting period the Fund’s Class A shares’ distribution rate was 3.71%. An investor in the 2012 maximum combined effective federal and Kentucky personal income tax bracket of 38.90% would need to earn a distribution rate of 6.07% from a taxable investment to match the Fund’s Class A tax-free distribution rate.
Commonwealth Update
Kentucky’s economy continued to recover, but at a slower pace than the nation’s. The commonwealth is a significant coal producer, which has helped boost its revenues. Although Kentucky’s economic base has diversified in recent years, it remained reliant on the manufacturing sector, particularly the automobile industry. At period-end, Kentucky’s unemployment rate was 8.7%, which was higher than the 8.3% national average.3 The information, financial activities, and mining and logging sectors led job losses, while the professional and business services, leisure and hospitality, and construction sectors led job growth.
The commonwealth’s enacted fiscal 2011-2012 biennial budget relied on several one-time measures, some spending cuts and projected revenue growth to achieve balance. General fund revenues in the first half of fiscal year 2012 were ahead of budget forecasts, reflecting strong sales and corporate tax receipts. The governor’s fiscal 2013-2014 biennial budget proposal moved closer to structural balance as it reduced reliance on one-time measures to fund recurring expenses. It also included a moderate revenue growth forecast and spending reductions to most state agencies. Key areas exempted from proposed general fund spending cuts included certain education, health care and public safety programs, as well as debt service payments.
Kentucky’s net tax-supported debt was 6.1% of personal income and $1,961 per capita, compared with the national medians of 2.8% and $1,066.4 Independent credit rating agency Moody’s Investors Service assigned Kentucky an issuer rating of Aa2 with a negative outlook.5 The rating reflected the commonwealth’s reliance on appropriation-backed debt, revenue stabilization and active financial control practices. The negative outlook reflected Moody’s assessment of the commonwealth’s significant fiscal stress, large unfunded pension liability and
2. All Fund distributions will vary depending upon current market conditions, and past distributions are not indicative of future trends.
3. Source: Bureau of Labor Statistics.
4. Source: Moody’s Investors Service, “Special Comment: 2011 State Debt Medians Report,” 6/3/11.
5. This does not indicate Moody’s rating of the Fund.
36 | Annual Report
reliance on one-time budget balancing solutions. Additionally, the commonwealth’s economy remains vulnerable primarily due to its relatively higher exposure to the manufacturing sector.
Manager’s Discussion
We used various investment strategies during the 12 months under review as we sought to maximize tax-free income for shareholders. Please read the discussion on page 6 for details.
Thank you for your continued participation in Franklin Kentucky Tax-Free Income Fund. We believe our conservative, buy-and-hold investment strategy can help us achieve high, current, tax-free income for shareholders.
The foregoing information reflects our analysis, opinions and portfolio holdings as of February 29, 2012, the end of the reporting period. The way we implement our main investment strategies and the resulting portfolio holdings may change depending on factors such as market and economic conditions. These opinions may not be relied upon as investment advice or an offer for a particular security. The information is not a complete analysis of every aspect of any market, state, industry, security or the Fund. Statements of fact are from sources considered reliable, but the investment manager makes no representation or warranty as to their completeness or accuracy. Although historical performance is no guarantee of future results, these insights may help you understand our investment management philosophy.
Annual Report | 37
Performance Summary as of 2/29/12
Franklin Kentucky Tax-Free Income Fund
Your dividend income will vary depending on dividends or interest paid by securities in the Fund’s portfolio, adjusted for operating expenses. Capital gain distributions are net profits realized from the sale of portfolio securities. The performance table and graph do not reflect any taxes that a shareholder would pay on Fund dividends, capital gain distributions, if any, or any realized gains on the sale of Fund shares. Total return reflects reinvestment of the Fund’s dividends and capital gain distributions, if any, and any unrealized gains or losses.
| | | | | | | | |
| Price and Distribution Information | | | | | | |
| Class A (Symbol: FRKYX) | | | | Change | | 2/29/12 | | 2/28/11 |
| Net Asset Value (NAV) | | | +$ | 0.84 | $ | 11.62 | $ | 10.78 |
| Distributions (3/1/11–2/29/12) | | | | | | | | |
| Dividend Income | $ | 0.4609 | | | | | | |
Performance
Cumulative total return excludes the sales charge. Average annual total returns include the maximum sales charge.
Class A: 4.25% maximum initial sales charge.
| | | | | | | | | | | |
| Class A | | | | 1-Year | | | 5-Year | | | 10-Year | |
| Cumulative Total Return1 | | | + | 12.32 | % | + | 25.15 | % | + | 59.47 | % |
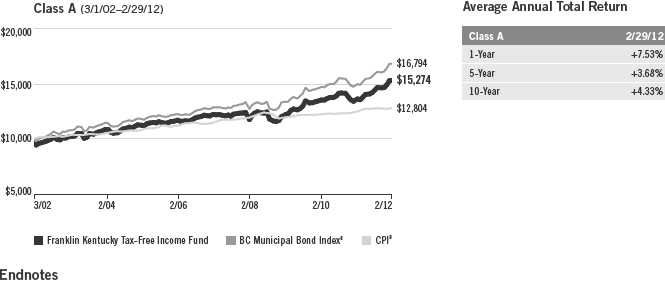
| Average Annual Total Return2 | | | + | 7.53 | % | + | 3.68 | % | + | 4.33 | % |
| Avg. Ann. Total Return (3/31/12)3 | | | + | 7.96 | % | + | 3.73 | % | + | 4.47 | % |
| Distribution Rate4 | 3.71 | % | | | | | | | | | |
| Taxable Equivalent Distribution Rate5 | 6.07 | % | | | | | | | | | |
| 30-Day Standardized Yield6 | 2.71 | % | | | | | | | | | |
| Taxable Equivalent Yield5 | 4.44 | % | | | | | | | | | |
| Total Annual Operating Expenses7 | 0.74 | % | | | | | | | | | |
Performance data represent past performance, which does not guarantee future results. Investment return and principal value will fluctuate, and you may have a gain or loss when you sell your shares. Current performance may differ from figures shown. For most recent month-end performance, go to franklintempleton.com or call (800) 342-5236.
38 | Annual Report
Performance Summary (continued)
Total Return Index Comparison for a Hypothetical $10,000 Investment
Total return represents the change in value of an investment over the periods shown. It includes the maximum sales charge, Fund expenses, account fees and reinvested distributions. The unmanaged index includes reinvestment of any income or distributions. It differs from the Fund in composition and does not pay management fees or expenses. One cannot invest directly in an index.
All investments involve risks, including possible loss of principal. Because municipal bonds are sensitive to interest rate movements, the Fund’s yield and share price will fluctuate with market conditions. Bond prices generally move in the opposite direction of interest rates. Thus, as prices of bonds in the Fund adjust to a rise in interest rates, the Fund’s share price may decline. Changes in the financial strength of a bond issuer or in a bond’s credit rating may affect its value. The Fund is actively managed but there is no guarantee that the manager’s investment decisions will produce the desired results. Since the Fund concentrates its investments in a single state, it is subject to greater risk of adverse economic and regulatory changes in that state than a geographically diversified fund. The Fund’s prospectus also includes a description of the main investment risks.
1. Cumulative total return represents the change in value of an investment over the periods indicated.
2. Average annual total return represents the average annual change in value of an investment over the periods indicated.
3. In accordance with SEC rules, we provide standardized average annual total return information through the latest calendar quarter.
4. Distribution rate is based on an annualization of the 3.75 cent per share current monthly dividend and the maximum offering price of $12.14 per share on 2/29/12.
5. Taxable equivalent distribution rate and yield assume the published rates as of 12/28/11 for the maximum combined effective federal and Kentucky personal income tax rate of 38.90%, based on the federal income tax rate of 35.00%.
6. The 30-day standardized yield for the month ended 2/29/12 reflects an estimated yield to maturity (assuming all portfolio securities are held to maturity). It should be regarded as an estimate of the Fund’s rate of investment income, and it may not equal the Fund’s actual income distribution rate (which reflects the Fund’s past dividends paid to shareholders) or the income reported in the Fund’s financial statements.
7. Figures are as stated in the Fund’s prospectus current as of the date of this report. In periods of market volatility, assets may decline significantly, causing total annual Fund operating expenses to become higher than the figures shown.
8. Source: © 2012 Morningstar. The BC Municipal Bond Index is a market value-weighted index engineered for the
long-term tax-exempt bond market. To be included in the index, bonds must be fixed rate, have at least one year to
final maturity and be rated investment grade (Baa3/BBB- or higher) by at least two of the following agencies:
Moody’s, Standard & Poor’s and Fitch. The Consumer Price Index (CPI), calculated by the U.S. Bureau of Labor
Statistics, is a commonly used measure of the inflation rate.
Annual Report | 39
Your Fund’s Expenses
Franklin Kentucky Tax-Free Income Fund
As a Fund shareholder, you can incur two types of costs:
- Transaction costs, including sales charges (loads) on Fund purchases; and
- Ongoing Fund costs, including management fees, distribution and service (12b-1) fees, and other Fund expenses. All mutual funds have ongoing costs, sometimes referred to as operating expenses.
The following table shows ongoing costs of investing in the Fund and can help you understand these costs and compare them with those of other mutual funds. The table assumes a $1,000 investment held for the six months indicated.
Actual Fund Expenses
The first line (Actual) for each share class listed in the table provides actual account values and expenses. The “Ending Account Value” is derived from the Fund’s actual return, which includes the effect of Fund expenses.
You can estimate the expenses you paid during the period by following these steps. Of course, your account value and expenses will differ from those in this illustration:
| 1. | Divide your account value by $1,000. |
| | If an account had an $8,600 value, then $8,600 ÷ $1,000 = 8.6. |
| 2. | Multiply the result by the number under the heading “Expenses Paid During Period.” |
| | If Expenses Paid During Period were $7.50, then 8.6 x $7.50 = $64.50. |
In this illustration, the estimated expenses paid this period are $64.50.
Hypothetical Example for Comparison with Other Funds
Information in the second line (Hypothetical) for each class in the table can help you compare ongoing costs of investing in the Fund with those of other mutual funds. This information may not be used to estimate the actual ending account balance or expenses you paid during the period. The hypothetical “Ending Account Value” is based on the actual expense ratio for each class and an assumed 5% annual rate of return before expenses, which does not represent the Fund’s actual return. The figure under the heading “Expenses Paid During Period” shows the hypothetical expenses your account would have incurred under this scenario. You can compare this figure with the 5% hypothetical examples that appear in shareholder reports of other funds.
40 | Annual Report
Your Fund’s Expenses (continued)
Please note that expenses shown in the table are meant to highlight ongoing costs and do not reflect any transaction costs, such as sales charges. Therefore, the second line for each class is useful in comparing ongoing costs only, and will not help you compare total costs of owning different funds. In addition, if transaction costs were included, your total costs would have been higher. Please refer to the Fund prospectus for additional information on operating expenses.
| | | | | | |
| | | Beginning Account | | Ending Account | | Expenses Paid During |
| Class A | | Value 9/1/11 | | Value 2/29/12 | | Period* 9/1/11–2/29/12 |
| Actual | $ | 1,000 | $ | 1,060.50 | $ | 3.84 |
| Hypothetical (5% return before expenses) | $ | 1,000 | $ | 1,021.13 | $ | 3.77 |
*Expenses are calculated using the most recent six-month annualized expense ratio of 0.75%, multiplied by the average account value over the period, multiplied by 182/366 to reflect the one-half year period.
Annual Report | 41
Franklin Louisiana Tax-Free Income Fund
Your Fund’s Goal and Main Investments: Franklin Louisiana Tax-Free Income Fund seeks to provide as high a level of income exempt from federal and Louisiana personal income taxes as is consistent with prudent investment management and preservation of capital by investing at least 80% of its total assets in securities that pay interest free from such taxes.1
Performance data represent past performance, which does not guarantee future results. Investment return and principal value will fluctuate, and you may have a gain or loss when you sell your shares. Current performance may differ from figures shown. Please visit franklintempleton.com or call (800) 342-5236 for most recent month-end performance.

We are pleased to bring you Franklin Louisiana Tax-Free Income Fund’s annual report for the fiscal year ended February 29, 2012.
Performance Overview
The Fund’s Class A share price, as measured by net asset value, increased from $10.91 on February 28, 2011, to $11.88 on February 29, 2012. The Fund’s Class A shares paid dividends totaling 49.08 cents per share for the
1. For investors subject to alternative minimum tax, a small portion of Fund dividends may be taxable. Distributions of capital gains are generally taxable. To avoid imposition of 28% backup withholding on all Fund distributions and redemption proceeds, U.S. investors must be properly certified on Form W-9 and non-U.S. investors on Form W-8BEN.
The dollar value, number of shares or principal amount, and names of all portfolio holdings are listed in the Fund’s Statement of Investments (SOI). The SOI begins on page 119.
42 | Annual Report
| | |
| Dividend Distributions* | | |
| Franklin Louisiana Tax-Free Income Fund | | |
| | Dividend per Share |
| Month | Class A | Class C |
| March 2011 | 4.09 cents | 3.61 cents |
| April 2011 | 4.09 cents | 3.61 cents |
| May 2011 | 4.09 cents | 3.61 cents |
| June 2011 | 4.09 cents | 3.61 cents |
| July 2011 | 4.09 cents | 3.61 cents |
| August 2011 | 4.09 cents | 3.61 cents |
| September 2011 | 4.09 cents | 3.55 cents |
| October 2011 | 4.09 cents | 3.55 cents |
| November 2011 | 4.09 cents | 3.55 cents |
| December 2011** | 5.14 cents | 4.44 cents |
| January 2012 | 2.94 cents | 2.54 cents |
| February 2012 | 4.04 cents | 3.49 cents |
*Assumes shares were purchased and held for the entire accrual period, which differs from the calendar month. Since dividends accrue daily, your actual distributions will vary depending on the date you purchased your shares and any account activity. All Fund distributions will vary depending upon current market conditions, and past distributions are not indicative of future trends.
**The December per-share dividend distribution consisted of payments on 12/21/11 and 12/30/11 for each class as follows: Class A, 4.04 cents and 1.10 cents, and Class C, 3.49 cents and 0.95 cents.
same period.2 The Performance Summary beginning on page 46 shows that at the end of this reporting period the Fund’s Class A shares’ distribution rate was 3.71% based on an annualization of the current 3.84 cent per share dividend and the maximum offering price of $12.41 on February 29, 2012. An investor in the 2012 maximum combined effective federal and Louisiana personal income tax bracket of 38.90% would need to earn a distribution rate of 6.07% from a taxable investment to match the Fund’s Class A tax-free distribution rate. For the Fund’s Class C shares’ performance, please see the Performance Summary. The reduction in dividend distributions from the start to the end of the period under review reflected generally declining interest rates. Additionally, investor demand was strong for municipal bonds in an environment of limited tax-exempt supply. These factors resulted in reduced income for the portfolio and caused dividends to decline overall.
2. All Fund distributions will vary depending upon current market conditions, and past distributions are not indicative of future trends.
Annual Report | 43
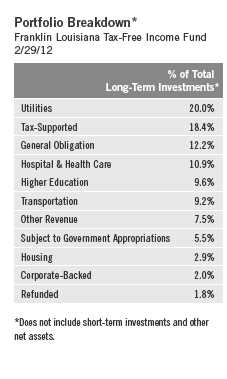
State Update
Louisiana’s economy has enjoyed lower-than-average unemployment in recent years, despite a concentration in the oil and gas industry. The state has a strong financial position and solid liquidity, largely due to federal stimulus money and significant federal funds to support rebuilding following Hurricane Katrina. Although the trade and government sectors were major employers, the less economically sensitive health care and social services and education sectors have been the main growth drivers over the past several years. At period-end, Louisiana’s 7.0% unemployment rate was significantly lower than the 8.3% national average.3
The state’s strong fiscal management framework limits budgeted expenditures to funds from current revenues and available reserves, and its constitution limits debt service payments to 6% of estimated revenues.4 Although the enacted fiscal year 2012 budget closed a gap, state officials found that 2012 tax collections would fall short of expectations, prompting Governor Jindal to issue an executive order to reduce expenditures. The governor’s proposed 2013 budget includes savings to be realized through a reduction in rates paid to Medicaid private providers and a reduction in state employee headcount, among other measures.
Since the early 2000s, Louisiana has reduced its debt burden significantly through reduced borrowing, economic gains and debt limitation measures. At period-end, Louisiana’s net tax-supported debt was 3.5% of personal income and $1,308 per capita, compared with the 2.8% and $1,066 national medians.5 Independent credit rating agency Moody’s Investors Service assigned Louisiana’s general obligation debt an Aa2 rating with a stable outlook.6 The rating and outlook reflected the state’s strong financial position, healthy liquidity, historically rapid responses to downward revenue forecasts, and to a lesser degree, upward trends in energy prices.
Manager’s Discussion
We used various investment strategies during the 12 months under review as we sought to maximize tax-free income for shareholders. Please read the discussion on page 6 for details.
3. Source: Bureau of Labor Statistics.
4. Source: Standard & Poor’s, “Louisiana; General Obligation,” RatingsDirect, 5/5/11.
5. Source: Moody’s Investors Service, “Special Comment: 2011 State Debt Medians Report,” 6/3/11.
6. This does not indicate Moody’s rating of the Fund.
44 | Annual Report
Thank you for your continued participation in Franklin Louisiana Tax-Free Income Fund. We believe our conservative, buy-and-hold investment strategy can help us achieve high, current, tax-free income for shareholders.
The foregoing information reflects our analysis, opinions and portfolio holdings as of February 29, 2012, the end of the reporting period. The way we implement our main investment strategies and the resulting portfolio holdings may change depending on factors such as market and economic conditions. These opinions may not be relied upon as investment advice or an offer for a particular security. The information is not a complete analysis of every aspect of any market, state, industry, security or the Fund. Statements of fact are from sources considered reliable, but the investment manager makes no representation or warranty as to their completeness or accuracy. Although historical performance is no guarantee of future results, these insights may help you understand our investment management philosophy.
Annual Report | 45
Performance Summary as of 2/29/12
Franklin Louisiana Tax-Free Income Fund
Your dividend income will vary depending on dividends or interest paid by securities in the Fund’s portfolio, adjusted for operating expenses of each class. Capital gain distributions are net profits realized from the sale of portfolio securities. The performance table and graphs do not reflect any taxes that a shareholder would pay on Fund dividends, capital gain distributions, if any, or any realized gains on the sale of Fund shares. Total return reflects reinvestment of the Fund’s dividends and capital gain distributions, if any, and any unrealized gains or losses.
| | | | | | | | |
| Price and Distribution Information | | | | | | |
| Class A (Symbol: FKLAX) | | | | Change | | 2/29/12 | | 2/28/11 |
| Net Asset Value (NAV) | | | +$ | 0.97 | $ | 11.88 | $ | 10.91 |
| Distributions (3/1/11–2/29/12) | | | | | | | | |
| Dividend Income | $ | 0.4908 | | | | | | |
| Class C (Symbol: FLAIX) | | | | Change | | 2/29/12 | | 2/28/11 |
| Net Asset Value (NAV) | | | +$ | 0.99 | $ | 12.03 | $ | 11.04 |
| Distributions (3/1/11–2/29/12) | | | | | | | | |
| Dividend Income | $ | 0.4288 | | | | | | |
Performance
Cumulative total return excludes sales charges. Average annual total returns include maximum sales charges. Class A: 4.25% maximum initial sales charge; Class C: 1% contingent deferred sales charge in first year only.
| | | | | | | | | | | |
| Class A | | | | 1-Year | | | 5-Year | | | 10-Year | |
| Cumulative Total Return1 | | | + | 13.67 | % | + | 26.90 | % | + | 61.89 | % |
| Average Annual Total Return2 | | | + | 8.88 | % | + | 3.96 | % | + | 4.48 | % |
| Avg. Ann. Total Return (3/31/12)3 | | | + | 8.65 | % | + | 3.90 | % | + | 4.58 | % |
| Distribution Rate4 | 3.71 | % | | | | | | | | | |
| Taxable Equivalent Distribution Rate5 | 6.07 | % | | | | | | | | | |
| 30-Day Standardized Yield6 | 2.75 | % | | | | | | | | | |
| Taxable Equivalent Yield5 | 4.50 | % | | | | | | | | | |
| Total Annual Operating Expenses7 | 0.68 | % | | | | | | | | | |
| Class C | | | | 1-Year | | | 5-Year | | | 10-Year | |
| Cumulative Total Return1 | | | + | 13.09 | % | + | 23.44 | % | + | 53.25 | % |
| Average Annual Total Return2 | | | + | 12.09 | % | + | 4.30 | % | + | 4.36 | % |
| Avg. Ann. Total Return (3/31/12)3 | | | + | 11.89 | % | + | 4.23 | % | + | 4.46 | % |
| Distribution Rate4 | 3.25 | % | | | | | | | | | |
| Taxable Equivalent Distribution Rate5 | 5.32 | % | | | | | | | | | |
| 30-Day Standardized Yield6 | 2.33 | % | | | | | | | | | |
| Taxable Equivalent Yield5 | 3.81 | % | | | | | | | | | |
| Total Annual Operating Expenses7 | 1.23 | % | | | | | | | | | |
Performance data represent past performance, which does not guarantee future results. Investment return and principal value will fluctuate, and you may have a gain or loss when you sell your shares. Current performance may differ from figures shown. For most recent month-end performance, go to franklintempleton.com or call (800) 342-5236.
46 | Annual Report
Performance Summary (continued)
Total Return Index Comparison for a Hypothetical $10,000 Investment
Total return represents the change in value of an investment over the periods shown. It includes any current, applicable, maximum sales charge, Fund expenses, account fees and reinvested distributions. The unmanaged index includes reinvestment of any income or distributions. It differs from the Fund in composition and does not pay management fees or expenses. One cannot invest directly in an index.
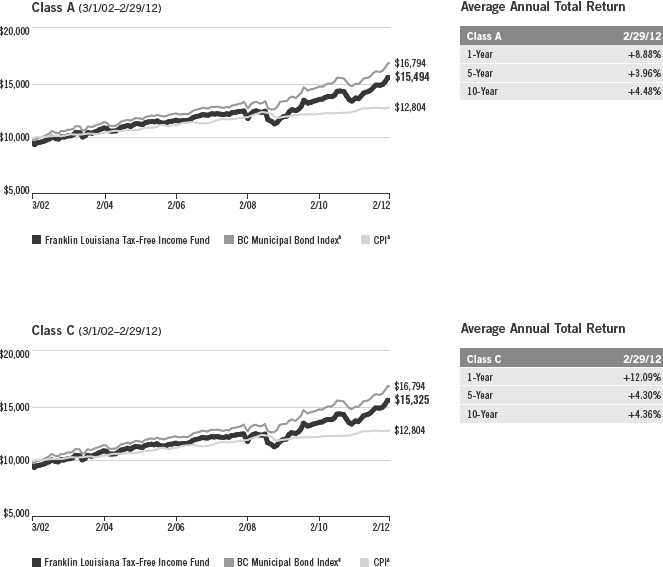
Annual Report | 47
Performance Summary (continued)
Endnotes
All investments involve risks, including possible loss of principal. Because municipal bonds are sensitive to interest rate movements, the Fund’s yield and share price will fluctuate with market conditions. Bond prices generally move in the opposite direction of interest rates. Thus, as prices of bonds in the Fund adjust to a rise in interest rates, the Fund’s share price may decline. Changes in the financial strength of a bond issuer or in a bond’s credit rating may affect its value. The Fund is actively managed but there is no guarantee that the manager’s investment decisions will produce the desired results. Since the Fund concentrates its investments in a single state, it is subject to greater risk of adverse economic and regulatory changes in that state than a geographically diversified fund. The Fund’s prospectus also includes a description of the main investment risks.
| |
Class C: | Prior to 1/1/04, these shares were offered with an initial sales charge; thus actual total returns would have differed. These shares have higher annual fees and expenses than Class A shares. |
1. Cumulative total return represents the change in value of an investment over the periods indicated.
2. Average annual total return represents the average annual change in value of an investment over the periods indicated.
3. In accordance with SEC rules, we provide standardized average annual total return information through the latest calendar quarter.
4. Distribution rate is based on an annualization of the respective class’s current monthly dividend and the maximum offering price (NAV for Class C) per share on 2/29/12.
5. Taxable equivalent distribution rate and yield assume the published rates as of 12/28/11 for the maximum combined effective federal and Louisiana personal income tax rate of 38.90%, based on the federal income tax rate of 35.00%.
6. The 30-day standardized yield for the month ended 2/29/12 reflects an estimated yield to maturity (assuming all portfolio securities are held to maturity). It should be regarded as an estimate of the Fund’s rate of investment income, and it may not equal the Fund’s actual income distribution rate (which reflects the Fund’s past dividends paid to shareholders) or the income reported in the Fund’s financial statements.
7. Figures are as stated in the Fund’s prospectus current as of the date of this report. In periods of market volatility, assets may decline significantly, causing total annual Fund operating expenses to become higher than the figures shown.
8. Source: © 2012 Morningstar. The BC Municipal Bond Index is a market value-weighted index engineered for the long-term tax-exempt bond market. To be included in the index, bonds must be fixed rate, have at least one year to final maturity and be rated investment grade (Baa3/BBB-or higher) by at least two of the following agencies: Moody’s, Standard & Poor’s and Fitch. The Consumer Price Index (CPI), calculated by the U.S. Bureau of Labor Statistics, is a commonly used measure of the inflation rate.
48 | Annual Report
Your Fund’s Expenses
Franklin Louisiana Tax-Free Income Fund
As a Fund shareholder, you can incur two types of costs:
- Transaction costs, including sales charges (loads) on Fund purchases; and
- Ongoing Fund costs, including management fees, distribution and service (12b-1) fees, and other Fund expenses. All mutual funds have ongoing costs, sometimes referred to as operating expenses.
The following table shows ongoing costs of investing in the Fund and can help you understand these costs and compare them with those of other mutual funds. The table assumes a $1,000 investment held for the six months indicated.
Actual Fund Expenses
The first line (Actual) for each share class listed in the table provides actual account values and expenses. The “Ending Account Value” is derived from the Fund’s actual return, which includes the effect of Fund expenses.
You can estimate the expenses you paid during the period by following these steps. Of course, your account value and expenses will differ from those in this illustration:
| 1. | Divide your account value by $1,000. |
| | If an account had an $8,600 value, then $8,600 ÷ $1,000 = 8.6. |
| 2. | Multiply the result by the number under the heading “Expenses Paid During Period.” |
| | If Expenses Paid During Period were $7.50, then 8.6 x $7.50 = $64.50. |
In this illustration, the estimated expenses paid this period are $64.50.
Hypothetical Example for Comparison with Other Funds
Information in the second line (Hypothetical) for each class in the table can help you compare ongoing costs of investing in the Fund with those of other mutual funds. This information may not be used to estimate the actual ending account balance or expenses you paid during the period. The hypothetical “Ending Account Value” is based on the actual expense ratio for each class and an assumed 5% annual rate of return before expenses, which does not represent the Fund’s actual return. The figure under the heading “Expenses Paid During Period” shows the hypothetical expenses your account would have incurred under this scenario. You can compare this figure with the 5% hypothetical examples that appear in shareholder reports of other funds.
Annual Report | 49
Your Fund’s Expenses (continued)
Please note that expenses shown in the table are meant to highlight ongoing costs and do not reflect any transaction costs, such as sales charges. Therefore, the second line for each class is useful in comparing ongoing costs only, and will not help you compare total costs of owning different funds. In addition, if transaction costs were included, your total costs would have been higher. Please refer to the Fund prospectus for additional information on operating expenses.
| | | | | | |
| | | Beginning Account | | Ending Account | | Expenses Paid During |
| Class A | | Value 9/1/11 | | Value 2/29/12 | | Period* 9/1/11–2/29/12 |
| Actual | $ | 1,000 | $ | 1,063.00 | $ | 3.49 |
| Hypothetical (5% return before expenses) | $ | 1,000 | $ | 1,021.48 | $ | 3.42 |
| Class C | | | | | | |
| Actual | $ | 1,000 | $ | 1,059.30 | $ | 6.30 |
| Hypothetical (5% return before expenses) | $ | 1,000 | $ | 1,018.75 | $ | 6.17 |
*Expenses are calculated using the most recent six-month expense ratio, annualized for each class (A: 0.68% and C: 1.23%), multiplied by the average account value over the period, multiplied by 182/366 to reflect the one-half year period.
50 | Annual Report
Franklin Maryland Tax-Free Income Fund
Your Fund’s Goal and Main Investments: Franklin Maryland Tax-Free Income Fund seeks to provide as high a level of income exempt from federal and Maryland personal income taxes as is consistent with prudent investment management and preservation of capital by investing at least 80% of its total assets in securities that pay interest free from such taxes.1
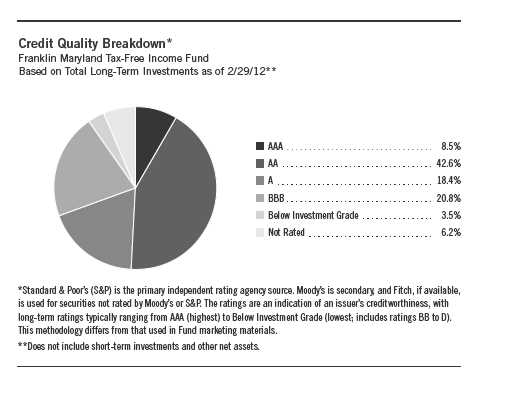
Performance data represent past performance, which does not guarantee future results. Investment return and principal value will fluctuate, and you may have a gain or loss when you sell your shares. Current performance may differ from figures shown. Please visit franklintempleton.com or call (800) 342-5236 for most recent month-end performance.
We are pleased to bring you Franklin Maryland Tax-Free Income Fund’s annual report for the fiscal year ended February 29, 2012.
Performance Overview
The Fund’s Class A share price, as measured by net asset value, increased from $10.91 on February 28, 2011, to $11.90 on February 29, 2012. The
1. For investors subject to alternative minimum tax, a small portion of Fund dividends may be taxable. Distributions of capital gains are generally taxable. To avoid imposition of 28% backup withholding on all Fund distributions and redemption proceeds, U.S. investors must be properly certified on Form W-9 and non-U.S. investors on Form W-8BEN.
The dollar value, number of shares or principal amount, and names of all portfolio holdings are listed in the Fund’s Statement of Investments (SOI). The SOI begins on page 126.
Annual Report | 51
| | | |
| Dividend Distributions* | | | |
| Franklin Maryland Tax-Free Income Fund | | | |
| | | Dividend per Share |
| Month | Class A | Class C | Advisor Class |
| March 2011 | 3.70 cents | 3.22 cents | 3.79 cents |
| April 2011 | 3.70 cents | 3.22 cents | 3.79 cents |
| May 2011 | 3.70 cents | 3.22 cents | 3.79 cents |
| June 2011 | 3.92 cents | 3.45 cents | 4.01 cents |
| July 2011 | 3.92 cents | 3.45 cents | 4.01 cents |
| August 2011 | 3.92 cents | 3.45 cents | 4.01 cents |
| September 2011 | 3.92 cents | 3.38 cents | 4.01 cents |
| October 2011 | 3.92 cents | 3.38 cents | 4.01 cents |
| November 2011 | 3.92 cents | 3.38 cents | 4.01 cents |
| December 2011** | 5.10 cents | 4.39 cents | 5.23 cents |
| January 2012 | 2.92 cents | 2.51 cents | 2.99 cents |
| February 2012 | 4.01 cents | 3.45 cents | 4.11 cents |
*Assumes shares were purchased and held for the entire accrual period, which differs from the calendar month. Since dividends accrue daily, your actual distributions will vary depending on the date you purchased your shares and any account activity. All Fund distributions will vary depending upon current market conditions, and past distributions are not indicative of future trends.
**The December per-share dividend distribution consisted of payments on 12/21/11 and 12/30/11 for each class as follows: Class A, 4.01 cents and 1.09 cents; Class C, 3.45 cents and 0.94 cents; and Advisor Class, 4.11 cents and 1.12 cents.
Fund’s Class A shares paid dividends totaling 46.91 cents per share for the same period.2 The Performance Summary beginning on page 55 shows that at the end of this reporting period the Fund’s Class A shares’ distribution rate was 3.80% based on an annualization of the current 3.94 cent per share dividend and the maximum offering price of $12.43 on February 29, 2012. An investor in the 2012 maximum combined effective federal and Maryland state and local personal income tax bracket of 40.66% would need to earn a distribution rate of 6.40% from a taxable investment to match the Fund’s Class A tax-free distribution rate. For the Fund’s Class C and Advisor shares’ performance, please see the Performance Summary.
State Update
In past years, Maryland’s proximity to Washington, DC, helped support the state economy. Recently, however, federal spending cuts hurt economic momentum, and Maryland had been recovering more slowly than the nation from
2. All Fund distributions will vary depending upon current market conditions, and past distributions are not indicative of future trends.
52 | Annual Report
the recession. Maryland’s economy gained traction in the latter part of the 12 months under review as the state’s unemployment rate declined, a survey indicated business activity was increasing, and personal income levels remained among the highest in the U.S.
Maryland’s unemployment rate dropped from 7.2% in February 2011 to 6.5% in February 2012, which was well below the 8.3% national average. Job sectors in the state with the largest one-year growth in February included mining, logging and construction; and education and health services.3 Maryland also continued to benefit from employment shifts associated with the 2005 federal military base realignment process. Improving employment levels were accompanied by robust salaries, as personal income in Maryland ranked fourth among states.4 A key business survey reported business activity increased in December, and a business expectations survey affirmed further economic growth was anticipated. During 2011, businesses in the state announced they were adding more than 10,000 new jobs and funding $3.3 billion in capital investment.5
Although the state’s retirement system was underfunded compared to those of many other states and a structural budget gap was cited, the legislature took action to address both challenges. State lawmakers enacted pension reforms in the 2012 budget intended to reduce the state’s pension liability and increase contributions and the funding level. Following recommendations by Maryland’s Spending Affordability Commission, the state initiated a multi-year program in 2012 to reduce the structural deficit.
The state’s debt burden was moderate, with net tax-supported debt of 3.5% of personal income and $1,681 per capita, compared with the 2.8% and $1,066 national medians.6 Independent credit rating agency Standard & Poor’s maintained its AAA rating for Maryland, noting the state’s economic strength and diverse economy, historically strong financial and debt management policies, and recent initiatives and debt affordability model.7
Manager’s Discussion
We used various investment strategies during the 12 months under review as we sought to maximize tax-free income for shareholders. Please read the discussion on page 6 for details.
3. Source: Bureau of Labor Statistics.
4. Sources: Bureau of Economic Analysis and Bureau of the Census.
5. Source: Maryland Department of Business and Economic Development, press release, 2/28/12. 6. Source: Moody’s Investors Service, “Special Comment: 2011 State Debt Medians Report,” 6/3/11. 7. This does not indicate Standard & Poor’s rating of the Fund.
Portfolio Breakdown
Franklin Maryland Tax-Free Income Fund 2/29/12
|
| % of Total |
| Long-Term Investments* |
| | |
| Hospital & Health Care | 20.1 | % |
| Utilities | 16.7 | % |
| General Obligation | 15.5 | % |
| Higher Education | 13.5 | % |
| Transportation | 9.5 | % |
| Refunded | 6.8 | % |
| Housing | 6.1 | % |
| Tax-Supported | 5.7 | % |
| Other Revenue | 5.1 | % |
| Subject to Government Appropriations | 1.0 | % |
*Does not include short-term investments and other net assets.
Annual Report | 53
Thank you for your continued participation in Franklin Maryland Tax-Free Income Fund. We believe our conservative, buy-and-hold investment strategy can help us achieve high, current, tax-free income for shareholders.
The foregoing information reflects our analysis, opinions and portfolio holdings as of February 29, 2012, the end of the reporting period. The way we implement our main investment strategies and the resulting portfolio holdings may change depending on factors such as market and economic conditions. These opinions may not be relied upon as investment advice or an offer for a particular security. The information is not a complete analysis of every aspect of any market, state, industry, security or the Fund. Statements of fact are from sources considered reliable, but the investment manager makes no representation or warranty as to their completeness or accuracy. Although historical performance is no guarantee of future results, these insights may help you understand our investment management philosophy.
54 | Annual Report
Performance Summary as of 2/29/12
Franklin Maryland Tax-Free Income Fund
Your dividend income will vary depending on dividends or interest paid by securities in the Fund’s portfolio, adjusted for operating expenses of each class. Capital gain distributions are net profits realized from the sale of portfolio securities. The performance table and graphs do not reflect any taxes that a shareholder would pay on Fund dividends, capital gain distributions, if any, or any realized gains on the sale of Fund shares. Total return reflects reinvestment of the Fund’s dividends and capital gain distributions, if any, and any unrealized gains or losses.
| | | | | | | | |
| Price and Distribution Information | | | | | | |
| Class A (Symbol: FMDTX) | | | | Change | | 2/29/12 | | 2/28/11 |
| Net Asset Value (NAV) | | | +$ | 0.99 | $ | 11.90 | $ | 10.91 |
| Distributions (3/1/11–2/29/12) | | | | | | | | |
| Dividend Income | $ | 0.4691 | | | | | | |
| Class C (Symbol: FMDIX) | | | | Change | | 2/29/12 | | 2/28/11 |
| Net Asset Value (NAV) | | | +$ | 1.01 | $ | 12.09 | $ | 11.08 |
| Distributions (3/1/11–2/29/12) | | | | | | | | |
| Dividend Income | $ | 0.4071 | | | | | | |
| Advisor Class (Symbol: FMDZX) | | | | Change | | 2/29/12 | | 2/28/11 |
| Net Asset Value (NAV) | | | +$ | 0.99 | $ | 11.90 | $ | 10.91 |
| Distributions (3/1/11–2/29/12) | | | | | | | | |
| Dividend Income | $ | 0.4803 | | | | | | |
Annual Report | 55
Performance Summary (continued)
Performance
Cumulative total return excludes sales charges. Average annual total returns include maximum sales charges. Class A: 4.25% maximum initial sales charge; Class C: 1% contingent deferred sales charge in first year only; Advisor Class: no sales charges.
| | | | | | | | | | | |
| Class A | | | | 1-Year | | | 5-Year | | | 10-Year | |
| Cumulative Total Return1 | | | + | 13.65 | % | + | 24.53 | % | + | 59.57 | % |
| Average Annual Total Return2 | | | + | 8.86 | % | + | 3.57 | % | + | 4.33 | % |
| Avg. Ann. Total Return (3/31/12)3 | | | + | 9.54 | % | + | 3.60 | % | + | 4.47 | % |
| Distribution Rate4 | 3.80 | % | | | | | | | | | |
| Taxable Equivalent Distribution Rate5 | 6.40 | % | | | | | | | | | |
| 30-Day Standardized Yield6 | 2.88 | % | | | | | | | | | |
| Taxable Equivalent Yield5 | 4.85 | % | | | | | | | | | |
| Total Annual Operating Expenses7 | 0.65 | % | | | | | | | | | |
| Class C | | | | 1-Year | | | 5-Year | | | 10-Year | |
| Cumulative Total Return1 | | | + | 13.02 | % | + | 21.18 | % | + | 51.15 | % |
| Average Annual Total Return2 | | | + | 12.02 | % | + | 3.92 | % | + | 4.22 | % |
| Avg. Ann. Total Return (3/31/12)3 | | | + | 12.78 | % | + | 3.93 | % | + | 4.35 | % |
| Distribution Rate4 | 3.33 | % | | | | | | | | | |
| Taxable Equivalent Distribution Rate5 | 5.61 | % | | | | | | | | | |
| 30-Day Standardized Yield6 | 2.47 | % | | | | | | | | | |
| Taxable Equivalent Yield5 | 4.16 | % | | | | | | | | | |
| Total Annual Operating Expenses7 | 1.20 | % | | | | | | | | | |
| Advisor Class8 | | | | 1-Year | | | 5-Year | | | 10-Year | |
| Cumulative Total Return1 | | | + | 13.76 | % | + | 24.83 | % | + | 59.95 | % |
| Average Annual Total Return2 | | | + | 13.76 | % | + | 4.54 | % | + | 4.81 | % |
| Avg. Ann. Total Return (3/31/12)3 | | | + | 14.54 | % | + | 4.55 | % | + | 4.95 | % |
| Distribution Rate4 | 4.07 | % | | | | | | | | | |
| Taxable Equivalent Distribution Rate5 | 6.86 | % | | | | | | | | | |
| 30-Day Standardized Yield6 | 3.18 | % | | | | | | | | | |
| Taxable Equivalent Yield5 | 5.36 | % | | | | | | | | | |
| Total Annual Operating Expenses7 | 0.55 | % | | | | | | | | | |
Performance data represent past performance, which does not guarantee future results. Investment return and principal value will fluctuate, and you may have a gain or loss when you sell your shares. Current performance may differ from figures shown. For most recent month-end performance, go to franklintempleton.com or call (800) 342-5236.
56 | Annual Report
Performance Summary (continued)
Total Return Index Comparison for a Hypothetical $10,000 Investment
Total return represents the change in value of an investment over the periods shown. It includes any current, applicable, maximum sales charge, Fund expenses, account fees and reinvested distributions. The unmanaged index includes reinvestment of any income or distributions. It differs from the Fund in composition and does not pay management fees or expenses. One cannot invest directly in an index.
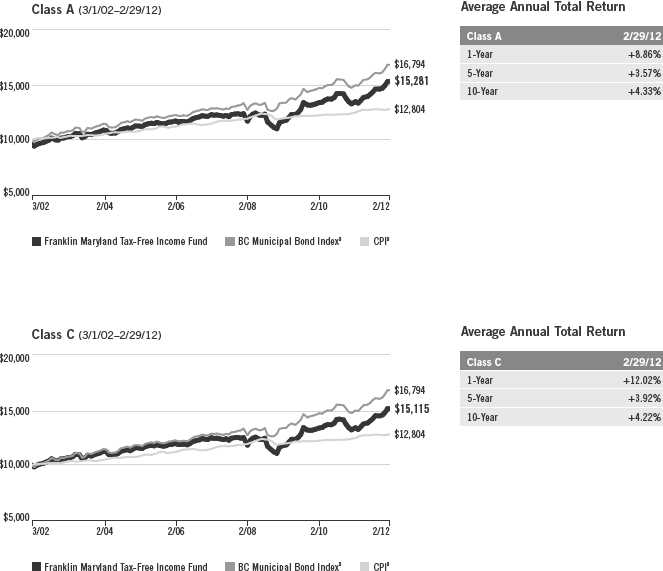
Annual Report | 57
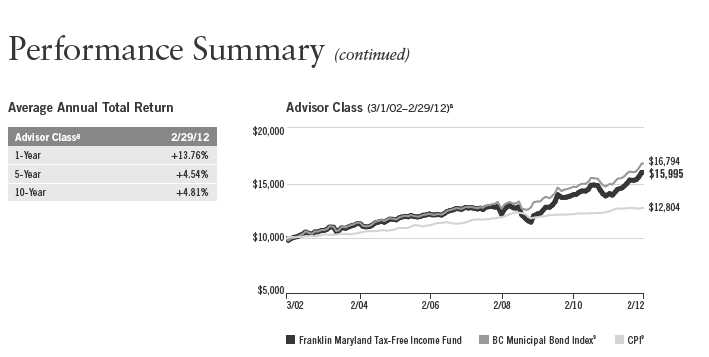
| |
| Endnotes | |
| |
| All investments involve risks, including possible loss of principal. Because municipal bonds are sensitive to |
| interest rate movements, the Fund’s yield and share price will fluctuate with market conditions. Bond prices |
| generally move in the opposite direction of interest rates. Thus, as prices of bonds in the Fund adjust to a rise |
| in interest rates, the Fund’s share price may decline. Changes in the financial strength of a bond issuer or in a |
| bond’s credit rating may affect its value. The Fund is actively managed but there is no guarantee that the man- |
| ager’s investment decisions will produce the desired results. Since the Fund concentrates its investments in a |
| single state, it is subject to greater risk of adverse economic and regulatory changes in that state than a geo- |
| graphically diversified fund. The Fund’s prospectus also includes a description of the main investment risks. |
| |
| |
| Class C: | Prior to 1/1/04, these shares were offered with an initial sales charge; thus actual total returns |
| | would have differed. These shares have higher annual fees and expenses than Class A shares. |
| |
| Advisor Class: | Shares are available to certain eligible investors as described in the prospectus. |
| |
| 1. Cumulative total return represents the change in value of an investment over the periods indicated. |
| 2. Average annual total return represents the average annual change in value of an investment over the periods |
| indicated. | |
| 3. In accordance with SEC rules, we provide standardized average annual total return information through the latest |
| calendar quarter. |
| 4. Distribution rate is based on an annualization of the respective class’s current monthly dividend and the maximum |
| offering price (NAV for Classes C and Advisor) per share on 2/29/12. |
| 5. Taxable equivalent distribution rate and yield assume the published rates as of 12/28/11 for the maximum com- |
| bined effective federal and Maryland state and local personal income tax rate of 40.66%, based on the federal |
| income tax rate of 35.00%. |
| 6. The 30-day standardized yield for the month ended 2/29/12 reflects an estimated yield to maturity (assuming all |
| portfolio securities are held to maturity). It should be regarded as an estimate of the Fund’s rate of investment |
| income, and it may not equal the Fund’s actual income distribution rate (which reflects the Fund’s past dividends |
| paid to shareholders) or the income reported in the Fund’s financial statements. |
| 7. Figures are as stated in the Fund’s prospectus current as of the date of this report. In periods of market volatility, |
| assets may decline significantly, causing total annual Fund operating expenses to become higher than the figures |
| shown. | |
| 8. Effective 7/1/09, the Fund began offering Advisor Class shares, which do not have sales charges or a Rule 12b-1 |
| plan. Performance quotations for this class reflect the following methods of calculation: (a) For periods prior to |
| 7/1/09, a restated figure is used based upon the Fund’s Class A performance, excluding the effect of Class A’s maxi- |
| mum initial sales charge, but reflecting the effect of the Class A Rule 12b-1 fees; and (b) for periods after 7/1/09, |
| actual Advisor Class performance is used reflecting all charges and fees applicable to that class. Since 7/1/09 |
| (commencement of sales), the cumulative and average annual total returns of Advisor Class shares were +24.68% |
| and +8.64%. | |
| 9. Source: © 2012 Morningstar. The BC Municipal Bond Index is a market value-weighted index engineered for the |
| long-term tax-exempt bond market. To be included in the index, bonds must be fixed rate, have at least one year to |
| final maturity and be rated investment grade (Baa3/BBB- or higher) by at least two of the following agencies: Moody���s, |
| Standard & Poor’s and Fitch. The Consumer Price Index (CPI), calculated by the U.S. Bureau of Labor Statistics, is a |
| commonly used measure of the inflation rate. |
58 | Annual Report
Your Fund’s Expenses
Franklin Maryland Tax-Free Income Fund
As a Fund shareholder, you can incur two types of costs:
- Transaction costs, including sales charges (loads) on Fund purchases; and
- Ongoing Fund costs, including management fees, distribution and service (12b-1) fees, and other Fund expenses. All mutual funds have ongoing costs, sometimes referred to as operating expenses.
The following table shows ongoing costs of investing in the Fund and can help you understand these costs and compare them with those of other mutual funds. The table assumes a $1,000 investment held for the six months indicated.
Actual Fund Expenses
The first line (Actual) for each share class listed in the table provides actual account values and expenses. The “Ending Account Value” is derived from the Fund’s actual return, which includes the effect of Fund expenses.
You can estimate the expenses you paid during the period by following these steps. Of course, your account value and expenses will differ from those in this illustration:
| 1. | Divide your account value by $1,000. |
| | If an account had an $8,600 value, then $8,600 ÷ $1,000 = 8.6. |
| 2. | Multiply the result by the number under the heading “Expenses Paid During Period.” |
| | If Expenses Paid During Period were $7.50, then 8.6 x $7.50 = $64.50. |
In this illustration, the estimated expenses paid this period are $64.50.
Hypothetical Example for Comparison with Other Funds
Information in the second line (Hypothetical) for each class in the table can help you compare ongoing costs of investing in the Fund with those of other mutual funds. This information may not be used to estimate the actual ending account balance or expenses you paid during the period. The hypothetical “Ending Account Value” is based on the actual expense ratio for each class and an assumed 5% annual rate of return before expenses, which does not represent the Fund’s actual return. The figure under the heading “Expenses Paid During Period” shows the hypothetical expenses your account would have incurred under this scenario. You can compare this figure with the 5% hypothetical examples that appear in shareholder reports of other funds.
Annual Report | 59
Your Fund’s Expenses (continued)
Please note that expenses shown in the table are meant to highlight ongoing costs and do not reflect any transaction costs, such as sales charges. Therefore, the second line for each class is useful in comparing ongoing costs only, and will not help you compare total costs of owning different funds. In addition, if transaction costs were included, your total costs would have been higher. Please refer to the Fund prospectus for additional information on operating expenses.
| | | | | | |
| | | Beginning Account | | Ending Account | | Expenses Paid During |
| Class A | | Value 9/1/11 | | Value 2/29/12 | | Period* 9/1/11–2/29/12 |
| Actual | $ | 1,000 | $ | 1,067.10 | $ | 3.34 |
| Hypothetical (5% return before expenses) | $ | 1,000 | $ | 1,021.63 | $ | 3.27 |
| Class C | | | | | | |
| Actual | $ | 1,000 | $ | 1,064.90 | $ | 6.16 |
| Hypothetical (5% return before expenses) | $ | 1,000 | $ | 1,018.90 | $ | 6.02 |
| Advisor Class | | | | | | |
| Actual | $ | 1,000 | $ | 1,067.60 | $ | 2.83 |
| Hypothetical (5% return before expenses) | $ | 1,000 | $ | 1,022.13 | $ | 2.77 |
*Expenses are calculated using the most recent six-month expense ratio, annualized for each class (A: 0.65%; C: 1.20%; and Advisor: 0.55%), multiplied by the average account value over the period, multiplied by 182/366 to reflect the one-half year period.
60 | Annual Report
Franklin Missouri Tax-Free Income Fund
Your Fund’s Goal and Main Investments: Franklin Missouri Tax-Free Income Fund seeks to provide as high a level of income exempt from federal and Missouri personal income taxes as is consistent with prudent investment management and preservation of capital by investing at least 80% of its total assets in securities that pay interest free from such taxes.1
Performance data represent past performance, which does not guarantee future results. Investment return and principal value will fluctuate, and you may have a gain or loss when you sell your shares. Current performance may differ from figures shown. Please visit franklintempleton.com or call (800) 342-5236 for most recent month-end performance.
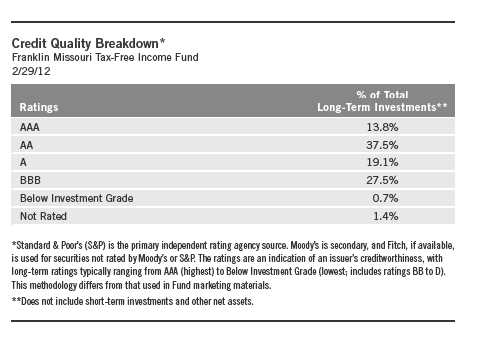
We are pleased to bring you Franklin Missouri Tax-Free Income Fund’s annual report for the fiscal year ended February 29, 2012.
Performance Overview
The Fund’s Class A share price, as measured by net asset value, increased from $11.55 on February 28, 2011, to $12.61 on February 29, 2012. The Fund’s Class A shares paid dividends totaling 50.73 cents per share for the same period.2 The Performance Summary beginning on page 65 shows that
1. For investors subject to alternative minimum tax, a small portion of Fund dividends may be taxable. Distributions of capital gains are generally taxable. To avoid imposition of 28% backup withholding on all Fund distributions and redemption proceeds, U.S. investors must be properly certified on Form W-9 and non-U.S. investors on Form W-8BEN.
2. All Fund distributions will vary depending upon current market conditions, and past distributions are not indicative of future trends.
The dollar value, number of shares or principal amount, and names of all portfolio holdings are listed in the Fund’s Statement of Investments (SOI). The SOI begins on page 133.
Annual Report | 61
| | | |
| Dividend Distributions* | | | |
| Franklin Missouri Tax-Free Income Fund | | | |
| | | Dividend per Share |
| Month | Class A | Class C | Advisor Class |
| March 2011 | 4.27 cents | 3.77 cents | 4.36 cents |
| April 2011 | 4.27 cents | 3.77 cents | 4.36 cents |
| May 2011 | 4.27 cents | 3.77 cents | 4.36 cents |
| June 2011 | 4.27 cents | 3.76 cents | 4.36 cents |
| July 2011 | 4.27 cents | 3.76 cents | 4.36 cents |
| August 2011 | 4.27 cents | 3.76 cents | 4.36 cents |
| September 2011 | 4.23 cents | 3.65 cents | 4.33 cents |
| October 2011 | 4.23 cents | 3.65 cents | 4.33 cents |
| November 2011 | 4.23 cents | 3.65 cents | 4.33 cents |
| December 2011** | 5.26 cents | 4.53 cents | 5.40 cents |
| January 2012 | 3.02 cents | 2.59 cents | 3.10 cents |
| February 2012 | 4.14 cents | 3.56 cents | 4.25 cents |
*Assumes shares were purchased and held for the entire accrual period, which differs from the calendar month. Since dividends accrue daily, your actual distributions will vary depending on the date you purchased your shares and any account activity. All Fund distributions will vary depending upon current market conditions, and past distributions are not indicative of future trends.
**The December per-share dividend distribution consisted of payments on 12/21/11 and 12/30/11 for each class as follows: Class A, 4.14 cents and 1.12 cents; Class C, 3.56 cents and 0.97 cents; and Advisor Class, 4.25 cents and 1.15 cents.
at the end of this reporting period the Fund’s Class A shares’ distribution rate was 3.64% based on an annualization of the current 3.99 cent per share dividend and the maximum offering price of $13.17 on February 29, 2012. An investor in the 2012 maximum combined effective federal and Missouri personal income tax bracket of 38.90% would need to earn a distribution rate of 5.96% from a taxable investment to match the Fund’s Class A tax-free distribution rate. For the Fund’s Class C and Advisor shares’ performance, please see the Performance Summary. The reduction in dividend distributions from the start to the end of the period under review reflected generally declining interest rates. Additionally, investor demand was strong for municipal bonds in an environment of limited tax-exempt supply. These factors resulted in reduced income for the portfolio and caused dividends to decline overall.
62 | Annual Report
State Update
During the 12 months under review, rising manufacturing activity and consumer spending in Missouri accompanied stronger expectations for production, hiring and capital spending. A report by the Federal Reserve Bank of St. Louis district noted the state’s economy “continued to expand at a modest pace.” Net general revenues for the first three months of fiscal year 2012 were above revenue levels for the same period in 2011, according to the Missouri Office of Administration. Similarly, as manufacturing activity picked up, state exports rose year-over-year in the third quarter of 2011, led by transportation equipment.
The state’s unemployment rate fell to 7.4% in February 2012, the lowest level in more than three years.3 Ford announced major capital investment to expand an assembly plant in Kansas City, potentially adding jobs. The improving employment picture included the farm sector, where income increased year-over-year in the third quarter of 2011.
The state’s actual tax revenues for fiscal year 2011 increased over fiscal year 2010 levels, as did personal income tax collections. However, revenue collections for fiscal year 2012 were below projected totals as of January, with corporate income and franchise tax collections down in January for 2012 and for the fiscal year. Real estate also represented a mix of positive and negative indicative measures, with Missouri’s lower supply of homes for sale and foreclosure rate below the national average contrasted by elevated levels of industrial and office space available in St. Louis and Kansas City.
The state’s debt burden was moderate, with net tax-supported debt of 2.2% of personal income and $775 per capita, compared with the 2.8% and $1,066 national medians.4 Independent rating agency Standard & Poor’s maintained a rating of AAA for the state, noting the state’s skilled financial management, diverse economic base, moderate debt burden and strong financial reserves.5
3. Source: Bureau of Labor Statistics.
4. Source: Moody’s Investors Service, “Special Comment: 2011 State Debt Medians Report,” 6/3/11.
5. This does not indicate Standard & Poor’s rating of the Fund.
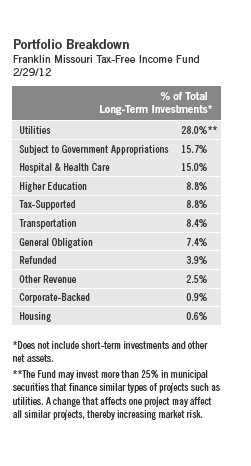
Annual Report | 63
Manager’s Discussion
We used various investment strategies during the 12 months under review as we sought to maximize tax-free income for shareholders. Please read the discussion on page 6 for details.
Thank you for your continued participation in Franklin Missouri Tax-Free Income Fund. We believe our conservative, buy-and-hold investment strategy can help us achieve high, current, tax-free income for shareholders.
The foregoing information reflects our analysis, opinions and portfolio holdings as of February 29, 2012, the end of the reporting period. The way we implement our main investment strategies and the resulting portfolio holdings may change depending on factors such as market and economic conditions. These opinions may not be relied upon as investment advice or an offer for a particular security. The information is not a complete analysis of every aspect of any market, state, industry, security or the Fund. Statements of fact are from sources considered reliable, but the investment manager makes no representation or warranty as to their completeness or accuracy. Although historical performance is no guarantee of future results, these insights may help you understand our investment management philosophy.
64 | Annual Report
Performance Summary as of 2/29/12
Franklin Missouri Tax-Free Income Fund
Your dividend income will vary depending on dividends or interest paid by securities in the Fund’s portfolio, adjusted for operating expenses of each class. Capital gain distributions are net profits realized from the sale of portfolio securities. The performance table and graphs do not reflect any taxes that a shareholder would pay on Fund dividends, capital gain distributions, if any, or any realized gains on the sale of Fund shares. Total return reflects reinvestment of the Fund’s dividends and capital gain distributions, if any, and any unrealized gains or losses.
| | | | | | | | |
| Price and Distribution Information | | | | | | |
| Class A (Symbol: FRMOX) | | | | Change | | 2/29/12 | | 2/28/11 |
| Net Asset Value (NAV) | | | +$ | 1.06 | $ | 12.61 | $ | 11.55 |
| Distributions (3/1/11–2/29/12) | | | | | | | | |
| Dividend Income | $ | 0.5088 | | | | | | |
| Class C (Symbol: FMOIX) | | | | Change | | 2/29/12 | | 2/28/11 |
| Net Asset Value (NAV) | | | +$ | 1.07 | $ | 12.71 | $ | 11.64 |
| Distributions (3/1/11–2/29/12) | | | | | | | | |
| Dividend Income | $ | 0.4431 | | | | | | |
| Advisor Class (Symbol: FRMZX) | | | | Change | | 2/29/12 | | 2/28/11 |
| Net Asset Value (NAV) | | | +$ | 1.07 | $ | 12.62 | $ | 11.55 |
| Distributions (3/1/11–2/29/12) | | | | | | | | |
| Dividend Income | $ | 0.5206 | | | | | | |
Annual Report | 65
Performance Summary (continued)
Performance
Cumulative total return excludes sales charges. Average annual total returns include maximum sales charges. Class A: 4.25% maximum initial sales charge; Class C: 1% contingent deferred sales charge in first year only; Advisor Class: no sales charges.
| | | | | | | | | | | |
| Class A | | | | 1-Year | | | 5-Year | | | 10-Year | |
| Cumulative Total Return1 | | | + | 13.87 | % | + | 26.37 | % | + | 62.69 | % |
| Average Annual Total Return2 | | | + | 9.05 | % | + | 3.88 | % | + | 4.53 | % |
| Avg. Ann. Total Return (3/31/12)3 | | | + | 8.83 | % | + | 3.85 | % | + | 4.68 | % |
| Distribution Rate4 | 3.64 | % | | | | | | | | | |
| Taxable Equivalent Distribution Rate5 | 5.96 | % | | | | | | | | | |
| 30-Day Standardized Yield6 | 2.73 | % | | | | | | | | | |
| Taxable Equivalent Yield5 | 4.47 | % | | | | | | | | | |
| Total Annual Operating Expenses7 | 0.64 | % | | | | | | | | | |
| Class C | | | | 1-Year | | | 5-Year | | | 10-Year | |
| Cumulative Total Return1 | | | + | 13.24 | % | + | 22.93 | % | + | 54.02 | % |
| Average Annual Total Return2 | | | + | 12.24 | % | + | 4.22 | % | + | 4.41 | % |
| Avg. Ann. Total Return (3/31/12)3 | | | + | 12.04 | % | + | 4.18 | % | + | 4.56 | % |
| Distribution Rate4 | 3.19 | % | | | | | | | | | |
| Taxable Equivalent Distribution Rate5 | 5.22 | % | | | | | | | | | |
| 30-Day Standardized Yield6 | 2.31 | % | | | | | | | | | |
| Taxable Equivalent Yield5 | 3.78 | % | | | | | | | | | |
| Total Annual Operating Expenses7 | 1.19 | % | | | | | | | | | |
| Advisor Class8 | | | | 1-Year | | | 5-Year | | | 10-Year | |
| Cumulative Total Return1 | | | + | 14.07 | % | + | 26.77 | % | + | 63.21 | % |
| Average Annual Total Return2 | | | + | 14.07 | % | + | 4.86 | % | + | 5.02 | % |
| Avg. Ann. Total Return (3/31/12)3 | | | + | 13.77 | % | + | 4.82 | % | + | 5.17 | % |
| Distribution Rate4 | 3.89 | % | | | | | | | | | |
| Taxable Equivalent Distribution Rate5 | 6.37 | % | | | | | | | | | |
| 30-Day Standardized Yield6 | 2.95 | % | | | | | | | | | |
| Taxable Equivalent Yield5 | 4.83 | % | | | | | | | | | |
| Total Annual Operating Expenses7 | 0.54 | % | | | | | | | | | |
Performance data represent past performance, which does not guarantee future results. Investment return and principal value will fluctuate, and you may have a gain or loss when you sell your shares. Current performance may differ from figures shown. For most recent month-end performance, go to franklintempleton.com or call (800) 342-5236.
66 | Annual Report
Performance Summary (continued)
Total Return Index Comparison for a Hypothetical $10,000 Investment
Total return represents the change in value of an investment over the periods shown. It includes any current, applicable, maximum sales charge, Fund expenses, account fees and reinvested distributions. The unmanaged index includes reinvestment of any income or distributions. It differs from the Fund in composition and does not pay management fees or expenses. One cannot invest directly in an index.

Annual Report | 67
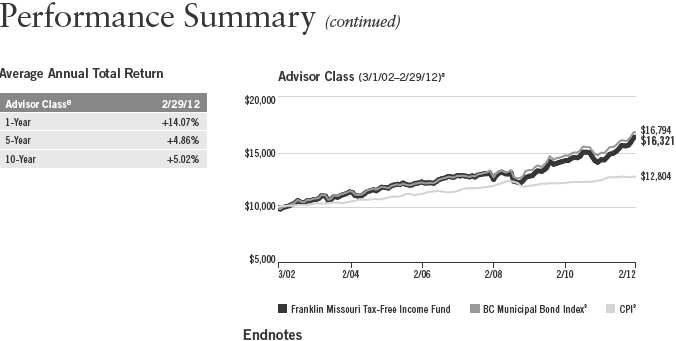
All investments involve risks, including possible loss of principal. Because municipal bonds are sensitive to interest rate movements, the Fund’s yield and share price will fluctuate with market conditions. Bond prices generally move in the opposite direction of interest rates. Thus, as prices of bonds in the Fund adjust to a rise in interest rates, the Fund’s share price may decline. Changes in the financial strength of a bond issuer or in a bond’s credit rating may affect its value. The Fund is actively managed but there is no guarantee that the manager’s investment decisions will produce the desired results. Since the Fund concentrates its investments in a single state, it is subject to greater risk of adverse economic and regulatory changes in that state than a geographically diversified fund. The Fund’s prospectus also includes a description of the main investment risks.
Class C: Prior to 1/1/04, these shares were offered with an initial sales charge; thus actual total returns
would have differed. These shares have higher annual fees and expenses than Class A shares.
Advisor Class: Shares are available to certain eligible investors as described in the prospectus.
1. Cumulative total return represents the change in value of an investment over the periods indicated.
2. Average annual total return represents the average annual change in value of an investment over the periods indicated.
3. In accordance with SEC rules, we provide standardized average annual total return information through the latest calendar quarter.
4. Distribution rate is based on an annualization of the respective class’s current monthly dividend and the maximum offering price (NAV for Classes C and Advisor) per share on 2/29/12.
5. Taxable equivalent distribution rate and yield assume the published rates as of 12/28/11 for the maximum combined effective federal and Missouri personal income tax rate of 38.90%, based on the federal income tax rate of 35.00%.
6. The 30-day standardized yield for the month ended 2/29/12 reflects an estimated yield to maturity (assuming all portfolio securities are held to maturity). It should be regarded as an estimate of the Fund’s rate of investment income, and it may not equal the Fund’s actual income distribution rate (which reflects the Fund’s past dividends paid to shareholders) or the income reported in the Fund’s financial statements.
7. Figures are as stated in the Fund’s prospectus current as of the date of this report. In periods of market volatility, assets may decline significantly, causing total annual Fund operating expenses to become higher than the figures shown.
8. Effective 7/1/09, the Fund began offering Advisor Class shares, which do not have sales charges or a Rule 12b-1 plan. Performance quotations for this class reflect the following methods of calculation: (a) For periods prior to 7/1/09, a restated figure is used based upon the Fund’s Class A performance, excluding the effect of Class A’s maximum initial sales charge, but reflecting the effect of the Class A Rule 12b-1 fees; and (b) for periods after 7/1/09, actual Advisor Class performance is used reflecting all charges and fees applicable to that class. Since 7/1/09 (commencement of sales), the cumulative and average annual total returns of Advisor Class shares were +23.31% and +8.19%.
9. Source: © 2012 Morningstar. The BC Municipal Bond Index is a market value-weighted index engineered for the long-term tax-exempt bond market. To be included in the index, bonds must be fixed rate, have at least one year to final maturity and be rated investment grade (Baa3/BBB- or higher) by at least two of the following agencies: Moody’s, Standard & Poor’s and Fitch. The Consumer Price Index (CPI), calculated by the U.S. Bureau of Labor Statistics, is a commonly used measure of the inflation rate.
68 | Annual Report
Your Fund’s Expenses
Franklin Missouri Tax-Free Income Fund
As a Fund shareholder, you can incur two types of costs:
- Transaction costs, including sales charges (loads) on Fund purchases; and
- Ongoing Fund costs, including management fees, distribution and service (12b-1) fees, and other Fund expenses. All mutual funds have ongoing costs, sometimes referred to as operating expenses.
The following table shows ongoing costs of investing in the Fund and can help you understand these costs and compare them with those of other mutual funds. The table assumes a $1,000 investment held for the six months indicated.
Actual Fund Expenses
The first line (Actual) for each share class listed in the table provides actual account values and expenses. The “Ending Account Value” is derived from the Fund’s actual return, which includes the effect of Fund expenses.
You can estimate the expenses you paid during the period by following these steps. Of course, your account value and expenses will differ from those in this illustration:
| 1. | Divide your account value by $1,000. |
| | If an account had an $8,600 value, then $8,600 ÷ $1,000 = 8.6. |
| 2. | Multiply the result by the number under the heading “Expenses Paid During Period.” |
| | If Expenses Paid During Period were $7.50, then 8.6 x $7.50 = $64.50. |
In this illustration, the estimated expenses paid this period are $64.50.
Hypothetical Example for Comparison with Other Funds
Information in the second line (Hypothetical) for each class in the table can help you compare ongoing costs of investing in the Fund with those of other mutual funds. This information may not be used to estimate the actual ending account balance or expenses you paid during the period. The hypothetical “Ending Account Value” is based on the actual expense ratio for each class and an assumed 5% annual rate of return before expenses, which does not represent the Fund’s actual return. The figure under the heading “Expenses Paid During Period” shows the hypothetical expenses your account would have incurred under this scenario. You can compare this figure with the 5% hypothetical examples that appear in shareholder reports of other funds.
Annual Report | 69
Your Fund’s Expenses (continued)
Please note that expenses shown in the table are meant to highlight ongoing costs and do not reflect any transaction costs, such as sales charges. Therefore, the second line for each class is useful in comparing ongoing costs only, and will not help you compare total costs of owning different funds. In addition, if transaction costs were included, your total costs would have been higher. Please refer to the Fund prospectus for additional information on operating expenses.
| | | | | | |
| | | Beginning Account | | Ending Account | | Expenses Paid During |
| Class A | | Value 9/1/11 | | Value 2/29/12 | | Period* 9/1/11–2/29/12 |
| Actual | $ | 1,000 | $ | 1,066.90 | $ | 3.29 |
| Hypothetical (5% return before expenses) | $ | 1,000 | $ | 1,021.68 | $ | 3.22 |
| Class C | | | | | | |
| Actual | $ | 1,000 | $ | 1,063.40 | $ | 6.11 |
| Hypothetical (5% return before expenses) | $ | 1,000 | $ | 1,018.95 | $ | 5.97 |
| Advisor Class | | | | | | |
| Actual | $ | 1,000 | $ | 1,067.40 | $ | 2.78 |
| Hypothetical (5% return before expenses) | $ | 1,000 | $ | 1,022.18 | $ | 2.72 |
*Expenses are calculated using the most recent six-month expense ratio, annualized for each class (A: 0.64%; C: 1.19%; and Advisor: 0.54%), multiplied by the average account value over the period, multiplied by 182/366 to reflect the one-half year period.
70 | Annual Report
Franklin North Carolina Tax-Free Income Fund
Your Fund’s Goal and Main Investments: Franklin North Carolina Tax-Free Income Fund seeks to provide as high a level of income exempt from federal and North Carolina personal income taxes as is consistent with prudent investment management and preservation of capital by investing at least 80% of its total assets in securities that pay interest free from such taxes.1
Performance data represent past performance, which does not guarantee future results. Investment return and principal value will fluctuate, and you may have a gain or loss when you sell your shares. Current performance may differ from figures shown. Please visit franklintempleton.com or call (800) 342-5236 for most recent month-end performance.
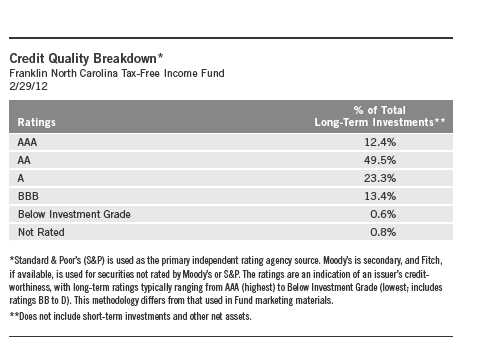
We are pleased to bring you Franklin North Carolina Tax-Free Income Fund’s annual report for the fiscal year ended February 29, 2012.
Performance Overview
The Fund’s Class A share price, as measured by net asset value, increased from $11.73 on February 28, 2011, to $12.79 on February 29, 2012. The Fund’s Class A shares paid dividends totaling 49.91 cents per share for the same period.2 The Performance Summary beginning on page 75 shows that
1. For investors subject to alternative minimum tax, a small portion of Fund dividends may be taxable. Distributions of capital gains are generally taxable. To avoid imposition of 28% backup withholding on all Fund distributions and redemption proceeds, U.S. investors must be properly certified on Form W-9 and non-U.S. investors on Form W-8BEN.
2. All Fund distributions will vary depending upon current market conditions, and past distributions are not indicative of future trends.
The dollar value, number of shares or principal amount, and names of all portfolio holdings are listed in the Fund’s Statement of Investments (SOI). The SOI begins on page 142.
Annual Report | 71
| | | |
| Dividend Distributions* | | | |
| Franklin North Carolina Tax-Free Income Fund | | | |
| | | Dividend per Share |
| Month | Class A | Class C | Advisor Class |
| March 2011 | 4.11 cents | 3.60 cents | 4.20 cents |
| April 2011 | 4.11 cents | 3.60 cents | 4.20 cents |
| May 2011 | 4.11 cents | 3.60 cents | 4.20 cents |
| June 2011 | 4.18 cents | 3.67 cents | 4.27 cents |
| July 2011 | 4.18 cents | 3.67 cents | 4.27 cents |
| August 2011 | 4.18 cents | 3.67 cents | 4.27 cents |
| September 2011 | 4.18 cents | 3.59 cents | 4.29 cents |
| October 2011 | 4.18 cents | 3.59 cents | 4.29 cents |
| November 2011 | 4.18 cents | 3.59 cents | 4.29 cents |
| December 2011** | 5.21 cents | 4.46 cents | 5.34 cents |
| January 2012 | 2.99 cents | 2.56 cents | 3.06 cents |
| February 2012 | 4.10 cents | 3.51 cents | 4.20 cents |
*Assumes shares were purchased and held for the entire accrual period, which differs from the calendar month. Since dividends accrue daily, your actual distributions will vary depending on the date you purchased your shares and any account activity. All Fund distributions will vary depending upon current market conditions, and past distributions are not indicative of future trends.
**The December per-share dividend distribution consisted of payments on 12/21/11 and 12/30/11 for each class as follows: Class A, 4.10 cents and 1.11 cents; Class C, 3.51 cents and 0.95 cents; and Advisor Class, 4.20 cents and 1.14 cents.
at the end of this reporting period the Fund’s Class A shares’ distribution rate was 3.64% based on an annualization of the current 4.05 cent per share dividend and the maximum offering price of $13.36 on February 29, 2012. An investor in the 2012 maximum combined effective federal and North Carolina personal income tax bracket of 40.04% would need to earn a distribution rate of 6.07% from a taxable investment to match the Fund’s Class A tax-free distribution rate. For the Fund’s Class C and Advisor shares’ performance, please see the Performance Summary. The reduction in dividend distributions from the start to the end of the period under review reflected generally declining interest rates. Additionally, investor demand was strong for municipal bonds in an environment of limited tax-exempt supply. These factors resulted in reduced income for the portfolio and caused dividends to decline overall.
72 | Annual Report
State Update
North Carolina’s diverse economy expanded during the period, but job growth remained relatively flat. Housing market weakness continued to be a drag on the state’s economy as it has been on the nation’s. Manufacturing, particularly the automotive industry, contributed to the state’s economic recovery. With the exception of mining and logging, all employment sectors added jobs, led by education and health services; professional and business services; and trade, transportation and utilities. The state’s unemployment rate improved from 10.4% in February 2011 to 9.9% at period-end, but it was considerably higher than the 8.3% national rate.3
The state closed its fiscal year 2011 budget with an adequate fund balance resulting from reduced expenditures and an improved revenue environment. The state’s enacted fiscal 2012-2013 biennial budget had a huge projected budget gap primarily due to the end of federal stimulus programs and expiration of the state’s temporary tax increase. State officials bridged the gap largely through spending reductions, primarily in education and health and human services. Projected revenue growth for the biennium is significantly higher than in recent years but below the historical average during the state’s economic expansion periods. Should revenue growth fall short of the projection, the state has additional reserves outside of the general fund that the governor is constitutionally authorized to transfer without legislative approval.
North Carolina has a moderate debt burden despite bond authorization and issuance increases in recent years. The state’s net tax-supported debt was 2.3% of personal income and $782 per capita, compared with the national medians of 2.8% and $1,066.4 Independent credit rating agency Standard & Poor’s assigned North Carolina’s general obligation debt its highest rating of AAA with a stable outlook.5 The rating and outlook reflected the state’s diverse economic base, historically healthy financial position, and prudent fiscal management that included proactive responses to budget shortfalls and surpluses to retain structural balance.
3. Source: Bureau of Labor Statistics.
4. Source: Moody’s Investors Service, “Special Comment: 2011 State Debt Medians Report,” 6/3/11.
5. This does not indicate Standard & Poor’s rating of the Fund.
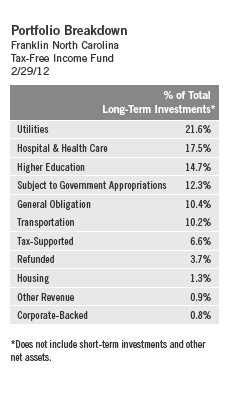
Annual Report | 73
Manager’s Discussion
We used various investment strategies during the 12 months under review as we sought to maximize tax-free income for shareholders. Please read the discussion on page 6 for details.
Thank you for your continued participation in Franklin North Carolina Tax-Free Income Fund. We believe our conservative, buy-and-hold investment strategy can help us achieve high, current, tax-free income for shareholders.
The foregoing information reflects our analysis, opinions and portfolio holdings as of February 29, 2012, the end of the reporting period. The way we implement our main investment strategies and the resulting portfolio holdings may change depending on factors such as market and economic conditions. These opinions may not be relied upon as investment advice or an offer for a particular security. The information is not a complete analysis of every aspect of any market, state, industry, security or the Fund. Statements of fact are from sources considered reliable, but the investment manager makes no representation or warranty as to their completeness or accuracy. Although historical performance is no guarantee of future results, these insights may help you understand our investment management philosophy.
74 | Annual Report
Performance Summary as of 2/29/12
Franklin North Carolina Tax-Free Income Fund
Your dividend income will vary depending on dividends or interest paid by securities in the Fund’s portfolio, adjusted for operating expenses of each class. Capital gain distributions are net profits realized from the sale of portfolio securities. The performance table and graphs do not reflect any taxes that a shareholder would pay on Fund dividends, capital gain distributions, if any, or any realized gains on the sale of Fund shares. Total return reflects reinvestment of the Fund’s dividends and capital gain distributions, if any, and any unrealized gains or losses.
| | | | | | | | |
| Price and Distribution Information | | | | | | |
| Class A (Symbol: FXNCX) | | | | Change | | 2/29/12 | | 2/28/11 |
| Net Asset Value (NAV) | | | +$ | 1.06 | $ | 12.79 | $ | 11.73 |
| Distributions (3/1/11–2/29/12) | | | | | | | | |
| Dividend Income | $ | 0.4991 | | | | | | |
| Class C (Symbol: FNCIX) | | | | Change | | 2/29/12 | | 2/28/11 |
| Net Asset Value (NAV) | | | +$ | 1.07 | $ | 12.95 | $ | 11.88 |
| Distributions (3/1/11–2/29/12) | | | | | | | | |
| Dividend Income | $ | 0.4325 | | | | | | |
| Advisor Class (Symbol: FNCZX) | | | | Change | | 2/29/12 | | 2/28/11 |
| Net Asset Value (NAV) | | | +$ | 1.05 | $ | 12.78 | $ | 11.73 |
| Distributions (3/1/11–2/29/12) | | | | | | | | |
| Dividend Income | $ | 0.5109 | | | | | | |
Annual Report | 75
Performance Summary (continued)
Performance
Cumulative total return excludes sales charges. Average annual total returns include maximum sales charges. Class A: 4.25% maximum initial sales charge; Class C: 1% contingent deferred sales charge in first year only; Advisor Class: no sales charges.
| | | | | | | | | | | |
| Class A | | | | 1-Year | | | 5-Year | | | 10-Year | |
| Cumulative Total Return1 | | | + | 13.57 | % | + | 27.29 | % | + | 64.25 | % |
| Average Annual Total Return2 | | | + | 8.74 | % | + | 4.04 | % | + | 4.63 | % |
| Avg. Ann. Total Return (3/31/12)3 | | | + | 8.72 | % | + | 4.03 | % | + | 4.78 | % |
| Distribution Rate4 | 3.64 | % | | | | | | | | | |
| Taxable Equivalent Distribution Rate5 | 6.07 | % | | | | | | | | | |
| 30-Day Standardized Yield6 | 2.59 | % | | | | | | | | | |
| Taxable Equivalent Yield5 | 4.32 | % | | | | | | | | | |
| Total Annual Operating Expenses7 | 0.63 | % | | | | | | | | | |
| Class C | | | | 1-Year | | | 5-Year | | | 10-Year | |
| Cumulative Total Return1 | | | + | 12.87 | % | + | 23.79 | % | + | 55.50 | % |
| Average Annual Total Return2 | | | + | 11.87 | % | + | 4.36 | % | + | 4.51 | % |
| Avg. Ann. Total Return (3/31/12)3 | | | + | 11.88 | % | + | 4.36 | % | + | 4.66 | % |
| Distribution Rate4 | 3.18 | % | | | | | | | | | |
| Taxable Equivalent Distribution Rate5 | 5.30 | % | | | | | | | | | |
| 30-Day Standardized Yield6 | 2.16 | % | | | | | | | | | |
| Taxable Equivalent Yield5 | 3.60 | % | | | | | | | | | |
| Total Annual Operating Expenses7 | 1.18 | % | | | | | | | | | |
| Advisor Class8 | | | | 1-Year | | | 5-Year | | | 10-Year | |
| Cumulative Total Return1 | | | + | 13.59 | % | + | 27.50 | % | + | 64.52 | % |
| Average Annual Total Return2 | | | + | 13.59 | % | + | 4.98 | % | + | 5.10 | % |
| Avg. Ann. Total Return (3/31/12)3 | | | + | 13.60 | % | + | 4.98 | % | + | 5.26 | % |
| Distribution Rate4 | 3.91 | % | | | | | | | | | |
| Taxable Equivalent Distribution Rate5 | 6.52 | % | | | | | | | | | |
| 30-Day Standardized Yield6 | 2.81 | % | | | | | | | | | |
| Taxable Equivalent Yield5 | 4.69 | % | | | | | | | | | |
| Total Annual Operating Expenses7 | 0.53 | % | | | | | | | | | |
Performance data represent past performance, which does not guarantee future results. Investment return and principal value will fluctuate, and you may have a gain or loss when you sell your shares. Current performance may differ from figures shown. For most recent month-end performance, go to franklintempleton.com or call (800) 342-5236.
76 | Annual Report
Performance Summary (continued)
Total Return Index Comparison for a Hypothetical $10,000 Investment
Total return represents the change in value of an investment over the periods shown. It includes any current, applicable, maximum sales charge, Fund expenses, account fees and reinvested distributions. The unmanaged index includes reinvestment of any income or distributions. It differs from the Fund in composition and does not pay management fees or expenses. One cannot invest directly in an index.

Annual Report | 77
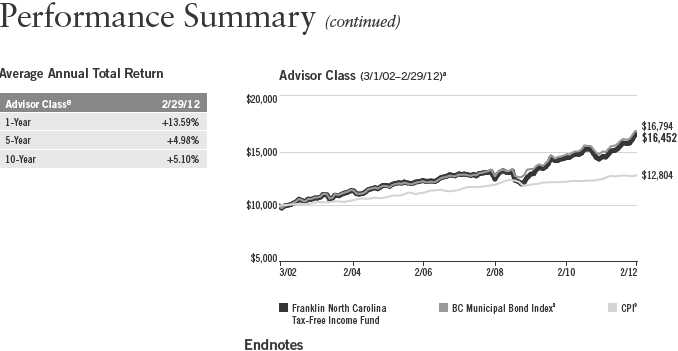
All investments involve risks, including possible loss of principal. Because municipal bonds are sensitive to interest rate movements, the Fund’s yield and share price will fluctuate with market conditions. Bond prices generally move in the opposite direction of interest rates. Thus, as prices of bonds in the Fund adjust to a rise in interest rates, the Fund’s share price may decline. Changes in the financial strength of a bond issuer or in a bond’s credit rating may affect its value. The Fund is actively managed but there is no guarantee that the manager’s investment decisions will produce the desired results. Since the Fund concentrates its investments in a single state, it is subject to greater risk of adverse economic and regulatory changes in that state than a geographically diversified fund. The Fund’s prospectus also includes a description of the main investment risks.
Class C: Prior to 1/1/04, these shares were offered with an initial sales charge; thus actual total returns
would have differed. These shares have higher annual fees and expenses than Class A shares.
Advisor Class: Shares are available to certain eligible investors as described in the prospectus.
1. Cumulative total return represents the change in value of an investment over the periods indicated.
2. Average annual total return represents the average annual change in value of an investment over the periods indicated.
3. In accordance with SEC rules, we provide standardized average annual total return information through the latest calendar quarter.
4. Distribution rate is based on an annualization of the respective class’s current monthly dividend and the maximum offering price (NAV for Classes C and Advisor) per share on 2/29/12.
5. Taxable equivalent distribution rate and yield assume the published rates as of 12/28/11 for the maximum combined effective federal and North Carolina personal income tax rate of 40.04%, based on the federal income tax rate of 35.00%.
6. The 30-day standardized yield for the month ended 2/29/12 reflects an estimated yield to maturity (assuming all portfolio securities are held to maturity). It should be regarded as an estimate of the Fund’s rate of investment income, and it may not equal the Fund’s actual income distribution rate (which reflects the Fund’s past dividends paid to shareholders) or the income reported in the Fund’s financial statements.
7. Figures are as stated in the Fund’s prospectus current as of the date of this report. In periods of market volatility, assets may decline significantly, causing total annual Fund operating expenses to become higher than the figures shown.
8. Effective 7/1/09, the Fund began offering Advisor Class shares, which do not have sales charges or a Rule 12b-1 plan. Performance quotations for this class reflect the following methods of calculation: (a) For periods prior to 7/1/09, a restated figure is used based upon the Fund’s Class A performance, excluding the effect of Class A’s maximum initial sales charge, but reflecting the effect of the Class A Rule 12b-1 fees; and (b) for periods after 7/1/09, actual Advisor Class performance is used reflecting all charges and fees applicable to that class. Since 7/1/09 (commencement of sales), the cumulative and average annual total returns of Advisor Class shares were +22.80% and +8.02%.
9. Source: © 2012 Morningstar. The BC Municipal Bond Index is a market value-weighted index engineered for the long-term tax-exempt bond market. To be included in the index, bonds must be fixed rate, have at least one year to final maturity and be rated investment grade (Baa3/BBB- or higher) by at least two of the following agencies: Moody’s, Standard & Poor’s and Fitch. The Consumer Price Index (CPI), calculated by the U.S. Bureau of Labor Statistics, is a commonly used measure of the inflation rate.
78 | Annual Report
Your Fund’s Expenses
Franklin North Carolina Tax-Free Income Fund
As a Fund shareholder, you can incur two types of costs:
- Transaction costs, including sales charges (loads) on Fund purchases; and
- Ongoing Fund costs, including management fees, distribution and service (12b-1) fees, and other Fund expenses. All mutual funds have ongoing costs, sometimes referred to as operating expenses.
The following table shows ongoing costs of investing in the Fund and can help you understand these costs and compare them with those of other mutual funds. The table assumes a $1,000 investment held for the six months indicated.
Actual Fund Expenses
The first line (Actual) for each share class listed in the table provides actual account values and expenses. The “Ending Account Value” is derived from the Fund’s actual return, which includes the effect of Fund expenses.
You can estimate the expenses you paid during the period by following these steps. Of course, your account value and expenses will differ from those in this illustration:
| 1. | Divide your account value by $1,000. |
| | If an account had an $8,600 value, then $8,600 ÷ $1,000 = 8.6. |
| 2. | Multiply the result by the number under the heading “Expenses Paid During Period.” |
| | If Expenses Paid During Period were $7.50, then 8.6 x $7.50 = $64.50. |
In this illustration, the estimated expenses paid this period are $64.50.
Hypothetical Example for Comparison with Other Funds
Information in the second line (Hypothetical) for each class in the table can help you compare ongoing costs of investing in the Fund with those of other mutual funds. This information may not be used to estimate the actual ending account balance or expenses you paid during the period. The hypothetical “Ending Account Value” is based on the actual expense ratio for each class and an assumed 5% annual rate of return before expenses, which does not represent the Fund’s actual return. The figure under the heading “Expenses Paid During Period” shows the hypothetical expenses your account would have incurred under this scenario. You can compare this figure with the 5% hypothetical examples that appear in shareholder reports of other funds.
Annual Report | 79
Your Fund’s Expenses (continued)
Please note that expenses shown in the table are meant to highlight ongoing costs and do not reflect any transaction costs, such as sales charges. Therefore, the second line for each class is useful in comparing ongoing costs only, and will not help you compare total costs of owning different funds. In addition, if transaction costs were included, your total costs would have been higher. Please refer to the Fund prospectus for additional information on operating expenses.
| | | | | | |
| | | Beginning Account | | Ending Account | | Expenses Paid During |
| Class A | | Value 9/1/11 | | Value 2/29/12 | | Period* 9/1/11–2/29/12 |
| Actual | $ | 1,000 | $ | 1,065.70 | $ | 3.24 |
| Hypothetical (5% return before expenses) | $ | 1,000 | $ | 1,021.73 | $ | 3.17 |
| Class C | | | | | | |
| Actual | $ | 1,000 | $ | 1,062.80 | $ | 6.05 |
| Hypothetical (5% return before expenses) | $ | 1,000 | $ | 1,019.00 | $ | 5.92 |
| Advisor Class | | | | | | |
| Actual | $ | 1,000 | $ | 1,065.40 | $ | 2.72 |
| Hypothetical (5% return before expenses) | $ | 1,000 | $ | 1,022.23 | $ | 2.66 |
*Expenses are calculated using the most recent six-month expense ratio, annualized for each class (A: 0.63%; C: 1.18%; and Advisor: 0.53%), multiplied by the average account value over the period, multiplied by 182/366 to reflect the one-half year period.
80 | Annual Report
Franklin Virginia Tax-Free Income Fund
Your Fund’s Goal and Main Investments: Franklin Virginia Tax-Free Income Fund seeks to provide as high a level of income exempt from federal and Virginia personal income taxes as is consistent with prudent investment management and preservation of capital by investing at least 80% of its total assets in securities that pay interest free from such taxes.1
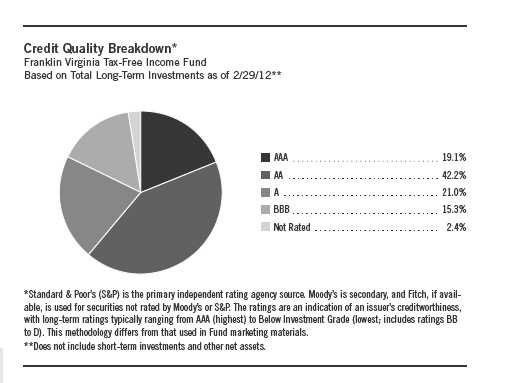
Performance data represent past performance, which does not guarantee future results. Investment return and principal value will fluctuate, and you may have a gain or loss when you sell your shares. Current performance may differ from figures shown. Please visit franklintempleton.com or call (800) 342-5236 for most recent month-end performance.
We are pleased to bring you Franklin Virginia Tax-Free Income Fund’s annual report for the fiscal year ended February 29, 2012.
Performance Overview
The Fund’s Class A share price, as measured by net asset value, increased from $11.18 on February 28, 2011, to $12.10 on February 29, 2012. The Fund’s Class A shares paid dividends totaling 48.73 cents per share for the
1. For investors subject to alternative minimum tax, a small portion of Fund dividends may be taxable. Distributions of capital gains are generally taxable. To avoid imposition of 28% backup withholding on all Fund distributions and redemption proceeds, U.S. investors must be properly certified on Form W-9 and non-U.S. investors on Form W-8BEN.
The dollar value, number of shares or principal amount, and names of all portfolio holdings are listed in the Fund’s Statement of Investments (SOI). The SOI begins on page 152.
Annual Report | 81
| | | |
| Dividend Distributions* | | | |
| Franklin Virginia Tax-Free Income Fund | | | |
| | | Dividend per Share |
| Month | Class A | Class C | Advisor Class |
| March 2011 | 4.01 cents | 3.51 cents | 4.10 cents |
| April 2011 | 4.01 cents | 3.51 cents | 4.10 cents |
| May 2011 | 4.01 cents | 3.51 cents | 4.10 cents |
| June 2011 | 4.08 cents | 3.58 cents | 4.17 cents |
| July 2011 | 4.08 cents | 3.58 cents | 4.17 cents |
| August 2011 | 4.08 cents | 3.58 cents | 4.17 cents |
| September 2011 | 4.08 cents | 3.53 cents | 4.17 cents |
| October 2011 | 4.08 cents | 3.53 cents | 4.17 cents |
| November 2011 | 4.08 cents | 3.53 cents | 4.17 cents |
| December 2011** | 5.10 cents | 4.39 cents | 5.23 cents |
| January 2012 | 2.92 cents | 2.51 cents | 2.99 cents |
| February 2012 | 4.01 cents | 3.45 cents | 4.11 cents |
*Assumes shares were purchased and held for the entire accrual period, which differs from the calendar month. Since dividends accrue daily, your actual distributions will vary depending on the date you purchased your shares and any account activity. All Fund distributions will vary depending upon current market conditions, and past distributions are not indicative of future trends.
**The December per-share dividend distribution consisted of payments on 12/21/11 and 12/30/11 for each class as follows: Class A, 4.01 cents and 1.09 cents; Class C, 3.45 cents and 0.94 cents; and Advisor Class, 4.11 cents and 1.12 cents.
same period.2 The Performance Summary beginning on page 85 shows that at the end of this reporting period the Fund’s Class A shares’ distribution rate was 3.74% based on an annualization of the current 3.94 cent per share dividend and the maximum offering price of $12.64 on February 29, 2012. An investor in the 2012 maximum combined effective federal and Virginia personal income tax bracket of 38.74% would need to earn a distribution rate of 6.10% from a taxable investment to match the Fund’s Class A tax-free distribution rate. For the Fund’s Class C and Advisor shares’ performance, please see the Performance Summary.
Commonwealth Update
During the 12 months under review, Virginia’s economy generated healthy revenue growth and the unemployment rate remained well below the national
2. All Fund distributions will vary depending upon current market conditions, and past distributions are not indicative of future trends.
82 | Annual Report
average. Virginia revenues for fiscal year 2012 climbed through January, although this rate slowed from the pace between July and September, the first quarter of fiscal year 2012. The higher revenues reflected growth in individual income tax receipts, and followed an upswing in revenue collections for fiscal year 2011. Virginia’s economy grew at a faster pace over the past 15 years than the national average.3
Revenue growth was accompanied by low unemployment rates relative to the national average. Virginia’s unemployment rate stood at 5.7% in February 2012, compared with the 8.3% national rate.4 The financial activities sector and education and health services sector grew the most for the 12 months under review. Although the majority of business sectors added jobs, the construction, information, manufacturing, and other services sectors lost jobs over the same period. Consistent with relatively low unemployment, Virginia’s home sales and median home prices rose in 2011 compared to prior year levels.
Independent credit rating agency Moody’s Investors Service acknowledged Virginia’s fiscal year 2012 structurally balanced budget and rebuilding of emergency reserves. The commonwealth ended fiscal year 2011 with a surplus resulting from general reserve collections and transfers. To reduce retirement plan obligations, Virginia began requiring new state employees to contribute a minimum of 5% to retirement plans.5 Also, because Virginia has a number of employers related to the military and reliant on federal funding, the governor proposed increasing the rainy day fund in fiscal year 2014 and initially invested $30 million to create the Federal Action Contingency Trust Fund, designed to continue programs directly affected by federal budget cuts.5
The state’s debt burden was moderate, with net tax-supported debt of 2.4% of personal income and $1,058 per capita, compared with the 2.8% and $1,066 national medians.6 Independent credit rating agency Standard & Poor’s maintained its top AAA rating for Virginia, classifying Virginia’s management practices as “strong.”7 Moody’s also maintained its Aaa rating, citing the commonwealth’s conservative fiscal management, diverse local economy and low debt burden.7
3. Source: Standard & Poor’s, “Virginia; Appropriations; General Obligation; Miscellaneous Tax; Moral Obligation,”
RatingsDirect, 2/15/12.
4. Source: Bureau of Labor Statistics.
5. Source: Moody’s Investors Service, “New Issue: Moody’s Assigns Aaa Rating to $98.9 million of Virginia General Obligation Bonds,” 2/14/12.
6. Source: Moody’s Investors Service, “Special Comment: 2011 State Debt Medians Report,” 6/3/11.
7. This does not indicate a rating of the Fund.
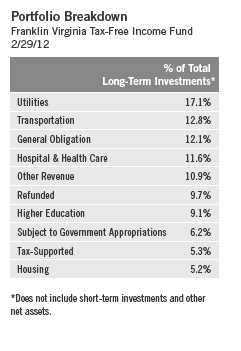
Annual Report | 83
Manager’s Discussion
We used various investment strategies during the 12 months under review as we sought to maximize tax-free income for shareholders. Please read the discussion on page 6 for details.
Thank you for your continued participation in Franklin Virginia Tax-Free Income Fund. We believe our conservative, buy-and-hold investment strategy can help us achieve high, current, tax-free income for shareholders.
The foregoing information reflects our analysis, opinions and portfolio holdings as of February 29, 2012, the end of the reporting period. The way we implement our main investment strategies and the resulting portfolio holdings may change depending on factors such as market and economic conditions. These opinions may not be relied upon as investment advice or an offer for a particular security. The information is not a complete analysis of every aspect of any market, state, industry, security or the Fund. Statements of fact are from sources considered reliable, but the investment manager makes no representation or warranty as to their completeness or accuracy. Although historical performance is no guarantee of future results, these insights may help you understand our investment management philosophy.
84 | Annual Report
Performance Summary as of 2/29/12
Franklin Virginia Tax-Free Income Fund
Your dividend income will vary depending on dividends or interest paid by securities in the Fund’s portfolio, adjusted for operating expenses of each class. Capital gain distributions are net profits realized from the sale of portfolio securities. The performance table and graphs do not reflect any taxes that a shareholder would pay on Fund dividends, capital gain distributions, if any, or any realized gains on the sale of Fund shares. Total return reflects reinvestment of the Fund’s dividends and capital gain distributions, if any, and any unrealized gains or losses.
| | | | | | | | |
| Price and Distribution Information | | | | | | |
| Class A (Symbol: FRVAX) | | | | Change | | 2/29/12 | | 2/28/11 |
| Net Asset Value (NAV) | | | +$ | 0.92 | $ | 12.10 | $ | 11.18 |
| Distributions (3/1/11–2/29/12) | | | | | | | | |
| Dividend Income | $ | 0.4873 | | | | | | |
| Class C (Symbol: FVAIX) | | | | Change | | 2/29/12 | | 2/28/11 |
| Net Asset Value (NAV) | | | +$ | 0.94 | $ | 12.26 | $ | 11.32 |
| Distributions (3/1/11–2/29/12) | | | | | | | | |
| Dividend Income | $ | 0.4235 | | | | | | |
| Advisor Class (Symbol: FRVZX) | | | | Change | | 2/29/12 | | 2/28/11 |
| Net Asset Value (NAV) | | | +$ | 0.92 | $ | 12.10 | $ | 11.18 |
| Distributions (3/1/11–2/29/12) | | | | | | | | |
| Dividend Income | $ | 0.4985 | | | | | | |
Annual Report | 85
Performance Summary (continued)
Performance
Cumulative total return excludes sales charges. Average annual total returns include maximum sales charges. Class A: 4.25% maximum initial sales charge; Class C: 1% contingent deferred sales charge in first year only; Advisor Class: no sales charges.
| | | | | | | | | | | |
| Class A | | | | 1-Year | | | 5-Year | | | 10-Year | |
| Cumulative Total Return1 | | | + | 12.84 | % | + | 26.10 | % | + | 61.70 | % |
| Average Annual Total Return2 | | | + | 8.01 | % | + | 3.83 | % | + | 4.47 | % |
| Avg. Ann. Total Return (3/31/12)3 | | | + | 7.98 | % | + | 3.77 | % | + | 4.59 | % |
| Distribution Rate4 | 3.74 | % | | | | | | | | | |
| Taxable Equivalent Distribution Rate5 | 6.10 | % | | | | | | | | | |
| 30-Day Standardized Yield6 | 2.59 | % | | | | | | | | | |
| Taxable Equivalent Yield5 | 4.23 | % | | | | | | | | | |
| Total Annual Operating Expenses7 | 0.64 | % | | | | | | | | | |
| Class C | | | | 1-Year | | | 5-Year | | | 10-Year | |
| Cumulative Total Return1 | | | + | 12.25 | % | + | 22.75 | % | + | 53.05 | % |
| Average Annual Total Return2 | | | + | 11.25 | % | + | 4.19 | % | + | 4.35 | % |
| Avg. Ann. Total Return (3/31/12)3 | | | + | 11.06 | % | + | 4.11 | % | + | 4.47 | % |
| Distribution Rate4 | 3.28 | % | | | | | | | | | |
| Taxable Equivalent Distribution Rate5 | 5.35 | % | | | | | | | | | |
| 30-Day Standardized Yield6 | 2.15 | % | | | | | | | | | |
| Taxable Equivalent Yield5 | 3.51 | % | | | | | | | | | |
| Total Annual Operating Expenses7 | 1.19 | % | | | | | | | | | |
| Advisor Class8 | | | | 1-Year | | | 5-Year | | | 10-Year | |
| Cumulative Total Return1 | | | + | 12.95 | % | + | 26.41 | % | + | 62.10 | % |
| Average Annual Total Return2 | | | + | 12.95 | % | + | 4.80 | % | + | 4.95 | % |
| Avg. Ann. Total Return (3/31/12)3 | | | + | 12.76 | % | + | 4.72 | % | + | 5.07 | % |
| Distribution Rate4 | 4.02 | % | | | | | | | | | |
| Taxable Equivalent Distribution Rate5 | 6.56 | % | | | | | | | | | |
| 30-Day Standardized Yield6 | 2.81 | % | | | | | | | | | |
| Taxable Equivalent Yield5 | 4.59 | % | | | | | | | | | |
| Total Annual Operating Expenses7 | 0.54 | % | | | | | | | | | |
Performance data represent past performance, which does not guarantee future results. Investment return and principal value will fluctuate, and you may have a gain or loss when you sell your shares. Current performance may differ from figures shown. For most recent month-end performance, go to franklintempleton.com or call (800) 342-5236.
86 | Annual Report
Performance Summary (continued)
Total Return Index Comparison for a Hypothetical $10,000 Investment
Total return represents the change in value of an investment over the periods shown. It includes any current, applicable, maximum sales charge, Fund expenses, account fees and reinvested distributions. The unmanaged index includes reinvestment of any income or distributions. It differs from the Fund in composition and does not pay management fees or expenses. One cannot invest directly in an index.
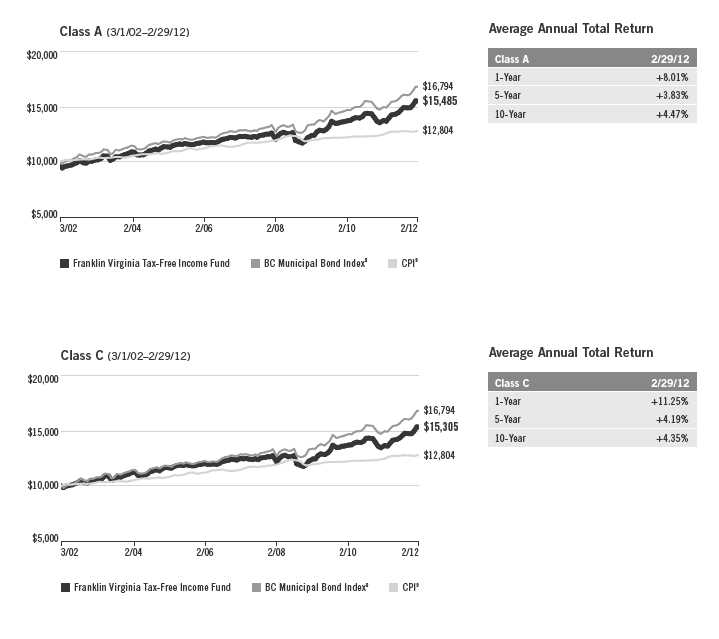
Annual Report | 87
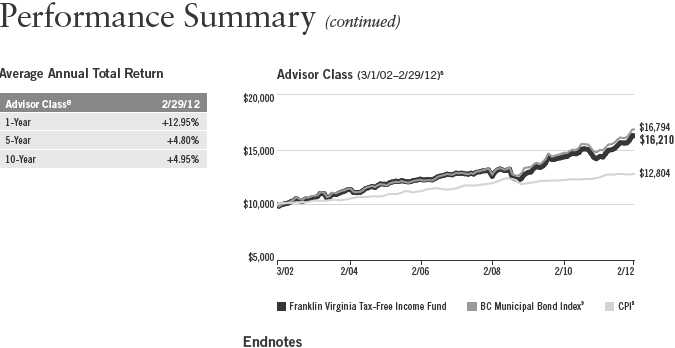
All investments involve risks, including possible loss of principal. Because municipal bonds are sensitive to interest rate movements, the Fund’s yield and share price will fluctuate with market conditions. Bond prices generally move in the opposite direction of interest rates. Thus, as prices of bonds in the Fund adjust to a rise in interest rates, the Fund’s share price may decline. Changes in the financial strength of a bond issuer or in a bond’s credit rating may affect its value. The Fund is actively managed but there is no guarantee that the manager’s investment decisions will produce the desired results. Since the Fund concentrates its investments in a single state, it is subject to greater risk of adverse economic and regulatory changes in that state than a geographically diversified fund. The Fund’s prospectus also includes a description of the main investment risks.
Class C: Prior to 1/1/04, these shares were offered with an initial sales charge; thus actual total returns
would have differed. These shares have higher annual fees and expenses than Class A shares.
Advisor Class: Shares are available to certain eligible investors as described in the prospectus.
1. Cumulative total return represents the change in value of an investment over the periods indicated.
2. Average annual total return represents the average annual change in value of an investment over the periods indicated.
3. In accordance with SEC rules, we provide standardized average annual total return information through the latest calendar quarter.
4. Distribution rate is based on an annualization of the respective class’s current monthly dividend and the maximum offering price (NAV for Classes C and Advisor) per share on 2/29/12.
5. Taxable equivalent distribution rate and yield assume the published rates as of 12/28/11 for the maximum combined federal and Virginia personal income tax rate of 38.74%, based on the federal income tax rate of 35.00%.
6. The 30-day standardized yield for the month ended 2/29/12 reflects an estimated yield to maturity (assuming all portfolio securities are held to maturity). It should be regarded as an estimate of the Fund’s rate of investment income, and it may not equal the Fund’s actual income distribution rate (which reflects the Fund’s past dividends paid to shareholders) or the income reported in the Fund’s financial statements.
7. Figures are as stated in the Fund’s prospectus current as of the date of this report. In periods of market volatility, assets may decline significantly, causing total annual Fund operating expenses to become higher than the figures shown.
8. Effective 7/1/09, the Fund began offering Advisor Class shares, which do not have sales charges or a Rule 12b-1 plan. Performance quotations for this class reflect the following methods of calculation: (a) For periods prior to 7/1/09, a restated figure is used based upon the Fund’s Class A performance, excluding the effect of Class A’s maximum initial sales charge, but reflecting the effect of the Class A Rule 12b-1 fees; and (b) for periods after 7/1/09, actual Advisor Class performance is used reflecting all charges and fees applicable to that class. Since 7/1/09 (commencement of sales), the cumulative and average annual total returns of Advisor Class shares were +21.55% and +7.60%.
9. Source: © 2012 Morningstar. The BC Municipal Bond Index is a market value-weighted index engineered for the long-term tax-exempt bond market. To be included in the index, bonds must be fixed rate, have at least one year to final maturity and be rated investment grade (Baa3/BBB- or higher) by at least two of the following agencies: Moody’s, Standard & Poor’s and Fitch. The Consumer Price Index (CPI), calculated by the U.S. Bureau of Labor Statistics, is a commonly used measure of the inflation rate.
88 | Annual Report
Your Fund’s Expenses
Franklin Virginia Tax-Free Income Fund
As a Fund shareholder, you can incur two types of costs:
- Transaction costs, including sales charges (loads) on Fund purchases; and
- Ongoing Fund costs, including management fees, distribution and service (12b-1) fees, and other Fund expenses. All mutual funds have ongoing costs, sometimes referred to as operating expenses.
The following table shows ongoing costs of investing in the Fund and can help you understand these costs and compare them with those of other mutual funds. The table assumes a $1,000 investment held for the six months indicated.
Actual Fund Expenses
The first line (Actual) for each share class listed in the table provides actual account values and expenses. The “Ending Account Value” is derived from the Fund’s actual return, which includes the effect of Fund expenses.
You can estimate the expenses you paid during the period by following these steps. Of course, your account value and expenses will differ from those in this illustration:
| 1. | Divide your account value by $1,000. |
| | If an account had an $8,600 value, then $8,600 ÷ $1,000 = 8.6. |
| 2. | Multiply the result by the number under the heading “Expenses Paid During Period.” |
| | If Expenses Paid During Period were $7.50, then 8.6 x $7.50 = $64.50. |
In this illustration, the estimated expenses paid this period are $64.50.
Hypothetical Example for Comparison with Other Funds
Information in the second line (Hypothetical) for each class in the table can help you compare ongoing costs of investing in the Fund with those of other mutual funds. This information may not be used to estimate the actual ending account balance or expenses you paid during the period. The hypothetical “Ending Account Value” is based on the actual expense ratio for each class and an assumed 5% annual rate of return before expenses, which does not represent the Fund’s actual return. The figure under the heading “Expenses Paid During Period” shows the hypothetical expenses your account would have incurred under this scenario. You can compare this figure with the 5% hypothetical examples that appear in shareholder reports of other funds.
Annual Report | 89
Your Fund’s Expenses (continued)
Please note that expenses shown in the table are meant to highlight ongoing costs and do not reflect any transaction costs, such as sales charges. Therefore, the second line for each class is useful in comparing ongoing costs only, and will not help you compare total costs of owning different funds. In addition, if transaction costs were included, your total costs would have been higher. Please refer to the Fund prospectus for additional information on operating expenses.
| | | | | | |
| | | Beginning Account | | Ending Account | | Expenses Paid During |
| Class A | | Value 9/1/11 | | Value 2/29/12 | | Period* 9/1/11–2/29/12 |
| Actual | $ | 1,000 | $ | 1,057.10 | $ | 3.27 |
| Hypothetical (5% return before expenses) | $ | 1,000 | $ | 1,021.68 | $ | 3.22 |
| Class C | | | | | | |
| Actual | $ | 1,000 | $ | 1,054.40 | $ | 6.08 |
| Hypothetical (5% return before expenses) | $ | 1,000 | $ | 1,018.95 | $ | 5.97 |
| Advisor Class | | | | | | |
| Actual | $ | 1,000 | $ | 1,057.60 | $ | 2.76 |
| Hypothetical (5% return before expenses) | $ | 1,000 | $ | 1,022.18 | $ | 2.72 |
*Expenses are calculated using the most recent six-month expense ratio, annualized for each class (A: 0.64%; C: 1.19%; and Advisor: 0.54%), multiplied by the average account value over the period, multiplied by 182/366 to reflect the one-half year period.
90 | Annual Report
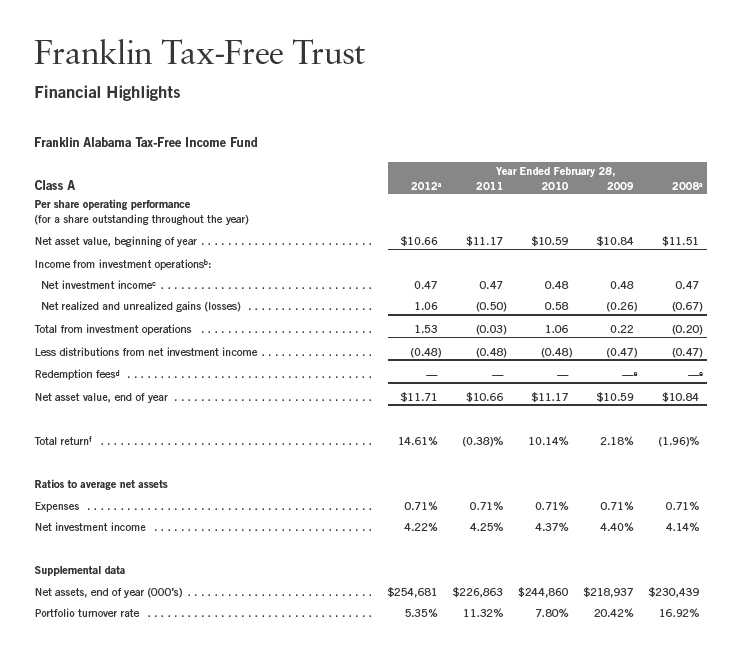
aFor the year ended February 29.
bThe amount shown for a share outstanding throughout the period may not correlate with the Statement of Operations for the period due to the timing of sales and repurchases of
the Fund shares in relation to income earned and/or fluctuating market value of the investments of the Fund.
cBased on average daily shares outstanding.
dEffective September 1, 2008, the redemption fee was eliminated.
eAmount rounds to less than $0.01 per share.
fTotal return does not reflect sales commissions or contingent deferred sales charges, if applicable.
Annual Report | The accompanying notes are an integral part of these financial statements. | 91
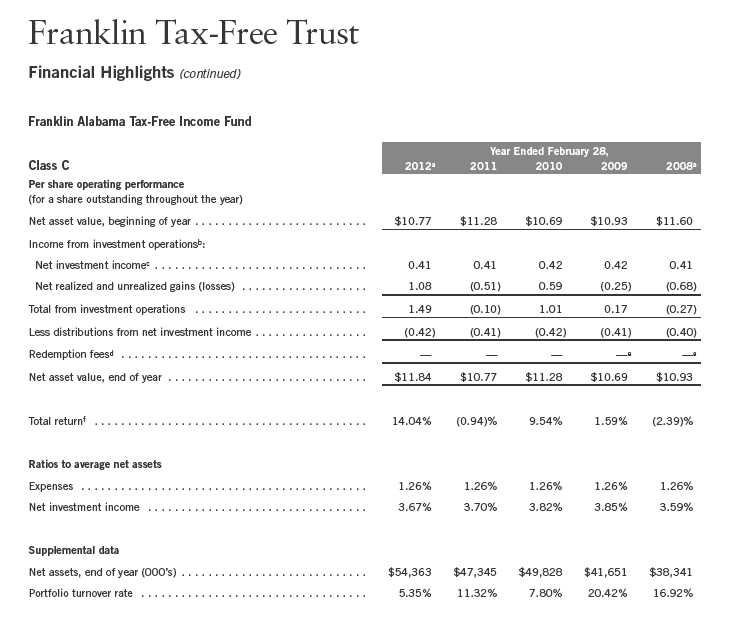
aFor the year ended February 29.
bThe amount shown for a share outstanding throughout the period may not correlate with the Statement of Operations for the period due to the timing of sales and repurchases of
the Fund shares in relation to income earned and/or fluctuating market value of the investments of the Fund.
cBased on average daily shares outstanding.
dEffective September 1, 2008, the redemption fee was eliminated.
eAmount rounds to less than $0.01 per share.
fTotal return does not reflect sales commissions or contingent deferred sales charges, if applicable.
92 | The accompanying notes are an integral part of these financial statements. | Annual Report
| | | | |
| Franklin Tax-Free Trust | | | | |
| |
| Statement of Investments, February 29, 2012 | | | | |
| |
| |
| Franklin Alabama Tax-Free Income Fund | | Principal Amount | | Value |
| Municipal Bonds 95.7% | | | | |
| Alabama 77.5% | | | | |
| Alabama Drinking Water Finance Authority Revenue, Revolving Fund Loan, Series A, | | | | |
| AMBAC Insured, 5.25%, 8/15/24 | $ | 1,755,000 | $ | 1,757,457 |
| Alabama State Port Authority Docks Facilities Revenue, Refunding, 6.00%, 10/01/40 | | 3,000,000 | | 3,279,090 |
| Alabama Water Pollution Control Authority Revenue, Revolving Fund Loan, Series A, | | | | |
| AMBAC Insured, 5.00%, 8/15/23 | | 4,435,000 | | 4,464,537 |
| Alabaster Sewer Revenue, NATL Insured, 5.00%, 4/01/29 | | 2,055,000 | | 2,092,134 |
| Anniston PBA Building Revenue, Judicial Center Project, AGMC Insured, 5.00%, 3/01/43 | | 4,120,000 | | 4,462,949 |
| Athens GO, wts., XLCA Insured, 5.00%, 2/01/36 | | 2,560,000 | | 2,661,939 |
| Auburn University General Fee Revenue, Series A, AGMC Insured, 5.00%, 6/01/38 | | 5,000,000 | | 5,418,150 |
| Bessemer GO, wts., XLCA Insured, 5.00%, 2/01/35 | | 1,990,000 | | 1,885,983 |
| Bessemer Governmental Utility Services Corp. Water Supply Revenue, Refunding, Series A, | | | | |
| Assured Guaranty, 5.00%, 6/01/39 | | 3,825,000 | | 4,027,955 |
| Birmingham Special Care Facilities Financing Authority, Health Care Facility Revenue, | | | | |
| Children’s Hospital, Assured Guaranty, 6.00%, 6/01/39 | | 4,000,000 | | 4,562,960 |
| Birmingham Waterworks Board Water Revenue, Series A, Assured Guaranty, 5.25%, 1/01/39 | | 5,950,000 | | 6,389,883 |
| Butler County IDA Environmental Improvement Revenue, International Paper, Series A, 7.00%, | | | | |
| 9/01/32 | | 1,000,000 | | 1,089,450 |
| Butler County Public Education Cooperative District, Series A, XLCA Insured, 5.00%, | | | | |
| 7/01/37 | | 9,025,000 | | 9,095,666 |
| Central Elmore Water and Sewer Authority Revenue, Water, NATL Insured, 5.00%, 1/01/29 | | 4,290,000 | | 4,491,544 |
| Chatom IDB Gulf Opportunity Zone Revenue, PowerSouth Energy Cooperative, Refunding, | | | | |
| Series A, Assured Guaranty, 5.00%, | | | | |
| 8/01/30 | | 5,250,000 | | 5,933,235 |
| 8/01/37 | | 5,000,000 | | 5,428,100 |
| Coffee County PBA Building Revenue, NATL Insured, 5.00%, 9/01/27 | | 2,145,000 | | 2,193,348 |
| Cullman Utilities Board Water Revenue, AGMC Insured, 5.00%, 9/01/41 | | 3,000,000 | | 3,232,020 |
| DCH Health Care Authority Health Care Facilities Revenue, 5.125%, 6/01/36 | | 7,000,000 | | 7,193,830 |
| East Alabama Health Care Authority Health Care Facilities Revenue, Mandatory Put 9/01/18, | | | | |
| Series A, 5.25%, 9/01/36 | | 5,000,000 | | 5,636,850 |
| Series B, 5.50%, 9/01/33 | | 4,500,000 | | 4,944,420 |
| Etowah County Board of Education Special Tax, School wts., AGMC Insured, 5.00%, | | | | |
| 9/01/24 | | 4,235,000 | | 4,353,665 |
| 9/01/28 | | 2,000,000 | | 2,041,100 |
| 9/01/33 | | 2,500,000 | | 2,537,950 |
| Fairfield GO, wts., Refunding, AMBAC Insured, 5.00%, 2/01/29 | | 980,000 | | 858,764 |
| Franklin County GO, wts., Series B, AMBAC Insured, 5.125%, 10/01/33 | | 2,000,000 | | 2,063,180 |
| Houston County Health Care Authority Revenue, Refunding, Series A, AMBAC Insured, 5.25%, | | | | |
| 10/01/30 | | 5,000,000 | | 5,102,150 |
| Huntsville Health Care Authority Revenue, Series A, NATL Insured, Pre-Refunded, | | | | |
| 5.40%, 6/01/22 | | 4,000,000 | | 4,119,800 |
| 5.50%, 6/01/27 | | 3,820,000 | | 3,935,135 |
| Huntsville PBA Lease Revenue, Municipal Justice and Public Safety Center, Capital Improvement | | | | |
| and Refunding, NATL Insured, 5.00%, 10/01/33 | | 8,000,000 | | 8,580,000 |
| Jacksonville State University Revenue, Tuition and Fee, NATL Insured, Pre-Refunded, 5.00%, | | | | |
| 12/01/22 | | 3,000,000 | | 3,034,590 |
| Jefferson County Limited Obligation School wts. Revenue, Series A, 5.00%, 1/01/24 | | 2,000,000 | | 1,869,160 |
| Jefferson County Sewer Revenue, wts., ETM, 7.50%, 9/01/13 | | 130,000 | | 134,554 |
Annual Report | 93
| | | | |
| Franklin Tax-Free Trust | | | | |
| |
| Statement of Investments, February 29, 2012 (continued) | | | | |
| |
| |
| Franklin Alabama Tax-Free Income Fund | | Principal Amount | | Value |
| Municipal Bonds (continued) | | | | |
| Alabama (continued) | | | | |
| Leeds Public Educational Building Authority Educational Facilities Revenue, Assured Guaranty, | | | | |
| 5.125%, 4/01/33 | $ | 7,410,000 | $ | 8,004,430 |
| Limestone County Water and Sewer Authority Water Revenue, | | | | |
| AMBAC Insured, 5.00%, 12/01/29 | | 1,540,000 | | 1,597,365 |
| AMBAC Insured, 5.00%, 12/01/31 | | 3,910,000 | | 4,029,959 |
| Assured Guaranty, 5.00%, 12/01/39 | | 3,750,000 | | 4,051,650 |
| Madison County Board of Education Capital Outlay Revenue, Tax Anticipation wts., | | | | |
| Assured Guaranty, 5.125%, 9/01/34 | | 600,000 | | 650,718 |
| Series A, AMBAC Insured, 5.00%, 9/01/34 | | 1,000,000 | | 1,022,040 |
| Madison GO, wts., Refunding, XLCA Insured, 4.75%, 12/01/36 | | 1,000,000 | | 1,043,880 |
| Madison Water and Wastewater Board Water and Sewer Revenue, Refunding, Series A, | | | | |
| XLCA Insured, 4.75%, 12/01/31 | | 7,500,000 | | 8,120,250 |
| Marshall County Health Care Authority Revenue, | | | | |
| Series A, 5.75%, 1/01/32 | | 2,170,000 | | 2,189,747 |
| Refunding, AMBAC Insured, 4.75%, 2/01/33 | | 3,000,000 | | 2,753,370 |
| Mobile GO, wts., 5.50%, 2/15/30 | | 2,000,000 | | 2,189,360 |
| Mobile Public Educational Building Authority Revenue, Limited Obligation School, Series A, | | | | |
| Assured Guaranty, 5.00%, 3/01/33 | | 6,500,000 | | 7,026,305 |
| Mobile Water and Sewer Commissioners Water and Sewer Revenue, Mobile Water, BHAC Insured, | | | | |
| 5.00%, 1/01/36 | | 10,000,000 | | 10,509,900 |
| Moulton Water Works Board Water Revenue, NATL Insured, 5.375%, 1/01/32 | | 1,935,000 | | 1,974,609 |
| Opelika Water Board Revenue, Assured Guaranty, 5.00%, 6/01/37 | | 3,000,000 | | 3,274,980 |
| Orange Beach Water Sewer and Fire Protection Authority Revenue, NATL Insured, 5.00%, | | | | |
| 5/15/35 | | 2,000,000 | | 2,067,180 |
| Phenix City Water and Sewer Revenue, wts., Series A, AGMC Insured, 5.00%, 8/15/40 | | 2,000,000 | | 2,190,080 |
| Selma IDBR, Gulf Opportunity Zone, | | | | |
| International Paper Co. Projects, Series A, 5.80%, 5/01/34 | | 3,000,000 | | 3,208,620 |
| International Paper Co. Project, Series A, 5.375%, 12/01/35 | | 3,000,000 | | 3,142,230 |
| Sheffield GO, wts., AMBAC Insured, 5.125%, 5/01/33 | | 2,610,000 | | 2,644,765 |
| Troy Public Educational Building Authority Dormitory Revenue, Troy University Housing LLC | | | | |
| Project, Series A, CIFG Insured, 5.00%, 9/01/32 | | 5,000,000 | | 5,207,750 |
| Troy Public Educational Building Authority Educational Facilities Revenue, AGMC Insured, | | | | |
| 5.25%, 12/01/40 | | 2,000,000 | | 2,192,000 |
| Trussville GO, wts., Series A, NATL RE, FGIC Insured, 5.00%, 10/01/36 | | 4,740,000 | | 4,962,069 |
| Tuscaloosa Public Educational Building Authority Student Housing Revenue, Ridgecrest Student | | | | |
| Housing LLC, University of Alabama Ridgecrest Residential Project, Assured Guaranty, 6.75%, | | | | |
| 7/01/38 | | 5,000,000 | | 5,815,600 |
| University of Alabama at Birmingham Hospital Revenue, Refunding, Series A, AMBAC Insured, | | | | |
| 5.00%, 9/01/41 | | 9,000,000 | | 9,258,390 |
| University of North Alabama Revenue, Student Housing, NATL RE, FGIC Insured, 5.00%, | | | | |
| 11/01/29 | | 2,995,000 | | 3,066,521 |
| University of South Alabama University Revenue, Facilities, Capital Improvement, BHAC Insured, | | | | |
| 5.00%, 8/01/38 | | 5,000,000 | | 5,358,700 |
| Valley Special Care Facilities Financing Authority Revenue, Lanier Memorial Hospital, Series A, | | | | |
| 5.65%, 11/01/22 | | 3,465,000 | | 3,205,610 |
| | | | | 239,629,626 |
94 | Annual Report
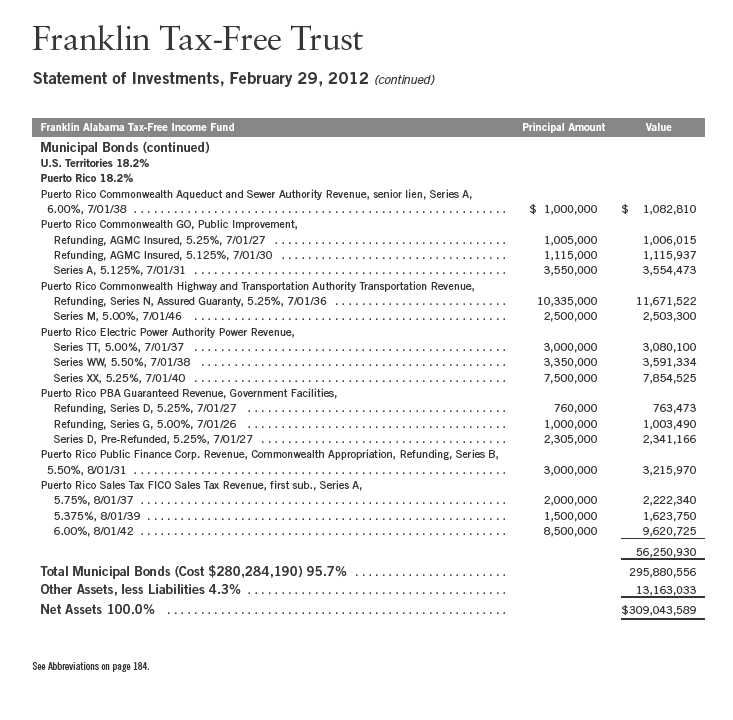
Annual Report | The accompanying notes are an integral part of these financial statements. | 95
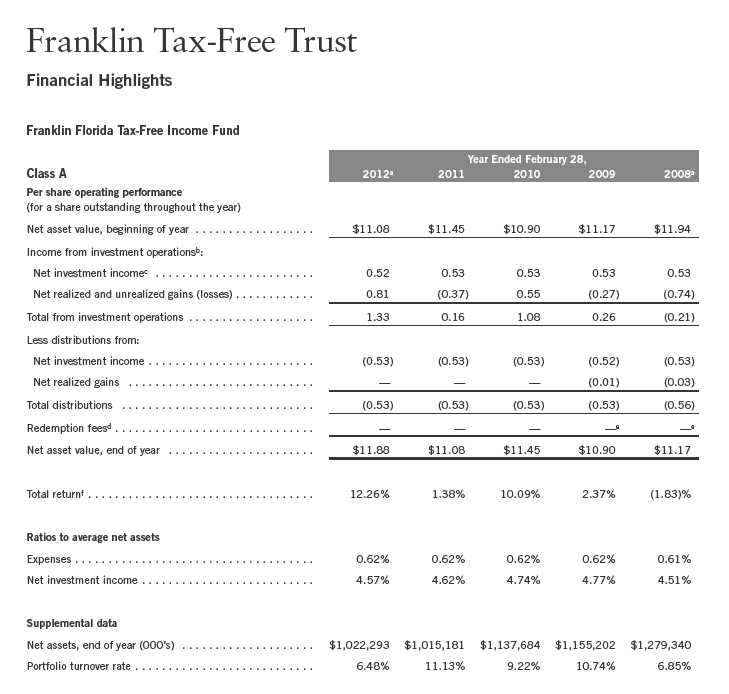
aFor the year ended February 29.
bThe amount shown for a share outstanding throughout the period may not correlate with the Statement of Operations for the period due to the timing of sales and repurchases of
the Fund shares in relation to income earned and/or fluctuating market value of the investments of the Fund.
cBased on average daily shares outstanding.
dEffective September 1, 2008, the redemption fee was eliminated.
eAmount rounds to less than $0.01 per share.
fTotal return does not reflect sales commissions or contingent deferred sales charges, if applicable.
96 | The accompanying notes are an integral part of these financial statements. | Annual Report
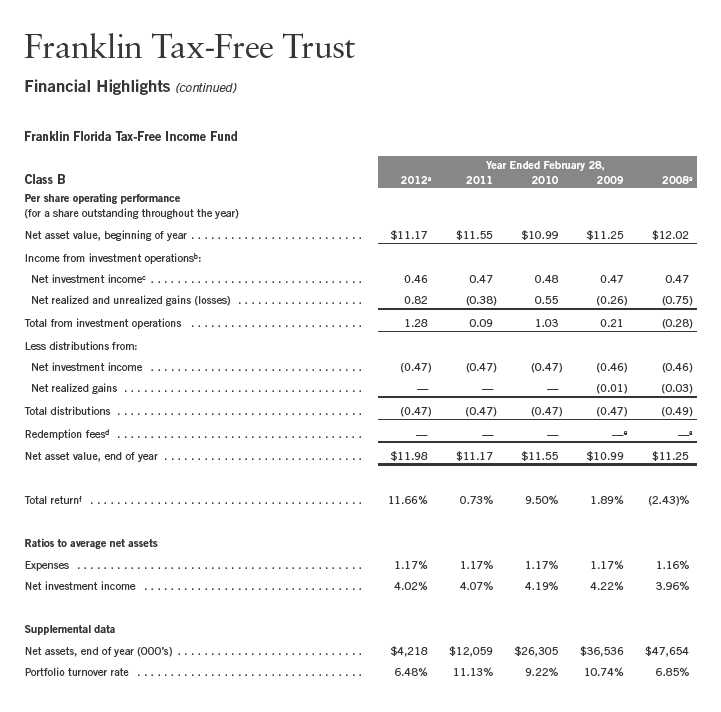
aFor the year ended February 29.
bThe amount shown for a share outstanding throughout the period may not correlate with the Statement of Operations for the period due to the timing of sales and repurchases of
the Fund shares in relation to income earned and/or fluctuating market value of the investments of the Fund.
cBased on average daily shares outstanding.
dEffective September 1, 2008, the redemption fee was eliminated.
eAmount rounds to less than $0.01 per share.
fTotal return does not reflect sales commissions or contingent deferred sales charges, if applicable.
Annual Report | The accompanying notes are an integral part of these financial statements. | 97
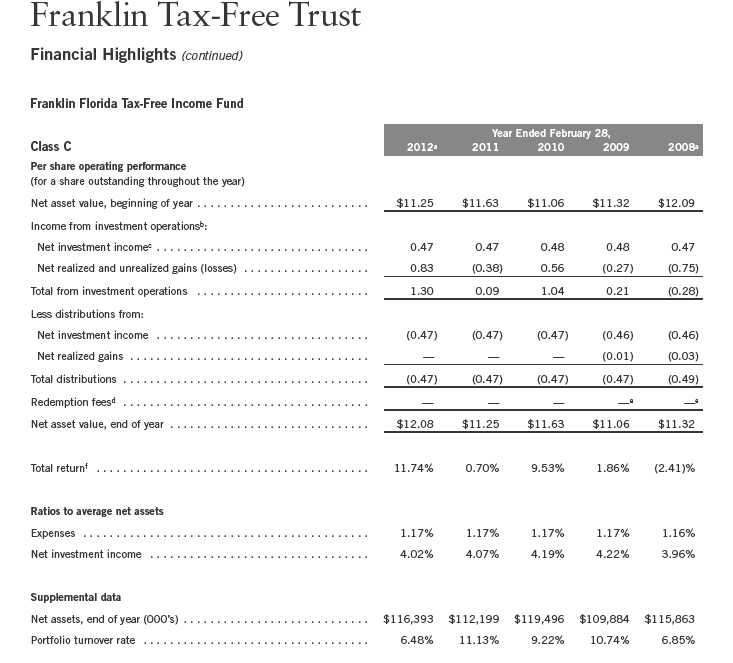
aFor the year ended February 29.
bThe amount shown for a share outstanding throughout the period may not correlate with the Statement of Operations for the period due to the timing of sales and repurchases of
the Fund shares in relation to income earned and/or fluctuating market value of the investments of the Fund.
cBased on average daily shares outstanding.
dEffective September 1, 2008, the redemption fee was eliminated.
eAmount rounds to less than $0.01 per share.
fTotal return does not reflect sales commissions or contingent deferred sales charges, if applicable.
98 | The accompanying notes are an integral part of these financial statements. | Annual Report
| | | | |
| Franklin Tax-Free Trust | | | | |
| |
| Statement of Investments, February 29, 2012 | | | | |
| |
| |
| Franklin Florida Tax-Free Income Fund | | Principal Amount | | Value |
| Municipal Bonds 98.5% | | | | |
| Florida 86.3% | | | | |
| Alachua County Health Facilities Authority Health Facilities Revenue, Shands Healthcare | | | | |
| Project, | | | | |
| Refunding, Series D-1, 6.50%, 12/01/19 | $ | 1,215,000 | $ | 1,448,936 |
| Refunding, Series D-1, 6.75%, 12/01/22 | | 1,000,000 | | 1,181,030 |
| Series D-2, 6.75%, 12/01/30 | | 5,000,000 | | 5,712,800 |
| Brevard County Health Facilities Authority Health Care Facilities Revenue, Health First Inc. | | | | |
| Project, | | | | |
| 7.00%, 4/01/39 | | 2,000,000 | | 2,336,840 |
| NATL Insured, 5.00%, 4/01/26 | | 5,000,000 | | 5,002,850 |
| Broward County Educational Facilities Authority Revenue, Educational Facilities, Nova | | | | |
| Southeastern University, Refunding, Series B, 5.60%, 4/01/29 | | 3,180,000 | | 3,218,860 |
| Broward County HFA, | | | | |
| MFHR, Stirling Apartments Phase II, Series A, 5.35%, 10/01/29 | | 990,000 | | 990,099 |
| MFHR, Stirling Apartments Phase II, Series A, 5.40%, 4/01/39 | | 1,980,000 | | 1,980,020 |
| SFMR, Refunding, Series B, FHA Insured, zero cpn., 4/01/29 | | 145,000 | | 44,788 |
| Broward County HFAR, Series D, GNMA Secured, 7.375%, 6/01/21 | | 40,000 | | 40,052 |
| Broward County School Board COP, Series A, AGMC Insured, 5.00%, 7/01/26 | | 21,500,000 | | 21,645,770 |
| Broward County Water and Sewer Utility Revenue, Series A, 5.25%, 10/01/34 | | 2,200,000 | | 2,451,548 |
| Celebration CDD Special Assessment, Series A, NATL Insured, 5.50%, 5/01/18 | | 975,000 | | 978,725 |
| Citizens Property Insurance Corp. Revenue, High-Risk Account, senior secured, Series A-1, | | | | |
| 6.00%, 6/01/17 | | 5,000,000 | | 5,867,500 |
| Citrus County Hospital Board Revenue, Citrus Memorial Hospital, Refunding, 6.25%, | | | | |
| 8/15/23 | | 7,735,000 | | 7,623,075 |
| Clearwater Water and Sewer Revenue, Series A, 5.25%, 12/01/39 | | 2,000,000 | | 2,238,260 |
| Collier County IDA Health Care Facilities Revenue, NCH Healthcare System Project, 6.25%, | | | | |
| 10/01/39 | | 5,000,000 | | 5,586,450 |
| Crossing at Fleming Island CDD Special Assessment Revenue, Refunding, Series B, | | | | |
| NATL Insured, 5.80%, 5/01/16 | | 5,060,000 | | 5,071,334 |
| Dade County Aviation Revenue, Miami International Airport, Series C, AGMC Insured, | | | | |
| 5.125%, 10/01/27 | | 9,550,000 | | 9,562,224 |
| Duval County School Board COP, Master Lease Program, Series A, Assured Guaranty, 5.25%, | | | | |
| 7/01/35 | | 10,000,000 | | 10,857,200 |
| Enterprise CDD Water and Sewer Revenue, NATL Insured, 5.50%, 5/01/26 | | 3,000,000 | | 3,011,280 |
| Escambia County Health Facilities Authority Health Facility Revenue, Baptist Hospital Inc. | | | | |
| Project, | | | | |
| Refunding, Series A, 5.75%, 8/15/29 | | 7,195,000 | | 7,608,425 |
| Series A, 6.00%, 8/15/36 | | 11,000,000 | | 11,594,880 |
| Escambia County HFA Dormitory Revenue, University of West Florida Foundation Inc. Project, | | | | |
| Refunding, NATL Insured, 5.00%, 6/01/31 | | 6,580,000 | | 6,631,587 |
| Florida HFAR, | | | | |
| Homeowner Mortgage, Series 1, NATL Insured, 5.625%, 7/01/17 | | 1,010,000 | | 1,011,535 |
| Reserve at Kanapaha, Series G, AMBAC Insured, 5.70%, 7/01/37 | | 5,000,000 | | 4,963,100 |
| Reserve at Northshore, Series H, AMBAC Insured, 5.70%, 5/01/37 | | 2,000,000 | | 1,980,060 |
| Florida HFC Revenue, | | | | |
| Brenwood Trace Apartments, Series E-1, AGMC Insured, 5.80%, 12/01/38 | | 4,385,000 | | 4,387,499 |
| Deer Meadows Apartments, Series R, FNMA Insured, 6.00%, 5/01/32 | | 3,415,000 | | 3,418,722 |
| Homeowner Mortgage, Series 4, GNMA Secured, 6.375%, 7/01/38 | | 2,625,000 | | 2,825,708 |
| Housing-Waverly Apartments, Series C-1, AGMC Insured, 6.50%, 7/01/40 | | 3,000,000 | | 3,015,060 |
Annual Report | 99
| | | | |
| Franklin Tax-Free Trust | | | | |
| |
| Statement of Investments, February 29, 2012 (continued) | | | | |
| |
| |
| Franklin Florida Tax-Free Income Fund | | Principal Amount | | Value |
| Municipal Bonds (continued) | | | | |
| Florida (continued) | | | | |
| Florida Higher Educational Facilities Financing Authority Revenue, | | | | |
| Bethune Cookman University, Refunding, 5.375%, 7/01/32 | $ | 3,500,000 | $ | 3,793,790 |
| Nova Southeastern University, 6.375%, 4/01/31 | | 2,750,000 | | 2,987,435 |
| Rollins College Project, 5.00%, 12/01/37 | | 10,000,000 | | 10,723,200 |
| Florida State Board of Education Capital Outlay GO, Public Education, | | | | |
| Refunding, Series D, 6.00%, 6/01/23 | | 15,000,000 | | 20,557,800 |
| Series G, NATL RE, FGIC Insured, Pre-Refunded, 5.00%, 6/01/31 | | 5,000,000 | | 5,108,250 |
| Florida State Board of Education GO, | | | | |
| Series A, 5.50%, 6/01/38 | | 10,000,000 | | 11,421,700 |
| Series F, NATL Insured, 5.00%, 6/01/28 | | 14,405,000 | | 14,716,868 |
| Florida State Board of Education Lottery Revenue, Series A, NATL RE, FGIC Insured, 5.00%, | | | | |
| 7/01/20 | | 6,000,000 | | 6,148,260 |
| Florida State Department of Environmental Protection Preservation Revenue, Florida Forever, | | | | |
| Series A, NATL Insured, Pre-Refunded, 5.00%, 7/01/21 | | 4,000,000 | | 4,102,160 |
| Florida State Governmental Utility Authority Utility Revenue, Lehigh Utility System, Refunding, | | | | |
| 5.25%, 10/01/40 | | 5,000,000 | | 5,406,050 |
| Florida State Mid-Bay Bridge Authority Revenue, | | | | |
| Exchangeable, Series D, ETM, 6.10%, 10/01/22 | | 3,545,000 | | 4,707,795 |
| Series A, AMBAC Insured, Pre-Refunded, zero cpn., 10/01/25 | | 9,845,000 | | 6,086,277 |
| Series A, AMBAC Insured, Pre-Refunded, zero cpn., 10/01/26 | | 2,500,000 | | 1,463,900 |
| Series A, ETM, 6.875%, 10/01/22 | | 6,000,000 | | 8,294,280 |
| Florida State Municipal Loan Council Revenue, Series D, AGMC Insured, 5.50%, | | | | |
| 10/01/41 | | 3,750,000 | | 4,180,950 |
| Florida State Municipal Power Agency Revenue, | | | | |
| All-Requirements Power Supply Project, Series A, 5.00%, 10/01/31 | | 6,000,000 | | 6,531,540 |
| All-Requirements Power Supply Project, Series A, 6.25%, 10/01/31 | | 2,000,000 | | 2,351,380 |
| Stanton II Project, Refunding, AMBAC Insured, 5.00%, 10/01/26 | | 5,000,000 | | 5,073,900 |
| Stanton Project, Refunding, 5.50%, 10/01/19 | | 1,000,000 | | 1,215,000 |
| Florida State Turnpike Authority Turnpike Revenue, Department of Transportation, Refunding, | | | | |
| Series A, 5.00%, 7/01/35 | | 5,000,000 | | 5,344,800 |
| Fort Lauderdale Water and Sewer Revenue, | | | | |
| 5.00%, 9/01/35 | | 24,090,000 | | 26,294,958 |
| NATL Insured, 5.00%, 9/01/31 | | 6,315,000 | | 6,781,300 |
| Fort Pierce Capital Improvement Revenue, Refunding, Series A, Assured Guaranty, 6.00%, | | | | |
| 9/01/32 | | 1,500,000 | | 1,715,055 |
| Fort Pierce Utilities Authority Revenue, | | | | |
| AMBAC Insured, 5.00%, 10/01/27 | | 7,000,000 | | 7,012,460 |
| Capital Appreciation, Series B, AMBAC Insured, zero cpn., 10/01/20 | | 3,090,000 | | 2,287,280 |
| Capital Appreciation, Series B, AMBAC Insured, zero cpn., 10/01/21 | | 2,585,000 | | 1,854,453 |
| Capital Appreciation, Series B, AMBAC Insured, zero cpn., 10/01/22 | | 3,090,000 | | 2,132,285 |
| Capital Appreciation, Series B, AMBAC Insured, zero cpn., 10/01/23 | | 3,060,000 | | 2,024,894 |
| Capital Appreciation, Series B, AMBAC Insured, zero cpn., 10/01/24 | | 2,560,000 | | 1,644,774 |
| Greater Orlando Aviation Authority Orlando Airport Facilities Revenue, | | | | |
| Refunding, Series C, 5.00%, 10/01/39 | | 4,250,000 | | 4,496,713 |
| Series A, 5.00%, 10/01/39 | | 5,000,000 | | 5,322,350 |
| Halifax Hospital Medical Center Hospital Revenue, | | | | |
| Refunding and Improvement, Series A, 5.00%, 6/01/38 | | 11,395,000 | | 11,445,936 |
| Series B-1, AGMC Insured, 5.50%, 6/01/38 | | 10,000,000 | | 10,571,400 |
100 | Annual Report
| | | | |
| Franklin Tax-Free Trust | | | | |
| |
| Statement of Investments, February 29, 2012 (continued) | | | | |
| |
| |
| Franklin Florida Tax-Free Income Fund | | Principal Amount | | Value |
| Municipal Bonds (continued) | | | | |
| Florida (continued) | | | | |
| Hernando County School Board COP, NATL Insured, 5.00%, 7/01/35 | $ | 10,000,000 | $ | 10,233,100 |
| Hialeah Housing Authority Revenue, Affordable Housing Program, Refunding, GNMA Secured, | | | | |
| 5.30%, 12/20/18 | | 935,000 | | 944,930 |
| Hillsborough County Assessment Revenue, Capacity Assessment Special, AGMC Insured, | | | | |
| 5.125%, 3/01/20 | | 1,000,000 | | 1,001,510 |
| Hillsborough County Aviation Authority Revenue, Series B, Assured Guaranty, 5.00%, | | | | |
| 10/01/33 | | 5,465,000 | | 5,882,581 |
| 10/01/38 | | 6,725,000 | | 7,114,108 |
| Hillsborough County IDA, PCR, Tampa Electric Co. Project, | | | | |
| Refunding, 5.50%, 10/01/23 | | 16,000,000 | | 16,304,800 |
| Series A, 5.65%, 5/15/18 | | 6,500,000 | | 7,612,150 |
| Hillsborough County IDAR, Tampa General Hospital Project, Refunding, Series B, 5.40%, | | | | |
| 10/01/28 | | 7,000,000 | | 7,221,060 |
| Hillsborough County School Board COP, Master Lease Program, Series B, NATL Insured, | | | | |
| 5.00%, 7/01/29 | | 10,000,000 | | 10,199,500 |
| Jacksonville Capital Improvement Revenue, | | | | |
| Refunding, Series C, AMBAC Insured, 5.00%, 10/01/25 | | 3,460,000 | | 3,517,920 |
| Series A, AMBAC Insured, 5.00%, 10/01/30 | | 10,000,000 | | 10,085,700 |
| Jacksonville Guaranteed Entitlement Revenue, Refunding and Improvement, NATL RE, | | | | |
| FGIC Insured, 5.00%, 10/01/32 | | 17,250,000 | | 17,401,800 |
| Jacksonville Transportation Revenue, NATL Insured, | | | | |
| 5.25%, 10/01/29 | | 17,955,000 | | 17,996,117 |
| 5.00%, 10/01/31 | | 25,000,000 | | 25,052,000 |
| Kissimmee Water and Sewer Revenue, AMBAC Insured, ETM, 6.00%, 10/01/15 | | 5,000,000 | | 5,019,650 |
| Lake County School Board COP, Series A, AMBAC Insured, 5.00%, 6/01/30 | | 5,000,000 | | 5,153,250 |
| Lakeland Electric and Water Revenue, Capital Appreciation, ETM, zero cpn., 10/01/14 | | 5,770,000 | | 5,675,949 |
| Lakeland Hospital System Revenue, Lakeland Regional Health System, Pre-Refunded, | | | | |
| 5.75%, 11/15/27 | | 6,925,000 | | 7,239,672 |
| 5.50%, 11/15/32 | | 12,070,000 | | 12,597,580 |
| Leesburg Hospital Revenue, Leesburg Regional Medical Center Project, 5.50%, 7/01/32 | | 4,150,000 | | 4,155,146 |
| Marion County Utility System Revenue, | | | | |
| NATL RE, FGIC Insured, 5.00%, 12/01/31 | | 2,765,000 | | 2,801,692 |
| Series A, NATL Insured, 5.00%, 12/01/28 | | 5,000,000 | | 5,187,800 |
| Martin County Health Facilities Authority Revenue, Martin Memorial Medical Center, 5.50%, | | | | |
| 11/15/42 | | 2,100,000 | | 2,168,313 |
| Melbourne Water and Sewer Improvement Revenue, Capital Appreciation, FGIC Insured, ETM, | | | | |
| zero cpn., 10/01/26 | | 1,500,000 | | 980,355 |
| Melbourne Water and Sewer Revenue, Capital Appreciation, Refunding, Series B, NATL RE, | | | | |
| FGIC Insured, zero cpn., | | | | |
| 10/01/22 | | 1,785,000 | | 1,150,254 |
| 10/01/26 | | 4,500,000 | | 2,319,480 |
| Miami Beach Water and Sewer Revenue, AMBAC Insured, 5.00%, 9/01/30 | | 7,000,000 | | 7,043,190 |
| Miami Parking System Revenue, Refunding, Assured Guaranty, 5.00%, 10/01/39 | | 4,000,000 | | 4,326,840 |
| Miami Special Obligation, Marlins Stadium Project, Series A, AGMC Insured, 5.25%, | | | | |
| 7/01/35 | | 5,000,000 | | 5,379,750 |
| Miami Special Obligation Revenue, 5.625%, 1/01/39 | | 15,000,000 | | 16,099,200 |
Annual Report | 101

102 | Annual Report

Annual Report | 103
| | | | |
| Franklin Tax-Free Trust | | | | |
| |
| Statement of Investments, February 29, 2012 (continued) | | | | |
| |
| |
| Franklin Florida Tax-Free Income Fund | | Principal Amount | | Value |
| Municipal Bonds (continued) | | | | |
| Florida (continued) | | | | |
| Viera East CDD Special Assessment, | | | | |
| Refunding, 7.00%, 5/01/26 | $ | 5,830,000 | $ | 6,003,326 |
| Series B, ETM, 6.75%, 5/01/14 | | 2,345,000 | | 2,506,899 |
| Village Center CDD Recreational Revenue, Series A, NATL Insured, 5.20%, 11/01/25 | | 10,000,000 | | 10,110,000 |
| Volusia County Tourist Development Tax Revenue, FSA Insured, 5.00%, 12/01/34 | | 11,000,000 | | 11,241,890 |
| West Lake CDD Special Assessment, NATL Insured, 5.75%, 5/01/17 | | 1,035,000 | | 1,035,797 |
| West Palm Beach CRDA Revenue, Northwood Pleasant Community Redevelopment, 5.00%, | | | | |
| 3/01/35 | | 1,000,000 | | 1,013,330 |
| Winter Park Water and Sewer Revenue, Improvement, Refunding, 5.00%, 12/01/34 | | 2,000,000 | | 2,208,880 |
| | | | | 985,786,267 |
| U.S. Territories 12.2% | | | | |
| Puerto Rico 11.3% | | | | |
| Puerto Rico Commonwealth Aqueduct and Sewer Authority Revenue, senior lien, Series A, | | | | |
| 6.00%, 7/01/44 | | 2,100,000 | | 2,263,128 |
| Puerto Rico Commonwealth GO, Public Improvement, | | | | |
| Refunding, Series B, 6.00%, 7/01/39 | | 15,000,000 | | 16,399,050 |
| Series A, 5.00%, 7/01/29 | | 7,500,000 | | 7,649,325 |
| Series A, 5.00%, 7/01/33 | | 5,000,000 | | 5,044,850 |
| Puerto Rico Commonwealth Highway and Transportation Authority Transportation Revenue, | | | | |
| Refunding, Series A, NATL Insured, 5.00%, 7/01/38 | | 255,000 | | 255,059 |
| Series G, 5.00%, 7/01/33 | | 1,495,000 | | 1,508,410 |
| Series G, Pre-Refunded, 5.00%, 7/01/33 | | 5,000 | | 5,310 |
| Puerto Rico Commonwealth Infrastructure Financing Authority Special Tax Revenue, 5.00%, | | | | |
| 7/01/46 | | 6,690,000 | | 6,780,315 |
| Puerto Rico Electric Power Authority Power Revenue, Series XX, 5.25%, 7/01/40 | | 15,250,000 | | 15,970,867 |
| Puerto Rico Industrial Tourist Educational Medical and Environmental Control Facilities | | | | |
| Revenue, Cogeneration Facility, AES Puerto Rico Project, 6.625%, 6/01/26 | | 5,900,000 | | 5,901,003 |
| Puerto Rico PBA Guaranteed Revenue, Government Facilities, | | | | |
| Refunding, Series D, 5.375%, 7/01/33 | | 1,210,000 | | 1,215,578 |
| Series I, 5.00%, 7/01/36 | | 5,000,000 | | 5,063,050 |
| Puerto Rico Public Finance Corp. Revenue, Commonwealth Appropriation, Refunding, | | | | |
| Series B, 5.50%, 8/01/31 | | 5,000,000 | | 5,359,950 |
| Puerto Rico Sales Tax FICO Sales Tax Revenue, | | | | |
| first sub., Series A, 6.00%, 8/01/42 | | 8,000,000 | | 9,054,800 |
| first sub., Series A-1, 5.25%, 8/01/43 | | 22,225,000 | | 24,057,896 |
| first sub., Series C, 5.50%, 8/01/40 | | 15,000,000 | | 16,423,950 |
| Refunding, Series C, 5.00%, 8/01/46 | | 6,250,000 | | 6,720,500 |
| | | | | 129,673,041 |
| U.S. Virgin Islands 0.9% | | | | |
| Virgin Islands PFAR, Gross Receipts Taxes Loan Note, Radian Insured, 5.00%, 10/01/33 | | 10,000,000 | | 10,170,900 |
| |
| Total U.S. Territories | | | | 139,843,941 |
| Total Municipal Bonds before Short Term Investments | | | | |
| (Cost $1,049,819,669) | | | | 1,125,630,208 |
104 | Annual Report
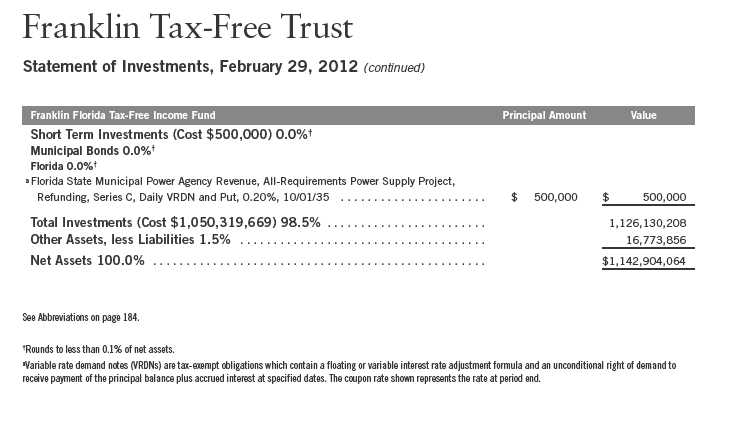
Annual Report | The accompanying notes are an integral part of these financial statements. | 105
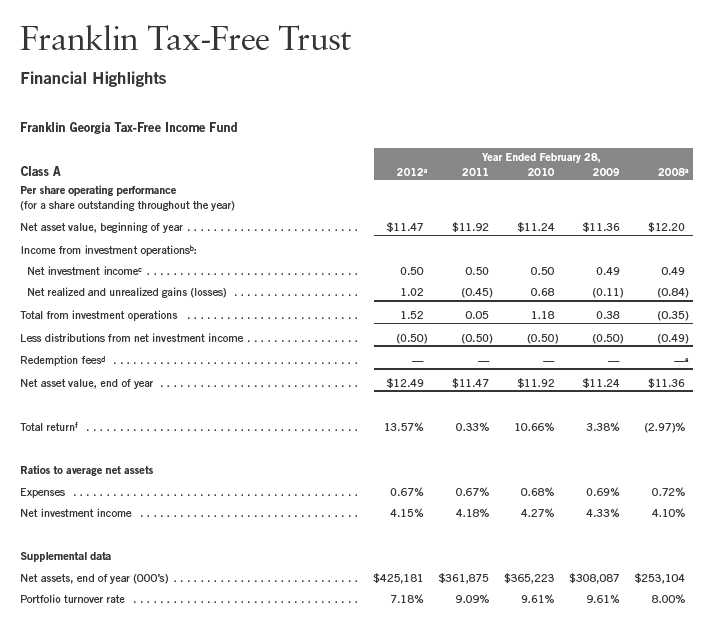
aFor the year ended February 29.
bThe amount shown for a share outstanding throughout the period may not correlate with the Statement of Operations for the period due to the timing of sales and repurchases of
the Fund shares in relation to income earned and/or fluctuating market value of the investments of the Fund.
cBased on average daily shares outstanding.
dEffective September 1, 2008, the redemption fee was eliminated.
eAmount rounds to less than $0.01 per share.
fTotal return does not reflect sales commissions or contingent deferred sales charges, if applicable.
106 | The accompanying notes are an integral part of these financial statements. | Annual Report

aFor the year ended February 29.
bThe amount shown for a share outstanding throughout the period may not correlate with the Statement of Operations for the period due to the timing of sales and repurchases of
the Fund shares in relation to income earned and/or fluctuating market value of the investments of the Fund.
cBased on average daily shares outstanding.
dEffective September 1, 2008, the redemption fee was eliminated.
eAmount rounds to less than $0.01 per share.
fTotal return does not reflect sales commissions or contingent deferred sales charges, if applicable.
Annual Report | The accompanying notes are an integral part of these financial statements. | 107
| | | | |
| Franklin Tax-Free Trust | | | | |
| |
| Statement of Investments, February 29, 2012 | | | | |
| |
| |
| Franklin Georgia Tax-Free Income Fund | | Principal Amount | | Value |
| Municipal Bonds 92.1% | | | | |
| Georgia 85.0% | | | | |
| Athens-Clarke County Unified Government Development Authority Revenue, 5.00%, 6/01/32 | $ | 1,080,000 | $ | 1,236,341 |
| Athens-Clarke County Unified Government Water and Sewer Revenue, | | | | |
| 5.625%, 1/01/33 | | 10,000,000 | | 11,344,100 |
| 5.50%, 1/01/38 | | 5,000,000 | | 5,560,300 |
| Atlanta Airport Passenger Facility Charge Revenue, General, sub. lien, | | | | |
| Refunding, Series C, AGMC Insured, 5.00%, 1/01/33 | | 5,000,000 | | 5,179,200 |
| Series J, AGMC Insured, 5.00%, 1/01/34 | | 5,000,000 | | 5,203,750 |
| Atlanta Airport Revenue, General, | | | | |
| Refunding, Series C, 6.00%, 1/01/30 | | 6,000,000 | | 7,266,720 |
| Series A, 5.00%, 1/01/40 | | 9,000,000 | | 9,561,600 |
| Atlanta Development Authority Educational Facilities Revenue, Science Park LLC Project, | | | | |
| 5.00%, 7/01/32 | | 3,000,000 | | 3,188,190 |
| Atlanta Development Authority Revenue, Tuff Yamacraw LLC Project, Refunding, Series A, | | | | |
| AMBAC Insured, 5.00%, 1/01/26 | | 2,555,000 | | 2,809,836 |
| Atlanta GO, Refunding, Assured Guaranty, 5.25%, 12/01/23 | | 2,000,000 | | 2,357,000 |
| Atlanta Public Safety and Judicial Facilities Authority Revenue, Public Safety Facility Project, | | | | |
| AGMC Insured, 5.00%, 12/01/26 | | 1,140,000 | | 1,257,990 |
| Atlanta Tax Allocation, Atlantic State Project, Refunding, Assured Guaranty, 5.00%, | | | | |
| 12/01/23 | | 1,000,000 | | 1,072,490 |
| Atlanta Water and Wastewater Revenue, | | | | |
| Refunding, Series A, 6.00%, 11/01/28 | | 5,055,000 | | 5,986,434 |
| Refunding, Series A, NATL Insured, 5.00%, 11/01/33 | | 5,000,000 | | 5,011,200 |
| Series A, AGMC Insured, 5.50%, 11/01/27 | | 5,000,000 | | 5,992,600 |
| Augusta Water and Sewer Revenue, | | | | |
| AGMC Insured, 5.25%, 10/01/39 | | 3,000,000 | | 3,241,650 |
| Refunding, AGMC Insured, 5.00%, 10/01/32 | | 5,000,000 | | 5,095,250 |
| Baldwin County Hospital Authority Revenue, Oconee Regional Medical Center, | | | | |
| 5.25%, 12/01/22 | | 2,500,000 | | 2,315,525 |
| 5.375%, 12/01/28 | | 2,000,000 | | 1,753,760 |
| Bartow County Development Authority PCR, Georgia Power Co., First Series, 5.10%, 6/01/23 | | 5,000,000 | | 5,198,900 |
| Bartow-Catersville Joint Development Authority Revenue, GHC Student Center LLC Project, | | | | |
| AGMC Insured, 5.00%, 6/15/36 | | 4,155,000 | | 4,514,449 |
| Bleckley-Dodge County Joint Development Authority Student Housing Facilities Revenue, | | | | |
| MGC Real Estate Foundation II LLC Project, 5.00%, 7/01/33 | | 3,500,000 | | 3,687,635 |
| Brunswick and Glynn County Joint Water and Sewer Commission Revenue, Refunding, Series C, | | | | |
| AGMC Insured, 5.00%, 6/01/33 | | 2,045,000 | | 2,229,173 |
| Bulloch County Development Authority Lease Revenue, Georgia Southern University, | | | | |
| XLCA Insured, 5.00%, 8/01/27 | | 5,000,000 | | 5,152,750 |
| Bulloch County Development Authority Student Housing Revenue, Georgia Southern University | | | | |
| Housing Foundation Five LLC Project, AGMC Insured, 5.00%, 7/01/36 | | 2,055,000 | | 2,196,980 |
| Burke County Development Authority PCR, Oglethorpe Power Corp., Vogtle Project, | | | | |
| Series B, 5.50%, 1/01/33 | | 5,000,000 | | 5,316,400 |
| Series E, 7.00%, 1/01/23 | | 5,000,000 | | 5,954,850 |
| Camden County Public Service Authority Revenue, St. Mary’s Project, Refunding, 4.50%, | | | | |
| 12/01/31 | | 1,200,000 | | 1,306,596 |
| 12/01/32 | | 1,000,000 | | 1,081,730 |
108 | Annual Report
| | | | |
| Franklin Tax-Free Trust | | | | |
| |
| Statement of Investments, February 29, 2012 (continued) | | | | |
| |
| |
| Franklin Georgia Tax-Free Income Fund | | Principal Amount | | Value |
| Municipal Bonds (continued) | | | | |
| Georgia (continued) | | | | |
| Carroll City-County Hospital Authority Revenue, Anticipation Certificates, Tanner Medical Center | | | | |
| Inc. Project, | | | | |
| 5.00%, 7/01/40 | $ | 5,000,000 | $ | 5,325,200 |
| Assured Guaranty, 5.00%, 7/01/38 | | 5,000,000 | | 5,311,050 |
| Cherokee County Water and Sewer Authority Revenue, | | | | |
| AGMC Insured, 5.00%, 8/01/35 | | 3,000,000 | | 3,306,780 |
| NATL Insured, 6.90%, 8/01/18 | | 10,000 | | 10,048 |
| Clayton County Development Authority Revenue, Refunding, Series A, NATL Insured, 5.00%, | | | | |
| 8/01/23 | | 2,310,000 | | 2,552,273 |
| Clayton County Development Authority Student Housing Revenue, CSU Foundation Real Estate II | | | | |
| LLC Project, AGMC Insured, 5.00%, 7/01/36 | | 3,000,000 | | 3,226,530 |
| Clayton County Hospital Authority Revenue, Anticipation Certificates, Southern Regional Medical | | | | |
| Center, Refunding, Series A, | | | | |
| 5.00%, 8/01/30 | | 2,000,000 | | 2,181,760 |
| 5.25%, 8/01/35 | | 1,000,000 | | 1,088,450 |
| Clayton County MFHR, Pointe Clear Apartments Project, AGMC Insured, 5.70%, 7/01/23 | | 930,000 | | 930,837 |
| Cobb County Development Authority University Facilities Revenue, Kennesaw State University | | | | |
| Foundations Project, Series D, NATL Insured, 5.00%, 7/15/29 | | 5,000,000 | | 5,052,900 |
| Columbia County Water and Sewerage Revenue, | | | | |
| AGMC Insured, Pre-Refunded, 5.00%, 6/01/24 | | 1,010,000 | | 1,114,878 |
| Refunding, 4.50%, 6/01/33 | | 4,015,000 | | 4,365,951 |
| Refunding, AGMC Insured, 5.00%, 6/01/24 | | 120,000 | | 127,650 |
| Columbus Water and Sewer Revenue, AGMC Insured, 5.00%, 5/01/29 | | 2,500,000 | | 2,707,100 |
| Coweta County Development Authority Revenue, Piedmont Healthcare Project, 5.00%, | | | | |
| 6/15/40 | | 5,000,000 | | 5,237,750 |
| Dahlonega Water and Wastewater Revenue, Series A, Assured Guaranty, | | | | |
| 5.25%, 9/01/30 | | 1,750,000 | | 1,903,090 |
| 5.50%, 9/01/37 | | 5,000,000 | | 5,433,800 |
| Decatur County School Building Authority Revenue, High School Project, AGMC Insured, 5.00%, | | | | |
| 10/01/32 | | 1,500,000 | | 1,612,185 |
| DeKalb County Public Safety and Judicial Facilities Authority Revenue, Public Safety and | | | | |
| Judicial Facility Project, 5.00%, 12/01/29 | | 2,000,000 | | 2,095,740 |
| DeKalb County School District COP, Georgia School Boards Assn. Inc., AMBAC Insured, 5.00%, | | | | |
| 12/01/27 | | 4,285,000 | | 4,662,723 |
| DeKalb County Water and Sewer Revenue, | | | | |
| Refunding, Series B, AGMC Insured, 5.00%, 10/01/35 | | 4,000,000 | | 4,606,000 |
| Series A, 5.25%, 10/01/41 | | 11,425,000 | | 12,733,962 |
| DeKalb Newton and Gwinnett Counties Joint Development Authority Revenue, Georgia Gwinnett | | | | |
| College Student Centre LLC Project, 5.50%, 7/01/34 | | 3,000,000 | | 3,156,510 |
| DeKalb Private Hospital Authority Revenue Anticipation Certificates, Children’s Healthcare, | | | | |
| Refunding, 5.25%, 11/15/39 | | 5,000,000 | | 5,417,000 |
| Douglasville-Douglas County Water and Sewer Authority Revenue, NATL Insured, 5.00%, | | | | |
| 6/01/29 | | 3,410,000 | | 3,649,348 |
| 6/01/32 | | 2,225,000 | | 2,406,604 |
| East Point Building Authority Revenue, Water and Sewer Project, Series A, XLCA Insured, | | | | |
| 5.00%, 2/01/34 | | 5,480,000 | | 5,113,498 |
Annual Report | 109
| | | | |
| Franklin Tax-Free Trust | | | | |
| |
| Statement of Investments, February 29, 2012 (continued) | | | | |
| |
| |
| Franklin Georgia Tax-Free Income Fund | | Principal Amount | | Value |
| Municipal Bonds (continued) | | | | |
| Georgia (continued) | | | | |
| Fairburn GO, AGMC Insured, 5.75%, 12/01/31 | $ | 2,000,000 | $ | 2,264,360 |
| Fayette County School District GO, AGMC Insured, | | | | |
| 4.75%, 3/01/21 | | 1,355,000 | | 1,501,015 |
| 4.95%, 3/01/25 | | 1,000,000 | | 1,094,450 |
| Forsyth County Water and Sewerage Authority Revenue, AGMC Insured, 5.00%, 4/01/32 | | 5,000,000 | | 5,526,650 |
| Fulton County Development Authority Revenue, | | | | |
| AMC Campus Project I LLC Project, AGMC Insured, 5.00%, 6/15/37 | | 3,075,000 | | 3,293,971 |
| Georgia Tech Facilities Inc. Project, Refunding, Series A, 5.00%, 6/01/34 | | 4,000,000 | | 4,348,560 |
| Georgia Tech Facilities Inc. Project, Series A, 5.00%, 6/01/41 | | 3,500,000 | | 3,846,465 |
| Georgia Tech Foundation Funding, Technology Square Project, Series A, 5.00%, 11/01/31 | | 3,000,000 | | 3,008,340 |
| Georgia Tech Foundation Inc., Series A, 5.00%, 11/01/27 | | 1,060,000 | | 1,222,021 |
| Georgia Tech Foundation Inc., Series A, 5.00%, 11/01/28 | | 1,200,000 | | 1,375,392 |
| Molecular Science Building Project, NATL Insured, 5.00%, 5/01/25 | | 2,240,000 | | 2,349,514 |
| Morehouse College Project, Refunding, AMBAC Insured, 5.00%, 12/01/27 | | 5,000,000 | | 5,362,450 |
| Piedmont Healthcare, Refunding, Series A, 5.25%, 6/15/37 | | 5,000,000 | | 5,374,600 |
| Fulton County Water and Sewer Revenue, NATL RE, FGIC Insured, 5.00%, 1/01/30 | | 2,500,000 | | 2,659,925 |
| Gainesville and Hall County Hospital Authority Revenue, Anticipation Certificates, Northeast | | | | |
| Georgia Healthcare Project, Series A, 5.375%, 2/15/40 | | 5,000,000 | | 5,248,500 |
| Georgia Municipal Assn. Inc. COP, City Court Atlanta Project, AMBAC Insured, 5.25%, | | | | |
| 12/01/26 | | 2,000,000 | | 2,025,520 |
| Georgia Municipal Electric Authority Power Revenue, Series W, | | | | |
| 6.60%, 1/01/18 | | 955,000 | | 1,085,491 |
| ETM, 6.60%, 1/01/18 | | 45,000 | | 48,480 |
| Georgia Private Colleges and Universities Authority Student Housing Revenue, Mercer Housing | | | | |
| Corp. Project, Series A, 6.00%, 6/01/24 | | 2,550,000 | | 2,554,029 |
| Georgia School Board Assn. Inc. COP, DeKalb County Public School Project, NATL Insured, | | | | |
| 5.00%, 12/01/25 | | 2,600,000 | | 2,713,178 |
| Georgia State GO, | | | | |
| Series B, 5.00%, 7/01/28 | | 3,225,000 | | 3,746,902 |
| Series I, 4.00%, 11/01/27 | | 8,000,000 | | 8,958,000 |
| Georgia State HFAR, SFM, | | | | |
| Series A, 5.375%, 6/01/39 | | 1,615,000 | | 1,656,974 |
| Series C, 5.00%, 12/01/27 | | 1,000,000 | | 1,035,290 |
| Georgia State Higher Education Facilities Authority Revenue, USG Real Estate Foundation I LLC | | | | |
| Project, | | | | |
| 6.00%, 6/15/34 | | 5,000,000 | | 5,506,250 |
| Assured Guaranty, 5.625%, 6/15/38 | | 3,000,000 | | 3,211,350 |
| Glynn-Brunswick Memorial Hospital Authority Revenue, Anticipation Certificates, Southeast | | | | |
| Georgia Health System Project, Series A, 5.625%, 8/01/34 | | 5,000,000 | | 5,376,000 |
| Gwinnett County Development Authority COP, Gwinnett County Public Schools Project, | | | | |
| NATL Insured, Pre-Refunded, 5.00%, 1/01/24 | | 8,500,000 | | 9,223,775 |
| Refunding, NATL Insured, 5.25%, 1/01/22 | | 3,000,000 | | 3,750,060 |
| Refunding, NATL Insured, 5.25%, 1/01/24 | | 2,000,000 | | 2,534,040 |
| Gwinnett County Hospital Authority Revenue, Anticipation Certificates, Gwinnett Hospital System | | | | |
| Inc. Project, Series D, AGMC Insured, 5.50%, 7/01/37 | | 4,000,000 | | 4,316,760 |
| Gwinnett County School District GO, | | | | |
| 5.00%, 2/01/32 | | 4,125,000 | | 4,618,102 |
| 5.00%, 2/01/36 | | 5,815,000 | | 6,397,023 |
| Pre-Refunded, 5.00%, 2/01/32 | | 875,000 | | 1,080,870 |
| |
| 110 | Annual Report | | | | |
| | | | |
| Franklin Tax-Free Trust | | | | |
| |
| Statement of Investments, February 29, 2012 (continued) | | | | |
| |
| |
| Franklin Georgia Tax-Free Income Fund | | Principal Amount | | Value |
| Municipal Bonds (continued) | | | | |
| Georgia (continued) | | | | |
| Gwinnett County Water and Sewerage Authority Revenue, Pre-Refunded, 5.25%, 8/01/25 | $ | 2,795,000 | $ | 2,853,108 |
| Habersham County Hospital Authority Revenue, Anticipation Certificates, XLCA Insured, 5.00%, | | | | |
| 12/01/27 | | 2,015,000 | | 2,079,722 |
| Habersham County School District GO, NATL Insured, 5.00%, 4/01/28 | | 2,750,000 | | 2,998,957 |
| Henry County Hospital Authority Revenue, Henry Medical Center Inc. Project, Refunding, | | | | |
| AMBAC Insured, 6.00%, 7/01/29 | | 5,000,000 | | 5,050,000 |
| Hogansville Combined Public Utility System Revenue, Refunding, AGMC Insured, 6.00%, | | | | |
| 10/01/23 | | 3,300,000 | | 4,310,163 |
| Jackson County School District GO, NATL Insured, 5.00%, 3/01/25 | | 3,000,000 | | 3,232,680 |
| LaGrange-Troup County Hospital Authority Revenue, Series A, 5.50%, 7/01/38 | | 4,000,000 | | 4,355,320 |
| Lincoln County School District GO, 5.50%, 4/01/37 | | 2,200,000 | | 2,500,036 |
| Macon-Bibb County Hospital Authority Revenue, Revenue Anticipation Certificates, The Medical | | | | |
| Center of Central Georgia Inc. Project, 5.00%, 8/01/35 | | 5,000,000 | | 5,284,750 |
| Main Street Natural Gas Inc. Gas Project Revenue, Series A, 5.50%, 9/15/27 | | 5,000,000 | | 5,554,300 |
| Medical Center Hospital Authority Revenue, Anticipation Certificates, Columbus Regional | | | | |
| Healthcare System, | | | | |
| Assured Guaranty, 6.375%, 8/01/29 | | 4,000,000 | | 4,600,200 |
| Refunding, AGMC Insured, 5.00%, 8/01/41 | | 5,000,000 | | 5,096,000 |
| Metropolitan Atlanta Rapid Transit Authority Sales Tax Revenue, Third Indenture, Refunding, | | | | |
| Series B, AGMC Insured, 5.00%, 7/01/37 | | 10,000,000 | 10,672,100 |
| Municipal Electric Authority Revenue, | | | | |
| General Resolution Projects, sub. note, Refunding, Series D, 5.50%, 1/01/26 | | 5,000,000 | | 5,761,400 |
| Project 1, sub. bond, Series E, NATL Insured, 5.00%, 1/01/25 | | 2,315,000 | | 2,515,826 |
| Newton County IDAR, Georgia Perimeter College Foundation Real Estate Newton, CIFG Insured, | | | | |
| 5.00%, 6/01/24 | | 3,150,000 | | 3,383,289 |
| Paulding County GO, Courthouse, NATL RE, FGIC Insured, 5.00%, 2/01/32 | | 4,000,000 | | 4,381,440 |
| Paulding County School District GO, 5.00%, 2/01/33 | | 4,000,000 | | 4,309,280 |
| Peach County Development Authority Student Housing Facilities Revenue, Fort Valley State | | | | |
| University Foundation Property LLC, AMBAC Insured, 5.00%, 6/01/34 | | 3,000,000 | | 3,108,630 |
| Private Colleges and Universities Authority Revenue, | | | | |
| Emory University, Refunding, 5.00%, 9/01/35 | | 10,000,000 | 11,119,800 |
| Mercer University Project, Refunding, Series A, 5.375%, 10/01/29 | | 2,000,000 | | 2,004,020 |
| Richmond County Development Authority Educational Facilities Revenue, Augusta State | | | | |
| University Jaguar Student Center, Series A, XLCA Insured, 5.00%, 7/01/29 | | 1,000,000 | | 1,044,380 |
| Richmond County Development Authority Solid Waste Disposal Revenue, International Paper Co. | | | | |
| Project, 5.80%, 12/01/20 | | 1,500,000 | | 1,501,665 |
| Rockdale County Water and Sewer Authority Revenue, AGMC Insured, 5.00%, 7/01/29 | | 4,000,000 | | 4,389,160 |
| Savannah EDA Revenue, Armstrong Center LLC Project, Series A, XLCA Insured, 5.00%, | | | | |
| 12/01/30 | | 1,500,000 | | 1,563,165 |
| South Fulton Municipal Regional Water and Sewer Authority Water Revenue, NATL Insured, | | | | |
| Pre-Refunded, 5.00%, 1/01/33 | | 3,500,000 | | 3,637,655 |
| Thomasville Hospital Authority Revenue, Anticipation Certificates, John D Archbold, | | | | |
| 5.25%, 11/01/35 | | 1,000,000 | | 1,059,840 |
| 5.375%, 11/01/40 | | 5,000,000 | | 5,317,850 |
| Upper Oconee Basin Water Authority Revenue, Refunding, NATL Insured, 5.00%, 7/01/26 | | 1,000,000 | | 1,081,520 |
| Valdosta and Lowndes County Hospital Authority Revenue, Certificates, South Georgia Medical | | | | |
| Center Project, | | | | |
| 5.00%, 10/01/33 | | 2,000,000 | | 2,073,660 |
| AMBAC Insured, Pre-Refunded, 5.25%, 10/01/27 | | 3,000,000 | | 3,117,090 |
| Series B, 5.00%, 10/01/41 | | 3,000,000 | | 3,221,730 |
| |
| | | Annual Report | 111 |
| | | | |
| Franklin Tax-Free Trust | | | | |
| |
| Statement of Investments, February 29, 2012 (continued) | | | | |
| |
| |
| Franklin Georgia Tax-Free Income Fund | | Principal Amount | | Value |
| Municipal Bonds (continued) | | | | |
| Georgia (continued) | | | | |
| Walton County Water and Sewer Authority Revenue, | | | | |
| Hard Labor Creek Project, AGMC Insured, 5.00%, 2/01/33 | $ | 5,000,000 | $ | 5,441,350 |
| Oconee, Hard Creek Resources Project, AGMC Insured, 5.00%, 2/01/38 | | 3,845,000 | | 4,141,680 |
| Ware County Hospital Authority Revenue, Anticipation Certificates, NATL Insured, 5.25%, | | | | |
| 3/01/25 | | 3,000,000 | | 3,019,200 |
| | | | | 471,498,289 |
| U.S. Territories 7.1% | | | | |
| Puerto Rico 7.1% | | | | |
| Puerto Rico Commonwealth GO, Public Improvement, Refunding, Series B, 6.00%, 7/01/39 | | 5,000,000 | | 5,466,350 |
| Puerto Rico Commonwealth Highway and Transportation Authority Transportation Revenue, | | | | |
| Refunding, Series L, NATL Insured, 5.25%, 7/01/35 | | 10,000,000 | | 10,626,700 |
| Puerto Rico Electric Power Authority Power Revenue, Series XX, 5.25%, 7/01/40 | | 5,000,000 | | 5,236,350 |
| Puerto Rico Sales Tax FICO Sales Tax Revenue, | | | | |
| first sub., Series A, 5.375%, 8/01/39 | | 10,000,000 | | 10,825,000 |
| first sub., Series C, 5.50%, 8/01/40 | | 5,000,000 | | 5,474,650 |
| Series C, 5.25%, 8/01/40 | | 1,430,000 | | 1,586,671 |
| | | | | 39,215,721 |
| Total Municipal Bonds before Short Term Investments (Cost $473,593,258) | | | | 510,714,010 |
| Short Term Investments 6.0% | | | | |
| Municipal Bonds 6.0% | | | | |
| Georgia 6.0% | | | | |
| aAthens-Clarke County Unified Government Development Authority Revenue, University of Georgia | | | | |
| Athletic Assn. Project, | | | | |
| Daily VRDN and Put, 0.24%, 8/01/33 | | 9,070,000 | | 9,070,000 |
| Series B, Daily VRDN and Put, 0.24%, 7/01/35 | | 24,460,000 | | 24,460,000 |
| Total Short Term Investments (Cost $33,530,000) | | | | 33,530,000 |
| Total Investments (Cost $507,123,258) 98.1% | | | | 544,244,010 |
| Other Assets, less Liabilities 1.9% | | | | 10,363,494 |
| Net Assets 100.0% | | | $ | 554,607,504 |
See Abbreviations on page 184.
aVariable rate demand notes (VRDNs) are tax-exempt obligations which contain a floating or variable interest rate adjustment formula and an unconditional right of demand to receive payment of the principal balance plus accrued interest at specified dates. The coupon rate shown represents the rate at period end.
112 | The accompanying notes are an integral part of these financial statements. | Annual Report
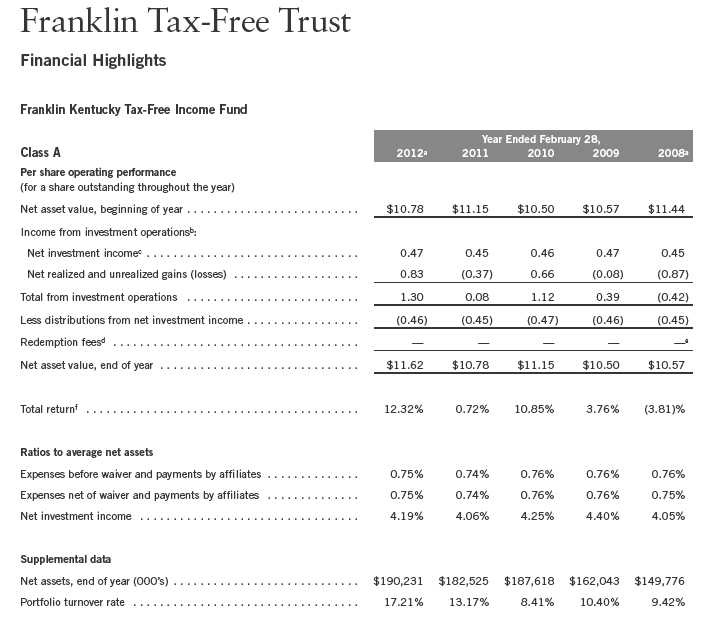
aFor the year ended February 29.
bThe amount shown for a share outstanding throughout the period may not correlate with the Statement of Operations for the period due to the timing of sales and repurchases of
the Fund shares in relation to income earned and/or fluctuating market value of the investments of the Fund.
cBased on average daily shares outstanding.
dEffective September 1, 2008, the redemption fee was eliminated.
eAmount rounds to less than $0.01 per share.
fTotal return does not reflect sales commissions or contingent deferred sales charges, if applicable.
Annual Report | The accompanying notes are an integral part of these financial statements. | 113
| | | | |
| Franklin Tax-Free Trust | | | | |
| |
| Statement of Investments, February 29, 2012 | | | | |
| |
| |
| Franklin Kentucky Tax-Free Income Fund | | Principal Amount | | Value |
| Municipal Bonds 95.2% | | | | |
| Kentucky 84.5% | | | | |
| Bellevue GO, Public Project, Harbor Greene Project, XLCA Insured, 5.00%, 2/01/34 | $ | 1,065,000 | $ | 1,100,134 |
| Boone County GO, Public Project, Pre-Refunded, 5.00%, | | | | |
| 4/01/20 | | 1,310,000 | | 1,314,585 |
| 4/01/21 | | 1,000,000 | | 1,003,500 |
| Boone County PCR, Collateralized, Dayton Power and Light Co., Refunding, Series A, | | | | |
| FGIC Insured, 4.70%, 1/01/28 | | 3,000,000 | | 3,087,150 |
| Bowling Green GO, Project, Series A, 5.00%, 6/01/38 | | 5,000,000 | | 5,451,950 |
| Boyle County Revenue, Refunding and College Improvement, CIFG Insured, 5.00%, 6/01/32 | | 1,500,000 | | 1,620,195 |
| Campbell and Kenton Counties Sanitation District No. 1 Sanitation District Revenue, | | | | |
| NATL Insured, 5.00%, 8/01/37 | | 2,500,000 | | 2,715,200 |
| Campbell County School District Finance Corp. School Building Revenue, AGMC Insured, | | | | |
| 5.00%, 8/01/26 | | 2,845,000 | | 3,110,069 |
| Christian County Hospital Revenue, Jennie Stuart Medical Center, Refunding, Assured Guaranty, | | | | |
| 5.50%, 2/01/36 | | 3,000,000 | | 3,205,230 |
| Florence GO, Public Project, Series A, NATL RE, FGIC Insured, Pre-Refunded, 5.00%, | | | | |
| 11/01/32 | | 1,000,000 | | 1,007,540 |
| Glasgow Healthcare Revenue, T.J. Samson Community Hospital, 6.45%, 2/01/41 | | 2,000,000 | | 2,134,920 |
| Greater Kentucky Housing Assistance Corp. Mortgage Revenue, Section 8 Assisted Projects, | | | | |
| Refunding, Series A, NATL Insured, 6.10%, 1/01/24 | | 285,000 | | 285,385 |
| Jefferson County School District Finance Corp. School Building Revenue, Series A, NATL Insured, | | | | |
| 4.75%, 6/01/27 | | 2,440,000 | | 2,651,646 |
| Kentucky Area Development Districts Financing Trust Lease Acquisition Program COP, Series L, | | | | |
| XLCA Insured, 5.00%, 11/01/29 | | 1,000,000 | | 1,075,900 |
| Kentucky Area Development Districts Financing Trust Lease Program Revenue, City of Ewing, | | | | |
| Series A, 6.00%, 6/01/30 | | 125,000 | | 125,982 |
| Series C, 6.00%, 6/01/30 | | 1,145,000 | | 1,147,737 |
| Series E, 5.70%, 6/01/22 | | 75,000 | | 75,491 |
| Kentucky Economic Development Finance Authority Health System Revenue, Norton | | | | |
| Healthcare Inc., | | | | |
| Refunding, Series C, NATL Insured, 6.15%, 10/01/24 | | 160,000 | | 168,269 |
| Series C, NATL Insured, Pre-Refunded, 6.15%, 10/01/24 | | 245,000 | | 269,490 |
| Series C, NATL Insured, Pre-Refunded, 6.15%, 10/01/25 | | 935,000 | | 1,028,463 |
| Kentucky Economic Development Finance Authority Hospital System Revenue, Appalachian | | | | |
| Regional Health Center Facility, Refunding and Improvement, 5.875%, 10/01/22 | | 2,000,000 | | 2,000,200 |
| Kentucky Economic Development Finance Authority Revenue, | | | | |
| Baptist Healthcare System Obligation Group, 5.25%, 8/15/46 | | 5,000,000 | | 5,325,400 |
| Catholic Health, Refunding, Series A, 5.00%, 5/01/29 | | 5,670,000 | | 6,144,239 |
| Kentucky Economic Finance Authority Louisville Arena Project Revenue, Louisville Arena, | | | | |
| Sub Series A-1, Assured Guaranty, 6.00%, 12/01/33 | | 2,000,000 | | 2,206,020 |
| Kentucky Housing Corp. Conduit MFHR, Collateral Mortgage Loan, Country Place Apartments, | | | | |
| GNMA Secured, | | | | |
| 5.00%, 4/20/40 | | 2,280,000 | | 2,342,677 |
| 5.25%, 4/20/45 | | 1,850,000 | | 1,925,572 |
| Kentucky Housing Corp. Housing Revenue, Series A, 4.60%, 7/01/32 | | 2,000,000 | | 2,000,660 |
| Kentucky Rural Water Finance Corp. Public Project Revenue, Multimodal, Flexible Term Program, | | | | |
| Series A, 5.00%, 2/01/26 | | 895,000 | | 904,997 |
| Series I, 5.00%, 2/01/34 | | 1,500,000 | | 1,524,405 |
114 | Annual Report
| | | | |
| Franklin Tax-Free Trust | | | | |
| |
| Statement of Investments, February 29, 2012 (continued) | | | | |
| |
| |
| Franklin Kentucky Tax-Free Income Fund | | Principal Amount | | Value |
| Municipal Bonds (continued) | | | | |
| Kentucky (continued) | | | | |
| Kentucky State Municipal Power Agency Power System Revenue, Prairie State Project, Series A, | | | | |
| NATL Insured, 5.00%, | | | | |
| 9/01/32 | $ | 5,000,000 | $ | 5,269,400 |
| 9/01/37 | | 3,250,000 | | 3,369,827 |
| Kentucky State Property and Buildings Commission Revenues, | | | | |
| Project No. 77, NATL Insured, Pre-Refunded, 5.00%, 8/01/23 | | 1,100,000 | | 1,173,260 |
| Project No. 90, Refunding, 5.50%, 11/01/28 | | 5,000,000 | | 5,748,850 |
| Kentucky State Turnpike Authority Economic Development Road Revenue, Revitalization Projects, | | | | |
| Refunding, Series A, 5.00%, 7/01/28 | | 1,000,000 | | 1,134,680 |
| Refunding, Series A, 5.00%, 7/01/29 | | 1,000,000 | | 1,154,000 |
| Refunding, Series A, 5.00%, 7/01/30 | | 2,500,000 | | 2,937,225 |
| aSeries A, 5.00%, 7/01/31 | | 1,000,000 | | 1,162,560 |
| aSeries A, 5.00%, 7/01/32 | | 4,000,000 | | 4,619,720 |
| Lawrenceburg Water and Sewer Revenue, NATL Insured, 5.00%, 10/01/28 | | 1,730,000 | | 1,763,199 |
| Lexington-Fayette Urban County Airport Board General Airport Revenue, Refunding, Series A, | | | | |
| 5.00%, 7/01/27 | | 2,000,000 | | 2,244,340 |
| Lexington-Fayette Urban County Government Public Facilities Corp. Lease Revenue, Eastern | | | | |
| State Hospital, Refunding, Series A, 5.25%, 6/01/32 | | 3,000,000 | | 3,348,450 |
| Louisville and Jefferson County Metropolitan Government College Revenue, Bellarmine University | | | | |
| Project, Refunding and Improvement, Series A, 6.00%, 5/01/38 | | 2,500,000 | | 2,641,700 |
| Louisville and Jefferson County Metropolitan Government Health Facilities Revenue, Jewish | | | | |
| Hospital and St. Mary’s HealthCare Inc. Project, Refunding, 6.125%, 2/01/37 | | 2,000,000 | | 2,125,260 |
| Louisville and Jefferson County Metropolitan Government Industrial Building Revenue, Sisters of | | | | |
| Mercy, Cincinnati, 5.00%, 10/01/35 | | 1,500,000 | | 1,530,630 |
| Louisville and Jefferson County Metropolitan Government Parking Authority Revenue, Series A, | | | | |
| 5.375%, 12/01/39 | | 1,995,000 | | 2,230,789 |
| Louisville and Jefferson County Metropolitan Sewer District Sewer and Drainage System Revenue, | | | | |
| Series A, AMBAC Insured, 5.00%, 5/15/36 | | 1,000,000 | | 1,055,600 |
| Louisville and Jefferson County Student Housing Revenue, University of Louisville, Phase 3-A, | | | | |
| AMBAC Insured, 5.00%, 6/01/34 | | 3,755,000 | | 3,872,381 |
| Louisville Parking Authority of River City Revenue, NATL Insured, 5.00%, 6/01/29 | | 3,290,000 | | 3,300,298 |
| Louisville Regional Airport Authority Airport System Revenue, AGMC Insured, 5.50%, | | | | |
| 7/01/38 | | 3,000,000 | | 3,131,400 |
| Murray Hospital Facilities Revenue, Murray, Calloway County Public Hospital, | | | | |
| 5.125%, 8/01/37 | | 3,000,000 | | 2,827,290 |
| 6.375%, 8/01/40 | | 2,500,000 | | 2,631,750 |
| Northern Kentucky University COP, AMBAC Insured, Pre-Refunded, 5.00%, 12/01/27 | | 1,500,000 | | 1,553,475 |
| Northern Kentucky Water Service District Revenue, NATL Insured, 4.875%, 2/01/20 | | 1,270,000 | | 1,273,454 |
| Oldham County School District Finance Corp. School Building Revenue, NATL Insured, 5.00%, | | | | |
| 5/01/24 | | 5,680,000 | | 5,873,063 |
| Owen County Waterworks System Revenue, American Water Co. Project, | | | | |
| Series A, 6.25%, 6/01/39 | | 2,000,000 | | 2,177,940 |
| Series A, 5.375%, 6/01/40 | | 2,000,000 | | 2,058,140 |
| Series B, 5.625%, 9/01/39 | | 2,000,000 | | 2,105,320 |
| Owensboro GO, Public Project, 5.00%, 4/01/41 | | 5,440,000 | | 6,002,714 |
| Paducah Electric Plant Board Revenue, Series A, Assured Guaranty, 5.25%, 10/01/35 | | 6,500,000 | | 7,113,275 |
| Pikeville Hospital Revenue, Pikeville Medical Center, Refunding and Improvement, 6.50%, | | | | |
| 3/01/41 | | 2,875,000 | | 3,271,175 |
Annual Report | 115
| | | | | |
| Franklin Tax-Free Trust | | | | | |
| |
| Statement of Investments, February 29, 2012 (continued) | | | | | |
| |
| |
| Franklin Kentucky Tax-Free Income Fund | | Principal Amount | | Value | |
| Municipal Bonds (continued) | | | | | |
| Kentucky (continued) | | | | | |
| Princeton Electric Plant Board Revenue, Series A, Assured Guaranty, 5.00%, 11/01/37 | $ | 1,500,000 | $ | 1,647,780 | |
| Pulaski County Public Properties Corp. First Mortgage Revenue, AOC Judicial Facility, Refunding, | | | | | |
| 6.00%, 12/01/28 | | 1,000,000 | | 1,195,910 | |
| Trimble County Environmental Facilities Revenue, Trimble County Environmental Facility, | | | | | |
| AMBAC Insured, 6.00%, 3/01/37 | | 5,000,000 | | 5,305,950 | |
| Refunding, AMBAC Insured, 4.60%, 6/01/33 | | 3,750,000 | | 3,853,387 | |
| Warren County Hospital Facility Revenue, Community Hospital Corp. Project, Refunding, | | | | | |
| Series A, 5.00%, 8/01/29 | | 1,000,000 | | 1,027,090 | |
| | | | | 160,684,288 | |
| U.S. Territories 10.7% | | | | | |
| Puerto Rico 10.7% | | | | | |
| Children’s Trust Fund Puerto Rico Tobacco Settlement Revenue, Asset-Backed Bonds, Refunding, | | | | | |
| 5.375%, 5/15/33 | | 1,560,000 | | 1,560,234 | |
| Puerto Rico Commonwealth GO, Public Improvement, Series A, 5.125%, 7/01/31 | | 3,125,000 | | 3,128,937 | |
| Puerto Rico Commonwealth Highway and Transportation Authority Transportation Revenue, | | | | | |
| Series D, Pre-Refunded, 5.375%, 7/01/36 | | 2,500,000 | | 2,541,075 | |
| Series K, 5.00%, 7/01/27 | | 3,000,000 | | 3,084,780 | |
| Puerto Rico PBA Guaranteed Revenue, Government Facilities, | | | | | |
| Refunding, Series D, 5.25%, 7/01/36 | | 455,000 | | 456,142 | |
| Refunding, Series N, 5.00%, 7/01/32 | | 3,000,000 | | 3,094,440 | |
| Series D, Pre-Refunded, 5.25%, 7/01/36 | | 995,000 | | 1,010,612 | |
| Puerto Rico Sales Tax FICO Sales Tax Revenue, first sub., Series C, 5.50%, 8/01/40 | | 5,000,000 | | 5,474,650 | |
| | | | | 20,350,870 | |
| Total Municipal Bonds before Short Term Investments (Cost $170,361,570) | | | | 181,035,158 | |
| Short Term Investments 6.5% | | | | | |
| Municipal Bonds 6.5% | | | | | |
| Kentucky 6.5% | | | | | |
| bKentucky Economic Development Finance Authority Hospital Facilities Revenue, Baptist | | | | | |
| Healthcare System, Refunding, Series B-2, Daily VRDN and Put, 0.10%, 8/15/38 | | 3,200,000 | | 3,200,000 | |
| bLexington-Fayette Urban County Airport Board General Airport Revenue, Refunding, Series B, | | | | | |
| Daily VRDN and Put, 0.10%, 7/01/38 | | 2,650,000 | | 2,650,000 | |
| bLouisville and Jefferson County Metropolitan Government Health System Revenue, Norton | | | | | |
| Healthcare, Series B, Daily VRDN and Put, 0.10%, 10/01/39 | | 6,600,000 | | 6,600,000 | |
| Total Short Term Investments (Cost $12,450,000) | | | | 12,450,000 | |
| Total Investments (Cost $182,811,570) 101.7% | | | | 193,485,158 | |
| Other Assets, less Liabilities (1.7)% | | | | (3,254,656 | ) |
| Net Assets 100.0% | | | $ | 190,230,502 | |
See Abbreviations on page 184.
aSecurity purchased on a when-issued basis. See Note 1(b).
bVariable rate demand notes (VRDNs) are tax-exempt obligations which contain a floating or variable interest rate adjustment formula and an unconditional right of demand to receive payment of the principal balance plus accrued interest at specified dates. The coupon rate shown represents the rate at period end.
116 | The accompanying notes are an integral part of these financial statements. | Annual Report
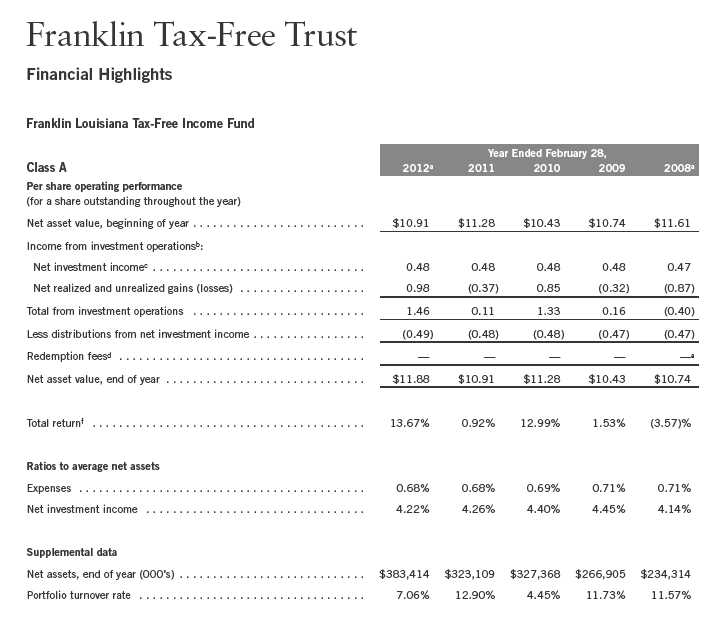
aFor the year ended February 29.
bThe amount shown for a share outstanding throughout the period may not correlate with the Statement of Operations for the period due to the timing of sales and repurchases of
the Fund shares in relation to income earned and/or fluctuating market value of the investments of the Fund.
cBased on average daily shares outstanding.
dEffective September 1, 2008, the redemption fee was eliminated.
eAmount rounds to less than $0.01 per share.
fTotal return does not reflect sales commissions or contingent deferred sales charges, if applicable.
Annual Report | The accompanying notes are an integral part of these financial statements. | 117
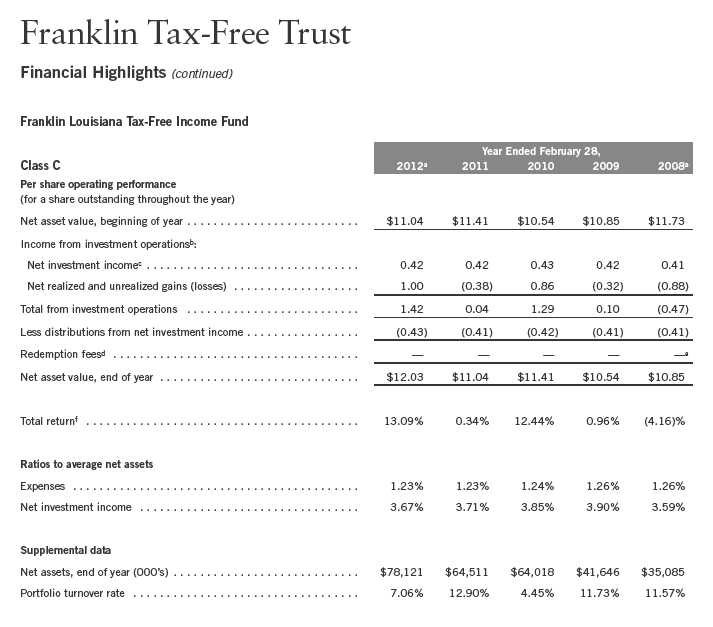
aFor the year ended February 29.
bThe amount shown for a share outstanding throughout the period may not correlate with the Statement of Operations for the period due to the timing of sales and repurchases of
the Fund shares in relation to income earned and/or fluctuating market value of the investments of the Fund.
cBased on average daily shares outstanding.
dEffective September 1, 2008, the redemption fee was eliminated.
eAmount rounds to less than $0.01 per share.
fTotal return does not reflect sales commissions or contingent deferred sales charges, if applicable.
118 | The accompanying notes are an integral part of these financial statements. | Annual Report
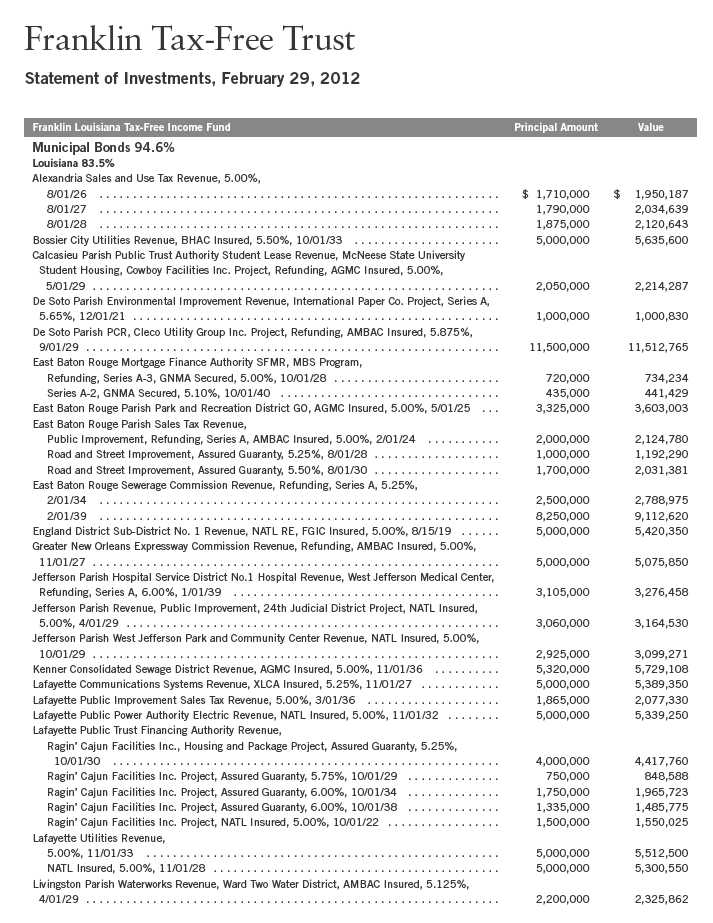
Annual Report | 119
| | | | |
| Franklin Tax-Free Trust | | | | |
| |
| Statement of Investments, February 29, 2012 (continued) | | | | |
| |
| |
| Franklin Louisiana Tax-Free Income Fund | | Principal Amount | | Value |
| Municipal Bonds (continued) | | | | |
| Louisiana (continued) | | | | |
| Louisiana HFA, SFMR, Home Ownership Program, | | | | |
| GO Zone, Series B-1, GNMA Secured, 5.00%, 12/01/32 | $ | 805,000 | $ | 807,294 |
| Series A, GNMA Secured, 5.50%, 6/01/40 | | 3,540,000 | | 3,621,703 |
| Series A-1, GNMA Secured, 5.45%, 12/01/20 | | 275,000 | | 278,751 |
| Series B, GNMA Secured, 6.125%, 12/01/33 | | 710,000 | | 768,085 |
| Louisiana Local Government Environmental Facilities and CDA Revenue, | | | | |
| Ascension Parish Library Projects, AMBAC Insured, 5.25%, 4/01/29 | | 1,000,000 | | 1,054,110 |
| Baton Rouge Community College, Refunding, AGMC Insured, 5.00%, 12/01/26 | | 1,000,000 | | 1,129,000 |
| Delta Campus Facilities Corp. Project, Assured Guaranty, 5.50%, 10/01/27 | | 5,000,000 | | 5,641,900 |
| Denham Springs Sewer District No. 1 Project, Assured Guaranty, 5.00%, 12/01/39 | | 3,750,000 | | 4,101,675 |
| East Ascension Consolidated Gravity Drainage District No. 1 Project, Refunding, | | | | |
| AMBAC Insured, 5.00%, 12/01/37 | | 5,370,000 | | 5,686,293 |
| East Ascension Consolidated Gravity Drainage District No. 1 Project, Refunding, | | | | |
| AMBAC Insured, 5.00%, 12/01/44 | | 8,870,000 | | 9,302,058 |
| Independence Stadium Project, Refunding, 5.25%, 3/01/30 | | 8,845,000 | | 9,570,467 |
| Jefferson Parish Projects, Refunding, Series A, 5.375%, 4/01/31 | | 2,000,000 | | 2,235,740 |
| Jefferson Parking Garage Project, AMBAC Insured, 5.00%, 9/01/21 | | 2,215,000 | | 2,216,551 |
| Lake Charles Public Improvements Project, AMBAC Insured, 5.00%, 5/01/27 | | 3,000,000 | | 3,223,650 |
| Livingston Parish Road Project, AMBC Insured, 5.00%, 3/01/21 | | 3,540,000 | | 3,807,058 |
| Monroe Regional Airport Terminal Project, Assured Guaranty, 5.50%, 2/01/39 | | 2,000,000 | | 2,205,800 |
| NATL Insured, Pre-Refunded, 5.00%, 12/01/26 | | 3,000,000 | | 3,105,810 |
| Parking Facilities Corp. Garage Project, Series A, AMBAC Insured, 5.375%, 10/01/26 | | 2,000,000 | | 2,000,260 |
| Parking Facilities Corp. Garage Project, Series A, AMBAC Insured, 5.375%, 10/01/31 | | 2,000,000 | | 2,000,060 |
| Shreveport Airport Cargo Project, Series C, Assured Guaranty, 6.75%, 1/01/24 | | 2,620,000 | | 3,042,894 |
| Shreveport Airport Cargo Project, Series C, Assured Guaranty, 7.00%, 1/01/33 | | 2,500,000 | | 2,835,200 |
| Southeastern Louisiana Student Housing, University Facilities Inc. Project, Series A, | | | | |
| NATL Insured, 5.00%, 8/01/27 | | 3,000,000 | | 3,077,040 |
| Louisiana Public Facilities Authority Hospital Revenue, | | | | |
| Franciscan Missionaries of Our Lady Health System Project, 6.75%, 7/01/39 | | 3,500,000 | | 4,019,260 |
| Lafayette General Medical Center Project, Refunding, 5.50%, 11/01/40 | | 5,000,000 | | 5,309,800 |
| Touro Infirmary Project, Series A, 5.625%, 8/15/29 | | 3,500,000 | | 3,500,560 |
| Louisiana Public Facilities Authority Revenue, | | | | |
| Archdiocese of New Orleans Project, Refunding, CIFG Insured, 5.00%, 7/01/31 | | 5,000,000 | | 5,043,800 |
| Black and Gold Facilities Project, Series A, CIFG Insured, 5.00%, 7/01/30 | | 5,000,000 | | 4,620,900 |
| CHRISTUS Health, Refunding, Series B, Assured Guaranty, 6.50%, 7/01/30 | | 5,000,000 | | 5,663,000 |
| Dillard University Project, Series A, AMBAC Insured, Pre-Refunded, 5.30%, 8/01/26 | | 1,540,000 | | 1,570,738 |
| Entergy LLC Project, Refunding, 5.00%, 6/01/30 | | 5,000,000 | | 5,278,400 |
| FHA Insured Mortgage, Baton Rouge General Medical Center Project, NATL Insured, 5.25%, | | | | |
| 7/01/33 | | 5,000,000 | | 5,343,250 |
| Loyola University Project, 5.00%, 10/01/39 | | 5,000,000 | | 5,384,800 |
| Loyola University Project, 5.00%, 10/01/41 | | 5,000,000 | | 5,285,800 |
| MFHR, One Lakeshore Place Apartments Project, Refunding, Series A, GNMA Secured, | | | | |
| 6.40%, 7/20/20 | | 1,400,000 | | 1,389,066 |
| Ochsner Clinic Foundation Project, 6.75%, 5/15/41 | | 5,000,000 | | 5,630,350 |
| Ochsner Clinic Foundation Project, Refunding, Series A, 5.375%, 5/15/43 | | 5,000,000 | | 5,068,500 |
| Ochsner Clinic Foundation Project, Series B, 5.25%, 5/15/27 | | 3,990,000 | | 4,130,687 |
| Ochsner Clinic Foundation Project, Series B, ETM, 5.75%, 5/15/23 | | 2,500,000 | | 3,403,025 |
| Tulane University of Louisiana, Series A, AMBAC Insured, Pre-Refunded, 5.125%, | | | | |
| 7/01/27 | | 3,000,000 | | 3,047,370 |
120 | Annual Report
| | | | |
| Franklin Tax-Free Trust | | | | |
| |
| Statement of Investments, February 29, 2012 (continued) | | | | |
| |
| |
| Franklin Louisiana Tax-Free Income Fund | | Principal Amount | | Value |
| Municipal Bonds (continued) | | | | |
| Louisiana (continued) | | | | |
| Louisiana State Citizens Property Insurance Corp. Assessment Revenue, | | | | |
| aRefunding, 5.00%, 6/01/24 | $ | 2,500,000 | $ | 2,799,650 |
| Series B, AMBAC Insured, 5.00%, 6/01/23 | | 5,000,000 | | 5,244,550 |
| Series C-2, Assured Guaranty, 6.75%, 6/01/26 | | 5,000,000 | | 5,965,150 |
| Louisiana State Gasoline and Fuels Tax Revenue, Series A, | | | | |
| AGMC Insured, 5.00%, 5/01/31 | | 13,000,000 | | 14,269,450 |
| AMBAC Insured, 5.00%, 6/01/27 | | 3,500,000 | | 3,515,610 |
| NATL RE, FGIC Insured, 5.00%, 5/01/35 | | 2,300,000 | | 2,428,892 |
| Louisiana State GO, | | | | |
| Match, Refunding, Series B, CIFG Insured, 5.00%, 7/15/24 | | 3,475,000 | | 3,928,418 |
| Match, Refunding, Series B, CIFG Insured, 5.00%, 7/15/25 | | 1,765,000 | | 1,980,330 |
| Series A, 5.00%, 9/01/27 | | 6,200,000 | | 7,399,824 |
| Louisiana State Local Government Environmental Facilities and CDA Revenue, McNeese State | | | | |
| University Student Parking, Cowboys Facilities Inc., AGMC Insured, 5.00%, 3/01/36 | | 1,800,000 | | 1,911,960 |
| Louisiana State Offshore Terminal Authority Deepwater Port Revenue, Loop LLC Project, | | | | |
| Refunding, 5.00%, 10/01/20 | | 5,000,000 | | 5,022,150 |
| Louisiana State University and Agricultural and Mechanical College Board Revenue, | | | | |
| AMBAC Insured, 5.00%, 7/01/22 | | 5,000,000 | | 5,217,800 |
| Auxiliary, NATL RE, FGIC Insured, 5.00%, 7/01/31 | | 3,000,000 | | 3,225,030 |
| Auxiliary, Series A, 5.00%, 7/01/40 | | 5,000,000 | | 5,514,400 |
| Auxiliary, Series B, AMBAC Insured, 5.00%, 7/01/27 | | 1,500,000 | | 1,599,105 |
| Monroe Sales Tax Increment Revenue, Economic Development Project, Garret Road, Refunding, | | | | |
| Assured Guaranty, | | | | |
| 5.375%, 3/01/24 | | 1,035,000 | | 1,069,031 |
| 5.50%, 3/01/25 | | 2,145,000 | | 2,217,072 |
| New Orleans Aviation Board Revenue, Restructuring GARB, Refunding, Series A-1, | | | | |
| Assured Guaranty, 6.00%, 1/01/23 | | 2,000,000 | | 2,359,480 |
| New Orleans GO, | | | | |
| Drainage System, AMBAC Insured, 5.00%, 12/01/18 | | 1,000,000 | | 1,005,420 |
| Public Improvement, AMBAC Insured, 5.25%, 12/01/29 | | 1,485,000 | | 1,527,560 |
| Public Improvement, FGIC Insured, 5.25%, 12/01/21 | | 1,295,000 | | 1,323,840 |
| Public Improvement, FGIC Insured, 5.125%, 12/01/26 | | 2,000,000 | | 2,001,680 |
| Radian Insured, 5.125%, 12/01/30 | | 10,055,000 | | 10,503,453 |
| Refunding, NATL Insured, 5.125%, 9/01/21 | | 2,000,000 | | 2,023,880 |
| New Orleans Sewage Service Revenue, Refunding, Assured Guaranty, 6.25%, 6/01/29 | | 500,000 | | 549,940 |
| Port New Orleans Board of Commissioners Port Facility Revenue, Refunding, Assured Guaranty, | | | | |
| 5.125%, 4/01/38 | | 5,000,000 | | 5,145,550 |
| Shreveport GO, 5.00%, | | | | |
| 8/01/25 | | 4,690,000 | | 5,424,501 |
| 8/01/29 | | 4,790,000 | | 5,464,480 |
| St. John the Baptist Parish EDR, USX Corp. Project, Refunding, 5.35%, 12/01/13 | | 2,500,000 | | 2,501,750 |
| St. John the Baptist Parish Revenue, Marathon Oil Corp. Project, Series A, 5.125%, 6/01/37 | | 5,000,000 | | 5,187,500 |
| St. Tammany Parish Utilities Revenue, Series B, | | | | |
| 5.50%, 8/01/35 | | 2,650,000 | | 2,961,348 |
| 5.00%, 8/01/44 | | 3,290,000 | | 3,525,202 |
| Terrebonne Parish Hospital Service District No. 1 Hospital Revenue, Terrebonne General Medical | | | | |
| Center Project, Refunding, AMBAC Insured, 5.50%, 4/01/33 | | 2,155,000 | | 2,211,698 |
| Terrebonne Parish Sales and Use Tax Revenue, Morganza Levee Improvement, Series ST, | | | | |
| AGMC Insured, 5.00%, 4/01/32 | | 2,265,000 | | 2,512,225 |
| | | | | 385,414,577 |
| |
| | | Annual Report | 121 |
| | | | |
| Franklin Tax-Free Trust | | | | |
| |
| Statement of Investments, February 29, 2012 (continued) | | | | |
| |
| |
| Franklin Louisiana Tax-Free Income Fund | | Principal Amount | | Value |
| Municipal Bonds (continued) | | | | |
| U.S. Territories 11.1% | | | | |
| Puerto Rico 10.3% | | | | |
| Puerto Rico Commonwealth GO, Public Improvement, | | | | |
| Refunding, Series A-4, AGMC Insured, 5.25%, 7/01/30 | $ | 5,000,000 | $ | 5,495,100 |
| Series A, 5.00%, 7/01/33 | | 615,000 | | 620,517 |
| Puerto Rico Commonwealth Highway and Transportation Authority Transportation Revenue, | | | | |
| Refunding, Series L, NATL Insured, 5.25%, 7/01/35 | | 10,000,000 | | 10,626,700 |
| Puerto Rico Electric Power Authority Power Revenue, | | | | |
| Series CCC, 5.25%, 7/01/27 | | 5,000,000 | | 5,554,300 |
| Series WW, 5.25%, 7/01/33 | | 6,450,000 | | 6,833,259 |
| Puerto Rico Sales Tax FICO Sales Tax Revenue, first sub., | | | | |
| Series A, 5.50%, 8/01/42 | | 6,000,000 | | 6,549,360 |
| Series B, 6.375%, 8/01/39 | | 10,000,000 | | 11,585,200 |
| | | | | 47,264,436 |
| U.S. Virgin Islands 0.8% | | | | |
| Virgin Islands PFAR, Matching Fund Loan Note, sub. lien, Series B, 5.00%, 10/01/25 | | 3,500,000 | | 3,767,575 |
| Total U.S. Territories | | | | 51,032,011 |
| Total Municipal Bonds before Short Term Investments (Cost $408,572,193) | | | | 436,446,588 |
| Short Term Investments 1.0% | | | | |
| Municipal Bonds 1.0% | | | | |
| Louisiana 1.0% | | | | |
| bLouisiana Public Facilities Authority Hospital Revenue, Franciscan Missionaries of Our Lady | | | | |
| Health System Project, Refunding, Series D, Daily VRDN and Put, 0.10%, 7/01/28 | | 850,000 | | 850,000 |
| bLouisiana State Offshore Terminal Authority Deepwater Port Revenue, Loop LLC Project, | | | | |
| First Stage, ACES, Refunding, Daily VRDN and Put, 0.12%, 9/01/17 | | 3,900,000 | | 3,900,000 |
| Total Short Term Investments (Cost $4,750,000) | | | | 4,750,000 |
| Total Investments (Cost $413,322,193) 95.6% | | | | 441,196,588 |
| Other Assets, less Liabilities 4.4% | | | | 20,338,171 |
| Net Assets 100.0% | | | $ | 461,534,759 |
See Abbreviations on page 184.
aSecurity purchased on a when-issued basis. See Note1(b).
bVariable rate demand notes (VRDNs) are tax-exempt obligations which contain a floating or variable interest rate adjustment formula and an unconditional right of demand to receive payment of the principal balance plus accrued interest at specified dates. The coupon rate shown represents the rate at period end.
122 | The accompanying notes are an integral part of these financial statements. | Annual Report
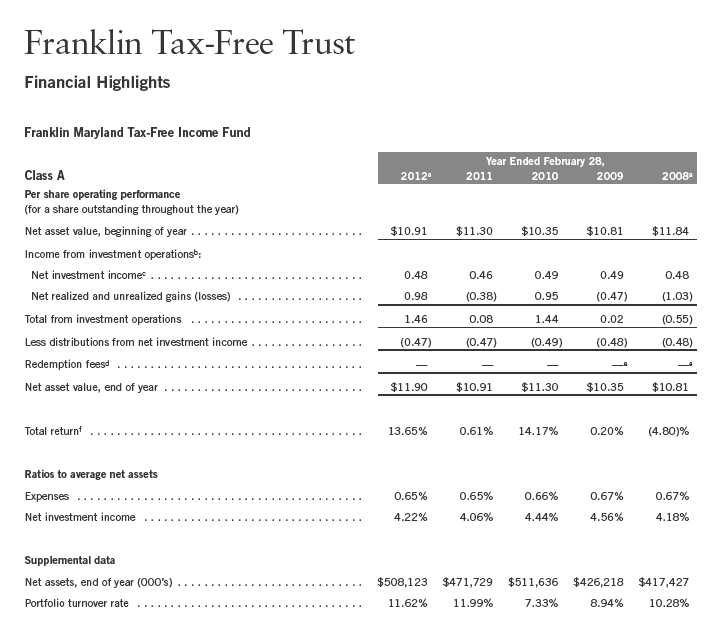
aFor the year ended February 29.
bThe amount shown for a share outstanding throughout the period may not correlate with the Statement of Operations for the period due to the timing of sales and repurchases of
the Fund shares in relation to income earned and/or fluctuating market value of the investments of the Fund.
cBased on average daily shares outstanding.
dEffective September 1, 2008, the redemption fee was eliminated.
eAmount rounds to less than $0.01 per share.
fTotal return does not reflect sales commissions or contingent deferred sales charges, if applicable.
Annual Report | The accompanying notes are an integral part of these financial statements. | 123

aFor the year ended February 29.
bThe amount shown for a share outstanding throughout the period may not correlate with the Statement of Operations for the period due to the timing of sales and repurchases of
the Fund shares in relation to income earned and/or fluctuating market value of the investments of the Fund.
cBased on average daily shares outstanding.
dEffective September 1, 2008, the redemption fee was eliminated.
eAmount rounds to less than $0.01 per share.
fTotal return does not reflect sales commissions or contingent deferred sales charges, if applicable.
124 | The accompanying notes are an integral part of these financial statements. | Annual Report
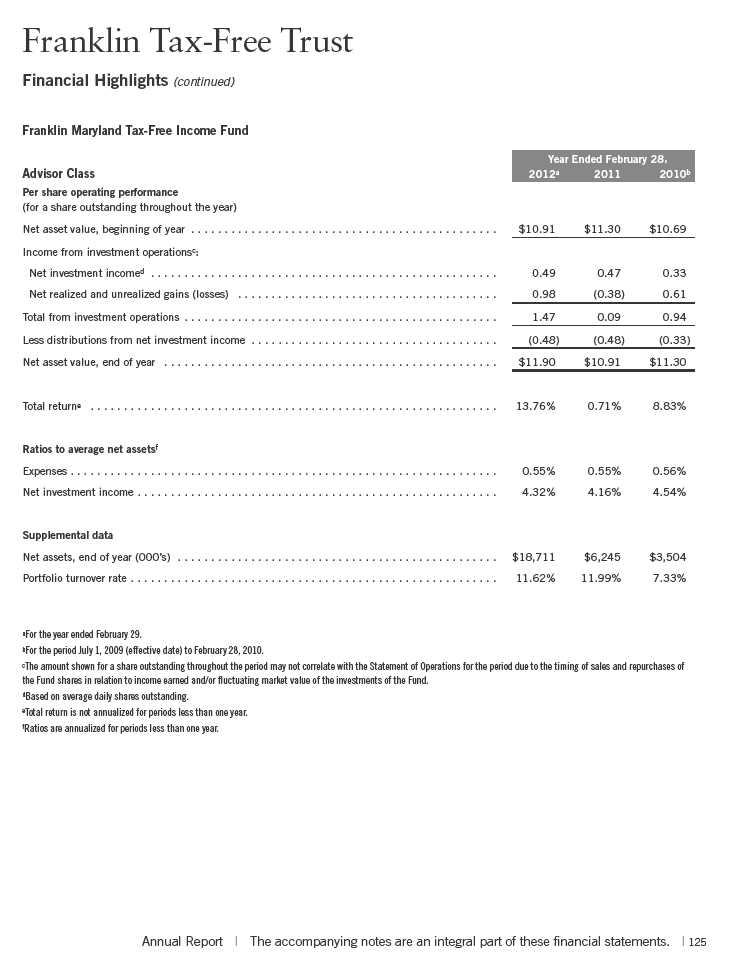
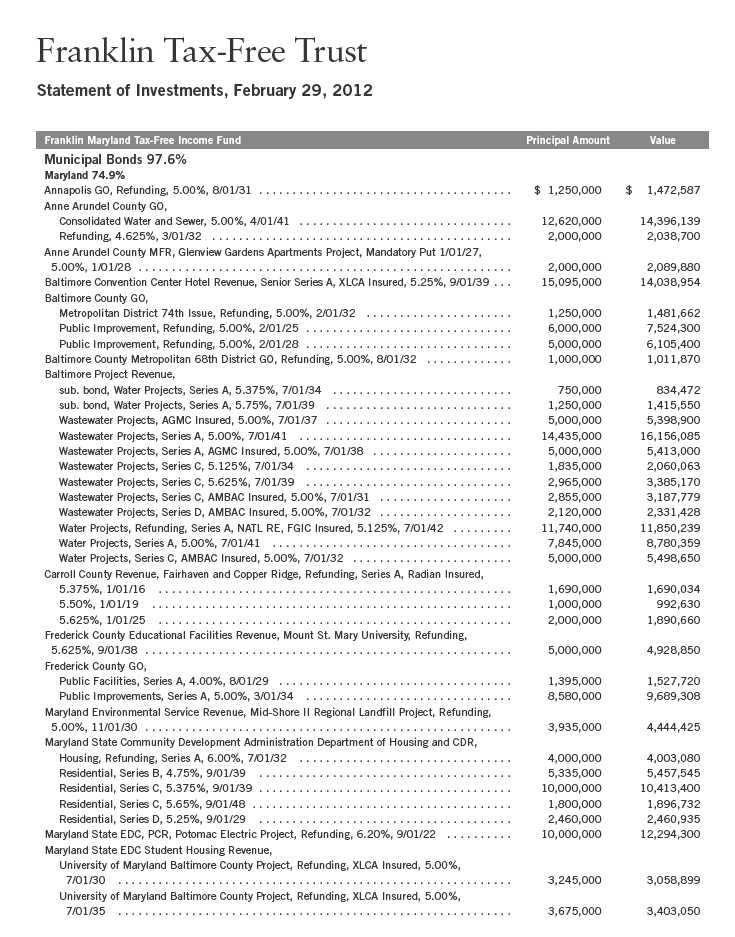
126 | Annual Report
| | | | |
| Franklin Tax-Free Trust | | | | |
| |
| Statement of Investments, February 29, 2012 (continued) | | | | |
| |
| |
| Franklin Maryland Tax-Free Income Fund | | Principal Amount | | Value |
| Municipal Bonds (continued) | | | | |
| Maryland (continued) | | | | |
| Maryland State EDC Student Housing Revenue, (continued) | | | | |
| University of Maryland College Park Projects, Refunding, Assured Guaranty, 5.00%, | | | | |
| 6/01/25 | $ | 2,500,000 | $ | 2,609,325 |
| University of Maryland College Park Projects, Refunding, Assured Guaranty, 5.00%, | | | | |
| 6/01/28 | | 2,000,000 | | 2,065,340 |
| University of Maryland College Park Projects, Refunding, Assured Guaranty, 5.00%, | | | | |
| 6/01/33 | | 9,370,000 | | 9,566,489 |
| Maryland State Health and Higher Educational Facilities Authority Revenue, | | | | |
| Anne Arundel Health System, Series A, 6.75%, 7/01/29 | | 2,000,000 | | 2,405,060 |
| Anne Arundel Health System, Series A, 6.75%, 7/01/39 | | 2,000,000 | | 2,400,780 |
| Anne Arundel Health System, Series A, Pre-Refunded, 5.125%, 7/01/34 | | 2,500,000 | | 2,773,375 |
| Anne Arundel Medical Center, AGMC Insured, 5.125%, 7/01/33 | | 8,365,000 | | 8,371,692 |
| Carroll County General Hospital, 6.00%, 7/01/26 | | 2,000,000 | | 2,014,860 |
| Carroll County General Hospital, 5.80%, 7/01/32 | | 5,000,000 | | 5,023,600 |
| Carroll Hospital Center, 5.00%, 7/01/40 | | 6,790,000 | | 6,964,503 |
| Edenwald, Series A, 5.40%, 1/01/31 | | 1,000,000 | | 998,750 |
| Helix Health Issue, AMBAC Insured, ETM, 5.00%, 7/01/27 | | 11,000,000 | | 14,116,960 |
| Johns Hopkins Medical Institutions, Series A, 5.00%, 5/15/37 | | 9,395,000 | | 9,742,051 |
| The Johns Hopkins University Issue, Series A, 5.00%, 7/01/32 | | 29,000,000 | | 29,324,220 |
| The Johns Hopkins University Issue, Series A, 5.00%, 7/01/38 | | 5,805,000 | | 6,213,150 |
| LifeBridge Health, Refunding, Assured Guaranty, 5.00%, 7/01/34 | | 10,945,000 | | 11,464,450 |
| LifeBridge Health, Refunding, Assured Guaranty, 4.75%, 7/01/38 | | 10,000,000 | | 10,201,900 |
| Loyola College, Series A, 5.00%, 10/01/40 | | 10,050,000 | | 10,408,282 |
| Maryland Institute College of Art, 5.00%, 6/01/35 | | 2,000,000 | | 2,031,120 |
| Maryland Institute College of Art, 5.00%, 6/01/36 | | 5,000,000 | | 5,094,150 |
| Maryland Institute College of Art, 5.00%, 6/01/40 | | 10,000,000 | | 10,136,400 |
| Mercy Medical Center, Refunding, 5.625%, 7/01/31 | | 5,500,000 | | 5,502,970 |
| Mercy Medical Center, Series A, 5.00%, 7/01/37 | | 10,000,000 | | 10,064,300 |
| Parking, Johns Hopkins Medical Institutions, AMBAC Insured, 5.00%, 7/01/27 | | 655,000 | | 655,327 |
| Parking, Johns Hopkins Medical Institutions, AMBAC Insured, 5.00%, 7/01/34 | | 5,000,000 | | 5,030,100 |
| Parking, Johns Hopkins Medical Institutions, Refunding, Series B, AMBAC Insured, 5.00%, | | | | |
| 7/01/38 | | 6,200,000 | | 6,238,440 |
| Peninsula Regional Medical Center, 5.00%, 7/01/36 | | 6,625,000 | | 6,811,030 |
| Roland Park Place Project, Refunding, 5.625%, 7/01/18 | | 2,500,000 | | 2,501,525 |
| Roland Park Place Project, Refunding, 5.625%, 7/01/24 | | 2,680,000 | | 2,680,188 |
| Union Hospital Cecil County Issue, 5.00%, 7/01/35 | | 3,015,000 | | 3,096,435 |
| University of Maryland Medical System, Refunding, AMBAC Insured, 5.25%, 7/01/28 | | 15,000,000 | | 16,396,500 |
| University of Maryland Medical System, Series A, 5.00%, 7/01/41 | | 2,500,000 | | 2,600,200 |
| Washington County Hospital, 5.75%, 1/01/38 | | 2,500,000 | | 2,593,500 |
| Western Maryland Health, Refunding, Series A, NATL Insured, 4.75%, 7/01/36 | | 17,120,000 | | 17,596,792 |
| Maryland State Transportation Authority Lease Revenue, Metrorail Parking Project, | | | | |
| AMBAC Insured, 5.00%, 7/01/28 | | 3,975,000 | | 4,194,937 |
| Maryland State Transportation Authority Parking Revenue, AMBAC Insured, 5.00%, 3/01/27 | | 8,000,000 | | 8,088,160 |
| Maryland State Transportation Authority Transportation Facility Projects Revenue, AGMC Insured, | | | | |
| 5.00%, 7/01/31 | | 7,455,000 | | 7,869,200 |
| 5.00%, 7/01/32 | | 7,165,000 | | 7,551,480 |
| 5.00%, 7/01/34 | | 7,500,000 | | 7,868,175 |
| Pre-Refunded, 5.00%, 7/01/27 | | 5,890,000 | | 6,524,294 |
Annual Report | 127
| | | | |
| Franklin Tax-Free Trust | | | | |
| |
| Statement of Investments, February 29, 2012 (continued) | | | | |
| |
| |
| Franklin Maryland Tax-Free Income Fund | | Principal Amount | | Value |
| Municipal Bonds (continued) | | | | |
| Maryland (continued) | | | | |
| Montgomery County GO, Consolidated Public Improvement, Refunding, Series A, 4.00%, | | | | |
| 11/01/20 | $ | 8,000,000 | $ | 9,384,400 |
| Montgomery County Revenue, Department of Liquor Control, | | | | |
| Refunding, Series A, 5.00%, 4/01/27 | | 1,625,000 | | 1,909,635 |
| Refunding, Series A, 5.00%, 4/01/28 | | 2,230,000 | | 2,603,101 |
| Refunding, Series A, 5.00%, 4/01/31 | | 2,470,000 | | 2,821,802 |
| Series A, 5.00%, 4/01/30 | | 1,935,000 | | 2,225,405 |
| Morgan State University Maryland and Auxiliary Facilities Fees Revenue, Series A, NATL RE, | | | | |
| FGIC Insured, 5.00%, 7/01/32 | | 6,450,000 | | 6,594,609 |
| Prince George’s County COP, Public Safety Communications, 5.00%, 10/01/30 | | 2,060,000 | | 2,349,286 |
| Prince George’s County GO, Consolidated Public Improvement, | | | | |
| Pre-Refunded, 4.40%, 9/15/22 | | 10,000,000 | | 10,325,700 |
| Series A, 5.00%, 9/15/28 | | 3,725,000 | | 4,538,391 |
| Prince George’s County IDA Lease Revenue, Upper Marlboro Justice, Series B, NATL Insured, | | | | |
| 4.75%, 6/30/30 | | 4,000,000 | | 4,076,200 |
| Westminster Education Facilities Revenue, McDaniel College Inc., Pre-Refunded, 5.50%, | | | | |
| 4/01/27 | | 425,000 | | 437,827 |
| 4/01/32 | | 1,500,000 | | 1,545,270 |
| | | | | 511,224,391 |
| District of Columbia 0.4% | | | | |
| Washington Metropolitan Area Transit Authority Gross Revenue, Transit, Series A, 5.125%, | | | | |
| 7/01/32 | | 2,500,000 | | 2,773,925 |
| U.S. Territories 22.3% | | | | |
| Puerto Rico 21.8% | | | | |
| Puerto Rico Commonwealth Aqueduct and Sewer Authority Revenue, senior lien, Series A, | | | | |
| 6.00%, 7/01/38 | | 2,100,000 | | 2,273,901 |
| Puerto Rico Commonwealth GO, Public Improvement, | | | | |
| Refunding, AGMC Insured, 5.25%, 7/01/27 | | 1,015,000 | | 1,016,025 |
| Refunding, AGMC Insured, 5.125%, 7/01/30 | | 2,870,000 | | 2,872,411 |
| Refunding, Series A, FGIC Insured, 5.50%, 7/01/21 | | 10,000,000 | | 11,157,100 |
| Refunding, Series A, FGIC Insured, 5.50%, 7/01/22 | | 5,000,000 | | 5,606,400 |
| Series A, 5.00%, 7/01/27 | | 6,250,000 | | 6,522,250 |
| Puerto Rico Commonwealth Highway and Transportation Authority Transportation Revenue, | | | | |
| Refunding, Series N, Assured Guaranty, 5.25%, 7/01/36 | | 5,000,000 | | 5,646,600 |
| Refunding, Series N, FGIC Insured, 5.25%, 7/01/39 | | 5,000,000 | | 5,308,550 |
| Series D, Pre-Refunded, 5.25%, 7/01/38 | | 5,000,000 | | 5,080,100 |
| Series G, 5.00%, 7/01/33 | | 2,155,000 | | 2,174,330 |
| Series G, Pre-Refunded, 5.00%, 7/01/33 | | 15,000 | | 15,930 |
| Puerto Rico Convention Center District Authority Hotel Occupancy Tax Revenue, Series A, | | | | |
| AMBAC Insured, 5.00%, 7/01/31 | | 5,000,000 | | 5,126,500 |
| FGIC Insured, 5.00%, 7/01/24 | | 5,000,000 | | 5,190,350 |
| Puerto Rico Electric Power Authority Power Revenue, | | | | |
| Refunding, Series SS, AGMC Insured, 5.00%, 7/01/30 | | 6,500,000 | | 6,786,390 |
| Series II, Pre-Refunded, 5.25%, 7/01/31 | | 3,000,000 | | 3,079,050 |
| Series WW, 5.50%, 7/01/38 | | 5,000,000 | | 5,360,200 |
| Series XX, 5.25%, 7/01/40 | | 13,500,000 | | 14,138,145 |
| Puerto Rico HFAR, Capital Fund Modernization, 5.125%, 12/01/27 | | 4,250,000 | | 4,639,853 |
128 | Annual Report
| | | | |
| Franklin Tax-Free Trust | | | | |
| |
| Statement of Investments, February 29, 2012 (continued) | | | | |
| |
| |
| Franklin Maryland Tax-Free Income Fund | | Principal Amount | | Value |
| Municipal Bonds (continued) | | | | |
| U.S. Territories (continued) | | | | |
| Puerto Rico (continued) | | | | |
| Puerto Rico PBA Guaranteed Revenue, Government Facilities, | | | | |
| Refunding, Series D, 5.25%, 7/01/36 | $ | 520,000 | $ | 521,305 |
| Refunding, Series K, AGMC Insured, 5.25%, 7/01/27 | | 5,300,000 | | 5,797,564 |
| Refunding, Series N, 5.00%, 7/01/32 | | 5,000,000 | | 5,157,400 |
| Refunding, Series Q, 5.625%, 7/01/39 | | 5,000,000 | | 5,334,400 |
| Series D, Pre-Refunded, 5.25%, 7/01/36 | | 1,480,000 | | 1,503,221 |
| Puerto Rico Sales Tax FICO Sales Tax Revenue, first sub., | | | | |
| Series A, 5.75%, 8/01/37 | | 11,425,000 | | 12,695,117 |
| Series A, 6.00%, 8/01/42 | | 18,160,000 | | 20,554,396 |
| Series C, 5.25%, 8/01/41 | | 1,300,000 | | 1,399,593 |
| University of Puerto Rico Revenues, University System, Refunding, Series P, 5.00%, 6/01/30 | | 4,000,000 | | 4,102,520 |
| | | | | 149,059,601 |
| U.S. Virgin Islands 0.5% | | | | |
| Virgin Islands PFAR, | | | | |
| Gross Receipts Taxes Loan Note, Refunding, Series A, AGMC Insured, 5.00%, 10/01/22 | | 2,000,000 | | 2,073,140 |
| senior lien, Capital Projects, Series A-1, 5.00%, 10/01/29 | | 1,000,000 | | 1,048,760 |
| | | | | 3,121,900 |
| Total U.S. Territories | | | | 152,181,501 |
| Total Municipal Bonds before Short Term Investments (Cost $631,395,028) | | | | 666,179,817 |
| Short Term Investments 1.5% | | | | |
| Municipal Bonds 1.5% | | | | |
| Maryland 1.5% | | | | |
| aMaryland State EDC, EDR, U.S. Pharmacopeial Convention Inc. Project, Refunding, | | | | |
| Series A, Daily VRDN and Put, 0.25%, 7/01/38 | | 905,000 | | 905,000 |
| Series B, Daily VRDN and Put, 0.25%, 7/01/38 | | 2,735,000 | | 2,735,000 |
| aMontgomery County GO, BAN, Refunding, Series A, Daily VRDN and Put, 0.09%, 6/01/26 | | 6,495,000 | | 6,495,000 |
| Total Short Term Investments (Cost $10,135,000) | | | | 10,135,000 |
| Total Investments (Cost $641,530,028) 99.1% | | | | 676,314,817 |
| Other Assets, less Liabilities 0.9% | | | | 6,283,186 |
| Net Assets 100.0% | | | $ | 682,598,003 |
See Abbreviations on page 184.
aVariable rate demand notes (VRDNs) are tax-exempt obligations which contain a floating or variable interest rate adjustment formula and an unconditional right of demand to receive payment of the principal balance plus accrued interest at specified dates. The coupon rate shown represents the rate at period end.
Annual Report | The accompanying notes are an integral part of these financial statements. | 129
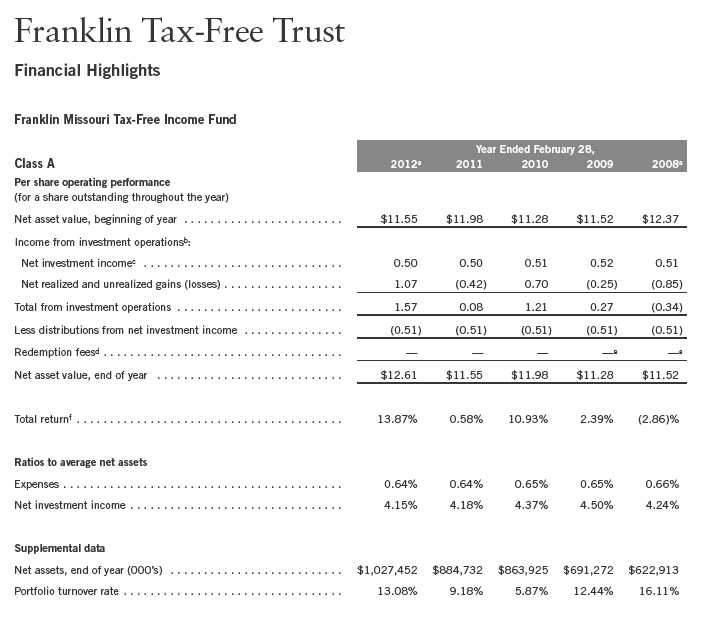
aFor the year ended February 29.
bThe amount shown for a share outstanding throughout the period may not correlate with the Statement of Operations for the period due to the timing of sales and repurchases of
the Fund shares in relation to income earned and/or fluctuating market value of the investments of the Fund.
cBased on average daily shares outstanding.
dEffective September 1, 2008, the redemption fee was eliminated.
eAmount rounds to less than $0.01 per share.
fTotal return does not reflect sales commissions or contingent deferred sales charges, if applicable.
130 | The accompanying notes are an integral part of these financial statements. | Annual Report
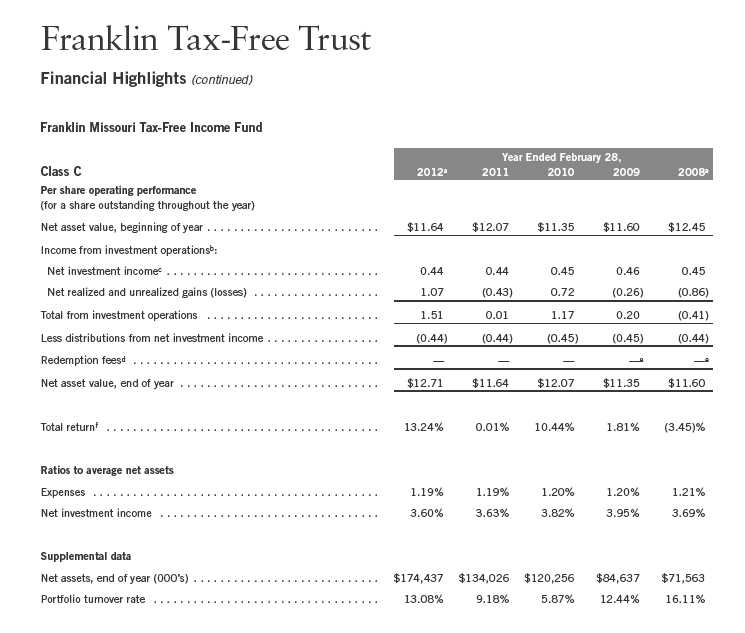
aFor the year ended February 29.
bThe amount shown for a share outstanding throughout the period may not correlate with the Statement of Operations for the period due to the timing of sales and repurchases of
the Fund shares in relation to income earned and/or fluctuating market value of the investments of the Fund.
cBased on average daily shares outstanding.
dEffective September 1, 2008, the redemption fee was eliminated.
eAmount rounds to less than $0.01 per share.
fTotal return does not reflect sales commissions or contingent deferred sales charges, if applicable.
Annual Report | The accompanying notes are an integral part of these financial statements. | 131
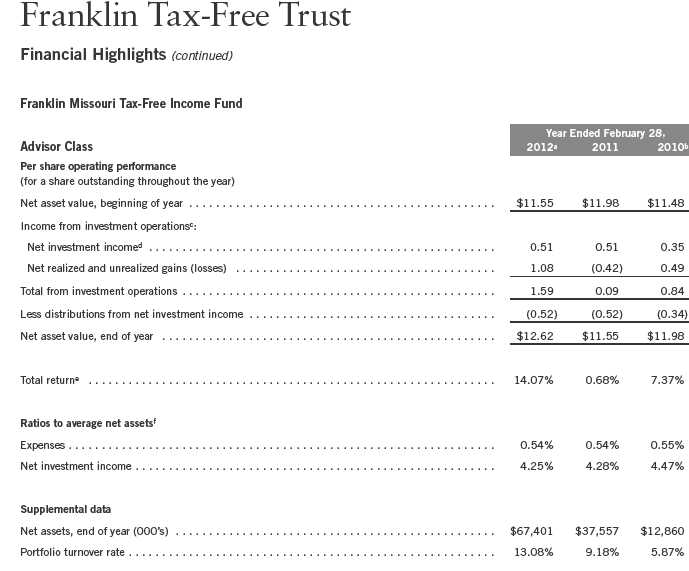
aFor the year ended February 29.
bFor the period July 1, 2009 (effective date) to February 28, 2010.
cThe amount shown for a share outstanding throughout the period may not correlate with the Statement of Operations for the period due to the timing of sales and repurchases of
the Fund shares in relation to income earned and/or fluctuating market value of the investments of the Fund.
dBased on average daily shares outstanding.
eTotal return is not annualized for periods less than one year.
fRatios are annualized for periods less than one year.
132 | The accompanying notes are an integral part of these financial statements. | Annual Report
| | | | |
| Franklin Tax-Free Trust | | | | |
| |
| Statement of Investments, February 29, 2012 | | | | |
| |
| |
| Franklin Missouri Tax-Free Income Fund | | Principal Amount | | Value |
| Municipal Bonds 95.1% | | | | |
| Missouri 73.8% | | | | |
| Bi-State Development Agency Missouri-Illinois Metropolitan District Mass Transit Sales Tax | | | | |
| Revenue, Metrolink Cross County Extension, Assured Guaranty, 5.00%, | | | | |
| 10/01/35 | $ | 5,000,000 | $ | 5,523,000 |
| 10/01/39 | | 30,300,000 | | 33,110,022 |
| Bi-State Development Agency Missouri-Illinois Metropolitan District Revenue, Metrolink Cross | | | | |
| County Project, Series B, AGMC Insured, 5.00%, 10/01/32 | | 7,300,000 | | 7,536,082 |
| Cape Girardeau County IDA Health Care Facilities Revenue, | | | | |
| Southeast Missouri Hospital Assn., 5.00%, 6/01/36 | | 7,500,000 | | 7,499,400 |
| St. Francis Medical Center, Series A, 5.50%, 6/01/27 | | 6,350,000 | | 6,493,764 |
| St. Francis Medical Center, Series A, 5.50%, 6/01/32 | | 5,000,000 | | 5,099,750 |
| St. Francis Medical Center, Series A, 5.75%, 6/01/39 | | 3,150,000 | | 3,421,121 |
| Cape Girardeau County IDA Solid Waste Disposal Revenue, Procter and Gamble Paper | | | | |
| Products, 5.30%, 5/15/28 | | 6,875,000 | | 6,877,269 |
| Carroll County Public Water Supply District No. 1 Water System Revenue, Refunding, | | | | |
| 5.625%, 3/01/34 | | 1,000,000 | | 1,105,950 |
| 6.00%, 3/01/39 | | 1,000,000 | | 1,106,690 |
| Columbia Special Obligation Electric Utility Improvement Revenue, Annual Appropriation | | | | |
| Obligation, Series A, 5.75%, 10/01/33 | | 10,290,000 | | 11,909,029 |
| aColumbia Special Obligation Revenue, Parking Project, Annual Appropriation Obligation, | | | | |
| Series, A-2, 4.00%, 3/01/31 | | 1,165,000 | | 1,249,777 |
| Curators of the University of Missouri System Facilities Revenue, | | | | |
| Refunding, 5.00%, 11/01/27 | | 1,065,000 | | 1,266,956 |
| Series A, 5.00%, 11/01/33 | | 5,000,000 | | 5,519,150 |
| Series A, 5.00%, 11/01/35 | | 20,000,000 | | 21,869,800 |
| System Facilities, Refunding, Series A, 5.00%, 11/01/25 | | 5,750,000 | | 6,382,902 |
| System Facilities, Refunding, Series A, 5.00%, 11/01/26 | | 3,625,000 | | 4,010,482 |
| Florissant COP, NATL RE, FGIC Insured, Pre-Refunded, 5.00%, 8/01/22 | | 1,285,000 | | 1,310,147 |
| Grandview COP, NATL RE, FGIC Insured, Pre-Refunded, 5.00%, 1/01/23 | | 2,410,000 | | 2,504,785 |
| Hannibal IDA Health Facilities Revenue, Refunding, 5.00%, 3/01/22 | | 1,000,000 | | 1,033,920 |
| Independence School District GO, Missouri Direct Deposit Program, Series A, 5.00%, | | | | |
| 3/01/27 | | 3,300,000 | | 3,852,453 |
| 3/01/28 | | 3,000,000 | | 3,476,490 |
| 3/01/29 | | 3,000,000 | | 3,455,610 |
| Jackson County Reorganized School District No. 4 Blue Springs GO, Refunding and | | | | |
| Improvement, Series A, 5.00%, 3/01/29 | | 4,000,000 | | 4,501,000 |
| Jackson County Reorganized School District No. 7 Lee’s Summit GO, Missouri Direct Deposit | | | | |
| Program, Refunding and Improvement, AGMC Insured, 5.00%, 3/01/21 | | 5,700,000 | | 5,700,000 |
| Jackson County Special Obligation Revenue, | | | | |
| Harry S. Truman Sports Complex, AMBAC Insured, 5.00%, 12/01/28 | | 2,400,000 | | 2,543,976 |
| Harry S. Truman Sports Complex, AMBAC Insured, 5.00%, 12/01/29 | | 26,925,000 | | 28,396,182 |
| NATL Insured, 5.00%, 12/01/27 | | 3,105,000 | | 3,138,286 |
| Jefferson County Consolidated School District No. 006 Lease Participation COP, | | | | |
| AGMC Insured, 5.00%, 3/01/25 | | 1,050,000 | | 1,120,770 |
| Joplin IDA Health Facilities Revenue, | | | | |
| Freeman Health System Project, 5.125%, 2/15/26 | | 6,000,000 | | 6,282,480 |
| Freeman Health System Project, 5.50%, 2/15/31 | | 2,055,000 | | 2,150,948 |
| Freeman Health Systems Project, 5.00%, 2/15/28 | | 1,150,000 | | 1,192,780 |
| Freeman Health Systems Project, 5.50%, 2/15/29 | | 2,000,000 | | 2,079,640 |
| Freeman Health Systems Project, 5.75%, 2/15/35 | | 2,500,000 | | 2,560,275 |
| |
| | | | | Annual Report | 133 |
| | | | |
| Franklin Tax-Free Trust | | | | |
| |
| Statement of Investments, February 29, 2012 (continued) | | | | |
| |
| |
| Franklin Missouri Tax-Free Income Fund | | Principal Amount | | Value |
| Municipal Bonds (continued) | | | | |
| Missouri (continued) | | | | |
| Kansas City IDAR, | | | | |
| Downtown Redevelopment District, Refunding, Series A, 5.50%, 9/01/29 | $ | 5,000,000 | $ | 5,680,350 |
| Downtown Redevelopment District, Refunding, Series A, 5.50%, 9/01/30 | | 12,000,000 | | 13,541,040 |
| Downtown Redevelopment District, Refunding, Series A, 5.00%, 9/01/32 | | 3,000,000 | | 3,247,260 |
| Kansas City Missouri IDA, AMBAC Insured, 5.00%, 12/01/24 | | 4,470,000 | | 4,918,117 |
| Kansas City Missouri IDA, AMBAC Insured, 4.50%, 12/01/32 | | 8,250,000 | | 8,588,002 |
| Kansas City Missouri IDA, AMBAC Insured, 5.00%, 12/01/32 | | 15,000,000 | | 16,079,250 |
| Kansas City Sanitation Sewer System Revenue, | | | | |
| Refunding, 5.00%, 1/01/37 | | 29,210,000 | �� | 32,934,859 |
| Series A, 5.25%, 1/01/34 | | 9,500,000 | | 10,740,605 |
| Kansas City Special Obligation Revenue, Arena Project, Refunding and Improvement, Series C, | | | | |
| 5.125%, 4/01/38 | | 10,000,000 | | 10,441,900 |
| Kansas City Special Obligation Tax Allocation, East Village Project, Series B, Assured Guaranty, | | | | |
| 5.00%, 4/15/31 | | 6,445,000 | | 7,144,476 |
| Kansas City Tax Increment Financing Commerce Tax Increment Revenue, Blue Parkway Town | | | | |
| Center Project, NATL Insured, 5.00%, 7/01/27 | | 1,730,000 | | 1,735,138 |
| Kansas City Water Revenue, | | | | |
| Refunding and Improvement, Series A, 5.25%, 12/01/32 | | 12,725,000 | | 14,476,214 |
| Series A, 4.50%, 12/01/32 | | 1,450,000 | | 1,616,881 |
| Series A, 4.50%, 12/01/36 | | 5,155,000 | | 5,594,825 |
| Lake of the Ozarks Community Board Corp. Bridge System Revenue, Refunding, 5.25%, | | | | |
| 12/01/14 | | 410,000 | | 406,265 |
| Lee’s Summit IDAR, John Knox Village Project, Pre-Refunded, 5.70%, 8/15/22 | | 1,500,000 | | 1,551,135 |
| Lee’s Summit Water and Sewer Revenue, Series A, AMBAC Insured, 5.00%, 7/01/22 | | 1,995,000 | | 2,005,893 |
| Lincoln University Auxiliary System Revenue, Assured Guaranty, 5.125%, 6/01/37 | | 2,325,000 | | 2,450,759 |
| Metropolitan St. Louis Sewer District Wastewater System Revenue, | | | | |
| Series A, 5.75%, 5/01/38 | | 2,000,000 | | 2,262,860 |
| Series A, NATL Insured, 5.00%, 5/01/34 | | 24,730,000 | | 25,482,287 |
| Series C, NATL Insured, 5.00%, 5/01/36 | | 22,740,000 | | 24,580,348 |
| Missouri Development Finance Board Cultural Facilities Revenue, Series B, 5.00%, | | | | |
| 6/01/37 | | 28,435,000 | | 30,614,258 |
| Missouri Joint Municipal Electric Utility Commission Power Project Revenue, | | | | |
| Iatan 2 Project, Series A, 6.00%, 1/01/39 | | 15,750,000 | | 17,494,312 |
| Plum Point Project, NATL Insured, 5.00%, 1/01/28 | | 5,235,000 | | 5,401,682 |
| Plum Point Project, NATL Insured, 5.00%, 1/01/34 | | 34,945,000 | | 35,685,485 |
| Series A, AMBAC Insured, 5.00%, 1/01/42 | | 34,410,000 | | 35,807,046 |
| Missouri Southern State College Revenue, Auxiliary Enterprise System, NATL Insured, 5.50%, | | | | |
| 4/01/23 | | 1,200,000 | | 1,202,364 |
| Missouri State Board of Public Buildings Special Obligation Revenue, Refunding, Series A, | | | | |
| 4.00%, 10/01/25 | | 9,370,000 | | 10,388,613 |
| Missouri State Development Finance Board Solid Waste Disposal Revenue, Procter and Gamble | | | | |
| Paper Product, 5.20%, 3/15/29 | | 3,000,000 | | 3,581,580 |
| Missouri State Environmental Improvement and Energy Resources Authority PCR, St. Joseph | | | | |
| Light and Power Co. Project, Refunding, AMBAC Insured, 5.85%, 2/01/13 | | 2,100,000 | | 2,127,405 |
| Missouri State Environmental Improvement and Energy Resources Authority Water PCR, State | | | | |
| Revolving Fund, | | | | |
| Series A, 6.55%, 7/01/14 | | 80,000 | | 80,342 |
| Series A, 5.75%, 1/01/16 | | 80,000 | | 80,281 |
134 | Annual Report
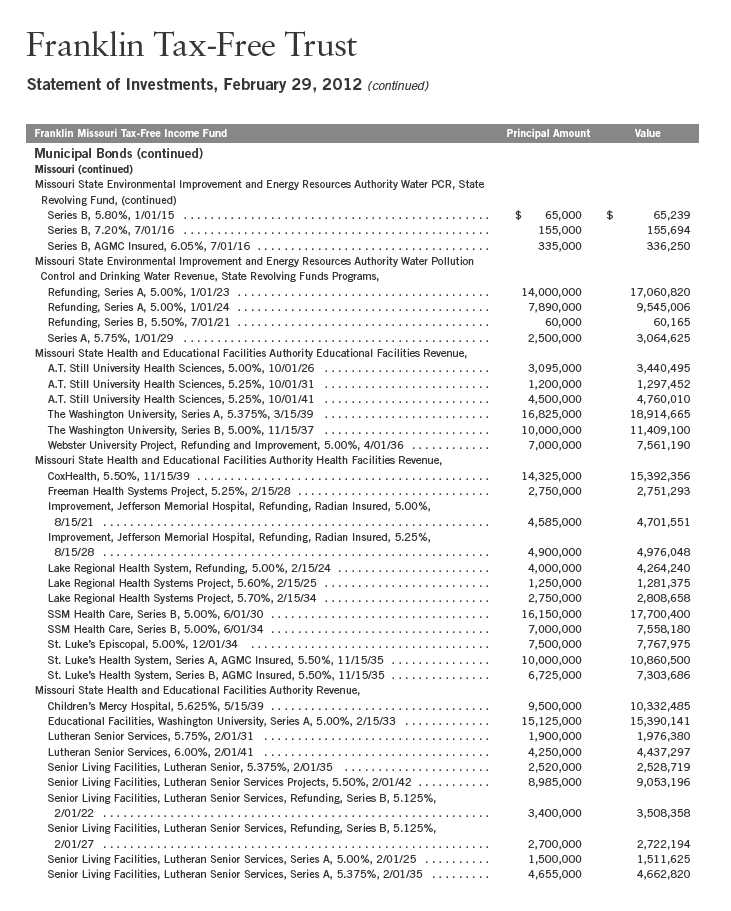
Annual Report | 135

136 | Annual Report

Annual Report | 137
| | | | |
| Franklin Tax-Free Trust | | | | |
| |
| Statement of Investments, February 29, 2012 (continued) | | | | |
| |
| |
| Franklin Missouri Tax-Free Income Fund | | Principal Amount | | Value |
| Municipal Bonds (continued) | | | | |
| U.S. Territories (continued) | | | | |
| Puerto Rico (continued) | | | | |
| Puerto Rico Sales Tax FICO Sales Tax Revenue, first sub., | | | | |
| Refunding, Series A-1, AGMC Insured, 5.00%, 8/01/43 | $ | 1,645,000 | $ | 1,775,514 |
| Refunding, Series C, 5.375%, 8/01/36 | | 6,900,000 | | 7,535,283 |
| Series A, 5.50%, 8/01/37 | | 3,000,000 | | 3,276,810 |
| Series A, 5.375%, 8/01/39 | | 2,000,000 | | 2,165,000 |
| Series B, 6.375%, 8/01/39 | | 10,000,000 | | 11,585,200 |
| Series C, 5.50%, 8/01/40 | | 15,000,000 | | 16,423,950 |
| Series C, 5.25%, 8/01/41 | | 7,500,000 | | 8,074,575 |
| | | | | 265,587,312 |
| U.S. Virgin Islands 0.4% | | | | |
| Virgin Islands PFAR, | | | | |
| Matching Fund Loan Note, senior lien, Series A, 5.00%, 10/01/29 | | 2,500,000 | | 2,626,125 |
| senior lien, Capital Projects, Series A-1, 5.00%, 10/01/39 | | 2,500,000 | | 2,540,850 |
| | | | | 5,166,975 |
| Total U.S. Territories | | | | 270,754,287 |
| Total Municipal Bonds before Short Term Investments | | | | |
| (Cost $1,131,291,053) | | | | 1,207,052,218 |
| Short Term Investments 3.7% | | | | |
| Municipal Bonds 3.7% | | | | |
| Missouri 3.7% | | | | |
| bMissouri Development Finance Board Cultural Facilities Revenue, The Nelson Gallery | | | | |
| Foundation, Refunding, Series A, Daily VRDN and Put, 0.10%, 12/01/37 | | 2,200,000 | | 2,200,000 |
| bMissouri State Health and Educational Facilities Authority Educational Facilities Revenue, | | | | |
| St. Louis University, Daily VRDN and Put, 0.12%, 7/01/32 | | 275,000 | | 275,000 |
| St. Louis University, Refunding, Series A-2, Daily VRDN and Put, 0.12%, 10/01/35 | | 1,750,000 | | 1,750,000 |
| St. Louis University, Refunding, Series B-1, Daily VRDN and Put, 0.10%, 10/01/35 | | 5,205,000 | | 5,205,000 |
| St. Louis University, Refunding, Series B-2, Daily VRDN and Put, 0.12%, 10/01/35 | | 10,245,000 | | 10,245,000 |
| St. Louis University, Series A, Daily VRDN and Put, 0.10%, 10/01/16 | | 2,615,000 | | 2,615,000 |
| St. Louis University, Series B, Daily VRDN and Put, 0.16%, 10/01/24 | | 2,600,000 | | 2,600,000 |
| The Washington University, Series B, Daily VRDN and Put, 0.13%, 2/15/33 | | 2,475,000 | | 2,475,000 |
| bMissouri State Health and Educational Facilities Authority Health Facilities Revenue, | | | | |
| SSM Health Care, Series C, Daily VRDN and Put, 0.19%, 6/01/45 | | 2,270,000 | | 2,270,000 |
| bNorth Kansas City Hospital Revenue, North Kansas City Hospital, Refunding, Daily VRDN and | | | | |
| Put, 0.20%, 11/01/33 | | 17,100,000 | | 17,100,000 |
| Total Short Term Investments (Cost $46,735,000) | | | | 46,735,000 |
| Total Investments (Cost $1,178,026,053) 98.8% | | | | 1,253,787,218 |
| Other Assets, less Liabilities 1.2% | | | | 15,502,692 |
| Net Assets 100.0% | | | $ | 1,269,289,910 |
See Abbreviations on page 184.
aSecurity purchased on a when-issued basis. See Note 1(b).
bVariable rate demand notes (VRDNs) are tax-exempt obligations which contain a floating or variable interest rate adjustment formula and an unconditional right of demand to receive payment of the principal balance plus accrued interest at specified dates. The coupon rate shown represents the rate at period end.
138 | The accompanying notes are an integral part of these financial statements. | Annual Report
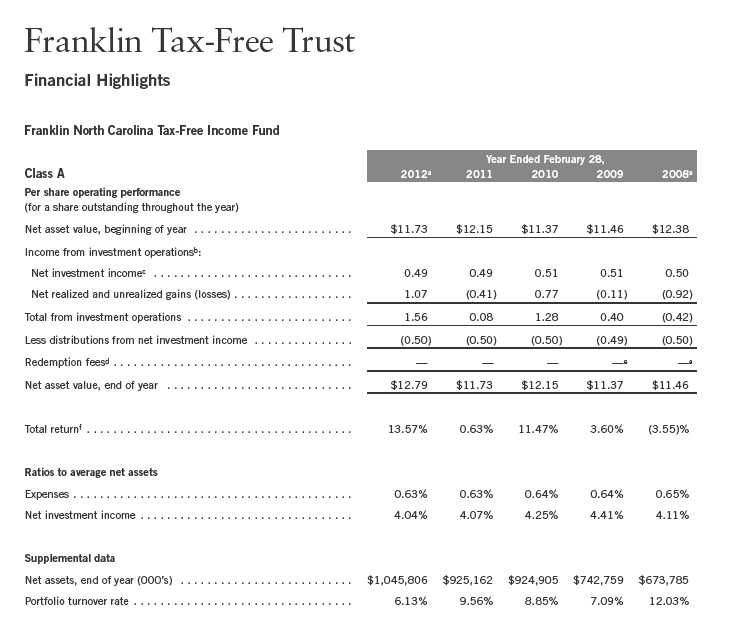
aFor the year ended February 29.
bThe amount shown for a share outstanding throughout the period may not correlate with the Statement of Operations for the period due to the timing of sales and repurchases of
the Fund shares in relation to income earned and/or fluctuating market value of the investments of the Fund.
cBased on average daily shares outstanding.
dEffective September 1, 2008, the redemption fee was eliminated.
eAmount rounds to less than $0.01 per share.
fTotal return does not reflect sales commissions or contingent deferred sales charges, if applicable.
Annual Report | The accompanying notes are an integral part of these financial statements. | 139

aFor the year ended February 29.
bThe amount shown for a share outstanding throughout the period may not correlate with the Statement of Operations for the period due to the timing of sales and repurchases of
the Fund shares in relation to income earned and/or fluctuating market value of the investments of the Fund.
cBased on average daily shares outstanding.
dEffective September 1, 2008, the redemption fee was eliminated.
eAmount rounds to less than $0.01 per share.
fTotal return does not reflect sales commissions or contingent deferred sales charges, if applicable.
140 | The accompanying notes are an integral part of these financial statements. | Annual Report
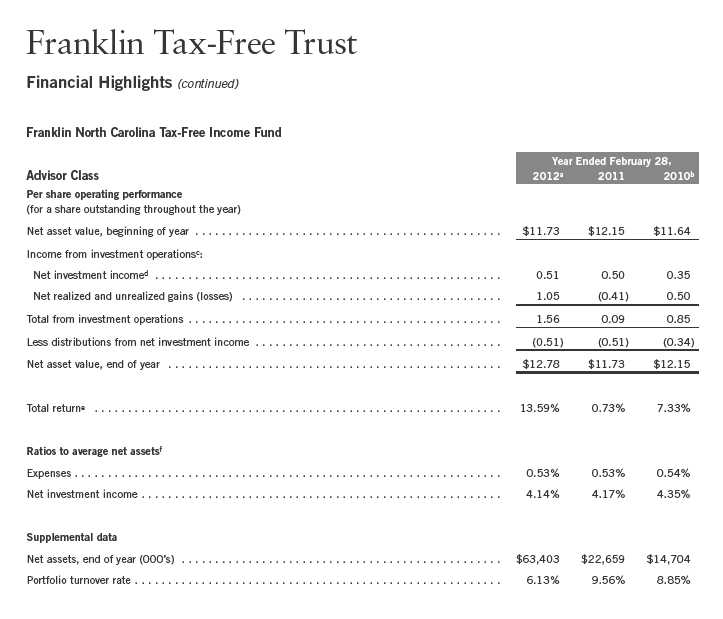
aFor the year ended February 29.
bFor the period July 1, 2009 (effective date) to February 28, 2010.
cThe amount shown for a share outstanding throughout the period may not correlate with the Statement of Operations for the period due to the timing of sales and repurchases of
the Fund shares in relation to income earned and/or fluctuating market value of the investments of the Fund.
dBased on average daily shares outstanding.
eTotal return is not annualized for periods less than one year.
fRatios are annualized for periods less than one year.
Annual Report | The accompanying notes are an integral part of these financial statements. | 141

142 | Annual Report
| | | | |
| Franklin Tax-Free Trust | | | | |
| |
| Statement of Investments, February 29, 2012 (continued) | | | | |
| |
| |
| Franklin North Carolina Tax-Free Income Fund | | Principal Amount | | Value |
| Municipal Bonds (continued) | | | | |
| North Carolina (continued) | | | | |
| Dare County Utility System Revenue, 5.00%, 2/01/41 | $ | 5,000,000 | $ | 5,545,200 |
| Durham County COP, Series A, 5.00%, 6/01/31 | | 4,000,000 | | 4,489,240 |
| Durham County Enterprise System Revenue, NATL Insured, 5.00%, 6/01/23 | | 1,670,000 | | 1,728,033 |
| Durham Utility System Revenue, Refunding, 5.00%, 6/01/41 | | 4,000,000 | | 4,537,520 |
| Greensboro HDC Mortgage Revenue, Refunding, Series A, NATL Insured, 6.70%, 1/01/24 | | 475,000 | | 475,290 |
| Greenville Utilities Commission Combined Enterprise System Revenue, Refunding, Series A, | | | | |
| AGMC Insured, 5.00%, 11/01/33 | | 6,000,000 | | 6,563,520 |
| Guilford County GO, Refunding, Series C, 5.00%, 2/01/22 | | 5,920,000 | | 7,246,494 |
| Halifax County Industrial Facilities and PCFA Revenue, Champion International Corp. Project, | | | | |
| 5.45%, 11/01/33 | | 4,000,000 | | 3,949,640 |
| Refunding, 6.45%, 11/01/29 | | 3,900,000 | | 3,902,223 |
| Harnett County COP, | | | | |
| AGMC Insured, Pre-Refunded, 5.125%, 12/01/23 | | 1,000,000 | | 1,046,560 |
| Assured Guaranty, 5.00%, 6/01/28 | | 1,000,000 | | 1,127,840 |
| Assured Guaranty, 5.00%, 6/01/29 | | 500,000 | | 560,810 |
| High Point Combined Enterprise System Revenue, | | | | |
| AGMC Insured, 5.00%, 11/01/33 | | 5,000,000 | | 5,504,000 |
| NATL RE, FGIC Insured, 5.00%, 11/01/31 | | 11,000,000 | | 11,499,840 |
| Iredell County COP, Iredell County School Project, AGMC Insured, | | | | |
| 5.125%, 6/01/27 | | 4,000,000 | | 4,504,400 |
| 5.00%, 6/01/28 | | 1,000,000 | | 1,114,190 |
| Johnston Memorial Hospital Authority Mortgage Revenue, AGMC Insured, 5.25%, | | | | |
| 10/01/36 | | 7,000,000 | | 7,585,060 |
| Mecklenburg County COP, Series A, 5.00%, 2/01/28 | | 350,000 | | 393,358 |
| Monroe COP, Assured Guaranty, 5.50%, | | | | |
| 3/01/34 | | 2,425,000 | | 2,720,195 |
| 3/01/39 | | 1,085,000 | | 1,202,896 |
| Nash Health Care System Health Care Facilities Revenue, AGMC Insured, 5.00%, | | | | |
| 11/01/30 | | 2,250,000 | | 2,399,175 |
| New Hanover County Hospital Revenue, New Hanover Regional Medical Center Project, | | | | |
| Refunding, Series B, AGMC Insured, | | | | |
| 5.00%, 10/01/27 | | 3,500,000 | | 3,861,165 |
| 5.125%, 10/01/31 | | 8,385,000 | | 9,161,786 |
| North Carolina Capital Facilities Finance Agency Educational Facilities Revenue, | | | | |
| Johnson and Wales University Project, Series A, XLCA Insured, 5.00%, 4/01/33 | | 3,000,000 | | 3,006,390 |
| Wake Forest University, 5.00%, 1/01/38 | | 27,000,000 | | 29,661,120 |
| North Carolina Capital Facilities Finance Agency Revenue, Duke University Project, | | | | |
| Refunding, Series A, 5.00%, 10/01/41 | | 11,080,000 | | 11,949,891 |
| Refunding, Series A, 5.00%, 10/01/44 | | 12,050,000 | | 13,207,161 |
| Refunding, Series B, 5.00%, 10/01/38 | | 20,000,000 | | 22,626,800 |
| Refunding, Series B, 4.75%, 7/01/42 | | 10,000,000 | | 10,782,200 |
| Series A, 5.00%, 10/01/39 | | 2,615,000 | | 2,866,118 |
| Series A, Pre-Refunded, 5.25%, 7/01/42 | | 10,000,000 | | 10,290,400 |
| North Carolina Eastern Municipal Power Agency Power System Revenue, | | | | |
| Refunding, Series A, 6.50%, 1/01/18 | | 3,000,000 | | 3,794,940 |
| Refunding, Series A, 5.00%, 1/01/24 | | 10,000,000 | | 11,128,500 |
| Refunding, Series A, AMBAC Insured, 5.00%, 1/01/21 | | 11,555,000 | | 12,891,913 |
| Series C, 6.75%, 1/01/24 | | 3,500,000 | | 4,323,585 |
Annual Report | 143
| | | | |
| Franklin Tax-Free Trust | | | | |
| |
| Statement of Investments, February 29, 2012 (continued) | | | | |
| |
| |
| Franklin North Carolina Tax-Free Income Fund | | Principal Amount | | Value |
| Municipal Bonds (continued) | | | | |
| North Carolina (continued) | | | | |
| North Carolina HFAR, | | | | |
| Home Ownership, Refunding, Series 12-C, 5.35%, 7/01/33 | $ | 10,000,000 | $ | 10,007,900 |
| SF, Refunding, Series DD, FHA Insured, 6.20%, 9/01/27 | | 345,000 | | 352,580 |
| SFR, Series AA, 6.25%, 3/01/17 | | 95,000 | | 95,024 |
| North Carolina Medical Care Commission Health Care Facilities Revenue, | | | | |
| Duke University Health System, Series A, 5.00%, 6/01/42 | | 11,500,000 | | 12,350,540 |
| Duke University Health System, Series A, 5.00%, 6/01/42 | | 8,150,000 | | 8,793,932 |
| FirstHealth Carolinas Project, Series A, 6.125%, 10/01/39 | | 11,315,000 | | 12,117,007 |
| FirstHealth Carolinas Project, Series C, 5.00%, 10/01/29 | | 5,000,000 | | 5,171,600 |
| Novant Health Obligated Group, NATL Insured, 5.00%, 11/01/39 | | 9,680,000 | | 9,962,559 |
| Refunding, NATL RE, FGIC Insured, 5.00%, 1/01/33 | | 10,805,000 | | 10,951,732 |
| Rex Healthcare, Refunding, Series A, 5.00%, 7/01/30 | | 5,000,000 | | 5,354,350 |
| Scotland Memorial Hospital Project, Radian Insured, 5.50%, 10/01/19 | | 550,000 | | 550,787 |
| Scotland Memorial Hospital Project, Radian Insured, 5.50%, 10/01/29 | | 1,220,000 | | 1,220,830 |
| University Health System, Refunding, Series D, 6.25%, 12/01/33 | | 10,000,000 | | 11,367,500 |
| WakeMed Project, AMBAC Insured, 5.00%, 10/01/32 | | 4,205,000 | | 4,226,782 |
| WakeMed Project, Series A, Assured Guaranty, 5.625%, 10/01/29 | | 1,500,000 | | 1,589,100 |
| WakeMed Project, Series A, Assured Guaranty, 5.625%, 10/01/38 | | 6,000,000 | | 6,279,240 |
| WakeMed Project, Series A, Assured Guaranty, 5.875%, 10/01/38 | | 2,515,000 | | 2,647,339 |
| North Carolina Medical Care Commission Health Care System Facilities Revenue, Appalachian | | | | |
| Regional Healthcare System, Refunding, Series A, | | | | |
| 6.50%, 7/01/31 | | 5,000,000 | | 5,628,400 |
| 6.625%, 7/01/34 | | 6,000,000 | | 6,728,400 |
| North Carolina Medical Care Commission Health System Revenue, Mission Health | | | | |
| Combination, Refunding, AGMC Insured, 5.00%, 10/01/36 | | 5,000,000 | | 5,272,950 |
| North Carolina Medical Care Commission Hospital Revenue, | | | | |
| Annie Penn Memorial Hospital Project, Pre-Refunded, 5.375%, 1/01/22 | | 1,920,000 | | 2,140,992 |
| Halifax Regional Medical Center Project, 5.00%, 8/15/24 | | 1,800,000 | | 1,666,008 |
| North Carolina Baptist Hospital, Refunding, 5.00%, 6/01/34 | | 10,000,000 | | 10,608,900 |
| Southeastern Regional Medical Center, 6.25%, 6/01/29 | | 4,000,000 | | 4,006,440 |
| Southeastern Regional Medical Center, 5.375%, 6/01/32 | | 3,500,000 | | 3,543,715 |
| North Carolina Medical Care Commission Revenue, | | | | |
| Betsy Johnson Project, AGMC Insured, Pre-Refunded, 5.125%, 10/01/32 | | 4,500,000 | | 4,844,025 |
| Rowan Regional Medical Center, AGMC Insured, 5.00%, 9/01/33 | | 21,720,000 | | 22,219,343 |
| North Carolina Municipal Power Agency No. 1 Catawba Electric Revenue, | | | | |
| Refunding, Series A, 5.00%, 1/01/26 | | 2,500,000 | | 2,824,400 |
| Refunding, Series A, 5.00%, 1/01/30 | | 4,670,000 | | 5,151,244 |
| Refunding, Series B, 5.00%, 1/01/21 | | 5,000,000 | | 5,933,700 |
| Series A, NATL Insured, 5.25%, 1/01/19 | | 5,000,000 | | 5,178,950 |
| Series A, NATL Insured, 5.25%, 1/01/20 | | 1,500,000 | | 1,550,910 |
| North Carolina State Capital Facilities Finance Agency Revenue, Davidson College, 5.00%, | | | | |
| 3/01/40 | | 4,000,000 | | 4,538,200 |
| North Carolina State Capital Improvement Limited Obligation Revenue, | | | | |
| Series A, 5.00%, 5/01/28 | | 5,000,000 | | 5,669,250 |
| Series C, 5.00%, 5/01/29 | | 10,000,000 | | 11,739,100 |
| North Carolina State COP, Western Carolina University Housing Project, AMBAC Insured, | | | | |
| 5.00%, 6/01/33 | | 1,500,000 | | 1,522,590 |
144 | Annual Report
| | | | |
| Franklin Tax-Free Trust | | | | |
| |
| Statement of Investments, February 29, 2012 (continued) | | | | |
| |
| |
| Franklin North Carolina Tax-Free Income Fund | | Principal Amount | | Value |
| Municipal Bonds (continued) | | | | |
| North Carolina (continued) | | | | |
| North Carolina State GO, | | | | |
| Public Improvement, Series A, 5.00%, 5/01/23 | $ | 10,000,000 | $ | 12,537,600 |
| Public Improvement, Series A, 5.00%, 5/01/24 | | 23,370,000 | | 29,138,884 |
| Public Improvement, Series A, 4.50%, 3/01/26 | | 4,855,000 | | 5,362,930 |
| Refunding, Series B, 5.00%, 6/01/19 | | 5,000,000 | | 6,281,950 |
| North Carolina State Infrastructure Financial Corp. COP, Capital Improvement, Series A, | | | | |
| AGMC Insured, 5.00%, 5/01/22 | | 6,595,000 | | 7,510,914 |
| North Carolina State Ports Authority Port Facilities Revenue, senior lien, Refunding, Series A, | | | | |
| 5.25%, 2/01/40 | | 6,000,000 | | 6,296,340 |
| North Carolina State Turnpike Authority Monroe Connector System State Appropriated Revenue, | | | | |
| 5.00%, 7/01/41 | | 6,565,000 | | 7,336,716 |
| North Carolina Turnpike Authority Triangle Expressway System Revenue, Series A, | | | | |
| Assured Guaranty, | | | | |
| 5.50%, 1/01/29 | | 6,400,000 | | 7,174,656 |
| 5.75%, 1/01/39 | | 12,120,000 | | 13,420,476 |
| Northern Hospital District of Surry County Health Care Facilities Revenue, | | | | |
| 6.00%, 10/01/28 | | 1,000,000 | | 1,048,040 |
| 6.25%, 10/01/38 | | 2,000,000 | | 2,105,940 |
| Oak Island Enterprise System Revenue, | | | | |
| Assured Guaranty, 6.00%, 6/01/34 | | 1,540,000 | | 1,752,551 |
| Assured Guaranty, 6.00%, 6/01/36 | | 1,000,000 | | 1,129,250 |
| Series A, NATL Insured, 5.00%, 6/01/33 | | 5,000,000 | | 5,353,150 |
| Onslow County Hospital Authority FHA Insured Mortgage Revenue, Onslow Memorial Hospital | | | | |
| Project, NATL Insured, 5.00%, | | | | |
| 4/01/31 | | 5,830,000 | | 6,135,958 |
| 10/01/34 | | 6,000,000 | | 6,289,140 |
| Onslow Water and Sewer Authority Combined Enterprise System Revenue, Series A, | | | | |
| NATL Insured, 5.00%, 6/01/33 | | 7,500,000 | | 8,173,500 |
| Pasquotank County COP, NATL Insured, 5.00%, 6/01/25 | | 1,400,000 | | 1,460,438 |
| Pitt County COP, School Facilities Project, Series B, AMBAC Insured, 5.00%, 4/01/29 | | 2,500,000 | | 2,653,550 |
| Pitt County Revenue, Assured Guaranty, 5.00%, 4/01/34 | | 1,000,000 | | 1,115,080 |
| Raleigh Combined Enterprise System Revenue, | | | | |
| 5.00%, 3/01/31 | | 10,360,000 | | 11,006,878 |
| 5.00%, 3/01/40 | | 11,915,000 | | 13,578,811 |
| Series A, 5.00%, 3/01/36 | | 6,000,000 | | 6,623,700 |
| Raleigh COP, Downtown Improvement Projects, Series A, 5.00%, 2/01/29 | | 6,070,000 | | 6,406,946 |
| Raleigh-Durham Airport Authority Airport Revenue, | | | | |
| Refunding, Series A, 5.00%, 5/01/36 | | 10,785,000 | | 11,747,885 |
| Series A, AMBAC Insured, 5.00%, 5/01/30 | | 14,060,000 | | 14,843,564 |
| Rockingham County COP, Assured Guaranty, 5.00%, 4/01/32 | | 9,380,000 | | 10,132,745 |
| Union County COP, AMBAC Insured, 5.00%, 6/01/30 | | 5,000,000 | | 5,405,400 |
| University of North Carolina at Asheville Revenue, General, | | | | |
| Refunding, Series A, AMBAC Insured, 5.00%, 6/01/27 | | 790,000 | | 794,803 |
| Series A, AMBAC Insured, Pre-Refunded, 5.00%, 6/01/27 | | 410,000 | | 414,727 |
| University of North Carolina at Chapel Hill Revenue, Board of Governors of the University of | | | | |
| North Carolina, General, | | | | |
| 5.00%, 12/01/28 | | 1,000,000 | | 1,065,540 |
| 5.00%, 12/01/31 | | 9,000,000 | | 10,134,090 |
Annual Report | 145
| | | | |
| Franklin Tax-Free Trust | | | | |
| |
| Statement of Investments, February 29, 2012 (continued) | | | | |
| |
| |
| Franklin North Carolina Tax-Free Income Fund | | Principal Amount | | Value |
| Municipal Bonds (continued) | | | | |
| North Carolina (continued) | | | | |
| University of North Carolina at Chapel Hill Revenue, Board of Governors of the University of | | | | |
| North Carolina, General, (continued) | | | | |
| Refunding, Series A, 5.00%, 12/01/34 | $ | 11,460,000 | $ | 12,824,084 |
| Series A, 5.00%, 12/01/25 | | 4,000,000 | | 4,011,800 |
| University of North Carolina at Charlotte Revenue, | | | | |
| General, Series B, AGMC Insured, 5.00%, 4/01/32 | | 5,000,000 | | 5,430,400 |
| Series A, 5.00%, 4/01/37 | | 12,995,000 | | 14,543,614 |
| Series A, 5.00%, 4/01/41 | | 18,000,000 | | 20,080,440 |
| University of North Carolina at Greensboro Revenue, General, Series A, Assured Guaranty, | | | | |
| 5.00%, 4/01/34 | | 1,000,000 | | 1,117,790 |
| University of North Carolina at Wilmington COP, Student Housing Project, | | | | |
| Assured Guaranty, 5.00%, 6/01/32 | | 5,000,000 | | 5,393,550 |
| NATL RE, FGIC Insured, 5.00%, 6/01/26 | | 1,655,000 | | 1,759,298 |
| NATL RE, FGIC Insured, 5.00%, 6/01/27 | | 1,740,000 | | 1,841,198 |
| NATL RE, FGIC Insured, 5.00%, 6/01/29 | | 1,915,000 | | 2,012,493 |
| NATL RE, FGIC Insured, 5.00%, 6/01/37 | | 11,350,000 | | 11,729,657 |
| University of North Carolina System Revenue, | | | | |
| 2011, Series A, AMBAC Insured, Pre-Refunded, 5.00%, 4/01/27 | | 290,000 | | 297,923 |
| AMBAC Insured, 5.00%, 4/01/29 | | 2,500,000 | | 2,622,825 |
| Series A, AMBAC Insured, Pre-Refunded, 5.00%, 4/01/27 | | 1,315,000 | | 1,350,925 |
| Series A, AMBAC Insured, Pre-Refunded, 5.00%, 4/01/27 | | 495,000 | | 499,549 |
| Series A, Assured Guaranty, 5.00%, 10/01/33 | | 5,000,000 | | 5,492,200 |
| Series A, NATL Insured, 5.00%, 10/01/33 | | 2,000,000 | | 2,128,300 |
| Wake County GO, | | | | |
| Limited Obligation Bonds, Series 2009, 5.00%, 6/01/36 | | 5,000,000 | | 5,701,950 |
| Refunding, Series C, 5.00%, 3/01/25 | | 10,000,000 | | 13,175,000 |
| Wake County Industrial Facilities and PCFA Revenue, Carolina Power and Light Co. Project, | | | | |
| Refunding, 5.375%, 2/01/17 | | 8,000,000 | | 8,104,960 |
| Wake County Revenue, 5.00%, | | | | |
| 1/01/33 | | 10,820,000 | | 12,506,081 |
| 1/01/37 | | 12,000,000 | | 13,697,760 |
| Western Carolina University Research and Development Corp. COP, Western Carolina University | | | | |
| Student Housing, Assured Guaranty, 5.00%, 6/01/39 | | 5,000,000 | | 5,310,200 |
| Wilkes County COP, NATL Insured, 5.00%, | | | | |
| 6/01/31 | | 4,295,000 | | 4,532,642 |
| 6/01/36 | | 6,085,000 | | 6,351,097 |
| Wilmington COP, | | | | |
| AMBAC Insured, 5.00%, 9/01/29 | | 1,000,000 | | 1,046,390 |
| Refunding, Series A, AMBAC Insured, 5.00%, 6/01/32 | | 5,310,000 | | 5,538,383 |
| Series A, 5.00%, 6/01/33 | | 6,000,000 | | 6,563,520 |
| Series A, 5.00%, 6/01/38 | | 7,625,000 | | 8,216,319 |
| Wilmington Storm Water Fee Revenue, Refunding, AMBAC Insured, 5.00%, 6/01/33 | | 1,000,000 | | 1,081,620 |
| Wilmington Water and Sewer System Revenue, Refunding, AGMC Insured, 5.00%, | | | | |
| 6/01/34 | | 3,565,000 | | 3,718,331 |
| Wilson COP, Public Facilities Project, Assured Guaranty, 5.00%, 5/01/33 | | 3,000,000 | | 3,245,400 |
146 | Annual Report
| | | | |
| Franklin Tax-Free Trust | | | | |
| |
| Statement of Investments, February 29, 2012 (continued) | | | | |
| |
| |
| Franklin North Carolina Tax-Free Income Fund | | Principal Amount | | Value |
| Municipal Bonds (continued) | | | | |
| North Carolina (continued) | | | | |
| Winston-Salem Water and Sewer System Revenue, | | | | |
| 5.00%, 6/01/39 | $ | 5,000,000 | $ | 5,649,600 |
| Refunding, Series A, 5.00%, 6/01/32 | | 7,590,000 | | 8,500,193 |
| | | | | 1,114,423,062 |
| U.S. Territories 18.7% | | | | |
| Puerto Rico 18.3% | | | | |
| Children’s Trust Fund Puerto Rico Tobacco Settlement Revenue, Asset-Backed Bonds, | | | | |
| Refunding, 5.50%, 5/15/39 | | 7,000,000 | | 6,883,030 |
| Puerto Rico Commonwealth Aqueduct and Sewer Authority Revenue, senior lien, Series A, | | | | |
| 6.00%, 7/01/38 | | 2,100,000 | | 2,273,901 |
| Puerto Rico Commonwealth GO, | | | | |
| Public Improvement, Refunding, AGMC Insured, 5.125%, 7/01/30 | | 3,445,000 | | 3,447,894 |
| Public Improvement, Refunding, Series A, 5.50%, 7/01/32 | | 5,000,000 | | 5,207,900 |
| Public Improvement, Refunding, Series A, 5.75%, 7/01/41 | | 5,000,000 | | 5,447,400 |
| Public Improvement, Refunding, Series B, 6.00%, 7/01/39 | | 10,000,000 | | 10,932,700 |
| Public Improvement, Series A, 5.375%, 7/01/28 | | 4,925,000 | | 4,938,297 |
| Public Improvement, Series A, 5.125%, 7/01/31 | | 3,265,000 | | 3,269,114 |
| Public Improvement, Series A, 5.25%, 7/01/37 | | 5,000,000 | | 5,182,600 |
| Series A, 5.00%, 7/01/26 | | 8,050,000 | | 8,404,522 |
| Puerto Rico Commonwealth Highway and Transportation Authority Transportation Revenue, | | | | |
| Refunding, Series A, NATL Insured, 5.00%, 7/01/38 | | 20,000 | | 20,005 |
| Refunding, Series H, 5.00%, 7/01/35 | | 1,365,000 | | 1,376,193 |
| Series D, AGMC Insured, 5.00%, 7/01/32 | | 2,765,000 | | 2,773,129 |
| Series D, AGMC Insured, Pre-Refunded, 5.00%, 7/01/32 | | 295,000 | | 299,540 |
| Series D, Pre-Refunded, 5.375%, 7/01/36 | | 5,000,000 | | 5,082,150 |
| Series H, Pre-Refunded, 5.00%, 7/01/35 | | 2,915,000 | | 3,099,579 |
| Puerto Rico Convention Center District Authority Hotel Occupancy Tax Revenue, Series A, | | | | |
| AMBAC Insured, 5.00%, 7/01/31 | | 5,000,000 | | 5,126,500 |
| Puerto Rico Electric Power Authority Power Revenue, | | | | |
| Series NN, NATL Insured, Pre-Refunded, 5.00%, 7/01/32 | | 5,000,000 | | 5,313,300 |
| Series RR, FGIC Insured, Pre-Refunded, 5.00%, 7/01/35 | | 3,000,000 | | 3,445,290 |
| Series RR, XLCA Insured, Pre-Refunded, 5.00%, 7/01/30 | | 1,000,000 | | 1,148,430 |
| Series TT, 5.00%, 7/01/32 | | 8,100,000 | | 8,413,551 |
| Series WW, 5.25%, 7/01/33 | | 6,500,000 | | 6,886,230 |
| Series WW, 5.50%, 7/01/38 | | 6,700,000 | | 7,182,668 |
| Series XX, 5.25%, 7/01/40 | | 30,510,000 | | 31,952,208 |
| Puerto Rico Infrastructure Financing Authority Revenue, Ports Authority Project, Series B, | | | | |
| 5.25%, 12/15/26 | | 5,000,000 | | 5,367,300 |
| Puerto Rico PBA Guaranteed Revenue, Government Facilities, | | | | |
| Refunding, Series D, 5.375%, 7/01/33 | | 1,790,000 | | 1,798,252 |
| Refunding, Series N, 5.00%, 7/01/32 | | 10,000,000 | | 10,314,800 |
| Refunding, Series P, 6.75%, 7/01/36 | | 5,000,000 | | 5,755,350 |
| Series D, Pre-Refunded, 5.375%, 7/01/33 | | 5,210,000 | | 5,293,881 |
| Series I, 5.00%, 7/01/36 | | 2,405,000 | | 2,435,327 |
Annual Report | 147
| | | | |
| Franklin Tax-Free Trust | | | | |
| |
| Statement of Investments, February 29, 2012 (continued) | | | | |
| |
| Franklin North Carolina Tax-Free Income Fund | | Principal Amount | | Value |
| Municipal Bonds (continued) | | | | |
| U.S. Territories (continued) | | | | |
| Puerto Rico (continued) | | | | |
| Puerto Rico Sales Tax FICO Sales Tax Revenue, first sub., | | | | |
| Series A, 5.375%, 8/01/39 | $ | 20,000,000 | $ | 21,650,000 |
| Series A, 5.50%, 8/01/42 | | 5,750,000 | | 6,276,470 |
| Series A, 6.00%, 8/01/42 | | 45,750,000 | | 51,782,137 |
| Series C, 5.50%, 8/01/40 | | 5,000,000 | | 5,474,650 |
| | | | | 254,254,298 |
| U.S. Virgin Islands 0.4% | | | | |
| Virgin Islands PFAR, senior lien, Refunding, Series B, 5.00%, 10/01/25 | | 5,500,000 | | 5,896,935 |
| Total U.S. Territories | | | | 260,151,233 |
| Total Municipal Bonds (Cost $1,285,717,385) 98.9% | | | | 1,374,574,295 |
| Other Assets, less Liabilities 1.1% | | | | 14,770,767 |
| Net Assets 100.0% | | | $ | 1,389,345,062 |
| |
| |
| See Abbreviations on page 184. | | | | |
148 | The accompanying notes are an integral part of these financial statements. | Annual Report
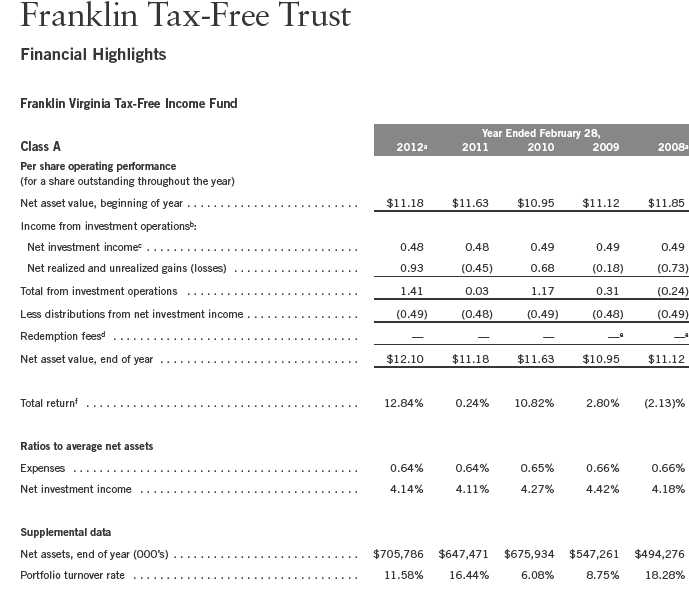
aFor the year ended February 29.
bThe amount shown for a share outstanding throughout the period may not correlate with the Statement of Operations for the period due to the timing of sales and repurchases of
the Fund shares in relation to income earned and/or fluctuating market value of the investments of the Fund.
cBased on average daily shares outstanding.
dEffective September 1, 2008, the redemption fee was eliminated.
eAmount rounds to less than $0.01 per share.
fTotal return does not reflect sales commissions or contingent deferred sales charges, if applicable.
Annual Report | The accompanying notes are an integral part of these financial statements. | 149
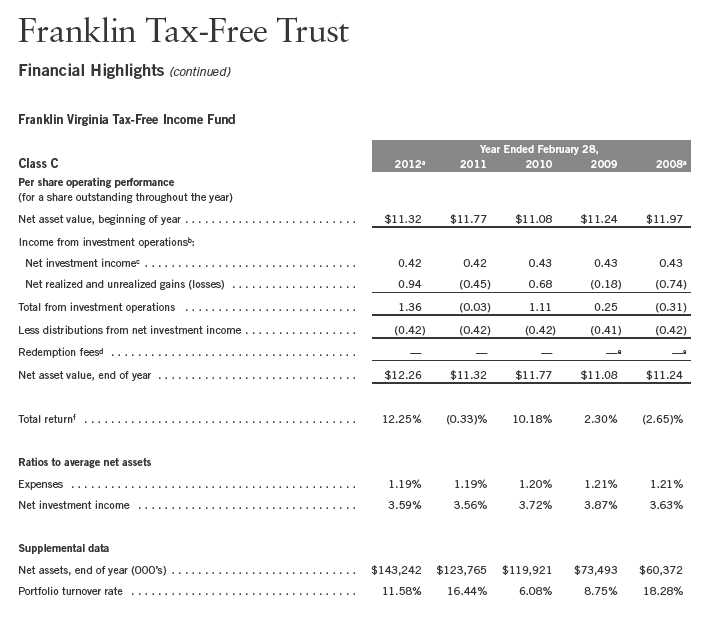
aFor the year ended February 29.
bThe amount shown for a share outstanding throughout the period may not correlate with the Statement of Operations for the period due to the timing of sales and repurchases of
the Fund shares in relation to income earned and/or fluctuating market value of the investments of the Fund.
cBased on average daily shares outstanding.
dEffective September 1, 2008, the redemption fee was eliminated.
eAmount rounds to less than $0.01 per share.
fTotal return does not reflect sales commissions or contingent deferred sales charges, if applicable.
150 | The accompanying notes are an integral part of these financial statements. | Annual Report

aFor the year ended February 29.
bFor the period July 1, 2009 (effective date) to February 28, 2010.
cThe amount shown for a share outstanding throughout the period may not correlate with the Statement of Operations for the period due to the timing of sales and repurchases of
the Fund shares in relation to income earned and/or fluctuating market value of the investments of the Fund.
dBased on average daily shares outstanding.
eTotal return is not annualized for periods less than one year.
fRatios are annualized for periods less than one year.
Annual Report | The accompanying notes are an integral part of these financial statements. | 151
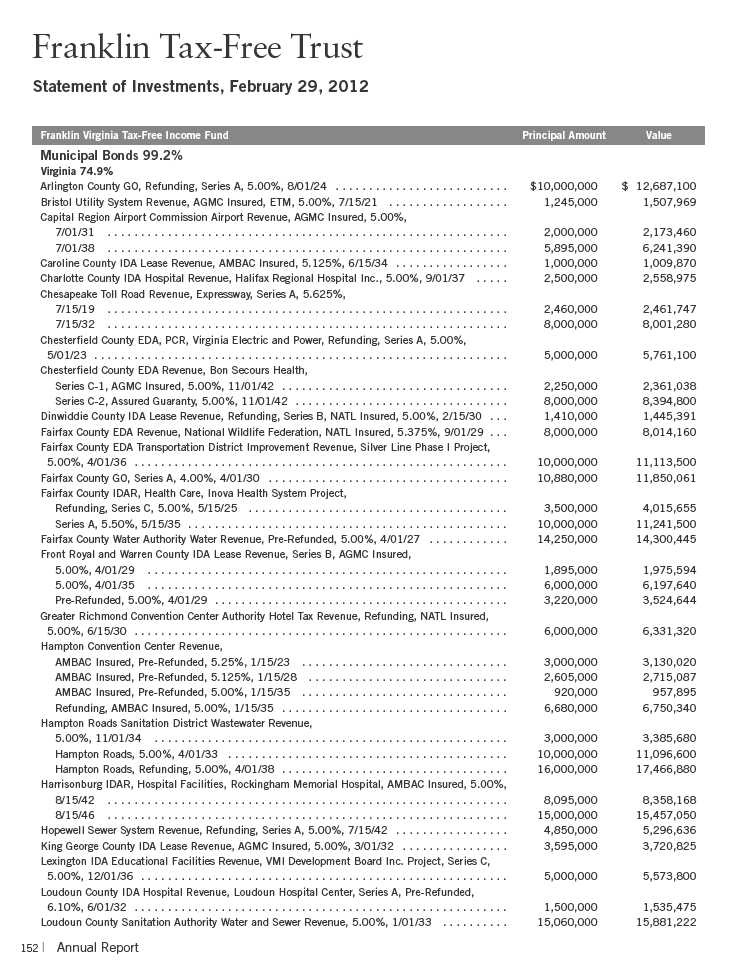
| | | | |
| Franklin Tax-Free Trust | | | | |
| |
| Statement of Investments, February 29, 2012 (continued) | | | | |
| |
| |
| Franklin Virginia Tax-Free Income Fund | | Principal Amount | | Value |
| Municipal Bonds (continued) | | | | |
| Virginia (continued) | | | | |
| Manassas Park GO, Series A, CIFG Insured, 5.00%, 4/01/29 | $ | 5,545,000 | $ | 6,071,276 |
| Middle River Regional Jail Authority Jail Facility Revenue, NATL Insured, 5.00%, 5/15/28 | | 1,000,000 | | 1,050,620 |
| Montgomery County EDA Revenue, Virginia Tech Foundation, Refunding, Series A, 4.25%, | | | | |
| 6/01/36 | | 5,000,000 | | 5,189,500 |
| Montgomery County IDA Public Facilities Lease Revenue, Public Projects, 5.00%, 2/01/29 | | 6,500,000 | | 7,191,210 |
| Newport News EDA, EDR, Series A, 5.00%, 1/15/31 | | 5,870,000 | | 6,252,900 |
| Norfolk Water Revenue, NATL Insured, 5.90%, 11/01/25 | | 5,000,000 | | 5,014,900 |
| Northwestern Regional Jail Authority Jail Facilities Revenue, NATL Insured, 5.00%, 7/01/33 | | 2,600,000 | | 2,702,960 |
| Patrick County EDA Lease Revenue, School Projects, Assured Guaranty, 5.25%, 3/01/39 | | 6,435,000 | | 6,955,591 |
| Pittsylvania County GO, Series B, 5.75%, 2/01/30 | | 5,800,000 | | 6,756,536 |
| Powhatan County EDA Lease Revenue, Virginia Capital Projects, AMBAC Insured, Pre-Refunded, | | | | |
| 5.25%, 7/15/33 | | 1,000,000 | | 1,028,140 |
| Prince William County GO, Public Improvement, Refunding, Series A, 5.00%, | | | | |
| 8/01/26 | | 1,190,000 | | 1,556,425 |
| 8/01/27 | | 1,025,000 | | 1,338,660 |
| Prince William County IDA Revenue, George Mason University Foundation, Prince William Life | | | | |
| Sciences Lab LLC Project, Series AA, 5.125%, 9/01/41 | | 3,200,000 | | 3,403,904 |
| Prince William County IDA, MFHR, Remington Place Apartments Project, Series A-1, | | | | |
| AMBAC Insured, 6.00%, 12/01/33 | | 2,080,000 | | 2,080,936 |
| Prince William County Service Authority Water and Sewer System Revenue, Refunding, 5.00%, | | | | |
| 7/01/32 | | 1,750,000 | | 1,870,103 |
| Richmond Public Facilities COP, 800 Megahertz Project, Series A, AMBAC Insured, 5.00%, | | | | |
| 8/01/22 | | 2,000,000 | | 2,003,540 |
| Richmond Public Utility Revenue, | | | | |
| AGMC Insured, 5.00%, 1/15/35 | | 3,500,000 | | 3,681,580 |
| Refunding, 5.00%, 1/15/35 | | 11,495,000 | | 12,842,674 |
| Riverside Regional Jail Authority Jail Facility Revenue, NATL Insured, 5.00%, | | | | |
| 7/01/28 | | 7,000,000 | | 7,633,290 |
| 7/01/32 | | 22,000,000 | | 23,621,840 |
| Roanoke County EDA Lease Revenue, Public Facility Projects, Assured Guaranty, 5.125%, | | | | |
| 10/15/37 | | 10,000,000 | | 10,914,300 |
| Roanoke EDA Hospital Revenue, Carilion Clinic Obligated Group, Refunding, 5.00%, | | | | |
| 7/01/33 | | 10,615,000 | | 11,375,034 |
| Roanoke IDA Hospital Revenue, Carilion Health System, Series B, Assured Guaranty, 5.00%, | | | | |
| 7/01/38 | | 4,000,000 | | 4,174,000 |
| Smyth County GO, Public Improvement, Series A, 5.00%, 11/01/31 | | 4,145,000 | | 4,708,720 |
| Stafford County and Staunton IDAR, Virginia Municipal League Assn. Counties Program, | | | | |
| Series A, NATL Insured, 5.25%, 8/01/31 | | 5,000,000 | | 5,166,300 |
| Series C, NATL Insured, 5.00%, 8/01/35 | | 7,735,000 | | 8,031,096 |
| XLCA Insured, 5.00%, 8/01/37 | | 3,985,000 | | 4,081,278 |
| Stafford County EDA Hospital Facilities Revenue, Medicorp Health System Obligation, 5.25%, | | | | |
| 6/15/37 | | 5,000,000 | | 5,108,950 |
| Suffolk GO, Refunding, 5.00%, 2/01/41 | | 10,000,000 | | 11,195,700 |
| University of Virginia Revenue, | | | | |
| General, 5.00%, 6/01/37 | | 8,935,000 | | 9,527,837 |
| General, Refunding, 5.00%, 9/01/31 | | 1,275,000 | | 1,532,040 |
| General, Refunding, 5.00%, 6/01/40 | | 17,750,000 | | 19,659,545 |
| Series B, 5.00%, 6/01/33 | | 2,020,000 | | 2,067,935 |
| Series B, Pre-Refunded, 5.00%, 6/01/33 | | 11,980,000 | | 12,691,133 |
| |
| | | Annual Report | 153 |
| | | | |
| Franklin Tax-Free Trust | | | | |
| |
| Statement of Investments, February 29, 2012 (continued) | | | | |
| |
| |
| Franklin Virginia Tax-Free Income Fund | | Principal Amount | | Value |
| Municipal Bonds (continued) | | | | |
| Virginia (continued) | | | | |
| Virginia Beach Development Authority Public Facility Revenue, 5.00%, 7/15/27 | $ | 5,635,000 | $ | 6,307,537 |
| Virginia College Building Authority Educational Facilities Revenue, | | | | |
| Liberty University Projects, 5.25%, 3/01/29 | | 2,860,000 | | 3,300,926 |
| Liberty University Projects, 5.00%, 3/01/41 | | 26,855,000 | | 29,057,379 |
| Public Higher Education Financing Program, Series A, 5.00%, 9/01/33 | | 4,010,000 | | 4,439,792 |
| Virginia Commonwealth Transportation Board Transportation Revenue, | | | | |
| Capital Projects, 4.00%, 5/15/29 | | 5,205,000 | | 5,655,232 |
| Capital Projects, 5.00%, 5/15/34 | | 5,000,000 | | 5,711,750 |
| Northern Virginia Transportation Program, Series A, Pre-Refunded, 5.00%, 5/15/27 | | 8,920,000 | | 9,004,026 |
| Virginia Port Authority Port Facility Revenue, | | | | |
| NATL Insured, 4.75%, 7/01/28 | | 1,500,000 | | 1,533,570 |
| Refunding, 5.00%, 7/01/40 | | 6,000,000 | | 6,520,080 |
| Virginia Small Business Financing Authority Healthcare Facilities Revenue, Sentara Healthcare, | | | | |
| Refunding, 5.00%, 11/01/40 | | 23,000,000 | | 24,685,210 |
| Virginia State HDA Revenue, Rental Housing, | | | | |
| Series B, 5.625%, 6/01/39 | | 7,240,000 | | 7,779,525 |
| Series B, 5.00%, 6/01/45 | | 3,050,000 | | 3,164,680 |
| Series E, 5.00%, 10/01/44 | | 6,540,000 | | 6,902,120 |
| Series F, 5.05%, 12/01/44 | | 12,125,000 | | 12,593,025 |
| Series F, 5.00%, 4/01/45 | | 2,125,000 | | 2,199,375 |
| Virginia State HDA, Commonwealth Mortgage Revenue, Series E, 6.375%, 1/01/36 | | 9,815,000 | | 10,698,841 |
| Virginia State PBA Public Facilities Revenue, Series A, 5.00%, 8/01/31 | | 10,000,000 | | 11,681,700 |
| aVirginia State Public School Authority Revenue, School Financing, 1997, Refunding, 5.00%, | | | | |
| 8/01/25 | | 10,000,000 | | 12,381,300 |
| Virginia State Public School Authority Special Obligation Fluvanna County Revenue, | | | | |
| School Financing, 6.00%, 12/01/32 | | 5,000,000 | | 5,809,450 |
| Virginia State Resources Authority Infrastructure Revenue, | | | | |
| Senior Series A, 5.00%, 11/01/31 | | 5,000,000 | | 5,525,150 |
| Senior Series A, 5.00%, 11/01/36 | | 4,915,000 | | 5,325,648 |
| St. Moral Virginia Pooled Financing Program, Series B, 5.00%, 11/01/41 | | 9,410,000 | | 10,731,446 |
| Virginia Pooled Financing Program, Senior Series, 5.00%, 11/01/33 | | 4,615,000 | | 4,789,355 |
| Virginia Pooled Financing Program, Senior Series A, 5.00%, 11/01/38 | | 1,600,000 | | 1,779,456 |
| Virginia Pooled Financing Program, Senior Series B, 5.00%, 11/01/32 | | 2,505,000 | | 2,802,444 |
| Virginia Pooled Financing Program, Senior Series, Pre-Refunded, 5.00%, 11/01/33 | | 385,000 | | 415,527 |
| Virginia State Resources Authority Water and Sewer System Revenue, Tuckahoe Service District | | | | |
| Project, 5.00%, 11/01/35 | | 1,125,000 | | 1,146,791 |
| Winchester IDA Hospital Revenue, Valley Health System Obligation, Series E, 5.625%, | | | | |
| 1/01/44 | | 3,350,000 | | 3,642,823 |
| | | | | 658,558,928 |
| District of Columbia 7.7% | | | | |
| Metropolitan Washington D.C. Airports Authority Airport System Revenue, | | | | |
| Refunding, BHAC Insured, 5.00%, 10/01/29 | | 3,000,000 | | 3,330,690 |
| Refunding, Series A, 5.00%, 10/01/35 | | 12,000,000 | | 13,081,440 |
| Refunding, Series A, AGMC Insured, 5.00%, 10/01/32 | | 10,000,000 | | 10,375,700 |
| Refunding, Series A, NATL RE, FGIC Insured, 5.00%, 10/01/25 | | 1,000,000 | | 1,026,280 |
| Refunding, Series C, 5.125%, 10/01/34 | | 6,450,000 | | 6,993,477 |
| Series B, FGIC Insured, Pre-Refunded, 5.25%, 10/01/32 | | 6,655,000 | | 6,848,261 |
154 | Annual Report
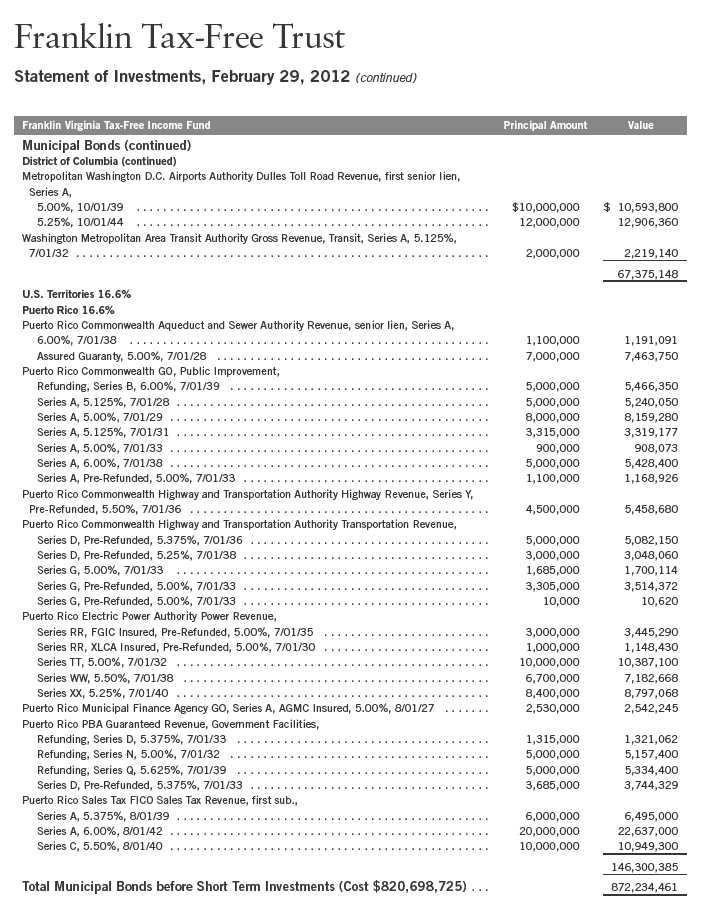
Annual Report | 155
| | | | | |
| Franklin Tax-Free Trust | | | | | |
| |
| Statement of Investments, February 29, 2012 (continued) | | | | | |
| |
| |
| Franklin Virginia Tax-Free Income Fund | | Principal Amount | | Value | |
| Short Term Investments 1.0% | | | | | |
| Municipal Bonds 1.0% | | | | | |
| Virginia 1.0% | | | | | |
| bAlbemarle County EDA Hospital Revenue, Martha Jefferson Hospital, Series C, Daily VRDN and | | | | | |
| Put, 0.12%, 10/01/48 | $ | 300,000 | $ | 300,000 | |
| bMontgomery County IDAR, Virginia Tech Foundation, Daily VRDN and Put, 0.13%, 6/01/35 | | 750,000 | | 750,000 | |
| bNorfolk Redevelopment and Housing Authority Revenue, Old Dominion University Project, | | | | | |
| Refunding, Daily VRDN and Put, 0.20%, 8/01/31 | | 3,730,000 | | 3,730,000 | |
| bVirginia Small Business Financing Authority Hospital Revenue, Carilion Clinic Obligation, | | | | | |
| Series A, Daily VRDN and Put, 0.12%, 7/01/42 | | 4,200,000 | | 4,200,000 | |
| Total Short Term Investments (Cost $8,980,000) | | | | 8,980,000 | |
| Total Investments (Cost $829,678,725) 100.2% | | | | 881,214,461 | |
| Other Assets, less Liabilities (0.2)% | | | | (2,020,075 | ) |
| Net Assets 100.0% | | | $ | 879,194,386 | |
See Abbreviations on page 184.
aSecurity purchased on a when-issued basis. See Note 1(b).
bVariable rate demand notes (VRDNs) are tax-exempt obligations which contain a floating or variable interest rate adjustment formula and an unconditional right of demand to receive payment of the principal balance plus accrued interest at specified dates. The coupon rate shown represents the rate at period end.
156 | The accompanying notes are an integral part of these financial statements. | Annual Report
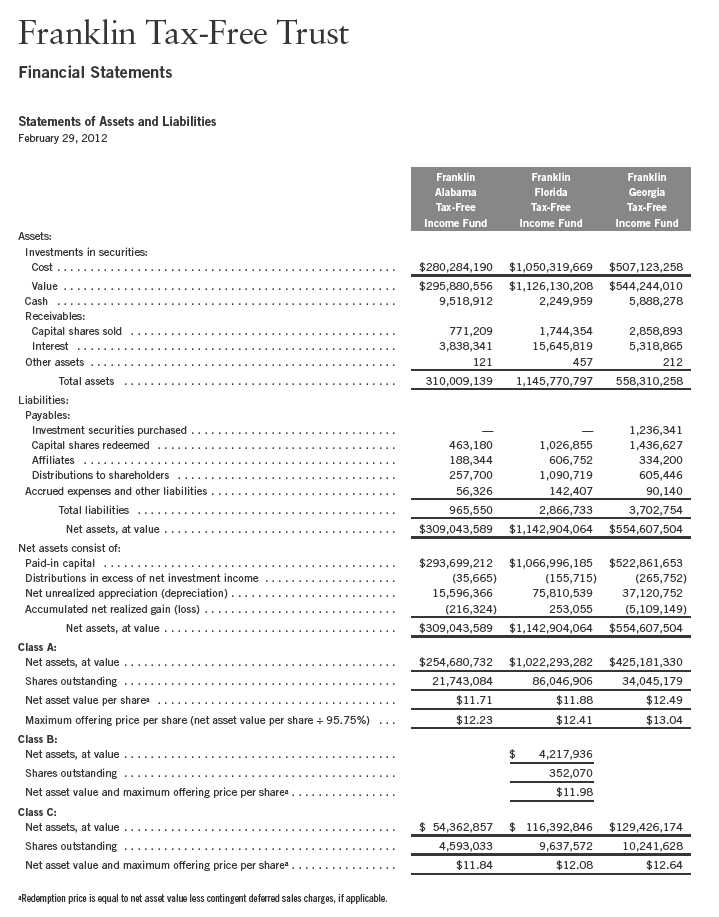
Annual Report | The accompanying notes are an integral part of these financial statements. | 157

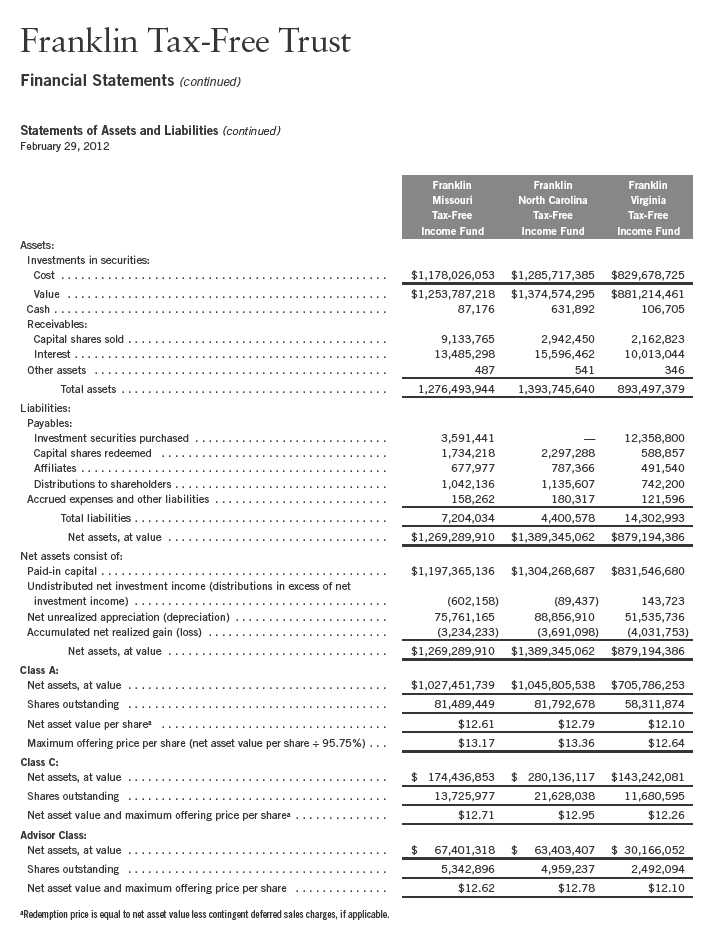
Annual Report | The accompanying notes are an integral part of these financial statements. | 159
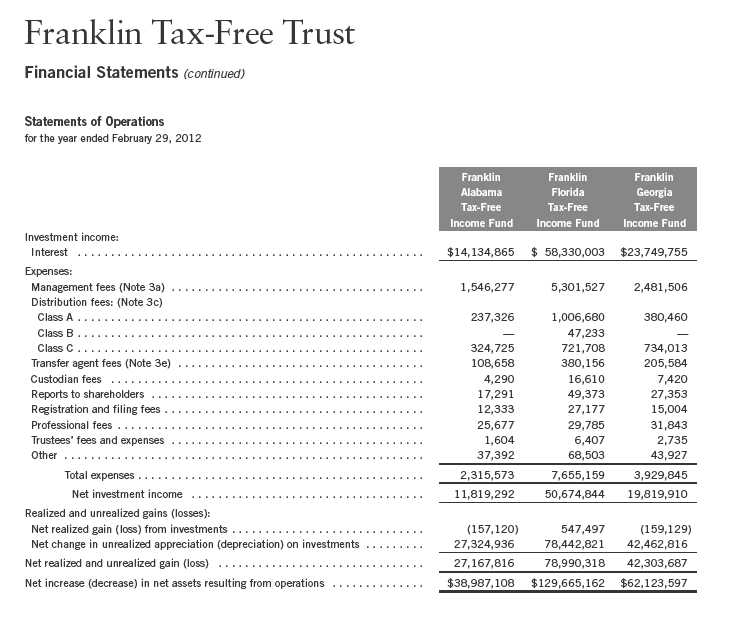
160 | The accompanying notes are an integral part of these financial statements. | Annual Report
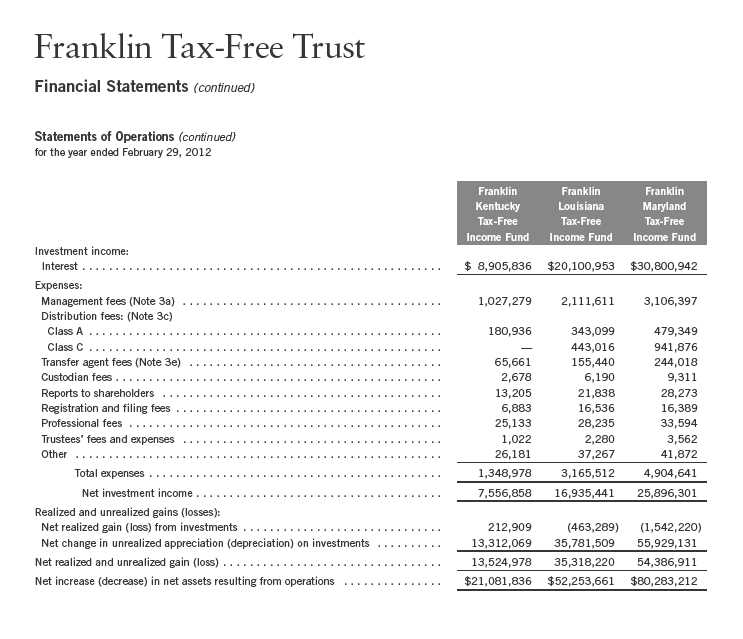
Annual Report | The accompanying notes are an integral part of these financial statements. | 161
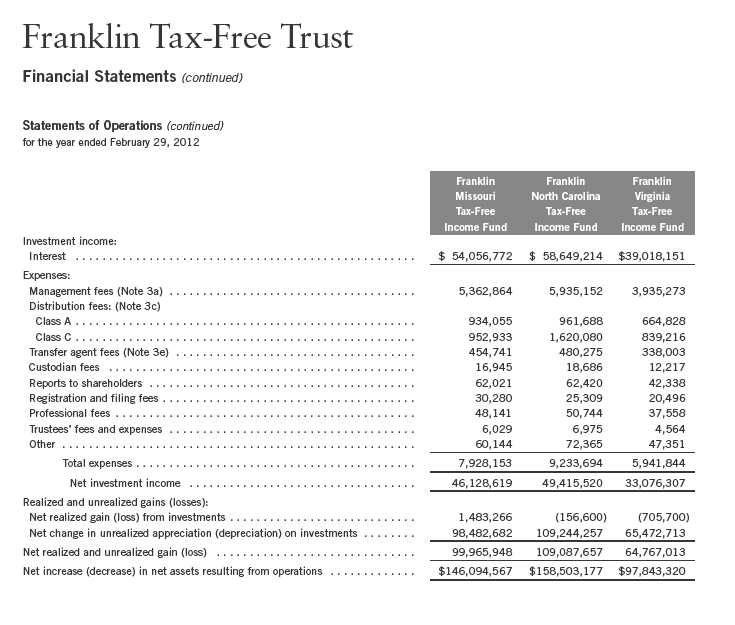
162 | The accompanying notes are an integral part of these financial statements. | Annual Report
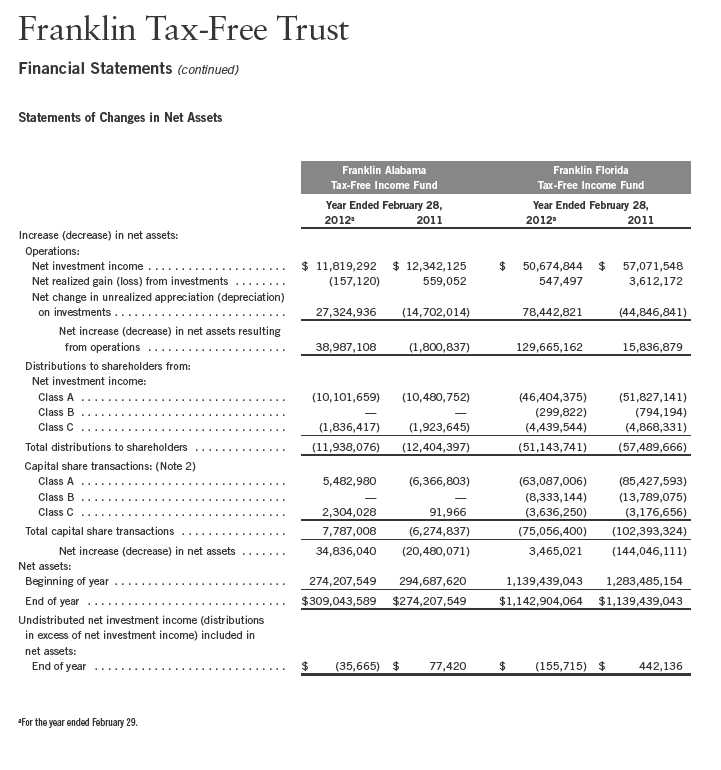
Annual Report | The accompanying notes are an integral part of these financial statements. | 163
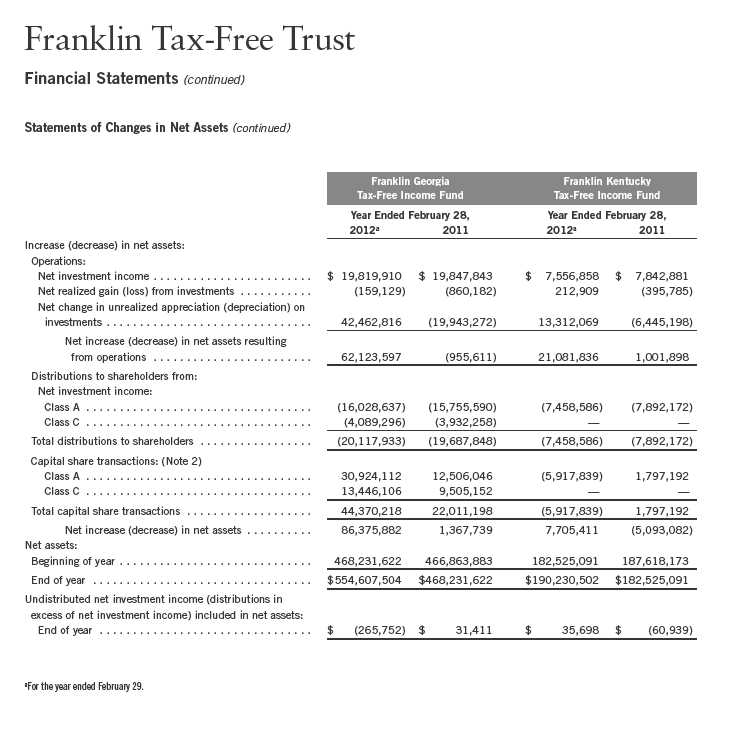
164 | The accompanying notes are an integral part of these financial statements. | Annual Report
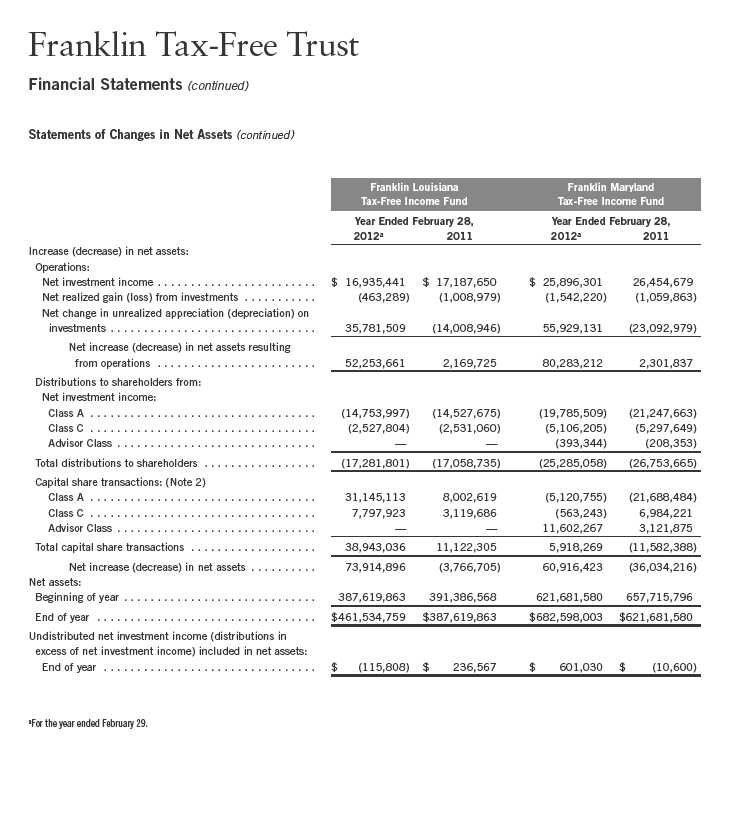
Annual Report | The accompanying notes are an integral part of these financial statements. | 165
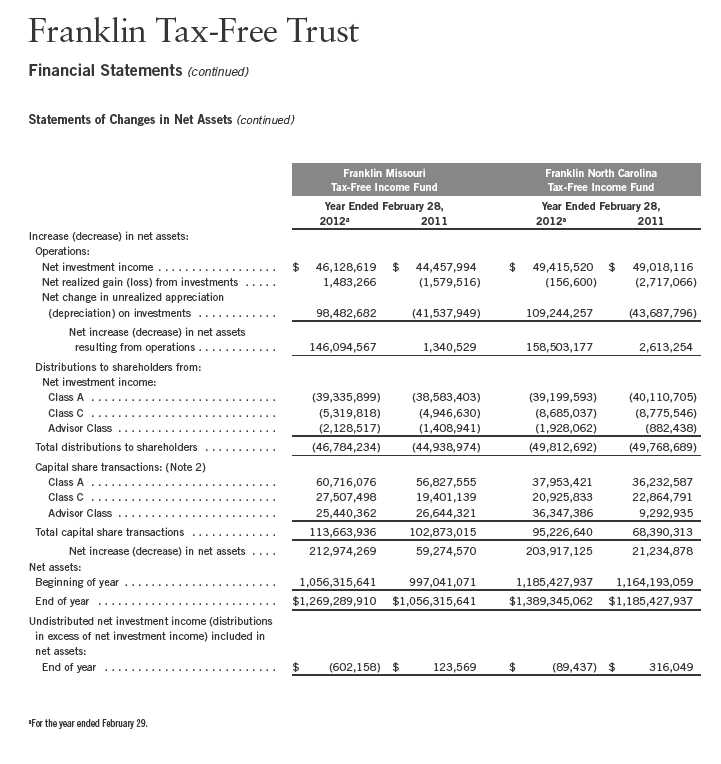
166 | The accompanying notes are an integral part of these financial statements. | Annual Report
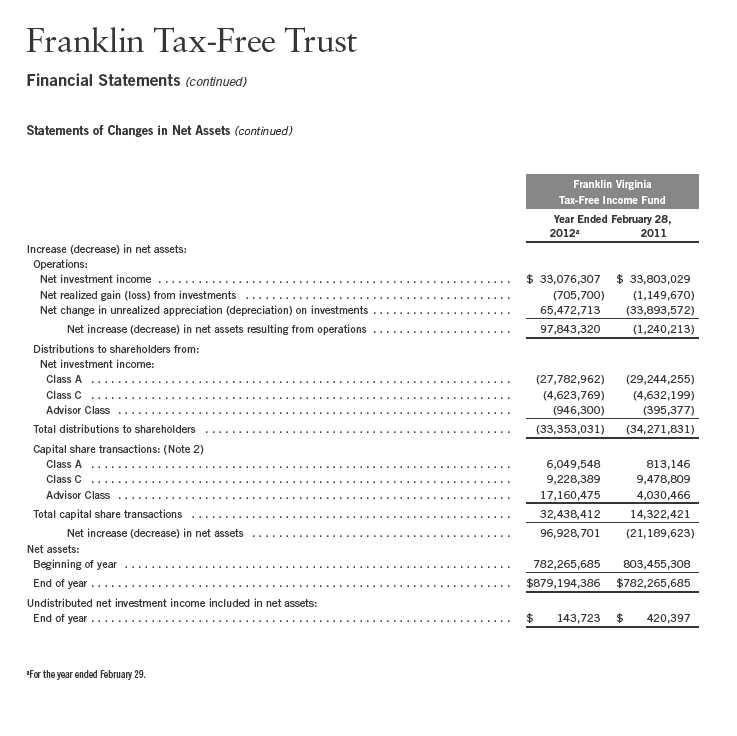
Annual Report | The accompanying notes are an integral part of these financial statements. | 167
Franklin Tax-Free Trust
Notes to Financial Statements
1. ORGANIZATION AND SIGNIFICANT ACCOUNTING POLICIES
Franklin Tax-Free Trust (Trust) is registered under the Investment Company Act of 1940, as amended, (1940 Act) as an open-end investment company, consisting of twenty-four separate funds, nine of which are included in this report (Funds). The financial statements of the remaining funds in the Trust are presented separately. The classes of shares offered within each of the Funds are indicated below. Each class of shares differs by its initial sales load, contingent deferred sales charges, distribution fees, voting rights on matters affecting a single class and its exchange privilege.

The following summarizes the Funds’ significant accounting policies.
a. Financial Instrument Valuation
The Funds’ investments in securities and other financial instruments are carried at fair value daily. Fair value is the price that would be received to sell an asset or paid to transfer a liability in an orderly transaction between market participants on the measurement date. Under procedures approved by the Trust’s Board of Trustees, the Funds may utilize independent pricing services, quotations from securities and financial instrument dealers, and other market sources to determine fair value.
Debt securities generally trade in the over-the-counter market rather than on a securities exchange. The Funds’ pricing services use multiple valuation techniques to determine fair value. In instances where sufficient market activity exists, the pricing services may utilize a market-based approach through which quotes from market makers are used to determine fair value. In instances where sufficient market activity may not exist or is limited, the pricing services also utilize proprietary valuation models which may consider market characteristics such as benchmark yield curves, option-adjusted spreads, credit spreads, estimated default rates, coupon rates, anticipated timing of principal repayments, underlying collateral, and other unique security features in order to estimate the relevant cash flows, which are then discounted to calculate the fair value.
The Funds have procedures to determine the fair value of securities and other financial instruments for which market prices are not readily available or which may not be reliably priced. Under these procedures, the Funds primarily employs a market-based approach which may use related or comparable assets or liabilities, recent transactions, market multiples, book values, and other relevant information for the investment to determine the fair value of the investment. The Funds may also
168 | Annual Report
Franklin Tax-Free Trust
Notes to Financial Statements (continued)
| 1. | ORGANIZATION AND SIGNIFICANT ACCOUNTING POLICIES (continued) |
| a. | Financial Instrument Valuation (continued) |
use an income-based valuation approach in which the anticipated future cash flows of the investment are discounted to calculate fair value. Discounts may also be applied due to the nature or duration of any restrictions on the disposition of the investments. Due to the inherent uncertainty of valuations of such investments, the fair values may differ significantly from the values that would have been used had an active market existed.
b. Securities Purchased on a When-Issued Basis
The Funds purchase securities on a when-issued basis, with payment and delivery scheduled for a future date. These transactions are subject to market fluctuations and are subject to the risk that the value at delivery may be more or less than the trade date purchase price. Although the Funds will generally purchase these securities with the intention of holding the securities, they may sell the securities before the settlement date. Sufficient assets have been segregated for these securities.
c. Income Taxes
It is each fund’s policy to qualify as a regulated investment company under the Internal Revenue Code. Each fund intends to distribute to shareholders substantially all of its income and net realized gains to relieve it from federal income and excise taxes. As a result, no provision for U.S. federal income taxes is required.
Each fund recognizes the tax benefits of uncertain tax positions only when the position is “more likely than not” to be sustained upon examination by the tax authorities based on the technical merits of the tax position. As of February 29, 2012, and for all open tax years, each fund has determined that no liability for unrecognized tax benefits is required in each fund’s financial statements related to uncertain tax positions taken on a tax return (or expected to be taken on future tax returns). Open tax years are those that remain subject to examination and are based on each tax jurisdiction statute of limitation.
d. Security Transactions, Investment Income, Expenses and Distributions
Security transactions are accounted for on trade date. Realized gains and losses on security transactions are determined on a specific identification basis. Interest income and estimated expenses are accrued daily. Amortization of premium and accretion of discount on debt securities are included in interest income. Dividends from net investment income are normally declared daily; these dividends may be reinvested or paid monthly to shareholders. Distributions from realized capital gains and other distributions, if any, are recorded on the ex-dividend date. Distributions to shareholders are determined according to income tax regulations (tax basis). Distributable earnings determined on a tax basis may differ from earnings recorded in accordance with accounting principles generally accepted in the United States of America. These differences may be permanent or temporary. Permanent differences are reclassified among capital accounts to reflect their tax character. These reclassifications have no impact on net assets or the results of operations. Temporary differences are not reclassified, as they may reverse in subsequent periods.
Annual Report | 169
Franklin Tax-Free Trust
Notes to Financial Statements (continued)
| 1. | ORGANIZATION AND SIGNIFICANT ACCOUNTING POLICIES (continued) |
| d. | Security Transactions, Investment Income, Expenses and Distributions (continued) |
Common expenses incurred by the Trust are allocated among the funds based on the ratio of net assets of each fund to the combined net assets of the Trust. Fund specific expenses are charged directly to the fund that incurred the expense.
Realized and unrealized gains and losses and net investment income, not including class specific expenses, are allocated daily to each class of shares based upon the relative proportion of net assets of each class. Differences in per share distributions, by class, are generally due to differences in class specific expenses.
e. Insurance
The scheduled payments of interest and principal for each insured municipal security in the Trust are insured by either a new issue insurance policy or a secondary insurance policy. Some municipal securities in the Funds are secured by collateral guaranteed by an agency of the U.S. government. Depending on the type of coverage, premiums for insurance are either added to the cost basis of the security or paid by a third party.
Insurance companies typically insure municipal bonds that tend to be of very high quality, with the majority of underlying municipal bonds rated A or better. However, an event involving an insurer could have an adverse effect on the value of the securities insured by that insurance company. There is no guarantee the insurer will be able to fulfill its obligations under the terms of the policy.
f. Accounting Estimates
The preparation of financial statements in accordance with accounting principles generally accepted in the United States of America requires management to make estimates and assumptions that affect the reported amounts of assets and liabilities at the date of the financial statements and the amounts of income and expenses during the reporting period. Actual results could differ from those estimates.
g. Guarantees and Indemnifications
Under the Trust’s organizational documents, its officers and trustees are indemnified by the Trust against certain liabilities arising out of the performance of their duties to the Trust. Additionally, in the normal course of business, the Trust, on behalf of the Funds, enters into contracts with service providers that contain general indemnification clauses. The Trust’s maximum exposure under these arrangements is unknown as this would involve future claims that may be made against the Trust that have not yet occurred. Currently, the Trust expects the risk of loss to be remote.
170 | Annual Report
Franklin Tax-Free Trust
Notes to Financial Statements (continued)
2. SHARES OF BENEFICIAL INTEREST
At February 29, 2012, there were an unlimited number of shares authorized (without par value).
Transactions in the Funds’ shares were as follows:
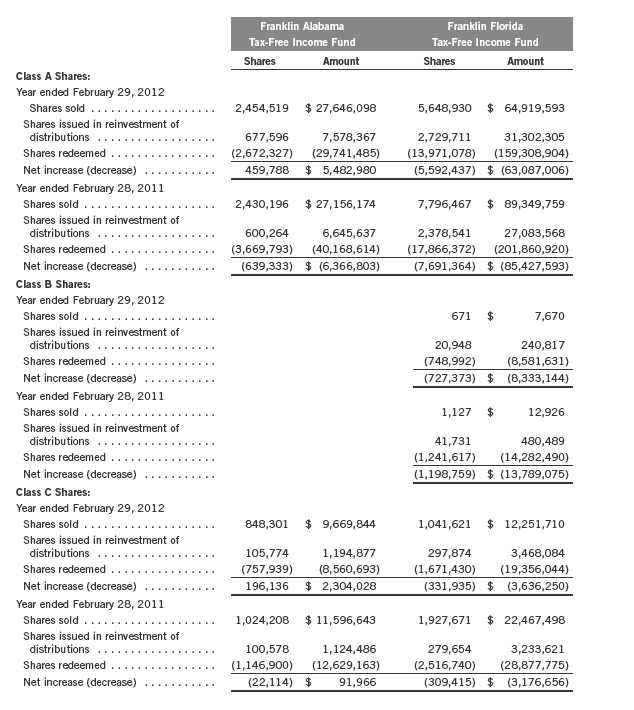
Annual Report | 171
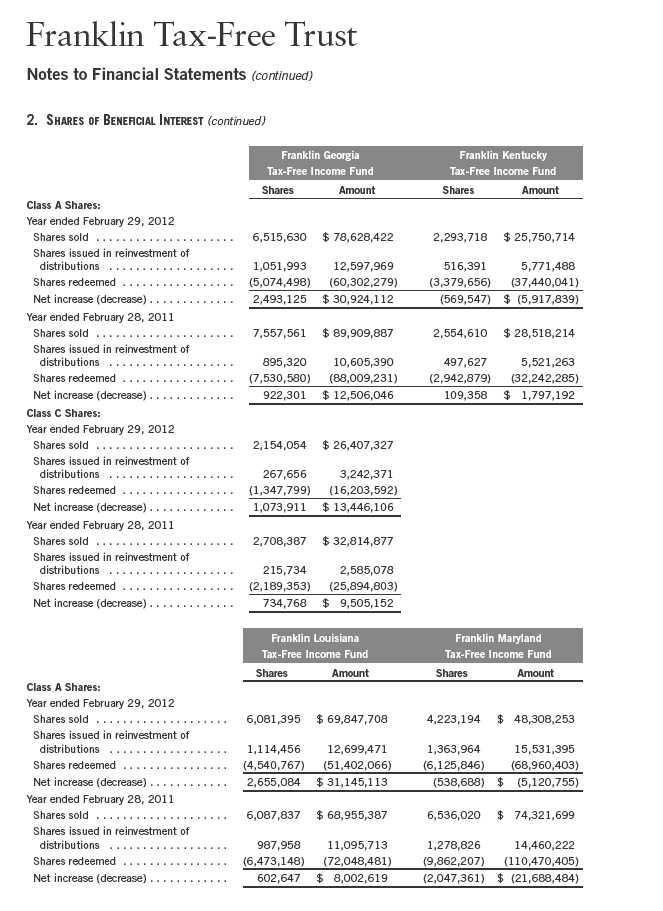
172 | Annual Report

Annual Report | 173
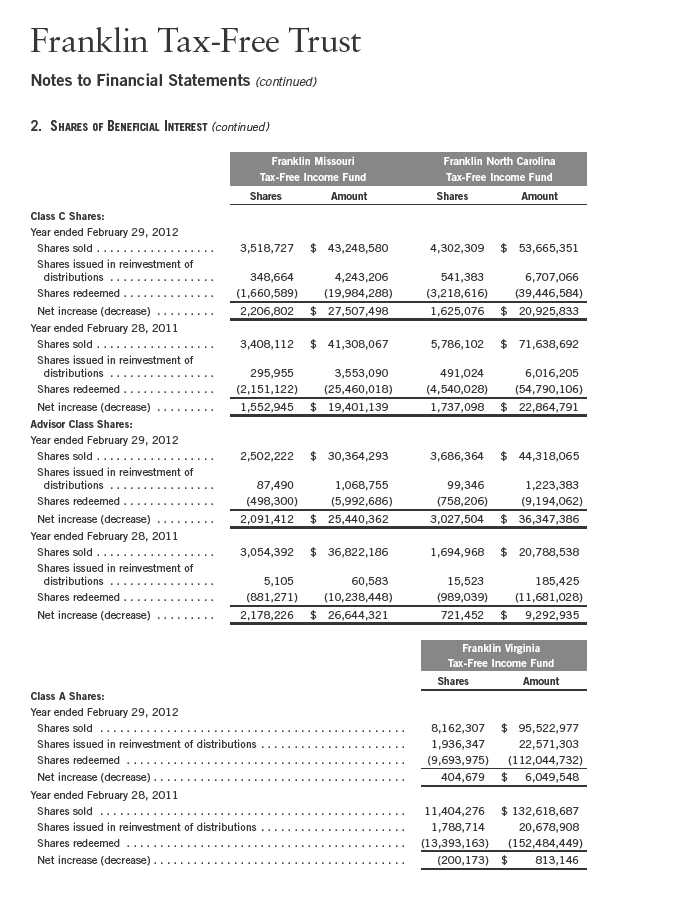
174 | Annual Report
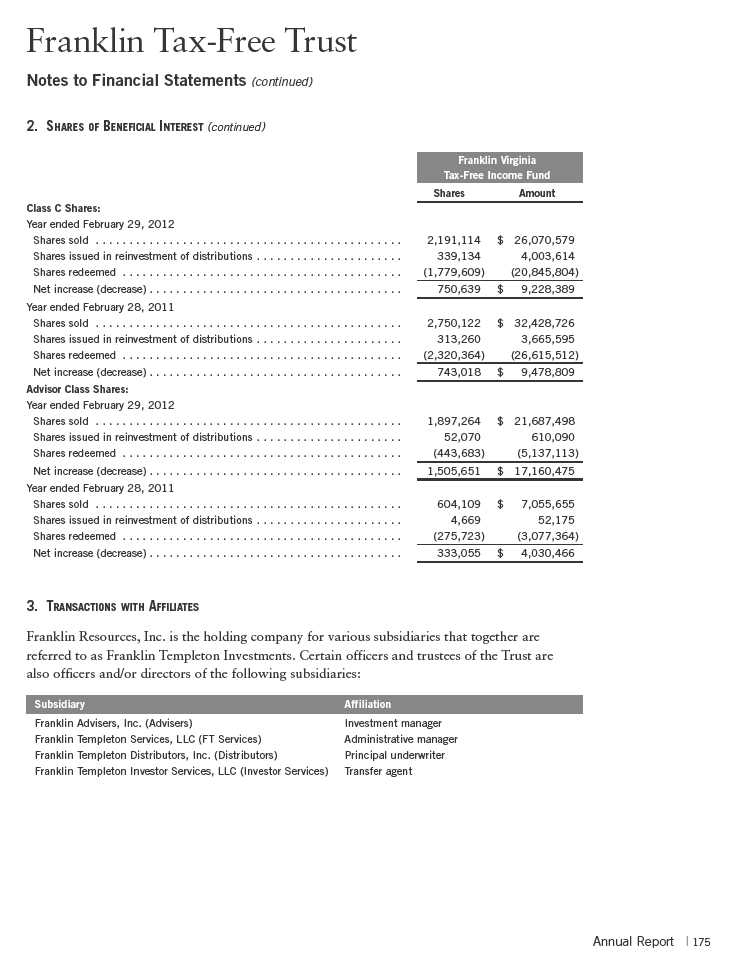
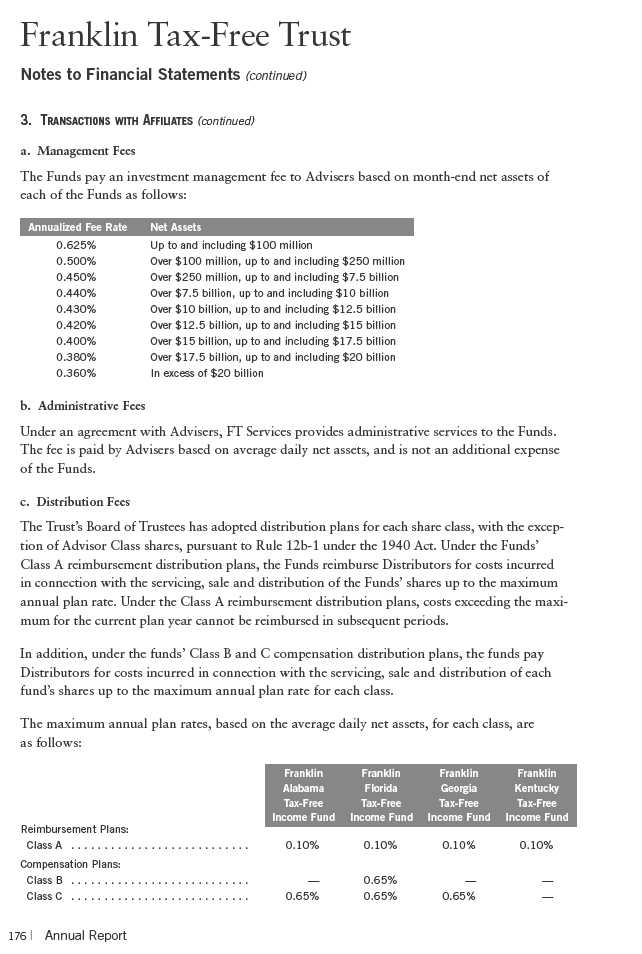
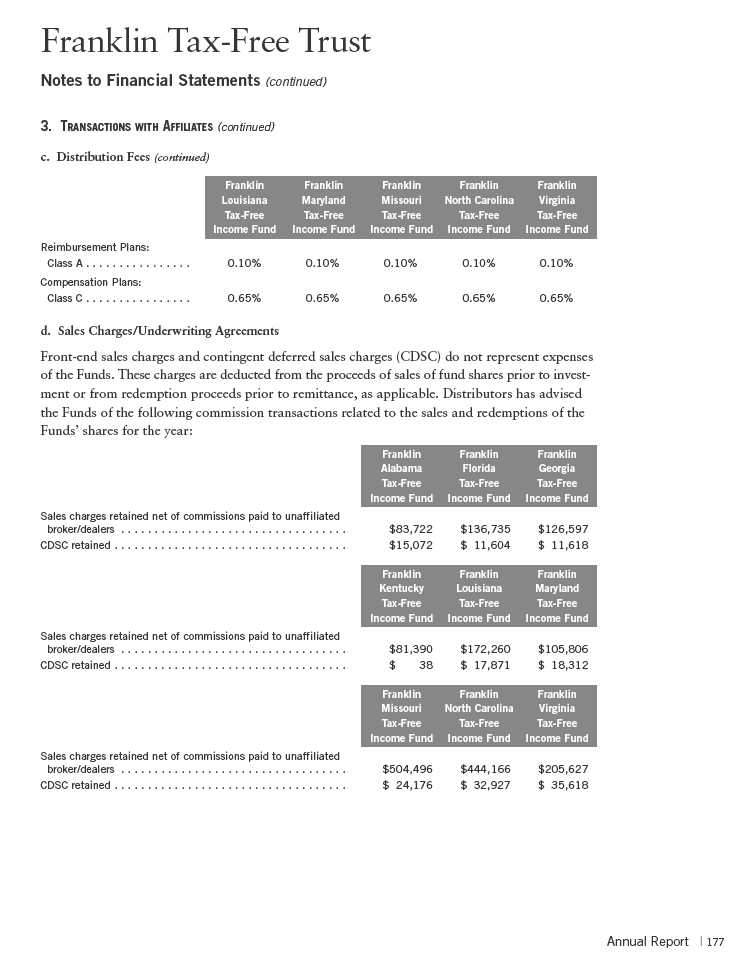
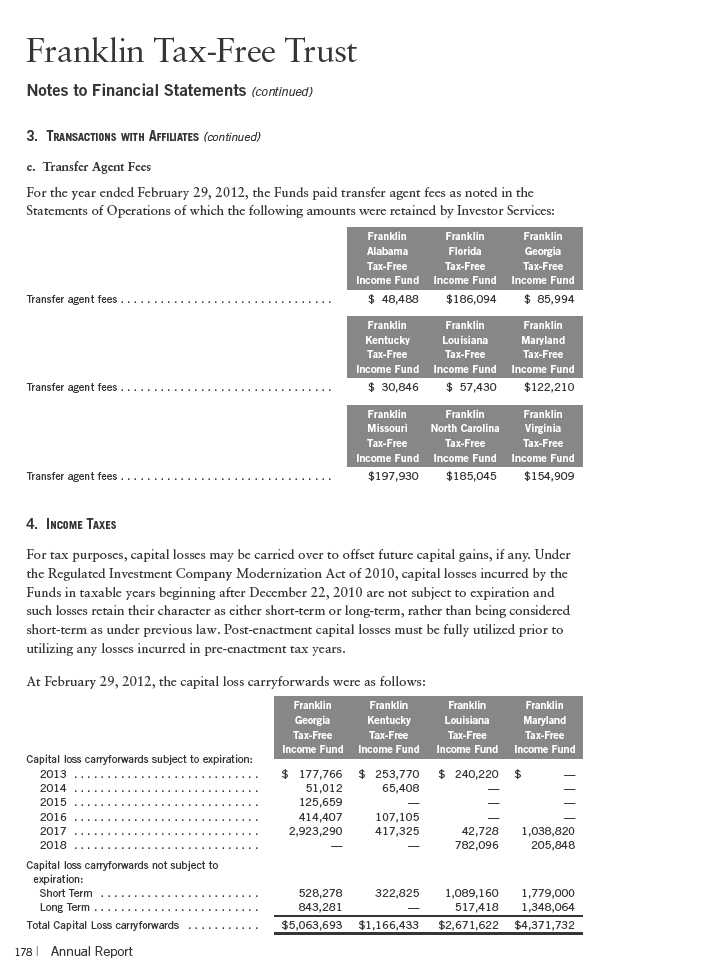
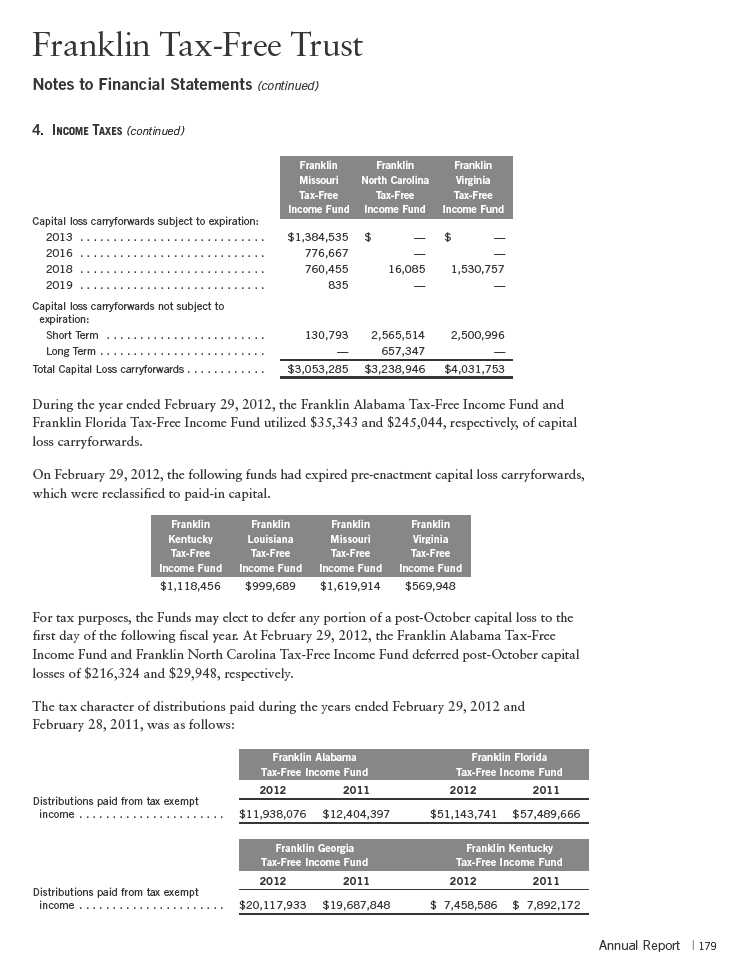

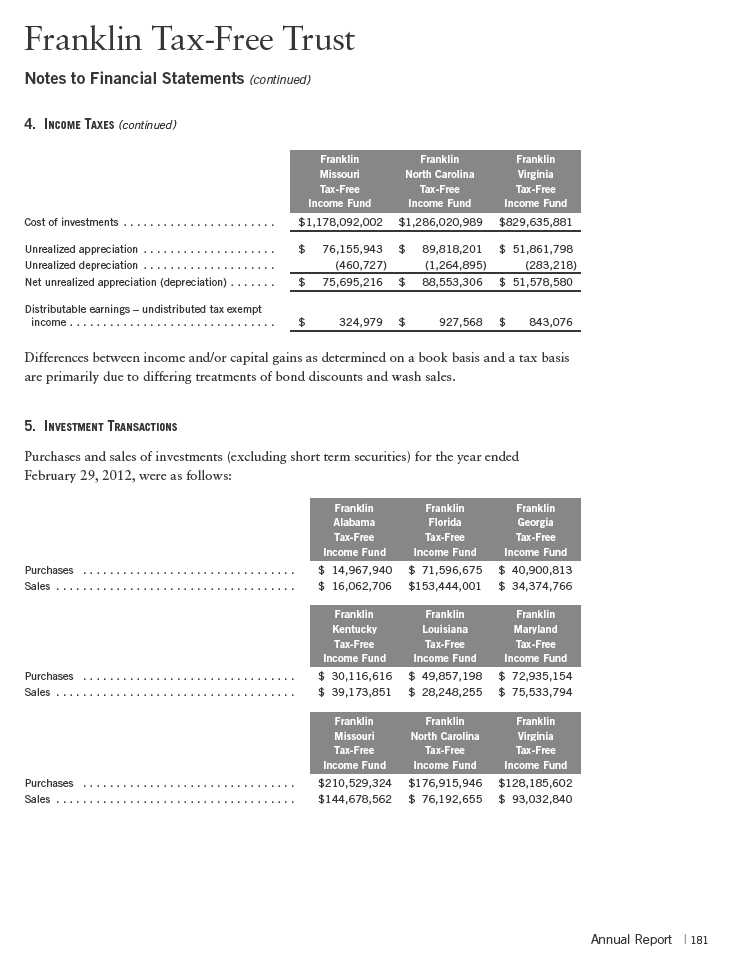
Franklin Tax-Free Trust
Notes to Financial Statements (continued)
6. CONCENTRATION OF RISK
Each of the Funds invests a large percentage of its total assets in obligations of issuers within its respective state, U.S. territories, and the District of Columbia. Such concentration may subject the Funds to risks associated with industrial or regional matters, and economic, political or legal developments occurring within those states, U.S. territories, and the District of Columbia. In addition, investments in these securities are sensitive to interest rate changes and credit risk of the issuer and may subject the funds to increased market volatility. The market for these investments may be limited, which may make them difficult to buy or sell.
7. CREDIT FACILITY
The Funds, together with other U.S. registered and foreign investment funds (collectively, Borrowers), managed by Franklin Templeton Investments, are borrowers in a joint syndicated senior unsecured credit facility totaling $1.5 billion (Global Credit Facility) which matures on January 18, 2013. This Global Credit Facility provides a source of funds to the Borrowers for temporary and emergency purposes, including the ability to meet future unanticipated or unusually large redemption requests.
Under the terms of the Global Credit Facility, the Funds shall, in addition to interest charged on any borrowings made by the Funds and other costs incurred by the Funds, pay their share of fees and expenses incurred in connection with the implementation and maintenance of the Global Credit Facility, based upon their relative share of the aggregate net assets of all of the Borrowers, including an annual commitment fee of 0.08% based upon the unused portion of the Global Credit Facility, which is reflected in other expenses on the Statements of Operations. During the year ended February 29, 2012, the Funds did not use the Global Credit Facility.
8. FAIR VALUE MEASUREMENTS
The Funds follow a fair value hierarchy that distinguishes between market data obtained from independent sources (observable inputs) and the Funds’ own market assumptions (unobservable inputs). These inputs are used in determining the value of the Funds’ investments and are summarized in the following fair value hierarchy:
- Level 1 – quoted prices in active markets for identical securities
- Level 2 – other significant observable inputs (including quoted prices for similar securities, interest rates, prepayment speed, credit risk, etc.)
- Level 3 – significant unobservable inputs (including the Funds’ own assumptions in determining the fair value of investments)
The inputs or methodology used for valuing securities are not an indication of the risk associated with investing in those securities.
182 | Annual Report
Franklin Tax-Free Trust
Notes to Financial Statements (continued)
8. FAIR VALUE MEASUREMENTS (continued)
For movements between the levels within the fair value hierarchy, the Funds have adopted a policy of recognizing the transfers as of the date of the underlying event which caused the movement.
At February 29, 2012, all of the Funds’ investments in securities carried at fair value were valued using Level 2 inputs.
9. NEW ACCOUNTING PRONOUNCEMENTS
In May 2011, the Financial Accounting Standards Board (FASB) issued Accounting Standards Update (ASU) No. 2011-04, Fair Value Measurement (Topic 820): Amendments to Achieve Common Fair Value Measurement and Disclosure Requirements in U.S. GAAP and IFRSs. The amendments in the ASU will improve the comparability of fair value measurements presented and disclosed in financial statements prepared in accordance with U.S. GAAP (Generally Accepted Accounting Principles) and IFRS (International Financial Reporting Standards) and include new guidance for certain fair value measurement principles and disclosure requirements. The ASU is effective for interim and annual periods beginning after December 15, 2011. The Funds believe the adoption of this ASU will not have a material impact on their financial statements.
10. SUBSEQUENT EVENTS
The Funds have evaluated subsequent events through the issuance of the financial statements and determined that no events have occurred that require disclosure.
Annual Report | 183
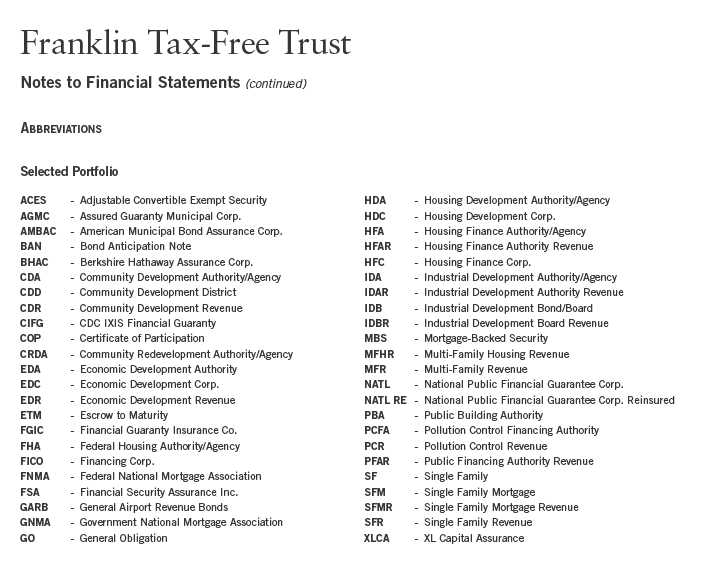
184 | Annual Report
Franklin Tax-Free Trust
Report of Independent Registered Public Accounting Firm
To the Board of Trustees and Shareholders of Franklin Tax-Free Trust
In our opinion, the accompanying statements of assets and liabilities, including the statements of investments, and the related statements of operations and of changes in net assets and the financial highlights present fairly, in all material respects, the financial position of the Franklin Alabama Tax-Free Income Fund, Franklin Florida Tax-Free Income Fund, Franklin Georgia Tax-Free Income Fund, Franklin Kentucky Tax-Free Income Fund, Franklin Louisiana Tax-Free Income Fund, Franklin Maryland Tax-Free Income Fund, Franklin Missouri Tax-Free Income Fund, Franklin North Carolina Tax-Free Income Fund and Franklin Virginia Tax-Free Income Fund (separate portfolios of Franklin Tax-Free Trust, hereafter referred to as the “Funds”) at February 29, 2012, the results of each of their operations for the year then ended, the changes in each of their net assets for each of the two years in the period then ended and the financial highlights for each of the periods presented, in conformity with accounting principles generally accepted in the United States of America. These financial statements and financial highlights (hereafter referred to as “financial statements”) are the responsibility of the Funds’ management. Our responsibility is to express an opinion on these financial statements based on our audits. We conducted our audits of these financial statements in accordance with the standards of the Public Company Accounting Oversight Board (United States). Those standards require that we plan and perform the audit to obtain reasonable assurance about whether the financial statements are free of material misstatement. An audit includes examining, on a test basis, evidence supporting the amounts and disclosures in the financial statements, assessing the accounting principles used and significant estimates made by management, and evaluating the overall financial statement presentation. We believe that our audits, which included confirmation of securities at February 29, 2012 by correspondence with the custodian and brokers, provide a reasonable basis for our opinion.
PricewaterhouseCoopers LLP
San Francisco, California
April 16, 2012
Annual Report | 185
Franklin Tax-Free Trust
Tax Information (unaudited)
Under Section 852(b)(5)(A) of the Internal Revenue Code (Code), the Funds hereby report 100% of the distributions paid from net investment income as exempt-interest dividends for the fiscal year ended February 29, 2012. A portion of the Funds’ exempt-interest dividends may be subject to the federal alternative minimum tax. By mid-February 2013, shareholders will be notified of amounts for use in preparing their 2012 income tax returns.
186 | Annual Report
Franklin Tax-Free Trust
Board Members and Officers
The name, year of birth and address of the officers and board members, as well as their affiliations, positions held with the Trust, principal occupations during at least the past five years and number of portfolios overseen in the Franklin Templeton Investments fund complex are shown below. Generally, each board member serves until that person’s successor is elected and qualified.


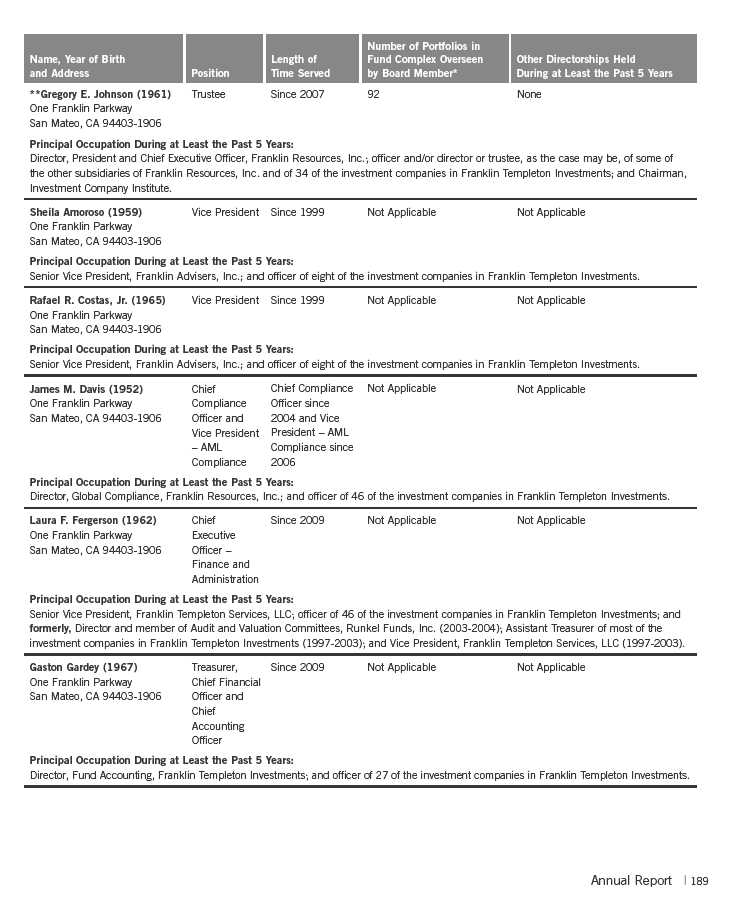
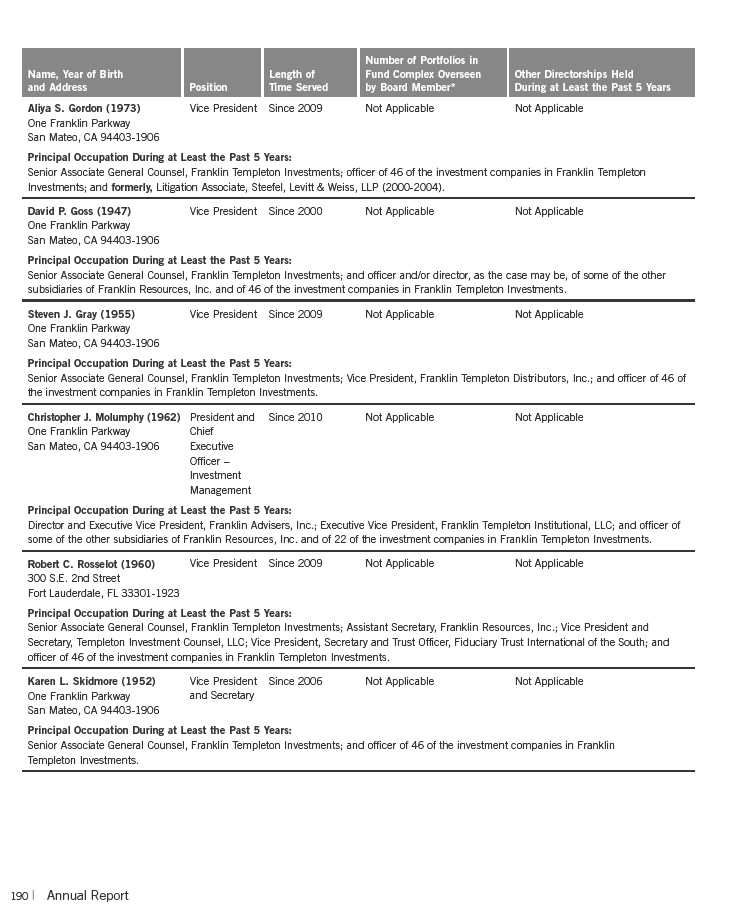
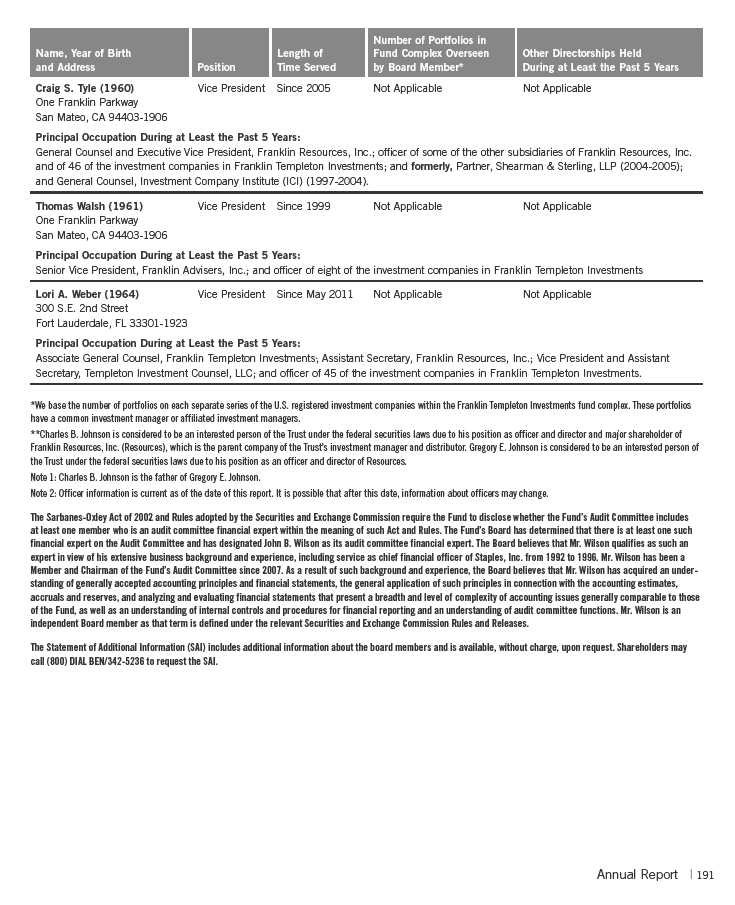
Franklin Tax-Free Trust
Shareholder Information
Board Review of Investment Management Agreement
At a meeting held February 28, 2012, the Board of Trustees (Board), including a majority of non-interested or independent Trustees, approved renewal of the investment management agreement for each of the separate tax-exempt funds within the Trust (Fund(s)). In reaching this decision, the Board took into account information furnished throughout the year at regular Board meetings, as well as information prepared specifically in connection with the annual renewal review process. Information furnished and discussed throughout the year included investment performance reports and related financial information for each Fund, as well as periodic reports on expenses, shareholder services, legal and compliance matters, pricing, and other services provided by the Investment Manager (Manager) and its affiliates. Information furnished specifically in connection with the renewal process included a report for each Fund prepared by Lipper, Inc. (Lipper), an independent organization, as well as additional material, including a Fund profitability analysis prepared by management. The Lipper reports compared each Fund’s investment performance and expenses with those of other mutual funds deemed comparable to the Fund as selected by Lipper. The Fund profitability analysis discussed the profitability to Franklin Templeton Investments from its overall U.S. fund operations, as well as on an individual fund-by-fund basis. Additional material accompanying such profitability analysis included information on a fund-by-fund basis listing portfolio managers and other accounts they manage, as well as information on management fees charged by the Manager and its affiliates to U.S. mutual funds and other accounts, including management’s explanation of differences where relevant. Such material also included a memorandum prepared by management describing project initiatives and capital investments relating to the services provided to the Funds by the Franklin Templeton Investments organization, as well as a memorandum relating to economies of scale and an analysis concerning transfer agent fees charged by an affiliate of the Manager.
In considering such materials, the independent Trustees received assistance and advice from and met separately with independent counsel. While the investment management agreements for all Funds were considered at the same Board meeting, the Board dealt with each Fund separately. In approving continuance of the investment management agreement for each Fund, the Board, including a majority of independent Trustees, determined that the existing management fee structure was fair and reasonable and that continuance of the investment management agreement was in the best interests of each Fund and its shareholders. While attention was given to all information furnished, the following discusses some primary factors relevant to the Board’s decision.
NATURE, EXTENT AND QUALITY OF SERVICES. The Board was satisfied with the nature and quality of the overall services provided by the Manager and its affiliates to the Funds and their shareholders. In addition to investment performance and expenses discussed later, the Board’s opinion was based, in part, upon periodic reports furnished it showing that the investment policies and restrictions for each Fund were consistently complied with as well as other reports periodically furnished the Board covering matters such as the compliance of portfolio managers and other management personnel with the code of ethics adopted throughout the Franklin Templeton fund complex,
192 | Annual Report
Franklin Tax-Free Trust
Shareholder Information (continued)
Board Review of Investment Management Agreement (continued)
the adherence to fair value pricing procedures established by the Board, and the accuracy of net asset value calculations. The Board also noted the extent of benefits provided Fund shareholders from being part of the Franklin Templeton family of funds, including the right to exchange investments between the same class of funds without a sales charge, the ability to reinvest Fund dividends into other funds and the right to combine holdings in other funds to obtain a reduced sales charge. Favorable consideration was given to management’s continuous efforts and expenditures in establishing back-up systems and recovery procedures to function in the event of a natural disaster, it being noted that such systems and procedures had functioned smoothly during the Florida hurricanes and blackouts experienced in previous years. Consideration was also given to the experience of each Fund’s portfolio management team, the number of accounts managed and general method of compensation. In this latter respect, the Board noted that a primary factor in management’s determination of a portfolio manager’s bonus compensation was the relative investment performance of the funds he or she managed and that a portion of such bonus was required to be invested in a predesignated list of funds within such person’s fund management area so as to be aligned with the interests of shareholders. The Board also took into account the quality of transfer agent and shareholder services provided Fund shareholders by an affiliate of the Manager and the continuous enhancements to the Franklin Templeton website. Particular attention was given to management’s conservative approach and diligent risk management procedures, including continuous monitoring of counterparty credit risk and attention given to derivatives and other complex instruments. The Board also took into account, among other things, management’s efforts in establishing a global credit facility for the benefit of the Funds and other accounts managed by Franklin Templeton Investments to provide a source of cash for temporary and emergency purposes or to meet unusual redemption requests as well as the strong financial position of the Manager’s parent company and its commitment to the mutual fund business as evidenced by its subsidization of money market funds.
INVESTMENT PERFORMANCE. The Board placed significant emphasis on the investment performance of each Fund in view of its importance to shareholders. While consideration was given to performance reports and discussions with portfolio managers at Board meetings throughout the year, particular attention in assessing performance was given to the Lipper reports furnished for the agreement renewals. The Lipper reports prepared for each individual Fund showed its investment performance or that of its Class A shares for a Fund having multiple share classes in comparison to a performance universe selected by Lipper. Comparative performance for each Fund was shown for the one-year period ended December 31, 2011, and for additional periods ended that date up to 10 years depending on when a particular Fund commenced operations. Investment performance was shown on an income return basis, as well as a total return basis for each Fund. The Lipper reports showed both the income and total return of each Fund to be above the median of its Lipper performance universe during 2011, with most being in the highest or second-highest performing quintile of such universe during such year, as well as for most of the applicable previous three-, five-and 10-year periods on an annualized basis. The Board was satisfied with the relative performance of these Funds as shown in the Lipper report.
Annual Report | 193
Franklin Tax-Free Trust
Shareholder Information (continued)
Board Review of Investment Management Agreement (continued)
COMPARATIVE EXPENSES. Consideration was given to the management fee and total expense ratios of each Fund in comparison with those of a group of funds selected by Lipper as its appropriate Lipper expense group. Lipper expense data is based upon information taken from each fund’s most recent annual report, which reflects historical asset levels that may be quite different from those currently existing, particularly in a period of market volatility. While recognizing such inherent limitation and the fact that expense ratios generally increase as assets decline and decrease as assets grow, the Board believed the independent analysis conducted by Lipper to be an appropriate measure of comparative expenses. In reviewing comparative costs, Lipper provides information on each Fund’s contractual investment management fee in comparison with the contractual investment management fee that would have been charged by other funds within its Lipper expense group assuming they were similar in size to the Fund, as well as the actual total expenses of the Fund in comparison with those of its Lipper expense group. The Lipper contractual investment management fee analysis includes an administrative charge as being part of the investment management fee, and total expenses, for comparative consistency, are shown by Lipper for Fund Class A shares for Funds having multiple share classes. The Lipper reports showed that the contractual investment management fee rates for each Fund were at or below the median of their respective Lipper expense groups, with the exception of Franklin Kentucky Tax-Free Income Fund and Franklin North Carolina Tax-Free Income Fund, whose fee rates in each case were within one-and-a-half basis points of their respective expense group medians. The Lipper reports further showed that the actual total expense ratios for all Funds were in the least expensive quintiles of their respective Lipper expense groups. Based on the above, the Board was satisfied with the investment management fee and total expense ratios of each Fund in comparison to its Lipper expense group as shown in the Lipper reports.
MANAGEMENT PROFITABILITY. The Board also considered the level of profits realized by the Manager and its affiliates in connection with the operation of each Fund. In this respect, the Board reviewed the Fund profitability analysis that addresses the overall profitability of Franklin Templeton’s U.S. fund business, as well as its profits in providing management and other services to each of the individual funds during the 12-month period ended September 30, 2011, being the most recent fiscal year-end for Franklin Resources, Inc., the Manager’s parent. In reviewing the analysis, attention was given to the methodology followed in allocating costs to each Fund, it being recognized that allocation methodologies are inherently subjective and various allocation methodologies may each be reasonable while producing different results. In this respect, the Board noted that while being continuously refined and reflecting changes in the Manager’s own cost accounting, such allocation methodology was consistent with that followed in profitability report presentations for the Funds made in prior years and that the Funds’ independent registered public accounting firm had been engaged by the Manager to review the reasonableness of the allocation methodologies solely for use by the Funds’ Board in reference to the profitability analysis. In reviewing and discussing such analysis, management discussed with the Board its belief that costs incurred in
194 | Annual Report
Franklin Tax-Free Trust
Shareholder Information (continued)
Board Review of Investment Management Agreement (continued)
establishing the infrastructure necessary for the type of mutual fund operations conducted by the Manager and its affiliates may not be fully reflected in the expenses allocated to each Fund in determining its profitability, as well as the fact that the level of profits, to a certain extent, reflected operational cost savings and efficiencies initiated by management. The Board also took into account management’s expenditures in improving shareholder services provided the Funds, as well as the need to implement systems and meet additional regulatory and compliance requirements resulting from statutes such as the Sarbanes-Oxley and Dodd-Frank Acts and recent SEC and other regulatory requirements. In addition, the Board considered a third-party study comparing the profitability of the Manager’s parent on an overall basis to other publicly held managers broken down to show profitability from management operations exclusive of distribution expenses, as well as profitability including distribution expenses. The Board also considered the extent to which the Manager and its affiliates might derive ancillary benefits from fund operations, including revenues generated from transfer agent services. Based upon its consideration of all these factors, the Board determined that the level of profits realized by the Manager and its affiliates from providing services to each Fund was not excessive in view of the nature, quality and extent of services provided.
ECONOMIES OF SCALE. The Board also considered whether economies of scale are realized by the Manager as the Funds grow larger and the extent to which this is reflected in the level of management fees charged. While recognizing any precise determination is inherently subjective, the Board noted that based upon the Fund profitability analysis, it appears that as some Funds get larger, at some point economies of scale do result in the Manager realizing a larger profit margin on management services provided such Fund. The Board also noted that any economies of scale are shared with each of these Funds and their shareholders through management fee breakpoints existing in each of the Funds’ investment management agreements, so that as a Fund grows in size, its effective management fee rate declines. The fee structure under the investment management agreement with each Fund provides an initial fee of 0.625% on the first $100 million of assets, 0.5% on the next $150 million of assets, 0.45% on assets in excess of $250 million, with additional breakpoints beginning at 0.44% on assets in excess of $7.5 billion, 0.43% on assets in excess of $10 billion and continuing thereafter until reaching a final breakpoint of 0.36% on assets in excess of $20 billion. In reviewing such structure, management stated its belief that this fee structure reaches a relatively low rate quickly as a Fund grows and that such low rate, in effect, reflects anticipated economies of scale as a Fund’s assets increase. In support of such position, management pointed out the favorable effective management fee and total expense comparisons for each Fund within its Lipper expense group as previously discussed under “Comparative Expenses.” The Board noted that at December 31, 2011, none of these Funds had assets in excess of $10 billion and believed that to the extent economies of scale may be realized by the Manager and its affiliates, the schedule of fees under the investment management agreement for each Fund provides a sharing of benefits with the Fund and its shareholders.
Annual Report | 195
Franklin Tax-Free Trust
Shareholder Information (continued)
Proxy Voting Policies and Procedures
The Trust’s investment manager has established Proxy Voting Policies and Procedures (Policies) that the Trust uses to determine how to vote proxies relating to portfolio securities. Shareholders may view the Trust’s complete Policies online at franklintempleton.com. Alternatively, shareholders may request copies of the Policies free of charge by calling the Proxy Group collect at (954) 527-7678 or by sending a written request to: Franklin Templeton Companies, LLC, 300 S.E. 2nd Street, Fort Lauderdale, FL 33301, Attention: Proxy Group. Copies of the Trust’s proxy voting records are also made available online at franklintempleton.com and posted on the U.S. Securities and Exchange Commission’s website at sec.gov and reflect the most recent 12-month period ended June 30.
Quarterly Statement of Investments
The Trust files a complete statement of investments with the U.S. Securities and Exchange Commission for the first and third quarters for each fiscal year on Form N-Q. Shareholders may view the filed Form N-Q by visiting the Commission’s website at sec.gov. The filed form may also be viewed and copied at the Commission’s Public Reference Room in Washington, DC. Information regarding the operations of the Public Reference Room may be obtained by calling (800) SEC-0330.
Householding of Reports and Prospectuses
You will receive each Fund’s financial reports every six months as well as an annual updated summary prospectus (prospectus available upon request). To reduce Fund expenses, we try to identify related shareholders in a household and send only one copy of the financial reports and summary prospectus. This process, called “householding,” will continue indefinitely unless you instruct us otherwise. If you prefer not to have these documents householded, please call us at (800) 632-2301. At any time you may view current prospectuses/summary prospectuses and financial reports on our website. If you choose, you may receive these documents through electronic delivery.
196 | Annual Report
This page intentionally left blank.
This page intentionally left blank.
Item 2. Code of Ethics.
(a) The Registrant has adopted a code of ethics that applies to its principal executive officers and principal financial and accounting officer.
(c) N/A
(d) N/A
(f) Pursuant to Item 12(a)(1), the Registrant is attaching as an exhibit a copy of its code of ethics that applies to its principal executive officers and principal financial and accounting officer.
Item 3. Audit Committee Financial Expert.
(a)(1) The Registrant has an audit committee financial expert serving on its audit committee.
(2) The audit committee financial expert is John B. Wilson, and he is "independent" as defined under the relevant Securities and Exchange Commission Rules and Releases.
Item 4. Principal Account Fees and Services.
(a) Audit Fees
The aggregate fees paid to the principal accountant for professional services rendered by the principal accountant for the audit of the registrant’s annual financial statements or for services that are normally provided by the principal accountant in connection with statutory and regulatory filings or engagements were $789,951 for the fiscal year ended February 29, 2012 and $814,407 for the fiscal year ended February 28, 2011.
(b) Audit-Related Fees
There were no fees paid to the principal accountant for assurance and related services rendered by the principal accountant to the registrant that are reasonably related to the performance of the audit of the registrant's financial statements and are not reported under paragraph (a) of Item 4.
There were no fees paid to the principal accountant for assurance and related services rendered by the principal accountant to the registrant's investment adviser and any entity controlling, controlled by or under common control with the investment adviser that provides ongoing services to the registrant that are reasonably related to the performance of the audit of their financial statements.
(c) Tax Fees
There were no fees paid to the principal accountant for professional services rendered by the principal accountant to the registrant for tax compliance, tax advice and tax planning.
The aggregate fees paid to the principal accountant for professional services rendered by the principal accountant to the registrant’s
investment adviser and any entity controlling, controlled by or under common control with the investment adviser that provides ongoing services to the registrant for tax compliance, tax advice and tax planning were $75,000 for the fiscal year ended February 29, 2012 and $60,000 for the fiscal year ended February 28, 2011. The services for which these fees were paid included technical tax consultation for capital gain tax reporting to foreign governments, application of local country tax laws to investments and licensing securities with local country offices.
(d) All Other Fees
The aggregate fees paid to the principal accountant for products and services rendered by the principal accountant to the registrant not reported in paragraphs (a)-(c) of Item 4 were $0 for the fiscal year ended February 29, 2012 and $12,442 for the fiscal year ended February 28, 2011. The services for which these fees were paid included review of materials provided to the fund Board in connection with the investment management contract renewal process.
The aggregate fees paid to the principal accountant for products and services rendered by the principal accountant to the registrant’s investment adviser and any entity controlling, controlled by or under common control with the investment adviser that provides ongoing services to the registrant other than services reported in paragraphs (a)-(c) of Item 4 were $0 for the fiscal year ended February 29, 2012 and $132,358 for the fiscal year ended February 28, 2011. The services for which these fees were paid included review of materials provided to the fund Board in connection with the investment management contract renewal process.
(e) (1) The registrant’s audit committee is directly responsible for approving the services to be provided by the auditors, including:
(i) pre-approval of all audit and audit related services;
(ii) pre-approval of all non-audit related services to be provided to the Fund by the auditors;
(iii) pre-approval of all non-audit related services to be provided to the registrant by the auditors to the registrant’s investment adviser or to any entity that controls, is controlled by or is under common control with the registrant’s investment adviser and that provides ongoing services to the registrant where the non-audit services relate directly to the operations or financial reporting of the registrant; and
(iv) establishment by the audit committee, if deemed necessary or appropriate, as an alternative to committee pre-approval of services to be provided by the auditors, as required by paragraphs (ii) and (iii) above, of policies and procedures to permit such services to be pre-approved by other means, such as through establishment of guidelines or by action of a designated member or members of the committee; provided the policies and procedures are detailed as to the particular service and the committee is informed of each service and such policies and procedures do not include delegation of audit committee responsibilities, as contemplated under the Securities Exchange Act of 1934, to management; subject, in the case of (ii)
through (iv), to any waivers, exceptions or exemptions that may be
available under applicable law or rules.
(e) (2) None of the services provided to the registrant described in
paragraphs (b)-(d) of Item 4 were approved by the audit committee
pursuant to paragraph (c)(7)(i)(C) of Rule 2-01 of regulation S-X.
(f) No disclosures are required by this Item 4(f).
(g) The aggregate non-audit fees paid to the principal accountant for
services rendered by the principal accountant to the registrant and the
registrant’s investment adviser and any entity controlling, controlled
by or under common control with the investment adviser that provides
ongoing services to the registrant were $75,000 for the fiscal year
ended February 29, 2012 and $204,800 for the fiscal year ended February
28, 2011.
(h) The registrant’s audit committee of the board has considered
whether the provision of non-audit services that were rendered to the
registrant’s investment adviser (not including any sub-adviser whose
role is primarily portfolio management and is subcontracted with or
overseen by another investment adviser), and any entity controlling,
controlled by, or under common control with the investment adviser that
provides ongoing services to the registrant that were not pre-approved
pursuant to paragraph (c)(7)(ii) of Rule 2-01 of Regulation S-X is
compatible with maintaining the principal accountant’s independence.
Item 5. Audit Committee of Listed Registrants. N/A
Item 6. Schedule of Investments. N/A
Item 7. Disclosure of Proxy Voting Policies and Procedures for Closed-
End Management Investment Companies. N/A
Item 8. Portfolio Managers of Closed-End Management Investment
Companies. N/A
Item 9. Purchases of Equity Securities by Closed-End Management
Investment Company and Affiliated Purchasers. N/A
Item 10. Submission of Matters to a Vote of Security Holders.
There have been no changes to the procedures by which shareholders may
recommend nominees to the Registrant's Board of Trustees that would
require disclosure herein.
Item 11. Controls and Procedures.
(a) Evaluation of Disclosure Controls and Procedures. The Registrant
maintains disclosure controls and procedures that are designed to
ensure that information required to be disclosed in the Registrant’s filings under the Securities Exchange Act of 1934 and the Investment Company Act of 1940 is recorded, processed, summarized and reported within the periods specified in the rules and forms of the Securities and Exchange Commission. Such information is accumulated and communicated to the Registrant’s management, including its principal executive officer and principal financial officer, as appropriate, to allow timely decisions regarding required disclosure. The Registrant’s management, including the principal executive officer and the principal financial officer, recognizes that any set of controls and procedures, no matter how well designed and operated, can provide only reasonable assurance of achieving the desired control objectives.
Within 90 days prior to the filing date of this Shareholder Report on Form N-CSR, the Registrant had carried out an evaluation, under the supervision and with the participation of the Registrant’s management, including the Registrant’s principal executive officer and the Registrant’s principal financial officer, of the effectiveness of the design and operation of the Registrant’s disclosure controls and procedures. Based on such evaluation, the Registrant’s principal executive officer and principal financial officer concluded that the Registrant’s disclosure controls and procedures are effective.
(b) Changes in Internal Controls. There have been no significant changes in the Registrant’s internal controls or in other factors that could significantly affect the internal controls subsequent to the date of their evaluation in connection with the preparation of this Shareholder Report on Form N-CSR.
Item 12. Exhibits.
(a)(1) Code of Ethics
(a)(2) Certifications pursuant to Section 302 of the Sarbanes-Oxley Act of 2002 of Laura F. Fergerson, Chief Executive Officer - Finance and Administration, and Gaston Gardey, Chief Financial Officer and Chief Accounting Officer
(b) Certifications pursuant to Section 906 of the Sarbanes-Oxley Act of 2002 of Laura F. Fergerson, Chief Executive Officer - Finance and Administration, and Gaston Gardey, Chief Financial Officer and Chief Accounting Officer
SIGNATURES
Pursuant to the requirements of the Securities Exchange Act of 1934 and the Investment Company Act of 1940, the registrant has duly caused this report to be signed on its behalf by the undersigned, thereunto duly authorized.
FRANKLIN TAX-FREE TRUST
By /s/LAURA F. FERGERSON
Laura F. Fergerson
5
Chief Executive Officer –
Finance and Administration
Date April 26, 2012
Pursuant to the requirements of the Securities Exchange Act of 1934 and the Investment Company Act of 1940, this report has been signed below by the following persons on behalf of the registrant and in the capacities and on the dates indicated.
By /s/LAURA F. FERGERSON
Laura F. Fergerson
Chief Executive Officer –
Finance and Administration
Date April 26, 2012
By /s/GASTON GARDY
Gaston Gardey
Chief Financial Officer and
Chief Accounting Officer
Date April 26, 2012
6