UNITED STATES
SECURITIES AND EXCHANGE COMMISSION
Washington, DC 20549
FORM N-CSR
CERTIFIED SHAREHOLDER REPORT OF REGISTERED MANAGEMENT INVESTMENT COMPANIES
Investment Company Act file number 811-04149
Franklin Tax-Free Trust
(Exact name of registrant as specified in charter)
One Franklin Parkway, San Mateo, CA 94403-1906
(Address of principal executive offices) (Zip code)
Craig S. Tyle, One Franklin Parkway, San Mateo, CA 94403-1906
(Name and address of agent for service)
Registrant's telephone number, including area code: (650) 312-2000
Date of fiscal year end: 2/28
Date of reporting period: 02/28/14
Item 1. Reports to Stockholders.
| | | | | | | |
| | Contents | | | | | |
| Shareholder Letter | 1 | Annual Report | | Franklin High Yield Tax-Free | | Notes to Financial Statements | 182 |
| | | Municipal Bond Market | | Income Fund | 34 | Report of Independent | |
| | | Overview | 4 | Franklin Insured Tax-Free | | Registered Public | |
| | | Investment Strategy | | Income Fund | 43 | Accounting Firm | 201 |
| | | and Manager’s Discussion | 6 | Franklin Massachusetts | | Tax Information | 202 |
| | | Franklin Double Tax-Free | | Tax-Free Income Fund | 52 | Board Members and Officers | 203 |
| | | Income Fund | 7 | Franklin New Jersey | | Shareholder Information | 208 |
| | | Franklin Federal Intermediate- | | Tax-Free Income Fund | 62 | | |
| | | Term Tax-Free Income Fund | 16 | Financial Highlights and | | | |
| | | Franklin Federal Limited-Term | | Statements of Investments | 72 | | |
| | | Tax-Free Income Fund | 25 | Financial Statements | 172 | | |
Annual Report
Municipal Bond Market Overview
For the 12-month period ended February 28, 2014, the municipal bond market declined in value. The Barclays Municipal Bond Index, which tracks investment-grade municipal securities, had a -0.21% total return for the 12-month period.1, 2 In comparison, the Barclays U.S. Treasury Index had a 12-month return of -0.88%.1, 2
Municipal bond and Treasury markets suffered steep declines beginning in late May 2013 following comments by Federal Reserve Board (Fed) Chairman Ben Bernanke that the Fed could begin tapering its bond buying in the coming months. Fears of declining bond prices increased when minutes from the Fed’s July meeting included more discussion of tapering. Municipal bond mutual funds experienced persistent, large outflows that accelerated during August. Selling in the Treasury and municipal bond markets caused yields on longer term bonds to rise faster than yields on shorter maturity bonds in both markets, but the yield difference was more pronounced for municipal bonds. Because bond prices move in the opposite direction from yields, the yield changes led to two significant developments during the sell-off — municipal bonds under-performed Treasury bonds, and longer term municipal bonds fared worse than shorter term municipal bonds. At its September meeting, the Fed decided to maintain its monthly level of bond purchases and wait for more evidence of sustained economic growth before tapering. Investors welcomed the news, and the municipal bond market posted positive returns for the month. At its December meeting, the Fed announced it would modestly reduce the pace of its bond buying program beginning in January 2014 while maintaining historically low interest rates. Municipal bond and Treasury markets showed little reaction to the news initially, but prices in both markets increased substantially during the first two months of 2014.
Other factors contributed to municipal bond price declines during the period under review. Several headline stories shook investor confidence in the municipal bond asset class. The City of Detroit, Michigan, filed for bankruptcy, the largest municipal bankruptcy filing in U.S. history. Independent credit rating agencies Standard & Poor’s, Moody’s Investors Service and Fitch Ratings downgraded Puerto Rico general obligation debt to below investment grade. The City of Chicago suffered a three-notch downgrade by Moody’s. In addition, reports from rating agencies and research organizations mentioned underfunded pensions that could affect the fiscal stability of several states and large municipalities. Bonds issued by municipalities involved in such stories have often experienced price erosion in secondary trading, but the extent of price erosion and the contagion to related issues have been unpredictable.
4 | Annual Report
Fallout from such headlines during the reporting period was no exception. As Puerto Rico debt traded at higher yields than similarly rated taxable securities, nontraditional buyers entered the market. Despite the entrance of these new buyers, Puerto Rico bonds experienced particularly poor performance and highly volatile trading. Puerto Rico bonds had a -16.99% total return for the reporting period, as measured by the Barclays Puerto Rico Municipal Bond Index.1, 2
At period-end, we maintained our positive view of the municipal bond market. We believe municipal bonds continue to be an attractive asset class among fixed income securities, and we intend to follow our solid discipline of investing to maximize income while seeking value in the municipal bond market.
The foregoing information reflects our analysis, opinions and portfolio holdings as of February 28, 2014, the end of the reporting period. The way we implement our main investment strategies and the resulting portfolio holdings may change depending on factors such as market and economic conditions. These opinions may not be relied upon as investment advice or an offer for a particular security. The information is not a complete analysis of every aspect of any market, state, industry, security or fund. Statements of fact are from sources considered reliable, but the investment manager makes no representation or warranty as to their completeness or accuracy. Although historical performance is no guarantee of future results, these insights may help you understand our investment management philosophy.
1. Source: © 2014 Morningstar. All Rights Reserved. The information contained herein: (1) is proprietary to Morningstar and/or its content providers; (2) may not be copied or distributed; and (3) is not warranted to be accurate, complete or timely. Neither Morningstar nor its content providers are responsible for any damages or losses arising from any use of this information. Past performance is no guarantee of future results.
2. Source: Barclays Global Family of Indices. © 2014 Barclays Capital Inc. Used with permission.
Annual Report | 5
Investment Strategy and
Manager’s Discussion
Investment Strategy
We use a consistent, disciplined strategy in an effort to maximize tax-exempt income for our shareholders by seeking to maintain exposure to higher coupon securities while balancing risk and return within each Fund’s range of allowable investments. We generally employ a buy-and-hold approach and invest in securities we believe should provide the most relative value in the market. We do not use leverage or derivatives, nor do we use hedging techniques that could add volatility and contribute to underperformance in adverse markets.
Manager’s Discussion
Based on the combination of our value-oriented philosophy of investing primarily for income and a positive-sloping municipal yield curve, in which yields for longer term bonds are higher than those for shorter term bonds, we favored the use of longer term bonds. Consistent with our strategy, we generally sought to purchase bonds from 15 to 30 years in maturity with good call features for the long-term funds, 10 to 15 years for the intermediate-term fund, and five years or less for the limited-term fund. We believe our conservative, buy-and-hold investment strategy can help us achieve high, current, tax-free income for shareholders.
We invite you to read your Fund report for more detailed performance and portfolio information. Thank you for your participation in Franklin Tax-Free Trust. We look forward to serving your future investment needs.
The foregoing information reflects our analysis, opinions and portfolio holdings as of February 28, 2014, the end of the reporting period. The way we implement our main investment strategies and the resulting portfolio holdings may change depending on factors such as market and economic conditions. These opinions may not be relied upon as investment advice or an offer for a particular security. The information is not a complete analysis of every aspect of any market, country, industry, security or fund. Statements of fact are from sources considered reliable, but the investment manager makes no representation or warranty as to their completeness or accuracy. Although historical performance is no guarantee of future results, these insights may help you understand our investment management philosophy.
6 | Annual Report
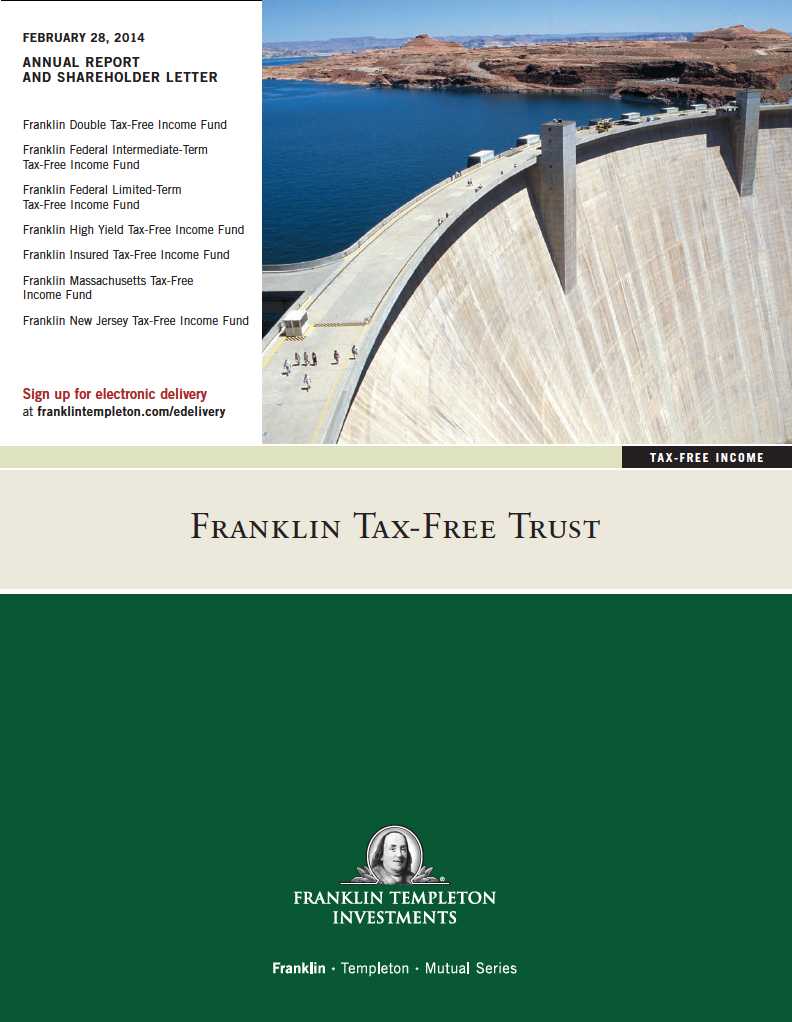
Franklin Double Tax-Free Income Fund
Your Fund’s Goal and Main Investments: Franklin Double Tax-Free Income Fund seeks to provide as high a level of income exempt from federal and state personal income taxes as is consistent with prudent investment management and preservation of capital by investing at least 80% of its net assets in securities that pay interest free from such taxes.1 The Fund focuses on municipal securities issued by U.S. territories such as Puerto Rico, Guam and the U.S. Virgin Islands, and currently invests primarily in Puerto Rican municipal securities.
|
| Performance data represent |
| past performance, which does |
| not guarantee future results. |
| Investment return and principal |
| value will fluctuate, and you may |
| have a gain or loss when you sell |
| your shares. Current performance |
| may differ from figures shown. |
| Please visit franklintempleton.com |
| or call (800) 342-5236 for most |
| recent month-end performance. |
This annual report for Franklin Double Tax-Free Income Fund covers theA fiscal year ended February 28, 2014. The Fund closed to all new investments (other than reinvestment of dividends or capital gains distributions) at theAA close of the market on August 1, 2012.
Performance Overview
The Fund’s Class A share price, as measured by net asset value, decreased from $12.15 on February 28, 2013, to $9.72 on February 28, 2014. The
The dollar value, number of shares or principal amount, and names of all portfolio holdings are listed in the Fund’s Statement of Investments (SOI). The SOI begins on page 75.
Annual Report | 7
| | | |
| Dividend Distributions* | | | |
| Franklin Double Tax-Free Income Fund | | | |
| 3/1/13–2/28/14 | | | |
| | Dividend per Share (cents) |
| Month | Class A | Class C | Advisor Class |
| March | 4.08 | 3.51 | 4.17 |
| April | 4.08 | 3.51 | 4.17 |
| May | 4.08 | 3.51 | 4.17 |
| June | 4.08 | 3.54 | 4.15 |
| July | 4.08 | 3.54 | 4.15 |
| August | 4.08 | 3.54 | 4.15 |
| September | 4.23 | 3.74 | 4.31 |
| October | 4.43 | 3.94 | 4.51 |
| November | 4.48 | 3.99 | 4.56 |
| December | 4.48 | 4.09 | 4.55 |
| January | 4.48 | 4.09 | 4.55 |
| February | 4.61 | 4.22 | 4.68 |
| Total | 51.19 | 45.22 | 52.12 |
*Assumes shares were purchased and held for the entire accrual period. Since dividends accrue daily, your actual distributions will vary depending on the date you purchased your shares and any account activity. All Fund distributions will vary depending upon current market conditions, and past distributions are not indicative of future trends.
Fund’s Class A shares paid dividends totaling 51.19 cents per share for the same period.2 The Performance Summary beginning on page 10 shows that at the end of this reporting period the Fund’s Class A shares’ distribution rate was 5.45%, based on an annualization of the 4.61 cent per share February dividend and the maximum offering price of $10.15 on February 28, 2014. An investor in the 2014 maximum federal income tax bracket of 39.60% (plus 3.8% Medicare tax) would need to earn a distribution rate of 9.63% from a taxable investment to match the Fund’s Class A tax-free distribution rate. For the Fund’s Class C and Advisor shares’ performance, please see the Performance Summary.
Manager’s Discussion
We used various investment strategies during the 12 months under review as we sought to maximize tax-free income for shareholders. Puerto Rico’s municipal bond market is widely traded because of its federal and state tax-exemption advantages. During the reporting period, some Puerto Rico issuers experienced a series of downgrades from Standard & Poor’s, Moody’s Investors Service and Fitch Ratings. In February 2014, these credit rating firms downgraded their respective ratings of Puerto Rico’s general obligation debt to below investment grade, along with the ratings of certain related Puerto Rico issuers. Additionally, each rating agency maintained a negative outlook on certain Puerto Rico issuers, and further downgrades are possible. The Fund is not
8 | Annual Report
required to sell securities that have been downgraded to below investment grade, but it is prohibited from making further purchases of such securities as long as the securities are not rated investment grade by at least one U.S. nationally recognized rating service. Rating actions combined with news related to the commonwealth’s financial position and future financing endeavors caused the Puerto Rico bond market to experience sharp declines in the latter half of 2013 and contrasting positive performance year-to-date in 2014.
Franklin Double Tax-Free Income Fund was the first mutual fund to offer both state and federal income tax exemptions in most states. We do this by focusing on investments in U.S. territories such as Puerto Rico, the U.S. Virgin Islands and Guam. This can be particularly appealing to residents of states where income from their own municipal securities may be fully taxable.
The Fund held 62 different positions across 10 different sectors as of February 28, 2014. Based on the Fund’s total long-term investments, issuers represented in the portfolio comprised Puerto Rico (66.3%), Guam (21.9%) and the U.S. Virgin Islands (7.6%).
Thank you for your continued participation in Franklin Double Tax-Free Income Fund. We believe our conservative, buy-and-hold investment strategy can help us achieve high, current, tax-free income for shareholders.
The foregoing information reflects our analysis, opinions and portfolio holdings as of February 28, 2014, the end
of the reporting period. The way we implement our main investment strategies and the resulting portfolio holdings
may change depending on factors such as market and economic conditions. These opinions may not be relied upon
as investment advice or an offer for a particular security. The information is not a complete analysis of every aspect
of any market, state, industry, security or the Fund. Statements of fact are from sources considered reliable, but
the investment manager makes no representation or warranty as to their completeness or accuracy. Although
historical performance is no guarantee of future results, these insights may help you understand our investment
management philosophy.
1. For investors subject to alternative minimum tax, a small portion of Fund dividends may be taxable. Distributions
of capital gains are generally taxable. To avoid imposition of 28% backup withholding on all Fund distributions and
redemption proceeds, U.S. investors must be properly certified on Form W-9 and non-U.S. investors on Form W-8BEN.
2. All Fund distributions will vary depending upon current market conditions, and past distributions are not indicative
of future trends.
| | |
| Portfolio Breakdown | | |
| Franklin Double Tax-Free Income Fund | |
| 2/28/14 | | |
| % of Total | |
| Long-Term Investments* | |
| Tax-Supported | 20.7 | % |
| Utilities | 15.3 | % |
| Other Revenue | 13.0 | % |
| Transportation | 12.7 | % |
| General Obligation | 12.3 | % |
| Subject to Government Appropriations | 9.3 | % |
| Higher Education | 8.4 | % |
| Refunded | 5.1 | % |
| Hospital & Health Care | 1.7 | % |
| Housing | 1.5 | % |
| |
| *Does not include short-term investments and other | |
| net assets. | | |
Annual Report | 9
Performance Summary as of 2/28/14
Franklin Double Tax-Free Income Fund
Your dividend income will vary depending on dividends or interest paid by securities in the Fund’s portfolio, adjusted for operating expenses of each class. Capital gain distributions are net profits realized from the sale of portfolio securities. The performance table and graphs do not reflect any taxes that a shareholder would pay on Fund dividends, capital gain distributions, if any, or any realized gains on the sale of Fund shares. Total return reflects reinvestment of the Fund’s dividends and capital gain distributions, if any, and any unrealized gains or losses.
| | | | | | | | |
| Price and Distribution Information | | | | | | |
| Class A (Symbol: FPRTX) | | | | Change | | 2/28/14 | | 2/28/13 |
| Net Asset Value (NAV) | | | -$ | 2.43 | $ | 9.72 | $ | 12.15 |
| Distributions (3/1/13–2/28/14) | | | | | | | | |
| Dividend Income | $ | 0.5119 | | | | | | |
| Class C (Symbol: FPRIX) | | | | Change | | 2/28/14 | | 2/28/13 |
| Net Asset Value (NAV) | | | -$ | 2.43 | $ | 9.77 | $ | 12.20 |
| Distributions (3/1/13–2/28/14) | | | | | | | | |
| Dividend Income | $ | 0.4522 | | | | | | |
| Advisor Class (Symbol: FDBZX) | | | | Change | | 2/28/14 | | 2/28/13 |
| Net Asset Value (NAV) | | | -$ | 2.43 | $ | 9.74 | $ | 12.17 |
| Distributions (3/1/13–2/28/14) | | | | | | | | |
| Dividend Income | $ | 0.5212 | | | | | | |
10 | Annual Report
Performance Summary (continued)
Performance
Cumulative total return excludes sales charges. Average annual total returns include maximum sales charges. Class A: 4.25% maximum initial sales charge; Class C: 1% contingent deferred sales charge in first year only; Advisor Class: no sales charges.
| | | | | | | | | | |
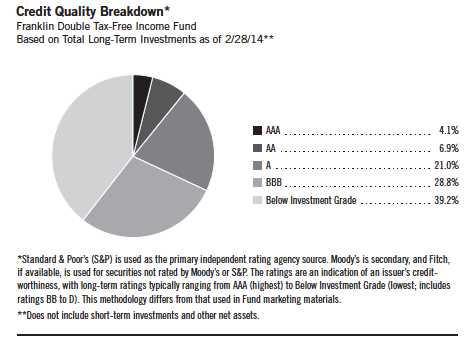
| Class A | | | 1-Year | | | 5-Year | | | 10-Year | |
| Cumulative Total Return1 | | | -16.00 | % | + | 15.22 | % | + | 24.91 | % |
| Average Annual Total Return2 | | | -19.58 | % | + | 1.98 | % | + | 1.80 | % |
| Avg. Ann. Total Return (3/31/14)3 | | | -17.58 | % | + | 2.71 | % | + | 1.90 | % |
| Distribution Rate4 | 5.45 | % | | | | | | | | |
| Taxable Equivalent Distribution Rate5 | 9.63 | % | | | | | | | | |
| 30-Day Standardized Yield6 | 5.32 | % | | | | | | | | |
| Taxable Equivalent Yield5 | 9.40 | % | | | | | | | | |
| Total Annual Operating Expenses7 | 0.66 | % | | | | | | | | |
| Class C | | | 1-Year | | | 5-Year | | | 10-Year | |
| Cumulative Total Return1 | | | -16.40 | % | + | 12.14 | % | + | 18.24 | % |
| Average Annual Total Return2 | | | -17.20 | % | + | 2.32 | % | + | 1.69 | % |
| Avg. Ann. Total Return (3/31/14)3 | | | -15.24 | % | + | 3.02 | % | + | 1.77 | % |
| Distribution Rate4 | 5.18 | % | | | | | | | | |
| Taxable Equivalent Distribution Rate5 | 9.15 | % | | | | | | | | |
| 30-Day Standardized Yield6 | 5.00 | % | | | | | | | | |
| Taxable Equivalent Yield5 | 8.83 | % | | | | | | | | |
| Total Annual Operating Expenses7 | 1.21 | % | | | | | | | | |
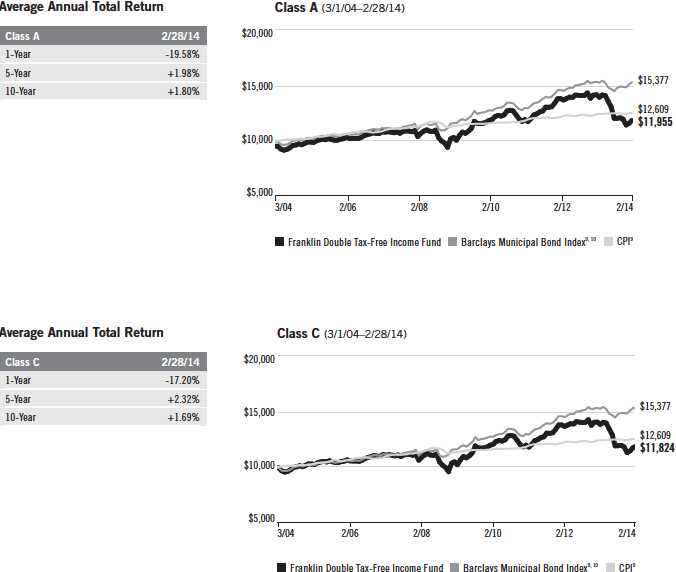
| Advisor Class8 | | | 1-Year | | | 5-Year | | | 10-Year | |
| Cumulative Total Return1 | | | -15.90 | % | + | 15.95 | % | + | 25.69 | % |
| Average Annual Total Return2 | | | -15.90 | % | + | 3.00 | % | + | 2.31 | % |
| Avg. Ann. Total Return (3/31/14)3 | | | -13.91 | % | + | 3.71 | % | + | 2.40 | % |
| Distribution Rate4 | 5.77 | % | | | | | | | | |
| Taxable Equivalent Distribution Rate5 | 10.19 | % | | | | | | | | |
| 30-Day Standardized Yield6 | 5.59 | % | | | | | | | | |
| Taxable Equivalent Yield5 | 9.88 | % | | | | | | | | |
| Total Annual Operating Expenses7 | 0.56 | % | | | | | | | | |
Performance data represent past performance, which does not guarantee future results. Investment return and principal value will fluctuate, and you may have a gain or loss when you sell your shares. Current performance may differ from figures shown. For most recent month-end performance, go to franklintempleton.com or call (800) 342-5236.
Annual Report | 11
Performance Summary (continued)
Total Return Index Comparison for a Hypothetical $10,000 Investment
Total return represents the change in value of an investment over the periods shown. It includes any applicable maximum sales charge, Fund expenses, account fees and reinvested distributions. The unmanaged index includes reinvestment of any income or distributions. It differs from the Fund in composition and does not pay management fees or expenses. One cannot invest directly in an index.
12 | Annual Report
All investments involve risks, including possible loss of principal. Because municipal bonds are sensitive to interest rate movements, the Fund’s yield and share price will fluctuate with market conditions. Bond prices generally move in the opposite direction of interest rates. Thus, as prices of bonds in the Fund adjust to a rise in interest rates, the Fund’s share price may decline. Because the Fund currently invests principally in Puerto Rico municipal bonds, it is subject to greater risk as those securities have been impacted by recent adverse economic and market changes. This along with adverse economic and regulatory changes in other U.S. territories may cause the Fund’s share price to decline. The Fund is classified as a nondiversified Fund, because it may invest a greater portion of its assets in the municipal securities of one issuer than a diversified fund. Changes in the credit rating of a bond, or in the credit rating or financial strength of a bond’s issuer, insurer or guarantor, may affect the bond’s value. The Fund may invest a significant part of its assets in municipal securities that finance similar types of projects, such as utilities, hospitals, higher education and transportation. A change that affects one project would likely affect all similar projects, thereby increasing market risk. The Fund is actively managed but there is no guarantee that the manager’s investment decisions will produce the desired results. The Fund’s prospectus also includes a description of the main investment risks.
Class C: These shares have higher annual fees and expenses than Class A shares.
Advisor Class: Shares are available to certain eligible investors as described in the prospectus.
1. Cumulative total return represents the change in value of an investment over the periods indicated.
2. Average annual total return represents the average annual change in value of an investment over the periods indicated.
3. In accordance with SEC rules, we provide standardized average annual total return information through the latest calendar quarter.
4. Distribution rate is based on an annualization of the respective class’s February dividend and the maximum offering price (NAV for Classes C and
Advisor) per share on 2/28/14.
5. Taxable equivalent distribution rate and yield assume the 2014 maximum federal income tax rate of 39.60% plus 3.8% Medicare tax.
6. The 30-day standardized yield for the month ended 2/28/14 reflects an estimated yield to maturity (assuming all portfolio securities are held to
maturity). It should be regarded as an estimate of the Fund’s rate of investment income, and it may not equal the Fund’s actual income distribution
rate (which reflects the Fund’s past dividends paid to shareholders) or the income reported in the Fund’s financial statements.
7. Figures are as stated in the Fund’s current prospectus. In periods of market volatility, assets may decline significantly, causing total annual Fund
operating expenses to become higher than the figures shown.
8. Effective 7/15/09, the Fund began offering Advisor Class shares, which do not have sales charges or a Rule 12b-1 plan. Performance quotations
for this class reflect the following methods of calculation: (a) For periods prior to 7/15/09, a restated figure is used based upon the Fund’s Class A
performance, excluding the effect of Class A’s maximum initial sales charge, but reflecting the effect of the Class A Rule 12b-1 fees; and (b) for peri-
ods after 7/15/09, actual Advisor Class performance is used reflecting all charges and fees applicable to that class. Since 7/15/09 (commencement
of sales), the cumulative and average annual total returns of Advisor Class shares were +11.34% and +2.35%.
9. Source: © 2014 Morningstar. The Barclays Municipal Bond Index is a market value-weighted index engineered for the long-term tax-exempt bond
market. To be included in the index, bonds must be fixed rate, have at least one year to final maturity and be rated investment grade (Baa3/BBB- or
higher) by at least two of the following agencies: Moody’s, Standard & Poor’s and Fitch. The Consumer Price Index (CPI), calculated by the Bureau of
Labor Statistics, is a commonly used measure of the inflation rate.
10. Source: Barclays Global Family of Indices. © 2014 Barclays Capital Inc. Used with permission.
Annual Report | 13
Your Fund’s Expenses
Franklin Double Tax-Free Income Fund
As a Fund shareholder, you can incur two types of costs:
- Transaction costs, including sales charges (loads) on Fund purchases; and
- Ongoing Fund costs, including management fees, distribution and service (12b-1) fees, and other Fund expenses. All mutual funds have ongoing costs, sometimes referred to as operating expenses.
The following table shows ongoing costs of investing in the Fund and can help you understand these costs and compare them with those of other mutual funds. The table assumes a $1,000 investment held for the six months indicated.
Actual Fund Expenses
The first line (Actual) for each share class listed in the table provides actual account values and expenses. The “Ending Account Value” is derived from the Fund’s actual return, which includes the effect of Fund expenses.
You can estimate the expenses you paid during the period by following these steps. Of course, your account value and expenses will differ from those in this illustration:
| 1. | Divide your account value by $1,000. |
| | If an account had an $8,600 value, then $8,600 ÷ $1,000 = 8.6. |
| 2. | Multiply the result by the number under the heading “Expenses Paid During Period.” |
| | If Expenses Paid During Period were $7.50, then 8.6 x $7.50 = $64.50. |
In this illustration, the estimated expenses paid this period are $64.50.
Hypothetical Example for Comparison with Other Funds
Information in the second line (Hypothetical) for each class in the table can help you compare ongoing costs of investing in the Fund with those of other mutual funds. This information may not be used to estimate the actual ending account balance or expenses you paid during the period. The hypothetical “Ending Account Value” is based on the actual expense ratio for each class and an assumed 5% annual rate of return before expenses, which does not represent the Fund’s actual return. The figure under the heading “Expenses Paid During Period” shows the hypothetical expenses your account would have incurred under this scenario. You can compare this figure with the 5% hypothetical examples that appear in shareholder reports of other funds.
14 | Annual Report
Your Fund’s Expenses (continued)
Please note that expenses shown in the table are meant to highlight ongoing costs and do not reflect any transaction costs, such as sales charges. Therefore, the second line for each class is useful in comparing ongoing costs only, and will not help you compare total costs of owning different funds. In addition, if transaction costs were included, your total costs would have been higher. Please refer to the Fund prospectus for additional information on operating expenses.
| | | | | | |
| | | Beginning Account | | Ending Account | | Expenses Paid During |
| Class A | | Value 9/1/13 | | Value 2/28/14 | | Period* 9/1/13–2/28/14 |
| Actual | $ | 1,000 | $ | 988.00 | $ | 3.45 |
| Hypothetical (5% return before expenses) | $ | 1,000 | $ | 1,021.32 | $ | 3.51 |
| Class C | | | | | | |
| Actual | $ | 1,000 | $ | 986.40 | $ | 6.21 |
| Hypothetical (5% return before expenses) | $ | 1,000 | $ | 1,018.55 | $ | 6.31 |
| Advisor Class | | | | | | |
| Actual | $ | 1,000 | $ | 989.50 | $ | 3.01 |
| Hypothetical (5% return before expenses) | $ | 1,000 | $ | 1,021.77 | $ | 3.06 |
*Expenses are calculated using the most recent six-month expense ratio, annualized for each class (A: 0.70%; C: 1.26%; and Advisor: 0.61%), multiplied by the average account value over the period, multiplied by 181/365 to reflect the one-half year period.
Annual Report | 15
Franklin Federal Intermediate-Term Tax-Free Income Fund
Your Fund’s Goal and Main Investments: Franklin Federal Intermediate-Term Tax-Free Income Fund seeks to provide as high a level of income exempt from federal income taxes as is consistent with prudent investment management and preservation of capital by investing at least 80% of its total assets in securities that pay interest free from such taxes.1 The Fund maintains a dollar-weighted average portfolio maturity (the time in which the debt must be repaid) of three to 10 years.
| | |
| Credit Quality Breakdown* | | |
| Franklin Federal Intermediate-Term Tax-Free Income Fund | | |
| 2/28/14 | | |
| | % of Total | |
| Ratings | Long-Term Investments** | |
| AAA | 6.4 | % |
| AA | 57.3 | % |
| A | 31.1 | % |
| BBB | 4.0 | % |
| Below Investment Grade | 0.9 | % |
| Not Rated | 0.3 | % |
| |
| *Standard & Poor’s (S&P) is used as the primary independent rating agency source. Moody’s is secondary, and Fitch, | |
| if available, is used for securities not rated by Moody’s or S&P. The ratings are an indication of an issuer’s credit- | |
| worthiness, with long-term ratings typically ranging from AAA (highest) to Below Investment Grade (lowest; includes | |
| ratings BB to D). This methodology differs from that used in Fund marketing materials. | |
| **Does not include short-term investments and other net assets. | | |
This annual report for Franklin Federal Intermediate-Term Tax-Free Income Fund covers the fiscal year ended February 28, 2014.
Performance data represent past performance, which does not guarantee future results. Investment return and principal value will fluctuate, and you may have a gain or loss when you sell your shares. Current performance may differ from figures shown. Please visit franklintempleton.com or call (800) 342-5236 for most recent month-end performance.
Performance Overview
The Fund’s Class A share price, as measured by net asset value, decreased from $12.59 on February 28, 2013, to $12.21 on February 28, 2014. The Fund’s Class A shares paid dividends totaling 33.71 cents per share for the same period.2 The Performance Summary beginning on page 19 shows that
The dollar value, number of shares or principal amount, and names of all portfolio holdings are listed in the Fund’s Statement of Investments (SOI). The SOI begins on page 81.
16 | Annual Report
| | | |
| Dividend Distributions* | | | |
| Franklin Federal Intermediate-Term Tax-Free Income Fund | | |
| 3/1/13–2/28/14 | | | |
| | Dividend per Share (cents) |
| Month | Class A | Class C | Advisor Class |
| March | 2.63 | 2.04 | 2.73 |
| April | 2.63 | 2.04 | 2.73 |
| May | 2.63 | 2.04 | 2.73 |
| June | 2.63 | 2.05 | 2.73 |
| July | 2.63 | 2.05 | 2.73 |
| August | 2.73 | 2.15 | 2.83 |
| September | 2.93 | 2.40 | 3.03 |
| October | 2.98 | 2.45 | 3.08 |
| November | 2.98 | 2.45 | 3.08 |
| December | 2.98 | 2.45 | 3.08 |
| January | 2.98 | 2.45 | 3.08 |
| February | 2.98 | 2.45 | 3.08 |
| Total | 33.71 | 27.02 | 34.91 |
*Assumes shares were purchased and held for the entire accrual period. Since dividends accrue daily, your actual distributions will vary depending on the date you purchased your shares and any account activity. All Fund distributions will vary depending upon current market conditions, and past distributions are not indicative of future trends.
at the end of this reporting period the Fund’s Class A shares’ distribution rate was 2.86%, based on an annualization of the 2.98 cent per share February dividend and the maximum offering price of $12.49 on February 28, 2014. An investor in the 2014 maximum federal income tax bracket of 39.60% (plus 3.8% Medicare tax) would need to earn a distribution rate of 5.05% from a taxable investment to match the Fund’s Class A tax-free distribution rate. For the Fund’s Class C and Advisor shares’ performance, please see the Performance Summary.
Manager’s Discussion
We used various investment strategies during the 12 months under review as we sought to maximize tax-free income for shareholders. Puerto Rico’s municipal bond market is widely traded because of its federal and state tax-exemption advantages. During the reporting period, some Puerto Rico issuers experienced a series of downgrades from Standard & Poor’s, Moody’s Investors Service and Fitch Ratings. In February 2014, these credit rating firms downgraded their respective ratings of Puerto Rico’s general obligation debt to below investment grade, along with the ratings of certain related Puerto Rico issuers. Additionally, each rating agency maintained a negative outlook
Annual Report | 17
| | |
| Portfolio Breakdown | | |
| Franklin Federal Intermediate-Term | | |
| Tax-Free Income Fund | | |
| 2/28/14 | | |
| % of Total | |
| Long-Term Investments* | |
| General Obligation | 21.6 | % |
| Utilities | 19.5 | % |
| Subject to Government Appropriations | 17.5 | % |
| Transportation | 15.0 | % |
| Hospital & Health Care | 8.2 | % |
| Tax-Supported | 7.3 | % |
| Other Revenue | 5.7 | % |
| Higher Education | 3.4 | % |
| Refunded | 1.8 | % |
| |
| *Does not include short-term investments and other | |
| net assets. | | |
on certain Puerto Rico issuers, and further downgrades are possible. The Fund is not required to sell securities that have been downgraded to below investment grade, but it is prohibited from making further purchases of such securities as long as the securities are not rated investment grade by at least one U.S. nationally recognized rating service. Rating actions combined with news related to the commonwealth’s financial position and future financing endeavors caused the Puerto Rico bond market to experience sharp declines in the latter half of 2013 and contrasting positive performance year-to-date in 2014.
Thank you for your continued participation in Franklin Federal Intermediate-Term Tax-Free Income Fund. We believe our conservative, buy-and-hold investment strategy can help us achieve high, current, tax-free income for shareholders.
The foregoing information reflects our analysis, opinions and portfolio holdings as of February 28, 2014, the end of the reporting period. The way we implement our main investment strategies and the resulting portfolio holdings may change depending on factors such as market and economic conditions. These opinions may not be relied upon as investment advice or an offer for a particular security. The information is not a complete analysis of every aspect of any market, state, industry, security or the Fund. Statements of fact are from sources considered reliable, but the investment manager makes no representation or warranty as to their completeness or accuracy. Although historical performance is no guarantee of future results, these insights may help you understand our investment management philosophy.
1. Dividends are generally subject to state and local taxes, if any. For investors subject to alternative minimum tax, a small portion of Fund dividends may be taxable. Distributions of capital gains are generally taxable. To avoid imposition of 28% backup withholding on all Fund distributions and redemption proceeds, U.S. investors must be properly certified on Form W-9 and non-U.S. investors on Form W-8BEN.
2. All Fund distributions will vary depending upon current market conditions, and past distributions are not indicative of future trends.
18 | Annual Report
Performance Summary as of 2/28/14
Franklin Federal Intermediate-Term Tax-Free Income Fund
Your dividend income will vary depending on dividends or interest paid by securities in the Fund’s portfolio, adjusted for operating expenses of each class. Capital gain distributions are net profits realized from the sale of portfolio securities. The performance table and graphs do not reflect any taxes that a shareholder would pay on Fund dividends, capital gain distributions, if any, or any realized gains on the sale of Fund shares. Total return reflects reinvestment of the Fund’s dividends and capital gain distributions, if any, and any unrealized gains or losses.
| | | | | | | | |
| Price and Distribution Information | | | | | | |
| Class A (Symbol: FKITX) | | | | Change | | 2/28/14 | | 2/28/13 |
| Net Asset Value (NAV) | | | -$ | 0.38 | $ | 12.21 | $ | 12.59 |
| Distributions (3/1/13–2/28/14) | | | | | | | | |
| Dividend Income | $ | 0.3371 | | | | | | |
| Class C (Symbol: FCITX) | | | | Change | | 2/28/14 | | 2/28/13 |
| Net Asset Value (NAV) | | | -$ | 0.38 | $ | 12.24 | $ | 12.62 |
| Distributions (3/1/13–2/28/14) | | | | | | | | |
| Dividend Income | $ | 0.2702 | | | | | | |
| Advisor Class (Symbol: FITZX) | | | | Change | | 2/28/14 | | 2/28/13 |
| Net Asset Value (NAV) | | | -$ | 0.37 | $ | 12.24 | $ | 12.61 |
| Distributions (3/1/13–2/28/14) | | | | | | | | |
| Dividend Income | $ | 0.3491 | | | | | | |
Annual Report | 19
Performance Summary (continued)
Performance
Cumulative total return excludes sales charges. Average annual total returns include maximum sales charges. Class A: 2.25% maximum initial sales charge; Class C: 1% contingent deferred sales charge in first year only; Advisor Class: no sales charges.
| | | | | | | | | | |
| Class A | | | 1-Year | | | 5-Year | | | 10-Year | |
| Cumulative Total Return1 | | | -0.29 | % | + | 30.46 | % | + | 46.75 | % |
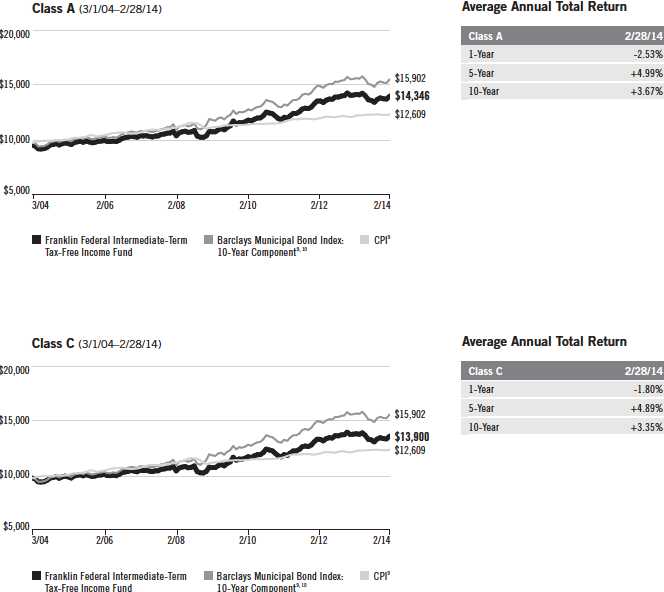
| Average Annual Total Return2 | | | -2.53 | % | + | 4.99 | % | + | 3.67 | % |
| Avg. Ann. Total Return (3/31/14)3 | | | -2.46 | % | + | 4.93 | % | + | 3.72 | % |
| Distribution Rate4 | 2.86 | % | | | | | | | | |
| Taxable Equivalent Distribution Rate5 | 5.05 | % | | | | | | | | |
| 30-Day Standardized Yield6 | 1.63 | % | | | | | | | | |
| Taxable Equivalent Yield5 | 2.88 | % | | | | | | | | |
| Total Annual Operating Expenses7 | 0.65 | % | | | | | | | | |
| Class C | | | 1-Year | | | 5-Year | | | 10-Year | |
| Cumulative Total Return1 | | | -0.83 | % | + | 26.95 | % | + | 39.00 | % |
| Average Annual Total Return2 | | | -1.80 | % | + | 4.89 | % | + | 3.35 | % |
| Avg. Ann. Total Return (3/31/14)3 | | | -1.72 | % | + | 4.83 | % | + | 3.39 | % |
| Distribution Rate4 | 2.40 | % | | | | | | | | |
| Taxable Equivalent Distribution Rate5 | 4.24 | % | | | | | | | | |
| 30-Day Standardized Yield6 | 1.15 | % | | | | | | | | |
| Taxable Equivalent Yield5 | 2.03 | % | | | | | | | | |
| Total Annual Operating Expenses7 | 1.20 | % | | | | | | | | |
| Advisor Class8 | | | 1-Year | | | 5-Year | | | 10-Year | |
| Cumulative Total Return1 | | | -0.11 | % | + | 31.27 | % | + | 47.82 | % |
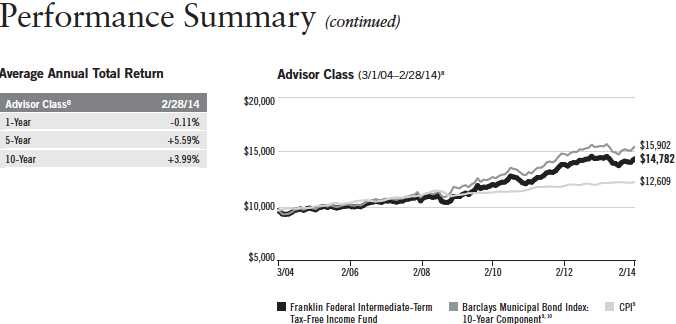
| Average Annual Total Return2 | | | -0.11 | % | + | 5.59 | % | + | 3.99 | % |
| Avg. Ann. Total Return (3/31/14)3 | | | -0.02 | % | + | 5.54 | % | + | 4.03 | % |
| Distribution Rate4 | 3.02 | % | | | | | | | | |
| Taxable Equivalent Distribution Rate5 | 5.34 | % | | | | | | | | |
| 30-Day Standardized Yield6 | 1.85 | % | | | | | | | | |
| Taxable Equivalent Yield5 | 3.27 | % | | | | | | | | |
| Total Annual Operating Expenses7 | 0.55 | % | | | | | | | | |
Performance data represent past performance, which does not guarantee future results. Investment return and principal value will fluctuate, and you may have a gain or loss when you sell your shares. Current performance may differ from figures shown. For most recent month-end performance, go to franklintempleton.com or call (800) 342-5236.
20 | Annual Report
Performance Summary (continued)
Total Return Index Comparison for a Hypothetical $10,000 Investment
Total return represents the change in value of an investment over the periods shown. It includes any applicable maximum sales charge, Fund expenses, account fees and reinvested distributions. The unmanaged index includes reinvestment of any income or distributions. It differs from the Fund in composition and does not pay management fees or expenses. One cannot invest directly in an index.
Annual Report | 21
All investments involve risks, including possible loss of principal. Because municipal bonds are sensitive to interest rate movements, the Fund’s yield and share price will fluctuate with market conditions. Bond prices generally move in the opposite direction of interest rates. Thus, as prices of bonds in the Fund adjust to a rise in interest rates, the Fund’s share price may decline. The Fund holds a small portion of its assets in Puerto Rico municipal bonds that have been impacted by recent adverse economic and market changes, which may cause the Fund’s share price to decline. Changes in the credit rating of a bond, or in the credit rating or financial strength of a bond’s issuer, insurer or guarantor, may affect the bond’s value. The Fund may invest a significant part of its assets in municipal securities that finance similar types of projects, such as utilities, hospitals, higher education and transportation. A change that affects one project would likely affect all similar projects, thereby increasing market risk. The Fund is actively managed but there is no guarantee that the manager’s investment decisions will produce the desired results. The Fund’s prospectus also includes a description of the main investment risks.
Class C: These shares have higher annual fees and expenses than Class A shares.
Advisor Class: Shares are available to certain eligible investors as described in the prospectus.
1. Cumulative total return represents the change in value of an investment over the periods indicated.
2. Average annual total return represents the average annual change in value of an investment over the periods indicated.
3. In accordance with SEC rules, we provide standardized average annual total return information through the latest calendar quarter.
4. Distribution rate is based on an annualization of the respective class’s February dividend and the maximum offering price (NAV for Classes C and
Advisor) per share on 2/28/14.
5. Taxable equivalent distribution rate and yield assume the 2014 maximum federal income tax rate of 39.60% plus 3.8% Medicare tax.
6. The 30-day standardized yield for the month ended 2/28/14 reflects an estimated yield to maturity (assuming all portfolio securities are held to
maturity). It should be regarded as an estimate of the Fund’s rate of investment income, and it may not equal the Fund’s actual income distribution
rate (which reflects the Fund’s past dividends paid to shareholders) or the income reported in the Fund’s financial statements.
7. Figures are as stated in the Fund’s current prospectus. In periods of market volatility, assets may decline significantly, causing total annual Fund
operating expenses to become higher than the figures shown.
8. Effective 12/1/08, the Fund began offering Advisor Class shares, which do not have sales charges or a Rule 12b-1 plan. Performance quotations
for this class reflect the following methods of calculation: (a) For periods prior to 12/1/08, a restated figure is used based upon the Fund’s Class A
performance, excluding the effect of Class A’s maximum initial sales charge, but reflecting the effect of the Class A Rule 12b-1 fees; and (b) for peri-
ods after 12/1/08, actual Advisor Class performance is used reflecting all charges and fees applicable to that class. Since 12/1/08 (commencement
of sales), the cumulative and average annual total returns of Advisor Class shares were +37.83% and +6.31%.
9. Source: © 2014 Morningstar. The Barclays Municipal Bond Index: 10-Year Component is the 10-year (8-12) component of the Municipal Bond
Index, which is a market value-weighted index engineered for the long-term tax-exempt bond market. To be included in the index, bonds must be
fixed rate, have at least one year to final maturity and be rated investment grade (Baa3/BBB- or higher) by at least two of the following agencies:
Moody’s, Standard & Poor’s and Fitch. The Consumer Price Index (CPI), calculated by the Bureau of Labor Statistics, is a commonly used measure of
the inflation rate.
10. Source: Barclays Global Family of Indices. © 2014 Barclays Capital Inc. Used with permission.
22 | Annual Report
Your Fund’s Expenses
Franklin Federal Intermediate-Term Tax-Free Income Fund
As a Fund shareholder, you can incur two types of costs:
- Transaction costs, including sales charges (loads) on Fund purchases; and
- Ongoing Fund costs, including management fees, distribution and service (12b-1) fees, and other Fund expenses. All mutual funds have ongoing costs, sometimes referred to as operating expenses.
The following table shows ongoing costs of investing in the Fund and can help you understand these costs and compare them with those of other mutual funds. The table assumes a $1,000 investment held for the six months indicated.
Actual Fund Expenses
The first line (Actual) for each share class listed in the table provides actual account values and expenses. The “Ending Account Value” is derived from the Fund’s actual return, which includes the effect of Fund expenses.
You can estimate the expenses you paid during the period, by following these steps. Of course, your account value and expenses will differ from those in this illustration:
| 1. | Divide your account value by $1,000. |
| | If an account had an $8,600 value, then $8,600 ÷ $1,000 = 8.6. |
| 2. | Multiply the result by the number under the heading “Expenses Paid During Period.” |
| | If Expenses Paid During Period were $7.50, then 8.6 x $7.50 = $64.50. |
In this illustration, the estimated expenses paid this period are $64.50.
Hypothetical Example for Comparison with Other Funds
Information in the second line (Hypothetical) for each class in the table can help you compare ongoing costs of investing in the Fund with those of other mutual funds. This information may not be used to estimate the actual ending account balance or expenses you paid during the period. The hypothetical “Ending Account Value” is based on the actual expense ratio for each class and an assumed 5% annual rate of return before expenses, which does not represent the Fund’s actual return. The figure under the heading “Expenses Paid During Period” shows the hypothetical expenses your account would have incurred under this scenario. You can compare this figure with the 5% hypothetical examples that appear in shareholder reports of other funds.
Annual Report | 23
Your Fund’s Expenses (continued)
Please note that expenses shown in the table are meant to highlight ongoing costs and do not reflect any transaction costs, such as sales charge. Therefore, the second line for each class is useful in comparing ongoing costs only, and will not help you compare total costs of owning different funds. In addition, if transaction costs were included, your total costs would have been higher. Please refer to the Fund prospectus for additional information on operating expenses.
| | | | | | |
| | | Beginning Account | | Ending Account | | Expenses Paid During |
| Class A | | Value 9/1/13 | | Value 2/28/14 | | Period* 9/1/13–2/28/14 |
| Actual | $ | 1,000 | $ | 1,050.10 | $ | 3.41 |
| Hypothetical (5% return before expenses) | $ | 1,000 | $ | 1,021.47 | $ | 3.36 |
| Class C | | | | | | |
| Actual | $ | 1,000 | $ | 1,047.30 | $ | 6.19 |
| Hypothetical (5% return before expenses) | $ | 1,000 | $ | 1,018.74 | $ | 6.11 |
| Advisor Class | | | | | | |
| Actual | $ | 1,000 | $ | 1,051.40 | $ | 2.90 |
| Hypothetical (5% return before expenses) | $ | 1,000 | $ | 1,021.97 | $ | 2.86 |
*Expenses are calculated using the most recent six-month expense ratio, annualized for each class (A: 0.67%; C: 1.22%; and Advisor: 0.57%), multiplied by the average account value over the period, multiplied by 181/365 to reflect the one-half year period.
24 | Annual Report
Franklin Federal Limited-Term Tax-Free Income Fund
Your Fund’s Goal and Main Investments: Franklin Federal Limited-Term Tax-Free Income Fund seeks to provide as high a level of income exempt from federal income taxes as is consistent with prudent investment management and preservation of capital by investing at least 80% of its total assets in securities that pay interest free from such taxes.1 The Fund maintains a dollar-weighted average portfolio maturity (the time in which the debt must be repaid) of five years or less.
Performance data represent past performance, which does not guarantee future results. Investment return and principal value will fluctuate, and you may have a gain or loss when you sell your shares. Current performance may differ from figures shown. Please visit franklintempleton.com or call (800) 342-5236 for most recent month-end performance.
| | |
| Credit Quality Breakdown* | | |
| Franklin Federal Limited-Term Tax-Free Income Fund | | |
| 2/28/14 | | |
| | % of Total | |
| Ratings | Long-Term Investments** | |
| SP-1 | 0.7 | % |
| AAA | 13.8 | % |
| AA | 55.2 | % |
| A | 25.5 | % |
| BBB | 4.0 | % |
| Below Investment Grade | 0.5 | % |
| Not Rated | 0.3 | % |
| |
| *Standard & Poor’s (S&P) is used as the primary independent rating agency source. Moody’s is secondary, and Fitch, | |
| if available, is used for securities not rated by Moody’s or S&P. The ratings are an indication of an issuer’s credit- | |
| worthiness, with short-term ratings typically ranging from SP-1 and MIG 1 (highest) to SP-3 and SG (lowest) and | |
| long-term ratings typically ranging from AAA (highest) to Below Investment Grade (lowest; includes ratings BB to D). | |
| This methodology differs from that used in Fund marketing materials. | | |
| **Does not include short-term investments and other net assets. | | |
This annual report for Franklin Federal Limited-Term Tax-Free Income Fund covers the fiscal year ended February 28, 2014.
Performance Overview
The Fund’s Class A share price, as measured by net asset value, decreased from $10.56 on February 28, 2013, to $10.51 on February 28, 2014. The Fund’s Class A shares paid dividends totaling 12.91 cents per share for the same period.2 The Performance Summary beginning on page 28 shows that
The dollar value, number of shares or principal amount, and names of all portfolio holdings are listed in the Fund’s Statement of Investments (SOI). The SOI begins on page 101.
Annual Report | 25
| | |
| Dividend Distributions* | | |
| Franklin Federal Limited-Term Tax-Free Income Fund | | |
| 3/1/13–2/28/14 | | |
| | Dividend per Share (cents) |
| Month | Class A | Advisor Class |
| March | 1.26 | 1.39 |
| April | 1.26 | 1.39 |
| May | 1.26 | 1.39 |
| June | 1.26 | 1.39 |
| July | 1.14 | 1.27 |
| August | 1.14 | 1.27 |
| September | 1.14 | 1.27 |
| October | 1.06 | 1.19 |
| November | 0.86 | 0.99 |
| December | 0.86 | 0.99 |
| January | 0.86 | 0.99 |
| February | 0.81 | 0.94 |
| Total | 12.91 | 14.47 |
*Assumes shares were purchased and held for the entire accrual period. Since dividends accrue daily, your actual distributions will vary depending on the date you purchased your shares and any account activity. All Fund distributions will vary depending upon current market conditions, and past distributions are not indicative of future trends.
at the end of this reporting period the Fund’s Class A shares’ distribution rate was 0.90%, based on an annualization of the 0.81 cent per share February dividend and the maximum offering price of $10.75 on February 28, 2014. An investor in the 2014 maximum federal income tax bracket of 39.60% (plus 3.8% Medicare tax) would need to earn a distribution rate of 1.59% from a taxable investment to match the Fund’s Class A tax-free distribution rate. For the Fund’s Advisor Class shares’ performance, please see the Performance Summary. Dividend distributions were affected by lower interest rates during the period. This and other factors resulted in reduced income for the portfolio and caused dividends to be lower at the end of the period.
Manager’s Discussion
We used various investment strategies during the 12 months under review as we sought to maximize tax-free income for shareholders. Puerto Rico’s municipal bond market is widely traded because of its federal and state tax-exemption advantages. During the reporting period, some Puerto Rico issuers experienced a series of downgrades from Standard & Poor’s, Moody’s Investors Service and Fitch Ratings. In February 2014, these credit rating firms downgraded their respective ratings of Puerto Rico’s general obligation
26 | Annual Report
debt to below investment grade, along with the ratings of certain related Puerto Rico issuers. Additionally, each rating agency maintained a negative outlook on certain Puerto Rico issuers, and further downgrades are possible. The Fund is not required to sell securities that have been downgraded to below investment grade, but it is prohibited from making further purchases of such securities as long as the securities are not rated investment grade by at least one U.S. nationally recognized rating service. Rating actions combined with news related to the commonwealth’s financial position and future financing endeavors caused the Puerto Rico bond market to experience sharp declines in the latter half of 2013 and contrasting positive performance year-to-date in 2014.
Consistent with our investment strategy, we invested in bonds we believed could provide the most relative value from an income perspective. Seeking a dollar-weighted average portfolio maturity of five years or less, we concentrated in the one- to five-year range in an effort to insulate investors against bond market volatility. As a result of our strategy, we believe the Fund was positioned to be less sensitive to changes in short-term interest rates, and to preserve capital and produce tax-free income.
Thank you for your continued participation in Franklin Federal Limited-Term Tax-Free Income Fund. We believe our conservative, buy-and-hold investment strategy can help us achieve high, current, tax-free income for shareholders.
The foregoing information reflects our analysis, opinions and portfolio holdings as of February 28, 2014, the end
of the reporting period. The way we implement our main investment strategies and the resulting portfolio holdings
may change depending on factors such as market and economic conditions. These opinions may not be relied upon
as investment advice or an offer for a particular security. The information is not a complete analysis of every aspect
of any market, state, industry, security or the Fund. Statements of fact are from sources considered reliable, but
the investment manager makes no representation or warranty as to their completeness or accuracy. Although
historical performance is no guarantee of future results, these insights may help you understand our investment
management philosophy.
1. Dividends are generally subject to state and local taxes, if any. For investors subject to alternative minimum tax, a
small portion of Fund dividends may be taxable. Distributions of capital gains are generally taxable. To avoid imposi-
tion of 28% backup withholding on all Fund distributions and redemption proceeds, U.S. investors must be properly
certified on Form W-9 and non-U.S. investors on Form W-8BEN.
2. All Fund distributions will vary depending upon current market conditions, and past distributions are not indicative
of future trends.
| | |
| Portfolio Breakdown | | |
| Franklin Federal Limited-Term Tax-Free | |
| Income Fund | | |
| 2/28/14 | | |
| % of Total | |
| Long-Term Investments* | |
| General Obligation | 27.2 | % |
| Utilities | 14.8 | % |
| Transportation | 12.1 | % |
| Subject to Government Appropriations | 9.8 | % |
| Tax-Supported | 9.8 | % |
| Other | 7.1 | % |
| Higher Education | 6.8 | % |
| Refunded | 5.9 | % |
| Hospital & Health Care | 4.9 | % |
| Housing | 1.1 | % |
| Corporate-Backed | 0.5 | % |
| |
| *Does not include short-term investments and other | |
| net assets. | | |
Annual Report | 27
Performance Summary as of 2/28/14
Franklin Federal Limited-Term Tax-Free Income Fund
Your dividend income will vary depending on dividends or interest paid by securities in the Fund’s portfolio, adjusted for operating expenses of each class. Capital gain distributions are net profits realized from the sale of portfolio securities. The performance table and graphs do not reflect any taxes that a shareholder would pay on Fund dividends, capital gain distributions, if any, or any realized gains on the sale of Fund shares. Total return reflects reinvestment of the Fund’s dividends and capital gain distributions, if any, and any unrealized gains or losses.
| | | | | | | | |
| Price and Distribution Information | | | | | | |
| Class A (Symbol: FFTFX) | | | | Change | | 2/28/14 | | 2/28/13 |
| Net Asset Value (NAV) | | | -$ | 0.05 | $ | 10.51 | $ | 10.56 |
| Distributions (3/1/13–2/28/14) | | | | | | | | |
| Dividend Income | $ | 0.1291 | | | | | | |
| Advisor Class (Symbol: FTFZX) | | | | Change | | 2/28/14 | | 2/28/13 |
| Net Asset Value (NAV) | | | -$ | 0.05 | $ | 10.50 | $ | 10.55 |
| Distributions (3/1/13–2/28/14) | | | | | | | | |
| Dividend Income | $ | 0.1447 | | | | | | |
28 | Annual Report
Performance Summary (continued)
Performance1
Cumulative total return excludes sales charges. Average annual total returns include maximum sales charges.
Class A: 2.25% maximum initial sales charge; Advisor Class: no sales charges.
| | | | | | | | | |
| Class A | | 1-Year | | | 5-Year | | | 10-Year | |
| Cumulative Total Return2 | + | 0.76 | % | + | 14.05 | % | + | 29.02 | % |
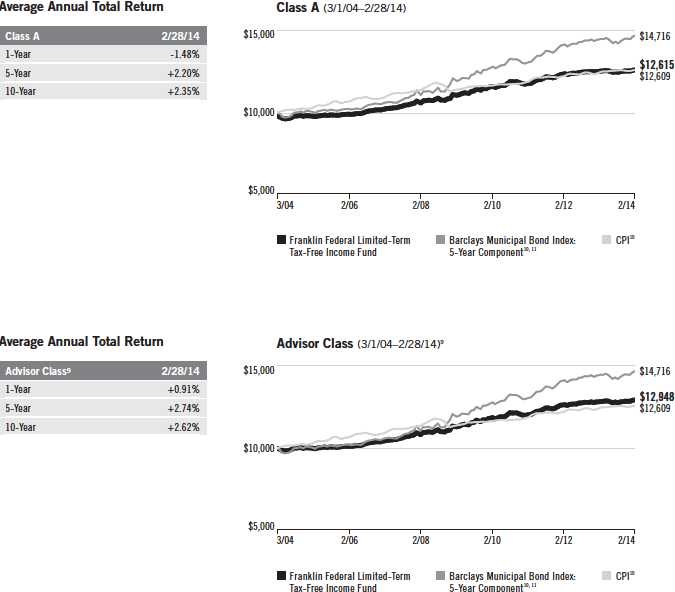
| Average Annual Total Return3 | | -1.48 | % | + | 2.20 | % | + | 2.35 | % |
| Avg. Ann. Total Return (3/31/14)4 | | -1.90 | % | + | 2.08 | % | + | 2.34 | % |
| Distribution Rate5 | | 0.90 | % | | | | | | |
| Taxable Equivalent Distribution Rate6 | | 1.59 | % | | | | | | |
| 30-Day Standardized Yield7 | | 0.45% (with waiver) | | | 0.22% (without waiver) | |
| Taxable Equivalent Yield6 | | 0.80% (with waiver) | | | 0.39% (without waiver) | |
| Total Annual Operating Expenses8 | | 0.60% (with waiver) | | | 0.84% (without waiver) | |
| Advisor Class9 | | 1-Year | | | 5-Year | | | 10-Year | |
| Cumulative Total Return2 | + | 0.91 | % | + | 14.46 | % | + | 29.48 | % |
| Average Annual Total Return3 | + | 0.91 | % | + | 2.74 | % | + | 2.62 | % |
| Avg. Ann. Total Return (3/31/14)4 | + | 0.58 | % | + | 2.63 | % | + | 2.61 | % |
| Distribution Rate5 | | 1.07 | % | | | | | | |
| Taxable Equivalent Distribution Rate6 | | 1.89 | % | | | | | | |
| 30-Day Standardized Yield7 | | 0.60% (with waiver) | | | 0.37% (without waiver) | |
| Taxable Equivalent Yield6 | | 1.06% (with waiver) | | | 0.65% (without waiver) | |
| Total Annual Operating Expenses8 | | 0.45% (with waiver) | | | 0.69% (without waiver) | |
Performance data represent past performance, which does not guarantee future results. Investment return and principal value will fluctuate, and you may have a gain or loss when you sell your shares. Current performance may differ from figures shown. For most recent month-end performance, go to franklintempleton.com or call (800) 342-5236.
Annual Report | 29
Performance Summary (continued)
Total Return Index Comparison for a Hypothetical $10,000 Investment1
Total return represents the change in value of an investment over the periods shown. It includes any current maximum sales charge, Fund expenses, account fees and reinvested distributions. The unmanaged index includes reinvestment of any income or distributions. It differs from the Fund in composition and does not pay management fees or expenses. One cannot invest directly in an index.
30 | Annual Report
Performance Summary (continued)
All investments involve risks, including possible loss of principal. Because municipal bonds are sensitive to interest rate movements, the Fund’s yield and share price will fluctuate with market conditions. Bond prices generally move in the opposite direction of interest rates. Thus, as prices of bonds in the Fund adjust to a rise in interest rates, the Fund’s share price may decline. The Fund holds a small portion of its assets in Puerto Rico municipal bonds that have been impacted by recent adverse economic and market changes, which may cause the Fund’s share price to decline. Changes in the credit rating of a bond, or in the credit rating or financial strength of a bond’s issuer, insurer or guarantor, may affect the bond’s value. The Fund may invest a significant part of its assets in municipal securities that finance similar types of projects, such as utilities, hospitals, higher education and transportation. A change that affects one project would likely affect all similar projects, thereby increasing market risk. The Fund is actively managed but there is no guarantee that the manager’s investment decisions will produce the desired results. The Fund’s prospectus also includes a description of the main investment risks.
Class A: Prior to 2/1/06, these shares were offered without an initial sales charge; thus actual total returns would have differed.
Advisor Class: Shares are available to certain eligible investors as described in the prospectus.
1. The Fund has an expense reduction contractually guaranteed through at least 6/30/14. Fund investment results reflect the expense reduction, to
the extent applicable; without this reduction, the results would have been lower.
2. Cumulative total return represents the change in value of an investment over the periods indicated.
3. Average annual total return represents the average annual change in value of an investment over the periods indicated.
4. In accordance with SEC rules, we provide standardized average annual total return information through the latest calendar quarter.
5. Distribution rate is based on an annualization of the respective class’s February dividend and the maximum offering price (NAV for Advisor Class)
per share on 2/28/14.
6. Taxable equivalent distribution rate and yield assume the 2014 maximum federal income tax rate of 39.60% plus 3.8% Medicare tax.
7. The 30-day standardized yield for the month ended 2/28/14 reflects an estimated yield to maturity (assuming all portfolio securities are held to
maturity). It should be regarded as an estimate of the Fund’s rate of investment income, and it may not equal the Fund’s actual income distribution
rate (which reflects the Fund’s past dividends paid to shareholders) or the income reported in the Fund’s financial statements.
8. Figures are as stated in the Fund’s current prospectus. In periods of market volatility, assets may decline significantly, causing total annual Fund
operating expenses to become higher than the figures shown.
9. Effective 2/1/11, the Fund began offering Advisor Class shares, which do not have sales charges or a Rule 12b-1 plan. Performance quotations for
this class reflect the following methods of calculation: (a) For periods prior to 2/1/11, a restated figure is used based upon the Fund’s Class A per-
formance, excluding the effect of Class A’s maximum initial sales charge, but reflecting the effect of the Class A Rule 12b-1 fees; and (b) for periods
after 2/1/11, actual Advisor Class performance is used reflecting all charges and fees applicable to that class. Since 2/1/11 (commencement of
sales), the cumulative and average annual total returns of Advisor Class shares were +7.87% and +2.49%.
10. Source: © 2014 Morningstar. The Barclays Municipal Bond Index: 5-Year Component is the 5-year (4-6) component of the Municipal Bond Index,
which is a market value-weighted index engineered for the long-term tax-exempt bond market. To be included in the index, bonds must be fixed rate,
have at least one year to final maturity and be rated investment grade (Baa3/BBB- or higher) by at least two of the following agencies: Moody’s,
Standard & Poor’s and Fitch. The Consumer Price Index (CPI), calculated by the Bureau of Labor Statistics, is a commonly used measure of the infla-
tion rate.
11. Source: Barclays Global Family of Indices. © 2014 Barclays Capital Inc. Used with permission.
Annual Report | 31
Your Fund’s Expenses
Franklin Federal Limited-Term Tax-Free Income Fund
As a Fund shareholder, you can incur two types of costs:
- Transaction costs, including sales charges (loads) on Fund purchases; and
- Ongoing Fund costs, including management fees, distribution and service (12b-1) fees, and other Fund expenses. All mutual funds have ongoing costs, sometimes referred to as operating expenses.
The following table shows ongoing costs of investing in the Fund and can help you understand these costs and compare them with those of other mutual funds. The table assumes a $1,000 investment held for the six months indicated.
Actual Fund Expenses
The first line (Actual) for each share class listed in the table provides actual account values and expenses. The “Ending Account Value” is derived from the Fund’s actual return, which includes the effect of Fund expenses.
You can estimate the expenses you paid during the period by following these steps. Of course, your account value and expenses will differ from those in this illustration:
| 1. | Divide your account value by $1,000. |
| | If an account had an $8,600 value, then $8,600 ÷ $1,000 = 8.6. |
| 2. | Multiply the result by the number under the heading “Expenses Paid During Period.” |
| | If Expenses Paid During Period were $7.50, then 8.6 x $7.50 = $64.50. |
In this illustration, the estimated expenses paid this period are $64.50.
Hypothetical Example for Comparison with Other Funds
Information in the second line (Hypothetical) for each class in the table can help you compare ongoing costs of investing in the Fund with those of other mutual funds. This information may not be used to estimate the actual ending account balance or expenses you paid during the period. The hypothetical “Ending Account Value” is based on the actual expense ratio for each class and an assumed 5% annual rate of return before expenses, which does not represent the Fund’s actual return. The figure under the heading “Expenses Paid During Period” shows the hypothetical expenses your account would have incurred under this scenario. You can compare this figure with the 5% hypothetical examples that appear in shareholder reports of other funds.
32 | Annual Report
Your Fund’s Expenses (continued)
Please note that expenses shown in the table are meant to highlight ongoing costs and do not reflect any transaction costs, such as sales charges. Therefore, the second line for each class is useful in comparing ongoing costs only, and will not help you compare total costs of owning different funds. In addition, if transaction costs were included, your total costs would have been higher. Please refer to the Fund prospectus for additional information on operating expenses.
| | | | | | |
| | | Beginning Account | | Ending Account | | Expenses Paid During |
| Class A | | Value 9/1/13 | | Value 2/28/14 | | Period* 9/1/13–2/28/14 |
| Actual | $ | 1,000 | $ | 1,013.10 | $ | 2.99 |
| Hypothetical (5% return before expenses) | $ | 1,000 | $ | 1,021.82 | $ | 3.01 |
| Advisor Class | | | | | | |
| Actual | $ | 1,000 | $ | 1,013.80 | $ | 2.25 |
| Hypothetical (5% return before expenses) | $ | 1,000 | $ | 1,022.56 | $ | 2.26 |
*Expenses are calculated using the most recent six-month expense ratio, net of expense waivers, annualized for each class (A: 0.60% and Advisor: 0.45%), multiplied by the average account value over the period, multiplied by 181/365 to reflect the one-half year period.
Annual Report | 33
Franklin High Yield Tax-Free Income Fund
Your Fund’s Goals and Main Investments: Franklin High Yield Tax-Free Income Fund seeks to provide a high current yield exempt from federal income taxes by investing at least 80% of its net assets in securities that pay interest free from such taxes.1 Its secondary goal is capital appreciation to the extent possible and consistent with the Fund’s principal investment goal.
Performance data represent past performance, which does not guarantee future results. Investment return and principal value will fluctuate, and you may have a gain or loss when you sell your shares. Current performance may differ from figures shown. Please visit franklintempleton.com or call (800) 342-5236 for most recent month-end performance.
| | |
| Credit Quality Breakdown* | | |
| Franklin High Yield Tax-Free Income Fund | | |
| 2/28/14 | | |
| | % of Total | |
| Ratings | Long-Term Investments** | |
| AAA | 0.8 | % |
| AA | 19.6 | % |
| A | 35.5 | % |
| BBB | 22.1 | % |
| Below Investment Grade | 13.3 | % |
| Not Rated | 8.7 | % |
| |
| *Standard & Poor’s (S&P) is used as the primary independent rating agency source. Moody’s is secondary, and Fitch, if | |
| available, is used for securities not rated by Moody’s or S&P. The ratings are an indication of an issuer’s creditworthi- | |
| ness, with long-term ratings typically ranging from AAA (highest) to Below Investment Grade (lowest; includes ratings | |
| BB to D). This methodology differs from that used in Fund marketing materials. | | |
| **Does not include short-term investments and other net assets. | | |
This annual report for Franklin High Yield Tax-Free Income Fund covers the fiscal year ended February 28, 2014.
Performance Overview
The Fund’s Class A share price, as measured by net asset value, decreased from $10.98 on February 28, 2013, to $10.15 on February 28, 2014. The Fund’s Class A shares paid dividends totaling 45.94 cents per share for the same period.2 The Performance Summary beginning on page 37 shows that at the end of this reporting period the Fund’s Class A shares’ distribution rate was 4.74%, based on an annualization of the 4.19 cent per share February dividend and the maximum offering price of $10.60 on February 28, 2014. An investor in the 2014 maximum federal income tax bracket of 39.60%
The dollar value, number of shares or principal amount, and names of all portfolio holdings are listed in the Fund’s Statement of Investments (SOI). The SOI begins on page 116.
34 | Annual Report
| | | |
| Dividend Distributions* | | | |
| Franklin High Yield Tax-Free Income Fund | | | |
| 3/1/13–2/28/14 | | | |
| | Dividend per Share (cents) |
| Month | Class A | Class C | Advisor Class |
| March | 3.55 | 3.03 | 3.64 |
| April | 3.55 | 3.03 | 3.64 |
| May | 3.55 | 3.03 | 3.64 |
| June | 3.55 | 3.05 | 3.64 |
| July | 3.65 | 3.15 | 3.74 |
| August | 3.75 | 3.25 | 3.84 |
| September | 3.95 | 3.52 | 4.03 |
| October | 4.05 | 3.62 | 4.13 |
| November | 4.05 | 3.62 | 4.13 |
| December | 4.05 | 3.61 | 4.13 |
| January | 4.05 | 3.61 | 4.13 |
| February | 4.19 | 3.75 | 4.27 |
| Total | 45.94 | 40.27 | 46.96 |
*Assumes shares were purchased and held for the entire accrual period. Since dividends accrue daily, your actual distributions will vary depending on the date you purchased your shares and any account activity. All Fund distributions will vary depending upon current market conditions, and past distributions are not indicative of future trends.
(plus 3.8% Medicare tax) would need to earn a distribution rate of 8.37% from a taxable investment to match the Fund’s Class A tax-free distribution rate. For the Fund’s Class C and Advisor shares’ performance, please see the Performance Summary.
Manager’s Discussion
We used various investment strategies during the 12 months under review as we sought to maximize tax-free income for shareholders. Puerto Rico’s municipal bond market is widely traded because of its federal and state tax-exemption advantages. During the reporting period, some Puerto Rico issuers experienced a series of downgrades from Standard & Poor’s, Moody’s Investors Service and Fitch Ratings. In February 2014, these credit rating firms downgraded their respective ratings of Puerto Rico’s general obligation debt to below investment grade, along with the ratings of certain related Puerto Rico issuers. Additionally, each rating agency maintained a negative outlook on certain Puerto Rico issuers, and further downgrades are possible. The Fund is not required to sell securities that have been downgraded to below investment grade, and may invest in municipal securities in any rating category. Rating
Annual Report | 35
| | |
| Portfolio Breakdown | | |
| Franklin High Yield Tax-Free Income Fund | |
| 2/28/14 | | |
| % of Total | |
| Long-Term Investments* | |
| Utilities | 19.5 | % |
| Transportation | 18.4 | % |
| Hospital & Health Care | 17.1 | % |
| General Obligation | 10.8 | % |
| Tax-Supported | 9.7 | % |
| Subject to Government Appropriations | 6.1 | % |
| Corporate-Backed | 5.6 | % |
| Refunded | 5.2 | % |
| Other Revenue | 4.3 | % |
| Higher Education | 2.2 | % |
| Housing | 1.1 | % |
| |
| *Does not include short-term investments and other | |
| net assets. | | |
actions combined with news related to the commonwealth’s financial position and future financing endeavors caused the Puerto Rico bond market to experience sharp declines in the latter half of 2013 and contrasting positive performance year-to-date in 2014.
During the reporting period, the Fund continued to generate high, current, tax-free income for its shareholders. Consistent with our strategy, the Fund did not use leverage or credit derivatives to boost short-term returns, and we were careful to not overexpose the portfolio to any one credit sector.
Thank you for your continued participation in Franklin High Yield Tax-Free Income Fund. We believe our conservative, buy-and-hold investment strategy can help us achieve high, current, tax-free income for shareholders.
The foregoing information reflects our analysis, opinions and portfolio holdings as of February 28, 2014, the end of the reporting period. The way we implement our main investment strategies and the resulting portfolio holdings may change depending on factors such as market and economic conditions. These opinions may not be relied upon as investment advice or an offer for a particular security. The information is not a complete analysis of every aspect of any market, state, industry, security or the Fund. Statements of fact are from sources considered reliable, but the investment manager makes no representation or warranty as to their completeness or accuracy. Although historical performance is no guarantee of future results, these insights may help you understand our investment management philosophy.
1. Dividends are generally subject to state and local taxes, if any. For investors subject to alternative minimum tax, a small portion of Fund dividends may be taxable. Distributions of capital gains are generally taxable. To avoid imposition of 28% backup withholding on all Fund distributions and redemption proceeds, U.S. investors must be properly certified on Form W-9 and non-U.S. investors on Form W-8BEN.
2. All Fund distributions will vary depending upon current market conditions, and past distributions are not indicative of future trends.
36 | Annual Report
Performance Summary as of 2/28/14
Franklin High Yield Tax-Free Income Fund
Your dividend income will vary depending on dividends or interest paid by securities in the Fund’s portfolio, adjusted for operating expenses of each class. Capital gain distributions are net profits realized from the sale of portfolio securities. The performance table and graphs do not reflect any taxes that a shareholder would pay on Fund dividends, capital gain distributions, if any, or any realized gains on the sale of Fund shares. Total return reflects reinvestment of the Fund’s dividends and capital gain distributions, if any, and any unrealized gains or losses.
| | | | | | | | |
| Price and Distribution Information | | | | | | |
| Class A (Symbol: FRHIX) | | | | Change | | 2/28/14 | | 2/28/13 |
| Net Asset Value (NAV) | | | -$ | 0.83 | $ | 10.15 | $ | 10.98 |
| Distributions (3/1/13–2/28/14) | | | | | | | | |
| Dividend Income | $ | 0.4594 | | | | | | |
| Class C (Symbol: FHYIX) | | | | Change | | 2/28/14 | | 2/28/13 |
| Net Asset Value (NAV) | | | -$ | 0.83 | $ | 10.31 | $ | 11.14 |
| Distributions (3/1/13–2/28/14) | | | | | | | | |
| Dividend Income | $ | 0.4027 | | | | | | |
| Advisor Class (Symbol: FHYVX) | | | | Change | | 2/28/14 | | 2/28/13 |
| Net Asset Value (NAV) | | | -$ | 0.84 | $ | 10.18 | $ | 11.02 |
| Distributions (3/1/13–2/28/14) | | | | | | | | |
| Dividend Income | $ | 0.4696 | | | | | | |
Annual Report | 37
Performance Summary (continued)
Performance
Cumulative total return excludes sales charges. Average annual total returns include maximum sales charges. Class A: 4.25% maximum initial sales charge; Class C: 1% contingent deferred sales charge in first year only; Advisor Class: no sales charges.
| | | | | | | | | | |
| Class A | | | 1-Year | | | 5-Year | | | 10-Year | |
| Cumulative Total Return1 | | | -3.20 | % | + | 48.62 | % | + | 56.73 | % |
| Average Annual Total Return2 | | | -7.34 | % | + | 7.31 | % | + | 4.14 | % |
| Avg. Ann. Total Return (3/31/14)3 | | | -6.19 | % | + | 7.40 | % | + | 4.21 | % |
| Distribution Rate4 | 4.74 | % | | | | | | | | |
| Taxable Equivalent Distribution Rate5 | 8.37 | % | | | | | | | | |
| 30-Day Standardized Yield6 | 4.10 | % | | | | | | | | |
| Taxable Equivalent Yield5 | 7.24 | % | | | | | | | | |
| Total Annual Operating Expenses7 | 0.65 | % | | | | | | | | |
| Class C | | | 1-Year | | | 5-Year | | | 10-Year | |
| Cumulative Total Return1 | | | -3.77 | % | + | 44.55 | % | + | 48.34 | % |
| Average Annual Total Return2 | | | -4.70 | % | + | 7.65 | % | + | 4.02 | % |
| Avg. Ann. Total Return (3/31/14)3 | | | -3.57 | % | + | 7.77 | % | + | 4.09 | % |
| Distribution Rate4 | 4.36 | % | | | | | | | | |
| Taxable Equivalent Distribution Rate5 | 7.70 | % | | | | | | | | |
| 30-Day Standardized Yield6 | 3.73 | % | | | | | | | | |
| Taxable Equivalent Yield5 | 6.59 | % | | | | | | | | |
| Total Annual Operating Expenses7 | 1.20 | % | | | | | | | | |
| Advisor Class8 | | | 1-Year | | | 5-Year | | | 10-Year | |
| Cumulative Total Return1 | | | -3.19 | % | + | 49.33 | % | + | 57.91 | % |
| Average Annual Total Return2 | | | -3.19 | % | + | 8.35 | % | + | 4.67 | % |
| Avg. Ann. Total Return (3/31/14)3 | | | -2.03 | % | + | 8.45 | % | + | 4.74 | % |
| Distribution Rate4 | 5.03 | % | | | | | | | | |
| Taxable Equivalent Distribution Rate5 | 8.89 | % | | | | | | | | |
| 30-Day Standardized Yield6 | 4.39 | % | | | | | | | | |
| Taxable Equivalent Yield5 | 7.76 | % | | | | | | | | |
| Total Annual Operating Expenses7 | 0.55 | % | | | | | | | | |
Performance data represent past performance, which does not guarantee future results. Investment return and principal value will fluctuate, and you may have a gain or loss when you sell your shares. Current performance may differ from figures shown. For most recent month-end performance, go to franklintempleton.com or call (800) 342-5236.
38 | Annual Report
Performance Summary (continued)
Total Return Index Comparison for a Hypothetical $10,000 Investment
Total return represents the change in value of an investment over the periods shown. It includes any applicable maximum sales charge, Fund expenses, account fees and reinvested distributions. The unmanaged index includes reinvestment of any income or distributions. It differs from the Fund in composition and does not pay management fees or expenses. One cannot invest directly in an index.
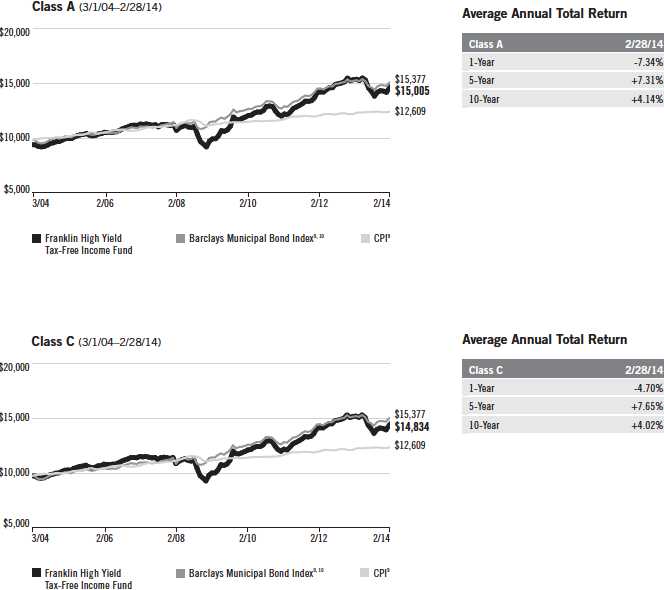
Annual Report | 39
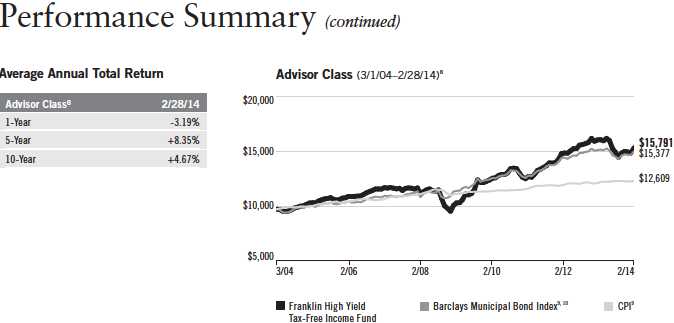
All investments involve risks, including possible loss of principal. Because municipal bonds are sensitive to interest rate movements, the Fund’s yield and share price will fluctuate with market conditions. Bond prices generally move in the opposite direction of interest rates. Thus, as prices of bonds in the Fund adjust to a rise in interest rates, the Fund’s share price may decline. Investments in lower-rated bonds include higher risk of default and loss of principal. The Fund holds a small portion of its assets in Puerto Rico municipal bonds that have been impacted by recent adverse economic and market changes, which may cause the Fund’s share price to decline. Changes in the credit rating of a bond, or in the credit rating or financial strength of a bond’s issuer, insurer or guarantor, may affect the bond’s value. The Fund may invest a significant part of its assets in municipal securities that finance similar types of projects, such as utilities, hospitals, higher education and transportation. A change that affects one project would likely affect all similar projects, thereby increasing market risk. The Fund is actively managed but there is no guarantee that the manager’s decisions will produce the desired results. The Fund’s prospectus also includes a description of the main investment risks.
Class C: These shares have higher annual fees and expenses than Class A shares.
Advisor Class: Shares are available to certain eligible investors as described in the prospectus.
1. Cumulative total return represents the change in value of an investment over the periods indicated.
2. Average annual total return represents the average annual change in value of an investment over the periods indicated.
3. In accordance with SEC rules, we provide standardized average annual total return information through the latest calendar quarter.
4. Distribution rate is based on an annualization of the respective class’s February dividend and the maximum offering price (NAV for Classes C and
Advisor) per share on 2/28/14.
5. Taxable equivalent distribution rate and yield assume the 2014 maximum federal income tax rate of 39.60% plus 3.8% Medicare tax.
6. The 30-day standardized yield for the month ended 2/28/14 reflects an estimated yield to maturity (assuming all portfolio securities are held to
maturity). It should be regarded as an estimate of the Fund’s rate of investment income, and it may not equal the Fund’s actual income distribution
rate (which reflects the Fund’s past dividends paid to shareholders) or the income reported in the Fund’s financial statements.
7. Figures are as stated in the Fund’s current prospectus. In periods of market volatility, assets may decline significantly, causing total annual Fund
operating expenses to become higher than the figures shown.
8. Effective 1/3/06, the Fund began offering Advisor Class shares, which do not have sales charges or a Rule 12b-1 plan. Performance quotations for
this class reflect the following methods of calculation: (a) For periods prior to 1/3/06, a restated figure is used based upon the Fund’s Class A per-
formance, excluding the effect of Class A’s maximum initial sales charge, but reflecting the effect of the Class A Rule 12b-1 fees; and (b) for periods
after 1/3/06, actual Advisor Class performance is used reflecting all charges and fees applicable to that class. Since 1/3/06 (commencement of
sales), the cumulative and average annual total returns of Advisor Class shares were +43.29% and +4.51%.
9. Source: © 2014 Morningstar. The Barclays Municipal Bond Index is a market value-weighted index engineered for the long-term tax-exempt bond
market. To be included in the index, bonds must be fixed rate, have at least one year to final maturity and be rated investment grade (Baa3/BBB- or
higher) by at least two of the following agencies: Moody’s, Standard & Poor’s and Fitch. The Consumer Price Index (CPI), calculated by the Bureau of
Labor Statistics, is a commonly used measure of the inflation rate.
10. Source: Barclays Global Family of Indices. © 2014 Barclays Capital Inc. Used with permission.
40 | Annual Report
Your Fund’s Expenses
Franklin High Yield Tax-Free Income Fund
As a Fund shareholder, you can incur two types of costs:
- Transaction costs, including sales charges (loads) on Fund purchases; and
- Ongoing Fund costs, including management fees, distribution and service (12b-1) fees, and other Fund expenses. All mutual funds have ongoing costs, sometimes referred to as operating expenses.
The following table shows ongoing costs of investing in the Fund and can help you understand these costs and compare them with those of other mutual funds. The table assumes a $1,000 investment held for the six months indicated.
Actual Fund Expenses
The first line (Actual) for each share class listed in the table provides actual account values and expenses. The “Ending Account Value” is derived from the Fund’s actual return, which includes the effect of Fund expenses.
You can estimate the expenses you paid during the period by following these steps. Of course, your account value and expenses will differ from those in this illustration:
| 1. | Divide your account value by $1,000. |
| | If an account had an $8,600 value, then $8,600 ÷ $1,000 = 8.6. |
| 2. | Multiply the result by the number under the heading “Expenses Paid During Period.” |
| | If Expenses Paid During Period were $7.50, then 8.6 x $7.50 = $64.50. |
In this illustration, the estimated expenses paid this period are $64.50.
Hypothetical Example for Comparison with Other Funds
Information in the second line (Hypothetical) for each class in the table can help you compare ongoing costs of investing in the Fund with those of other mutual funds. This information may not be used to estimate the actual ending account balance or expenses you paid during the period. The hypothetical “Ending Account Value” is based on the actual expense ratio for each class and an assumed 5% annual rate of return before expenses, which does not represent the Fund’s actual return. The figure under the heading “Expenses Paid During Period” shows the hypothetical expenses your account would have incurred under this scenario. You can compare this figure with the 5% hypothetical examples that appear in shareholder reports of other funds.
Annual Report | 41
Your Fund’s Expenses (continued)
Please note that expenses shown in the table are meant to highlight ongoing costs and do not reflect any transaction costs, such as sales charges. Therefore, the second line for each class is useful in comparing ongoing costs only, and will not help you compare total costs of owning different funds. In addition, if transaction costs were included, your total costs would have been higher. Please refer to the Fund prospectus for additional information on operating expenses.
| | | | | | |
| | | Beginning Account | | Ending Account | | Expenses Paid During |
| Class A | | Value 9/1/13 | | Value 2/28/14 | | Period* 9/1/13–2/28/14 |
| Actual | $ | 1,000 | $ | 1,073.40 | $ | 3.24 |
| Hypothetical (5% return before expenses) | $ | 1,000 | $ | 1,021.67 | $ | 3.16 |
| Class C | | | | | | |
| Actual | $ | 1,000 | $ | 1,070.50 | $ | 6.06 |
| Hypothetical (5% return before expenses) | $ | 1,000 | $ | 1,018.94 | $ | 5.91 |
| Advisor Class | | | | | | |
| Actual | $ | 1,000 | $ | 1,073.70 | $ | 2.73 |
| Hypothetical (5% return before expenses) | $ | 1,000 | $ | 1,022.17 | $ | 2.66 |
*Expenses are calculated using the most recent six-month expense ratio, annualized for each class (A: 0.63%; C: 1.18%; and Advisor: 0.53%), multiplied by the average account value over the period, multiplied by 181/365 to reflect the one-half year period.
42 | Annual Report
Franklin Insured Tax-Free Income Fund
Your Fund’s Goal and Main Investments: Franklin Insured Tax-Free Income Fund seeks to provide as high a level of income exempt from federal income taxes as is consistent with prudent investment management and preservation of capital by investing at least 80% of its total assets in securities that pay interest free from such taxes.1 The Fund invests predominantly in insured municipal securities.2
Performance data represent past performance, which does not guarantee future results. Investment return and principal value will fluctuate, and you may have a gain or loss when you sell your shares. Current performance may differ from figures shown. Please visit franklintempleton.com or call (800) 342-5236 for most recent month-end performance.
| | |
| Credit Quality Breakdown* | | |
| Franklin Insured Tax-Free Income Fund | | |
| 2/28/14 | | |
| | % of Total | |
| Ratings | Long-Term Investments** | |
| AAA | 0.5 | % |
| AA | 74.9 | % |
| A | 19.5 | % |
| BBB | 2.4 | % |
| Below Investment Grade | 0.4 | % |
| Not Rated | 2.3 | % |
| |
| *Standard & Poor’s (S&P) is used as the primary independent rating agency source. Moody’s is secondary, and Fitch, | |
| if available, is used for securities not rated by Moody’s or S&P. The ratings are an indication of an issuer’s credit- | |
| worthiness, with long-term ratings typically ranging from AAA (highest) to Below Investment Grade (lowest; includes | |
| ratings BB to D). This methodology differs from that used in Fund marketing materials. | |
| **Does not include short-term investments and other net assets. | | |
This annual report for Franklin Insured Tax-Free Income Fund covers the fiscal year ended February 28, 2014. The Fund closed to all new investments (other than reinvestment of dividends or capital gains distributions) at the close of the market on March 1, 2013.
Performance Overview
The Fund’s Class A share price, as measured by net asset value, decreased from $12.63 on February 28, 2013, to $12.02 on February 28, 2014. The Fund’s Class A shares paid dividends totaling 46.10 cents per share for the same period.3 The Performance Summary beginning on page 46 shows that
The dollar value, number of shares or principal amount, and names of all portfolio holdings are listed in the Fund’s Statement of Investments (SOI). The SOI begins on page 145.
Annual Report | 43
| | | |
| Dividend Distributions* | | | |
| Franklin Insured Tax-Free Income Fund | | | |
| 3/1/13–2/28/14 | | | |
| | Dividend per Share (cents) |
| Month | Class A | Class C | Advisor Class |
| March | 3.38 | 2.79 | 3.49 |
| April | 3.48 | 2.89 | 3.59 |
| May | 3.58 | 2.99 | 3.69 |
| June | 3.68 | 3.11 | 3.78 |
| July | 3.68 | 3.11 | 3.78 |
| August | 3.86 | 3.29 | 3.96 |
| September | 3.96 | 3.42 | 4.05 |
| October | 4.08 | 3.54 | 4.17 |
| November | 4.08 | 3.54 | 4.17 |
| December | 4.08 | 3.53 | 4.14 |
| January | 4.12 | 3.57 | 4.18 |
| February | 4.12 | 3.57 | 4.18 |
| Total | 46.10 | 39.35 | 47.18 |
*Assumes shares were purchased and held for the entire accrual period. Since dividends accrue daily, your actual distributions will vary depending on the date you purchased your shares and any account activity. All Fund distributions will vary depending upon current market conditions, and past distributions are not indicative of future trends.
at the end of this reporting period the Fund’s Class A shares’ distribution rate was 3.94%, based on an annualization of the 4.12 cent per share February dividend and the maximum offering price of $12.55 on February 28, 2014. An investor in the 2014 maximum federal income tax bracket of 39.60% (plus 3.8% Medicare tax) would need to earn a distribution rate of 6.96% from a taxable investment to match the Fund’s Class A tax-free distribution rate. For the Fund’s Class C and Advisor shares’ performance, please see the Performance Summary.
Manager’s Discussion
We used various investment strategies during the 12 months under review as we sought to maximize tax-free income for shareholders. Puerto Rico’s municipal bond market is widely traded because of its federal and state tax-exemption advantages. During the reporting period, some Puerto Rico issuers experienced a series of downgrades from Standard & Poor’s, Moody’s Investors Service and Fitch Ratings. In February 2014, these credit rating firms downgraded their respective ratings of Puerto Rico’s general obligation debt to below investment grade, along with the ratings of certain related Puerto Rico issuers. Additionally, each rating agency maintained a negative outlook on
44 | Annual Report
certain Puerto Rico issuers, and further downgrades are possible. The Fund is not required to sell securities that have been downgraded to below investment grade, but it is prohibited from making further purchases of such securities as long as the securities are not rated investment grade by at least one U.S. nationally recognized rating service. Rating actions combined with news related to the commonwealth’s financial position and future financing endeavors caused the Puerto Rico bond market to experience sharp declines in the latter half of 2013 and contrasting positive performance year-to-date in 2014.
During the reporting period, we limited Fund purchases to bonds insured by Assured Guaranty and Build America Mutual and non-insured bonds rated AA or higher by independent credit rating agencies. Since the 2008 financial crisis, rating agencies have lowered or withdrawn their ratings on most municipal bond insurers, and certain municipal bond insurers have withdrawn from the market or ceased writing new policies. Insurance penetration in the municipal bond market has greatly decreased, with fewer qualified bond insurers (rated BBB or better) offering insurance on new issues of municipal securities. These circumstances have led to a decrease in the supply of insured municipal securities and a consolidation among municipal bond insurers, thereby concentrating the insurance company credit risk with respect to securities in the Fund’s portfolio among fewer municipal bond insurers. Accordingly, effective at the close of the market on March 1, 2013, the Fund was closed to all new investments (other than reinvestment of dividends or capital gain distributions).
Thank you for your continued participation in Franklin Insured Tax-Free Income Fund. We believe our conservative, buy-and-hold investment strategy can help us achieve high, current, tax-free income for shareholders.
The foregoing information reflects our analysis, opinions and portfolio holdings as of February 28, 2014, the end of the reporting period. The way we implement our main investment strategies and the resulting portfolio holdings may change depending on factors such as market and economic conditions. These opinions may not be relied upon as investment advice or an offer for a particular security. The information is not a complete analysis of every aspect of any market, state, industry, security or the Fund. Statements of fact are from sources considered reliable, but the investment manager makes no representation or warranty as to their completeness or accuracy. Although historical performance is no guarantee of future results, these insights may help you understand our investment management philosophy.
1. Dividends are generally subject to state and local taxes, if any. For investors subject to alternative minimum tax, a small portion of Fund dividends may be taxable. Distributions of capital gains are generally taxable. To avoid imposition of 28% backup withholding on all Fund distributions and redemption proceeds, U.S. investors must be properly certified on Form W-9 and non-U.S. investors on Form W-8BEN.
2. Fund shares are not insured by any U.S. or other government agency. They are subject to market risks and will fluctuate in value.
3. All Fund distributions will vary depending upon current market conditions, and past distributions are not indicative of future trends.
| | |
| Portfolio Breakdown | | |
| Franklin Insured Tax-Free Income Fund | |
| 2/28/14 | | |
| % of Total | |
| Long-Term Investments* | |
| Utilities | 17.8 | % |
| Hospital & Health Care | 16.8 | % |
| Subject to Government Appropriations | 15.1 | % |
| Transportation | 14.7 | % |
| General Obligation | 14.6 | % |
| Higher Education | 6.4 | % |
| Tax-Supported | 6.0 | % |
| Other Revenue | 4.7 | % |
| Refunded | 3.5 | % |
| Housing | 0.4 | % |
| |
| *Does not include short-term investments and other | |
| net assets. | | |
Annual Report | 45
Performance Summary as of 2/28/14
Franklin Insured Tax-Free Income Fund
Your dividend income will vary depending on dividends or interest paid by securities in the Fund’s portfolio, adjusted for operating expenses of each class. Capital gain distributions are net profits realized from the sale of portfolio securities. The performance table and graphs do not reflect any taxes that a shareholder would pay on Fund dividends, capital gain distributions, if any, or any realized gains on the sale of Fund shares. Total return reflects reinvestment of the Fund’s dividends and capital gain distributions, if any, and any unrealized gains or losses.
| | | | | | | | |
| Price and Distribution Information | | | | | | |
| Class A (Symbol: FTFIX) | | | | Change | | 2/28/14 | | 2/28/13 |
| Net Asset Value (NAV) | | | -$ | 0.61 | $ | 12.02 | $ | 12.63 |
| Distributions (3/1/13–2/28/14) | | | | | | | | |
| Dividend Income | $ | 0.4610 | | | | | | |
| Class C (Symbol: FRITX) | | | | Change | | 2/28/14 | | 2/28/13 |
| Net Asset Value (NAV) | | | -$ | 0.61 | $ | 12.18 | $ | 12.79 |
| Distributions (3/1/13–2/28/14) | | | | | | | | |
| Dividend Income | $ | 0.3935 | | | | | | |
| Advisor Class (Symbol: FINZX) | | | | Change | | 2/28/14 | | 2/28/13 |
| Net Asset Value (NAV) | | | -$ | 0.61 | $ | 12.01 | $ | 12.62 |
| Distributions (3/1/13–2/28/14) | | | | | | | | |
| Dividend Income | $ | 0.4718 | | | | | | |
46 | Annual Report
Performance Summary (continued)
Performance
Cumulative total return excludes sales charges. Average annual total returns include maximum sales charges. Class A: 4.25% maximum initial sales charge; Class C: 1% contingent deferred sales charge in first year only; Advisor Class: no sales charges.
| | | | | | | | | | | |
| Class A | | | | 1-Year | | | 5-Year | | | 10-Year | |
| Cumulative Total Return1 | | | | -1.10 | % | + | 31.66 | % | + | 45.76 | % |
| Average Annual Total Return2 | | | | -5.30 | % | + | 4.74 | % | + | 3.39 | % |
| Avg. Ann. Total Return (3/31/14)3 | | | | -4.12 | % | + | 4.77 | % | + | 3.48 | % |
| Distribution Rate4 | 3.94 | % | | | | | | | | | |
| Taxable Equivalent Distribution Rate5 | 6.96 | % | | | | | | | | | |
| 30-Day Standardized Yield6 | 3.34 | % | | | | | | | | | |
| Taxable Equivalent Yield5 | 5.90 | % | | | | | | | | | |
| Total Annual Operating Expenses7 | 0.62 | % | | | | | | | | | |
| Class C | | | | 1-Year | | | 5-Year | | | 10-Year | |
| Cumulative Total Return1 | | | | -1.63 | % | + | 28.23 | % | + | 38.10 | % |
| Average Annual Total Return2 | | | | -2.58 | % | + | 5.10 | % | + | 3.28 | % |
| Avg. Ann. Total Return (3/31/14)3 | | | | -1.35 | % | + | 5.13 | % | + | 3.37 | % |
| Distribution Rate4 | 3.52 | % | | | | | | | | | |
| Taxable Equivalent Distribution Rate5 | 6.22 | % | | | | | | | | | |
| 30-Day Standardized Yield6 | 2.94 | % | | | | | | | | | |
| Taxable Equivalent Yield5 | 5.19 | % | | | | | | | | | |
| Total Annual Operating Expenses7 | 1.17 | % | | | | | | | | | |
| Advisor Class8 | | | | 1-Year | | | 5-Year | | | 10-Year | |
| Cumulative Total Return1 | | | | -1.01 | % | + | 32.21 | % | + | 46.46 | % |
| Average Annual Total Return2 | | | | -1.01 | % | + | 5.74 | % | + | 3.89 | % |
| Avg. Ann. Total Return (3/31/14)3 | | | + | 0.18 | % | + | 5.79 | % | + | 3.98 | % |
| Distribution Rate4 | 4.18 | % | | | | | | | | | |
| Taxable Equivalent Distribution Rate5 | 7.39 | % | | | | | | | | | |
| 30-Day Standardized Yield6 | 3.59 | % | | | | | | | | | |
| Taxable Equivalent Yield5 | 6.34 | % | | | | | | | | | |
| Total Annual Operating Expenses7 | 0.52 | % | | | | | | | | | |
Performance data represent past performance, which does not guarantee future results. Investment return and principal value will fluctuate, and you may have a gain or loss when you sell your shares. Current performance may differ from figures shown. For most recent month-end performance, go to franklintempleton.com or call (800) 342-5236.
Annual Report | 47
Performance Summary (continued)
Total Return Index Comparison for a Hypothetical $10,000 Investment
Total return represents the change in value of an investment over the periods shown. It includes any applicable maximum sales charge, Fund expenses, account fees and reinvested distributions. The unmanaged index includes reinvestment of any income or distributions. It differs from the Fund in composition and does not pay management fees or expenses. One cannot invest directly in an index.
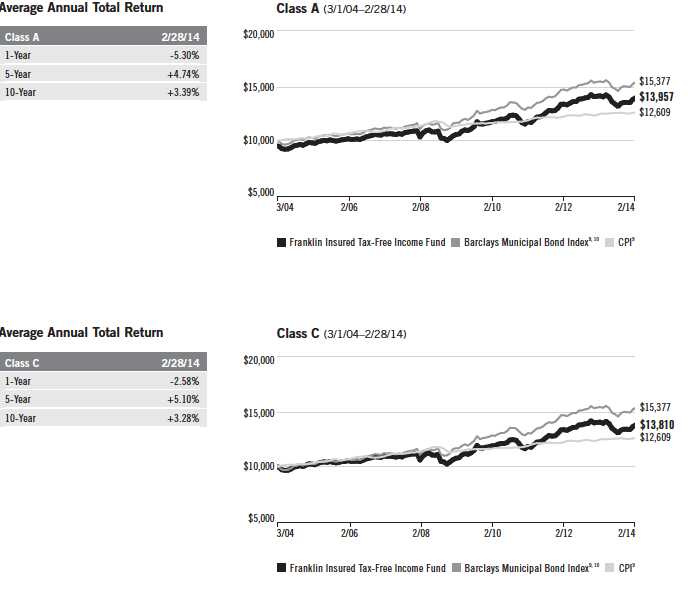
48 | Annual Report
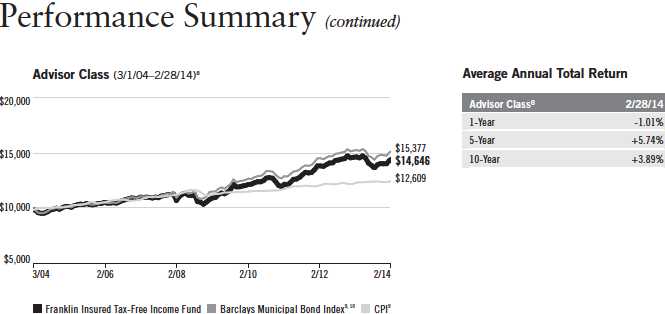
All investments involve risks, including possible loss of principal. Because municipal bonds are sensitive to interest rate movements, the Fund’s yield and share price will fluctuate with market conditions. Bond prices generally move in the opposite direction of interest rates. Thus, as prices of bonds in the Fund adjust to a rise in interest rates, the Fund’s share price may decline. The Fund holds a small portion of its assets in Puerto Rico municipal bonds that have been impacted by recent adverse economic and market changes, which may cause the Fund’s share price to decline. Changes in the credit rating of a bond, or in the credit rating or financial strength of a bond’s issuer, insurer or guarantor, may affect the bond’s value. The Fund may invest a significant part of its assets in municipal securities that finance similar types of projects, such as utilities, hospitals, higher education and transportation. A change that affects one project would likely affect all similar projects, thereby increasing market risk. The Fund is actively managed but there is no guarantee that the manager’s investment decisions will produce the desired results. The Fund’s prospectus also includes a description of the main investment risks.
Class C: These shares have higher annual fees and expenses than Class A shares.
Advisor Class: Shares are available to certain eligible investors as described in the prospectus.
1. Cumulative total return represents the change in value of an investment over the periods indicated.
2. Average annual total return represents the average annual change in value of an investment over the periods indicated.
3. In accordance with SEC rules, we provide standardized average annual total return information through the latest calendar quarter.
4. Distribution rate is based on an annualization of the respective class’s February dividend and the maximum offering price (NAV for Classes C and
Advisor) per share on 2/28/14.
5. Taxable equivalent distribution rate and yield assume the 2014 maximum federal income tax rate of 39.60% plus 3.8% Medicare tax.
6. The 30-day standardized yield for the month ended 2/28/14 reflects an estimated yield to maturity (assuming all portfolio securities are held to
maturity). It should be regarded as an estimate of the Fund’s rate of investment income, and it may not equal the Fund’s actual income distribution
rate (which reflects the Fund’s past dividends paid to shareholders) or the income reported in the Fund’s financial statements.
7. Figures are as stated in the Fund’s current prospectus. In periods of market volatility, assets may decline significantly, causing total annual Fund
operating expenses to become higher than the figures shown.
8. Effective 7/1/08, the Fund began offering Advisor Class shares, which do not have sales charges or a Rule 12b-1 plan. Performance quotations for
this class reflect the following methods of calculation: (a) For periods prior to 7/1/08, a restated figure is used based upon the Fund’s Class A per-
formance, excluding the effect of Class A’s maximum initial sales charge, but reflecting the effect of the Class A Rule 12b-1 fees; and (b) for periods
after 7/1/08, actual Advisor Class performance is used reflecting all charges and fees applicable to that class. Since 7/1/08 (commencement of
sales), the cumulative and average annual total returns of Advisor Class shares were +28.79% and +4.57%.
9. Source: © 2014 Morningstar. The Barclays Municipal Bond Index is a market value-weighted index engineered for the long-term tax-exempt bond
market. To be included in the index, bonds must be fixed rate, have at least one year to final maturity and be rated investment grade (Baa3/BBB- or
higher) by at least two of the following agencies: Moody’s, Standard & Poor’s and Fitch. The Consumer Price Index (CPI), calculated by the Bureau of
Labor Statistics, is a commonly used measure of the inflation rate.
10. Source: Barclays Global Family of Indices. © 2014 Barclays Capital Inc. Used with permission.
Annual Report | 49
Your Fund’s Expenses
Franklin Insured Tax-Free Income Fund
As a Fund shareholder, you can incur two types of costs:
- Transaction costs, including sales charges (loads) on Fund purchases; and
- Ongoing Fund costs, including management fees, distribution and service (12b-1) fees, and other Fund expenses. All mutual funds have ongoing costs, sometimes referred to as operating expenses.
The following table shows ongoing costs of investing in the Fund and can help you understand these costs and compare them with those of other mutual funds. The table assumes a $1,000 investment held for the six months indicated.
Actual Fund Expenses
The first line (Actual) for each share class listed in the table provides actual account values and expenses. The “Ending Account Value” is derived from the Fund’s actual return, which includes the effect of Fund expenses.
You can estimate the expenses you paid during the period by following these steps. Of course, your account value and expenses will differ from those in this illustration:
| 1. | Divide your account value by $1,000. |
| | If an account had an $8,600 value, then $8,600 ÷ $1,000 = 8.6. |
| 2. | Multiply the result by the number under the heading “Expenses Paid During Period.” |
| | If Expenses Paid During Period were $7.50, then 8.6 x $7.50 = $64.50. |
In this illustration, the estimated expenses paid this period are $64.50.
Hypothetical Example for Comparison with Other Funds
Information in the second line (Hypothetical) for each class in the table can help you compare ongoing costs of investing in the Fund with those of other mutual funds. This information may not be used to estimate the actual ending account balance or expenses you paid during the period. The hypothetical “Ending Account Value” is based on the actual expense ratio for each class and an assumed 5% annual rate of return before expenses, which does not represent the Fund’s actual return. The figure under the heading “Expenses Paid During Period” shows the hypothetical expenses your account would have incurred under this scenario. You can compare this figure with the 5% hypothetical examples that appear in shareholder reports of other funds.
50 | Annual Report
Your Fund’s Expenses (continued)
Please note that expenses shown in the table are meant to highlight ongoing costs and do not reflect any transaction costs, such as sales charges. Therefore, the second line for each class is useful in comparing ongoing costs only, and will not help you compare total costs of owning different funds. In addition, if transaction costs were included, your total costs would have been higher. Please refer to the Fund prospectus for additional information on operating expenses.
| | | | | | |
| | | Beginning Account | | Ending Account | | Expenses Paid During |
| Class A | | Value 9/1/13 | | Value 2/28/14 | | Period* 9/1/13–2/28/14 |
| Actual | $ | 1,000 | $ | 1,062.40 | $ | 3.12 |
| Hypothetical (5% return before expenses) | $ | 1,000 | $ | 1,021.77 | $ | 3.06 |
| Class C | | | | | | |
| Actual | $ | 1,000 | $ | 1,059.50 | $ | 6.03 |
| Hypothetical (5% return before expenses) | $ | 1,000 | $ | 1,018.94 | $ | 5.91 |
| Advisor Class | | | | | | |
| Actual | $ | 1,000 | $ | 1,062.80 | $ | 2.71 |
| Hypothetical (5% return before expenses) | $ | 1,000 | $ | 1,022.17 | $ | 2.66 |
*Expenses are calculated using the most recent six-month expense ratio, annualized for each class (A: 0.61%; C: 1.18%; and Advisor: 0.53%), multiplied by the average account value over the period, multiplied by 181/365 to reflect the one-half year period.
Annual Report | 51
Franklin Massachusetts Tax-Free Income Fund
Your Fund’s Goal and Main Investments: Franklin Massachusetts Tax-Free Income Fund seeks to provide as high a level of income exempt from federal and Massachusetts personal income taxes as is consistent with prudent investment management and preservation of capital by investing at least 80% of its total assets in securities that pay interest free from such taxes.1
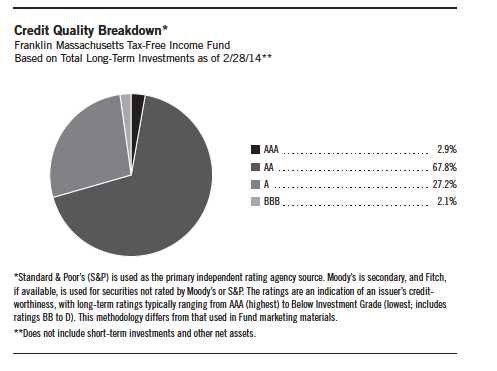
Performance data represent past performance, which does not guarantee future results. Investment return and principal value will fluctuate, and you may have a gain or loss when you sell your shares. Current performance may differ from figures shown. Please visit franklintempleton.com or call (800) 342-5236 for most recent month-end performance.
This annual report for Franklin Massachusetts Tax-Free Income Fund covers AA the fiscal year ended February 28, 2014.
Performance Overview
The Fund’s Class A share price, as measured by net asset value, decreased from $12.16 on February 28, 2013, to $11.42 on February 28, 2014. The Fund’s Class A shares paid dividends totaling 39.91 cents per share for the same period.2 The Performance Summary beginning on page 56 shows that at the end of this reporting period the Fund’s Class A shares’ distribution rate was 3.61%, based on an annualization of the 3.59 cent per share February dividend and the maximum offering price of $11.93 on February 28, 2014.
The dollar value, number of shares or principal amount, and names of all portfolio holdings are listed in the Fund’s Statement of Investments (SOI). The SOI begins on page 160.
52 | Annual Report
| | | |
| Dividend Distributions* | | | |
| Franklin Massachusetts Tax-Free Income Fund | | | |
| 3/1/13–2/28/14 | | | |
| | Dividend per Share (cents) |
| Month | Class A | Class C | Advisor Class |
| March | 3.18 | 2.61 | 3.28 |
| April | 3.18 | 2.61 | 3.28 |
| May | 3.18 | 2.61 | 3.28 |
| June | 3.18 | 2.63 | 3.28 |
| July | 3.18 | 2.63 | 3.28 |
| August | 3.18 | 2.63 | 3.28 |
| September | 3.24 | 2.76 | 3.33 |
| October | 3.44 | 2.96 | 3.53 |
| November | 3.52 | 3.04 | 3.61 |
| December | 3.52 | 3.02 | 3.61 |
| January | 3.52 | 3.02 | 3.61 |
| February | 3.59 | 3.09 | 3.68 |
| Total | 39.91 | 33.61 | 41.05 |
*Assumes shares were purchased and held for the entire accrual period. Since dividends accrue daily, your actual distributions will vary depending on the date you purchased your shares and any account activity. All Fund distributions will vary depending upon current market conditions, and past distributions are not indicative of future trends.
An investor in the 2014 maximum combined effective federal and Massachusetts personal income tax bracket of 46.57% (including 3.8% Medicare tax) would need to earn a distribution rate of 6.76% from a taxable investment to match the Fund’s Class A tax-free distribution rate. For the Fund’s Class C and Advisor shares’ performance, please see the Performance Summary.
Commonwealth Update
Massachusetts experienced modest but uneven economic growth during the year under review. The commonwealth’s employment, income and consumer spending levels improved early in the reporting period. However, the local economy faced setbacks after tax increases hampered business activity and automatic federal budget spending cuts impacted Massachusetts’s large concentration of government-funded research programs. Severe winter weather also suppressed some business activity during the period. Against this backdrop, the commonwealth’s unemployment level rose during much of the period but declined overall to 6.5% by period-end, which was below the 6.7% national rate.3 Massachusetts experienced employment gains in the information; education and health services; and trade, transportation and utilities job sectors and was the only New England state to regain its pre-recession employment level.
Annual Report | 53
| | |
| Portfolio Breakdown | | |
| Franklin Massachusetts | | |
| Tax-Free Income Fund | | |
| 2/28/14 | | |
| | % of Total | |
| Long-Term Investments* | |
| Higher Education | 26.5 | % |
| Tax-Supported | 15.6 | % |
| Transportation | 14.2 | % |
| Other Revenue | 12.9 | % |
| Housing | 9.9 | % |
| Hospital & Health Care | 9.7 | % |
| General Obligation | 6.1 | % |
| Utilities | 3.2 | % |
| Refunded | 1.9 | % |
| |
| *Does not include short-term investments and other | |
| net assets. | | |
54 | Annual Report
Home sales reached an eight-year high, largely because of higher demand, lower inventory and concerns about rising interest rates. The number of new foreclosures declined, further indicating a strengthening real estate market.
Massachusetts ended fiscal year 2013 with a surplus. Revenue collections were strong and surpassed lawmakers’ expectations and the previous year’s performance. Personal income tax collections contributed to revenue growth, supported by asset sales made in anticipation of higher tax rates in 2013. Sales tax collections underperformed the commonwealth’s forecast but increased compared to the previous fiscal year. The fiscal year 2014 budget included spending on education, health care and workforce development, balanced by a withdrawal from the budget stabilization fund (BSF). Through period-end, revenue collections, including withholding, sales and business taxes, increased during fiscal year 2014. Proposed increases for the governor’s fiscal year 2015 budget, which are expected to be covered by further recurring revenue growth, include state employee pensions, primary and higher education, transportation, and health and human services. The budget plans for ongoing Medicaid expansion under the Affordable Care Act that would utilize federal funding and cost controls.
Massachusetts’s debt levels ranked among the nation’s highest, with net tax-supported debt at 9.3% of personal income and $4,968 per capita, compared with the 2.8% and $1,074 national medians.4 In issuing a rating of AA+ and stable outlook on Massachusetts’s general obligation bonds, independent credit rating agency Standard & Poor’s (S&P) cited the commonwealth’s strong budget performance, including a focus on structural solutions to maintain budget balance; ongoing progress in improving financial, debt and budget management; and commitment to stabilize and increase the BSF.5 Furthermore, S&P cited the commonwealth’s diverse economy, high wealth and income levels, and active management of postretirement liabilities as positive factors. However, S&P viewed the commonwealth’s high debt balance and large unfunded pension and other postemployment liabilities as mitigating considerations. The stable outlook reflected S&P’s expectation that Massachusetts will continue to proactively manage its budget and improve structural budget performance.
Manager’s Discussion
We used various investment strategies during the 12 months under review as we sought to maximize tax-free income for shareholders. Puerto Rico’s municipal bond market is widely traded because of its federal and state tax-exemption advantages. During the reporting period, some Puerto Rico issuers experienced a series of downgrades from S&P, Moody’s Investors Service and Fitch Ratings. In February 2014, these credit rating firms downgraded their respective ratings of Puerto Rico’s general obligation debt to below investment grade, along with the ratings of certain related Puerto Rico issuers.
Additionally, each rating agency maintained a negative outlook on certain Puerto Rico issuers, and further downgrades are possible. The Fund is not required to sell securities that have been downgraded to below investment grade, but it is prohibited from making further purchases of such securities as long as the securities are not rated investment grade by at least one U.S. nationally recognized rating service. Rating actions combined with news related to Puerto Rico’s financial position and future financing endeavors caused its bond market to experience sharp declines in the latter half of 2013 and contrasting positive performance year-to-date in 2014.
Thank you for your continued participation in Franklin Massachusetts Tax-Free Income Fund. We believe our conservative, buy-and-hold investment strategy can help us achieve high, current, tax-free income for shareholders.
The foregoing information reflects our analysis, opinions and portfolio holdings as of February 28, 2014, the end of the reporting period. The way we implement our main investment strategies and the resulting portfolio holdings may change depending on factors such as market and economic conditions. These opinions may not be relied upon as investment advice or an offer for a particular security. The information is not a complete analysis of every aspect of any market, state, industry, security or the Fund. Statements of fact are from sources considered reliable, but the investment manager makes no representation or warranty as to their completeness or accuracy. Although historical performance is no guarantee of future results, these insights may help you understand our investment management philosophy.
1. For investors subject to alternative minimum tax, a small portion of Fund dividends may be taxable. Distributions of capital gains are generally taxable. To avoid imposition of 28% backup withholding on all Fund distributions and redemption proceeds, U.S. investors must be properly certified on Form W-9 and non-U.S. investors on Form W-8BEN.
2. All Fund distributions will vary depending upon current market conditions, and past distributions are not indicative of future trends.
3. Source: Bureau of Labor Statistics.
4. Source: Moody’s Investors Service, “2013 State Debt Medians Report,” 5/29/13.
5. This does not indicate S&P’s rating of the Fund.
Annual Report | 55
Performance Summary as of 2/28/14
Franklin Massachusetts Tax-Free Income Fund
Your dividend income will vary depending on dividends or interest paid by securities in the Fund’s portfolio, adjusted for operating expenses of each class. Capital gain distributions are net profits realized from the sale of portfolio securities. The performance table and graphs do not reflect any taxes that a shareholder would pay on Fund dividends, capital gain distributions, if any, or any realized gains on the sale of Fund shares. Total return reflects reinvestment of the Fund’s dividends and capital gain distributions, if any, and any unrealized gains or losses.
| | | | | | | | |
| Price and Distribution Information | | | | | | |
| Class A (Symbol: FMISX) | | | | Change | | 2/28/14 | | 2/28/13 |
| Net Asset Value (NAV) | | | -$ | 0.74 | $ | 11.42 | $ | 12.16 |
| Distributions (3/1/13–2/28/14) | | | | | | | | |
| Dividend Income | $ | 0.3991 | | | | | | |
| Class C (Symbol: FMAIX) | | | | Change | | 2/28/14 | | 2/28/13 |
| Net Asset Value (NAV) | | | -$ | 0.76 | $ | 11.53 | $ | 12.29 |
| Distributions (3/1/13–2/28/14) | | | | | | | | |
| Dividend Income | $ | 0.3361 | | | | | | |
| Advisor Class (Symbol: n/a) | | | | Change | | 2/28/14 | | 2/28/13 |
| Net Asset Value (NAV) | | | -$ | 0.75 | $ | 11.41 | $ | 12.16 |
| Distributions (3/1/13–2/28/14) | | | | | | | | |
| Dividend Income | $ | 0.4105 | | | | | | |
56 | Annual Report
Performance Summary (continued)
Performance
Cumulative total return excludes sales charges. Average annual total returns include maximum sales charges. Class A: 4.25% maximum initial sales charge; Class C: 1% contingent deferred sales charge in first year only; Advisor Class: no sales charges.
| | | | | | | | | | |
| Class A | | | 1-Year | | | 5-Year | | | 10-Year | |
| Cumulative Total Return1 | | | -2.75 | % | + | 27.00 | % | + | 41.81 | % |
| Average Annual Total Return2 | | | -6.88 | % | + | 3.98 | % | + | 3.10 | % |
| Avg. Ann. Total Return (3/31/14)3 | | | -5.48 | % | + | 4.09 | % | + | 3.16 | % |
| Distribution Rate4 | 3.61 | % | | | | | | | | |
| Taxable Equivalent Distribution Rate5 | 6.76 | % | | | | | | | | |
| 30-Day Standardized Yield6 | 3.14 | % | | | | | | | | |
| Taxable Equivalent Yield5 | 5.88 | % | | | | | | | | |
| Total Annual Operating Expenses7 | 0.65 | % | | | | | | | | |
| Class C | | | 1-Year | | | 5-Year | | | 10-Year | |
| Cumulative Total Return1 | | | -3.41 | % | + | 23.51 | % | + | 34.18 | % |
| Average Annual Total Return2 | | | -4.35 | % | + | 4.31 | % | + | 2.98 | % |
| Avg. Ann. Total Return (3/31/14)3 | | | -2.78 | % | + | 4.42 | % | + | 3.05 | % |
| Distribution Rate4 | 3.22 | % | | | | | | | | |
| Taxable Equivalent Distribution Rate5 | 6.03 | % | | | | | | | | |
| 30-Day Standardized Yield6 | 2.73 | % | | | | | | | | |
| Taxable Equivalent Yield5 | 5.11 | % | | | | | | | | |
| Total Annual Operating Expenses7 | 1.20 | % | | | | | | | | |
| Advisor Class8 | | | 1-Year | | | 5-Year | | | 10-Year | |
| Cumulative Total Return1 | | | -2.74 | % | + | 27.47 | % | + | 42.34 | % |
| Average Annual Total Return2 | | | -2.74 | % | + | 4.97 | % | + | 3.59 | % |
| Avg. Ann. Total Return (3/31/14)3 | | | -1.21 | % | + | 5.09 | % | + | 3.67 | % |
| Distribution Rate4 | 3.87 | % | | | | | | | | |
| Taxable Equivalent Distribution Rate5 | 7.24 | % | | | | | | | | |
| 30-Day Standardized Yield6 | 3.38 | % | | | | | | | | |
| Taxable Equivalent Yield5 | 6.33 | % | | | | | | | | |
| Total Annual Operating Expenses7 | 0.55 | % | | | | | | | | |
Performance data represent past performance, which does not guarantee future results. Investment return and principal value will fluctuate, and you may have a gain or loss when you sell your shares. Current performance may differ from figures shown. For most recent month-end performance, go to franklintempleton.com or call (800) 342-5236.
Annual Report | 57
Performance Summary (continued)
Total Return Index Comparison for a Hypothetical $10,000 Investment
Total return represents the change in value of an investment over the periods shown. It includes any applicable maximum sales charge, Fund expenses, account fees and reinvested distributions. The unmanaged index includes reinvestment of any income or distributions. It differs from the Fund in composition and does not pay management fees or expenses. One cannot invest directly in an index.
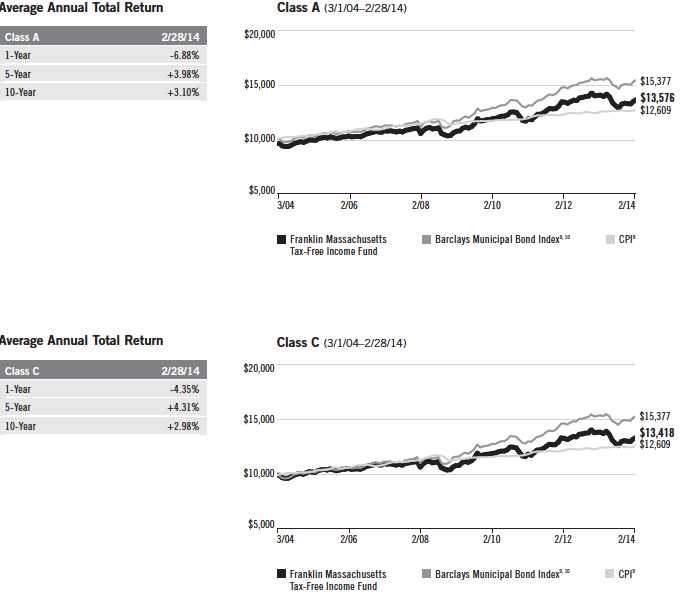
58 | Annual Report
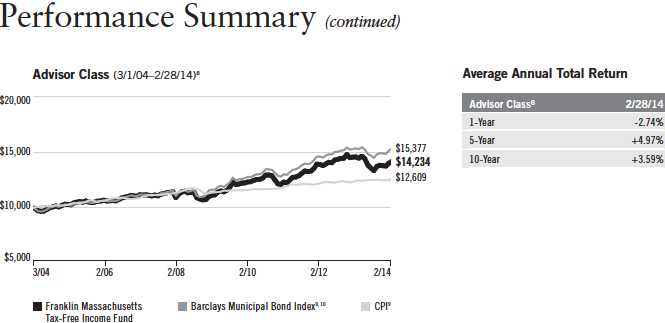
All investments involve risks, including possible loss of principal. Because municipal bonds are sensitive to interest rate movements, the Fund’s yield and share price will fluctuate with market conditions. Bond prices generally move in the opposite direction of interest rates. Thus, as prices of bonds in the Fund adjust to a rise in interest rates, the Fund’s share price may decline. Because the Fund invests principally in a single state, it is subject to greater risk of adverse economic and regulatory changes in that state than a geographically diversified fund. The Fund holds a small portion of its assets in Puerto Rico municipal bonds that have been impacted by recent adverse economic and market changes, which may cause the Fund’s share price to decline. Changes in the credit rating of a bond, or in the credit rating or financial strength of a bond’s issuer, insurer or guarantor, may affect the bond’s value. The Fund may invest a significant part of its assets in municipal securities that finance similar types of projects, such as utilities, hospitals, higher education and transportation. A change that affects one project would likely affect all similar projects, thereby increasing market risk. The Fund is actively managed but there is no guarantee that the manager’s investment decisions will produce the desired results. The Fund’s prospectus also includes a description of the main investment risks.
Class C: These shares have higher annual fees and expenses than Class A shares.
Advisor Class: Shares are available to certain eligible investors as described in the prospectus.
1. Cumulative total return represents the change in value of an investment over the periods indicated.
2. Average annual total return represents the average annual change in value of an investment over the periods indicated.
3. In accordance with SEC rules, we provide standardized average annual total return information through the latest calendar quarter.
4. Distribution rate is based on an annualization of the respective class’s February dividend and the maximum offering price (NAV for Classes C and
Advisor) per share on 2/28/14.
5. Taxable equivalent distribution rate and yield assume the published rates as of 12/18/13 for the maximum combined effective federal and
Massachusetts personal income tax rate of 46.57%, based on the federal income tax rate of 39.60% plus 3.8% Medicare tax.
6. The 30-day standardized yield for the month ended 2/28/14 reflects an estimated yield to maturity (assuming all portfolio securities are held to
maturity). It should be regarded as an estimate of the Fund’s rate of investment income, and it may not equal the Fund’s actual income distribution
rate (which reflects the Fund’s past dividends paid to shareholders) or the income reported in the Fund’s financial statements.
7. Figures are as stated in the Fund’s current prospectus. In periods of market volatility, assets may decline significantly, causing total annual Fund
operating expenses to become higher than the figures shown.
8. Effective 7/1/09, the Fund began offering Advisor Class shares, which do not have sales charges or a Rule 12b-1 plan. Performance quotations for
this class reflect the following methods of calculation: (a) For periods prior to 7/1/09, a restated figure is used based upon the Fund’s Class A per-
formance, excluding the effect of Class A’s maximum initial sales charge, but reflecting the effect of the Class A Rule 12b-1 fees; and (b) for periods
after 7/1/09, actual Advisor Class performance is used reflecting all charges and fees applicable to that class. Since 7/1/09 (commencement of
sales), the cumulative and average annual total returns of Advisor Class shares were +23.98% and +4.72%.
9. Source: © 2014 Morningstar. The Barclays Municipal Bond Index is a market value-weighted index engineered for the long-term tax-exempt bond
market. To be included in the index, bonds must be fixed rate, have at least one year to final maturity and be rated investment grade (Baa3/BBB- or
higher) by at least two of the following agencies: Moody’s, S&P and Fitch. The Consumer Price Index (CPI), calculated by the Bureau of Labor
Statistics, is a commonly used measure of the inflation rate.
10. Source: Barclays Global Family of Indices. © 2014 Barclays Capital Inc. Used with permission.
Annual Report | 59
Your Fund’s Expenses
Franklin Massachusetts Tax-Free Income Fund
As a Fund shareholder, you can incur two types of costs:
- Transaction costs, including sales charges (loads) on Fund purchases; and
- Ongoing Fund costs, including management fees, distribution and service (12b-1) fees, and other Fund expenses. All mutual funds have ongoing costs, sometimes referred to as operating expenses.
The following table shows ongoing costs of investing in the Fund and can help you understand these costs and compare them with those of other mutual funds. The table assumes a $1,000 investment held for the six months indicated.
Actual Fund Expenses
The first line (Actual) for each share class listed in the table provides actual account values and expenses. The “Ending Account Value” is derived from the Fund’s actual return, which includes the effect of Fund expenses.
You can estimate the expenses you paid during the period by following these steps. Of course, your account value and expenses will differ from those in this illustration:
| 1. | Divide your account value by $1,000. |
| | If an account had an $8,600 value, then $8,600 ÷ $1,000 = 8.6. |
| 2. | Multiply the result by the number under the heading “Expenses Paid During Period.” |
| | If Expenses Paid During Period were $7.50, then 8.6 x $7.50 = $64.50. |
In this illustration, the estimated expenses paid this period are $64.50.
Hypothetical Example for Comparison with Other Funds
Information in the second line (Hypothetical) for each class in the table can help you compare ongoing costs of investing in the Fund with those of other mutual funds. This information may not be used to estimate the actual ending account balance or expenses you paid during the period. The hypothetical “Ending Account Value” is based on the actual expense ratio for each class and an assumed 5% annual rate of return before expenses, which does not represent the Fund’s actual return. The figure under the heading “Expenses Paid During Period” shows the hypothetical expenses your account would have incurred under this scenario. You can compare this figure with the 5% hypothetical examples that appear in shareholder reports of other funds.
60 | Annual Report
Your Fund’s Expenses (continued)
Please note that expenses shown in the table are meant to highlight ongoing costs and do not reflect any transaction costs, such as sales charges. Therefore, the second line for each class is useful in comparing ongoing costs only, and will not help you compare total costs of owning different funds. In addition, if transaction costs were included, your total costs would have been higher. Please refer to the Fund prospectus for additional information on operating expenses.
| | | | | | |
| | | Beginning Account | | Ending Account | | Expenses Paid During |
| Class A | | Value 9/1/13 | | Value 2/28/14 | | Period* 9/1/13–2/28/14 |
| Actual | $ | 1,000 | $ | 1,063.30 | $ | 3.43 |
| Hypothetical (5% return before expenses) | $ | 1,000 | $ | 1,021.47 | $ | 3.36 |
| Class C | | | | | | |
| Actual | $ | 1,000 | $ | 1,060.00 | $ | 6.23 |
| Hypothetical (5% return before expenses) | $ | 1,000 | $ | 1,018.74 | $ | 6.11 |
| Advisor Class | | | | | | |
| Actual | $ | 1,000 | $ | 1,062.90 | $ | 2.92 |
| Hypothetical (5% return before expenses) | $ | 1,000 | $ | 1,021.97 | $ | 2.86 |
*Expenses are calculated using the most recent six-month expense ratio, annualized for each class (A: 0.67%; C: 1.22% and Advisor: 0.57%), multiplied by the average account value over the period, multiplied by 181/365 to reflect the one-half year period.
Annual Report | 61
Franklin New Jersey Tax-Free Income Fund
Your Fund’s Goal and Main Investments: Franklin New Jersey Tax-Free Income Fund seeks to provide as high a level of income exempt from federal and New Jersey personal income taxes as is consistent with prudent investment management and preservation of capital by investing at least 80% of its net assets in securities that pay interest free from such taxes.1
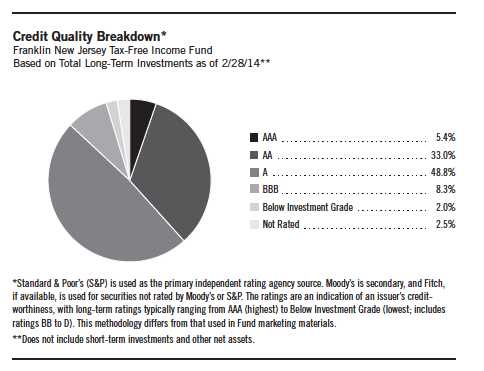
Performance data represent past performance, which does not guarantee future results. Investment return and principal value will fluctuate, and you may have a gain or loss when you sell your shares. Current performance may differ from figures shown. Please visit franklintempleton.com or call (800) 342-5236 for most recent month-end performance.
This annual report for Franklin New Jersey Tax-Free Income Fund coversBBB the fiscal year ended February 28, 2014.
Performance Overview
The Fund’s Class A share price, as measured by net asset value, decreased from $12.62 on February 28, 2013, to $11.76 on February 28, 2014. The Fund’s Class A shares paid dividends totaling 44.94 cents per share for the same period.2 The Performance Summary beginning on page 66 shows that at the end of this reporting period the Fund’s Class A shares’ distribution rate
The dollar value, number of shares or principal amount, and names of all portfolio holdings are listed in the Fund’s Statement of Investments (SOI). The SOI begins on page 166.
62 | Annual Report
| | | |
| Dividend Distributions* | | | |
| Franklin New Jersey Tax-Free Income Fund | | | |
| 3/1/13–2/28/14 | | | |
| | Dividend per Share (cents) |
| Month | Class A | Class C | Advisor Class |
| March | 3.59 | 3.00 | 3.70 |
| April | 3.59 | 3.00 | 3.70 |
| May | 3.59 | 3.00 | 3.70 |
| June | 3.59 | 3.02 | 3.69 |
| July | 3.59 | 3.02 | 3.69 |
| August | 3.66 | 3.09 | 3.76 |
| September | 3.73 | 3.20 | 3.82 |
| October | 3.84 | 3.31 | 3.93 |
| November | 3.89 | 3.36 | 3.98 |
| December | 3.89 | 3.37 | 3.98 |
| January | 3.94 | 3.42 | 4.03 |
| February | 4.04 | 3.52 | 4.13 |
| Total | 44.94 | 38.31 | 46.11 |
*Assumes shares were purchased and held for the entire accrual period. Since dividends accrue daily, your actual distributions will vary depending on the date you purchased your shares and any account activity. All Fund distributions will vary depending upon current market conditions, and past distributions are not indicative of future trends.
was 3.95%, based on an annualization of the 4.04 cent per share February dividend and the maximum offering price of $12.28 on February 28, 2014. An investor in the 2014 maximum combined effective federal and New Jersey personal income tax bracket of 48.82% (including 3.8% Medicare tax) would need to earn a distribution rate of 7.72% from a taxable investment to match the Fund’s Class A tax-free distribution rate. For the Fund’s Class C and Advisor shares’ performance, please see the Performance Summary.
State Update
New Jersey’s broad and mature economy made uneven progress during the 12-month reporting period. The housing sector was affected by rising new foreclosures and declining construction jobs, but the sector was aided by post-Superstorm Sandy recovery efforts after insurers and federal relief agencies dispensed funds used to repair and rebuild homes and businesses. The expenditures bolstered home sales and prices, and housing permits increased statewide. This, as well as seasonal hiring at the start of the summer tourism season and rising personal income, stimulated economic activity that together with growth in education and health services employment helped New Jersey’s unemployment rate reach a five-year low of 7.1% at period-end, which was
Annual Report | 63
| | |
| Portfolio Breakdown | | |
| Franklin New Jersey Tax-Free Income Fund | |
| 2/28/14 | | |
| % of Total | |
| Long-Term Investments* | |
| Transportation | 18.6 | % |
| Higher Education | 16.0 | % |
| Subject to Government Appropriations | 15.4 | % |
| Hospital & Health Care | 14.1 | % |
| Refunded | 10.5 | % |
| Utilities | 9.0 | % |
| Tax-Supported | 7.1 | % |
| Other Revenue | 6.5 | % |
| Housing | 2.1 | % |
| General Obligation | 0.7 | % |
| |
| *Does not include short-term investments and other | |
| net assets. | | |
higher than the 6.7% national average.3 Challenges for New Jersey’s ongoing recovery include high business and living costs and slow population growth.
The state’s Sandy recovery effort boosted revenue growth. Sales tax collections increased as home and business owners replaced damaged vehicles and purchased tools and materials to rebuild. However, by fiscal 2013’s year-end, New Jersey’s revenue missed expectations resulting in reduced liquidity. The fiscal year 2014 budget exceeded the prior year’s plan, mostly because of higher pension, health insurance and other benefit costs. State pension funding increased substantially per 2010 legislation designed, in response to years of missed payments, to attain required annual contributions within seven years. This mandate was expected to offset future revenue growth, liquidity and fund balances. Increased benefit costs were mitigated by new revenue from online gambling and sales tax collections. The budget was balanced based on revenue growth, nonrecurring resources, savings from participation in the federal Affordable Care Act and larger participant contributions for health insurance.
New Jersey’s debt levels remained among the nation’s highest, with net tax-supported debt at 7.6% of personal income and $4,023 per capita, compared with the 2.8% and $1,074 national medians.4 Independent credit rating agency Moody’s Investors Services affirmed its Aa3 rating for the state’s general obligations bonds, but revised its outlook from stable to negative based on anticipated challenges in improving the state’s weak liquidity position because of its slowly recovering economy and required pension funding increases.5 The rating reflected Moody’s positive view of the state’s high wealth levels, diverse economy and job growth, proactive liability and cost management, and the governor’s broad powers to trim spending. Moody’s believed these strengths were offset by structurally unbalanced budgets beset by rapidly growing pension and postemployment obligations, high debt, the absence of some best governance practices, no specific plan to improve depleted fund balances and liquidity, and lower-than-expected fiscal year 2014 revenue collections.
Manager’s Discussion
We used various investment strategies during the 12 months under review as we sought to maximize tax-free income for shareholders. Puerto Rico’s municipal bond market is widely traded because of its federal and state tax-exemption advantages. During the reporting period, some Puerto Rico issuers experienced a series of downgrades from Standard & Poor’s, Moody’s and Fitch Ratings. In February 2014, these credit rating firms downgraded their respective ratings of Puerto Rico’s general obligation debt to below investment grade, along with the ratings of certain related Puerto Rico issuers. Additionally,
64 | Annual Report
each rating agency maintained a negative outlook on certain Puerto Rico issuers, and further downgrades are possible. The Fund is not required to sell securities that have been downgraded to below investment grade, but it is prohibited from making further purchases of such securities as long as the securities are not rated investment grade by at least one U.S. nationally recognized rating service. Rating actions combined with news related to the commonwealth’s financial position and future financing endeavors caused the Puerto Rico bond market to experience sharp declines in the latter half of 2013 and contrasting positive performance year-to-date in 2014.
Thank you for your continued participation in Franklin New Jersey Tax-Free Income Fund. We believe our conservative, buy-and-hold investment strategy can help us achieve high, current, tax-free income for shareholders.
The foregoing information reflects our analysis, opinions and portfolio holdings as of February 28, 2014, the end of the reporting period. The way we implement our main investment strategies and the resulting portfolio holdings may change depending on factors such as market and economic conditions. These opinions may not be relied upon as investment advice or an offer for a particular security. The information is not a complete analysis of every aspect of any market, state, industry, security or the Fund. Statements of fact are from sources considered reliable, but the investment manager makes no representation or warranty as to their completeness or accuracy. Although historical performance is no guarantee of future results, these insights may help you understand our investment management philosophy.
1. For state personal income taxes, the 80% minimum is measured by total Fund assets. For investors subject to alternative minimum tax, a small portion of Fund dividends may be taxable. Distributions of capital gains are generally taxable. To avoid imposition of 28% backup withholding on all Fund distributions and redemption proceeds, U.S. investors must be properly certified on Form W-9 and non-U.S. investors on Form W-8BEN.
2. All Fund distributions will vary depending upon current market conditions, and past distributions are not indicative of future trends.
3. Source: Bureau of Labor Statistics.
4. Source: Moody’s Investors Service, “2013 State Debt Medians Report,” 5/29/13.
5. This does not indicate Moody’s rating of the Fund.
Annual Report | 65
Performance Summary as of 2/28/14
Franklin New Jersey Tax-Free Income Fund
Your dividend income will vary depending on dividends or interest paid by securities in the Fund’s portfolio, adjusted for operating expenses of each class. Capital gain distributions are net profits realized from the sale of portfolio securities. The performance table and graphs do not reflect any taxes that a shareholder would pay on Fund dividends, capital gain distributions, if any, or any realized gains on the sale of Fund shares. Total return reflects reinvestment of the Fund’s dividends and capital gain distributions, if any, and any unrealized gains or losses.
| | | | | | | | |
| Price and Distribution Information | | | | | | |
| Class A (Symbol: FRNJX) | | | | Change | | 2/28/14 | | 2/28/13 |
| Net Asset Value (NAV) | | | -$ | 0.86 | $ | 11.76 | $ | 12.62 |
| Distributions (3/1/13–2/28/14) | | | | | | | | |
| Dividend Income | $ | 0.4494 | | | | | | |
| Class C (Symbol: FNIIX) | | | | Change | | 2/28/14 | | 2/28/13 |
| Net Asset Value (NAV) | | | -$ | 0.87 | $ | 11.89 | $ | 12.76 |
| Distributions (3/1/13–2/28/14) | | | | | | | | |
| Dividend Income | $ | 0.3831 | | | | | | |
| Advisor Class (Symbol: FNJZX) | | | | Change | | 2/28/14 | | 2/28/13 |
| Net Asset Value (NAV) | | | -$ | 0.86 | $ | 11.77 | $ | 12.63 |
| Distributions (3/1/13–2/28/14) | | | | | | | | |
| Dividend Income | $ | 0.4611 | | | | | | |
66 | Annual Report
Performance Summary (continued)
Performance
Cumulative total return excludes sales charges. Average annual total returns include maximum sales charges. Class A: 4.25% maximum initial sales charge; Class C: 1% contingent deferred sales charge in first year only; Advisor Class: no sales charges.
| | | | | | | | | | |
| Class A | | | 1-Year | | | 5-Year | | | 10-Year | |
| Cumulative Total Return1 | | | -3.22 | % | + | 27.85 | % | + | 46.42 | % |
| Average Annual Total Return2 | | | -7.33 | % | + | 4.13 | % | + | 3.44 | % |
| Avg. Ann. Total Return (3/31/14)3 | | | -6.37 | % | + | 4.13 | % | + | 3.46 | % |
| Distribution Rate4 | 3.95 | % | | | | | | | | |
| Taxable Equivalent Distribution Rate5 | 7.72 | % | | | | | | | | |
| 30-Day Standardized Yield6 | 3.15 | % | | | | | | | | |
| Taxable Equivalent Yield5 | 6.15 | % | | | | | | | | |
| Total Annual Operating Expenses7 | 0.63 | % | | | | | | | | |
| Class C | | | 1-Year | | | 5-Year | | | 10-Year | |
| Cumulative Total Return1 | | | -3.80 | % | + | 24.39 | % | + | 38.56 | % |
| Average Annual Total Return2 | | | -4.73 | % | + | 4.46 | % | + | 3.32 | % |
| Avg. Ann. Total Return (3/31/14)3 | | | -3.77 | % | + | 4.47 | % | + | 3.34 | % |
| Distribution Rate4 | 3.55 | % | | | | | | | | |
| Taxable Equivalent Distribution Rate5 | 6.94 | % | | | | | | | | |
| 30-Day Standardized Yield6 | 2.75 | % | | | | | | | | |
| Taxable Equivalent Yield5 | 5.37 | % | | | | | | | | |
| Total Annual Operating Expenses7 | 1.18 | % | | | | | | | | |
| Advisor Class8 | | | 1-Year | | | 5-Year | | | 10-Year | |
| Cumulative Total Return1 | | | -3.12 | % | + | 28.59 | % | + | 47.35 | % |
| Average Annual Total Return2 | | | -3.12 | % | + | 5.16 | % | + | 3.95 | % |
| Avg. Ann. Total Return (3/31/14)3 | | | -2.23 | % | + | 5.14 | % | + | 3.97 | % |
| Distribution Rate4 | 4.21 | % | | | | | | | | |
| Taxable Equivalent Distribution Rate5 | 8.23 | % | | | | | | | | |
| 30-Day Standardized Yield6 | 3.40 | % | | | | | | | | |
| Taxable Equivalent Yield5 | 6.64 | % | | | | | | | | |
| Total Annual Operating Expenses7 | 0.53 | % | | | | | | | | |
Performance data represent past performance, which does not guarantee future results. Investment return and principal value will fluctuate, and you may have a gain or loss when you sell your shares. Current performance may differ from figures shown. For most recent month-end performance, go to franklintempleton.com or call (800) 342-5236.
Annual Report | 67
Performance Summary (continued)
Total Return Index Comparison for a Hypothetical $10,000 Investment
Total return represents the change in value of an investment over the periods shown. It includes any applicable maximum sales charge, Fund expenses, account fees and reinvested distributions. The unmanaged index includes reinvestment of any income or distributions. It differs from the Fund in composition and does not pay management fees or expenses. One cannot invest directly in an index.
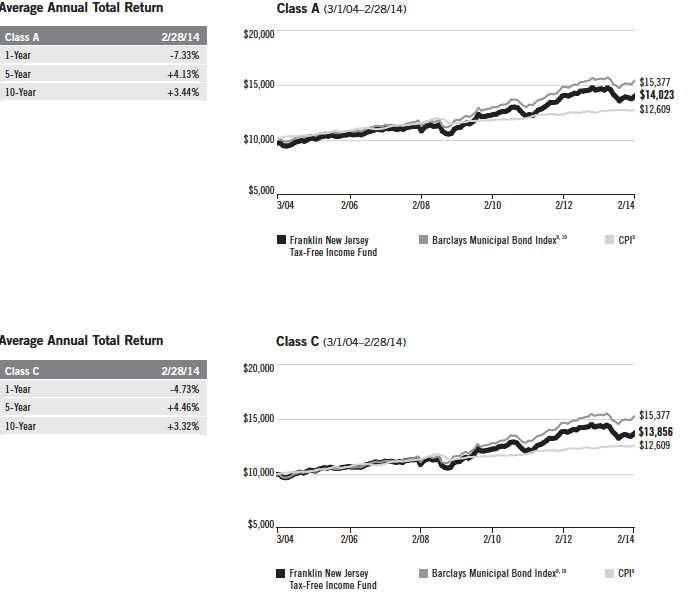
68 | Annual Report
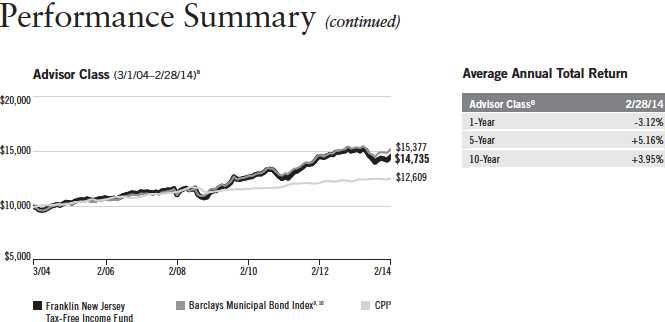
All investments involve risks, including possible loss of principal. Because municipal bonds are sensitive to interest rate movements, the Fund’s yield and share price will fluctuate with market conditions. Bond prices generally move in the opposite direction of interest rates. Thus, as prices of bonds in the Fund adjust to a rise in interest rates, the Fund’s share price may decline. Because the Fund invests principally in a single state, it is subject to greater risk of adverse economic and regulatory changes in that state than a geographically diversified fund. The Fund holds a portion of its assets in Puerto Rico municipal bonds that have been impacted by recent adverse economic and market changes, which may cause the Fund’s share price to decline. Changes in the credit rating of a bond, or in the credit rating or financial strength of a bond’s issuer, insurer or guarantor, may affect the bond’s value. The Fund may invest a significant part of its assets in municipal securities that finance similar types of projects, such as utilities, hospitals, higher education and transportation. A change that affects one project would likely affect all similar projects, thereby increasing market risk. The Fund is actively managed but there is no guarantee that the manager’s investment decisions will produce the desired results. The Fund’s prospectus also includes a description of the main investment risks.
Class C: These shares have higher annual fees and expenses than Class A shares.
Advisor Class: Shares are available to certain eligible investors as described in the prospectus.
1. Cumulative total return represents the change in value of an investment over the periods indicated.
2. Average annual total return represents the average annual change in value of an investment over the periods indicated.
3. In accordance with SEC rules, we provide standardized average annual total return information through the latest calendar quarter.
4. Distribution rate is based on an annualization of the respective class’s February dividend and the maximum offering price (NAV for Classes C and
Advisor) per share on 2/28/14.
5. Taxable equivalent distribution rate and yield assume the published rates as of 12/18/13 for the maximum combined effective federal and New
Jersey personal income tax rate of 48.82%, based on the federal income tax rate of 39.60% plus 3.8% Medicare tax.
6. The 30-day standardized yield for the month ended 2/28/14 reflects an estimated yield to maturity (assuming all portfolio securities are held to
maturity). It should be regarded as an estimate of the Fund’s rate of investment income, and it may not equal the Fund’s actual income distribution
rate (which reflects the Fund’s past dividends paid to shareholders) or the income reported in the Fund’s financial statements.
7. Figures are as stated in the Fund’s current prospectus. In periods of market volatility, assets may decline significantly, causing total annual Fund
operating expenses to become higher than the figures shown.
8. Effective 7/1/08, the Fund began offering Advisor Class shares, which do not have sales charges or a Rule 12b-1 plan. Performance quotations for
this class reflect the following methods of calculation: (a) For periods prior to 7/1/08, a restated figure is used based upon the Fund’s Class A per-
formance, excluding the effect of Class A’s maximum initial sales charge, but reflecting the effect of the Class A Rule 12b-1 fees; and (b) for periods
after 7/1/08, actual Advisor Class performance is used reflecting all charges and fees applicable to that class. Since 7/1/08 (commencement of
sales), the cumulative and average annual total returns of Advisor Class shares were +26.93% and +4.30%.
9. Source: © 2014 Morningstar. The Barclays Municipal Bond Index is a market value-weighted index engineered for the long-term tax-exempt bond
market. To be included in the index, bonds must be fixed rate, have at least one year to final maturity and be rated investment grade (Baa3/BBB- or
higher) by at least two of the following agencies: Moody’s, Standard & Poor’s and Fitch. The Consumer Price Index (CPI), calculated by the Bureau of
Labor Statistics, is a commonly used measure of the inflation rate.
10. Source: Barclays Global Family of Indices. © 2014 Barclays Capital Inc. Used with permission.
Annual Report | 69
Your Fund’s Expenses
Franklin New Jersey Tax-Free Income Fund
As a Fund shareholder, you can incur two types of costs:
- Transaction costs, including sales charges (loads) on Fund purchases; and
- Ongoing Fund costs, including management fees, distribution and service (12b-1) fees, and other Fund expenses. All mutual funds have ongoing costs, sometimes referred to as operating expenses.
The following table shows ongoing costs of investing in the Fund and can help you understand these costs and compare them with those of other mutual funds. The table assumes a $1,000 investment held for the six months indicated.
Actual Fund Expenses
The first line (Actual) for each share class listed in the table provides actual account values and expenses. The “Ending Account Value” is derived from the Fund’s actual return, which includes the effect of Fund expenses.
You can estimate the expenses you paid during the period by following these steps. Of course, your account value and expenses will differ from those in this illustration:
| 1. | Divide your account value by $1,000. |
| | If an account had an $8,600 value, then $8,600 ÷ $1,000 = 8.6. |
| 2. | Multiply the result by the number under the heading “Expenses Paid During Period.” |
| | If Expenses Paid During Period were $7.50, then 8.6 x $7.50 = $64.50. |
In this illustration, the estimated expenses paid this period are $64.50.
Hypothetical Example for Comparison with Other Funds
Information in the second line (Hypothetical) for each class in the table can help you compare ongoing costs of investing in the Fund with those of other mutual funds. This information may not be used to estimate the actual ending account balance or expenses you paid during the period. The hypothetical “Ending Account Value” is based on the actual expense ratio for each class and an assumed 5% annual rate of return before expenses, which does not represent the Fund’s actual return. The figure under the heading “Expenses Paid During Period” shows the hypothetical expenses your account would have incurred under this scenario. You can compare this figure with the 5% hypothetical examples that appear in shareholder reports of other funds.
70 | Annual Report
Your Fund’s Expenses (continued)
Please note that expenses shown in the table are meant to highlight ongoing costs and do not reflect any transaction costs, such as sales charges. Therefore, the second line for each class is useful in comparing ongoing costs only, and will not help you compare total costs of owning different funds. In addition, if transaction costs were included, your total costs would have been higher. Please refer to the Fund prospectus for additional information on operating expenses.
| | | | | | |
| | | Beginning Account | | Ending Account | | Expenses Paid During |
| Class A | | Value 9/1/13 | | Value 2/28/14 | | Period* 9/1/13–2/28/14 |
| Actual | $ | 1,000 | $ | 1,047.90 | $ | 3.25 |
| Hypothetical (5% return before expenses) | $ | 1,000 | $ | 1,021.62 | $ | 3.21 |
| Class C | | | | | | |
| Actual | $ | 1,000 | $ | 1,044.50 | $ | 6.03 |
| Hypothetical (5% return before expenses) | $ | 1,000 | $ | 1,018.89 | $ | 5.96 |
| Advisor Class | | | | | | |
| Actual | $ | 1,000 | $ | 1,048.30 | $ | 2.74 |
| Hypothetical (5% return before expenses) | $ | 1,000 | $ | 1,022.12 | $ | 2.71 |
*Expenses are calculated using the most recent six-month expense ratio, annualized for each class (A: 0.64%; C: 1.19%; and Advisor: 0.54%), multiplied by the average account value over the period, multiplied by 181/365 to reflect the one-half year period.
Annual Report | 71
| | | | | | | | | | | | | | | | |
| Franklin Tax-Free Trust | | | | | | | | | | | | | | | |
| Financial Highlights | | | | | | | | | | | | | | | | |
| |
| Franklin Double Tax-Free Income Fund | | | | | | | | | | | | | | | | |
| | | | | | | Year Ended February 28, | | | | |
| Class A | | | 2014 | | | 2013 | | | 2012 | a | | 2011 | | | 2010 | |
| Per share operating performance | | | | | | | | | | | | | | | | |
| (for a share outstanding throughout the year) | | | | | | | | | | | | | | | | |
| Net asset value, beginning of year | | $ | 12.15 | | $ | 12.31 | | $ | 11.12 | | $ | 11.56 | | $ | 10.54 | |
| Income from investment operationsb: | | | | | | | | | | | | | | | | |
| Net investment incomec | | | 0.52 | | | 0.49 | | | 0.52 | | | 0.52 | | | 0.51 | |
| Net realized and unrealized gains (losses) | | | (2.44 | ) | | (0.18 | ) | | 1.20 | | | (0.44 | ) | | 1.02 | |
| Total from investment operations | | | (1.92 | ) | | 0.31 | | | 1.72 | | | 0.08 | | | 1.53 | |
| Less distributions from net investment income | | | (0.51 | ) | | (0.47 | ) | | (0.53 | ) | | (0.52 | ) | | (0.51 | ) |
| Net asset value, end of year | | $ | 9.72 | | $ | 12.15 | | $ | 12.31 | | $ | 11.12 | | $ | 11.56 | |
| |
| Total returnd | | | (16.00 | )% | | 2.58 | % | | 15.85 | % | | 0.56 | % | | 14.78 | % |
| |
| Ratios to average net assets | | | | | | | | | | | | | | | | |
| Expenses | | | 0.67 | % | | 0.66 | % | | 0.67 | % | | 0.67 | % | | 0.69 | % |
| Net investment income | | | 4.77 | % | | 3.96 | % | | 4.49 | % | | 4.42 | % | | 4.64 | % |
| |
| Supplemental data | | | | | | | | | | | | | | | | |
| Net assets, end of year (000’s) | | $ | 282,254 | | $ | 601,374 | | $ | 643,529 | | $ | 523,391 | | $ | 507,856 | |
| Portfolio turnover rate | | | 9.95 | % | | 12.60 | % | | 6.73 | % | | 12.85 | % | | 18.53 | % |
aFor the year ended February 29.
bThe amount shown for a share outstanding throughout the period may not correlate with the Statement of Operations for the period due to the timing of sales and repurchases of
the Fund shares in relation to income earned and/or fluctuating market value of the investments of the Fund.
cBased on average daily shares outstanding.
dTotal return does not reflect sales commissions or contingent deferred sales charges, if applicable.
72 | The accompanying notes are an integral part of these financial statements. | Annual Report
| | | | | | | | | | | | | | | | |
| Franklin Tax-Free Trust | | | | | | | | | | | | | | | |
| Financial Highlights (continued) | | | | | | | | | | | | | | | | |
| |
| Franklin Double Tax-Free Income Fund | | | | | | | | | | | | | | | | |
| | | | | | | Year Ended February 28, | | | | |
| Class C | | | 2014 | | | 2013 | | | 2012 | a | | 2011 | | | 2010 | |
| Per share operating performance | | | | | | | | | | | | | | | | |
| (for a share outstanding throughout the year) | | | | | | | | | | | | | | | | |
| Net asset value, beginning of year | | $ | 12.20 | | $ | 12.37 | | $ | 11.17 | | $ | 11.61 | | $ | 10.58 | |
| Income from investment operationsb: | | | | | | | | | | | | | | | | |
| Net investment incomec | | | 0.46 | | | 0.42 | | | 0.46 | | | 0.45 | | | 0.45 | |
| Net realized and unrealized gains (losses) | | | (2.44 | ) | | (0.19 | ) | | 1.21 | | | (0.44 | ) | | 1.03 | |
| Total from investment operations | | | (1.98 | ) | | 0.23 | | | 1.67 | | | 0.01 | | | 1.48 | |
| Less distributions from net investment income | | | (0.45 | ) | | (0.40 | ) | | (0.47 | ) | | (0.45 | ) | | (0.45 | ) |
| Net asset value, end of year | | $ | 9.77 | | $ | 12.20 | | $ | 12.37 | | $ | 11.17 | | $ | 11.61 | |
| |
| Total returnd | | | (16.40 | )% | | 1.91 | % | | 15.26 | % | | (0.01 | )% | | 14.21 | % |
| |
| Ratios to average net assets | | | | | | | | | | | | | | | | |
| Expenses | | | 1.23 | % | | 1.21 | % | | 1.22 | % | | 1.22 | % | | 1.24 | % |
| Net investment income | | | 4.21 | % | | 3.41 | % | | 3.94 | % | | 3.87 | % | | 4.09 | % |
| |
| Supplemental data | | | | | | | | | | | | | | | | |
| Net assets, end of year (000’s) | | $ | 51,180 | | $ | 116,050 | | $ | 116,229 | | $ | 95,163 | | $ | 90,262 | |
| Portfolio turnover rate | | | 9.95 | % | | 12.60 | % | | 6.73 | % | | 12.85 | % | | 18.53 | % |
aFor the year ended February 29.
bThe amount shown for a share outstanding throughout the period may not correlate with the Statement of Operations for the period due to the timing of sales and repurchases of
the Fund shares in relation to income earned and/or fluctuating market value of the investments of the Fund.
cBased on average daily shares outstanding.
dTotal return does not reflect sales commissions or contingent deferred sales charges, if applicable.
Annual Report | The accompanying notes are an integral part of these financial statements. | 73
| | | | | | | | | | | | | | | |
| Franklin Tax-Free Trust | | | | | | | | | | | | | | | |
| Financial Highlights (continued) | | | | | | | | | | | | | | | |
| |
| Franklin Double Tax-Free Income Fund | | | | | | | | | | | | | | | |
| | | | | | Year Ended February 28, | | | | |
| Advisor Class | | 2014 | | | 2013 | | | 2012 | a | | 2011 | | | 2010 | b |
| Per share operating performance | | | | | | | | | | | | | | | |
| (for a share outstanding throughout the year) | | | | | | | | | | | | | | | |
| Net asset value, beginning of year | $ | 12.17 | | $ | 12.33 | | $ | 11.13 | | $ | 11.57 | | $ | 10.78 | |
| Income from investment operationsc: | | | | | | | | | | | | | | | |
| Net investment incomed | | 0.53 | | | 0.50 | | | 0.54 | | | 0.53 | | | 0.33 | |
| Net realized and unrealized gains (losses) | | (2.44 | ) | | (0.17 | ) | | 1.20 | | | (0.44 | ) | | 0.78 | |
| Total from investment operations | | (1.91 | ) | | 0.33 | | | 1.74 | | | 0.09 | | | 1.11 | |
| Less distributions from net investment income | | (0.52 | ) | | (0.49 | ) | | (0.54 | ) | | (0.53 | ) | | (0.32 | ) |
| Net asset value, end of year | $ | 9.74 | | $ | 12.17 | | $ | 12.33 | | $ | 11.13 | | $ | 11.57 | |
| |
| Total returne | | (15.90 | )% | | 2.68 | % | | 16.04 | % | | 0.67 | % | | 10.38 | % |
| |
| Ratios to average net assetsf | | | | | | | | | | | | | | | |
| Expenses | | 0.58 | % | | 0.56 | % | | 0.57 | % | | 0.57 | % | | 0.59 | % |
| Net investment income | | 4.86 | % | | 4.06 | % | | 4.59 | % | | 4.52 | % | | 4.74 | % |
| |
| Supplemental data | | | | | | | | | | | | | | | |
| Net assets, end of year (000’s) | $ | 5,355 | | $ | 14,637 | | $ | 13,766 | | $ | 4,104 | | $ | 2,538 | |
| Portfolio turnover rate | | 9.95 | % | | 12.60 | % | | 6.73 | % | | 12.85 | % | | 18.53 | % |
aFor the year ended February 29.
bFor the period July 15, 2009 (effective date) to February 28, 2010.
cThe amount shown for a share outstanding throughout the period may not correlate with the Statement of Operations for the period due to the timing of sales and repurchases of
the Fund shares in relation to income earned and/or fluctuating market value of the investments of the Fund.
dBased on average daily shares outstanding.
eTotal return is not annualized for periods less than one year.
fRatios are annualized for periods less than one year.
74 | The accompanying notes are an integral part of these financial statements. | Annual Report
| | | | | |
| | Franklin Tax-Free Trust | | | | |
| |
| | Statement of Investments, February 28, 2014 | | | | |
| |
| |
| | Franklin Double Tax-Free Income Fund | | Principal Amount | | Value |
| | Municipal Bonds 95.8% | | | | |
| | U.S. Territories 95.8% | | | | |
| | Guam 21.9% | | | | |
| | Guam Education Financing Foundation COP, 5.00%, 10/01/23 | $ | 2,500,000 | $ | 2,526,925 |
| | Guam Government Business Privilege Tax Revenue, Series A, | | | | |
| | 5.25%, 1/01/36 | | 5,000,000 | | 5,148,100 |
| | 5.125%, 1/01/42 | | 20,000,000 | | 20,262,200 |
| | Guam Government Hotel Occupancy Tax Revenue, Refunding, Series A, 6.50%, 11/01/40 | | 10,380,000 | | 11,151,234 |
| | Guam Government Limited Obligation Revenue, Section 30, Series A, | | | | |
| | 5.625%, 12/01/29 | | 3,850,000 | | 4,030,950 |
| | 5.75%, 12/01/34 | | 10,430,000 | | 10,778,466 |
| | Guam International Airport Authority Revenue, General, Refunding, Series B, AGMC Insured, | | | | |
| | 5.50%, 10/01/33 | | 2,000,000 | | 2,133,240 |
| | 5.75%, 10/01/43 | | 3,000,000 | | 3,247,680 |
| | Guam Power Authority Revenue, Refunding, Series A, 5.50%, 10/01/40 | | 14,500,000 | | 14,860,180 |
| | | | | | 74,138,975 |
| | Puerto Rico 66.3% | | | | |
| | Children’s Trust Fund Tobacco Settlement Revenue, Asset-Backed, Refunding, 5.50%, | | | | |
| | 5/15/39 | | 5,000,000 | | 4,520,900 |
| | Puerto Rico Commonwealth Aqueduct and Sewer Authority Revenue, senior lien, Series A, | | | | |
| | 6.00%, 7/01/38 | | 3,100,000 | | 2,346,421 |
| | Puerto Rico Commonwealth GO, Public Improvement, | | | | |
| | Refunding, Series A, 5.50%, 7/01/18 | | 2,300,000 | | 1,968,938 |
| | Refunding, Series A, 6.00%, 7/01/40 | | 5,000,000 | | 3,955,850 |
| | Refunding, Series C, 6.00%, 7/01/39 | | 18,950,000 | | 14,992,861 |
| | Series A, 6.00%, 7/01/38 | | 3,000,000 | | 2,381,760 |
| | Puerto Rico Commonwealth Highways and Transportation Authority Highway Revenue, Series Y, | | | | |
| Pre -Refunded, 5.50%, 7/01/36 | | 11,850,000 | | 13,289,538 |
| | Puerto Rico Commonwealth Highways and Transportation Authority Transportation Revenue, | | | | |
| | Refunding, Series H, 5.45%, 7/01/35 | | 3,980,000 | | 2,418,367 |
| | Refunding, Series N, FGIC Insured, 5.25%, 7/01/39 | | 13,000,000 | | 7,793,630 |
| | Series K, Pre-Refunded, 5.00%, 7/01/40 | | 3,000,000 | | 3,192,540 |
| | Puerto Rico Commonwealth Infrastructure Financing Authority Special Tax Revenue, | | | | |
| | Refunding, Series C, FGIC Insured, 5.50%, 7/01/22 | | 6,285,000 | | 4,446,826 |
| | Series B, 5.00%, 7/01/37 | | 20,750,000 | | 12,134,185 |
| | Puerto Rico Convention Center District Authority Hotel Occupancy Tax Revenue, Series A, | | | | |
| | AMBAC Insured, 5.00%, 7/01/31 | | 15,000,000 | | 11,598,750 |
| | Puerto Rico Electric Power Authority Power Revenue, | | | | |
| | Series WW, 5.50%, 7/01/38 | | 4,965,000 | | 3,375,306 |
| | Series XX, 5.75%, 7/01/36 | | 15,000,000 | | 10,524,900 |
| | Series XX, 5.25%, 7/01/40 | | 20,000,000 | | 13,310,200 |
| | Puerto Rico HFAR, Capital Fund Modernization Program, Puerto Rico Public Housing Projects, | | | | |
| | 5.125%, 12/01/27 | | 4,750,000 | | 4,758,550 |
| | Puerto Rico Industrial Tourist Educational Medical and Environmental Control Facilities | | | | |
| | Financing Authority Educational Facilities Revenue, University Plaza Project, Series A, | | | | |
| | NATL Insured, 5.00%, 7/01/33 | | 5,975,000 | | 4,973,231 |
Annual Report | 75
| | | | |
| Franklin Tax-Free Trust | | | | |
| |
| Statement of Investments, February 28, 2014 (continued) | | | | |
| |
| |
| Franklin Double Tax-Free Income Fund | | Principal Amount | | Value |
| Municipal Bonds (continued) | | | | |
| U.S. Territories (continued) | | | | |
| Puerto Rico (continued) | | | | |
| Puerto Rico Industrial Tourist Educational Medical and Environmental Control Facilities | | | | |
| Financing Authority Industrial Revenue, | | | | |
| Guaynabo Municipal Government Center Project, 5.625%, 7/01/15 | $ | 1,750,000 | $ | 1,656,655 |
| Guaynabo Municipal Government Center Project, 5.625%, 7/01/22 | | 3,160,000 | | 2,484,424 |
| Guaynabo Warehouse for Emergencies Project, Series A, 5.15%, 7/01/19 | | 780,000 | | 648,983 |
| Guaynabo Warehouse for Emergencies Project, Series A, 5.20%, 7/01/24 | | 4,120,000 | | 3,074,179 |
| Puerto Rico Industrial Tourist Educational Medical and Environmental Control Facilities | | | | |
| Financing Authority Revenue, | | | | |
| Ana G. Mendez University System Project, Refunding, 5.00%, 4/01/21 | | 1,225,000 | | 993,157 |
| Ana G. Mendez University System Project, Refunding, 5.375%, 12/01/21 | | 1,570,000 | | 1,320,119 |
| Ana G. Mendez University System Project, Refunding, 5.00%, 4/01/22 | | 1,345,000 | | 1,065,200 |
| Ana G. Mendez University System Project, Refunding, 5.00%, 4/01/27 | | 4,000,000 | | 2,899,880 |
| Ana G. Mendez University System Project, Refunding, 5.125%, 4/01/32 | | 2,000,000 | | 1,438,740 |
| Ana G. Mendez University System Project, Refunding, 5.375%, 4/01/42 | | 3,005,000 | | 2,009,083 |
| Auxilio Mutuo Obligated Group, Refunding, Series A, 6.00%, 7/01/33 | | 6,000,000 | | 5,584,680 |
| Cogeneration Facility, AES Puerto Rico Project, 6.625%, 6/01/26 | | 5,970,000 | | 5,365,836 |
| Inter American University of Puerto Rico Project, NATL Insured, 4.375%, 10/01/25 | | 1,000,000 | | 858,250 |
| Inter American University of Puerto Rico Project, NATL Insured, 4.50%, 10/01/29 | | 3,750,000 | | 3,135,488 |
| Inter American University of Puerto Rico Project, Refunding, 5.00%, 10/01/21 | | 1,000,000 | | 980,230 |
| Inter American University of Puerto Rico Project, Refunding, 5.00%, 10/01/31 | | 1,000,000 | | 786,750 |
| Puerto Rico Infrastructure Financing Authority Revenue, Ports Authority Project, Series B, | | | | |
| 5.00%, 12/15/22 | | 9,750,000 | | 6,133,042 |
| 5.25%, 12/15/26 | | 13,520,000 | | 8,282,217 |
| 6.00%, 12/15/26 | | 2,000,000 | | 1,331,520 |
| Puerto Rico PBA Guaranteed Revenue, Government Facilities, | | | | |
| Refunding, Series M, 6.25%, 7/01/21 | | 5,000,000 | | 4,292,550 |
| Refunding, Series P, 6.50%, 7/01/30 | | 5,000,000 | | 4,171,250 |
| Refunding, Series P, 6.75%, 7/01/36 | | 5,000,000 | | 4,221,900 |
| Refunding, Series Q, 5.625%, 7/01/39 | | 5,000,000 | | 3,878,200 |
| Series I, Pre-Refunded, 5.25%, 7/01/33 | | 50,000 | | 50,813 |
| Puerto Rico Public Finance Corp. Revenue, Commonwealth Appropriation, Refunding, Series B, | | | | |
| 5.50%, 8/01/31 | | 5,000,000 | | 3,220,550 |
| Puerto Rico Sales Tax FICO Sales Tax Revenue, | | | | |
| Capital Appreciation, first subordinate, Series A, zero cpn. to 8/01/19, 6.25% thereafter, | | | | |
| 8/01/33 | | 7,000,000 | | 3,779,020 |
| first subordinate, Series A, 6.50%, 8/01/44 | | 17,850,000 | | 15,364,566 |
| Senior Series C, 5.25%, 8/01/40 | | 4,560,000 | | 3,829,534 |
| Series A, 5.25%, 8/01/57 | | 4,000,000 | | 3,288,120 |
| University of Puerto Rico Revenue, University System, Refunding, Series P, 5.00%, | | | | |
| 6/01/24 | | 6,500,000 | | 3,785,340 |
| 6/01/26 | | 5,000,000 | | 2,878,800 |
| | | | | 224,791,829 |
76 | Annual Report
Franklin Tax-Free Trust
Statement of Investments, February 28, 2014 (continued)
Franklin Double Tax-Free Income Fund Principal Amount Value
| | | | |
| Municipal Bonds (continued) | | | | |
| U.S. Territories (continued) | | | | |
| U.S. Virgin Islands 7.6% | | | | |
| Virgin Islands PFAR, Virgin Islands Matching Fund Loan Note, | | | | |
| Diageo Project, Series A, 6.75%, 10/01/37 | $ | 7,700,000 | $ | 8,293,439 |
| Series A, 6.00%, 10/01/39 | | 7,250,000 | | 7,297,198 |
| Virgin Islands Port Authority Marine Revenue, Series A, AGMC Insured, 5.00%, 9/01/23 | | 10,000,000 | | 10,003,400 |
| | | | | 25,594,037 |
| Total Municipal Bonds (Cost $390,744,212) 95.8% | | | | 324,524,841 |
| Other Assets, less Liabilities 4.2% | | | | 14,264,406 |
| Net Assets 100.0% | | | $ | 338,789,247 |
| |
| |
| |
| See Abbreviations on page 200. | | | | |
Annual Report | The accompanying notes are an integral part of these financial statements. | 77
| | | | | | | | | | | | | | | |
| Franklin Tax-Free Trust | | | | | | | | | | | | | |
| Financial Highlights | | | | | | | | | | | | | | | |
| |
| Franklin Federal Intermediate-Term Tax-Free Income Fund | | | | | | | | | | | | | |
| | | | | | Year Ended February 28, | | | | |
| Class A | | 2014 | | | 2013 | | | 2012 | a | | 2011 | | | 2010 | |
| Per share operating performance | | | | | | | | | | | | | | | |
| (for a share outstanding throughout the year) | | | | | | | | | | | | | | | |
| Net asset value, beginning of year | $ | 12.59 | | $ | 12.39 | | $ | 11.43 | | $ | 11.59 | | $ | 10.99 | |
| Income from investment operationsb: | | | | | | | | | | | | | | | |
| Net investment incomec | | 0.34 | | | 0.34 | | | 0.38 | | | 0.40 | | | 0.43 | |
| Net realized and unrealized gains (losses) | | (0.38 | ) | | 0.19 | | | 0.97 | | | (0.15 | ) | | 0.61 | |
| Total from investment operations | | (0.04 | ) | | 0.53 | | | 1.35 | | | 0.25 | | | 1.04 | |
| Less distributions from net investment income | | (0.34 | ) | | (0.33 | ) | | (0.39 | ) | | (0.41 | ) | | (0.44 | ) |
| Net asset value, end of year | $ | 12.21 | | $ | 12.59 | | $ | 12.39 | | $ | 11.43 | | $ | 11.59 | |
| |
| Total returnd | | (0.29 | )% | | 4.35 | % | | 12.02 | % | | 2.12 | % | | 9.61 | % |
| |
| Ratios to average net assets | | | | | | | | | | | | | | | |
| Expenses | | 0.65 | % | | 0.65 | % | | 0.66 | % | | 0.66 | % | | 0.67 | % |
| Net investment income | | 2.81 | % | | 2.71 | % | | 3.23 | % | | 3.45 | % | | 3.76 | % |
| |
| Supplemental data | | | | | | | | | | | | | | | |
| Net assets, end of year (000’s) | $ | 1,747,118 | | $ | 2,252,973 | | $ | 1,832,750 | | $ | 1,492,832 | | $ | 1,390,805 | |
| Portfolio turnover rate | | 9.30 | % | | 1.81 | % | | 6.01 | % | | 10.11 | % | | 3.68 | % |
aFor the year ended February 29.
bThe amount shown for a share outstanding throughout the period may not correlate with the Statement of Operations for the period due to the timing of sales and repurchases of
the Fund shares in relation to income earned and/or fluctuating market value of the investments of the Fund.
cBased on average daily shares outstanding.
dTotal return does not reflect sales commissions or contingent deferred sales charges, if applicable.
78 | The accompanying notes are an integral part of these financial statements. | Annual Report
| | | | | | | | | | | | | | | | |
| Franklin Tax-Free Trust | | | | | | | | | | | | | | | |
| Financial Highlights (continued) | | | | | | | | | | | | | | | | |
| |
| Franklin Federal Intermediate-Term Tax-Free Income Fund | | | | | | | | | | | | | | | |
| | | | | | | Year Ended February 28, | | | | |
| Class C | | | 2014 | | | 2013 | | | 2012 | a | | 2011 | | | 2010 | |
| Per share operating performance | | | | | | | | | | | | | | | | |
| (for a share outstanding throughout the year) | | | | | | | | | | | | | | | | |
| Net asset value, beginning of year | | $ | 12.62 | | $ | 12.42 | | $ | 11.46 | | $ | 11.61 | | $ | 11.01 | |
| Income from investment operationsb: | | | | | | | | | | | | | | | | |
| Net investment incomec | | | 0.27 | | | 0.27 | | | 0.32 | | | 0.34 | | | 0.36 | |
| Net realized and unrealized gains (losses) | | | (0.38 | ) | | 0.19 | | | 0.97 | | | (0.15 | ) | | 0.61 | |
| Total from investment operations | | | (0.11 | ) | | 0.46 | | | 1.29 | | | 0.19 | | | 0.97 | |
| Less distributions from net investment income | | | (0.27 | ) | | (0.26 | ) | | (0.33 | ) | | (0.34 | ) | | (0.37 | ) |
| Net asset value, end of year | | $ | 12.24 | | $ | 12.62 | | $ | 12.42 | | $ | 11.46 | | $ | 11.61 | |
| |
| Total returnd | | | (0.83 | )% | | 3.77 | % | | 11.38 | % | | 1.63 | % | | 8.98 | % |
| |
| Ratios to average net assets | | | | | | | | | | | | | | | | |
| Expenses | | | 1.20 | % | | 1.20 | % | | 1.21 | % | | 1.21 | % | | 1.22 | % |
| Net investment income | | | 2.26 | % | | 2.16 | % | | 2.68 | % | | 2.90 | % | | 3.21 | % |
| |
| Supplemental data | | | | | | | | | | | | | | | | |
| Net assets, end of year (000’s) | | $ | 453,176 | | $ | 548,013 | | $ | 445,913 | | $ | 357,180 | | $ | 257,249 | |
| Portfolio turnover rate | | | 9.30 | % | | 1.81 | % | | 6.01 | % | | 10.11 | % | | 3.68 | % |
aFor the year ended February 29.
bThe amount shown for a share outstanding throughout the period may not correlate with the Statement of Operations for the period due to the timing of sales and repurchases of
the Fund shares in relation to income earned and/or fluctuating market value of the investments of the Fund.
cBased on average daily shares outstanding.
dTotal return does not reflect sales commissions or contingent deferred sales charges, if applicable.
Annual Report | The accompanying notes are an integral part of these financial statements. | 79
| | | | | | | | | | | | | | | |
| Franklin Tax-Free Trust | | | | | | | | | | | | | | | |
| Financial Highlights (continued) | | | | | | | | | | | | | | | |
| |
| Franklin Federal Intermediate-Term Tax-Free Income Fund | | | | | | | | | | | | | | | |
| | | | | | Year Ended February 28, | | | | |
| Advisor Class | | 2014 | | | 2013 | | | 2012 | a | | 2011 | | | 2010 | |
| Per share operating performance | | | | | | | | | | | | | | | |
| (for a share outstanding throughout the year) | | | | | | | | | | | | | | | |
| Net asset value, beginning of year | $ | 12.61 | | $ | 12.41 | | $ | 11.45 | | $ | 11.60 | | $ | 11.00 | |
| Income from investment operationsb: | | | | | | | | | | | | | | | |
| Net investment incomec | | 0.36 | | | 0.35 | | | 0.40 | | | 0.41 | | | 0.44 | |
| Net realized and unrealized gains (losses) | | (0.38 | ) | | 0.20 | | | 0.96 | | | (0.14 | ) | | 0.61 | |
| Total from investment operations | | (0.02 | ) | | 0.55 | | | 1.36 | | | 0.27 | | | 1.05 | |
| Less distributions from net investment income | | (0.35 | ) | | (0.35 | ) | | (0.40 | ) | | (0.42 | ) | | (0.45 | ) |
| Net asset value, end of year | $ | 12.24 | | $ | 12.61 | | $ | 12.41 | | $ | 11.45 | | $ | 11.60 | |
| |
| Total return | | (0.11 | )% | | 4.45 | % | | 12.10 | % | | 2.30 | % | | 9.70 | % |
| |
| Ratios to average net assets | | | | | | | | | | | | | | | |
| Expenses | | 0.55 | % | | 0.55 | % | | 0.56 | % | | 0.56 | % | | 0.57 | % |
| Net investment income | | 2.91 | % | | 2.81 | % | | 3.33 | % | | 3.55 | % | | 3.86 | % |
| |
| Supplemental data | | | | | | | | | | | | | | | |
| Net assets, end of year (000’s) | $ | 1,798,459 | | $ | 1,146,322 | | $ | 792,857 | | $ | 435,837 | | $ | 144,745 | |
| Portfolio turnover rate | | 9.30 | % | | 1.81 | % | | 6.01 | % | | 10.11 | % | | 3.68 | % |
aFor the year ended February 29.
bThe amount shown for a share outstanding throughout the period may not correlate with the Statement of Operations for the period due to the timing of sales and repurchases of
the Fund shares in relation to income earned and/or fluctuating market value of the investments of the Fund.
cBased on average daily shares outstanding.
80 | The accompanying notes are an integral part of these financial statements. | Annual Report
| | | | | |
| Franklin Tax-Free Trust | | | | | |
| |
| Statement of Investments, February 28, 2014 | | | | | |
| |
| |
| Franklin Federal Intermediate-Term Tax-Free Income Fund | | | Principal Amount | | Value |
| Municipal Bonds 88.2% | | | | | |
| Alabama 2.1% | | | | | |
| Alabama State Public School and College Authority Revenue, Capital Improvement, Refunding, | | | | | |
| Series A, 5.00%, 5/01/19 | | $ | 7,750,000 | $ | 9,200,800 |
| Chatom IDB Gulf Opportunity Zone Revenue, PowerSouth Energy Cooperative, Refunding, | | | | | |
| Series A, Assured Guaranty, 5.00%, | | | | | |
| 8/01/20 | | | 3,535,000 | | 4,114,104 |
| 8/01/21 | | | 3,535,000 | | 4,068,573 |
| 8/01/22 | | | 3,535,000 | | 4,001,337 |
| East Alabama Health Care Authority Health Care Facilities Revenue, Mandatory Put 9/01/18, | | | | | |
| Series A, 5.25%, 9/01/36 | | | 10,000,000 | | 11,129,400 |
| Series B, 5.50%, 9/01/33 | | | 13,500,000 | | 15,258,510 |
| Huntsville Health Care Authority Revenue, Series A, NATL Insured, Pre-Refunded, 5.00%, | | | | | |
| 6/01/17 | | | 2,900,000 | | 3,071,390 |
| Jefferson County GO, Capital Improvement wts., Series A, NATL Insured, 5.00%, 4/01/17 | | | 2,195,000 | | 2,174,213 |
| Jefferson County Revenue, Limited Obligation School wts., Series A, 5.25%, 1/01/16 | | | 2,000,000 | | 2,015,360 |
| Shelby County Board of Education Revenue, Capital Outlay School wts., 5.00%, | | | | | |
| 2/01/22 | | | 5,250,000 | | 5,963,475 |
| 2/01/23 | | | 5,520,000 | | 6,214,802 |
| 2/01/24 | | | 5,055,000 | | 5,674,541 |
| 2/01/25 | | | 5,920,000 | | 6,594,762 |
| University of Alabama General Revenue, Series A, NATL Insured, Pre-Refunded, 5.00%, | | | | | |
| 7/01/15 | | | 4,070,000 | | 4,131,945 |
| | | | | | 83,613,212 |
| Alaska 0.1% | | | | | |
| Matanuska-Susitna Borough Lease Revenue, Goose Creek Correctional Center Project, | | | | | |
| Assured Guaranty, 5.00%, 9/01/19 | | | 3,650,000 | | 4,329,156 |
| Arizona 4.8% | | | | | |
| Arizona Health Facilities Authority Revenue, Banner Health, | | | | | |
| Series A, 5.00%, 1/01/22 | | | 8,000,000 | | 8,747,440 |
| Series D, 5.50%, 1/01/22 | | | 5,000,000 | | 5,503,050 |
| Series D, 5.00%, 1/01/23 | | | 5,000,000 | | 5,390,250 |
| Arizona School Facilities Board COP, | | | | | |
| 5.25%, 9/01/19 | | | 10,000,000 | | 11,509,300 |
| Refunding, Series A-3, Assured Guaranty, 5.00%, 9/01/19 | | | 16,185,000 | | 18,706,299 |
| Arizona State Board of Regents Arizona State University System Revenue, Series C, 5.75%, | | | | | |
| 7/01/20 | | | 500,000 | | 586,765 |
| 7/01/21 | | | 500,000 | | 586,080 |
| Arizona State COP, Department of Administration, | | | | | |
| Series A, AGMC Insured, 5.00%, 10/01/19 | | | 5,650,000 | | 6,594,623 |
| Series A, AGMC Insured, 5.25%, 10/01/21 | | | 10,000,000 | | 11,540,000 |
| Series A, AGMC Insured, 5.25%, 10/01/22 | | | 40,910,000 | | 46,612,854 |
| Series B, AGMC Insured, 5.00%, 10/01/20 | | | 14,860,000 | | 16,958,678 |
| Arizona State Health Facilities Authority Hospital Revenue, Phoenix Children’s Hospital, | | | | | |
| Refunding, Series A, 5.00%, 2/01/27 | | | 6,000,000 | | 6,357,120 |
| Arizona State Transportation Board Highway Revenue, Subordinated, Refunding, Series A, | | | | | |
| 5.00%, | | | | | |
| 7/01/24 | | | 5,000,000 | | 5,795,200 |
| 7/01/25 | | | 5,000,000 | | 5,759,250 |
Annual Report | 81
| | | | |
| Franklin Tax-Free Trust | | | | |
| |
| Statement of Investments, February 28, 2014 (continued) | | | | |
| |
| |
| Franklin Federal Intermediate-Term Tax-Free Income Fund | | Principal Amount | | Value |
| Municipal Bonds (continued) | | | | |
| Arizona (continued) | | | | |
| Arizona State University COP, Research Infrastructure Projects, AMBAC Insured, Pre-Refunded, | | | | |
| 5.25%, 9/01/16 | $ | 2,505,000 | $ | 2,567,149 |
| Glendale IDA Hospital Revenue, John C. Lincoln Health Network, Refunding, Series B, 5.00%, | | | | |
| 12/01/18 | | 5,605,000 | | 5,810,704 |
| Maricopa County Hospital Revenue, Sun Health Corp., Pre-Refunded, 5.00%, 4/01/18 | | 2,000,000 | | 2,101,660 |
| Phoenix Civic Improvement Corp. Airport Revenue, junior lien, Series A, 5.00%, | | | | |
| 7/01/19 | | 1,900,000 | | 2,221,936 |
| 7/01/20 | | 1,300,000 | | 1,518,725 |
| 7/01/21 | | 4,200,000 | | 4,810,386 |
| Pima County Sewer System Revenue, | | | | |
| Series A, AGMC Insured, 5.00%, 7/01/24 | | 2,250,000 | | 2,600,663 |
| Series B, 5.00%, 7/01/24 | | 6,030,000 | | 6,919,726 |
| Series B, 5.00%, 7/01/25 | | 4,500,000 | | 5,122,395 |
| Scottsdale IDA Hospital Revenue, Scottsdale Healthcare, Refunding, Series A, 5.00%, | | | | |
| 9/01/21 | | 4,000,000 | | 4,304,040 |
| Tempe IDA Lease Revenue, State University Foundation, AMBAC Insured, 4.00%, | | | | |
| 7/01/15 | | 1,000,000 | | 1,000,960 |
| 7/01/16 | | 1,000,000 | | 1,000,660 |
| University Medical Center Corp. Hospital Revenue, Tucson, 6.00%, 7/01/24 | | 2,000,000 | | 2,220,260 |
| | | | | 192,846,173 |
| Arkansas 0.2% | | | | |
| Arkansas State Development Finance Authority Revenue, State Agencies Facilities, Arkansas | | | | |
| Department of Correction Project, Series B, AGMC Insured, Pre-Refunded, 5.00%, | | | | |
| 11/01/17 | | 1,955,000 | | 2,109,347 |
| 11/01/19 | | 1,065,000 | | 1,149,082 |
| Fort Smith Sales and Use Tax Revenue, Refunding and Improvement, 5.00%, 5/01/23 | | 5,000,000 | | 5,687,500 |
| | | | | 8,945,929 |
| California 10.0% | | | | |
| California Health Facilities Financing Authority Revenue, | | | | |
| Catholic Healthcare West, Series L, 5.125%, 7/01/22 | | 6,320,000 | | 6,611,858 |
| Providence Health and Services, Series C, 6.00%, 10/01/18 | | 500,000 | | 602,500 |
| Scripps Health, Series A, 5.00%, 10/01/21 | | 5,000,000 | | 5,670,950 |
| California State GO, | | | | |
| Refunding, 5.00%, 8/01/21 | | 20,000,000 | | 22,444,400 |
| Refunding, 5.25%, 9/01/25 | | 15,000,000 | | 17,846,400 |
| Refunding, 5.00%, 10/01/25 | | 15,000,000 | | 17,405,700 |
| Various Purpose, 5.50%, 4/01/21 | | 20,000,000 | | 23,614,200 |
| Various Purpose, 5.25%, 10/01/23 | | 25,050,000 | | 30,352,083 |
| Various Purpose, 5.25%, 10/01/24 | | 9,780,000 | | 11,850,035 |
| Various Purpose, 5.25%, 10/01/25 | | 5,000,000 | | 5,958,300 |
| Various Purpose, XLCA Insured, 5.00%, 11/01/22 | | 4,805,000 | | 5,526,807 |
| California State Health Facilities Financing Authority Revenue, Sutter Health, Refunding, | | | | |
| Series B, | | | | |
| 5.00%, 8/15/22 | | 4,000,000 | | 4,630,400 |
| 5.25%, 8/15/23 | | 13,000,000 | | 15,073,500 |
82 | Annual Report
| | | | |
| Franklin Tax-Free Trust | | | | |
| |
| Statement of Investments, February 28, 2014 (continued) | | | | |
| |
| |
| Franklin Federal Intermediate-Term Tax-Free Income Fund | | Principal Amount | | Value |
| Municipal Bonds (continued) | | | | |
| California (continued) | | | | |
| California State Public Works Board Lease Revenue, Various Capital Projects, | | | | |
| Series A, 5.00%, 10/01/20 | $ | 2,000,000 | $ | 2,382,700 |
| Series A, 5.25%, 10/01/22 | | 3,300,000 | | 3,897,498 |
| Series A, 5.25%, 10/01/23 | | 5,365,000 | | 6,240,246 |
| Series A, 5.25%, 10/01/24 | | 3,000,000 | | 3,478,350 |
| Series A, 5.25%, 10/01/25 | | 3,000,000 | | 3,434,460 |
| Series G, Sub Series G-1, 5.25%, 10/01/18 | | 5,605,000 | | 6,625,671 |
| Series G, Sub Series G-1, 5.25%, 10/01/19 | | 10,000,000 | | 11,997,300 |
| Series G, Sub Series G-1, 5.00%, 10/01/21 | | 15,055,000 | | 17,322,283 |
| Series I, 5.00%, 11/01/18 | | 4,000,000 | | 4,688,160 |
| Series I, 5.25%, 11/01/20 | | 5,000,000 | | 5,885,250 |
| California Statewide CDA Revenue, | | | | |
| Enloe Medical Center, Series A, California Mortgage Insured, 5.25%, 8/15/19 | | 1,990,000 | | 2,271,903 |
| Enloe Medical Center, Series A, California Mortgage Insured, 5.375%, 8/15/20 | | 1,650,000 | | 1,862,421 |
| Sutter Health, Refunding, Series A, 5.25%, 8/15/24 | | 4,000,000 | | 4,602,120 |
| El Dorado Irrigation District COP, Refunding, Series A, Assured Guaranty, | | | | |
| 5.00%, 8/01/22 | | 2,610,000 | | 2,883,711 |
| 5.25%, 8/01/23 | | 2,860,000 | | 3,126,552 |
| Livermore-Amador Valley Water Management Agency Sewer Revenue, Refunding, 5.00%, | | | | |
| 8/01/24 | | 5,660,000 | | 6,307,108 |
| 8/01/25 | | 4,765,000 | | 5,263,562 |
| Los Angeles Department of Water and Power Revenue, Power System, Refunding, | | | | |
| Series A, 5.00%, 7/01/26 | | 11,025,000 | | 12,890,210 |
| Series B, 5.25%, 7/01/24 | | 17,000,000 | | 20,105,560 |
| Los Angeles Municipal Improvement Corp. Lease Revenue, Capital Equipment, Refunding, | | | | |
| Series A, Assured Guaranty, | | | | |
| 5.00%, 4/01/17 | | 3,215,000 | | 3,616,650 |
| 5.25%, 4/01/18 | | 2,495,000 | | 2,900,812 |
| 5.25%, 4/01/19 | | 3,180,000 | | 3,765,406 |
| Los Angeles USD, GO, | | | | |
| Election of 2004, Series F, FGIC Insured, 5.00%, 7/01/24 | | 6,700,000 | | 7,383,668 |
| Election of 2005, Series F, 5.00%, 7/01/22 | | 5,675,000 | | 6,602,011 |
| Orange County Airport Revenue, 5.00%, | | | | |
| 7/01/20 | | 3,465,000 | | 4,006,198 |
| 7/01/21 | | 7,545,000 | | 8,682,182 |
| San Diego Community College District GO, Refunding, 5.00%, 8/01/25 | | 21,370,000 | | 25,184,331 |
| San Francisco City and County COP, Multiple Capital Improvement Projects, Series A, | | | | |
| 5.00%, 4/01/25 | | 4,000,000 | | 4,447,320 |
| 5.25%, 4/01/26 | | 2,500,000 | | 2,768,975 |
| San Joaquin Hills Transportation Corridor Agency Toll Road Revenue, Capital Appreciation, | | | | |
| Refunding, Series A, 5.65%, 1/15/17 | | 3,000,000 | | 3,065,430 |
| San Jose RDA Tax Allocation, Merged Area, Refunding, Series D, Assured Guaranty, 5.00%, | | | | |
| 8/01/21 | | 10,000,000 | | 10,533,200 |
| 8/01/22 | | 10,000,000 | | 10,444,600 |
| Tulare Joint UHSD, GO, Election of 2004, Series A, NATL Insured, 5.00%, 8/01/16 | | 2,870,000 | | 2,964,222 |
Annual Report | 83
| | | | |
| Franklin Tax-Free Trust | | | | |
| |
| Statement of Investments, February 28, 2014 (continued) | | | | |
| |
| |
| Franklin Federal Intermediate-Term Tax-Free Income Fund | | Principal Amount | | Value |
| Municipal Bonds (continued) | | | | |
| California (continued) | | | | |
| Tuolumne Wind Project Authority Revenue, Tuolumne Co. Project, Series A, 5.25%, | | | | |
| 1/01/23 | $ | 8,000,000 | $ | 9,209,200 |
| Val Verde USD, COP, Centralized Support Services and District Office Facilities Project, | | | | |
| FGIC Insured, ETM, 5.00%, 1/01/15 | | 1,000,000 | | 1,039,410 |
| | | | | 399,465,813 |
| Colorado 1.9% | | | | |
| Adams County PCR, Public Service Co. of Colorado Project, Refunding, Series A, | | | | |
| NATL Insured, 4.375%, 9/01/17 | | 17,000,000 | | 17,799,340 |
| Denver City and County Airport System Revenue, Subordinate, Series B, 5.25%, | | | | |
| 11/15/26 | | 5,000,000 | | 5,608,900 |
| 11/15/27 | | 4,250,000 | | 4,752,902 |
| Denver City and County Excise Tax Revenue, Refunding, Series A, AGMC Insured, 5.00%, | | | | |
| 9/01/20 | | 10,090,000 | | 11,889,854 |
| E-470 Public Highway Authority Senior Revenue, Series D, Sub Series D-1, NATL Insured, | | | | |
| 5.50%, 9/01/24 | | 8,000,000 | | 8,331,840 |
| Public Authority for Colorado Energy Natural Gas Purchase Revenue, 5.75%, 11/15/18 | | 3,440,000 | | 3,849,601 |
| Regional Transportation District COP, Refunding, Series A, 5.00%, 6/01/26 | | 14,000,000 | | 15,539,720 |
| Regional Transportation District Sales Tax Revenue, FasTracks Project, Series A, 5.00%, | | | | |
| 11/01/25 | | 5,870,000 | | 6,787,951 |
| | | | | 74,560,108 |
| Connecticut 0.9% | | | | |
| Connecticut State GO, Series E, 5.00%, | | | | |
| 8/15/25 | | 11,295,000 | | 13,272,754 |
| 8/15/26 | | 18,585,000 | | 21,655,242 |
| | | | | 34,927,996 |
| Florida 8.3% | | | | |
| Broward County School Board COP, Master Lease Purchase Agreement, Series A, | | | | |
| AGMC Insured, 5.00%, 7/01/16 | | 5,915,000 | | 6,253,989 |
| Broward County Water and Sewer Utility Revenue, Refunding, Series B, 5.00%, | | | | |
| 10/01/24 | | 6,000,000 | | 6,935,340 |
| 10/01/25 | | 6,325,000 | | 7,243,896 |
| Citizens Property Insurance Corp. Revenue, High-Risk Account, senior secured, Series A-1, | | | | |
| 5.00%, 6/01/16 | | 40,415,000 | | 44,334,851 |
| 5.25%, 6/01/17 | | 3,250,000 | | 3,689,075 |
| 6.00%, 6/01/17 | | 5,000,000 | | 5,787,750 |
| Collier County School Board COP, Master Lease Program, AGMC Insured, 5.00%, 2/15/22 | | 5,075,000 | | 5,569,305 |
| Hillsborough County Capacity Assessment Special Assessment Revenue, NATL RE, | | | | |
| FGIC Insured, 5.00%, 3/01/19 | | 5,000,000 | | 5,294,050 |
| Hillsborough County IDA, PCR, Tampa Electric Co. Project, Series A, 5.65%, 5/15/18 | | 6,500,000 | | 7,585,825 |
| Jacksonville Capital Improvement Revenue, Refunding, 5.00%, | | | | |
| 10/01/25 | | 7,295,000 | | 8,319,437 |
| 10/01/26 | | 7,350,000 | | 8,317,186 |
| Jacksonville Sales Tax Revenue, Better Jacksonville, Refunding, Series A, 5.00%, | | | | |
| 10/01/28 | | 6,000,000 | | 6,577,560 |
84 | Annual Report
| | | | | |
| | Franklin Tax-Free Trust | | | | |
| |
| | Statement of Investments, February 28, 2014 (continued) | | | | |
| |
| |
| | Franklin Federal Intermediate-Term Tax-Free Income Fund | | Principal Amount | | Value |
| | Municipal Bonds (continued) | | | | |
| | Florida (continued) | | | | |
| | Leon County School District Sales Tax Revenue, 5.00%, 9/01/25 | $ | 6,040,000 | $ | 7,025,668 |
| | Miami-Dade County Aviation Revenue, Miami International Airport, Refunding, Series A, | | | | |
| | 4.25%, 10/01/18 | | 6,920,000 | | 7,810,120 |
| | 4.50%, 10/01/19 | | 4,805,000 | | 5,492,595 |
| | 5.00%, 10/01/21 | | 5,000,000 | | 5,707,600 |
| | 5.00%, 10/01/22 | | 5,890,000 | | 6,598,979 |
| | 5.25%, 10/01/23 | | 4,875,000 | | 5,478,379 |
| | Miami-Dade County School Board COP, Master Lease Purchase Agreement, Series A, | | | | |
| | Assured Guaranty, 5.00%, 2/01/23 | | 12,115,000 | | 13,346,005 |
| Miami-Dade County Transit System Sales Surtax Revenue, 5.00%, | | | | |
| | 7/01/24 | | 2,250,000 | | 2,577,352 |
| | 7/01/25 | | 3,000,000 | | 3,408,090 |
| | 7/01/26 | | 4,000,000 | | 4,478,800 |
| | 7/01/27 | | 4,000,000 | | 4,445,000 |
| Miami-Dade County Water and Sewer System Revenue, Refunding, Series B, 5.00%, | | | | |
| | 10/01/27 | | 15,000,000 | | 16,803,450 |
| | Orange County School Board COP, Master Lease Purchase Agreement, Series B, NATL RE, | | | | |
| | FGIC Insured, 5.00%, | | | | |
| | 8/01/18 | | 5,150,000 | | 5,674,682 |
| | 8/01/19 | | 5,985,000 | | 6,588,707 |
| | Orlando Utilities Commission Utility System Revenue, Refunding, Series A, 5.00%, | | | | |
| | 10/01/23 | | 4,000,000 | | 4,763,960 |
| | 10/01/24 | | 2,405,000 | | 2,874,071 |
| | 10/01/25 | | 2,000,000 | | 2,386,440 |
| | Orlando-Orange County Expressway Authority Revenue, Refunding, | | | | |
| | AGMC Insured, 5.00%, 7/01/24 | | 9,355,000 | | 10,738,324 |
| | Series B, AGMC Insured, 5.00%, 7/01/22 | | 7,500,000 | | 8,851,275 |
| | Series B, AGMC Insured, 5.00%, 7/01/23 | | 10,000,000 | | 11,784,700 |
| | Series B, AGMC Insured, 5.00%, 7/01/24 | | 14,650,000 | | 17,029,746 |
| | Palm Beach County School Board COP, Master Lease Purchase Agreement, Series E, | | | | |
| | NATL Insured, 5.00%, 8/01/21 | | 6,060,000 | | 6,672,363 |
| | Palm Beach County Solid Waste Authority Revenue, Refunding, 5.00%, 10/01/23 | | 17,290,000 | | 19,983,782 |
| | Palm Beach County Water and Sewer Revenue, Refunding, 5.00%, | | | | |
| | 10/01/24 | | 700,000 | | 836,955 |
| | 10/01/25 | | 1,690,000 | | 2,009,647 |
| | 10/01/26 | | 1,250,000 | | 1,473,738 |
| | 10/01/27 | | 2,150,000 | | 2,507,373 |
| | 10/01/28 | | 1,240,000 | | 1,433,824 |
| | Pasco County Solid Waste Disposal and Resource Recovery System Revenue, Series D, | | | | |
| | AGMC Insured, 5.00%, | | | | |
| | 10/01/22 | | 9,490,000 | | 10,253,850 |
| | 10/01/24 | | 10,455,000 | | 11,258,989 |
| | South Miami Health Facilities Authority Hospital Revenue, Baptist Health South Florida | | | | |
| | Obligated Group, 5.00%, 8/15/19 | | 5,000,000 | | 5,601,400 |
| | | | | | 331,804,128 |
Annual Report | 85
| | | | |
| Franklin Tax-Free Trust | | | | |
| |
| Statement of Investments, February 28, 2014 (continued) | | | | |
| |
| |
| Franklin Federal Intermediate-Term Tax-Free Income Fund | | Principal Amount | | Value |
| Municipal Bonds (continued) | | | | |
| Georgia 0.9% | | | | |
| Atlanta Tax Allocation, Atlantic Station Project, Refunding, Assured Guaranty, 5.25%, | | | | |
| 12/01/20 | $ | 1,500,000 | $ | 1,604,190 |
| 12/01/21 | | 1,000,000 | | 1,064,390 |
| Atlanta Water and Wastewater Revenue, Refunding, Series B, AGMC Insured, 5.00%, | | | | |
| 11/01/20 | | 8,575,000 | | 9,854,819 |
| 11/01/21 | | 9,230,000 | | 10,439,591 |
| Georgia State Municipal Electric Authority Revenue, Project One, Subordinated, Series B, | | | | |
| 5.00%, 1/01/20 | | 10,000,000 | | 11,730,800 |
| South Georgia Governmental Services Authority Revenue, Telecommunications/Cable Systems | | | | |
| Projects, NATL RE, FGIC Insured, 5.00%, 1/01/16 | | 2,650,000 | | 2,708,274 |
| | | | | 37,402,064 |
| Illinois 4.8% | | | | |
| Chicago Board of Education GO, Dedicated Revenues, Refunding, Series B, AMBAC Insured, | | | | |
| 5.00%, 12/01/21 | | 16,015,000 | | 17,268,654 |
| Chicago GO, Project and Refunding, Series A, | | | | |
| AGMC Insured, 5.00%, 1/01/20 | | 22,490,000 | | 23,987,609 |
| AMBAC Insured, 5.00%, 1/01/21 | | 10,280,000 | | 11,063,130 |
| Chicago O’Hare International Airport Revenue, General, third lien, | | | | |
| Refunding, Series B, AGMC Insured, 5.00%, 1/01/18 | | 10,670,000 | | 11,851,489 |
| Refunding, Series B, AGMC Insured, 5.00%, 1/01/20 | | 7,850,000 | | 8,737,835 |
| Series C, AGMC Insured, 5.25%, 1/01/22 | | 5,215,000 | | 6,048,670 |
| Chicago Transit Authority Capital Grant Receipts Revenue, Federal Transit Administration | | | | |
| Section 5307, Refunding, AGMC Insured, 5.25%, 6/01/25 | | 6,125,000 | | 6,534,273 |
| Cook County GO, Refunding, Series A, 5.25%, 11/15/22 | | 12,395,000 | | 14,224,626 |
| Illinois State Finance Authority Revenue, Rush University Medical Center Obligated Group, | | | | |
| Series A, 6.75%, 11/01/24 | | 5,000,000 | | 5,743,150 |
| Illinois State GO, | | | | |
| 5.00%, 2/01/26 | | 5,650,000 | | 6,170,987 |
| 5.50%, 7/01/26 | | 7,000,000 | | 7,885,430 |
| Refunding, AGMC Insured, 5.00%, 1/01/19 | | 12,000,000 | | 13,813,680 |
| Series A, AGMC Insured, 5.00%, 4/01/25 | | 18,000,000 | | 19,759,860 |
| Illinois State Sales Tax Revenue, Build Illinois, Junior Obligation, Refunding, 5.00%, | | | | |
| 6/15/26 | | 14,000,000 | | 15,876,140 |
| Metropolitan Pier and Exposition Authority Revenue, McCormick Place Expansion Project, | | | | |
| Refunding, Series B, 5.00%, | | | | |
| 12/15/22 | | 5,000,000 | | 5,842,100 |
| 12/15/22 | | 2,000,000 | | 2,217,600 |
| 6/15/23 | | 4,000,000 | | 4,569,760 |
| Southwestern Illinois Development Authority Revenue, Local Government Program, | | | | |
| Edwardsville Community Unit School District No. 7 Project, AGMC Insured, 5.00%, | | | | |
| 12/01/19 | | 11,005,000 | | 12,264,082 |
| | | | | 193,859,075 |
| Kentucky 0.7% | | | | |
| Kentucky Asset/Liability Commission Agency Fund Revenue, Project Notes, Federal Highway | | | | |
| Trust, First Series A, 5.00%, 9/01/20 | | 6,000,000 | | 6,987,060 |
| Kentucky State Property and Buildings Commission Revenues, Project No. 87, Refunding, | | | | |
| NATL RE, FGIC Insured, 5.00%, 3/01/23 | | 11,000,000 | | 12,151,810 |
86 | Annual Report
Franklin Tax-Free Trust
Statement of Investments, February 28, 2014 (continued)
| | | | |
| Franklin Federal Intermediate-Term Tax-Free Income Fund | | Principal Amount | | Value |
| Municipal Bonds (continued) | | | | |
| Kentucky (continued) | | | | |
| Kentucky State Turnpike Authority Economic Development Road Revenue, 5.00%, | | | | |
| 7/01/22 | $ | 1,000,000 | $ | 1,148,540 |
| Louisville and Jefferson County Metropolitan Sewer District Sewer and Drainage System | | | | |
| Revenue, Refunding, Series A, 5.00%, 5/15/24 | | 7,000,000 | | 8,012,130 |
| | | | | 28,299,540 |
| Louisiana 1.4% | | | | |
| Jefferson Sales Tax District Special Sales Tax Revenue, Parish of Jefferson, Refunding, | | | | |
| Series B, Assured Guaranty, 5.00%, 12/01/21 | | 15,000,000 | | 17,234,850 |
| Louisiana State Citizens Property Insurance Corp. Assessment Revenue, Series B, | | | | |
| AMBAC Insured, 5.00%, 6/01/19 | | 20,000,000 | | 21,743,200 |
| New Orleans Aviation Board Revenue, Restructuring GARB, Refunding, Series A-1, | | | | |
| Assured Guaranty, 6.00%, 1/01/23 | | 2,000,000 | | 2,242,600 |
| New Orleans GO, Public Improvement, Radian Insured, Series A, 5.00%, 12/01/25 | | 7,915,000 | | 8,315,974 |
| Orleans Parish Parishwide School District GO, Refunding, AGMC Insured, 5.00%, 9/01/18 | | 5,000,000 | | 5,682,350 |
| | | | | 55,218,974 |
| Maryland 0.3% | | | | |
| Maryland State EDC Student Housing Revenue, University of Maryland College Park Projects, | | | | |
| Refunding, Assured Guaranty, 5.00%, | | | | |
| 6/01/19 | | 1,445,000 | | 1,535,804 |
| 6/01/20 | | 1,000,000 | | 1,061,040 |
| Maryland State Health and Higher Educational Facilities Authority Revenue, | | | | |
| Peninsula Regional Medical Center Issue, 5.00%, 7/01/18 | | 1,600,000 | | 1,736,496 |
| Peninsula Regional Medical Center Issue, 5.00%, 7/01/19 | | 1,430,000 | | 1,540,711 |
| Peninsula Regional Medical Center Issue, 5.00%, 7/01/20 | | 1,000,000 | | 1,067,710 |
| Washington County Hospital Issue, 5.25%, 1/01/22 | | 1,000,000 | | 1,048,540 |
| Washington County Hospital Issue, 5.25%, 1/01/23 | | 1,250,000 | | 1,302,550 |
| Western Maryland Health System Issue, Refunding, Series A, NATL Insured, 5.00%, | | | | |
| 1/01/19 | | 2,920,000 | | 3,155,819 |
| | | | | 12,448,670 |
| Massachusetts 1.8% | | | | |
| Massachusetts State Department of Transportation Metropolitan Highway System Revenue, | | | | |
| Commonwealth Contract Assistance Secured, Subordinated, Series B, 5.00%, 1/01/20 | | 5,000,000 | | 5,877,500 |
| Senior, Refunding, Series B, 5.00%, 1/01/17 | | 5,000,000 | | 5,590,800 |
| Senior, Refunding, Series B, 5.00%, 1/01/18 | | 5,000,000 | | 5,756,250 |
| Massachusetts State Health and Educational Facilities Authority Revenue, CareGroup Issue, | | | | |
| Capital Asset Program, Series B-2, NATL Insured, 5.375%, 2/01/26 | | 1,720,000 | | 1,891,088 |
| Massachusetts State School Building Authority Dedicated Sales Tax Revenue, Senior, | | | | |
| Refunding, | | | | |
| Series A, 5.00%, 8/15/25 | | 10,975,000 | | 12,896,723 |
| Series A, 5.00%, 8/15/26 | | 7,000,000 | | 8,168,090 |
| Series B, 5.00%, 8/15/27 | | 6,000,000 | | 6,913,380 |
| Massachusetts State Water Pollution Abatement Trust Revenue, State Revolving Fund, | | | | |
| Series 17, Sub Series 17A, 5.00%, | | | | |
| 2/01/24 | | 9,380,000 | | 11,324,849 |
| 2/01/25 | | 9,750,000 | | 11,573,738 |
| | | | | 69,992,418 |
| |
| | | | | Annual Report | 87 |
| | | | | |
| | Franklin Tax-Free Trust | | | | |
| |
| | Statement of Investments, February 28, 2014 (continued) | | | | |
| |
| |
| | Franklin Federal Intermediate-Term Tax-Free Income Fund | | Principal Amount | | Value |
| | Municipal Bonds (continued) | | | | |
| | Michigan 3.6% | | | | |
| | Detroit GO, | | | | |
| | Distributable State Aid, 5.00%, 11/01/19 | $ | 6,775,000 | $ | 7,445,183 |
| | Distributable State Aid, 5.00%, 11/01/20 | | 6,000,000 | | 6,537,420 |
| | Series A-1, NATL Insured, 5.00%, 4/01/19 | | 5,000,000 | | 4,775,700 |
| | Series B, AGMC Insured, 5.00%, 4/01/18 | | 2,635,000 | | 2,572,419 |
| | Series B, AGMC Insured, 5.00%, 4/01/19 | | 2,515,000 | | 2,443,649 |
| | Michigan Municipal Bond Authority Revenue, Local Government Loan Program, Group A, | | | | |
| | Refunding, Series B, AMBAC Insured, 5.00%, | | | | |
| | 12/01/17 | | 1,000,000 | | 1,024,540 |
| | 12/01/18 | | 1,000,000 | | 1,019,980 |
| | Michigan State Finance Authority Revenue, | | | | |
| | School District of the City of Detroit, Refunding, 5.25%, 6/01/17 | | 10,640,000 | | 11,718,896 |
| | School District of the City of Detroit, Refunding, 5.50%, 6/01/21 | | 6,000,000 | | 6,755,520 |
| | State Revolving Fund, Clean Water, 5.00%, 10/01/24 | | 5,000,000 | | 5,812,350 |
| | State Revolving Fund, Clean Water, Subordinate, Refunding, 5.00%, 10/01/24 | | 7,000,000 | | 8,137,290 |
| | Michigan State GO, School Loan, Refunding, Series A, 5.25%, 11/01/22 | | 10,000,000 | | 11,423,300 |
| | Michigan State HDA, SFMR, Series A, 5.00%, 12/01/19 | | 410,000 | | 429,578 |
| | Michigan State Hospital Finance Authority Revenue, Trinity Health Credit Group, | | | | |
| | Mandatory Put 12/01/17, Refunding, Series A, 6.00%, 12/01/34 | | 10,000,000 | | 11,721,600 |
| | Refunding, Series MI, 5.00%, 12/01/24 | | 8,000,000 | | 8,864,080 |
| | Michigan State Revenue, Grant Anticipation Bonds, AGMC Insured, 5.25%, 9/15/20 | | 7,500,000 | | 8,529,375 |
| | Michigan State Strategic Fund Limited Obligation Revenue, | | | | |
| | Detroit Edison Co. Exempt Facilities Project, Mandatory Put 8/01/16, Refunding, Series ET, | | | | |
| | Sub Series ET-2, 5.50%, 8/01/29 | | 7,000,000 | | 7,711,550 |
| | Michigan House of Representatives Facilities, Series A, Assured Guaranty, 5.25%, | | | | |
| | 10/15/22 | | 4,000,000 | | 4,373,920 |
| | Michigan House of Representatives Facilities, Series A, Assured Guaranty, 5.25%, | | | | |
| | 10/15/23 | | 1,000,000 | | 1,087,650 |
| | Royal Oak Hospital Finance Authority Hospital Revenue, William Beaumont Hospital Obligated | | | | |
| | Group, Refunding, Series V, 6.25%, 9/01/14 | | 3,000,000 | | 3,083,520 |
| | South Lyon Community Schools GO, Refunding, NATL RE, FGIC Insured, 5.00%, 5/01/16 | | 3,040,000 | | 3,331,536 |
| | Wayne State University Revenue, Refunding, Series A, 5.00%, | | | | |
| | 11/15/18 | | 4,265,000 | | 4,934,946 |
| | 11/15/19 | | 5,210,000 | | 6,050,165 |
| | 11/15/20 | | 5,255,000 | | 5,900,577 |
| Wayne -Westland Community Schools GO, Refunding, AGMC Insured, 5.00%, 5/01/16 | | 2,825,000 | | 2,907,518 |
| | Wyandotte Electric System Revenue, Refunding, Series A, Assured Guaranty, 5.00%, | | | | |
| | 10/01/17 | | 3,955,000 | | 4,411,288 |
| | | | | | 143,003,550 |
| | Minnesota 0.5% | | | | |
| | Minnesota Agricultural and Economic Development Board Revenue, Health Care Facilities, | | | | |
| | Essentia Health Obligated Group, Series C-1, Assured Guaranty, | | | | |
| | 5.00%, 2/15/21 | | 4,165,000 | | 4,712,198 |
| | 5.00%, 2/15/22 | | 5,570,000 | | 6,207,598 |
| | 5.25%, 2/15/23 | | 5,000,000 | | 5,616,950 |
| | Minnesota State General Fund Revenue, Appropriation, Refunding, Series A, 5.00%, | | | | |
| | 3/01/25 | | 1,925,000 | | 2,229,265 |
| | | | | | 18,766,011 |
| |
| | 88 | Annual Report | | | | |
| | | | |
| Franklin Tax-Free Trust | | | | |
| |
| Statement of Investments, February 28, 2014 (continued) | | | | |
| |
| |
| Franklin Federal Intermediate-Term Tax-Free Income Fund | | Principal Amount | | Value |
| Municipal Bonds (continued) | | | | |
| Missouri 0.6% | | | | |
| Hannibal IDA Health Facilities Revenue, Hannibal Regional Hospital, Refunding, 5.00%, | | | | |
| 3/01/19 | $ | 1,675,000 | $ | 1,724,480 |
| Jackson County Reorganized School District No. 7 Lee’s Summit GO, School Building, | | | | |
| NATL Insured, 5.00%, 3/01/16 | | 2,000,000 | | 2,000,000 |
| Missouri Joint Municipal Electric Utility Commission Power Project Revenue, Plum Point | | | | |
| Project, NATL Insured, 5.00%, | | | | |
| 1/01/17 | | 1,500,000 | | 1,595,955 |
| 1/01/19 | | 1,000,000 | | 1,053,210 |
| Springfield Public Utility Revenue, NATL RE, FGIC Insured, 4.50%, 8/01/21 | | 15,245,000 | | 16,209,551 |
| | | | | 22,583,196 |
| Nevada 1.3% | | | | |
| Clark County Airport Revenue, System, sub. lien, Series C, AGMC Insured, 5.00%, | | | | |
| 7/01/22 | | 5,000,000 | | 5,729,100 |
| 7/01/23 | | 15,000,000 | | 17,098,050 |
| Clark County School District GO, Refunding, Series A, NATL RE, FGIC Insured, 4.50%, | | | | |
| 6/15/19 | | 5,000,000 | | 5,615,550 |
| Clark County Water Reclamation District GO, | | | | |
| Series A, 5.25%, 7/01/21 | | 3,435,000 | | 3,910,232 |
| Series A, 5.25%, 7/01/22 | | 3,120,000 | | 3,534,991 |
| Series B, 5.25%, 7/01/21 | | 3,430,000 | | 3,904,541 |
| Series B, 5.25%, 7/01/22 | | 3,615,000 | | 4,095,831 |
| Washoe County School District GO, Refunding, Series A, 5.00%, 6/01/25 | | 6,130,000 | | 6,880,802 |
| | | | | 50,769,097 |
| New Hampshire 0.2% | | | | |
| Manchester GARB, Series A, AGMC Insured, 5.00%, 1/01/25 | | 7,930,000 | | 8,568,286 |
| New Jersey 8.0% | | | | |
| Hudson County Improvement Authority Facility Lease Revenue, Hudson County Lease Project, | | | | |
| Refunding, AGMC Insured, 5.375%, | | | | |
| 10/01/22 | | 5,220,000 | | 6,006,028 |
| 10/01/23 | | 5,375,000 | | 6,160,341 |
| 10/01/24 | | 2,050,000 | | 2,367,545 |
| New Jersey EDA Revenue, School Facilities Construction, Refunding, | | | | |
| Series DD-1, 5.00%, 12/15/18 | | 20,000,000 | | 23,427,000 |
| Series EE, 5.25%, 9/01/24 | | 12,210,000 | | 13,930,511 |
| New Jersey Health Care Facilities Financing Authority Revenue, Barnabas Health Issue, | | | | |
| Refunding, Series A, 5.00%, | | | | |
| 7/01/20 | | 10,000,000 | | 11,453,300 |
| 7/01/21 | | 20,535,000 | | 23,506,414 |
| New Jersey State COP, Equipment Lease Purchase Agreement, Series A, | | | | |
| 5.25%, 6/15/22 | | 10,000,000 | | 11,256,600 |
| 5.25%, 6/15/23 | | 17,945,000 | | 20,089,248 |
| AMBAC Insured, 5.00%, 6/15/17 | | 5,000,000 | | 5,059,900 |
| New Jersey State Educational Facilities Authority Revenue, Kean University Issue, Refunding, | | | | |
| Series A, 5.00%, 9/01/21 | | 6,000,000 | | 6,840,840 |
| New Jersey State Higher Education Assistance Authority Student Loan Revenue, | | | | |
| Refunding, Series 1A, 5.00%, 12/01/17 | | 3,250,000 | | 3,698,500 |
| Refunding, Series 1A, 5.25%, 12/01/19 | | 2,500,000 | | 2,892,400 |
| |
| | | | | Annual Report | 89 |
| | | | |
| Franklin Tax-Free Trust | | | | |
| |
| Statement of Investments, February 28, 2014 (continued) | | | | |
| |
| |
| Franklin Federal Intermediate-Term Tax-Free Income Fund | | Principal Amount | | Value |
| Municipal Bonds (continued) | | | | |
| New Jersey (continued) | | | | |
| New Jersey State Higher Education Assistance Authority Student Loan Revenue, (continued) | | | | |
| Refunding, Series 1A, 4.75%, 12/01/21 | $ | 6,375,000 | $ | 6,894,945 |
| Refunding, Series 1A, 4.75%, 12/01/22 | | 8,500,000 | | 9,064,485 |
| Series A, 5.375%, 6/01/24 | | 15,000,000 | | 16,104,450 |
| New Jersey State Transportation Trust Fund Authority Revenue, | | | | |
| Transportation Program, Series AA, AGMC Insured, 5.00%, 6/15/26 | | 26,650,000 | | 29,865,855 |
| Transportation System, Refunding, Series A, 5.25%, 12/15/21 | | 10,000,000 | | 11,955,900 |
| Transportation System, Refunding, Series A, 5.50%, 12/15/22 | | 25,000,000 | | 30,090,250 |
| Transportation System, Refunding, Series A, Assured Guaranty, 5.50%, 12/15/22 | | 11,465,000 | | 13,799,389 |
| Transportation System, Series D, AGMC Insured, Pre-Refunded, 5.00%, 6/15/19 | | 5,630,000 | | 5,973,205 |
| New Jersey State Turnpike Authority Turnpike Revenue, Series H, 5.00%, | | | | |
| 1/01/20 | | 10,000,000 | | 11,521,400 |
| 1/01/21 | | 20,000,000 | | 22,685,400 |
| Rutgers State University GO, | | | | |
| Refunding, Series J, 5.00%, 5/01/26 | | 5,000,000 | | 5,808,250 |
| Refunding, Series J, 5.00%, 5/01/27 | | 10,830,000 | | 12,458,832 |
| Series L, 5.00%, 5/01/27 | | 5,270,000 | | 6,062,608 |
| | | | | 318,973,596 |
| New York 9.6% | | | | |
| Erie County IDA School Facility Revenue, City School District of the City of Buffalo Project, | | | | |
| Refunding, 5.00%, 5/01/23 | | 6,235,000 | | 7,204,168 |
| Refunding, 5.00%, 5/01/24 | | 8,000,000 | | 9,155,840 |
| Series A, 5.00%, 5/01/22 | | 14,840,000 | | 16,715,479 |
| Series A, AGMC Insured, 5.75%, 5/01/22 | | 5,000,000 | | 5,716,000 |
| Long Island Power Authority Electric System Revenue, General, | | | | |
| Refunding, Series B, 5.00%, 9/01/26 | | 5,000,000 | | 5,481,250 |
| Refunding, Series E, NATL RE, FGIC Insured, 5.00%, 12/01/18 | | 8,500,000 | | 9,312,005 |
| Series A, NATL RE, FGIC Insured, Pre-Refunded, 5.00%, 12/01/19 | | 7,000,000 | | 7,733,530 |
| MTA Revenue, Transportation, | | | | |
| Refunding, Series F, 5.00%, 11/15/15 | | 1,250,000 | | 1,351,438 |
| Refunding, Series F, 5.00%, 11/15/26 | | 25,000,000 | | 27,848,500 |
| Series A, 5.00%, 11/15/27 | | 3,500,000 | | 3,880,485 |
| Series A, AGMC Insured, 5.00%, 11/15/20 | | 5,000,000 | | 5,640,000 |
| Series A, AGMC Insured, 5.50%, 11/15/20 | | 4,365,000 | | 5,293,261 |
| Series C, 5.00%, 11/15/16 | | 1,150,000 | | 1,291,289 |
| Series C, 5.75%, 11/15/18 | | 15,000,000 | | 16,884,150 |
| Nassau County Local Economic Assistance and FICO Revenue, Catholic Health Services of | | | | |
| Long Island Obligated Group Project, Refunding, 5.00%, 7/01/21 | | 9,000,000 | | 10,093,320 |
| New York City GO, | | | | |
| Fiscal 2008, Refunding, Series G, 5.00%, 8/01/21 | | 7,000,000 | | 7,915,040 |
| Fiscal 2008, Series D, 5.00%, 12/01/21 | | 5,000,000 | | 5,716,250 |
| Fiscal 2012, Refunding, Series I, 5.00%, 8/01/24 | | 11,420,000 | | 13,151,272 |
| Fiscal 2013, Series I, 5.00%, 8/01/24 | | 10,200,000 | | 11,906,256 |
| Refunding, Series D, 5.00%, 8/01/27 | | 10,000,000 | | 11,302,200 |
| Refunding, Series G, 5.00%, 8/01/22 | | 8,000,000 | | 9,461,040 |
| Refunding, Series G, 5.00%, 8/01/23 | | 6,860,000 | | 8,112,636 |
90 | Annual Report
| | | | |
| Franklin Tax-Free Trust | | | | |
| |
| Statement of Investments, February 28, 2014 (continued) | | | | |
| |
| |
| Franklin Federal Intermediate-Term Tax-Free Income Fund | | Principal Amount | | Value |
| Municipal Bonds (continued) | | | | |
| New York (continued) | | | | |
| New York City GO, (continued) | | | | |
| Series F, 4.75%, 1/15/16 | $ | 5,000 | $ | 5,017 |
| Series H, 5.00%, 8/01/16 | | 1,555,000 | | 1,585,431 |
| Series H, 5.00%, 8/01/17 | | 2,345,000 | | 2,390,610 |
| Series H, Pre-Refunded, 5.00%, 8/01/16 | | 1,445,000 | | 1,473,105 |
| Series H, Pre-Refunded, 5.00%, 8/01/17 | | 1,985,000 | | 2,024,005 |
| Series J, Sub Series J-1, AGMC Insured, 5.00%, 6/01/20 | | 35,000 | | 38,436 |
| Series J, Sub Series J-1, AGMC Insured, Pre-Refunded, 5.00%, 6/01/20 | | 9,965,000 | | 11,009,232 |
| Series O, 5.00%, 6/01/19 | | 45,000 | | 47,596 |
| Series O, Pre-Refunded, 5.00%, 6/01/19 | | 4,955,000 | | 5,249,773 |
| New York City Transitional Finance Authority Building Aid Revenue, Fiscal 2009, | | | | |
| Series S-3, 5.00%, 1/15/23 | | 5,000,000 | | 5,691,450 |
| Series S-4, 5.00%, 1/15/21 | | 4,665,000 | | 5,314,741 |
| New York City Transitional Finance Authority Revenue, Future Tax Secured, Subordinate, | | | | |
| Fiscal 2003, Refunding, Sub Series A-1, 5.00%, 11/01/23 | | 11,500,000 | | 13,447,870 |
| Fiscal 2011, Series C, 5.00%, 11/01/23 | | 12,805,000 | | 14,798,611 |
| Series C, 5.00%, 11/01/24 | | 7,620,000 | | 8,830,285 |
| New York State Dormitory Authority Lease Revenue, Third General Resolution, State University | | | | |
| Educational Facilities Issue, Refunding, Series A, 5.00%, 5/15/24 | | 7,000,000 | | 8,070,510 |
| New York State Dormitory Authority Revenues, | | | | |
| Non-State Supported Debt, School Districts Revenue, Bond Financing Program, Series A, | | | | |
| Assured Guaranty, 5.00%, 10/01/24 | | 5,000,000 | | 5,488,000 |
| State Supported Debt, City University System, Consolidated Fifth General Resolution, | | | | |
| Series A, NATL RE, FGIC Insured, 5.50%, 7/01/23 | | 7,915,000 | | 9,621,157 |
| State Supported Debt, Mental Health Services Facilities Improvement, Refunding, | | | | |
| Series A-1, 5.50%, 2/15/18 | | 10,000,000 | | 11,702,300 |
| State Supported Debt, Mental Health Services Facilities Improvement, Refunding, | | | | |
| Series A-1, 5.00%, 2/15/19 | | 3,245,000 | | 3,787,629 |
| New York State Local Government Assistance Corp. Revenue, sub. lien, Refunding, Series B, | | | | |
| 5.00%, 4/01/21 | | 12,000,000 | | 14,138,880 |
| New York State Thruway Authority General Revenue, | | | | |
| Refunding, Series H, NATL RE, FGIC Insured, 5.00%, 1/01/22 | | 10,000,000 | | 11,184,500 |
| Series I, 5.00%, 1/01/26 | | 10,000,000 | | 11,148,600 |
| New York State Thruway Authority Revenue, Local Highway and Bridge Service Contract, | | | | |
| Refunding, 5.00%, 4/01/19 | | 9,570,000 | | 11,287,049 |
| New York State Urban Development Corp. Revenue, Service Contract, Refunding, Series A, | | | | |
| Sub Series A-1, 5.00%, 1/01/20 | | 6,500,000 | | 7,652,515 |
| Rockland County Solid Waste Management Authority Revenue, Refunding, Series A, | | | | |
| Assured Guaranty, 5.375%, 12/15/18 | | 5,365,000 | | 6,271,310 |
| Suffolk County EDC Revenue, Catholic Health Services of Long Island Obligated Group Project, | | | | |
| Refunding, 5.00%, 7/01/22 | | 10,000,000 | | 10,974,600 |
| | | | | 384,398,621 |
| North Carolina 1.6% | | | | |
| Buncombe County Limited Obligation Revenue, Series A, 5.00%, 6/01/28 | | 5,000,000 | | 5,751,950 |
| The Charlotte-Mecklenburg Hospital Authority Health Care Revenue, Carolinas HealthCare | | | | |
| System, Series A, AGMC Insured, 5.00%, 1/15/22 | | 10,000,000 | | 10,795,200 |
Annual Report | 91
| | | | | |
| Franklin Tax-Free Trust | | | | | |
| |
| Statement of Investments, February 28, 2014 (continued) | | | | | |
| |
| |
| Franklin Federal Intermediate-Term Tax-Free Income Fund | | | Principal Amount | | Value |
| Municipal Bonds (continued) | | | | | |
| North Carolina (continued) | | | | | |
| North Carolina Eastern Municipal Power Agency Power System Revenue, | | | | | |
| Refunding, Series A, 5.00%, 1/01/21 | | $ | 10,000,000 | $ | 11,558,800 |
| Refunding, Series A, Assured Guaranty, 5.25%, 1/01/19 | | | 15,000,000 | | 17,184,000 |
| Series C, Assured Guaranty, 6.00%, 1/01/19 | | | 2,150,000 | | 2,357,905 |
| North Carolina Municipal Power Agency No. 1 Catawba Electric Revenue, Refunding, | | | | | |
| Series A, 5.25%, 1/01/20 | | | 4,500,000 | | 5,142,510 |
| Series B, 5.00%, 1/01/20 | | | 8,000,000 | | 9,418,480 |
| Oak Island Enterprise System Revenue, Assured Guaranty, 5.50%, 6/01/23 | | | 1,735,000 | | 1,950,019 |
| | | | | | 64,158,864 |
| Ohio 6.0% | | | | | |
| Akron Income Tax Revenue, Community Learning Centers, Refunding, Series A, 5.00%, | | | | | |
| 12/01/24 | | | 5,265,000 | | 6,094,975 |
| 12/01/25 | | | 6,645,000 | | 7,639,823 |
| 12/01/26 | | | 8,240,000 | | 9,389,562 |
| American Municipal Power-Ohio Inc. Revenue, Prairie State Energy Campus Project, | | | | | |
| Refunding, Series A, 5.25%, | | | | | |
| 2/15/20 | | | 6,000,000 | | 6,765,180 |
| 2/15/21 | | | 11,500,000 | | 12,831,930 |
| Cleveland Airport System Revenue, Refunding, Series A, AGMC Insured, 5.00%, | | | | | |
| 1/01/25 | | | 5,000,000 | | 5,420,050 |
| 1/01/26 | | | 5,000,000 | | 5,381,450 |
| Cleveland Municipal School District GO, School Improvement, AGMC Insured, Pre-Refunded, | | | | | |
| 5.00%, | | | | | |
| 12/01/14 | | | 1,915,000 | | 1,937,080 |
| 12/01/15 | | | 1,510,000 | | 1,527,410 |
| 12/01/16 | | | 1,400,000 | | 1,416,142 |
| Cleveland Water Revenue, second lien, Refunding, Series A, 5.00%, | | | | | |
| 1/01/23 | | | 1,840,000 | | 2,142,183 |
| 1/01/24 | | | 1,750,000 | | 2,020,043 |
| 1/01/25 | | | 2,500,000 | | 2,857,450 |
| 1/01/26 | | | 2,000,000 | | 2,266,520 |
| Cuyahoga County EDR, Recovery Zone Facility, Medical Mart/Convention Center Project, | | | | | |
| Series F, 5.00%, | | | | | |
| 12/01/20 | | | 7,000,000 | | 8,140,160 |
| 12/01/21 | | | 7,300,000 | | 8,390,912 |
| Hamilton City School District GO, School Improvement, AGMC Insured, 5.00%, 12/01/24 | | | 5,000,000 | | 5,359,000 |
| Hamilton County Sewer System Revenue, The Metropolitan Sewer District of Greater Cincinnati, | | | | | |
| Improvement and Refunding, Series A, 5.00%, | | | | | |
| 12/01/24 | | | 2,500,000 | | 2,968,225 |
| 12/01/25 | | | 2,400,000 | | 2,815,944 |
| 12/01/26 | | | 4,000,000 | | 4,645,440 |
| 12/01/27 | | | 5,000,000 | | 5,752,250 |
| 12/01/28 | | | 3,000,000 | | 3,427,050 |
| Kent State University Revenues, General Receipts, Series A, 5.00%, | | | | | |
| 5/01/23 | | | 1,200,000 | | 1,378,056 |
| 5/01/24 | | | 1,500,000 | | 1,707,405 |
| 5/01/25 | | | 1,500,000 | | 1,691,250 |
| 5/01/26 | | | 1,600,000 | | 1,788,176 |
92 | Annual Report
| | | | | |
| | Franklin Tax-Free Trust | | | | |
| |
| | Statement of Investments, February 28, 2014 (continued) | | | | |
| |
| |
| | Franklin Federal Intermediate-Term Tax-Free Income Fund | | Principal Amount | | Value |
| | Municipal Bonds (continued) | | | | |
| | Ohio (continued) | | | | |
| | Lakewood City School District GO, School Improvement, Refunding, AGMC Insured, 4.50%, | | | | |
| | 12/01/22 | $ | 2,900,000 | $ | 3,139,134 |
| | Mason City School District GO, School Improvement, Refunding, NATL RE, FGIC Insured, | | | | |
| | 5.00%, 12/01/15 | | 2,670,000 | | 2,888,940 |
| | Montgomery County Revenue, Miami Valley Hospital, Mandatory Put 11/15/14, Refunding, | | | | |
| | Series B, 5.25%, 11/15/39 | | 4,000,000 | | 4,103,160 |
| | Nordonia Hills City School District GO, School Improvement, Refunding, NATL RE, | | | | |
| | FGIC Insured, 4.50%, 12/01/21 | | 2,360,000 | | 2,495,700 |
| | Ohio State Building Authority Revenue, State Facilities, Administrative Building Fund Projects, | | | | |
| | Refunding, Series C, 5.00%, 10/01/22 | | 5,780,000 | | 6,639,313 |
| | Ohio State GO, Higher Education, Refunding, Series A, 5.00%, | | | | |
| | 2/01/24 | | 8,585,000 | | 10,046,510 |
| | 2/01/25 | | 7,000,000 | | 8,140,230 |
| | Ohio State Turnpike Commission Turnpike Revenue, Refunding, Series A, NATL RE, | | | | |
| | FGIC Insured, 5.50%, 2/15/24 | | 10,000,000 | | 12,145,200 |
| | Toledo City School District GO, School Facilities Improvement, Refunding, Series B, 5.00%, | | | | |
| | 12/01/24 | | 2,920,000 | | 3,392,690 |
| | 12/01/25 | | 4,125,000 | | 4,741,192 |
| | 12/01/26 | | 4,340,000 | | 4,941,871 |
| | 12/01/27 | | 4,565,000 | | 5,146,079 |
| | Toledo Water System Revenue, Improvement and Refunding, 5.00%, | | | | |
| | 11/15/25 | | 4,000,000 | | 4,635,000 |
| | 11/15/26 | | 6,140,000 | | 7,045,650 |
| | 11/15/27 | | 6,450,000 | | 7,329,651 |
| | 11/15/28 | | 6,570,000 | | 7,426,991 |
| | University of Cincinnati General Receipts Revenue, Series C, | | | | |
| | 5.00%, 6/01/25 | | 3,010,000 | | 3,454,667 |
| | Assured Guaranty, 5.00%, 6/01/21 | | 11,810,000 | | 13,645,274 |
| | Assured Guaranty, 5.00%, 6/01/22 | | 11,675,000 | | 13,319,774 |
| | Youngstown GO, AMBAC Insured, 6.125%, 12/01/15 | | 555,000 | | 585,436 |
| | | | | | 241,016,128 |
| | Oregon 0.9% | | | | |
| | Deschutes County Hospital Facilities Authority Hospital Revenue, Cascade Healthcare | | | | |
| | Community Inc., Refunding, 7.375%, 1/01/23 | | 2,000,000 | | 2,424,020 |
| | Oregon State Department of Administrative Services COP, Series A, NATL RE, FGIC Insured, | | | | |
| Pre-Refunded, 5.00%, 11/01/19 | | 2,340,000 | | 2,628,686 |
| | Oregon State Department of Transportation Highway User Tax Revenue, senior lien, | | | | |
| | Refunding, Series A, 5.00%, 11/15/25 | | 10,000,000 | | 11,695,300 |
| | Series A, 5.00%, 11/15/22 | | 5,840,000 | | 6,746,952 |
| | Portland Sewer System Revenue, second lien, Series B, NATL Insured, 5.00%, | | | | |
| | 6/15/18 | | 3,135,000 | | 3,415,175 |
| | 6/15/19 | | 3,290,000 | | 3,578,566 |
| | Portland Water System Revenue, second lien, Refunding, Series A, 5.00%, 10/01/25 | | 5,000,000 | | 5,880,200 |
| | | | | | 36,368,899 |
Annual Report | 93
| | | | | |
| Franklin Tax-Free Trust | | | | | |
| |
| Statement of Investments, February 28, 2014 (continued) | | | | | |
| |
| |
| Franklin Federal Intermediate-Term Tax-Free Income Fund | | | Principal Amount | | Value |
| Municipal Bonds (continued) | | | | | |
| Pennsylvania 4.5% | | | | | |
| Allegheny County Hospital Development Authority Revenue, University of Pittsburgh Medical | | | | | |
| Center, | | | | | |
| Series A, 5.00%, 5/15/19 | | $ | 9,000,000 | $ | 10,538,820 |
| Series A, 5.00%, 5/15/20 | | | 7,500,000 | | 8,814,075 |
| Series B, 5.00%, 6/15/18 | | | 5,000,000 | | 5,055,250 |
| Commonwealth Financing Authority Revenue, Series C-1, AGMC Insured, 5.00%, | | | | | |
| 6/01/22 | | | 4,130,000 | | 4,682,016 |
| 6/01/23 | | | 4,345,000 | | 4,877,958 |
| Lancaster County Solid Waste Management Authority Solid Waste Disposal Revenue, Series A, | | | | | |
| 5.25%, | | | | | |
| 12/15/25 | | | 5,345,000 | | 6,132,693 |
| 12/15/26 | | | 5,835,000 | | 6,632,644 |
| Pennsylvania State Turnpike Commission Turnpike Revenue, | | | | | |
| Series B, 5.00%, 12/01/19 | | | 32,230,000 | | 37,770,982 |
| Series E, 5.00%, 12/01/24 | | | 5,000,000 | | 5,623,350 |
| Series E, 5.00%, 12/01/25 | | | 10,000,000 | | 11,145,000 |
| Subordinate, Refunding, Series C, Sub Series C-1, Assured Guaranty, 6.00%, 6/01/23 | | | 10,000,000 | | 11,622,000 |
| Subordinate, Series A, Assured Guaranty, 5.00%, 6/01/22 | | | 6,070,000 | | 6,760,098 |
| Philadelphia GO, Refunding, Series A, Assured Guaranty, 5.25%, 8/01/22 | | | 20,000,000 | | 22,699,400 |
| Philadelphia Municipal Authority Lease Revenue, 6.00%, 4/01/22 | | | 7,065,000 | | 8,016,443 |
| Philadelphia Water and Wastewater Revenue, | | | | | |
| Refunding, Series A, AGMC Insured, 5.00%, 6/15/17 | | | 10,000,000 | | 11,390,900 |
| Refunding, Series A, AGMC Insured, 5.00%, 6/15/18 | | | 5,000,000 | | 5,828,550 |
| Refunding, Series A, AGMC Insured, 5.00%, 6/15/19 | | | 5,000,000 | | 5,929,350 |
| Series A, 5.00%, 1/01/20 | | | 1,210,000 | | 1,395,299 |
| Series A, 5.25%, 1/01/21 | | | 3,655,000 | | 4,185,706 |
| Series A, 5.25%, 1/01/22 | | | 2,330,000 | | 2,623,813 |
| | | | | | 181,724,347 |
| South Carolina 1.5% | | | | | |
| Anderson Water and Sewer System Revenue, Refunding, AGMC Insured, 5.00%, | | | | | |
| 7/01/22 | | | 2,555,000 | | 3,025,835 |
| 7/01/23 | | | 2,695,000 | | 3,169,509 |
| 7/01/24 | | | 2,825,000 | | 3,310,872 |
| 7/01/25 | | | 2,965,000 | | 3,458,109 |
| Berkeley County Utility Revenue, Combined Utility System, Refunding, 5.00%, | | | | | |
| 6/01/25 | | | 3,665,000 | | 4,278,228 |
| 6/01/26 | | | 1,700,000 | | 1,968,039 |
| SCAGO Educational Facilities Corp. for Pickens School District Revenue, Installment Purchase, | | | | | |
| School District of Pickens County Project, AGMC Insured, 5.00%, 12/01/18 | | | 5,000,000 | | 5,563,400 |
| South Carolina Jobs EDA Hospital Revenue, Palmetto Health, Refunding and Improvement, | | | | | |
| 5.375%, 8/01/22 | | | 6,000,000 | | 6,658,620 |
| South Carolina State Transportation Infrastructure Bank Revenue, Refunding, Series B, | | | | | |
| AGMC Insured, 5.00%, | | | | | |
| 10/01/25 | | | 12,935,000 | | 14,657,812 |
| 10/01/26 | | | 13,440,000 | | 15,101,453 |
| | | | | | 61,191,877 |
94 | Annual Report
| | | | |
| Franklin Tax-Free Trust | | | | |
| |
| Statement of Investments, February 28, 2014 (continued) | | | | |
| |
| |
| Franklin Federal Intermediate-Term Tax-Free Income Fund | | Principal Amount | | Value |
| Municipal Bonds (continued) | | | | |
| Tennessee 0.7% | | | | |
| Memphis GO, General Improvement, Refunding, Series A, 5.00%, 4/01/22 | $ | 15,805,000 | $ | 18,945,137 |
| Metropolitan Government of Nashville and Davidson County GO, Improvement, Refunding, | | | | |
| Series A, 5.00%, 1/01/26 | | 5,000,000 | | 5,862,950 |
| Metropolitan Government of Nashville and Davidson County Water and Sewer Revenue, | | | | |
| Refunding, 5.00%, | | | | |
| 7/01/26 | | 1,675,000 | | 1,954,491 |
| 7/01/27 | | 1,800,000 | | 2,079,702 |
| | | | | 28,842,280 |
| Texas 6.4% | | | | |
| Austin Water and Wastewater System Revenue, Refunding, | | | | |
| 5.00%, 11/15/26 | | 4,835,000 | | 5,566,004 |
| 5.00%, 11/15/27 | | 4,000,000 | | 4,581,720 |
| Series A, 5.00%, 11/15/28 | | 5,000,000 | | 5,703,200 |
| Board of Regents of the University of Houston System Revenue, Consolidated, Refunding, | | | | |
| Series A, 5.00%, 2/15/27 | | 5,000,000 | | 5,632,600 |
| Brownsville Utility System Revenue, | | | | |
| AGMC insured, Pre-Refunded, 5.00%, 9/01/22 | | 5,840,000 | | 6,259,253 |
| Refunding and Improvement, AGMC Insured, 5.00%, 9/01/22 | | 2,615,000 | | 2,760,812 |
| Clear Creek ISD, GO, Refunding, Series A, 5.00%, | | | | |
| 2/15/25 | | 11,370,000 | | 13,219,558 |
| 2/15/26 | | 12,060,000 | | 13,836,197 |
| Dallas County Utility and Reclamation District GO, Refunding, | | | | |
| Series A, AMBAC Insured, 5.15%, 2/15/21 | | 3,025,000 | | 3,240,471 |
| Series B, AMBAC Insured, 5.15%, 2/15/21 | | 8,025,000 | | 8,596,621 |
| Dallas Waterworks and Sewer System Revenue, Refunding, AMBAC Insured, 4.50%, | | | | |
| 10/01/19 | | 10,000,000 | | 11,076,400 |
| Dallas/Fort Worth International Airport Revenue, Joint, Refunding, | | | | |
| Series A, 5.00%, 11/01/23 | | 1,500,000 | | 1,666,035 |
| Series A, 5.00%, 11/01/24 | | 1,000,000 | | 1,109,850 |
| Series D, 5.25%, 11/01/27 | | 5,000,000 | | 5,733,500 |
| Series D, 5.25%, 11/01/28 | | 2,100,000 | | 2,391,417 |
| Fort Worth GO, General Purpose, Refunding and Improvement, 5.00%, | | | | |
| 3/01/25 | | 6,000,000 | | 6,971,640 |
| 3/01/26 | | 6,790,000 | | 7,847,407 |
| Frisco GO, Collin and Denton Counties, Refunding and Improvement, 5.00%, 2/15/25 | | 5,000,000 | | 5,843,400 |
| Harris County Hospital District Revenue, senior lien, Refunding, Series A, NATL Insured, | | | | |
| 5.00%, 2/15/22 | | 4,165,000 | | 4,442,847 |
| Houston GO, Public Improvement, Refunding, Series A, 5.00%, 3/01/22 | | 10,000,000 | | 11,502,500 |
| Lower Colorado River Authority Transmission Contract Revenue, LCRA Transmission Services | | | | |
| Corp. Project, Refunding, | | | | |
| Series A, 5.00%, 5/15/24 | | 6,000,000 | | 6,738,060 |
| Series B, 5.00%, 5/15/24 | | 10,620,000 | | 11,926,366 |
| North Texas Tollway Authority Revenue, Special Projects System, Series D, 5.00%, | | | | |
| 9/01/24 | | 12,000,000 | | 13,824,840 |
| Sabine River Authority PCR, Southwestern Electric Power Co. Project, Refunding, | | | | |
| NATL Insured, 4.95%, 3/01/18 | | 15,000,000 | | 16,162,050 |
| San Antonio Electric and Gas Revenue, Refunding, 5.25%, 2/01/25 | | 27,000,000 | | 33,065,010 |
Annual Report | 95
| | | | |
| Franklin Tax-Free Trust | | | | |
| |
| Statement of Investments, February 28, 2014 (continued) | | | | |
| |
| |
| Franklin Federal Intermediate-Term Tax-Free Income Fund | | Principal Amount | | Value |
| Municipal Bonds (continued) | | | | |
| Texas (continued) | | | | |
| Tyler Health Facilities Development Corp. Hospital Revenue, East Texas Medical Center | | | | |
| Regional Healthcare System Project, Refunding and Improvement, Series A, 5.25%, | | | | |
| 11/01/22 | $ | 5,000,000 | $ | 5,206,850 |
| 11/01/23 | | 5,000,000 | | 5,167,350 |
| aUniversity of Texas Permanent University Fund Revenue, Series B, 5.00%, 7/01/27 | | 10,000,000 | | 11,859,900 |
| Williamson County GO, Refunding, 5.00%, | | | | |
| 2/15/23 | | 6,235,000 | | 7,416,034 |
| 2/15/25 | | 13,780,000 | | 16,096,693 |
| | | | | 255,444,585 |
| Utah 0.6% | | | | |
| Salt Lake County College Revenue, Westminster College Project, Refunding, 5.00%, | | | | |
| 10/01/19 | | 2,585,000 | | 2,652,934 |
| Utah State Board of Regents Student Loan Revenue, Refunding, Series EE-2, 5.00%, | | | | |
| 11/01/20 | | 9,000,000 | | 10,656,000 |
| 11/01/21 | | 9,000,000 | | 10,449,180 |
| | | | | 23,758,114 |
| Virginia 1.1% | | | | |
| Norfolk Water Revenue, Refunding, 5.00%, | | | | |
| 11/01/24 | | 6,145,000 | | 7,222,341 |
| 11/01/25 | | 6,000,000 | | 7,008,660 |
| Virginia Beach Development Authority Public Facility Revenue, Refunding, Series B, 5.00%, | | | | |
| 8/01/19 | | 12,635,000 | | 14,865,204 |
| 8/01/20 | | 13,450,000 | | 15,873,287 |
| | | | | 44,969,492 |
| Washington 1.2% | | | | |
| Seattle Municipal Light and Power Revenue, Refunding and Improvement, Series B, 5.00%, | | | | |
| 2/01/19 | | 6,805,000 | | 8,076,106 |
| 2/01/20 | | 7,000,000 | | 8,375,220 |
| Washington State GO, Various Purpose, Series D, 5.00%, | | | | |
| 2/01/24 | | 13,285,000 | | 15,477,556 |
| 2/01/25 | | 13,955,000 | | 16,135,469 |
| | | | | 48,064,351 |
| Wisconsin 0.3% | | | | |
| Wisconsin State Transportation Revenue, Series 1, 5.00%, 7/01/24 | | 10,000,000 | | 11,687,400 |
| U.S. Territories 1.4% | | | | |
| Guam 0.1% | | | | |
| Guam Government Limited Obligation Revenue, Section 30, Series A, 5.50%, | | | | |
| 12/01/18 | | 1,540,000 | | 1,681,772 |
| 12/01/19 | | 1,025,000 | | 1,122,324 |
| | | | | 2,804,096 |
| Puerto Rico 1.3% | | | | |
| Puerto Rico Commonwealth GO, Public Improvement, | | | | |
| Refunding, Series A, 5.50%, 7/01/18 | | 8,455,000 | | 7,237,987 |
| Series A, 5.00%, 7/01/23 | | 4,000,000 | | 3,161,480 |
| Series A, 5.25%, 7/01/23 | | 3,500,000 | | 2,881,970 |
| Series A, FGIC Insured, 5.50%, 7/01/21 | | 2,500,000 | | 2,106,250 |
| 96 | Annual Report | | | | |
| | | | |
| Franklin Tax-Free Trust | | | | |
| |
| Statement of Investments, February 28, 2014 (continued) | | | | |
| |
| |
| Franklin Federal Intermediate-Term Tax-Free Income Fund | | Principal Amount | | Value |
| Municipal Bonds (continued) | | | | |
| U.S. Territories (continued) | | | | |
| Puerto Rico (continued) | | | | |
| Puerto Rico Commonwealth Highways and Transportation Authority Transportation Revenue, | | | | |
| Series K, 5.00%, 7/01/19 | $ | 5,000,000 | $ | 3,848,150 |
| Puerto Rico Commonwealth Infrastructure Financing Authority Special Tax Revenue, | | | | |
| Refunding, Series C, AMBAC Insured, 5.50%, 7/01/24 | | 10,000,000 | | 8,590,500 |
| Puerto Rico Electric Power Authority Power Revenue, Refunding, | | | | |
| Series DDD, 5.00%, 7/01/21 | | 8,745,000 | | 6,578,864 |
| Series SS, NATL Insured, 5.00%, 7/01/24 | | 10,000,000 | | 9,137,000 |
| Series ZZ, 5.25%, 7/01/19 | | 8,000,000 | | 6,459,520 |
| Puerto Rico Sales Tax FICO Sales Tax Revenue, Senior Series C, 5.00%, 8/01/22 | | 3,500,000 | | 3,465,070 |
| | | | | 53,466,791 |
| | | | | 56,270,887 |
| Total Municipal Bonds before Short Term Investments | | | | |
| (Cost $3,338,975,399) | | | | 3,528,272,837 |
| Short Term Investments 5.2% | | | | |
| Municipal Bonds 5.2% | | | | |
| Florida 0.6% | | | | |
| bSarasota County Public Hospital District Revenue, Sarasota Memorial Hospital Project, | | | | |
| Refunding, Series B, Daily VRDN and Put, 0.03%, 7/01/37 | | 23,485,000 | | 23,485,000 |
| Kentucky 0.6% | | | | |
| bKentucky Economic Development Finance Authority Hospital Revenue, Baptist Healthcare | | | | |
| System, Refunding, Series B-1, Daily VRDN and Put, 0.04%, 8/15/38 | | 25,000,000 | | 25,000,000 |
| Maryland 0.2% | | | | |
| bMontgomery County GO, Consolidated Public Improvement, BAN, Refunding, Series A, | | | | |
| Daily VRDN and Put, 0.03%, 6/01/26 | | 6,750,000 | | 6,750,000 |
| Minnesota 0.9% | | | | |
| bMinneapolis and St. Paul Housing and RDA Health Care System Revenue, | | | | |
| Allina Health System, Refunding, Series B-1, Daily VRDN and Put, 0.04%, 11/15/35 | | 10,000,000 | | 10,000,000 |
| Health Care Facilities, Children’s Hospitals and Clinics, Series B, AGMC Insured, | | | | |
| Daily VRDN and Put, 0.04%, 8/15/25 | | 25,150,000 | | 25,150,000 |
| | | | | 35,150,000 |
| New York 0.5% | | | | |
| bNew York City GO, Fiscal 2008, Series L, Sub Series L-6, Daily VRDN and Put, 0.03%, | | | | |
| 4/01/32 | | 20,190,000 | | 20,190,000 |
| Ohio 0.0%† | | | | |
| bAllen County Hospital Facilities Revenue, Catholic Healthcare Partners, Series A, Daily VRDN | | | | |
| and Put, 0.04%, 10/01/31 | | 1,900,000 | | 1,900,000 |
| Pennsylvania 1.5% | | | | |
| bGeisinger Authority Health System Revenue, Geisinger Health System, | | | | |
| Refunding, Series A, Daily VRDN and Put, 0.03%, 5/15/35 | | 22,650,000 | | 22,650,000 |
| Series C, Daily VRDN and Put, 0.02%, 8/01/28 | | 36,720,000 | | 36,720,000 |
| | | | | 59,370,000 |
Annual Report | 97
Franklin Tax-Free Trust
Statement of Investments, February 28, 2014 (continued)
| | | | |
| Franklin Federal Intermediate-Term Tax-Free Income Fund | | Principal Amount | | Value |
| Short Term Investments (continued) | | | | |
| Municipal Bonds (continued) | | | | |
| Virginia 0.9% | | | | |
| bRoanoke IDA Hospital Revenue, Carilion Health System Obligated Group, Series A, | | | | |
| Sub Series A-1, AGMC Insured, Daily VRDN and Put, 0.05%, 7/01/36 | $ | 16,000,000 | $ | 16,000,000 |
| Sub Series A-2, AGMC Insured, Daily VRDN and Put, 0.05%, 7/01/36 | | 18,205,000 | | 18,205,000 |
| | | | | 34,205,000 |
| Total Short Term Investments (Cost $206,050,000) | | | | 206,050,000 |
| Total Investments (Cost $3,545,025,399) 93.4% | | | | 3,734,322,837 |
| Other Assets, less Liabilities 6.6% | | | | 264,430,560 |
| Net Assets 100.0% | | | $ | 3,998,753,397 |
See Abbreviations on page 200.
†Rounds to less than 0.1% of net assets.
aSecurity purchased on a when-issued basis. See Note 1(b).
bVariable rate demand notes (VRDNs) are tax-exempt obligations which contain a floating or variable interest rate adjustment formula and an unconditional right of demand to
receive payment of the principal balance plus accrued interest at specified dates. The coupon rate shown represents the rate at period end.
98 | The accompanying notes are an integral part of these financial statements. | Annual Report
| | | | | | | | | | | | | | | | |
| Franklin Tax-Free Trust | | | | | | | | | | | | | | | |
| Financial Highlights | | | | | | | | | | | | | | | | |
| |
| Franklin Federal Limited-Term Tax-Free Income Fund | | | | | | | | | | | | | | | |
| | | | | | | Year Ended February 28, | | | | |
| Class A | | | 2014 | | | 2013 | | | 2012 | a | | 2011 | | | 2010 | |
| Per share operating performance | | | | | | | | | | | | | | | | |
| (for a share outstanding throughout the year) | | | | | | | | | | | | | | | | |
| Net asset value, beginning of year | | $ | 10.56 | | $ | 10.60 | | $ | 10.29 | | $ | 10.35 | | $ | 10.11 | |
| Income from investment operationsb: | | | | | | | | | | | | | | | | |
| Net investment incomec | | | 0.13 | | | 0.18 | | | 0.20 | | | 0.21 | | | 0.24 | |
| Net realized and unrealized gains (losses) | | | (0.05 | ) | | (0.04 | ) | | 0.31 | | | (0.05 | ) | | 0.25 | |
| Total from investment operations | | | 0.08 | | | 0.14 | | | 0.51 | | | 0.16 | | | 0.49 | |
| Less distributions from net investment income | | (0.13 | ) | | (0.18 | ) | | (0.20 | ) | | (0.22 | ) | | (0.25 | ) |
| Net asset value, end of year | | $ | 10.51 | | $ | 10.56 | | $ | 10.60 | | $ | 10.29 | | $ | 10.35 | |
| |
| Total returnd | | | 0.76 | % | | 1.32 | % | | 4.95 | % | | 1.52 | % | | 4.86 | % |
| |
| Ratios to average net assets | | | | | | | | | | | | | | | | |
| Expenses before waiver and payments by affiliates | | 0.84 | % | | 0.84 | % | | 0.85 | % | | 0.87 | % | | 0.92 | % |
| Expenses net of waiver and payments by affiliates | | 0.60 | % | | 0.60 | % | | 0.57 | % | | 0.50 | % | | 0.50 | % |
| Net investment income | | | 1.25 | % | | 1.67 | % | | 1.88 | % | | 2.01 | % | | 2.33 | % |
| |
| Supplemental data | | | | | | | | | | | | | | | | |
| Net assets, end of year (000’s) | | $ | 977,274 | | $ | 778,018 | | $ | 682,132 | | $ | 640,865 | | $ | 380,522 | |
| Portfolio turnover rate | | | 20.20 | % | | 10.94 | % | | 5.72 | % | | 7.40 | % | | 15.53 | % |
aFor the year ended February 29.
bThe amount shown for a share outstanding throughout the period may not correlate with the Statement of Operations for the period due to the timing of sales and repurchases of
the Fund shares in relation to income earned and/or fluctuating market value of the investments of the Fund.
cBased on average daily shares outstanding.
dTotal return does not reflect sales commissions or contingent deferred sales charges, if applicable.
Annual Report | The accompanying notes are an integral part of these financial statements. | 99
| | | | | | | | | | | | |
| Franklin Tax-Free Trust | | | | | | | | | | | | |
| Financial Highlights (continued) | | | | | | | | | | | | |
| |
| Franklin Federal Limited-Term Tax-Free Income Fund | | | | | | | | | | | | |
| | | | | | Year Ended February 28, | | | | |
| Advisor Class | | 2014 | | | 2013 | | | 2012 | a | | 2011 | b |
| Per share operating performance | | | | | | | | | | | | |
| (for a share outstanding throughout the year) | | | | | | | | | | | | |
| Net asset value, beginning of year | $ | 10.55 | | $ | 10.59 | | $ | 10.29 | | $ | 10.27 | |
| Income from investment operationsc: | | | | | | | | | | | | |
| Net investment incomed | | 0.15 | | | 0.19 | | | 0.21 | | | 0.02 | |
| Net realized and unrealized gains (losses) | | (0.06 | ) | | (0.04 | ) | | 0.30 | | | 0.01 | |
| Total from investment operations | | 0.09 | | | 0.15 | | | 0.51 | | | 0.03 | |
| Less distributions from net investment income | | (0.14 | ) | | (0.19 | ) | | (0.21 | ) | | (0.01 | ) |
| Net asset value, end of year | $ | 10.50 | | $ | 10.55 | | $ | 10.59 | | $ | 10.29 | |
| |
| Total returne | | 0.91 | % | | 1.47 | % | | 5.00 | % | | 0.33 | % |
| |
| Ratios to average net assetsf | | | | | | | | | | | | |
| Expenses before waiver and payments by affiliates | | 0.69 | % | | 0.69 | % | | 0.70 | % | | 0.72 | % |
| Expenses net of waiver and payments by affiliates | | 0.45 | % | | 0.45 | % | | 0.42 | % | | 0.35 | % |
| Net investment income | | 1.40 | % | | 1.82 | % | | 2.03 | % | | 2.16 | % |
| |
| Supplemental data | | | | | | | | | | | | |
| Net assets, end of year (000’s) | $ | 183,518 | | $ | 108,836 | | $ | 80,569 | | $ | 29,056 | |
| Portfolio turnover rate | | 20.20 | % | | 10.94 | % | | 5.72 | % | | 7.40 | % |
aFor the year ended February 29.
bFor the period February 1, 2011 (effective date) to February 28, 2011.
cThe amount shown for a share outstanding throughout the period may not correlate with the Statement of Operations for the period due to the timing of sales and repurchases of
the Fund shares in relation to income earned and/or fluctuating market value of the investments of the Fund.
dBased on average daily shares outstanding.
eTotal return is not annualized for periods less than one year.
fRatios are annualized for periods less than one year.
100 | The accompanying notes are an integral part of these financial statements. | Annual Report
| | | | | |
| | Franklin Tax-Free Trust | | | | |
| |
| | Statement of Investments, February 28, 2014 | | | | |
| |
| |
| | Franklin Federal Limited-Term Tax-Free Income Fund | | Principal Amount | | Value |
| | Municipal Bonds 82.7% | | | | |
| | Alabama 0.7% | | | | |
| | Alabama State University Revenue, General Tuition and Fee, Assured Guaranty, 5.00%, | | | | |
| | 9/01/14 | $ | 665,000 | $ | 679,690 |
| | 9/01/15 | | 700,000 | | 741,601 |
| | 9/01/16 | | 730,000 | | 798,576 |
| | East Alabama Health Care Authority Health Care Facilities Revenue, Mandatory Put 9/01/18, | | | | |
| | Series A, 5.25%, 9/01/36 | | 1,000,000 | | 1,112,940 |
| | Mobile IDR, PCR, Alabama Power Co. Barry Plant Project, Mandatory Put 3/20/17, Series A, | | | | |
| | 1.65%, 6/01/34 | | 5,000,000 | | 5,028,150 |
| | | | | | 8,360,957 |
| | Alaska 0.5% | | | | |
| | Valdez Marine Terminal Revenue, BP Pipelines Inc. Project, Refunding, Series A, 5.00%, | | | | |
| | 1/01/16 | | 5,000,000 | | 5,403,800 |
| | Arizona 4.1% | | | | |
| | Arizona State COP, Department of Administration, Series B, AGMC Insured, 5.00%, | | | | |
| | 10/01/15 | | 11,975,000 | | 12,837,439 |
| | Phoenix Civic Improvement Corp. Transit Excise Tax Revenue, Light Rail Project, | | | | |
| | AMBAC Insured, Pre-Refunded, 5.00%, 7/01/16 | | 17,000,000 | | 17,264,350 |
| | AMBAC Insured, Pre-Refunded, 5.00%, 7/01/17 | | 2,805,000 | | 2,848,618 |
| | Refunding, 3.00%, 7/01/17 | | 6,465,000 | | 6,963,516 |
| | Phoenix Civic Improvement Corp. Wastewater System Revenue, junior lien, Refunding, | | | | |
| | NATL Insured, 5.00%, 7/01/19 | | 3,840,000 | | 3,900,096 |
| | Tucson COP, Refunding, AGMC Insured, | | | | |
| | 2.00%, 7/01/16 | | 1,200,000 | | 1,220,256 |
| | 3.00%, 7/01/17 | | 1,250,000 | | 1,310,525 |
| | 3.00%, 7/01/18 | | 1,195,000 | | 1,253,340 |
| | | | | | 47,598,140 |
| | Arkansas 0.4% | | | | |
| | Jefferson County PCR, Entergy Arkansas Inc. Project, Refunding, 1.55%, 10/01/17 | | 5,000,000 | | 5,050,500 |
| | California 6.4% | | | | |
| | Bennett Valley USD, GO, BANS, ETM, 4.00%, 1/01/15 | | 2,130,000 | | 2,198,245 |
| | California State Economic Recovery GO, Refunding, Series A, 5.00%, 7/01/22 | | 5,000,000 | | 5,528,600 |
| | California State GO, Refunding, 5.00%, 4/01/15 | | 500,000 | | 525,750 |
| | California State Health Facilities Financing Authority Revenue, St. Joseph Health System, | | | | |
| | Mandatory Put 10/15/19, Series C, 5.00%, 7/01/43 | | 3,250,000 | | 3,795,058 |
| | Mandatory Put 10/15/20, Refunding, Series D, 5.00%, 7/01/43 | | 5,000,000 | | 5,811,800 |
| | aCalifornia State Infrastructure and Economic Development Bank Revenue, The J. Paul Getty | | | | |
| | Trust, Mandatory Put 4/01/15, Refunding, Series B-1, Weekly FRN, 0.33%, 10/01/47 | | 8,000,000 | | 8,007,040 |
| | California State Municipal Finance Authority Solid Waste Disposal Revenue, Waste Management | | | | |
| | Inc. Project, Mandatory Put 2/01/14, Series A, 1.125%, 2/01/39 | | 5,000,000 | | 5,012,950 |
| | California Statewide CDA Revenue, | | | | |
| CHF -Irvine LLC, UCI East Campus Apartments, Phase II, 5.00%, 5/15/14 | | 1,000,000 | | 1,006,850 |
| | Temporary 40, American Baptist Homes of the West, Series B, Sub Series B-3, 2.10%, | | | | |
| | 10/01/19 | | 2,000,000 | | 1,971,960 |
| | Temporary 55, American Baptist Homes of the West, Series B, Sub Series B-2, 2.40%, | | | | |
| | 10/01/20 | | 1,000,000 | | 972,610 |
| | Temporary 70, American Baptist Homes of the West, Series B, Sub Series B-1, 2.75%, | | | | |
| | 10/01/21 | | 5,880,000 | | 5,741,996 |
| |
| | | | | | Annual Report | 101 |
| | | | |
| Franklin Tax-Free Trust | | | | |
| |
| Statement of Investments, February 28, 2014 (continued) | | | | |
| |
| |
| Franklin Federal Limited-Term Tax-Free Income Fund | | Principal Amount | | Value |
| Municipal Bonds (continued) | | | | |
| California (continued) | | | | |
| Coachella Valley USD, GO, Refunding, Build America Mutual Assurance, 4.00%, | | | | |
| 8/01/16 | $ | 1,110,000 | $ | 1,198,334 |
| 8/01/17 | | 1,220,000 | | 1,346,990 |
| 8/01/18 | | 1,265,000 | | 1,412,499 |
| 8/01/19 | | 1,330,000 | | 1,490,983 |
| Imperial Community College District GO, Capital Appreciation, zero cpn., 8/01/14 | | 7,250,000 | | 7,230,932 |
| Northern California Power Agency Public Power Revenue, Hydroelectric Project No. 1, | | | | |
| Refunding, Series C, Assured Guaranty, 5.00%, 7/01/15 | | 1,000,000 | | 1,063,490 |
| Riverside County Transportation Commission Sales Tax Revenue, Refunding, Series A, 5.00%, | | |
| 6/01/18 | | 1,000,000 | | 1,178,360 |
| San Francisco City and County Airport Commission International Airport Revenue, Issue 32G, | | |
| Refunding, Second Series, NATL RE, FGIC Insured, 5.00%, 5/01/23 | | 11,675,000 | | 12,736,491 |
| San Jose RDA Tax Allocation, Merged Area Redevelopment Project, Series A, 6.125%, | | | | |
| 8/01/15 | | 3,000,000 | | 3,120,480 |
| Santa Clara County Financing Authority Revenue, El Camino Hospital, Series B, | | | | |
| AMBAC Insured, 5.00%, 2/01/15 | | 1,025,000 | | 1,068,532 |
| Southern California Public Power Authority Gas Project Revenue, Project No. 1, Series A, | | |
| 5.00%, 11/01/15 | | 1,000,000 | | 1,058,350 |
| Tustin USD School Facilities ID No. 2002-1 GO, Capital Appreciation, Election of 2002, | | |
| Series C, AGMC Insured, zero cpn., 6/01/18 | | 810,000 | | 755,819 |
| | | | | 74,234,119 |
| Colorado 0.3% | | | | |
| Garfield County School District No. 16 GO, Refunding, 3.00%, 12/01/18 | | 1,115,000 | | 1,195,447 |
| Regional Transportation District COP, Transit Vehicles Project, Series A, AMBAC Insured, | | |
| 5.00%, 12/01/15 | | 1,500,000 | | 1,621,905 |
| | | | | 2,817,352 |
| Connecticut 2.0% | | | | |
| Connecticut State Health and Educational Facilities Authority Revenue, Yale University Issue, | | |
| Series A-3, 0.875%, 7/01/49 | | 23,070,000 | | 23,074,383 |
| Florida 6.5% | | | | |
| Citizens Property Insurance Corp. Revenue, High-Risk Account, senior secured, Series A-1, | | |
| 5.50%, 6/01/17 | | 5,000,000 | | 5,715,250 |
| 6.00%, 6/01/17 | | 8,000,000 | | 9,260,400 |
| Assured Guaranty, 5.50%, 6/01/16 | | 5,000,000 | | 5,542,800 |
| Escambia County Solid Waste Disposal Revenue, Gulf Power Co. Project, Mandatory Put | | |
| 6/02/15, 1.35%, 4/01/39 | | 7,500,000 | | 7,526,700 |
| Florida State Board of Education Lottery Revenue, Refunding, Series B, AMBAC Insured, | | |
| 5.00%, 7/01/18 | | 11,480,000 | | 12,815,928 |
| Florida State Hurricane Catastrophe Fund Finance Corp. Revenue, Series A, 4.25%, | | | | |
| 7/01/14 | | 4,000,000 | | 4,052,800 |
| Jacksonville Sales Tax Revenue, Better Jacksonville, Refunding, 5.00%, 10/01/16 | | 2,000,000 | | 2,212,340 |
| aLakeland Electric and Water Revenue, Refunding, Weekly FRN, 0.78%, 10/01/17 | | 3,000,000 | | 3,013,020 |
| Miami-Dade County Public Facilities Revenue, Jackson Health System, Assured Guaranty, | | |
| 4.00%, 6/01/16 | | 1,580,000 | | 1,658,747 |
| Sunshine State Governmental Financing Commission Revenue, Miami-Dade County Program, | | |
| Series A, AGMC Insured, 4.00%, 9/01/14 | | 23,185,000 | | 23,617,632 |
| | | | | 75,415,617 |
| |
| 102 | Annual Report | | | | |
| | | | | |
| | Franklin Tax-Free Trust | | | | |
| |
| | Statement of Investments, February 28, 2014 (continued) | | | | |
| |
| |
| | Franklin Federal Limited-Term Tax-Free Income Fund | | Principal Amount | | Value |
| | Municipal Bonds (continued) | | | | |
| | Georgia 2.1% | | | | |
| | Atlanta Water and Wastewater Revenue, Refunding, Series B, AGMC Insured, 4.00%, | | | | |
| | 11/01/15 | $ | 6,390,000 | $ | 6,785,605 |
| | Burke County Development Authority PCR, Georgia Power Co. Plant Vogtle Project, Mandatory | | | | |
| | Put 6/01/17, 1.75%, | | | | |
| | 12/01/49 | | 5,000,000 | | 5,048,850 |
| | 12/01/49 | | 5,000,000 | | 5,106,300 |
| | Georgia State GO, Refunding, Series C, 5.00%, 7/01/21 | | 2,350,000 | | 2,677,073 |
| | Monroe County Development Authority PCR, Gulf Power Co. Project, Mandatory Put 6/21/17, | | | | |
| | First Series, 1.70%, 6/01/49 | | 5,000,000 | | 5,041,650 |
| | | | | | 24,659,478 |
| | Idaho 0.1% | | | | |
| | Canyon County School District No. 131 GO, Refunding, 4.00%, 8/15/18 | | 1,480,000 | | 1,627,112 |
| | Illinois 8.4% | | | | |
| | Chicago GO, Modern Schools Across Chicago Program, Series A, 5.00%, 12/01/16 | | 5,000,000 | | 5,457,900 |
| | Chicago Housing Authority Capital Program Revenue, AGMC Insured, | | | | |
| | ETM, 5.00%, 7/01/16 | | 5,000,000 | | 5,521,250 |
| Pre-Refunded, 5.00%, 7/01/19 | | 7,455,000 | | 8,232,183 |
| | Chicago Wastewater Transmission Revenue, Series A, BHAC Insured, | | | | |
| | 5.00%, 1/01/16 | | 1,425,000 | | 1,542,249 |
| | 5.50%, 1/01/17 | | 1,000,000 | | 1,119,550 |
| | Dolton GO, Refunding, Series B, AGMC Insured, | | | | |
| | 4.00%, 12/01/14 | | 1,195,000 | | 1,215,339 |
| | 3.50%, 12/01/15 | | 1,245,000 | | 1,284,728 |
| | Homer Glen Village GO, Will and Cook Counties, Series A, | | | | |
| | 2.00%, 12/01/15 | | 1,000,000 | | 1,019,800 |
| | 4.00%, 12/01/18 | | 1,000,000 | | 1,104,750 |
| | Illinois State Educational Facilities Authority Revenue, University of Chicago, Mandatory Put | | | | |
| | 2/01/19, 1.65%, 7/01/25 | | 10,000,000 | | 10,093,000 |
| | Illinois State GO, | | | | |
| | AGMC Insured, 5.50%, 5/01/15 | | 5,000,000 | | 5,298,450 |
| | AGMC Insured, 5.00%, 9/01/16 | | 9,000,000 | | 9,568,080 |
| | Refunding, AGMC Insured, 5.00%, 1/01/16 | | 7,000,000 | | 7,563,990 |
| | Illinois State Sales Tax Revenue, Build Illinois, Junior Obligation, Refunding, 5.00%, | | | | |
| | 6/15/17 | | 5,000,000 | | 5,676,250 |
| | Illinois State Toll Highway Authority Revenue, Senior, Refunding, Series B, 5.00%, | | | | |
| | 12/01/17 | | 10,000,000 | | 11,492,000 |
| | Illinois State Unemployment Insurance Fund Building Receipts Revenue, Series B, 5.00%, | | | | |
| | 12/15/17 | | 6,000,000 | | 6,747,420 |
| | Mount Vernon GO, Jefferson County, AGMC Insured, 3.00%, | | | | |
| | 12/15/17 | | 1,430,000 | | 1,495,580 |
| | 12/15/18 | | 1,475,000 | | 1,528,882 |
| | Regional Transportation Authority Revenue, Series A, NATL RE Insured, 5.00%, 7/01/21 | | 5,410,000 | | 5,910,695 |
| | Southwestern Development Authority Revenue, Local Government Program, Edwardsville | | | | |
| | Community Unit School District No. 7 Project, Refunding, AGMC Insured, 5.25%, | | | | |
| | 12/01/20 | | 4,475,000 | | 4,946,889 |
| | | | | | 96,818,985 |
Annual Report | 103
| | | | | |
| Franklin Tax-Free Trust | | | | | |
| |
| Statement of Investments, February 28, 2014 (continued) | | | | | |
| |
| |
| Franklin Federal Limited-Term Tax-Free Income Fund | | | Principal Amount | | Value |
| Municipal Bonds (continued) | | | | | |
| Indiana 0.8% | | | | | |
| Indiana Health Facilities Financing Authority Revenue, Ascension Health, Mandatory Put | | | | | |
| 8/01/17, Series A-5, 2.00%, 11/01/27 | | $ | 3,500,000 | $ | 3,554,355 |
| Indianapolis Thermal Energy System Revenue, first lien, Refunding, Series B, AGMC Insured, | | | | | |
| 4.00%, 10/01/14 | | | 4,640,000 | | 4,731,315 |
| Lafayette Sewage Works Revenue, Refunding, 3.00%, 1/01/15 | | | 1,000,000 | | 1,021,650 |
| | | | | | 9,307,320 |
| Kansas 0.4% | | | | | |
| Kansas City SFMR, Muni Multiplier, Series A, FHLMC Insured, ETM, zero cpn., 12/01/14 | | | 3,000,000 | | 2,994,690 |
| Kansas State Department of Transportation Highway Revenue, Refunding, Series A-3, 0.33%, | | | | | |
| 9/01/15 | | | 1,500,000 | | 1,497,930 |
| | | | | | 4,492,620 |
| Kentucky 0.6% | | | | | |
| Louisville/Jefferson County Metro Government PCR, Louisville Gas and Electric Co. Project, | | | | | |
| Mandatory Put 8/01/19, 2.20%, 2/01/35 | | | 7,000,000 | | 7,051,240 |
| Louisiana 0.5% | | | | | |
| England District Sub-District No. 1 Revenue, Economic Development Project, Refunding, | | | | | |
| 4.00%, 8/15/15 | | | 2,780,000 | | 2,916,137 |
| 5.00%, 8/15/16 | | | 2,505,000 | | 2,760,460 |
| Louisiana Local Government Environmental Facilities and CDA Revenue, Shreveport Utility | | | | | |
| System Project, NATL Insured, 4.00%, 12/01/14 | | | 500,000 | | 508,620 |
| | | | | | 6,185,217 |
| Maryland 1.3% | | | | | |
| aHoward County Housing Commission Revenue, Columbia Landing Project, Mandatory Put | | | | | |
| 7/01/18, Series A, Weekly FRN , 1.28%, 7/01/34 | | | 6,000,000 | | 6,011,100 |
| Maryland State Department of Transportation Consolidated Transportation Revenue, Refunding, | | | | | |
| 5.00%, 5/01/19 | | | 7,500,000 | | 8,949,525 |
| | | | | | 14,960,625 |
| Massachusetts 0.1% | | | | | |
| Massachusetts State Health and Educational Facilities Authority Revenue, Cape Cod Healthcare | | | | | |
| Obligated Group, Series D, Assured Guaranty, 4.00%, 11/15/15 | | | 1,000,000 | | 1,040,110 |
| Michigan 4.3% | | | | | |
| Detroit GO, Distribution State Aid, 5.00%, 11/01/16 | | | 6,120,000 | | 6,543,137 |
| Detroit Water and Sewerage Department Sewage Disposal System Revenue, senior lien, | | | | | |
| Refunding, Series A, AGMC Insured, 5.00%, 7/01/16 | | | 5,000,000 | | 5,045,450 |
| Garden City GO, Refunding, AGMC Insured, 4.00%, | | | | | |
| 4/01/14 | | | 1,015,000 | | 1,016,989 |
| 4/01/15 | | | 1,215,000 | | 1,245,606 |
| 4/01/16 | | | 1,415,000 | | 1,470,978 |
| Jackson GO, Downtown Development, AGMC Insured, zero cpn., 6/01/16 | | | 1,370,000 | | 1,317,296 |
| Michigan State Building Authority Revenue, Facilities Program, Refunding, Series I-A, 5.00%, | | | | | |
| 10/15/17 | | | 1,500,000 | | 1,716,285 |
| Michigan State Finance Authority Revenue, | | | | | |
| Refunding, Unemployment Obligation Assessment, Series B, 5.00%, 7/01/20 | | | 10,000,000 | | 11,845,600 |
| School District of the City of Detroit, Refunding, 4.00%, 6/01/14 | | | 550,000 | | 554,345 |
| School District of the City of Detroit, Refunding, 5.00%, 6/01/14 | | | 1,250,000 | | 1,262,850 |
| |
| 104 | Annual Report | | | | | |
| | | | |
| Franklin Tax-Free Trust | | | | |
| |
| Statement of Investments, February 28, 2014 (continued) | | | | |
| |
| |
| Franklin Federal Limited-Term Tax-Free Income Fund | | Principal Amount | | Value |
| Municipal Bonds (continued) | | | | |
| Michigan (continued) | | | | |
| Michigan State Finance Authority Revenue, (continued) | | | | |
| School District of the City of Detroit, Refunding, 5.00%, 6/01/15 | $ | 1,700,000 | $ | 1,771,230 |
| School District of the City of Detroit, Refunding, 5.00%, 6/01/16 | | 1,600,000 | | 1,705,264 |
| Rochester Community School District GO, AGMC Insured, Pre-Funded, 5.00%, 5/01/15 | | 4,795,000 | | 4,831,154 |
| Royal Oak Hospital Finance Authority Hospital Revenue, William Beaumont Hospital Obligated | | | | |
| Group, Refunding, Series W, 5.25%, 8/01/17 | | 7,000,000 | | 7,806,470 |
| Western Townships Utilities Authority Revenue, Sewage Disposal System, Refunding, 3.00%, | | | | |
| 1/01/15 | | 1,000,000 | | 1,020,230 |
| 1/01/17 | | 1,000,000 | | 1,052,650 |
| | | | | 50,205,534 |
| Minnesota 1.6% | | | | |
| Hennepin County GO, Refunding, Series B, 5.00%, 12/01/18 | | 3,315,000 | | 3,932,253 |
| Minneapolis-St. Paul Metropolitan Airports Commission Airport Revenue, Refunding, Series B, | | | | |
| NATL RE, FGIC Insured, 5.00%, 1/01/23 | | 5,925,000 | | 6,471,700 |
| Minnesota Agricultural and Economic Development Board Revenue, Health Care Facilities, | | | | |
| Essentia Health Obligated Group, Series C-1, Assured Guaranty, 5.00%, 2/15/15 | | 1,335,000 | | 1,386,477 |
| Northern Municipal Power Agency Electric System Revenue, Refunding, Series A, | | | | |
| Assured Guaranty, 5.00%, 1/01/15 | | 5,000,000 | | 5,189,000 |
| Otsego GO, Water and Sewer, Refunding, Series C, AGMC Insured, 2.00%, 12/01/16 | | 2,000,000 | | 2,062,680 |
| | | | | 19,042,110 |
| Mississippi 0.1% | | | | |
| Jackson Water and Sewer System Revenue, Refunding, AGMC Insured, 4.00%, 9/01/14 | | 580,000 | | 590,046 |
| Nevada 2.0% | | | | |
| Clark County School District GO, Building, Series C, 5.00%, 6/15/23 | | 9,920,000 | | 10,978,266 |
| Nevada State GO, | | | | |
| Capital Improvement and Cultural Affairs, Series C, 5.00%, 6/01/20 | | 7,115,000 | | 8,203,524 |
| Nevada Municipal Bond Bank Project Nos. R-9A R-9B R-9C R-10 R-11 and R12, Series F, | | | | |
| AGMC Insured, 5.00%, 12/01/20 | | 4,260,000 | | 4,506,824 |
| | | | | 23,688,614 |
| New Hampshire 0.3% | | | | |
| New Hampshire State GO, Refunding, Series A, 5.00%, 7/01/18 | | 2,610,000 | | 3,073,536 |
| New Jersey 5.1% | | | | |
| Gloucester County Improvement Authority Solid Waste Resource Recovery Revenue, Waste | | | | |
| Management Inc. Project, Mandatory Put 12/01/17, Refunding, Series A, 2.125%, | | | | |
| 12/01/29 | | 3,000,000 | | 3,158,610 |
| New Jersey EDA Revenue, | | | | |
| Cigarette Tax, Refunding, 5.00%, 6/15/14 | | 4,810,000 | | 4,869,692 |
| Cigarette Tax, Refunding, 5.00%, 6/15/15 | | 3,160,000 | | 3,333,358 |
| School Facilities Construction, Refunding, Series DD-1, 5.00%, 12/15/16 | | 10,000,000 | | 11,251,600 |
| aSchool Facilities Construction, Series H, Weekly FRN, 0.93%, 2/01/17 | | 3,000,000 | | 3,021,570 |
| New Jersey Environmental Infrastructure Trust Revenue, | | | | |
| Environmental-2012, Series A, Pre-Refunded, 5.00%, 9/01/22 | | 15,000 | | 16,715 |
| Environmental-2013, Series A, 5.00%, 9/01/22 | | 3,105,000 | | 3,416,804 |
Annual Report | 105
| | | | | |
| | Franklin Tax-Free Trust | | | | |
| |
| | Statement of Investments, February 28, 2014 (continued) | | | | |
| |
| |
| | Franklin Federal Limited-Term Tax-Free Income Fund | | Principal Amount | | Value |
| | Municipal Bonds (continued) | | | | |
| | New Jersey (continued) | | | | |
| | New Jersey State GO, Refunding, | | | | |
| | Series N, AMBAC Insured, 5.50%, 7/15/14 | $ | 3,000,000 | $ | 3,058,020 |
| | Series Q, 5.00%, 8/15/18 | | 15,885,000 | | 18,731,274 |
| | New Jersey Transportation Trust Fund Authority Revenue, Transportation System, Refunding, | | | | |
| | Series A, AMBAC Insured, 5.50%, 12/15/14 | | 5,000,000 | | 5,205,850 |
| | Ocean County GO, Refunding, 5.00%, 8/01/19 | | 1,125,000 | | 1,333,834 |
| | Rutgers State University GO, The State University of New Jersey, Refunding, Series J, 5.00%, | | | | |
| | 5/01/17 | | 1,000,000 | | 1,129,270 |
| | South Brunswick Township GO, Refunding, 1.75%, 7/01/14 | | 1,000,000 | | 1,004,990 |
| | | | | | 59,531,587 |
| | New Mexico 1.9% | | | | |
| | New Mexico Educational Assistance Foundation Revenue, Education Loan, Series A-1, 4.00%, | | | | |
| | 12/01/14 | | 2,000,000 | | 2,052,600 |
| | 12/01/15 | | 4,000,000 | | 4,243,280 |
| | New Mexico State Severance Tax Revenue, Series A, 4.00%, 7/01/20 | | 11,640,000 | | 12,915,162 |
| | Taos County Gross Receipts Tax Revenue, County Education Improvement, Build America | | | | |
| | Mutual Assurance, | | | | |
| | 3.00%, 4/01/16 | | 1,000,000 | | 1,033,390 |
| | 3.00%, 4/01/17 | | 750,000 | | 780,203 |
| | 3.50%, 4/01/19 | | 1,000,000 | | 1,045,400 |
| | | | | | 22,070,035 |
| | New York 11.3% | | | | |
| | Beekmantown CSD, GO, Refunding, AGMC Insured, | | | | |
| | 3.00%, 6/15/14 | | 1,000,000 | | 1,006,930 |
| | 4.00%, 6/15/15 | | 1,245,000 | | 1,297,489 |
| | 2.00%, 6/15/16 | | 1,075,000 | | 1,093,769 |
| | East Meadow Union Free School District GO, Nassau County, Refunding, | | | | |
| | 3.00%, 8/15/15 | | 1,000,000 | | 1,038,740 |
| | 4.00%, 8/15/16 | | 1,000,000 | | 1,083,650 |
| | 4.00%, 8/15/17 | | 1,000,000 | | 1,107,420 |
| | Freeport GO, Public Improvement, Refunding, Series A, 5.00%, 1/15/19 | | 1,920,000 | | 2,201,818 |
| | aMTA Dedicated Tax Fund Revenue, Mandatory Put 11/04/14, Refunding, Sub Series B-3A, | | | | |
| | Weekly FRN, 0.26%, 11/01/28 | | 8,900,000 | | 8,900,089 |
| | MTA Service Contract Revenue, Transportation Facilities, Series O, ETM, 5.50%, 7/01/17 | | 9,220,000 | | 10,489,594 |
| | New York City GO, Refunding, Series G, | | | | |
| | 5.25%, 8/01/16 | | 9,010,000 | | 10,057,412 |
| | 5.00%, 8/01/20 | | 7,000,000 | | 8,307,460 |
| | New York City IDAR, Capital Appreciation, Yankee Stadium Project, Pilot, Series A, | | | | |
| | Assured Guaranty, zero cpn., 3/01/14 | | 5,335,000 | | 5,335,000 |
| | New York State Dormitory Authority Revenues, | | | | |
| | Non-State Supported Debt, Municipal Health Facilities Improvement Program, Lease, | | | | |
| | New York City Issue, Refunding, Series 1, 5.00%, 1/15/19 | | 4,000,000 | | 4,510,360 |
| Non-State Supported Debt, Rochester General Hospital, Radian Insured, ETM, 5.00%, | | | | |
| | 12/01/15 | | 100,000 | | 107,981 |
| | Non-State Supported Debt, School District Financing Program, Series A, AGMC Insured, | | | | |
| | 5.00%, 10/01/15 | | 1,000,000 | | 1,073,660 |
106 | Annual Report
| | | | |
| Franklin Tax-Free Trust | | | | |
| |
| Statement of Investments, February 28, 2014 (continued) | | | | |
| |
| |
| Franklin Federal Limited-Term Tax-Free Income Fund | | Principal Amount | | Value |
| Municipal Bonds (continued) | | | | |
| New York (continued) | | | | |
| New York State Dormitory Authority Revenues, (continued) | | | | |
| Non-State Supported Debt, School Districts Financing Program, Series A, | | | | |
| Assured Guaranty, 3.75%, 10/01/14 | $ | 1,380,000 | $ | 1,407,200 |
| Non-State Supported Debt, School Districts Financing Program, Series F, 4.00%, | | | | |
| 10/01/14 | | 3,300,000 | | 3,369,762 |
| State Supported Debt, Mental Health Services Facilities Improvement, Series A, | | | | |
| AGMC Insured, 5.00%, 2/15/15 | | 995,000 | | 1,038,581 |
| State Supported Debt, Mental Health Services Facilities Improvement, Series A, | | | | |
| AGMC Insured, ETM, 5.00%, 2/15/15 | | 5,000 | | 5,228 |
| New York State Dormitory Authority State Personal Income Tax Revenue, | | | | |
| Education, Series C, 5.00%, 12/15/18 | | 6,165,000 | | 6,863,988 |
| General Purpose, Refunding, Series A, 5.00%, 12/15/19 | | 6,095,000 | | 7,297,421 |
| New York State Environmental Facilities Corp. Special Obligation Revenue, Riverbank State | | | | |
| Park, Refunding, CIFG Insured, 5.00%, 4/01/16 | | 200,000 | | 218,268 |
| New York State GO, Series A, 5.00%, 3/01/18 | | 1,130,000 | | 1,272,403 |
| New York State Urban Development Corp. Revenue, Refunding, Series D, 5.00%, 1/01/15 | | 4,000,000 | | 4,159,680 |
| New York Thruway Authority General Junior Indebtedness Obligations Revenue, Series A, | | | | |
| 5.00%, 5/01/19 | | 15,000,000 | | 17,570,550 |
| Patchogue-Medford Union Free School District GO, Refunding, Series B, | | | | |
| 2.00%, 7/01/14 | | 1,000,000 | | 1,005,600 |
| 3.00%, 7/01/16 | | 1,000,000 | | 1,046,970 |
| Poughkeepsie Town GO, Public Improvement, Refunding, AGMC Insured, 5.00%, 4/15/15 | | 250,000 | | 261,077 |
| Rochester GO, Refunding, | | | | |
| Series IV, 2.00%, 10/15/15 | | 1,850,000 | | 1,902,022 |
| Series V, 2.00%, 2/15/15 | | 1,535,000 | | 1,561,049 |
| Sales Tax Asset Receivable Corp. Revenue, | | | | |
| Refunding, Series A, NATL Insured, 5.25%, 10/15/18 | | 3,285,000 | | 3,383,583 |
| Series A, NATL Insured, 5.25%, 10/15/19 | | 785,000 | | 808,409 |
| St. Lawrence County IDA Civic Facility Revenue, St. Lawrence University Project, Series A, | | | | |
| 5.00%, 10/01/16 | | 9,910,000 | | 11,018,632 |
| Suffolk County EDC Revenue, Catholic Health Services of Long Island Obligated Group | | | | |
| Project, Refunding, 5.00%, | | | | |
| 7/01/16 | | 1,250,000 | | 1,355,137 |
| 7/01/17 | | 3,000,000 | | 3,328,680 |
| Tobacco Settlement Financing Corp. Revenue, Asset-Backed, State Contingency Contract | | | | |
| Secured, Refunding, Series B, 5.00%, 6/01/20 | | 4,000,000 | | 4,212,760 |
| | | | | 130,698,372 |
| North Carolina 0.9% | | | | |
| Charlotte COP, Transit Projects, Phase III, Series B, 3.00%, 6/01/22 | | 7,500,000 | | 7,590,075 |
| North Carolina Eastern Municipal Power Agency Power System Revenue, Refunding, Series A, | | | | |
| Assured Guaranty, 5.25%, 1/01/19 | | 2,350,000 | | 2,692,160 |
| | | | | 10,282,235 |
| Ohio 3.5% | | | | |
| Akron COP, District Energy Project, 2.75%, 12/01/16 | | 1,440,000 | | 1,500,739 |
| Cleveland Airport System Revenue, | | | | |
| Refunding, Series A, AGMC Insured, 5.00%, 1/01/19 | | 7,870,000 | | 8,876,573 |
| Series C, Assured Guaranty, 5.00%, 1/01/16 | | 5,140,000 | | 5,536,500 |
Annual Report | 107
| | | | |
| Franklin Tax-Free Trust | | | | |
| |
| Statement of Investments, February 28, 2014 (continued) | | | | |
| |
| |
| Franklin Federal Limited-Term Tax-Free Income Fund | | Principal Amount | | Value |
| Municipal Bonds (continued) | | | | |
| Ohio (continued) | | | | |
| Cleveland Public Power System Revenue, Refunding, Series A-1, NATL RE, FGIC Insured, | | | | |
| 5.00%, 11/15/20 | $ | 5,000,000 | $ | 5,380,500 |
| Hamilton GO, Various Purpose, Street Improvement and Building, Refunding, 2.00%, | | | | |
| 11/01/14 | | 1,455,000 | | 1,466,000 |
| 11/01/15 | | 1,465,000 | | 1,489,465 |
| Ohio State Department of Administrative Services COP, Administrative Knowledge System | | | | |
| Project, Series A, NATL Insured, 5.25%, 9/01/15 | | 6,205,000 | | 6,499,800 |
| Ohio State Higher Educational Facilities Commission Revenue, Case Western Reserve | | | | |
| University Project, 4.00%, 12/01/17 | | 2,225,000 | | 2,489,352 |
| South-Western City School District of Ohio Franklin and Pickaway Counties GO, School | | | | |
| Facilities Construction and Improvement, 3.00%, | | | | |
| 12/01/15 | | 1,210,000 | | 1,266,834 |
| 12/01/16 | | 1,265,000 | | 1,342,013 |
| Toledo GO, | | | | |
| Capital Improvement, Refunding, Assured Guaranty, 3.25%, 12/01/14 | | 945,000 | | 964,354 |
| Various Purpose Improvement, Refunding, Assured Guaranty, 3.00%, 12/01/14 | | 1,210,000 | | 1,232,554 |
| Various Purpose Improvement, Refunding, Assured Guaranty, 3.00%, 12/01/15 | | 1,185,000 | | 1,223,039 |
| Wright State University Revenue, General Receipts, Series A, 3.00%, 5/01/14 | | 1,325,000 | | 1,330,843 |
| | | | | 40,598,566 |
| Oklahoma 0.7% | | | | |
| Oklahoma County ISD No. 89 GO, 2.00%, 7/01/16 | | 4,195,000 | | 4,359,905 |
| Tulsa County Industrial Authority Educational Facilities Lease Revenue, Broken Arrow Public | | | | |
| Schools Project, 4.00%, 9/01/15 | | 4,000,000 | | 4,220,320 |
| | | | | 8,580,225 |
| Pennsylvania 5.5% | | | | |
| Pennsylvania Economic Development Financing Authority Exempt Facilities Revenue, | | | | |
| PPL Energy Supply LLC Project, Mandatory Put 9/01/15, Refunding, Series A, 3.00%, | | | | |
| 12/01/38 | | 10,000,000 | | 10,264,800 |
| Pennsylvania State Higher Educational Facilities Authority Revenue, Philadelphia University, | | | | |
| Series A, Pre-Refunded, 5.125%, 6/01/25 | | 3,000,000 | | 3,035,100 |
| Philadelphia Gas Works Revenue, 1998 General Ordinance, Refunding, Tenth Series, | | | | |
| AGMC Insured, | | | | |
| 3.50%, 7/01/16 | | 6,190,000 | | 6,517,946 |
| 4.00%, 7/01/17 | | 4,795,000 | | 5,186,848 |
| Philadelphia GO, Refunding, Series A, AGMC Insured, 5.25%, 8/01/17 | | 10,000,000 | | 11,448,400 |
| Philadelphia School District GO, Refunding, Series C, 5.00%, | | | | |
| 9/01/14 | | 1,000,000 | | 1,022,490 |
| 9/01/15 | | 1,500,000 | | 1,595,595 |
| 9/01/16 | | 2,630,000 | | 2,877,746 |
| 9/01/17 | | 2,750,000 | | 3,083,960 |
| Pittsburgh School District GO, | | | | |
| Refunding, Series A, 3.00%, 9/01/14 | | 845,000 | | 856,593 |
| Refunding, Series A, 4.00%, 9/01/17 | | 4,250,000 | | 4,682,990 |
| Series A, ETM, 3.00%, 9/01/14 | | 315,000 | | 319,432 |
108 | Annual Report
| | | | |
| Franklin Tax-Free Trust | | | | |
| |
| Statement of Investments, February 28, 2014 (continued) | | | | |
| |
| |
| Franklin Federal Limited-Term Tax-Free Income Fund | | Principal Amount | | Value |
| Municipal Bonds (continued) | | | | |
| Pennsylvania (continued) | | | | |
| Reading School District GO, Refunding, Series A, 5.00%, | | | | |
| 4/01/17 | $ | 4,500,000 | $ | 4,918,545 |
| 4/01/18 | | 4,035,000 | | 4,457,787 |
| South Fork Municipal Authority Hospital Revenue, Conemaugh Valley Memorial Hospital, | | | | |
| Refunding, Series A, Assured Guaranty, | | | | |
| 5.00%, 7/01/14 | | 1,250,000 | | 1,262,175 |
| 4.00%, 7/01/15 | | 1,235,000 | | 1,263,615 |
| 5.00%, 7/01/16 | | 1,325,000 | | 1,418,161 |
| | | | | 64,212,183 |
| Rhode Island 0.6% | | | | |
| Rhode Island State and Providence Plantations GO, Consolidated Capital Development Loan, | | | | |
| Refunding, Series A, 5.00%, 8/01/18 | | 6,290,000 | | 7,353,891 |
| South Carolina 0.6% | | | | |
| Piedmont Municipal Power Agency Electric Revenue, Refunding, Series A-2, 5.00%, | | | | |
| 1/01/15 | | 4,000,000 | | 4,151,880 |
| SCAGO Educational Facilities Corp. for Pickens School District Revenue, Installment Purchase, | | | | |
| School District of Pickens County Project, AGMC Insured, 5.00%, 12/01/14 | | 3,000,000 | | 3,104,190 |
| | | | | 7,256,070 |
| Tennessee 1.6% | | | | |
| Memphis Electric System Revenue, Subordinate, Refunding, 5.00%, 12/01/15 | | 8,000,000 | | 8,654,480 |
| Sevier County PBA Revenue, Local Government Public Improvement, Series VII-D-1, 5.00%, | | | | |
| 6/01/15 | | 9,000,000 | | 9,473,040 |
| | | | | 18,127,520 |
| Texas 3.7% | | | | |
| Austin Water and Wastewater System Revenue, Refunding, Series A, | | | | |
| 4.00%, 11/15/15 | | 1,700,000 | | 1,808,613 |
| 4.00%, 11/15/16 | | 600,000 | | 655,794 |
| 5.00%, 11/15/17 | | 500,000 | | 576,685 |
| Brock ISD, GO, Capital Appreciation, PSF Guarantee, zero cpn., 8/15/16 | | 460,000 | | 454,420 |
| Crandall ISD, GO, Refunding, Series A, PSF Guarantee, zero cpn., 8/15/15 | | 1,000,000 | | 989,960 |
| Dallas Area Rapid Transit Sales Tax Revenue, senior lien, Refunding, AGMC Insured, 4.50%, | | | | |
| 12/01/24 | | 6,720,000 | | 7,249,469 |
| Dallas/Fort Worth International Airport Revenue, Joint, Refunding, | | | | |
| Series A, 5.00%, 11/01/14 | | 3,235,000 | | 3,335,802 |
| Series D, 5.00%, 11/01/17 | | 2,000,000 | | 2,298,880 |
| Tarrant County Cultural Education Facilities Finance Corp. Revenue, CHRISTUS Health, | | | | |
| Refunding, Series A, Assured Guaranty, 5.75%, 7/01/18 | | 1,585,000 | | 1,751,932 |
| Texas State A&M University Permanent University Fund Revenue, Refunding, 5.00%, | | | | |
| 7/01/19 | | 5,845,000 | | 7,010,142 |
| Texas State PFAR, Southern University Financing System, Refunding, Build America Mutual | | | | |
| Assurance, | | | | |
| 4.00%, 11/01/14 | | 2,500,000 | | 2,555,350 |
| 4.00%, 11/01/15 | | 3,160,000 | | 3,321,666 |
| 5.00%, 11/01/16 | | 2,000,000 | | 2,191,960 |
| Texas State Transportation Commission Revenue, State Highway Fund, first tier, Series A, | | | | |
| 5.00%, 4/01/20 | | 4,195,000 | | 4,583,667 |
Annual Report | 109
| | | | |
| Franklin Tax-Free Trust | | | | |
| |
| Statement of Investments, February 28, 2014 (continued) | | | | |
| |
| |
| Franklin Federal Limited-Term Tax-Free Income Fund | | Principal Amount | | Value |
| Municipal Bonds (continued) | | | | |
| Texas (continued) | | | | |
| Wylie ISD, GO, | | | | |
| Capital Appreciation Bonds, Refunding, PSF Guarantee, zero cpn., 8/15/17 | $ | 2,775,000 | $ | 2,683,120 |
| Capital Appreciation, Refunding, PSF Guarantee, zero cpn., 8/15/16 | | 1,500,000 | | 1,474,950 |
| | | | | 42,942,410 |
| Utah 0.2% | | | | |
| Nebo School District GO, Utah County, Refunding, Series A, 2.00%, | | | | |
| 7/01/16 | | 1,200,000 | | 1,223,532 |
| 7/01/17 | | 1,000,000 | | 1,016,410 |
| | | | | 2,239,942 |
| Virginia 0.1% | | | | |
| Virginia State HDA Commonwealth Mortgage Revenue, Sub Series C-5, 2.45%, 7/01/19 | | 1,400,000 | | 1,477,336 |
| Washington 0.7% | | | | |
| King County Housing Authority Revenue, Birch Creek Apartments Project, 4.40%, 5/01/18 | | 2,290,000 | | 2,428,110 |
| Snohomish County Everett School District No. 2 GO, Refunding, NATL RE, FGIC Insured, | | | | |
| 5.00%, 12/01/14 | | 250,000 | | 258,913 |
| Snohomish County School District No. 103 GO, Monroe, Refunding, 2.50%, 12/01/15 | | 3,895,000 | | 4,043,516 |
| Washington State Health Care Facilities Authority Revenue, MultiCare Health System, | | | | |
| Series A, AGMC Insured, 4.00%, 8/15/14 | | 310,000 | | 315,313 |
| Series B, AGMC Insured, 4.00%, 8/15/14 | | 600,000 | | 610,284 |
| Series B, AGMC Insured, 4.00%, 8/15/15 | | 625,000 | | 658,213 |
| | | | | 8,314,349 |
| Wyoming 1.9% | | | | |
| Sweetwater County 2013 Specific Purpose Tax Joint Powers Board Revenue, | | | | |
| 5.00%, 12/15/17 | | 5,370,000 | | 6,057,682 |
| 4.00%, 6/15/18 | | 4,510,000 | | 4,867,282 |
| 2.125%, 12/15/18 | | 580,000 | | 584,304 |
| 5.00%, 12/15/18 | | 9,000,000 | | 10,005,210 |
| | | | | 21,514,478 |
| U.S. Territories 0.9% | | | | |
| Puerto Rico 0.9% | | | | |
| Puerto Rico Commonwealth GO, Public Improvement, AGMC Insured, 5.50%, 7/01/15 | | 5,000,000 | | 5,076,650 |
| Puerto Rico PBA Guaranteed Revenue, Government Facilities, Mandatory Put 7/01/17, | | | | |
| Refunding, Series M, Sub Series M-2, | | | | |
| 5.75%, 7/01/34 | | 5,000,000 | | 4,331,900 |
| AMBAC Insured, 5.50%, 7/01/35 | | 750,000 | | 693,135 |
| | | | | 10,101,685 |
| Total Municipal Bonds before Short Term Investments | | | | |
| (Cost $940,522,293) | | | | 959,998,299 |
| Short Term Investments 16.2% | | | | |
| Municipal Bonds 16.2% | | | | |
| Connecticut 0.4% | | | | |
| bConnecticut State GO, Variable, Economic Recovery Notes, Refunding, Series A-1, Daily VRDN | | | | |
| and Put, 0.38%, 7/01/16 | | 5,000,000 | | 5,000,000 |
110 | Annual Report
Franklin Tax-Free Trust
Statement of Investments, February 28, 2014 (continued)
| | | | |
| Franklin Federal Limited-Term Tax-Free Income Fund | | Principal Amount | | Value |
| Short Term Investments (continued) | | | | |
| Municipal Bonds (continued) | | | | |
| Florida 1.0% | | | | |
| bGainesville City Utilities System Revenue, Refunding, Series B, Daily VRDN and Put, 0.03%, | | | | |
| 10/01/42 | $ | 8,000,000 | $ | 8,000,000 |
| bSarasota County Public Hospital District Revenue, Sarasota Memorial Hospital Project, | | | | |
| Refunding, Series B, Daily VRDN and Put, 0.03%, 7/01/37 | | 3,200,000 | | 3,200,000 |
| | | | | 11,200,000 |
| Georgia 2.7% | | | | |
| bBurke County Development Authority PCR, Georgia Power Co. Plant Vogtle Project, Refunding, | | | | |
| First Series, Daily VRDN and Put, 0.04%, 7/01/49 | | 31,700,000 | | 31,700,000 |
| Kentucky 1.0% | | | | |
| bKentucky Economic Development Finance Authority Hospital Revenue, Baptist Healthcare | | | | |
| System Obligated Group, Refunding, Series B-2, Daily VRDN and Put, 0.03%, 8/15/38 | | 9,000,000 | | 9,000,000 |
| bShelby County Lease Revenue, Series A, Daily VRDN and Put, 0.03%, 9/01/34 | | 3,000,000 | | 3,000,000 |
| | | | | 12,000,000 |
| Louisiana 0.8% | | | | |
| bEast Baton Rouge Parish Sewer Commission Revenue, Series A, Monthly VRDN and Put, | | | | |
| 0.911%, 2/01/46 | | 9,000,000 | | 9,004,590 |
| Maryland 0.9% | | | | |
| bMaryland State Health and Higher Educational Facilities Authority Revenue, University of | | | | |
| Maryland Medical System Issue, Refunding, Series D, Daily VRDN and Put, 0.03%, | | | | |
| 7/01/41 | | 7,000,000 | | 7,000,000 |
| bMontgomery County GO, Consolidated Public Improvement, BAN, Refunding, Series A, | | | | |
| Daily VRDN and Put, 0.03%, 6/01/26 | | 3,800,000 | | 3,800,000 |
| | | | | 10,800,000 |
| Massachusetts 1.5% | | | | |
| bMassachusetts State Health and Educational Facilities Authority Revenue, Museum of Fine | | | | |
| Arts, Series A-2, Daily VRDN and Put, 0.03%, 12/01/37 | | 17,600,000 | | 17,600,000 |
| Minnesota 1.5% | | | | |
| bMinneapolis and St. Paul Housing and RDA Health Care System Revenue, | | | | |
| Allina Health System, Refunding, Series B-1, Daily VRDN and Put, 0.04%, 11/15/35 | | 8,425,000 | | 8,425,000 |
| Health Care Facilities, Children’s Hospitals and Clinics, Series B, AGMC Insured, | | | | |
| Daily VRDN and Put, 0.04%, 8/15/25 | | 9,000,000 | | 9,000,000 |
| | | | | 17,425,000 |
| Missouri 0.7% | | | | |
| bMissouri State Health and Educational Facilities Authority Educational Facilities Revenue, | | | | |
| St. Louis University, Daily VRDN and Put, 0.03%, 7/01/32 | | 7,990,000 | | 7,990,000 |
| New York 2.0% | | | | |
| Nassau County GO, Tax Anticipation Notes, Series A, 2.00%, 9/15/14 | | 5,000,000 | | 5,044,950 |
| bNew York City GO, | | | | |
| Fiscal 2008, Series L, Sub Series L-6, Daily VRDN and Put, 0.03%, 4/01/32 | | 9,000,000 | | 9,000,000 |
| Series E, Sub Series E-2, Daily VRDN and Put, 0.03%, 8/01/34 | | 9,000,000 | | 9,000,000 |
| | | | | 23,044,950 |
Annual Report | 111
Franklin Tax-Free Trust
Statement of Investments, February 28, 2014 (continued)
| | | | |
| Franklin Federal Limited-Term Tax-Free Income Fund | | Principal Amount | | Value |
| Short Term Investments (continued) | | | | |
| Municipal Bonds (continued) | | | | |
| Pennsylvania 0.5% | | | | |
| bPennsylvania State Turnpike Commission Turnpike Revenue, Series A, Weekly VRDN and Put, | | | | |
| 1.18%, 12/01/19 | $ | 5,000,000 | $ | 5,098,250 |
| Tennessee 1.4% | | | | |
| bBlount County PBA Revenue, Local Government Public Improvement, Blount County, | | | | |
| Refunding, Series E-3-B, Daily VRDN and Put, 0.03%, 6/01/31 | | 15,965,000 | | 15,965,000 |
| Virginia 1.8% | | | | |
| Henrico County Water and Sewer Revenue, Refunding, 2.25%, 5/01/14 | | 1,000,000 | | 1,003,440 |
| bRoanoke IDA Hospital Revenue, Carilion Health System Obligated Group, Series A, | | | | |
| Sub Series A-2, AGMC Insured, Daily VRDN and Put, 0.05%, 7/01/36 | | 20,000,000 | | 20,000,000 |
| | | | | 21,003,440 |
| Total Short Term Investments (Cost $187,723,075) | | | | 187,831,230 |
| Total Investments (Cost $1,128,245,368) 98.9% | | | | 1,147,829,529 |
| Other Assets, less Liabilities 1.1% | | | | 12,963,228 |
| Net Assets 100.0% | | | $ | 1,160,792,757 |
See Abbreviations on page 200.
aThe coupon rate shown represents the rate at period end.
bVariable rate demand notes (VRDNs) are tax-exempt obligations which contain a floating or variable interest rate adjustment formula and an unconditional right of demand to
receive payment of the principal balance plus accrued interest at specified dates. The coupon rate shown represents the rate at period end.
112 | The accompanying notes are an integral part of these financial statements. | Annual Report
| | | | | | | | | | | | | | | | |
| Franklin Tax-Free Trust | | | | | | | | | | | | | |
| Financial Highlights | | | | | | | | | | | | | | | | |
| |
| Franklin High Yield Tax-Free Income Fund | | | | | | | | | | | | | | | | |
| | | | | | | Year Ended February 28, | | | | |
| Class A | | | 2014 | | | 2013 | | | 2012 | a | | 2011 | | | 2010 | |
| Per share operating performance | | | | | | | | | | | | | | | | |
| (for a share outstanding throughout the year) | | | | | | | | | | | | | | | | |
| Net asset value, beginning of year | | $ | 10.98 | | $ | 10.59 | | $ | 9.60 | | $ | 9.99 | | $ | 8.75 | |
| Income from investment operationsb: | | | | | | | | | | | | | | | | |
| Net investment incomec | | | 0.47 | | | 0.46 | | | 0.51 | | | 0.52 | | | 0.54 | |
| Net realized and unrealized gains (losses) | | | (0.84 | ) | | 0.38 | | | 1.00 | | | (0.39 | ) | | 1.25 | |
| Total from investment operations | | | (0.37 | ) | | 0.84 | | | 1.51 | | | 0.13 | | | 1.79 | |
| Less distributions from net investment income | | | (0.46 | ) | | (0.45 | ) | | (0.52 | ) | | (0.52 | ) | | (0.55 | ) |
| Net asset value, end of year | | $ | 10.15 | | $ | 10.98 | | $ | 10.59 | | $ | 9.60 | | $ | 9.99 | |
| |
| Total returnd | | | (3.20 | )% | | 7.95 | % | | 16.20 | % | | 1.19 | % | | 20.96 | % |
| |
| Ratios to average net assets | | | | | | | | | | | | | | | | |
| Expenses | | | 0.63 | % | | 0.65 | % | | 0.64 | % | | 0.63 | % | | 0.63 | % |
| Net investment income | | | 4.64 | % | | 4.22 | % | | 5.12 | % | | 5.18 | % | | 5.66 | % |
| |
| Supplemental data | | | | | | | | | | | | | | | | |
| Net assets, end of year (000’s) | | $ | 5,014,941 | | $ | 6,559,328 | | $ | 5,881,103 | | $ | 5,133,343 | | $ | 5,477,710 | |
| Portfolio turnover rate | | | 17.08 | % | | 10.47 | % | | 8.86 | % | | 18.18 | % | | 8.58 | % |
aFor the year ended February 29.
bThe amount shown for a share outstanding throughout the period may not correlate with the Statement of Operations for the period due to the timing of sales and repurchases of
the Fund shares in relation to income earned and/or fluctuating market value of the investments of the Fund.
cBased on average daily shares outstanding.
dTotal return does not reflect sales commissions or contingent deferred sales charges, if applicable.
Annual Report | The accompanying notes are an integral part of these financial statements. | 113
| | | | | | | | | | | | | | | | |
| Franklin Tax-Free Trust | | | | | | | | | | | | | |
| Financial Highlights (continued) | | | | | | | | | | | | | | | | |
| |
| Franklin High Yield Tax-Free Income Fund | | | | | | | | | | | | | | | | |
| | | | | | | Year Ended February 28, | | | | |
| Class C | | | 2014 | | | 2013 | | | 2012 | a | | 2011 | | | 2010 | |
| Per share operating performance | | | | | | | | | | | | | | | | |
| (for a share outstanding throughout the year) | | | | | | | | | | | | | | | | |
| Net asset value, beginning of year | | $ | 11.14 | | $ | 10.75 | | $ | 9.73 | | $ | 10.12 | | $ | 8.86 | |
| Income from investment operationsb: | | | | | | | | | | | | | | | | |
| Net investment incomec | | | 0.42 | | | 0.40 | | | 0.47 | | | 0.47 | | | 0.49 | |
| Net realized and unrealized gains (losses) | | | (0.85 | ) | | 0.38 | | | 1.02 | | | (0.40 | ) | | 1.27 | |
| Total from investment operations | | | (0.43 | ) | | 0.78 | | | 1.49 | | | 0.07 | | | 1.76 | |
| Less distributions from net investment income | | | (0.40 | ) | | (0.39 | ) | | (0.47 | ) | | (0.46 | ) | | (0.50 | ) |
| Net asset value, end of year | | $ | 10.31 | | $ | 11.14 | | $ | 10.75 | | $ | 9.73 | | $ | 10.12 | |
| |
| Total returnd | | | (3.77 | )% | | 7.33 | % | | 15.68 | % | | 0.59 | % | | 20.28 | % |
| |
| Ratios to average net assets | | | | | | | | | | | | | | | | |
| Expenses | | | 1.18 | % | | 1.20 | % | | 1.19 | % | | 1.18 | % | | 1.18 | % |
| Net investment income | | | 4.09 | % | | 3.67 | % | | 4.57 | % | | 4.63 | % | | 5.11 | % |
| |
| Supplemental data | | | | | | | | | | | | | | | | |
| Net assets, end of year (000’s) | | $ | 1,042,823 | | $ | 1,446,670 | | $ | 1,219,076 | | $ | 996,921 | | $ | 1,002,985 | |
| Portfolio turnover rate | | | 17.08 | % | | 10.47 | % | | 8.86 | % | | 18.18 | % | | 8.58 | % |
aFor the year ended February 29.
bThe amount shown for a share outstanding throughout the period may not correlate with the Statement of Operations for the period due to the timing of sales and repurchases of
the Fund shares in relation to income earned and/or fluctuating market value of the investments of the Fund.
cBased on average daily shares outstanding.
dTotal return does not reflect sales commissions or contingent deferred sales charges, if applicable.
114 | The accompanying notes are an integral part of these financial statements. | Annual Report
| | | | | | | | | | | | | | | |
| Franklin Tax-Free Trust | | | | | | | | | | | | | | | |
| Financial Highlights (continued) | | | | | | | | | | | | | | | |
| |
| Franklin High Yield Tax-Free Income Fund | | | | | | | | | | | | | | | |
| | | | | | Year Ended February 28, | | | | |
| Advisor Class | | 2014 | | | 2013 | | | 2012 | a | | 2011 | | | 2010 | |
| Per share operating performance | | | | | | | | | | | | | | | |
| (for a share outstanding throughout the year) | | | | | | | | | | | | | | | |
| Net asset value, beginning of year | $ | 11.02 | | $ | 10.63 | | $ | 9.63 | | $ | 10.02 | | $ | 8.77 | |
| Income from investment operationsb: | | | | | | | | | | | | | | | |
| Net investment incomec | | 0.49 | | | 0.47 | | | 0.53 | | | 0.53 | | | 0.55 | |
| Net realized and unrealized gains (losses) | | (0.86 | ) | | 0.38 | | | 1.00 | | | (0.39 | ) | | 1.26 | |
| Total from investment operations | | (0.37 | ) | | 0.85 | | | 1.53 | | | 0.14 | | | 1.81 | |
| Less distributions from net investment income | | (0.47 | ) | | (0.46 | ) | | (0.53 | ) | | (0.53 | ) | | (0.56 | ) |
| Net asset value, end of year | $ | 10.18 | | $ | 11.02 | | $ | 10.63 | | $ | 9.63 | | $ | 10.02 | |
| |
| Total return | | (3.19 | )% | | 8.03 | % | | 16.37 | % | | 1.29 | % | | 21.14 | % |
| |
| Ratios to average net assets | | | | | | | | | | | | | | | |
| Expenses | �� | 0.53 | % | | 0.55 | % | | 0.54 | % | | 0.53 | % | | 0.53 | % |
| Net investment income | | 4.74 | % | | 4.32 | % | | 5.22 | % | | 5.28 | % | | 5.76 | % |
| |
| Supplemental data | | | | | | | | | | | | | | | |
| Net assets, end of year (000’s) | $ | 1,737,090 | | $ | 2,156,523 1,438,591 | | $ | 848,957 | | $ | 621,454 | |
| Portfolio turnover rate | | 17.08 | % | | 10.47 | % | | 8.86 | % | | 18.18 | % | | 8.58 | % |
aFor the year ended February 29.
bThe amount shown for a share outstanding throughout the period may not correlate with the Statement of Operations for the period due to the timing of sales and repurchases of
the Fund shares in relation to income earned and/or fluctuating market value of the investments of the Fund.
cBased on average daily shares outstanding.
Annual Report | The accompanying notes are an integral part of these financial statements. | 115
| | | | | |
| Franklin Tax-Free Trust | | | | | |
| |
| Statement of Investments, February 28, 2014 | | | | | |
| |
| |
| Franklin High Yield Tax-Free Income Fund | | | Principal Amount | | Value |
| Municipal Bonds 97.1% | | | | | |
| Alabama 1.5% | | | | | |
| Alabama State Port Authority Docks Facilities Revenue, Refunding, 6.00%, 10/01/40 | | $ | 6,000,000 | $ | 6,709,380 |
| Courtland IDB Environmental Improvement Revenue, International Paper Co. Projects, | | | | | |
| Refunding, Series B, 6.25%, 8/01/25 | | | 2,500,000 | | 2,506,900 |
| Cullman County Health Care Authority GO, Refunding, Series A, 7.00%, 2/01/36 | | | 7,500,000 | | 7,905,075 |
| Jefferson County Sewer Revenue, wts., sub. lien, Refunding, | | | | | |
| Series E, zero cpn., 10/01/28 | | | 5,025,000 | | 1,742,921 |
| Series E, zero cpn., 10/01/29 | | | 13,465,000 | | 4,239,859 |
| Series E, zero cpn., 10/01/30 | | | 19,050,000 | | 5,481,257 |
| Series E, zero cpn., 10/01/31 | | | 24,845,000 | | 6,519,825 |
| Series E, zero cpn., 10/01/32 | | | 30,825,000 | | 7,429,442 |
| Series E, zero cpn., 10/01/33 | | | 35,700,000 | | 7,924,686 |
| Series E, zero cpn., 10/01/34 | | | 28,020,000 | | 5,669,006 |
| Series E, zero cpn., 10/01/35 | | | 15,000,000 | | 2,849,100 |
| Series E, zero cpn., 10/01/36 | | | 12,425,000 | | 2,161,577 |
| Series F, zero cpn., to 9/30/23, 7.50% thereafter, 10/01/39 | | | 75,000,000 | | 39,721,500 |
| Prattville IDB Environmental Improvement Revenue, International Paper Co. Projects, | | | | | |
| Series A, 9.25%, 3/01/33 | | | 5,500,000 | | 6,631,240 |
| Selma IDBR, Gulf Opportunity Zone, | | | | | |
| International Paper Co. Project, Series A, 5.375%, 12/01/35 | | | 3,250,000 | | 3,358,745 |
| International Paper Co. Projects, Series A, 5.80%, 5/01/34 | | | 3,000,000 | | 3,153,150 |
| | | | | | 114,003,663 |
| Arizona 2.6% | | | | | |
| Arizona Health Facilities Authority Revenue, Catholic Healthcare West, Series B, | | | | | |
| Sub Series B-1, 5.25%, 3/01/39 | | | 10,000,000 | | 10,366,500 |
| aCasa Grande IDA Hospital Revenue, Casa Grande Regional Medical Center, Series A, 7.25%, | | | | | |
| 12/01/32 | | | 14,500,000 | | 14,065,000 |
| Downtown Phoenix Hotel Corp. Revenue, Subordinate, Series B, NATL RE, FGIC Insured, | | | | | |
| 5.00%, 7/01/36 | | | 10,000,000 | | 10,056,400 |
| Maricopa County IDA Health Facility Revenue, Catholic Healthcare West, Refunding, | | | | | |
| Series A, 5.50%, 7/01/26 | | | 7,500,000 | | 7,594,350 |
| Maricopa County PCC, PCR, | | | | | |
| El Paso Electric Co. Palo Verde Project, Series A, 7.25%, 4/01/40 | | | 20,000,000 | | 22,459,000 |
| Public Service Co. of New Mexico Palo Verde Project, Refunding, Series A, 6.25%, | | | | | |
| 1/01/38 | | | 15,000,000 | | 16,269,600 |
| Navajo County PCC Revenue, Arizona Public Service Co. Cholla Project, Mandatory Put | | | | | |
| 6/01/16, Refunding, Series D , 5.75%, 6/01/34 | | | 10,750,000 | | 11,776,948 |
| Phoenix Civic Improvement Corp. Airport Revenue, | | | | | |
| junior lien, Series A, 5.00%, 7/01/40 | | | 20,000,000 | | 20,499,400 |
| senior lien, Series A, 5.00%, 7/01/38 | | | 15,000,000 | | 15,337,950 |
| Pima County IDAR, Tucson Electric Power Co. Project, Series A, 5.25%, 10/01/40 | | | 15,405,000 | | 15,756,388 |
| Pinal County Electrical District No. 3 Electric System Revenue, Refunding, 5.25%, | | | | | |
| 7/01/41 | | | 10,000,000 | | 10,668,400 |
| Salt Verde Financial Corp. Senior Gas Revenue, | | | | | |
| 5.25%, 12/01/25 | | | 6,000,000 | | 6,732,660 |
| 5.50%, 12/01/29 | | | 11,105,000 | | 12,480,909 |
| University Medical Center Corp. Hospital Revenue, Tucson, | | | | | |
| 6.00%, 7/01/24 | | | 250,000 | | 277,533 |
| 6.25%, 7/01/29 | | | 1,000,000 | | 1,095,300 |
| |
| 116 | Annual Report | | | | | |
| | | | | |
| | Franklin Tax-Free Trust | | | | |
| |
| | Statement of Investments, February 28, 2014 (continued) | | | | |
| |
| |
| | Franklin High Yield Tax-Free Income Fund | | Principal Amount | | Value |
| | Municipal Bonds (continued) | | | | |
| | Arizona (continued) | | | | |
| | University Medical Center Corp. Hospital Revenue, Tucson, (continued) | | | | |
| | 5.00%, 7/01/35 | $ | 10,175,000 | $ | 10,179,477 |
| | 6.50%, 7/01/39 | | 1,500,000 | | 1,644,930 |
| | Yuma County IDA Water and Sewer Exempt Facility Revenue, Far West Water and Sewer Inc. | | | | |
| | Project, Refunding, Series A, 6.375%, 12/01/37 | | 15,500,000 | | 13,492,595 |
| | | | | | 200,753,340 |
| | California 18.2% | | | | |
| | Aliso Viejo CFD No. 2005-01 Special Tax, Glenwood at Aliso Viejo, 6.00%, 9/01/38 | | 5,200,000 | | 5,356,000 |
| | Alvord USD, GO, Election of 2007, Refunding, Series B, AGMC Insured, zero cpn., | | | | |
| | 8/01/41 | | 30,750,000 | | 6,988,552 |
| | Anaheim City School District GO, Capital Appreciation, Election of 2002, AGMC Insured, | | | | |
| | zero cpn., | | | | |
| | 8/01/29 | | 7,000,000 | | 3,261,230 |
| | 8/01/30 | | 5,000,000 | | 2,188,550 |
| | Azusa Special Tax, CFD No. 2005-1, Improvement Area No. 1, 5.00%, 9/01/37 | | 4,280,000 | | 4,292,198 |
| | Bay Area Toll Authority Toll Bridge Revenue, San Francisco Bay Area, Refunding, Series F-1, | | | | |
| | 5.50%, 4/01/43 | | 29,685,000 | | 31,663,802 |
| | Beaumont Financing Authority Local Agency Revenue, Improvement Area No. 19C, Series A, | | | | |
| | 5.35%, 9/01/36 | | 3,680,000 | | 3,685,042 |
| | Beaumont PFAR, Sewer Enterprise Project, Series A, Pre-Refunded, 6.90%, 9/01/23 | | 3,345,000 | | 3,784,132 |
| | California County Tobacco Securitization Agency Tobacco Settlement Revenue, Asset-Backed, | | | | |
| | Alameda County Tobacco Asset Securitization Corp., 5.875%, 6/01/35 | | 3,700,000 | | 3,601,210 |
| | California HFAR, Home Mortgage, Series K, 4.70%, 8/01/31 | | 20,000,000 | | 19,603,200 |
| | California Infrastructure and Economic Development Bank Revenue, North County Center for | | | | |
| Self-Sufficiency Corp. Project, AMBAC Insured, 5.00%, | | | | |
| | 12/01/30 | | 10,300,000 | | 11,210,005 |
| | 12/01/35 | | 5,000,000 | | 5,323,850 |
| | California PCFA Water Facilities Revenue, American Water Capital Corp. Project, 5.25%, | | | | |
| | 8/01/40 | | 6,000,000 | | 6,067,980 |
| | California State GO, Various Purpose, | | | | |
| | 6.00%, 4/01/38 | | 28,725,000 | | 32,954,756 |
| | 5.25%, 11/01/40 | | 47,000,000 | | 51,726,320 |
| | Refunding, 5.25%, 3/01/30 | | 70,000,000 | | 79,395,400 |
| | Refunding, 5.50%, 3/01/40 | | 60,000,000 | | 66,296,400 |
| | Refunding, 5.00%, 10/01/41 | | 10,000,000 | | 10,514,000 |
| | California State Health Facilities Financing Authority Revenue, Children’s Hospital of Orange | | | | |
| | County, Series A, 6.50%, | | | | |
| | 11/01/24 | | 5,000,000 | | 6,072,000 |
| | 11/01/38 | | 8,000,000 | | 9,306,000 |
| | California State Municipal Finance Authority Revenue, Harbor Regional Center Project, | | | | |
| | 8.50%, 11/01/39 | | 5,000,000 | | 5,844,300 |
| | California State Public Works Board Lease Revenue, | | | | |
| | Trustees of the California State University, J. Paul Leonard and Sutro Library, Series J, | | | | |
| | 6.00%, 11/01/29 | | 7,365,000 | | 8,602,099 |
| | Trustees of the California State University, J. Paul Leonard and Sutro Library, Series J, | | | | |
| | 6.00%, 11/01/34 | | 17,560,000 | | 20,045,267 |
| | Various Capital Projects, Series A, 5.00%, 4/01/30 | | 17,785,000 | | 19,243,370 |
Annual Report | 117
| | | | |
| Franklin Tax-Free Trust | | | | |
| |
| Statement of Investments, February 28, 2014 (continued) | | | | |
| |
| |
| Franklin High Yield Tax-Free Income Fund | | Principal Amount | | Value |
| Municipal Bonds (continued) | | | | |
| California (continued) | | | | |
| California Statewide CDA Revenue, | | | | |
| American Baptist Homes of the West, Refunding, 6.00%, 10/01/29 | $ | 3,125,000 | $ | 3,281,406 |
| American Baptist Homes of the West, Refunding, 6.25%, 10/01/39 | | 5,000,000 | | 5,211,700 |
| Monterey Institute International, 5.50%, 7/01/31 | | 13,240,000 | | 14,750,949 |
| St. Joseph Health System, Series B, FGIC Insured, 5.75%, 7/01/47 | | 5,000,000 | | 5,366,400 |
| St. Joseph Health System, Series E, AGMC Insured, 5.25%, 7/01/47 | | 10,000,000 | | 10,216,100 |
| Sutter Health, Refunding, Series A, 5.00%, 11/15/43 | | 25,000,000 | | 25,273,250 |
| Thomas Jefferson School of Law, Refunding, Series A, 7.25%, 10/01/38 | | 11,730,000 | | 6,803,400 |
| California Statewide CDA Special Tax Revenue, CFD No. 2007-01, Orinda Wilder Project, | | | | |
| Series A, 6.00%, 9/01/37 | | 10,000,000 | | 10,020,900 |
| Centinela Valley UHSD, GO, County of Los Angeles, Election of 2010, Series B, | | | | |
| AGMC Insured, zero cpn., 8/01/37 | | 8,400,000 | | 2,207,352 |
| Chabot-Las Positas Community College District GO, Capital Appreciation, Series C, | | | | |
| AMBAC Insured, zero cpn., | | | | |
| 8/01/33 | | 15,000,000 | | 5,415,000 |
| 8/01/34 | | 10,000,000 | | 3,391,500 |
| 8/01/45 | | 16,035,000 | | 2,728,035 |
| Chino CFD Special Tax, No. 03-3, Improvement Area 2, 5.00%, 9/01/36 | | 2,215,000 | | 2,064,956 |
| Chula Vista CFD Special Tax, No. 13-I, Otay Ranch Village Seven, 5.35%, 9/01/36 | | 1,765,000 | | 1,584,299 |
| Compton Community College District GO, Election of 2002, Series D, Build America Mutual | | | | |
| Assurance, zero cpn., | | | | |
| 8/01/30 | | 3,425,000 | | 1,282,868 |
| 8/01/32 | | 4,000,000 | | 1,282,760 |
| 8/01/34 | | 4,560,000 | | 1,244,652 |
| 8/01/36 | | 5,250,000 | | 1,228,028 |
| 8/01/37 | | 3,065,000 | | 664,829 |
| 8/01/38 | | 6,000,000 | | 1,205,520 |
| El Dorado County CFD No. 2001-1 Special Tax, Promontory Specific Plan, 6.30%, | | | | |
| 9/01/31 | | 3,500,000 | | 3,515,260 |
| Foothill/Eastern Transportation Corridor Agency Toll Road Revenue, | | | | |
| Capital Appreciation, Refunding, Series A, AGMC Insured, zero cpn. to 1/15/24, | | | | |
| 5.50% thereafter, 1/15/31 | | 7,295,000 | | 4,522,170 |
| Capital Appreciation, Refunding, Series A, zero cpn. to 1/15/24, 5.40% thereafter, | | | | |
| 1/15/30 | | 10,000,000 | | 6,215,700 |
| junior lien, Refunding, Series C, 6.25%, 1/15/33 | | 17,580,000 | | 18,544,439 |
| junior lien, Refunding, Series C, 6.50%, 1/15/43 | | 28,790,000 | | 30,262,608 |
| Golden State Tobacco Securitization Corp. Tobacco Settlement Revenue, Enhanced, | | | | |
| Asset-Backed, Refunding, Series A, | | | | |
| 5.00%, 6/01/45 | | 15,750,000 | | 15,576,750 |
| AMBAC Insured, 5.00%, 6/01/45 | | 13,250,000 | | 13,104,250 |
| Livermore CFD Special Tax, No. 06-1, Shea Properties, 5.40%, 9/01/36 | | 6,595,000 | | 5,871,792 |
| Los Angeles Department of Airports Revenue, Los Angeles International Airport, Senior, | | | | |
| Series D, 5.00%, 5/15/40 | | 52,685,000 | | 55,576,880 |
| Los Angeles MFR, Refunding, | | | | |
| Series J-1C, 7.125%, 1/01/24 | | 25,000 | | 24,997 |
| aSeries J-2C, 8.50%, 1/01/24 | | 130,000 | | 129,960 |
| Los Angeles USD, GO, Series KRY, 5.25%, 7/01/34 | | 36,625,000 | | 40,845,665 |
118 | Annual Report
| | | | |
| Franklin Tax-Free Trust | | | | |
| |
| Statement of Investments, February 28, 2014 (continued) | | | | |
| |
| |
| Franklin High Yield Tax-Free Income Fund | | Principal Amount | | Value |
| Municipal Bonds (continued) | | | | |
| California (continued) | | | | |
| M-S-R Energy Authority Gas Revenue, | | | | |
| Series B, 6.125%, 11/01/29 | $ | 30,505,000 | $ | 36,643,216 |
| Series B, 7.00%, 11/01/34 | | 20,000,000 | | 26,194,800 |
| Series C, 6.50%, 11/01/39 | | 20,000,000 | | 25,192,000 |
| Novato RDA Tax Allocation, Hamilton Field Redevelopment Project, 6.75%, 9/01/40 | | 3,750,000 | | 4,160,662 |
| Palmdale Elementary School District Special Tax, CFD No. 90-1, Series A, AGMC Insured, | | | | |
| zero cpn., 8/01/28 | | 1,500,000 | | 715,005 |
| zero cpn., 8/01/30 | | 1,250,000 | | 519,025 |
| zero cpn., 8/01/31 | | 1,250,000 | | 484,513 |
| zero cpn. to 8/01/25, 5.625% thereafter, 8/01/34 | | 2,500,000 | | 1,328,900 |
| Perris UHSD Financing Authority Special Tax, | | | | |
| 5.75%, 9/01/30 | | 1,690,000 | | 1,739,652 |
| 6.00%, 9/01/33 | | 2,570,000 | | 2,652,163 |
| 6.125%, 9/01/41 | | 5,500,000 | | 5,664,450 |
| Poway USD Special Tax, CFD No. 14, Del Sur, 5.25%, 9/01/36 | | 7,465,000 | | 7,627,140 |
| Riverside County Transportation Commission Toll Revenue, senior lien, | | | | |
| Series A, 5.75%, 6/01/44 | | 6,065,000 | | 6,311,239 |
| Series A, zero cpn., 6/01/42 | | 7,000,000 | | 1,115,730 |
| Series B, zero cpn., 6/01/32 | | 4,000,000 | | 1,318,120 |
| Series B, zero cpn., 6/01/33 | | 5,500,000 | | 1,683,220 |
| Series B, zero cpn., 6/01/41 | | 5,000,000 | | 852,750 |
| Rocklin Special Tax, CFD No. 10, Whitney Ranch, 5.00%, 9/01/35 | | 7,030,000 | | 7,032,742 |
| Romoland School District Special Tax, CFD No. 1, | | | | |
| Improvement Area 1, 5.35%, 9/01/28 | | 7,015,000 | | 7,045,796 |
| Improvement Area 1, 5.40%, 9/01/36 | | 6,175,000 | | 6,200,317 |
| Improvement Area 2, 5.35%, 9/01/38 | | 7,900,000 | | 7,906,636 |
| Roseville Special Tax, CFD No. 1, Westpark, 5.25%, 9/01/25 | | 1,550,000 | | 1,552,837 |
| San Buenaventura Revenue, Community Memorial Health System, | | | | |
| 8.00%, 12/01/31 | | 10,000,000 | | 11,834,100 |
| 7.50%, 12/01/41 | | 15,000,000 | | 16,898,550 |
| San Diego USD, GO, Election of 2008, Series E, zero cpn. to 7/01/32, | | | | |
| 5.25% thereafter, 7/01/42 | | 44,565,000 | | 17,331,774 |
| 5.375% thereafter, 7/01/47 | | 33,305,000 | | 12,584,627 |
| San Francisco City and County COP, Multiple Capital Improvement Projects, Series A, | | | | |
| 5.00%, 4/01/29 | | 10,000,000 | | 10,807,200 |
| San Francisco City and County RDA Lease Revenue, George R. Moscone Convention Center, | | | | |
| zero cpn., 7/01/14 | | 2,250,000 | | 2,242,058 |
| San Joaquin Hills Transportation Corridor Agency Toll Road Revenue, | | | | |
| Capital Appreciation, junior lien, ETM, zero cpn., 1/01/24 | | 52,700,000 | | 40,534,732 |
| Capital Appreciation, Refunding, Series A, 5.60%, 1/15/16 | | 22,500,000 | | 22,993,875 |
| Capital Appreciation, Refunding, Series A, 5.65%, 1/15/17 | | 20,000,000 | | 20,436,200 |
| Capital Appreciation, Refunding, Series A, zero cpn. to 7/15/21, 5.75% thereafter, | | | | |
| 1/15/41 | | 35,256,000 | | 18,747,378 |
| Capital Appreciation, Refunding, Series A, zero cpn. to 7/15/21, 5.75% thereafter, | | | | |
| 1/15/42 | | 35,256,000 | | 18,684,622 |
| Capital Appreciation, senior lien, 5.00%, 1/01/33 | | 44,970,000 | | 41,507,760 |
| junior lien, ETM, zero cpn., 1/01/25 | | 45,200,000 | | 33,418,620 |
| junior lien, ETM, zero cpn., 1/01/26 | | 131,900,000 | | 92,328,681 |
| junior lien, ETM, zero cpn., 1/01/27 | | 139,100,000 | | 92,351,272 |
| |
| | | | | Annual Report | 119 |
| | | | | |
| | Franklin Tax-Free Trust | | | | |
| |
| | Statement of Investments, February 28, 2014 (continued) | | | | |
| |
| |
| | Franklin High Yield Tax-Free Income Fund | | Principal Amount | | Value |
| | Municipal Bonds (continued) | | | | |
| | California (continued) | | | | |
| | San Jose Special Hotel Tax Revenue, Convention Center Expansion and Renovation Project, | | | | |
| | 6.50%, 5/01/42 | $ | 10,000,000 | $ | 11,243,800 |
| | San Mateo-Foster City School District GO, Capital Appreciation, Election of 2008, Series A, | | | | |
| | zero cpn. to 8/01/26, 6.625% thereafter, 8/01/42 | | 40,000,000 | | 21,607,200 |
| | San Mateo UHSD, GO, Capital Appreciation, Election of 2010, Refunding, Series A, | | | | |
| | zero cpn. to 9/01/28, 6.70% thereafter, 9/01/41 | | 20,000,000 | | 10,753,400 |
| | Seal Beach CFD No. 2005-01 Special Tax, Pacific Gateway Business Center, 5.30%, | | | | |
| | 9/01/36 | | 2,000,000 | | 1,901,720 |
| | South Bayside Waste Management Authority Solid Waste Enterprise Revenue, Shoreway | | | | |
| | Environmental Center, Series A, 6.00%, 9/01/36 | | 7,740,000 | | 8,295,190 |
| | Southern California Public Power Authority Gas Project Revenue, Project No. 1, Series A, | | | | |
| | 5.25%, 11/01/27 | | 9,855,000 | | 10,943,189 |
| | Stockton 1915 Act Special Assessment, Limited Obligation, Mosher AD No. 2003-2, | | | | |
| | 6.30%, 9/02/33 | | 6,000,000 | | 6,045,780 |
| | a,b,cStockton PFA Lease Revenue, Capital Improvement Projects, Series A, | | | | |
| | 6.75%, 9/01/29 | | 15,905,000 | | 1,590,500 |
| | 7.00%, 9/01/38 | | 12,175,000 | | 1,217,500 |
| | Tustin CFD No. 06-01 Special Tax, Legacy/Columbus Villages, Series A, 6.00%, 9/01/36 | | 19,810,000 | | 20,139,242 |
| | | | | | 1,416,819,921 |
| | Colorado 3.9% | | | | |
| | Colorado State Health Facilities Authority Revenue, Hospital, Refunding, Series C, | | | | |
| | AGMC Insured, 5.25%, 3/01/40 | | 20,000,000 | | 20,654,200 |
| | Denver City and County Airport System Revenue, Series B, 4.00%, 11/15/43 | | 10,250,000 | | 9,379,775 |
| | Denver City and County Special Facilities Airport Revenue, United Air Lines Project, | | | | |
| | Refunding, Series A, 5.25%, 10/01/32 | | 5,000,000 | | 4,733,050 |
| | Denver Convention Center Hotel Authority Revenue, senior bond, Refunding, XLCA Insured, | | | | |
| | 5.00%, 12/01/30 | | 15,000,000 | | 15,139,950 |
| | Denver Health and Hospital Authority Healthcare Recovery Zone Facility Revenue, Series A, | | | | |
| Pre-Refunded, 6.25%, 12/01/33 | | 4,000,000 | | 4,178,880 |
| | E-470 Public Highway Authority Senior Revenue, | | | | |
| | Capital Appreciation, Series A, NATL Insured, zero cpn., 9/01/28 | | 15,000,000 | | 7,119,600 |
| | Capital Appreciation, Series B, NATL Insured, zero cpn., 9/01/29 | | 10,000,000 | | 4,248,600 |
| | Capital Appreciation, Series B, NATL Insured, zero cpn., 9/01/30 | | 17,300,000 | | 6,893,531 |
| | Capital Appreciation, Series B, NATL Insured, zero cpn., 9/01/31 | | 10,000,000 | | 3,736,500 |
| | Current Interest, Series C, 5.375%, 9/01/26 | | 5,000,000 | | 5,359,950 |
| | Series A, Sub Series A-1, NATL Insured, 5.50%, 9/01/24 | | 10,000,000 | | 10,414,800 |
| | Series C, Sub Series C-1, NATL Insured, 5.50%, 9/01/24 | | 3,000,000 | | 3,124,440 |
| | Series D, Sub Series D-1, NATL Insured, 5.50%, 9/01/24 | | 6,000,000 | | 6,248,880 |
| | Eagle County Sports and Housing Facilities Revenue, Vail Associate Project, Refunding, | | | | |
| | 6.95%, 8/01/19 | | 41,200,000 | | 41,708,820 |
| | Plaza Metropolitan District No. 1 Revenue, Refunding, 5.00%, 12/01/40 | | 3,000,000 | | 2,871,870 |
| | Public Authority for Colorado Energy Natural Gas Purchase Revenue, | | | | |
| | 6.125%, 11/15/23 | | 2,465,000 | | 2,925,979 |
| | 6.25%, 11/15/28 | | 12,500,000 | | 14,758,125 |
| | 6.50%, 11/15/38 | | 90,100,000 | | 113,180,016 |
| | Regional Transportation District COP, Series A, 5.00%, 6/01/25 | | 13,500,000 | | 14,672,745 |
120 | Annual Report
| | | | |
| Franklin Tax-Free Trust | | | | |
| |
| Statement of Investments, February 28, 2014 (continued) | | | | |
| |
| |
| Franklin High Yield Tax-Free Income Fund | | Principal Amount | | Value |
| Municipal Bonds (continued) | | | | |
| Colorado (continued) | | | | |
| Superior Metropolitan District No. 1 Special Revenue, Refunding, AMBAC Insured, 5.00%, | | | | |
| 12/01/28 | $ | 7,640,000 | $ | 7,700,127 |
| a,dVillages Castle Rock Metropolitan District No. 4 Revenue, Refunding, 8.50%, 6/01/31 | | 3,000,000 | | 2,448,510 |
| | | | | 301,498,348 |
| Connecticut 0.1% | | | | |
| Connecticut State Health and Educational Facilities Authority Revenue, St. Mary’s Hospital | | | | |
| Issue, Refunding, Series E, 5.50%, 7/01/20 | | 5,650,000 | | 5,650,226 |
| District of Columbia 2.6% | | | | |
| District of Columbia Hospital Revenue, Children’s Hospital Obligated Group, Assured Guaranty, | | | | |
| 5.25%, 7/15/38 | | 11,000,000 | | 11,261,580 |
| District of Columbia Income Tax Secured Revenue, Series C, 4.00%, 12/01/37 | | 8,905,000 | | 8,904,555 |
| District of Columbia Revenue, | | | | |
| American Society of Hematology Issue, 5.00%, 7/01/36 | | 1,500,000 | | 1,522,335 |
| American Society of Hematology Issue, 5.00%, 7/01/42 | | 9,515,000 | | 9,565,810 |
| Assn. of American Medical Colleges Issue, Series B, 5.25%, 10/01/36 | | 12,425,000 | | 13,131,237 |
| Assn. of American Medical Colleges Issue, Series B, 5.00%, 10/01/41 | | 5,010,000 | | 5,159,348 |
| The Catholic University of America Issue, Refunding, 5.00%, 10/01/34 | | 3,750,000 | | 3,892,463 |
| Center for Strategic and International Studies Inc. Issue, Refunding, 6.375%, | | | | |
| 3/01/31 | | 5,200,000 | | 5,390,892 |
| Center for Strategic and International Studies Inc. Issue, Refunding, 6.625%, | | | | |
| 3/01/41 | | 5,500,000 | | 5,684,360 |
| Deed Tax, Series A, 5.00%, 6/01/40 | | 13,000,000 | | 13,335,010 |
| The Methodist Home of the District of Columbia Issue, 6.00%, 1/01/29 | | 4,750,000 | | 4,431,608 |
| The Methodist Home of the District of Columbia Issue, Series A, 7.375%, 1/01/30 | | 2,525,000 | | 2,544,695 |
| The Methodist Home of the District of Columbia Issue, Series A, 7.50%, 1/01/39 | | 4,580,000 | | 4,614,029 |
| District of Columbia Tobacco Settlement FICO Revenue, | | | | |
| Asset-Backed, Refunding, 6.50%, 5/15/33 | | 22,000,000 | | 24,391,400 |
| Capital Appreciation, Asset-Backed, Series A, zero cpn., 6/15/46 | | 175,000,000 | | 19,964,000 |
| Metropolitan Washington D.C. Airports Authority Dulles Toll Road Revenue, Capital | | | | |
| Appreciation, second lien, Series C, Assured Guaranty, zero cpn. to 10/01/16, 6.50% | | | | |
| thereafter, 10/01/41 | | 60,145,000 | | 60,965,979 |
| Washington Convention and Sports Authority Dedicated Tax Revenue, senior lien, Convention | | | | |
| Center Hotel Project, Series A, 5.00%, 10/01/40 | | 10,000,000 | | 10,184,600 |
| | | | | 204,943,901 |
| Florida 6.2% | | | | |
| Bartram Springs CDD Special Assessment, Refunding, 4.75%, 5/01/34 | | 4,500,000 | | 4,313,745 |
| Boggy Creek Improvement District Special Assessment Revenue, Refunding, 5.125%, | | | | |
| 5/01/43 | | 5,000,000 | | 4,653,500 |
| Brevard County Health Facilities Authority Health Facilities Revenue, Health First Inc. | | | | |
| Project, Series B, 7.00%, 4/01/39 | | 6,500,000 | | 7,176,650 |
| Brooks of Bonita Springs CDD Capital Improvement Revenue, 6.85%, 5/01/31 | | 1,180,000 | | 1,180,885 |
| Cape Coral Water and Sewer Revenue, Refunding, Series A, AGMC Insured, 5.00%, | | | | |
| 10/01/42 | | 7,500,000 | | 7,836,000 |
| Championsgate CDD Capital Improvement Revenue, Series A, 6.25%, 5/01/20 | | 1,550,000 | | 1,465,866 |
| Citizens Property Insurance Corp. Revenue, High-Risk Account, senior secured, Series A-1, | | | | |
| 6.00%, 6/01/17 | | 25,000,000 | | 28,938,750 |
Annual Report | 121
| | | | | |
| | Franklin Tax-Free Trust | | | | |
| |
| | Statement of Investments, February 28, 2014 (continued) | | | | |
| |
| |
| | Franklin High Yield Tax-Free Income Fund | | Principal Amount | | Value |
| | Municipal Bonds (continued) | | | | |
| | Florida (continued) | | | | |
| | Citrus County Hospital Board Revenue, Citrus Memorial Hospital, Refunding, 6.375%, | | | | |
| | 8/15/32 | $ | 10,550,000 | $ | 9,958,989 |
| | Collier County Educational Facilities Authority Revenue, | | | | |
| | Ave Maria University Inc. Project, Refunding, Series A, 6.00%, 6/01/33 | | 5,500,000 | | 5,592,950 |
| | Ave Maria University Inc. Project, Refunding, Series A, 6.00%, 6/01/38 | | 12,000,000 | | 12,159,960 |
| | Hodges University Inc. Project, 6.125%, 11/01/43 | | 10,035,000 | | 10,088,487 |
| | East Homestead CDD Special Assessment Revenue, 5.45%, 5/01/36 | | 1,400,000 | | 1,392,762 |
| | Escambia County Environmental Improvement Revenue, International Paper Co. Projects, | | | | |
| | Series A, 9.50%, 3/01/33 | | 7,975,000 | | 9,703,342 |
| | Florida State Board of Education Public Education GO, Capital Outlay, Refunding, Series D, | | | | |
| | 6.00%, 6/01/23 | | 5,000,000 | | 6,369,150 |
| | Greenway ID Special Assessment Revenue, 5.125%, 5/01/43 | | 35,750,000 | | 32,936,475 |
| | Halifax Hospital Medical Center Hospital Revenue, Daytona Beach, Refunding and | | | | |
| | Improvement, Series A, 5.375%, 6/01/46 | | 18,000,000 | | 17,580,780 |
| | Hillsborough County IDA, PCR, Tampa Electric Co. Project, Series A, 5.65%, 5/15/18 | | 6,525,000 | | 7,615,001 |
| | Indian Trace Development District Special Assessment, Isles at Weston Project, 5.50%, | | | | |
| | 5/01/33 | | 2,560,000 | | 2,384,896 |
| | Indigo CDD Capital Improvement Revenue, Refunding, | | | | |
| | Series A, 7.00%, 5/01/31 | | 800,000 | | 735,744 |
| | a,bSeries C, 7.00%, 5/01/30 | | 4,275,451 | | 2,137,726 |
| | Islands at Doral CDD Special Assessment, 6.125%, 5/01/24 | | 1,350,000 | | 1,363,162 |
| | Lake Ashton CDD Revenue, Capital Improvement, Series A, 7.40%, 5/01/32 | | 1,210,000 | | 1,150,202 |
| | Lakeland Retirement Community Revenue, first mortgage, Carpenters Estates, Accredited | | | | |
| | Investors, Refunding, | | | | |
| | 5.875%, 1/01/19 | | 1,070,000 | | 1,175,823 |
| | 6.25%, 1/01/28 | | 1,230,000 | | 1,284,883 |
| | 6.375%, 1/01/43 | | 2,250,000 | | 2,280,892 |
| | Martin County Health Facilities Authority Hospital Revenue, Martin Memorial Medical Center, | | | | |
| | 5.50%, 11/15/42 | | 3,800,000 | | 3,863,992 |
| | Miami-Dade County Aviation Revenue, Miami International Airport, Refunding, Series A, | | | | |
| | 5.50%, 10/01/41 | | 20,850,000 | | 22,293,237 |
| | Miami-Dade County Educational Facilities Authority Revenue, University of Miami Issue, | | | | |
| | Refunding, Series B, AMBAC Insured, 5.25%, 4/01/27 | | 10,995,000 | | 12,527,703 |
| Miami -Dade County Expressway Authority Toll System Revenue, Series A, 5.00%, | | | | |
| | 7/01/40 | | 44,360,000 | | 45,763,107 |
| | Miami-Dade County School Board COP, | | | | |
| | Refunding, Series A, 5.00%, 5/01/31 | | 7,985,000 | | 8,422,498 |
| | Refunding, Series A, 5.00%, 5/01/32 | | 10,000,000 | | 10,417,000 |
| | Series B, Assured Guaranty, 5.00%, 5/01/33 | | 14,310,000 | | 14,857,644 |
| Miami-Dade County Special Obligation Revenue, Refunding, Series A, 5.00%, 10/01/30 | | 10,925,000 | | 11,637,419 |
| | Midtown Miami Community Development Special Assessment Revenue, | | | | |
| | Series A, 6.25%, 5/01/37 | | 7,500,000 | | 7,501,950 |
| | Series B, 6.50%, 5/01/37 | | 3,785,000 | | 3,787,990 |
| | North Sumter County Utility Dependent District Utility Revenue, sub. bond, | | | | |
| | 6.00%, 10/01/30 | | 3,780,000 | | 4,085,953 |
| | 6.25%, 10/01/43 | | 6,865,000 | | 7,308,754 |
| | Northern Palm Beach County ID Special Assessment, Water Control and Improvement, | | | | |
| | Unit of Development No. 46, Series A, 5.35%, 8/01/41 | | 800,000 | | 781,960 |
122 | Annual Report
| | | | | |
| | Franklin Tax-Free Trust | | | | |
| |
| | Statement of Investments, February 28, 2014 (continued) | | | | |
| |
| |
| | Franklin High Yield Tax-Free Income Fund | | Principal Amount | | Value |
| | Municipal Bonds (continued) | | | | |
| | Florida (continued) | | | | |
| | Orlando-Orange County Expressway Authority Revenue, Series C, 5.00%, 7/01/35 | $ | 7,965,000 | $ | 8,310,601 |
| | Palm Glades CDD Revenue, Special Assessment, Series A, 5.30%, 5/01/36 | | 1,100,000 | | 1,035,716 |
| | Pelican Marsh CDD Special Assessment Revenue, Refunding, | | | | |
| | 4.875%, 5/01/22 | | 1,325,000 | | 1,318,309 |
| | 5.375%, 5/01/31 | | 1,500,000 | | 1,494,060 |
| | Pensacola Airport Revenue, Refunding, 6.00%, 10/01/28 | | 7,000,000 | | 7,739,480 |
| | a,bPortofino Landings CDD Special Assessment, Series A, 5.40%, 5/01/38 | | 2,705,000 | | 1,059,819 |
| | River Place St. Lucie CDD Special Assessment Revenue, Series A, 7.625%, | | | | |
| | 5/01/21 | | 750,000 | | 749,963 |
| | 5/01/30 | | 1,590,000 | | 1,547,833 |
| | Somerset CDD Revenue, Capital Improvement, 5.30%, 5/01/37 | | 7,000,000 | | 5,388,390 |
| | South Broward Hospital District Revenue, South Broward Hospital District Obligated Group, | | | | |
| | Refunding, 5.00%, 5/01/36 | | 12,500,000 | | 12,776,500 |
| | South Miami Health Facilities Authority Hospital Revenue, Baptist Health South Florida | | | | |
| | Obligated Group, | | | | |
| | 5.00%, 8/15/32 | | 15,000,000 | | 15,463,200 |
| | Refunding, 5.00%, 8/15/42 | | 15,500,000 | | 15,786,905 |
| South-Dade Venture CDD Special Assessment Revenue, Pre-Refunded, 6.00%, 5/01/24 | | 1,990,000 | | 2,027,830 |
| | Stonegate CDD Special Assessment Revenue, Pre-Refunded, 6.00%, 5/01/24 | | 1,635,000 | | 1,666,081 |
| | Verandah East CDD Revenue, Capital Improvement, Series A, 5.40%, 5/01/37 | | 1,825,000 | | 1,302,192 |
| | Village CDD No. 6 Special Assessment Revenue, Refunding, 4.00%, 5/01/29 | | 6,465,000 | | 6,292,514 |
| | Village CDD No. 8 Special Assessment Revenue, 6.375%, 5/01/38 | | 8,000,000 | | 8,993,840 |
| | Village CDD No. 9 Special Assessment Revenue, | | | | |
| | 6.75%, 5/01/31 | | 8,280,000 | | 9,871,582 |
| | 7.00%, 5/01/41 | | 7,335,000 | | 8,742,366 |
| | Refunding, 5.00%, 5/01/22 | | 1,805,000 | | 1,867,182 |
| | Refunding, 5.25%, 5/01/31 | | 2,190,000 | | 2,279,702 |
| | Refunding, 5.50%, 5/01/42 | | 2,185,000 | | 2,272,116 |
| | Village CDD No. 10 Special Assessment Revenue, | | | | |
| | 5.75%, 5/01/31 | | 2,000,000 | | 2,033,980 |
| | 5.00%, 5/01/32 | | 6,000,000 | | 5,651,220 |
| | 5.125%, 5/01/43 | | 9,000,000 | | 8,364,150 |
| | 6.00%, 5/01/44 | | 8,000,000 | | 8,089,040 |
| | eVillage Center CDD Recreational Revenue, sub. bond, | | | | |
| | Series B, 8.25%, 1/01/17 | | 680,000 | | 683,570 |
| | Series C, 7.375%, 1/01/19 | | 1,485,000 | | 1,491,371 |
| | Waters Edge CDD Capital Improvement Revenue, 5.30%, 5/01/36 | | 1,500,000 | | 1,373,820 |
| | Westchase East CDD Capital Improvement Revenue, 7.10%, 5/01/21 | | 840,000 | | 840,412 |
| | Winter Garden Village at Fowler Groves CDD Special Assessment, 5.65%, 5/01/37 | | 1,820,000 | | 1,848,956 |
| | | | | | 483,088,527 |
| | Georgia 2.8% | | | | |
| | Atlanta Tax Allocation, Princeton Lakes Project, 5.50%, 1/01/31 | | 1,035,000 | | 1,039,430 |
| | Atlanta Water and Wastewater Revenue, Refunding, | | | | |
| | Series A, 6.25%, 11/01/34 | | 30,000,000 | | 34,714,500 |
| | Series B, AGMC Insured, 5.25%, 11/01/34 | | 30,000,000 | | 31,755,000 |
| | Baldwin County Hospital Authority Revenue, Oconee Regional Medical Center, 5.375%, | | | | |
| | 12/01/28 | | 1,470,000 | | 1,372,612 |
Annual Report | 123
| | | | |
| Franklin Tax-Free Trust | | | | |
| |
| Statement of Investments, February 28, 2014 (continued) | | | | |
| |
| |
| Franklin High Yield Tax-Free Income Fund | | Principal Amount | | Value |
| Municipal Bonds (continued) | | | | |
| Georgia (continued) | | | | |
| Burke County Development Authority PCR, Oglethorpe Power Corp. Vogtle Project, | | | | |
| Series C, 5.70%, 1/01/43 | $ | 55,000,000 | $ | 58,100,350 |
| Series E, 7.00%, 1/01/23 | | 25,000,000 | | 28,750,250 |
| Carrollton Payroll Development Authority Revenue, UWG Phase II LLC Project, | | | | |
| AGMC Insured, 5.00%, 6/15/40 | | 2,000,000 | | 2,073,940 |
| Forsyth County Hospital Authority Revenue, Anticipation Certificates, Georgia Baptist Health | | | | |
| Care System Project, ETM, | | | | |
| 6.25%, 10/01/18 | | 3,990,000 | | 4,555,144 |
| 6.375%, 10/01/28 | | 8,000,000 | | 10,018,080 |
| Fulton County Residential Care Revenue, Lenbrook Project, Series A, 5.00%, 7/01/27 | | 5,000,000 | | 4,676,000 |
| Gainesville RDA Educational Facilities Revenue, Riverside Military Academy Project, | | | | |
| Refunding, 5.125%, 3/01/37 | | 6,500,000 | | 5,550,935 |
| Main Street Natural Gas Inc. Revenue, Gas Project, Series A, 5.50%, | | | | |
| 9/15/25 | | 5,000,000 | | 5,593,950 |
| 9/15/27 | | 4,000,000 | | 4,449,240 |
| 9/15/28 | | 10,000,000 | | 11,012,900 |
| Richmond County Development Authority Environmental Improvement Revenue, | | | | |
| International Paper Co. Project, Series A, 6.25%, 11/01/33 | | 7,000,000 | | 7,572,530 |
| Savannah EDA Revenue, Recovery Zone Facility, International Paper Co. Project, Series A, | | | | |
| 6.25%, 11/01/33 | | 4,865,000 | | 5,262,908 |
| | | | | 216,497,769 |
| Hawaii 0.2% | | | | |
| Hawaii State Department of Budget and Finance Special Purpose Revenue, | | | | |
| Hawaii Pacific University Project, Series A, 6.875%, 7/01/43 | | 5,595,000 | | 5,676,855 |
| Hawaiian Electric Co. and Subsidiary Projects, 6.50%, 7/01/39 | | 7,500,000 | | 8,288,175 |
| | | | | 13,965,030 |
| Idaho 0.6% | | | | |
| Idaho Health Facilities Authority Revenue, St. Luke’s Health System Project, Series A, | | | | |
| 6.75%, 11/01/37 | | 12,500,000 | | 13,934,875 |
| Idaho State Housing and Finance Assn. EDR, TDF Facilities Project, Series A, 7.00%, | | | | |
| 2/01/36 | | 13,305,000 | | 14,825,628 |
| Nez Perce County PCR, Potlatch Corp. Projects, Refunding, 6.00%, 10/01/24 | | 22,500,000 | | 22,505,850 |
| | | | | 51,266,353 |
| Illinois 6.0% | | | | |
| Antioch Village Special Service Area No. 1 Special Tax, Deercrest Project, 6.625%, | | | | |
| 3/01/33 | | 3,214,000 | | 2,679,801 |
| Bolingbrook GO, Will and DuPage Counties, Capital Appreciation, Refunding, Series A, | | | | |
| zero cpn., 1/01/35 | | 19,800,000 | | 6,475,788 |
| Bourbonnais Industrial Project Revenue, Olivet Nazarene University Project, 5.50%, | | | | |
| 11/01/40 | | 3,570,000 | | 3,637,366 |
| Bryant PCR, Central Illinois Light Co. Project, Refunding, NATL Insured, 5.90%, 8/01/23 | | 5,000 | | 5,016 |
| Bureau County Township High School District No. 502 GO, School Building, Series A, Build | | | | |
| America Mutual Assurance, 6.625%, 10/01/43 | | 5,250,000 | | 5,944,208 |
| Cary Special Tax, Special Service Area No. 2, Refunding, Radian Insured, 5.00%, | | | | |
| 3/01/30 | | 3,025,000 | | 2,880,919 |
124 | Annual Report
| | | | |
| Franklin Tax-Free Trust | | | | |
| |
| Statement of Investments, February 28, 2014 (continued) | | | | |
| |
| |
| Franklin High Yield Tax-Free Income Fund | | Principal Amount | | Value |
| Municipal Bonds (continued) | | | | |
| Illinois (continued) | | | | |
| Chicago Board of Education GO, Series A, | | | | |
| 5.50%, 12/01/39 | $ | 6,500,000 | $ | 6,726,980 |
| 5.00%, 12/01/42 | | 40,200,000 | | 39,893,676 |
| Chicago GO, Project, Series A, 5.25%, 1/01/35 | | 7,000,000 | | 7,152,320 |
| Chicago O’Hare International Airport Revenue, | | | | |
| General Airport, third lien, Refunding, Series A, AGMC Insured, 5.00%, 1/01/38 | | 16,500,000 | | 16,774,065 |
| General Airport, third lien, Series A, NATL RE, FGIC Insured, 5.00%, 1/01/33 | | 15,000,000 | | 15,286,650 |
| Passenger Facility Charge, Series B, 5.00%, 1/01/35 | | 12,555,000 | | 12,769,690 |
| Passenger Facility Charge, Series B, 5.00%, 1/01/40 | | 20,430,000 | | 20,831,449 |
| Chicago Transit Authority Sales Tax Receipts Revenue, 5.25%, 12/01/36 | | 11,000,000 | | 11,651,310 |
| Chicago Wastewater Transmission Revenue, Project, second lien, 4.00%, 1/01/42 | | 5,000,000 | | 4,326,050 |
| Cook County GO, Refunding, | | | | |
| Series A, 5.25%, 11/15/33 | | 8,720,000 | | 9,155,477 |
| Series C, 5.00%, 11/15/29 | | 34,555,000 | | 37,017,044 |
| Illinois Finance Authority Water Facility Revenue, American Water Capital Corp. Project, | | | | |
| 5.25%, | | | | |
| 10/01/39 | | 15,350,000 | | 15,519,157 |
| 5/01/40 | | 10,415,000 | | 10,523,316 |
| Illinois Health Facilities Authority Revenue, Thorek Hospital and Medical Center, Refunding, | | | | |
| 5.375%, 8/15/28 | | 8,595,000 | | 8,610,643 |
| Illinois State Finance Authority Revenue, | | | | |
| Institute of Technology, 6.50%, 2/01/23 | | 1,000,000 | | 1,079,810 |
| Institute of Technology, 7.125%, 2/01/34 | | 1,500,000 | | 1,620,150 |
| Lutheran Hillside Village, Refunding, 5.25%, 2/01/37 | | 7,500,000 | | 7,285,575 |
| Resurrection Health Care, Series A, AGMC Insured, 5.25%, 5/15/29 | | 15,500,000 | | 16,277,015 |
| Riverside Health System, 6.25%, 11/15/35 | | 5,000,000 | | 5,455,800 |
| Roosevelt University Project, Refunding, 6.25%, 4/01/29 | | 2,500,000 | | 2,586,400 |
| Roosevelt University Project, Refunding, 6.50%, 4/01/39 | | 19,430,000 | | 19,920,219 |
| Rush University Medical Center Obligated Group, Series B, 7.25%, 11/01/38 | | 10,000,000 | | 11,700,500 |
| Sherman Health Systems, Series A, 5.50%, 8/01/37 | | 17,240,000 | | 18,297,502 |
| Illinois State Finance Authority Student Housing Revenue, | | | | |
| CHF-DeKalb II LLC, Northern Illinois University Project, 6.875%, 10/01/43 | | 15,000,000 | | 16,704,150 |
| CHF-Normal LLC, Illinois State University Project, 7.00%, 4/01/43 | | 7,500,000 | | 8,220,375 |
| Illinois State GO, | | | | |
| 5.25%, 7/01/29 | | 15,000,000 | | 16,251,900 |
| 5.25%, 7/01/31 | | 5,000,000 | | 5,329,700 |
| 5.50%, 7/01/38 | | 5,000,000 | | 5,349,400 |
| Metropolitan Pier and Exposition Authority Dedicated State Tax Revenue, | | | | |
| Capital Appreciation, McCormick Place Expansion Project, Series A, NATL Insured, | | | | |
| zero cpn., 6/15/35 | | 10,000,000 | | 3,265,200 |
| Capital Appreciation, McCormick Place Expansion Project, Refunding, Series B, | | | | |
| AGMC Insured, 6/15/45 | | 18,100,000 | | 3,082,792 |
| McCormick Place Expansion Project, Series A, 5.50%, 6/15/50 | | 10,475,000 | | 10,764,739 |
| Metropolitan Pier and Exposition Authority Hospitality Facilities Revenue, McCormick Place | | | | |
| Convention Center, ETM, 7.00%, 7/01/26 | | 7,500,000 | | 10,093,425 |
| Minooka Special Assessment, Improvement, Prairie Ridge Project, 6.875%, 3/01/33 | | 2,836,000 | | 2,839,290 |
| Otter Creek Water Reclamation District Kane County GO, Separate Waterworks and Sewerage | | | | |
| Systems Alternate Revenue Source, Refunding, XLCA Insured, 5.00%, 1/01/39 | | 3,000,000 | | 3,023,340 |
Annual Report | 125
| | | | | |
| | Franklin Tax-Free Trust | | | | |
| |
| | Statement of Investments, February 28, 2014 (continued) | | | | |
| |
| |
| | Franklin High Yield Tax-Free Income Fund | | Principal Amount | | Value |
| | Municipal Bonds (continued) | | | | |
| | Illinois (continued) | | | | |
| | Plano Special Service Area No. 2 Special Tax, Lakewood Springs Project, Series B, 6.375%, | | | | |
| | 3/01/34 | $ | 7,575,000 | $ | 7,614,769 |
| | Railsplitter Tobacco Settlement Authority Revenue, | | | | |
| | 6.25%, 6/01/24 | | 6,000,000 | | 6,643,260 |
| | Refunding, 6.00%, 6/01/28 | | 24,650,000 | | 28,002,153 |
| | Wauconda Special Service Area No. 1 Special Tax, Liberty Lakes Project, | | | | |
| | 6.00%, 3/01/33 | | 4,307,000 | | 4,357,521 |
| | 6.625%, 3/01/33 | | 5,097,000 | | 5,152,404 |
| | Yorkville United City Special Service Area Special Tax, | | | | |
| | No. 2004-104, MPI Grande Reserve Project, 6.375%, 3/01/34 | | 4,084,000 | | 3,564,842 |
| | No. 2005-108, Autumn Creek Project, 6.00%, 3/01/36 | | 4,245,000 | | 3,837,989 |
| | | | | | 466,181,145 |
| | Indiana 1.8% | | | | |
| | Carmel RDA Lease Rental Revenue, Multipurpose, Series A, 4.00%, 2/01/38 | | 7,220,000 | | 7,024,482 |
| | Delaware County Hospital Authority Hospital Revenue, Cardinal Health System Obligated | | | | |
| | Group, 5.25%, 8/01/36 | | 5,000,000 | | 5,085,500 |
| | Indiana Finance Authority Midwestern Disaster Relief Revenue, Ohio Valley Electric Corp. | | | | |
| | Project, Series A, 5.00%, 6/01/32 | | 10,000,000 | | 9,928,300 |
| | Indiana Health and Educational Facility Financing Authority Hospital Revenue, Community | | | | |
| | Foundation of Northwest Indiana Obligated Group, 5.50%, 3/01/37 | | 8,000,000 | | 8,298,320 |
| | Indiana Health and Educational Facility Financing Authority Revenue, Baptist Homes of | | | | |
| | Indiana, Refunding, 5.25%, 11/15/35 | | 12,000,000 | | 11,785,680 |
| | Indiana Health Facility Financing Authority Hospital Revenue, Community Foundation of | | | | |
| | Northwest Indiana Obligated Group, Pre-Refunded, | | | | |
| | 6.25%, 3/01/25 | | 5,900,000 | | 5,959,000 |
| | 6.00%, 3/01/34 | | 12,000,000 | | 12,120,000 |
| | Indiana State Finance Authority Revenue, | | | | |
| | Baptist Homes of Indiana Senior Living, 5.75%, 11/15/41 | | 5,000,000 | | 5,083,350 |
| | Educational Facilities, Marian University Project, 6.375%, 9/15/41 | | 12,500,000 | | 12,765,125 |
| | Greencroft Obligated Group, Series A, 7.00%, 11/15/43 | | 5,000,000 | | 5,137,300 |
| | Private Activity, Ohio River Bridges East End Crossing Project, Series A, 5.00%, | | | | |
| | 7/01/40 | | 12,500,000 | | 12,536,125 |
| | Indiana State Finance Authority Wastewater Utility Revenue, CWA Authority Project, | | | | |
| | first lien, Series A, 4.00%, 10/01/42 | | 22,620,000 | | 20,726,028 |
| | Indiana State Municipal Power Agency Power Supply System Revenue, Series B, 6.00%, | | | | |
| | 1/01/39 | | 4,000,000 | | 4,468,880 |
| | Jasper County PCR, Northern Indiana Public Service Co. Project, Refunding, Series C, | | | | |
| | NATL Insured, | | | | |
| | 5.60%, 11/01/16 | | 10,000,000 | | 10,939,900 |
| | 5.85%, 4/01/19 | | 5,000,000 | | 5,690,950 |
| | | | | | 137,548,940 |
| | Iowa 0.5% | | | | |
| | Iowa Higher Education Loan Authority Revenue, Private College Facility, Upper Iowa | | | | |
| | University Project, Refunding, 6.00%, 9/01/39 | | 11,000,000 | | 11,082,500 |
| | Tobacco Settlement Authority Tobacco Settlement Revenue, Capital Appreciation, | | | | |
| Asset -Backed, Refunding, Series B, 5.60%, 6/01/34 | | 35,850,000 | | 31,546,925 |
| | | | | | 42,629,425 |
| |
| | 126 | Annual Report | | | | |
| | | | |
| Franklin Tax-Free Trust | | | | |
| |
| Statement of Investments, February 28, 2014 (continued) | | | | |
| |
| |
| Franklin High Yield Tax-Free Income Fund | | Principal Amount | | Value |
| Municipal Bonds (continued) | | | | |
| Kansas 0.1% | | | | |
| Kansas State Development Finance Authority Hospital Revenue, Adventist Health System/ | | | | |
| Sunbelt Obligated Group, Refunding, Series C, 5.75%, 11/15/38 | $ | 6,250,000 | $ | 6,844,938 |
| Kentucky 1.1% | | | | |
| Kentucky Economic Development Finance Authority Hospital Revenue, Owensboro Medical | | | | |
| Health System Inc., Refunding, Series A, 6.50%, 3/01/45 | | 18,330,000 | | 19,344,382 |
| Kentucky Economic Development Finance Authority Louisville Arena Project Revenue, | | | | |
| Louisville Arena Authority Inc., Series A, Sub Series A-1, Assured Guaranty, 6.00%, | | | | |
| 12/01/42 | | 5,000,000 | | 5,171,050 |
| Kentucky State Public Transportation Infrastructure Authority First Tier Toll Revenue, | | | | |
| Downtown Crossing Project, | | | | |
| zero cpn. to 6/30/13, 6.60% thereafter, 7/01/39 | | 10,000,000 | | 5,854,100 |
| zero cpn. to 6/30/23, 6.75% thereafter, 7/01/43 | | 5,000,000 | | 2,887,150 |
| Louisville/Jefferson County Metro Government College Revenue, Improvement, Bellarmine | | | | |
| University Inc. Project, | | | | |
| 5.625%, 5/01/29 | | 5,555,000 | | 5,793,199 |
| 6.125%, 5/01/39 | | 5,000,000 | | 5,261,200 |
| Louisville/Jefferson County Metro Government Health Facilities Revenue, Jewish Hospital | | | | |
| and St. Mary’s HealthCare Inc. Project, Pre-Refunded, 6.125%, 2/01/37 | | 11,500,000 | | 13,889,470 |
| Ohio County PCR, Big Rivers Electric Corp. Project, Refunding, Series A, 6.00%, 7/15/31 | | 10,500,000 | | 8,911,665 |
| Owen County Waterworks System Revenue, American Water Co. Project, Series A, | | | | |
| 6.25%, 6/01/39 | | 8,000,000 | | 8,462,720 |
| 5.375%, 6/01/40 | | 10,000,000 | | 10,182,000 |
| | | | | 85,756,936 |
| Louisiana 3.0% | | | | |
| Beauregard Parish Revenue, Boise Cascade Corp. Project, Refunding, 6.80%, 2/01/27 | | 13,990,000 | | 14,022,876 |
| Louisiana Local Government Environmental Facilities and CDA Revenue, Westlake Chemical | | | | |
| Corp. Projects, | | | | |
| 6.75%, 11/01/32 | | 41,250,000 | | 44,271,150 |
| Series A, 6.50%, 8/01/29 | | 9,000,000 | | 10,055,250 |
| Series A-2, 6.50%, 11/01/35 | | 8,000,000 | | 8,790,240 |
| Louisiana Public Facilities Authority Hospital Revenue, Franciscan Missionaries of Our Lady | | | | |
| Health System Project, Series A, 6.75%, 7/01/39 | | 10,000,000 | | 11,148,600 |
| Louisiana Public Facilities Authority Revenue, | | | | |
| Entergy Gulf States Louisiana LLC Project, Refunding, Series A, 5.00%, 9/01/28 | | 25,000,000 | | 25,656,500 |
| Ochsner Clinic Foundation Project, 6.50%, 5/15/37 | | 5,000,000 | | 5,448,100 |
| Ochsner Clinic Foundation Project, 6.75%, 5/15/41 | | 15,500,000 | | 17,003,035 |
| Ochsner Clinic Foundation Project, Series B, 5.25%, 5/15/38 | | 10,000,000 | | 10,060,500 |
| Ochsner Clinic Foundation Project, Series B, 5.50%, 5/15/47 | | 10,000,000 | | 10,089,300 |
| New Orleans GO, | | | | |
| Limited Tax, NATL Insured, 5.00%, 3/01/21 | | 5,000,000 | | 5,125,800 |
| Public Improvement, Series A, Radian Insured, 5.25%, 12/01/36 | | 13,480,000 | | 13,725,875 |
| St. John the Baptist Parish Revenue, Marathon Oil Corp. Project, Series A, 5.125%, | | | | |
| 6/01/37 | | 56,075,000 | | 57,026,593 |
| Tobacco Settlement FICO Revenue, Tobacco Settlement Asset-Backed, Refunding, Series A, | | | | |
| 5.25%, 5/15/35 | | 1,000,000 | | 1,027,820 |
| | | | | 233,451,639 |
Annual Report | 127
| | | | |
| Franklin Tax-Free Trust | | | | |
| |
| Statement of Investments, February 28, 2014 (continued) | | | | |
| |
| |
| Franklin High Yield Tax-Free Income Fund | | Principal Amount | | Value |
| Municipal Bonds (continued) | | | | |
| Maine 0.3% | | | | |
| Maine State Health and Higher Educational Facilities Authority Revenue, Maine General | | | | |
| Medical Center Issue, | | | | |
| 6.75%, 7/01/36 | $ | 4,250,000 | $ | 4,614,183 |
| 7.00%, 7/01/41 | | 10,000,000 | | 10,975,100 |
| Rumford PCR, Boise Cascade Corp. Project, Refunding, 6.625%, 7/01/20 | | 4,800,000 | | 4,819,104 |
| | | | | 20,408,387 |
| Maryland 0.6% | | | | |
| Harford County Special Obligation Tax Allocation, Beachtree Estates Project, 7.50%, | | | | |
| 7/01/40 | | 7,000,000 | | 7,352,380 |
| Maryland State Community Development Administration Department of Housing and CDR, | | | | |
| Housing, Series A, 5.875%, 7/01/16 | | 320,000 | | 320,352 |
| Maryland State EDC Port Facilities Revenue, CNX MarineTerminals Inc. Port of Baltimore | | | | |
| Facility, Refunding, 5.75%, 9/01/25 | | 8,600,000 | | 9,085,212 |
| bMaryland State EDC Revenue, Chesapeake Bay Conference Center Project, senior lien, | | | | |
| Refunding, | | | | |
| Series A, 5.00%, 12/01/16 | | 2,500,000 | | 1,249,375 |
| Series A, 5.00%, 12/01/31 | | 10,000,000 | | 4,997,500 |
| Series B, 5.00%, 12/01/16 | | 400,000 | | 199,900 |
| Series B, 5.25%, 12/01/31 | | 2,000,000 | | 999,500 |
| Maryland State EDC, EDR, 5.75%, 6/01/35 | | 13,070,000 | | 13,413,349 |
| Maryland State Health and Higher Educational Facilities Authority Revenue, | | | | |
| Anne Arundel Health System Issue, Series A, 6.75%, 7/01/39 | | 3,000,000 | | 3,506,010 |
| Edenwald Issue, Series A, 5.40%, 1/01/37 | | 1,200,000 | | 1,202,496 |
| Washington County Hospital Issue, 6.00%, 1/01/43 | | 6,000,000 | | 6,089,220 |
| | | | | 48,415,294 |
| Massachusetts 1.3% | | | | |
| Massachusetts Bay Transportation Authority Revenue, | | | | |
| Assessment, Refunding, Series A, 4.00%, 7/01/37 | | 15,000,000 | | 14,909,250 |
| General Transportation System, Series A, 7.00%, 3/01/21 | | 775,000 | | 980,220 |
| General Transportation System, Series A, ETM, 7.00%, 3/01/21 | | 930,000 | | 1,019,131 |
| Massachusetts State Development Finance Agency Resource Recovery Revenue, Covanta | | | | |
| Energy Project, Refunding, Series C, 5.25%, 11/01/42 | | 5,000,000 | | 4,820,350 |
| Massachusetts State Development Finance Agency Revenue, | | | | |
| Berkshire Retirement Community Issue, first mortgage, 5.60%, 7/01/19 | | 685,000 | | 685,582 |
| Berkshire Retirement Community Issue, first mortgage, 5.625%, 7/01/29 | | 1,620,000 | | 1,620,421 |
| North Hill Communities Issue, Series A, 6.25%, 11/15/28 | | 2,250,000 | | 2,270,903 |
| North Hill Communities Issue, Series A, 6.25%, 11/15/33 | | 2,000,000 | | 1,986,340 |
| North Hill Communities Issue, Series A, 6.50%, 11/15/43 | | 4,125,000 | | 4,050,008 |
| Massachusetts State Development Finance Agency Solid Waste Disposal Revenue, | | | | |
| Mandatory Put 5/01/19, Pre-Refunded, 5.75%, 12/01/42 | | 3,700,000 | | 4,564,172 |
| Massachusetts State Educational Financing Authority Education Loan Revenue, Refunding, | | | | |
| Series K, 5.25%, 7/01/29 | | 10,000,000 | | 10,360,600 |
| Massachusetts State Port Authority Special Facilities Revenue, ConRAC Project, Series A, | | | | |
| 5.125%, 7/01/41 | | 10,340,000 | | 10,778,002 |
| Massachusetts State Special Obligation Dedicated Tax Revenue, Refunding, NATL RE, | | | | |
| FGIC Insured, 5.50%, 1/01/34 | | 35,000,000 | | 41,130,250 |
| | | | | 99,175,229 |
| |
| 128 | Annual Report | | | | |
| | | | |
| Franklin Tax-Free Trust | | | | |
| |
| Statement of Investments, February 28, 2014 (continued) | | | | |
| |
| |
| Franklin High Yield Tax-Free Income Fund | | Principal Amount | | Value |
| Municipal Bonds (continued) | | | | |
| Michigan 4.2% | | | | |
| Detroit City School District GO, School Building and Site Improvement, Series A, | | | | |
| AGMC Insured, 6.00%, 5/01/29 | $ | 15,900,000 | $ | 17,208,411 |
| Detroit GO, Distribution State Aid, 5.25%, 11/01/35 | | 23,000,000 | | 23,451,030 |
| Detroit Sewage Disposal System Revenue, second lien, | | | | |
| Series A, NATL Insured, 5.00%, 7/01/35 | | 25,750,000 | | 24,610,047 |
| Series B, Assured Guaranty, 5.00%, 7/01/36 | | 10,000,000 | | 9,558,900 |
| Series B, NATL Insured, 5.00%, 7/01/36 | | 3,000,000 | | 2,848,920 |
| Series B, NATL RE, FGIC Insured, 5.50%, 7/01/29 | | 5,000,000 | | 5,156,700 |
| Detroit Water and Sewerage Department Sewage Disposal System Revenue, senior lien, | | | | |
| Refunding, Series A, 5.25%, 7/01/39 | | 12,000,000 | | 11,481,120 |
| Detroit Water Supply System Revenue, | | | | |
| Refunding, Series D, NATL Insured, 5.00%, 7/01/33 | | 20,430,000 | | 19,837,121 |
| second lien, Refunding, Series C, AGMC Insured, 5.00%, 7/01/33 | | 11,000,000 | | 10,891,650 |
| Ecorse City GO, Financial Recovery, Dedicated Tax, 6.50%, 11/01/35 | | 5,215,000 | | 5,388,816 |
| Garden City Hospital Finance Authority Hospital Revenue, Garden City Hospital Obligated | | | | |
| Group, Refunding, Series A, | | | | |
| 5.75%, 9/01/17 | | 355,000 | | 354,993 |
| 5.00%, 8/15/38 | | 5,250,000 | | 5,056,905 |
| Michigan State Building Authority Revenue, Facilities Program, Refunding, | | | | |
| Series I, 6.00%, 10/15/38 | | 6,000,000 | | 6,663,060 |
| Series II-A, 5.375%, 10/15/41 | | 10,000,000 | | 10,751,500 |
| Michigan State Finance Authority Revenue, | | | | |
| Hospital, Trinity Health Credit Group, Refunding, Series MI, 5.00%, 12/01/39 | | 27,600,000 | | 28,546,128 |
| School District of the City of Detroit, Refunding, 5.50%, 6/01/21 | | 10,000,000 | | 11,259,200 |
| Michigan State Hospital Finance Authority Revenue, | | | | |
| Marquette General Hospital Obligated Group, Series A, Pre-Refunded, 5.00%, 5/15/34 | | 6,000,000 | | 6,339,660 |
| MidMichigan Obligated Group, Series A, 6.125%, 6/01/34 | | 4,065,000 | | 4,505,809 |
| Oakwood Obligated Group, Refunding, Series A, 5.00%, 7/15/37 | | 3,680,000 | | 3,691,040 |
| Trinity Health Credit Group, Refunding, Series C, 5.00%, 12/01/34 | | 28,860,000 | | 30,287,993 |
| Michigan State Strategic Fund Limited Obligation Revenue, The Dow Chemical Co. Project, | | | | |
| Mandatory Put 6/02/14, Refunding, Series A-1, 6.75%, 12/01/28 | | 2,800,000 | | 2,835,980 |
| Refunding, Series B-2, 6.25%, 6/01/14 | | 20,050,000 | | 20,292,204 |
| Michigan Tobacco Settlement Finance Authority Revenue, Tobacco Settlement Asset-Backed, | | | | |
| Senior Series A, 6.00%, | | | | |
| 6/01/34 | | 2,500,000 | | 2,062,900 |
| 6/01/48 | | 10,000,000 | | 8,253,400 |
| Royal Oak Hospital Finance Authority Hospital Revenue, William Beaumont Hospital | | | | |
| Obligated Group, Refunding, | | | | |
| Series V, 8.25%, 9/01/39 | | 20,000,000 | | 24,108,400 |
| Series W, 6.00%, 8/01/39 | | 33,120,000 | | 35,249,947 |
| | | | | 330,691,834 |
| Minnesota 0.4% | | | | |
| Minneapolis Health Care System Revenue, Fairview Health Services, Series A, | | | | |
| 6.625%, 11/15/28 | | 11,000,000 | | 12,843,490 |
| 6.75%, 11/15/32 | | 6,250,000 | | 7,224,375 |
| Minnesota Agricultural and Economic Development Board Revenue, Health Care System, | | | | |
| Fairview Health Services, Refunding, Series A, 6.375%, 11/15/29 | | 175,000 | | 175,637 |
Annual Report | 129
| | | | | | |
| | Franklin Tax-Free Trust | | | | | |
| |
| | Statement of Investments, February 28, 2014 (continued) | | | | | |
| |
| �� |
| | Franklin High Yield Tax-Free Income Fund | | | Principal Amount | | Value |
| | Municipal Bonds (continued) | | | | | |
| | Minnesota (continued) | | | | | |
| | St. Paul Housing and RDA Hospital Facility Revenue, HealthEast Project, 6.00%, | | | | | |
| | 11/15/35 | | $ | 10,000,000 | $ | 10,202,000 |
| | | | | | | 30,445,502 |
| | Mississippi 0.8% | | | | | |
| | Lowndes County Solid Waste Disposal and PCR, Weyerhaeuser Co. Project, Refunding, | | | | | |
| | Series B, 6.70%, 4/01/22 | | | 18,875,000 | | 21,700,210 |
| | Warren County Gulf Opportunity Zone Revenue, International Paper Co. Project, Series A, | | | | | |
| | 5.50%, 9/01/31 | | | 20,000,000 | | 20,587,000 |
| | 6.50%, 9/01/32 | | | 10,000,000 | | 10,957,700 |
| | 5.80%, 5/01/34 | | | 7,000,000 | | 7,357,350 |
| | | | | | | 60,602,260 |
| | Missouri 0.4% | | | | | |
| | Missouri Joint Municipal Electric Utility Commission Power Project Revenue, Iatan 2 Project, | | | | | |
| | Series A, 6.00%, 1/01/39 | | | 11,000,000 | | 11,697,510 |
| | St. Louis Airport Revenue, Lambert-St. Louis International Airport, Series A-1, | | | | | |
| | 6.25%, 7/01/29 | | | 7,000,000 | | 7,793,940 |
| | 6.625%, 7/01/34 | | | 3,000,000 | | 3,418,650 |
| | St. Louis County IDA Senior Living Facilities Revenue, Friendship Village Chesterfield, | | | | | |
| | 5.00%, 9/01/42 | | | 7,000,000 | | 6,414,730 |
| | | | | | | 29,324,830 |
| | Nevada 0.5% | | | | | |
| | Clark County ID Special Assessment, | | | | | |
| | Local ID No. 128, The Summerlin Centre, Series A, 5.00%, 2/01/26 | | | 1,320,000 | | 1,088,485 |
| | Local ID No. 128, The Summerlin Centre, Series A, 5.05%, 2/01/31 | | | 1,035,000 | | 800,811 |
| | Local ID No. 142, Mountain’s Edge Local Improvement, Refunding, 5.00%, 8/01/21 | | | 1,600,000 | | 1,658,000 |
| | Local ID No. 151, Summerlin-Mesa, 5.00%, 8/01/20 | | | 730,000 | | 679,404 |
| | Local ID No. 151, Summerlin-Mesa, 5.00%, 8/01/25 | | | 2,345,000 | | 2,004,670 |
| | Henderson GO, Refunding, Series A, 4.00%, | | | | | |
| | 6/01/33 | | | 5,240,000 | | 5,262,794 |
| | 6/01/34 | | | 4,230,000 | | 4,232,876 |
| | Henderson Health Care Facility Revenue, Catholic Healthcare West, Series A, 5.625%, | | | | | |
| | 7/01/24 | | | 7,000,000 | | 7,095,270 |
| | Henderson Local ID Special Assessment, | | | | | |
| No. T -4(C) , Green Valley Properties, Limited Obligation, Refunding, Series A, 5.90%, | | | | | |
| | 11/01/18 | | | 3,000,000 | | 3,004,440 |
| No. T-16, Limited Obligation Improvement, The Falls at Lake Las Vegas , 4.90%, | | | | | |
| | 3/01/16 | | | 1,345,000 | | 1,320,333 |
| No. T -16, Limited Obligation Improvement, The Falls at Lake Las Vegas , 5.00%, | | | | | |
| | 3/01/18 | | | 955,000 | | 918,615 |
| No. T-16, Limited Obligation Improvement, The Falls at Lake Las Vegas ,5.00%, | | | | | |
| | 3/01/19 | | | 950,000 | | 904,058 |
| No. T -16, Limited Obligation Improvement, The Falls at Lake Las Vegas, 5.10%, | | | | | |
| | 3/01/22 | | | 1,430,000 | | 1,314,284 |
| No. T-16, Limited Obligation Improvement, The Falls at Lake Las Vegas, 5.125%, | | | | | |
| | 3/01/25 | | | 1,520,000 | | 1,340,184 |
| No. T -17, Limited Obligation Improvement, Madeira Canyon, 5.00%, 9/01/15 | | | 680,000 | | 693,280 |
130 | Annual Report
| | | | |
| Franklin Tax-Free Trust | | | | |
| |
| Statement of Investments, February 28, 2014 (continued) | | | | |
| |
| |
| Franklin High Yield Tax-Free Income Fund | | Principal Amount | | Value |
| Municipal Bonds (continued) | | | | |
| Nevada (continued) | | | | |
| Henderson Local ID Special Assessment, (continued) | | | | |
| No. T-17, Limited Obligation Improvement, Madeira Canyon, 5.00%, 9/01/16 | $ | 705,000 | $ | 720,700 |
| No. T-17, Limited Obligation Improvement, Madeira Canyon, 5.00%, 9/01/25 | | 1,300,000 | | 1,294,371 |
| Overton Power District No. 5 Special Obligation Revenue, 8.00%, 12/01/38 | | 7,500,000 | | 8,357,775 |
| | | | | 42,690,350 |
| New Hampshire 0.2% | | | | |
| aNew Hampshire Higher Educational and Health Facilities Authority Revenue, Hillcrest | | | | |
| Terrace Issue, 7.50%, 7/01/24 | | 12,050,000 | | 12,048,313 |
| New Hampshire State Business Finance Authority Revenue, Elliot Hospital Obligated Group, | | | | |
| Series A, 6.125%, 10/01/39 | | 5,000,000 | | 5,230,850 |
| | | | | 17,279,163 |
| New Jersey 3.2% | | | | |
| Hudson County Improvement Authority Solid Waste Systems Revenue, Refunding, Series A, | | | | |
| 5.75%, 1/01/40 | | 5,000,000 | | 5,466,450 |
| New Jersey EDA Revenue, | | | | |
| Cigarette Tax, Pre-Refunded, 5.50%, 6/15/31 | | 6,500,000 | | 6,597,110 |
| Cigarette Tax, Pre-Refunded, 5.75%, 6/15/34 | | 10,000,000 | | 10,156,300 |
| Montclair State University Student Housing Project, Provident Group, Montclair Properties | | | | |
| LLC, Series A, 5.875%, 6/01/42 | | 5,000,000 | | 5,231,550 |
| New Jersey EDA Special Facility Revenue, Continental Airlines Inc. Project, | | | | |
| 4.875%, 9/15/19 | | 19,840,000 | | 19,768,576 |
| 5.125%, 9/15/23 | | 19,800,000 | | 19,484,982 |
| 5.25%, 9/15/29 | | 37,900,000 | | 37,424,355 |
| New Jersey Health Care Facilities Financing Authority Revenue, | | | | |
| Capital Appreciation, St. Barnabas Health Care System Issue, Refunding, Series B, | | | | |
| zero cpn., 7/01/33 | | 57,680,000 | | 19,398,361 |
| Capital Appreciation, St. Barnabas Health Care System Issue, Refunding, Series B, | | | | |
| zero cpn., 7/01/34 | | 52,330,000 | | 16,503,312 |
| St. Joseph’s Healthcare System Obligated Group Issue, 6.625%, 7/01/38 | | 27,015,000 | | 27,605,278 |
| New Jersey State Transportation Trust Fund Authority Revenue, | | | | |
| Capital Appreciation, Transportation System, Series A, zero cpn., 12/15/35 | | 6,000,000 | | 1,936,860 |
| Capital Appreciation, Transportation System, Series C, zero cpn., 12/15/31 | | 23,650,000 | | 9,932,527 |
| Transportation System, Series A, 6.00%, 12/15/38 | | 35,705,000 | | 39,615,412 |
| Transportation System, Series A, Pre-Refunded, 6.00%, 12/15/38 | | 19,295,000 | | 23,865,985 |
| Transportation System, Series B, 5.25%, 6/15/36 | | 10,000,000 | | 10,710,200 |
| | | | | 253,697,258 |
| New Mexico 1.9% | | | | |
| Farmington PCR, Public Service Co. of New Mexico, San Juan Project, Refunding, | | | | |
| Series B, 5.90%, 6/01/40 | | 58,000,000 | | 61,592,520 |
| Series C, 5.90%, 6/01/40 | | 18,435,000 | | 19,576,864 |
| Series D, 5.90%, 6/01/40 | | 53,520,000 | | 56,835,029 |
| New Mexico State Hospital Equipment Loan Council Hospital Revenue, St. Vincent Hospital, | | | | |
| Series A, Radian Insured, Pre-Refunded, | | | | |
| 5.25%, 7/01/30 | | 4,360,000 | | 4,637,340 |
| 5.00%, 7/01/35 | | 3,470,000 | | 3,679,310 |
| | | | | 146,321,063 |
Annual Report | 131
| | | | |
| Franklin Tax-Free Trust | | | | |
| |
| Statement of Investments, February 28, 2014 (continued) | | | | |
| |
| |
| Franklin High Yield Tax-Free Income Fund | | Principal Amount | | Value |
| Municipal Bonds (continued) | | | | |
| New York 3.6% | | | | |
| Long Island Power Authority Electric System Revenue, General, Refunding, Series A, 6.00%, | | | | |
| 5/01/33 | $ | 12,500,000 | $ | 14,062,125 |
| MAC for City of Troy Revenue, Capital Appreciation, Series C, NATL Insured, zero cpn., | | | | |
| 7/15/21 | | 428,010 | | 353,378 |
| 1/15/22 | | 649,658 | | 522,104 |
| MTA Revenue, Transportation, | | | | |
| Refunding, Series D, 5.00%, 11/15/38 | | 8,790,000 | | 9,251,651 |
| Refunding, Series D, 5.25%, 11/15/40 | | 10,000,000 | | 10,546,900 |
| Series A, 5.00%, 11/15/41 | | 15,500,000 | | 16,131,315 |
| Series E, 5.00%, 11/15/33 | | 10,000,000 | | 10,713,400 |
| New York City GO, | | | | |
| Refunding, Series H, 6.25%, 8/01/15 | | 20,000 | | 20,089 |
| Refunding, Series H, 6.125%, 8/01/25 | | 5,000 | | 5,020 |
| Series F, 7.50%, 2/01/21 | | 85,000 | | 85,436 |
| Series G, 7.50%, 2/01/22 | | 10,000 | | 10,050 |
| New York City IDA Civic Facility Revenue, Amboy Properties Corp. Project, Refunding, | | | | |
| 6.75%, 6/01/20 | | 4,680,000 | | 4,571,986 |
| New York City IDA Special Facility Revenue, | | | | |
| American Airlines Inc., JFK International Airport Project, 7.625%, 8/01/25 | | 31,860,000 | | 35,051,416 |
| American Airlines Inc., JFK International Airport Project, 7.75%, 8/01/31 | | 15,000,000 | | 16,471,350 |
| British Airways PLC Project, 7.625%, 12/01/32 | | 15,550,000 | | 15,766,612 |
| New York Liberty Development Corp. Liberty Revenue, Second Priority, Bank of America | | | | |
| Tower at One Bryant Park Project, Class 3, Refunding, 6.375%, 7/15/49 | | 18,500,000 | | 19,903,410 |
| New York Liberty Development Corp. Revenue, Goldman Sachs Headquarters Issue, 5.25%, | | | | |
| 10/01/35 | | 65,000,000 | | 71,208,800 |
| New York State Dormitory Authority Revenues, Non-State Supported Debt, Orange Regional | | | | |
| Medical Center, | | | | |
| 6.125%, 12/01/29 | | 16,000,000 | | 16,027,360 |
| 6.25%, 12/01/37 | | 30,000,000 | | 29,486,700 |
| The Port Authority of New York and New Jersey Special Project Revenue, Continental Airlines | | | | |
| Inc., Eastern Project, La Guardia, 9.125%, 12/01/15 | | 9,840,000 | | 9,837,638 |
| | | | | 280,026,740 |
| North Carolina 0.7% | | | | |
| Albemarle Hospital Authority Health Care Facilities Revenue, Refunding, 5.25%, | | | | |
| 10/01/27 | | 4,500,000 | | 4,530,375 |
| Columbus County Industrial Facilities and PCFA Revenue, | | | | |
| Environmental Improvement, International Paper Co. Projects, Series A, 6.25%, | | | | |
| 11/01/33 | | 1,300,000 | | 1,406,327 |
| International Paper Co. Projects, Recovery Zone Facility Bonds, Series B, 6.25%, | | | | |
| 11/01/33 | | 4,000,000 | | 4,327,160 |
| North Carolina Medical Care Commission Health Care Facilities Revenue, | | | | |
| Duke University Health System, Series A, 5.00%, 6/01/42 | | 15,000,000 | | 15,813,600 |
| Pennybyrn at Maryfield Project, Series A, 5.75%, 10/01/23 | | 3,625,000 | | 3,625,363 |
| Pennybyrn at Maryfield Project, Series A, 6.00%, 10/01/23 | | 2,500,000 | | 2,509,500 |
| Pennybyrn at Maryfield Project, Series A, 5.65%, 10/01/25 | | 2,000,000 | | 1,960,040 |
| Pennybyrn at Maryfield Project, Series A, 6.125%, 10/01/35 | | 21,750,000 | | 21,207,555 |
132 | Annual Report
| | | | |
| Franklin Tax-Free Trust | | | | |
| |
| Statement of Investments, February 28, 2014 (continued) | | | | |
| |
| |
| Franklin High Yield Tax-Free Income Fund | | Principal Amount | | Value |
| Municipal Bonds (continued) | | | | |
| North Carolina (continued) | | | | |
| North Carolina Medical Care Commission Retirement Facilities Revenue, The United | | | | |
| Methodist Retirement Homes Project, first mortgage, Refunding, Series C, | | | | |
| 5.25%, 10/01/24 | $ | 920,000 | $ | 928,933 |
| 5.50%, 10/01/32 | | 1,600,000 | | 1,607,328 |
| | | | | 57,916,181 |
| Ohio 1.9% | | | | |
| American Municipal Power-Ohio Inc. Revenue, Prairie State Energy Campus Project, | | | | |
| Refunding, Series A, 5.00%, 2/15/38 | | 22,285,000 | | 22,975,389 |
| Bowling Green Student Housing Revenue, CFP I LLC, State University Project, 6.00%, | | | | |
| 6/01/45 | | 12,500,000 | | 12,660,625 |
| Buckeye Tobacco Settlement Financing Authority Revenue, Asset-Backed, | | | | |
| Senior Capital Appreciation Turbo Term Bond, Series A-3, 6.25%, 6/01/37 | | 7,250,000 | | 6,266,030 |
| Senior Current Interest Turbo Term Bond, Series A-2, 5.75%, 6/01/34 | | 5,000,000 | | 4,077,750 |
| Butler County Hospital Facilities Revenue, UC Health, 5.50%, 11/01/40 | | 10,000,000 | | 10,273,700 |
| Fairfield County Hospital Revenue, Improvement, Medical Centre Project, Refunding, | | | | |
| 5.00%, 6/15/43 | | 10,000,000 | | 9,685,500 |
| Hamilton County Healthcare Revenue, Life Enriching Communities Project, Series A, | | | | |
| 6.50%, 1/01/41 | | 4,970,000 | | 5,272,226 |
| 6.625%, 1/01/46 | | 2,500,000 | | 2,677,000 |
| Little Miami Local School District GO, School Improvement, Refunding, 6.875%, | | | | |
| 12/01/34 | | 5,825,000 | | 6,293,738 |
| Miami County Hospital Facilities Revenue, Upper Valley Medical Center, Refunding and | | | | |
| Improvement, 5.25%, 5/15/26 | | 2,750,000 | | 2,837,202 |
| Ohio State Air Quality Development Authority Revenue, Environmental Improvement, | | | | |
| Buckeye Power Inc. Project, 6.00%, 12/01/40 | | 15,000,000 | | 15,927,150 |
| Ohio State Turnpike Commission Revenue, junior lien, Series A-3, zero cpn. to 2/14/23, | | | | |
| 5.75% thereafter, 2/15/35 | | 35,000,000 | | 23,390,850 |
| Scioto County Hospital Facilities Revenue, Southern Ohio Medical Center, Refunding, | | | | |
| 5.75%, 2/15/38 | | 17,000,000 | | 17,891,480 |
| Southeastern Port Authority Hospital Facilities Revenue, Memorial Health System Obligated | | | | |
| Group Project, Refunding and Improvement, 6.00%, 12/01/42 | | 12,000,000 | | 11,477,400 |
| | | | | 151,706,040 |
| Oklahoma 0.1% | | | | |
| Oklahoma Development Finance Authority Continuing Care Retirement Revenue, Inverness | | | | |
| Village Community, Refunding, 5.75%, 1/01/37 | | 5,000,000 | | 4,845,250 |
| Oregon 0.2% | | | | |
| Oregon Health and Science University Revenue, Series A, 5.75%, 7/01/39 | | 5,000,000 | | 5,415,400 |
| Salem Hospital Facility Authority Revenue, Capital Manor Inc., Refunding, | | | | |
| 5.00%, 5/15/22 | | 1,000,000 | | 1,011,320 |
| 5.75%, 5/15/27 | | 1,000,000 | | 1,030,180 |
| 5.625%, 5/15/32 | | 1,000,000 | | 1,013,990 |
| 6.00%, 5/15/42 | | 3,100,000 | | 3,143,710 |
| 6.00%, 5/15/47 | | 2,000,000 | | 2,021,700 |
| | | | | 13,636,300 |
Annual Report | 133
| | | | |
| Franklin Tax-Free Trust | | | | |
| |
| Statement of Investments, February 28, 2014 (continued) | | | | |
| |
| |
| Franklin High Yield Tax-Free Income Fund | | Principal Amount | | Value |
| Municipal Bonds (continued) | | | | |
| Pennsylvania 1.5% | | | | |
| Allegheny County Higher Education Building Authority University Revenue, Carlow University | | | | |
| Project, Refunding, | | | | |
| 6.75%, 11/01/31 | $ | 1,215,000 | $ | 1,290,816 |
| 7.00%, 11/01/40 | | 2,000,000 | | 2,123,640 |
| Commonwealth Financing Authority Revenue, Series B, 5.00%, 6/01/42 | | 12,000,000 | | 12,366,720 |
| Delaware County IDAR, Resource Recovery Facility, Refunding, Series A, 6.20%, 7/01/19 | | 16,905,000 | | 16,913,791 |
| Lancaster County Hospital Authority Revenue, Brethren Village Project, Series A, | | | | |
| 6.375%, 7/01/30 | | 1,000,000 | | 1,011,340 |
| 6.50%, 7/01/40 | | 3,000,000 | | 3,028,980 |
| Northampton County General Purpose Authority Hospital Revenue, St. Luke’s Hospital | | | | |
| Project, Series A, 5.50%, 8/15/40 | | 15,000,000 | | 15,122,850 |
| Pennsylvania State Turnpike Commission Turnpike Revenue, | | | | |
| Capital Appreciation, Series C, AGMC Insured, zero cpn. to 6/01/16, 6.25% thereafter, | | | | |
| 6/01/33 | | 5,000,000 | | 5,158,050 |
| Motor License Fund Enhanced Turnpike, Subordinate Special, Series B-2, zero cpn. to | | | | |
| 11/30/28, 5.75% thereafter, 12/01/37 | | 20,000,000 | | 9,587,800 |
| Motor License Fund Enhanced Turnpike, Subordinate Special, Series B-2, zero cpn. to | | | | |
| 12/01/28, 5.875% thereafter, 12/01/40 | | 25,075,000 | | 11,722,813 |
| sub. bond, Series B, 5.75%, 6/01/39 | | 20,000,000 | | 21,317,000 |
| Philadelphia Hospitals and Higher Education Facilities Authority Revenue, Temple University | | | | |
| Health System Obligated Group, | | | | |
| Refunding, Series B, 5.50%, 7/01/26 | | 10,000,000 | | 9,361,200 |
| Series A, 5.625%, 7/01/42 | | 10,000,000 | | 8,642,600 |
| | | | | 117,647,600 |
| Rhode Island 0.2% | | | | |
| Rhode Island State Health and Educational Building Corp. Revenue, Hospital Financing, | | | | |
| Care New England Issue, Refunding, Series A, 6.00%, 9/01/33 | | 7,320,000 | | 7,522,398 |
| Lifespan Obligated Group Issue, Refunding, NATL Insured, 5.75%, 5/15/23 | | 405,000 | | 405,397 |
| Lifespan Obligated Group Issue, Series A, 7.00%, 5/15/39 | | 8,200,000 | | 9,059,606 |
| Tobacco Settlement FICO Revenue, Asset-Backed, Series B, zero cpn., 6/01/52 | | 90,000,000 | | 1,515,600 |
| | | | | 18,503,001 |
| South Carolina 1.0% | | | | |
| SCAGO Educational Facilities Corp. for Calhoun School District Revenue, School District of | | | | |
| Calhoun County Project, Radian Insured, 5.00%, 12/01/26 | | 7,540,000 | | 7,713,646 |
| SCAGO Educational Facilities Corp. for Williamsburg School District Revenue, School | | | | |
| District of Williamsburg County Project, Refunding, Radian Insured, 5.00%, 12/01/31 | | 2,000,000 | | 2,021,760 |
| South Carolina Jobs EDA Student Housing Revenue, Coastal Housing Foundation LLC | | | | |
| Project, Series A, 6.50%, 4/01/42 | | 10,000,000 | | 11,074,300 |
| South Carolina State Public Service Authority Revenue, Series B, Refunding, 5.125%, | | | | |
| 12/01/43 | | 52,890,000 | | 55,512,286 |
| | | | | 76,321,992 |
| Tennessee 1.0% | | | | |
| Johnson City Health and Educational Facilities Board Hospital Revenue, Mountain States | | | | |
| Health Alliance, Capital Appreciation, first mortgage, Refunding, Series A, NATL Insured, | | | | |
| zero cpn., | | | | |
| 7/01/27 | | 19,365,000 | | 9,861,626 |
| 7/01/28 | | 19,400,000 | | 9,287,168 |
| |
| 134 | Annual Report | | | | |
| | | | |
| Franklin Tax-Free Trust | | | | |
| |
| Statement of Investments, February 28, 2014 (continued) | | | | |
| |
| |
| Franklin High Yield Tax-Free Income Fund | | Principal Amount | | Value |
| Municipal Bonds (continued) | | | | |
| Tennessee (continued) | | | | |
| Johnson City Health and Educational Facilities Board Hospital Revenue, Mountain States | | | | |
| Health Alliance, Capital Appreciation, first mortgage, Refunding, Series A, NATL Insured, | | | | |
| zero cpn., (continued) | | | | |
| 7/01/29 | $ | 19,365,000 | $ | 8,649,377 |
| 7/01/30 | | 19,370,000 | | 8,040,487 |
| Knox County Health Educational and Housing Facility Board Hospital Revenue, Covenant | | | | |
| Health, Refunding and Improvement, Series A, zero cpn., | | | | |
| 1/01/37 | | 12,760,000 | | 3,248,696 |
| 1/01/39 | | 13,755,000 | | 3,125,274 |
| Knox County Health Educational and Housing Facility Board Revenue, University Health | | | | |
| System Inc., Refunding, 5.25%, 4/01/36 | | 23,475,000 | | 23,672,425 |
| Memphis-Shelby County Airport Authority Airport Revenue, Refunding, Series B, 5.75%, | | | | |
| 7/01/23 | | 5,000,000 | | 5,718,150 |
| 7/01/24 | | 3,500,000 | | 3,985,520 |
| | | | | 75,588,723 |
| Texas 8.5% | | | | |
| Austin Convention Enterprises Inc. Convention Center Hotel Revenue, first tier, Refunding, | | | | |
| Series B, 5.75%, 1/01/34 | | 15,750,000 | | 15,870,645 |
| Brazos County Health Facilities Development Corp. Franciscan Services Corp. Revenue, | | | | |
| Obligated Group, St. Joseph Regional Health Center, 5.50%, 1/01/38 | | 5,250,000 | | 5,360,722 |
| Capital Area Cultural Education Facilities Finance Corp. Revenue, The Roman Catholic | | | | |
| Diocese of Austin, Series B, 6.125%, 4/01/45 | | 10,000,000 | | 10,701,200 |
| Central Texas Regional Mobility Authority Revenue, | | | | |
| Capital Appreciation, Refunding, zero cpn., 1/01/35 | | 3,000,000 | | 865,470 |
| Capital Appreciation, Refunding, zero cpn., 1/01/37 | | 2,500,000 | | 630,200 |
| Capital Appreciation, Refunding, zero cpn., 1/01/38 | | 2,405,000 | | 565,488 |
| Capital Appreciation, Refunding, zero cpn., 1/01/39 | | 2,545,000 | | 560,409 |
| senior lien, Refunding, 5.75%, 1/01/25 | | 2,350,000 | | 2,560,302 |
| senior lien, Refunding, 5.75%, 1/01/31 | | 2,500,000 | | 2,672,575 |
| senior lien, Refunding, 6.00%, 1/01/41 | | 7,925,000 | | 8,401,134 |
| senior lien, Refunding, 6.25%, 1/01/46 | | 24,340,000 | | 25,962,504 |
| Dallas/Fort Worth International Airport Revenue, Joint Improvement, | | | | |
| Series A, 5.00%, 11/01/42 | | 12,000,000 | | 12,271,800 |
| Series A, 5.00%, 11/01/45 | | 50,000,000 | | 51,017,500 |
| Series B, 5.00%, 11/01/44 | | 11,385,000 | | 11,681,921 |
| El Paso Downtown Development Corp. Special Revenue, Downtown Ballpark Venue Project, | | | | |
| Series A, 7.25%, 8/15/38 | | 15,000,000 | | 17,331,900 |
| Fort Bend Grand Parkway Toll Road Authority Ltd. Contract Tax and Toll Road Revenue, | | | | |
| sub. lien, 4.00%, 3/01/46 | | 8,000,000 | | 7,276,720 |
| Grand Parkway Transportation Corp. System Toll Revenue, | | | | |
| First Tier Toll, Series A, 5.125%, 10/01/43 | | 2,850,000 | | 2,889,729 |
| Series B, zero cpn. to 9/30/23, 5.80% thereafter, 10/01/45 | | 10,000,000 | | 6,167,300 |
| Harris County Cultural Education Facilities Finance Corp. Revenue, first mortgage, Brazos | | | | |
| Presbyterian Homes Inc. Project, Series B, 7.00%, | | | | |
| 1/01/43 | | 3,000,000 | | 3,095,070 |
| 1/01/48 | | 5,250,000 | | 5,381,040 |
| Harris County Health Facilities Development Corp. Hospital Revenue, Memorial Hermann | | | | |
| Healthcare System, Series B, Pre-Refunded, 7.25%, 12/01/35 | | 13,500,000 | | 17,417,160 |
| |
| | | | | Annual Report | 135 |
| | | | |
| Franklin Tax-Free Trust | | | | |
| |
| Statement of Investments, February 28, 2014 (continued) | | | | |
| |
| |
| Franklin High Yield Tax-Free Income Fund | | Principal Amount | | Value |
| Municipal Bonds (continued) | | | | |
| Texas (continued) | | | | |
| Houston Airport System Revenue, Special Facilities, Continental Airlines Inc. Terminal E | | | | |
| Project, Series E, 6.75%, | | | | |
| 7/01/21 | $ | 35,095,000 | $ | 35,163,786 |
| 7/01/29 | | 36,520,000 | | 36,591,579 |
| Lufkin Health Facilities Development Corp. Revenue, Memorial Health System of East Texas, | | | | |
| Refunding and Improvement, 6.25%, 2/15/37 | | 5,000,000 | | 5,299,800 |
| Matagorda County Navigation District No. 1 PCR, Central Power and Light Co. Project, | | | | |
| Refunding, Series A, 6.30%, 11/01/29 | | 10,000,000 | | 11,151,900 |
| Matagorda County Navigation District No. 1 Revenue, CenterPoint Energy Houston Electric | | | | |
| LLC Project, Refunding, 5.60%, 3/01/27 | | 12,000,000 | | 12,131,040 |
| New Hope Cultural Education Facilities Finance Corp. First Mortgage Revenue, Morningside | | | | |
| Ministries Project, 6.50%, 1/01/43 | | 4,350,000 | | 4,493,855 |
| New Hope Cultural Education Facilities Finance Corp. Student Housing Revenue, | | | | |
| CHF-Stephenville LLC, Tarleton State University Project, Series A, 6.00%, 4/01/45 | | 3,000,000 | | 2,991,450 |
| North Texas Tollway Authority Revenue, | | | | |
| Special Projects System, Capital Appreciation, first tier, Refunding, Series I, zero cpn. to | | | | |
| 1/01/15, 6.50% thereafter, 1/01/43 | | 25,000,000 | | 27,926,000 |
| Special Projects System, Capital Appreciation, Series B, zero cpn., 9/01/37 | | 7,500,000 | | 2,002,950 |
| Special Projects System, Capital Appreciation, Series C, zero cpn. to 9/01/21, | | | | |
| 6.75% thereafter, 9/01/45 | | 25,000,000 | | 19,397,250 |
| Special Projects System, Capital Appreciation, Series C, zero cpn. to 9/01/23, | | | | |
| 7.00% thereafter, 9/01/43 | | 10,000,000 | | 7,010,400 |
| System, first tier, Refunding, Series A, 5.625%, 1/01/33 | | 1,000,000 | | 1,100,540 |
| System, first tier, Refunding, Series A, 6.25%, 1/01/39 | | 12,500,000 | | 13,988,875 |
| System, first tier, Refunding, Series A, 5.75%, 1/01/48 | | 30,000,000 | | 32,865,900 |
| System, first tier, Refunding, Series B, 5.00%, 1/01/38 | | 10,000,000 | | 10,355,700 |
| System, first tier, Refunding, Series B, 5.75%, 1/01/40 | | 11,680,000 | | 12,906,867 |
| System, first tier, Refunding, Series K, Sub Series K-2, 6.00%, 1/01/38 | | 15,000,000 | | 16,433,700 |
| System, second tier, Refunding, Series F, 5.75%, 1/01/38 | | 20,000,000 | | 21,082,800 |
| Red River Health Facilities Development Corp. First Mortgage Revenue, | | | | |
| Eden Home Project, 7.25%, 12/15/42 | | 11,000,000 | | 10,945,550 |
| Wichita Falls Retirement Foundation Project, Refunding, 5.50%, 1/01/32 | | 1,500,000 | | 1,464,930 |
| Wichita Falls Retirement Foundation Project, Refunding, 5.125%, 1/01/41 | | 2,000,000 | | 1,765,480 |
| San Antonio Public Facilities Corp. Lease Revenue, Refunding and Improvement, Convention | | | | |
| Center Refinancing and Expansion Project, 4.00%, | | | | |
| 9/15/33 | | 7,910,000 | | 7,888,643 |
| 9/15/35 | | 4,365,000 | | 4,200,090 |
| 9/15/42 | | 41,000,000 | | 37,135,750 |
| Tarrant County Cultural Education Facilities Finance Corp. Revenue, Texas Health Resources | | | | |
| System, Refunding, 5.00%, 11/15/40 | | 15,225,000 | | 15,606,691 |
| Texas State Municipal Gas Acquisition and Supply Corp. III Gas Supply Revenue, 5.00%, | | | | |
| 12/15/30 | | 25,000,000 | | 25,641,000 |
| 12/15/31 | | 24,500,000 | | 25,057,375 |
| 12/15/32 | | 10,000,000 | | 10,198,600 |
| Texas State Transportation Commission Turnpike System Revenue, first tier, Refunding, | | | | |
| Series A, 5.00%, 8/15/41 | | 5,000,000 | | 5,023,800 |
| Texas State Turnpike Authority Central Turnpike System Revenue, Capital Appreciation, | | | | |
| AMBAC Insured, zero cpn., 8/15/32 | | 51,000,000 | | 16,978,920 |
136 | Annual Report
| | | | | |
| | Franklin Tax-Free Trust | | | | |
| |
| | Statement of Investments, February 28, 2014 (continued) | | | | |
| |
| |
| | Franklin High Yield Tax-Free Income Fund | | Principal Amount | | Value |
| | Municipal Bonds (continued) | | | | |
| | Texas (continued) | | | | |
| | Tyler Health Facilities Development Corp. Hospital Revenue, | | | | |
| | East Texas Medical Center Regional Healthcare System Project, Refunding and | | | | |
| | Improvement, Series A, 5.375%, 11/01/37 | $ | 8,000,000 | $ | 7,764,960 |
| | Mother Frances Hospital Regional Health Care Center Project, Series B, 5.00%, | | | | |
| | 7/01/37 | | 2,500,000 | | 2,436,000 |
| | Wood County Central Hospital District Hospital Revenue, East Texas Medical Center Quitman | | | | |
| | Project, 6.00%, 11/01/41 | | 9,350,000 | | 9,792,629 |
| | | | | | 663,475,599 |
| | Virginia 1.0% | | | | |
| | Norfolk EDA Health Care Facilities Revenue, Sentara Healthcare, Refunding, Series B, | | | | |
| | 5.00%, 11/01/43 | | 17,575,000 | | 18,468,337 |
| | Peninsula Ports Authority Coal Terminal Revenue, Dominion Terminal Associates Project, | | | | |
| | Refunding, 6.00%, 4/01/33 | | 9,500,000 | | 9,506,935 |
| | Tobacco Settlement FICO Revenue, | | | | |
| Asset -Backed, Pre-Refunded, 5.50%, 6/01/26 | | 1,690,000 | | 1,760,051 |
| | Capital Appreciation, Second Subordinate, Refunding, Series D, zero cpn., 6/01/47 | | 50,000,000 | | 1,266,500 |
| | Virginia Small Business Financing Authority Revenue, Elizabeth River Crossings OPCO LLC | | | | |
| | Project, senior lien, | | | | |
| | 6.00%, 1/01/37 | | 8,000,000 | | 8,510,560 |
| | 5.50%, 1/01/42 | | 35,790,000 | | 36,723,761 |
| | | | | | 76,236,144 |
| | Washington 2.4% | | | | |
| | FYI Properties Lease Revenue, Washington State District Project, 5.50%, | | | | |
| | 6/01/34 | | 11,935,000 | | 12,883,952 |
| | 6/01/39 | | 16,250,000 | | 17,367,025 |
| | Greater Wenatchee Regional Events Center Public Facilities District Revenue, Refunding, | | | | |
| | Series A, 5.50%, 9/01/42 | | 3,150,000 | | 3,040,254 |
| | Ocean Shores Local ID No. 1 Tax Allocation, 7.25%, 2/01/31 | | 13,515,000 | | 16,029,466 |
| | Skagit County Public Hospital District No. 1 Revenue, Skagit Valley Hospital, 5.75%, | | | | |
| | 12/01/32 | | 2,000,000 | | 2,028,620 |
| | 12/01/35 | | 5,355,000 | | 5,444,107 |
| | aWashington State Economic Development Finance Authority Environmental Facilities | | | | |
| | Revenue, Coalview Centralia LLC Project, 9.50%, 8/01/25 | | 14,000,000 | | 14,294,700 |
| | Washington State GO, | | | | |
| | Motor Vehicle Fuel Tax, Series B-1, 4.00%, 8/01/42 | | 19,530,000 | | 18,635,331 |
| | Various Purpose, Series A, 4.00%, 8/01/36 | | 19,290,000 | | 19,204,545 |
| | Washington State Health Care Facilities Authority Revenue, | | | | |
| | Central Washington Health Services Assn., 7.00%, 7/01/39 | | 8,500,000 | | 9,360,030 |
| | Fred Hutchinson Cancer Research Center, Refunding, Series A, 6.00%, 1/01/33 | | 7,500,000 | | 8,078,100 |
| | Kadlec Medical Center, 5.00%, 12/01/42 | | 3,000,000 | | 2,796,630 |
| | Kadlec Medical Center, Refunding, Series A, Assured Guaranty, 5.00%, 12/01/30 | | 4,000,000 | | 4,044,560 |
| | Providence Health and Services, Refunding, Series A, 5.00%, 10/01/42 | | 19,725,000 | | 20,483,426 |
| | Providence Health and Services, Series A, FGIC Insured, Pre-Refunded, 5.00%, | | | | |
| | 10/01/36 | | 305,000 | | 339,782 |
| | Virginia Mason Medical Center, Series B, ACA Insured, 6.00%, 8/15/37 | | 30,000,000 | | 30,784,800 |
| | Washington State Higher Education Facilities Authority Revenue, Whitworth University | | | | |
| | Project, Refunding, 5.625%, 10/01/40 | | 5,235,000 | | 5,389,642 |
| | | | | | 190,204,970 |
| |
| | | | | | Annual Report | 137 |
| | | | |
| Franklin Tax-Free Trust | | | | |
| |
| Statement of Investments, February 28, 2014 (continued) | | | | |
| |
| |
| Franklin High Yield Tax-Free Income Fund | | Principal Amount | | Value |
| Municipal Bonds (continued) | | | | |
| West Virginia 0.6% | | | | |
| County Commission of Harrison County Solid Waste Disposal Revenue, Allegheny Energy | | | | |
| Supply Co. LLC Harrison Station Project, Refunding, Series D, 5.50%, 10/15/37 | $ | 14,745,000 | $ | 14,777,439 |
| Kanawha County Commission Student Housing Revenue, West Virginia University Foundation | | | | |
| Project, 6.75%, 7/01/45 | | 6,650,000 | | 6,745,494 |
| Pleasants County PCR, County Commission, Series F, 5.25%, 10/15/37 | | 24,250,000 | | 24,383,132 |
| | | | | 45,906,065 |
| Wisconsin 0.6% | | | | |
| Wisconsin State General Fund Annual Appropriation Revenue, Series A, 6.00%, 5/01/33 | | 15,000,000 | | 17,011,350 |
| Wisconsin State Health and Educational Facilities Authority Revenue, | | | | |
| Beaver Dam Community Hospitals Inc., Refunding, Series A, 5.25%, 8/15/34 | | 5,000,000 | | 4,938,150 |
| Fort Healthcare Inc. Project, 5.75%, 5/01/24 | | 5,000,000 | | 5,014,900 |
| Thedacare Inc., AMBAC Insured, 5.00%, 12/15/30 | | 9,530,000 | | 9,724,221 |
| Thedacare Inc., Series A, 5.50%, 12/15/38 | | 5,000,000 | | 5,309,000 |
| Wisconsin State Public Finance Authority Revenue, Adams-Columbia Electric Cooperative, | | | | |
| Series A, NATL Insured, 5.50%, 12/01/40 | | 6,755,000 | | 7,135,374 |
| | | | | 49,132,995 |
| Wyoming 0.3% | | | | |
| Campbell County Solid Waste Facilities Revenue, Basin Electric Power Cooperative, Dry Fork | | | | |
| Station Facilities, Series A, 5.75%, 7/15/39 | | 5,500,000 | | 6,021,070 |
| West Park Hospital District Revenue, West Park Hospital Project, Series A, 7.00%, | | | | |
| 6/01/40 | | 5,500,000 | | 6,333,635 |
| Wyoming CDA Student Housing Revenue, CHF-Wyoming LLC, University of Wyoming Project, | | | | |
| 6.25%, 7/01/31 | | 600,000 | | 625,668 |
| 6.50%, 7/01/43 | | 1,600,000 | | 1,664,912 |
| Wyoming Municipal Power Agency Power Supply System Revenue, Series A, | | | | |
| 5.50%, 1/01/28 | | 1,350,000 | | 1,457,784 |
| 5.50%, 1/01/33 | | 2,360,000 | | 2,530,864 |
| 5.50%, 1/01/38 | | 2,810,000 | | 2,999,956 |
| 5.375%, 1/01/42 | | 2,750,000 | | 2,912,635 |
| | | | | 24,546,524 |
| U.S. Territories 8.5% | | | | |
| Guam 1.3% | | | | |
| Guam Government Department of Education COP, John F. Kennedy High School Project, | | | | |
| Series A, | | | | |
| 6.625%, 12/01/30 | | 5,065,000 | | 5,101,114 |
| 6.875%, 12/01/40 | | 4,000,000 | | 4,054,120 |
| Guam Government GO, | | | | |
| Refunding, Series A, 5.125%, 11/15/27 | | 7,270,000 | | 6,935,507 |
| Refunding, Series A, 5.25%, 11/15/37 | | 37,000,000 | | 33,167,540 |
| Series A, 6.00%, 11/15/19 | | 8,000,000 | | 8,505,440 |
| Series A, 6.75%, 11/15/29 | | 10,000,000 | | 10,518,300 |
| Series A, 7.00%, 11/15/39 | | 15,000,000 | | 15,860,700 |
138 | Annual Report
| | | | |
| Franklin Tax-Free Trust | | | | |
| |
| Statement of Investments, February 28, 2014 (continued) | | | | |
| |
| |
| Franklin High Yield Tax-Free Income Fund | | Principal Amount | | Value |
| Municipal Bonds (continued) | | | | |
| U.S. Territories (continued) | | | | |
| Guam (continued) | | | | |
| Guam Government Waterworks Authority Water and Wastewater System Revenue, | | | | |
| 6.00%, 7/01/25 | $ | 4,000,000 | $ | 4,156,880 |
| 5.875%, 7/01/35 | | 8,000,000 | | 8,295,600 |
| 5.625%, 7/01/40 | | 4,000,000 | | 4,118,480 |
| | | | | 100,713,681 |
| Northern Mariana Islands 0.1% | | | | |
| Northern Mariana Islands Commonwealth Ports Authority Seaport Revenue, Senior Series A, | | | | |
| 6.60%, 3/15/28 | | 6,520,000 | | 6,332,941 |
| Puerto Rico 6.5% | | | | |
| Children’s Trust Fund Tobacco Settlement Revenue, Asset-Backed, Refunding, | | | | |
| 5.50%, 5/15/39 | | 11,500,000 | | 10,398,070 |
| 5.625%, 5/15/43 | | 4,000,000 | | 3,488,160 |
| Puerto Rico Commonwealth Aqueduct and Sewer Authority Revenue, senior lien, | | | | |
| Refunding, Series A, 5.75%, 7/01/37 | | 18,765,000 | | 13,954,592 |
| Series A, 6.00%, 7/01/38 | | 9,755,000 | | 7,383,657 |
| Series A, 6.00%, 7/01/44 | | 12,420,000 | | 9,454,353 |
| Puerto Rico Commonwealth GO, Public Improvement, Refunding, Series A, | | | | |
| 5.50%, 7/01/26 | | 19,450,000 | | 15,813,239 |
| 5.75%, 7/01/28 | | 27,125,000 | | 22,043,674 |
| 5.50%, 7/01/39 | | 24,830,000 | | 19,255,169 |
| 5.75%, 7/01/41 | | 15,000,000 | | 11,611,950 |
| Puerto Rico Commonwealth Highways and Transportation Authority Highway Revenue, | | | | |
| NATL Insured, 5.50%, 7/01/28 | | 10,000,000 | | 9,260,400 |
| Puerto Rico Commonwealth Highways and Transportation Authority Transportation Revenue, | | | | |
| Refunding, Series N, FGIC Insured, 5.25%, 7/01/39 | | 7,500,000 | | 4,496,325 |
| Puerto Rico Electric Power Authority Power Revenue, | | | | |
| Refunding, Series A, 5.00%, 7/01/42 | | 26,990,000 | | 17,367,795 |
| Series A, 7.25%, 7/01/30 | | 25,000,000 | | 19,271,250 |
| Series A, 6.75%, 7/01/36 | | 11,000,000 | | 7,948,380 |
| Series A, 7.00%, 7/01/43 | | 5,000,000 | | 3,660,550 |
| Series WW, 5.50%, 7/01/38 | | 16,355,000 | | 11,118,456 |
| Series XX, 5.75%, 7/01/36 | | 8,620,000 | | 6,048,309 |
| Series XX, 5.25%, 7/01/40 | | 59,030,000 | | 39,285,055 |
| Puerto Rico Industrial Tourist Educational Medical and Environmental Control Facilities | | | | |
| Financing Authority Revenue, Cogeneration Facility, AES Puerto Rico Project, 6.625%, | | | | |
| 6/01/26 | | 11,865,000 | | 10,664,262 |
| Puerto Rico PBA Guaranteed Revenue, Government Facilities, Series S, 6.00%, 7/01/41 | | 15,000,000 | | 11,867,550 |
| Puerto Rico Public Finance Corp. Revenue, Commonwealth Appropriation, Refunding, | | | | |
| Series B, 5.50%, 8/01/31 | | 93,125,000 | | 59,982,744 |
| Puerto Rico Sales Tax FICO Sales Tax Revenue, | | | | |
| Capital Appreciation, first subordinate, Series A, zero cpn., 8/01/33 | | 12,150,000 | | 2,554,416 |
| Capital Appreciation, first subordinate, Series A, zero cpn., 8/01/34 | | 4,000,000 | | 776,040 |
| Capital Appreciation, first subordinate, Series A, zero cpn., 8/01/35 | | 4,930,000 | | 882,618 |
| Capital Appreciation, first subordinate, Series A, zero cpn., 8/01/36 | | 17,800,000 | | 2,940,560 |
| Capital Appreciation, first subordinate, Series A, zero cpn. to 8/01/16, 6.75% thereafter, | | | | |
| 8/01/32 | | 53,000,000 | | 39,713,960 |
Annual Report | 139
| | | | |
| Franklin Tax-Free Trust | | | | |
| |
| Statement of Investments, February 28, 2014 (continued) | | | | |
| |
| |
| Franklin High Yield Tax-Free Income Fund | | Principal Amount | | Value |
| Municipal Bonds (continued) | | | | |
| U.S. Territories (continued) | | | | |
| Puerto Rico (continued) | | | | |
| Puerto Rico Sales Tax FICO Sales Tax Revenue, (continued) | | | | |
| Capital Appreciation, first subordinate, Series A, zero cpn. to 8/01/19, 6.25% thereafter, | | | | |
| 8/01/33 | $ | 36,500,000 | $ | 19,704,890 |
| Capital Appreciation, Sub Series A, zero cpn., 8/01/34 | | 54,715,000 | | 10,636,049 |
| first subordinate, Refunding, Series A, Sub Series A-1, 5.00%, 8/01/43 | | 10,000,000 | | 7,431,500 |
| first subordinate, Series A, 5.50%, 8/01/42 | | 61,560,000 | | 48,356,611 |
| first subordinate, Series A, 6.00%, 8/01/42 | | 32,365,000 | | 26,688,826 |
| first subordinate, Series A, 6.50%, 8/01/44 | | 14,750,000 | | 12,696,210 |
| first subordinate, Series C, 5.50%, 8/01/40 | | 25,000,000 | | 19,884,000 |
| | | | | 506,639,620 |
| U.S. Virgin Islands 0.6% | | | | |
| Virgin Islands PFAR, | | | | |
| senior lien, Capital Projects, Series A-1, 5.00%, 10/01/24 | | 555,000 | | 587,567 |
| senior lien, Refunding, Series B, 5.00%, 10/01/25 | | 1,500,000 | | 1,574,985 |
| sub. lien, Refunding, Series C, 5.00%, 10/01/19 | | 9,145,000 | | 10,156,071 |
| sub. lien, Refunding, Series C, 5.00%, 10/01/22 | | 10,000,000 | | 10,705,900 |
| Virgin Islands Matching Fund Loan Note, Diageo Project, Series A, 6.625%, 10/01/29 | | 18,380,000 | | 19,714,020 |
| Virgin Islands Matching Fund Loan Note, Working Capital, sub. lien, Refunding, Series B, | | | | |
| 5.25%, 10/01/29 | | 5,750,000 | | 5,963,038 |
| | | | | 48,701,581 |
| | | | | 662,387,823 |
| Total Municipal Bonds before Short Term Investments | | | | |
| (Cost $7,231,009,321) | | | | 7,568,033,218 |
| Short Term Investments 0.7% | | | | |
| Municipal Bonds 0.7% | | | | |
| Georgia 0.2% | | | | |
| fBurke County Development Authority PCR, Georgia Power Co. Plant Vogtle Project, | | | | |
| Refunding, First Series, Daily VRDN and Put, 0.04%, 7/01/49 | | 15,700,000 | | 15,700,000 |
| Michigan 0.5% | | | | |
| fUniversity of Michigan Revenue, General, Series A, Daily VRDN and Put, 0.03%, | | | | |
| 4/01/38 | | 42,025,000 | | 42,025,000 |
| Total Short Term Investments (Cost $57,725,000) | | | | 57,725,000 |
| Total Investments (Cost $7,288,734,321) 97.8% | | | | 7,625,758,218 |
| Other Assets, less Liabilities 2.2% | | | | 169,095,152 |
| Net Assets 100.0% | | | $ | 7,794,853,370 |
140 | Annual Report
Franklin Tax-Free Trust
Statement of Investments, February 28, 2014 (continued)
Franklin High Yield Tax-Free Income Fund
See Abbreviations on page 200.
aSecurity has been deemed illiquid because it may not be able to be sold within seven days. At February 28, 2014, the aggregate value of these securities was $48,992,028,
representing 0.63% of net assets.
bSee Note 6 regarding defaulted securities.
cAt February 28, 2014, pursuant to the Fund’s policies and the requirements of applicable securities law, the Fund may be restricted from trading these securities for a limited
or extended period of time due to ownership limits and/or potential possession of material non-public information.
dThe bond pays interest and/or principal based upon the issuer’s ability to pay, which may be less than the stated interest rate or principal paydown.
eThe Internal Revenue Service is examining the bond and has proposed that the income generated by the bond is taxable. The issuer of the bond is seeking relief under IRS
procedures. Until the matter is finalized, the Fund will continue to recognize interest income earned on the bond as tax-exempt. The Trust’s management believes that the
final outcome of this matter will not have a material adverse impact to the Fund and/or its shareholders.
fVariable rate demand notes (VRDNs) are tax-exempt obligations which contain a floating or variable interest rate adjustment formula and an unconditional right of demand
to receive payment of the principal balance plus accrued interest at specified dates. The coupon rate shown represents the rate at period end.
Annual Report | The accompanying notes are an integral part of these financial statements. | 141
| | | | | | | | | | | | | | | | |
| Franklin Tax-Free Trust | | | | | | | | | | | | | |
| Financial Highlights | | | | | | | | | | | | | | | | |
| |
| Franklin Insured Tax-Free Income Fund | | | | | | | | | | | | | | | | |
| | | | | | | Year Ended February 28, | | | | |
| Class A | | | 2014 | | | 2013 | | | 2012 | a | | 2011 | | | 2010 | |
| Per share operating performance | | | | | | | | | | | | | | | | |
| (for a share outstanding throughout the year) | | | | | | | | | | | | | | | | |
| Net asset value, beginning of year | | $ | 12.63 | | $ | 12.37 | | $ | 11.39 | | $ | 11.88 | | $ | 11.20 | |
| Income from investment operationsb: | | | | | | | | | | | | | | | | |
| Net investment incomec | | | 0.47 | | | 0.45 | | | 0.50 | | | 0.51 | | | 0.52 | |
| Net realized and unrealized gains (losses) | | | (0.62 | ) | | 0.24 | | | 1.00 | | | (0.49 | ) | | 0.68 | |
| Total from investment operations | | | (0.15 | ) | | 0.69 | | | 1.50 | | | 0.02 | | | 1.20 | |
| Less distributions from net investment income | | | (0.46 | ) | | (0.43 | ) | | (0.52 | ) | | (0.51 | ) | | (0.52 | ) |
| Net asset value, end of year | | $ | 12.02 | | $ | 12.63 | | $ | 12.37 | | $ | 11.39 | | $ | 11.88 | |
| |
| Total returnd | | | (1.10 | )% | | 5.69 | % | | 13.40 | % | | 0.13 | % | | 10.93 | % |
| |
| Ratios to average net assets | | | | | | | | | | | | | | | | |
| Expenses | | | 0.60 | % | | 0.62 | % | | 0.62 | % | | 0.63 | % | | 0.63 | % |
| Net investment income | | | 3.94 | % | | 3.57 | % | | 4.25 | % | | 4.30 | % | | 4.46 | % |
| |
| Supplemental data | | | | | | | | | | | | | | | | |
| Net assets, end of year (000’s) | | $ | 1,880,628 | | $ | 2,552,174 | | $ | 2,312,711 | | $ | 2,100,666 | | $ | 2,134,949 | |
| Portfolio turnover rate | | | 1.61 | % | | 11.01 | % | | 7.08 | % | | 17.09 | % | | 5.21 | % |
aFor the year ended February 29.
bThe amount shown for a share outstanding throughout the period may not correlate with the Statement of Operations for the period due to the timing of sales and repurchases of
the Fund shares in relation to income earned and/or fluctuating market value of the investments of the Fund.
cBased on average daily shares outstanding.
dTotal return does not reflect sales commissions or contingent deferred sales charges, if applicable.
142 | The accompanying notes are an integral part of these financial statements. | Annual Report
| | | | | | | | | | | | | | | | |
| Franklin Tax-Free Trust | | | | | | | | | | | | | | | |
| Financial Highlights (continued) | | | | | | | | | | | | | | | | |
| |
| Franklin Insured Tax-Free Income Fund | | | | | | | | | | | | | | | | |
| | | | | | | Year Ended February 28, | | | | |
| Class C | | | 2014 | | | 2013 | | | 2012 | a | | 2011 | | | 2010 | |
| Per share operating performance | | | | | | | | | | | | | | | | |
| (for a share outstanding throughout the year) | | | | | | | | | | | | | | | | |
| Net asset value, beginning of year | | $ | 12.79 | | $ | 12.52 | | $ | 11.53 | | $ | 12.01 | | $ | 11.31 | |
| Income from investment operationsb: | | | | | | | | | | | | | | | | |
| Net investment incomec | | | 0.41 | | | 0.38 | | | 0.44 | | | 0.45 | | | 0.46 | |
| Net realized and unrealized gains (losses) | | | (0.63 | ) | | 0.25 | | | 1.00 | | | (0.49 | ) | | 0.70 | |
| Total from investment operations | | | (0.22 | ) | | 0.63 | | | 1.44 | | | (0.04 | ) | | 1.16 | |
| Less distributions from net investment income | | | (0.39 | ) | | (0.36 | ) | | (0.45 | ) | | (0.44 | ) | | (0.46 | ) |
| Net asset value, end of year | | $ | 12.18 | | $ | 12.79 | | $ | 12.52 | | $ | 11.53 | | $ | 12.01 | |
| |
| Total returnd | | | (1.63 | )% | | 5.12 | % | | 12.72 | % | | (0.36 | )% | | 10.41 | % |
| |
| Ratios to average net assets | | | | | | | | | | | | | | | | |
| Expenses | | | 1.16 | % | | 1.17 | % | | 1.17 | % | | 1.18 | % | | 1.18 | % |
| Net investment income | | | 3.38 | % | | 3.02 | % | | 3.70 | % | | 3.75 | % | | 3.91 | % |
| |
| Supplemental data | | | | | | | | | | | | | | | | |
| Net assets, end of year (000’s) | | $ | 333,816 | | $ | 547,371 | | $ | 455,584 | | $ | 385,479 | | $ | 339,444 | |
| Portfolio turnover rate | | | 1.61 | % | | 11.01 | % | | 7.08 | % | | 17.09 | % | | 5.21 | % |
aFor the year ended February 29.
bThe amount shown for a share outstanding throughout the period may not correlate with the Statement of Operations for the period due to the timing of sales and repurchases of
the Fund shares in relation to income earned and/or fluctuating market value of the investments of the Fund.
cBased on average daily shares outstanding.
dTotal return does not reflect sales commissions or contingent deferred sales charges, if applicable.
Annual Report | The accompanying notes are an integral part of these financial statements. | 143
| | | | | | | | | | | | | | | | |
| Franklin Tax-Free Trust | | | | | | | | | | | | | | | |
| Financial Highlights (continued) | | | | | | | | | | | | | | | | |
| |
| Franklin Insured Tax-Free Income Fund | | | | | | | | | | | | | | | | |
| | | | | | | Year Ended February 28, | | | | |
| Advisor Class | | | 2014 | | | 2013 | | | 2012 | a | | 2011 | | | 2010 | |
| Per share operating performance | | | | | | | | | | | | | | | | |
| (for a share outstanding throughout the year) | | | | | | | | | | | | | | | | |
| Net asset value, beginning of year | | $ | 12.62 | | $ | 12.36 | | $ | 11.39 | | $ | 11.88 | | $ | 11.20 | |
| Income from investment operationsb: | | | | | | | | | | | | | | | | |
| Net investment incomec | | | 0.48 | | | 0.46 | | | 0.51 | | | 0.52 | | | 0.53 | |
| Net realized and unrealized gains (losses) | | | (0.62 | ) | | 0.25 | | | 0.99 | | | (0.49 | ) | | 0.69 | |
| Total from investment operations | | | (0.14 | ) | | 0.71 | | | 1.50 | | | 0.03 | | | 1.22 | |
| Less distributions from net investment income | | | (0.47 | ) | | (0.45 | ) | | (0.53 | ) | | (0.52 | ) | | (0.54 | ) |
| Net asset value, end of year | | $ | 12.01 | | $ | 12.62 | | $ | 12.36 | | $ | 11.39 | | $ | 11.88 | |
| |
| Total return | | | (1.01 | )% | | 5.80 | % | | 13.42 | % | | 0.23 | % | | 11.04 | % |
| |
| Ratios to average net assets | | | | | | | | | | | | | | | | |
| Expenses | | | 0.51 | % | | 0.52 | % | | 0.52 | % | | 0.53 | % | | 0.53 | % |
| Net investment income | | | 4.03 | % | | 3.67 | % | | 4.35 | % | | 4.40 | % | | 4.56 | % |
| |
| Supplemental data | | | | | | | | | | | | | | | | |
| Net assets, end of year (000’s) | | $ | 46,589 | | $ | 72,179 | | $ | 62,000 | | $ | 21,855 | | $ | 9,408 | |
| Portfolio turnover rate | | | 1.61 | % | | 11.01 | % | | 7.08 | % | | 17.09 | % | | 5.21 | % |
aFor the year ended February 29.
bThe amount shown for a share outstanding throughout the period may not correlate with the Statement of Operations for the period due to the timing of sales and repurchases of
the Fund shares in relation to income earned and/or fluctuating market value of the investments of the Fund.
cBased on average daily shares outstanding.
144 | The accompanying notes are an integral part of these financial statements. | Annual Report
| | | | | |
| | Franklin Tax-Free Trust | | | | |
| |
| | Statement of Investments, February 28, 2014 | | | | |
| |
| |
| | Franklin Insured Tax-Free Income Fund | | Principal Amount | | Value |
| | Municipal Bonds 98.4% | | | | |
| | Alabama 4.4% | | | | |
| | Birmingham Airport Authority Airport Revenue, AGMC Insured, 5.50%, 7/01/40 | $ | 20,000,000 | $ | 21,683,200 |
| | Birmingham Waterworks Board Water Revenue, Series A, Assured Guaranty, 5.25%, | | | | |
| | 1/01/39 | | 5,000,000 | | 5,287,100 |
| | Chatom IDB Gulf Opportunity Zone Revenue, PowerSouth Energy Cooperative, Refunding, | | | | |
| | Series A, Assured Guaranty, 5.00%, | | | | |
| | 8/01/30 | | 5,250,000 | | 5,758,200 |
| | 8/01/37 | | 5,000,000 | | 5,314,750 |
| | Houston County Health Care Authority Revenue, Series A, AMBAC Insured, 5.125%, | | | | |
| | 10/01/24 | | 5,855,000 | | 5,910,037 |
| | 10/01/25 | | 6,065,000 | | 6,095,507 |
| | Leeds Public Educational Building Authority Educational Facilities Revenue, Assured Guaranty, | | | | |
| | 5.125%, 4/01/38 | | 10,865,000 | | 11,286,671 |
| | Limestone County Water and Sewer Authority Water Revenue, AMBAC Insured, 5.00%, | | | | |
| | 12/01/35 | | 9,100,000 | | 9,291,828 |
| | Orange Beach Water Sewer and Fire Protection Authority Revenue, NATL Insured, | | | | |
| Pre -Refunded, 5.00%, 5/15/35 | | 3,665,000 | | 3,874,748 |
| | Pell City GO, wts., | | | | |
| | Refunding, XLCA Insured, 5.00%, 2/01/24 | | 1,020,000 | | 1,067,532 |
| | XLCA Insured, 5.00%, 2/01/34 | | 5,195,000 | | 5,270,120 |
| | Phenix City Water and Sewer Revenue, wts., Series A, AGMC Insured, 5.00%, 8/15/40 | | 8,090,000 | | 8,654,439 |
| | Tuscaloosa Public Educational Building Authority Student Housing Revenue, Ridgecrest | | | | |
| | Student Housing LLC, University of Alabama Ridgecrest Residential Project, | | | | |
| | Assured Guaranty, 6.75%, 7/01/38 | | 5,000,000 | | 5,521,650 |
| | University of Alabama at Birmingham Hospital Revenue, Refunding, Series A, AMBAC Insured, | | | | |
| | 5.00%, 9/01/41 | | 5,000,000 | | 5,029,000 |
| | | | | | 100,044,782 |
| | Alaska 0.5% | | | | |
| | Alaska Energy Authority Power Revenue, Bradley Lake Project, Refunding, NATL Insured, | | | | |
| | 6.25%, 7/01/21 | | 5,000 | | 5,018 |
| | Matanuska-Susitna Borough Lease Revenue, Goose Creek Correctional Center Project, | | | | |
| | Assured Guaranty, 6.00%, 9/01/32 | | 10,000,000 | | 11,431,700 |
| | | | | | 11,436,718 |
| | Arizona 2.7% | | | | |
| | Arizona State COP, Department of Administration, | | | | |
| | Series A, AGMC Insured, 5.25%, 10/01/26 | | 8,500,000 | | 9,419,275 |
| | Series A, AGMC Insured, 5.25%, 10/01/28 | | 10,000,000 | | 10,979,500 |
| | Series A, AGMC Insured, 5.00%, 10/01/29 | | 5,000,000 | | 5,397,600 |
| | Series B, AGMC Insured, 5.00%, 10/01/27 | | 8,000,000 | | 8,628,400 |
| | Downtown Phoenix Hotel Corp. Revenue, Subordinate, Series B, NATL RE, FGIC Insured, | | | | |
| | 5.00%, 7/01/36 | | 6,450,000 | | 6,486,378 |
| | Maricopa County IDA Hospital System Revenue, Samaritan Health Services, Series A, | | | | |
| | NATL Insured, ETM, 7.00%, 12/01/16 | | 300,000 | | 326,088 |
| | Pima County Sewer System Revenue, Obligations, Assured Guaranty, 5.00%, 7/01/25 | | 7,000,000 | | 7,847,560 |
| | Tucson Water System Revenue, Series B, AGMC Insured, 5.00%, 7/01/32 | | 12,000,000 | | 12,620,880 |
| | | | | | 61,705,681 |
Annual Report | 145
| | | | | |
| | Franklin Tax-Free Trust | | | | |
| |
| | Statement of Investments, February 28, 2014 (continued) | | | | |
| |
| |
| | Franklin Insured Tax-Free Income Fund | | Principal Amount | | Value |
| | Municipal Bonds (continued) | | | | |
| | Arkansas 0.4% | | | | |
| | Benton Regional Public Water Authority Water Revenue, Refunding and Improvement, | | | | |
| | XLCA Insured, 5.00%, 10/01/35 | $ | 5,230,000 | $ | 5,397,046 |
| | Board of Trustees of the University of Arkansas Revenue, Various Facility, Fayetteville Campus, | | | | |
| | AMBAC Insured, 5.00%, 11/01/36 | | 3,205,000 | | 3,336,501 |
| | | | | | 8,733,547 |
| | California 9.7% | | | | |
| | California State GO, | | | | |
| | Refunding, AMBAC Insured, 5.00%, 2/01/33 | | 1,250,000 | | 1,253,338 |
| | Refunding, NATL Insured, 5.00%, 10/01/32 | | 20,000 | | 20,055 |
| | Various Purpose, AGMC Insured, 6.00%, 4/01/38 | | 30,000,000 | | 34,417,500 |
| | Various Purpose, Refunding, NATL Insured, 4.75%, 3/01/35 | | 20,855,000 | | 21,103,383 |
| | California State Public Works Board Lease Revenue, Various Capital Projects, | | | | |
| | Series A, AGMC Insured, 5.00%, 4/01/28 | | 13,030,000 | | 14,345,639 |
| | Series A, AGMC Insured, 5.00%, 4/01/29 | | 21,000,000 | | 22,920,240 |
| | Series G, Sub Series G-1, Assured Guaranty, 5.25%, 10/01/24 | | 5,000,000 | | 5,812,650 |
| | California State University Revenue, Systemwide, Series A, AGMC Insured, 5.00%, | | | | |
| | 11/01/39 | | 10,000,000 | | 10,344,000 |
| | Colton Joint USD, GO, San Bernardino and Riverside Counties, Election of 2008, Series A, | | | | |
| | Assured Guaranty, 5.375%, 8/01/34 | | 10,000,000 | | 10,783,000 |
| | East Side UHSD Santa Clara County GO, Election of 2008, Series B, Assured Guaranty, | | | | |
| | 5.25%, 8/01/35 | | 23,800,000 | | 25,125,898 |
| | Los Angeles USD, GO, Election of 2004, Series H, AGMC Insured, 5.00%, 7/01/32 | | 32,565,000 | | 35,328,140 |
| | Montebello USD, GO, Election of 2004, Series A-1, Assured Guaranty, 5.25%, 8/01/34 | | 5,000,000 | | 5,356,150 |
| | Richmond Joint Powers Financing Authority Lease Revenue, Civic Center Project, Refunding, | | | | |
| | Assured Guaranty, 5.75%, 8/01/29 | | 13,315,000 | | 15,022,915 |
| | San Joaquin Hills Transportation Corridor Agency Toll Road Revenue, Refunding, Series A, | | | | |
| | NATL Insured, 5.25%, 1/15/30 | | 4,000,000 | | 3,974,200 |
| | San Jose RDA Tax Allocation, Merged Area, Refunding, Series D, Assured Guaranty, 5.00%, | | | | |
| | 8/01/22 | | 10,000,000 | | 10,444,600 |
| | Val Verde USD, COP, School Construction Project, | | | | |
| | Refunding, Series B, NATL RE, FGIC Insured, 5.00%, 1/01/35 | | 1,680,000 | | 1,683,108 |
| | Series B, FGIC Insured, Pre-Refunded, 5.00%, 1/01/35 | | 820,000 | | 852,316 |
| | | | | | 218,787,132 |
| | Colorado 2.9% | | | | |
| | Colorado State Board of Governors University Enterprise System Revenue, Series A, | | | | |
| | NATL RE, FGIC Insured, | | | | |
| | 5.00%, 3/01/37 | | 1,350,000 | | 1,399,221 |
| Pre-Refunded, 5.00%, 3/01/37 | | 8,650,000 | | 9,811,609 |
| | Colorado State Health Facilities Authority Revenue, | | | | |
| | Catholic Health Initiatives, Series C-7, AGMC Insured, 5.00%, 9/01/36 | | 20,000,000 | | 20,664,800 |
| | Health Facility Authority, Hospital, Refunding, Series B, AGMC Insured, 5.25%, | | | | |
| | 3/01/36 | | 10,000,000 | | 10,412,200 |
| | Denver City and County Airport System Revenue, Series C, NATL Insured, ETM, 6.125%, | | | | |
| | 11/15/25 | | 4,410,000 | | 4,422,789 |
| | 11/15/25 | | 3,590,000 | | 4,590,820 |
| | Denver Convention Center Hotel Authority Revenue, senior bond, Refunding, XLCA Insured, | | | | |
| | 5.00%, 12/01/35 | | 15,000,000 | | 15,054,450 |
| | | | | | 66,355,889 |
| | 146 | Annual Report | | | | |
| | | | |
| Franklin Tax-Free Trust | | | | |
| |
| Statement of Investments, February 28, 2014 (continued) | | | | |
| |
| |
| Franklin Insured Tax-Free Income Fund | | Principal Amount | | Value |
| Municipal Bonds (continued) | | | | |
| Connecticut 0.2% | | | | |
| Connecticut State Health and Educational Facilities Authority Revenue, Child Care Facilities | | | | |
| Program, Series G, Assured Guaranty, 6.00%, 7/01/38 | $ | 5,000,000 | $ | 5,384,750 |
| District of Columbia 0.9% | | | | |
| District of Columbia Hospital Revenue, Children’s Hospital Obligated Group Issue, | | | | |
| Sub Series 1, AGMC Insured, 5.45%, 7/15/35 | | 19,075,000 | | 19,873,289 |
| Florida 6.1% | | | | |
| Brevard County Local Option Fuel Tax Revenue, NATL RE, FGIC Insured, 5.00%, | | | | |
| 8/01/32 | | 12,440,000 | | 12,916,203 |
| 8/01/37 | | 13,000,000 | | 13,351,260 |
| Broward County HFAR, | | | | |
| 5.65%, 11/01/22 | | 405,000 | | 405,373 |
| 5.70%, 11/01/29 | | 225,000 | | 225,133 |
| Broward County School Board COP, Master Lease Purchase Agreement, Series A, | | | | |
| AGMC Insured, 5.00%, 7/01/30 | | 2,000,000 | | 2,082,940 |
| Cape Coral Water and Sewer Revenue, AMBAC Insured, 5.00%, 10/01/36 | | 2,000,000 | | 2,046,900 |
| Celebration CDD Special Assessment, Series B, NATL Insured, 5.50%, 5/01/19 | | 115,000 | | 115,421 |
| Coral Gables Health Facilities Authority Hospital Revenue, Baptist Health South Florida | | | | |
| Obligated Group, AGMC Insured, Pre-Refunded, 5.00%, 8/15/29 | | 1,000,000 | | 1,021,450 |
| Dade County HFA, MFMR, Siesta Pointe Apartments, Series A, AGMC Insured, 5.75%, | | | | |
| 9/01/29 | | 1,890,000 | | 1,891,172 |
| Deltona Utility System Revenue, Refunding, AGMC Insured, 5.125%, 10/01/39 | | 5,000,000 | | 5,336,900 |
| Florida Gulf Coast University FICO Capital Improvement Revenue, Housing Project, Series A, | | | | |
| NATL Insured, 5.00%, 2/01/37 | | 10,000,000 | | 10,034,400 |
| Florida HFAR, Spinnaker Cove Apartments, Series G, AMBAC Insured, 6.50%, 7/01/36 | | 1,600,000 | | 1,600,800 |
| Florida State Correctional Privatization Commission COP, Series B, AMBAC Insured, 5.00%, | | | | |
| 8/01/25 | | 2,000,000 | | 2,029,320 |
| Hernando County School Board COP, NATL Insured, 5.00%, 7/01/30 | | 1,150,000 | | 1,176,864 |
| Hillsborough County School Board COP, Master Lease Program, Refunding, Series A, | | | | |
| NATL Insured, 5.00%, 7/01/26 | | 1,670,000 | | 1,746,202 |
| Indian Trail Water Control District Improvement Revenue, NATL Insured, 5.75%, 8/01/16 | | 520,000 | | 522,054 |
| Lake County School Board COP, Series A, AMBAC Insured, 5.00%, 6/01/30 | | 2,080,000 | | 2,127,819 |
| Lee County Airport Revenue, Refunding, AGMC Insured, 5.00%, 10/01/33 | | 3,530,000 | | 3,600,988 |
| Lee Memorial Health System Hospital Revenue, Series A, AMBAC Insured, 5.00%, | | | | |
| 4/01/32 | | 1,460,000 | | 1,502,194 |
| 4/01/37 | | 11,000,000 | | 11,111,760 |
| Leon County COP, AMBAC Insured, 5.00%, 7/01/25 | | 8,935,000 | | 9,535,789 |
| Maitland CDA Revenue, AMBAC Insured, 5.00%, 7/01/34 | | 2,595,000 | | 2,697,736 |
| Martin County Health Facilities Authority Hospital Revenue, Martin Memorial Medical Center, | | | | |
| AGMC Insured, 5.50%, 11/15/42 | | 3,800,000 | | 3,966,668 |
| Miami Beach Water and Sewer Revenue, AMBAC Insured, 5.00%, 9/01/30 | | 3,000,000 | | 3,003,450 |
| Miami-Dade County Aviation Revenue, Miami International Airport, Hub of the Americas, | | | | |
| Refunding, Series A, CIFG Insured, 5.00%, 10/01/38 | | 1,625,000 | | 1,638,374 |
| Series B, NATL RE, FGIC Insured, 5.00%, 10/01/30 | | 3,500,000 | | 3,530,590 |
| Miami-Dade County GO, Building Better Communities Program, NATL RE, FGIC Insured, | | | | |
| 5.00%, 7/01/33 | | 2,000,000 | | 2,096,660 |
| Miami-Dade County Public Facilities Revenue, Jackson Health System, Series A, | | | | |
| NATL Insured, 5.00%, 6/01/31 | | 1,650,000 | | 1,665,460 |
Annual Report | 147
| | | | |
| Franklin Tax-Free Trust | | | | |
| |
| Statement of Investments, February 28, 2014 (continued) | | | | |
| |
| |
| Franklin Insured Tax-Free Income Fund | | Principal Amount | | Value |
| Municipal Bonds (continued) | | | | |
| Florida (continued) | | | | |
| Miami-Dade County School Board COP, Master Lease Purchase Agreement, Series A, | | | | |
| NATL RE, FGIC Insured, 5.00%, 5/01/25 | $ | 5,000,000 | $ | 5,378,450 |
| Orange County Health Facilities Authority Hospital Revenue, Orlando Regional Healthcare | | | | |
| System, Refunding, Series B, AGMC Insured, 5.00%, 12/01/32 | | 7,000,000 | | 7,357,700 |
| Pembroke Pines Public Improvement Revenue, | | | | |
| Series A, AMBAC Insured, 5.00%, 10/01/29 | | 2,000,000 | | 2,019,300 |
| Series B, AMBAC Insured, 5.00%, 10/01/34 | | 2,000,000 | | 2,017,700 |
| Pinellas County Sewer Revenue, AGMC Insured, 5.00%, 10/01/32 | | 610,000 | | 611,531 |
| Polk County Public Facilities Revenue, NATL Insured, 5.00%, 12/01/33 | | 2,000,000 | | 2,104,800 |
| Polk County Utility System Revenue, Series A, NATL RE, FGIC Insured, Pre-Refunded, | | | | |
| 5.00%, 10/01/30 | | 1,000,000 | | 1,027,610 |
| Port Orange GO, NATL Insured, 5.00%, 4/01/33 | | 1,755,000 | | 1,858,756 |
| Port St. Lucie Utility System Revenue, NATL Insured, 5.00%, 9/01/34 | | 8,420,000 | | 8,496,117 |
| Sumter County School District Revenue, Multi-District Loan Program, AGMC Insured, ETM, | | | | |
| 7.15%, 11/01/15 | | 245,000 | | 272,173 |
| Sunrise Utilities System Revenue, | | | | |
| AMBAC Insured, Pre-Refunded, 5.20%, 10/01/22 | | 860,000 | | 1,030,908 |
| Refunding, AMBAC Insured, 5.20%, 10/01/22 | | 1,140,000 | | 1,252,005 |
| University of Central Florida Athletics Assn. Inc. COP, Series A, NATL RE, FGIC Insured, | | | | |
| 5.00%, | | | | |
| 10/01/27 | | 1,000,000 | | 1,006,270 |
| 10/01/30 | | 1,485,000 | | 1,489,618 |
| | | | | 138,902,818 |
| Georgia 5.2% | | | | |
| Albany Dougherty Payroll Development Authority Revenue, Darton College Project, | | | | |
| Assured Guaranty, 5.75%, 6/15/41 | | 5,550,000 | | 6,125,923 |
| Atlanta Airport General Revenue, Series A, AGMC Insured, 5.00%, 1/01/40 | | 9,215,000 | | 9,572,450 |
| Atlanta Water and Wastewater Revenue, | | | | |
| AGMC Insured, 5.00%, 11/01/37 | | 15,000,000 | | 15,075,000 |
| Refunding, Series B, AGMC Insured, 5.375%, 11/01/39 | | 23,000,000 | | 24,239,930 |
| Brunswick Water and Sewer Revenue, Improvement, NATL Insured, ETM, 6.10%, | | | | |
| 10/01/14 | | 545,000 | | 563,476 |
| Bulloch County Development Authority Student Housing Revenue, Georgia Southern | | | | |
| University Housing Foundation Four, Assured Guaranty, 5.25%, 7/01/33 | | 14,825,000 | | 15,746,522 |
| Cherokee County Water and Sewerage Authority Revenue, NATL Insured, 6.90%, 8/01/18 | | 15,000 | | 15,042 |
| Dahlonega Water and Wastewater Revenue, Series A, Assured Guaranty, 5.50%, 9/01/37 | | 6,450,000 | | 6,787,077 |
| East Point Building Authority Revenue, Water and Sewer Project, Series A, XLCA Insured, | | | | |
| 5.00%, 2/01/30 | | 11,360,000 | | 11,388,059 |
| Georgia State Higher Education Facilities Authority Revenue, USG Real Estate Foundation III | | | | |
| LLC Project, Series A, Assured Guaranty, 5.00%, 6/15/38 | | 9,250,000 | | 9,520,285 |
| Medical Center Hospital Authority Revenue, Anticipation Certificates, Columbus Regional | | | | |
| Healthcare System Inc. Project, Refunding, AGMC Insured, 5.00%, 8/01/41 | | 7,500,000 | | 7,660,350 |
| Savannah EDA Revenue, SSU Community Development I LLC Project, Series I, | | | | |
| Assured Guaranty, 5.75%, 6/15/41 | | 10,000,000 | | 10,818,200 |
| | | | | 117,512,314 |
148 | Annual Report
| | | | |
| Franklin Tax-Free Trust | | | | |
| |
| Statement of Investments, February 28, 2014 (continued) | | | | |
| |
| |
| Franklin Insured Tax-Free Income Fund | | Principal Amount | | Value |
| Municipal Bonds (continued) | | | | |
| Illinois 8.6% | | | | |
| Chicago Board of Education GO, | | | | |
| Dedicated Tax, Series A, AGMC Insured, 5.00%, 12/01/42 | $ | 20,000,000 | $ | 20,181,800 |
| Refunding, Series C, Assured Guaranty, 5.25%, 12/01/26 | | 12,575,000 | | 13,252,164 |
| Chicago GO, Refunding, Series A, AGMC Insured, 5.00%, | | | | |
| 1/01/28 | | 29,885,000 | | 31,216,675 |
| 1/01/29 | | 13,345,000 | | 13,827,822 |
| 1/01/30 | | 6,200,000 | | 6,408,196 |
| Chicago O’Hare International Airport Revenue, | | | | |
| General, third lien, Series C, AGMC Insured, 5.25%, 1/01/35 | | 26,635,000 | | 27,701,732 |
| Refunding, Series A, AGMC Insured, 5.00%, 1/01/28 | | 24,915,000 | | 26,459,979 |
| Illinois State Finance Authority Revenue, | | | | |
| Edward Hospital, Series A, AMBAC Insured, 5.50%, 2/01/40 | | 4,000,000 | | 4,061,440 |
| Southern Illinois HealthCare, AGMC Insured, 5.375%, 3/01/35 | | 8,500,000 | | 8,836,855 |
| Illinois State GO, | | | | |
| AGMC Insured, 5.00%, 3/01/26 | | 4,000,000 | | 4,322,320 |
| AGMC Insured, 5.00%, 3/01/27 | | 11,500,000 | | 12,312,245 |
| Refunding, AGMC Insured, 5.00%, 1/01/23 | | 10,000,000 | | 10,876,800 |
| Regional Transportation Authority Revenue, Series A, AMBAC Insured, 7.20%, 11/01/20 | | 265,000 | | 297,046 |
| Saline Valley Conservancy District Waterworks Revenue, Saline Valley Conservancy District, | | | | |
| Refunding, Series A, AMBAC Insured, 5.00%, 1/01/41 | | 7,000,000 | | 7,136,010 |
| St. Clair County School District No. 189 East St. Louis GO, Alternate Revenue Source, | | | | |
| Refunding, AMBAC Insured, 5.125%, 1/01/28 | | 7,135,000 | | 7,334,923 |
| | | | | 194,226,007 |
| Indiana 0.6% | | | | |
| Indiana Health and Educational Facility Financing Authority Revenue, Sisters of St. Francis | | | | |
| Health Services Inc. Obligated Group, Refunding, Series E, AGMC Insured, 5.25%, | | | | |
| 5/15/41 | | 3,750,000 | | 3,833,888 |
| Indianapolis Local Public Improvement Bond Bank Revenue, Waterworks Project, Series A, | | | | |
| Assured Guaranty, 5.50%, 1/01/38 | | 8,650,000 | | 9,236,902 |
| | | | | 13,070,790 |
| Kentucky 0.5% | | | | |
| Kentucky State Municipal Power Agency Power System Revenue, Prairie State Project, | | | | |
| Series A, NATL Insured, 5.00%, 9/01/37 | | 10,000,000 | | 10,195,300 |
| Louisiana 2.8% | | | | |
| Lafayette Public Trust Financing Authority Revenue, Ragin’ Cajun Facilities, Housing and | | | | |
| Package Project, Assured Guaranty, | | | | |
| 5.00%, 10/01/25 | | 5,500,000 | | 5,873,890 |
| 5.50%, 10/01/41 | | 15,000,000 | | 15,679,800 |
| Louisiana Local Government Environmental Facilities and CDA Revenue, | | | | |
| LCTCS Facilities Corp. Project, Series B, Assured Guaranty, 5.00%, 10/01/26 | | 2,750,000 | | 2,909,995 |
| Southeastern Louisiana University, Series A, AGMC Insured, 5.00%, 10/01/40 | | 8,545,000 | | 8,953,793 |
| Louisiana State Citizens Property Insurance Corp. Assessment Revenue, | | | | |
| Refunding, AGMC Insured, 5.00%, 6/01/24 | | 5,250,000 | | 5,860,890 |
| Series C-2, Assured Guaranty, 6.75%, 6/01/26 | | 21,000,000 | | 24,678,360 |
| | | | | 63,956,728 |
Annual Report | 149
| | | | |
| Franklin Tax-Free Trust | | | | |
| |
| Statement of Investments, February 28, 2014 (continued) | | | | |
| |
| |
| Franklin Insured Tax-Free Income Fund | | Principal Amount | | Value |
| Municipal Bonds (continued) | | | | |
| Maine 1.1% | | | | |
| Maine State Educational Loan Authority Student Loan Revenue, Supplemental Education | | | | |
| Loan Program, Series A-3, Assured Guaranty, 5.875%, 12/01/39 | $ | 13,520,000 | $ | 14,268,332 |
| Portland Airport Revenue, General, AGMC Insured, | | | | |
| 5.25%, 1/01/35 | | 3,000,000 | | 3,165,780 |
| 5.00%, 1/01/40 | | 6,000,000 | | 6,232,740 |
| | | | | 23,666,852 |
| Maryland 0.8% | | | | |
| Baltimore Convention Center Hotel Revenue, Senior Series A, XLCA Insured, 5.00%, | | | | |
| 9/01/32 | | 10,000,000 | | 9,260,100 |
| Maryland State Health and Higher Educational Facilities Authority Revenue, | | | | |
| LifeBridge Health Issue, Refunding, Assured Guaranty, 5.00%, 7/01/34 | | 9,000,000 | | 9,209,340 |
| University of Maryland Medical System Issue, Series B, NATL RE, FGIC Insured, 7.00%, | | | | |
| 7/01/22 | | 190,000 | | 225,650 |
| | | | | 18,695,090 |
| Massachusetts 2.5% | | | | |
| Massachusetts State Development Finance Agency Revenue, Worcester Polytechnic Institute | | | | |
| Issue, NATL Insured, 5.00%, 9/01/47 | | 25,050,000 | | 25,636,922 |
| Massachusetts State Health and Educational Facilities Authority Revenue, | | | | |
| CareGroup Issue, Series A, NATL Insured, Pre-Refunded, 5.00%, 7/01/25 | | 750,000 | | 870,908 |
| Emmanuel College Issue, NATL Insured, 5.00%, 7/01/37 | | 21,685,000 | | 21,868,238 |
| Harvard Pilgrim Health Care Issue, Series A, AGMC Insured, 5.00%, 7/01/18 | | 3,000,000 | | 3,005,460 |
| Simmons College Issue, Series C, NATL Insured, 5.125%, 10/01/28 | | 4,260,000 | | 4,261,661 |
| | | | | 55,643,189 |
| Michigan 7.6% | | | | |
| Birmingham City School District GO, School Building and Site, AGMC Insured, Pre-Refunded, | | | | |
| 5.00%, 11/01/33 | | 8,135,000 | | 8,395,076 |
| Detroit GO, Series A-1, NATL Insured, 5.00%, 4/01/21 | | 12,390,000 | | 10,899,111 |
| Detroit Sewage Disposal System Revenue, | | | | |
| second lien, Series B, NATL Insured, 5.00%, 7/01/36 | | 15,000,000 | | 14,244,600 |
| senior lien, Refunding, Series A, AGMC Insured, 5.00%, 7/01/32 | | 2,905,000 | | 2,773,897 |
| senior lien, Series B, AGMC Insured, 7.50%, 7/01/33 | | 6,000,000 | | 6,443,640 |
| Detroit Water and Sewerage Department Sewage Disposal System Revenue, senior lien, | | | | |
| Refunding, Series A, AGMC Insured, 5.00%, 7/01/39 | | 10,000,000 | | 9,230,500 |
| Detroit Water Supply System Revenue, | | | | |
| second lien, Series B, AGMC Insured, 7.00%, 7/01/36 | | 5,000,000 | | 5,334,350 |
| senior lien, Series A, AGMC Insured, 5.00%, 7/01/34 | | 7,040,000 | | 6,778,605 |
| senior lien, Series A, NATL Insured, 5.00%, 7/01/34 | | 10,150,000 | | 9,773,131 |
| Jackson County Hospital Finance Authority Revenue, W.A. Foote Memorial Hospital, | | | | |
| Refunding, Series C, Assured Guaranty, 5.00%, 6/01/26 | | 15,000,000 | | 15,845,550 |
| Michigan State Building Authority Revenue, Refunding, Series IA, | | | | |
| AGMC Insured, 5.00%, 10/15/36 | | 28,895,000 | | 29,610,729 |
| NATL RE, FGIC Insured, 5.00%, 10/15/36 | | 10,000,000 | | 10,247,700 |
| Michigan State Hospital Finance Authority Revenue, | | | | |
| Hospital, Sparrow Obligated Group, Refunding, NATL Insured, 5.00%, 11/15/36 | | 13,000,000 | | 13,066,430 |
| Trinity Health Credit Group, Series A, 6.50%, 12/01/33 | | 25,000,000 | | 28,458,000 |
150 | Annual Report
| | | | |
| Franklin Tax-Free Trust | | | | |
| |
| Statement of Investments, February 28, 2014 (continued) | | | | |
| |
| |
| Franklin Insured Tax-Free Income Fund | | Principal Amount | | Value |
| Municipal Bonds (continued) | | | | |
| Michigan (continued) | | | | |
| Michigan State Strategic Fund Limited Obligation Revenue, Detroit Edison Co. Pollution | | | | |
| Control Bonds Project, Refunding, Collateralized Series BB, AMBAC Insured, 7.00%, | | | | |
| 5/01/21 | $ | 250,000 | $ | 309,953 |
| | | | | 171,411,272 |
| Minnesota 0.7% | | | | |
| Minneapolis-St. Paul Metropolitan Airports Commission Airport Revenue, sub. bond, | | | | |
| Refunding, Series A, AMBAC Insured, 5.00%, 1/01/35 | | 15,000,000 | | 15,313,950 |
| Minnesota Agricultural and Economic Development Board Revenue, Health Care System, | | | | |
| Fairview Hospital and Healthcare Services, Refunding, Series A, NATL Insured, 5.75%, | | | | |
| 11/15/26 | | 180,000 | | 180,520 |
| | | | | 15,494,470 |
| Mississippi 0.5% | | | | |
| Mississippi Development Bank Special Obligation Revenue, Municipal Energy Agency, | | | | |
| Series A, XLCA Insured, 5.00%, 3/01/36 | | 10,915,000 | | 11,030,044 |
| Missouri 1.0% | | | | |
| Bi-State Development Agency Missouri-Illinois Metropolitan District Mass Transit Sales Tax | | | | |
| Revenue, Metrolink Cross County Extension Project, Assured Guaranty, 5.00%, 10/01/39 | | 6,000,000 | | 6,299,940 |
| Missouri State Health and Educational Facilities Authority Health Facilities Revenue, | | | | |
| St. Luke’s Health System, Series B, AGMC Insured, 5.50%, 11/15/35 | | 15,000,000 | | 15,979,800 |
| | | | | 22,279,740 |
| Nebraska 0.1% | | | | |
| Lancaster County Hospital Authority Revenue, Bryan Memorial Hospital Project No. 1, | | | | |
| NATL Insured, ETM, 6.70%, 6/01/22 | | 2,325,000 | | 2,886,860 |
| Nevada 1.4% | | | | |
| Clark County GO, Series A, AMBAC Insured, 6.50%, 6/01/17 | | 250,000 | | 292,835 |
| Clark County Passenger Facility Charge Revenue, Las Vegas, McCarran International Airport, | | | | |
| Series A, | | | | |
| AGMC Insured, 5.25%, 7/01/42 | | 5,000,000 | | 5,221,100 |
| Assured Guaranty, 5.25%, 7/01/39 | | 20,000,000 | | 21,010,200 |
| Reno Hospital Revenue, Washoe Medical Center Project, Refunding, Series C, AGMC Insured, | | | | |
| 5.375%, 6/01/39 | | 5,000,000 | | 5,117,850 |
| | | | | 31,641,985 |
| New Hampshire 0.3% | | | | |
| Manchester GARB, General, Refunding, Series A, AGMC Insured, 5.125%, 1/01/30 | | 6,000,000 | | 6,301,080 |
| New Jersey 2.1% | | | | |
| New Jersey EDA Revenue, | | | | |
| Motor Vehicle Surcharges, Series A, NATL Insured, 5.00%, 7/01/29 | | 3,450,000 | | 3,497,403 |
| Motor Vehicle Surcharges, Series A, NATL Insured, 5.00%, 7/01/34 | | 21,250,000 | | 21,527,312 |
| Municipal Rehabilitation, Series A, AMBAC Insured, 5.00%, 4/01/28 | | 4,000,000 | | 4,007,000 |
| New Jersey State Transportation Trust Fund Authority Revenue, Transportation System, | | | | |
| Series A, | | | | |
| 6.00%, 12/15/38 | | 9,620,000 | | 10,673,582 |
| Pre-Refunded, 6.00%, 12/15/38 | | 5,380,000 | | 6,654,522 |
Annual Report | 151
| | | | |
| Franklin Tax-Free Trust | | | | |
| |
| Statement of Investments, February 28, 2014 (continued) | | | | |
| |
| |
| Franklin Insured Tax-Free Income Fund | | Principal Amount | | Value |
| Municipal Bonds (continued) | | | | |
| New Jersey (continued) | | | | |
| New Jersey State Turnpike Authority Turnpike Revenue, Series C, AMBAC Insured, | | | | |
| 6.50%, 1/01/16 | $ | 35,000 | $ | 38,804 |
| ETM, 6.50%, 1/01/16 | | 20,000 | | 22,252 |
| ETM, 6.50%, 1/01/16 | | 15,000 | | 16,674 |
| Pre-Refunded, 6.50%, 1/01/16 | | 75,000 | | 79,160 |
| | | | | 46,516,709 |
| New York 5.2% | | | | |
| Hudson Yards Infrastructure Corp. Revenue, Series A, AGMC Insured, 5.00%, 2/15/47 | | 16,475,000 | | 16,971,062 |
| MTA Revenue, | | | | |
| Refunding, Series D, AGMC Insured, 5.00%, 11/15/29 | | 3,000,000 | | 3,294,570 |
| Transportation, Series A, AGMC Insured, 5.00%, 11/15/33 | | 20,000,000 | | 20,889,000 |
| New York City Municipal Water Finance Authority Water and Sewer System Revenue, | | | | |
| Second General Resolution, Refunding, | | | | |
| Series AA, 5.00%, 6/15/44 | | 21,550,000 | | 22,592,589 |
| Series GG, 5.00%, 6/15/43 | | 25,000,000 | | 26,225,500 |
| New York City Transitional Finance Authority Building Aid Revenue, Fiscal 2012, Series S-1, | | | | |
| Sub Series S-1A, 5.25%, 7/15/37 | | 25,000,000 | | 27,140,250 |
| | | | | 117,112,971 |
| North Carolina 0.4% | | | | |
| Raleigh Combined Enterprise System Revenue, 5.00%, 3/01/40 | | 7,915,000 | | 8,503,164 |
| North Dakota 1.4% | | | | |
| Cass County Health Care Facilities Revenue, Essentia Health Obligated Group, Series D, | | | | |
| Assured Guaranty, 5.00%, 2/15/40 | | 31,970,000 | | 32,529,475 |
| Ohio 3.0% | | | | |
| Cleveland Airport System Revenue, Refunding, Series A, AGMC Insured, 5.00%, | | | | |
| 1/01/27 | | 4,190,000 | | 4,489,166 |
| 1/01/28 | | 9,500,000 | | 10,119,020 |
| Hamilton County Healthcare Revenue, Christ Hospital Project, AGMC Insured, 5.00%, | | | | |
| 6/01/42 | | 22,500,000 | | 23,125,275 |
| Jefferson Area Local School District GO, School Facilities Construction and Improvement, | | | | |
| NATL RE, FGIC Insured, Pre-Refunded, 5.00%, 12/01/31 | | 4,085,000 | | 4,326,423 |
| Ohio State Higher Educational Facility Commission Revenue, Summa Health System, | | | | |
| 2010 Project, Refunding, Assured Guaranty, 5.25%, 11/15/40 | | 15,000,000 | | 15,308,550 |
| Ohio State Hospital Facility Revenue, University Hospital Health System, Refunding, Series A, | | | | |
| AGMC Insured, 5.00%, 1/15/41 | | 7,000,000 | | 7,173,250 |
| Reynoldsburg City School District GO, School Facilities Construction and Improvement, | | | | |
| AGMC Insured, 5.00%, 12/01/31 | | 4,000,000 | | 4,085,360 |
| | | | | 68,627,044 |
| Oklahoma 0.0%† | | | | |
| McGee Creek Authority Water Revenue, NATL Insured, 6.00%, 1/01/23 | | 280,000 | | 312,225 |
| Oregon 0.2% | | | | |
| Medford Hospital Facilities Authority Revenue, Asante Health System, Series A, | | | | |
| Assured Guaranty, 5.00%, 8/15/40 | | 4,935,000 | | 5,041,103 |
152 | Annual Report
| | | | |
| Franklin Tax-Free Trust | | | | |
| |
| Statement of Investments, February 28, 2014 (continued) | | | | |
| |
| |
| Franklin Insured Tax-Free Income Fund | | Principal Amount | | Value |
| Municipal Bonds (continued) | | | | |
| Pennsylvania 6.4% | | | | |
| Allegheny County GO, Series C-70, AGMC Insured, 5.00%, 12/01/37 | $ | 10,000,000 | $ | 10,482,500 |
| Allegheny County Sanitary Authority Sewer Revenue, | | | | |
| AGMC Insured, 5.00%, 6/01/25 | | 3,540,000 | | 3,955,171 |
| AGMC Insured, 5.00%, 6/01/26 | | 5,930,000 | | 6,575,955 |
| Build America Mutual Assurance, 5.25%, 12/01/44 | | 5,000,000 | | 5,325,200 |
| Bucks County Water and Sewer Authority Water System Revenue, AGMC Insured, 5.00%, | | | | |
| 12/01/33 | | 5,500,000 | | 5,919,485 |
| 12/01/37 | | 10,520,000 | | 11,177,605 |
| 12/01/41 | | 5,110,000 | | 5,384,305 |
| Centre County Hospital Authority Hospital Revenue, Mount Nittany Medical Center Project, | | | | |
| Assured Guaranty, Pre-Refunded, | | | | |
| 5.875%, 11/15/29 | | 1,000,000 | | 1,039,570 |
| 6.125%, 11/15/39 | | 3,000,000 | | 3,123,930 |
| 6.25%, 11/15/44 | | 2,500,000 | | 2,605,450 |
| Delaware River Port Authority Revenue, Series D, AGMC Insured, 5.00%, 1/01/40 | | 15,000,000 | | 15,803,250 |
| Lackawanna County GO, Series B, AGMC Insured, 5.00%, 9/01/35 | | 7,500,000 | | 7,516,425 |
| Pennsylvania Convention Center Authority Revenue, Series A, FGIC Insured, ETM, 6.00%, | | | | |
| 9/01/19 | | 500,000 | | 608,665 |
| Pennsylvania State Public School Building Authority Lease Revenue, School District of | | | | |
| Philadelphia Project, Refunding, Series B, AGMC Insured, 4.75%, 6/01/30 | | 6,000,000 | | 6,200,280 |
| Pennsylvania State Turnpike Commission Turnpike Revenue, | | | | |
| AGMC Insured, 6.00%, 12/01/41 | | 10,000,000 | | 10,706,400 |
| Refunding, Series C, Sub Series C-1, Assured Guaranty, 6.25%, 6/01/38 | | 10,000,000 | | 11,119,800 |
| Series A, Assured Guaranty, 5.00%, 6/01/39 | | 10,000,000 | | 10,310,400 |
| Philadelphia Gas Works Revenue, 1998 General Ordinance, Fourth Series, AGMC Insured, | | | | |
| 5.00%, 8/01/32 | | 4,000,000 | | 4,003,440 |
| Philadelphia Water and Wastewater Revenue, Series C, AGMC Insured, 5.00%, 8/01/40 | | 7,000,000 | | 7,307,370 |
| Pittsburgh Water and Sewer Authority Revenue, FGIC Insured, ETM, 7.25%, 9/01/14 | | 25,000 | | 25,871 |
| South Fork Municipal Authority Hospital Revenue, Conemaugh Valley Memorial Hospital, | | | | |
| Refunding, Series B, Assured Guaranty, 5.375%, 7/01/35 | | 15,000,000 | | 15,705,900 |
| | | | | 144,896,972 |
| Rhode Island 1.6% | | | | |
| Rhode Island State Clean Water Finance Agency Revenue, Cranston Wastewater Treatment | | | | |
| System, NATL Insured, 5.80%, 9/01/22 | | 7,785,000 | | 7,790,294 |
| Rhode Island State EDC Special Facility Revenue, first lien, Rhode Island Airport Corp. | | | | |
| Project, CIFG Insured, 5.00%, 7/01/31 | | 5,720,000 | | 5,803,455 |
| Rhode Island State Health and Educational Building Corp. Higher Education Facility Revenue, | | | | |
| Board of Governors for Higher Education, University of Rhode Island, Auxiliary Enterprise | | | | |
| Issue, Series B, AGMC Insured, 5.00%, | | | | |
| 9/15/30 | | 7,535,000 | | 8,066,820 |
| 9/15/35 | | 4,500,000 | | 4,735,125 |
| 9/15/40 | | 10,270,000 | | 10,693,021 |
| Rhode Island State Health and Educational Building Corp. Revenue, Hospital Financing, | | | | |
| Lifespan Obligated Group Issue, Refunding, NATL Insured, 5.75%, 5/15/23 | | 100,000 | | 100,098 |
| | | | | 37,188,813 |
Annual Report | 153
| | | | |
| Franklin Tax-Free Trust | | | | |
| |
| Statement of Investments, February 28, 2014 (continued) | | | | |
| |
| |
| Franklin Insured Tax-Free Income Fund | | Principal Amount | | Value |
| Municipal Bonds (continued) | | | | |
| South Carolina 2.2% | | | | |
| Piedmont Municipal Power Agency Electric Revenue, Refunding, NATL RE, FGIC Insured, | | | | |
| 6.25%, 1/01/21 | $ | 200,000 | $ | 246,624 |
| Richland County Hospital Facilities Revenue, Community Provider, Pooled Loan Program, | | | | |
| Series A, AGMC Insured, ETM, 7.125%, 7/01/17 | | 1,025,000 | | 1,142,988 |
| SCAGO Educational Facilities Corp. for Pickens School District Revenue, Installment | | | | |
| Purchase, School District of Pickens County Project, AGMC Insured, 5.00%, 12/01/31 | | 17,800,000 | | 18,391,850 |
| South Carolina Jobs EDA Hospital Revenue, Palmetto Health, Refunding, Series A, | | | | |
| AGMC Insured, 5.00%, 8/01/35 | | 20,000,000 | | 20,274,600 |
| Spartanburg Water System Revenue, Assured Guaranty, 5.00%, 6/01/39 | | 6,000,000 | | 6,234,660 |
| Woodruff Roebuck Water District Water System Revenue, Improvement, Refunding, | | | | |
| AGMC Insured, 5.00%, 6/01/40 | | 3,000,000 | | 3,138,720 |
| | | | | 49,429,442 |
| South Dakota 0.2% | | | | |
| Brookings COP, Refunding, AMBAC Insured, 5.10%, 12/01/18 | | 3,375,000 | | 3,377,666 |
| South Dakota Lease Revenue, Series A, AGMC Insured, 6.75%, 12/15/16 | | 880,000 | | 939,083 |
| | | | | 4,316,749 |
| Tennessee 0.4% | | | | |
| Johnson City Health and Educational Facilities Board Hospital Revenue, Johnson City Medical | | | | |
| Center Hospital, Improvement, | | | | |
| NATL Insured, ETM, 5.25%, 7/01/28 | | 8,500,000 | | 8,504,760 |
| Series C, NATL Insured, Pre-Refunded, 5.125%, 7/01/25 | | 390,000 | | 390,776 |
| | | | | 8,895,536 |
| Texas 5.9% | | | | |
| Coastal Bend Health Facilities Development Corp. Revenue, Series B, AMBAC Insured, ETM, | | | | |
| 6.30%, 1/01/17 | | 3,820,000 | | 4,079,989 |
| Harris County Hospital District Revenue, senior lien, Refunding, Series A, NATL Insured, | | | | |
| 5.25%, 2/15/37 | | 10,250,000 | | 10,436,858 |
| Harris County Houston Sports Authority Revenue, senior lien, Series G, NATL Insured, 5.25%, | | | | |
| 11/15/30 | | 21,325,000 | | 21,327,772 |
| North Fort Bend Water Authority Water System Revenue, Assured Guaranty, 5.25%, | | | | |
| 12/15/34 | | 20,000,000 | | 21,437,000 |
| Palestine ISD, GO, Anderson County, School Building, Assured Guaranty, 5.50%, 2/15/39 | | 12,530,000 | | 14,051,017 |
| Port Neches-Groves ISD, GO, Jefferson County, School Building, Assured Guaranty, 5.00%, | | | | |
| 2/15/34 | | 11,375,000 | | 12,032,702 |
| San Antonio Airport System Revenue, Improvement, Passenger Facility Charge, sub. lien, | | | | |
| Refunding and Improvement, AGMC Insured, 5.375%, 7/01/40 | | 5,000,000 | | 5,337,250 |
| San Marcos Electric Utility System Revenue, Hays Caldwell and Guadalupe Counties, | | | | |
| Build America Mutual Assurance, 5.00%, 11/01/33 | | 6,300,000 | | 6,477,912 |
| Tarrant County Health Facilities Development Corp. Health Systems Revenue, Harris Methodist | | | | |
| Health System, NATL Insured, ETM, 6.00%, 9/01/24 | | 3,250,000 | | 3,973,060 |
| Texas State Transportation Commission Turnpike System Revenue, first tier, Refunding, | | | | |
| Series A, | | | | |
| AGMC Insured, 5.00%, 8/15/41 | | 23,500,000 | | 24,051,780 |
| Build America Mutual Assurance, 5.00%, 8/15/41 | | 9,665,000 | | 9,925,955 |
| | | | | 133,131,295 |
154 | Annual Report
| | | | |
| Franklin Tax-Free Trust | | | | |
| |
| Statement of Investments, February 28, 2014 (continued) | | | | |
| |
| |
| Franklin Insured Tax-Free Income Fund | | Principal Amount | | Value |
| Municipal Bonds (continued) | | | | |
| Utah 0.0%† | | | | |
| Provo Electric System Revenue, Series A, AMBAC Insured, ETM, 10.375%, 9/15/15 | $ | 25,000 | $ | 27,400 |
| Virginia 0.5% | | | | |
| Chesterfield County EDA Revenue, Bon Secours Health System Inc., Series C-2, | | | | |
| Assured Guaranty, 5.00%, 11/01/42 | | 8,000,000 | | 8,278,560 |
| Middle River Regional Jail Authority Jail Facility Revenue, NATL Insured, 5.00%, 5/15/28 | | 3,510,000 | | 3,554,823 |
| | | | | 11,833,383 |
| Washington 1.5% | | | | |
| King County Sewer Revenue, Refunding, Second Series, AGMC Insured, 5.00%, 1/01/36 | | 5,000,000 | | 5,198,300 |
| Snohomish County PUD No. 1 Electric Revenue, Generation System, FGIC Insured, ETM, | | | | |
| 6.65%, 1/01/16 | | 2,375,000 | | 2,497,028 |
| Washington State Health Care Facilities Authority Revenue, | | | | |
| MultiCare Health System, Series B, Assured Guaranty, 6.00%, 8/15/39 | | 1,500,000 | | 1,624,080 |
| Providence Health and Services, Refunding, Series D, AGMC Insured, 5.25%, | | | | |
| 10/01/33 | | 18,000,000 | | 19,292,040 |
| Virginia Mason Medical Center, Series B, NATL Insured, 5.00%, 2/15/27 | | 5,165,000 | | 5,234,882 |
| | | | | 33,846,330 |
| West Virginia 0.6% | | | | |
| Shepherd University Board of Governors Revenue, Residence Facilities Projects, | | | | |
| NATL Insured, 5.00%, 6/01/35 | | 7,445,000 | | 7,612,512 |
| West Virginia State Water Development Authority Water Development Revenue, | | | | |
| Loan Program II, Refunding, Series A-II, NATL RE, FGIC Insured, 5.00%, 11/01/36 | | 5,000,000 | | 5,151,150 |
| | | | | 12,763,662 |
| Wisconsin 1.2% | | | | |
| Superior Limited Obligation Revenue, Midwest Energy Resources, Refunding, Series E, | | | | |
| NATL RE, FGIC Insured, 6.90%, 8/01/21 | | 3,000,000 | | 3,669,000 |
| Wisconsin State General Fund Annual Appropriation Revenue, Series A, 6.00%, 5/01/36 | | 20,000,000 | | 22,529,800 |
| | | | | 26,198,800 |
| U.S. Territories 4.1% | | | | |
| Puerto Rico 3.0% | | | | |
| Puerto Rico Commonwealth Aqueduct and Sewer Authority Revenue, senior lien, Series A, | | | | |
| Assured Guaranty, 5.125%, 7/01/47 | | 10,000,000 | | 8,516,400 |
| Puerto Rico Commonwealth Highways and Transportation Authority Highway Revenue, | | | | |
| Refunding, Series CC, AGMC Insured, 5.25%, | | | | |
| 7/01/32 | | 5,000,000 | | 4,498,850 |
| 7/01/36 | | 8,870,000 | | 7,828,307 |
| Puerto Rico Sales Tax FICO Sales Tax Revenue, | | | | |
| First Subordinate, Series A, Assured Guaranty, 5.00%, 8/01/40 | | 10,000,000 | | 8,530,300 |
| First Subordinate, Series C, AGMC Insured, 5.125%, 8/01/42 | | 20,000,000 | | 17,262,000 |
| Refunding, Senior Series C, 5.00%, 8/01/46 | | 20,890,000 | | 16,721,192 |
| Senior Series C, 5.25%, 8/01/40 | | 7,000,000 | | 5,878,670 |
| | | | | 69,235,719 |
Annual Report | 155
Franklin Tax-Free Trust
Statement of Investments, February 28, 2014 (continued)
| | | | |
| Franklin Insured Tax-Free Income Fund | | Principal Amount | | Value |
| Municipal Bonds (continued) | | | | |
| U.S. Territories (continued) | | | | |
| U.S. Virgin Islands 1.1% | | | | |
| Virgin Islands PFAR, Matching Fund Loan Notes, senior lien, AGMC Insured, 5.00%, | | | | |
| 10/01/29 | $ | 23,000,000 | $ | 24,194,850 |
| | | | | 93,430,569 |
| Total Municipal Bonds (Cost $2,154,457,118) 98.4% | | | | 2,223,837,969 |
| Other Assets, less Liabilities 1.6% | | | | 37,195,135 |
| Net Assets 100.0% | | | $ | 2,261,033,104 |
| |
| |
| See Abbreviations on page 200. | | | | |
| |
| †Rounds to less than 0.1% of net assets. | | | | |
156 | The accompanying notes are an integral part of these financial statements. | Annual Report
| | | | | | | | | | | | | | | | |
| Franklin Tax-Free Trust | | | | | | | | | | | | | | | |
| Financial Highlights | | | | | | | | | | | | | | | | |
| |
| Franklin Massachusetts Tax-Free Income Fund | | | | | | | | | | | | | | | |
| | | | | | | Year Ended February 28, | | | | |
| Class A | | | 2014 | | | 2013 | | | 2012 | a | | 2011 | | | 2010 | |
| Per share operating performance | | | | | | | | | | | | | | | | |
| (for a share outstanding throughout the year) | | | | | | | | | | | | | | | | |
| Net asset value, beginning of year | | $ | 12.16 | | $ | 12.02 | | $ | 11.11 | | $ | 11.60 | | $ | 10.94 | |
| Income from investment operationsb: | | | | | | | | | | | | | | | | |
| Net investment incomec | | | 0.42 | | | 0.42 | | | 0.47 | | | 0.47 | | | 0.49 | |
| Net realized and unrealized gains (losses) | | | (0.76 | ) | | 0.14 | | | 0.91 | | | (0.46 | ) | | 0.66 | |
| Total from investment operations | | | (0.34 | ) | | 0.56 | | | 1.38 | | | 0.01 | | | 1.15 | |
| Less distributions from: | | | | | | | | | | | | | | | | |
| Net investment income | | | (0.40 | ) | | (0.42 | ) | | (0.47 | ) | | (0.48 | ) | | (0.49 | ) |
| Net realized gains | | | — | | | — | | | (—)d | | | (0.02 | ) | | — | |
| Total distributions | | | (0.40 | ) | | (0.42 | ) | | (0.47 | ) | | (0.50 | ) | | (0.49 | ) |
| Net asset value, end of year | | $ | 11.42 | | $ | 12.16 | | $ | 12.02 | | $ | 11.11 | | $ | 11.60 | |
| |
| Total returne | | | (2.75 | )% | | 4.75 | % | | 12.65 | % | | 0.01 | % | | 10.66 | % |
| |
| Ratios to average net assets | | | | | | | | | | | | | | | | |
| Expenses | | | 0.66 | % | | 0.65 | % | | 0.66 | % | | 0.66 | % | | 0.67 | % |
| Net investment income | | | 3.64 | % | | 3.49 | % | | 4.05 | % | | 4.06 | % | | 4.27 | % |
| |
| Supplemental data | | | | | | | | | | | | | | | | |
| Net assets, end of year (000’s) | | $ | 419,556 | | $ | 525,946 | | $ | 461,749 | | $ | 439,506 | | $ | 494,372 | |
| Portfolio turnover rate | | | 7.12 | % | | 20.05 | % | | 14.50 | % | | 18.65 | % | | 6.61 | % |
aFor the year ended February 29.
bThe amount shown for a share outstanding throughout the period may not correlate with the Statement of Operations for the period due to the timing of sales and repurchases of
the Fund shares in relation to income earned and/or fluctuating market value of the investments of the Fund.
cBased on average daily shares outstanding.
dAmount rounds to less than $0.01 per share.
eTotal return does not reflect sales commissions or contingent deferred sales charges, if applicable.
Annual Report | The accompanying notes are an integral part of these financial statements. | 157
| | | | | | | | | | | | | | | | |
| Franklin Tax-Free Trust | | | | | | | | | | | | | | | |
| Financial Highlights (continued) | | | | | | | | | | | | | | | | |
| |
| Franklin Massachusetts Tax-Free Income Fund | | | | | | | | | | | | | | | |
| | | | | | | Year Ended February 28, | | | | |
| Class C | | | 2014 | | | 2013 | | | 2012 | a | | 2011 | | | 2010 | |
| Per share operating performance | | | | | | | | | | | | | | | | |
| (for a share outstanding throughout the year) | | | | | | | | | | | | | | | | |
| Net asset value, beginning of year | | $ | 12.29 | | $ | 12.14 | | $ | 11.22 | | $ | 11.70 | | $ | 11.03 | |
| Income from investment operationsb: | | | | | | | | | | | | | | | | |
| Net investment incomec | | | 0.36 | | | 0.36 | | | 0.41 | | | 0.41 | | | 0.43 | |
| Net realized and unrealized gains (losses) | | | (0.78 | ) | | 0.14 | | | 0.91 | | | (0.46 | ) | | 0.66 | |
| Total from investment operations | | | (0.42 | ) | | 0.50 | | | 1.32 | | | (0.05 | ) | | 1.09 | |
| Less distributions from: | | | | | | | | | | | | | | | | |
| Net investment income | | | (0.34 | ) | | (0.35 | ) | | (0.40 | ) | | (0.41 | ) | | (0.42 | ) |
| Net realized gains | | | — | | | — | | | (—)d | | | (0.02 | ) | | — | |
| Total distributions | | | (0.34 | ) | | (0.35 | ) | | (0.40 | ) | | (0.43 | ) | | (0.42 | ) |
| Net asset value, end of year | | $ | 11.53 | | $ | 12.29 | | $ | 12.14 | | $ | 11.22 | | $ | 11.70 | |
| |
| Total returne | | | (3.41 | )% | | 4.20 | % | | 12.01 | % | | (0.47 | )% | | 10.06 | % |
| |
| Ratios to average net assets | | | | | | | | | | | | | | | | |
| Expenses | | | 1.21 | % | | 1.20 | % | | 1.21 | % | | 1.21 | % | | 1.22 | % |
| Net investment income | | | 3.09 | % | | 2.94 | % | | 3.50 | % | | 3.51 | % | | 3.72 | % |
| |
| Supplemental data | | | | | | | | | | | | | | | | |
| Net assets, end of year (000’s) | | $ | 61,760 | | $ | 90,144 | | $ | 84,078 | | $ | 83,046 | | $ | 83,397 | |
| Portfolio turnover rate | | | 7.12 | % | | 20.05 | % | | 14.50 | % | | 18.65 | % | | 6.61 | % |
aFor the year ended February 29.
bThe amount shown for a share outstanding throughout the period may not correlate with the Statement of Operations for the period due to the timing of sales and repurchases of
the Fund shares in relation to income earned and/or fluctuating market value of the investments of the Fund.
cBased on average daily shares outstanding.
dAmount rounds to less than $0.01 per share.
eTotal return does not reflect sales commissions or contingent deferred sales charges, if applicable.
158 | The accompanying notes are an integral part of these financial statements. | Annual Report
| | | | | | | | | | | | | | | | |
| Franklin Tax-Free Trust | | | | | | | | | | | | | | | |
| Financial Highlights (continued) | | | | | | | | | | | | | | | | |
| |
| Franklin Massachusetts Tax-Free Income Fund | | | | | | | | | | | | | | | |
| | | | | | | Year Ended February 28, | | | | |
| Advisor Class | | | 2014 | | | 2013 | | | 2012 | a | | 2011 | | | 2010 | b |
| Per share operating performance | | | | | | | | | | | | | | | | |
| (for a share outstanding throughout the year) | | | | | | | | | | | | | | | | |
| Net asset value, beginning of year | | $ | 12.16 | | $ | 12.02 | | $ | 11.11 | | $ | 11.60 | | $ | 11.08 | |
| Income from investment operationsc: | | | | | | | | | | | | | | | | |
| Net investment incomed | | | 0.43 | | | 0.44 | | | 0.48 | | | 0.48 | | | 0.33 | |
| Net realized and unrealized gains (losses) | | | (0.77 | ) | | 0.14 | | | 0.91 | | | (0.46 | ) | | 0.52 | |
| Total from investment operations | | | (0.34 | ) | | 0.58 | | | 1.39 | | | 0.02 | | | 0.85 | |
| Less distributions from: | | | | | | | | | | | | | | | | |
| Net investment income | | | (0.41 | ) | | (0.44 | ) | | (0.48 | ) | | (0.49 | ) | | (0.33 | ) |
| Net realized gains | | | — | | | — | | | (—)e | | | (0.02 | ) | | — | |
| Total distributions | | | (0.41 | ) | | (0.44 | ) | | (0.48 | ) | | (0.51 | ) | | (0.33 | ) |
| Net asset value, end of year | | $ | 11.41 | | $ | 12.16 | | $ | 12.02 | | $ | 11.11 | | $ | 11.60 | |
| |
| Total returnf | | | (2.74 | )% | | 4.85 | % | | 12.76 | % | | 0.12 | % | | 7.69 | % |
| |
| Ratios to average net assetsg | | | | | | | | | | | | | | | | |
| Expenses | | | 0.56 | % | | 0.55 | % | | 0.56 | % | | 0.56 | % | | 0.57 | % |
| Net investment income | | | 3.74 | % | | 3.59 | % | | 4.15 | % | | 4.16 | % | | 4.37 | % |
| |
| Supplemental data | | | | | | | | | | | | | | | | |
| Net assets, end of year (000’s) | | $ | 4,574 | | $ | 9,135 | | $ | 7,743 | | $ | 4,007 | | $ | 4,012 | |
| Portfolio turnover rate | | | 7.12 | % | | 20.05 | % | | 14.50 | % | | 18.65 | % | | 6.61 | % |
aFor the year ended February 29.
bFor the period July 1, 2009 (effective date) to February 28, 2010.
cThe amount shown for a share outstanding throughout the period may not correlate with the Statement of Operations for the period due to the timing of sales and repurchases of
the Fund shares in relation to income earned and/or fluctuating market value of the investments of the Fund.
dBased on average daily shares outstanding.
eAmount rounds to less than $0.01 per share.
fTotal return is not annualized for periods less than one year.
gRatios are annualized for periods less than one year.
Annual Report | The accompanying notes are an integral part of these financial statements. | 159
| | | | |
| Franklin Tax-Free Trust | | | | |
| |
| Statement of Investments, February 28, 2014 | | | | |
| |
| |
| Franklin Massachusetts Tax-Free Income Fund | | Principal Amount | | Value |
| Municipal Bonds 98.1% | | | | |
| Massachusetts 95.0% | | | | |
| Auburn GO, AMBAC Insured, 5.125%, 6/01/24 | $ | 1,465,000 | $ | 1,477,643 |
| Dudley-Charlton Regional School District GO, Series B, NATL RE, FGIC Insured, 5.25%, | | | | |
| 5/01/19 | | 3,140,000 | | 3,659,230 |
| Martha’s Vineyard Land Bank Revenue, AMBAC Insured, | | | | |
| 4.875%, 5/01/22 | | 2,000,000 | | 2,005,660 |
| 5.00%, 5/01/34 | | 7,000,000 | | 7,030,310 |
| Massachusetts Bay Transportation Authority Revenue, General Transportation System, Series C, | | | | |
| NATL RE, FGIC Insured, 5.25%, 3/01/15 | | 2,000,000 | | 2,100,540 |
| Massachusetts Bay Transportation Authority Sales Tax Revenue, Senior, Refunding, Series A, | | | | |
| 5.25%, 7/01/30 | | 4,000,000 | | 4,798,080 |
| Massachusetts State College Building Authority Project Revenue, | | | | |
| Refunding, Series B, XLCA Insured, 5.50%, 5/01/39 | | 5,000,000 | | 6,265,350 |
| Series A, Assured Guaranty, 5.00%, 5/01/33 | | 10,000,000 | | 10,594,800 |
| Series B, 5.00%, 5/01/40 | | 4,625,000 | | 4,971,505 |
| Massachusetts State Department of Transportation Metropolitan Highway System Revenue, | | | | |
| Commonwealth Contract Assistance Secured, Series B, 5.00%, 1/01/35 | | 16,165,000 | | 17,160,117 |
| Massachusetts State Development Finance Agency Revenue, | | | | |
| Boston College Issue, Series P, NATL Insured, 4.75%, 7/01/42 | | 11,000,000 | | 11,284,680 |
| Boston University Issue, Series T-1, AMBAC Insured, 5.00%, 10/01/35 | | 3,600,000 | | 3,662,460 |
| Boston University Issue, Series T-1, AMBAC Insured, 5.00%, 10/01/39 | | 18,630,000 | | 18,927,707 |
| Brandeis University Issue, Series N, 5.00%, 10/01/39 | | 5,000,000 | | 5,247,350 |
| The Broad Institute Issue, Series A, 5.375%, 4/01/41 | | 15,000,000 | | 16,002,150 |
| Massachusetts College of Pharmacy and Allied Health Sciences Issue, Series E, | | | | |
| Assured Guaranty, 5.00%, 7/01/31 | | 5,000,000 | | 5,233,050 |
| Massachusetts College of Pharmacy and Allied Health Sciences Issue, Series E, | | | | |
| Assured Guaranty, 5.00%, 7/01/37 | | 5,035,000 | | 5,204,176 |
| Northeastern University, Series A, 5.00%, 3/01/44 | | 5,000,000 | | 5,232,100 |
| Partners Healthcare System Issue, Refunding, Series L, 5.00%, 7/01/41 | | 5,000,000 | | 5,243,200 |
| Sterling and Francine Clark Art Institute Issue, 5.00%, 7/01/41 | | 12,900,000 | | 13,577,250 |
| Western New England College Issue, Refunding, Series A, Assured Guaranty, 5.00%, | | | | |
| 9/01/33 | | 12,200,000 | | 12,299,064 |
| WGBH Educational Foundation Issue, Refunding, Series A, Assured Guaranty, 5.00%, | | | | |
| 1/01/36 | | 15,945,000 | | 16,265,973 |
| Worcester Polytechnic Institute Issue, 4.00%, 9/01/49 | | 4,825,000 | | 4,278,376 |
| Worcester Polytechnic Institute Issue, Refunding, NATL Insured, 5.00%, 9/01/37 | | 12,850,000 | | 13,374,922 |
| Massachusetts State Educational Financing Authority Education Loan Revenue, Issue I, | | | | |
| 6.00%, 1/01/28 | | 8,250,000 | | 8,920,890 |
| Refunding, Series A, 5.50%, 1/01/22 | | 3,000,000 | | 3,316,740 |
| Massachusetts State GO, Consolidated Loan, | | | | |
| Series A, AGMC Insured, Pre-Refunded, 5.00%, 3/01/24 | | 5,000,000 | | 5,239,550 |
| Series C, AMBAC Insured, 5.00%, 8/01/37 | | 10,000,000 | | 10,546,400 |
| Massachusetts State Health and Educational Facilities Authority Revenue, | | | | |
| Cable Housing and Health Services Issue, Series A, NATL Insured, 5.25%, 7/01/23 | | 1,000,000 | | 1,000,580 |
| Cape Cod Healthcare Obligated Group, Assured Guaranty, 6.00%, 11/15/28 | | 3,000,000 | | 3,293,040 |
| Cape Cod Healthcare Obligated Group, Assured Guaranty, 5.125%, 11/15/35 | | 3,150,000 | | 3,233,381 |
| Children’s Hospital Issue, Series M, 5.25%, 12/01/39 | | 7,000,000 | | 7,396,480 |
| Emmanuel College Issue, NATL Insured, 5.00%, 7/01/37 | | 10,000,000 | | 10,084,500 |
| Lesley University Issue, Series A, Assured Guaranty, 5.25%, 7/01/39 | | 9,350,000 | | 9,877,246 |
| Partners Healthcare System Issue, Refunding, Series J1, 5.00%, 7/01/39 | | 4,345,000 | | 4,530,054 |
| |
| 160 | Annual Report | | | | |
| | | | |
| Franklin Tax-Free Trust | | | | |
| |
| Statement of Investments, February 28, 2014 (continued) | | | | |
| |
| |
| Franklin Massachusetts Tax-Free Income Fund | | Principal Amount | | Value |
| Municipal Bonds (continued) | | | | |
| Massachusetts (continued) | | | | |
| Massachusetts State Health and Educational Facilities Authority Revenue, (continued) | | | | |
| Southcoast Health System Obligated Group, Series D, 5.00%, 7/01/39 | $ | 5,500,000 | $ | 5,586,625 |
| Sterling and Francine Clark Art Institute Issue, Series B, 5.00%, 7/01/40 | | 10,000,000 | | 10,576,100 |
| Massachusetts State HFA, MFHR, Section 8 Assisted, Series A, ETM, 7.00%, 4/01/21 | | 430,000 | | 555,994 |
| Massachusetts State HFAR, | | | | |
| Housing, Refunding, Series A, 3.50%, 12/01/31 | | 5,805,000 | | 5,238,606 |
| Housing, Series A, 3.25%, 12/01/27 | | 4,000,000 | | 3,781,720 |
| Housing, Series C, 5.125%, 12/01/39 | | 1,700,000 | | 1,756,508 |
| Housing, Series C, 5.35%, 12/01/49 | | 4,500,000 | | 4,665,780 |
| Housing, Series F, 2.875%, 12/01/27 | | 2,020,000 | | 1,854,037 |
| Housing, Series F, 3.15%, 12/01/32 | | 3,445,000 | | 2,941,307 |
| Housing, Series F, 3.45%, 12/01/37 | | 1,500,000 | | 1,248,570 |
| Series D, 5.05%, 6/01/40 | | 4,440,000 | | 4,567,162 |
| SF Housing, Series 159, 4.05%, 12/01/32 | | 12,000,000 | | 11,813,400 |
| SF, Series 162, 3.15%, 12/01/32 | | 10,905,000 | | 9,161,727 |
| Massachusetts State Port Authority Revenue, Series A, | | | | |
| AGMC Insured, 4.50%, 7/01/32 | | 5,590,000 | | 5,716,054 |
| AGMC Insured, 4.50%, 7/01/37 | | 7,935,000 | | 8,032,204 |
| AMBAC Insured, 5.00%, 7/01/35 | | 10,000,000 | | 10,354,600 |
| Massachusetts State School Building Authority Dedicated Sales Tax Revenue, | | | | |
| Senior, Series B, 5.00%, 10/15/41 | | 10,000,000 | | 10,745,200 |
| Series A, AMBAC Insured, 4.75%, 8/15/32 | | 15,000,000 | | 15,578,400 |
| Massachusetts State Special Obligation Dedicated Tax Revenue, Refunding, NATL RE, | | | | |
| FGIC Insured, 5.50%, | | | | |
| 1/01/25 | | 10,900,000 | | 12,990,293 |
| 1/01/34 | | 16,900,000 | | 19,860,035 |
| Massachusetts State Transportation Fund Revenue, Accelerated Bridge Program, Series A, | | | | |
| 4.00%, 6/01/31 | | 5,555,000 | | 5,738,204 |
| Massachusetts State Water Pollution Abatement Trust Revenue, 2012, | | | | |
| Pool Loan Program Bonds, Series 6, 5.50%, 8/01/30 | | 1,005,000 | | 1,007,874 |
| Pooled Loan Program, Series 7, 5.125%, 2/01/31 | | 1,900,000 | | 1,904,826 |
| Massachusetts State Water Pollution Abatement Trust Water Pollution Abatement Revenue, | | | | |
| MWRA Program, Refunding, Sub Series A, 5.75%, 8/01/29 | | 250,000 | | 250,768 |
| Massachusetts State Water Resources Authority Revenue, | | | | |
| General, Refunding, Series B, AGMC Insured, 5.25%, 8/01/28 | | 5,490,000 | | 6,576,526 |
| Series A, AGMC Insured, 4.50%, 8/01/46 | | 5,325,000 | | 5,401,573 |
| Metropolitan Boston Transit Parking Corp. Systemwide Parking Revenue, senior lien, | | | | |
| 5.00%, 7/01/41 | | 7,500,000 | | 7,898,550 |
| Refunding, 5.25%, 7/01/36 | | 5,585,000 | | 6,053,526 |
| Monson GO, AMBAC Insured, 5.25%, 11/01/23 | | 1,675,000 | | 1,695,854 |
| Springfield GO, State Qualified Municipal Purpose Loan, AGMC Insured, 4.50%, 8/01/26 | | 2,000,000 | | 2,068,720 |
| University of Massachusetts Building Authority Project Revenue, Senior Series 1, | | | | |
| AMBAC Insured, Pre-Refunded, 5.25%, 11/01/29 | | 3,000,000 | | 3,099,810 |
| Worcester GO, | | | | |
| Assured Guaranty, 5.00%, 11/01/37 | | 3,000,000 | | 3,072,210 |
| Municipal Purpose Loan, 3.25%, 11/01/25 | | 3,370,000 | | 3,394,972 |
| Municipal Purpose Loan, 3.50%, 11/01/26 | | 3,000,000 | | 3,034,110 |
| | | | | 461,556,399 |
Annual Report | 161
| | | | |
| Franklin Tax-Free Trust | | | | |
| |
| Statement of Investments, February 28, 2014 (continued) | | | | |
| |
| Franklin Massachusetts Tax-Free Income Fund | | Principal Amount | | Value |
| Municipal Bonds (continued) | | | | |
| U.S. Territories 3.1% | | | | |
| Puerto Rico 3.1% | | | | |
| Puerto Rico Sales Tax FICO Sales Tax Revenue, | | | | |
| Refunding, Senior Series C, zero cpn., 8/01/39 | $ | 24,325,000 | $ | 4,204,576 |
| Senior Series C, 5.25%, 8/01/40 | | 13,000,000 | | 10,917,530 |
| | | | | 15,122,106 |
| Total Municipal Bonds (Cost $468,636,503) 98.1% | | | | 476,678,505 |
| Other Assets, less Liabilities 1.9% | | | | 9,211,913 |
| Net Assets 100.0% | | | $ | 485,890,418 |
| |
| |
| See Abbreviations on page 200. | | | | |
162 | The accompanying notes are an integral part of these financial statements. | Annual Report
| | | | | | | | | | | | | | | | |
| Franklin Tax-Free Trust | | | | | | | | | | | | | |
| Financial Highlights | | | | | | | | | | | | | | | | |
| |
| Franklin New Jersey Tax-Free Income Fund | | | | | | | | | | | | | | | |
| | | | | | | Year Ended February 28, | | | | |
| Class A | | | 2014 | | | 2013 | | | 2012 | a | | 2011 | | | 2010 | |
| Per share operating performance | | | | | | | | | | | | | | | | |
| (for a share outstanding throughout the year) | | | | | | | | | | | | | | | | |
| Net asset value, beginning of year | | $ | 12.62 | | $ | 12.55 | | $ | 11.49 | | $ | 11.99 | | $ | 11.29 | |
| Income from investment operationsb: | | | | | | | | | | | | | | | | |
| Net investment incomec | | | 0.46 | | | 0.47 | | | 0.52 | | | 0.51 | | | 0.52 | |
| Net realized and unrealized gains (losses) | | | (0.87 | ) | | 0.06 | | | 1.06 | | | (0.49 | ) | | 0.69 | |
| Total from investment operations | | | (0.41 | ) | | 0.53 | | | 1.58 | | | 0.02 | | | 1.21 | |
| Less distributions from: | | | | | | | | | | | | | | | | |
| Net investment income | | | (0.45 | ) | | (0.46 | ) | | (0.52 | ) | | (0.52 | ) | | (0.51 | ) |
| Net realized gains | | | — | | | — | | | — | | | (—)d | | | — | |
| Total distributions | | | (0.45 | ) | | (0.46 | ) | | (0.52 | ) | | (0.52 | ) | | (0.51 | ) |
| Net asset value, end of year | | $ | 11.76 | | $ | 12.62 | | $ | 12.55 | | $ | 11.49 | | $ | 11.99 | |
| |
| Total returne | | | (3.22 | )% | | 4.31 | % | | 14.09 | % | | 0.11 | % | | 10.87 | % |
| |
| Ratios to average net assets | | | | | | | | | | | | | | | | |
| Expenses | | | 0.63 | % | | 0.63 | % | | 0.63 | % | | 0.63 | % | | 0.63 | % |
| Net investment income | | | 3.88 | % | | 3.69 | % | | 4.30 | % | | 4.26 | % | | 4.42 | % |
| |
| Supplemental data | | | | | | | | | | | | | | | | |
| Net assets, end of year (000’s) | | $ | 974,154 | | $ | 1,281,242 | | $ | 1,201,084 | | $ | 1,128,665 | | $ | 1,230,689 | |
| Portfolio turnover rate | | | 9.73 | % | | 13.02 | % | | 8.01 | % | | 12.97 | % | | 9.93 | % |
aFor the year ended February 29.
bThe amount shown for a share outstanding throughout the period may not correlate with the Statement of Operations for the period due to the timing of sales and repurchases of
the Fund shares in relation to income earned and/or fluctuating market value of the investments of the Fund.
cBased on average daily shares outstanding.
dAmount rounds to less than $0.01 per share.
eTotal return does not reflect sales commissions or contingent deferred sales charges, if applicable.
Annual Report | The accompanying notes are an integral part of these financial statements. | 163
| | | | | | | | | | | | | | | | |
| Franklin Tax-Free Trust | | | | | | | | | | | | | |
| Financial Highlights (continued) | | | | | | | | | | | | | | | | |
| |
| Franklin New Jersey Tax-Free Income Fund | | | | | | | | | | | | | | | |
| | | | | | | Year Ended February 28, | | | | |
| Class C | | | 2014 | | | 2013 | | | 2012 | a | | 2011 | | | 2010 | |
| Per share operating performance | | | | | | | | | | | | | | | | |
| (for a share outstanding throughout the year) | | | | | | | | | | | | | | | | |
| Net asset value, beginning of year | | $ | 12.76 | | $ | 12.68 | | $ | 11.60 | | $ | 12.11 | | $ | 11.39 | |
| Income from investment operationsb: | | | | | | | | | | | | | | | | |
| Net investment incomec | | | 0.40 | | | 0.40 | | | 0.45 | | | 0.45 | | | 0.46 | |
| Net realized and unrealized gains (losses) | | | (0.89 | ) | | 0.07 | | | 1.09 | | | (0.51 | ) | | 0.70 | |
| Total from investment operations | | | (0.49 | ) | | 0.47 | | | 1.54 | | | (0.06 | ) | | 1.16 | |
| Less distributions from: | | | | | | | | | | | | | | | | |
| Net investment income | | | (0.38 | ) | | (0.39 | ) | | (0.46 | ) | | (0.45 | ) | | (0.44 | ) |
| Net realized gains | | | — | | | — | | | — | | | (—)d | | | — | |
| Total distributions | | | (0.38 | ) | | (0.39 | ) | | (0.46 | ) | | (0.45 | ) | | (0.44 | ) |
| Net asset value, end of year | | $ | 11.89 | | $ | 12.76 | | $ | 12.68 | | $ | 11.60 | | $ | 12.11 | |
| |
| Total returne | | | (3.80 | )% | | 3.77 | % | | 13.52 | % | | (0.53 | )% | | 10.35 | % |
| |
| Ratios to average net assets | | | | | | | | | | | | | | | | |
| Expenses | | | 1.18 | % | | 1.18 | % | | 1.18 | % | | 1.18 | % | | 1.18 | % |
| Net investment income | | | 3.33 | % | | 3.14 | % | | 3.75 | % | | 3.71 | % | | 3.87 | % |
| |
| Supplemental data | | | | | | | | | | | | | | | | |
| Net assets, end of year (000’s) | | $ | 247,538 | | $ | 331,573 | | $ | 296,302 | | $ | 276,916 | | $ | 292,947 | |
| Portfolio turnover rate | | | 9.73 | % | | 13.02 | % | | 8.01 | % | | 12.97 | % | | 9.93 | % |
aFor the year ended February 29.
bThe amount shown for a share outstanding throughout the period may not correlate with the Statement of Operations for the period due to the timing of sales and repurchases of
the Fund shares in relation to income earned and/or fluctuating market value of the investments of the Fund.
cBased on average daily shares outstanding.
dAmount rounds to less than $0.01 per share.
eTotal return does not reflect sales commissions or contingent deferred sales charges, if applicable.
164 | The accompanying notes are an integral part of these financial statements. | Annual Report
| | | | | | | | | | | | | | | |
| Franklin Tax-Free Trust | | | | | | | | | | | | | | | |
| Financial Highlights (continued) | | | | | | | | | | | | | | | |
| |
| Franklin New Jersey Tax-Free Income Fund | | | | | | | | | | | | | | | |
| | | | | | Year Ended February 28, | | | | |
| Advisor Class | | 2014 | | | 2013 | | | 2012 | a | | 2011 | | | 2010 | |
| Per share operating performance | | | | | | | | | | | | | | | |
| (for a share outstanding throughout the year) | | | | | | | | | | | | | | | |
| Net asset value, beginning of year | $ | 12.63 | | $ | 12.55 | | $ | 11.49 | | $ | 11.99 | | $ | 11.29 | |
| Income from investment operationsb: | | | | | | | | | | | | | | | |
| Net investment incomec | | 0.47 | | | 0.48 | | | 0.53 | | | 0.52 | | | 0.53 | |
| Net realized and unrealized gains (losses) | | (0.87 | ) | | 0.08 | | | 1.07 | | | (0.49 | ) | | 0.69 | |
| Total from investment operations | | (0.40 | ) | | 0.56 | | | 1.60 | | | 0.03 | | | 1.22 | |
| Less distributions from: | | | | | | | | | | | | | | | |
| Net investment income | | (0.46 | ) | | (0.48 | ) | | (0.54 | ) | | (0.53 | ) | | (0.52 | ) |
| Net realized gains | | — | | | — | | | — | | | (—)d | | | — | |
| Total distributions | | (0.46 | ) | | (0.48 | ) | | (0.54 | ) | | (0.53 | ) | | (0.52 | ) |
| Net asset value, end of year | $ | 11.77 | | $ | 12.63 | | $ | 12.55 | | $ | 11.49 | | $ | 11.99 | |
| |
| Total return | | (3.12 | )% | | 4.50 | % | | 14.20 | % | | 0.21 | % | | 10.98 | % |
| |
| Ratios to average net assets | | | | | | | | | | | | | | | |
| Expenses | | 0.53 | % | | 0.53 | % | | 0.53 | % | | 0.53 | % | | 0.53 | % |
| Net investment income | | 3.98 | % | | 3.79 | % | | 4.40 | % | | 4.36 | % | | 4.52 | % |
| |
| Supplemental data | | | | | | | | | | | | | | | |
| Net assets, end of year (000’s) | $ | 63,162 | | $ | 81,557 | | $ | 63,827 | | $ | 25,378 | | $ | 13,791 | |
| Portfolio turnover rate | | 9.73 | % | | 13.02 | % | | 8.01 | % | | 12.97 | % | | 9.93 | % |
aFor the year ended February 29.
bThe amount shown for a share outstanding throughout the period may not correlate with the Statement of Operations for the period due to the timing of sales and repurchases of
the Fund shares in relation to income earned and/or fluctuating market value of the investments of the Fund.
cBased on average daily shares outstanding.
dAmount rounds to less than $0.01 per share.
Annual Report | The accompanying notes are an integral part of these financial statements. | 165
| | | | |
| Franklin Tax-Free Trust | | | | |
| |
| Statement of Investments, February 28, 2014 | | | | |
| |
| |
| Franklin New Jersey Tax-Free Income Fund | | Principal Amount | | Value |
| Municipal Bonds 97.8% | | | | |
| Delaware 0.5% | | | | |
| Delaware River and Bay Authority Revenue, Series A, 5.00%, 1/01/42 | $ | 6,000,000 | $ | 6,368,640 |
| New Jersey 74.0% | | | | |
| Atlantic County Improvement Authority Luxury Tax Revenue, Convention Center Project, | | | | |
| NATL Insured, ETM, 7.40%, 7/01/16 | | 5,315,000 | | 5,628,213 |
| Bergen County Improvement Authority School District Revenue GO, Wyckoff Township Board | | | | |
| of Education Project, Pre-Refunded, 5.00%, 4/01/32 | | 3,400,000 | | 3,576,596 |
| Bergen County Utilities Authority Water PCR, System, AMBAC Insured, 5.00%, 12/15/31 | | 3,000,000 | | 3,131,100 |
| Bernards Township School District GO, NATL Insured, Pre-Refunded, 5.00%, 7/15/30 | | 10,038,000 | | 10,689,767 |
| Cape May County Industrial PCFA Revenue, Atlantic City Electric Co. Project, Refunding, | | | | |
| Series A, NATL Insured, 6.80%, 3/01/21 | | 5,400,000 | | 6,608,790 |
| Egg Harbor Township School District GO, NATL Insured, Pre-Refunded, 5.00%, 4/01/30 | | 3,027,000 | | 3,180,862 |
| Hudson County Improvement Authority Lease Revenue, County Secured, County Services | | | | |
| Building Project, AGMC Insured, 5.00%, 4/01/32 | | 3,895,000 | | 3,995,102 |
| Hudson County Improvement Authority Parking Revenue, County-Guaranteed, Harrison Parking | | | | |
| Facility Redevelopment Project, Series C, Assured Guaranty, 5.125%, 1/01/34 | | 2,000,000 | | 2,119,280 |
| Middlesex County COP, NATL Insured, zero cpn., 6/15/24 | | 1,000,000 | | 695,820 |
| Middlesex County Improvement Authority Lease Revenue, County Guaranteed, Regional | | | | |
| Educational Services Commission Projects, 5.25%, 12/15/33 | | 3,000,000 | | 3,281,460 |
| Middlesex County Improvement Authority Revenue, Administration Building Residential | | | | |
| Project, FNMA Insured, | | | | |
| 5.25%, 7/01/21 | | 715,000 | | 716,287 |
| 5.35%, 7/01/34 | | 1,575,000 | | 1,576,307 |
| Morristown Parking Authority Revenue, Guaranteed Parking, NATL Insured, 5.00%, | | | | |
| 8/01/30 | | 1,815,000 | | 1,898,073 |
| 8/01/33 | | 2,630,000 | | 2,727,284 |
| Mount Olive Township Board of Education GO, NATL Insured, Pre-Refunded, 5.00%, | | | | |
| 7/15/29 | | 7,875,000 | | 8,012,261 |
| New Jersey EDA Revenue, | | | | |
| Cigarette Tax, Pre-Refunded, 5.75%, 6/15/34 | | 5,000,000 | | 5,078,150 |
| Cigarette Tax, Refunding, 5.00%, 6/15/24 | | 7,000,000 | | 7,653,800 |
| Cigarette Tax, Refunding, 5.00%, 6/15/28 | | 3,000,000 | | 3,149,040 |
| Cigarette Tax, Refunding, 5.00%, 6/15/29 | | 1,000,000 | | 1,043,300 |
| Cigarette Tax, Refunding, Assured Guaranty, 5.00%, 6/15/22 | | 10,000,000 | | 11,387,400 |
| Montclair State University Student Housing Project, Provident Group, Montclair Properties | | | | |
| LLC, Series A, 5.875%, 6/01/42 | | 17,950,000 | | 18,781,264 |
| Motor Vehicle Surcharges, Series A, NATL Insured, 5.00%, 7/01/27 | | 5,000,000 | | 5,070,500 |
| Motor Vehicle Surcharges, Series A, NATL Insured, 5.00%, 7/01/29 | | 12,500,000 | | 12,671,750 |
| Motor Vehicle Surcharges, Series A, NATL Insured, 5.00%, 7/01/34 | | 10,000,000 | | 10,130,500 |
| Municipal Rehabilitation, Series A, AMBAC Insured, 5.00%, 4/01/28 | | 15,000,000 | | 15,026,250 |
| School Facilities Construction, Refunding, Series K, NATL RE, FGIC Insured, 5.25%, | | | | |
| 12/15/21 | | 10,000,000 | | 11,901,300 |
| School Facilities Construction, Refunding, Series N-1, NATL RE, FGIC Insured, 5.50%, | | | | |
| 9/01/27 | | 8,660,000 | | 10,252,920 |
| School Facilities Construction, Refunding, Series NN, 5.00%, 3/01/30 | | 5,000,000 | | 5,429,450 |
| School Facilities Construction, Series KK, 5.00%, 3/01/38 | | 5,000,000 | | 5,257,600 |
| School Facilities Construction, Series L, AGMC Insured, Pre-Refunded, 5.00%, | | | | |
| 3/01/30 | | 3,500,000 | | 3,665,900 |
| School Facilities Construction, Series NN, 5.00%, 3/01/28 | | 5,000,000 | | 5,513,300 |
166 | Annual Report
| | | | |
| Franklin Tax-Free Trust | | | | |
| |
| Statement of Investments, February 28, 2014 (continued) | | | | |
| |
| |
| Franklin New Jersey Tax-Free Income Fund | | Principal Amount | | Value |
| Municipal Bonds (continued) | | | | |
| New Jersey (continued) | | | | |
| New Jersey EDA Revenue, (continued) | | | | |
| School Facilities Construction, Series O, Pre-Refunded, 5.125%, 3/01/28 | $ | 5,000,000 | $ | 5,243,150 |
| School Facilities Construction, Series U, 5.00%, 9/01/37 | | 5,000,000 | | 5,109,000 |
| School Facilities Construction, Series U, AMBAC Insured, 5.00%, 9/01/37 | | 5,000,000 | | 5,109,000 |
| School Facilities Construction, Series Y, 5.00%, 9/01/33 | | 6,000,000 | | 6,204,420 |
| School Facilities Construction, Series Z, Assured Guaranty, 5.50%, 12/15/34 | | 3,000,000 | | 3,276,870 |
| New Jersey EDA State Lease Revenue, Liberty State Park Lease Rental, Refunding, | | | | |
| AMBAC Insured, 5.75%, 3/15/20 | | 4,605,000 | | 4,621,440 |
| New Jersey EDA Water Facilities Revenue, New Jersey-American Water Co. Inc. Project, | | | | |
| Refunding, | | | | |
| Series A, 5.70%, 10/01/39 | | 10,000,000 | | 10,722,600 |
| Series B, 5.00%, 10/01/39 | | 8,750,000 | | 9,156,263 |
| New Jersey EDA, GO Lease Revenue, Rutgers University, | | | | |
| 5.00%, 6/15/46 | | 7,500,000 | | 8,052,075 |
| College Avenue Redevelopment Project, 5.00%, 6/15/38 | | 5,000,000 | | 5,440,700 |
| New Jersey Environmental Infrastructure Trust Revenue, Refunding, Series A-R, 4.00%, | | | | |
| 9/01/25 | | 15,745,000 | | 17,541,032 |
| New Jersey Health Care Facilities Financing Authority Revenue, | | | | |
| Atlantic Health System Hospital Corp. Issue, 6.00%, 7/01/41 | | 10,600,000 | | 12,005,348 |
| Atlantic Health System Hospital Corp. Issue, Series A, 5.00%, 7/01/27 | | 8,000,000 | | 8,427,840 |
| AtlantiCare Regional Medical Center Issue, Refunding, 5.00%, 7/01/25 | | 4,605,000 | | 4,907,502 |
| AtlantiCare Regional Medical Center Issue, Refunding, 5.00%, 7/01/37 | | 19,490,000 | | 19,780,401 |
| Barnabas Health Issue, Refunding, Series A, 5.625%, 7/01/32 | | 5,500,000 | | 5,864,320 |
| Hackensack University Medical Center, Refunding, Assured Guaranty, 5.25%, 1/01/31 | | 5,000,000 | | 5,295,550 |
| Hackensack University Medical Center, Refunding, Assured Guaranty, 5.25%, 1/01/36 | | 5,000,000 | | 5,201,200 |
| Holy Name Hospital Issue, 5.00%, 7/01/36 | | 5,000,000 | | 4,966,400 |
| Hunterdon Medical Center Issue, Series A, 5.125%, 7/01/35 | | 2,000,000 | | 2,034,200 |
| Meridian Health System Obligated Group Issue, Refunding, 5.00%, 7/01/27 | | 2,500,000 | | 2,734,600 |
| Meridian Health System Obligated Group Issue, Tranche I, Assured Guaranty, 5.00%, | | | | |
| 7/01/38 | | 9,775,000 | | 10,072,844 |
| Meridian Health System Obligated Group Issue, Tranche II, Assured Guaranty, 5.00%, | | | | |
| 7/01/38 | | 13,670,000 | | 14,086,525 |
| Robert Wood Johnson University Hospital Issue, Series A, 5.50%, 7/01/43 | | 4,000,000 | | 4,288,960 |
| Somerset Medical Center Issue, 5.75%, 7/01/28 | | 11,000,000 | | 11,004,180 |
| South Jersey Hospital Issue, 5.00%, 7/01/36 | | 12,000,000 | | 12,093,240 |
| South Jersey Hospital Issue, 5.00%, 7/01/46 | | 27,200,000 | | 27,363,744 |
| St. Barnabas Health Care System Issue, Series A, 5.00%, 7/01/29 | | 7,000,000 | | 7,109,900 |
| St. Luke’s Warren Hospital Obligated Group Issue, Refunding, 5.00%, 8/15/31 | | 2,935,000 | | 3,121,138 |
| St. Luke’s Warren Hospital Obligated Group Issue, Refunding, 5.00%, 8/15/34 | | 1,500,000 | | 1,568,895 |
| St. Peter’s University Hospital Obligated Group Issue, Refunding, 6.00%, 7/01/26 | | 1,000,000 | | 1,068,820 |
| St. Peter’s University Hospital Obligated Group Issue, Refunding, 6.25%, 7/01/35 | | 3,400,000 | | 3,530,934 |
| Virtua Health Issue, Series A, Assured Guaranty, 5.50%, 7/01/38 | | 10,000,000 | | 10,535,600 |
| New Jersey Health Care Facilities Financing Authority State Contract Revenue, Hospital Asset | | | | |
| Transformation Program, Series A, | | | | |
| 5.75%, 10/01/31 | | 10,000,000 | | 11,248,300 |
| 5.25%, 10/01/38 | | 15,000,000 | | 15,846,450 |
| New Jersey Institute of Technology GO, Series A, 5.00%, 7/01/42 | | 7,000,000 | | 7,364,350 |
| New Jersey State COP, Equipment Lease Purchase, Series A, 5.25%, 6/15/29 | | 1,000,000 | | 1,079,610 |
Annual Report | 167
| | | | |
| Franklin Tax-Free Trust | | | | |
| |
| Statement of Investments, February 28, 2014 (continued) | | | | |
| |
| |
| Franklin New Jersey Tax-Free Income Fund | | Principal Amount | | Value |
| Municipal Bonds (continued) | | | | |
| New Jersey (continued) | | | | |
| New Jersey State Educational Facilities Authority Revenue, | | | | |
| The College of New Jersey Issue, Refunding, Series D, AGMC Insured, 5.00%, 7/01/28 | $ | 5,940,000 | $ | 6,383,065 |
| The College of New Jersey Issue, Refunding, Series D, AGMC Insured, 5.00%, 7/01/35 | | 11,000,000 | | 11,418,770 |
| Georgian Court University, Refunding, Series D, 5.00%, 7/01/27 | | 1,325,000 | | 1,356,641 |
| Georgian Court University, Refunding, Series D, 5.00%, 7/01/33 | | 1,000,000 | | 1,003,870 |
| Kean University Issue, Refunding, Series A, 5.50%, 9/01/36 | | 8,500,000 | | 9,186,630 |
| Kean University Issue, Series B, NATL Insured, Pre-Refunded, 5.00%, 7/01/30 | | 5,240,000 | | 5,805,606 |
| Kean University Issue, Series D, AGMC Insured, 5.00%, 7/01/39 | | 1,000,000 | | 1,028,880 |
| Kean University Issue, Series D, NATL RE, FGIC Insured, 5.00%, 7/01/39 | | 4,695,000 | | 4,815,943 |
| Montclair State University Issue, Refunding, Series A, AMBAC Insured, 5.00%, | | | | |
| 7/01/31 | | 10,000,000 | | 10,514,000 |
| Montclair State University Issue, Refunding, Series A, AMBAC Insured, 5.00%, | | | | |
| 7/01/36 | | 20,000,000 | | 20,894,600 |
| Montclair State University Issue, Series J, 5.25%, 7/01/38 | | 2,000,000 | | 2,131,720 |
| Princeton University, Refunding, Series A, 5.00%, 7/01/30 | | 5,000,000 | | 5,208,700 |
| Princeton University, Refunding, Series E, 5.00%, 7/01/33 | | 5,000,000 | | 5,452,550 |
| Princeton University, Series B, 5.00%, 7/01/39 | | 15,000,000 | | 16,320,300 |
| Princeton University, Series B, 4.375%, 7/01/41 | | 15,000,000 | | 15,473,400 |
| Princeton University, Series D, Pre-Refunded, 5.00%, 7/01/29 | | 1,000,000 | | 1,015,710 |
| Ramapo College of New Jersey Issue, Series B, 5.00%, 7/01/37 | | 1,000,000 | | 1,059,240 |
| Ramapo College of New Jersey Issue, Series B, 5.00%, 7/01/42 | | 1,000,000 | | 1,047,050 |
| Ramapo College of New Jersey Issue, Series D, NATL Insured, Pre-Refunded, 5.00%, | | | | |
| 7/01/36 | | 6,745,000 | | 7,464,759 |
| The Richard Stockton College of New Jersey Issue, Refunding, Series A, 5.375%, | | | | |
| 7/01/38 | | 5,000,000 | | 5,354,100 |
| The Richard Stockton College of New Jersey Issue, Refunding, Series F, AMBAC Insured, | | | | |
| 5.00%, 7/01/28 | | 2,370,000 | | 2,420,363 |
| Rowan University Issue, Refunding, Series D, AMBAC Insured, 5.00%, 7/01/24 | | 1,755,000 | | 1,820,040 |
| Seton Hall University Issue, Refunding, Series E, 6.25%, 7/01/37 | | 5,000,000 | | 5,703,800 |
| Stevens Institute of Technology Issue, Refunding, Series A, 5.00%, 7/01/34 | | 4,750,000 | | 4,768,383 |
| Stevens Institute of Technology Issue, Refunding, Series I, 5.00%, 7/01/18 | | 500,000 | | 500,840 |
| Stevens Institute of Technology Issue, Refunding, Series I, 5.00%, 7/01/28 | | 865,000 | | 865,554 |
| Stevens Institute of Technology Issue, Series I, ETM, 5.00%, 7/01/18 | | 435,000 | | 455,258 |
| Stevens Institute of Technology Issue, Series I, ETM, 5.00%, 7/01/28 | | 710,000 | | 774,922 |
| The William Paterson University of New Jersey Issue, Series C, Assured Guaranty, 5.00%, | | | | |
| 7/01/38 | | 5,500,000 | | 5,785,120 |
| New Jersey State Higher Education Assistance Authority Student Loan Revenue, | | | | |
| Refunding, Series 1, 5.875%, 12/01/33 | | 2,140,000 | | 2,246,165 |
| Refunding, Series 1A, 5.00%, 12/01/25 | | 3,565,000 | | 3,749,168 |
| Refunding, Series 1A, 5.00%, 12/01/26 | | 1,715,000 | | 1,791,952 |
| Refunding, Series 1A, 5.125%, 12/01/27 | | 4,250,000 | | 4,438,870 |
| Refunding, Series 1A, 5.25%, 12/01/28 | | 4,255,000 | | 4,446,688 |
| Series 2, 5.00%, 12/01/26 | | 3,145,000 | | 3,274,291 |
| Series 2, 5.00%, 12/01/27 | | 2,295,000 | | 2,378,469 |
| Series 2, 5.00%, 12/01/28 | | 2,295,000 | | 2,378,469 |
| Series 2, 5.00%, 12/01/30 | | 1,500,000 | | 1,554,555 |
| Series 2, 5.00%, 12/01/36 | | 1,000,000 | | 1,049,280 |
| Series A, 5.625%, 6/01/30 | | 14,500,000 | | 15,322,005 |
| Series A, Assured Guaranty, 6.125%, 6/01/30 | | 10,000,000 | | 10,592,300 |
| |
| 168 | Annual Report | | | | |
| | | | | |
| Franklin Tax-Free Trust | | | | | |
| |
| Statement of Investments, February 28, 2014 (continued) | | | | | |
| |
| |
| Franklin New Jersey Tax-Free Income Fund | | | Principal Amount | | Value |
| Municipal Bonds (continued) | | | | | |
| New Jersey (continued) | | | | | |
| New Jersey State Housing and Mortgage Finance Agency MFHR, Series I, 5.75%, | | | | | |
| 11/01/38 | | $ | 2,490,000 | $ | 2,568,136 |
| New Jersey State Housing and Mortgage Finance Agency SFHR, Series AA, 6.50%, | | | | | |
| 10/01/38 | | | 3,015,000 | | 3,174,373 |
| New Jersey State Transportation Trust Fund Authority Revenue, | | | | | |
| Capital Appreciation, Transportation System, Series A, zero cpn., 12/15/29 | | | 5,000,000 | | 2,417,250 |
| Capital Appreciation, Transportation System, Series A, zero cpn., 12/15/32 | | | 10,000,000 | | 3,905,600 |
| Capital Appreciation, Transportation System, Series C, AGMC Insured, zero cpn., | | | | | |
| 12/15/33 | | | 10,000,000 | | 3,581,300 |
| Transportation Program, Series AA, 5.25%, 6/15/31 | | | 11,500,000 | | 12,623,090 |
| Transportation System, Series A, 6.00%, 12/15/38 | | | 16,110,000 | | 17,874,367 |
| Transportation System, Series A, 5.50%, 6/15/41 | | | 5,000,000 | | 5,446,150 |
| Transportation System, Series A, AGMC Insured, 5.00%, 12/15/34 | | | 15,000,000 | | 15,419,550 |
| Transportation System, Series A, AMBAC Insured, 5.00%, 12/15/34 | | | 10,000,000 | | 10,283,200 |
| Transportation System, Series A, Pre-Refunded, 6.00%, 12/15/38 | | | 8,890,000 | | 10,996,041 |
| Transportation System, Series B, 5.00%, 6/15/42 | | | 7,000,000 | | 7,298,550 |
| New Jersey State Turnpike Authority Turnpike Revenue, | | | | | |
| Growth and Income Securities, Series B, AMBAC Insured, zero cpn. to 1/01/15, | | | | | |
| 5.15% thereafter, 1/01/35 | | | 7,500,000 | | 7,335,225 |
| Refunding, Series I, 5.00%, 1/01/35 | | | 5,000,000 | | 5,281,050 |
| Series A, 5.00%, 1/01/35 | | | 4,000,000 | | 4,252,360 |
| Series E, 5.25%, 1/01/40 | | | 30,000,000 | | 32,089,500 |
| Series H, 5.00%, 1/01/36 | | | 14,000,000 | | 14,638,960 |
| North Hudson Sewerage Authority Gross Revenue, Lease Certificates, Refunding, Series A, | | | | | |
| 5.00%, 6/01/42 | | | 17,800,000 | | 18,480,316 |
| Passaic County Improvement Authority Parking Facilities Revenue, 200 Hospital Plaza Corp. | | | | | |
| Project, 5.00%, 5/01/42 | | | 3,200,000 | | 3,335,648 |
| Rutgers State University GO, | | | | | |
| Series F, 5.00%, 5/01/39 | | | 20,000,000 | | 21,432,200 |
| Series L, 5.00%, 5/01/43 | | | 15,500,000 | | 16,690,090 |
| Salem County PCFA, PCR, Atlantic City Electric Co. Project, Refunding, Series A, 4.875%, | | | | | |
| 6/01/29 | | | 5,000,000 | | 5,300,200 |
| South Jersey Transportation Authority Transportation System Revenue, Refunding, Series A, | | | | | |
| 5.00%, | | | | | |
| 11/01/27 | | | 3,000,000 | | 3,238,020 |
| 11/01/28 | | | 2,000,000 | | 2,135,960 |
| 11/01/29 | | | 2,000,000 | | 2,119,460 |
| Sussex County Municipal Utilities Authority Wastewater Facilities Revenue, Capital | | | | | |
| Appreciation, Series B, AGMC Insured, zero cpn., | | | | | |
| 12/01/35 | | | 2,815,000 | | 917,549 |
| 12/01/36 | | | 2,810,000 | | 858,062 |
| 12/01/37 | | | 2,815,000 | | 810,185 |
| 12/01/38 | | | 2,810,000 | | 759,599 |
| University of Medicine and Dentistry COP, NATL Insured, Pre-Refunded, 5.00%, 6/15/36 | | | 12,500,000 | | 12,665,750 |
| Upper Freehold Regional School District GO, NATL Insured, Pre-Refunded, 5.00%, | | | | | |
| 2/15/35 | | | 8,730,000 | | 9,871,273 |
| | | | | | 949,978,067 |
Annual Report | 169
| | | | |
| Franklin Tax-Free Trust | | | | |
| |
| Statement of Investments, February 28, 2014 (continued) | | | | |
| |
| |
| Franklin New Jersey Tax-Free Income Fund | | Principal Amount | | Value |
| Municipal Bonds (continued) | | | | |
| New York 8.7% | | | | |
| Port Authority of New York and New Jersey Revenue, Consolidated, | | | | |
| One Hundred Fifty-Third Series, Refunding, 5.00%, 7/15/38 | $ | 8,850,000 | $ | 9,385,867 |
| One Hundred Forty-Eighth Series, AGMC Insured, 5.00%, 8/15/34 | | 10,000,000 | | 10,782,300 |
| One Hundred Forty-Eighth Series, AGMC Insured, 5.00%, 8/15/37 | | 5,000,000 | | 5,308,000 |
| One Hundred Forty-Fourth Series, 5.00%, 10/01/29 | | 5,000,000 | | 5,339,100 |
| One Hundred Forty-Ninth Series, 5.00%, 11/15/31 | | 10,000,000 | | 10,891,400 |
| One Hundred Seventy-First Series, Refunding, 5.00%, 7/15/30 | | 12,200,000 | | 13,518,332 |
| One Hundred Seventy-Ninth Series, 5.00%, 12/01/38 | | 15,000,000 | | 16,338,150 |
| One Hundred Sixtieth Series, Refunding, 5.00%, 9/15/36 | | 15,000,000 | | 16,114,050 |
| One Hundred Sixty-First Series, 5.00%, 10/15/33 | | 10,000,000 | | 10,939,000 |
| One Hundred Sixty-Sixth Series, Refunding, 5.25%, 7/15/36 | | 5,000,000 | | 5,526,200 |
| Port Authority of New York and New Jersey Special Project Revenue, JFK International Air | | | | |
| Terminal LLC Project, NATL Insured, 5.75%, 12/01/22 | | 8,000,000 | | 8,061,200 |
| | | | | 112,203,599 |
| Pennsylvania 2.4% | | | | |
| Delaware River Joint Toll Bridge Commission Bridge Revenue, Series A, NATL Insured, | | | | |
| 5.00%, 7/01/35 | | 1,625,000 | | 1,697,621 |
| Pre-Refunded, 5.00%, 7/01/35 | | 3,375,000 | | 3,874,737 |
| Delaware River Port Authority Revenue, | | | | |
| 5.00%, 1/01/37 | | 10,000,000 | | 10,679,400 |
| Series E, 5.00%, 1/01/35 | | 14,000,000 | | 14,861,840 |
| | | | | 31,113,598 |
| U.S. Territories 12.2% | | | | |
| Puerto Rico 11.8% | | | | |
| Puerto Rico Commonwealth Aqueduct and Sewer Authority Revenue, senior lien, Series A, | | | | |
| 6.00%, 7/01/44 | | 4,100,000 | | 3,121,002 |
| Puerto Rico Commonwealth GO, Public Improvement, | | | | |
| Refunding, AGMC Insured, 5.125%, 7/01/30 | | 5,020,000 | | 4,551,383 |
| Refunding, Series A-4, AGMC Insured, 5.00%, 7/01/31 | | 5,000,000 | | 4,431,000 |
| Series B, Pre-Refunded, 5.00%, 7/01/35 | | 3,175,000 | | 3,523,964 |
| Puerto Rico Electric Power Authority Power Revenue, | | | | |
| Series RR, FGIC Insured, Pre-Refunded, 5.00%, 7/01/35 | | 30,000,000 | | 31,904,700 |
| Series TT, 5.00%, 7/01/32 | | 10,000,000 | | 6,531,900 |
| Series TT, 5.00%, 7/01/37 | | 12,925,000 | | 8,318,401 |
| Series WW, 5.50%, 7/01/38 | | 16,620,000 | | 11,298,608 |
| Series XX, 5.25%, 7/01/40 | | 14,500,000 | | 9,649,895 |
| Puerto Rico Industrial Tourist Educational Medical and Environmental Control Facilities | | | | |
| Financing Authority Educational Facilities Revenue, University Plaza Project, Series A, | | | | |
| NATL Insured, 5.00%, 7/01/33 | | 1,000,000 | | 832,340 |
| Puerto Rico Infrastructure Financing Authority Revenue, Ports Authority Project, Series B, | | | | |
| 5.25%, 12/15/26 | | 11,250,000 | | 6,891,638 |
170 | Annual Report
| | | | |
| Franklin Tax-Free Trust | | | | |
| |
| Statement of Investments, February 28, 2014 (continued) | | | | |
| |
| Franklin New Jersey Tax-Free Income Fund | | Principal Amount | | Value |
| Municipal Bonds (continued) | | | | |
| U.S. Territories (continued) | | | | |
| Puerto Rico (continued) | | | | |
| Puerto Rico Sales Tax FICO Sales Tax Revenue, | | | | |
| first subordinate, Series A, 5.75%, 8/01/37 | $ | 10,000,000 | $ | 8,129,200 |
| first subordinate, Series A, 5.50%, 8/01/42 | | 17,000,000 | | 13,353,840 |
| first subordinate, Series A, 6.00%, 8/01/42 | | 32,000,000 | | 26,387,840 |
| first subordinate, Series C, 5.50%, 8/01/40 | | 10,000,000 | | 7,953,600 |
| Senior Series C, 5.25%, 8/01/40 | | 6,290,000 | | 5,282,405 |
| | | | | 152,161,716 |
| U.S. Virgin Islands 0.4% | | | | |
| Virgin Islands PFAR, Gross Receipts Taxes Loan Note, Radian Insured, 5.00%, 10/01/33 | | 5,000,000 | | 4,938,350 |
| | | | | 157,100,066 |
| Total Municipal Bonds (Cost $1,247,331,310) 97.8% | | | | 1,256,763,970 |
| Other Assets, less Liabilities 2.2% | | | | 28,089,476 |
| Net Assets 100.0% | | | $ | 1,284,853,446 |
| |
| |
| See Abbreviations on page 200. | | | | |
Annual Report | The accompanying notes are an integral part of these financial statements. | 171
| | | | | | | | | | | | |
| Franklin Tax-Free Trust | | | | | | | | | | |
| |
| Financial Statements | | | | | | | | | | | | |
| |
| |
| Statements of Assets and Liabilities | | | | | | | | | | | | |
| February 28, 2014 | | | | | | | | | | | | |
| |
| | | Franklin | | | Franklin Federal | | | Franklin Federal | | | Franklin | |
| | | Double | | | Intermediate-Term | | | Limited-Term | | | High Yield | |
| | | Tax-Free | | | Tax-Free | | | Tax-Free | | | Tax-Free | |
| | | Income Fund | | | Income Fund | | | Income Fund | | | Income Fund | |
| Assets: | | | | | | | | | | | | |
| Investments in securities: | | | | | | | | | | | | |
| Cost | $ | 390,744,212 | | $ | 3,545,025,399 | | $ | 1,128,245,368 | | $ | 7,288,734,321 | |
| Value | $ | 324,524,841 | | $ | 3,734,322,837 | | $ | 1,147,829,529 | | $ | 7,625,758,218 | |
| Cash | | 8,799,260 | | | 240,354,431 | | | 4,442,822 | | | 76,051,926 | |
| Receivables: | | | | | | | | | | | | |
| Investment securities sold | | 2,926,012 | | | — | | | — | | | 18,200,496 | |
| Capital shares sold | | 22,672 | | | 13,176,911 | | | 3,139,696 | | | 16,849,355 | |
| Interest | | 4,697,878 | | | 39,138,960 | | | 8,724,949 | | | 97,481,164 | |
| Other assets | | 251 | | | 2,832 | | | 829 | | | 5,475 | |
| Total assets | | 340,970,914 | | | 4,026,995,971 | | | 1,164,137,825 | | | 7,834,346,634 | |
| Liabilities: | | | | | | | | | | | | |
| Payables: | | | | | | | | | | | | |
| Investment securities purchased | | — | | | 11,752,700 | | | — | | | 3,082,792 | |
| Capital shares redeemed | | 1,709,563 | | | 12,540,092 | | | 2,601,831 | | | 26,458,194 | |
| Management fees | | 147,647 | | | 1,517,016 | | | 260,225 | | | 2,935,162 | |
| Distribution fees | | 45,854 | | | 368,513 | | | 110,656 | | | 895,893 | |
| Transfer agent fees | | 45,211 | | | 469,327 | | | 68,587 | | | 890,510 | |
| Distributions to shareholders | | 170,604 | | | 1,379,243 | | | 215,606 | | | 4,703,092 | |
| Accrued expenses and other liabilities | | 62,788 | | | 215,683 | | | 88,163 | | | 527,621 | |
| Total liabilities | | 2,181,667 | | | 28,242,574 | | | 3,345,068 | | | 39,493,264 | |
| Net assets, at value | $ | 338,789,247 | | $ | 3,998,753,397 | | $ | 1,160,792,757 | | $ | 7,794,853,370 | |
| Net assets consist of: | | | | | | | | | | | | |
| Paid-in capital | $ | 440,965,940 | | $ | 3,855,318,370 | | $ | 1,141,545,816 | | $ | 7,966,079,202 | |
| Undistributed net investment income | | 1,443,889 | | | 1,548,090 | | | 269,090 | | | 26,210,656 | |
| Net unrealized appreciation (depreciation) | | (66,219,371 | ) | | 189,297,438 | | | 19,584,161 | | | 337,023,897 | |
| Accumulated net realized gain (loss) | | (37,401,211 | ) | | (47,410,501 | ) | | (606,310 | ) | | (534,460,385 | ) |
| Net assets, at value | $ | 338,789,247 | | $ | 3,998,753,397 | | $ | 1,160,792,757 | | $ | 7,794,853,370 | |
172 | The accompanying notes are an integral part of these financial statements. | Annual Report
Franklin Tax-Free Trust
Financial Statements (continued)
Statements of Assets and Liabilities (continued)
February 28, 2014
| | | | | | | | | | | |
| | | | | Franklin | | Franklin Federal | | | Franklin Federal | | Franklin |
| | | | | Double | | Intermediate-Term | | | Limited-Term | | High Yield |
| | | | | Tax-Free | | Tax-Free | | | Tax-Free | | Tax-Free |
| | | Income Fund | | Income Fund | | | Income Fund | | Income Fund |
| Class A: | | | | | | | | | | | |
| Net assets, at value | $ | 282,254,084 | $ | 1,747,118,494 | $ | | 977,274,369 | $ | 5,014,940,802 |
| Shares outstanding | | | | 29,036,072 | | 143,065,409 | | | 92,982,588 | | 494,277,982 |
| Net asset value per sharea | | | $ | 9.72 | $ | 12.21 | | $ | 10.51 | $ | 10.15 |
| Maximum offering price per share (net asset value per | | | | | | | | | | | |
| share ÷ 95.75%, 97.75%, 97.75% and 95.75%, | | | | | | | | | | | |
| respectively) | | | $ | 10.15 | $ | 12.49 | | $ | 10.75 | $ | 10.60 |
| Class C: | | | | | | | | | | | |
| Net assets, at value | | $ | | 51,179,900 | $ | 453,176,046 | | | | $ | 1,042,822,934 |
| Shares outstanding | | | | 5,240,811 | | 37,011,761 | | | | | 101,154,695 |
| Net asset value and maximum offering price per | | | | | | | | | | | |
| sharea | | | $ | 9.77 | $ | 12.24 | | | | $ | 10.31 |
| Advisor Class: | | | | | | | | | | | |
| Net assets, at value | | $ | | 5,355,263 | $ | 1,798,458,857 | $ | | 183,518,388 | $ | 1,737,089,634 |
| Shares outstanding | | | | 550,093 | | 146,973,562 | | | 17,471,165 | | 170,581,797 |
| Net asset value and maximum offering price per | | | | | | | | | | | |
| share | | | $ | 9.74 | $ | 12.24 | | $ | 10.50 | $ | 10.18 |
| |
| |
| |
| aRedemption price is equal to net asset value less contingent deferred sales charges, if applicable. | | | | | | | |
Annual Report | The accompanying notes are an integral part of these financial statements. | 173
| | | | | | | | | |
| Franklin Tax-Free Trust | | | | | | | | | |
| |
| Financial Statements (continued) | | | | | | | | | |
| |
| |
| Statements of Assets and Liabilities (continued) | | | | | | | | | |
| February 28, 2014 | | | | | | | | | |
| |
| | | | | | Franklin | | | Franklin | |
| | | Franklin | | | Massachusetts | | | New Jersey | |
| | | Insured Tax-Free | | | Tax-Free | | | Tax-Free | |
| | | Income Fund | | | Income Fund | | | Income Fund | |
| Assets: | | | | | | | | | |
| Investments in securities: | | | | | | | | | |
| Cost | $ | 2,154,457,118 | | $ | 468,636,503 | | $ | 1,247,331,310 | |
| Value | $ | 2,223,837,969 | | $ | 476,678,505 | | $ | 1,256,763,970 | |
| Cash | | 18,747,950 | | | 5,429,186 | | | 18,060,083 | |
| Receivables: | | | | | | | | | |
| Capital shares sold | | 615,571 | | | 322,209 | | | 1,242,804 | |
| Interest | | 27,426,163 | | | 5,280,445 | | | 13,913,692 | |
| Other assets | | 1,623 | | | 345 | | | 911 | |
| Total assets | | 2,270,629,276 | | | 487,710,690 | | | 1,289,981,460 | |
| Liabilities: | | | | | | | | | |
| Payables: | | | | | | | | | |
| Capital shares redeemed | | 7,015,602 | | | 1,169,261 | | | 3,371,953 | |
| Management fees | | 867,651 | | | 202,808 | | | 502,007 | |
| Distribution fees | | 297,780 | | | 62,611 | | | 196,894 | |
| Transfer agent fees | | 162,246 | | | 33,533 | | | 120,599 | |
| Distributions to shareholders | | 1,115,222 | | | 296,176 | | | 836,857 | |
| Accrued expenses and other liabilities | | 137,671 | | | 55,883 | | | 99,704 | |
| Total liabilities | | 9,596,172 | | | 1,820,272 | | | 5,128,014 | |
| Net assets, at value | $ | 2,261,033,104 | | $ | 485,890,418 | | $ | 1,284,853,446 | |
| Net assets consist of: | | | | | | | | | |
| Paid-in capital | $ | 2,239,571,618 | | $ | 491,995,035 | | $ | 1,295,024,282 | |
| Undistributed net investment income | | 4,352,763 | | | 734,523 | | | 2,554,308 | |
| Net unrealized appreciation | | 69,380,851 | | | 8,042,002 | | | 9,432,660 | |
| Accumulated net realized gain (loss) | | (52,272,128 | ) | | (14,881,142 | ) | | (22,157,804 | ) |
| Net assets, at value | $ | 2,261,033,104 | | $ | 485,890,418 | | $ | 1,284,853,446 | |
174 | The accompanying notes are an integral part of these financial statements. | Annual Report
Franklin Tax-Free Trust
Financial Statements (continued)
Statements of Assets and Liabilities (continued)
February 28, 2014
| | | | | | | | | |
| | | | | | | Franklin | | | Franklin |
| | | | Franklin | | | Massachusetts | | | New Jersey |
| | | | Insured Tax-Free | | | Tax-Free | | | Tax-Free |
| | | | Income Fund | | | Income Fund | | | Income Fund |
| Class A: | | | | | | | | | |
| Net assets, at value | $ | | 1,880,627,689 | $ | | 419,556,487 | $ | | 974,153,742 |
| Shares outstanding | | | 156,504,301 | | | 36,753,919 | | | 82,827,687 |
| Net asset value per sharea | | $ | 12.02 | | $ | 11.42 | | $ | 11.76 |
| Maximum offering price per share (net asset value per share ÷ 95.75%) | | $ | 12.55 | | $ | 11.93 | | $ | 12.28 |
| Class C: | | | | | | | | | |
| Net assets, at value | $ | | 333,816,032 | $ | | 61,760,229 | $ | | 247,538,034 |
| Shares outstanding | | | 27,414,462 | | | 5,354,850 | | | 20,811,671 |
| Net asset value and maximum offering price per sharea | | $ | 12.18 | | $ | 11.53 | | $ | 11.89 |
| Advisor Class: | | | | | | | | | |
| Net assets, at value | $ | | 46,589,383 | $ | | 4,573,702 | $ | | 63,161,670 |
| Shares outstanding | | | 3,878,698 | | | 400,763 | | | 5,367,932 |
| Net asset value and maximum offering price per share | | $ | 12.01 | | $ | 11.41 | | $ | 11.77 |
| |
| |
| aRedemption price is equal to net asset value less contingent deferred sales charges, if applicable. | | | | | | | | | |
Annual Report | The accompanying notes are an integral part of these financial statements. | 175
| | | | | | | | | | | | |
| Franklin Tax-Free Trust | | | | | | | | | | |
| |
| Financial Statements (continued) | | | | | | | | | | | | |
| |
| |
| Statements of Operations | | | | | | | | | | | | |
| for the year ended February 28, 2014 | | | | | | | | | | | | |
| |
| | | | | | Franklin | | | Franklin | | | | |
| | | Franklin | | | Federal | | | Federal | | | Franklin | |
| | | Double | | | Intermediate- | | | Limited-Term | | | High Yield | |
| | | Tax-Free | | | Term Tax-Free | | | Tax-Free | | | Tax-Free | |
| | | Income Fund | | | Income Fund | | | Income Fund | | | Income Fund | |
| Investment income: | | | | | | | | | | | | |
| Interest | $ | 28,781,091 | | $ | 130,064,864 | | $ | 19,368,997 | | $ | 463,776,621 | |
| Expenses: | | | | | | | | | | | | |
| Management fees (Note 3a) | | 2,556,755 | | | 17,236,048 | | | 6,188,723 | | | 39,225,614 | |
| Administrative fees (Note 3b) | | — | | | — | | | 299,016 | | | — | |
| Distribution fees: (Note 3c) | | | | | | | | | | | | |
| Class A | | 406,161 | | | 2,022,518 | | | 1,352,846 | | | 5,590,934 | |
| Class C | | 522,376 | | | 3,213,320 | | | — | | | 7,828,814 | |
| Transfer agent fees: (Note 3e) | | | | | | | | | | | | |
| Class A | | 260,847 | | | 1,459,102 | | | 329,781 | | | 3,524,580 | |
| Class C | | 47,849 | | | 357,357 | | | — | | | 761,307 | |
| Advisor Class | | 6,015 | | | 870,922 | | | 50,279 | | | 1,260,124 | |
| Custodian fees | | 3,694 | | | 29,750 | | | 8,502 | | | 66,379 | |
| Reports to shareholders | | 35,428 | | | 264,347 | | | 43,389 | | | 564,118 | |
| Registration and filing fees | | 59,603 | | | 258,796 | | | 103,267 | | | 481,264 | |
| Professional fees | | 37,377 | | | 60,095 | | | 39,461 | | | 497,471 | |
| Trustees’ fees and expenses | | 2,883 | | | 18,488 | | | 4,890 | | | 44,897 | |
| Other | | 40,479 | | | 197,569 | | | 98,495 | | | 781,245 | |
| Total expenses | | 3,979,467 | | | 25,988,312 | | | 8,518,649 | | | 60,626,747 | |
| Expenses waived/paid by affiliates (Note 3f) | | — | | | — | | | (2,473,798 | ) | | — | |
| Net expenses | | 3,979,467 | | | 25,988,312 | | | 6,044,851 | | | 60,626,747 | |
| Net investment income | | 24,801,624 | | | 104,076,552 | | | 13,324,146 | | | 403,149,874 | |
| Realized and unrealized gains (losses): | | | | | | | | | | | | |
| Net realized gain (loss) from investments | | (30,249,145 | ) | | (23,344,484 | ) | | 175,379 | | | (239,073,701 | ) |
| Net change in unrealized appreciation (depreciation) on | | | | | | | | | | | | |
| investments | | (98,412,208 | ) | | (101,859,297 | ) | | (3,603,564 | ) | | (571,611,548 | ) |
| Net realized and unrealized gain (loss) | | (128,661,353 | ) | | (125,203,781 | ) | | (3,428,185 | ) | | (810,685,249 | ) |
| Net increase (decrease) in net assets resulting from | | | | | | | | | | | | |
| operations | $ | (103,859,729 | ) | $ | (21,127,229 | ) | $ | 9,895,961 | | $ | (407,535,375 | ) |
176 | The accompanying notes are an integral part of these financial statements. | Annual Report
| | | | | | | | | |
| Franklin Tax-Free Trust | | | | | | | | | |
| |
| Financial Statements (continued) | | | | | | | | | |
| |
| |
| Statements of Operations (continued) | | | | | | | | | |
| for the year ended February 28, 2014 | | | | | | | | | |
| |
| | | | | | Franklin | | | Franklin | |
| | | Franklin | | | Massachusetts | | | New Jersey | |
| | | Insured Tax-Free | | | Tax-Free | | | Tax-Free | |
| | | Income Fund | | | Income Fund | | | Income Fund | |
| Investment income: | | | | | | | | | |
| Interest | $ | 118,684,137 | | $ | 23,464,125 | | $ | 65,835,576 | |
| Expenses: | | | | | | | | | |
| Management fees (Note 3a) | | 11,833,920 | | | 2,679,234 | | | 6,742,310 | |
| Distribution fees: (Note 3c) | | | | | | | | | |
| Class A | | 1,917,274 | | | 463,409 | | | 1,103,698 | |
| Class C | | 2,721,869 | | | 488,552 | | | 1,854,824 | |
| Transfer agent fees: (Note 3e) | | | | | | | | | |
| Class A | | 919,353 | | | 176,760 | | | 521,637 | |
| Class C | | 181,565 | | | 28,673 | | | 134,968 | |
| Advisor Class | | 24,594 | | | 2,609 | | | 33,239 | |
| Custodian fees | | 19,715 | | | 4,074 | | | 11,053 | |
| Reports to shareholders | | 144,025 | | | 23,202 | | | 68,978 | |
| Registration and filing fees | | 132,368 | | | 44,809 | | | 43,744 | |
| Professional fees | | 53,676 | | | 36,910 | | | 44,248 | |
| Trustees’ fees and expenses | | 13,487 | | | 2,782 | | | 7,477 | |
| Other | | 128,880 | | | 35,561 | | | 84,858 | |
| Total expenses | | 18,090,726 | | | 3,986,575 | | | 10,651,034 | |
| Net investment income | | 100,593,411 | | | 19,477,550 | | | 55,184,542 | |
| Realized and unrealized gains (losses): | | | | | | | | | |
| Net realized gain (loss) from investments | | (33,887,257 | ) | | (11,915,165 | ) | | (20,730,399 | ) |
| Net change in unrealized appreciation (depreciation) on investments | | (126,294,534 | ) | | (29,219,409 | ) | | (96,341,509 | ) |
| Net realized and unrealized gain (loss) | | (160,181,791 | ) | | (41,134,574 | ) | | (117,071,908 | ) |
| Net increase (decrease) in net assets resulting from operations | $ | (59,588,380 | ) | $ | (21,657,024 | ) | $ | (61,887,366 | ) |
Annual Report | The accompanying notes are an integral part of these financial statements. | 177
| | | | | | | | | | | | |
| Franklin Tax-Free Trust | | | | | | | | | | |
| |
| Financial Statements (continued) | | | | | | | | | | | | |
| |
| |
| Statements of Changes in Net Assets | | | | | | | | | | | | |
| |
| |
| | | | | | | | | Franklin Federal | |
| | | Franklin Double | | | Intermediate-Term | |
| | | Tax-Free Income Fund | | | Tax-Free Income Fund | |
| | | Year Ended February 28, | | | Year Ended February 28, | |
| | | 2014 | | | 2013 | | | 2014 | | | 2013 | |
| Increase (decrease) in net assets: | | | | | | | | | | | | |
| Operations: | | | | | | | | | | | | |
| Net investment income | $ | 24,801,624 | | $ | 31,155,281 | | $ | 104,076,552 | | $ | 93,205,779 | |
| Net realized gain (loss) from investments | | (30,249,145 | ) | | 217,712 | | | (23,344,484 | ) | | 155,542 | |
| Net change in unrealized appreciation | | | | | | | | | | | | |
| (depreciation) on investments | | (98,412,208 | ) | | (11,386,408 | ) | | (101,859,297 | ) | | 50,568,973 | |
| Net increase (decrease) in net assets | | | | | | | | | | | | |
| resulting from operations | | (103,859,729 | ) | | 19,986,585 | | | (21,127,229 | ) | | 143,930,294 | |
| Distributions to shareholders from: | | | | | | | | | | | | |
| Net investment income: | | | | | | | | | | | | |
| Class A | | (20,591,558 | ) | | (25,492,524 | ) | | (55,999,654 | ) | | (54,261,305 | ) |
| Class C | | (3,295,261 | ) | | (4,109,924 | ) | | (10,924,668 | ) | | (10,518,283 | ) |
| Advisor Class | | (476,276 | ) | | (631,487 | ) | | (35,693,521 | ) | | (26,304,347 | ) |
| Total distributions to shareholders | | (24,363,095 | ) | | (30,233,935 | ) | | (102,617,843 | ) | | (91,083,935 | ) |
| Capital share transactions: (Note 2) | | | | | | | | | | | | |
| Class A | | (212,864,101 | ) | | (33,691,305 | ) | | (434,202,030 | ) | | 389,091,004 | |
| Class C | | (45,408,962 | ) | | 1,413,547 | | | (77,074,643 | ) | | 94,474,602 | |
| Advisor Class | | (6,775,581 | ) | | 1,061,573 | | | 686,468,135 | | | 339,374,872 | |
| Total capital share transactions | | (265,048,644 | ) | | (31,216,185 | ) | | 175,191,462 | | | 822,940,478 | |
| Net increase (decrease) in net assets | | (393,271,468 | ) | | (41,463,535 | ) | | 51,446,390 | | | 875,786,837 | |
| Net assets: | | | | | | | | | | | | |
| Beginning of year | | 732,060,715 | | | 773,524,250 | | | 3,947,307,007 | | | 3,071,520,170 | |
| End of year | $ | 338,789,247 | | $ | 732,060,715 | | $ | 3,998,753,397 | | $ | 3,947,307,007 | |
| Undistributed net investment income included in | | | | | | | | | | | | |
| net assets: | | | | | | | | | | | | |
| End of year | $ | 1,443,889 | | $ | 1,035,604 | | $ | 1,548,090 | | $ | 89,547 | |
178 | The accompanying notes are an integral part of these financial statements. | Annual Report
| | | | | | | | | | | | |
| Franklin Tax-Free Trust | | | | | | | | | | |
| |
| Financial Statements (continued) | | | | | | | | | | | | |
| |
| |
| Statements of Changes in Net Assets (continued) | | | | | | | | | | |
| |
| |
| | | Franklin Federal Limited-Term | | | Franklin High Yield | |
| | | Tax-Free Income Fund | | | Tax-Free Income Fund | |
| | | Year Ended February 28, | | | Year Ended February 28, | |
| | | 2014 | | | 2013 | | | 2014 | | | 2013 | |
| Increase (decrease) in net assets: | | | | | | | | | | | | |
| Operations: | | | | | | | | | | | | |
| Net investment income | $ | 13,324,146 | | $ | 13,828,818 | | $ | 403,149,874 | | $ | 393,985,896 | |
| Net realized gain (loss) from investments | | 175,379 | | | 103,548 | | | (239,073,701 | ) | | (105,138,460 | ) |
| Net change in unrealized appreciation | | | | | | | | | | | | |
| (depreciation) on investments | | (3,603,564 | ) | | (3,197,500 | ) | | (571,611,548 | ) | | 422,807,102 | |
| Net increase (decrease) in net assets | | | | | | | | | | | | |
| resulting from operations | | 9,895,961 | | | 10,734,866 | | | (407,535,375 | ) | | 711,654,538 | |
| Distributions to shareholders from: | | | | | | | | | | | | |
| Net investment income: | | | | | | | | | | | | |
| Class A | | (11,009,041 | ) | | (12,196,004 | ) | | (250,275,056 | ) | | (259,869,776 | ) |
| Class B | | — | | | — | | | — | | | (231,254 | ) |
| Class C | | — | | | — | | | (46,366,828 | ) | | (47,393,332 | ) |
| Advisor Class | | (1,860,794 | ) | | (1,784,731 | ) | | (91,162,719 | ) | | (76,507,017 | ) |
| Total distributions to shareholders | | (12,869,835 | ) | | (13,980,735 | ) | | (387,804,603 | ) | | (384,001,379 | ) |
| Capital share transactions: (Note 2) | | | | | | | | | | | | |
| Class A | | 202,080,079 | | | 98,757,004 | | | (1,038,781,188 | ) | | 459,155,544 | |
| Class B | | — | | | — | | | (422,960 | ) | | (13,134,270 | ) |
| Class C | | — | | | — | | | (292,046,584 | ) | | 180,195,308 | |
| Advisor Class | | 74,832,596 | | | 28,642,026 | | | (241,499,831 | ) | | 657,028,709 | |
| Total capital share transactions | | 276,912,675 | | | 127,399,030 | | | (1,572,750,563 | ) | | 1,283,245,291 | |
| Net increase (decrease) in net assets | | 273,938,801 | | | 124,153,161 | | | (2,368,090,541 | ) | | 1,610,898,450 | |
| Net assets: | | | | | | | | | | | | |
| Beginning of year | | 886,853,956 | | | 762,700,795 | | | 10,162,943,911 | | | 8,552,045,461 | |
| End of year | $ | 1,160,792,757 | | $ | 886,853,956 | | $ | 7,794,853,370 | | $ | 10,162,943,911 | |
| Undistributed net investment income | | | | | | | | | | | | |
| (distributions in excess of net investment | | | | | | | | | | | | |
| income) included in net assets: | | | | | | | | | | | | |
| End of year | $ | 269,090 | | $ | (181,749 | ) | $ | 26,210,656 | | $ | 13,085,048 | |
Annual Report | The accompanying notes are an integral part of these financial statements. | 179
| | | | | | | | | | | | | |
| Franklin Tax-Free Trust | | | | | | | | | | | |
| |
| Financial Statements (continued) | | | | | | | | | | | | | |
| |
| |
| Statements of Changes in Net Assets (continued) | | | | | | | | | | | | | |
| |
| |
| | | Franklin Insured | | | Franklin Massachusetts | |
| | | Tax-Free Income Fund | | | Tax-Free Income Fund | |
| | | Year Ended February 28, | | | Year Ended February 28, | |
| | | 2014 | | | | 2013 | | | 2014 | | | 2013 | |
| Increase (decrease) in net assets: | | | | | | | | | | | | | |
| Operations: | | | | | | | | | | | | | |
| Net investment income | $ | 100,593,411 | | $ | 105,630,507 | | $ | 19,477,550 | | $ | 20,339,723 | |
| Net realized gain (loss) from investments | | (33,887,257 | ) | | | 3,615,685 | | | (11,915,165 | ) | | 640,578 | |
| Net change in unrealized appreciation | | | | | | | | | | | | | |
| (depreciation) on investments | | (126,294,534 | ) | | | 54,308,712 | | | (29,219,409 | ) | | 6,037,387 | |
| Net increase (decrease) in net assets | | | | | | | | | | | | | |
| resulting from operations | | (59,588,380 | ) | | 163,554,904 | | | (21,657,024 | ) | | 27,017,688 | |
| Distributions to shareholders from: | | | | | | | | | | | | | |
| Net investment income: | | | | | | | | | | | | | |
| Class A | | (81,522,827 | ) | | | (84,815,152 | ) | | (16,109,085 | ) | | (17,387,048 | ) |
| Class B | | — | | | | (82,993 | ) | | — | | | — | |
| Class C | | (13,362,543 | ) | | | (14,582,915 | ) | | (2,168,600 | ) | | (2,562,148 | ) |
| Advisor Class | | (2,219,822 | ) | | | (2,420,673 | ) | | (242,092 | ) | | (297,368 | ) |
| Total distributions to shareholders | | (97,105,192 | ) | | (101,901,733 | ) | | (18,519,777 | ) | | (20,246,564 | ) |
| Capital share transactions: (Note 2) | | | | | | | | | | | | | |
| Class A | | (545,755,568 | ) | | 189,708,717 | | | (72,722,670 | ) | | 58,576,613 | |
| Class B | | (383,713 | ) | | | (4,941,731 | ) | | — | | | — | |
| Class C | | (186,317,373 | ) | | | 81,290,584 | | | (22,518,228 | ) | | 5,004,542 | |
| Advisor Class | | (21,923,978 | ) | | | 8,850,078 | | | (3,917,811 | ) | | 1,303,160 | |
| Total capital share transactions | | (754,380,632 | ) | | 274,907,648 | | | (99,158,709 | ) | | 64,884,315 | |
| Net increase (decrease) in net assets | | (911,074,204 | ) | | 336,560,819 | | | (139,335,510 | ) | | 71,655,439 | |
| Net assets: | | | | | | | | | | | | | |
| Beginning of year | | 3,172,107,308 | | | 2,835,546,489 | | | 625,225,928 | | | 553,570,489 | |
| End of year | $ | 2,261,033,104 | | $ | 3,172,107,308 | | $ | 485,890,418 | | $ | 625,225,928 | |
| Undistributed net investment income (distributions | | | | | | | | | | | | | |
| in excess of net investment income) included in | | | | | | | | | | | | | |
| net assets: | | | | | | | | | | | | | |
| End of year | $ | 4,352,763 | | | $ | 913,042 | | $ | 734,523 | | $ | (177,938 | ) |
180 | The accompanying notes are an integral part of these financial statements. | Annual Report
| | | | | | |
| Franklin Tax-Free Trust | | | | | | |
| |
| Financial Statements (continued) | | | | | | |
| |
| |
| Statements of Changes in Net Assets (continued) | | | | | | |
| |
| |
| | | Franklin New Jersey | |
| | | Tax-Free Income Fund | |
| | | Year Ended February 28, | |
| | | 2014 | | | 2013 | |
| Increase (decrease) in net assets: | | | | | | |
| Operations: | | | | | | |
| Net investment income | $ | 55,184,542 | | $ | 59,343,595 | |
| Net realized gain (loss) from investments | | (20,730,399 | ) | | 1,708,984 | |
| Net change in unrealized appreciation (depreciation) on investments | | (96,341,509 | ) | | 7,935,748 | |
| Net increase (decrease) in net assets resulting from operations | | (61,887,366 | ) | | 68,988,327 | |
| Distributions to shareholders from: | | | | | | |
| Net investment income: | | | | | | |
| Class A | | (41,541,891 | ) | | (46,166,421 | ) |
| Class B | | — | | | (101,941 | ) |
| Class C | | (9,040,613 | ) | | (9,752,869 | ) |
| Advisor Class | | (2,703,744 | ) | | (2,771,024 | ) |
| Total distributions to shareholders | | (53,286,248 | ) | | (58,792,255 | ) |
| Capital share transactions: (Note 2) | | | | | | |
| Class A | | (220,351,567 | ) | | 72,426,148 | |
| Class B | | (519,178 | ) | | (5,838,717 | ) |
| Class C | | (61,287,445 | ) | | 33,241,983 | |
| Advisor Class | | (12,706,308 | ) | | 17,324,686 | |
| Total capital share transactions | | (294,864,498 | ) | | 117,154,100 | |
| Net increase (decrease) in net assets | | (410,038,112 | ) | | 127,350,172 | |
| Net assets: | | | | | | |
| Beginning of year | | 1,694,891,558 | | | 1,567,541,386 | |
| End of year | $ | 1,284,853,446 | | $ | 1,694,891,558 | |
| Undistributed net investment income included in net assets: | | | | | | |
| End of year | $ | 2,554,308 | | $ | 665,113 | |
Annual Report | The accompanying notes are an integral part of these financial statements. | 181
Franklin Tax-Free Trust
Notes to Financial Statements
1. ORGANIZATION AND SIGNIFICANT ACCOUNTING POLICIES
Franklin Tax-Free Trust (Trust) is registered under the Investment Company Act of 1940, as amended, (1940 Act) as an open-end investment company, consisting of twenty-four separate funds, seven of which are included in this report (Funds). The financial statements of the remaining funds in the Trust are presented separately. The classes of shares offered within each of the Funds are indicated below. Effective March 1, 2013, all Class B shares were converted to Class A. Each class of shares differs by its initial sales load, contingent deferred sales charges, voting rights on matters affecting a single class, its exchange privilege and fees primarily due to differing arrangements for distribution and transfer agent fees. The Franklin Insured Tax-Free Income Fund was closed to all investments from new and existing shareholders effective at the close of market March 1, 2013 (with the exception of purchases made through reinvestment of dividends or capital gains).
| |
| Class A & Advisor Class | Class A, Class C & Advisor Class |
| Franklin Federal Limited-Term Tax-Free Income Fund | Franklin Double Tax-Free Income Fund |
| | Franklin Federal Intermediate-Term Tax-Free Income Fund |
| | Franklin High Yield Tax-Free Income Fund |
| | Franklin Insured Tax-Free Income Fund |
| | Franklin Massachusetts Tax-Free Income Fund |
| | Franklin New Jersey Tax-Free Income Fund |
The following summarizes the Funds’ significant accounting policies.
a. Financial Instrument Valuation
The Funds’ investments in financial instruments are carried at fair value daily. Fair value is the price that would be received to sell an asset or paid to transfer a liability in an orderly transaction between market participants on the measurement date. The Funds’ calculate the net asset value per share at the close of the New York Stock Exchange (NYSE), generally at 4p.m. Eastern time (NYSE close) on each day the NYSE is open for trading. Under procedures approved by the Trust’s Board of Trustees (the Board), the Funds’ administrator, investment manager and other affiliates have formed the Valuation and Liquidity Oversight Committee (VLOC). The VLOC provides administration and oversight of the Funds’ valuation policies and procedures, which are approved annually by the Board. Among other things, these procedures allow the Funds to utilize independent pricing services, quotations from securities and financial instrument dealers, and other market sources to determine fair value.
Debt securities generally trade in the over-the-counter market rather than on a securities exchange. The Funds’ pricing services use multiple valuation techniques to determine fair value. In instances where sufficient market activity exists, the pricing services may utilize a market-based approach through which quotes from market makers are used to determine fair value. In instances where sufficient market activity may not exist or is limited, the pricing services also utilize proprietary valuation models which may consider market characteristics such as benchmark yield curves, credit
182 | Annual Report
Franklin Tax-Free Trust
Notes to Financial Statements (continued)
| 1. | ORGANIZATION AND SIGNIFICANT ACCOUNTING POLICIES (continued) |
| a. | Financial Instrument Valuation (continued) |
spreads, estimated default rates, anticipated market interest rate volatility, coupon rates, anticipated timing of principal repayments, underlying collateral, and other unique security features in order to estimate the relevant cash flows, which are then discounted to calculate the fair value.
The Funds have procedures to determine the fair value of financial instruments for which market prices are not reliable or readily available. Under these procedures, the VLOC convenes on a regular basis to review such financial instruments and considers a number of factors, including significant unobservable valuation inputs, when arriving at fair value. The VLOC primarily employs a market-based approach which may use related or comparable assets or liabilities, recent transactions, market multiples, book values, and other relevant information for the investment to determine the fair value of the investment. An income-based valuation approach may also be used in which the anticipated future cash flows of the investment are discounted to calculate fair value. Discounts may also be applied due to the nature or duration of any restrictions on the disposition of the investments. Due to the inherent uncertainty of valuations of such investments, the fair values may differ significantly from the values that would have been used had an active market existed. The VLOC employs various methods for calibrating these valuation approaches including a regular review of key inputs and assumptions, transactional back-testing or disposition analysis, and reviews of any related market activity.
b. Securities Purchased on a When-Issued Basis
Certain funds purchase securities on a when-issued basis, with payment and delivery scheduled for a future date. These transactions are subject to market fluctuations and are subject to the risk that the value at delivery may be more or less than the trade date purchase price. Although the funds will generally purchase these securities with the intention of holding the securities, they may sell the securities before the settlement date. Sufficient assets have been segregated for these securities.
c. Income Taxes
It is each fund’s policy to qualify as a regulated investment company under the Internal Revenue Code. Each fund intends to distribute to shareholders substantially all of its income and net realized gains to relieve it from federal income and excise taxes. As a result, no provision for U.S. federal income taxes is required.
Each fund recognizes the tax benefits of uncertain tax positions only when the position is “more likely than not” to be sustained upon examination by the tax authorities based on the technical merits of the tax position. As of February 28, 2014, and for all open tax years, each fund has determined that no liability for unrecognized tax benefits is required in each fund’s financial statements related to uncertain tax positions taken on a tax return (or expected to be taken on future tax returns). Open tax years are those that remain subject to examination and are based on each tax jurisdiction statute of limitation.
Annual Report | 183
Franklin Tax-Free Trust
Notes to Financial Statements (continued)
| 1. | ORGANIZATION AND SIGNIFICANT ACCOUNTING POLICIES (continued) |
| d. | Security Transactions, Investment Income, Expenses and Distributions |
Security transactions are accounted for on trade date. Realized gains and losses on security transactions are determined on a specific identification basis. Interest income and estimated expenses are accrued daily. Amortization of premium and accretion of discount on debt securities are included in interest income. Dividends from net investment income are normally declared daily; these dividends may be reinvested or paid monthly to shareholders. Distributions to shareholders are determined according to income tax regulations (tax basis). Distributable earnings determined on a tax basis may differ from earnings recorded in accordance with accounting principles generally accepted in the United States of America. These differences may be permanent or temporary. Permanent differences are reclassified among capital accounts to reflect their tax character. These reclassifications have no impact on net assets or the results of operations. Temporary differences are not reclassified, as they may reverse in subsequent periods.
Common expenses incurred by the Trust are allocated among the funds based on the ratio of net assets of each fund to the combined net assets of the Trust. Fund specific expenses are charged directly to the fund that incurred the expense.
Realized and unrealized gains and losses and net investment income, not including class specific expenses, are allocated daily to each class of shares based upon the relative proportion of net assets of each class. Differences in per share distributions, by class, are generally due to differences in class specific expenses.
e. Insurance
The scheduled payments of interest and principal for each insured municipal security in the Trust are insured by either a new issue insurance policy or a secondary insurance policy. Some municipal securities in the Funds are secured by collateral guaranteed by an agency of the U.S. government. Depending on the type of coverage, premiums for insurance are either added to the cost basis of the security or paid by a third party.
Insurance companies typically insure municipal bonds that tend to be of very high quality, with the majority of underlying municipal bonds rated A or better. However, an event involving an insurer could have an adverse effect on the value of the securities insured by that insurance company. There is no guarantee the insurer will be able to fulfill its obligations under the terms of the policy.
f. Accounting Estimates
The preparation of financial statements in accordance with accounting principles generally accepted in the United States of America requires management to make estimates and assumptions that affect the reported amounts of assets and liabilities at the date of the financial statements and the amounts of income and expenses during the reporting period. Actual results could differ from those estimates.
184 | Annual Report
Franklin Tax-Free Trust
Notes to Financial Statements (continued)
| 1. | ORGANIZATION AND SIGNIFICANT ACCOUNTING POLICIES (continued) |
| g. | Guarantees and Indemnifications |
Under the Trust’s organizational documents, its officers and trustees are indemnified by the Trust against certain liabilities arising out of the performance of their duties to the Trust. Additionally, in the normal course of business, the Trust, on behalf of the Funds, enters into contracts with service providers that contain general indemnification clauses. The Trust’s maximum exposure under these arrangements is unknown as this would involve future claims that may be made against the Trust that have not yet occurred. Currently, the Trust expects the risk of loss to be remote.
2. SHARES OF BENEFICIAL INTEREST
At February 28, 2014, there were an unlimited number of shares authorized (without par value).
Transactions in the Funds’ shares were as follows:
| | | | | | | | | | | |
| | | | | | | | Franklin Federal | |
| | Franklin Double | | Intermediate-Term | |
| | Tax-Free Income Fund | | Tax-Free Income Fund | |
| | Shares | | | | Amount | | Shares | | | Amount | |
| Class A Shares: | | | | | | | | | | | |
| Year ended February 28, 2014 | | | | | | | | | | | |
| Shares sold | 89,045 | | | $ | 919,381 | | 47,978,543 | | $ | 582,835,363 | |
| Shares issued in reinvestment of | | | | | | | | | | | |
| distributions | 1,740,727 | | | | 18,490,256 | | 4,118,192 | | | 49,997,946 | |
| Shares redeemed | (22,290,762 | ) | | | (232,273,738 | ) | (88,041,839 | ) | | (1,067,035,339 | ) |
| Net increase (decrease) | (20,460,990 | ) | $ | (212,864,101 | ) | (35,945,104 | ) | $ | (434,202,030 | ) |
| Year ended February 28, 2013 | | | | | | | | | | | |
| Shares sold | 8,050,013 | | | $ | 98,788,877 | | 58,877,975 | | $ | 736,979,645 | |
| Shares issued in reinvestment of | | | | | | | | | | | |
| distributions | 1,878,579 | | | | 22,998,696 | | 3,885,211 | | | 48,623,360 | |
| Shares redeemed | (12,691,567 | ) | | | (155,478,878 | ) | (31,682,363 | ) | | (396,512,001 | ) |
| Net increase (decrease) | (2,762,975 | ) | | $ | (33,691,305 | ) | 31,080,823 | | $ | 389,091,004 | |
| Class C Shares: | | | | | | | | | | | |
| Year ended February 28, 2014 | | | | | | | | | | | |
| Shares sold | 39,885 | | | $ | 428,946 | | 9,210,350 | | $ | 112,241,169 | |
| Shares issued in reinvestment of | | | | | | | | | | | |
| distributions | 275,174 | | | | 2,937,098 | | 723,768 | | | 8,808,142 | |
| Shares redeemed | (4,583,899 | ) | | | (48,775,006 | ) | (16,354,384 | ) | | (198,123,954 | ) |
| Net increase (decrease) | (4,268,840 | ) | | $ | (45,408,962 | ) | (6,420,266 | ) | $ | (77,074,643 | ) |
| Year ended February 28, 2013 | | | | | | | | | | | |
| Shares sold | 1,910,320 | | | $ | 23,525,307 | | 14,101,462 | | $ | 176,935,848 | |
| Shares issued in reinvestment of | | | | | | | | | | | |
| distributions | 296,411 | | | | 3,644,287 | | 672,638 | | | 8,439,116 | |
| Shares redeemed | (2,096,627 | ) | | | (25,756,047 | ) | (7,245,858 | ) | | (90,900,362 | ) |
| Net increase (decrease) | 110,104 | | | $ | 1,413,547 | | 7,528,242 | | $ | 94,474,602 | |
Annual Report | 185
| | | | | | | | | | | | |
| Franklin Tax-Free Trust | | | | | | | |
| |
| Notes to Financial Statements (continued) | | | | | | | |
| |
| |
| 2. SHARES OF BENEFICIAL INTEREST (continued) | | | | | | | | | | | |
| |
| | | | | | | | Franklin Federal | |
| | Franklin Double | | Intermediate-Term | |
| | Tax-Free Income Fund | | Tax-Free Income Fund | |
| | Shares | | | | Amount | | Shares | | | | Amount | |
| Advisor Class Shares: | | | | | | | | | | | | |
| Year ended February 28, 2014 | | | | | | | | | | | | |
| Shares sold | 115,372 | | | $ | 1,287,864 | | 94,095,836 | | $ | 1,146,604,504 | |
| Shares issued in reinvestment of | | | | | | | | | | | | |
| distributions | 33,938 | | | | 364,110 | | 2,264,321 | | | | 27,522,835 | |
| Shares redeemed | (802,146 | ) | | | (8,427,555 | ) | (40,310,145 | ) | | | (487,659,204 | ) |
| Net increase (decrease) | (652,836 | ) | | $ | (6,775,581 | ) | 56,050,012 | | | $ | 686,468,135 | |
| Year ended February 28, 2013 | | | | | | | | | | | | |
| Shares sold | 509,112 | | | $ | 6,250,918 | | 41,915,240 | | | $ | 525,907,509 | |
| Shares issued in reinvestment of | | | | | | | | | | | | |
| distributions | 42,172 | | | | 517,077 | | 1,551,365 | | | | 19,458,915 | |
| Shares redeemed | (464,697 | ) | | | (5,706,422 | ) | (16,429,638 | ) | | | (205,991,552 | ) |
| Net increase (decrease) | 86,587 | | | $ | 1,061,573 | | 27,036,967 | | | $ | 339,374,872 | |
| |
| | Franklin Federal | | Franklin | |
| | Limited-Term | | High Yield | |
| | Tax-Free Income Fund | | Tax-Free Income Fund | |
| | Shares | | | | Amount | | Shares | | | | Amount | |
| Class A Shares: | | | | | | | | | | | | |
| Year ended February 28, 2014 | | | | | | | | | | | | |
| Shares sold | 53,830,197 | | $ | 563,796,058 | | 59,469,325 | | | $ | 608,899,547 | |
| Shares issued in reinvestment of | | | | | | | | | | | | |
| distributions | 901,683 | | | | 9,452,483 | | 20,840,626 | | | | 212,045,170 | |
| Shares redeemed | (35,433,429 | ) | | | (371,168,462 | ) | (183,662,490 | ) | | | (1,859,725,905 | ) |
| Net increase (decrease) | 19,298,451 | | $ | 202,080,079 | | (103,352,539 | ) | $ | (1,038,781,188 | ) |
| Year ended February 28, 2013 | | | | | | | | | | | | |
| Shares sold | 28,072,463 | | $ | 296,783,110 | | 117,191,241 | | $ | 1,272,156,105 | |
| Shares issued in reinvestment of | | | | | | | | | | | | |
| distributions | 976,491 | | | | 10,322,488 | | 19,888,088 | | | | 215,848,088 | |
| Shares redeemed | (19,708,181 | ) | | | (208,348,594 | ) | (94,594,903 | ) | | | (1,028,848,649 | ) |
| Net increase (decrease) | 9,340,773 | | | $ | 98,757,004 | | 42,484,426 | | | $ | 459,155,544 | |
| Class B Shares: | | | | | | | | | | | | |
| Year ended February 28, 2014a | | | | | | | | | | | | |
| Shares redeemed | | | | | | | (38,210 | ) | | $ | (422,960 | ) |
| Year ended February 28, 2013 | | | | | | | | | | | | |
| Shares sold | | | | | | | 14,330 | | | $ | 154,571 | |
| Shares issued in reinvestment of | | | | | | | | | | | | |
| distributions | | | | | | | 18,092 | | | | 196,086 | |
| Shares redeemed | | | | | | | (1,237,647 | ) | | | (13,484,927 | ) |
| Net increase (decrease) | | | | | | | (1,205,225 | ) | | $ | (13,134,270 | ) |
186 | Annual Report
| | | | | | | | | | | | |
| Franklin Tax-Free Trust | | | | | | | |
| |
| Notes to Financial Statements (continued) | | | | | | | | |
| |
| |
| 2. SHARES OF BENEFICIAL INTEREST (continued) | | | | | | | | | | | |
| |
| | Franklin Federal | | Franklin | |
| | Limited-Term | | High Yield | |
| | Tax-Free Income Fund | | Tax-Free Income Fund | |
| | Shares | | | | Amount | | Shares | | | | Amount | |
| Class C Shares: | | | | | | | | | | | | |
| Year ended February 28, 2014 | | | | | | | | | | | | |
| Shares sold | | | | | | | 11,402,805 | | | $ | 118,998,075 | |
| Shares issued in reinvestment of | | | | | | | | | | | | |
| distributions | | | | | | | 3,785,401 | | | | 39,120,725 | |
| Shares redeemed | | | | | | | (43,840,751 | ) | | | (450,165,384 | ) |
| Net increase (decrease) | | | | | | | (28,652,545 | ) | | $ | (292,046,584 | ) |
| Year ended February 28, 2013 | | | | | | | | | | | | |
| Shares sold | | | | | | | 30,241,478 | | | $ | 332,990,071 | |
| Shares issued in reinvestment of | | | | | | | | | | | | |
| distributions | | | | | | | 3,572,506 | | | | 39,354,088 | |
| Shares redeemed | | | | | | | (17,415,942 | ) | | | (192,148,851 | ) |
| Net increase (decrease) | | | | | | | 16,398,042 | | | $ | 180,195,308 | |
| Advisor Class Shares: | | | | | | | | | | | | |
| Year ended February 28, 2014 | | | | | | | | | | | | |
| Shares sold | 12,386,673 | | $ | 129,639,690 | | 101,830,003 | | $ | 1,040,634,829 | |
| Shares issued in reinvestment of | | | | | | | | | | | | |
| distributions | 55,791 | | | | 584,302 | | 7,486,430 | | | | 76,268,110 | |
| Shares redeemed | (5,285,056 | ) | | | (55,391,396 | ) | (134,514,922 | ) | | (1,358,402,770 | ) |
| Net increase (decrease) | 7,157,408 | | | $ | 74,832,596 | | (25,198,489 | ) | | $ | (241,499,831 | ) |
| Year ended February 28, 2013 | | | | | | | | | | | | |
| Shares sold | 5,682,525 | | | $ | 60,047,196 | | 98,738,557 | | $ | 1,075,682,446 | |
| Shares issued in reinvestment of | | | | | | | | | | | | |
| distributions | 49,054 | | | | 518,287 | | 5,576,041 | | | | 60,794,738 | |
| Shares redeemed | (3,022,247 | ) | | | (31,923,457 | ) | (43,876,353 | ) | | | (479,448,475 | ) |
| Net increase (decrease) | 2,709,332 | | | $ | 28,642,026 | | 60,438,245 | | | $ | 657,028,709 | |
| |
| aEffective March 1, 2013, all Class B shares were converted to Class A. | | | | | | | | | | | |
| |
| | Franklin Insured | | Franklin Massachusetts | |
| | Tax-Free Income Fund | | Tax-Free Income Fund | |
| | Shares | | | | Amount | | Shares | | | | Amount | |
| Class A Shares: | | | | | | | | | | | | |
| Year ended February 28, 2014 | | | | | | | | | | | | |
| Shares sold | 637,933 | | | $ | 7,676,017 | | 14,263,643 | | $ | 161,644,051 | |
| Shares issued in reinvestment of | | | | | | | | | | | | |
| distributions | 5,766,058 | | | | 69,110,330 | | 1,132,404 | | | | 12,939,425 | |
| Shares redeemed | (52,027,743 | ) | | (622,541,915 | ) | (21,877,246 | ) | | | (247,306,146 | ) |
| Net increase (decrease) | (45,623,752 | ) | $ | (545,755,568 | ) | (6,481,199 | ) | | $ | (72,722,670 | ) |
| Year ended February 28, 2013 | | | | | | | | | | | | |
| Shares sold | 34,651,244 | | $ | 435,131,562 | | 9,215,852 | | $ | 111,754,753 | |
| Shares issued in reinvestment of | | | | | | | | | | | | |
| distributions | 5,684,089 | | | | 71,334,192 | | 1,140,462 | | | | 13,839,315 | |
| Shares redeemed | (25,214,541 | ) | | (316,757,037 | ) | (5,530,117 | ) | | | (67,017,455 | ) |
| Net increase (decrease) | 15,120,792 | | $ | 189,708,717 | | 4,826,197 | | | $ | 58,576,613 | |
Annual Report | 187
| | | | | | | | | | | |
| Franklin Tax-Free Trust | | | | | | |
| |
| Notes to Financial Statements (continued) | | | | | | | |
| |
| |
| 2. SHARES OF BENEFICIAL INTEREST (continued) | | | | | | | | | | |
| |
| | Franklin Insured | | Franklin Massachusetts | |
| | Tax-Free Income Fund | | Tax-Free Income Fund | |
| | Shares | | | | Amount | | Shares | | | Amount | |
| Class B Shares: | | | | | | | | | | | |
| Year ended February 28, 2014a | | | | | | | | | | | |
| Shares redeemed | (30,217 | ) | | $ | (383,713 | ) | | | | | |
| Year ended February 28, 2013 | | | | | | | | | | | |
| Shares sold | 4,493 | | | $ | 56,906 | | | | | | |
| Shares issued in reinvestment of | | | | | | | | | | | |
| distributions | 5,236 | | | | 65,711 | | | | | | |
| Shares redeemed | (402,017 | ) | | | (5,064,348 | ) | | | | | |
| Net increase (decrease) | (392,288 | ) | | $ | (4,941,731 | ) | | | | | |
| Class C Shares: | | | | | | | | | | | |
| Year ended February 28, 2014 | | | | | | | | | | | |
| Shares sold | 144,968 | | | $ | 1,774,098 | | 604,890 | | $ | 7,099,778 | |
| Shares issued in reinvestment of | | | | | | | | | | | |
| distributions | 976,889 | | | | 11,875,249 | | 157,770 | | | 1,822,479 | |
| Shares redeemed | (16,506,125 | ) | | (199,966,720 | ) | (2,744,307 | ) | | (31,440,485 | ) |
| Net increase (decrease) | (15,384,268 | ) | $ | (186,317,373 | ) | (1,981,647 | ) | $ | (22,518,228 | ) |
| Year ended February 28, 2013 | | | | | | | | | | | |
| Shares sold | 11,672,244 | | $ | 148,228,282 | | 1,351,169 | | $ | 16,545,376 | |
| Shares issued in reinvestment of | | | | | | | | | | | |
| distributions | 1,018,749 | | | | 12,950,328 | | 178,031 | | | 2,181,276 | |
| Shares redeemed | (6,281,177 | ) | | | (79,888,026 | ) | (1,119,641 | ) | | (13,722,110 | ) |
| Net increase (decrease) | 6,409,816 | | | $ | 81,290,584 | | 409,559 | | $ | 5,004,542 | |
| Advisor Class Shares: | | | | | | | | | | | |
| Year ended February 28, 2014 | | | | | | | | | | | |
| Shares sold | 1,107,166 | | | $ | 13,193,385 | | 151,905 | | $ | 1,749,306 | |
| Shares issued in reinvestment of | | | | | | | | | | | |
| distributions | 151,481 | | | | 1,817,018 | | 12,833 | | | 146,853 | |
| Shares redeemed | (3,098,210 | ) | | | (36,934,381 | ) | (515,095 | ) | | (5,813,970 | ) |
| Net increase (decrease) | (1,839,563 | ) | | $ | (21,923,978 | ) | (350,357 | ) | $ | (3,917,811 | ) |
| Year ended February 28, 2013 | | | | | | | | | | | |
| Shares sold | 1,986,587 | | | $ | 24,977,555 | | 208,434 | | $ | 2,533,516 | |
| Shares issued in reinvestment of | | | | | | | | | | | |
| distributions | 169,857 | | | | 2,131,281 | | 14,128 | | | 171,455 | |
| Shares redeemed | (1,453,112 | ) | | | (18,258,758 | ) | (115,607 | ) | | (1,401,811 | ) |
| Net increase (decrease) | 703,332 | | | $ | 8,850,078 | | 106,955 | | $ | 1,303,160 | |
| |
| aEffective March 1, 2013, all Class B shares were converted to Class A. | | | | | | | | | | |
188 | Annual Report
| | | | | | |
| Franklin Tax-Free Trust | | | | | | |
| |
| Notes to Financial Statements (continued) | | | | | | |
| |
| |
| 2. SHARES OF BENEFICIAL INTEREST (continued) | | | | | | |
| |
| | Franklin New Jersey | |
| | Tax-Free Income Fund | |
| | Shares | | | | Amount | |
| Class A Shares: | | | | | | |
| Year ended February 28, 2014 | | | | | | |
| Shares sold | 12,546,810 | | $ | 149,726,572 | |
| Shares issued in reinvestment of distributions | 2,820,702 | | | | 33,503,802 | |
| Shares redeemed | (34,038,745 | ) | | | (403,581,941 | ) |
| Net increase (decrease) | (18,671,233 | ) | $ | (220,351,567 | ) |
| Year ended February 28, 2013 | | | | | | |
| Shares sold | 16,131,145 | | $ | 203,251,854 | |
| Shares issued in reinvestment of distributions | 2,962,022 | | | | 37,359,189 | |
| Shares redeemed | (13,333,352 | ) | | | (168,184,895 | ) |
| Net increase (decrease) | 5,759,815 | | | $ | 72,426,148 | |
| Class B Shares: | | | | | | |
| Year ended February 28, 2014a | | | | | | |
| Shares redeemed | (40,834 | ) | | $ | (519,178 | ) |
| Year ended February 28, 2013 | | | | | | |
| Shares sold | 2,862 | | | $ | 36,059 | |
| Shares issued in reinvestment of distributions | 6,542 | | | | 82,792 | |
| Shares redeemed | (469,931 | ) | | | (5,957,568 | ) |
| Net increase (decrease) | (460,527 | ) | | $ | (5,838,717 | ) |
| Class C Shares: | | | | | | |
| Year ended February 28, 2014 | | | | | | |
| Shares sold | 2,277,360 | | | $ | 27,788,100 | |
| Shares issued in reinvestment of distributions | 602,945 | | | | 7,239,344 | |
| Shares redeemed | (8,052,649 | ) | | | (96,314,889 | ) |
| Net increase (decrease) | (5,172,344 | ) | | $ | (61,287,445 | ) |
| Year ended February 28, 2013 | | | | | | |
| Shares sold | 4,958,487 | | | $ | 63,184,424 | |
| Shares issued in reinvestment of distributions | 618,252 | | | | 7,879,435 | |
| Shares redeemed | (2,967,796 | ) | | | (37,821,876 | ) |
| Net increase (decrease) | 2,608,943 | | | $ | 33,241,983 | |
| Advisor Class Shares: | | | | | | |
| Year ended February 28, 2014 | | | | | | |
| Shares sold | 1,999,455 | | | $ | 23,639,531 | |
| Shares issued in reinvestment of distributions | 156,692 | | | | 1,862,620 | |
| Shares redeemed | (3,246,445 | ) | | | (38,208,459 | ) |
| Net increase (decrease) | (1,090,298 | ) | | $ | (12,706,308 | ) |
| Year ended February 28, 2013 | | | | | | |
| Shares sold | 2,677,391 | | | $ | 33,781,111 | |
| Shares issued in reinvestment of distributions | 155,901 | | | | 1,967,288 | |
| Shares redeemed | (1,460,868 | ) | | | (18,423,713 | ) |
| Net increase (decrease) | 1,372,424 | | | $ | 17,324,686 | |
| aEffective March 1, 2013, all Class B shares were converted to Class A. | | | | | | |
Annual Report | 189
Franklin Tax-Free Trust
Notes to Financial Statements (continued)
3. TRANSACTIONS WITH AFFILIATES
Franklin Resources, Inc. is the holding company for various subsidiaries that together are referred to as Franklin Templeton Investments. Certain officers and trustees of the Trust are also officers and/or directors of the following subsidiaries:
| |
| Subsidiary | Affiliation |
| Franklin Advisers, Inc. (Advisers) | Investment manager |
| Franklin Templeton Services, LLC (FT Services) | Administrative manager |
| Franklin Templeton Distributors, Inc. (Distributors) | Principal underwriter |
| Franklin Templeton Investor Services, LLC (Investor Services) | Transfer agent |
a. Management Fees
The Funds, except the Franklin Federal Limited-Term Tax-Free Income Fund, pay an investment management fee to Advisers based on the month-end net assets of each of the funds as follows:
| | |
| Annualized Fee Rate | | Net Assets |
| 0.625 | % | Up to and including $100 million |
| 0.500 | % | Over $100 million, up to and including $250 million |
| 0.450 | % | Over $250 million, up to and including $7.5 billion |
| 0.440 | % | Over $7.5 billion, up to and including $10 billion |
| 0.430 | % | Over $10 billion, up to and including $12.5 billion |
| 0.420 | % | Over $12.5 billion, up to and including $15 billion |
| 0.400 | % | Over $15 billion, up to and including $17.5 billion |
| 0.380 | % | Over $17.5 billion, up to and including $20 billion |
| 0.360 | % | In excess of $20 billion |
The Franklin Federal Limited-Term Tax-Free Income Fund pays an investment management fee to Advisers based on the average daily net assets of the Fund as follows:
| | |
| Annualized Fee Rate | | Net Assets |
| 0.700 | % | Up to and including $100 million |
| 0.650 | % | Over $100 million, up to and including $250 million |
| 0.625 | % | Over $250 million, up to and including $500 million |
| 0.600 | % | In excess of $500 million |
Effective May 1, 2013, the Franklin Federal Limited-Term Tax-Free Income Fund combined its investment management and administration agreements as approved by the Board. The fees paid under the combined agreement do not exceed the aggregate fees that were paid under the separate agreements.
Prior to May 1, 2013, the Franklin Federal Limited-Term Tax-Free Income Fund paid fees to Advisers based on the average daily net assets of the fund as follows:
| | |
| Annualized Fee Rate | | Net Assets |
| 0.500 | % | Up to and including $100 million |
| 0.450 | % | Over $100 million, up to and including $250 million |
| 0.425 | % | Over $250 million, up to and including $500 million |
| 0.400 | % | In excess of $500 million |
190 | Annual Report
Franklin Tax-Free Trust
Notes to Financial Statements (continued)
| 3. | TRANSACTIONS WITH AFFILIATES (continued) |
| b. | Administrative Fees |
Under an agreement with Advisers, FT Services provides administrative services to the Funds. The fee is paid by Advisers based on the Funds’ average daily net assets, and is not an additional expense of the Funds.
Prior to May 1, 2013, the Franklin Federal Limited-Term Tax-Free Income Fund paid administrative fees to FT Services of 0.20% per year of its average daily net assets.
c. Distribution Fees
The Board has adopted distribution plans for each share class, with the exception of Advisor Class shares, pursuant to Rule 12b-1 under the 1940 Act. Distribution fees are not charged on shares held by affiliates. Under the Funds’ Class A reimbursement distribution plans, the Funds reimburse Distributors for costs incurred in connection with the servicing, sale and distribution of each fund’s shares up to the maximum annual plan rate. Under the Class A reimbursement distribution plans, costs exceeding the maximum for the current plan year cannot be reimbursed in subsequent periods. In addition, under the funds’ Class C compensation distribution plans, the funds pay Distributors for costs incurred in connection with the servicing, sale and distribution of each fund’s shares up to the maximum annual plan rate. The plan year, for purposes of monitoring compliance with the maximum annual plan rates, is February 1 through January 31 for each fund.
The maximum annual plan rates, based on the average daily net assets, for each class, are as follows:
| | | | | | | | |
| | | | Franklin | | Franklin | | | |
| | Franklin | | Federal | | Federal | | Franklin | |
| | Double | | Intermediate- | | Limited-Term | | High Yield | |
| | Tax-Free | | Term Tax-Free | | Tax-Free | | Tax-Free | |
| | Income Fund | | Income Fund | | Income Fund | | Income Fund | |
| Reimbursement Plans: | | | | | | | | |
| Class A | 0.10% | | 0.10% | | 0.15% | | 0.10% | |
| Compensation Plans: | | | | | | | | |
| Class C | 0.65% | | 0.65% | | — | | 0.65% | |
| |
| | Franklin | | Franklin | | Franklin | | | |
| | Insured | | Massachusetts | | New Jersey | | | |
| | Tax-Free | | Tax-Free | | Tax-Free | | | |
| | Income Fund | | Income Fund | | Income Fund | | | |
| Reimbursement Plans: | | | | | | | | |
| Class A | 0.10% | | 0.10% | | 0.10% | | | |
| Compensation Plans: | | | | | | | | |
| Class C | 0.65% | | 0.65% | | 0.65% | | | |
Annual Report | 191
Franklin Tax-Free Trust
Notes to Financial Statements (continued)
| 3. | TRANSACTIONS WITH AFFILIATES (continued) |
| d. | Sales Charges/Underwriting Agreements |
Front-end sales charges and contingent deferred sales charges (CDSC) do not represent expenses of the Funds. These charges are deducted from the proceeds of sales of fund shares prior to investment or from redemption proceeds prior to remittance, as applicable. Distributors has advised the Funds of the following commission transactions related to the sales and redemptions of the Funds’ shares for the year:
| | | | | | | | |
| | | | | Franklin | | Franklin | | |
| | | Franklin | | Federal | | Federal | | Franklin |
| | | Double | | Intermediate- | | Limited-Term | | High Yield |
| | | Tax-Free | | Term Tax-Free | | Tax-Free | | Tax-Free |
| | | Income Fund | | Income Fund | | Income Fund | | Income Fund |
| Sales charges retained net of commissions | | | | | | | | |
| paid to unaffiliated broker/dealers | $ | 377 | $ | 312,065 | $ | 174,623 | $ | 901,367 |
| CDSC retained | $ | 13,741 | $ | 241,669 | $ | 110,446 | $ | 403,098 |
| |
| | | Franklin | | Franklin | | Franklin | | |
| | | Insured | | Massachusetts | | New Jersey | | |
| | | Tax-Free | | Tax-Free | | Tax-Free | | |
| | | Income Fund | | Income Fund | | Income Fund | | |
| Sales charges retained net of commissions | | | | | | | | |
| paid to unaffiliated broker/dealers | $ | 1,749 | $ | 29,940 | $ | 149,799 | | |
| CDSC retained | $ | 154,211 | $ | 23,355 | $ | 111,168 | | |
e. Transfer Agent Fees
Each class of shares pays transfer agent fees to Investor Services for its performance of shareholder servicing obligations and reimburses Investor Services for out of pocket expenses incurred, including shareholding servicing fees paid to third parties. These fees are allocated daily based upon their relative proportion of such classes’ aggregate net assets.
For the year ended February 28, 2014, the Funds paid transfer agent fees as noted in the Statements of Operations of which the following amounts were retained by Investor Services:
| | | | | | |
| | | | Franklin | Franklin | | |
| | | Franklin | Federal | Federal | | Franklin |
| | | Double | Intermediate- | Limited-Term | | High Yield |
| | | Tax-Free | Term Tax-Free | Tax-Free | | Tax-Free |
| | | Income Fund | Income Fund | Income Fund | | Income Fund |
| Transfer agent fees | $ | 128,562 | $696,538 | $116,852 | $ | 1,866,628 |
| |
| | | Franklin | Franklin | Franklin | | |
| | | Insured | Massachusetts | New Jersey | | |
| | | Tax-Free | Tax-Free | Tax-Free | | |
| | | Income Fund | Income Fund | Income Fund | | |
| Transfer agent fees | $ | 453,519 | $ 90,791 | $259,862 | | |
192 | Annual Report
Franklin Tax-Free Trust
Notes to Financial Statements (continued)
3. TRANSACTIONS WITH AFFILIATES (continued) f. Waiver and Expense Reimbursements
FT Services and Advisers have contractually agreed in advance to waive or limit their respective fees and to assume as their own expense certain expenses otherwise payable by the Franklin Limited-Term Tax-Free Income Fund so that the expenses (excluding distribution fees, and acquired fund fees and expenses) for each class of the Fund do not exceed 0.45%, (other than certain non-routine expenses or costs, including those relating to litigation, indemnification, reorganizations, and liquidations) until June 30, 2014.
4. INCOME TAXES
For tax purposes, capital losses may be carried over to offset future capital gains. Capital loss carryforwards with no expiration, if any, must be fully utilized before those losses with expiration dates.
At February 28, 2014, the capital loss carryforwards were as follows:
| | | | | | | | |
| | | | | Franklin | | Franklin | | |
| | | Franklin | | Federal | | Federal | | Franklin |
| | | Double | | Intermediate- | | Limited-Term | | High Yield |
| | | Tax-Free | | Term Tax-Free | | Tax-Free | | Tax-Free |
| | | Income Fund | | Income Fund | | Income Fund | | Income Fund |
| Capital loss carryforwards subject to | | | | | | | | |
| expiration: | | | | | | | | |
| 2015 | $ | 134,018 | $ | 361,303 | $ | 321,499 | $ | — |
| 2016 | | 503,897 | | 1,114,337 | | 17,957 | | 62,972,830 |
| 2017 | | 944,001 | | 6,237,620 | | — | | 15,478,643 |
| 2018 | | 2,690,894 | | 223,211 | | 567 | | 53,451,410 |
| 2019 | | 853,373 | | 1,793,931 | | — | | 583,369 |
| Capital loss carryforwards not subject to | | | | | | | | |
| expiration: | | | | | | | | |
| Short term | | 4,349,879 | | 32,178,741 | | — | | 136,349,814 |
| Long term | | 27,751,205 | | 5,501,359 | | 266,287 | | 257,947,916 |
| Total capital loss carryforwards | $ | 37,227,267 | $ | 47,410,502 | $ | 606,310 | $ | 526,783,982 |
| |
| | | Franklin | | Franklin | | Franklin | | |
| | | Insured | | Massachusetts | | New Jersey | | |
| | | Tax-Free | | Tax-Free | | Tax-Free | | |
| | | Income Fund | | Income Fund | | Income Fund | | |
| Capital loss carryforwards subject to | | | | | | | | |
| expiration: | | | | | | | | |
| 2017 | $ | 36,012 | $ | — | $ | — | | |
| 2018 | | 5,518,185 | | — | | — | | |
| Capital loss carryforwards not subject to | | | | | | | | |
| expiration: | | | | | | | | |
| Short term | | 35,870,393 | | 6,953,892 | | 10,718,530 | | |
| Long term | | 10,847,538 | | 7,927,250 | | 11,439,272 | | |
| Total capital loss carryforwards | $ | 52,272,128 | $ | 14,881,142 | $ | 22,157,802 | | |
Annual Report | 193
Franklin Tax-Free Trust
Notes to Financial Statements (continued)
4. INCOME TAXES (continued)
During the year ended February 28, 2014, the Franklin Federal Limited-Term Tax-Free Income Fund utilized $175,379 of capital loss carryforwards.
On February 28, 2014, the following funds had expired capital loss carryforwards, which were reclassified to paid-in capital.
| | | | | |
| | | Franklin | Franklin | | |
| | Franklin | Federal | Federal | | Franklin |
| | Double | Intermediate- | Limited-Term | | High Yield |
| | Tax-Free | Term Tax-Free | Tax-Free | | Tax-Free |
| | Income Fund | Income Fund | Income Fund | | Income Fund |
| $ | 152,458 | $213,358 | $322,208 | $ | 7,711,279 |
The tax character of distributions paid during the years ended February 28, 2014 and 2013, was as follows:
| | | | | | | | |
| | | | | | | Franklin Federal |
| | | Franklin Double | | Intermediate-Term |
| | | Tax-Free Income Fund | | Tax-Free Income Fund |
| | | 2014 | | 2013 | | 2014 | | 2013 |
| Distributions paid from | | | | | | | | |
| tax exempt income | $ | 24,363,095 | $ | 30,233,935 | $ | 102,617,843 | $ | 91,083,935 |
| |
| Franklin Federal |
|
| | | Limited-Term | | Franklin High Yield |
| | | Tax-Free Income Fund | | Tax-Free Income Fund |
| | | 2014 | | 2013 | | 2014 | | 2013 |
| Distributions paid from | | | | | | | | |
| tax exempt income | $ | 12,869,835 | $ | 13,980,735 | $ | 387,804,603 | $ | 384,001,379 |
| |
| | | Franklin Insured | | Franklin Massachusetts |
| | | Tax-Free Income Fund | | Tax-Free Income Fund |
| | | 2014 | | 2013 | | 2014 | | 2013 |
| Distributions paid from | | | | | | | | |
| tax exempt income | $ | 97,105,192 | $ | 101,901,733 | $ | 18,519,777 | $ | 20,246,564 |
| |
| Franklin New Jersey |
|
| Tax-Free Income Fund |
| | | 2014 | | 2013 | | | | |
| Distributions paid from | | | | | | | | |
| tax exempt income | $ | 53,286,248 | $ | 58,792,255 | | | | |
194 | Annual Report
Franklin Tax-Free Trust
Notes to Financial Statements (continued)
4. INCOME TAXES (continued)
At February 28, 2014, the cost of investments, net unrealized appreciation (depreciation), undistributed tax exempt and ordinary income for income tax purposes were as follows:
| | | | | | | | | | | | |
| | | | | | Franklin | | | Franklin | | | | |
| | | Franklin | | | Federal | | | Federal | | | Franklin | |
| | | Double | | | Intermediate- | | | Limited-Term | | | High Yield | |
| | | Tax-Free | | | Term Tax-Free | | | Tax-Free | | | Tax-Free | |
| | | Income Fund | | | Income Fund | | | Income Fund | | | Income Fund | |
| Cost of investments | $ | 390,760,473 | | $ | 3,544,812,199 | | $ | 1,128,202,207 | | $ | 7,286,898,696 | |
| |
| Unrealized appreciation | $ | 6,133,639 | | $ | 215,775,046 | | $ | 21,501,764 | | $ | 604,409,657 | |
| Unrealized depreciation | | (72,369,271 | ) | | (26,264,408 | ) | | (1,874,442 | ) | | (265,550,135 | ) |
| Net unrealized appreciation | | | | | | | | | | | | |
| (depreciation) | $ | (66,235,632 | ) | $ | 189,510,638 | | $ | 19,627,322 | | $ | 338,859,522 | |
| |
| Undistributed tax exempt | | | | | | | | | | | | |
| income | $ | 1,456,808 | | $ | 2,714,135 | | $ | 441,681 | | $ | 20,841,791 | |
| Undistributed ordinary | | | | | | | | | | | | |
| income | | — | | | — | | | — | | | 1,672,120 | |
| Distributable earnings | $ | 1,456,808 | | $ | 2,714,135 | | $ | 441,681 | | $ | 22,513,911 | |
| |
| | | Franklin | | | Franklin | | | Franklin | | | | |
| | | Insured | | | Massachusetts | | | New Jersey | | | | |
| | | Tax-Free | | | Tax-Free | | | Tax-Free | | | | |
| | | Income Fund | | | Income Fund | | | Income Fund | | | | |
| Cost of investments | $ | 2,154,273,705 | | $ | 468,520,535 | | $ | 1,247,319,588 | | | | |
| |
| Unrealized appreciation | $ | 91,670,111 | | $ | 15,920,393 | | $ | 51,503,925 | | | | |
| Unrealized depreciation | | (22,105,847 | ) | | (7,762,423 | ) | | (42,059,543 | ) | | | |
| Net unrealized appreciation | | | | | | | | | | | | |
| (depreciation) | $ | 69,564,264 | | $ | 8,157,970 | | $ | 9,444,382 | | | | |
| |
| Distributable earnings – | | | | | | | | | | | | |
| undistributed tax exempt | | | | | | | | | | | | |
| income | $ | 5,284,565 | | $ | 914,731 | | $ | 3,379,444 | | | | |
Differences between income and/or capital gains as determined on a book basis and a tax basis are primarily due to differing treatments of bond discounts and wash sales.
Annual Report | 195
Franklin Tax-Free Trust
Notes to Financial Statements (continued)
5. INVESTMENT TRANSACTIONS
Purchases and sales of investments (excluding short term securities) for the year ended February 28, 2014, were as follows:
| | | | | | | | |
| | | | | Franklin | | Franklin | | |
| | | Franklin | | Federal | | Federal | | Franklin |
| | | Double | | Intermediate- | | Limited-Term | | High Yield |
| | | Tax-Free | | Term Tax-Free | | Tax-Free | | Tax-Free |
| | | Income Fund | | Income Fund | | Income Fund | | Income Fund |
| Purchases | $ | 50,273,469 | $ | 447,823,945 | $ | 414,923,139 | $ | 1,478,389,375 |
| Sales | $ | 294,816,796 | $ | 326,481,836 | $ | 170,405,897 | $ | 2,976,439,505 |
| |
| | | Franklin | | Franklin | | Franklin | | |
| | | Insured | | Massachusetts | | New Jersey | | |
| | | Tax-Free | | Tax-Free | | Tax-Free | | |
| | | Income Fund | | Income Fund | | Income Fund | | |
| Purchases | $ | 40,848,957 | $ | 38,166,101 | $ | 138,934,287 | | |
| Sales | $ | 605,605,900 | $ | 137,006,632 | $ | 392,289,786 | | |
6. CREDIT RISK AND DEFAULTED SECURITIES
At February 28, 2014, the Franklin Double Tax-Free Income Fund and the Franklin High Yield Tax-Free Income Fund had 39.2% and 19.40%, respectively, of their portfolios invested in high yield or other securities rated below investment grade. These securities may be more sensitive to economic conditions causing greater price volatility and are potentially subject to a greater risk of loss due to default than higher rated securities.
The Franklin High Yield Tax-Free Income Fund held defaulted securities and/or other securities for which the income has been deemed uncollectible. At February 28, 2014, the aggregate value of these securities was $13,451,820, representing 0.17% of the Fund’s net assets. The Fund discontinues accruing income on securities for which income has been deemed uncollectible and provides an estimate for losses on interest receivable. The securities have been identified on the accompanying Statement of Investments.
7. CONCENTRATION OF RISK
The Franklin Double Tax-Free Income Fund, Franklin Massachusetts Tax-Free Income Fund and Franklin New Jersey Tax-Free Income Fund invest a large percentage of its total assets in obligations of issuers within their respective state and U.S. territories. Such concentration may subject the funds to risks associated with industrial or regional matters, and economic, political or legal developments occurring within those states and U.S. territories. In addition, investments in these securities are sensitive to interest rate changes and credit risk of the issuer and may subject the funds to increased market volatility. The market for these investments may be limited, which may make them difficult to buy or sell.
196 | Annual Report
Franklin Tax-Free Trust
Notes to Financial Statements (continued)
8. CREDIT FACILITY
The Funds, together with other U.S. registered and foreign investment funds (collectively, Borrowers), managed by Franklin Templeton Investments, are borrowers in a joint syndicated senior unsecured credit facility totaling $1.5 billion (Global Credit Facility) which, matures on February 13, 2015. This Global Credit Facility provides a source of funds to the Borrowers for temporary and emergency purposes, including the ability to meet future unanticipated or unusually large redemption requests.
Under the terms of the Global Credit Facility, the Funds shall, in addition to interest charged on any borrowings made by the Funds and other costs incurred by the Funds, pay their share of fees and expenses incurred in connection with the implementation and maintenance of the Global Credit Facility, based upon their relative share of the aggregate net assets of all of the Borrowers, including an annual commitment fee of 0.07% based upon the unused portion of the Global Credit Facility. These fees are reflected in other expenses on the Statements of Operations. During the year ended February 28, 2014, the Funds did not use the Global Credit Facility.
9. FAIR VALUE MEASUREMENTS
The Funds follow a fair value hierarchy that distinguishes between market data obtained from independent sources (observable inputs) and the Funds’ own market assumptions (unobservable inputs). These inputs are used in determining the value of the Funds’ financial instruments and are summarized in the following fair value hierarchy:
- Level 1 – quoted prices in active markets for identical financial instruments
- Level 2 – other significant observable inputs (including quoted prices for similar financial instruments, interest rates, prepayment speed, credit risk, etc.)
- Level 3 – significant unobservable inputs (including the Funds’ own assumptions in determining the fair value of financial instruments)
The input levels are not necessarily an indication of the risk or liquidity associated with financial instruments at that level.
For movements between the levels within the fair value hierarchy, the Funds have adopted a policy of recognizing the transfers as of the date of the underlying event which caused the movement.
Annual Report | 197
Franklin Tax-Free Trust
Notes to Financial Statements (continued)
9. FAIR VALUE MEASUREMENTS (continued)
A summary of inputs used as of February 28, 2014, in valuing the Funds’ assets carried at fair value, is as follows:
| | | | | | | | |
| | | Level 1 | | Level 2 | | Level 3 | | Total |
| Franklin Double Tax-Free Income Fund | | | | | | | | |
| Assets: | | | | | | | | |
| Investments in Securities: | | | | | | | | |
| Municipal Bonds | $ | — | $ | 324,524,841 | $ | — | $ | 324,524,841 |
| Franklin Federal Intermediate-Term | | | | | | | | |
| Tax-Free Income Fund | | | | | | | | |
| Assets: | | | | | | | | |
| Investments in Securities: | | | | | | | | |
| Municipal Bonds | $ | — | $ | 3,528,272,837 | $ | — | $ | 3,528,272,837 |
| Short Term Investments | | — | | 206,050,000 | | — | | 206,050,000 |
| Total Investments in Securities | $ | — | $ | 3,734,322,837 | $ | — | $ | 3,734,322,837 |
| Franklin Federal Limited-Term Tax-Free | | | | | | | | |
| Income Fund | | | | | | | | |
| Assets: | | | | | | | | |
| Investments in Securities: | | | | | | | | |
| Municipal Bonds | $ | — | $ | 959,998,299 | $ | — | $ | 959,998,299 |
| Short Term Investments | | — | | 187,831,230 | | — | | 187,831,230 |
| Total Investments in Securities | $ | — | $ | 1,147,829,529 | $ | — | $ | 1,147,829,529 |
| Franklin High Yield Tax-Free Income Fund | | | | | | | | |
| Assets: | | | | | | | | |
| Investments in Securities: | | | | | | | | |
| Municipal Bonds | $ | — | $ | 7,559,994,608 | $ | 8,038,610 | $ | 7,568,033,218 |
| Short Term Investments | | — | | 57,725,000 | | — | | 57,725,000 |
| Total Investments in Securities | $ | — | $ | 7,617,719,608 | $ | 8,038,610 | $ | 7,625,758,218 |
| Franklin Insured Tax-Free Income Fund | | | | | | | | |
| Assets: | | | | | | | | |
| Investments in Securities: | | | | | | | | |
| Municipal Bonds | $ | — | $ | 2,223,837,969 | $ | — | $ | 2,223,837,969 |
| Franklin Massachusetts Tax-Free Income | | | | | | | | |
| Fund | | | | | | | | |
| Assets: | | | | | | | | |
| Investments in Securities: | | | | | | | | |
| Municipal Bonds | $ | — | $ | 476,678,505 | $ | — | $ | 476,678,505 |
| Franklin New Jersey Tax-Free Income Fund | | | | | | | | |
| Assets: | | | | | | | | |
| Investments in Securities: | | | | | | | | |
| Municipal Bonds | $ | — | $ | 1,256,763,970 | $ | — | $ | 1,256,763,970 |
198 | Annual Report
Franklin Tax-Free Trust
Notes to Financial Statements (continued)
| 9. | FAIR VALUE MEASUREMENTS (continued) |
| A | reconciliation of assets in which Level 3 inputs are used in determining fair value is presented |
when there are significant Level 3 investments at the end of the year.
10. NEW ACCOUNTING PRONOUNCEMENTS
In June 2013, the Financial Accounting Standards Board issued Accounting Standards Update (ASU) No. 2013-08, Investment Companies (Topic 946): Amendments to the Scope, Measurement, and Disclosure Requirements. The ASU modifies the criteria used in defining an investment company under U.S. Generally Accepted Accounting Principles and also sets forth certain measurement and disclosure requirements. Under the ASU, an entity that is registered under the 1940 Act automatically qualifies as an investment company. The ASU is effective for interim and annual reporting periods beginning after December 15, 2013. Management has reviewed the requirements and believes the adoption of this ASU will not have a material impact on the financial statements.
11. SUBSEQUENT EVENTS
The Funds have evaluated subsequent events through the issuance of the financial statements and determined that no events have occurred that require disclosure.
Annual Report | 199
Franklin Tax-Free Trust
Notes to Financial Statements (continued)
| | | |
| ABBREVIATIONS | | |
| |
| |
| Selected Portfolio | | |
| |
| 1915 Act | - Improvement Bond Act of 1915 | ID | - Improvement District |
| ABAG | - The Association of Bay Area Governments | IDA | -IndustrialDevelopment Authority/Agency |
| ACA | - American Capital Access Holdings Inc. | IDAR | -IndustrialDevelopment Authority Revenue |
| AD | - Assessment District | IDB | -IndustrialDevelopment Bond/Board |
| AGMC | - Assured Guaranty Municipal Corp. | IDBR | -IndustrialDevelopment Board Revenue |
| AMBAC | - American Municipal Bond Assurance Corp. | IDR | -IndustrialDevelopment Revenue |
| BAN | -BondAnticipation Note | ISD | -IndependentSchool District |
| BHAC | - Berkshire Hathaway Assurance Corp. | MAC | -MunicipalAssistance Corp. |
| CDA | - Community Development Authority/Agency | MFHR | -Multi-FamilyHousing Revenue |
| CDD | - Community Development District | MFMR | -Multi-FamilyMortgage Revenue |
| CDR | - Community Development Revenue | MFR | -Multi-FamilyRevenue |
| CFD | - Community Facilities District | MTA | - Metropolitan Transit Authority |
| CIFG | - CDC IXIS Financial Guaranty | NATL | - National Public Financial Guarantee Corp. |
| COP | - Certificate of Participation | NATL RE | - National Public Financial Guarantee Corp. Reinsured |
| EDA | - Economic Development Authority | PBA | -PublicBuilding Authority |
| EDC | - Economic Development Corp. | PCC | - Pollution Control Corp. |
| EDR | - Economic Development Revenue | PCFA | - Pollution Control Financing Authority |
| ETM | - Escrow to Maturity | PCR | - Pollution Control Revenue |
| FGIC | -FinancialGuaranty Insurance Co. | PFA | -PublicFinancing Authority |
| FHLMC | - Federal Home Loan Mortgage Corp. | PFAR | -PublicFinancing Authority Revenue |
| FICO | -FinancingCorp. | PSF | - Permanent School Fund |
| FNMA | - Federal National Mortgage Association | PUD | -PublicUtility District |
| FRN | - Floating Rate Note | RDA | - Redevelopment Agency/Authority |
| GARB | -GeneralAirport Revenue Bonds | SF | -SingleFamily |
| GO | -GeneralObligation | SFHR | -SingleFamily Housing Revenue |
| HDA | -HousingDevelopment Authority/Agency | SFMR | -SingleFamily Mortgage Revenue |
| HFA | -HousingFinance Authority/Agency | UHSD | -Unified/UnionHigh School District |
| HFAR | -HousingFinance Authority Revenue | USD | -Unified/UnionSchool District |
| | | XLCA | - XL Capital Assurance |
200 | Annual Report
Franklin Tax-Free Trust
Report of Independent Registered Public Accounting Firm
To the Board of Trustees and Shareholders of Franklin Tax-Free Trust
In our opinion, the accompanying statements of assets and liabilities, including the statements of investments, and the related statements of operations and of changes in net assets and the financial highlights present fairly, in all material respects, the financial position of Franklin Double Tax-Free Income Fund, Franklin Federal Intermediate-Term Tax-Free Income Fund, Franklin Federal Limited-Term Tax-Free Income Fund, Franklin High Yield Tax-Free Income Fund, Franklin Insured Tax-Free Income Fund, Franklin Massachusetts Tax-Free Income Fund and Franklin New Jersey Tax-Free Income Fund (separate portfolios of Franklin Tax-Free Trust, hereafter referred to as the “Funds”) at February 28, 2014, the results of each of their operations for the year then ended, the changes in each of their net assets for each of the two years in the period then ended and the financial highlights for each of the periods presented, in conformity with accounting principles generally accepted in the United States of America. These financial statements and financial highlights (hereafter referred to as “financial statements”) are the responsibility of the Funds’ management. Our responsibility is to express an opinion on these financial statements based on our audits. We conducted our audits of these financial statements in accordance with the standards of the Public Company Accounting Oversight Board (United States). Those standards require that we plan and perform the audit to obtain reasonable assurance about whether the financial statements are free of material misstatement. An audit includes examining, on a test basis, evidence supporting the amounts and disclosures in the financial statements, assessing the accounting principles used and significant estimates made by management, and evaluating the overall financial statement presentation. We believe that our audits, which included confirmation of securities at February 28, 2014 by correspondence with the custodian and brokers, provide a reasonable basis for our opinion.
PricewaterhouseCoopers LLP
San Francisco, California
April 17, 2014
Annual Report | 201
Franklin Tax-Free Trust
Tax Information (unaudited)
Under Section 852(b)(5)(A) of the Internal Revenue Code (Code), the Funds hereby report 100% of the distributions paid from net investment income as exempt-interest dividends for the fiscal year ended February 28, 2014. A portion of the Funds’ exempt-interest dividends may be subject to the federal alternative minimum tax. By mid-February 2015, shareholders will be notified of amounts for use in preparing their 2014 income tax returns.
202 | Annual Report
Franklin Tax-Free Trust
Board Members and Officers
The name, year of birth and address of the officers and board members, as well as their affiliations, positions held with the Fund, principal occupations during at least the past five years and number of portfolios overseen in the Franklin Templeton Investments fund complex are shown below. Generally, each board member serves until that person’s successor is elected and qualified.
| | | | |
| Independent Board Members | | | |
| |
| | | | Number of Portfolios in | |
| Name, Year of Birth | | Length of | Fund Complex Overseen | Other Directorships Held |
| and Address | Position | Time Served | by Board Member* | During at Least the Past 5 Years |
| Harris J. Ashton (1932) | Trustee | Since 1984 | 140 | Bar-S Foods (meat packing company) |
| One Franklin Parkway | | | | (1981-2010). |
| San Mateo, CA 94403-1906 | | | | |
Principal Occupation During at Least the Past 5 Years:
Director of various companies; and formerly, Director, RBC Holdings, Inc. (bank holding company) (until 2002); and President, Chief Executive Officer and Chairman of the Board, General Host Corporation (nursery and craft centers) (until 1998).
| | | | |
| Sam Ginn (1937) | Trustee | Since 2007 | 113 | ICO Global Communications |
| One Franklin Parkway | | | | (Holdings) Limited (satellite company) |
| San Mateo, CA 94403-1906 | | | | (2006-2010), Chevron Corporation |
| | | | | (global energy company) (1989-2009), |
| | | | | Hewlett-Packard Company (technology |
| | | | | company) (1996-2002), Safeway, Inc. |
| | | | | (grocery retailer) (1991-1998) and |
| | | | | TransAmerica Corporation (insurance |
| | | | | company) (1989-1999). |
Principal Occupation During at Least the Past 5 Years:
Private investor; Chairman, First Responder Network Authority (FirstNet) (interoperable wireless broadband network) (2012); and formerly, Chairman of the Board, Vodafone AirTouch, PLC (wireless company) (1999-2000); Chairman of the Board and Chief Executive Officer, AirTouch Communications (cellular communications) (1993-1998) and Pacific Telesis Group (telephone holding company) (1988-1994).
| | | | |
| Edith E. Holiday (1952) | Trustee | Since 1998 | 140 | Hess Corporation (exploration and |
| One Franklin Parkway | | | | refining of oil and gas), H.J. Heinz |
| San Mateo, CA 94403-1906 | | | | Company (processed foods and |
| | | | | allied products) (1994-2013), RTI |
| | | | | International Metals, Inc. (manu- |
| | | | | facture and distribution of titanium), |
| | | | | Canadian National Railway (railroad) |
| | | | | and White Mountains Insurance |
| | | | | Group, Ltd. (holding company). |
Principal Occupation During at Least the Past 5 Years:
Director or Trustee of various companies and trusts; and formerly, Assistant to the President of the United States and Secretary of the Cabinet (1990-1993); General Counsel to the United States Treasury Department (1989-1990); and Counselor to the Secretary and Assistant Secretary for Public Affairs and Public Liaison – United States Treasury Department (1988-1989).
| | | | |
| J. Michael Luttig (1954) | Trustee | Since 2009 | 140 | Boeing Capital Corporation (aircraft |
| One Franklin Parkway | | | | financing) (2006-2013). |
| San Mateo, CA 94403-1906 | | | | |
Principal Occupation During at Least the Past 5 Years:
Executive Vice President, General Counsel and member of Executive Council, The Boeing Company (aerospace company); and formerly, Federal Appeals Court Judge, U.S. Court of Appeals for the Fourth Circuit (1991-2006).
Annual Report | 203
| | | | |
| | | | Number of Portfolios in | |
| Name, Year of Birth | | Length of | Fund Complex Overseen | Other Directorships Held |
| and Address | Position | Time Served | by Board Member* | During at Least the Past 5 Years |
| Frank A. Olson (1932) | Trustee | Since 2005 | 140 | Hess Corporation (exploration and |
| One Franklin Parkway | | | | refining of oil and gas) (1998-2013). |
| San Mateo, CA 94403-1906 | | | | |
Principal Occupation During at Least the Past 5 Years:
Chairman Emeritus, The Hertz Corporation (car rental) (since 2000) (Chairman of the Board (1980-2000) and Chief Executive Officer (1977-1999)); and formerly, Chairman of the Board, President and Chief Executive Officer, UAL Corporation (airlines) (until 1987).
| | | | |
| Larry D. Thompson (1945) | Trustee | Since 2007 | 140 | Cbeyond, Inc. (business commu- |
| One Franklin Parkway | | | | nications provider) (2010-2012), The |
| San Mateo, CA 94403-1906 | | | | Southern Company (energy company) |
| | | | | (2010-2012) and Graham Holdings |
| | | | | Company (formerly, The Washington |
| | | | | Post Company) (education and media |
| | | | | organization). |
Principal Occupation During at Least the Past 5 Years:
Executive Vice President – Government Affairs, General Counsel and Corporate Secretary, PepsiCo, Inc. (consumer products) (July 2012); and formerly, John A. Sibley Professor of Corporate and Business Law, University of Georgia School of Law (2011-2012); Senior Vice President – Government Affairs, General Counsel and Secretary, PepsiCo, Inc. (2004-2011); Senior Fellow of The Brookings Institution (2003-2004); Visiting Professor, University of Georgia School of Law (2004); and Deputy Attorney General, U.S. Department of Justice (2001-2003).
| | | | |
| John B. Wilson (1959) | Lead | Trustee since | 113 | None |
| One Franklin Parkway | Independent | 2007 and Lead | | |
| San Mateo, CA 94403-1906 | Trustee | Independent | | |
| | | Trustee since | | |
| 2008 |
Principal Occupation During at Least the Past 5 Years:
President, Staples Europe (office supplies) (2012); President and Founder, Hyannis Port Capital, Inc. (real estate and private equity investing); serves on private and non-profit boards; and formerly, Chief Operating Officer and Executive Vice President, Gap, Inc. (retail) (1996-2000); Chief Financial Officer and Executive Vice President – Finance and Strategy, Staples, Inc. (1992-1996); Senior Vice President – Corporate Planning, Northwest Airlines, Inc. (airlines) (1990-1992); and Vice President and Partner, Bain & Company (consulting firm) (1986-1990).
| | | | |
| Interested Board Members and Officers | | |
| |
| | | | Number of Portfolios in | |
| Name, Year of Birth | | Length of | Fund Complex Overseen | Other Directorships Held |
| and Address | Position | Time Served | by Board Member* | During at Least the Past 5 Years |
| **Gregory E. Johnson (1961) | Trustee | Since 2007 | 150 | None |
| One Franklin Parkway | | | | |
| San Mateo, CA 94403-1906 | | | | |
Principal Occupation During at Least the Past 5 Years:
Chairman of the Board, Member – Office of the Chairman, Director, President and Chief Executive Officer, Franklin Resources, Inc.; officer and/or director or trustee, as the case may be, of some of the other subsidiaries of Franklin Resources, Inc. and of 44 of the investment companies in Franklin Templeton Investments; and Chairman, Investment Company Institute.
204 | Annual Report
| | | | |
| | | | Number of Portfolios in | |
| Name, Year of Birth | | Length of | Fund Complex Overseen | Other Directorships Held |
| and Address | Position | Time Served | by Board Member* | During at Least the Past 5 Years |
| **Rupert H. Johnson, Jr. (1940) | Chairman of | Chairman of the | 140 | None |
| One Franklin Parkway | the Board and | Board and Trustee | | |
| San Mateo, CA 94403-1906 | Trustee | since June 2013 | | |
Principal Occupation During at Least the Past 5 Years:
Vice Chairman, Member – Office of the Chairman and Director, Franklin Resources, Inc.; Director, Franklin Advisers, Inc.; Senior Vice President, Franklin Advisory Services, LLC; and officer and/or director or trustee, as the case may be, of some of the other subsidiaries of Franklin Resources, Inc. and of 41 of the investment companies in Franklin Templeton Investments.
| | | | |
| Sheila Amoroso (1959) | Vice President | Since 1999 | Not Applicable | Not Applicable |
| One Franklin Parkway | | | | |
| San Mateo, CA 94403-1906 | | | | |
Principal Occupation During at Least the Past 5 Years:
Senior Vice President, Franklin Advisers, Inc.; and officer of seven of the investment companies in Franklin Templeton Investments.
| | | | |
| Alison E. Baur (1964) | Vice President | Since 2012 | Not Applicable | Not Applicable |
| One Franklin Parkway | | | | |
| San Mateo, CA 94403-1906 | | | | |
Principal Occupation During at Least the Past 5 Years:
Deputy General Counsel, Franklin Templeton Investments; and officer of some of the other subsidiaries of Franklin Resources, Inc. and of 46 of the investment companies in Franklin Templeton Investments.
| | | | |
| Rafael R. Costas, Jr. (1965) | Vice President | Since 1999 | Not Applicable | Not Applicable |
| One Franklin Parkway | | | | |
| San Mateo, CA 94403-1906 | | | | |
Principal Occupation During at Least the Past 5 Years:
Senior Vice President, Franklin Advisers, Inc.; and officer of seven of the investment companies in Franklin Templeton Investments.
| | | | |
| Laura F. Fergerson (1962) | Chief | Since 2009 | Not Applicable | Not Applicable |
| One Franklin Parkway | Executive | | | |
| San Mateo, CA 94403-1906 | Officer – | | | |
| | Finance and | | | |
| | Administration | | | |
Principal Occupation During at Least the Past 5 Years:
Senior Vice President, Franklin Templeton Services, LLC; and officer of 46 of the investment companies in Franklin Templeton Investments.
| | | | |
| Gaston Gardey (1967) | Treasurer, | Since 2009 | Not Applicable | Not Applicable |
| One Franklin Parkway | Chief Financial | | | |
| San Mateo, CA 94403-1906 | Officer and | | | |
| | Chief | | | |
| | Accounting | | | |
| | Officer | | | |
Principal Occupation During at Least the Past 5 Years:
Director, Fund Accounting, Franklin Templeton Investments; and officer of 27 of the investment companies in Franklin Templeton Investments.
Annual Report | 205
| | | | |
| | | | Number of Portfolios in | |
| Name, Year of Birth | | Length of | Fund Complex Overseen | Other Directorships Held |
| and Address | Position | Time Served | by Board Member* | During at Least the Past 5 Years |
| Aliya S. Gordon (1973) | Vice President | Since 2009 | Not Applicable | Not Applicable |
| One Franklin Parkway | | | | |
| San Mateo, CA 94403-1906 | | | | |
Principal Occupation During at Least the Past 5 Years:
Senior Associate General Counsel, Franklin Templeton Investments; officer of 46 of the investment companies in Franklin Templeton Investments; and formerly, Litigation Associate, Steefel, Levitt & Weiss, LLP (2000-2004).
| | | | |
| Steven J. Gray (1955) | Vice President | Since 2009 | Not Applicable | Not Applicable |
| One Franklin Parkway | | | | |
| San Mateo, CA 94403-1906 | | | | |
Principal Occupation During at Least the Past 5 Years:
Senior Associate General Counsel, Franklin Templeton Investments; Vice President, Franklin Templeton Distributors, Inc. and Franklin Alternative Strategies Advisers, LLC; and officer of 46 of the investment companies in Franklin Templeton Investments.
| | | | |
| Selena L. Holmes (1965) | Vice President | Since 2012 | Not Applicable | Not Applicable |
| 100 Fountain Parkway | – AML | | | |
| St. Petersburg, FL 33716-1205 | Compliance | | | |
Principal Occupation During at Least the Past 5 Years:
Director, Global Compliance Monitoring; Deputy Chief Compliance Officer, Franklin Alternative Strategies Advisers, LLC; and officer of 46 of the investment companies in Franklin Templeton Investments.
| | | | |
| Christopher J. Molumphy (1962) | President and | Since 2010 | Not Applicable | Not Applicable |
| One Franklin Parkway | Chief | | | |
| San Mateo, CA 94403-1906 | Executive | | | |
| | Officer – | | | |
| | Investment | | | |
| | Management | | | |
Principal Occupation During at Least the Past 5 Years:
Director and Executive Vice President, Franklin Advisers, Inc.; Executive Vice President, Franklin Templeton Institutional, LLC; and officer of some of the other subsidiaries of Franklin Resources, Inc. and of 22 of the investment companies in Franklin Templeton Investments.
| | | | |
| Kimberly H. Novotny (1972) | Vice President | Since 2013 | Not Applicable | Not Applicable |
| 300 S.E. 2nd Street | | | | |
| Fort Lauderdale, FL 33301-1923 | | | | |
Principal Occupation During at Least the Past 5 Years:
Associate General Counsel, Franklin Templeton Investments; Vice President and Secretary, Fiduciary Trust International of the South; Vice President, Templeton Investment Counsel, LLC; Assistant Secretary, Franklin Resources, Inc.; and officer of 46 of the investment companies in Franklin Templeton Investments.
| | | | |
| Robert C. Rosselot (1960) | Chief | Since 2013 | Not Applicable | Not Applicable |
| 300 S.E. 2nd Street | Compliance | | | |
| Fort Lauderdale, FL 33301-1923 | Officer | | | |
Principal Occupation During at Least the Past 5 Years:
Director, Global Compliance, Franklin Templeton Investments; Vice President, Franklin Templeton Companies, LLC; officer of 46 of the investment companies in Franklin Templeton Investments; and formerly, Senior Associate General Counsel, Franklin Templeton Investments (2007-2013); and Secretary and Vice President, Templeton Group of Funds (2004-2013).
206 | Annual Report
| | | | |
| | | | Number of Portfolios in | |
| Name, Year of Birth | | Length of | Fund Complex Overseen | Other Directorships Held |
| and Address | Position | Time Served | by Board Member* | During at Least the Past 5 Years |
| Karen L. Skidmore (1952) | Vice President | Since 2006 | Not Applicable | Not Applicable |
| One Franklin Parkway | and Secretary | | | |
| San Mateo, CA 94403-1906 | | | | |
Principal Occupation During at Least the Past 5 Years:
Senior Associate General Counsel, Franklin Templeton Investments; and officer of 46 of the investment companies in Franklin Templeton Investments.
| | | | |
| Craig S. Tyle (1960) | Vice President | Since 2005 | Not Applicable | Not Applicable |
| One Franklin Parkway | | | | |
| San Mateo, CA 94403-1906 | | | | |
Principal Occupation During at Least the Past 5 Years:
General Counsel and Executive Vice President, Franklin Resources, Inc.; and officer of some of the other subsidiaries of Franklin Resources, Inc. and of 46 of the investment companies in Franklin Templeton Investments.
| | | | |
| Thomas Walsh (1961) | Vice President | Since 1999 | Not Applicable | Not Applicable |
| One Franklin Parkway | | | | |
| San Mateo, CA 94403-1906 | | | | |
Principal Occupation During at Least the Past 5 Years:
Senior Vice President, Franklin Advisers, Inc.; and officer of seven of the investment companies in Franklin Templeton Investments.
| | | | |
| Lori A. Weber (1964) | Vice President | Since 2011 | Not Applicable | Not Applicable |
| 300 S.E. 2nd Street | | | | |
| Fort Lauderdale, FL 33301-1923 | | | | |
Principal Occupation During at Least the Past 5 Years:
Senior Associate General Counsel, Franklin Templeton Investments; Assistant Secretary, Franklin Resources, Inc.; Vice President and Secretary, Templeton Investment Counsel, LLC; Vice President, Fiduciary Trust International of the South; and officer of 46 of the investment companies in Franklin Templeton Investments.
*We base the number of portfolios on each separate series of the U.S. registered investment companies within the Franklin Templeton Investments fund complex. These portfolios have a common investment manager or affiliated investment managers.
**Gregory E. Johnson is considered to be an interested person of the Fund under the federal securities laws due to his position as an officer and director of Franklin Resources, Inc. (Resources), which is the parent company of the Fund’s investment manager and distributor. Rupert H. Johnson, Jr. is considered to be an interested person of the Fund under the federal securities laws due to his position as officer and director and major shareholder of Resources.
Note 1: Rupert H. Johnson, Jr. is the uncle of Gregory E. Johnson.
Note 2: Officer information is current as of the date of this report. It is possible that after this date, information about officers may change. Note 3: Effective June 13, 2013, Charles B. Johnson ceased to be a trustee of the Fund.
The Sarbanes-Oxley Act of 2002 and Rules adopted by the Securities and Exchange Commission require the Fund to disclose whether the Fund’s Audit Committee includes at least one member who is an audit committee financial expert within the meaning of such Act and Rules. The Fund’s Board has determined that there is at least one such financial expert on the Audit Committee and has designated John B. Wilson as its audit committee financial expert. The Board believes that Mr. Wilson qualifies as such an expert in view of his extensive business background and experience, including service as chief financial officer of Staples, Inc. from 1992 to 1996. Mr. Wilson has been a Member and Chairman of the Fund’s Audit Committee since 2007. As a result of such background and experience, the Board believes that Mr. Wilson has acquired an understanding of generally accepted accounting principles and financial statements, the general application of such principles in connection with the accounting estimates, accruals and reserves, and analyzing and evaluating financial statements that present a breadth and level of complexity of accounting issues generally comparable to those of the Fund, as well as an understanding of internal controls and procedures for financial reporting and an understanding of audit committee functions. Mr. Wilson is an independent Board member as that term is defined under the relevant Securities and Exchange Commission Rules and Releases.
The Statement of Additional Information (SAI) includes additional information about the board members and is available, without charge, upon request. Shareholders may call (800) DIAL BEN/342-5236 to request the SAI.
Annual Report | 207
Franklin Tax-Free Trust
Shareholder Information
Board Review of Investment Management Agreement
At a meeting held February 25, 2014, the Board of Trustees (Board), including a majority of non-interested or independent Trustees, approved renewal of the investment management agreement for each of the separate tax-exempt funds within the Trust (Fund(s)). In reaching this decision, the Board took into account information furnished throughout the year at regular Board meetings, as well as information prepared specifically in connection with the annual renewal review process. Information furnished and discussed throughout the year included investment performance reports and related financial information for each Fund, along with periodic reports on expenses, shareholder services, legal and compliance matters, pricing, and other services provided by the Investment Manager (Manager) and its affiliates. Information furnished specifically in connection with the renewal process included a report for each Fund prepared by Lipper, Inc. (Lipper), an independent organization, as well as additional material, including a Fund profitability analysis prepared by management. The Lipper reports compared each Fund’s investment performance and expenses with those of other mutual funds deemed comparable to the Fund as selected by Lipper. The Fund profitability analysis discussed the profitability to Franklin Templeton Investments from its overall U.S. fund operations, as well as on an individual fund-by-fund basis. Additional material accompanying such profitability analysis included information on a fund-by-fund basis listing portfolio managers and other accounts they manage, as well as information on management fees charged by the Manager and its affiliates to U.S. mutual funds and other accounts, including management’s explanation of differences where relevant. Such material also included a memorandum prepared by management describing project initiatives and capital investments relating to the services provided to the Funds by the Franklin Templeton Investments organization, as well as a memorandum relating to economies of scale and an analysis concerning transfer agent fees charged by an affiliate of the Manager.
In considering such materials, the independent Trustees received assistance and advice from and met separately with independent counsel. While the investment management agreements for all Funds were considered at the same Board meeting, the Board dealt with each Fund separately. In approving continuance of the investment management agreement for each Fund, the Board, including a majority of independent Trustees, determined that the existing management fee structure was fair and reasonable and that continuance of the investment management agreement was in the best interests of each Fund and its shareholders. While attention was given to all information furnished, the following discusses some primary factors relevant to the Board’s decision.
NATURE, EXTENT AND QUALITY OF SERVICES. The Board was satisfied with the nature and quality of the overall services provided by the Manager and its affiliates to the Funds and their shareholders. In addition to investment performance and expenses discussed later, the Board’s opinion was based, in part, upon periodic reports furnished it showing that the investment policies and restrictions for each Fund were consistently complied with as well as other reports periodically furnished the Board covering matters such as the compliance of portfolio managers and other
208 | Annual Report
Franklin Tax-Free Trust
Shareholder Information (continued)
Board Review of Investment Management Agreement (continued)
management personnel with the code of ethics adopted throughout the Franklin Templeton fund complex, the adherence to fair value pricing procedures established by the Board, and the accuracy of net asset value calculations. The Board also noted the extent of benefits provided Fund shareholders from being part of the Franklin Templeton family of funds, including the right to exchange investments between the same class of funds without a sales charge, the ability to reinvest Fund dividends into other funds and the right to combine holdings in other funds to obtain a reduced sales charge. Favorable consideration was given to management’s continuous efforts and expenditures in establishing back-up systems and recovery procedures to function in the event of a natural disaster, it being noted that such systems and procedures had functioned well during the Florida hurricanes and blackouts experienced in previous years and that those operations in the New York/New Jersey area ran smoothly during the period of the 2012 Hurricane Sandy. Consideration was also given to the experience of each Fund’s portfolio management team, the number of accounts managed and general method of compensation. In this latter respect, the Board noted that a primary factor in management’s determination of a portfolio manager’s bonus compensation was the relative investment performance of the funds he or she managed and that a portion of such bonus was required to be invested in a predesignated list of funds within such person’s fund management area so as to be aligned with the interests of shareholders. The Board also took into account the quality of transfer agent and shareholder services provided Fund shareholders by an affiliate of the Manager and the continuous enhancements to the Franklin Templeton website. Particular attention was given to management’s conservative approach and diligent risk management procedures, including continuous monitoring of counterparty credit risk and attention given to derivatives and other complex instruments. The Board also took into account, among other things, management’s efforts in establishing a global credit facility for the benefit of the Funds and other accounts managed by Franklin Templeton Investments to provide a source of cash for temporary and emergency purposes or to meet unusual redemption requests as well as the strong financial position of the Manager’s parent company and its commitment to the mutual fund business as evidenced by its subsidization of money market funds.
INVESTMENT PERFORMANCE. The Board placed significant emphasis on the investment performance of each Fund in view of its importance to shareholders. While consideration was given to performance reports and discussions with portfolio managers at Board meetings throughout the year, particular attention in assessing performance was given to the Lipper reports furnished for the agreement renewals. The Lipper reports prepared for each individual Fund showed its investment performance, or those of its Class A shares for Funds having multiple share classes, in comparison to a performance universe selected by Lipper. Comparative performance for each Fund was shown for the one-year period ended December 31, 2013, and for additional periods ended that date up to 10 years depending on when a particular Fund commenced operations. The Lipper report showed the income return for each Fund, other than Franklin High Yield Tax-Free Income Fund, to be above the median of its Lipper performance universe for 2013, as well as for the previous three-, five- and 10-year periods on an annualized basis, with most being in the highest or second-highest
Annual Report | 209
Franklin Tax-Free Trust
Shareholder Information (continued)
Board Review of Investment Management Agreement (continued)
performing quintile during all such periods. The Lipper report showed the total returns of a majority of the Funds to be below the medians of their respective Lipper performance universes in 2013, but on an annualized basis, with the exception of Franklin Double Tax-Free Income Fund, the total returns of all the Funds were at or above the medians of their Lipper performance universes for the 10-year period, with the majority being at or above the middle performing quintiles of their respective performance universes for the previous three- and five-year periods as well. The Board was satisfied with the overall performance of these Funds, noting their income oriented objective. The Lipper report showed the income return for Franklin High Yield Tax-Free Income Fund to be below the median, but in the middle performing quintile, of its Lipper performance universe for 2013, as well as the previous three- and five-year periods on an annualized basis, but to be in the second-highest performing quintile of such universe for the previous 10-year period on an annualized basis. The Board reviewed with management the reasons for the Fund’s 2013 underperformance but believed it did not warrant any change in portfolio management. In doing so, the Board noted the Fund’s income objective and that its actual income return for 2013 and the previous three- and five-year annualized periods as shown in the Lipper report amounted to 4.44%, 4.73% and 5.12%, respectively, and in each period was within 12 basis points of the performance universe median. The Lipper report showed the income return of Franklin Double Tax-Free Income Fund to be in the highest performing quintile of its performance universe during 2013, and the previous annualized three-, five- and 10-year periods, but its total return to be in the lowest performing quintile of such universe during 2013 and such annualized periods. In discussing this, the Board noted that Franklin Double Tax-Free Income Fund is the only fund in its Lipper performance universe investing primarily in Puerto Rican municipal securities and that its total return performance reflected Puerto Rico’s financial difficulties and the rating downgrades of Puerto Rican bonds that occurred in 2013. While disappointed in such total return and intending to continually monitor developments in Puerto Rico, the Board did not believe the Fund’s performance warranted any change in portfolio management in view of such fact.
COMPARATIVE EXPENSES. Consideration was given to the management fee and total expense ratio of each Fund in comparison with those of a group of funds selected by Lipper as its appropriate Lipper expense group. Lipper expense data is based upon information taken from each fund’s most recent annual report, which reflects historical asset levels that may be quite different from those currently existing, particularly in a period of market volatility. While recognizing such inherent limitation and the fact that expense ratios generally increase as assets decline and decrease as assets grow, the Board believed the independent analysis conducted by Lipper to be an appropriate measure of comparative expenses. In reviewing comparative costs, Lipper provides information on each Fund’s contractual investment management fee in comparison with the contractual investment management fee that would have been charged by other funds within its Lipper expense group assuming they were similar in size to the Fund, as well as the actual total expenses of the Fund in comparison with those of its Lipper expense group. The Lipper contractual investment management fee analysis includes an administrative charge as being part of the investment management fee, and total expenses, for comparative consistency, are shown by Lipper for Fund Class A shares for Funds
210 | Annual Report
Franklin Tax-Free Trust
Shareholder Information (continued)
Board Review of Investment Management Agreement (continued)
having multiple share classes. The Lipper reports showed that the contractual investment management fee rates for each Fund were at or below the medians of their respective Lipper expense groups, with the exception of Franklin Insured Tax-Free Income Fund and Franklin Federal Intermediate-Term Tax-Free Income Fund. The contractual investment management fee rate of each such Fund, however, was within two basis points of its respective Lipper expense group median. The contractual investment management fee rate for Franklin Federal Limited-Term Tax-Free Income Fund was also above its Lipper expense group median, but its actual management fee rate paid was within two basis points of its expense group median as a result of fee waivers. The Lipper reports further showed that the actual total expense ratios for all Funds were below the medians of their respective Lipper expense groups, with each being in the least expensive quintile of such group. Based on the above, the Board was satisfied with the investment management fee and total expense ratio of each Fund in comparison to its Lipper expense group as shown in the Lipper reports.
MANAGEMENT PROFITABILITY. The Board also considered the level of profits realized by the Manager and its affiliates in connection with the operation of each Fund. In this respect, the Board reviewed the Fund profitability analysis that addresses the overall profitability of Franklin Templeton’s U.S. fund business, as well as its profits in providing management and other services to each of the individual funds during the 12-month period ended September 30, 2013, being the most recent fiscal year-end for Franklin Resources, Inc., the Manager’s parent. In reviewing the analysis, the Board recognized that allocation methodologies are inherently subjective and various allocation methodologies may be reasonable while producing different results. In this respect, the Board noted that while management continuously makes refinements to its methodologies in response to organizational and product related changes, the overall approach as defined by the primary drivers and activity measurements has remained consistent with that used in the Funds’ profitability report presentations from prior years. Additionally, the Funds’ independent registered public accounting firm had been engaged by the Manager to periodically review the reasonableness of the allocation methodologies to be used solely by the Funds’ Board in reference to the profitability analysis. In reviewing and discussing such analysis, management discussed with the Board its belief that costs incurred in establishing the infrastructure necessary for the type of mutual fund operations conducted by the Manager and its affiliates may not be fully reflected in the expenses allocated to each Fund in determining its profitability, as well as the fact that the level of profits, to a certain extent, reflected operational cost savings and efficiencies initiated by management. The Board also took into account management’s expenditures in improving shareholder services provided the Funds, as well as the need to implement systems and meet additional regulatory and compliance requirements resulting from statutes such as the Sarbanes-Oxley and Dodd-Frank Acts and recent SEC and other regulatory requirements. In addition, the Board considered a third-party study comparing the profitability of the Manager’s parent on an overall basis to other publicly held managers broken down to show profitability from management operations exclusive of distribution expenses, as well as profitability including distribution expenses. The Board also considered the extent to which the Manager and its affiliates might derive ancillary benefits from fund operations,
Annual Report | 211
Franklin Tax-Free Trust
Shareholder Information (continued)
Board Review of Investment Management Agreement (continued)
including revenues generated from transfer agent services. Based upon its consideration of all these factors, the Board determined that the level of profits realized by the Manager and its affiliates from providing services to each Fund was not excessive in view of the nature, quality and extent of services provided.
ECONOMIES OF SCALE. The Board also considered whether economies of scale are realized by the Manager as the Funds grow larger and the extent to which this is reflected in the level of management fees charged. While recognizing any precise determination is inherently subjective, the Board noted that based upon the Fund profitability analysis, it appears that as some Funds get larger, at some point economies of scale do result in the Manager realizing a larger profit margin on management services provided such Fund. The Board also noted that any economies of scale are shared with each of these Funds and their shareholders through management fee breakpoints existing in each of the Fund’s investment management agreements, so that as a Fund grows in size, its effective management fee rate declines. The fee structure under the investment management agreement with each Fund, other than Franklin Federal Limited-Term Tax-Free Income Fund, provides an initial fee of 0.625% on the first $100 million of assets; 0.5% on the next $150 million of assets; 0.45% on assets in excess of $250 million; with additional breakpoints beginning at 0.44% on assets in excess of $7.5 billion; 0.43% on assets in excess of $10 billion and continuing thereafter until reaching a final breakpoint of 0.36% on assets in excess of $20 billion. In reviewing such structure, management stated its belief that this fee structure reaches a relatively low rate quickly as a Fund grows and that such low rate, in effect, reflects anticipated economies of scale as a Fund’s assets increase and pointed out the favorable contractual management fee and total expense comparisons for each Fund within its Lipper expense group as discussed under “Comparative Expenses.” The Board observed that at December 31, 2013, none of these Funds had assets in excess of $8 billion and believed that to the extent economies of scale may be realized by the Manager and its affiliates, the schedule of fees under the investment management agreement for each such Fund provides a sharing of benefits with the Fund and its shareholders. The fee structure under the investment management agreement with Franklin Federal Limited-Term Tax-Free Income Fund provides an initial fee of 0.70% on the first $100 million of assets; 0.65% on the next $150 million of assets; 0.625% on the next $250 million of assets; and 0.60% on assets in excess of $500 million. The assets of such Fund at December 31, 2013, amounted to $1.17 billion, and while its expenses continued to be subsidized by management through fee waivers the Board negotiated with management a revision in such fee structure so as to be consistent with those charged the other Funds effective April 1, 2014.
212 | Annual Report
Franklin Tax-Free Trust
Shareholder Information (continued)
Proxy Voting Policies and Procedures
The Trust’s investment manager has established Proxy Voting Policies and Procedures (Policies) that the Trust uses to determine how to vote proxies relating to portfolio securities. Shareholders may view the Trust’s complete Policies online at franklintempleton.com. Alternatively, shareholders may request copies of the Policies free of charge by calling the Proxy Group collect at (954) 527-7678 or by sending a written request to: Franklin Templeton Companies, LLC, 300 S.E. 2nd Street, Fort Lauderdale, FL 33301, Attention: Proxy Group. Copies of the Trust’s proxy voting records are also made available online at franklintempleton.com and posted on the U.S. Securities and Exchange Commission’s website at sec.gov and reflect the most recent 12-month period ended June 30.
Quarterly Statement of Investments
The Trust files a complete statement of investments with the U.S. Securities and Exchange Commission for the first and third quarters for each fiscal year on Form N-Q. Shareholders may view the filed Form N-Q by visiting the Commission’s website at sec.gov. The filed form may also be viewed and copied at the Commission’s Public Reference Room in Washington, DC. Information regarding the operations of the Public Reference Room may be obtained by calling (800) SEC-0330.
Householding of Reports and Prospectuses
You will receive each Fund’s financial reports every six months as well as an annual updated summary prospectus (prospectus available upon request). To reduce Fund expenses, we try to identify related shareholders in a household and send only one copy of the financial reports and summary prospectus. This process, called “householding,” will continue indefinitely unless you instruct us otherwise. If you prefer not to have these documents householded, please call us at (800) 632-2301. At any time you may view current prospectuses/summary prospectuses and financial reports on our website. If you choose, you may receive these documents through electronic delivery.
Annual Report | 213
This page intentionally left blank.
This page intentionally left blank.
This page intentionally left blank.
Item 2. Code of Ethics.
(a) The Registrant has adopted a code of ethics that applies to its principal executive officers and principal financial and accounting officer.
(c) N/A
(d) N/A
(f) Pursuant to Item 12(a)(1), the Registrant is attaching as an exhibit a copy of its code of ethics that applies to its principal executive officers and principal financial and accounting officer.
Item 3. Audit Committee Financial Expert.
(a)(1) The Registrant has an audit committee financial expert serving on its audit committee.
(2) The audit committee financial expert is John B. Wilson, and he is "independent" as defined under the relevant Securities and Exchange Commission Rules and Releases.
Item 4. Principal Accountant Fees and Services.
(a) Audit Fees
The aggregate fees paid to the principal accountant for professional services rendered by the principal accountant for the audit of the registrant’s annual financial statements or for services that are normally provided by the principal accountant in connection with statutory and regulatory filings or engagements were $823,994 for the fiscal year ended February 28, 2014 and $872,267 for the fiscal year ended February 28, 2013.
(b) Audit-Related Fees
There were no fees paid to the principal accountant for assurance and related services rendered by the principal accountant to the registrant that are reasonably related to the performance of the audit of the registrant's financial statements and are not reported under paragraph (a) of Item 4.
There were no fees paid to the principal accountant for assurance and related services rendered by the principal accountant to the registrant's investment adviser and any entity controlling, controlled by or under common control with the investment adviser that provides ongoing services to the registrant that are reasonably related to the performance of the audit of their financial statements.
(c) Tax Fees
There were no fees paid to the principal accountant for professional services rendered by the principal accountant to the registrant for tax compliance, tax advice and tax planning.
The aggregate fees paid to the principal accountant for professional services rendered by the principal accountant to the registrant’s investment adviser and any entity controlling, controlled by or under common control with the investment adviser that provides ongoing services to the registrant for tax compliance, tax advice and tax planning were $6,930 for the fiscal year ended February 28, 2014 and $4,600 for the fiscal year ended February 28, 2013. The services for which these fees were paid included technical tax consultation for capital gain tax reporting to foreign governments and requirements on local country’s self certification forms.
(d) All Other Fees
The aggregate fees paid to the principal accountant for products and services rendered by the principal accountant to the registrant not reported in paragraphs (a)-(c) of Item 4 were $0 for the fiscal year ended February 28, 2014 and $12,167 for the fiscal year ended February 28, 2013. The services for which these fees were paid included review of materials provided to the fund Board in connection with the investment management contract renewal process.
The aggregate fees paid to the principal accountant for products and services rendered by the principal accountant to the registrant’s investment adviser and any entity controlling, controlled by or under common control with the investment adviser that provides ongoing services to the registrant other than services reported in paragraphs (a)-(c) of Item 4 were $39,194 for the fiscal year ended February 28, 2014 and $140,283 for the fiscal year ended February 28, 2013. The services for which these fees were paid included preparation and review of materials provided to the fund Board in connection with the investment management contract renewal process.
(e) (1) The registrant’s audit committee is directly responsible for approving the services to be provided by the auditors, including:
(i) pre-approval of all audit and audit related services;
(ii) pre-approval of all non-audit related services to be provided to the Fund by the auditors;
(iii) pre-approval of all non-audit related services to be provided to the registrant by the auditors to the registrant’s investment adviser or to any entity that controls, is controlled by or is under common control with the registrant’s investment adviser and that provides ongoing services to the registrant where the non-audit services relate directly to the operations or financial reporting of the registrant; and
(iv) establishment by the audit committee, if deemed necessary or appropriate, as an alternative to committee pre-approval of services to be provided by the auditors, as required by paragraphs (ii) and (iii) above, of policies and procedures to permit such services to be pre-approved by other means, such as through establishment of guidelines or by action of a designated member or members of the committee; provided the policies and procedures are detailed as to the particular service and the committee is informed of each service and such policies and procedures do not include delegation of audit committee responsibilities, as contemplated under the Securities Exchange Act of 1934, to management; subject, in the case of (ii) through (iv), to any waivers, exceptions or exemptions that may be available under applicable law or rules.
(e) (2) None of the services provided to the registrant described in paragraphs (b)-(d) of Item 4 were approved by the audit committee pursuant to paragraph (c)(7)(i)(C) of Rule 2-01 of regulation S-X.
(f) No disclosures are required by this Item 4(f).
(g) The aggregate non-audit fees paid to the principal accountant for services rendered by the principal accountant to the registrant and the registrant’s investment adviser and any entity controlling, controlled by or under common control with the investment adviser that provides ongoing services to the registrant were $46,124 for the fiscal year ended February 28, 2014 and $157,050 for the fiscal year ended February 28, 2013.
(h) The registrant’s audit committee of the board has considered whether the provision of non-audit services that were rendered to the registrant’s investment adviser (not including any sub-adviser whose role is primarily portfolio management and is subcontracted with or overseen by another investment adviser), and any entity controlling, controlled by, or under common control with the investment adviser that provides ongoing services to the registrant that were not pre-approved pursuant to paragraph (c)(7)(ii) of Rule 2-01 of Regulation S-X is compatible with maintaining the principal accountant’s independence.
Item 5. Audit Committee of Listed Registrants. N/A
Item 6. Schedule of Investments. N/A
Item 7. Disclosure of Proxy Voting Policies and Procedures for Closed-End Management Investment Companies. N/A
Item 8. Portfolio Managers of Closed-End Management Investment Companies. N/A
Item 9. Purchases of Equity Securities by Closed-End Management Investment Company and Affiliated Purchasers. N/A
Item 10. Submission of Matters to a Vote of Security Holders.
There have been no changes to the procedures by which shareholders may recommend nominees to the Registrant's Board of Trustees that would require disclosure herein.
Item 11. Controls and Procedures.
(a) Evaluation of Disclosure Controls and Procedures. The Registrant maintains disclosure controls and procedures that are designed to ensure that information required to be disclosed in the Registrant’s filings under the Securities Exchange Act of 1934 and the Investment Company Act of 1940 is recorded, processed, summarized and reported within the periods specified in the rules and forms of the Securities and Exchange Commission. Such information is accumulated and communicated to the Registrant’s management, including its principal executive officer and principal financial officer, as appropriate, to allow timely decisions regarding required disclosure. The Registrant’s management, including the principal executive officer and the principal financial officer, recognizes that any set of controls and procedures, no matter how well designed and operated, can provide only reasonable assurance of achieving the desired control objectives.
Within 90 days prior to the filing date of this Shareholder Report on Form N-CSR, the Registrant had carried out an evaluation, under the supervision and with the participation of the Registrant’s management, including the Registrant’s principal executive officer and the Registrant’s principal financial officer, of the effectiveness of the design and operation of the Registrant’s disclosure controls and procedures. Based on such evaluation, the Registrant’s principal executive officer and principal financial officer concluded that the Registrant’s disclosure controls and procedures are effective.
(b) Changes in Internal Controls. There have been no changes in the Registrant’s internal controls or in other factors that could materially affect the internal controls over financial reporting subsequent to the date of their evaluation in connection with the preparation of this Shareholder Report on Form N-CSR.
Item 12. Exhibits.
(a)(1) Code of Ethics
(a)(2) Certifications pursuant to Section 302 of the Sarbanes-Oxley Act of 2002 of Laura F. Fergerson, Chief Executive Officer - Finance and Administration, and Gaston Gardey, Chief Financial Officer and Chief Accounting Officer
(b) Certifications pursuant to Section 906 of the Sarbanes-Oxley Act of 2002 of Laura F. Fergerson, Chief Executive Officer - Finance and Administration, and Gaston Gardey, Chief Financial Officer and Chief Accounting Officer
SIGNATURES
Pursuant to the requirements of the Securities Exchange Act of 1934 and the Investment Company Act of 1940, the registrant has duly caused this report to be signed on its behalf by the undersigned, thereunto duly authorized.
FRANKLIN TAX-FREE TRUST
By /s/Laura F. Fergerson
Laura F. Fergerson
Chief Executive Officer –
Finance and Administration
Date April 25, 2014
Pursuant to the requirements of the Securities Exchange Act of 1934 and the Investment Company Act of 1940, this report has been signed below by the following persons on behalf of the registrant and in the capacities and on the dates indicated.
By /s/Laura F. Fergerson
Laura F. Fergerson
Chief Executive Officer –
Finance and Administration
Date April 25, 2014
By /s/Gaston Gardey
Gaston Gardey
Chief Financial Officer and
Chief Accounting Officer
Date April 25, 2014