UNITED STATES
SECURITIES AND EXCHANGE COMMISSION
Washington, DC 20549
FORM N-CSR
CERTIFIED SHAREHOLDER REPORT OF REGISTERED
MANAGEMENT INVESTMENT COMPANIES
Investment Company Act file number 811-04149
Franklin Tax-Free Trust
(Exact name of registrant as specified in charter)
One Franklin Parkway, San Mateo, CA 94403-1906
(Address of principal executive offices) (Zip code)
Craig S. Tyle, One Franklin Parkway, San Mateo, CA 94403-1906
(Name and address of agent for service)
Registrant’s telephone number, including area code: (650) 312-2000
Date of fiscal year end: 2/28
Date of reporting period: 02/28/18
| Item 1. | Reports to Stockholders. |
2
| | | | |
 | | | | Annual Report and Shareholder Letter February 28, 2018 |

Franklin Federal Intermediate-Term Tax-Free Income Fund
Franklin Federal Limited-Term Tax-Free Income Fund
Franklin High Yield Tax-Free Income Fund
Franklin Massachusetts Tax-Free Income Fund
Franklin New Jersey Tax-Free Income Fund

Sign up for electronic delivery at franklintempleton.com/edelivery
Franklin Templeton Investments
Why choose Franklin Templeton Investments?
Successful investing begins with ambition. And achievement only comes when you reach for it. That’s why we continually strive to deliver better outcomes for investors. No matter what your goals are, our deep, global investment expertise allows us to offer solutions that can help.
During our more than 70 years of experience, we’ve managed through all kinds of markets—up, down and those in between. We’re always preparing for what may come next. It’s because of this, combined with our strength as one of the world’s largest asset managers that we’ve earned the trust of millions of investors around the world.
Dear Shareholder:
The 12 months ended February 28, 2018, benefited from mostly upbeat economic data as the US job market continued to improve and the unemployment rate declined. Accordingly, the US Federal Reserve (Fed) increased its target range for the federal funds rate a quarter point to 1.25%–1.50% at its past December meeting.
During the period, the municipal bond market posted modest performance similar to other US fixed income classes, with generally higher returns for longer term and lower rated municipal bonds. Factors contributing to this positive investment environment for municipals included consistently low inflation and relatively steady interest rates, stagnant wage growth and geopolitical concerns. Federal government fiscal reform uncertainty also benefited tax-free municipals during most of the period, despite some volatility toward period-end in reaction to the government’s tax code revision efforts.
Shortly after the end of the reporting period, the Fed, under new chairman Jerome Powell, raised the federal funds rate
another quarter point to a range of 1.50%-1.75%. The Fed based its decision on a stronger economic outlook in recent months.
In addition, Franklin Tax Free Trust’s annual report includes more detail about municipal bond market conditions and a discussion from the portfolio managers. On our website, franklintempleton.com, you can find updated commentary by our municipal bond experts. Municipal bonds can provide tax-free income and diversification from equities. Despite periods of volatility, municipal bonds historically have had a solid long-term record of performance, driven mostly by their income component. Please remember all securities markets fluctuate, as do mutual fund share prices.
As always, we recommend investors consult their financial advisors to help them make the best decisions for the long term. In a constantly changing market environment, we remain committed to our disciplined strategy as we manage the Fund, keeping in mind the trust you have placed in us.
| | | | | | |
| | | Not FDIC Insured | | | May Lose Value | | | No Bank Guarantee |
| | | | |
franklintempleton.com | | Not part of the annual report | | 1 |
We appreciate your confidence in us and encourage you to contact us when you have questions about your Franklin Templeton tax-free investment.
Sincerely,

Rupert H. Johnson, Jr.
Chairman
Franklin Tax-Free Trust

Sheila Amoroso

Rafael R. Costas Jr.
Senior Vice Presidents and Co-Directors
Franklin Municipal Bond Department
This letter reflects our analysis and opinions as of February 28, 2018, unless otherwise indicated. The information is not a complete analysis of every aspect of any market, state, industry, security or fund. Statements of fact are from sources considered reliable.
Contents
Visit franklintempleton.com for fund updates, to access your account, or to find helpful financial planning tools.
| | | | |
2 | | Not part of the annual report | | franklintempleton.com |
Annual Report
Municipal Bond Market Overview
The municipal bond market outperformed the US Treasury market but underperformed US stock markets during the 12-month period ended February 28, 2018. Investment-grade municipal bonds, as measured by the Bloomberg Barclays Municipal Bond Index, generated a +2.50% total return for the period, while US Treasuries, as measured by the Bloomberg Barclays US Treasury Index, had a -0.56% total return.1 Both high-yield corporate bonds and high-yield municipal bonds outperformed their investment-grade counterparts. US stocks, as represented by the Standard & Poor’s® 500 Index, outperformed both municipals and US Treasuries with a +17.10% total return for the reporting period.1 US stocks generated strong returns through the first eleven months of the reporting period, but experienced a significant bout of volatility in early February that led to losses in that month and dragged down overall returns. Recent indications of stronger inflation and rising interest rates contributed to the volatility in stock markets and also drove losses in both the municipal bond market and US Treasury market during the first two months of 2018.
Municipal issuance during the reporting period totaled $414 billion.2 This represents an almost 8% decline from total issuance in the previous 12-month period ended February 28, 2017.2 Subdued issuance at the beginning of 2018 largely contributed to this decline, with only $37 billion issued thus far in 2018 (down 38% from the first two months of 2017).2 After accounting for redemptions (bonds that matured or were called out of the market), net issuance stood at $64 billion in 2017, which marked a third consecutive year of positive net issuance.3 However, net issuance turned negative in the first two months of 2018, standing at -$19 billion at period-end.3 According to the Investment Company Institute Trends in Mutual Fund Investing, municipal bond funds reported inflows for 10 of the 12 months of the reporting period, with the only negative flows occurring in December 2017 and February 2018. The total inflows for the period were approximately $28 billion.4
Impending tax reform contained potential implications for the municipal bond market and caused a deluge of supply in December, as issuers rushed to market before the end of the 2017. December supply of $63 billion and fourth-quarter 2017
supply of $145 billion eclipsed previous monthly and quarterly records of municipal bond issuance, respectively.2 Despite this extraordinary supply weighing on the market, strong demand buoyed returns through the end of the 2017. However, diminished issuance, heavy dealer inventories and selling pressures in 2018 led municipals to have a -1.47% total return during the first two months of 2018, as measured by the Bloomberg Barclays Municipal Bond Index, although it still performed better than the -2.10% total return for US Treasuries during the same period, as measured by the Bloomberg Barclays US Treasury Index.1
The Federal Reserve (Fed) raised its target range for the federal funds rate 0.25% at its December 2017 meeting. The target range stood at 1.25%–1.50% at period-end. The Fed also increased the discount rate 0.25% to 2.00% in December. The Fed decided to raise interest rates at its December meeting due to the strength of the US jobs market and continued economic growth. This was the third rate hike of 2017, following increases of 0.25% in March and June.
Jerome Powell spoke before Congress for the first time as Fed Chair after succeeding Janet Yellen in that role. He indicated that the Fed saw signs of a continued strong labor market and economic growth. He reiterated the Fed’s intention to gradually raise interest rates in an effort to keep the economy from overheating as inflation increases toward the Fed’s 2% target. He noted that there was no evidence of the economy overheating and that he had yet to see a clear move upward in wages.
Investors continued to favor risky assets through most of the period. Municipal bonds with longer maturities generally performed better than bonds with shorter maturities, and high yield tax-exempt bonds outperformed their investment-grade counterparts. The Bloomberg Barclays High Yield Municipal Bond Index generated a +4.74% total return for the period and the Bloomberg Barclays Municipal Long Bond (22+ Years) Index returned +4.30% during the 12-month reporting period.1
Several developments affected Puerto Rico bonds over the reporting period. Please visit
1. Source: Morningstar. Treasuries, if held to maturity, offer a fixed rate of return and a fixed principal value; their interest payments and principal are guaranteed.
2. Source: The Bond Buyer, Thomson Reuters.
3. Source: Barclays Municipal Credit Research.
4. Source: Investment Company Institute, Trends in Mutual Fund Investing February 2018, 3/28/18.
See www.franklintempletondatasources.com for additional data provider information.
| | | | |
franklintempleton.com | | Annual Report | | �� 3 |
MUNICIPAL BOND MARKET OVERVIEW
franklintempleton.com/investor/products/fund-resources/puerto-rico for the latest Puerto Rico updates from Franklin Templeton.
At period-end, we maintained our positive view of the municipal bond market. We believe municipal bonds continue to be an attractive asset class among fixed income securities, and we intend to follow our solid discipline of investing to maximize income, while seeking value in the municipal bond market.
The foregoing information reflects our analysis, opinions and portfolio holdings as of February 28, 2018, the end of the reporting period. The way we implement our main investment strategies and the resulting portfolio holdings may change depending on factors such as market and economic conditions. These opinions may not be relied upon as investment advice or an offer for a particular security. The information is not a complete analysis of every aspect of any market, state, industry, security or fund. Statements of fact are from sources considered reliable, but the investment manager makes no representation or warranty as to their completeness or accuracy. Although historical performance is no guarantee of future results, these insights may help you understand our investment management philosophy.
| | | | | | |
4 | | Annual Report | | | | franklintempleton.com |
Investment Strategy and Manager’s Discussion
Investment Strategy
We use a consistent, disciplined strategy with the objective of maximizing tax-free income and capital preservation by focusing on credit selection. We seek to maintain exposure to higher coupon securities, while balancing risk and return within each Fund’s range of allowable investments. We do not purchase high yield securities in our investment-grade funds, however if a security is downgraded we are not required to sell it. Our security selection process includes purchasing securities that we believe are undervalued in the market and which have met our credit selection criteria. We do not use leverage or derivatives, which could add volatility and contribute to underperformance in adverse markets.
Manager’s Discussion
Due to the positive sloping municipal yield curve, we found value in higher quality securities in the 15–30 year maturity range for the long-term funds, 10 to 15 years for the intermediate-term fund, and five years or less for the limited-term fund, which allowed us to achieve our objective of maximizing income for our investors. Typically, in declining rate environments, our turnover declines as we maintain exposure to securities that are producing income that exceeds their replacement value in the market. However, when rates rise, our turnover increases as opportunities to purchase securities that have the potential to increase income in the portfolios become available. We believe our consistent, disciplined strategy can help our investors achieve high, tax-free income over the long term.
We invite you to read your Fund report for more detailed performance and portfolio information. Thank you for your participation in Franklin Tax-Free Trust. We look forward to serving your future investment needs.
The foregoing information reflects our analysis, opinions and portfolio holdings as of February 28, 2018, the end of the reporting period. The way we implement our main investment strategies and the resulting portfolio holdings may change depending on factors such as market and economic conditions. These opinions may not be relied upon as investment advice or an offer for a particular security. The information is not a complete analysis of every aspect of any market, state, industry, security or fund. Statements of fact are from sources considered reliable, but the investment manager makes no representation or warranty as to their completeness or accuracy. Although historical performance is no guarantee of future results, these insights may help you understand our investment management philosophy.
| | | | | | |
franklintempleton.com | | | | Annual Report | | 5 |
Franklin Federal Intermediate-Term Tax-Free Income Fund
This annual report for Franklin Federal Intermediate-Term Tax-Free Income Fund covers the fiscal year ended February 28, 2018.
Your Fund’s Goal and Main Investments
The Fund seeks to provide as high a level of income exempt from federal income taxes as is consistent with prudent investment management and preservation of capital by investing at least 80% of its total assets in securities that pay interest free from such taxes.1 The Fund maintains a dollar-weighted average portfolio maturity (the time in which the debt must be repaid) of three to 10 years.
Credit Quality Composition*
2/28/18
| | | | |
| Ratings | | % of Total Investments | |
| |
AAA | | | 18.12% | |
| | | | | |
| |
AA | | | 59.28% | |
| | | | | |
| |
A | | | 12.50% | |
| | | | | |
| |
BBB | | | 1.25% | |
| | | | | |
| |
Refunded | | | 7.99% | |
| | | | | |
| |
Not Rated | | | 0.86% | |
| | | | | |
*Securities, except for those labeled Not Rated, are assigned ratings by one or more Nationally Recognized Statistical Credit Rating Organizations (NRSROs), such as Standard & Poor’s, Moody’s and Fitch, that can be considered by the investment manager as part of its independent securities analysis. When ratings from multiple agencies are available, the highest is used, consistent with the portfolio investment process. Ratings reflect an NRSRO’s opinion of an issuer’s creditworthiness and typically range from AAA (highest) to D (lowest). The Below Investment Grade category consists of bonds rated below BBB-. The Refunded category generally consists of refunded bonds secured by US government or other high-quality securities and not rerated by an NRSRO. The Not Rated category consists of ratable securities that have not been rated by an NRSRO. Cash and equivalents are excluded from this composition.
Performance Overview
The Fund’s Class A share price, as measured by net asset value, decreased from $12.11 on February 28, 2017, to $11.94 on February 28, 2018. The Fund’s Class A shares paid dividends totaling 30.99 cents per share for the reporting period.2 The Performance Summary beginning on page 8 shows that at the end of this reporting period the Fund’s Class A shares’ distribution rate was 2.55%, based on an annualization of the
Dividend Distributions*
3/1/17–2/28/18
| | | | | | | | | | | | | | | | |
| | | Dividend per Share (cents) | |
| Month | | Class A | | | Class C | | | Class R6** | | | Advisor
Class | |
| | | | |
March | | | 2.56 | | | | 2.00 | | | | — | | | | 2.66 | |
| | | | | | | | | | | | | | | | | |
| | | | |
April | | | 2.56 | | | | 2.00 | | | | — | | | | 2.66 | |
| | | | | | | | | | | | | | | | | |
| | | | |
May | | | 2.56 | | | | 2.00 | | | | — | | | | 2.66 | |
| | | | | | | | | | | | | | | | | |
| | | | |
June | | | 2.59 | | | | 2.03 | | | | — | | | | 2.69 | |
| | | | | | | | | | | | | | | | | |
| | | | |
July | | | 2.59 | | | | 2.03 | | | | — | | | | 2.69 | |
| | | | | | | | | | | | | | | | | |
| | | | |
August | | | 2.59 | | | | 2.03 | | | | 2.67 | | | | 2.69 | |
| | | | | | | | | | | | | | | | | |
| | | | |
September | | | 2.59 | | | | 2.03 | | | | 2.76 | | | | 2.69 | |
| | | | | | | | | | | | | | | | | |
| | | | |
October | | | 2.59 | | | | 2.03 | | | | 2.76 | | | | 2.69 | |
| | | | | | | | | | | | | | | | | |
| | | | |
November | | | 2.59 | | | | 2.03 | | | | 2.76 | | | | 2.69 | |
| | | | | | | | | | | | | | | | | |
| | | | |
December | | | 2.59 | | | | 2.03 | | | | 2.76 | | | | 2.69 | |
| | | | | | | | | | | | | | | | | |
| | | | |
January | | | 2.59 | | | | 2.03 | | | | 2.76 | | | | 2.69 | |
| | | | | | | | | | | | | | | | | |
| | | | |
February | | | 2.59 | | | | 2.03 | | | | 2.76 | | | | 2.69 | |
| | | | | | | | | | | | | | | | | |
| | | | |
Total | | | 30.99 | | | | 24.27 | | | | 19.23 | | | | 32.19 | |
| | | | | | | | | | | | | | | | | |
*The distribution amount is the sum of all net investment income distributions for the period shown. Assumes shares were purchased and held for the entire accrual period. Since dividends accrue daily, your actual distributions will vary depending on the date you purchased your shares and any account activity. All Fund distributions will vary depending upon current market conditions, and past distributions are not indicative of future trends.
**Effective 8/1/17, the Fund began offering Class R6 shares. See the prospectus for details.
2.59 cent per share February dividend and the maximum offering price of $12.21 on February 28, 2018. An investor in the 2018 maximum federal income tax bracket of 40.80% (including 3.80% Medicare tax) would need to earn a distribution rate of 4.31% from a taxable investment to match the Fund’s Class A tax-free distribution rate. For other performance data, please see the Performance Summary.
Performance data represent past performance, which does not guarantee future results. Investment return and principal value will fluctuate, and you may have a gain or loss when you sell your shares. Current performance may differ from figures shown. For most recent month-end performance, go to franklintempleton.com or call (800) 342-5236.
1. Dividends are generally subject to state and local taxes, if any. For investors subject to alternative minimum tax, a small portion of Fund dividends may be taxable. Distributions of capital gains are generally taxable. To avoid imposition of 28% backup withholding on all Fund distributions and redemption proceeds, US investors must be properly certified on Form W-9 and non-US investors on Form W-8BEN.
2. The distribution amount is the sum of all net investment income distributions for the period shown. Assumes shares were purchased and held for the entire accrual period. Since dividends accrue daily, your actual distributions will vary depending on the date you purchased your shares and any account activity. All Fund distributions will vary depending upon current market conditions, and past distributions are not indicative of future trends.
The dollar value, number of shares or principal amount, and names of all portfolio holdings are listed in the Fund’s Statement of Investments (SOI).
The SOI begins on page 44.
| | | | | | |
6 | | Annual Report | | | | franklintempleton.com |
FRANKLIN FEDERAL INTERMEDIATE-TERM TAX-FREE INCOME FUND
Manager’s Discussion
We used various investment strategies during the 12 months under review as we sought to maximize tax-free income for shareholders. Please read the Investment Strategy and Manager’s Discussion on page 5 for more information.
Portfolio Composition
2/28/18
| | | | |
| | |
| % of Total
Investments |
* |
| |
Utilities | | | 23.0% | |
| | | | | |
| |
General Obligation | | | 19.3% | |
| | | �� | | |
| |
Refunded** | | | 14.3% | |
| | | | | |
| |
Transportation | | | 13.8% | |
| | | | | |
| |
Subject to Government Appropriations | | | 9.8% | |
| | | | | |
| |
Tax-Supported | | | 7.3% | |
| | | | | |
| |
Hospital & Health Care | | | 5.8% | |
| | | | | |
| |
Higher Education | | | 5.7% | |
| | | | | |
| |
Other Revenue | | | 1.0% | |
| | | | | |
*Does not include cash and cash equivalents.
**Includes all refunded bonds; the percentage may differ from that in the Credit Quality Composition.
Thank you for your continued participation in Franklin Federal Intermediate-Term Tax-Free Income Fund. We believe our conservative, buy-and-hold investment strategy can help us achieve high, current, tax-free income for shareholders.
The foregoing information reflects our analysis, opinions and portfolio holdings as of February 28, 2018, the end of the reporting period. The way we implement our main investment strategies and the resulting portfolio holdings may change depending on factors such as market and economic conditions. These opinions may not be relied upon as investment advice or an offer for a particular security. The information is not a complete analysis of every aspect of any market, state, industry, security or the Fund. Statements of fact are from sources considered reliable, but the investment manager makes no representation or warranty as to their completeness or accuracy. Although historical performance is no guarantee of future results, these insights may help you understand our investment management philosophy.
| | | | | | |
franklintempleton.com | | | | Annual Report | | 7 |
FRANKLIN FEDERAL INTERMEDIATE-TERM TAX-FREE INCOME FUND
Performance Summary as of February 28, 2018
The performance tables and graphs do not reflect any taxes that a shareholder would pay on Fund dividends, capital gain distributions, if any, or any realized gains on the sale of Fund shares. Total return reflects reinvestment of the Fund’s dividends and capital gain distributions, if any, and any unrealized gains or losses. Your dividend income will vary depending on dividends or interest paid by securities in the Fund’s portfolio, adjusted for operating expenses of each class. Capital gain distributions are net profits realized from the sale of portfolio securities.
Performance as of 2/28/181
Cumulative total return excludes sales charges. Average annual total return includes maximum sales charges. Sales charges will vary depending on the size of the investment and the class of share purchased. The maximum is 2.25% and the minimum is 0%. Class A: 2.25% maximum initial sales charge; Advisor Class: no sales charges. For other share classes, visit franklintempleton.com.
| | | | | | | | |
| Share Class | |
| Cumulative
Total Return |
2 | |
| Average Annual
Total Return |
3 |
| | |
A | | | | | | | | |
| | |
1-Year | | | +1.14% | | | | -1.15% | |
| | | | | | | | | |
| | |
5-Year | | | +7.90% | | | | +1.07% | |
| | | | | | | | | |
| | |
10-Year | | | +46.09% | | | | +3.63% | |
| | | | | | | | | |
| | |
Advisor4 | | | | | | | | |
| | |
1-Year | | | +1.32% | | | | +1.32% | |
| | | | | | | | | |
| | |
5-Year | | | +8.50% | | | | +1.65% | |
| | | | | | | | | |
| | |
10-Year | | | +47.71% | | | | +3.98% | |
| | | | | | | | | |
| | | | | | | | | | | | | | | | | | | | | | | | | | | | | | | | |
| | | | | | | | | | | | | | | | | | | | | Taxable Equivalent | |
| | | Distribution | | | Taxable Equivalent | | | | | | 30 Day Standardized Yield7 | | | | | | 30-Day Standardized Yield6 | |
| Share Class | | | Rate | 5 | | | Distribution Rate | 6 | | | | | | | (with waiver) | | | | (without waiver) | | | | | | | | (with waiver) | | | | (without waiver) | |
| | | | | | | | |
A | | | 2.55% | | | | 4.31% | | | | | | | | 1.57% | | | | 1.45% | | | | | | | | 2.65% | | | | 2.45% | |
| | | | | | | | | | | | | | | | | | | | | | | | | | | | | | | | | |
| | | | | | | | |
Advisor | | | 2.70% | | | | 4.56% | | | | | | | | 1.71% | | | | 1.58% | | | | | | | | 2.89% | | | | 2.67% | |
| | | | | | | | | | | | | | | | | | | | | | | | | | | | | | | | | |
Performance data represent past performance, which does not guarantee future results. Investment return and principal value will fluctuate, and you may have a gain or loss when you sell your shares. Current performance may differ from figures shown. For most recent month-end performance, go to franklintempleton.com or call (800) 342-5236.
See page 11 for Performance Summary footnotes.
| | | | | | |
8 | | Annual Report | | | | franklintempleton.com |
FRANKLIN FEDERAL INTERMEDIATE-TERM TAX-FREE INCOME FUND
PERFORMANCE SUMMARY
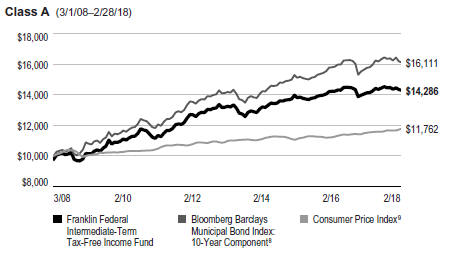
Total Return Index Comparison for a Hypothetical $10,000 Investment
Total return represents the change in value of an investment over the periods shown. It includes any applicable maximum sales charge, Fund expenses, account fees and reinvested distributions. The unmanaged indexes include reinvestment of any income or distributions. They differ from the Fund in composition and do not pay management fees or expenses. One cannot invest directly in an index.
See page 11 for Performance Summary footnotes.
| | | | | | |
franklintempleton.com | | | | Annual Report | | 9 |
FRANKLIN FEDERAL INTERMEDIATE-TERM TAX-FREE INCOME FUND
PERFORMANCE SUMMARY
Net Asset Value
| | | | | | | | | | | | | | | | |
| Share Class (Symbol) | | 2/28/18 | | | 8/1/17 | | | 2/28/17 | | | Change | |
| | | | |
A (FKITX) | | | $11.94 | | | | N/A | | | | $12.11 | | | | -$0.17 | |
| | | | | | | | | | | | | | | | | |
| | | | |
C (FCITX) | | | $11.98 | | | | N/A | | | | $12.14 | | | | -$0.16 | |
| | | | | | | | | | | | | | | | | |
| | | | |
R6 (FITQX) | | | $11.97 | | | | $12.28 | | | | N/A | | | | -$0.31 | |
| | | | | | | | | | | | | | | | | |
| | | | |
Advisor (FITZX) | | | $11.97 | | | | N/A | | | | $12.13 | | | | -$0.16 | |
| | | | | | | | | | | | | | | | | |
| | | | |
| Distributions (3/1/17–2/28/18) | | | | | | | | | | | | | | | | |
| | | | |
| Share Class | | Net Investment
Income | | | | | | | | | | |
| | | | |
A | | | $0.3099 | | | | | | | | | | | | | |
| | | | | | | | | | | | | | | | | |
| | | | |
C | | | $0.2427 | | | | | | | | | | | | | |
| | | | | | | | | | | | | | | | | |
| | | | |
R6 (8/1/17–2/28/18) | | | $0.1923 | | | | | | | | | | | | | |
| | | | | | | | | | | | | | | | | |
| | | | |
Advisor | | | $0.3219 | | | | | | | | | | | | | |
| | | | | | | | | | | | | | | | | |
|
| Total Annual Operating Expenses10 | |
| | | | |
| Share Class | | With Waiver | | | Without Waiver | | | | | | | |
| | | | |
A | | | 0.56% | | | | 0.66% | | | | | | | | | |
| | | | | | | | | | | | | | | | | |
| | | | |
Advisor | | | 0.46% | | | | 0.56% | | | | | | | | | |
| | | | | | | | | | | | | | | | | |
| | | | | | |
10 | | Annual Report | | franklintempleton.com |
FRANKLIN FEDERAL INTERMEDIATE-TERM TAX-FREE INCOME FUND
PERFORMANCE SUMMARY
Each class of shares is available to certain eligible investors and has different annual fees and expenses, as described in the prospectus.
All investments involve risks, including possible loss of principal. Because municipal bonds are sensitive to interest rate movements, the Fund’s yield and share price will fluctuate with market conditions. Bond prices generally move in the opposite direction of interest rates. Thus, as prices of bonds in the Fund adjust to a rise in interest rates, the Fund’s share price may decline. Changes in the credit rating of a bond, or in the credit rating or financial strength of a bond’s issuer, insurer or guarantor, may affect the bond’s value. The Fund may invest a significant part of its assets in municipal securities that finance similar types of projects, such as utilities, hospitals, higher education and transportation. A change that affects one project would likely affect all similar projects, thereby increasing market risk. The Fund is actively managed but there is no guarantee that the manager’s investment decisions will produce the desired results. The Fund’s prospectus also includes a description of the main investment risks.
1. The Fund has an expense reduction contractually guaranteed through 6/30/19. Fund investment results reflect the expense reduction; without this reduction, the results would have been lower.
2. Cumulative total return represents the change in value of an investment over the periods indicated.
3. Average annual total return represents the average annual change in value of an investment over the periods indicated. Return for less than one year, if any, has not been annualized.
4. Effective 12/1/08, the Fund began offering Advisor Class shares, which do not have sales charges or a Rule 12b-1 plan. Performance quotations for this class reflect the following methods of calculation: (a) For periods prior to 12/1/08, a restated figure is used based upon the Fund’s Class A performance, excluding the effect of Class A’s maximum initial sales charge, but reflecting the effect of the Class A Rule 12b-1 fees; and (b) for periods after 12/1/08, actual Advisor Class performance is used reflecting all charges and fees applicable to that class. Since 12/1/08 (commencement of sales), the cumulative and average annual total returns of Advisor Class shares were +49.71% and +4.46%.
5. Distribution rate is based on an annualization of the respective class’s February dividend and the maximum offering price (NAV for Advisor Class) per share on 2/28/18.
6. Taxable equivalent distribution rate and yield assume the 2018 maximum federal income tax rate of 37.00% plus 3.80% Medicare tax.
7. The Fund’s 30-day standardized yield is calculated over a trailing 30-day period using the yield to maturity on bonds and/or the dividends accrued on stocks. It may not equal the Fund’s actual income distribution rate, which reflects the Fund’s past dividends paid to shareholders.
8. Source: Morningstar. The Bloomberg Barclays Municipal Bond Index: 10-Year Component is the 10-year (8-12) component of the Municipal Bond Index, which is a market value-weighted index engineered for the long-term tax-exempt bond market. To be included in the index, bonds must be fixed rate, have at least one year to final maturity and be rated investment grade (Baa3/BBB- or higher) by at least two of the following agencies: Moody’s, S&P and Fitch.
9. Source: Bureau of Labor Statistics, bls.gov/cpi. The Consumer Price Index is a commonly used measure of the inflation rate.
10. Figures are as stated in the Fund’s current prospectus and may differ from the expense ratios disclosed in the Your Fund’s Expenses and Financial Highlights sections in this report. In periods of market volatility, assets may decline significantly, causing total annual Fund operating expenses to become higher than the figures shown.
See www.franklintempletondatasources.com for additional data provider information.
| | | | | | |
franklintempleton.com | | | | Annual Report | | 11 |
FRANKLIN FEDERAL INTERMEDIATE-TERM TAX-FREE INCOME FUND
Your Fund’s Expenses
As a Fund shareholder, you can incur two types of costs: (1) transaction costs, including sales charges (loads) on Fund purchases and redemptions; and (2) ongoing Fund costs, including management fees, distribution and service (12b-1) fees, and other Fund expenses. All mutual funds have ongoing costs, sometimes referred to as operating expenses. The table below shows ongoing costs of investing in the Fund and can help you understand these costs and compare them with those of other mutual funds. The table assumes a $1,000 investment held for the six months indicated.
Actual Fund Expenses
The table below provides information about actual account values and actual expenses in the columns under the heading “Actual.” In these columns the Fund’s actual return, which includes the effect of Fund expenses, is used to calculate the “Ending Account Value” for each class of shares. You can estimate the expenses you paid during the period by following these steps (of course, your account value and expenses will differ from those in this illustration): Divide your account value by $1,000 (if your account had an $8,600 value, then $8,600 ÷ $1,000 = 8.6). Then multiply the result by the number in the row for your class of shares under the headings “Actual” and “Expenses Paid During Period” (if Actual Expenses Paid During Period were $7.50, then 8.6 x $7.50 = $64.50). In this illustration, the actual expenses paid this period are $64.50.
Hypothetical Example for Comparison with Other Funds
Under the heading “Hypothetical” in the table, information is provided about hypothetical account values and hypothetical expenses based on the Fund’s actual expense ratio and an assumed rate of return of 5% per year before expenses, which is not the Fund’s actual return. This information may not be used to estimate the actual ending account balance or expenses you paid for the period, but it can help you compare ongoing costs of investing in the Fund with those of other funds. To do so, compare this 5% hypothetical example for the class of shares you hold with the 5% hypothetical examples that appear in the shareholder reports of other funds.
Please note that expenses shown in the table are meant to highlight ongoing costs and do not reflect any transactional costs. Therefore, information under the heading “Hypothetical” is useful in comparing ongoing costs only, and will not help you compare total costs of owning different funds. In addition, if transactional costs were included, your total costs would have been higher.
| | | | | | | | | | | | | | | | | | |
| | | | | | | Actual | | | | Hypothetical | | | | |
| | | | | | | (actual return after expenses) | | | | (5% annual return before expenses) | | | | |
| | | | | | | | | Expenses | | | | | | Expenses | | | | Net |
| | | Beginning | | | | Ending | | Paid During | | | | Ending | | Paid During | | | | Annualized |
| Share | | Account | | | | Account | | Period | | | | Account | | Period | | | | Expense |
| Class | | Value 9/1/17 | | | | Value 2/28/18 | | 9/1/17–2/28/181,2 | | | | Value 2/28/18 | | 9/1/17–2/28/181,2 | | | | Ratio2 |
| A | | $1,000 | | | | $983.30 | | $3.25 | | | | $1,021.52 | | $3.31 | | | | 0.66% |
| C | | $1,000 | | | | $981.40 | | $5.94 | | | | $1,018.79 | | $6.06 | | | | 1.21% |
| R6 | | $1,000 | | | | $984.10 | | $2.36 | | | | $1,022.41 | | $2.41 | | | | 0.48% |
| Advisor | | $1,000 | | | | $983.80 | | $2.75 | | | | $1,022.02 | | $2.81 | | | | 0.56% |
1. Expenses are equal to the annualized expense ratio for the six-month period as indicated above—in the far right column—multiplied by the simple average account value over the period indicated, and then multiplied by 181/365 to reflect the one-half year period.
2. Reflects expenses after fee waivers and expense reimbursements.
| | | | | | |
12 | | Annual Report | | | | franklintempleton.com |
FRANKLIN FEDERAL INTERMEDIATE-TERM TAX-FREE INCOME FUND
YOUR FUND’S EXPENSES
There were decreases in Fund expenses that occurred during the Fund’s most recent fiscal half-year that affected the information in the expense table above. The table below reflects Fund expenses had those changes been in place throughout the entire most recent fiscal half-year.
| | | | | | | | | | | | | | | | | | |
| | | | | | | Actual | | | | Hypothetical | | | | |
| | | | | | | (actual return after expenses) | | | | (5% annual return before expenses) | | | | |
| | | | | | | | | Expenses | | | | | | Expenses | | | | Net |
| | | Beginning | | | | Ending | | Paid During | | | | Ending | | Paid During | | | | Annualized |
| Share | | Account | | | | Account | | Period | | | | Account | | Period | | | | Expense |
| Class | | Value 9/1/17 | | | | Value 2/28/18 | | 9/1/17–2/28/181,2 | | | | Value 2/28/18 | | 9/1/17–2/28/181,2 | | | | Ratio2 |
| A | | $1,000 | | | | $983.30 | | $2.75 | | | | $1,022.02 | | $2.81 | | | | 0.56% |
| C | | $1,000 | | | | $981.40 | | $5.45 | | | | $1,019.29 | | $5.56 | | | | 1.11% |
| R6 | | $1,000 | | | | $984.10 | | $1.92 | | | | $1,022.86 | | $1.96 | | | | 0.39% |
| Advisor | | $1,000 | | | | $983.80 | | $2.26 | | | | $1,022.51 | | $2.31 | | | | 0.46% |
1. Expenses are equal to the annualized expense ratio for the six-month period as indicated above—in the far right column—as if it has been in effect throughout the entire six-month period, multiplied by the simple average account value over the period indicated, and then multiplied by 181/365 to reflect the one-half year period.
2. Reflects expenses after fee waivers and expense reimbursements.
| | | | | | |
franklintempleton.com | | | | Annual Report | | 13 |
Franklin Federal Limited-Term Tax-Free Income Fund
This annual report for Franklin Federal Limited-Term Tax-Free Income Fund covers the fiscal year ended February 28, 2018.
Your Fund’s Goal and Main Investments
The Fund seeks to provide as high a level of income exempt from federal income taxes as is consistent with prudent investment management and preservation of capital by investing at least 80% of its total assets in securities that pay interest free from such taxes.1 The Fund maintains a dollar-weighted average portfolio maturity (the time in which the debt must be repaid) of five years or less.
Credit Quality Composition*
2/28/18
| | | | |
| Ratings | | % of Total
Investments | |
| |
AAA | | | 30.65% | |
| | | | | |
| |
AA | | | 46.87% | |
| | | | | |
| |
A | | | 14.66% | |
| | | | | |
| |
Refunded | | | 3.07% | |
| | | | | |
| |
SP-1 | | | 2.60% | |
| | | | | |
| |
Not Rated | | | 0.67% | |
| | | | | |
*Securities, except for those labeled Not Rated, are assigned ratings by one or more Nationally Recognized Statistical Credit Rating Organizations (NRSROs), such as Standard & Poor’s, Moody’s and Fitch, that can be considered by the investment manager as part of its independent securities analysis. When ratings from multiple agencies are available, the highest is used, consistent with the portfolio investment process. Ratings reflect an NRSRO’s opinion of an issuer’s creditworthiness and typically range from SP-1 (highest) to SP-3 (lowest) for short-term bonds and from AAA (highest) to D (lowest) for long-term bonds. The Below Investment Grade category consists of bonds rated below BBB-. The Refunded category generally consists of refunded bonds secured by US government or other high-quality securities and not rerated by an NRSRO. The Not Rated category consists of ratable securities that have not been rated by an NRSRO. Cash and equivalents are excluded from this breakdown.
Performance Overview
The Fund’s Class A share price, as measured by net asset value, decreased from $10.37 on February 28, 2017, to $10.29 on February 28, 2018. The Fund’s Class A shares paid dividends totaling 8.12 cents per share for the reporting period.2 The Performance Summary beginning on page 16 shows that at the end of this reporting period the Fund’s Class A shares’ distribution rate was 0.88%, based on an annualization of the
Dividend Distributions*
3/1/17–2/28/18
| | | | | | | | | | | | |
| | | Dividend per Share (cents) | |
| Month | | Class A | | | Class R6** | | | Advisor
Class | |
| | | |
March | | | 0.70 | | | | — | | | | 0.83 | |
| | | | | | | | | | | | | |
| | | |
April | | | 0.70 | | | | — | | | | 0.83 | |
| | | | | | | | | | | | | |
| | | |
May | | | 0.70 | | | | — | | | | 0.83 | |
| | | | | | | | | | | | | |
| | | |
June | | | 0.70 | | | | — | | | | 0.83 | |
| | | | | | | | | | | | | |
| | | |
July | | | 0.70 | | | | — | | | | 0.83 | |
| | | | | | | | | | | | | |
| | | |
August | | | 0.70 | | | | 0.83 | | | | 0.83 | |
| | | | | | | | | | | | | |
| | | |
September | | | 0.62 | | | | 0.78 | | | | 0.75 | |
| | | | | | | | | | | | | |
| | | |
October | | | 0.62 | | | | 0.78 | | | | 0.75 | |
| | | | | | | | | | | | | |
| | | |
November | | | 0.62 | | | | 0.78 | | | | 0.75 | |
| | | | | | | | | | | | | |
| | | |
December | | | 0.62 | | | | 0.77 | | | | 0.74 | |
| | | | | | | | | | | | | |
| | | |
January | | | 0.67 | | | | 0.82 | | | | 0.79 | |
| | | | | | | | | | | | | |
| | | |
February | | | 0.77 | | | | 0.92 | | | | 0.89 | |
| | | | | | | | | | | | | |
| | | |
Total | | | 8.12 | | | | 5.68 | | | | 9.65 | |
| | | | | | | | | | | | | |
*The distribution amount is the sum of all net investment income distributions for the period shown. Assumes shares were purchased and held for the entire accrual period. Since dividends accrue daily, your actual distributions will vary depending on the date you purchased your shares and any account activity. All Fund distributions will vary depending upon current market conditions, and past distributions are not indicative of future trends.
**Effective 8/1/17, the Fund began offering Class R6 shares. See the prospectus for details.
0.77 cent per share February dividend and the maximum offering price of $10.53 on February 28, 2018. An investor in the 2018 maximum federal income tax bracket of 40.80% (including 3.80% Medicare tax) would need to earn a distribution rate of 1.49% from a taxable investment to match the Fund’s Class A tax-free distribution rate. For other performance data, please see the Performance Summary.
Performance data represent past performance, which does not guarantee future results. Investment return and principal value will fluctuate, and you may have a gain or loss when you sell your shares. Current performance may differ from figures shown. For most recent month-end performance, go to franklintempleton.com or call (800) 342-5236.
1. Dividends are generally subject to state and local taxes, if any. For investors subject to alternative minimum tax, a small portion of Fund dividends may be taxable. Distributions of capital gains are generally taxable. To avoid imposition of 28% backup withholding on all Fund distributions and redemption proceeds, US investors must be properly certified on Form W-9 and non-US investors on Form W-8BEN.
2. The distribution amount is the sum of all net investment income distributions for the period shown. Assumes shares were purchased and held for the entire accrual period. Since dividends accrue daily, your actual distributions will vary depending on the date you purchased your shares and any account activity. All Fund distributions will vary depending upon current market conditions, and past distributions are not indicative of future trends.
The dollar value, number of shares or principal amount, and names of all portfolio holdings are listed in the Fund’s Statement of Investments (SOI).
The SOI begins on page 66.
| | | | |
14 | | Annual Report | | franklintempleton.com |
FRANKLIN FEDERAL LIMITED-TERM TAX-FREE INCOME FUND
Manager’s Discussion
We used various investment strategies during the 12 months under review as we sought to maximize tax-free income for shareholders. Please read the Investment Strategy and Manager’s Discussion on page 5 for more information.
Portfolio Composition
2/28/18
| | | | |
| | |
| % of Total
Investments |
* |
| |
General Obligation | | | 39.4% | |
| | | | | |
| |
Utilities | | | 16.8% | |
| | | | | |
| |
Refunded** | | | 12.2% | |
| | | | | |
| |
Transportation | | | 10.0% | |
| | | | | |
| |
Higher Education | | | 8.2% | |
| | | | | |
| |
Subject to Government Appropriations | | | 4.3% | |
| | | | | |
| |
Housing | | | 2.9% | |
| | | | | |
| |
Tax-Supported | | | 2.2% | |
| | | | | |
| |
Hospital & Health Care | | | 2.2% | |
| | | | | |
| |
Other Revenue | | | 1.8% | |
| | | | | |
*Does not include cash and cash equivalents.
**Includes all refunded bonds; the percentage may differ from that in the Credit Quality Composition.
Thank you for your continued participation in Franklin Federal Limited-Term Tax-Free Income Fund. We believe our conservative, buy-and-hold investment strategy can help us achieve high, current, tax-free income for shareholders.
The foregoing information reflects our analysis, opinions and portfolio holdings as of February 28, 2018, the end of the reporting period. The way we implement our main investment strategies and the resulting portfolio holdings may change depending on factors such as market and economic conditions. These opinions may not be relied upon as investment advice or an offer for a particular security. The information is not a complete analysis of every aspect of any market, state, industry, security or the Fund. Statements of fact are from sources considered reliable, but the investment manager makes no representation or warranty as to their completeness or accuracy. Although historical performance is no guarantee of future results, these insights may help you understand our investment management philosophy.
| | | | | | |
franklintempleton.com | | | | Annual Report | | 15 |
FRANKLIN FEDERAL LIMITED-TERM TAX-FREE INCOME FUND
Performance Summary as of February 28, 2018
The performance tables and graphs do not reflect any taxes that a shareholder would pay on Fund dividends, capital gain distributions, if any, or any realized gains on the sale of Fund shares. Total return reflects reinvestment of the Fund’s dividends and capital gain distributions, if any, and any unrealized gains or losses. Your dividend income will vary depending on dividends or interest paid by securities in the Fund’s portfolio, adjusted for operating expenses of each class. Capital gain distributions are net profits realized from the sale of portfolio securities.
Performance as of 2/28/181
Cumulative total return excludes sales charges. Average annual total return includes maximum sales charges. Sales charges will vary depending on the size of the investment and the class of share purchased. The maximum is 2.25% and the minimum is 0%. Class A: 2.25% maximum initial sales charge; Advisor Class: no sales charges. For other share classes, visit franklintempleton.com.
| | | | | | | | |
| Share Class | |
| Cumulative
Total Return |
2 | |
| Average Annual
Total Return |
3 |
| | |
A | | | | | | | | |
| | |
1-Year | | | +0.01% | | | | -2.25% | |
| | | | | | | | | |
| | |
5-Year | | | +2.13% | | | | -0.03% | |
| | | | | | | | | |
| | |
10-Year | | | +20.61% | | | | +1.66% | |
| | | | | | | | | |
| | |
Advisor4 | | | | | | | | |
| | |
1-Year | | | +0.16% | | | | +0.16% | |
| | | | | | | | | |
| | |
5-Year | | | +2.99% | | | | +0.59% | |
| | | | | | | | | |
| | |
10-Year | | | +21.88% | | | | +2.00% | |
| | | | | | | | | |
| | | | | | | | | | | | | | | | | | | | | | | | | | | | | | | | |
| | | | | | | | | | | | | | | | | | | | | Taxable Equivalent | |
| | | Distribution | | | Taxable Equivalent | | | | | | 30 Day Standardized Yield7 | | | | | | 30-Day Standardized Yield6 | |
| Share Class | | | Rate | 5 | | | Distribution Rate | 6 | | | | | | | (with waiver) | | | | (without waiver) | | | | | | | | (with waiver) | | | | (without waiver) | |
| | | | | | | | |
A | | | 0.88% | | | | 1.49% | | | | | | | | 1.16% | | | | 1.01% | | | | | | | | 1.96% | | | | 1.71% | |
| | | | | | | | | | | | | | | | | | | | | | | | | | | | | | | | | |
| | | | | | | | |
Advisor | | | 1.04% | | | | 1.76% | | | | | | | | 1.32% | | | | 1.17% | | | | | | | | 2.23% | | | | 1.98% | |
| | | | | | | | | | | | | | | | | | | | | | | | | | | | | | | | | |
Performance data represent past performance, which does not guarantee future results. Investment return and principal value will fluctuate, and you may have a gain or loss when you sell your shares. Current performance may differ from figures shown. For most recent month-end performance, go to franklintempleton.com or call (800) 342-5236.
See page 18 for Performance Summary footnotes.
| | | | | | |
16 | | Annual Report | | | | franklintempleton.com |
FRANKLIN FEDERAL LIMITED-TERM TAX-FREE INCOME FUND
PERFORMANCE SUMMARY
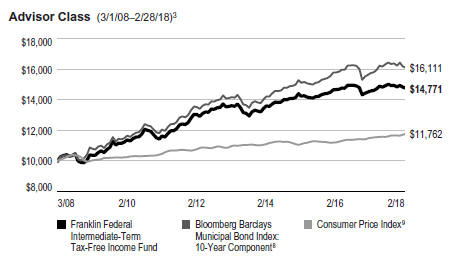
Total Return Index Comparison for a Hypothetical $10,000 Investment1
Total return represents the change in value of an investment over the periods shown. It includes any applicable maximum sales charge, Fund expenses, account fees and reinvested distributions. The unmanaged indexes include reinvestment of any income or distributions. They differ from the Fund in composition and do not pay management fees or expenses. One cannot invest directly in an index.
See page 18 for Performance Summary footnotes.
| | | | | | |
franklintempleton.com | | | | Annual Report | | 17 |
FRANKLIN FEDERAL LIMITED-TERM TAX-FREE INCOME FUND
PERFORMANCE SUMMARY
Net Asset Value
| | | | | | | | | | | | | | | | |
| Share Class (Symbol) | | 2/28/18 | | | 8/1/17 | | | 2/28/17 | | | Change | |
| | | | |
A (FFTFX) | | | $10.29 | | | | N/A | | | | $10.37 | | | | -$0.08 | |
| | | | | | | | | | | | | | | | | |
| | | | |
R6 (FFTRX) | | | $10.28 | | | | $10.37 | | | | N/A | | | | -$0.09 | |
| | | | | | | | | | | | | | | | | |
| | | | |
Advisor (FTFZX) | | | $10.29 | | | | N/A | | | | $10.37 | | | | -$0.08 | |
| | | | | | | | | | | | | | | | | |
| | | | |
| Distributions (3/1/17–2/28/18) | | | | | | | | | | | | | | | | |
| | | | |
| Share Class | | Net Investment
Income | | | | | | | | | | |
| | | | |
A | | | $0.0812 | | | | | | | | | | | | | |
| | | | | | | | | | | | | | | | | |
| | | | |
R6 (8/1/17–2/28/18) | | | $0.0568 | | | | | | | | | | | | | |
| | | | | | | | | | | | | | | | | |
| | | | |
Advisor | | | $0.0965 | | | | | | | | | | | | | |
| | | | | | | | | | | | | | | | | |
| |
| Total Annual Operating Expenses10 | | | | | |
| | | | |
| Share Class | | With Waiver | | | Without Waiver | | | | | | | |
| | | | |
A | | | 0.55% | | | | 0.70% | | | | | | | | | |
| | | | | | | | | | | | | | | | | |
| | | | |
Advisor | | | 0.40% | | | | 0.55% | | | | | | | | | |
| | | | | | | | | | | | | | | | | |
Each class of shares is available to certain eligible investors and has different annual fees and expenses, as described in the prospectus.
All investments involve risks, including possible loss of principal. Because municipal bonds are sensitive to interest rate movements, the Fund’s yield and share price will fluctuate with market conditions. Bond prices generally move in the opposite direction of interest rates. Thus, as prices of bonds in the Fund adjust to a rise in interest rates, the Fund’s share price may decline. Changes in the credit rating of a bond, or in the credit rating or financial strength of a bond’s issuer, insurer or guarantor, may affect the bond’s value. The Fund may invest a significant part of its assets in municipal securities that finance similar types of projects, such as utilities, hospitals, higher education and transportation. A change that affects one project would likely affect all similar projects, thereby increasing market risk. The Fund is actively managed but there is no guarantee that the manager’s investment decisions will produce the desired results. The Fund’s prospectus also includes a description of the main investment risks.
1. The Fund has an expense reduction contractually guaranteed through 6/30/19. Fund investment results reflect the expense reduction; without this reduction, the results would have been lower.
2. Cumulative total return represents the change in value of an investment over the periods indicated.
3. Average annual total return represents the average annual change in value of an investment over the periods indicated. Return for less than one year, if any, has not been annualized.
4. Effective 2/1/11, the Fund began offering Advisor Class shares, which do not have sales charges or a Rule 12b-1 plan. Performance quotations for this class reflect the following methods of calculation: (a) For periods prior to 2/1/11, a restated figure is used based upon the Fund’s Class A performance, excluding the effect of Class A’s maximum initial sales charge, but reflecting the effect of the Class A Rule 12b-1 fees; and (b) for periods after 2/1/11, actual Advisor Class performance is used reflecting all charges and fees applicable to that class. Since 2/1/11 (commencement of sales), the cumulative and average annual total return of Advisor Class shares were +10.09% and +1.37%.
5. Distribution rate is based on an annualization of the respective class’s February dividend and the maximum offering price (NAV for Advisor Class) per share on 2/28/18.
6. Taxable equivalent distribution rate and yield assume the 2018 maximum federal income tax rate of 37.00% plus 3.80% Medicare tax.
7. The Fund’s 30-day standardized yield is calculated over a trailing 30-day period using the yield to maturity on bonds and/or the dividends accrued on stocks. It may not equal the Fund’s actual income distribution rate, which reflects the Fund’s past dividends paid to shareholders.
8. Source: Morningstar. The Bloomberg Barclays Municipal Bond Index: 5-Year Component is the 5-year (4-6) component of the Municipal Bond Index, which is a market value-weighted index engineered for the long-term tax-exempt bond market. To be included in the index, bonds must be fixed rate, have at least one year to final maturity and be rated investment grade (Baa3/BBB- or higher) by at least two of the following agencies: Moody’s, S&P and Fitch.
9. Source: Bureau of Labor Statistics, bls.gov/cpi. The Consumer Price Index is a commonly used measure of the inflation rate.
10. Figures are as stated in the Fund’s current prospectus and may differ from the expense ratios disclosed in the Your Fund’s Expenses and Financial Highlights sections in this report. In periods of market volatility, assets may decline significantly, causing total annual Fund operating expenses to become higher than the figures shown.
See www.franklintempletondatasources.com for additional data provider information.
| | | | | | |
18 | | Annual Report | | | | franklintempleton.com |
FRANKLIN FEDERAL LIMITED-TERM TAX-FREE INCOME FUND
Your Fund’s Expenses
As a Fund shareholder, you can incur two types of costs: (1) transaction costs, including sales charges (loads) on Fund purchases and redemptions; and (2) ongoing Fund costs, including management fees, distribution and service (12b-1) fees, and other Fund expenses. All mutual funds have ongoing costs, sometimes referred to as operating expenses. The table below shows ongoing costs of investing in the Fund and can help you understand these costs and compare them with those of other mutual funds. The table assumes a $1,000 investment held for the six months indicated.
Actual Fund Expenses
The table below provides information about actual account values and actual expenses in the columns under the heading “Actual.” In these columns the Fund’s actual return, which includes the effect of Fund expenses, is used to calculate the “Ending Account Value” for each class of shares. You can estimate the expenses you paid during the period by following these steps (of course, your account value and expenses will differ from those in this illustration): Divide your account value by $1,000 (if your account had an $8,600 value, then $8,600 ÷ $1,000 = 8.6). Then multiply the result by the number in the row for your class of shares under the headings “Actual” and “Expenses Paid During Period” (if Actual Expenses Paid During Period were $7.50, then 8.6 x $7.50 = $64.50). In this illustration, the actual expenses paid this period are $64.50.
Hypothetical Example for Comparison with Other Funds
Under the heading “Hypothetical” in the table, information is provided about hypothetical account values and hypothetical expenses based on the Fund’s actual expense ratio and an assumed rate of return of 5% per year before expenses, which is not the Fund’s actual return. This information may not be used to estimate the actual ending account balance or expenses you paid for the period, but it can help you compare ongoing costs of investing in the Fund with those of other funds. To do so, compare this 5% hypothetical example for the class of shares you hold with the 5% hypothetical examples that appear in the shareholder reports of other funds.
Please note that expenses shown in the table are meant to highlight ongoing costs and do not reflect any transactional costs. Therefore, information under the heading “Hypothetical” is useful in comparing ongoing costs only, and will not help you compare total costs of owning different funds. In addition, if transactional costs were included, your total costs would have been higher.
| | | | | | | | | | | | | | | | | | |
| | | | | | | Actual | | | | Hypothetical | | | | |
| | | | | | | (actual return after expenses) | | | | (5% annual return before expenses) | | | | |
| | | | | | | | | Expenses | | | | | | Expenses | | | | Net |
| | | Beginning | | | | Ending | | Paid During | | | | Ending | | Paid During | | | | Annualized |
| Share | | Account | | | | Account | | Period | | | | Account | | Period | | | | Expense |
| Class | | Value 9/1/17 | | | | Value 2/28/18 | | 9/1/17–2/28/181,2 | | | | Value 2/28/18 | | 9/1/17–2/28/181,2 | | | | Ratio2 |
| A | | $1,000 | | | | $994.10 | | $3.07 | | | | $1,021.72 | | $3.11 | | | | 0.62% |
| R6 | | $1,000 | | | | $995.00 | | $2.13 | | | | $1,022.66 | | $2.16 | | | | 0.43% |
| Advisor | | $1,000 | | | | $995.80 | | $2.33 | | | | $1,022.46 | | $2.36 | | | | 0.47% |
1. Expenses are equal to the annualized expense ratio for the six-month period as indicated above—in the far right column—multiplied by the simple average account value over the period indicated, and then multiplied by 181/365 to reflect the one-half year period.
2. Reflects expenses after fee waivers and expense reimbursements.
| | | | | | |
franklintempleton.com | | | | Annual Report | | 19 |
Franklin High Yield Tax-Free Income Fund
This annual report for Franklin High Yield Tax-Free Income Fund covers the fiscal year ended February 28, 2018.
Your Fund’s Goal and Main Investments
The Fund seeks to provide a high current yield exempt from federal income taxes by investing at least 80% of its net assets in securities that pay interest free from such taxes.1 Its secondary goal is capital appreciation to the extent possible and consistent with the Fund’s principal investment goal.
Credit Quality Composition*
2/28/18
| | | | |
| Ratings | | % of Total
Investments | |
| |
AAA | | | 7.14% | |
| | | | | |
| |
AA | | | 17.56% | |
| | | | | |
| |
A | | | 25.77% | |
| | | | | |
| |
BBB | | | 18.97% | |
| | | | | |
| |
Below Investment Grade | | | 10.44% | |
| | | | | |
| |
Refunded | | | 10.90% | |
| | | | | |
| |
Not Rated | | | 9.22% | |
| | | | | |
*Securities, except for those labeled Not Rated, are assigned ratings by one or more Nationally Recognized Statistical Credit Rating Organizations (NRSROs), such as Standard & Poor’s, Moody’s and Fitch, that can be considered by the investment manager as part of its independent securities analysis. When ratings from multiple agencies are available, the highest is used, consistent with the portfolio investment process. Ratings reflect an NRSRO’s opinion of an issuer’s creditworthiness and typically range from AAA (highest) to D (lowest). The Below Investment Grade category consists of bonds rated below BBB-. The Refunded category generally consists of refunded bonds secured by US government or other high-quality securities and not rerated by an NRSRO. The Not Rated category consists of ratable securities that have not been rated by an NRSRO. Cash and equivalents are excluded from this composition.
Performance Overview
The Fund’s Class A share price, as measured by net asset value, decreased from $10.25 on February 28, 2017, to $9.94 on February 28, 2018. The Fund’s Class A shares paid dividends totaling 44.49 cents per share for the reporting period.2 The Performance Summary beginning on page 22 shows that at the end of this reporting period the Fund’s Class A shares’ distribution rate was 4.18%, based on an annualization of the 3.62 cent per share February dividend and the maximum
Dividend Distributions*
3/1/17–2/28/18
| | | | | | | | | | | | | | | | | | | | |
| | | Dividend per Share (cents) | |
| Month | | Class A | | | Class M** | | | Class C | | | Class R6*** | | | Advisor
Class | |
| | | | | |
March | | | 3.87 | | | | — | | | | 3.39 | | | | — | | | | 3.95 | |
| | | | | | | | | | | | | | | | | | | | | |
| | | | | |
April | | | 3.87 | | | | — | | | | 3.39 | | | | — | | | | 3.95 | |
| | | | | | | | | | | | | | | | | | | | | |
| | | | | |
May | | | 3.82 | | | | — | | | | 3.34 | | | | — | | | | 3.90 | |
| | | | | | | | | | | | | | | | | | | | | |
| | | | | |
June | | | 3.77 | | | | — | | | | 3.28 | | | | — | | | | 3.85 | |
| | | | | | | | | | | | | | | | | | | | | |
| | | | | |
July | | | 3.72 | | | | — | | | | 3.23 | | | | — | | | | 3.80 | |
| | | | | | | | | | | | | | | | | | | | | |
| | | | | |
August | | | 3.67 | | | | — | | | | 3.18 | | | | 3.67 | | | | 3.75 | |
| | | | | | | | | | | | | | | | | | | | | |
| | | | | |
September | | | 3.67 | | | | — | | | | 3.18 | | | | 3.79 | | | | 3.75 | |
| | | | | | | | | | | | | | | | | | | | | |
| | | | | |
October | | | 3.62 | | | | — | | | | 3.13 | | | | 3.74 | | | | 3.70 | |
| | | | | | | | | | | | | | | | | | | | | |
| | | | | |
November | | | 3.62 | | | | — | | | | 3.13 | | | | 3.74 | | | | 3.70 | |
| | | | | | | | | | | | | | | | | | | | | |
| | | | | |
December | | | 3.62 | | | | — | | | | 3.14 | | | | 3.73 | | | | 3.70 | |
| | | | | | | | | | | | | | | | | | | | | |
| | | | | |
January | | | 3.62 | | | | 0.67 | | | | 3.14 | | | | 3.73 | | | | 3.70 | |
| | | | | | | | | | | | | | | | | | | | | |
| | | | | |
February | | | 3.62 | | | | 3.49 | | | | 3.14 | | | | 3.73 | | | | 3.70 | |
| | | | | | | | | | | | | | | | | | | | | |
| | | | | |
Total | | | 44.49 | | | | 4.16 | | | | 38.67 | | | | 26.13 | | | | 45.45 | |
| | | | | | | | | | | | | | | | | | | | | |
*The distribution amount is the sum of all net investment income distributions for the period shown. Assumes shares were purchased and held for the entire accrual period. Since dividends accrue daily, your actual distributions will vary depending on the date you purchased your shares and any account activity. All Fund distributions will vary depending upon current market conditions, and past distributions are not indicative of future trends.
**Effective 1/25/18, the Fund began offering Class M shares. See the prospectus for details.
***Effective 8/1/17, the Fund began offering Class R6 shares. See the prospectus for details.
offering price of $10.38 on February 28, 2018. An investor in the 2018 maximum federal income tax bracket of 40.80% (including 3.80% Medicare tax) would need to earn a distribution rate of 7.06% from a taxable investment to match the Fund’s Class A tax-free distribution rate. For other performance data, please see the Performance Summary. Dividend distributions were affected by low interest rates during the period. This and other factors resulted in reduced income for the portfolio and caused dividends to be lower at the end of the period.
Performance data represent past performance, which does not guarantee future results. Investment return and principal value will fluctuate, and you may have a gain or loss when you sell
1. Dividends are generally subject to state and local taxes, if any. For investors subject to alternative minimum tax, a small portion of Fund dividends may be taxable. Distributions of capital gains are generally taxable. To avoid imposition of 28% backup withholding on all Fund distributions and redemption proceeds, US investors must be properly certified on Form W-9 and non-US investors on Form W-8BEN
2. The distribution amount is the sum of all net investment income distributions for the period shown. Assumes shares were purchased and held for the entire accrual period. Since dividends accrue daily, your actual distributions will vary depending on the date you purchased your shares and any account activity. All Fund distributions will vary depending upon current market conditions, and past distributions are not indicative of future trends.
The dollar value, number of shares or principal amount, and names of all portfolio holdings are listed in the Fund’s Statement of Investments (SOI).
The SOI begins on page 79.
| | | | |
20 | | Annual Report | | franklintempleton.com |
FRANKLIN HIGH YIELD TAX-FREE INCOME FUND
your shares. Current performance may differ from figures shown. For most recent month-end performance, go to franklintempleton.com or call (800) 342-5236.
Manager’s Discussion
We used various investment strategies during the 12 months under review as we sought to maximize tax-free income for shareholders. Please read the Investment Strategy and Manager’s Discussion on page 5 for more information.
The Fund holds a very small portion of its assets in Puerto Rico bonds, which decreased in price over the period. Puerto Rico and its municipal issuers continue to experience significant financial difficulties and we continue to monitor developments affecting them.
The Fund continued to seek high, current, tax-free income for its shareholders during the reporting period. Consistent with our strategy, the Fund did not use leverage or credit derivatives to boost short-term returns, and we were careful to not overexpose the portfolio to any one credit sector.
Thank you for your continued participation in Franklin High Yield Tax-Free Income Fund. We believe our conservative, buy-and-hold investment strategy can help us achieve high, current, tax-free income for shareholders.
The foregoing information reflects our analysis, opinions and portfolio holdings as of February 28, 2018, the end of the reporting period. The way we implement our main investment strategies and the resulting portfolio holdings may change depending on factors such as market and economic conditions. These opinions may not be relied upon as investment advice or an offer for a particular security. The information is not a complete analysis of every aspect of any market, state, industry, security or the Fund. Statements of fact are from sources considered reliable, but the investment manager makes no representation or warranty as to their completeness or accuracy. Although historical performance is no guarantee of future results, these insights may help you understand our investment management philosophy.
Portfolio Composition
2/28/18
| | | | |
| | |
| % of Total
Investments |
* |
| |
Refunded** | | | 19.8% | |
| | | | | |
| |
Utilities | | | 18.7% | |
| | | | | |
| |
Transportation | | | 16.6% | |
| | | | | |
| |
Hospital & Health Care | | | 14.3% | |
| | | | | |
| |
General Obligation | | | 7.7% | |
| | | | | |
| |
Tax-Supported | | | 5.9% | |
| | | | | |
| |
Other Revenue | | | 4.5% | |
| | | | | |
| |
Subject to Government Appropriations | | | 4.2% | |
| | | | | |
| |
Corporate-Backed | | | 4.1% | |
| | | | | |
| |
Higher Education | | | 2.4% | |
| | | | | |
| |
Housing | | | 1.8% | |
| | | | | |
*Does not include cash and cash equivalents.
**Includes all refunded bonds; the percentage may differ from that in the Credit Quality Composition.
| | | | | | |
franklintempleton.com | | | | Annual Report | | 21 |
FRANKLIN HIGH YIELD TAX-FREE INCOME FUND
Performance Summary as of February 28, 2018
The performance tables and graphs do not reflect any taxes that a shareholder would pay on Fund dividends, capital gain distributions, if any, or any realized gains on the sale of Fund shares. Total return reflects reinvestment of the Fund’s dividends and capital gain distributions, if any, and any unrealized gains or losses. Your dividend income will vary depending on dividends or interest paid by securities in the Fund’s portfolio, adjusted for operating expenses of each class. Capital gain distributions are net profits realized from the sale of portfolio securities.
Performance as of 2/28/18
Cumulative total return excludes sales charges. Average annual total return includes maximum sales charges. Sales charges will vary depending on the size of the investment and the class of share purchased. The maximum is 4.25% and the minimum is 0%. Class A: 4.25% maximum initial sales charge; Advisor Class: no sales charges. For other share classes, visit franklintempleton.com.
| | | | | | | | |
| Share Class | |
| Cumulative
Total Return |
1 | |
| Average Annual
Total Return |
2 |
| | |
A | | | | | | | | |
| | |
1-Year | | | +1.30% | | | | -2.96% | |
| | | | | | | | | |
| | |
5-Year | | | +12.76% | | | | +1.54% | |
| | | | | | | | | |
| | |
10-Year | | | +60.85% | | | | +4.42% | |
| | | | | | | | | |
| | |
Advisor | | | | | | | | |
| | |
1-Year | | | +1.29% | | | | +1.29% | |
| | | | | | | | | |
| | |
5-Year | | | +13.25% | | | | +2.52% | |
| | | | | | | | | |
| | |
10-Year | | | +62.48% | | | | +4.97% | |
| | | | | | | | | |
| | | | | | | | | | | | | | | | |
| Share Class | |
| Distribution
Rate |
3 | |
| Taxable Equivalent
Distribution Rate |
4 | |
| 30-Day
Standardized Yield |
5 | |
| Taxable Equivalent 30-Day
Standardized Yield |
4 |
| | | | |
A | | | 4.18% | | | | 7.06% | | | | 2.39% | | | | 4.04% | |
| | | | | | | | | | | | | | | | | |
| | | | |
Advisor | | | 4.45% | | | | 7.52% | | | | 2.60% | | | | 4.39% | |
| | | | | | | | | | | | | | | | | |
Performance data represent past performance, which does not guarantee future results. Investment return and principal value will fluctuate, and you may have a gain or loss when you sell your shares. Current performance may differ from figures shown. For most recent month-end performance, go to franklintempleton.com or call (800) 342-5236.
See page 24 for Performance Summary footnotes.
| | | | | | |
22 | | Annual Report | | | | franklintempleton.com |
FRANKLIN HIGH YIELD TAX-FREE INCOME FUND
PERFORMANCE SUMMARY
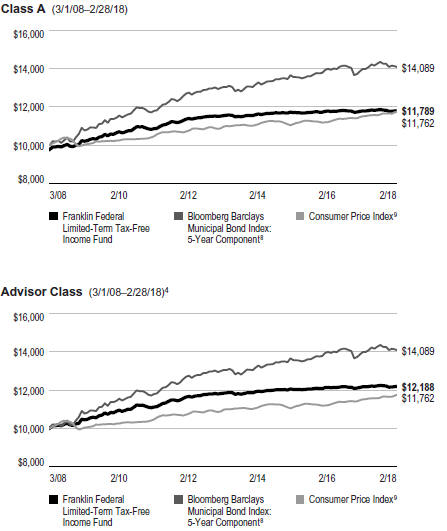
Total Return Index Comparison for a Hypothetical $10,000 Investment
Total return represents the change in value of an investment over the periods shown. It includes any applicable maximum sales charge, Fund expenses, account fees and reinvested distributions. The unmanaged indexes include reinvestment of any income or distributions. They differ from the Fund in composition and do not pay management fees or expenses. One cannot invest directly in an index.
See page 24 for Performance Summary footnotes.
| | | | | | |
franklintempleton.com | | | | Annual Report | | 23 |
FRANKLIN HIGH YIELD TAX-FREE INCOME FUND
PERFORMANCE SUMMARY
Net Asset Value
| | | | | | | | | | | | | | | | | | | | |
| Share Class (Symbol) | | 2/28/18 | | | 1/25/18 | | | 8/1/17 | | | 2/28/17 | | | Change | |
| | | | | |
A (FRHIX) | | | $ 9.94 | | | | N/A | | | | N/A | | | | $10.25 | | | | -$ 0.31 | |
| | | | | | | | | | | | | | | | | | | | | |
| | | | | |
M (FHYMX) | | | $ 9.94 | | | | $10.06 | | | | N/A | | | | N/A | | | | -$ 0.12 | |
| | | | | | | | | | | | | | | | | | | | | |
| | | | | |
C (FHYIX) | | | $10.13 | | | | N/A | | | | N/A | | | | $10.44 | | | | -$ 0.31 | |
| | | | | | | | | | | | | | | | | | | | | |
| | | | | |
R6 (FHYRX) | | | $ 9.98 | | | | N/A | | | | $10.31 | | | | N/A | | | | -$ 0.33 | |
| | | | | | | | | | | | | | | | | | | | | |
| | | | | |
Advisor (FHYVX) | | | $ 9.98 | | | | N/A | | | | N/A | | | | $10.30 | | | | -$ 0.32 | |
| | | | | | | | | | | | | | | | | | | | | |
| | |
| Distributions (3/1/17–2/28/18) | | | | | | | | | |
| | | | | |
| Share Class | | Net Investment
Income | | | | | | | | | | | | | |
| | | | | |
A | | | $0.4449 | | | | | | | | | | | | | | | | | |
| | | | | | | | | | | | | | | | | | | | | |
| | | | | |
M (1/25/18–2/28/18) | | | $0.0416 | | | | | | | | | | | | | | | | | |
| | | | | | | | | | | | | | | | | | | | | |
| | | | | |
C | | | $0.3867 | | | | | | | | | | | | | | | | | |
| | | | | | | | | | | | | | | | | | | | | |
| | | | | |
R6 (8/1/17–2/28/18) | | | $0.2613 | | | | | | | | | | | | | | | | | |
| | | | | | | | | | | | | | | | | | | | | |
| | | | | |
Advisor | | | $0.4545 | | | | | | | | | | | | | | | | | |
| | | | | | | | | | | | | | | | | | | | | |
|
| Total Annual Operating Expenses8 | |
| | | | | |
| Share Class | | | | | | | | | | | | | | | |
| | | | | |
A | | | 0.64% | | | | | | | | | | | | | | | | | |
| | | | | | | | | | | | | | | | | | | | | |
| | | | | |
Advisor | | | 0.54% | | | | | | | | | | | | | | | | | |
| | | | | | | | | | | | | | | | | | | | | |
Each class of shares is available to certain eligible investors and has different annual fees and expenses, as described in the prospectus.
All investments involve risks, including possible loss of principal. Because municipal bonds are sensitive to interest rate movements, the Fund’s yield and share price will fluctuate with market conditions. Bond prices generally move in the opposite direction of interest rates. Thus, as prices of bonds in the Fund adjust to a rise in interest rates, the Fund’s share price may decline. Investments in lower rated bonds include higher risk of default and loss of principal. The Fund holds a very small portion of its assets in Puerto Rico municipal bonds that have been impacted by recent adverse economic and market changes, which may cause the Fund’s share price to decline. Changes in the credit rating of a bond, or in the credit rating or financial strength of a bond’s issuer, insurer or guarantor, may affect the bond’s value. The Fund may invest a significant part of its assets in municipal securities that finance similar types of projects, such as utilities, hospitals, higher education and transportation. A change that affects one project would likely affect all similar projects, thereby increasing market risk. The Fund is actively managed but there is no guarantee that the manager’s investment decisions will produce the desired results. The Fund’s prospectus also includes a description of the main investment risks.
1. Cumulative total return represents the change in value of an investment over the periods indicated.
2. Average annual total return represents the average annual change in value of an investment over the periods indicated. Return for less than one year, if any, has not been annualized.
3. Distribution rate is based on an annualization of the respective class’s February dividend and the maximum offering price (NAV for Advisor Class) per share on 2/28/18.
4. Taxable equivalent distribution rate and yield assume the 2018 maximum federal income tax rate of 37.00% plus 3.80% Medicare tax.
5. The Fund’s 30-day standardized yield is calculated over a trailing 30-day period using the yield to maturity on bonds and/or the dividends accrued on stocks. It may not equal the Fund’s actual income distribution rate, which reflects the Fund’s past dividends paid to shareholders.
6. Source: Morningstar. The Bloomberg Barclays Municipal Bond Index is a market value-weighted index engineered for the long-term tax-exempt bond market. To be included in the index, bonds must be fixed rate, have at least one year to final maturity and be rated investment grade (Baa3/BBB- or higher) by at least two of the following agencies: Moody’s, S&P and Fitch.
7. Source: Bureau of Labor Statistics, bls.gov/cpi. The Consumer Price Index is a commonly used measure of the inflation rate.
8. Figures are as stated in the Fund’s current prospectus and may differ from the expense ratios disclosed in the Your Fund’s Expenses and Financial Highlights sections in this report. In periods of market volatility, assets may decline significantly, causing total annual Fund operating expenses to become higher than the figures shown.
See www.franklintempletondatasources.com for additional data provider information.
| | | | | | |
24 | | Annual Report | | | | franklintempleton.com |
FRANKLIN HIGH YIELD TAX-FREE INCOME FUND
Your Fund’s Expenses
As a Fund shareholder, you can incur two types of costs: (1) transaction costs, including sales charges (loads) on Fund purchases and redemptions; and (2) ongoing Fund costs, including management fees, distribution and service (12b-1) fees, and other Fund expenses. All mutual funds have ongoing costs, sometimes referred to as operating expenses. The table below shows ongoing costs of investing in the Fund and can help you understand these costs and compare them with those of other mutual funds. The table assumes a $1,000 investment held for the six months indicated.
Actual Fund Expenses
The table below provides information about actual account values and actual expenses in the columns under the heading “Actual.” In these columns the Fund’s actual return, which includes the effect of Fund expenses, is used to calculate the “Ending Account Value” for each class of shares. You can estimate the expenses you paid during the period by following these steps (of course, your account value and expenses will differ from those in this illustration): Divide your account value by $1,000 (if your account had an $8,600 value, then $8,600 ÷ $1,000 = 8.6). Then multiply the result by the number in the row for your class of shares under the headings “Actual” and “Expenses Paid During Period” (if Actual Expenses Paid During Period were $7.50, then 8.6 x $7.50 = $64.50). In this illustration, the actual expenses paid this period are $64.50.
Hypothetical Example for Comparison with Other Funds
Under the heading “Hypothetical” in the table, information is provided about hypothetical account values and hypothetical expenses based on the Fund’s actual expense ratio and an assumed rate of return of 5% per year before expenses, which is not the Fund’s actual return. This information may not be used to estimate the actual ending account balance or expenses you paid for the period, but it can help you compare ongoing costs of investing in the Fund with those of other funds. To do so, compare this 5% hypothetical example for the class of shares you hold with the 5% hypothetical examples that appear in the shareholder reports of other funds.
Please note that expenses shown in the table are meant to highlight ongoing costs and do not reflect any transactional costs. Therefore, information under the heading “Hypothetical” is useful in comparing ongoing costs only, and will not help you compare total costs of owning different funds. In addition, if transactional costs were included, your total costs would have been higher.
| | | | | | | | | | | | | | | | | | |
| | | | | | | Actual (actual return after expenses) | | | | Hypothetical
(5% annual return before expenses) | | | | |
| | | | | | | | | Expenses | | | | | | Expenses | | | | Net |
| | | Beginning | | | | Ending | | Paid During | | | | Ending | | Paid During | | | | Annualized |
| Share | | Account | | | | Account | | Period | | | | Account | | Period | | | | Expense |
| Class | | Value 9/1/171 | | | | Value 2/28/18 | | 9/1/17–2/28/182,3,4 | | | | Value 2/28/18 | | 9/1/17–2/28/183,4 | | | | Ratio4 |
| A | | $1,000 | | | | $986.10 | | $3.35 | | | | $1,021.42 | | $3.41 | | | | 0.68% |
| M | | $1,000 | | | | $992.20 | | $0.52 | | | | $1,022.02 | | $2.81 | | | | 0.56% |
| C | | $1,000 | | | | $983.60 | | $6.05 | | | | $1,018.70 | | $6.16 | | | | 1.23% |
| R6 | | $1,000 | | | | $986.80 | | $2.66 | | | | $1,022.12 | | $2.71 | | | | 0.54% |
| Advisor | | $1,000 | | | | $986.60 | | $2.86 | | | | $1,021.92 | | $2.91 | | | | 0.58% |
1. For Classes A, C, R6 and Advisor, 9/1/17 for Actual and Hypothetical. For Class M, 1/25/18 for Actual and 9/1/17 for Hypothetical.
2. For Classes A, C, R6 and Advisor, 9/1/17–2/28/18. For Class M, 1/25/18–2/28/18.
3. Expenses are equal to the annualized expense ratio for the six-month period as indicated above—in the far right column—multiplied by the simple average account value over the period indicated, and then multiplied by 181/365 to reflect the one-half year period. The multiplier is 34/365 for Actual Class M expenses to reflect the number of days since inception.
4. Reflects expenses after fee waivers and expense reimbursements, for Class R6.
| | | | | | |
franklintempleton.com | | | | Annual Report | | 25 |
Franklin Massachusetts Tax-Free Income Fund
This annual report for Franklin Massachusetts Tax-Free Income Fund covers the fiscal year ended February 28, 2018.
Your Fund’s Goal and Main Investments
The Fund seeks to provide as high a level of income exempt from federal and Massachusetts personal income taxes as is consistent with prudent investment management and preservation of capital by investing at least 80% of its total assets in securities that pay interest free from such taxes.1
Credit Quality Composition*
2/28/18
| | | | |
| Ratings | | % of Total
Investments | |
| |
AAA | | | 9.83% | |
| | | | | |
| |
AA | | | 55.88% | |
| | | | | |
| |
A | | | 16.76% | |
| | | | | |
| |
BBB | | | 1.33% | |
| | | | | |
| |
Refunded | | | 16.20% | |
| | | | | |
*Securities, except for those labeled Not Rated, are assigned ratings by one or more Nationally Recognized Statistical Credit Rating Organizations (NRSROs), such as Standard & Poor’s, Moody’s and Fitch, that can be considered by the investment manager as part of its independent securities analysis. When ratings from multiple agencies are available, the highest is used, consistent with the portfolio investment process. Ratings reflect an NRSRO’s opinion of an issuer’s creditworthiness and typically range from AAA (highest) to D (lowest). The Below Investment Grade category consists of bonds rated below BBB-. The Refunded category generally consists of refunded bonds secured by US government or other high-quality securities and not rerated by an NRSRO. The Not Rated category consists of ratable securities that have not been rated by an NRSRO. Cash and equivalents are excluded from this composition.
Performance Overview
The Fund’s Class A share price, as measured by net asset value, decreased from $11.63 on February 28, 2017, to $11.47 on February 28, 2018. The Fund’s Class A shares paid dividends totaling 35.50 cents per share for the reporting period.2 The Performance Summary beginning on page 28 shows that at the end of this reporting period the Fund’s Class A shares’ distribution rate was 2.88%, based on an annualization of the 2.88 cent per share February dividend and the maximum offering price of $11.98 on February 28, 2018. An investor in the 2018 maximum combined effective federal and Massachusetts personal income tax bracket of 45.90% (including 3.80% Medicare tax) would need to earn a
Dividend Distributions*
3/1/17–2/28/18
| | | | | | | | | | | | | | | | |
| | | Dividend per Share (cents) | |
| Month | | Class A | | | Class C | | | Class R6** | | | Advisor
Class | |
| | | | |
March | | | 3.15 | | | | 2.61 | | | | — | | | | 3.24 | |
| | | | | | | | | | | | | | | | | |
| | | | |
April | | | 3.15 | | | | 2.61 | | | | — | | | | 3.24 | |
| | | | | | | | | | | | | | | | | |
| | | | |
May | | | 3.15 | | | | 2.61 | | | | — | | | | 3.24 | |
| | | | | | | | | | | | | | | | | |
| | | | |
June | | | 3.15 | | | | 2.60 | | | | — | | | | 3.24 | |
| | | | | | | | | | | | | | | | | |
| | | | |
July | | | 3.02 | | | | 2.47 | | | | — | | | | 3.11 | |
| | | | | | | | | | | | | | | | | |
| | | | |
August | | | 2.90 | | | | 2.35 | | | | 2.92 | | | | 2.99 | |
| | | | | | | | | | | | | | | | | |
| | | | |
September | | | 2.78 | | | | 2.23 | | | | 2.90 | | | | 2.87 | |
| | | | | | | | | | | | | | | | | |
| | | | |
October | | | 2.78 | | | | 2.23 | | | | 2.90 | | | | 2.87 | |
| | | | | | | | | | | | | | | | | |
| | | | |
November | | | 2.78 | | | | 2.23 | | | | 2.90 | | | | 2.87 | |
| | | | | | | | | | | | | | | | | |
| | | | |
December | | | 2.88 | | | | 2.33 | | | | 2.99 | | | | 2.97 | |
| | | | | | | | | | | | | | | | | |
| | | | |
January | | | 2.88 | | | | 2.33 | | | | 2.99 | | | | 2.97 | |
| | | | | | | | | | | | | | | | | |
| | | | |
February | | | 2.88 | | | | 2.33 | | | | 2.99 | | | | 2.97 | |
| | | | | | | | | | | | | | | | | |
| | | | |
Total | | | 35.50 | | | | 28.93 | | | | 20.59 | | | | 36.58 | |
| | | | | | | | | | | | | | | | | |
*The distribution amount is the sum of all net investment income distributions for the period shown. Assumes shares were purchased and held for the entire accrual period. Since dividends accrue daily, your actual distributions will vary depending on the date you purchased your shares and any account activity. All Fund distributions will vary depending upon current market conditions, and past distributions are not indicative of future trends.
**Effective 8/1/17, the Fund began offering Class R6 shares. See the prospectus for details.
distribution rate of 5.32% from a taxable investment to match the Fund’s Class A tax-free distribution rate. For other performance data, please see the Performance Summary. Dividend distributions were affected by low interest rates during the period. This and other factors resulted in reduced income for the portfolio and caused dividends to be lower at the end of the period.
Performance data represent past performance, which does not guarantee future results. Investment return and principal value will fluctuate, and you may have a gain or loss when you sell your shares. Current performance may differ from figures shown. For most recent month-end performance, go to franklintempleton.com or call (800) 342-5236.
Commonwealth Update
Massachusetts’ economy grew for much of the 12 months under review. The commonwealth’s economy slumped early in
1. For investors subject to alternative minimum tax, a small portion of Fund dividends may be taxable. Distributions of capital gains are generally taxable. To avoid imposition of 28% backup withholding on all Fund distributions and redemption proceeds, US investors must be properly certified on Form W-9 and non-US investors on Form W-8BEN.
2. The distribution amount is the sum of all net investment income distributions for the period shown. Assumes shares were purchased and held for the entire accrual period. Since dividends accrue daily, your actual distributions will vary depending on the date you purchased your shares and any account activity. All Fund distributions will vary depending upon current market conditions, and past distributions are not indicative of future trends.
The dollar value, number of shares or principal amount, and names of all portfolio holdings are listed in the Fund’s Statement of Investments (SOI).
The SOI begins on page 106.
| | | | |
| 26 | | Annual Report | | franklintempleton.com |
FRANKLIN MASSACHUSETTS TAX-FREE INCOME FUND
the reporting period, but rallied in the second half. This uptick was spurred by Massachusetts’ economic fundamentals and key anchors, which center on higher education, technology and health care. The commonwealth’s unemployment rate declined from 3.9% in February 2017 to 3.5% at period-end, and was lower than the 4.1% national average.3 These positive economic developments supported home prices.
Portfolio Composition
2/28/18
| | | | |
| | |
| % of Total
Investments |
* |
| |
Higher Education | | | 19.2% | |
| | | | | |
| |
Refunded** | | | 17.5% | |
| | | | | |
| |
Transportation | | | 14.8% | |
| | | | | |
| |
Tax-Supported | | | 12.1% | |
| | | | | |
| |
General Obligation | | | 11.1% | |
| | | | | |
| |
Hospital & Health Care | | | 10.2% | |
| | | | | |
| |
Housing | | | 7.1% | |
| | | | | |
| |
Utilities | | | 6.3% | |
| | | | | |
| |
Other Revenue | | | 1.7% | |
| | | | | |
*Does not include cash and cash equivalents.
**Includes all refunded bonds; the percentage may differ from that in the Credit Quality Composition.
Massachusetts continued to operate with thin operating margins and has needed several rounds of mid-year budget adjustments over the past three years, despite a prolonged period of economic expansion and generally positive revenue trends. The commonwealth’s revenues for fiscal year (FY) 2017 (ended June 30, 2017) were below expectations, due to lower-than-expected business and income tax collections. The enacted FY 2018 budget increased funding for local aid, education, child and family welfare, substance abuse treatment, workforce training and housing without raising taxes. The budget also included a projected deposit of excess capital gains into the budget stabilization fund (BSF) with reduced reliance on one-time solutions. The governor’s budget proposal for FY 2019 kept spending in line with revenues and anticipated a deposit into the BSF. The governor’s plan would also provide for tax relief to working families and small businesses as well as spending increases for local aid, education, mental health services, child and family welfare, substance abuse treatment, workforce development and housing.
Massachusetts’ debt levels ranked among the nation’s highest, with net tax-supported debt at 9.8% of personal income and $5,983 per capita, compared with the 2.5% and $1,006 national medians, respectively.4 Independent credit rating agency Standard & Poor’s (S&P) downgraded Massachusetts’ general obligation bond rating from AA+ to AA, but changed its outlook from negative to stable.5 The rating and outlook reflected S&P’s view that the commonwealth’s strong economic growth and proactive management would allow it to continue to manage its budgetary pressures amid mid-year budget shortfalls, albeit with some continued use of one-time measures to balance the budget.
Manager’s Discussion
We used various investment strategies during the 12 months under review as we sought to maximize tax-free income for shareholders. Please read the Investment Strategy and Manager’s Discussion on page 3 for more information.
Thank you for your continued participation in Franklin Massachusetts Tax-Free Income Fund. We believe our conservative, buy-and-hold investment strategy can help us achieve high, current, tax-free income for shareholders.
The foregoing information reflects our analysis, opinions and portfolio holdings as of February 28, 2018, the end of the reporting period. The way we implement our main investment strategies and the resulting portfolio holdings may change depending on factors such as market and economic conditions. These opinions may not be relied upon as investment advice or an offer for a particular security. The information is not a complete analysis of every aspect of any market, state, industry, security or the Fund. Statements of fact are from sources considered reliable, but the investment manager makes no representation or warranty as to their completeness or accuracy. Although historical performance is no guarantee of future results, these insights may help you understand our investment management philosophy.
3. Source: Bureau of Labor Statistics.
4. Source: Moody’s Investors Service, State Government – US: Medians – Total State Debt Remains Essentially Flat in 2017, 5/3/17.
5. This does not indicate S&P’s rating of the Fund.
See www.franklintempletondatasources.com for additional data provider information.
| | | | | | |
franklintempleton.com | | | | Annual Report | | 27 |
FRANKLIN MASSACHUSETTS TAX-FREE INCOME FUND
Performance Summary as of February 28, 2018
The performance tables and graphs do not reflect any taxes that a shareholder would pay on Fund dividends, capital gain distributions, if any, or any realized gains on the sale of Fund shares. Total return reflects reinvestment of the Fund’s dividends and capital gain distributions, if any, and any unrealized gains or losses. Your dividend income will vary depending on dividends or interest paid by securities in the Fund’s portfolio, adjusted for operating expenses of each class. Capital gain distributions are net profits realized from the sale of portfolio securities.
Performance as of 2/28/18
Cumulative total return excludes sales charges. Average annual total return includes maximum sales charges. Sales charges will vary depending on the size of the investment and the class of share purchased. The maximum is 4.25% and the minimum is 0%. Class A: 4.25% maximum initial sales charge; Advisor Class: no sales charges. For other share classes, visit franklintempleton.com.
| | | | | | | | |
| Share Class | |
| Cumulative
Total Return |
1 | |
| Average Annual
Total Return |
2 |
| | |
A | | | | | | | | |
| | |
1-Year | | | +1.66% | | | | -2.69% | |
| | | | | | | | | |
| | |
5-Year | | | +11.48% | | | | +1.31% | |
| | | | | | | | | |
| | |
10-Year | | | +48.50% | | | | +3.58% | |
| | | | | | | | | |
| | |
Advisor3 | | | | | | | | |
| | |
1-Year | | | +1.84% | | | | +1.84% | |
| | | | | | | | | |
| | |
5-Year | | | +12.12% | | | | +2.32% | |
| | | | | | | | | |
| | |
10-Year | | | +49.89% | | | | +4.13% | |
| | | | | | | | | |
| | | | | | | | | | | | | | | | | | | | | | | | |
| Share Class | |
| Distribution
Rate |
4 | | | | | |
| Taxable Equivalent
Distribution Rate |
5 | | | | | |
| 30-Day
Standardized Yield |
6 | |
| Taxable Equivalent 30-Day
Standardized Yield |
5 |
| | | | | | |
A | | | 2.88% | | | | | | | | 5.32% | | | | | | | | 1.84% | | | | 3.40% | |
| | | | | | | | | | | | | | | | | | | | | | | | | |
| | | | | | |
Advisor | | | 3.10% | | | | | | | | 5.73% | | | | | | | | 2.02% | | | | 3.73% | |
| | | | | | | | | | | | | | | | | | | | | | | | | |
Performance data represent past performance, which does not guarantee future results. Investment return and principal value will fluctuate, and you may have a gain or loss when you sell your shares. Current performance may differ from figures shown. For most recent month-end performance, go to franklintempleton.com or call (800) 342-5236.
See page 31 for Performance Summary footnotes.
| | | | | | |
28 | | Annual Report | | | | franklintempleton.com |
FRANKLIN MASSACHUSETTS TAX-FREE INCOME FUND
PERFORMANCE SUMMARY
Total Return Index Comparison for a Hypothetical $10,000 Investment
Total return represents the change in value of an investment over the periods shown. It includes any applicable maximum sales charge, Fund expenses, account fees and reinvested distributions. The unmanaged indexes include reinvestment of any income or distributions. They differ from the Fund in composition and do not pay management fees or expenses. One cannot invest directly in an index.
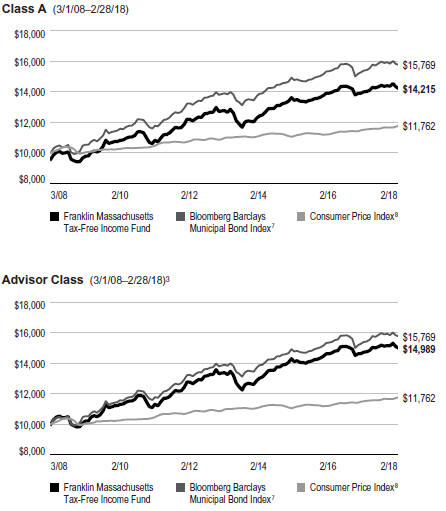
See page 31 for Performance Summary footnotes.
| | | | | | |
franklintempleton.com | | | | Annual Report | | 29 |
FRANKLIN MASSACHUSETTS TAX-FREE INCOME FUND
PERFORMANCE SUMMARY
Net Asset Value
| | | | | | | | | | | | | | | | |
| Share Class (Symbol) | | 2/28/18 | | | 8/1/17 | | | 2/28/17 | | | Change | |
| | | | |
A (FMISX) | | | $11.47 | | | | N/A | | | | $11.63 | | | | -$0.16 | |
| | | | | | | | | | | | | | | | | |
| | | | |
C (FMAIX) | | | $11.61 | | | | N/A | | | | $11.77 | | | | -$0.16 | |
| | | | | | | | | | | | | | | | | |
| | | | |
R6 (FKTMX) | | | $11.48 | | | | $11.76 | | | | N/A | | | | -$0.28 | |
| | | | | | | | | | | | | | | | | |
| | | | |
Advisor (N/A) | | | $11.48 | | | | N/A | | | | $11.63 | | | | -$0.15 | |
| | | | | | | | | | | | | | | | | |
| | |
| Distributions (3/1/17–2/28/18) | | | | | | | | | |
| | | | |
| Share Class | | Net Investment
Income | | | | | | | | | | |
| | | | |
A | | | $0.3550 | | | | | | | | | | | | | |
| | | | | | | | | | | | | | | | | |
| | | | |
C | | | $0.2893 | | | | | | | | | | | | | |
| | | | | | | | | | | | | | | | | |
| | | | |
R6 (8/1/17–2/28/18) | | | $0.2059 | | | | | | | | | | | | | |
| | | | | | | | | | | | | | | | | |
| | | | |
Advisor | | | $0.3658 | | | | | | | | | | | | | |
| | | | | | | | | | | | | | | | | |
| | | | |
| Total Annual Operating Expenses9 | | | | | | | | | | | | | | | | |
| | | | |
| Share Class | | | | | | | | | | | | |
| | | | |
A | | | 0.67% | | | | | | | | | | | | | |
| | | | | | | | | | | | | | | | | |
| | | | |
Advisor | | | 0.57% | | | | | | | | | | | | | |
| | | | | | | | | | | | | | | | | |
| | | | | | |
30 | | Annual Report | | | | franklintempleton.com |
FRANKLIN MASSACHUSETTS TAX-FREE INCOME FUND
PERFORMANCE SUMMARY
Each class of shares is available to certain eligible investors and has different annual fees and expenses, as described in the prospectus.
All investments involve risks, including possible loss of principal. Because municipal bonds are sensitive to interest rate movements, the Fund’s yield and share price will fluctuate with market conditions. Bond prices generally move in the opposite direction of interest rates. Thus, as prices of bonds in the Fund adjust to a rise in interest rates, the Fund’s share price may decline. Because the Fund invests principally in a single state, it is subject to greater risk of adverse economic and regulatory changes in that state than a geographically diversified fund. Changes in the credit rating of a bond, or in the credit rating or financial strength of a bond’s issuer, insurer or guarantor, may affect the bond’s value. The Fund may invest a significant part of its assets in municipal securities that finance similar types of projects, such as utilities, hospitals, higher education and transportation. A change that affects one project would likely affect all similar projects, thereby increasing market risk. The Fund is actively managed but there is no guarantee that the manager’s investment decisions will produce the desired results. The Fund’s prospectus also includes a description of the main investment risks.
1. Cumulative total return represents the change in value of an investment over the periods indicated.
2. Average annual total return represents the average annual change in value of an investment over the periods indicated. Return for less than one year, if any, has not been annualized.
3. Effective 7/1/09, the Fund began offering Advisor Class shares, which do not have sales charges or a Rule 12b-1 plan. Performance quotations for this class reflect the following methods of calculation: (a) For periods prior to 7/1/09, a restated figure is used based upon the Fund’s Class A performance, excluding the effect of Class A’s maximum initial sales charge, but reflecting the effect of the Class A Rule 12b-1 fees; and (b) for periods after 7/1/09, actual Advisor Class performance is used reflecting all charges and fees applicable to that class. Since 7/1/09 (commencement of sales), the cumulative and average annual total returns of Advisor Class shares were +42.93% and +4.21%.
4. Distribution rate is based on an annualization of the respective class’s February dividend and the maximum offering price (NAV for Advisor Class) per share on 2/28/18.
5. Taxable equivalent distribution rate and yield assume the published rates as of 1/15/18 for the maximum combined effective federal and Massachusetts personal income tax rate of 45.90%, based on the federal income tax rate of 37.00% plus 3.80% Medicare tax.
6. The Fund’s 30-day standardized yield is calculated over a trailing 30-day period using the yield to maturity on bonds and/or the dividends accrued on stocks. It may not equal the Fund’s actual income distribution rate, which reflects the Fund’s past dividends paid to shareholders.
7. Source: Morningstar. The Bloomberg Barclays Municipal Bond Index is a market value-weighted index engineered for the long-term tax-exempt bond market. To be included in the index, bonds must be fixed rate, have at least one year to final maturity and be rated investment grade (Baa3/BBB- or higher) by at least two of the following agencies: Moody’s, S&P and Fitch.
8. Source: Bureau of Labor Statistics, bls.gov/cpi. The Consumer Price Index is a commonly used measure of the inflation rate.
9. Figures are as stated in the Fund’s current prospectus and may differ from the expense ratios disclosed in the Your Fund’s Expenses and Financial Highlights sections in this report. In periods of market volatility, assets may decline significantly, causing total annual Fund operating expenses to become higher than the figures shown.
See www.franklintempletondatasources.com for additional data provider information.
| | | | | | |
franklintempleton.com | | | | Annual Report | | 31 |
FRANKLIN MASSACHUSETTS TAX-FREE INCOME FUND
Your Fund’s Expenses
As a Fund shareholder, you can incur two types of costs: (1) transaction costs, including sales charges (loads) on Fund purchases and redemptions; and (2) ongoing Fund costs, including management fees, distribution and service (12b-1) fees, and other Fund expenses. All mutual funds have ongoing costs, sometimes referred to as operating expenses. The table below shows ongoing costs of investing in the Fund and can help you understand these costs and compare them with those of other mutual funds. The table assumes a $1,000 investment held for the six months indicated.
Actual Fund Expenses
The table below provides information about actual account values and actual expenses in the columns under the heading “Actual.” In these columns the Fund’s actual return, which includes the effect of Fund expenses, is used to calculate the “Ending Account Value” for each class of shares. You can estimate the expenses you paid during the period by following these steps (of course, your account value and expenses will differ from those in this illustration): Divide your account value by $1,000 (if your account had an $8,600 value, then $8,600 ÷ $1,000 = 8.6). Then multiply the result by the number in the row for your class of shares under the headings “Actual” and “Expenses Paid During Period” (if Actual Expenses Paid During Period were $7.50, then 8.6 x $7.50 = $64.50). In this illustration, the actual expenses paid this period are $64.50.
Hypothetical Example for Comparison with Other Funds
Under the heading “Hypothetical” in the table, information is provided about hypothetical account values and hypothetical expenses based on the Fund’s actual expense ratio and an assumed rate of return of 5% per year before expenses, which is not the Fund’s actual return. This information may not be used to estimate the actual ending account balance or expenses you paid for the period, but it can help you compare ongoing costs of investing in the Fund with those of other funds. To do so, compare this 5% hypothetical example for the class of shares you hold with the 5% hypothetical examples that appear in the shareholder reports of other funds.
Please note that expenses shown in the table are meant to highlight ongoing costs and do not reflect any transactional costs. Therefore, information under the heading “Hypothetical” is useful in comparing ongoing costs only, and will not help you compare total costs of owning different funds. In addition, if transactional costs were included, your total costs would have been higher.
| | | | | | | | | | | | | | | | | | |
| | | | | | | Actual | | | | Hypothetical | | | | |
| | | | | | | (actual return after expenses) | | | | (5% annual return before expenses) | | | | |
| | | | | | | | | Expenses | | | | | | Expenses | | | | Net |
| | | Beginning | | | | Ending | | Paid During | | | | Ending | | Paid During | | | | Annualized |
| Share | | Account | | | | Account | | Period | | | | Account | | Period | | | | Expense |
| Class | | Value 9/1/17 | | | | Value 2/28/18 | | 9/1/17–2/28/181,2 | | | | Value 2/28/18 | | 9/1/17–2/28/181,2 | | | | Ratio2 |
| A | | $1,000 | | | | $986.30 | | $3.45 | | | | $1,021.32 | | $3.51 | | | | 0.70% |
| C | | $1,000 | | | | $983.70 | | $6.15 | | | | $1,018.60 | | $6.26 | | | | 1.25% |
| R6 | | $1,000 | | | | $987.70 | | $2.76 | | | | $1,022.02 | | $2.81 | | | | 0.56% |
| Advisor | | $1,000 | | | | $987.60 | | $2.96 | | | | $1,021.82 | | $3.01 | | | | 0.60% |
1. Expenses are equal to the annualized expense ratio for the six-month period as indicated above—in the far right column—multiplied by the simple average account value over the period indicated, and then multiplied by 181/365 to reflect the one-half year period.
2. Reflects expenses after fee waivers and expense reimbursements, for Class R6.
| | | | |
32 | | Annual Report | | franklintempleton.com |
Franklin New Jersey Tax-Free Income Fund
This annual report for Franklin New Jersey Tax-Free Income Fund covers the fiscal year ended February 28, 2018.
Your Fund’s Goal and Main Investments
The Fund seeks to provide as high a level of income exempt from federal and New Jersey personal income taxes as is consistent with prudent investment management and preservation of capital by investing at least 80% of its net assets in securities that pay interest free from such taxes.1
Credit Quality Composition*
2/28/18
| | | | |
| Ratings | | % of Total Investments | |
| |
AAA | | | 10.64% | |
| | | | | |
| |
AA | | | 29.00% | |
| | | | | |
| |
A | | | 39.43% | |
| | | | | |
| |
BBB | | | 2.60% | |
| | | | | |
| |
Below Investment Grade | | | 1.31% | |
| | | | | |
| |
Refunded | | | 17.02% | |
| | | | | |
*Securities, except for those labeled Not Rated, are assigned ratings by one or more Nationally Recognized Statistical Credit Rating Organizations (NRSROs), such as Standard & Poor’s, Moody’s and Fitch, that can be considered by the investment manager as part of its independent securities analysis. When ratings from multiple agencies are available, the highest is used, consistent with the portfolio investment process. Ratings reflect an NRSRO’s opinion of an issuer’s creditworthiness and typically range from AAA (highest) to D (lowest). The Below Investment Grade category consists of bonds rated below BBB-. The Refunded category generally consists of refunded bonds secured by US government or other high-quality securities and not rerated by an NRSRO. The Not Rated category consists of ratable securities that have not been rated by an NRSRO. Cash and equivalents are excluded from this composition.
Performance Overview
The Fund’s Class A share price, as measured by net asset value, decreased from $11.45 on February 28, 2017, to $11.11 on February 28, 2018. The Fund’s Class A shares paid dividends totaling 41.82 cents per share for the reporting period.2 The Performance Summary beginning on page 35 shows that at the end of this reporting period the Fund’s Class A shares’ distribution rate was 3.42%, based on an annualization of the 3.31 cent per share February dividend and the maximum offering price of $11.60 on February 28, 2018. An investor in the 2018 maximum combined effective federal and New Jersey
Dividend Distributions*
3/1/17–2/28/18
| | | | | | | | | | | | | | | | |
| | | Dividend per Share (cents) | |
| Month | | Class A | | | Class C | | | Class R6** | | | Advisor
Class | |
| | | | |
March | | | 3.70 | | | | 3.16 | | | | — | | | | 3.79 | |
| | | | | | | | | | | | | | | | | |
| | | | |
April | | | 3.75 | | | | 3.21 | | | | — | | | | 3.84 | |
| | | | | | | | | | | | | | | | | |
| | | | |
May | | | 3.80 | | | | 3.26 | | | | — | | | | 3.89 | |
| | | | | | | | | | | | | | | | | |
| | | | |
June | | | 3.80 | | | | 3.27 | | | | — | | | | 3.89 | |
| | | | | | | | | | | | | | | | | |
| | | | |
July | | | 3.60 | | | | 3.07 | | | | — | | | | 3.69 | |
| | | | | | | | | | | | | | | | | |
| | | | |
August | | | 3.31 | | | | 2.78 | | | | 3.32 | | | | 3.40 | |
| | | | | | | | | | | | | | | | | |
| | | | |
September | | | 3.31 | | | | 2.78 | | | | 3.43 | | | | 3.40 | |
| | | | | | | | | | | | | | | | | |
| | | | |
October | | | 3.31 | | | | 2.78 | | | | 3.43 | | | | 3.40 | |
| | | | | | | | | | | | | | | | | |
| | | | |
November | | | 3.31 | | | | 2.78 | | | | 3.43 | | | | 3.40 | |
| | | | | | | | | | | | | | | | | |
| | | | |
December | | | 3.31 | | | | 2.78 | | | | 3.43 | | | | 3.40 | |
| | | | | | | | | | | | | | | | | |
| | | | |
January | | | 3.31 | | | | 2.78 | | | | 3.43 | | | | 3.40 | |
| | | | | | | | | | | | | | | | | |
| | | | |
February | | | 3.31 | | | | 2.78 | | | | 3.43 | | | | 3.40 | |
| | | | | | | | | | | | | | | | | |
| | | | |
Total | | | 41.82 | | | | 35.43 | | | | 23.90 | | | | 42.90 | |
| | | | | | | | | | | | | | | | | |
*The distribution amount is the sum of all net investment income distributions for the period shown. Assumes shares were purchased and held for the entire accrual period. Since dividends accrue daily, your actual distributions will vary depending on the date you purchased your shares and any account activity. All Fund distributions will vary depending upon current market conditions, and past distributions are not indicative of future trends.
**Effective 8/1/17, the Fund began offering Class R6 shares. See the prospectus for details.
personal income tax bracket of 49.77% (including 3.80% Medicare tax) would need to earn a distribution rate of 6.81% from a taxable investment to match the Fund’s Class A tax-free distribution rate. For other performance data, please see the Performance Summary. Dividend distributions were affected by low interest rates during the period. This and other factors resulted in reduced income for the portfolio and caused dividends to be lower at the end of the period.
Performance data represent past performance, which does not guarantee future results. Investment return and principal value will fluctuate, and you may have a gain or loss when you sell your shares. Current performance may differ from figures shown. For most recent month-end performance, go to franklintempleton.com or call (800) 342-5236.
1. For state personal income taxes, the 80% minimum is measured by total Fund assets. For investors subject to alternative minimum tax, a small portion of Fund dividends may be taxable. Distributions of capital gains are generally taxable. To avoid imposition of 28% backup withholding on all Fund distributions and redemption proceeds, US investors must be properly certified on Form W-9 and non-US investors on Form W-8BEN.
2. The distribution amount is the sum of all net investment income distributions for the period shown. Assumes shares were purchased and held for the entire accrual period. Since dividends accrue daily, your actual distributions will vary depending on the date you purchased your shares and any account activity. All Fund distributions will vary depending upon current market conditions, and past distributions are not indicative of future trends.
The dollar value, number of shares or principal amount, and names of all portfolio holdings are listed in the Fund’s Statement of Investments (SOI).
The SOI begins on page 113.
| | | | |
franklintempleton.com | | Annual Report | | 33 |
FRANKLIN NEW JERSEY TAX-FREE INCOME FUND
State Update
During the 12 months under review, New Jersey’s economy grew at a slower pace than the nation’s. The state’s unemployment rate remained unchanged from 4.6% in February 2017 to 4.6% at period-end, which was higher than the 4.1% national average.3 Despite a slight increase in homebuilding and higher home prices, the housing market continued to be a challenge to the state as the foreclosure rate remained among the nation’s highest.
Portfolio Composition
2/28/18
| | | | |
| | |
| % of Total
Investments |
* |
| |
Refunded** | | | 21.2% | |
| | | | | |
| |
Transportation | | | 18.7% | |
| | | | | |
| |
Higher Education | | | 16.0% | |
| | | | | |
| |
Subject to Government Appropriations | | | 15.0% | |
| | | | | |
| |
Hospital & Health Care | | | 13.7% | |
| | | | | |
| |
Utilities | | | 6.2% | |
| | | | | |
| |
Housing | | | 4.4% | |
| | | | | |
| |
Other Revenue | | | 3.4% | |
| | | | | |
| |
General Obligation | | | 1.4% | |
| | | | | |
*Does not include cash and cash equivalents.
**Includes all refunded bonds; the percentage may differ from that in the Credit Quality Composition.
The state’s revenue growth for fiscal year (FY) 2017 (ended June 30, 2017) was in line with the updated budget forecast, due to strengthening income tax and sales tax collections in the period’s second half. The enacted FY 2018 budget was slightly larger than the previous year’s plan, and it included the largest pension contribution in the state’s history. The state also provided a broad-based tax relief and increased pre-K to K-12 education funding, while keeping higher education spending relatively flat.
New Jersey’s debt levels ranked among the nation’s highest, with net tax-supported debt at 7.3% of personal income and $4,388 per capita, compared with the 2.5% and $1,006 national medians, respectively.4 Independent credit rating agency Moody’s Investors Service downgraded New Jersey’s general obligation debt rating from A2 to A3 with a stable outlook, based on its view of the state’s weak budgetary condition and liquidity position, structural imbalance, moderate economic growth, high debt position and growing unfunded pension
liability.5 These challenges were somewhat offset by New Jersey’s diverse economy and high wealth levels, as well as the governor’s broad powers to reduce expenditures. The stable outlook reflected Moody’s expectation that the state’s current rating is well-positioned, aided by solid economic performance and the expectation that any budget gaps would remain manageable. However, in the longer term, Moody’s believes that the state’s budget could be challenged by growing pension contributions amid a low revenue growth environment.
Manager’s Discussion
We used various investment strategies during the 12 months under review as we sought to maximize tax-free income for shareholders. Please read the Investment Strategy and Manager’s Discussion on page 3 for more information.
The Fund holds a very small portion of its assets in Puerto Rico bonds, which decreased in price over the period. Puerto Rico and its municipal issuers continue to experience significant financial difficulties and we continue to monitor developments affecting them.
Thank you for your continued participation in Franklin New Jersey Tax-Free Income Fund. We believe our conservative, buy-and-hold investment strategy can help us achieve high, current, tax-free income for shareholders.
The foregoing information reflects our analysis, opinions and portfolio holdings as of February 28, 2018, the end of the reporting period. The way we implement our main investment strategies and the resulting portfolio holdings may change depending on factors such as market and economic conditions. These opinions may not be relied upon as investment advice or an offer for a particular security. The information is not a complete analysis of every aspect of any market, state, industry, security or the Fund. Statements of fact are from sources considered reliable, but the investment manager makes no representation or warranty as to their completeness or accuracy. Although historical performance is no guarantee of future results, these insights may help you understand our investment management philosophy.
3. Source: Bureau of Labor Statistics.
4. Source: Moody’s Investors Service, State Government - US: Medians - Total State Debt Remains Essentially Flat in 2017, 5/3/17.
5. This does not indicate Moody’s rating of the Fund.
See www.franklintempletondatasources.com for additional data provider information.
| | | | |
34 | | Annual Report | | franklintempleton.com |
FRANKLIN NEW JERSEY TAX-FREE INCOME FUND
Performance Summary as of February 28, 2018
The performance tables and graphs do not reflect any taxes that a shareholder would pay on Fund dividends, capital gain distributions, if any, or any realized gains on the sale of Fund shares. Total return reflects reinvestment of the Fund’s dividends and capital gain distributions, if any, and any unrealized gains or losses. Your dividend income will vary depending on dividends or interest paid by securities in the Fund’s portfolio, adjusted for operating expenses of each class. Capital gain distributions are net profits realized from the sale of portfolio securities.
Performance as of 2/28/18
Cumulative total return excludes sales charges. Average annual total return includes maximum sales charges. Sales charges will vary depending on the size of the investment and the class of share purchased. The maximum is 4.25% and the minimum is 0%. Class A: 4.25% maximum initial sales charge; Advisor Class: no sales charges. For other share classes, visit franklintempleton.com.
| | | | | | | | |
| Share Class | |
| Cumulative
Total Return |
1 | |
| Average Annual
Total Return |
2 |
| | |
A | | | | | | | | |
| | |
1-Year | | | +0.68% | | | | -3.61% | |
| | | | | | | | | |
| | |
5-Year | | | +6.62% | | | | +0.41% | |
| | | | | | | | | |
| | |
10-Year | | | +44.99% | | | | +3.33% | |
| | | | | | | | | |
| | |
Advisor3 | | | | | | | | |
| | |
1-Year | | | +0.77% | | | | +0.77% | |
| | | | | | | | | |
| | |
5-Year | | | +7.14% | | | | +1.39% | |
| | | | | | | | | |
| | |
10-Year | | | +46.48% | | | | +3.89% | |
| | | | | | | | | |
| | | | | | | | | | | | | | | | |
| | | Distribution | | | Taxable Equivalent | | | 30-Day | | | Taxable Equivalent 30-Day | |
| Share Class | | | Rate | 4 | | | Distribution Rate | 5 | | | Standardized Yield | 6 | | | Standardized Yield | 5 |
| | | | |
A | | | 3.42% | | | | 6.81% | | | | 1.91% | | | | 3.80% | |
| | | | | | | | | | | | | | | | | |
| | | | |
Advisor | | | 3.67% | | | | 7.31% | | | | 2.09% | | | | 4.16% | |
| | | | | | | | | | | | | | | | | |
Performance data represent past performance, which does not guarantee future results. Investment return and principal value will fluctuate, and you may have a gain or loss when you sell your shares. Current performance may differ from figures shown. For most recent month-end performance, go to franklintempleton.com or call (800) 342-5236.
See page 38 for Performance Summary footnotes.
| | | | | | |
franklintempleton.com | | | | Annual Report | | 35 |
FRANKLIN NEW JERSEY TAX-FREE INCOME FUND
PERFORMANCE SUMMARY
Total Return Index Comparison for a Hypothetical $10,000 Investment
Total return represents the change in value of an investment over the periods shown. It includes any applicable maximum sales charge, Fund expenses, account fees and reinvested distributions. The unmanaged indexes include reinvestment of any income or distributions. They differ from the Fund in composition and do not pay management fees or expenses. One cannot invest directly in an index.
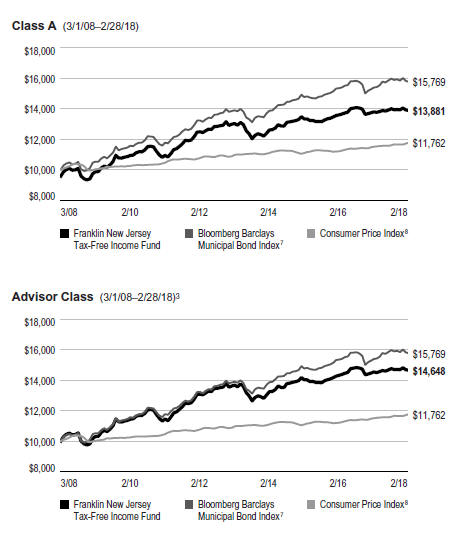
See page 38 for Performance Summary footnotes.
| | | | | | |
36 | | Annual Report | | | | franklintempleton.com |
FRANKLIN NEW JERSEY TAX-FREE INCOME FUND
PERFORMANCE SUMMARY
Net Asset Value
| | | | | | | | | | | | | | | | |
| Share Class (Symbol) | | 2/28/18 | | | 8/1/17 | | | 2/28/17 | | | Change | |
| | | | |
A (FRNJX) | | | $11.11 | | | | N/A | | | | $11.45 | | | | -$0.34 | |
| | | | | | | | | | | | | | | | | |
| | | | |
C (FNIIX) | | | $11.26 | | | | N/A | | | | $11.60 | | | | -$0.34 | |
| | | | | | | | | | | | | | | | | |
| | | | |
R6 (FNJRX) | | | $11.12 | | | | $11.37 | | | | N/A | | | | -$0.25 | |
| | | | | | | | | | | | | | | | | |
| | | | |
Advisor (FNJZX) | | | $11.12 | | | | N/A | | | | $11.46 | | | | -$0.34 | |
| | | | | | | | | | | | | | | | | |
| | | | |
| Distributions (3/1/17–2/28/18) | | | | | | | | | | | | | | | | |
| | | | |
| Share Class | | Net Investment
Income | | | | | | | | | | |
| | | | |
A | | | $0.4182 | | | | | | | | | | | | | |
| | | | | | | | | | | | | | | | | |
| | | | |
C | | | $0.3543 | | | | | | | | | | | | | |
| | | | | | | | | | | | | | | | | |
| | | | |
R6 (8/1/17–2/28/18) | | | $0.2390 | | | | | | | | | | | | | |
| | | | | | | | | | | | | | | | | |
| | | | |
Advisor | | | $0.4290 | | | | | | | | | | | | | |
| | | | | | | | | | | | | | | | | |
|
| Total Annual Operating Expenses9 | |
| | | | |
| Share Class | | | | | | | | | | | | |
| | | | |
A | | | 0.65% | | | | | | | | | | | | | |
| | | | | | | | | | | | | | | | | |
| | | | |
Advisor | | | 0.55% | | | | | | | | | | | | | |
| | | | | | | | | | | | | | | | | |
| | | | | | |
franklintempleton.com | | | | Annual Report | | 37 |
FRANKLIN NEW JERSEY TAX-FREE INCOME FUND
PERFORMANCE SUMMARY
Each class of shares is available to certain eligible investors and has different annual fees and expenses, as described in the prospectus.
All investments involve risks, including possible loss of principal. Because municipal bonds are sensitive to interest rate movements, the Fund’s yield and share price will fluctuate with market conditions. Bond prices generally move in the opposite direction of interest rates. Thus, as prices of bonds in the Fund adjust to a rise in interest rates, the Fund’s share price may decline. Because the Fund invests principally in a single state, it is subject to greater risk of adverse economic and regulatory changes in that state than a geographically diversified fund. The Fund holds a very small portion of its assets in Puerto Rico municipal bonds that have been impacted by recent adverse economic and market changes, which may cause the Fund’s share price to decline. Changes in the credit rating of a bond, or in the credit rating or financial strength of a bond’s issuer, insurer or guarantor, may affect the bond’s value. The Fund may invest a significant part of its assets in municipal securities that finance similar types of projects, such as utilities, hospitals, higher education and transportation. A change that affects one project would likely affect all similar projects, thereby increasing market risk. The Fund is actively managed but there is no guarantee that the manager’s investment decisions will produce the desired results. The Fund’s prospectus also includes a description of the main investment risks.
1. Cumulative total return represents the change in value of an investment over the periods indicated.
2. Average annual total return represents the average annual change in value of an investment over the periods indicated. Return for less than one year, if any, has not been annualized.
3. Effective 7/1/08, the Fund began offering Advisor Class shares, which do not have sales charges or a Rule 12b-1 plan. Performance quotations for this class reflect the following methods of calculation: (a) For periods prior to 7/1/08, a restated figure is used based upon the Fund’s Class A performance, excluding the effect of Class A’s maximum initial sales charge, but reflecting the effect of the Class A Rule 12b-1 fees; and (b) for periods after 7/1/08, actual Advisor Class performance is used reflecting all charges and fees applicable to that class. Since 7/1/08 (commencement of sales), the cumulative and average annual total returns of Advisor Class shares were +40.37% and +3.57%.
4. Distribution rate is based on an annualization of the respective class’s February dividend and the maximum offering price (NAV for Advisor Class) per share on 2/28/18.
5. Taxable equivalent distribution rate and yield assume the published rates as of 1/15/18 for the maximum combined effective federal and New Jersey personal income tax rate of 49.77%, based on the federal income tax rate of 37.00% plus 3.80% Medicare tax.
6. The Fund’s 30-day standardized yield is calculated over a trailing 30-day period using the yield to maturity on bonds and/or the dividends accrued on stocks. It may not equal the Fund’s actual income distribution rate, which reflects the Fund’s past dividends paid to shareholders.
7. Source: Morningstar. The Bloomberg Barclays Municipal Bond Index is a market value-weighted index engineered for the long-term tax-exempt bond market. To be included in the index, bonds must be fixed rate, have at least one year to final maturity and be rated investment grade (Baa3/BBB- or higher) by at least two of the following agencies: Moody’s, S&P and Fitch.
8. Source: Bureau of Labor Statistics, bls.gov/cpi. The Consumer Price Index is a commonly used measure of the inflation rate.
9. Figures are as stated in the Fund’s current prospectus and may differ from the expense ratios disclosed in the Your Fund’s Expenses and Financial Highlights sections in this report. In periods of market volatility, assets may decline significantly, causing total annual Fund operating expenses to become higher than the figures shown.
See www.franklintempletondatasources.com for additional data provider information.
| | | | | | |
38 | | Annual Report | | | | franklintempleton.com |
FRANKLIN NEW JERSEY TAX-FREE INCOME FUND
Your Fund’s Expenses
As a Fund shareholder, you can incur two types of costs: (1) transaction costs, including sales charges (loads) on Fund purchases and redemptions; and (2) ongoing Fund costs, including management fees, distribution and service (12b-1) fees, and other Fund expenses. All mutual funds have ongoing costs, sometimes referred to as operating expenses. The table below shows ongoing costs of investing in the Fund and can help you understand these costs and compare them with those of other mutual funds. The table assumes a $1,000 investment held for the six months indicated.
Actual Fund Expenses
The table below provides information about actual account values and actual expenses in the columns under the heading “Actual.” In these columns the Fund’s actual return, which includes the effect of Fund expenses, is used to calculate the “Ending Account Value” for each class of shares. You can estimate the expenses you paid during the period by following these steps (of course, your account value and expenses will differ from those in this illustration): Divide your account value by $1,000 (if your account had an $8,600 value, then $8,600 ÷ $1,000 = 8.6). Then multiply the result by the number in the row for your class of shares under the headings “Actual” and “Expenses Paid During Period” (if Actual Expenses Paid During Period were $7.50, then 8.6 x $7.50 = $64.50). In this illustration, the actual expenses paid this period are $64.50.
Hypothetical Example for Comparison with Other Funds
Under the heading “Hypothetical” in the table, information is provided about hypothetical account values and hypothetical expenses based on the Fund’s actual expense ratio and an assumed rate of return of 5% per year before expenses, which is not the Fund’s actual return. This information may not be used to estimate the actual ending account balance or expenses you paid for the period, but it can help you compare ongoing costs of investing in the Fund with those of other funds. To do so, compare this 5% hypothetical example for the class of shares you hold with the 5% hypothetical examples that appear in the shareholder reports of other funds.
Please note that expenses shown in the table are meant to highlight ongoing costs and do not reflect any transactional costs. Therefore, information under the heading “Hypothetical” is useful in comparing ongoing costs only, and will not help you compare total costs of owning different funds. In addition, if transactional costs were included, your total costs would have been higher.
| | | | | | | | | | | | | | | | | | |
| | | | | | | Actual | | | | Hypothetical | | | | |
| | | | | | | (actual return after expenses) | | | | (5% annual return before expenses) | | | | |
| | | | | | | | | Expenses | | | | | | Expenses | | | | Net |
| | | Beginning | | | | Ending | | Paid During | | | | Ending | | Paid During | | | | Annualized |
| Share | | Account | | | | Account | | Period | | | | Account | | Period | | | | Expense |
| Class | | Value 9/1/17 | | | | Value 2/28/18 | | 9/1/17–2/28/181,2 | | | | Value 2/28/18 | | 9/1/17–2/28/181,2 | | | | Ratio2 |
| A | | $1,000 | | | | $991.90 | | $3.41 | | | | $1,021.37 | | $3.46 | | | | 0.69% |
| C | | $1,000 | | | | $989.30 | | $6.12 | | | | $1,018.65 | | $6.21 | | | | 1.24% |
| R6 | | $1,000 | | | | $992.60 | | $2.67 | | | | $1,022.12 | | $2.71 | | | | 0.54% |
| Advisor | | $1,000 | | | | $992.40 | | $2.91 | | | | $1,021.87 | | $2.96 | | | | 0.59% |
1. Expenses are equal to the annualized expense ratio for the six-month period as indicated above—in the far right column—multiplied by the simple average account value over the period indicated, and then multiplied by 181/365 to reflect the one-half year period.
2. Reflects expenses after fee waivers and expense reimbursements, for Class R6.
| | | | | | |
franklintempleton.com | | | | Annual Report | | 39 |
FRANKLIN TAX-FREE TRUST
Financial Highlights
Franklin Federal Intermediate-Term Tax-Free Income Fund
| | | | | | | | | | | | | | | | | | | | |
| | | Year Ended February 28, | |
| | | 2018 | | | 2017 | | | 2016a | | | 2015 | | | 2014 |
| | | | | |
Class A | | | | | | | | | | | | | | | | | | | | |
| | | | | |
Per share operating performance
(for a share outstanding throughout the year) | | | | | | | | | | | | | | | | | | | | |
| | | | | |
Net asset value, beginning of year | | | $12.11 | | | | $12.50 | | | | $12.44 | | | | $12.21 | | | | $12.59 | |
| | | | |
| | | | | |
Income from investment operationsb: | | | | | | | | | | | | | | | | | | | | |
| | | | | |
Net investment incomec | | | 0.31 | | | | 0.31 | | | | 0.31 | | | | 0.32 | | | | 0.34 | |
| | | | | |
Net realized and unrealized gains (losses) | | | (0.17 | ) | | | (0.40 | ) | | | 0.06 | | | | 0.23 | | | | (0.38 | ) |
| | | | |
| | | | | |
Total from investment operations | | | 0.14 | | | | (0.09 | ) | | | 0.37 | | | | 0.55 | | | | (0.04 | ) |
| | | | |
| | | | | |
Less distributions from net investment income | | | (0.31 | ) | | | (0.30 | ) | | | (0.31 | ) | | | (0.32 | ) | | | (0.34 | ) |
| | | | |
| | | | | |
Net asset value, end of year | | | $11.94 | | | | $12.11 | | | | $12.50 | | | | $12.44 | | | | $12.21 | |
| | | | |
| | | | | |
Total returnd | | | 1.14% | | | | (0.70)% | | | | 3.03% | | | | 4.58% | | | | (0.29)% | |
| | | | | |
Ratios to average net assets | | | | | | | | | | | | | | | | | | | | |
| | | | | |
Expenses before waiver and payments by affiliates | | | 0.66% | | | | 0.66% | | | | 0.66% | | | | 0.68% | | | | 0.65% | |
| | | | | |
Expenses net of waiver and payments by affiliates | | | 0.65% | | | | 0.66% | | | | 0.66% | | | | 0.68% | | | | 0.65% | |
| | | | | |
Net investment income | | | 2.56% | | | | 2.48% | | | | 2.54% | | | | 2.59% | | | | 2.81% | |
| | | | | |
Supplemental data | | | | | | | | | | | | | | | | | | | | |
| | | | | |
Net assets, end of year (000’s) | | | $1,850,075 | | | | $1,929,083 | | | | $2,017,642 | | | | $1,828,050 | | | | $1,747,118 | |
| | | | | |
Portfolio turnover rate | | | 10.72% | | | | 8.98% | | | | 6.62% | | | | 4.10% | | | | 9.30% | |
aFor the year ended February 29.
bThe amount shown for a share outstanding throughout the period may not correlate with the Statement of Operations for the period due to the timing of sales and repurchases of the Fund’s shares in relation to income earned and/or fluctuating fair value of the investments of the Fund.
cBased on average daily shares outstanding.
dTotal return does not reflect sales commissions or contingent deferred sales charges, if applicable.
| | | | | | |
40 | | Annual Report | | | The accompanying notes are an integral part of these financial statements. | | franklintempleton.com |
FRANKLIN TAX-FREE TRUST
FINANCIAL HIGHLIGHTS
Franklin Federal Intermediate-Term Tax-Free Income Fund (continued)
| | | | | | | | | | | | | | | | | | | | |
| | | Year Ended February 28, | |
| | | 2018 | | | 2017 | | | 2016a | | | 2015 | | | 2014 |
| | | | | |
Class C | | | | | | | | | | | | | | | | | | | | |
| | | | | |
Per share operating performance (for a share outstanding throughout the year) | | | | | | | | | | | | | | | | | | | | |
| | | | | |
Net asset value, beginning of year | | | $12.14 | | | | $12.53 | | | | $12.47 | | | | $12.24 | | | | $12.62 | |
| | | | |
| | | | | |
Income from investment operationsb: | | | | | | | | | | | | | | | | | | | | |
| | | | | |
Net investment incomec | | | 0.25 | | | | 0.24 | | | | 0.25 | | | | 0.25 | | | | 0.27 | |
| | | | | |
Net realized and unrealized gains (losses) | | | (0.17 | ) | | | (0.39 | ) | | | 0.05 | | | | 0.24 | | | | (0.38 | ) |
| | | | |
| | | | | |
Total from investment operations | | | 0.08 | | | | (0.15 | ) | | | 0.30 | | | | 0.49 | | | | (0.11 | ) |
| | | | |
| | | | | |
Less distributions from net investment income | | | (0.24 | ) | | | (0.24 | ) | | | (0.24 | ) | | | (0.26 | ) | | | (0.27 | ) |
| | | | |
| | | | | |
Net asset value, end of year | | | $11.98 | | | | $12.14 | | | | $12.53 | | | | $12.47 | | | | $12.24 | |
| | | | |
| | | | | |
Total returnd | | | 0.67% | | | | (1.26)% | | | | 2.47% | | | | 4.00% | | | | (0.83)% | |
| | | | | |
Ratios to average net assets | | | | | | | | | | | | | | | | | | | | |
| | | | | |
Expenses before waiver and payments by affiliates | | | 1.20% | | | | 1.21% | | | | 1.21% | | | | 1.23% | | | | 1.20% | |
| | | | | |
Expenses net of waiver and payments by affiliates | | | 1.19% | | | | 1.21% | | | | 1.21% | | | | 1.23% | | | | 1.20% | |
| | | | | |
Net investment income | | | 2.02% | | | | 1.93% | | | | 1.99% | | | | 2.04% | | | | 2.26% | |
| | | | | |
Supplemental data | | | | | | | | | | | | | | | | | | | | |
| | | | | |
Net assets, end of year (000’s) | | | $358,228 | | | | $425,649 | | | | $469,355 | | | | $456,698 | | | | $453,176 | |
| | | | | |
Portfolio turnover rate | | | 10.72% | | | | 8.98% | | | | 6.62% | | | | 4.10% | | | | 9.30% | |
aFor the year ended February 29.
bThe amount shown for a share outstanding throughout the period may not correlate with the Statement of Operations for the period due to the timing of sales and repurchases of the Fund’s shares in relation to income earned and/or fluctuating fair value of the investments of the Fund.
cBased on average daily shares outstanding.
dTotal return does not reflect sales commissions or contingent deferred sales charges, if applicable.
| | | | | | |
franklintempleton.com | | | | The accompanying notes are an integral part of these financial statements. | Annual Report | | 41 |
FRANKLIN TAX-FREE TRUST
FINANCIAL HIGHLIGHTS
Franklin Federal Intermediate-Term Tax-Free Income Fund (continued)
| | | | |
| | | Year Ended
February 28, | |
| | | 2018a | |
| |
Class R6 | | | | |
| |
Per share operating performance | | | | |
(for a share outstanding throughout the year) | | | | |
| |
Net asset value, beginning of year | | | $12.28 | |
| |
Income from investment operationsb: | | | | |
| |
Net investment incomec | | | 0.20 | |
| |
Net realized and unrealized gains (losses) | | | (0.32 | ) |
| |
Total from investment operations | | | (0.12 | ) |
| |
Less distributions from net investment income | | | (0.19 | ) |
| |
Net asset value, end of year | | | $11.97 | |
| |
Total returnd | | | (0.97)% | |
| |
Ratios to average net assetse | | | | |
| |
Expenses before waiver and payments by affiliates | | | 0.49% | |
| |
Expenses net of waiver and payments by affiliates | | | 0.48% | |
| |
Net investment income | | | 2.73% | |
| |
Supplemental data | | | | |
| |
Net assets, end of year (000’s) | | | $672,199 | |
| |
Portfolio turnover rate | | | 10.72% | |
aFor the period August 1, 2017 (effective date) to February 28, 2018.
bThe amount shown for a share outstanding throughout the period may not correlate with the Statement of Operations for the period due to the timing of sales and repurchases of the Fund’s shares in relation to income earned and/or fluctuating fair value of the investments of the Fund.
cBased on average daily shares outstanding.
dTotal return is not annualized for periods less than one year.
eRatios are annualized for periods less than one year.
| | | | | | |
42 | | Annual Report | | | The accompanying notes are an integral part of these financial statements. | | franklintempleton.com |
FRANKLIN TAX-FREE TRUST
FINANCIAL HIGHLIGHTS
Franklin Federal Intermediate-Term Tax-Free Income Fund (continued)
| | | | | | | | | | | | | | | | | | | | |
| | | Year Ended February 28, | |
| | | 2018 | | | 2017 | | | 2016a
| | | 2015 | | | 2014 | |
| | | | | |
Advisor Class | | | | | | | | | | | | | | | | | | | | |
| | | | | |
Per share operating performance | | | | | | | | | | | | | | | | | | | | |
(for a share outstanding throughout the year) | | | | | | | | | | | | | | | | | | | | |
| | | | | |
Net asset value, beginning of year | | | $12.13 | | | | $12.52 | | | | $12.47 | | | | $12.24 | | | | $12.61 | |
| | | | | |
Income from investment operationsb: | | | | | | | | | | | | | | | | | | | | |
| | | | | |
Net investment incomec | | | 0.32 | | | | 0.32 | | | | 0.33 | | | | 0.33 | | | | 0.36 | |
| | | | | |
Net realized and unrealized gains (losses) | | | (0.16 | ) | | | (0.39 | ) | | | 0.04 | | | | 0.24 | | | | (0.38 | ) |
| | | | | |
Total from investment operations | | | 0.16 | | | | (0.07 | ) | | | 0.37 | | | | 0.57 | | | | (0.02 | ) |
| | | | | |
Less distributions from net investment income | | | (0.32 | ) | | | (0.32 | ) | | | (0.32 | ) | | | (0.34 | ) | | | (0.35 | ) |
| | | | | |
Net asset value, end of year | | | $11.97 | | | | $12.13 | | | | $12.52 | | | | $12.47 | | | | $12.24 | |
| | | | | |
Total return | | | 1.32% | | | | (0.61)% | | | | 3.05% | | | | 4.67% | | | | (0.11)% | |
| | | | | |
Ratios to average net assets | | | | | | | | | | | | | | | | | | | | |
| | | | | |
Expenses before waiver and payments by affiliates | | | 0.56% | | | | 0.56% | | | | 0.56% | | | | 0.58% | | | | 0.55% | |
| | | | | |
Expenses net of waiver and payments by affiliates | | | 0.55% | | | | 0.56% | | | | 0.56% | | | | 0.58% | | | | 0.55% | |
| | | | | |
Net investment income | | | 2.66% | | | | 2.58% | | | | 2.64% | | | | 2.69% | | | | 2.91% | |
| | | | | |
Supplemental data | | | | | | | | | | | | | | | | | | | | |
| | | | | |
Net assets, end of year (000’s) | | | $1,196,627 | | | | $1,986,241 | | | | $2,019,784 | | | | $2,285,627 | | | | $1,798,459 | |
| | | | | |
Portfolio turnover rate | | | 10.72% | | | | 8.98% | | | | 6.62% | | | | 4.10% | | | | 9.30% | |
aFor the year ended February 29.
bThe amount shown for a share outstanding throughout the period may not correlate with the Statement of Operations for the period due to the timing of sales and repurchases of the Fund’s shares in relation to income earned and/or fluctuating fair value of the investments of the Fund.
cBased on average daily shares outstanding.
| | | | | | |
franklintempleton.com | | | | The accompanying notes are an integral part of these financial statements. | Annual Report | | 43 |
FRANKLIN TAX-FREE TRUST
Statement of Investments, February 28, 2018
Franklin Federal Intermediate-Term Tax-Free Income Fund
| | | | | | | | |
| | | Principal
Amount | | | Value | |
| |
Municipal Bonds 96.5% | | | | | | | | |
Alabama 2.6% | | | | | | | | |
Alabama State Public School and College Authority Revenue, | | | | | | | | |
Capital Improvement, Refunding, Series A, 5.00%, 5/01/19 | | $ | 7,750,000 | | | $ | 8,065,347 | |
Capital Improvement, Refunding, Series B, 5.00%, 1/01/27 | | | 25,000,000 | | | | 28,748,000 | |
Chatom IDB Gulf Opportunity Zone Revenue, | | | | | | | | |
PowerSouth Energy Cooperative, Refunding, Series A, Assured Guaranty, 5.00%, 8/01/20 | | | 3,535,000 | | | | 3,795,777 | |
PowerSouth Energy Cooperative, Refunding, Series A, Assured Guaranty, 5.00%, 8/01/21 | | | 3,535,000 | | | | 3,787,965 | |
PowerSouth Energy Cooperative, Refunding, Series A, Assured Guaranty, 5.00%, 8/01/22 | | | 3,535,000 | | | | 3,794,893 | |
a East Alabama Health Care Authority Health Care Facilities Revenue, | | | | | | | | |
Mandatory Put, Series A, Pre-Refunded, 5.25%, 9/01/18 | | | 10,000,000 | | | | 10,195,100 | |
Mandatory Put, Series B, Pre-Refunded, 5.50%, 9/01/18 | | | 13,500,000 | | | | 13,776,750 | |
Infirmary Health System Special Care Facilities Financing Authority of Mobile Revenue, | | | | | | | | |
Infirmary Health System Inc., Series A, 5.00%, 2/01/27 | | | 4,920,000 | | | | 5,587,890 | |
Infirmary Health System Inc., Series A, 5.00%, 2/01/28 | | | 5,000,000 | | | | 5,630,950 | |
Shelby County Board of Education Revenue, | | | | | | | | |
Capital Outlay School wts., 5.00%, 2/01/22 | | | 5,250,000 | | | | 5,667,217 | |
Capital Outlay School wts., 5.00%, 2/01/23 | | | 5,520,000 | | | | 5,981,472 | |
Capital Outlay School wts., 5.00%, 2/01/24 | | | 5,055,000 | | | | 5,473,150 | |
Capital Outlay School wts., 5.00%, 2/01/25 | | | 5,920,000 | | | | 6,406,210 | |
| | | | | | | | |
| | |
| | | | | | | 106,910,721 | |
| | | | | | | | |
Alaska 0.1% | | | | | | | | |
Matanuska-Susitna Borough Lease Revenue, Goose Creek Correctional Center Project, Assured Guaranty, 5.00%, 9/01/19 | | | 3,650,000 | | | | 3,829,544 | |
| | | | | | | | |
Arizona 4.8% | | | | | | | | |
Arizona Board of Regents Arizona State University System Revenue, | | | | | | | | |
Polytechnic Campus Project, Series C, Pre-Refunded, 5.75%, 7/01/20 | | | 500,000 | | | | 507,305 | |
Polytechnic Campus Project, Series C, Pre-Refunded, 5.75%, 7/01/21 | | | 500,000 | | | | 507,305 | |
Arizona Health Facilities Authority Hospital Revenue, Phoenix Children’s Hospital, Refunding, Series A, 5.00%, 2/01/27 | | | 6,000,000 | | | | 6,467,460 | |
Arizona School Facilities Board COP, | | | | | | | | |
Pre-Refunded, 5.25%, 9/01/19 | | | 10,000,000 | | | | 10,197,700 | |
Refunding, Series A-3, AGMC Insured, 5.00%, 9/01/19 | | | 16,185,000 | | | | 16,995,869 | |
Arizona State COP, | | | | | | | | |
Department of Administration, Series A, AGMC Insured, 5.00%, 10/01/19 | | | 5,650,000 | | | | 5,945,834 | |
Department of Administration, Series A, AGMC Insured, 5.25%, 10/01/21 | | | 10,000,000 | | | | 10,552,800 | |
Department of Administration, Series A, AGMC Insured, 5.25%, 10/01/22 | | | 40,910,000 | | | | 43,144,913 | |
Department of Administration, Series B, AGMC Insured, 5.00%, 10/01/20 | | | 14,860,000 | | | | 15,854,877 | |
Arizona Transportation Board Highway Revenue, | | | | | | | | |
Subordinated, Refunding, 5.00%, 7/01/29 | | | 10,920,000 | | | | 12,570,995 | |
Subordinated, Refunding, Series A, 5.00%, 7/01/24 | | | 5,000,000 | | | | 5,497,800 | |
Subordinated, Refunding, Series A, 5.00%, 7/01/25 | | | 5,000,000 | | | | 5,494,400 | |
Mesa Utility Systems Revenue, | | | | | | | | |
Refunding, 5.00%, 7/01/28 | | | 1,500,000 | | | | 1,761,900 | |
Refunding, 5.00%, 7/01/29 | | | 2,500,000 | | | | 2,924,275 | |
Phoenix Civic Improvement Corp. Airport Revenue, | | | | | | | | |
junior lien, Refunding, Series D, 5.00%, 7/01/30 | | | 10,000,000 | | | | 11,678,800 | |
junior lien, Series A, 5.00%, 7/01/19 | | | 1,900,000 | | | | 1,983,904 | |
junior lien, Series A, 5.00%, 7/01/20 | | | 1,300,000 | | | | 1,398,215 | |
junior lien, Series A, Pre-Refunded, 5.00%, 7/01/21 | | | 4,200,000 | | | | 4,525,290 | |
Pima County Regional Transportation Excise Tax Revenue, | | | | | | | | |
Pima County Regional Transportation Fund, 5.00%, 6/01/24 | | | 3,385,000 | | | | 3,862,996 | |
Pima County Regional Transportation Fund, 5.00%, 6/01/26 | | | 7,180,000 | | | | 8,163,301 | |
| | | | | | |
44 | | Annual Report | | | | franklintempleton.com |
FRANKLIN TAX-FREE TRUST
STATEMENT OF INVESTMENTS
Franklin Federal Intermediate-Term Tax-Free Income Fund (continued)
| | | | | | | | |
| | | Principal
Amount | | | Value | |
| |
Municipal Bonds (continued) | | | | | | | | |
Arizona (continued) | | | | | | | | |
Pima County Sewer System Revenue, | | | | | | | | |
Series B, Pre-Refunded, 5.00%, 7/01/24 | | $ | 6,030,000 | | | $ | 6,659,170 | |
Series B, Pre-Refunded, 5.00%, 7/01/25 | | | 4,500,000 | | | | 4,969,530 | |
Scottsdale IDA Hospital Revenue, Scottsdale Healthcare, Refunding, Series A, 5.00%, 9/01/21 | | | 4,000,000 | | | | 4,066,840 | |
Scottsdale Municipal Property Corp. Excise Tax Revenue, | | | | | | | | |
Refunding, 5.00%, 7/01/26 | | | 2,580,000 | | | | 3,039,756 | |
Refunding, 5.00%, 7/01/27 | | | 2,000,000 | | | | 2,351,980 | |
Refunding, 5.00%, 7/01/28 | | | 3,325,000 | | | | 3,880,940 | |
University Medical Center Corp. Hospital Revenue, Tucson, Pre-Refunded, 6.00%, 7/01/24 | | | 2,000,000 | | | | 2,115,060 | |
| | | | | | | | |
| | |
| | | | | | | 197,119,215 | |
| | | | | | | | |
Arkansas 0.1% | | | | | | | | |
Fort Smith Sales and Use Tax Revenue, Refunding and Improvement, 5.00%, 5/01/23 | | | 5,000,000 | | | | 5,600,550 | |
| | | | | | | | |
California 10.2% | | | | | | | | |
Bay Area Toll Authority Toll Bridge Revenue, | | | | | | | | |
San Francisco Bay Area, Subordinate, Refunding, Series S-7, 4.00%, 4/01/31 | | | 7,000,000 | | | | 7,593,250 | |
San Francisco Bay Area, Subordinate, Refunding, Series S-7, 4.00%, 4/01/33 | | | 5,000,000 | | | | 5,361,850 | |
California Health Facilities Financing Authority Revenue, | | | | | | | | |
Providence Health and Services, Series C, 6.00%, 10/01/18 | | | 500,000 | | | | 513,245 | |
Scripps Health, Series A, 5.00%, 10/01/21 | | | 5,000,000 | | | | 5,102,750 | |
Sutter Health, Refunding, Series B, 5.00%, 8/15/22 | | | 4,000,000 | | | | 4,320,800 | |
Sutter Health, Refunding, Series B, 5.25%, 8/15/23 | | | 13,000,000 | | | | 14,113,840 | |
California State GO, | | | | | | | | |
Refunding, 5.00%, 8/01/21 | | | 55,000 | | | | 55,166 | |
Various Purpose, 5.50%, 4/01/21 | | | 20,000,000 | | | | 20,880,600 | |
Various Purpose, 5.25%, 10/01/23 | | | 25,050,000 | | | | 28,163,214 | |
Various Purpose, 5.25%, 10/01/24 | | | 9,780,000 | | | | 10,980,984 | |
Various Purpose, 5.25%, 10/01/25 | | | 5,000,000 | | | | 5,610,300 | |
Various Purpose, Refunding, 5.25%, 9/01/25 | | | 15,000,000 | | | | 16,795,200 | |
Various Purpose, Refunding, 5.00%, 10/01/25 | | | 15,000,000 | | | | 17,124,450 | |
Various Purpose, Refunding, 5.00%, 8/01/30 | | | 25,000,000 | | | | 29,240,000 | |
Various Purpose, Refunding, 5.00%, 8/01/30 | | | 10,000,000 | | | | 11,667,300 | |
California State Public Works Board Lease Revenue, | | | | | | | | |
Various Capital Projects, Series A, 5.00%, 10/01/20 | | | 2,000,000 | | | | 2,173,860 | |
Various Capital Projects, Series A, 5.25%, 10/01/22 | | | 3,300,000 | | | | 3,706,461 | |
Various Capital Projects, Series A, 5.25%, 10/01/23 | | | 5,365,000 | | | | 6,003,972 | |
Various Capital Projects, Series A, 5.25%, 10/01/24 | | | 3,000,000 | | | | 3,353,970 | |
Various Capital Projects, Series A, 5.25%, 10/01/25 | | | 3,000,000 | | | | 3,350,670 | |
Various Capital Projects, Series G, Subseries G-1, ETM, 5.25%, 10/01/18 | | | 5,605,000 | | | | 5,737,558 | |
Various Capital Projects, Series G, Subseries G-1, ETM, 5.25%, 10/01/19 | | | 10,000,000 | | | | 10,599,600 | |
Various Capital Projects, Series G, Subseries G-1, Pre-Refunded, 5.00%, 10/01/21 | | | 15,055,000 | | | | 15,899,134 | |
Various Capital Projects, Series I, 5.00%, 11/01/18 | | | 4,000,000 | | | | 4,099,080 | |
Various Capital Projects, Series I, Pre-Refunded, 5.25%, 11/01/20 | | | 5,000,000 | | | | 5,314,550 | |
California Statewide CDA Revenue, | | | | | | | | |
Enloe Medical Center, Series A, California Mortgage Insured, 5.25%, 8/15/19 | | | 1,990,000 | | | | 2,024,347 | |
Enloe Medical Center, Series A, California Mortgage Insured, 5.375%, 8/15/20 | | | 1,650,000 | | | | 1,680,162 | |
Sutter Health, Refunding, Series A, 5.25%, 8/15/24 | | | 4,000,000 | | | | 4,338,680 | |
El Dorado Irrigation District COP, | | | | | | | | |
Series A, Assured Guaranty, Pre-Refunded, 5.00%, 8/01/22 | | | 2,610,000 | | | | 2,742,197 | |
Series A, Assured Guaranty, Pre-Refunded, 5.25%, 8/01/23 | | | 2,860,000 | | | | 3,014,812 | |
| | | | | | |
franklintempleton.com | | | | Annual Report | | 45 |
FRANKLIN TAX-FREE TRUST
STATEMENT OF INVESTMENTS
Franklin Federal Intermediate-Term Tax-Free Income Fund (continued)
| | | | | | | | |
| | | Principal
Amount | | | Value | |
| |
Municipal Bonds (continued) | | | | | | | | |
California (continued) | | | | | | | | |
Livermore-Amador Valley Water Management Agency Sewer Revenue, | | | | | | | | |
Refunding, 5.00%, 8/01/24 | | $ | 5,660,000 | | | $ | 6,270,884 | |
Refunding, 5.00%, 8/01/25 | | | 4,765,000 | | | | 5,274,283 | |
Los Angeles Department of Water and Power Revenue, | | | | | | | | |
Power System, Refunding, Series A, 5.00%, 7/01/26 | | | 11,025,000 | | | | 12,551,301 | |
Power System, Refunding, Series B, 5.00%, 7/01/31 | | | 8,220,000 | | | | 9,731,740 | |
Power System, Series B, 5.25%, 7/01/24 | | | 16,870,000 | | | | 17,757,362 | |
Power System, Series B, Pre-Refunded, 5.25%, 7/01/24 | | | 130,000 | | | | 136,466 | |
Power System, Series C, 5.00%, 7/01/32 | | | 4,615,000 | | | | 5,485,158 | |
Power System, Series C, 5.00%, 7/01/33 | | | 3,960,000 | | | | 4,685,155 | |
Power System, Series C, 5.00%, 7/01/34 | | | 4,080,000 | | | | 4,805,057 | |
Los Angeles Municipal Improvement Corp. Lease Revenue, | | | | | | | | |
Capital Equipment, Refunding, Series A, Assured Guaranty, 5.25%, 4/01/18 | | | 2,495,000 | | | | 2,503,234 | |
Capital Equipment, Refunding, Series A, Assured Guaranty, 5.25%, 4/01/19 | | | 3,180,000 | | | | 3,311,143 | |
Los Angeles USD, | | | | | | | | |
GO, Election of 2005, Series F, 5.00%, 7/01/22 | | | 5,675,000 | | | | 5,941,725 | |
b GO, Election of 2008, Series B-1, 5.00%, 7/01/32 | | | 8,000,000 | | | | 9,485,760 | |
Orange County Airport Revenue, | | | | | | | | |
Series B, 5.00%, 7/01/20 | | | 3,465,000 | | | | 3,625,499 | |
Series B, 5.00%, 7/01/21 | | | 7,545,000 | | | | 7,892,447 | |
Riverside Sewer Revenue, | | | | | | | | |
Refunding, Series A, 5.00%, 8/01/34 | | | 10,605,000 | | | | 12,103,593 | |
Refunding, Series A, 5.00%, 8/01/35 | | | 11,000,000 | | | | 12,499,410 | |
San Diego Community College District GO, Refunding, 5.00%, 8/01/25 | | | 21,370,000 | | | | 24,248,966 | |
San Francisco City and County COP, | | | | | | | | |
Multiple Capital Improvement Projects, Series A, 5.00%, 4/01/25 | | | 4,000,000 | | | | 4,150,320 | |
Multiple Capital Improvement Projects, Series A, 5.25%, 4/01/26 | | | 2,500,000 | | | | 2,601,450 | |
Tuolumne Wind Project Authority Revenue, Tuolumne Co. Project, Series A, Pre-Refunded, 5.25%, 1/01/23 | | | 8,000,000 | | | | 8,260,720 | |
| | | | | | | | |
| | |
| | | | | | | 414,883,675 | |
| | | | | | | | |
Colorado 1.3% | | | | | | | | |
Colorado Springs Utilities System Revenue, | | | | | | | | |
Refunding, Series A-1, 5.00%, 11/15/29 | | | 1,675,000 | | | | 2,005,008 | |
Refunding, Series A-1, 5.00%, 11/15/30 | | | 2,570,000 | | | | 3,061,821 | |
Refunding, Series A-1, 5.00%, 11/15/31 | | | 1,125,000 | | | | 1,336,073 | |
Denver City and County Airport System Revenue, | | | | | | | | |
Subordinate, Series B, 5.25%, 11/15/26 | | | 5,000,000 | | | | 5,729,250 | |
Subordinate, Series B, 5.25%, 11/15/27 | | | 4,250,000 | | | | 4,865,017 | |
Denver City and County Excise Tax Revenue, Series A, AGMC Insured, ETM, 5.00%, 9/01/20 | | | 10,090,000 | | | | 10,939,477 | |
Denver City and County School District No. 1 GO, Refunding, 4.00%, 12/01/31 | | | 9,000,000 | | | | 9,566,460 | |
Public Authority for Colorado Energy Natural Gas Purchase Revenue, 5.75%, 11/15/18 | | | 885,000 | | | | 909,904 | |
Regional Transportation District COP, Refunding, Series A, 5.00%, 6/01/26 | | | 14,000,000 | | | | 15,739,920 | |
| | | | | | | | |
| | |
| | | | | | | 54,152,930 | |
| | | | | | | | |
Connecticut 1.4% | | | | | | | | |
Connecticut State GO, | | | | | | | | |
Series E, 5.00%, 8/15/25 | | | 11,295,000 | | | | 12,423,370 | |
Series E, 5.00%, 8/15/26 | | | 18,585,000 | | | | 20,343,699 | |
Connecticut State Special Tax Obligation Revenue, Transportation Infrastructure Purposes, Series A, 5.00%, 1/01/28 | | | 10,000,000 | | | | 10,906,800 | |
| | | | | | |
46 | | Annual Report | | | | franklintempleton.com |
FRANKLIN TAX-FREE TRUST
STATEMENT OF INVESTMENTS
Franklin Federal Intermediate-Term Tax-Free Income Fund (continued)
| | | | | | | | | | | | |
| | | Principal
Amount | | | | | | Value | |
| |
Municipal Bonds (continued) | | | | | | | | | | | | |
Connecticut (continued) | | | | | | | | | | | | |
University of Connecticut GO, | | | | | | | | | | | | |
Series A, 5.00%, 3/15/29 | | $ | 2,000,000 | | | | | | | $ | 2,253,300 | |
Series A, 5.00%, 3/15/30 | | | 3,075,000 | | | | | | | | 3,450,550 | |
Series A, 5.00%, 3/15/31 | | | 5,025,000 | | | | | | | | 5,619,859 | |
| | | | | | | | | | | | |
| | | |
| | | | | | | | | | | 54,997,578 | |
| | | | | | | | | | | | |
District of Columbia 0.3% | | | | | | | | | | | | |
Washington Metropolitan Area Transit Authority Gross Revenue, | | | | | | | | | | | | |
Series B, 5.00%, 7/01/31 | | | 5,000,000 | | | | | | | | 5,866,150 | |
Series B, 5.00%, 7/01/32 | | | 5,750,000 | | | | | | | | 6,725,545 | |
| | | | | | | | | | | | |
| | | |
| | | | | | | | | | | 12,591,695 | |
| | | | | | | | | | | | |
Florida 7.8% | | | | | | | | | | | | |
Broward County Water and Sewer Utility Revenue, | | | | | | | | | | | | |
Refunding, Series B, 5.00%, 10/01/24 | | | 6,000,000 | | | | | | | | 6,806,520 | |
Refunding, Series B, 5.00%, 10/01/25 | | | 6,325,000 | | | | | | | | 7,166,288 | |
Clearwater City Water and Sewer Revenue, Refunding, 5.00%, 12/01/33 | | | 5,520,000 | | | | | | | | 6,345,295 | |
Florida State Board of Education GO, | | | | | | | | | | | | |
Full Faith and Credit, Public Education Capital Outlay, Refunding, Series C, 4.00%, 6/01/32 | | | 12,855,000 | | | | | | | | 13,864,375 | |
Full Faith and Credit, Public Education Capital Outlay, Refunding, Series C, 4.00%, 6/01/33 | | | 5,000,000 | | | | | | | | 5,363,350 | |
Full Faith and Credit, Public Education Capital Outlay, Refunding, Series E, 4.00%, 6/01/33 | | | 11,855,000 | | | | | | | | 12,709,508 | |
Gainesville Utilities System Revenue, Series A, 5.00%, 10/01/30 | | | 1,500,000 | | | | | | | | 1,768,680 | |
Hillsborough County IDA, PCR, Tampa Electric Co. Project, Series A, 5.65%, 5/15/18 | | | 6,500,000 | | | | | | | | 6,553,105 | |
Jacksonville Sales Tax Revenue, Better Jacksonville, Refunding, Series A, 5.00%, 10/01/28 | | | 6,000,000 | | | | | | | | 6,658,980 | |
JEA Water and Sewer System Revenue, | | | | | | | | | | | | |
Refunding, Series A, 5.00%, 10/01/26 | | | 1,455,000 | | | | | | | | 1,682,969 | |
Refunding, Series A, 5.00%, 10/01/27 | | | 5,130,000 | | | | | | | | 5,914,839 | |
Refunding, Series A, 5.00%, 10/01/31 | | | 17,435,000 | | | | | | | | 20,670,413 | |
Series A, 5.00%, 10/01/29 | | | 1,205,000 | | | | | | | | 1,381,990 | |
Series A, Pre-Refunded, 5.00%, 10/01/26 | | | 1,530,000 | | | | | | | | 1,772,551 | |
Series A, Pre-Refunded, 5.00%, 10/01/27 | | | 5,375,000 | | | | | | | | 6,227,099 | |
Series A, Pre-Refunded, 5.00%, 10/01/29 | | | 1,265,000 | | | | | | | | 1,465,540 | |
Leon County School District Sales Tax Revenue, 5.00%, 9/01/25 | | | 6,040,000 | | | | | | | | 6,917,914 | |
Miami-Dade County Aviation Revenue, | | | | | | | | | | | | |
Miami International Airport, Refunding, Series A, 4.25%, 10/01/18 | | | 6,920,000 | | | | | | | | 7,032,381 | |
Miami International Airport, Refunding, Series A, 4.50%, 10/01/19 | | | 4,805,000 | | | | | | | | 5,018,486 | |
Miami International Airport, Refunding, Series A, 5.00%, 10/01/21 | | | 5,000,000 | | | | | | | | 5,405,550 | |
Miami International Airport, Refunding, Series A, 5.00%, 10/01/22 | | | 5,890,000 | | | | | | | | 6,366,206 | |
Miami International Airport, Refunding, Series A, 5.25%, 10/01/23 | | | 4,875,000 | | | | | | | | 5,298,443 | |
Miami-Dade County School Board COP, Master Lease Purchase Agreement, Series A, Assured Guaranty, Pre-Refunded, 5.00%, 2/01/23 | | | 12,115,000 | | | | | | | | 12,514,068 | |
Miami-Dade County Transit System Sales Surtax Revenue, | | | | | | | | | | | | |
5.00%, 7/01/24 | | | 2,250,000 | | | | | | | | 2,511,765 | |
5.00%, 7/01/25 | | | 3,000,000 | | | | | | | | 3,343,770 | |
5.00%, 7/01/26 | | | 4,000,000 | | | | | | | | 4,451,360 | |
5.00%, 7/01/27 | | | 4,000,000 | | | | | | | | 4,442,600 | |
Miami-Dade County Water and Sewer System Revenue, Refunding, Series B, 5.00%, 10/01/27 | | | 15,000,000 | | | | | | | | 17,075,700 | |
Orange County Health Facilities Authority Revenue, | | | | | | | | | | | | |
Hospital, Orlando Health Obligated Group, Refunding, Series A, 5.00%, 10/01/27 | | | 1,000,000 | | | | | | | | 1,156,700 | |
Hospital, Orlando Health Obligated Group, Refunding, Series A, 5.00%, 10/01/28 | | | 1,000,000 | | | | | | | | 1,147,890 | |
Hospital, Orlando Health Obligated Group, Refunding, Series A, 5.00%, 10/01/30 | | | 2,875,000 | | | | | | | | 3,262,866 | |
| | | | | | |
franklintempleton.com | | | | Annual Report | | 47 |
FRANKLIN TAX-FREE TRUST
STATEMENT OF INVESTMENTS
Franklin Federal Intermediate-Term Tax-Free Income Fund (continued)
| | | | | | | | |
| | | Principal
Amount | | | Value | |
| |
Municipal Bonds (continued) | | | | | | | | |
Florida (continued) | | | | | | | | |
Orlando Utilities Commission Utility System Revenue, | | | | | | | | |
Refunding, Series A, 5.00%, 10/01/24 | | $ | 2,405,000 | | | $ | 2,807,405 | |
Refunding, Series A, 5.00%, 10/01/25 | | | 2,000,000 | | | | 2,359,940 | |
Series A, 5.00%, 10/01/30 | | | 6,535,000 | | | | 7,747,700 | |
Series A, 5.00%, 10/01/31 | | | 4,540,000 | | | | 5,361,558 | |
Series A, 5.00%, 10/01/32 | | | 4,325,000 | | | | 5,095,715 | |
Series A, 5.00%, 10/01/33 | | | 1,755,000 | | | | 2,059,721 | |
Orlando-Orange County Expressway Authority Revenue, | | | | | | | | |
Refunding, Series B, AGMC Insured, 5.00%, 7/01/23 | | | 10,000,000 | | | | 11,400,800 | |
Refunding, Series B, AGMC Insured, 5.00%, 7/01/24 | | | 14,650,000 | | | | 16,686,350 | |
Palm Beach County School Board COP, Master Lease Purchase Agreement, Refunding, Series B, 5.00%, 8/01/25 | | | 4,000,000 | | | | 4,678,720 | |
Palm Beach County Solid Waste Authority Revenue, Refunding, 5.00%, 10/01/23 | | | 17,290,000 | | | | 19,206,424 | |
Palm Beach County Water and Sewer Revenue, Refunding, 5.00%, 10/01/28 | | | 1,240,000 | | | | 1,421,375 | |
Pasco County Solid Waste Disposal and Resource Recovery System Revenue, | | | | | | | | |
Series D, AGMC Insured, Pre-Refunded, 5.00%, 10/01/22 | | | 9,490,000 | | | | 9,519,609 | |
Series D, AGMC Insured, Pre-Refunded, 5.00%, 10/01/24 | | | 10,455,000 | | | | 10,487,620 | |
Port St. Lucie Utility System Revenue, | | | | | | | | |
Refunding, 4.00%, 9/01/30 | | | 2,500,000 | | | | 2,640,150 | |
Refunding, 4.00%, 9/01/31 | | | 4,135,000 | | | | 4,338,566 | |
Sarasota County Utility System Revenue, | | | | | | | | |
Refunding, Series B, 4.00%, 10/01/35 | | | 1,000,000 | | | | 1,053,630 | |
Refunding, Series B, 4.00%, 10/01/36 | | | 2,000,000 | | | | 2,102,900 | |
Refunding, Series B, 4.00%, 10/01/37 | | | 2,670,000 | | | | 2,795,757 | |
South Miami Health Facilities Authority Hospital Revenue, Baptist Health South Florida Obligated Group,
Refunding, 4.00%, 8/15/33 | | | 6,000,000 | | | | 6,166,500 | |
Tohopekaliga Water Authority Utility System Revenue, Refunding, 4.00%, 10/01/32 | | | 5,000,000 | | | | 5,328,900 | |
| | | | | | | | |
| | |
| | | | | | | 315,556,541 | |
| | | | | | | | |
Georgia 1.8% | | | | | | | | |
Atlanta Airport Passenger Facility Charge Revenue, | | | | | | | | |
General, sub. lien, Refunding, Series A, 5.00%, 1/01/27 | | | 7,000,000 | | | | 7,980,420 | |
General, sub. lien, Refunding, Series A, 5.00%, 1/01/28 | | | 5,100,000 | | | | 5,814,306 | |
Atlanta Water and Wastewater Revenue, | | | | | | | | |
Refunding, 5.00%, 11/01/26 | | | 5,165,000 | | | | 6,032,772 | |
Refunding, Series B, AGMC Insured, 5.00%, 11/01/20 | | | 2,875,000 | | | | 3,033,355 | |
Refunding, Series B, AGMC Insured, 5.00%, 11/01/21 | | | 3,100,000 | | | | 3,270,221 | |
Series B, AGMC Insured, Pre-Refunded, 5.00%, 11/01/20 | | | 5,700,000 | | | | 6,025,527 | |
Series B, AGMC Insured, Pre-Refunded, 5.00%, 11/01/21 | | | 6,130,000 | | | | 6,480,084 | |
Fulton County Development Authority Revenue, | | | | | | | | |
Spelman College, Refunding, 5.00%, 6/01/28 | | | 3,785,000 | | | | 4,343,666 | |
Spelman College, Refunding, 5.00%, 6/01/29 | | | 4,385,000 | | | | 5,019,817 | |
Spelman College, Refunding, 5.00%, 6/01/30 | | | 4,805,000 | | | | 5,483,658 | |
Gainesville and Hall County Hospital Authority Revenue, | | | | | | | | |
Anticipation Certificates, Northeast Georgia Health System Inc. Project, Refunding, Series A, 5.00%, 2/15/27 | | | 1,750,000 | | | | 2,020,095 | |
Anticipation Certificates, Northeast Georgia Health System Inc. Project, Refunding, Series A, 5.00%, 2/15/28 | | | 2,100,000 | | | | 2,409,813 | |
Anticipation Certificates, Northeast Georgia Health System Inc. Project, Refunding, Series A, 5.00%, 2/15/29 | | | 2,000,000 | | | | 2,283,300 | |
Anticipation Certificates, Northeast Georgia Health System Inc. Project, Refunding, Series A, 5.00%, 2/15/30 | | | 1,000,000 | | | | 1,136,640 | |
| | | | | | |
48 | | Annual Report | | | | franklintempleton.com |
FRANKLIN TAX-FREE TRUST
STATEMENT OF INVESTMENTS
Franklin Federal Intermediate-Term Tax-Free Income Fund (continued)
| | | | | | | | |
| | | Principal
Amount | | | Value | |
| |
Municipal Bonds (continued) | | | | | | | | |
Georgia (continued) | | | | | | | | |
Georgia Municipal Electric Authority Revenue, Project One, Subordinated, Series B, 5.00%, 1/01/20 | | $ | 10,000,000 | | | $ | 10,558,600 | |
| | | | | | | | |
| | |
| | | | | | | 71,892,274 | |
| | | | | | | | |
Hawaii 0.9% | | | | | | | | |
Hawaii State GO, | | | | | | | | |
Series EO, 5.00%, 8/01/28 | | | 25,000,000 | | | | 28,858,250 | |
Series FG, 4.00%, 10/01/32 | | | 5,285,000 | | | | 5,616,264 | |
| | | | | | | | |
| | |
| | | | | | | 34,474,514 | |
| | | | | | | | |
Illinois 1.5% | | | | | | | | |
Chicago O’Hare International Airport Revenue, General Airport, third lien, Series C, Assured Guaranty, 5.25%, 1/01/22 | | | 5,215,000 | | | | 5,548,134 | |
Chicago Transit Authority Capital Grant Receipts Revenue, Federal Transit Administration Section 5307, Refunding, AGMC Insured, 5.25%, 6/01/25 | | | 6,125,000 | | | | 6,676,985 | |
Cook County GO, Refunding, Series A, MAC Insured, 5.25%, 11/15/22 | | | 12,395,000 | | | | 13,756,219 | |
Illinois State Finance Authority Revenue, | | | | | | | | |
Northwestern University, 5.00%, 12/01/28 | | | 1,675,000 | | | | 2,037,470 | |
Rush University Medical Center Obligated Group, Series A, Pre-Refunded, 6.75%, 11/01/24 | | | 5,000,000 | | | | 5,177,750 | |
Illinois State GO, | | | | | | | | |
MAC Insured, 5.00%, 2/01/26 | | | 5,650,000 | | | | 6,225,848 | |
Series A, AGMC Insured, 5.00%, 4/01/25 | | | 18,000,000 | | | | 19,657,620 | |
Metropolitan Pier and Exposition Authority Revenue, McCormick Place Expansion Project, Series B, Pre-Refunded, 5.00%, 6/15/23 | | | 600,000 | | | | 673,302 | |
| | | | | | | | |
| | |
| | | | | | | 59,753,328 | |
| | | | | | | | |
Kansas 0.2% | | | | | | | | |
Kansas State Department of Transportation Highway Revenue, Refunding, Series A, 5.00%, 9/01/28 | | | 8,000,000 | | | | 9,260,080 | |
| | | | | | | | |
Kentucky 0.9% | | | | | | | | |
Kentucky Asset/Liability Commission Agency Fund Revenue, Project Notes, Federal Highway Trust, First Series A, 5.00%, 9/01/20 | | | 6,000,000 | | | | 6,472,920 | |
Kentucky State Turnpike Authority Economic Development Road Revenue, | | | | | | | | |
Revitalization Projects, Refunding, Series B, 5.00%, 7/01/26 | | | 2,570,000 | | | | 3,027,126 | |
Revitalization Projects, Refunding, Series B, 5.00%, 7/01/27 | | | 2,000,000 | | | | 2,377,100 | |
Revitalization Projects, Refunding, Series B, 5.00%, 7/01/28 | | | 3,000,000 | | | | 3,546,630 | |
Revitalization Projects, Series A, Pre-Refunded, 5.00%, 7/01/22 | | | 1,000,000 | | | | 1,045,780 | |
Louisville and Jefferson County Metropolitan Sewer District Revenue, Sewer and Drainage System, Refunding, Series A, 5.00%, 5/15/24 | | | 7,000,000 | | | | 7,785,400 | |
Paducah Electric Plant Board Revenue, | | | | | | | | |
Refunding, Series A, AGMC Insured, 5.00%, 10/01/29 | | | 5,500,000 | | | | 6,189,260 | |
Refunding, Series A, AGMC Insured, 5.00%, 10/01/31 | | | 5,500,000 | | | | 6,149,990 | |
| | | | | | | | |
| | |
| | | | | | | 36,594,206 | |
| | | | | | | | |
Louisiana 1.6% | | | | | | | | |
Jefferson Sales Tax District Special Sales Tax Revenue, Parish of Jefferson, Refunding, Series B, Assured Guaranty, 5.00%, 12/01/21 | | | 15,000,000 | | | | 15,856,200 | |
Lafayette Communications System Revenue, | | | | | | | | |
Refunding, AGMC Insured, 5.00%, 11/01/25 | | | 2,400,000 | | | | 2,745,792 | |
Refunding, AGMC Insured, 5.00%, 11/01/27 | | | 3,500,000 | | | | 3,975,965 | |
Refunding, AGMC Insured, 5.00%, 11/01/29 | | | 4,685,000 | | | | 5,281,073 | |
Louisiana Public Facilities Authority Revenue, | | | | | | | | |
Ochsner Clinic Foundation Project, Pre-Refunded, 5.00%, 5/15/29 | | | 10,000 | | | | 11,892 | |
Ochsner Clinic Foundation Project, Pre-Refunded, 5.00%, 5/15/30 | | | 5,000 | | | | 5,946 | |
Ochsner Clinic Foundation Project, Pre-Refunded, 5.00%, 5/15/32 | | | 15,000 | | | | 17,839 | |
| | | | | | |
franklintempleton.com | | | | Annual Report | | 49 |
FRANKLIN TAX-FREE TRUST
STATEMENT OF INVESTMENTS
Franklin Federal Intermediate-Term Tax-Free Income Fund (continued)
| | | | | | | | |
| | | Principal
Amount | | | Value | |
| |
Municipal Bonds (continued) | | | | | | | | |
Louisiana (continued) | | | | | | | | |
Louisiana Public Facilities Authority Revenue, (continued) | | | | | | | | |
Ochsner Clinic Foundation Project, Refunding, 5.00%, 5/15/28 | | $ | 1,000,000 | | | $ | 1,146,750 | |
Ochsner Clinic Foundation Project, Refunding, 5.00%, 5/15/29 | | | 2,000,000 | | | | 2,279,780 | |
Ochsner Clinic Foundation Project, Refunding, 5.00%, 5/15/29 | | | 1,240,000 | | | | 1,403,680 | |
Ochsner Clinic Foundation Project, Refunding, 5.00%, 5/15/30 | | | 2,250,000 | | | | 2,553,255 | |
Ochsner Clinic Foundation Project, Refunding, 5.00%, 5/15/30 | | | 995,000 | | | | 1,121,315 | |
Ochsner Clinic Foundation Project, Refunding, 5.00%, 5/15/31 | | | 1,745,000 | | | | 1,971,309 | |
Ochsner Clinic Foundation Project, Refunding, 5.00%, 5/15/32 | | | 1,750,000 | | | | 1,969,590 | |
Ochsner Clinic Foundation Project, Refunding, 5.00%, 5/15/32 | | | 1,485,000 | | | | 1,658,270 | |
Ochsner Clinic Foundation Project, Refunding, 5.00%, 5/15/33 | | | 2,000,000 | | | | 2,242,560 | |
Louisiana State GO, Refunding, Series C, 5.00%, 8/01/25 | | | 10,000,000 | | | | 11,498,400 | |
New Orleans Aviation Board Revenue, Restructuring GARB, Series A-1, Assured Guaranty, Pre-Refunded, 6.00%, 1/01/23 | | | 2,000,000 | | | | 2,076,680 | |
Parishwide School District GO, Parish of Orleans, Refunding, AGMC Insured, 5.00%, 9/01/18 | | | 5,000,000 | | | | 5,087,100 | |
| | | | | | | | |
| | |
| | | | | | | 62,903,396 | |
| | | | | | | | |
Maryland 1.9% | | | | | | | | |
Anne Arundel County GO, | | | | | | | | |
Consolidated General Improvements, 5.00%, 10/01/31 | | | 3,110,000 | | | | 3,620,475 | |
Consolidated General Improvements, Refunding, 5.00%, 4/01/29 | | | 7,495,000 | | | | 8,709,190 | |
Baltimore Revenue, | | | | | | | | |
Mayor and City Council of Baltimore, Wastewater Projects, Refunding, Series C, 5.00%, 7/01/30 | | | 6,450,000 | | | | 7,569,656 | |
Mayor and City Council of Baltimore, Wastewater Projects, Refunding, Series C, 5.00%, 7/01/32 | | | 5,905,000 | | | | 6,884,758 | |
Mayor and City Council of Baltimore, Wastewater Projects, Refunding, Series D, 5.00%, 7/01/28 | | | 2,790,000 | | | | 3,215,921 | |
Mayor and City Council of Baltimore, Wastewater Projects, Refunding, Series D, 5.00%, 7/01/29 | | | 5,835,000 | | | | 6,686,385 | |
Mayor and City Council of Baltimore, Wastewater Projects, Subordinate, Series A, 5.00%, 7/01/29 | | | 1,000,000 | | | | 1,169,320 | |
Mayor and City Council of Baltimore, Wastewater Projects, Subordinate, Series A, 5.00%, 7/01/30 | | | 2,940,000 | | | | 3,422,807 | |
Mayor and City Council of Baltimore, Wastewater Projects, Subordinate, Series A, 5.00%, 7/01/31 | | | 2,085,000 | | | | 2,418,579 | |
Mayor and City Council of Baltimore, Wastewater Projects, Subordinate, Series A, 5.00%, 7/01/32 | | | 3,240,000 | | | | 3,747,449 | |
Mayor and City Council of Baltimore, Water Projects, Subordinate, Series A, 5.00%, 7/01/29 | | | 1,320,000 | | | | 1,543,502 | |
Mayor and City Council of Baltimore, Water Projects, Subordinate, Series A, 5.00%, 7/01/30 | | | 1,785,000 | | | | 2,078,133 | |
Mayor and City Council of Baltimore, Water Projects, Subordinate, Series A, 5.00%, 7/01/31 | | | 3,765,000 | | | | 4,367,362 | |
Mayor and City Council of Baltimore, Water Projects, Subordinate, Series A, 5.00%, 7/01/32 | | | 4,000,000 | | | | 4,626,480 | |
Maryland State Health and Higher Educational Facilities Authority Revenue, | | | | | | | | |
University of Maryland Medical System Issue, Refunding, Series B, 5.00%, 7/01/30 | | | 8,520,000 | | | | 9,748,243 | |
University of Maryland Medical System Issue, Refunding, Series B, 5.00%, 7/01/31 | | | 7,415,000 | | | | 8,451,914 | |
| | | | | | | | |
| | |
| | | | | | | 78,260,174 | |
| | | | | | | | |
Massachusetts 2.9% | | | | | | | | |
Massachusetts State Department of Transportation Metropolitan Highway System Revenue, Commonwealth Contract Assistance Secured, Subordinated, Series B, 5.00%, 1/01/20 | | | 5,000,000 | | | | 5,315,650 | |
Massachusetts State GO, | | | | | | | | |
Refunding, Series A, 5.00%, 7/01/28 | | | 7,500,000 | | | | 8,726,700 | |
Refunding, Series A, 5.00%, 7/01/29 | | | 6,000,000 | | | | 7,016,340 | |
Massachusetts State Health and Educational Facilities Authority Revenue, CareGroup Issue, Capital Asset Program, Series B-2, NATL Insured, Pre-Refunded, 5.375%, 2/01/26 | | | 1,720,000 | | | | 1,748,810 | |
Massachusetts State School Building Authority Dedicated Sales Tax Revenue, | | | | | | | | |
Senior, Refunding, Series A, 5.00%, 8/15/25. | | | 10,975,000 | | | | 12,360,923 | |
Senior, Refunding, Series A, 5.00%, 8/15/26. | | | 7,000,000 | | | | 7,874,440 | |
Senior, Refunding, Series B, 5.00%, 8/15/27. | | | 6,000,000 | | | | 6,733,200 | |
| | | | | | |
50 | | Annual Report | | | | franklintempleton.com |
FRANKLIN TAX-FREE TRUST
STATEMENT OF INVESTMENTS
Franklin Federal Intermediate-Term Tax-Free Income Fund (continued)
| | | | | | | | |
| | | Principal
Amount | | | Value | |
| |
Municipal Bonds (continued) | | | | | | | | |
Massachusetts (continued) | | | | | | | | |
Massachusetts State Water Pollution Abatement Trust Revenue, | | | | | | | | |
State Revolving Fund, Refunding, 5.00%, 8/01/26 | | $ | 10,650,000 | | | $ | 12,756,996 | |
State Revolving Fund, Series 17, Sub Series 17A, 5.00%, 2/01/24 | | | 9,380,000 | | | | 10,681,194 | |
State Revolving Fund, Series 17, Sub Series 17A, 5.00%, 2/01/25 | | | 9,750,000 | | | | 11,078,047 | |
Massachusetts Water Resources Authority Revenue, General, Green Bonds, Refunding, Series C, 5.00%, 8/01/32 | | | 13,920,000 | | | | 16,451,213 | |
University of Massachusetts Building Authority Revenue, | | | | | | | | |
Refunding, Senior Series 3, 5.00%, 11/01/31 | | | 10,035,000 | | | | 11,873,914 | |
Senior Series 3, 5.00%, 11/01/32 | | | 5,000,000 | | | | 5,902,300 | |
| | | | | | | | |
| | |
| | | | | | | 118,519,727 | |
| | | | | | | | |
Michigan 2.0% | | | | | | | | |
Lansing School District GO, | | | | | | | | |
Counties of Ingham, Eaton and Clinton, School Building and Site, Series I, 5.00%, 5/01/30 | | | 1,860,000 | | | | 2,142,069 | |
Counties of Ingham, Eaton and Clinton, School Building and Site, Series I, 5.00%, 5/01/31 | | | 2,010,000 | | | | 2,303,802 | |
Counties of Ingham, Eaton and Clinton, School Building and Site, Series I, 5.00%, 5/01/32 | | | 2,310,000 | | | | 2,636,865 | |
Michigan Finance Authority Revenue, | | | | | | | | |
Hospital, Trinity Health Credit Group, Refunding, Series MI, 5.00%, 12/01/34 | | | 8,200,000 | | | | 9,249,436 | |
State Revolving Fund, Clean Water, Pre-Refunded, 5.00%, 10/01/24 | | | 5,000,000 | | | | 5,679,150 | |
State Revolving Fund, Clean Water, Subordinate, Refunding, 5.00%, 10/01/24 | | | 7,000,000 | | | | 7,937,650 | |
Michigan State GO, School Loan, Series A, Pre-Refunded, 5.25%, 11/01/22 | | | 10,000,000 | | | | 10,260,100 | |
Michigan State Hospital Finance Authority Revenue, | | | | | | | | |
Ascension Health Credit Group, 4.00%, 11/15/31 | | | 5,100,000 | | | | 5,370,759 | |
Trinity Health Credit Group, Refunding, Series C, 5.00%, 12/01/31 | | | 2,700,000 | | | | 3,118,743 | |
Trinity Health Credit Group, Refunding, Series C, 5.00%, 12/01/32 | | | 1,250,000 | | | | 1,440,462 | |
Trinity Health Credit Group, Refunding, Series MI, 5.00%, 12/01/24 | | | 8,000,000 | | | | 8,978,960 | |
Michigan State Strategic Fund Limited Obligation Revenue, | | | | | | | | |
Michigan House of Representatives Facilities, Series A, Assured Guaranty, Pre-Refunded, 5.25%, 10/15/22 | | | 4,000,000 | | | | 4,098,360 | |
Michigan House of Representatives Facilities, Series A, Assured Guaranty, Pre-Refunded, 5.25%, 10/15/23 | | | 1,000,000 | | | | 1,024,590 | |
Wayne State University Revenue, | | | | | | | | |
General, Refunding, Series A, 5.00%, 11/15/18 | | | 3,195,000 | | | | 3,275,099 | |
General, Refunding, Series A, 5.00%, 11/15/19 | | | 3,905,000 | | | | 4,129,772 | |
General, Refunding, Series A, 5.00%, 11/15/20 | | | 3,935,000 | | | | 4,143,752 | |
General, Series A, ETM, 5.00%, 11/15/18 | | | 1,070,000 | | | | 1,097,199 | |
General, Series A, ETM, 5.00%, 11/15/19 | | | 1,305,000 | | | | 1,378,980 | |
General, Series A, Pre-Refunded, 5.00%, 11/15/20 | | | 1,320,000 | | | | 1,394,831 | |
| | | | | | | | |
| | |
| | | | | | | 79,660,579 | |
| | | | | | | | |
Minnesota 1.5% | | | | | | | | |
Minnesota Agricultural and Economic Development Board Revenue, | | | | | | | | |
Health Care Facilities, Essentia Health Obligated Group, Series C-1, Assured Guaranty, 5.00%, 2/15/21 | | | 4,165,000 | | | | 4,426,895 | |
Health Care Facilities, Essentia Health Obligated Group, Series C-1, Assured Guaranty, 5.00%, 2/15/22 | | | 5,570,000 | | | | 5,905,425 | |
Health Care Facilities, Essentia Health Obligated Group, Series C-1, Assured Guaranty, 5.25%, 2/15/23 | | | 5,000,000 | | | | 5,341,600 | |
University of Minnesota GO, | | | | | | | | |
Refunding, Series B, 5.00%, 12/01/30 | | | 8,060,000 | | | | 9,623,801 | |
Refunding, Series B, 5.00%, 12/01/31 | | | 13,900,000 | | | | 16,531,409 | |
Refunding, Series B, 5.00%, 12/01/32 | | | 4,405,000 | | | | 5,226,488 | |
| | | | | | |
franklintempleton.com | | | | Annual Report | | 51 |
FRANKLIN TAX-FREE TRUST
STATEMENT OF INVESTMENTS
Franklin Federal Intermediate-Term Tax-Free Income Fund (continued)
| | | | | | | | | | | | |
| | | Principal
Amount | | | | | | Value | |
Municipal Bonds (continued) | | | | | | | | | | | | |
Minnesota (continued) | | | | | | | | | | | | |
University of Minnesota GO, (continued) | | | | | | | | | | | | |
Refunding, Series B, 5.00%, 12/01/33 | | $ | 6,755,000 | | | | | | | $ | 7,983,127 | |
Series A, 5.00%, 4/01/30 | | | 4,970,000 | | | | | | | | 5,830,208 | |
| | | | | | | | | | | | |
| | | |
| | | | | | | | | | | 60,868,953 | |
| | | | | | | | | | | | |
Missouri 0.3% | | | | | | | | | | | | |
Missouri State Joint Municipal Electric Utility Commission Power Project Revenue, | | | | | | | | | | | | |
Plum Point Project, Refunding, Series A, 5.00%, 1/01/27 | | | 3,250,000 | | | | | | | | 3,676,497 | |
Plum Point Project, Refunding, Series A, 5.00%, 1/01/28 | | | 4,500,000 | | | | | | | | 5,072,670 | |
Plum Point Project, Refunding, Series A, 5.00%, 1/01/29 | | | 4,045,000 | | | | | | | | 4,543,789 | |
| | | | | | | | | | | | |
| | | |
| | | | | | | | | | | 13,292,956 | |
| | | | | | | | | | | | |
Nevada 1.2% | | | | | | | | | | | | |
Clark County Airport System Revenue, | | | | | | | | | | | | |
sub. lien, Series C, AGMC Insured, 5.00%, 7/01/22 | | | 5,000,000 | | | | | | | | 5,228,250 | |
sub. lien, Series C, AGMC Insured, 5.00%, 7/01/23 | | | 15,000,000 | | | | | | | | 15,682,650 | |
Clark County School District GO, Refunding, Series A, NATL Insured, 4.50%, 6/15/19 | | | 4,600,000 | | | | | | | | 4,749,040 | |
Clark County Water Reclamation District GO, | | | | | | | | | | | | |
Series A, Pre-Refunded, 5.25%, 7/01/21 | | | 3,435,000 | | | | | | | | 3,605,857 | |
Series A, Pre-Refunded, 5.25%, 7/01/22 | | | 3,120,000 | | | | | | | | 3,275,189 | |
Series B, Pre-Refunded, 5.25%, 7/01/21 | | | 3,430,000 | | | | | | | | 3,600,608 | |
Series B, Pre-Refunded, 5.25%, 7/01/22 | | | 3,615,000 | | | | | | | | 3,794,810 | |
Washoe County School District GO, Refunding, Series A, 5.00%, 6/01/25 | | | 6,130,000 | | | | | | | | 6,819,502 | |
| | | | | | | | | | | | |
| | | |
| | | | | | | | | | | 46,755,906 | |
| | | | | | | | | | | | |
New Hampshire 0.2% | | | | | | | | | | | | |
Manchester GARB, Series A, AGMC Insured, 5.00%, 1/01/25 | | | 7,930,000 | | | | | | | | 8,661,780 | |
| | | | | | | | | | | | |
New Jersey 5.9% | | | | | | | | | | | | |
Hudson County Improvement Authority Facility Lease Revenue, | | | | | | | | | | | | |
Hudson County Lease Project, Refunding, AGMC Insured, 5.375%, 10/01/22 | | | 5,220,000 | | | | | | | | 5,896,982 | |
Hudson County Lease Project, Refunding, AGMC Insured, 5.375%, 10/01/23 | | | 5,375,000 | | | | | | | | 6,160,072 | |
Hudson County Lease Project, Refunding, AGMC Insured, 5.375%, 10/01/24 | | | 2,050,000 | | | | | | | | 2,382,571 | |
New Jersey EDA Revenue, | | | | | | | | | | | | |
School Facilities Construction, Refunding, Series EE, 5.25%, 9/01/24 | | | 12,210,000 | | | | | | | | 13,031,611 | |
School Facilities Construction, Series AAA, 5.00%, 6/15/34 | | | 5,000,000 | | | | | | | | 5,374,700 | |
New Jersey Health Care Facilities Financing Authority Revenue, | | | | | | | | | | | | |
Barnabas Health Issue, Series A, ETM, 5.00%, 7/01/20 | | | 10,000,000 | | | | | | | | 10,738,800 | |
Barnabas Health Issue, Series A, ETM, 5.00%, 7/01/21 | | | 20,535,000 | | | | | | | | 22,572,483 | |
Inspira Health Obligated Group Issue, Series A, 5.00%, 7/01/30 | | | 900,000 | | | | | | | | 1,031,310 | |
Inspira Health Obligated Group Issue, Series A, 5.00%, 7/01/31 | | | 1,080,000 | | | | | | | | 1,232,885 | |
New Jersey State COP, | | | | | | | | | | | | |
Equipment Lease Purchase Agreement, Series A, Pre-Refunded, 5.25%, 6/15/22 | | | 10,000,000 | | | | | | | | 10,465,200 | |
Equipment Lease Purchase Agreement, Series A, Pre-Refunded, 5.25%, 6/15/23 | | | 17,945,000 | | | | | | | | 18,779,801 | |
New Jersey State Educational Facilities Authority Revenue, | | | | | | | | | | | | |
Higher Education Capital Improvement Fund Issue, Series B, 5.00%, 9/01/36 | | | 5,000,000 | | | | | | | | 5,309,050 | |
Kean University Issue, Series A, Pre-Refunded, 5.00%, 9/01/21 | | | 6,000,000 | | | | | | | | 6,297,900 | |
New Jersey State Higher Education Assistance Authority Student Loan Revenue, | | | | | | | | | | | | |
Refunding, Series 1A, 5.25%, 12/01/19 | | | 2,500,000 | | | | | | | | 2,632,125 | |
Series A, 5.375%, 6/01/24 | | | 5,110,000 | | | | | | | | 5,276,944 | |
New Jersey State Transportation Trust Fund Authority Revenue, | | | | | | | | | | | | |
Transportation Program, Series AA, AGMC Insured, 5.00%, 6/15/26 | | | 26,650,000 | | | | | | | | 28,633,293 | |
Transportation System, Refunding, Series A, 5.50%, 12/15/22 | | | 25,000,000 | | | | | | | | 27,872,250 | |
Transportation System, Refunding, Series A, Assured Guaranty, 5.50%, 12/15/22 | | | 11,465,000 | | | | | | | | 12,946,163 | |
| | | | | | |
52 | | Annual Report | | | | franklintempleton.com |
FRANKLIN TAX-FREE TRUST
STATEMENT OF INVESTMENTS
Franklin Federal Intermediate-Term Tax-Free Income Fund (continued)
| | | | | | | | | | | | |
| | | Principal
Amount | | | | | | Value | |
Municipal Bonds (continued) | | | | | | | | | | | | |
New Jersey (continued) | | | | | | | | | | | | |
New Jersey State Turnpike Authority Revenue, | | | | | | | | | | | | |
Turnpike, Refunding, Series H, 5.00%, 1/01/20 | | $ | 6,540,000 | | | | | | | $ | 6,729,202 | |
Turnpike, Series H, Pre-Refunded, 5.00%, 1/01/20 | | | 3,460,000 | | | | | | | | 3,561,274 | |
Turnpike, Series H, Pre-Refunded, 5.00%, 1/01/21 | | | 13,060,000 | | | | | | | | 13,453,237 | |
Turnpike, Series H, Pre-Refunded, 5.00%, 1/01/21 | | | 6,940,000 | | | | | | | | 7,143,134 | |
Rutgers State University GO, | | | | | | | | | | | | |
Refunding, Series J, 5.00%, 5/01/26 | | | 5,000,000 | | | | | | | | 5,664,050 | |
Refunding, Series J, 5.00%, 5/01/27 | | | 10,830,000 | | | | | | | | 12,228,911 | |
Series L, 5.00%, 5/01/27 | | | 5,270,000 | | | | | | | | 5,950,726 | |
| | | | | | | | | | | | |
| | | |
| | | | | | | | | | | 241,364,674 | |
| | | | | | | | | | | | |
New York 9.2% | | | | | | | | | | | | |
Erie County IDA School Facility Revenue, | | | | | | | | | | | | |
City School District of the City of Buffalo Project, Refunding, Series A, 5.00%, 5/01/23 | | | 6,235,000 | | | | | | | | 6,975,905 | |
City School District of the City of Buffalo Project, Refunding, Series A, 5.00%, 5/01/24 | | | 8,000,000 | | | | | | | | 8,950,640 | |
City School District of the City of Buffalo Project, Series A, AGMC Insured, Pre-Refunded, 5.75%, 5/01/22. | | | 5,000,000 | | | | | | | | 5,036,750 | |
City School District of the City of Buffalo Project, Series A, Pre-Refunded, 5.00%, 5/01/22 | | | 14,840,000 | | | | | | | | 15,452,595 | |
Long Island Power Authority Electric System Revenue, General, Refunding, Series B, 5.00%, 9/01/26 | | | 5,000,000 | | | | | | | | 5,580,450 | |
MTA Revenue, | | | | | | | | | | | | |
Transportation, Refunding, Series F, 5.00%, 11/15/26 | | | 25,000,000 | | | | | | | | 28,062,750 | |
Transportation, Series A, AGMC Insured, 5.50%, 11/15/20 | | | 4,365,000 | | | | | | | | 4,803,683 | |
Transportation, Series A, Pre-Refunded, 5.00%, 11/15/27 | | | 3,500,000 | | | | | | | | 4,021,885 | |
Transportation, Series C, 5.75%, 11/15/18 | | | 3,345,000 | | | | | | | | 3,448,227 | |
Nassau County Local Economic Assistance and FICO Revenue, Catholic Health Services of Long Island Obligated Group Project, Refunding, 5.00%, 7/01/21 | | | 9,000,000 | | | | | | | | 9,816,840 | |
New York City GO, | | | | | | | | | | | | |
Fiscal 2013, Refunding, Series D, 5.00%, 8/01/27 | | | 10,000,000 | | | | | | | | 11,267,400 | |
Fiscal 2013, Series I, 5.00%, 8/01/24 | | | 10,200,000 | | | | | | | | 11,649,930 | |
Fiscal 2014, Refunding, Series G, 5.00%, 8/01/22 | | | 8,000,000 | | | | | | | | 9,016,160 | |
Fiscal 2014, Refunding, Series G, 5.00%, 8/01/23 | | | 6,860,000 | | | | | | | | 7,857,787 | |
Fiscal 2015, Refunding, Series C, 5.00%, 8/01/25 | | | 2,000,000 | | | | | | | | 2,343,320 | |
Fiscal 2015, Refunding, Series C, 5.00%, 8/01/26 | | | 10,000,000 | | | | | | | | 11,578,100 | |
Fiscal 2015, Refunding, Series C, 5.00%, 8/01/27 | | | 7,500,000 | | | | | | | | 8,673,300 | |
Fiscal 2017, Subseries A-1, 5.00%, 8/01/29 | | | 10,000,000 | | | | | | | | 11,622,500 | |
New York City Transitional Finance Authority Building Aid Revenue, | | | | | | | | | | | | |
Fiscal 2009, Series S-3, 5.00%, 1/15/23 | | | 5,000,000 | | | | | | | | 5,152,700 | |
Fiscal 2009, Series S-4, 5.00%, 1/15/21 | | | 4,665,000 | | | | | | | | 4,808,309 | |
New York City Transitional Finance Authority Revenue, | | | | | | | | | | | | |
Future Tax Secured, Subordinate, Fiscal 2003, Refunding, Subseries A-1, 5.00%, 11/01/23 | | | 11,500,000 | | | | | | | | 12,781,560 | |
Future Tax Secured, Subordinate, Fiscal 2011, Series C, 5.00%, 11/01/23 | | | 12,805,000 | | | | | | | | 13,932,224 | |
Future Tax Secured, Subordinate, Fiscal 2012, Series C, 5.00%, 11/01/24 | | | 7,620,000 | | | | | | | | 8,460,638 | |
Future Tax Secured, Subordinate, Fiscal 2014, Series D, Subseries D-1, 5.00%, 2/01/27 | | | 8,740,000 | | | | | | | | 10,027,227 | |
Future Tax Secured, Subordinate, Fiscal 2014, Series D, Subseries D-1, 5.00%, 2/01/28 | | | 5,000,000 | | | | | | | | 5,709,700 | |
New York State Dormitory Authority Revenues, | | | | | | | | | | | | |
Non-State Supported Debt, North Shore-Long Island Jewish Obligated Group, Refunding, Series A, 5.00%, 5/01/29 | | | 10,000,000 | | | | | | | | 11,405,200 | |
Non-State Supported Debt, School Districts, Financing Program, Series A, Assured Guaranty, 5.00%, 10/01/24 | | | 350,000 | | | | | | | | 367,819 | |
Non-State Supported Debt, School Districts, Financing Program, Series A, Assured Guaranty, Pre-Refunded, 5.00%, 10/01/24 | | | 4,035,000 | | | | | | | | 4,255,392 | |
| | | | | | |
franklintempleton.com | | | | Annual Report | | 53 |
FRANKLIN TAX-FREE TRUST
STATEMENT OF INVESTMENTS
Franklin Federal Intermediate-Term Tax-Free Income Fund (continued)
| | | | | | | | | | | | |
| | | Principal
Amount | | | | | | Value | |
Municipal Bonds (continued) | | | | | | | | | | | | |
New York (continued) | | | | | | | | | | | | |
New York State Dormitory Authority Revenues, (continued) | | | | | | | | | | | | |
Non-State Supported Debt, School Districts, Financing Program, Series A, Assured Guaranty, Pre-Refunded, 5.00%, 10/01/24 | | $ | 615,000 | | | | | | | $ | 648,093 | |
State Supported Debt, City University System, Consolidated Fifth General Resolution, Series A, NATL Insured, 5.50%, 7/01/23 | | | 7,915,000 | | | | | | | | 9,252,160 | |
State Supported Debt, Mental Health Services Facilities Improvement, Refunding, Series A-1, 5.00%, 2/15/19 | | | 3,245,000 | | | | | | | | 3,352,961 | |
Third General Resolution, State University Educational Facilities Issue, Refunding, Series A, 5.00%, 5/15/24 | | | 7,000,000 | | | | | | | | 7,845,250 | |
New York State Dormitory Authority State Personal Income Tax Revenue, | | | | | | | | | | | | |
General Purpose, Refunding, Series A, 5.00%, 12/15/27 | | | 10,000,000 | | | | | | | | 11,303,900 | |
General Purpose, Refunding, Series A, 5.00%, 3/15/28 | | | 7,185,000 | | | | | | | | 8,322,242 | |
General Purpose, Refunding, Series E, 5.00%, 2/15/28 | | | 10,000,000 | | | | | | | | 11,565,600 | |
General Purpose, Refunding, Series E, 5.00%, 2/15/30 | | | 5,000,000 | | | | | | | | 5,751,850 | |
New York State Local Government Assistance Corp. Revenue, sub. lien, Refunding, Series B, 5.00%, 4/01/21 | | | 12,000,000 | | | | | | | | 12,854,520 | |
New York State Thruway Authority General Revenue, | | | | | | | | | | | | |
Refunding, Series H, NATL Insured, 5.00%, 1/01/22 | | | 10,000,000 | | | | | | | | 10,028,700 | |
Series I, 5.00%, 1/01/26 | | | 10,000,000 | | | | | | | | 11,057,800 | |
New York State Thruway Authority Revenue, Local Highway and Bridge Service Contract, Refunding, 5.00%, 4/01/19 | | | 9,570,000 | | | | | | | | 9,937,009 | |
New York State Urban Development Corp. Revenue, | | | | | | | | | | | | |
Empire State Development Corp., Service Contract, Refunding, Series C, 5.00%, 1/01/20 | | | 6,500,000 | | | | | | | | 6,904,300 | |
State Personal Income Tax, General Purpose, Series D, 5.00%, 3/15/24 | | | 10,000,000 | | | | | | | | 11,404,600 | |
Rockland County Solid Waste Management Authority Revenue, Refunding, Series A, Assured Guaranty, 5.375%, 12/15/18 | | | 1,655,000 | | | | | | | | 1,704,501 | |
Suffolk County EDC Revenue, Catholic Health Services of Long Island Obligated Group Project, Refunding, 5.00%, 7/01/22 | | | 10,000,000 | | | | | | | | 10,870,700 | |
| | | | | | | | | | | | |
| | | |
| | | | | | | | | | | 375,863,177 | |
| | | | | | | | | | | | |
North Carolina 0.9% | | | | | | | | | | | | |
Buncombe County Limited Obligation Revenue, Series A, 5.00%, 6/01/28 | | | 5,000,000 | | | | | | | | 5,746,700 | |
Charlotte Water and Sewer System Revenue, Refunding, 5.00%, 7/01/27 | | | 10,000,000 | | | | | | | | 11,767,300 | |
Greenville Utilities Commission Combined Enterprise System Revenue, | | | | | | | | | | | | |
Refunding, 5.00%, 4/01/32 | | | 2,830,000 | | | | | | | | 3,264,122 | |
Refunding, 5.00%, 4/01/34 | | | 1,400,000 | | | | | | | | 1,601,726 | |
North Carolina Eastern Municipal Power Agency Power System Revenue, | | | | | | | | | | | | |
Series A, ETM, 5.00%, 1/01/21 | | | 10,000,000 | | | | | | | | 10,887,700 | |
Series C, Assured Guaranty, ETM, 6.00%, 1/01/19 | | | 500,000 | | | | | | | | 519,170 | |
Oak Island Enterprise System Revenue, Assured Guaranty, Pre-Refunded, 5.50%, 6/01/23 | | | 1,735,000 | | | | | | | | 1,820,830 | |
| | | | | | | | | | | | |
| | | |
| | | | | | | | | | | 35,607,548 | |
| | | | | | | | | | | | |
Ohio 6.3% | | | | | | | | | | | | |
Akron Income Tax Revenue, | | | | | | | | | | | | |
Community Learning Centers, Refunding, Series A, 5.00%, 12/01/24 | | | 5,265,000 | | | | | | | | 5,898,064 | |
Community Learning Centers, Refunding, Series A, 5.00%, 12/01/25 | | | 6,645,000 | | | | | | | | 7,432,499 | |
Community Learning Centers, Refunding, Series A, 5.00%, 12/01/26 | | | 8,240,000 | | | | | | | | 9,198,724 | |
American Municipal Power Inc. Revenue, | | | | | | | | | | | | |
Greenup Hydroelectric Project, Series A, 5.00%, 2/15/29 | | | 1,000,000 | | | | | | | | 1,142,840 | |
Greenup Hydroelectric Project, Series A, 5.00%, 2/15/30 | | | 1,000,000 | | | | | | | | 1,137,530 | |
| | | | | | |
54 | | Annual Report | | | | franklintempleton.com |
FRANKLIN TAX-FREE TRUST
STATEMENT OF INVESTMENTS
Franklin Federal Intermediate-Term Tax-Free Income Fund (continued)
| | | | | | | | | | | | |
| | | Principal
Amount | | | | | | Value | |
Municipal Bonds (continued) | | | | | | | | | | | | |
Ohio (continued) | | | | | | | | | | | | |
Cincinnati GO, | | | | | | | | | | | | |
Various Purpose, Improvement, Series A, Pre-Refunded, 5.00%, 12/01/24 | | $ | 1,270,000 | | | | | | | $ | 1,432,090 | |
Various Purpose, Improvement, Series A, Pre-Refunded, 5.00%, 12/01/25 | | | 2,000,000 | | | | | | | | 2,255,260 | |
Various Purpose, Improvement, Series A, Pre-Refunded, 5.00%, 12/01/27 | | | 2,000,000 | | | | | | | | 2,255,260 | |
Various Purpose, Improvement, Series A, Pre-Refunded, 5.00%, 12/01/28 | | | 2,350,000 | | | | | | | | 2,649,930 | |
Cleveland Airport System Revenue, | | | | | | | | | | | | |
Refunding, Series A, AGMC Insured, 5.00%, 1/01/25 | | | 5,000,000 | | | | | | | | 5,484,450 | |
Refunding, Series A, AGMC Insured, 5.00%, 1/01/26 | | | 5,000,000 | | | | | | | | 5,471,000 | |
Cleveland Water Revenue, | | | | | | | | | | | | |
second lien, Series A, Pre-Refunded, 5.00%, 1/01/25 | | | 2,500,000 | | | | | | | | 2,791,825 | |
second lien, Series A, Pre-Refunded, 5.00%, 1/01/26 | | | 2,000,000 | | | | | | | | 2,233,460 | |
Cuyahoga County EDR, | | | | | | | | | | | | |
Recovery Zone Facility, Medical Mart/Convention Center Project, Series F, 5.00%, 12/01/20 | | | 7,000,000 | | | | | | | | 7,597,590 | |
Recovery Zone Facility, Medical Mart/Convention Center Project, Series F, 5.00%, 12/01/21 | | | 7,300,000 | | | | | | | | 7,943,714 | |
Hamilton County Sewer System Revenue, | | | | | | | | | | | | |
The Metropolitan Sewer District of Greater Cincinnati, Improvement and Refunding, Series A, 5.00%, 12/01/24 | | | 2,500,000 | | | | | | | | 2,884,650 | |
The Metropolitan Sewer District of Greater Cincinnati, Improvement and Refunding, Series A, 5.00%, 12/01/25 | | | 2,400,000 | | | | | | | | 2,762,256 | |
The Metropolitan Sewer District of Greater Cincinnati, Improvement and Refunding, Series A, 5.00%, 12/01/26 | | | 4,000,000 | | | | | | | | 4,592,120 | |
The Metropolitan Sewer District of Greater Cincinnati, Improvement and Refunding, Series A, 5.00%, 12/01/27 | | | 5,000,000 | | | | | | | | 5,725,600 | |
The Metropolitan Sewer District of Greater Cincinnati, Improvement and Refunding, Series A, 5.00%, 12/01/28 | | | 3,000,000 | | | | | | | | 3,426,690 | |
Kent State University Revenues, | | | | | | | | | | | | |
General Receipts, Series A, 5.00%, 5/01/23 | | | 1,200,000 | | | | | | | | 1,341,072 | |
General Receipts, Series A, 5.00%, 5/01/24 | | | 1,500,000 | | | | | | | | 1,675,065 | |
General Receipts, Series A, 5.00%, 5/01/25 | | | 1,500,000 | | | | | | | | 1,672,530 | |
General Receipts, Series A, 5.00%, 5/01/26 | | | 1,600,000 | | | | | | | | 1,781,328 | |
Ohio State Building Authority Revenue, State Facilities, Administrative Building Fund Projects, Refunding, Series C, 5.00%, 10/01/22 | | | 5,780,000 | | | | | | | | 6,254,943 | |
Ohio State GO, | | | | | | | | | | | | |
Higher Education, Series A, Pre-Refunded, 5.00%, 2/01/24 | | | 8,585,000 | | | | | | | | 9,514,584 | |
Higher Education, Series A, Pre-Refunded, 5.00%, 2/01/25 | | | 7,000,000 | | | | | | | | 7,757,960 | |
Highway Capital Improvements, Full Faith and Credit, Highway User Receipts, Series R, Pre-Refunded, 5.00%, 5/01/26 | | | 11,000,000 | | | | | | | | 12,835,020 | |
Highway Capital Improvements, Full Faith and Credit, Highway User Receipts, Series R, Pre-Refunded, 5.00%, 5/01/27 | | | 5,000,000 | | | | | | | | 5,834,100 | |
Highway Capital Improvements, Full Faith and Credit, Highway User Receipts, Series R, Pre-Refunded, 5.00%, 5/01/28 | | | 9,100,000 | | | | | | | | 10,618,062 | |
Highway Capital Improvements, Full Faith and Credit, Highway User Receipts, Series T, 5.00%, 5/01/31 | | | 5,000,000 | | | | | | | | 5,910,100 | |
Highway Capital Improvements, Full Faith and Credit, Highway User Receipts, Series T, 5.00%, 5/01/32 | | | 5,000,000 | | | | | | | | 5,887,900 | |
Ohio State Turnpike Commission Revenue, Turnpike, Refunding, Series A, NATL Insured, 5.50%, 2/15/24 | | | 10,000,000 | | | | | | | | 11,449,400 | |
Ohio State Water Development Authority Revenue, Fresh Water, Series A, 5.00%, 12/01/30 | | | 5,875,000 | | | | | | | | 6,882,034 | |
Ohio State Water Development Authority Water PCR, Loan Fund, Series A, 5.00%, 12/01/31 | | | 10,000,000 | | | | | | | | 11,816,800 | |
| | | | | | |
franklintempleton.com | | | | Annual Report | | 55 |
FRANKLIN TAX-FREE TRUST
STATEMENT OF INVESTMENTS
Franklin Federal Intermediate-Term Tax-Free Income Fund (continued)
| | | | | | | | | | | | |
| | | Principal Amount | | | | | | Value | |
Municipal Bonds (continued) | | | | | | | | | | | | |
Ohio (continued) | | | | | | | | | | | | |
Toledo City School District GO, | | | | | | | | | | | | |
School Facilities Improvement, Refunding, Series B, 5.00%, 12/01/24 | | $ | 2,920,000 | | | | | | | $ | 3,294,986 | |
School Facilities Improvement, Refunding, Series B, 5.00%, 12/01/25 | | | 4,125,000 | | | | | | | | 4,624,991 | |
School Facilities Improvement, Refunding, Series B, 5.00%, 12/01/26 | | | 4,340,000 | | | | | | | | 4,863,968 | |
School Facilities Improvement, Refunding, Series B, 5.00%, 12/01/27 | | | 4,565,000 | | | | | | | | 5,094,357 | |
Toledo Water System Revenue, | | | | | | | | | | | | |
Improvement and Refunding, 5.00%, 11/15/25 | | | 4,000,000 | | | | | | | | 4,537,080 | |
Improvement and Refunding, 5.00%, 11/15/26 | | | 6,140,000 | | | | | | | | 6,951,524 | |
Improvement and Refunding, 5.00%, 11/15/27 | | | 6,450,000 | | | | | | | | 7,289,016 | |
Improvement and Refunding, 5.00%, 11/15/28 | | | 6,570,000 | | | | | | | | 7,397,163 | |
University of Cincinnati General Receipts Revenue, | | | | | | | | | | | | |
Series C, 5.00%, 6/01/25 | | | 3,010,000 | | | | | | | | 3,397,989 | |
Series C, Assured Guaranty, 5.00%, 6/01/21 | | | 11,810,000 | | | | | | | | 12,503,011 | |
Series C, Assured Guaranty, 5.00%, 6/01/22 | | | 11,675,000 | | | | | | | | 12,358,104 | |
| | | | | | | | | | | | |
| | | |
| | | | | | | | | | | 257,858,639 | |
| | | | | | | | | | | | |
Oregon 1.7% | | | | | | | | | | | | |
Clackamas County School District No. 12 North Clackamas, Series B, 5.00%, 6/15/32 | | | 3,725,000 | | | | | | | | 4,370,915 | |
Deschutes County Hospital Facility Authority Hospital Revenue, Cascade Healthcare Community Inc., Pre-Refunded, 7.375%, 1/01/23 | | | 2,000,000 | | | | | | | | 2,095,880 | |
Oregon State Department of Transportation Highway User Tax Revenue, senior lien, Refunding, Series A, 5.00%, 11/15/25 | | | 10,000,000 | | | | | | | | 11,330,200 | |
senior lien, Refunding, Series A, 5.00%, 11/15/27 | | | 13,000,000 | | | | | | | | 15,124,460 | |
senior lien, Refunding, Series A, 5.00%, 11/15/28 | | | 3,500,000 | | | | | | | | 4,067,245 | |
senior lien, Series A, Pre-Refunded, 5.00%, 11/15/22 | | | 5,840,000 | | | | | | | | 6,088,317 | |
Portland Water System Revenue, second lien, Refunding, Series A, 5.00%, 10/01/25 | | | 5,000,000 | | | | | | | | 5,692,600 | |
Washington Counties School District No. 48J Beaverton GO, | | | | | | | | | | | | |
5.00%, 6/15/27 | | | 5,000,000 | | | | | | | | 5,760,450 | |
5.00%, 6/15/28 | | | 5,000,000 | | | | | | | | 5,751,000 | |
5.00%, 6/15/29 | | | 7,500,000 | | | | | | | | 8,598,225 | |
| | | | | | | | | | | | |
| | | |
| | | | | | | | | | | 68,879,292 | |
| | | | | | | | | | | | |
Pennsylvania 4.9% | | | | | | | | | | | | |
Allegheny County Hospital Development Authority Revenue, | | | | | | | | | | | | |
University of Pittsburgh Medical Center, Series A, 5.00%, 5/15/19 | | | 9,000,000 | | | | | | | | 9,368,370 | |
University of Pittsburgh Medical Center, Series A, 5.00%, 5/15/20 | | | 7,500,000 | | | | | | | | 8,031,000 | |
Allegheny County Sanitary Authority Sewer Revenue, Refunding, AGMC Insured, 4.00%, 12/01/32 | | | 2,250,000 | | | | | | | | 2,375,753 | |
Commonwealth Financing Authority Revenue, | | | | | | | | | | | | |
Series C-1, AGMC Insured, 5.00%, 6/01/22 | | | 4,130,000 | | | | | | | | 4,414,020 | |
Series C-1, AGMC Insured, 5.00%, 6/01/23 | | | 4,345,000 | | | | | | | | 4,640,808 | |
Lancaster County Solid Waste Management Authority Solid Waste Disposal System Revenue, | | | | | | | | | | | | |
Series A, 5.25%, 12/15/25 | | | 5,345,000 | | | | | | | | 6,079,563 | |
Series A, 5.25%, 12/15/26 | | | 5,835,000 | | | | | | | | 6,606,795 | |
Pennsylvania State GO, Second Series, 5.00%, 10/15/26 | | | 13,375,000 | | | | | | | | 15,124,985 | |
Pennsylvania State Higher Educational Facilities Authority Revenue, | | | | | | | | | | | | |
The Trustees of the University of Pennsylvania, Refunding, Series A, 4.00%, 8/15/31 | | | 3,775,000 | | | | | | | | 4,043,289 | |
University of Pennsylvania Health System, Series A, 4.00%, 8/15/34 | | | 5,895,000 | | | | | | | | 6,120,779 | |
Pennsylvania State Turnpike Commission Turnpike Revenue, | | | | | | | | | | | | |
Series B, 5.00%, 12/01/19 | | | 32,230,000 | | | | | | | | 34,144,462 | |
Series E, Pre-Refunded, 5.00%, 12/01/24 | | | 5,000,000 | | | | | | | | 5,577,150 | |
Series E, Pre-Refunded, 5.00%, 12/01/25 | | | 10,000,000 | | | | | | | | 11,154,300 | |
Subordinate, Series A, Assured Guaranty, Pre-Refunded, 5.00%, 6/01/22 | | | 6,070,000 | | | | | | | | 6,332,952 | |
| | | | | | |
56 | | Annual Report | | | | franklintempleton.com |
FRANKLIN TAX-FREE TRUST
STATEMENT OF INVESTMENTS
Franklin Federal Intermediate-Term Tax-Free Income Fund (continued)
| | | | | | | | | | | | |
| | | Principal
Amount | | | | | | Value | |
Municipal Bonds (continued) | | | | | | | | | | | | |
Pennsylvania (continued) | | | | | | | | | | | | |
Pennsylvania State Turnpike Commission Turnpike Revenue, (continued) | | | | | | | | | | | | |
Subordinate, Series C, Subseries C-1, Assured Guaranty, Pre-Refunded, 6.00%, 6/01/23 | | $ | 10,000,000 | | | | | | | $ | 10,115,800 | |
Pennsylvania State University Revenue, Series A, 5.00%, 9/01/30 | | | 4,000,000 | | | | | | | | 4,729,400 | |
Philadelphia Gas Works Revenue, | | | | | | | | | | | | |
1998 General Ordinance, Refunding, Fifteenth Series, 5.00%, 8/01/30 | | | 2,000,000 | | | | | | | | 2,302,860 | |
1998 General Ordinance, Refunding, Fifteenth Series, 5.00%, 8/01/31 | | | 4,030,000 | | | | | | | | 4,629,624 | |
1998 General Ordinance, Refunding, Fourteenth Series, 5.00%, 10/01/29 | | | 2,000,000 | | | | | | | | 2,290,820 | |
Philadelphia GO, | | | | | | | | | | | | |
Refunding, Series A, Assured Guaranty, 5.25%, 8/01/22 | | | 17,810,000 | | | | | | | | 18,725,256 | |
Series A, Assured Guaranty, Pre-Refunded, 5.25%, 8/01/22 | | | 2,190,000 | | | | | | | | 2,303,814 | |
Philadelphia Municipal Authority Lease Revenue, Pre-Refunded, 6.00%, 4/01/22 | | | 7,065,000 | | | | | | | | 7,407,511 | |
Philadelphia Water and Wastewater Revenue, | | | | | | | | | | | | |
Refunding, Series A, AGMC Insured, 5.00%, 6/15/18 | | | 5,000,000 | | | | | | | | 5,052,400 | |
Refunding, Series A, AGMC Insured, 5.00%, 6/15/19 | | | 5,000,000 | | | | | | | | 5,218,050 | |
Refunding, Series B, 5.00%, 11/01/31 | | | 5,750,000 | | | | | | | | 6,661,260 | |
Series A, Pre-Refunded, 5.00%, 1/01/20 | | | 1,210,000 | | | | | | | | 1,245,925 | |
Series A, Pre-Refunded, 5.25%, 1/01/21 | | | 3,655,000 | | | | | | | | 3,771,046 | |
Series A, Pre-Refunded, 5.25%, 1/01/22 | | | 2,330,000 | | | | | | | | 2,403,978 | |
| | | | | | | | | | | | |
| | | |
| | | | | | | | | | | 200,871,970 | |
| | | | | | | | | | | | |
South Carolina 1.3% | | | | | | | | | | | | |
Anderson Water and Sewer System Revenue, | | | | | | | | | | | | |
Refunding, AGMC Insured, 5.00%, 7/01/22 | | | 2,555,000 | | | | | | | | 2,864,615 | |
Refunding, AGMC Insured, 5.00%, 7/01/23 | | | 2,695,000 | | | | | | | | 3,008,536 | |
Refunding, AGMC Insured, 5.00%, 7/01/24 | | | 2,825,000 | | | | | | | | 3,140,072 | |
Refunding, AGMC Insured, 5.00%, 7/01/25 | | | 2,965,000 | | | | | | | | 3,280,180 | |
Berkeley County Utility Revenue, | | | | | | | | | | | | |
Combined Utility System, Refunding, 5.00%, 6/01/25 | | | 3,665,000 | | | | | | | | 4,178,613 | |
Combined Utility System, Refunding, 5.00%, 6/01/26 | | | 1,700,000 | | | | | | | | 1,930,095 | |
South Carolina Jobs EDA Hospital Revenue, Palmetto Health, Refunding and Improvement, 5.375%, 8/01/22 | | | 6,000,000 | | | | | | | | 6,253,380 | |
South Carolina State Transportation Infrastructure Bank Revenue, | | | | | | | | | | | | |
Refunding, Series B, AGMC Insured, 5.00%, 10/01/25 | | | 12,935,000 | | | | | | | | 14,468,833 | |
Refunding, Series B, AGMC Insured, 5.00%, 10/01/26 | | | 13,440,000 | | | | | | | | 14,983,987 | |
| | | | | | | | | | | | |
| | | |
| | | | | | | | | | | 54,108,311 | |
| | | | | | | | | | | | |
Tennessee 1.4% | | | | | | | | | | | | |
Memphis GO, General Improvement, Refunding, Series A, 5.00%, 4/01/22 | | | 15,805,000 | | | | | | | | 17,719,776 | |
Metropolitan Government of Nashville and Davidson County GO, Improvement, Series A, Pre-Refunded, 5.00%, 1/01/26 | | | 5,000,000 | | | | | | | | 5,682,350 | |
Metropolitan Government of Nashville and Davidson County Water and Sewer Revenue, | | | | | | | | | | | | |
Refunding, 5.00%, 7/01/26 | | | 1,675,000 | | | | | | | | 1,900,606 | |
Refunding, 5.00%, 7/01/27 | | | 1,800,000 | | | | | | | | 2,042,442 | |
Tennessee State School Bond Authority Revenue, | | | | | | | | | | | | |
Higher Educational Facilities Second Program, Refunding, Series B, 5.00%, 11/01/28 | | | 8,180,000 | | | | | | | | 9,566,919 | |
Higher Educational Facilities Second Program, Refunding, Series B, 5.00%, 11/01/30 | | | 4,355,000 | | | | | | | | 5,197,779 | |
Higher Educational Facilities Second Program, Refunding, Series B, 5.00%, 11/01/31 | | | 3,710,000 | | | | | | | | 4,414,047 | |
Higher Educational Facilities Second Program, Series A, 5.00%, 11/01/30 | | | 5,245,000 | | | | | | | | 6,260,012 | |
Higher Educational Facilities Second Program, Series A, 5.00%, 11/01/31 | | | 2,000,000 | | | | | | | | 2,379,540 | |
Higher Educational Facilities Second Program, Series A, 5.00%, 11/01/32 | | | 1,500,000 | | | | | | | | 1,780,455 | |
| | | | | | | | | | | | |
| | | |
| | | | | | | | | | | 56,943,926 | |
| | | | | | | | | | | | |
| | | | | | |
franklintempleton.com | | | | Annual Report | | 57 |
FRANKLIN TAX-FREE TRUST
STATEMENT OF INVESTMENTS
Franklin Federal Intermediate-Term Tax-Free Income Fund (continued)
| | | | | | | | |
| | | Principal
Amount | | | Value | |
| |
Municipal Bonds (continued) | | | | | | | | |
Texas 10.3% | | | | | | | | |
Austin Water and Wastewater System Revenue, | | | | | | | | |
Travis Williamson and Hays Counties, Refunding, 5.00%, 11/15/26 | | $ | 4,835,000 | | | $ | 5,454,992 | |
Travis Williamson and Hays Counties, Refunding, 5.00%, 11/15/27 | | | 4,000,000 | | | | 4,512,920 | |
Travis Williamson and Hays Counties, Refunding, 5.00%, 11/15/29 | | | 3,700,000 | | | | 4,397,672 | |
Travis Williamson and Hays Counties, Refunding, Series A, 5.00%, 11/15/28 | | | 5,000,000 | | | | 5,658,250 | |
Clear Creek ISD, | | | | | | | | |
GO, Refunding, Series A, 5.00%, 2/15/25 | | | 11,370,000 | | | | 12,600,689 | |
GO, Refunding, Series A, 5.00%, 2/15/26 | | | 12,060,000 | | | | 13,336,430 | |
Dallas Waterworks and Sewer System Revenue, | | | | | | | | |
Denton Collin Kaufman and Rockwall Counties, Refunding, 5.00%, 10/01/30 | | | 1,500,000 | | | | 1,772,820 | |
Denton Collin Kaufman and Rockwall Counties, Refunding, 5.00%, 10/01/31 | | | 2,500,000 | | | | 2,943,225 | |
Denton Collin Kaufman and Rockwall Counties, Refunding, 5.00%, 10/01/32 | | | 1,000,000 | | | | 1,174,540 | |
Dallas/Fort Worth International Airport Revenue, | | | | | | | | |
Joint Refunding, Series D, 5.25%, 11/01/27 | | | 5,000,000 | | | | 5,750,300 | |
Joint Refunding, Series D, 5.25%, 11/01/28 | | | 2,100,000 | | | | 2,407,923 | |
El Paso ISD, | | | | | | | | |
GO, Refunding, PSF Guarantee, 5.00%, 8/15/27 | | | 5,460,000 | | | | 6,357,078 | |
GO, Refunding, PSF Guarantee, 5.00%, 8/15/28 | | | 2,500,000 | | | | 2,896,100 | |
Fort Worth GO, | | | | | | | | |
Tarrant Denton Parker and Wise Counties, General Purpose, Refunding and Improvement, 5.00%, 3/01/25 | | | 6,000,000 | | | | 6,673,560 | |
Tarrant Denton Parker and Wise Counties, General Purpose, Refunding and Improvement, 5.00%, 3/01/26 | | | 6,790,000 | | | | 7,541,178 | |
Harris County MTA Revenue, | | | | | | | | |
Sales and Use Tax, Contractual Obligations, 5.00%, 11/01/28 | | | 2,000,000 | | | | 2,314,400 | |
Sales and Use Tax, Contractual Obligations, Pre-Refunded, 5.00%, 11/01/26 | | | 2,000,000 | | | | 2,345,300 | |
Sales and Use Tax, Contractual Obligations, Pre-Refunded, 5.00%, 11/01/27 | | | 2,000,000 | | | | 2,345,300 | |
Harris County Toll Road Revenue, | | | | | | | | |
senior lien, Refunding, Series A, 5.00%, 8/15/32 | | | 2,500,000 | | | | 2,939,200 | |
senior lien, Refunding, Series A, 5.00%, 8/15/33 | | | 2,500,000 | | | | 2,927,425 | |
Houston GO, | | | | | | | | |
Public Improvement, Refunding, Series A, 5.00%, 3/01/22 | | | 3,855,000 | | | | 4,106,924 | |
Public Improvement, Series A, Pre-Refunded, 5.00%, 3/01/22 | | | 6,145,000 | | | | 6,549,034 | |
Houston ISD, GO, Harris County, Limited Tax Schoolhouse, Refunding, Series A, PSF Guarantee, 5.00%, 2/15/29 | | | 10,000,000 | | | | 11,706,300 | |
Houston Utility System Revenue, | | | | | | | | |
Combined, first lien, Refunding, Series B, 5.00%, 11/15/29 | | | 10,000,000 | | | | 11,696,800 | |
Combined, first lien, Refunding, Series B, 5.00%, 11/15/34 | | | 3,250,000 | | | | 3,772,730 | |
Combined, first lien, Refunding, Series B, 5.00%, 11/15/35 | | | 4,500,000 | | | | 5,207,445 | |
Combined, first lien, Refunding, Series C, 5.00%, 5/15/24 | | | 5,000,000 | | | | 5,791,750 | |
Combined, first lien, Refunding, Series C, 5.00%, 5/15/26 | | | 19,690,000 | | | | 22,672,444 | |
Lower Colorado River Authority Transmission Contract Revenue, | | | | | | | | |
LCRA Transmission Services Corp. Project, Refunding, Series A, 5.00%, 5/15/24 | | | 6,000,000 | | | | 6,549,720 | |
LCRA Transmission Services Corp. Project, Refunding, Series B, 5.00%, 5/15/24 | | | 10,620,000 | | | | 11,593,004 | |
North Texas Tollway Authority Revenue, | | | | | | | | |
Special Projects System, Series D, Pre-Refunded, 5.00%, 9/01/24 | | | 12,000,000 | | | | 13,287,240 | |
System, first tier, Refunding, Series A, 5.00%, 1/01/28 | | | 6,500,000 | | | | 7,503,990 | |
System, first tier, Refunding, Series A, 4.00%, 1/01/33 | | | 5,000,000 | | | | 5,262,100 | |
Northwest ISD, | | | | | | | | |
GO, Refunding, Series A, PSF Guarantee, 5.00%, 2/15/28 | | | 4,815,000 | | | | 5,568,836 | |
GO, Refunding, Series A, PSF Guarantee, 5.00%, 2/15/29 | | | 7,015,000 | | | | 8,089,137 | |
| | | | | | |
58 | | Annual Report | | | | franklintempleton.com |
FRANKLIN TAX-FREE TRUST
STATEMENT OF INVESTMENTS
Franklin Federal Intermediate-Term Tax-Free Income Fund (continued)
| | | | | | | | |
| | | Principal
Amount | | | Value | |
Municipal Bonds (continued) | | | | | | | | |
Texas (continued) | | | | | | | | |
Sabine River Authority PCR, Southwestern Electric Power Co. Project, Refunding, NATL Insured, 4.95%, 3/01/18 | | $ | 15,000,000 | | | $ | 15,000,000 | |
San Angelo ISD, GO, Refunding, Series A, PSF Guarantee, 5.00%, 2/15/28 | | | 5,220,000 | | | | 5,968,600 | |
San Antonio Electric and Gas Systems Revenue, | | | | | | | | |
Refunding, 5.25%, 2/01/25 | | | 27,000,000 | | | | 32,101,920 | |
Refunding, 5.00%, 2/01/27 | | | 10,415,000 | | | | 12,241,166 | |
San Antonio Water System Revenue, | | | | | | | | |
junior lien, Refunding, Series A, 5.00%, 5/15/24 | | | 1,500,000 | | | | 1,727,370 | |
junior lien, Refunding, Series A, 5.00%, 5/15/26 | | | 2,200,000 | | | | 2,520,760 | |
junior lien, Refunding, Series A, 5.00%, 5/15/28 | | | 2,000,000 | | | | 2,280,120 | |
junior lien, Refunding, Series A, 5.00%, 5/15/29 | | | 1,000,000 | | | | 1,137,770 | |
junior lien, Refunding, Series C, 5.00%, 5/15/31 | | | 8,855,000 | | | | 10,290,661 | |
Texas Transportation Commission State Highway Fund Revenue, | | | | | | | | |
first tier, Refunding, Series A, 5.00%, 4/01/23 | | | 20,000,000 | | | | 22,811,800 | |
first tier, Refunding, Series A, 5.00%, 4/01/24 | | | 20,000,000 | | | | 23,195,200 | |
first tier, Refunding, Series A, 5.00%, 4/01/25 | | | 20,000,000 | | | | 23,220,000 | |
Trinity River Authority Revenue, Refunding, 5.00%, 2/01/28 | | | 3,000,000 | | | | 3,493,290 | |
University of Houston Revenue, | | | | | | | | |
Consolidated, Series A, Pre-Refunded, 5.00%, 2/15/27 | | | 4,745,000 | | | | 5,188,278 | |
Consolidated, Series A, Pre-Refunded, 5.00%, 2/15/27 | | | 255,000 | | | | 277,670 | |
University of Texas System Revenue, Board of Regents, Permanent University Fund, Series B, 5.00%, 7/01/27 | | | 10,000,000 | | | | 11,626,700 | |
Williamson County GO, | | | | | | | | |
Refunding, 5.00%, 2/15/23 | | | 6,235,000 | | | | 6,967,613 | |
Refunding, 5.00%, 2/15/25 | | | 13,780,000 | | | | 15,376,827 | |
| | | | | | | | |
| | | | | | | 421,132,501 | |
| | | | | | | | |
Utah 0.7% | | | | | | | | |
State Board of Regents University of Utah Revenue, Refunding, Series A, 5.00%, 8/01/30 | | | 4,400,000 | | | | 5,212,108 | |
Utah State Board of Regents Student Loan Revenue, | | | | | | | | |
Refunding, Series EE-2, 5.00%, 11/01/20 | | | 9,000,000 | | | | 9,777,510 | |
Refunding, Series EE-2, 5.00%, 11/01/21 | | | 9,000,000 | | | | 9,789,750 | |
Utah State Transit Authority Sales Tax Revenue, sub. bond, Refunding, 4.00%, 12/15/31 | | | 4,000,000 | | | | 4,237,120 | |
| | | | | | | | |
| | | | | | | 29,016,488 | |
| | | | | | | | |
Virginia 4.2% | | | | | | | | |
Norfolk Water Revenue, | | | | | | | | |
Pre-Refunded, 5.00%, 11/01/24 | | | 6,050,000 | | | | 6,781,808 | |
Pre-Refunded, 5.00%, 11/01/25 | | | 5,910,000 | | | | 6,624,874 | |
Refunding, 5.00%, 11/01/24 | | | 95,000 | | | | 106,128 | |
Refunding, 5.00%, 11/01/25 | | | 90,000 | | | | 100,390 | |
Richmond Public Utility Revenue, Refunding, Series A, 5.00%, 1/15/32 | | | 10,000,000 | | | | 11,597,400 | |
Upper Occoquan Sewage Authority Regional Sewerage System Revenue, Refunding, Series B, 4.00%, 7/01/35 | | | 9,665,000 | | | | 10,226,150 | |
Virginia Beach Development Authority Public Facility Revenue, | | | | | | | | |
Refunding, Series B, 5.00%, 8/01/19 | | | 12,635,000 | | | | 13,254,873 | |
Refunding, Series B, 5.00%, 8/01/20 | | | 13,450,000 | | | | 14,475,293 | |
Virginia College Building Authority Educational Facilities Revenue, | | | | | | | | |
21st Century College and Equipment Programs, Series A, Pre-Refunded, 5.00%, 2/01/25 | | | 13,080,000 | | | | 15,178,947 | |
21st Century College and Equipment Programs, Series D, 5.00%, 2/01/25 | | | 7,405,000 | | | | 8,660,666 | |
| | | | | | |
franklintempleton.com | | | | Annual Report | | 59 |
FRANKLIN TAX-FREE TRUST
STATEMENT OF INVESTMENTS
Franklin Federal Intermediate-Term Tax-Free Income Fund (continued)
| | | | | | | | |
| | | Principal
Amount | | | Value | |
| |
Municipal Bonds (continued) | | | | | | | | |
Virginia (continued) | | | | | | | | |
Virginia State PBA Public Facilities Revenue, | | | | | | | | |
Refunding, Series B, 4.00%, 8/01/29 | | $ | 12,060,000 | | | $ | 13,034,569 | |
Series B, Pre-Refunded, 4.00%, 8/01/29 | | | 1,075,000 | | | | 1,200,979 | |
Virginia State Public School Authority Revenue, | | | | | | | | |
School Financing, 1997 Resolution, Refunding, Series B, 5.00%, 8/01/23 | | | 8,535,000 | | | | 9,776,416 | |
School Financing, 1997 Resolution, Series C, 5.00%, 8/01/26 | | | 4,335,000 | | | | 5,043,209 | |
School Financing, 1997 Resolution, Series C, 5.00%, 8/01/27 | | | 4,460,000 | | | | 5,148,312 | |
Virginia State Resources Authority Clean Water Revenue, | | | | | | | | |
Revolving Fund, Refunding, 5.00%, 10/01/27 | | | 5,825,000 | | | | 6,877,752 | |
Revolving Fund, Refunding, 5.00%, 10/01/28 | | | 11,950,000 | | | | 14,073,395 | |
Revolving Fund, Refunding, Series B, 5.00%, 10/01/26 | | | 26,155,000 | | | | 30,548,517 | |
| | | | | | | | |
| | |
| | | | | | | 172,709,678 | |
| | | | | | | | |
Washington 3.7% | | | | | | | | |
Energy Northwest Electric Revenue, | | | | | | | | |
Columbia Generating Station, Refunding, Series A, 5.00%, 7/01/22 | | | 3,250,000 | | | | 3,658,200 | |
Columbia Generating Station, Refunding, Series A, 5.00%, 7/01/23 | | | 3,500,000 | | | | 4,007,325 | |
Columbia Generating Station, Refunding, Series A, 5.00%, 7/01/24 | | | 1,250,000 | | | | 1,452,538 | |
King County School District No. 403 Renton GO, | | | | | | | | |
Refunding, 5.00%, 12/01/27 | | | 3,500,000 | | | | 4,107,285 | |
Refunding, 5.00%, 12/01/28 | | | 4,000,000 | | | | 4,675,640 | |
King County Sewer Revenue, | | | | | | | | |
Refunding, Series B, 5.00%, 7/01/25 | | | 1,200,000 | | | | 1,397,508 | |
Refunding, Series B, 5.00%, 7/01/26 | | | 1,200,000 | | | | 1,392,900 | |
Refunding, Series B, 5.00%, 7/01/27 | | | 1,900,000 | | | | 2,199,345 | |
Refunding, Series B, 5.00%, 7/01/28 | | | 3,050,000 | | | | 3,526,654 | |
Refunding, Series B, 5.00%, 7/01/29 | | | 2,600,000 | | | | 2,984,878 | |
Seattle Drain and Wastewater Revenue, | | | | | | | | |
Refunding, 5.00%, 5/01/24 | | | 5,230,000 | | | | 6,069,676 | |
Refunding, 5.00%, 5/01/25 | | | 5,500,000 | | | | 6,352,115 | |
Refunding, 5.00%, 5/01/26 | | | 2,995,000 | | | | 3,462,759 | |
Refunding, 5.00%, 5/01/27 | | | 3,150,000 | | | | 3,624,358 | |
Seattle Municipal Light and Power Revenue, | | | | | | | | |
Improvement and Refunding, Series B, 5.00%, 2/01/19 | | | 6,805,000 | | | | 7,027,864 | |
Improvement and Refunding, Series B, 5.00%, 2/01/20 | | | 7,000,000 | | | | 7,457,730 | |
Improvement and Refunding, Series C, 4.00%, 9/01/34 | | | 10,300,000 | | | | 10,918,206 | |
Washington Health Care Facilities Authority Revenue, | | | | | | | | |
Overlake Hospital Medical Center, Refunding, Series B, 5.00%, 7/01/30 | | | 1,000,000 | | | | 1,145,300 | |
Overlake Hospital Medical Center, Refunding, Series B, 5.00%, 7/01/31 | | | 1,925,000 | | | | 2,192,537 | |
Virginia Mason Medical Center, Refunding, 5.00%, 8/15/31 | | | 2,250,000 | | | | 2,531,137 | |
Virginia Mason Medical Center, Refunding, 5.00%, 8/15/32 | | | 4,005,000 | | | | 4,491,728 | |
Washington State GO, | | | | | | | | |
Motor Vehicle Fuel Tax, Refunding, Series B, 5.00%, 7/01/25 | | | 29,370,000 | | | | 34,147,618 | |
Various Purpose, Series D, 5.00%, 2/01/31 | | | 5,480,000 | | | | 6,401,572 | |
Various Purpose, Series D, 5.00%, 2/01/32 | | | 10,000,000 | | | | 11,630,400 | |
Various Purpose, Series D, Pre-Refunded, 5.00%, 2/01/25 | | | 13,955,000 | | | | 15,612,714 | |
| | | | | | | | |
| | |
| | | | | | | 152,467,987 | |
| | | | | | | | |
| | | | | | |
60 | | Annual Report | | | | franklintempleton.com |
FRANKLIN TAX-FREE TRUST
STATEMENT OF INVESTMENTS
Franklin Federal Intermediate-Term Tax-Free Income Fund (continued)
| | | | | | | | |
| | | Principal
Amount | | | Value | |
| |
Municipal Bonds (continued) | | | | | | | | |
Wisconsin 0.4% | | | | | | | | |
Wisconsin State Transportation Revenue, | | | | | | | | |
Refunding, Series 1, 5.00%, 7/01/24 | | $ | 6,560,000 | | | $ | 7,331,850 | |
Refunding, Series 2, 5.00%, 7/01/31 | | | 5,000,000 | | | | 5,893,050 | |
Series 1, Pre-Refunded, 5.00%, 7/01/24 | | | 3,440,000 | | | | 3,872,064 | |
| | | | | | | | |
| | |
| | | | | | | 17,096,964 | |
| | | | | | | | |
U.S. Territories 0.1% | | | | | | | | |
Guam 0.1% | | | | | | | | |
Guam Government Limited Obligation Revenue, | | | | | | | | |
Section 30, Series A, ETM, 5.50%, 12/01/18 | | | 1,540,000 | | | | 1,588,371 | |
Section 30, Series A, ETM, 5.50%, 12/01/19 | | | 1,025,000 | | | | 1,095,602 | |
| | | | | | | | |
| | |
| | | | | | | 2,683,973 | |
| | | | | | | | |
| | |
Total Municipal Bonds before Short Term Investments (Cost $3,825,636,858) | | | | | | | 3,933,145,450 | |
| | | | | | | | |
Short Term Investments 2.8% | | | | | | | | |
Municipal Bonds 2.8% | | | | | | | | |
Arizona 0.7% | | | | | | | | |
c Arizona Health Facilities Authority Revenue, Banner Health, Series C, LOC Bank of America, Daily VRDN and Put, 1.09%, 1/01/46 | | | 5,900,000 | | | | 5,900,000 | |
c Phoenix IDA Health Care Facilities Revenue, Mayo Clinic, Series B, SPA Wells Fargo Bank, Daily VRDN and Put, 1.06%, 11/15/52 | | | 21,500,000 | | | | 21,500,000 | |
| | | | | | | | |
| | |
| | | | | | | 27,400,000 | |
| | | | | | | | |
Colorado 0.0%† | | | | | | | | |
c Denver City and County COP, Wellington E. Webb Municipal Office Building, Refunding, Series A2, SPA JPMorgan Chase Bank, Daily VRDN and Put, 1.09%, 12/01/29 | | | 1,600,000 | | | | 1,600,000 | |
| | | | | | | | |
Florida 0.5% | | | | | | | | |
c St. Lucie County PCR, Florida Power and Light Co. Project, Refunding, Daily VRDN and Put, 1.17%, 9/01/28 | | | 21,600,000 | | | | 21,600,000 | |
| | | | | | | | |
Michigan 0.1% | | | | | | | | |
c Green Lake Township EDC Revenue, Interlochen Center for the Arts Project, Refunding, LOC Harris Trust & Savings Bank, Daily VRDN and Put, 1.09%, 6/01/34 | | | 5,600,000 | | | | 5,600,000 | |
| | | | | | | | |
New York 1.5% | | | | | | | | |
c New York City GO, Fiscal 2015, Series F, Subseries F-6, SPA JPMorgan Chase Bank, Daily VRDN and Put, 1.10%, 6/01/44 | | | 39,800,000 | | | | 39,800,000 | |
c New York City Municipal Water Finance Authority Water and Sewer System Revenue, | | | | | | | | |
Second General Resolution, Fiscal 2014, Refunding, Series AA, Subseries AA-1, SPA JPMorgan Chase Bank, Daily VRDN and Put, 1.10%, 6/15/50 | | | 13,000,000 | | | | 13,000,000 | |
Second General Resolution, Fiscal 2014, Refunding, Series AA, Subseries AA-4, SPA Bank of Montreal, Daily VRDN and Put, 1.11%, 6/15/49 | | | 6,600,000 | | | | 6,600,000 | |
| | | | | | | | |
| | |
| | | | | | | 59,400,000 | |
| | | | | | | | |
North Carolina 0.0%† | | | | | | | | |
c The Charlotte-Mecklenburg Hospital Authority Health Care Revenue, Carolinas HealthCare System, Refunding, Series C, SPA JPMorgan Chase Bank, Daily VRDN and Put, 1.12%, 1/15/37 | | | 700,000 | | | | 700,000 | |
| | | | | | | | |
Total Short Term Investments (Cost $116,300,000) | | | | | | | 116,300,000 | |
| | | | | | | | |
Total Investments (Cost $3,941,936,858) 99.3% | | | | | | | 4,049,445,450 | |
Other Assets, less Liabilities 0.7%. | | | | | | | 27,683,567 | |
| | | | | | | | |
Net Assets 100.0% | | | | | | $ | 4,077,129,017 | |
| | | | | | | | |
| | | | | | |
franklintempleton.com | | | | Annual Report | | 61 |
FRANKLIN TAX-FREE TRUST
STATEMENT OF INVESTMENTS
Franklin Federal Intermediate-Term Tax-Free Income Fund (continued)
See Abbreviations on page 140.
†Rounds to less than 0.1% of net assets.
aThe maturity date shown represents the mandatory put date.
bSecurity purchased on a when-issued basis. See Note 1(b).
cVariable rate demand notes (VRDNs) are obligations which contain a floating or variable interest rate adjustment formula and an unconditional right of demand to receive payment of the principal balance plus accrued interest at specified dates. Unless otherwise noted, the coupon rate is determined based on factors including supply and demand, underlying credit, tax treatment, and current short term rates. The coupon rate shown represents the rate at period end.
| | | | | | |
62 | | Annual Report | | | The accompanying notes are an integral part of these financial statements. | | franklintempleton.com |
FRANKLIN TAX-FREE TRUST
Financial Highlights
Franklin Federal Limited-Term Tax-Free Income Fund
| | | | | | | | | | | | | | | | | | |
| | | Year Ended February 28, |
| | | |
| | | 2018 | | | 2017 | | | 2016a | | | 2015 | | | 2014 |
|
| | | | | |
Class A | | | | | | | | | | | | | | | | | | |
| | | | | |
Per share operating performance | | | | | | | | | | | | | | | | | | |
(for a share outstanding throughout the year) | | | | | | | | | | | | | | | | | | |
| | | | | |
Net asset value, beginning of year | | | $10.37 | | | | $10.45 | | | | $10.47 | | | | $10.51 | | | $10.56 |
| | | |
| | | | | |
Income from investment operationsb: | | | | | | | | | | | | | | | | | | |
| | | | | |
Net investment incomec | | | 0.09 | | | | 0.09 | | | | 0.10 | | | | 0.11 | | | 0.13 |
| | | | | |
Net realized and unrealized gains (losses) | | | (0.09 | ) | | | (0.09 | ) | | | (0.03 | ) | | | (0.05 | ) | | (0.05) |
| | | |
| | | | | |
Total from investment operations | | | — | | | | — | | | | 0.07 | | | | 0.06 | | | 0.08 |
| | | |
| | | | | |
Less distributions from net investment income | | | (0.08 | ) | | | (0.08 | ) | | | (0.09 | ) | | | (0.10 | ) | | (0.13) |
| | | |
| | | | | |
Net asset value, end of year | | | $10.29 | | | | $10.37 | | | | $10.45 | | | | $10.47 | | | $10.51 |
| | | |
| | | | | |
Total returnd | | | 0.01% | | | | 0.04% | | | | 0.70% | | | | 0.60% | | | 0.76% |
| | | | | |
Ratios to average net assets | | | | | | | | | | | | | | | | | | |
| | | | | |
Expenses before waiver and payments by affiliates | | | 0.71% | | | | 0.70% | | | | 0.69% | | | | 0.70% | | | 0.84% |
| | | | | |
Expenses net of waiver and payments by affiliates | | | 0.63% | | | | 0.63% | | | | 0.63% | | | | 0.62% | | | 0.60% |
| | | | | |
Net investment income | | | 0.84% | | | | 0.83% | | | | 0.95% | | | | 1.05% | | | 1.25% |
| | | | | |
Supplemental data | | | | | | | | | | | | | | | | | | |
| | | | | |
Net assets, end of year (000’s) | | | $687,197 | | | | $810,811 | | | | $886,784 | | | | $890,556 | | | $977,274 |
| | | | | |
Portfolio turnover rate | | | 40.13% | | | | 18.54% | | | | 22.58% | | | | 19.64% | | | 20.20% |
aFor the year ended February 29.
bThe amount shown for a share outstanding throughout the period may not correlate with the Statement of Operations for the period due to the timing of sales and repurchases of the Fund’s shares in relation to income earned and/or fluctuating fair value of the investments of the Fund.
cBased on average daily shares outstanding.
dTotal return does not reflect sales commissions or contingent deferred sales charges, if applicable.
| | | | | | |
franklintempleton.com | | | | The accompanying notes are an integral part of these financial statements. | Annual Report | | 63 |
FRANKLIN TAX-FREE TRUST
FINANCIAL HIGHLIGHTS
Franklin Federal Limited-Term Tax-Free Income Fund (continued)
| | | | |
| | | Year Ended
February 28,
2018a | |
| |
| |
Class R6 | | | | |
| |
Per share operating performance | | | | |
(for a share outstanding throughout the year) | | | | |
| |
Net asset value, beginning of year | | | $10.37 | |
| | | | |
| |
Income from investment operationsb: | | | | |
| |
Net investment incomec | | | 0.07 | |
| |
Net realized and unrealized gains (losses) | | | (0.10) | |
| | | | |
| |
Total from investment operations | | | (0.03) | |
| | | | |
| |
Less distributions from net investment income | | | (0.06) | |
| | | | |
| |
Net asset value, end of year | | | $10.28 | |
| | | | |
| |
Total returnd | | | (0.32)% | |
| |
Ratios to average net assetse | | | | |
| |
Expenses before waiver and payments by affiliates | | | 0.54% | |
| |
Expenses net of waiver and payments by affiliates | | | 0.44% | |
| |
Net investment income | | | 1.03% | |
| |
Supplemental data | | | | |
| |
Net assets, end of year (000’s) | | | $51,656 | |
| |
Portfolio turnover rate | | | 40.13% | |
aFor the period August 1, 2017 (effective date) to February 28, 2018.
bThe amount shown for a share outstanding throughout the period may not correlate with the Statement of Operations for the period due to the timing of sales and repurchases of the Fund’s shares in relation to income earned and/or fluctuating fair value of the investments of the Fund.
cBased on average daily shares outstanding.
dTotal return is not annualized for periods less than one year.
eRatios are annualized for periods less than one year.
| | | | | | |
64 | | Annual Report | | | The accompanying notes are an integral part of these financial statements. | | franklintempleton.com |
FRANKLIN TAX-FREE TRUST
FINANCIAL HIGHLIGHTS
Franklin Federal Limited-Term Tax-Free Income Fund (continued)
| | | | | | | | | | | | | | | | | | |
| | | Year Ended February 28, |
| | | |
| | | 2018 | | | 2017 | | | 2016a | | | 2015 | | | 2014 |
|
| | | | | |
Advisor Class | | | | | | | | | | | | | | | | | | |
| | | | | |
Per share operating performance | | | | | | | | | | | | | | | | | | |
(for a share outstanding throughout the year) | | | | | | | | | | | | | | | | | | |
| | | | | |
Net asset value, beginning of year | | | $10.37 | | | | $10.44 | | | | $10.46 | | | | $10.50 | | | $10.55 |
| | | |
| | | | | |
Income from investment operationsb: | | | | | | | | | | | | | | | | | | |
| | | | | |
Net investment incomec | | | 0.10 | | | | 0.10 | | | | 0.11 | | | | 0.12 | | | 0.15 |
| | | | | |
Net realized and unrealized gains (losses) | | | (0.08) | | | | (0.07) | | | | (0.02) | | | | (0.04) | | | (0.06) |
| | | |
| | | | | |
Total from investment operations | | | 0.02 | | | | 0.03 | | | | 0.09 | | | | 0.08 | | | 0.09 |
| | | |
| | | | | |
Less distributions from net investment income | | | (0.10) | | | | (0.10) | | | | (0.11) | | | | (0.12) | | | (0.14) |
| | | |
| | | | | |
Net asset value, end of year | | | $10.29 | | | | $10.37 | | | | $10.44 | | | | $10.46 | | | $10.50 |
| | | |
| | | | | |
Total return | | | 0.16% | | | | 0.28% | | | | 0.86% | | | | 0.75% | | | 0.91% |
| | | | | |
Ratios to average net assets | | | | | | | | | | | | | | | | | | |
| | | | | |
Expenses before waiver and payments by affiliates | | | 0.56% | | | | 0.55% | | | | 0.54% | | | | 0.55% | | | 0.69% |
| | | | | |
Expenses net of waiver and payments by affiliates | | | 0.48% | | | | 0.48% | | | | 0.48% | | | | 0.47% | | | 0.45% |
| | | | | |
Net investment income | | | 0.99% | | | | 0.98% | | | | 1.10% | | | | 1.20% | | | 1.40% |
| | | | | |
Supplemental data | | | | | | | | | | | | | | | | | | |
| | | | | |
Net assets, end of year (000’s) | | | $247,708 | | | | $296,298 | | | | $239,537 | | | | $231,428 | | | $183,518 |
| | | | | |
Portfolio turnover rate | | | 40.13% | | | | 18.54% | | | | 22.58% | | | | 19.64% | | | 20.20% |
aFor the year ended February 29.
bThe amount shown for a share outstanding throughout the period may not correlate with the Statement of Operations for the period due to the timing of sales and repurchases of the Fund’s shares in relation to income earned and/or fluctuating fair value of the investments of the Fund.
cBased on average daily shares outstanding.
| | | | | | |
franklintempleton.com | | | | The accompanying notes are an integral part of these financial statements. | Annual Report | | 65 |
FRANKLIN TAX-FREE TRUST
Statement of Investments, February 28, 2018
Franklin Federal Limited-Term Tax-Free Income Fund
| | | | | | | | |
| | | Principal
Amount | | | Value | |
| |
Municipal Bonds 89.2% | | | | | | | | |
Alabama 0.6% | | | | | | | | |
a East Alabama Health Care Authority Health Care Facilities Revenue, Mandatory Put, Series A, Pre-Refunded, 5.25%, 9/01/18 | | $ | 1,000,000 | | | $ | 1,019,510 | |
a Mobile IDBR, | | | | | | | | |
PCR, Alabama Power Co. Barry Plant Project, Mandatory Put, 1.625%, 10/02/18 | | | 2,500,000 | | | | 2,495,300 | |
PCR, Alabama Power Co. Barry Plant Project, Mandatory Put, Series A, 1.85%, 3/24/20 | | | 2,250,000 | | | | 2,242,755 | |
| | | | | | | | |
| | |
| | | | | | | 5,757,565 | |
| | | | | | | | |
Arizona 1.8% | | | | | | | | |
Pinal County Revenue, Pledged Obligations, Refunding, 5.00%, 8/01/18 | | | 1,160,000 | | | | 1,177,447 | |
Salt River Project Agricultural Improvement and Power District Electric System Revenue, Salt River Project, Refunding, Series A, 5.00%, 1/01/21 | | | 14,045,000 | | | | 15,324,359 | |
Tucson COP, Refunding, AGMC Insured, 3.00%, 7/01/18 | | | 1,195,000 | | | | 1,201,178 | |
| | | | | | | | |
| | |
| | | | | | | 17,702,984 | |
| | | | | | | | |
Arkansas 0.5% | | | | | | | | |
Little Rock School District GO, Pulaski County, Construction, 3.00%, 2/01/20 | | | 4,930,000 | | | | 5,037,967 | |
| | | | | | | | |
California 8.1% | | | | | | | | |
a California Health Facilities Financing Authority Revenue, | | | | | | | | |
St. Joseph Health System, Mandatory Put, Refunding, Series D, 5.00%, 10/15/20 | | | 5,000,000 | | | | 5,412,650 | |
St. Joseph Health System, Mandatory Put, Series C, 5.00%, 10/15/19 | | | 3,250,000 | | | | 3,422,672 | |
a California Statewide CDA, PCR, Southern California Edison Co., Mandatory Put, Refunding, Series D, 2.625%, 12/01/23 | | | 3,000,000 | | | | 3,027,930 | |
Coachella Valley USD, | | | | | | | | |
GO, Riverside and Imperial Counties, Refunding, BAM Insured, 4.00%, 8/01/18 | | | 1,265,000 | | | | 1,279,092 | |
GO, Riverside and Imperial Counties, Refunding, BAM Insured, 4.00%, 8/01/19 | | | 1,330,000 | | | | 1,377,468 | |
Fremont UHSD Santa Clara County GO, | | | | | | | | |
Capital Appreciation, Election of 2008, Series B, Pre-Refunded, zero cpn., 8/01/31 | | | 3,235,000 | | | | 1,549,177 | |
Capital Appreciation, Election of 2008, Series B, Pre-Refunded, zero cpn., 8/01/32 | | | 3,930,000 | | | | 1,740,440 | |
Capital Appreciation, Election of 2008, Series B, Pre-Refunded, zero cpn., 8/01/33 | | | 1,020,000 | | | | 417,914 | |
Capital Appreciation, Election of 2008, Series B, Pre-Refunded, zero cpn., 8/01/34 | | | 1,520,000 | | | | 574,560 | |
Capital Appreciation, Election of 2008, Series B, Pre-Refunded, zero cpn., 8/01/35 | | | 3,245,000 | | | | 1,132,765 | |
Capital Appreciation, Election of 2008, Series B, Pre-Refunded, zero cpn., 8/01/36 | | | 4,705,000 | | | | 1,519,056 | |
Capital Appreciation, Election of 2008, Series B, Pre-Refunded, zero cpn., 8/01/37 | | | 11,005,000 | | | | 3,288,184 | |
Capital Appreciation, Election of 2008, Series B, Pre-Refunded, zero cpn., 8/01/38 | | | 11,665,000 | | | | 3,217,674 | |
Capital Appreciation, Election of 2008, Series B, Pre-Refunded, zero cpn., 8/01/39 | | | 12,290,000 | | | | 3,126,822 | |
Hacienda La Puente USD, | | | | | | | | |
GO, Los Angeles County, Election of 2016, Series A, 2.00%, 8/01/18 | | | 3,720,000 | | | | 3,732,685 | |
GO, Los Angeles County, Election of 2016, Series A, 3.00%, 8/01/19 | | | 3,210,000 | | | | 3,282,546 | |
Los Angeles Department of Water and Power Revenue, Power System, Refunding, Series B, 5.00%, 12/01/18 | | | 20,000,000 | | | | 20,495,400 | |
Montebello USD, GO, Election of 2016, Series A, 3.00%, 8/01/18 | | | 2,000,000 | | | | 2,012,300 | |
Mount San Antonio Community College District GO, BAN, zero cpn., 4/01/22 | | | 10,000,000 | | | | 9,175,500 | |
Riverside County Transportation Commission Sales Tax Revenue, Refunding, Series A, 5.00%, 6/01/18 | | | 1,000,000 | | | | 1,009,150 | |
Salinas UHSD, GO, Monterey County, BAN, Capital Appreciation, zero cpn., 8/01/20 | | | 5,000,000 | | | | 4,776,700 | |
Tustin USD School Facilities ID No. 2002-1 GO, Capital Appreciation, Election of 2002, Series C, AGMC Insured, zero cpn., 6/01/18 | | | 810,000 | | | | 807,384 | |
a Western Municipal Water District Facilities Authority Adjustable Rate Water Revenue, Mandatory Put, Refunding, Series A, 1.50%, 10/01/20 | | | 3,250,000 | | | | 3,235,277 | |
| | | | | | | | |
| | |
| | | | | | | 79,613,346 | |
| | | | | | | | |
| | | | |
66 | | Annual Report | | franklintempleton.com |
FRANKLIN TAX-FREE TRUST
STATEMENT OF INVESTMENTS
Franklin Federal Limited-Term Tax-Free Income Fund (continued)
| | | | | | | | |
| | | Principal
Amount | | | Value | |
| |
Municipal Bonds (continued) | | | | | | | | |
Colorado 3.8% | | | | | | | | |
Colorado Springs Utilities System Revenue, Refunding, Series A-3, 5.00%, 11/15/22 | | $ | 8,700,000 | | | $ | 9,874,065 | |
Colorado State HFA, MFHR, Loan Program, Pass Through, Crisman Apartments Project, Series II, FHA Insured, 0.90%, 3/01/19 | | | 2,000,000 | | | | 1,988,520 | |
Dawson Ridge Metropolitan District No. 1 GO, Series A, ETM, zero cpn., 10/01/22 | | | 23,955,000 | | | | 21,680,473 | |
Douglas County School District No. Re-1 Douglas and Elbert Counties GO, Refunding, 5.00%, 12/15/18 | | | 2,800,000 | | | | 2,881,592 | |
Garfield County School District No. 16 GO, Refunding, 3.00%, 12/01/18 | | | 1,115,000 | | | | 1,129,283 | |
| | | | | | | | |
| | |
| | | | | | | 37,553,933 | |
| | | | | | | | |
Connecticut 3.4% | | | | | | | | |
a Connecticut State Health and Educational Facilities Authority Revenue, | | | | | | | | |
Yale University Issue, Mandatory Put, Refunding, Series A, 1.375%, 7/11/18 | | | 14,500,000 | | | | 14,507,830 | |
Yale University Issue, Mandatory Put, Refunding, Series A-1, 1.00%, 7/01/19 | | | 6,000,000 | | | | 5,964,540 | |
Yale University Issue, Mandatory Put, Series A, 1.30%, 2/03/20 | | | 10,000,000 | | | | 9,934,100 | |
Yale University Issue, Mandatory Put, Series X-2, 1.80%, 2/09/21 | | | 3,000,000 | | | | 2,994,000 | |
| | | | | | | | |
| | |
| | | | | | | 33,400,470 | |
| | | | | | | | |
Florida 2.4% | | | | | | | | |
Florida State Board of Education Lottery Revenue, Series A, Pre-Refunded, 5.00%, 7/01/19 | | | 4,550,000 | | | | 4,650,555 | |
Florida State Department of General Services Division Facilities Management Revenue, Facilities Pool, Refunding, Series A, 5.00%, 9/01/21 | | | 7,710,000 | | | | 8,548,154 | |
Florida State Municipal Power Agency Revenue, All-Requirements Power Supply Project, Refunding, Series A, 5.00%, 10/01/25 | | | 1,000,000 | | | | 1,171,650 | |
Lee County Transportation Facilities Revenue, Refunding, AGMC Insured, 5.00%, 10/01/19 | | | 2,385,000 | | | | 2,511,023 | |
a Miami-Dade County IDA Solid Waste Disposal Revenue, Waste Management Inc. of Florida Project, Mandatory Put, 1.75%, 11/01/19 | | | 2,000,000 | | | | 2,001,620 | |
Orlando-Orange County Expressway Authority Revenue, Refunding, AGMC Insured, 5.00%, 7/01/24 | | | 4,000,000 | | | | 4,482,960 | |
| | | | | | | | |
| | |
| | | | | | | 23,365,962 | |
| | | | | | | | |
Georgia 2.5% | | | | | | | | |
Clarke County School District GO, | | | | | | | | |
Sales Tax, 3.00%, 9/01/18 | | | 2,650,000 | | | | 2,672,128 | |
Sales Tax, 5.00%, 9/01/19 | | | 2,750,000 | | | | 2,891,982 | |
a Cobb County Development Authority Revenue, Georgia Waste Management Project, Mandatory Put, Series A, 1.875%, 10/01/19. | | | 2,500,000 | | | | 2,502,500 | |
Georgia State Municipal Gas Authority Revenue, Gas Portfolio IV Project, Refunding, Series A, 5.00%, 10/01/19 | | | 9,500,000 | | | | 9,988,300 | |
a Monroe County Development Authority PCR, | | | | | | | | |
Georgia Power Co. Plant Scherer Project, Mandatory Put, Refunding, First Series, 2.05%, 11/19/21 | | | 3,250,000 | | | | 3,209,375 | |
Gulf Power Co. Plant Scherer Project, Mandatory Put, First Series, 1.40%, 9/19/19 | | | 3,750,000 | | | | 3,709,650 | |
| | | | | | | | |
| | |
| | | | | | | 24,973,935 | |
| | | | | | | | |
Hawaii 0.3% | | | | | | | | |
Hawaii State Highway Revenue, Series A, 3.00%, 1/01/19 | | | 3,275,000 | | | | 3,317,804 | |
| | | | | | | | |
Idaho 0.6% | | | | | | | | |
Canyon County School District No. 131 GO, Refunding, 4.00%, 8/15/18 | | | 1,480,000 | | | | 1,498,041 | |
Idaho State GO, TAN, 4.00%, 6/29/18 | | | 4,000,000 | | | | 4,035,480 | |
| | | | | | | | |
| | |
| | | | | | | 5,533,521 | |
| | | | | | | | |
| | | | | | |
franklintempleton.com | | | | Annual Report | | 67 |
FRANKLIN TAX-FREE TRUST
STATEMENT OF INVESTMENTS
Franklin Federal Limited-Term Tax-Free Income Fund (continued)
| | | | | | | | |
| | | Principal
Amount | | | Value | |
| |
Municipal Bonds (continued) | | | | | | | | |
Illinois 1.3% | | | | | | | | |
Homer Glen Village GO, Will and Cook Counties, Series A, 4.00%, 12/01/18 | | $ | 1,000,000 | | | $ | 1,019,240 | |
a Illinois State Educational Facilities Authority Revenue, Adjustable Rate, University of Chicago, Mandatory Put, 1.65%, 2/01/19 | | | 10,000,000 | | | | 10,009,900 | |
Mount Vernon GO, Jefferson County, AGMC Insured, 3.00%, 12/15/18 | | | 1,475,000 | | | | 1,491,166 | |
| | | | | | | | |
| | |
| | | | | | | 12,520,306 | |
| | | | | | | | |
Kansas 0.9% | | | | | | | | |
Dodge City GO, Temporary Notes, Series 1, 1.50%, 10/01/19 | | | 2,750,000 | | | | 2,737,047 | |
b Kansas State Department of Transportation Highway Revenue, Refunding, Series B-5, Monthly FRN, 1.455%, (1-month USD LIBOR + 0.40%), 9/01/19 | | | 5,700,000 | | | | 5,717,043 | |
| | | | | | | | |
| | |
| | | | | | | 8,454,090 | |
| | | | | | | | |
Kentucky 0.9% | | | | | | | | |
a Louisville/Jefferson County Metro Government Environmental Facilities Revenue, Louisville Gas and Electric Co. Project, Mandatory Put, Series A, 1.25%, 6/03/19 | | | 2,000,000 | | | | 1,984,220 | |
a Louisville/Jefferson County Metro Government PCR, Louisville Gas and Electric Co. Project, Mandatory Put, Series A, 2.20%, 8/01/19 | | | 7,000,000 | | | | 7,029,120 | |
| | | | | | | | |
| | |
| | | | | | | 9,013,340 | |
| | | | | | | | |
Maryland 5.4% | | | | | | | | |
Baltimore County Metropolitan District GO, BAN, 3.00%, 3/16/18 | | | 15,000,000 | | | | 15,013,650 | |
a,b Howard County Housing Commission Revenue, Columbia Landing Project, Mandatory Put, Series A, Weekly FRN, 2.34%, (MUNIPSA + 1.25%), 7/01/18 | | | 6,000,000 | | | | 6,000,600 | |
Maryland CDA Department of Housing and Community Development Housing Revenue, FHA Risk-Sharing Insured Pass-Through, Series A, FHA Insured, 1.35%, 6/01/19 | | | 3,860,000 | | | | 3,843,325 | |
Maryland State Department of Transportation Consolidated Transportation Revenue, Refunding, 5.00%, 5/01/19 | | | 7,500,000 | | | | 7,809,600 | |
Maryland State GO, | | | | | | | | |
State and Local Facilities Loan of 2013, Refunding, First Series B, 4.50%, 8/01/19 | | | 8,000,000 | | | | 8,341,280 | |
State and Local Facilities Loan of 2013, Second Series A, Pre-Refunded, 5.00%, 8/01/23 | | | 11,355,000 | | | | 12,584,519 | |
| | | | | | | | |
| | |
| | | | | | | 53,592,974 | |
| | | | | | | | |
Massachusetts 2.8% | | | | | | | | |
Massachusetts Development Finance Agency Revenue, | | | | | | | | |
Boston University Issue, Refunding, Series Z-1, 1.50%, 8/01/19 | | | 7,000,000 | | | | 7,003,850 | |
a Partners Healthcare System Issue, Mandatory Put, Refunding, Series S-4, 5.00%, 1/25/24 | | | 5,000,000 | | | | 5,704,850 | |
a Williams College Issue, Mandatory Put, Series N, 1.45%, 7/01/21 | | | 3,000,000 | | | | 2,935,680 | |
Massachusetts State Federal Highway Revenue, Grant Anticipation Notes, Accelerated Bridge Program, Series A, 5.00%, 6/15/19 | | | 11,370,000 | | | | 11,882,218 | |
| | | | | | | | |
| | |
| | | | | | | 27,526,598 | |
| | | | | | | | |
Michigan 1.1% | | | | | | | | |
Michigan Finance Authority Revenue, Unemployment Obligation Assessment, Refunding, Series B, 5.00%, 7/01/20 | | | 10,000,000 | | | | 10,451,000 | |
| | | | | | | | |
Minnesota 3.3% | | | | | | | | |
Circle Pines ISD No. 12 GO, School Building, Minnesota School District Credit Enhancement Program, Capital Appreciation, Series A, zero cpn., 2/01/19 | | | 650,000 | | | | 639,834 | |
Duluth ISD No. 709 COP, Refunding, Series A, 3.00%, 2/01/19 | | | 2,125,000 | | | | 2,150,500 | |
Hennepin County GO, Refunding, Series B, 5.00%, 12/01/18 | | | 3,315,000 | | | | 3,404,837 | |
Minneapolis Health Care System Revenue, Fairview Health Services, Series A, Pre-Refunded, 6.75%, 11/15/32 | | | 6,440,000 | | | | 6,679,954 | |
| | | | | | |
68 | | Annual Report | | | | franklintempleton.com |
FRANKLIN TAX-FREE TRUST
STATEMENT OF INVESTMENTS
Franklin Federal Limited-Term Tax-Free Income Fund (continued)
| | | | | | | | |
| | | Principal
Amount | | | Value | |
| |
Municipal Bonds (continued) | | | | | | | | |
Minnesota (continued) | | | | | | | | |
Minnesota State GO, | | | | | | | | |
State Trunk Highway, Refunding, Series E, 4.00%, 10/01/20 | | $ | 3,835,000 | | | $ | 4,066,711 | |
Various Purpose, Series A, 5.00%, 8/01/22 | | | 9,175,000 | | | | 10,361,144 | |
Minnesota State Higher Education Facilities Authority Revenue, Macalester College, Refunding, 5.00%, 3/01/19 | | | 210,000 | | | | 217,396 | |
Northern Municipal Power Agency Electric System Revenue, Refunding, 5.00%, 1/01/21 | | | 5,000,000 | | | | 5,443,850 | |
| | | | | | | | |
| | |
| | | | | | | 32,964,226 | |
| | | | | | | | |
Mississippi 0.5% | | | | | | | | |
a Mississippi Business Finance Corp. Solid Waste Disposal Revenue, Waste Management Inc. Project, Mandatory Put, 1.35%, 9/01/20 | | | 5,000,000 | | | | 4,967,100 | |
| | | | | | | | |
Missouri 0.9% | | | | | | | | |
Platte County School District Park Hill GO, Missouri Direct Deposit Program, Refunding, 3.00%, 3/01/18 | | | 9,245,000 | | | | 9,245,000 | |
| | | | | | | | |
Nevada 2.9% | | | | | | | | |
Clark County School District GO, Refunding, Series D, 5.00%, 6/15/20 | | | 20,000,000 | | | | 21,454,600 | |
Nevada State GO, Capital Improvement and Cultural Affairs, Series C, Pre-Refunded, 5.00%, 6/01/20 | | | 7,115,000 | | | | 7,180,814 | |
| | | | | | | | |
| | |
| | | | | | | 28,635,414 | |
| | | | | | | | |
New Hampshire 0.3% | | | | | | | | |
New Hampshire State GO, Refunding, Series A, 5.00%, 7/01/18 | | | 2,610,000 | | | | 2,641,503 | |
| | | | | | | | |
New Jersey 2.7% | | | | | | | | |
Jersey City GO, | | | | | | | | |
General Improvement and Qualified Water Improvement, Refunding, Series A, BAM Insured, 4.00%, 8/01/18 | | | 2,000,000 | | | | 2,021,360 | |
General Improvement and Qualified Water Improvement, Refunding, Series A, BAM Insured, 4.00%, 8/01/19 | | | 1,330,000 | | | | 1,375,380 | |
New Jersey State GO, | | | | | | | | |
5.00%, 6/01/18 | | | 5,990,000 | | | | 6,042,412 | |
Refunding, Series Q, 5.00%, 8/15/18 | | | 15,885,000 | | | | 16,138,366 | |
Ocean County GO, Refunding, 5.00%, 8/01/19 | | | 1,125,000 | | | | 1,179,709 | |
| | | | | | | | |
| | |
| | | | | | | 26,757,227 | |
| | | | | | | | |
New Mexico 2.2% | | | | | | | | |
a Farmington PCR, Southern California Edison Co. Four Corners Project, Mandatory Put, Refunding, Series A, 1.875%, 4/01/20 | | | 9,000,000 | | | | 8,958,960 | |
New Mexico State Severance Tax Revenue, Series A, Pre-Refunded, 4.00%, 7/01/20 | | | 11,640,000 | | | | 11,744,993 | |
Taos County Gross Receipts Tax Revenue, County Education Improvement, BAM Insured, 3.50%, 4/01/19 | | | 1,000,000 | | | | 1,018,100 | |
| | | | | | | | |
| | |
| | | | | | | 21,722,053 | |
| | | | | | | | |
New York 10.3% | | | | | | | | |
a Chautauqua County Capital Resource Corp. Revenue, Multi-Mode, Jamestown Center City Development Corp. Project, Mandatory Put, Refunding, Subseries C, 2.00%, 11/01/21 | | | 4,750,000 | | | | 4,719,980 | |
Freeport GO, Nassau County, Public Improvement, Refunding, Series A, 5.00%, 1/15/19 | | | 1,920,000 | | | | 1,977,293 | |
New York City GO, | | | | | | | | |
Fiscal 2014, Refunding, Series G, 5.00%, 8/01/20 | | | 7,000,000 | | | | 7,563,010 | |
Fiscal 2017, Series B, Subseries B-1, 4.00%, 12/01/18 | | | 10,000,000 | | | | 10,203,700 | |
Fiscal 2018, Refunding, Series A, 4.00%, 8/01/18 | | | 8,015,000 | | | | 8,106,932 | |
| | | | | | |
franklintempleton.com | | | | Annual Report | | 69 |
FRANKLIN TAX-FREE TRUST
STATEMENT OF INVESTMENTS
Franklin Federal Limited-Term Tax-Free Income Fund (continued)
| | | | | | | | |
| | | Principal
Amount | | | Value | |
| |
Municipal Bonds (continued) | | | | | | | | |
New York (continued) | | | | | | | | |
New York State Dormitory Authority Revenues, | | | | | | | | |
Non-State Supported Debt, Municipal Health Facilities Improvement Program, Lease, New York City Issue, Refunding, Series 1, 5.00%, 1/15/19 | | $ | 4,000,000 | | | $ | 4,011,280 | |
Non-State Supported Debt, New York University, Series B, Pre-Refunded, 5.25%, 7/01/48 | | | 10,800,000 | | | | 10,940,400 | |
Secondarily Insured, New York University Credit, Series A, BHAC Insured, Pre-Refunded, 5.25%, 7/01/48 | | | 7,490,000 | | | | 7,587,370 | |
New York State Dormitory Authority State Personal Income Tax Revenue, General Purpose, Refunding, Series A, 5.00%, 12/15/19 | | | 6,095,000 | | | | 6,470,574 | |
New York State GO, Series A, 5.00%, 3/01/18 | | | 1,130,000 | | | | 1,130,000 | |
New York State HFAR, Affordable Housing, Climate Bond Certified/Green Bonds, Series K, GNMA Secured, 1.50%, 5/01/21 | | | 10,000,000 | | | | 9,826,500 | |
New York State Thruway Authority General Junior Indebtedness Obligations Revenue, Series A, 5.00%, 5/01/19 | | | 15,000,000 | | | | 15,601,350 | |
Suffolk County GO, | | | | | | | | |
Refunding, Series D, 4.00%, 10/15/19 | | | 3,835,000 | | | | 3,973,367 | |
Refunding, Series D, 4.00%, 10/15/20 | | | 4,270,000 | | | | 4,487,941 | |
Yonkers GO, Refunding, Series D, AGMC Insured, 5.00%, 8/01/19 | | | 4,720,000 | | | | 4,936,600 | |
| | | | | | | | |
| | |
| | | | | | | 101,536,297 | |
| | | | | | | | |
North Carolina 2.4% | | | | | | | | |
Charlotte COP, Transit Projects, Phase III, Series B, 3.00%, 6/01/22 | | | 7,500,000 | | | | 7,506,375 | |
North Carolina State GO, Refunding, Series C, 4.00%, 5/01/22 | | | 14,655,000 | | | | 15,911,813 | |
| | | | | | | | |
| | |
| | | | | | | 23,418,188 | |
| | | | | | | | |
Ohio 2.4% | | | | | | | | |
American Municipal Power Inc. Revenue, Prairie State Energy Campus Project, Refunding, Series A, 5.00%, 2/15/20 | | | 7,000,000 | | | | 7,434,840 | |
Cincinnati GO, Various Purpose, Improvement and Refunding, Series A, 5.00%, 12/01/19 | | | 3,000,000 | | | | 3,178,200 | |
Cleveland Airport System Revenue, Refunding, Series A, AGMC Insured, 5.00%, 1/01/19 | | | 7,870,000 | | | | 8,079,106 | |
a Franklin County Hospital Revenue, Facilities, OhioHealth Corp., Mandatory Put, Refunding, Series B, 4.00%, 11/01/18 | | | 3,995,000 | | | | 4,057,202 | |
Marysville Wastewater Treatment System Revenue, Refunding, BAM Insured, 5.00%, 12/01/19 | | | 1,000,000 | | | | 1,056,730 | |
| | | | | | | | |
| | |
| | | | | | | 23,806,078 | |
| | | | | | | | |
Oklahoma 1.3% | | | | | | | | |
Oklahoma County Finance Authority Educational Facilities Lease Revenue, | | | | | | | | |
Midwest City-Del City Public Schools Project, 5.00%, 10/01/19 | | | 510,000 | | | | 536,622 | |
Midwest City-Del City Public Schools Project, 5.00%, 10/01/20 | | | 1,350,000 | | | | 1,452,411 | |
Midwest City-Del City Public Schools Project, 5.00%, 10/01/22 | | | 1,000,000 | | | | 1,114,880 | |
Tulsa County ISD No.4 BIXBY GO, Combined Purpose, 2.00%, 5/01/18 | | | 10,150,000 | | | | 10,161,672 | |
| | | | | | | | |
| | |
| | | | | | | 13,265,585 | |
| | | | | | | | |
Oregon 2.1% | | | | | | | | |
Multnomah County School District No. 1J GO, Portland Public Schools, Series B, 5.00%, 6/15/20 | | | 10,000,000 | | | | 10,767,000 | |
Oregon State GO, Full Faith and Credit, Series A, TAN, 5.00%, 9/28/18 | | | 10,000,000 | | | | 10,209,600 | |
| | | | | | | | |
| | |
| | | | | | | 20,976,600 | |
| | | | | | | | |
Pennsylvania 2.8% | | | | | | | | |
Lancaster Area Sewer Authority Revenue, BAM Insured, 5.00%, 4/01/18 | | | 3,500,000 | | | | 3,510,395 | |
a Lehigh County IDA, PCR, PPL Electric Utilities Corp. Project, Mandatory Put, Refunding, Series A, 1.80%, 9/01/22 | | | 10,000,000 | | | | 9,758,200 | |
Pennsylvania State GO, Refunding, Second Series, 5.00%, 1/15/20 | | | 10,000,000 | | | | 10,608,300 | |
| | | | | | |
70 | | Annual Report | | | | franklintempleton.com |
FRANKLIN TAX-FREE TRUST
STATEMENT OF INVESTMENTS
Franklin Federal Limited-Term Tax-Free Income Fund (continued)
| | | | | | | | |
| | | Principal
Amount | | | Value | |
| |
Municipal Bonds (continued) | | | | | | | | |
Pennsylvania (continued) | | | | | | | | |
Reading School District GO, Refunding, Series A, 5.00%, 4/01/18 | | $ | 4,035,000 | | | $ | 4,046,016 | |
| | | | | | | | |
| | |
| | | | | | | 27,922,911 | |
| | | | | | | | |
Rhode Island 0.7% | | | | | | | | |
Rhode Island State and Providence Plantations GO, Consolidated Capital Development Loan, Refunding, Series A, 5.00%, 8/01/18 | | | 6,290,000 | | | | 6,385,105 | |
| | | | | | | | |
Texas 8.8% | | | | | | | | |
Austin GO, Travis Williamson and Hays Counties, Refunding, 4.00%, 9/01/18 | | | 1,500,000 | | | | 1,520,085 | |
Austin Water and Wastewater System Revenue, Travis Williamson and Hays Counties, Refunding, 5.00%, 11/15/20 | | | 5,000,000 | | | | 5,439,500 | |
Camino Real Regional Mobility Authority Pass-Through Toll Transport Revenue, State SPUR 601, 5.25%, 8/15/18 | | | 9,485,000 | | | | 9,514,403 | |
Clifton Higher Education Finance Corp. Revenue, | | | | | | | | |
Education, IDEA Public Schools, Refunding, PSF Guarantee, 3.00%, 8/15/20 | | | 2,400,000 | | | | 2,469,960 | |
Education, IDEA Public Schools, Refunding, PSF Guarantee, 4.00%, 8/15/21 | | | 2,000,000 | | | | 2,134,860 | |
Education, IDEA Public Schools, Refunding, PSF Guarantee, 4.00%, 8/15/22 | | | 3,200,000 | | | | 3,450,080 | |
Comal ISD, | | | | | | | | |
GO, School Building, PSF Guarantee, 5.00%, 2/01/21 | | | 2,280,000 | | | | 2,488,210 | |
GO, School Building, PSF Guarantee, 5.00%, 2/01/22 | | | 2,250,000 | | | | 2,505,555 | |
Dallas Area Rapid Transit Sales Tax Revenue, senior lien, Pre-Refunded, 5.25%, 12/01/48 | | | 5,190,000 | | | | 5,340,251 | |
Lewisville ISD, GO, School Building, PSF Guarantee, 3.00%, 8/15/20 | | | 5,070,000 | | | | 5,232,595 | |
Northside ISD, | | | | | | | | |
GO, Refunding, PSF Guarantee, 2.00%, 8/15/19 | | | 3,925,000 | | | | 3,951,965 | |
GO, Refunding, PSF Guarantee, 4.00%, 8/15/20 | | | 5,940,000 | | | | 6,272,699 | |
Tarrant County Cultural Education Facilities Finance Corp. Revenue, CHRISTUS Health, Refunding, Series A, Assured Guaranty, 5.75%, 7/01/18 | | | 370,000 | | | | 375,117 | |
Texas State A&M University System Permanent University Fund Revenue, Refunding, 5.00%, 7/01/19 | | | 5,845,000 | | | | 6,116,559 | |
Texas State Revenue, TRAN, 4.00%, 8/30/18 | | | 10,000,000 | | | | 10,135,200 | |
Texas Transportation Commission State Highway Fund Revenue, | | | | | | | | |
a first tier, Mandatory Put, Refunding, Series B, 4.00%, 10/01/21 | | | 3,000,000 | | | | 3,207,360 | |
first tier, Refunding, Series A, 5.00%, 4/01/19 | | | 5,000,000 | | | | 5,192,850 | |
University of Texas System Revenue, | | | | | | | | |
Board of Regents, Financing System, Series J, 5.00%, 8/15/21 | | | 4,000,000 | | | | 4,425,200 | |
Financing System, Refunding, Series A, 5.00%, 8/15/22 | | | 6,315,000 | | | | 7,126,856 | |
| | | | | | | | |
| | |
| | | | | | | 86,899,305 | |
| | | | | | | | |
Utah 0.8% | | | | | | | | |
Jordan School District GO, Utah School Bond Guaranty Program, Refunding, 5.00%, 6/15/18 | | | 8,000,000 | | | | 8,084,960 | |
| | | | | | | | |
Virginia 0.1% | | | | | | | | |
Virginia State HDA Commonwealth Mortgage Revenue, Sub Series C-5, 2.45%, 7/01/19 | | | 1,400,000 | | | | 1,416,702 | |
| | | | | | | | |
Washington 6.0% | | | | | | | | |
c Energy Northwest Electric Revenue, Columbia Generating Station, Refunding, Series A, 5.00%, 7/01/23 | | | 5,000,000 | | | | 5,715,100 | |
King County Housing Authority Revenue, Birch Creek Apartments Project, 4.40%, 5/01/18 | | | 2,290,000 | | | | 2,301,084 | |
King County School District No. 414 Lake Washington GO, | | | | | | | | |
Refunding, 4.00%, 12/01/18 | | | 2,705,000 | | | | 2,758,072 | |
Refunding, 5.00%, 12/01/19 | | | 9,045,000 | | | | 9,583,901 | |
Pierce County Sumner School District No. 320 GO, Unlimited Tax, Improvement and Refunding, 4.00%, 12/01/20 | | | 7,250,000 | | | | 7,695,585 | |
Snohomish County School District No. 15 Edmonds GO, | | | | | | | | |
4.00%, 12/01/19 | | | 5,245,000 | | | | 5,466,496 | |
5.00%, 12/01/20 | | | 4,630,000 | | | | 5,038,274 | |
5.00%, 12/01/21 | | | 5,020,000 | | | | 5,589,770 | |
| | | | | | |
franklintempleton.com | | | | Annual Report | | 71 |
FRANKLIN TAX-FREE TRUST
STATEMENT OF INVESTMENTS
Franklin Federal Limited-Term Tax-Free Income Fund (continued)
| | | | | | | | |
| | | Principal
Amount | | | Value | |
| |
Municipal Bonds (continued) | | | | | | | | |
Washington (continued) | | | | | | | | |
Snoqualmie Valley School District No. 410 GO, | | | | | | | | |
King County, Improvement and Refunding, 4.00%, 12/01/18 | | $ | 2,740,000 | | | $ | 2,793,759 | |
King County, Improvement and Refunding, 4.00%, 12/01/19 | | | 3,815,000 | | | | 3,976,794 | |
King County, Improvement and Refunding, 5.00%, 12/01/20 | | | 4,880,000 | | | | 5,317,199 | |
King County, Improvement and Refunding, 5.00%, 12/01/21 | | | 2,455,000 | | | | 2,736,490 | |
| | | | | | | | |
| | |
| | | | | | | 58,972,524 | |
| | | | | | | | |
Wisconsin 0.9% | | | | | | | | |
Fond Du Lac GO, | | | | | | | | |
Fond Du Lac County, Refunding, Series B, 2.00%, 4/01/20 | | | 700,000 | | | | 703,843 | |
Fond Du Lac County, Refunding, Series B, 2.00%, 4/01/22 | | | 1,000,000 | | | | 995,330 | |
Muskego GO, Waukesha County, Promissory Notes, Series A, 2.25%, 9/01/18 | | | 1,500,000 | | | | 1,501,005 | |
Wisconsin State GO, Refunding, Series 4, 5.00%, 5/01/19 | | | 5,000,000 | | | | 5,207,600 | |
| | | | | | | | |
| | |
| | | | | | | 8,407,778 | |
| | | | | | | | |
Wyoming 1.4% | | | | | | | | |
Sweetwater County 2013 Specific Purpose Tax Joint Powers Board Revenue, | | | | | | | | |
4.00%, 6/15/18 | | | 4,330,000 | | | | 4,338,313 | |
2.125%, 12/15/18 | | | 565,000 | | | | 565,249 | |
5.00%, 12/15/18 | | | 8,645,000 | | | | 8,668,774 | |
| | | | | | | | |
| | |
| | | | | | | 13,572,336 | |
| | | | | | | | |
Total Municipal Bonds before Short Term Investments (Cost $883,372,163) | | | | | | | 879,412,687 | |
| | | | | | | | |
Short Term Investments 10.7% | | | | | | | | |
Municipal Bonds 10.7% | | | | | | | | |
Colorado 0.0%† | | | | | | | | |
d Colorado Educational and Cultural Facilities Authority Revenue, National Jewish Federation Bond Program, Series B-4, LOC Toronto Dominion Bank, Daily VRDN and Put, 1.09%, 12/01/35 | | | 400,000 | | | | 400,000 | |
| | | | | | | | |
Florida 3.1% | | | | | | | | |
d St. Lucie County PCR, Florida Power and Light Co. Project, Refunding, Daily VRDN and Put, 1.17%, 9/01/28 | | | 25,300,000 | | | | 25,300,000 | |
Tallahassee Consolidated Utility Systems Revenue, Refunding, 5.00%, 10/01/18 | | | 4,680,000 | | | | 4,779,778 | |
| | | | | | | | |
| | |
| | | | | | | 30,079,778 | |
| | | | | | | | |
Hawaii 0.2% | | | | | | | | |
Honolulu City and County GO, Series B, 4.00%, 10/01/18 | | | 1,920,000 | | | | 1,949,990 | |
| | | | | | | | |
Minnesota 0.3% | | | | | | | | |
d Minneapolis and St. Paul Housing and RDA Health Care System Revenue, Allina Health System, Refunding, Series B-1, LOC JPMorgan Chase Bank, Daily VRDN and Put, 1.09%, 11/15/35 | | | 2,600,000 | | | | 2,600,000 | |
Minnesota State Higher Education Facilities Authority Revenue, Macalester College, Refunding, 5.00%, 3/01/18 | | | 550,000 | | | | 550,000 | |
| | | | | | | | |
| | |
| | | | | | | 3,150,000 | |
| | | | | | | | |
Missouri 1.0% | | | | | | | | |
St. Louis General Fund Revenue, TRAN, 3.00%, 6/01/18 | | | 10,000,000 | | | | 10,043,300 | |
| | | | | | | | |
New York 2.4% | | | | | | | | |
d New York City Municipal Water Finance Authority Water and Sewer System Revenue, | | | | | | | | |
Second General Resolution, Fiscal 2007, Series CC, Sub-Series CC-2, SPA Bank of Montreal, Daily VRDN and Put, 1.11%, 6/15/38 | | | 3,245,000 | | | | 3,245,000 | |
Second General Resolution, Fiscal 2014, Refunding, Series AA, Subseries AA-3, SPA Toronto Dominion Bank, Daily VRDN and Put, 1.10%, 6/15/49 | | | 7,300,000 | | | | 7,300,000 | |
| | | | | | |
72 | | Annual Report | | | | franklintempleton.com |
FRANKLIN TAX-FREE TRUST
STATEMENT OF INVESTMENTS
Franklin Federal Limited-Term Tax-Free Income Fund (continued)
| | | | | | | | | | | | |
| | | Principal
Amount | | | | | | Value | |
| | | |
Short Term Investments (continued) | | | | | | | | | | | | |
Municipal Bonds (continued) | | | | | | | | | | | | |
New York (continued) | | | | | | | | | | | | |
d New York City Transitional Finance Authority Revenue, Future Tax Secured, Senior, Multi-Modal, Fiscal 2003, Refunding, Subseries A-4, SPA Toronto Dominion Bank, Daily VRDN and Put, 1.10%, 11/01/29 | | $ | 12,900,000 | | | | | | | $ | 12,900,000 | |
| | | | | | | | | | | | |
| | | |
| | | | | | | | | | | 23,445,000 | |
| | | | | | | | | | | | |
North Carolina 1.4% | | | | | | | | | | | | |
d The Charlotte-Mecklenburg Hospital Authority Health Care Revenue, | | | | | | | | | | | | |
Carolinas HealthCare System, Refunding, Series B, SPA JPMorgan Chase Bank, Daily VRDN and Put, 1.12%, 1/15/38 | �� | | 4,000,000 | | | | | | | | 4,000,000 | |
Carolinas HealthCare System, Refunding, Series C, SPA JPMorgan Chase Bank, Daily VRDN and Put, 1.12%, 1/15/37 | | | 10,200,000 | | | | | | | | 10,200,000 | |
| | | | | | | | | | | | |
| | | |
| | | | | | | | | | | 14,200,000 | |
| | | | | | | | | | | | |
Pennsylvania 1.6% | | | | | | | | | | | | |
d Emmaus General Authority Revenue, SPA Wells Fargo Bank, Weekly VRDN and Put, 1.17%, 12/01/28 | | | 7,460,000 | | | | | | | | 7,460,000 | |
d Pennsylvania State Turnpike Commission Turnpike Revenue, | | | | | | | | | | | | |
Refunding, Series A-2, Weekly VRDN and Put, 1.79%, (MUNIPSA + 0.70%), 12/01/19 | | | 3,000,000 | | | | | | | | 3,016,170 | |
Refunding, Series B, Weekly VRDN and Put, 2.24%, (MUNIPSA + 1.15%), 12/01/19 | | | 5,000,000 | | | | | | | | 5,054,850 | |
| | | | | | | | | | | | |
| | | |
| | | | | | | | | | | 15,531,020 | |
| | | | | | | | | | | | |
Texas 0.1% | | | | | | | | | | | | |
Clifton Higher Education Finance Corp. Revenue, Education, IDEA Public Schools, Refunding, PSF Guarantee, 1.50%, 8/15/18 | | | 1,360,000 | | | | | | | | 1,360,734 | |
| | | | | | | | | | | | |
Wisconsin 0.6% | | | | | | | | | | | | |
Muskego Revenue, Waukesha County, Note Anticipation Notes, Series A, 2.50%, 9/01/18 | | | 5,750,000 | | | | | | | | 5,782,085 | |
| | | | | | | | | | | | |
| | | |
Total Short Term Investments (Cost $105,888,413) | | | | | | | | | | | 105,941,907 | |
| | | | | | | | | | | | |
Total Investments (Cost $989,260,576) 99.9% | | | | | | | | | | | 985,354,594 | |
Other Assets, less Liabilities 0.1% | | | | | | | | | | | 1,205,968 | |
| | | | | | | | | | | | |
| | | |
Net Assets 100.0% | | | | | | | | | | $ | 986,560,562 | |
| | | | | | | | | | | | |
See Abbreviations on page 140.
†Rounds to less than 0.1% of net assets.
aThe maturity date shown represents the mandatory put date.
bThe coupon rate shown represents the rate at period end.
cSecurity purchased on a when-issued basis. See Note 1(b).
dVariable rate demand notes (VRDNs) are obligations which contain a floating or variable interest rate adjustment formula and an unconditional right of demand to receive payment of the principal balance plus accrued interest at specified dates. Unless otherwise noted, the coupon rate is determined based on factors including supply and demand, underlying credit, tax treatment, and current short term rates. The coupon rate shown represents the rate at period end.
| | | | | | |
franklintempleton.com | | | | The accompanying notes are an integral part of these financial statements. | Annual Report | | 73 |
FRANKLIN TAX-FREE TRUST
Financial Highlights
Franklin High Yield Tax-Free Income Fund
| | | | | | | | | | | | | | | | | | | | |
| | | Year Ended February 28, | |
| | | | | |
| | | 2018 | | | 2017 | | | 2016a | | | 2015 | | | 2014 |
| | | | | |
Class A | | | | | | | | | | | | | | | | | | | | |
| | | | | |
Per share operating performance (for a share outstanding throughout the year) | | | | | | | | | | | | | | | | | | | | |
| | | | | |
Net asset value, beginning of year | | | $10.25 | | | | $10.57 | | | | $10.68 | | | | $10.15 | | | | $10.98 | |
| | | | |
| | | | | |
Income from investment operationsb: | | | | | | | | | | | | | | | | | | | | |
| | | | | |
Net investment incomec | | | 0.43 | | | | 0.46 | | | | 0.45 | | | | 0.46 | | | | 0.47 | |
| | | | | |
Net realized and unrealized gains (losses) | | | (0.30 | ) | | | (0.33 | ) | | | (0.11 | ) | | | 0.54 | | | | (0.84) | |
| | | | |
| | | | | |
Total from investment operations | | | 0.13 | | | | 0.13 | | | | 0.34 | | | | 1.00 | | | | (0.37) | |
| | | | |
| | | | | |
Less distributions from net investment income | | | (0.44 | ) | | | (0.45 | ) | | | (0.45 | ) | | | (0.47 | ) | | | (0.46) | |
| | | | |
| | | | | |
Net asset value, end of year. | | | $9.94 | | | | $10.25 | | | | $10.57 | | | | $10.68 | | | | $10.15 | |
| | | | |
| | | | | |
Total returnd | | | 1.30% | | | | 1.21% | | | | 3.30% | | | | 9.99% | | | | (3.20)% | |
| | | | | |
Ratios to average net assets | | | | | | | | | | | | | | | | | | | | |
| | | | | |
Expenses | | | 0.66% | | | | 0.64% | | | | 0.67% | | | | 0.65% | | | | 0.63% | |
| | | | | |
Net investment income | | | 4.22% | | | | 4.36% | | | | 4.32% | | | | 4.39% | | | | 4.64% | |
| | | | | |
Supplemental data | | | | | | | | | | | | | | | | | | | | |
| | | | | |
Net assets, end of year (000’s) | | | $4,608,917 | | | | $5,030,901 | | | | $5,117,876 | | | | $5,244,428 | | | | $5,014,941 | |
| | | | | |
Portfolio turnover rate | | | 6.98% | | | | 12.26% | | | | 11.81% | | | | 8.29% | | | | 17.08% | |
aFor the year ended February 29.
bThe amount shown for a share outstanding throughout the period may not correlate with the Statement of Operations for the period due to the timing of sales and repurchases of the Fund’s shares in relation to income earned and/or fluctuating fair value of the investments of the Fund.
cBased on average daily shares outstanding.
dTotal return does not reflect sales commissions or contingent deferred sales charges, if applicable.
| | | | | | |
74 | | Annual Report | | | The accompanying notes are an integral part of these financial statements. | | franklintempleton.com |
FRANKLIN TAX-FREE TRUST
FINANCIAL HIGHLIGHTS
Franklin High Yield Tax-Free Income Fund (continued)
| | |
| | | Year Ended February 28, 2018a |
|
| |
Class M | | |
| |
Per share operating performance | | |
(for a share outstanding throughout the year) | | |
| |
Net asset value, beginning of year | | $10.06 |
| | |
| |
Income from investment operationsb: | | |
| |
Net investment incomec | | 0.04 |
| |
Net realized and unrealized gains (losses) | | (0.12) |
| | |
| |
Total from investment operations | | (0.08) |
| | |
| |
Less distributions from net investment income | | (0.04) |
| | |
| |
Net asset value, end of year. | | $ 9.94 |
| | |
| |
Total returnd | | (0.78)% |
| |
Ratios to average net assetse | | |
| |
Expenses | | 0.56% |
| |
Net investment income | | 4.32% |
| |
Supplemental data | | |
| |
Net assets, end of year (000’s) | | $5 |
| |
Portfolio turnover rate | | 6.98% |
aFor the period January 25, 2018 (effective date) to February 28, 2018.
bThe amount shown for a share outstanding throughout the period may not correlate with the Statement of Operations for the period due to the timing of sales and repurchases of the Fund’s shares in relation to income earned and/or fluctuating fair value of the investments of the Fund.
cBased on average daily shares outstanding.
dTotal return does not reflect sales commissions or contingent deferred sales charges, if applicable, and is not annualized for periods less than one year.
eRatios are annualized for periods less than one year.
| | | | | | |
franklintempleton.com | | | | The accompanying notes are an integral part of these financial statements. | Annual Report | | 75 |
FRANKLIN TAX-FREE TRUST
FINANCIAL HIGHLIGHTS
Franklin High Yield Tax-Free Income Fund (continued)
| | | | | | | | | | | | | | | | | | |
| | | Year Ended February 28, |
| | | |
| | | | | |
| | | 2018 | | | 2017 | | | 2016a | | | 2015 | | | 2014 |
|
| | | | | |
Class C | | | | | | | | | | | | | | | | | | |
| | | | | |
Per share operating performance | | | | | | | | | | | | | | | | | | |
(for a share outstanding throughout the year) | | | | | | | | | | | | | | | | | | |
| | | | | |
Net asset value, beginning of year | | | $10.44 | | | | $10.76 | | | | $10.86 | | | | $10.31 | | | $11.14 |
| | | |
| | | | | |
Income from investment operationsb: | | | | | | | | | | | | | | | | | | |
| | | | | |
Net investment incomec | | | 0.38 | | | | 0.41 | | | | 0.40 | | | | 0.41 | | | 0.42 |
| | | | | |
Net realized and unrealized gains (losses) | | | (0.30 | ) | | | (0.34 | ) | | | (0.11 | ) | | | 0.55 | | | (0.85) |
| | | |
| | | | | |
Total from investment operations | | | 0.08 | | | | 0.07 | | | | 0.29 | | | | 0.96 | | | (0.43) |
| | | |
| | | | | |
Less distributions from net investment income | | | (0.39 | ) | | | (0.39 | ) | | | (0.39 | ) | | | (0.41 | ) | | (0.40) |
| | | |
| | | | | |
Net asset value, end of year. | | | $10.13 | | | | $10.44 | | | | $10.76 | | | | $10.86 | | | $10.31 |
| | | |
| | | | | |
Total returnd | | | 0.71% | | | | 0.62% | | | | 2.78% | | | | 9.43% | | | (3.77)% |
| | | | | |
Ratios to average net assets | | | | | | | | | | | | | | | | | | |
| | | | | |
Expenses | | | 1.21% | | | | 1.19% | | | | 1.22% | | | | 1.20% | | | 1.18% |
| | | | | |
Net investment income | | | 3.67% | | | | 3.81% | | | | 3.77% | | | | 3.84% | | | 4.09% |
| | | | | |
Supplemental data | | | | | | | | | | | | | | | | | | |
| | | | | |
Net assets, end of year (000’s) | | | $870,227 | | | | $1,025,186 | | | | $1,062,643 | | | | $1,100,883 | | | $1,042,823 |
| | | | | |
Portfolio turnover rate | | | 6.98% | | | | 12.26% | | | | 11.81% | | | | 8.29% | | | 17.08% |
aFor the year ended February 29.
bThe amount shown for a share outstanding throughout the period may not correlate with the Statement of Operations for the period due to the timing of sales and repurchases of the Fund’s shares in relation to income earned and/or fluctuating fair value of the investments of the Fund.
cBased on average daily shares outstanding.
dTotal return does not reflect sales commissions or contingent deferred sales charges, if applicable.
| | | | | | |
76 | | Annual Report | | | The accompanying notes are an integral part of these financial statements. | | franklintempleton.com |
FRANKLIN TAX-FREE TRUST
FINANCIAL HIGHLIGHTS
Franklin High Yield Tax-Free Income Fund (continued)
| | | | |
| | | Year Ended February 28, 2018a | |
| |
| |
Class R6 | | | | |
| |
Per share operating performance | | | | |
(for a share outstanding throughout the year) | | | | |
| |
Net asset value, beginning of year | | | $10.31 | |
| | | | |
| |
Income from investment operationsb: | | | | |
| |
Net investment incomec | | | 0.27 | |
| |
Net realized and unrealized gains (losses) | | | (0.34) | |
| | | | |
| |
Total from investment operations | | | (0.07) | |
| | | | |
| |
Less distributions from net investment income | | | (0.26) | |
| | | | |
| |
Net asset value, end of year. | | | $9.98 | |
| | | | |
| |
Total returnd | | | (0.68)% | |
| |
Ratios to average net assetse | | | | |
| |
Expenses before waiver and payments by affiliates | | | 0.52% | |
| |
Expenses net of waiver and payments by affiliates | | | 0.51% | |
| |
Net investment income | | | 4.37% | |
| |
Supplemental data | | | | |
| |
Net assets, end of year (000’s) | | | $152,255 | |
| |
Portfolio turnover rate | | | 6.98% | |
aFor the period August 1, 2017 (effective date) to February 28, 2018.
bThe amount shown for a share outstanding throughout the period may not correlate with the Statement of Operations for the period due to the timing of sales and repurchases of the Fund’s shares in relation to income earned and/or fluctuating fair value of the investments of the Fund.
cBased on average daily shares outstanding.
dTotal return is not annualized for periods less than one year.
eRatios are annualized for periods less than one year.
| | | | | | |
franklintempleton.com | | | | The accompanying notes are an integral part of these financial statements. | Annual Report | | 77 |
FRANKLIN TAX-FREE TRUST
FINANCIAL HIGHLIGHTS
Franklin High Yield Tax-Free Income Fund (continued)
| | | | | | | | | | | | | | | | | | |
| | | Year Ended February 28, |
| | | |
| | | | | |
| | | 2018 | | | 2017 | | | 2016a | | | 2015 | | | 2014 |
|
| | | | | |
Advisor Class | | | | | | | | | | | | | | | | | | |
| | | | | |
Per share operating performance | | | | | | | | | | | | | | | | | | |
(for a share outstanding throughout the year) | | | | | | | | | | | | | | | | | | |
| | | | | |
Net asset value, beginning of year | | | $10.30 | | | | $10.61 | | | | $10.72 | | | | $10.18 | | | $11.02 |
| | | |
| | | | | |
Income from investment operationsb: | | | | | | | | | | | | | | | | | | |
| | | | | |
Net investment incomec | | | 0.44 | | | | 0.47 | | | | 0.46 | | | | 0.47 | | | 0.49 |
| | | | | |
Net realized and unrealized gains (losses) | | | (0.31 | ) | | | (0.32 | ) | | | (0.11 | ) | | | 0.55 | | | (0.86) |
| | | |
| | | | | |
Total from investment operations | | | 0.13 | | | | 0.15 | | | | 0.35 | | | | 1.02 | | | (0.37) |
| | | |
| | | | | |
Less distributions from net investment income | | | (0.45 | ) | | | (0.46 | ) | | | (0.46 | ) | | | (0.48 | ) | | (0.47) |
| | | |
| | | | | |
Net asset value, end of year. | | | $9.98 | | | | $10.30 | | | | $10.61 | | | | $10.72 | | | $10.18 |
| | | |
| | | | | |
Total return | | | 1.29% | | | | 1.39% | | | | 3.39% | | | | 10.16% | | | (3.19)% |
| | | | | |
Ratios to average net assets | | | | | | | | | | | | | | | | | | |
| | | | | |
Expenses | | | 0.56% | | | | 0.54% | | | | 0.57% | | | | 0.55% | | | 0.53% |
| | | | | |
Net investment income | | | 4.32% | | | | 4.46% | | | | 4.42% | | | | 4.49% | | | 4.74% |
| | | | | |
Supplemental data | | | | | | | | | | | | | | | | | | |
| | | | | |
Net assets, end of year (000’s) | | | $1,070,254 | | | | $1,898,648 | | | | $2,167,363 | | | | $2,194,757 | | | $1,737,090 |
| | | | | |
Portfolio turnover rate | | | 6.98% | | | | 12.26% | | | | 11.81% | | | | 8.29% | | | 17.08% |
aFor the year ended February 29.
bThe amount shown for a share outstanding throughout the period may not correlate with the Statement of Operations for the period due to the timing of sales and repurchases of the Fund’s shares in relation to income earned and/or fluctuating fair value of the investments of the Fund.
cBased on average daily shares outstanding.
| | | | | | |
78 | | Annual Report | | | The accompanying notes are an integral part of these financial statements. | | franklintempleton.com |
FRANKLIN TAX-FREE TRUST
Statement of Investments, February 28, 2018
Franklin High Yield Tax-Free Income Fund
| | | | | | | | |
| | | Units | | | Value | |
| |
Common Stocks and Other Equity Interests (Cost $717,086) 0.0%† | | | | | | | | |
Consumer Discretionary 0.0%† | | | | | | | | |
a,b,c 1155 Island Avenue LLC, LP | | | 9,185,586 | | | $ | 717,082 | |
| | | | | | | | |
| | |
| | | Principal
Amount | | | | |
| | | | | | | | |
Corporate Bonds (Cost $4,536,593) 0.1% | | | | | | | | |
Consumer Discretionary 0.1% | | | | | | | | |
d 1155 Island Avenue LLC, PIK, 10.00% (all cash), 12/11/24 | | $ | 4,536,593 | | | | 4,537,410 | |
| | | | | | | | |
Municipal Bonds 98.5% | | | | | | | | |
Alabama 2.4% | | | | | | | | |
Alabama State Port Authority Docks Facilities Revenue, Pre-Refunded, 6.00%, 10/01/40 | | | 6,000,000 | | | | 6,661,500 | |
Cullman County Health Care Authority GO, Refunding, Series A, 7.00%, 2/01/36 | | | 7,500,000 | | | | 7,705,725 | |
Jefferson County Sewer Revenue, | | | | | | | | |
Capital Appreciation, wts., sub. lien, Refunding, Series E, zero cpn., 10/01/28 | | | 7,350,000 | | | | 4,107,548 | |
Capital Appreciation, wts., sub. lien, Refunding, Series E, zero cpn., 10/01/29 | | | 13,465,000 | | | | 6,912,662 | |
Capital Appreciation, wts., sub. lien, Refunding, Series E, zero cpn., 10/01/30 | | | 19,050,000 | | | | 8,991,409 | |
Capital Appreciation, wts., sub. lien, Refunding, Series E, zero cpn., 10/01/31 | | | 24,845,000 | | | | 10,742,978 | |
Capital Appreciation, wts., sub. lien, Refunding, Series E, zero cpn., 10/01/32 | | | 30,825,000 | | | | 12,246,772 | |
Capital Appreciation, wts., sub. lien, Refunding, Series E, zero cpn., 10/01/33 | | | 35,700,000 | | | | 13,051,206 | |
Capital Appreciation, wts., sub. lien, Refunding, Series E, zero cpn., 10/01/34 | | | 28,020,000 | | | | 9,406,314 | |
Capital Appreciation, wts., sub. lien, Refunding, Series E, zero cpn., 10/01/35 | | | 15,000,000 | | | | 4,630,500 | |
Capital Appreciation, wts., sub. lien, Refunding, Series E, zero cpn., 10/01/36 | | | 12,425,000 | | | | 3,520,003 | |
Capital Appreciation, wts., sub. lien, Refunding, Series F, zero cpn. to 9/30/23, 7.50% thereafter, 10/01/39 | | | 75,000,000 | | | | 62,379,000 | |
Prattville IDB Environmental Improvement Revenue, International Paper Co. Projects, Series A, 9.25%, 3/01/33 | | | 5,500,000 | | | | 5,911,730 | |
Selma IDBR, | | | | | | | | |
Gulf Opportunity Zone, International Paper Co. Project, Series A, 5.80%, 5/01/34 | | | 3,000,000 | | | | 3,253,470 | |
Gulf Opportunity Zone, International Paper Co. Project, Series A, 5.375%, 12/01/35 | | | 3,250,000 | | | | 3,600,545 | |
| | | | | | | | |
| | |
| | | | | | | 163,121,362 | |
| | | | | | | | |
Arizona 2.1% | | | | | | | | |
Arizona Health Facilities Authority Revenue, Catholic Healthcare West, Series B, Sub Series B-1, 5.25%, 3/01/39 | | | 10,000,000 | | | | 10,721,700 | |
Maricopa County PCC, | | | | | | | | |
PCR, El Paso Electric Co. Palo Verde Project, Series A, 7.25%, 4/01/40 | | | 20,000,000 | | | | 21,103,200 | |
PCR, Public Service Co. of New Mexico Palo Verde Project, Refunding, Series A, 6.25%, 1/01/38 | | | 15,000,000 | | | | 16,191,000 | |
Phoenix Civic Improvement Corp. Airport Revenue, junior lien, Series A, Pre-Refunded, 5.00%, 7/01/40 | | | 20,000,000 | | | | 21,549,000 | |
Pima County IDAR, Tucson Electric Power Co. Project, Series A, 5.25%, 10/01/40 | | | 15,405,000 | | | | 16,548,975 | |
Pinal County Electrical District No. 3 Electric System Revenue, Pre-Refunded, 5.25%, 7/01/41 | | | 10,000,000 | | | | 11,141,100 | |
Salt Verde Financial Corp. Senior Gas Revenue, | | | | | | | | |
5.25%, 12/01/25 | | | 6,000,000 | | | | 6,935,760 | |
5.50%, 12/01/29 | | | 11,105,000 | | | | 13,323,557 | |
Tempe IDAR, | | | | | | | | |
Mirabella at ASU Project, Series A, 6.00%, 10/01/37 | | | 1,200,000 | | | | 1,228,896 | |
Mirabella at ASU Project, Series A, 6.125%, 10/01/47 | | | 1,400,000 | | | | 1,436,106 | |
Mirabella at ASU Project, Series A, 6.125%, 10/01/52 | | | 1,400,000 | | | | 1,430,940 | |
University Medical Center Corp. Hospital Revenue, | | | | | | | | |
Tucson, Pre-Refunded, 6.00%, 7/01/24 | | | 250,000 | | | | 264,383 | |
Tucson, Pre-Refunded, 6.25%, 7/01/29 | | | 1,000,000 | | | | 1,060,810 | |
Tucson, Pre-Refunded, 6.50%, 7/01/39 | | | 1,500,000 | | | | 1,595,100 | |
| | | | |
franklintempleton.com | | Annual Report | | 79 |
FRANKLIN TAX-FREE TRUST
STATEMENT OF INVESTMENTS
Franklin High Yield Tax-Free Income Fund (continued)
| | | | | | | | |
| | | Principal
Amount | | | Value | |
| |
Municipal Bonds (continued) | | | | | | | | |
Arizona (continued) | | | | | | | | |
Yuma County IDA Water and Sewer Exempt Facility Revenue, Far West Water and Sewer Inc. Project, Refunding, Series A, 6.375%, 12/01/37 | | $ | 15,500,000 | | | $ | 14,599,760 | |
| | | | | | | | |
| | |
| | | | | | | 139,130,287 | |
| | | | | | | | |
California 20.8% | | | | | | | | |
Alvord USD, GO, Riverside County, Capital Appreciation, Election of 2007, Refunding, Series B, AGMC Insured, zero cpn., 8/01/41 | | | 30,750,000 | | | | 11,301,547 | |
Azusa Special Tax, CFD No. 2005-1, Rosedale, Improvement Area No. 1, 5.00%, 9/01/37 | | | 3,715,000 | | | | 3,751,221 | |
California County Tobacco Securitization Agency Tobacco Settlement Revenue, | | | | | | | | |
Asset-Backed, Alameda County Tobacco Asset Securitization Corp., 5.875%, 6/01/35 | | | 3,700,000 | | | | 3,738,258 | |
Asset-Backed, Kern County Tobacco Funding Corp., Refunding, 4.00%, 6/01/29 | | | 11,130,000 | | | | 11,140,240 | |
California Health Facilities Financing Authority Revenue, | | | | | | | | |
Children’s Hospital of Orange County, Series A, 6.50%, 11/01/24 | | | 5,000,000 | | | | 5,404,000 | |
Children’s Hospital of Orange County, Series A, 6.50%, 11/01/38 | | | 8,000,000 | | | | 8,654,720 | |
California Infrastructure and Economic Development Bank Revenue, | | | | | | | | |
North County Center for Self-Sufficiency Corp. Project, AMBAC Insured, 5.00%, 12/01/30 | | | 10,300,000 | | | | 11,617,164 | |
North County Center for Self-Sufficiency Corp. Project, AMBAC Insured, 5.00%, 12/01/35 | | | 5,000,000 | | | | 5,619,950 | |
California State GO, | | | | | | | | |
Various Purpose, 6.00%, 4/01/38 | | | 28,725,000 | | | | 30,095,470 | |
Various Purpose, 5.25%, 11/01/40 | | | 47,000,000 | | | | 51,031,660 | |
Various Purpose, Refunding, 5.25%, 3/01/30 | | | 70,000,000 | | | | 75,059,600 | |
Various Purpose, Refunding, 5.50%, 3/01/40 | | | 60,000,000 | | | | 64,397,400 | |
Various Purpose, Refunding, 5.00%, 10/01/41 | | | 10,000,000 | | | | 11,020,500 | |
California State Municipal Finance Authority Revenue, | | | | | | | | |
California Baptist University, Series A, 5.50%, 11/01/45 | | | 17,400,000 | | | | 19,131,300 | |
California Baptist University, Series A, 5.00%, 11/01/46 | | | 6,800,000 | | | | 7,267,500 | |
Harbor Regional Center Project, Pre-Refunded, 8.50%, 11/01/39 | | | 5,000,000 | | | | 5,560,550 | |
California State PCFA Solid Waste Disposal Revenue, | | | | | | | | |
CalPlant I Project, Green Bonds, 7.50%, 7/01/32 | | | 24,500,000 | | | | 23,909,550 | |
CalPlant I Project, Green Bonds, 8.00%, 7/01/39 | | | 10,000,000 | | | | 10,011,200 | |
California State PCFA Water Facilities Revenue, American Water Capital Corp. Project, 5.25%, 8/01/40 | | | 6,000,000 | | | | 6,424,860 | |
California State Public Works Board Lease Revenue, | | | | | | | | |
Trustees of the California State University, J. Paul Leonard and Sutro Library, Series J, Pre-Refunded, 6.00%, 11/01/29 | | | 7,365,000 | | | | 7,912,514 | |
Trustees of the California State University, J. Paul Leonard and Sutro Library, Series J, Pre-Refunded, 6.00%, 11/01/34 | | | 17,560,000 | | | | 18,865,410 | |
Various Capital Projects, Series A, 5.00%, 4/01/30 | | | 17,785,000 | | | | 19,732,635 | |
California Statewide CDA Revenue, | | | | | | | | |
American Baptist Homes of the West, Refunding, 6.00%, 10/01/29 | | | 3,125,000 | | | | 3,314,938 | |
American Baptist Homes of the West, Refunding, 6.25%, 10/01/39 | | | 5,000,000 | | | | 5,285,500 | |
Lancer Educational Student Housing Project, Refunding, Series A, 5.00%, 6/01/36 | | | 7,210,000 | | | | 7,623,566 | |
Loma Linda University Medical Center, Refunding, Series A, 5.25%, 12/01/44 | | | 13,000,000 | | | | 13,959,790 | |
Loma Linda University Medical Center, Series A, 5.25%, 12/01/56 | | | 3,000,000 | | | | 3,206,670 | |
Monterey Institute International, 5.50%, 7/01/31 | | | 11,165,000 | | | | 11,435,751 | |
Centinela Valley UHSD, GO, Los Angeles County, Capital Appreciation, Election of 2010, Refunding, Series B, AGMC Insured, zero cpn., 8/01/37 | | | 8,400,000 | | | | 3,145,380 | |
Compton Community College District GO, | | | | | | | | |
Capital Appreciation, Election of 2002, Series D, BAM Insured, zero cpn., 8/01/30 | | | 3,425,000 | | | | 1,926,015 | |
Capital Appreciation, Election of 2002, Series D, BAM Insured, zero cpn., 8/01/32 | | | 4,000,000 | | | | 1,951,800 | |
Capital Appreciation, Election of 2002, Series D, BAM Insured, zero cpn., 8/01/34 | | | 4,560,000 | | | | 1,919,350 | |
Capital Appreciation, Election of 2002, Series D, BAM Insured, zero cpn., 8/01/36 | | | 5,250,000 | | | | 1,910,475 | |
| | | | | | |
80 | | Annual Report | | | | franklintempleton.com |
FRANKLIN TAX-FREE TRUST
STATEMENT OF INVESTMENTS
Franklin High Yield Tax-Free Income Fund (continued)
| | | | | | | | | | |
| | | Principal
Amount | | | | | Value | |
Municipal Bonds (continued) | | | | | | | | | | |
California (continued) | | | | | | | | | | |
Compton Community College District GO, (continued) | | | | | | | | | | |
Capital Appreciation, Election of 2002, Series D, BAM Insured, zero cpn., 8/01/37 | | $ | 3,065,000 | | | | | $ | 1,036,951 | |
Capital Appreciation, Election of 2002, Series D, BAM Insured, zero cpn., 8/01/38 | | | 6,000,000 | | | | | | 1,888,560 | |
Foothill/Eastern Transportation Corridor Agency Toll Road Revenue, | | | | | | | | | | |
Capital Appreciation, Refunding, Series A, AGMC Insured, zero cpn. to 1/15/24, 5.40% thereafter, 1/15/30 | | | 10,000,000 | | | | | | 8,814,700 | |
Capital Appreciation, Refunding, Series A, AGMC Insured, zero cpn. to 1/15/24, 5.50% thereafter, 1/15/31 | | | 7,295,000 | | | | | | 6,515,237 | |
junior lien, Refunding, Series C, 6.25%, 1/15/33 | | | 17,580,000 | | | | | | 20,695,352 | |
junior lien, Refunding, Series C, 6.50%, 1/15/43 | | | 28,790,000 | | | | | | 33,920,378 | |
Golden State Tobacco Securitization Corp. Enhanced Tobacco Settement Revenue, Asset-Backed,
Capital Appreciation, First Subordinate, Series B, zero cpn., 6/01/47 | | | 50,000,000 | | | | | | 6,831,500 | |
Los Angeles Department of Airports Revenue, Los Angeles International Airport, Senior, Series D,
5.00%, 5/15/40 | | | 52,685,000 | | | | | | 56,367,681 | |
Los Angeles USD, GO, Series KRY, 5.25%, 7/01/34 | | | 36,625,000 | | | | | | 39,547,675 | |
M-S-R Energy Authority Gas Revenue, | | | | | | | | | | |
Series B, 6.125%, 11/01/29 | | | 30,505,000 | | | | | | 37,590,091 | |
Series B, 7.00%, 11/01/34 | | | 20,000,000 | | | | | | 28,091,400 | |
Series C, 6.50%, 11/01/39 | | | 20,000,000 | | | | | | 27,848,600 | |
Novato RDA Tax Allocation, Hamilton Field Redevelopment Project, 6.75%, 9/01/40 | | | 3,750,000 | | | | | | 4,244,213 | |
Palmdale Elementary School District Special Tax, | | | | | | | | | | |
CFD No. 90-1, Capital Appreciation, Series A, AGMC Insured, zero cpn., 8/01/28 | | | 1,500,000 | | | | | | 1,039,785 | |
CFD No. 90-1, Capital Appreciation, Series A, AGMC Insured, zero cpn., 8/01/30 | | | 1,250,000 | | | | | | 785,275 | |
CFD No. 90-1, Capital Appreciation, Series A, AGMC Insured, zero cpn., 8/01/31 | | | 1,250,000 | | | | | | 749,475 | |
CFD No. 90-1, Capital Appreciation, Series A, AGMC Insured, zero cpn. to 8/01/25, 5.625%
thereafter, 8/01/34 | | | 2,500,000 | | | | | | 1,974,500 | |
Riverside County Transportation Commission Toll Revenue, | | | | | | | | | | |
Capital Appreciation, senior lien, Series B, zero cpn., 6/01/32 | | | 4,000,000 | | | | | | 2,227,960 | |
Capital Appreciation, senior lien, Series B, zero cpn., 6/01/33 | | | 5,500,000 | | | | | | 2,913,955 | |
Capital Appreciation, senior lien, Series B, zero cpn., 6/01/41 | | | 5,000,000 | | | | | | 1,813,700 | |
Capital Appreciation, senior lien, Series B, zero cpn., 6/01/42 | | | 7,000,000 | | | | | | 2,425,080 | |
senior lien, Series A, 5.75%, 6/01/44 | | | 6,065,000 | | | | | | 6,753,559 | |
San Buenaventura Revenue, | | | | | | | | | | |
Community Memorial Health System, 8.00%, 12/01/31 | | | 10,000,000 | | | | | | 11,471,800 | |
Community Memorial Health System, 7.50%, 12/01/41 | | | 15,000,000 | | | | | | 16,797,600 | |
San Diego USD, | | | | | | | | | | |
GO, Dedicated Unlimited Ad Valorem Property Tax, Capital Appreciation, Election of 2008, Series
E, zero cpn. to 7/01/32, 5.25% thereafter, 7/01/42 | | | 44,565,000 | | | | | | 28,793,001 | |
GO, Dedicated Unlimited Ad Valorem Property Tax, Capital Appreciation, Election of 2008, Series
E, zero cpn. to 7/01/32, 5.375% thereafter, 7/01/47 | | | 33,305,000 | | | | | | 22,040,250 | |
GO, Dedicated Unlimited Ad Valorem Property Tax, Capital Appreciation, Election of 2008, Series
G, zero cpn., 7/01/34 | | | 5,000,000 | | | | | | 2,370,600 | |
GO, Dedicated Unlimited Ad Valorem Property Tax, Capital Appreciation, Election of 2008, Series
G, zero cpn., 7/01/35 | | | 10,000,000 | | | | | | 4,452,300 | |
San Francisco City and County COP, Multiple Capital Improvement Projects, Series A, 5.00%, 4/01/29 | | | 10,000,000 | | | | | | 10,371,400 | |
San Joaquin Hills Transportation Corridor Agency Toll Road Revenue, | | | | | | | | | | |
Capital Appreciation, Refunding, Series A, zero cpn. to 7/15/21, 5.75% thereafter, 1/15/41 | | | 35,256,000 | | | | | | 33,897,586 | |
Capital Appreciation, Refunding, Series A, zero cpn. to 7/15/21, 5.75% thereafter, 1/15/42 | | | 35,256,000 | | | | | | 33,960,342 | |
junior lien, Capital Appreciation, ETM, zero cpn., 1/01/24 | | | 52,700,000 | | | | | | 46,575,733 | |
junior lien, Capital Appreciation, ETM, zero cpn., 1/01/25 | | | 45,200,000 | | | | | | 38,768,040 | |
junior lien, Capital Appreciation, ETM, zero cpn., 1/01/26 | | | 131,900,000 | | | | | | 109,339,824 | |
| | | | | | |
franklintempleton.com | | | | Annual Report | | 81 |
FRANKLIN TAX-FREE TRUST
STATEMENT OF INVESTMENTS
Franklin High Yield Tax-Free Income Fund (continued)
| | | | | | | | | | |
| | | Principal
Amount | | | | | | Value |
Municipal Bonds (continued) | | | | | | | | | | |
California (continued) | | | | | | | | | | |
San Joaquin Hills Transportation Corridor Agency Toll Road Revenue, (continued) | | | | | | | | | | |
junior lien, Capital Appreciation, ETM, zero cpn., 1/01/27 | | $ | 139,100,000 | | | | | | | $ 111,211,841 |
junior lien, Refunding, Series B, 5.25%, 1/15/44 | | | 20,000,000 | | | | | | | 21,839,000 |
junior lien, Refunding, Series B, 5.25%, 1/15/49 | | | 25,000,000 | | | | | | | 27,219,750 |
San Jose Special Hotel Tax Revenue, Convention Center Expansion and Renovation Project, 6.50%, 5/01/42 | | | 10,000,000 | | | | | | | 11,395,800 |
San Mateo UHSD, GO, Capital Appreciation, Election of 2010, Refunding, Series A, zero cpn. to 9/01/28, 6.70% thereafter, 9/01/41 | | | 20,000,000 | | | | | | | 16,637,000 |
San Mateo-Foster City School District GO, Capital Appreciation, Election of 2008, Series A, zero cpn. to 8/01/26, 6.625% thereafter, 8/01/42 | | | 50,000,000 | | | | | | | 42,490,000 |
San Ysidro School District GO, | | | | | | | | | | |
Capital Appreciation, Refunding, AGMC Insured, zero cpn., 8/01/42 | | | 10,000,000 | | | | | | | 3,111,000 |
Capital Appreciation, Refunding, AGMC Insured, zero cpn., 8/01/43 | | | 12,500,000 | | | | | | | 3,676,125 |
Silicon Valley Tobacco Securitization Authority Tobacco Settlement Revenue, Turbo-Santa Clara, Capital Appreciation, Series A, zero cpn., 6/01/36 | | | 15,000,000 | | | | | | | 5,331,450 |
South Bayside Waste Management Authority Solid Waste Enterprise Revenue, Shoreway Environmental Center, Series A, 6.00%, 9/01/36 | | | 7,740,000 | | | | | | | 8,225,221 |
Southern California Public Power Authority Gas Project Revenue, Project No. 1, Series A, 5.25%, 11/01/27 | | | 9,855,000 | | | | | | | 11,549,370 |
Tobacco Securitization Authority Southern California Tobacco Settlement Revenue, First Subordinate Capital Appreciation, Series B, zero cpn., 6/01/46 | | | 50,000,000 | | | | | | | 7,750,500 |
| | | | | | | | | | |
| | | |
| | | | | | | | | | 1,390,677,644 |
| | | | | | | | | | |
Colorado 3.9% | | | | | | | | | | |
Brighton Crossing Metropolitan District No. 4 GO, | | | | | | | | | | |
Adams County, Limited Tax, Series A, 5.00%, 12/01/37 | | | 525,000 | | | | | | | 538,178 |
Adams County, Limited Tax, Series A, 5.00%, 12/01/47 | | | 1,220,000 | | | | | | | 1,242,643 |
Colorado Health Facilities Authority Revenue, | | | | | | | | | | |
The Evangelical Lutheran Good Samaritan Society Project, Refunding, Series A, 5.00%, 6/01/45 | | | 14,000,000 | | | | | | | 14,963,200 |
Fraiser Meadows Retirement Community Project, Improvement, Series B, 5.00%, 5/15/48 | | | 4,085,000 | | | | | | | 4,282,755 |
Frasier Meadows Retirement Community Project, Refunding and Improvement, Series A, 5.25%, 5/15/47 | | | 4,250,000 | | | | | | | 4,655,407 |
Hospital, Refunding, Series C, AGMC Insured, 5.25%, 3/01/40 | | | 20,000,000 | | | | | | | 20,650,400 |
Copperleaf Metropolitan District No. 2 GO, Refunding, 5.75%, 12/01/45 | | | 2,000,000 | | | | | | | 2,096,320 |
Cornerstar Metropolitan District GO, | | | | | | | | | | |
City of Aurora, Arapahoe County, Limited Tax, Refunding, Series A, 5.125%, 12/01/37 | | | 1,000,000 | | | | | | | 1,033,160 |
City of Aurora, Arapahoe County, Limited Tax, Refunding, Series A, 5.25%, 12/01/47 | | | 2,600,000 | | | | | | | 2,681,536 |
Denver Health and Hospital Authority Healthcare Revenue, | | | | | | | | | | |
Refunding, Series A, 4.00%, 12/01/35 | | | 5,000,000 | | | | | | | 4,778,900 |
Refunding, Series A, 4.00%, 12/01/36 | | | 5,000,000 | | | | | | | 4,740,050 |
E-470 Public Highway Authority Revenue, | | | | | | | | | | |
Current Interest, Senior, Series C, 5.375%, 9/01/26 | | | 5,000,000 | | | | | | | 5,384,950 |
senior bond, Capital Appreciation, Series A, NATL Insured, zero cpn., 9/01/28 | | | 15,000,000 | | | | | | | 10,346,100 |
senior bond, Capital Appreciation, Series B, NATL Insured, zero cpn., 9/01/29 | | | 10,000,000 | | | | | | | 5,636,700 |
senior bond, Capital Appreciation, Series B, NATL Insured, zero cpn., 9/01/30 | | | 17,300,000 | | | | | | | 9,193,739 |
senior bond, Capital Appreciation, Series B, NATL Insured, zero cpn., 9/01/31 | | | 10,000,000 | | | | | | | 5,010,600 |
Leyden Rock Metropolitan District No. 10 GO, | | | | | | | | | | |
Refunding and Improvement, Series A, 4.375%, 12/01/33 | | | 750,000 | | | | | | | 743,633 |
Refunding and Improvement, Series A, 5.00%, 12/01/45 | | | 1,250,000 | | | | | | | 1,269,212 |
The Plaza Metropolitan District No. 1 Revenue, Refunding, 5.00%, 12/01/40 | | | 3,000,000 | | | | | | | 3,098,220 |
| | | | | | |
82 | | Annual Report | | | | franklintempleton.com |
FRANKLIN TAX-FREE TRUST
STATEMENT OF INVESTMENTS
Franklin High Yield Tax-Free Income Fund (continued)
| | | | | | | | | | | | |
| | | Principal
Amount | | | | | | Value | |
Municipal Bonds (continued) | | | | | | | | | | | | |
Colorado (continued) | | | | | | | | | | | | |
Public Authority for Colorado Energy Natural Gas Purchase Revenue, | | | | | | | | | | | | |
6.125%, 11/15/23 | | $ | 2,465,000 | | | | | | | $ | 2,921,222 | |
6.25%, 11/15/28 | | | 12,500,000 | | | | | | | | 15,571,125 | |
6.50%, 11/15/38 | | | 80,100,000 | | | | | | | | 110,192,769 | |
Regional Transportation District COP, | | | | | | | | | | | | |
Refunding, Series A, 5.00%, 6/01/25 | | | 1,115,000 | | | | | | | | 1,186,594 | |
Series A, Pre-Refunded, 5.00%, 6/01/25 | | | 12,385,000 | | | | | | | | 13,299,137 | |
Sierra Ridge Metropolitan District No. 2 GO, Douglas County, Limited Tax, Senior, Series A, 5.50%, 12/01/46 | | | 1,500,000 | | | | | | | | 1,532,040 | |
Southglenn Metropolitan District Special Revenue, | | | | | | | | | | | | |
In the City of Centennial Colorado, Refunding, 5.00%, 12/01/30 | | | 3,470,000 | | | | | | | | 3,608,626 | |
In the City of Centennial Colorado, Refunding, 5.00%, 12/01/36 | | | 810,000 | | | | | | | | 828,079 | |
In the City of Centennial Colorado, Refunding, 5.00%, 12/01/46 | | | 4,200,000 | | | | | | | | 4,259,640 | |
Southlands Metropolitan District No. 1 GO, | | | | | | | | | | | | |
Aurora, Arapahoe County, Refunding, Series A-1, 5.00%, 12/01/37 | | | 500,000 | | | | | | | | 535,830 | |
Aurora, Arapahoe County, Refunding, Series A-1, 5.00%, 12/01/47 | | | 1,000,000 | | | | | | | | 1,061,740 | |
Aurora, Arapahoe County, Refunding, Series A-2, 5.00%, 12/01/37 | | | 200,000 | | | | | | | | 214,332 | |
Aurora, Arapahoe County, Refunding, Series A-2, 5.00%, 12/01/47 | | | 325,000 | | | | | | | | 345,066 | |
e Villages Castle Rock Metropolitan District No. 4 Revenue, Refunding, 8.50%, 12/01/10 | | | 3,000,000 | | | | | | | | 2,400,000 | |
| | | | | | | | | | | | |
| | | |
| | | | | | | | | | | 260,301,903 | |
| | | | | | | | | | | | |
Connecticut 0.4% | | | | | | | | | | | | |
Connecticut State Health and Educational Facilities Authority Revenue, | | | | | | | | | | | | |
Church Home of Hartford Inc. Project, Series A, 5.00%, 9/01/46 | | | 1,490,000 | | | | | | | | 1,528,367 | |
Church Home of Hartford Inc. Project, Series A, 5.00%, 9/01/53 | | | 4,650,000 | | | | | | | | 4,746,813 | |
Masonicare Issue, Refunding, Series F, 5.00%, 7/01/37 | | | 5,500,000 | | | | | | | | 5,926,525 | |
Masonicare Issue, Refunding, Series F, 5.00%, 7/01/43 | | | 13,000,000 | | | | | | | | 13,884,130 | |
| | | | | | | | | | | | |
| | | |
| | | | | | | | | | | 26,085,835 | |
| | | | | | | | | | | | |
District of Columbia 3.1% | | | | | | | | | | | | |
District of Columbia Hospital Revenue, Children’s Hospital Obligated Group Issue, Assured Guaranty, Pre-Refunded, 5.25%, 7/15/38 | | | 11,000,000 | | | | | | | | 11,161,480 | |
District of Columbia Revenue, | | | | | | | | | | | | |
American Society of Hematology Issue, 5.00%, 7/01/36 | | | 1,500,000 | | | | | | | | 1,639,410 | |
American Society of Hematology Issue, 5.00%, 7/01/42 | | | 9,515,000 | | | | | | | | 10,370,874 | |
Assn. of American Medical Colleges Issue, Series B, 5.25%, 10/01/36 | | | 12,425,000 | | | | | | | | 13,288,537 | |
Assn. of American Medical Colleges Issue, Series B, 5.00%, 10/01/41 | | | 5,010,000 | | | | | | | | 5,291,813 | |
The Catholic University of America Issue, Pre-Refunded, 5.00%, 10/01/34 | | | 3,750,000 | | | | | | | | 3,829,950 | |
Center for Strategic and International Studies Inc. Issue, Pre-Refunded, 6.375%, 3/01/31 | | | 5,200,000 | | | | | | | | 5,800,184 | |
Center for Strategic and International Studies Inc. Issue, Pre-Refunded, 6.625%, 3/01/41 | | | 5,500,000 | | | | | | | | 6,253,665 | |
Deed Tax, Series A, 5.00%, 6/01/40 | | | 13,000,000 | | | | | | | | 13,769,860 | |
The Methodist Home of the District of Columbia Issue, Series A, 5.125%, 1/01/35 | | | 1,565,000 | | | | | | | | 1,482,900 | |
The Methodist Home of the District of Columbia Issue, Series A, 5.25%, 1/01/39 | | | 1,015,000 | | | | | | | | 950,365 | |
District of Columbia Tobacco Settlement FICO Revenue, | | | | | | | | | | | | |
Asset-Backed, Refunding, 6.50%, 5/15/33 | | | 19,295,000 | | | | | | | | 21,732,537 | |
Capital Appreciation, Asset-Backed, Series A, zero cpn., 6/15/46 | | | 175,000,000 | | | | | | | | 25,476,500 | |
Metropolitan Washington Airports Authority Dulles Toll Road Revenue, Dulles Metrorail and Capital Improvement Projects, Convertible Capital Appreciation, second senior lien, Series C, Assured Guaranty, 6.50%, 10/01/41 | | | 60,145,000 | | | | | | | | 76,068,389 | |
Washington Convention and Sports Authority Dedicated Tax Revenue, Convention Center Hotel Project, senior lien, Series A, 5.00%, 10/01/40 | | | 10,000,000 | | | | | | | | 10,657,000 | |
| | | | | | | | | | | | |
| | | |
| | | | | | | | | | | 207,773,464 | |
| | | | | | | | | | | | |
| | | | | | |
franklintempleton.com | | | | Annual Report | | 83 |
FRANKLIN TAX-FREE TRUST
STATEMENT OF INVESTMENTS
Franklin High Yield Tax-Free Income Fund (continued)
| | | | | | | | | | | | |
| | | Principal
Amount | | | | | | Value | |
Municipal Bonds (continued) | | | | | | | | | | | | |
Florida 6.8% | | | | | | | | | | | | |
Brevard County Health Facilities Authority Health Facilities Revenue, Health First Inc. Project, Series B, Pre-Refunded, 7.00%, 4/01/39 | | $ | 6,500,000 | | | | | | | $ | 6,877,325 | |
Brooks of Bonita Springs CDD Capital Improvement Revenue, 6.85%, 5/01/31 | | | 930,000 | | | | | | | | 931,144 | |
Cape Coral Health Facilities Authority Revenue, Senior Housing, Gulf Care Inc. Project, Refunding, 6.00%, 7/01/45 | | | 5,250,000 | | | | | | | | 5,675,460 | |
Capital Trust Agency Retirement Facility Revenue, Sarasota-Manatee Jewish Housing Council Inc. Project ACCD Investments, Refunding, 5.00%, 7/01/46 | | | 3,250,000 | | | | | | | | 3,281,168 | |
Championsgate CDD Capital Improvement Revenue, Series A, 6.25%, 5/01/20 | | | 720,000 | | | | | | | | 721,706 | |
Collier County Educational Facilities Authority Revenue, | | | | | | | | | | | | |
Ave Maria University Inc. Project, Refunding, Series A, 6.00%, 6/01/33 | | | 5,500,000 | | | | | | | | 6,040,155 | |
Ave Maria University Inc. Project, Refunding, Series A, 6.00%, 6/01/38 | | | 12,000,000 | | | | | | | | 13,107,120 | |
Hodges University Inc. Project, 6.125%, 11/01/43 | | | 10,035,000 | | | | | | | | 11,100,215 | |
Escambia County Environmental Improvement Revenue, International Paper Co. Projects, Series A, 9.50%, 3/01/33 | | | 7,975,000 | | | | | | | | 8,591,627 | |
f Florida Development Finance Corp. Surface Transportation Facility Revenue, Brightline Passenger Rail Project-South Segment, Mandatory Put, 5.625%, 1/01/28 | | | 10,000,000 | | | | | | | | 10,312,300 | |
Florida State Board of Education GO, Public Education Capital Outlay, Refunding, Series D, 6.00%, 6/01/23 | | | 5,000,000 | | | | | | | | 5,994,150 | |
Florida State Mid-Bay Bridge Authority Revenue, first senior lien, Refunding, Series A, 5.00%, 10/01/40 | | | 3,000,000 | | | | | | | | 3,299,370 | |
Greenway ID Special Assessment Revenue, 5.125%, 5/01/43 | | | 38,945,000 | | | | | | | | 39,355,480 | |
Hillsborough County IDA, PCR, Tampa Electric Co. Project, Series A, 5.65%, 5/15/18 | | | 6,525,000 | | | | | | | | 6,578,309 | |
Indian Trace Development District Special Assessment, Isles at Weston Project, 5.50%, 5/01/33 | | | 2,295,000 | | | | | | | | 2,300,003 | |
Indigo CDD Capital Improvement Revenue, | | | | | | | | | | | | |
Refunding, Series A, 7.00%, 5/01/31 | | | 695,000 | | | | | | | | 695,466 | |
g Refunding, Series C, 7.00%, 5/01/30 | | | 4,123,752 | | | | | | | | 1,855,688 | |
Lakeland Hospital Revenue, Lakeland Regional Health Systems, 5.00%, 11/15/40 | | | 21,575,000 | | | | | | | | 23,398,519 | |
Lakeland Retirement Community Revenue, | | | | | | | | | | | | |
first mortgage, Carpenters Estates, Accredited Investors, Refunding, 5.875%, 1/01/19 | | | 385,000 | | | | | | | | 396,438 | |
first mortgage, Carpenters Estates, Accredited Investors, Refunding, 6.25%, 1/01/28 | | | 1,230,000 | | | | | | | | 1,258,290 | |
first mortgage, Carpenters Estates, Accredited Investors, Refunding, 6.375%, 1/01/43 | | | 2,250,000 | | | | | | | | 2,296,418 | |
Martin County Health Facilities Authority Hospital Revenue, | | | | | | | | | | | | |
Martin Memorial Medical Center, 5.50%, 11/15/42 | | | 3,800,000 | | | | | | | | 4,127,598 | |
Martin Memorial Medical Center, 5.00%, 11/15/45 | | | 7,500,000 | | | | | | | | 7,869,225 | |
Miami World Center CDD Special Assessment, | | | | | | | | | | | | |
5.125%, 11/01/39 | | | 2,000,000 | | | | | | | | 2,088,980 | |
5.25%, 11/01/49 | | | 2,500,000 | | | | | | | | 2,637,800 | |
Miami-Dade County Aviation Revenue, | | | | | | | | | | | | |
Miami International Airport, Refunding, Series A, 5.00%, 10/01/38 | | | 40,000,000 | | | | | | | | 44,216,000 | |
Miami International Airport, Refunding, Series A, 5.50%, 10/01/41 | | | 20,850,000 | | | | | | | | 22,714,615 | |
Miami-Dade County Educational Facilities Authority Revenue, University of Miami Issue, Refunding, Series B, AMBAC Insured, 5.25%, 4/01/27 | | | 10,995,000 | | | | | | | | 12,862,611 | |
Miami-Dade County Expressway Authority Toll System Revenue, Series A, 5.00%, 7/01/40 | | | 44,360,000 | | | | | | | | 47,134,274 | |
Miami-Dade County Professional Sports Franchise Facilities Revenue, Capital Appreciation, Refunding, Series A, Assured Guaranty, zero cpn., 10/01/45 | | | 25,000,000 | | | | | | | | 7,411,000 | |
Miami-Dade County School Board COP, Master Lease Purchase Agreement, Refunding, Series A, 5.00%, 5/01/31 | | | 7,985,000 | | | | | | | | 8,823,824 | |
North Sumter County Utility Dependent District Utility Revenue, | | | | | | | | | | | | |
sub. bond, 6.00%, 10/01/30 | | | 3,780,000 | | | | | | | | 4,161,364 | |
sub. bond, 6.25%, 10/01/43 | | | 6,865,000 | | | | | | | | 7,576,832 | |
| | | | | | |
84 | | Annual Report | | | | franklintempleton.com |
FRANKLIN TAX-FREE TRUST
STATEMENT OF INVESTMENTS
Franklin High Yield Tax-Free Income Fund (continued)
| | | | | | | | | | | | |
| | | Principal
Amount | | | | | | Value | |
Municipal Bonds (continued) | | | | | | | | | | | | |
Florida (continued) | | | | | | | | | | | | |
Northern Palm Beach County ID Special Assessment, | | | | | | | | | | | | |
Water Control and Improvement, Unit of Development No. 2C, 5.00%, 8/01/34 | | $ | 2,700,000 | | | | | | | $ | 2,824,875 | |
Water Control and Improvement, Unit of Development No. 2C, 5.00%, 8/01/37 | | | 750,000 | | | | | | | | 790,860 | |
Water Control and Improvement, Unit of Development No. 2C, 5.00%, 8/01/46 | | | 3,000,000 | | | | | | | | 3,139,770 | |
Water Control and Improvement, Unit of Development No. 2C, 5.20%, 8/01/46 | | | 6,000,000 | | | | | | | | 6,265,500 | |
Orange County Health Facilities Authority Revenue, | | | | | | | | | | | | |
Presbyterian Retirement Communities Project, 5.00%, 8/01/41 | | | 5,300,000 | | | | | | | | 5,820,619 | |
Presbyterian Retirement Communities Project, 5.00%, 8/01/47 | | | 6,285,000 | | | | | | | | 6,882,641 | |
Orlando-Orange County Expressway Authority Revenue, Series C, Pre-Refunded, 5.00%, 7/01/35 | | | 7,965,000 | | | | | | | | 8,562,933 | |
Palm Beach County Health Facilities Authority Revenue, Retirement Communities, ACTS Retirement- Life Communities Inc., Obligated Group, Refunding, 5.00%, 11/15/32 | | | 8,180,000 | | | | | | | | 9,217,551 | |
Pelican Marsh CDD Special Assessment Revenue, | | | | | | | | | | | | |
Refunding, 4.875%, 5/01/22 | | | 800,000 | | | | | | | | 801,216 | |
Refunding, 5.375%, 5/01/31 | | | 1,295,000 | | | | | | | | 1,309,569 | |
Pensacola Airport Revenue, Refunding, 6.00%, 10/01/28 | | | 7,000,000 | | | | | | | | 7,173,040 | |
g Portofino Landings CDD Special Assessment, Series A, 5.40%, 5/01/38 | | | 2,705,000 | | | | | | | | 1,082,000 | |
River Place St. Lucie CDD Special Assessment Revenue, | | | | | | | | | | | | |
Series A, 7.625%, 5/01/21 | | | 600,000 | | | | | | | | 508,710 | |
Series A, 7.625%, 5/01/30 | | | 1,590,000 | | | | | | | | 1,233,284 | |
Somerset CDD Revenue, Capital Improvement, 5.30%, 5/01/37 | | | 6,530,000 | | | | | | | | 6,529,739 | |
South Broward Hospital District Revenue, South Broward Hospital District Obligated Group, Pre- Refunded, 5.00%, 5/01/36 | | | 12,500,000 | | | | | | | | 12,577,500 | |
Village CDD No. 6 Special Assessment Revenue, Refunding, 4.00%, 5/01/35 | | | 3,735,000 | | | | | | | | 3,747,624 | |
Village CDD No. 8 Special Assessment Revenue, 6.375%, 5/01/38 | | | 6,700,000 | | | | | | | | 6,771,757 | |
Village CDD No. 9 Special Assessment Revenue, | | | | | | | | | | | | |
6.75%, 5/01/31 | | | 7,035,000 | | | | | | | | 7,899,953 | |
7.00%, 5/01/41 | | | 6,240,000 | | | | | | | | 7,187,544 | |
Refunding, 5.00%, 5/01/22 | | | 965,000 | | | | | | | | 1,003,243 | |
Refunding, 5.25%, 5/01/31 | | | 1,920,000 | | | | | | | | 2,062,138 | |
Refunding, 5.50%, 5/01/42 | | | 1,915,000 | | | | | | | | 2,071,360 | |
Village CDD No. 10 Special Assessment Revenue, | | | | | | | | | | | | |
5.75%, 5/01/31 | | | 1,800,000 | | | | | | | | 2,060,622 | |
5.00%, 5/01/32 | | | 5,530,000 | | | | | | | | 6,105,562 | |
5.125%, 5/01/43 | | | 8,400,000 | | | | | | | | 9,315,684 | |
6.00%, 5/01/44 | | | 7,800,000 | | | | | | | | 9,069,372 | |
Westchase East CDD Capital Improvement Revenue, 7.10%, 5/01/21 | | | 425,000 | | | | | | | | 426,887 | |
| | | |
| | | | | | | | | | | 458,132,027 | |
Georgia 2.0% | | | | | | | | | | | | |
The Atlanta Development Authority Senior Health Care Facilities Revenue, Georgia Proton Treatment Center Project, Series A-1, 7.00%, 1/01/40 | | | 5,000,000 | | | | | | | | 5,135,050 | |
Atlanta Water and Wastewater Revenue, | | | | | | | | | | | | |
Refunding, Series B, AGMC Insured, 5.25%, 11/01/34 | | | 10,600,000 | | | | | | | | 11,201,974 | |
Series A, Pre-Refunded, 6.25%, 11/01/34 | | | 30,000,000 | | | | | | | | 32,301,300 | |
Series B, AGMC Insured, Pre-Refunded, 5.25%, 11/01/34 | | | 19,400,000 | | | | | | | | 20,587,280 | |
b,g Baldwin County Hospital Authority Revenue, Oconee Regional Medical Center, 5.375%, 12/01/28 | | | 1,470,000 | | | | | | | | 15 | |
Forsyth County Hospital Authority Revenue, | | | | | | | | | | | | |
Anticipation Certificates, Georgia Baptist Health Care System Project, ETM, 6.25%, 10/01/18 | | | 780,000 | | | | | | | | 802,246 | |
Anticipation Certificates, Georgia Baptist Health Care System Project, ETM, 6.375%, 10/01/28 | | | 8,000,000 | | | | | | | | 9,860,560 | |
Georgia Municipal Electric Authority Revenue, Plant Vogtle Units 3 and 4 Project J, Series A, 5.50%, 7/01/60 | | | 17,000,000 | | | | | | | | 18,832,940 | |
| | | | | | |
franklintempleton.com | | | | Annual Report | | 85 |
FRANKLIN TAX-FREE TRUST
STATEMENT OF INVESTMENTS
Franklin High Yield Tax-Free Income Fund (continued)
| | | | | | | | | | |
| | | Principal
Amount | | | | | Value | |
Municipal Bonds (continued) | | | | | | | | | | |
Georgia (continued) | | | | | | | | | | |
Main Street Natural Gas Inc. Revenue, | | | | | | | | | | |
Gas Project, Series A, 5.50%, 9/15/25 | | $ | 5,000,000 | | | | | | $ 5,870,600 | |
Gas Project, Series A, 5.50%, 9/15/27 | | | 4,000,000 | | | | | | 4,772,680 | |
Gas Project, Series A, 5.50%, 9/15/28 | | | 10,000,000 | | | | | | 11,993,700 | |
Richmond County Development Authority Environmental Improvement Revenue, International Paper Co. Project, Series A, 6.25%, 11/01/33 | | | 7,000,000 | | | | | | 7,514,150 | |
Savannah EDA Revenue, Recovery Zone Facility, International Paper Co. Project, Series A, 6.25%, 11/01/33 | | | 4,865,000 | | | | | | 5,222,334 | |
| | | | | | | | | | |
| | | |
| | | | | | | | | 134,094,829 | |
| | | | | | | | | | |
Hawaii 0.2% | | | | | | | | | | |
Hawaii State Department of Budget and Finance Special Purpose Revenue, | | | | | | | | | | |
Hawaiian Electric Co. Inc. and Subsidiary Projects, 6.50%, 7/01/39 | | | 7,500,000 | | | | | | 7,924,350 | |
Hawaiian Electric Co. Inc. and Subsidiary Projects, Refunding, Series B, 4.00%, 3/01/37 | | | 5,000,000 | | | | | | 5,021,200 | |
| | | | | | | | | | |
| | | |
| | | | | | | | | 12,945,550 | |
| | | | | | | | | | |
Idaho 0.4% | | | | | | | | | | |
Idaho State Health Facilities Authority Revenue, St. Luke’s Health System Project, Series A, 6.75%, 11/01/37 | | | 12,500,000 | | | | | | 12,887,875 | |
Idaho State Housing and Finance Assn. EDR, TDF Facilities Project, Series A, 7.00%, 2/01/36 | | | 13,305,000 | | | | | | 14,794,628 | |
| | | | | | | | | | |
| | | |
| | | | | | | | | 27,682,503 | |
| | | | | | | | | | |
Illinois 4.9% | | | | | | | | | | |
Bolingbrook GO, Will and DuPage Counties, Capital Appreciation, Refunding, Series A, zero cpn., 1/01/35 | | | 19,800,000 | | | | | | 8,539,344 | |
Bourbonnais Industrial Project Revenue, Olivet Nazarene University Project, Pre-Refunded, 5.50%, 11/01/40 | | | 3,570,000 | | | | | | 3,918,825 | |
Bryant PCR, Central Illinois Light Co. Project, Refunding, NATL Insured, 5.90%, 8/01/23 | | | 5,000 | | | | | | 5,021 | |
Bureau County Township High School District No. 502 GO, School Building, Series A, BAM Insured,
Pre-Refunded, 6.625%, 10/01/43 | | | 5,250,000 | | | | | | 6,513,570 | |
Chicago O’Hare International Airport Revenue, | | | | | | | | | | |
Passenger Facility Charge, Series B, 5.00%, 1/01/35 | | | 12,555,000 | | | | | | 13,179,611 | |
Passenger Facility Charge, Series B, 5.00%, 1/01/40 | | | 20,430,000 | | | | | | 21,423,919 | |
Chicago Transit Authority Sales Tax Receipts Revenue, | | | | | | | | | | |
5.25%, 12/01/36 | | | 11,000,000 | | | | | | 11,947,760 | |
5.00%, 12/01/44 | | | 10,000,000 | | | | | | 10,906,500 | |
Cook County GO, Refunding, Series C, 5.00%, 11/15/29 | | | 34,555,000 | | | | | | 37,374,688 | |
Illinois State Finance Authority Education Revenue, | | | | | | | | | | |
Illinois Charter Schools Project - Noble Network of Charter Schools, Refunding, 5.00%, 9/01/25 | | | 2,750,000 | | | | | | 3,041,693 | |
Illinois Charter Schools Project - Noble Network of Charter Schools, Refunding, 5.00%, 9/01/32 | | | 3,750,000 | | | | | | 4,006,913 | |
h Illinois State Finance Authority MFHR, | | | | | | | | | | |
Better Housing Foundation ERNST Portfolio Project, Series A-1, 5.10%, 12/01/43 | | | 1,600,000 | | | | | | 1,588,080 | |
Better Housing Foundation ERNST Portfolio Project, Series A-1, 5.25%, 12/01/53 | | | 2,600,000 | | | | | | 2,577,380 | |
Illinois State Finance Authority Revenue, | | | | | | | | | | |
Institute of Technology, 6.50%, 2/01/23 | | | 1,000,000 | | | | | | 1,029,820 | |
Institute of Technology, 7.125%, 2/01/34 | | | 1,500,000 | | | | | | 1,530,870 | |
Mercy Health System Corp., Refunding, 5.00%, 12/01/40 | | | 11,980,000 | | | | | | 12,918,513 | |
OSF Healthcare System, Series A, 5.00%, 11/15/45 | | | 20,750,000 | | | | | | 22,470,175 | |
Plymouth Place Inc., Refunding, 5.00%, 5/15/37 | | | 2,500,000 | | | | | | 2,583,775 | |
Plymouth Place Inc., Refunding, 5.25%, 5/15/45 | | | 1,100,000 | | | | | | 1,153,647 | |
Resurrection Health Care, Series A, AGMC Insured, Pre-Refunded, 5.25%, 5/15/29 | | | 14,445,000 | | | | | | 14,563,160 | |
Riverside Health System, Pre-Refunded, 6.25%, 11/15/35 | | | 3,035,000 | | | | | | 3,270,516 | |
Riverside Health System, Refunding, 6.25%, 11/15/35 | | | 1,965,000 | | | | | | 2,091,625 | |
| | | | | | |
86 | | Annual Report | | | | franklintempleton.com |
FRANKLIN TAX-FREE TRUST
STATEMENT OF INVESTMENTS
Franklin High Yield Tax-Free Income Fund (continued)
| | | | | | | | | | |
| | | Principal
Amount | | | | | | Value |
Municipal Bonds (continued) | | | | | | | | | | |
Illinois (continued) | | | | | | | | | | |
Illinois State Finance Authority Revenue, (continued) | | | | | | | | | | |
Roosevelt University Project, Refunding, 6.50%, 4/01/39 | | $ | 15,000,000 | | | | | | | $ 15,775,500 |
Rosalind Franklin University, Refunding, Series A, 5.00%, 8/01/47 | | | 1,525,000 | | | | | | | 1,625,116 |
Rosalind Franklin University Research Building Project, Series C, 5.00%, 8/01/46 | | | 1,900,000 | | | | | | | 2,026,255 |
Rush University Medical Center Obligated Group, Series B, Pre-Refunded, 7.25%, 11/01/38 | | | 10,000,000 | | | | | | | 10,388,400 |
Illinois State Finance Authority Student Housing Revenue, | | | | | | | | | | |
CHF-Cook LLC, Northeastern Illinois University Project, Series A, 5.00%, 7/01/35 | | | 5,335,000 | | | | | | | 5,225,632 |
CHF-Cook LLC, Northeastern Illinois University Project, Series A, 5.00%, 7/01/47 | | | 10,000,000 | | | | | | | 9,455,900 |
CHF-DeKalb II LLC, Northern Illinois University Project, 6.875%, 10/01/43 | | | 15,000,000 | | | | | | | 16,398,600 |
CHF-Normal LLC, Illinois State University Project, Pre-Refunded, 7.00%, 4/01/43 | | | 7,500,000 | | | | | | | 8,651,250 |
Illinois State Finance Authority Water Facility Revenue, | | | | | | | | | | |
American Water Capital Corp. Project, 5.25%, 10/01/39 | | | 15,350,000 | | | | | | | 15,857,164 |
American Water Capital Corp. Project, 5.25%, 5/01/40 | | | 10,415,000 | | | | | | | 10,955,747 |
Metropolitan Pier and Exposition Authority Dedicated State Tax Revenue, | | | | | | | | | | |
McCormick Place Expansion Project, Capital Appreciation, Refunding, Series B-1, AGMC Insured, zero cpn., 6/15/45 | | | 18,100,000 | | | | | | | 5,345,835 |
McCormick Place Expansion Project, Capital Appreciation, Series A, NATL Insured, zero cpn., 6/15/35 | | | 10,000,000 | | | | | | | 4,404,600 |
Metropolitan Pier and Exposition Authority Hospitality Facilities Revenue, McCormick Place Convention Center, ETM, 7.00%, 7/01/26 | | | 7,500,000 | | | | | | | 9,045,300 |
Railsplitter Tobacco Settlement Authority Revenue, Pre-Refunded, 6.00%, 6/01/28 | | | 24,650,000 | | | | | | | 27,900,349 |
United City of Yorkville Special Tax, Kendall County, Special Service Area Nos. 2005-108 and 2005-109, Refunding, AGMC Insured, 4.00%, 3/01/36 | | | 11,000 | | | | | | | 10,792 |
| | | | | | | | | | |
| | | |
| | | | | | | | | | 329,701,845 |
| | | | | | | | | | |
Indiana 0.9% | | | | | | | | | | |
Indiana Finance Authority Midwestern Disaster Relief Revenue, Ohio Valley Electric Corp. Project, Series A, 5.00%, 6/01/32 | | | 10,000,000 | | | | | | | 10,199,900 |
Indiana Finance Authority Revenue, | | | | | | | | | | |
Baptist Homes of Indiana Senior Living, 5.75%, 11/15/41 | | | 5,000,000 | | | | | | | 5,432,500 |
Deaconess Health System Obligated Group, Refunding, Series A, 4.00%, 3/01/37 | | | 5,000,000 | | | | | | | 5,116,850 |
Educational Facilities, Marian University Project, 6.375%, 9/15/41 | | | 12,500,000 | | | | | | | 13,533,875 |
Greencroft Obligated Group, Series A, 7.00%, 11/15/43 | | | 5,000,000 | | | | | | | 5,657,000 |
Private Activity, Ohio River Bridges East End Crossing Project, Series A, 5.00%, 7/01/40 | | | 12,500,000 | | | | | | | 13,422,875 |
Indiana State Municipal Power Agency Revenue, Power Supply System, Series B, Pre-Refunded, 6.00%, 1/01/39 | | | 4,000,000 | | | | | | | 4,153,360 |
Jasper County PCR, Northern Indiana Public Service Co. Project, Refunding, Series C, NATL Insured, 5.85%, 4/01/19 | | | 5,000,000 | | | | | | | 5,202,350 |
| | | | | | | | | | |
| | | |
| | | | | | | | | | 62,718,710 |
| | | | | | | | | | |
Iowa 0.7% | | | | | | | | | | |
Iowa Higher Education Loan Authority Revenue, Private College Facility, Upper Iowa University Project, Pre-Refunded, 6.00%, 9/01/39 | | | 11,000,000 | | | | | | | 12,180,190 |
Tobacco Settlement Authority Tobacco Settlement Revenue, Capital Appreciation, Asset-Backed, Refunding, Series B, 5.60%, 6/01/34 | | | 35,850,000 | | | | | | | 36,219,972 |
| | | | | | | | | | |
| | | |
| | | | | | | | | | 48,400,162 |
| | | | | | | | | | |
Kansas 0.1% | | | | | | | | | | |
Kansas State Development Finance Authority Hospital Revenue, Adventist Health System/Sunbelt Obligated Group, Refunding, Series C, 5.75%, 11/15/38 | | | 6,250,000 | | | | | | | 6,656,563 |
| | | | | | | | | | |
| | | | | | |
franklintempleton.com | | | | Annual Report | | 87 |
FRANKLIN TAX-FREE TRUST
STATEMENT OF INVESTMENTS
Franklin High Yield Tax-Free Income Fund (continued)
| | | | | | | | | | | | |
| | | Principal
Amount | | | | | | Value | |
Municipal Bonds (continued) | | | | | | | | | | | | |
Kentucky 1.3% | | | | | | | | | | | | |
Kentucky Economic Development Finance Authority Revenue, | | | | | | | | | | | | |
Hospital, Owensboro Health Inc., Refunding, Series A, 5.00%, 6/01/45 | | $ | 8,950,000 | | | | | | | $ | 9,472,322 | |
Hospital, Owensboro Medical Health System Inc., Series A, Pre-Refunded, 6.50%, 3/01/45 | | | 18,330,000 | | | | | | | | 20,222,756 | |
Louisville Arena Project, Louisville Arena Authority Inc., Series A, Subseries A-1, Assured Guaranty, Pre-Refunded, 6.00%, 12/01/42 | | | 5,000,000 | | | | | | | | 5,058,550 | |
Kentucky State Public Transportation Infrastructure Authority First Tier Toll Revenue, | | | | | | | | | | | | |
Downtown Crossing Project, Capital Appreciation, zero cpn. to 6/30/23, 6.60% thereafter, 7/01/39 | | | 10,000,000 | | | | | | | | 9,211,500 | |
Downtown Crossing Project, Capital Appreciation, zero cpn. to 6/30/23, 6.75% thereafter, 7/01/43 | | | 5,000,000 | | | | | | | | 4,613,850 | |
Louisville/Jefferson County Metro Government College Revenue, | | | | | | | | | | | | |
Bellarmine University Inc. Project, Improvement, 5.625%, 5/01/29 | | | 430,000 | | | | | | | | 446,602 | |
Bellarmine University Inc. Project, Improvement, Pre-Refunded, 5.625%, 5/01/29 | | | 5,125,000 | | | | | | | | 5,470,118 | |
Bellarmine University Inc. Project, Improvement, Pre-Refunded, 6.125%, 5/01/39 | | | 5,000,000 | | | | | | | | 5,377,650 | |
Ohio County PCR, Big Rivers Electric Corp. Project, Refunding, Series A, 6.00%, 7/15/31 | | | 10,500,000 | | | | | | | | 10,665,585 | |
Owen County Waterworks System Revenue, | | | | | | | | | | | | |
American Water Co. Project, Series A, 6.25%, 6/01/39 | | | 8,000,000 | | | | | | | | 8,441,920 | |
American Water Co. Project, Series A, 5.375%, 6/01/40 | | | 10,000,000 | | | | | | | | 10,698,900 | |
| | | |
| | | | | | | | | | | 89,679,753 | |
Louisiana 1.6% | | | | | | | | | | | | |
Beauregard Parish Revenue, Boise Cascade Corp. Project, Refunding, 6.80%, 2/01/27 | | | 13,990,000 | | | | | | | | 14,035,747 | |
Louisiana Local Government Environmental Facilities and CDA Revenue, | | | | | | | | | | | | |
Westlake Chemical Corp. Projects, Series A, 6.50%, 8/01/29 | | | 9,000,000 | | | | | | | | 9,947,250 | |
Westlake Chemical Corp. Projects, Series A-2, 6.50%, 11/01/35 | | | 8,000,000 | | | | | | | | 8,871,840 | |
Louisiana Public Facilities Authority Hospital Revenue, | | | | | | | | | | | | |
Franciscan Missionaries of Our Lady Health System Project, Series A, Pre-Refunded, 6.75%, 7/01/39 | | | 10,000,000 | | | | | | | | 10,673,600 | |
Lafayette General Health System Project, Refunding, Series A, 5.00%, 11/01/41 | | | 2,000,000 | | | | | | | | 2,163,700 | |
Lafayette General Health System Project, Refunding, Series A, 5.00%, 11/01/45 | | | 7,405,000 | | | | | | | | 7,990,661 | |
Louisiana Public Facilities Authority Revenue, | | | | | | | | | | | | |
Ochsner Clinic Foundation Project, Pre-Refunded, 6.50%, 5/15/37 | | | 5,000,000 | | | | | | | | 5,702,850 | |
Ochsner Clinic Foundation Project, Pre-Refunded, 6.75%, 5/15/41 | | | 15,500,000 | | | | | | | | 17,798,495 | |
Ochsner Clinic Foundation Project, Pre-Refunded, 5.00%, 5/15/47 | | | 60,000 | | | | | | | | 71,354 | |
Ochsner Clinic Foundation Project, Refunding, 5.00%, 5/15/46 | | | 20,000,000 | | | | | | | | 21,718,600 | |
Ochsner Clinic Foundation Project, Refunding, 5.00%, 5/15/47 | | | 3,755,000 | | | | | | | | 4,065,914 | |
St. Tammany Public Trust Financing Authority Revenue, | | | | | | | | | | | | |
Christwood Project, Refunding, 5.25%, 11/15/29 | | | 1,200,000 | | | | | | | | 1,309,452 | |
Christwood Project, Refunding, 5.25%, 11/15/37 | | | 1,650,000 | | | | | | | | 1,762,118 | |
Tobacco Settlement FICO Revenue, Tobacco Settlement, Asset-Backed, Refunding, Series A, 5.25%, 5/15/35 | | | 1,000,000 | | | | | | | | 1,085,000 | |
| | | |
| | | | | | | | | | | 107,196,581 | |
Maine 0.3% | | | | | | | | | | | | |
Maine State Health and Higher Educational Facilities Authority Revenue, | | | | | | | | | | | | |
Maine General Medical Center Issue, 6.75%, 7/01/36 | | | 4,250,000 | | | | | | | | 4,631,522 | |
Maine General Medical Center Issue, 7.00%, 7/01/41 | | | 10,000,000 | | | | | | | | 10,991,500 | |
Rumford PCR, Boise Cascade Corp. Project, Refunding, 6.625%, 7/01/20 | | | 4,800,000 | | | | | | | | 4,799,520 | |
| | | |
| | | | | | | | | | | 20,422,542 | |
Maryland 0.4% | | | | | | | | | | | | |
Baltimore Special Obligation Revenue, | | | | | | | | | | | | |
Harbor Point Project, Refunding, 5.00%, 6/01/36 | | | 1,250,000 | | | | | | | | 1,289,975 | |
Harbor Point Project, Refunding, 5.125%, 6/01/43 | | | 2,500,000 | | | | | | | | 2,587,325 | |
Harford County Special Obligation Tax Allocation, Beachtree Estates Project, 7.50%, 7/01/40 | | | 6,970,000 | | | | | | | | 7,289,226 | |
| | | | | | |
88 | | Annual Report | | | | franklintempleton.com |
FRANKLIN TAX-FREE TRUST
STATEMENT OF INVESTMENTS
Franklin High Yield Tax-Free Income Fund (continued)
| | | | | | | | | | | | |
| | | Principal
Amount | | | | | | Value | |
Municipal Bonds (continued) | | | | | | | | | | | | |
Maryland (continued) | | | | | | | | | | | | |
Maryland State EDC, EDR, Transportation Facilities Project, Series A, Pre-Refunded, 5.75%, 6/01/35 | | $ | 13,070,000 | | | | | | | $ | 14,265,251 | |
Maryland State Health and Higher Educational Facilities Authority Revenue, Anne Arundel Health System Issue, Series A, Pre-Refunded, 6.75%, 7/01/39 | | | 3,000,000 | | | | | | | | 3,197,970 | |
| | | | | | | | | | | | |
| | | |
| | | | | | | | | | | 28,629,747 | |
| | | | | | | | | | | | |
Massachusetts 1.2% | | | | | | | | | | | | |
Massachusetts Bay Transportation Authority Revenue, | | | | | | | | | | | | |
General Transportation System, Series A, 7.00%, 3/01/21 | | | 775,000 | | | | | | | | 845,021 | |
General Transportation System, Series A, 7.00%, 3/01/21 | | | 230,000 | | | | | | | | 230,000 | |
Massachusetts Development Finance Agency Revenue, | | | | | | | | | | | | |
North Hill Communities Issue, Series A, Pre-Refunded, 6.25%, 11/15/28 | | | 2,250,000 | | | | | | | | 2,644,245 | |
North Hill Communities Issue, Series A, Pre-Refunded, 6.25%, 11/15/33 | | | 2,000,000 | | | | | | | | 2,439,000 | |
North Hill Communities Issue, Series A, Pre-Refunded, 6.50%, 11/15/43 | | | 4,125,000 | | | | | | | | 5,073,090 | |
f Massachusetts State Development Finance Agency Solid Waste Disposal Revenue, Mandatory Put, Pre-Refunded, 5.75%, 5/01/19 | | | 3,700,000 | | | | | | | | 3,879,783 | |
Massachusetts State Educational Financing Authority Education Loan Revenue, Issue K, Refunding, 5.25%, 7/01/29 | | | 6,940,000 | | | | | | | | 7,386,450 | |
Massachusetts State Port Authority Special Facilities Revenue, ConRAC Project, Series A, 5.125%, 7/01/41 | | | 10,340,000 | | | | | | | | 11,140,006 | |
Massachusetts State Special Obligation Dedicated Tax Revenue, Refunding, NATL Insured, 5.50%, 1/01/34 | | | 35,000,000 | | | | | | | | 44,649,150 | |
| | | | | | | | | | | | |
| | | |
| | | | | | | | | | | 78,286,745 | |
| | | | | | | | | | | | |
Michigan 4.8% | | | | | | | | | | | | |
Detroit City School District GO, School Building and Site Improvement, Series A, AGMC Insured, 6.00%, 5/01/29 | | | 15,900,000 | | | | | | | | 18,911,460 | |
Detroit Sewage Disposal System Revenue, | | | | | | | | | | | | |
second lien, Series B, NATL Insured, 5.50%, 7/01/29 | | | 5,000,000 | | | | | | | | 5,821,500 | |
second lien, Series B, NATL Insured, 5.00%, 7/01/36 | | | 15,000 | | | | | | | | 15,038 | |
Detroit Water and Sewerage Department Sewage Disposal System Revenue, senior lien, Refunding, Series A, 5.25%, 7/01/39 | | | 12,000,000 | | | | | | | | 12,986,880 | |
Ecorse City GO, Financial Recovery, Dedicated Tax, 6.50%, 11/01/35 | | | 5,215,000 | | | | | | | | 5,930,967 | |
Grand Rapids EDC, | | | | | | | | | | | | |
EDR, Beacon Hill at Eastgate Project, Refunding, Series A, 5.00%, 11/01/37 | | | 600,000 | | | | | | | | 630,954 | |
EDR, Beacon Hill at Eastgate Project, Refunding, Series A, 5.00%, 11/01/47 | | | 1,390,000 | | | | | | | | 1,449,436 | |
EDR, Beacon Hill at Eastgate Project, Refunding, Series A, 5.00%, 11/01/52 | | | 1,185,000 | | | | | | | | 1,230,942 | |
Michigan Finance Authority Revenue, | | | | | | | | | | | | |
Higher Education, Limited Obligation, Thomas M. Cooley Law School Project, Refunding, 6.00%, 7/01/24 | | | 3,000,000 | | | | | | | | 3,153,750 | |
Higher Education, Limited Obligation, Thomas M. Cooley Law School Project, Refunding, 6.75%, 7/01/44 | | | 5,505,000 | | | | | | | | 5,515,515 | |
Hospital, Henry Ford Health System, Refunding, 5.00%, 11/15/41 | | | 5,050,000 | | | | | | | | 5,562,070 | |
Hospital, Trinity Health Credit Group, Refunding, Series MI, 5.00%, 12/01/39 | | | 27,525,000 | | | | | | | | 29,940,043 | |
Hospital, Trinity Health Credit Group, Series MI, Pre-Refunded, 5.00%, 12/01/39 | | | 75,000 | | | | | | | | 83,513 | |
Local Government Loan Program, Public Lighting Authority, Local Project, Refunding, Series B, 5.00%, 7/01/39 | | | 7,600,000 | | | | | | | | 8,192,724 | |
Local Government Loan Program, Public Lighting Authority, Local Project, Refunding, Series B, 5.00%, 7/01/44 | | | 10,000,000 | | | | | | | | 10,727,200 | |
Local Government Loan Program, senior lien, Refunding, Series C-1, 5.00%, 7/01/44 | | | 10,000,000 | | | | | | | | 10,861,200 | |
Local Government Loan Program, senior lien, Refunding, Series C-3, AGMC Insured, 5.00%, 7/01/32 | | | 10,000,000 | | | | | | | | 11,163,300 | |
| | | | | | |
franklintempleton.com | | | | Annual Report | | 89 |
FRANKLIN TAX-FREE TRUST
STATEMENT OF INVESTMENTS
Franklin High Yield Tax-Free Income Fund (continued)
| | | | | | | | | | | | |
| | | Principal
Amount | | | | | | Value | |
Municipal Bonds (continued) | | | | | | | | | | | | |
Michigan (continued) | | | | | | | | | | | | |
Michigan Finance Authority Revenue, (continued) | | | | | | | | | | | | |
Local Government Loan Program, senior lien, Refunding, Series C-3, AGMC Insured, 5.00%, 7/01/33 | | $ | 3,000,000 | | | | | | | $ | 3,338,010 | |
Local Government Loan Program, senior lien, Refunding, Series D-1, AGMC Insured, 5.00%, 7/01/37 | | | 5,000,000 | | | | | | | | 5,523,900 | |
Local Government Loan Program, senior lien, Refunding, Series D-4, 5.00%, 7/01/29 | | | 11,000,000 | | | | | | | | 12,232,660 | |
Local Government Loan Program, senior lien, Refunding, Series D-4, 5.00%, 7/01/30 | | | 9,000,000 | | | | | | | | 9,992,070 | |
Local Government Loan Program, senior lien, Refunding, Series D-4, 5.00%, 7/01/34 | | | 10,000,000 | | | | | | | | 10,975,600 | |
Local Government Loan Program, senior lien, Series C-6, 5.00%, 7/01/33 | | | 10,000,000 | | | | | | | | 11,005,600 | |
Michigan Hospital Finance Authority Revenue, | | | | | | | | | | | | |
MidMichigan Obligated Group, Series A, Pre-Refunded, 6.125%, 6/01/34 | | | 4,065,000 | | | | | | | | 4,299,998 | |
Trinity Health Credit Group, Refunding, Series C, 5.00%, 12/01/34 | | | 26,810,000 | | | | | | | | 29,493,949 | |
Trinity Health Credit Group, Series C, Pre-Refunded, 5.00%, 12/01/34 | | | 2,050,000 | | | | | | | | 2,302,724 | |
Michigan State Building Authority Revenue, | | | | | | | | | | | | |
Facilities Program, Refunding, Series I, 6.00%, 10/15/38 | | | 175,000 | | | | | | | | 179,834 | |
Facilities Program, Refunding, Series II-A, 5.375%, 10/15/41 | | | 10,000,000 | | | | | | | | 11,105,900 | |
Facilities Program, Series I, Pre-Refunded, 6.00%, 10/15/38 | | | 5,825,000 | | | | | | | | 5,989,556 | |
Michigan Tobacco Settlement Finance Authority Revenue, | | | | | | | | | | | | |
First Subordinate, Capital Appreciation, Series B, zero cpn., 6/01/52. | | | 150,000,000 | | | | | | | | 9,823,500 | |
Tobacco Settlement Asset-Backed, Senior, Series A, 6.00%, 6/01/34 | | | 2,500,000 | | | | | | | | 2,493,750 | |
Tobacco Settlement Asset-Backed, Senior, Series A, 6.00%, 6/01/48 | | | 5,000,000 | | | | | | | | 4,987,500 | |
Royal Oak Hospital Finance Authority Hospital Revenue, | | | | | | | | | | | | |
William Beaumont Hospital Obligated Group, Refunding, Series D, 5.00%, 9/01/39 | | | 10,320,000 | | | | | | | | 11,193,485 | |
William Beaumont Hospital Obligated Group, Series V, Pre-Refunded, 8.25%, 9/01/39 | | | 20,000,000 | | | | | | | | 20,683,600 | |
William Beaumont Hospital Obligated Group, Series W, Pre-Refunded, 6.00%, 8/01/39 | | | 33,120,000 | | | | | | | | 35,115,149 | |
| | | | | | | | | | | | |
| | | |
| | | | | | | | | | | 322,913,277 | |
| | | | | | | | | | | | |
Minnesota 0.3% | | | | | | | | | | | | |
Minneapolis Health Care System Revenue, | | | | | | | | | | | | |
Fairview Health Services, Series A, Pre-Refunded, 6.625%, 11/15/28 | | | 11,000,000 | | | | | | | | 11,400,290 | |
Fairview Health Services, Series A, Pre-Refunded, 6.75%, 11/15/32 | | | 6,250,000 | | | | | | | | 6,482,875 | |
Minneapolis Senior Housing and Healthcare Revenue, | | | | | | | | | | | | |
Ecumen - Abiitan Mill City Project, 5.25%, 11/01/45 | | | 2,800,000 | | | | | | | | 2,891,728 | |
Ecumen - Abiitan Mill City Project, 5.375%, 11/01/50 | | | 1,000,000 | | | | | | | | 1,001,240 | |
| | | | | | | | | | | | |
| | | |
| | | | | | | | | | | 21,776,133 | |
| | | | | | | | | | | | |
Mississippi 1.3% | | | | | | | | | | | | |
Lowndes County Solid Waste Disposal and PCR, Weyerhaeuser Co. Project, Refunding, Series B, 6.70%, 4/01/22 | | | 18,875,000 | | | | | | | | 21,655,099 | |
Mississippi Hospital Equipment and Facilities Authority Revenue, Baptist Memorial Health Care, Series A, 5.00%, 9/01/41 | | | 47,000,000 | | | | | | | | 50,009,410 | |
Warren County Gulf Opportunity Zone Revenue, | | | | | | | | | | | | |
International Paper Co. Project, Series A, 6.50%, 9/01/32 | | | 10,000,000 | | | | | | | | 10,249,300 | |
International Paper Co. Project, Series A, 5.80%, 5/01/34 | | | 7,000,000 | | | | | | | | 7,591,430 | |
| | | | | | | | | | | | |
| | | |
| | | | | | | | | | | 89,505,239 | |
| | | | | | | | | | | | |
Missouri 0.7% | | | | | | | | | | | | |
Cape Girardeau County IDA Health Facilities Revenue, Southeast Health, Refunding, Series A, 6.00%, 3/01/33 | | | 5,350,000 | | | | | | | | 6,095,950 | |
Kirkwood IDA Retirement Community Revenue, | | | | | | | | | | | | |
Aberdeen Heights, Refunding, Series A, 5.25%, 5/15/42 | | | 1,000,000 | | | | | | | | 1,060,580 | |
Aberdeen Heights, Refunding, Series A, 5.25%, 5/15/50 | | | 3,500,000 | | | | | | | | 3,690,365 | |
| | | | | | |
90 | | Annual Report | | | | franklintempleton.com |
FRANKLIN TAX-FREE TRUST
STATEMENT OF INVESTMENTS
Franklin High Yield Tax-Free Income Fund (continued)
| | | | | | | | | | | | |
| | | Principal
Amount | | | | | | Value | |
Municipal Bonds (continued) | | | | | | | | | | | | |
Missouri (continued) | | | | | | | | | | | | |
Missouri State Joint Municipal Electric Utility Commission Power Project Revenue, Iatan 2 Project, Series A, Pre-Refunded, 6.00%, 1/01/39 | | $ | 11,000,000 | | | | | | | $ | 11,421,740 | |
St. Louis Airport Revenue, | | | | | | | | | | | | |
Lambert-St. Louis International Airport, Series A-1, 6.25%, 7/01/29 | | | 7,000,000 | | | | | | | | 7,413,210 | |
Lambert-St. Louis International Airport, Series A-1, 6.625%, 7/01/34 | | | 3,000,000 | | | | | | | | 3,188,130 | |
St. Louis County IDA Senior Living Facilities Revenue, Friendship Village Chesterfield, Pre-Refunded, 5.00%, 9/01/42 | | | 7,000,000 | | | | | | | | 7,905,310 | |
Stoddard County IDA Health Facilities Revenue, Southeast Health, Refunding, Series B, 6.00%, 3/01/37 | | | 4,220,000 | | | | | | | | 4,779,108 | |
| | | | | | | | | | | | |
| | | |
| | | | | | | | | | | 45,554,393 | |
| | | | | | | | | | | | |
Nebraska 0.1% | | | | | | | | | | | | |
Douglas County Hospital Authority No. 3 Revenue, Health Facilities Methodist Health System, Refunding, 5.00%, 11/01/45 | | | 6,750,000 | | | | | | | | 7,358,782 | |
| | | | | | | | | | | | |
Nevada 0.7% | | | | | | | | | | | | |
Clark County ID Special Assessment, | | | | | | | | | | | | |
Local ID No. 128, The Summerlin Centre, Series A, 5.00%, 2/01/26 | | | 1,295,000 | | | | | | | | 1,304,026 | |
Local ID No. 128, The Summerlin Centre, Series A, 5.05%, 2/01/31 | | | 1,010,000 | | | | | | | | 1,016,121 | |
Local ID No. 142, Mountain’s Edge, Refunding, 5.00%, 8/01/21 | | | 1,245,000 | | | | | | | | 1,328,116 | |
Local ID No. 159, Summerlin Village 16A, 5.00%, 8/01/35 | | | 2,470,000 | | | | | | | | 2,558,055 | |
Director of the State of Nevada Department of Business and Industry Environmental Improvement Revenue, | | | | | | | | | | | | |
Green Fulcrum Sierra Biofuels LLC Project, 5.875%, 12/15/27 | | | 7,885,000 | | | | | | | | 8,468,253 | |
Green Fulcrum Sierra Biofuels LLC Project, 6.25%, 12/15/37 | | | 9,000,000 | | | | | | | | 9,796,050 | |
Henderson Local ID Special Assessment, | | | | | | | | | | | | |
No. T-16, Limited Obligation Improvement, The Falls at Lake Las Vegas, 5.00%, 3/01/18 | | | 740,000 | | | | | | | | 740,000 | |
No. T-16, Limited Obligation Improvement, The Falls at Lake Las Vegas, 5.00%, 3/01/19 | | | 740,000 | | | | | | | | 735,575 | |
No. T-16, Limited Obligation Improvement, The Falls at Lake Las Vegas, 5.10%, 3/01/22 | | | 1,120,000 | | | | | | | | 1,092,963 | |
No. T-16, Limited Obligation Improvement, The Falls at Lake Las Vegas, 5.125%, 3/01/25 | | | 1,175,000 | | | | | | | | 1,125,180 | |
No. T-18, Limited Obligation Improvement, Inspirada, Discount Term, Refunding, 4.00%, 9/01/32 | | | 1,750,000 | | | | | | | | 1,732,903 | |
No. T-18, Limited Obligation Improvement, Inspirada, Discount Term, Refunding, 4.00%, 9/01/35 | | | 2,500,000 | | | | | | | | 2,429,425 | |
Las Vegas Special ID No. 812 Special Assessment, | | | | | | | | | | | | |
Local Improvement, Summerlin Village 24, 5.00%, 12/01/27 | | | 1,495,000 | | | | | | | | 1,584,461 | |
Local Improvement, Summerlin Village 24, 5.00%, 12/01/30 | | | 1,730,000 | | | | | | | | 1,803,179 | |
Local Improvement, Summerlin Village 24, 5.00%, 12/01/35 | | | 1,100,000 | | | | | | | | 1,122,572 | |
Las Vegas Special ID No. 813 Special Assessment, Local Improvement, Summerlin Village 26, 4.00%, 6/01/33 | | | 635,000 | | | | | | | | 613,823 | |
Overton Power District No. 5 Special Obligation Revenue, Pre-Refunded, 8.00%, 12/01/38 | | | 7,500,000 | | | | | | | | 7,862,325 | |
| | | | | | | | | | | | |
| | | |
| | | | | | | | | | | 45,313,027 | |
| | | | | | | | | | | | |
New Hampshire 0.1% | | | | | | | | | | | | |
New Hampshire State Business Finance Authority Revenue, Elliot Hospital Obligated Group, Series A, Pre-Refunded, 6.125%, 10/01/39. | | | 5,000,000 | | | | | | | | 5,351,650 | |
| | | | | | | | | | | | |
New Jersey 3.6% | | | | | | | | | | | | |
Hudson County Improvement Authority Solid Waste System Revenue, Refunding, Series A, 5.75%, 1/01/40 | | | 5,000,000 | | | | | | | | 5,352,050 | |
New Jersey EDA Revenue, | | | | | | | | | | | | |
Montclair State University Student Housing Project, Provident Group, Montclair Properties LLC, Series A, Pre-Refunded, 5.875%, 6/01/42 | | | 5,000,000 | | | | | | | | 5,471,000 | |
Provident Group-Rowan Properties LLC, Rowan University Student Housing Project, Series A, 5.00%, 1/01/48 | | | 5,000,000 | | | | | | | | 5,280,700 | |
School Facilities Construction, Series AAA, 5.00%, 6/15/35 | | | 3,450,000 | | | | | | | | 3,690,086 | |
| | | | | | |
franklintempleton.com | | | | Annual Report | | 91 |
FRANKLIN TAX-FREE TRUST
STATEMENT OF INVESTMENTS
Franklin High Yield Tax-Free Income Fund (continued)
| | | | | | | | | | | | |
| | | Principal
Amount | | | | | | Value | |
Municipal Bonds (continued) | | | | | | | | | | | | |
New Jersey (continued) | | | | | | | | | | | | |
New Jersey EDA Revenue, (continued) | | | | | | | | | | | | |
School Facilities Construction, Series AAA, 5.00%, 6/15/41 | | $ | 4,550,000 | | | | | | | $ | 4,767,126 | |
New Jersey EDA Special Facility Revenue, | | | | | | | | | | | | |
Continental Airlines Inc. Project, 4.875%, 9/15/19 | | | 7,465,000 | | | | | | | | 7,673,199 | |
Continental Airlines Inc. Project, 5.125%, 9/15/23 | | | 19,800,000 | | | | | | | | 21,868,308 | |
Continental Airlines Inc. Project, 5.25%, 9/15/29 | | | 41,900,000 | | | | | | | | 45,738,459 | |
New Jersey Health Care Facilities Financing Authority Revenue, | | | | | | | | | | | | |
St. Joseph’s Healthcare System Obligated Group Issue, Pre-Refunded, 6.625%, 7/01/38 | | | 27,015,000 | | | | | | | | 27,482,630 | |
University Hospital Issue, Refunding, Series A, 5.00%, 7/01/46 | | | 5,750,000 | | | | | | | | 6,307,060 | |
New Jersey State Transportation Trust Fund Authority Revenue, | | | | | | | | | | | | |
Transportation Program, Series AA, 5.00%, 6/15/38 | | | 4,810,000 | | | | | | | | 5,020,341 | |
Transportation Program, Series AA, 5.25%, 6/15/41 | | | 2,500,000 | | | | | | | | 2,656,700 | |
Transportation Program, Series AA, 5.00%, 6/15/44 | | | 9,335,000 | | | | | | | | 9,644,269 | |
Transportation System, Capital Appreciation, Series A, zero cpn., 12/15/38 | | | 46,750,000 | | | | | | | | 17,125,927 | |
Transportation System, Series A, 6.00%, 12/15/38 | | | 35,705,000 | | | | | | | | 36,763,653 | |
Transportation System, Series A, Pre-Refunded, 6.00%, 12/15/38 | | | 19,295,000 | | | | | | | | 19,995,408 | |
Transportation System, Series B, 5.25%, 6/15/36 | | | 17,500,000 | | | | | | | | 18,419,625 | |
| | | | | | | | | | | | |
| | | |
| | | | | | | | | | | 243,256,541 | |
| | | | | | | | | | | | |
New Mexico 2.2% | | | | | | | | | | | | |
Farmington PCR, | | | | | | | | | | | | |
Public Service Co. of New Mexico, San Juan Project, Refunding, Series B, 5.90%, 6/01/40 | | | 58,000,000 | | | | | | | | 62,359,860 | |
Public Service Co. of New Mexico, San Juan Project, Refunding, Series C, 5.90%, 6/01/40 | | | 18,435,000 | | | | | | | | 19,820,759 | |
Public Service Co. of New Mexico, San Juan Project, Refunding, Series D, 5.90%, 6/01/40 | | | 53,520,000 | | | | | | | | 57,543,098 | |
New Mexico State Hospital Equipment Loan Council First Mortgage Revenue, Haverland Carter Lifestyle Group, 5.00%, 7/01/42 | | | 5,000,000 | | | | | | | | 5,214,900 | |
| | | |
| | | | | | | | | | | 144,938,617 | |
New York 4.8% | | | | | | | | | | | | |
Long Island Power Authority Electric System Revenue, General, Series A, Pre-Refunded, 6.00%, 5/01/33 | | | 12,500,000 | | | | | | | | 13,137,375 | |
MAC for City of Troy Revenue, | | | | | | | | | | | | |
Capital Appreciation, Series C, NATL Insured, zero cpn., 7/15/21 | | | 428,010 | | | | | | | | 399,449 | |
Capital Appreciation, Series C, NATL Insured, zero cpn., 1/15/22 | | | 649,658 | | | | | | | | 596,691 | |
MTA Revenue, | | | | | | | | | | | | |
Transportation, Refunding, Series D, 5.00%, 11/15/38 | | | 8,790,000 | | | | | | | | 9,846,646 | |
Transportation, Series A, Pre-Refunded, 5.00%, 11/15/41 | | | 15,500,000 | | | | | | | | 17,321,715 | |
Transportation, Series D, Pre-Refunded, 5.25%, 11/15/40 | | | 10,000,000 | | | | | | | | 10,972,600 | |
Transportation, Series E, 5.00%, 11/15/33 | | | 10,000,000 | | | | | | | | 11,258,400 | |
New York City GO, | | | | | | | | | | | | |
Refunding, Series H, 6.125%, 8/01/25 | | | 5,000 | | | | | | | | 5,020 | |
Series F, 7.50%, 2/01/21 | | | 5,000 | | | | | | | | 5,026 | |
Series G, 7.50%, 2/01/22 | | | 5,000 | | | | | | | | 5,026 | |
New York City HDC, MFMR, 8 Spruce Street, Class F, 4.50%, 2/15/48 | | | 7,500,000 | | | | | | | | 7,743,375 | |
New York City IDA, | | | | | | | | | | | | |
IDR, Brooklyn Navy Yard Cogeneration Partners, 5.65%, 10/01/28 | | | 14,130,000 | | | | | | | | 14,102,305 | |
IDR, Brooklyn Navy Yard Cogeneration Partners, 5.75%, 10/01/36 | | | 18,205,000 | | | | | | | | 18,080,842 | |
New York City IDA Civic Facility Revenue, Amboy Properties Corp. Project, Refunding, 6.75%, 6/01/20 . | | | 2,760,000 | | | | | | | | 2,759,945 | |
New York Liberty Development Corp. 3 World Trade Center Project, Class 2, Refunding, 5.375%, 11/15/40 | | | 10,000,000 | | | | | | | | 10,942,200 | |
New York Liberty Development Corp. Liberty Revenue, Second Priority, Bank of America Tower at One Bryant Park Project, Class 3, Refunding, 6.375%, 7/15/49 | | | 18,500,000 | | | | | | | | 19,786,675 | |
| | | | | | |
92 | | Annual Report | | | | franklintempleton.com |
FRANKLIN TAX-FREE TRUST
STATEMENT OF INVESTMENTS
Franklin High Yield Tax-Free Income Fund (continued)
| | | | | | | | | | | | |
| | | Principal
Amount | | | | | | Value | |
Municipal Bonds (continued) | | | | | | | | | | | | |
New York (continued) | | | | | | | | | | | | |
New York Liberty Development Corp. Revenue, Goldman Sachs Headquarters Issue, Second Tranche, 5.25%, 10/01/35 | | $ | 65,000,000 | | | | | | | $ | 80,032,550 | |
New York State Dormitory Authority Revenues, | | | | | | | | | | | | |
Non-State Supported Debt, Orange Regional Medical Center, Pre-Refunded, 6.125%, 12/01/29 | | | 16,000,000 | | | | | | | | 16,549,760 | |
Non-State Supported Debt, Orange Regional Medical Center, Pre-Refunded, 6.25%, 12/01/37 | | | 30,000,000 | | | | | | | | 31,058,700 | |
New York Transportation Development Corp. Special Facilities Revenue, Laguardia Airport Terminal B Redevelopment Project, Series A, 5.25%, 1/01/50 | | | 41,785,000 | | | | | | | | 45,777,975 | |
Rockland Tobacco Asset Securitization Corp. Settlement Revenue, Asset-Backed, First Subordinate, Series A, zero cpn., 8/15/45 | | | 61,000,000 | | | | | | | | 9,448,900 | |
TSASC Inc. Revenue, Tobacco Settlement, Refunding, Senior Series A, 5.00%, 6/01/41 | | | 4,000,000 | | | | | | | | 4,410,480 | |
| | | |
| | | | | | | | | | | 324,241,655 | |
North Carolina 0.7% | | | | | | | | | | | | |
Columbus County Industrial Facilities and PCFA Revenue, | | | | | | | | | | | | |
Environmental Improvement, International Paper Co. Projects, Series A, 6.25%, 11/01/33 | | | 1,300,000 | | | | | | | | 1,395,485 | |
Recovery Zone Facility, International Paper Co. Projects, Series B, 6.25%, 11/01/33 | | | 4,000,000 | | | | | | | | 4,293,800 | |
North Carolina State Department of Transportation Private Activity Revenue, I-77 Hot Lanes Project, 5.00%, 12/31/37 | | | 3,100,000 | | | | | | | | 3,364,740 | |
North Carolina State Medical Care Commission Health Care Facilities Revenue, | | | | | | | | | | | | |
Duke University Health System, Series A, 5.00%, 6/01/42 | | | 15,000,000 | | | | | | | | 16,343,550 | |
Pennybyrn at Maryfield, first mortgage, Refunding, 5.00%, 10/01/30 | | | 2,790,000 | | | | | | | | 2,994,981 | |
Pennybyrn at Maryfield, first mortgage, Refunding, 5.00%, 10/01/35 | | | 1,000,000 | | | | | | | | 1,058,510 | |
Vidant Health, Refunding, 5.00%, 6/01/45 | | | 5,000,000 | | | | | | | | 5,503,050 | |
North Carolina State Medical Care Commission Retirement Facilities Revenue, | | | | | | | | | | | | |
Galloway Ridge Project, first mortgage, Refunding, Series A, 5.25%, 1/01/41 | | | 2,720,000 | | | | | | | | 2,829,072 | |
United Church Homes and Services, first mortgage, Refunding, Series A, 5.00%, 9/01/37 | | | 2,100,000 | | | | | | | | 2,242,632 | |
United Church Homes and Services, first mortgage, Refunding, Series C, 5.00%, 9/01/41 | | | 2,120,000 | | | | | | | | 2,220,085 | |
United Church Homes and Services, first mortgage, Refunding, Series C, 5.00%, 9/01/46 | | | 3,160,000 | | | | | | | | 3,297,776 | |
| | | |
| | | | | | | | | | | 45,543,681 | |
North Dakota 0.1% | | | | | | | | | | | | |
Burleigh County Education Facilities Revenue, | | | | | | | | | | | | |
University of Mary Project, 5.10%, 4/15/36 | | | 2,800,000 | | | | | | | | 2,809,072 | |
University of Mary Project, 5.20%, 4/15/46 | | | 5,430,000 | | | | | | | | 5,388,243 | |
| | | |
| | | | | | | | | | | 8,197,315 | |
Ohio 2.1% | | | | | | | | | | | | |
Bowling Green Student Housing Revenue, CFP I LLC, State University Project, Pre-Refunded, 6.00%, 6/01/45 | | | 12,500,000 | | | | | | | | 13,697,250 | |
Butler County Hospital Facilities Revenue, | | | | | | | | | | | | |
UC Health, Pre-Refunded, 5.50%, 11/01/40 | | | 6,680,000 | | | | | | | | 7,341,921 | |
UC Health, Pre-Refunded, 5.50%, 11/01/40 | | | 3,320,000 | | | | | | | | 3,653,527 | |
Centerville Health Care Revenue, | | | | | | | | | | | | |
Graceworks Lutheran Services, Improvement and Refunding, 5.25%, 11/01/47 | | | 2,700,000 | | | | | | | | 2,841,966 | |
Graceworks Lutheran Services, Improvement and Refunding, 5.25%, 11/01/50 | | | 2,500,000 | | | | | | | | 2,621,500 | |
Fairfield County Hospital Revenue, Fairfield Medical Center Project, Refunding and Improvement, 5.00%, 6/15/43 | | | 10,000,000 | | | | | | | | 10,303,400 | |
Hamilton County Healthcare Revenue, | | | | | | | | | | | | |
Life Enriching Communities Project, Series A, Pre-Refunded, 6.50%, 1/01/41 | | | 4,970,000 | | | | | | | | 5,601,389 | |
Life Enriching Communities Project, Series A, Pre-Refunded, 6.625%, 1/01/46 | | | 2,500,000 | | | | | | | | 2,826,175 | |
Lake County Hospital Facilities Revenue, Lake Hospital System Inc., Refunding, 5.00%, 8/15/45 | | | 6,000,000 | | | | | | | | 6,472,260 | |
| | | | | | |
franklintempleton.com | | | | Annual Report | | 93 |
FRANKLIN TAX-FREE TRUST
STATEMENT OF INVESTMENTS
Franklin High Yield Tax-Free Income Fund (continued)
| | | | | | | | | | | | |
| | | Principal
Amount | | | | | | Value | |
Municipal Bonds (continued) | | | | | | | | | | | | |
Ohio (continued) | | | | | | | | | | | | |
Little Miami Local School District GO, | | | | | | | | | | | | |
School Improvement, Pre-Refunded, 6.875%, 12/01/34 | | $ | 5,100,000 | | | | | | | $ | 5,810,175 | |
School Improvement, Refunding, 6.875%, 12/01/34 | | | 470,000 | | | | | | | | 525,150 | |
Ohio State Air Quality Development Authority Exempt Facilities Revenue, Pratt Paper LLC Project, 4.25%, 1/15/38 | | | 3,000,000 | | | | | | | | 3,028,800 | |
Ohio State Air Quality Development Authority Revenue, Environmental Improvement, Buckeye Power Inc. Project, 6.00%, 12/01/40 | | | 15,000,000 | | | | | | | | 16,621,050 | |
Ohio State Hospital Revenue, University Hospitals Health System Inc., Refunding, Series A, 5.00%, 1/15/46 | | | 6,000,000 | | | | | | | | 6,536,640 | |
Ohio State Turnpike and Infrastructure Commission Revenue, Infrastructure Projects, Capital Appreciation, junior lien, Series A-3, zero cpn. to 2/14/23, 5.75% thereafter, 2/15/35 | | | 35,000,000 | | | | | | | | 33,374,950 | |
Southeastern Port Authority Hospital Facilities Revenue, | | | | | | | | | | | | |
Memorial Health System Obligated Group Project, Refunding, 5.00%, 12/01/35 | | | 1,000,000 | | | | | | | | 1,043,510 | |
Memorial Health System Obligated Group Project, Refunding, 5.00%, 12/01/43 | | | 1,000,000 | | | | | | | | 1,029,910 | |
Memorial Health System Obligated Group Project, Refunding, 5.50%, 12/01/43 | | | 1,300,000 | | | | | | | | 1,389,648 | |
Memorial Health System Obligated Group Project, Refunding and Improvement, 6.00%, 12/01/42 . | | | 14,000,000 | | | | | | | | 15,135,680 | |
| | | | | | | | | | | | |
| | | |
| | | | | | | | | | | 139,854,901 | |
| | | | | | | | | | | | |
Oklahoma 0.3% | | | | | | | | | | | | |
Oklahoma Development Finance Authority Revenue, Provident Education Resources Inc. Cross Village Student Housing Project, Series A, 5.00%, 8/01/47 | | | 10,000,000 | | | | | | | | 10,672,500 | |
Tulsa County Industrial Authority Senior Living Community Revenue, | | | | | | | | | | | | |
Montereau Inc. Project, Refunding, 5.25%, 11/15/37 | | | 1,250,000 | | | | | | | | 1,419,288 | |
Montereau Inc. Project, Refunding, 5.25%, 11/15/45 | | | 5,250,000 | | | | | | | | 5,926,672 | |
| | | | | | | | | | | | |
| | | |
| | | | | | | | | | | 18,018,460 | |
| | | | | | | | | | | | |
Oregon 0.4% | | | | | | | | | | | | |
Multnomah County Hospital Facilities Authority Revenue, | | | | | | | | | | | | |
Mirabella South Waterfront Project, Refunding, Series A, 5.40%, 10/01/44 | | | 3,000,000 | | | | | | | | 3,206,790 | |
Mirabella South Waterfront Project, Refunding, Series A, 5.50%, 10/01/49 | | | 5,500,000 | | | | | | | | 5,894,130 | |
Oregon Health and Science University Revenue, Series A, Pre-Refunded, 5.75%, 7/01/39 | | | 5,000,000 | | | | | | | | 5,278,100 | |
Salem Hospital Facility Authority Revenue, | | | | | | | | | | | | |
Capital Manor Inc., Refunding, 5.00%, 5/15/22 | | | 1,000,000 | | | | | | | | 1,086,200 | |
Capital Manor Inc., Refunding, 5.75%, 5/15/27 | | | 1,000,000 | | | | | | | | 1,098,240 | |
Capital Manor Inc., Refunding, 5.625%, 5/15/32 | | | 1,000,000 | | | | | | | | 1,079,080 | |
Capital Manor Inc., Refunding, 6.00%, 5/15/42 | | | 3,100,000 | | | | | | | | 3,362,415 | |
Capital Manor Inc., Refunding, 6.00%, 5/15/47 | | | 2,000,000 | | | | | | | | 2,165,260 | |
Yamhill County Hospital Authority, Friendsview Retirement Community, Refunding, Series A, 5.00%, 11/15/51 | | | 3,045,000 | | | | | | | | 3,220,849 | |
| | | | | | | | | | | | |
| | | |
| | | | | | | | | | | 26,391,064 | |
| | | | | | | | | | | | |
Pennsylvania 2.3% | | | | | | | | | | | | |
Allegheny County Higher Education Building Authority University Revenue, | | | | | | | | | | | | |
Carlow University Project, Refunding, 6.75%, 11/01/31 | | | 1,215,000 | | | | | | | | 1,334,690 | |
Carlow University Project, Refunding, 7.00%, 11/01/40 | | | 2,000,000 | | | | | | | | 2,203,880 | |
Chester County IDA Revenue, | | | | | | | | | | | | |
Renaissance Academy Charter School Project, 5.00%, 10/01/34 | | | 1,500,000 | | | | | | | | 1,594,005 | |
Renaissance Academy Charter School Project, 5.00%, 10/01/39 | | | 1,725,000 | | | | | | | | 1,816,735 | |
Renaissance Academy Charter School Project, 5.00%, 10/01/44 | | | 1,160,000 | | | | | | | | 1,212,838 | |
Commonwealth Financing Authority Revenue, Series B, 5.00%, 6/01/42 | | | 12,000,000 | | | | | | | | 12,939,960 | |
Delaware County IDAR, Resource Recovery Facility, Refunding, Series A, 6.20%, 7/01/19 | | | 3,720,000 | | | | | | | | 3,729,970 | |
| | | | | | |
94 | | Annual Report | | | | franklintempleton.com |
FRANKLIN TAX-FREE TRUST
STATEMENT OF INVESTMENTS
Franklin High Yield Tax-Free Income Fund (continued)
| | | | | | | | | | |
| | | Principal
Amount | | | | | | Value |
Municipal Bonds (continued) | | | | | | | | | | |
Pennsylvania (continued) | | | | | | | | | | |
Lancaster County Hospital Authority Revenue, | | | | | | | | | | |
Brethren Village Project, Refunding, 5.125%, 7/01/37 | | $ | 1,000,000 | | | | | | | $1,090,900 |
Brethren Village Project, Refunding, 5.25%, 7/01/41 | | | 1,000,000 | | | | | | | 1,096,490 |
Northampton County General Purpose Authority Hospital Revenue, St. Luke’s Hospital Project, Series A, Pre-Refunded, 5.50%, 8/15/40 | | | 15,000,000 | | | | | | | 15,273,000 |
f Pennsylvania State Economic Development Financing Authority Exempt Facilities Revenue, PPL Energy Supply LLC Project, Series B, Mandatory Put, 5.00%, 9/01/20 | | | 25,000,000 | | | | | | | 25,169,000 |
Pennsylvania State Turnpike Commission Turnpike Revenue, | | | | | | | | | | |
Motor License Fund Enhanced Turnpike, Capital Appreciation, Subordinate Special, Series B, Sub Series B-2, zero cpn. to 11/30/28, 5.75% thereafter, 12/01/37 | | | 20,000,000 | | | | | | | 14,569,800 |
Motor License Fund Enhanced Turnpike, Capital Appreciation, Subordinate Special, Series B, Sub Series B-2, zero cpn. to 12/01/28, 5.875% thereafter, 12/01/40 | | | 25,075,000 | | | | | | | 18,212,223 |
Subordinate, Convertible Capital Appreciation, Series C, AGMC Insured, 6.25%, 6/01/33 | | | 5,000,000 | | | | | | | 6,154,550 |
Subordinate, Series B, Pre-Refunded, 5.75%, 6/01/39 | | | 20,000,000 | | | | | | | 21,051,000 |
Philadelphia IDAR, Senior Living Facilities, Wesley Enhanced Living Obligated Group, Refunding, Series A, 5.00%, 7/01/49 | | | 3,000,000 | | | | | | | 3,155,130 |
State Public School Building Authority Revenue, Commonwealth of Pennsylvania, School Lease, The School District of Philadelphia Project, Refunding, Series A, AGMC Insured, 5.00%, 6/01/32 | | | 20,000,000 | | | | | | | 21,926,800 |
| | | | | | | | | | |
| | | |
| | | | | | | | | | 152,530,971 |
| | | | | | | | | | |
Rhode Island 0.4% | | | | | | | | | | |
Rhode Island State Health and Educational Building Corp. Revenue, | | | | | | | | | | |
Hospital Financing, Care New England Issue, Series A, Pre-Refunded, 6.00%, 9/01/33 | | | 7,320,000 | | | | | | | 8,782,243 |
Hospital Financing, Lifespan Obligated Group Issue, Series A, Pre-Refunded, 7.00%, 5/15/39 | | | 8,200,000 | | | | | | | 8,738,412 |
Tobacco Settlement FICO Revenue, Asset-Backed, Refunding, Series A, 5.00%, 6/01/40 | | | 10,000,000 | | | | | | | 10,707,600 |
| | | | | | | | | | |
| | | |
| | | | | | | | | | 28,228,255 |
| | | | | | | | | | |
South Carolina 1.1% | | | | | | | | | | |
South Carolina Jobs EDA Residential Care Facilities Revenue, | | | | | | | | | | |
South Carolina Episcopal Home at Still Hopes, 5.00%, 4/01/47 | | | 2,000,000 | | | | | | | 2,070,780 |
South Carolina Episcopal Home at Still Hopes, 5.00%, 4/01/52 | | | 1,750,000 | | | | | | | 1,802,728 |
South Carolina Jobs EDA Student Housing Revenue, Coastal Housing Foundation LLC Project, Series A, Pre-Refunded, 6.50%, 4/01/42 | | | 10,000,000 | | | | | | | 11,000,800 |
South Carolina State Public Service Authority Revenue, Series B, Refunding, 5.125%, 12/01/43 | | | 52,890,000 | | | | | | | 57,326,413 |
| | | | | | | | | | |
| | | |
| | | | | | | | | | 72,200,721 |
| | | | | | | | | | |
South Dakota 0.2% | | | | | | | | | | |
Sioux Falls Health Facilities Revenue, | | | | | | | | | | |
Dow Rummel Village Project, 5.00%, 11/01/42 | | | 3,000,000 | | | | | | | 3,065,400 |
Dow Rummel Village Project, Refunding, 5.00%, 11/01/46 | | | 11,110,000 | | | | | | | 11,257,430 |
| | | | | | | | | | |
| | | |
| | | | | | | | | | 14,322,830 |
| | | | | | | | | | |
Tennessee 1.3% | | | | | | | | | | |
Johnson City Health and Educational Facilities Board Hospital Revenue, | | | | | | | | | | |
Mountain States Health Alliance, Capital Appreciation, first mortgage, Refunding, Series A, NATL Insured, zero cpn., 7/01/27 | | | 19,365,000 | | | | | | | 13,492,951 |
Mountain States Health Alliance, Capital Appreciation, first mortgage, Refunding, Series A, NATL Insured, zero cpn., 7/01/28 | | | 19,400,000 | | | | | | | 12,951,246 |
Mountain States Health Alliance, Capital Appreciation, first mortgage, Refunding, Series A, NATL Insured, zero cpn., 7/01/29 | | | 19,365,000 | | | | | | | 12,308,394 |
Mountain States Health Alliance, Capital Appreciation, first mortgage, Refunding, Series A, NATL Insured, zero cpn., 7/01/30 | | | 19,370,000 | | | | | | | 11,743,256 |
| | | | | | |
franklintempleton.com | | | | Annual Report | | 95 |
FRANKLIN TAX-FREE TRUST
STATEMENT OF INVESTMENTS
Franklin High Yield Tax-Free Income Fund (continued)
| | | | | | | | | | |
| | | Principal
Amount | | | | | | Value |
Municipal Bonds (continued) | | | | | | | | | | |
Tennessee (continued) | | | | | | | | | | |
Knox County Health Educational and Housing Facility Board Hospital Revenue, Covenant Health, Refunding, Series A, 5.00%, 1/01/47 | | $ | 5,000,000 | | | | | | | $ 5,454,100 |
Memphis-Shelby County Airport Authority Airport Revenue, | | | | | | | | | | |
Refunding, Series B, 5.75%, 7/01/23 | | | 5,000,000 | | | | | | | 5,429,500 |
Refunding, Series B, 5.75%, 7/01/24 | | | 3,500,000 | | | | | | | 3,802,330 |
Metropolitan Government of Nashville and Davidson County Health and Educational Facilities Board Revenue, Vanderbilt University Medical Center, Series A, 5.00%, 7/01/40 | | | 20,000,000 | | | | | | | 22,089,800 |
| | | | | | | | | | |
| | | |
| | | | | | | | | | 87,271,577 |
| | | | | | | | | | |
Texas 8.7% | | | | | | | | | | |
Brazos County Health Facilities Development Corp. Franciscan Services Corp. Revenue, Obligated Group, St. Joseph Regional Health Center, Pre-Refunded, 5.50%, 1/01/38 | | | 5,250,000 | | | | | | | 5,321,505 |
Capital Area Cultural Education Facilities Finance Corp. Revenue, The Roman Catholic Diocese of Austin, Series B, 6.125%, 4/01/45 | | | 10,000,000 | | | | | | | 10,705,000 |
Central Texas Regional Mobility Authority Revenue, | | | | | | | | | | |
Capital Appreciation, senior lien, Refunding, zero cpn., 1/01/35 | | | 3,000,000 | | | | | | | 1,483,050 |
Capital Appreciation, senior lien, Refunding, zero cpn., 1/01/37 | | | 2,500,000 | | | | | | | 1,124,125 |
Capital Appreciation, senior lien, Refunding, zero cpn., 1/01/38 | | | 2,405,000 | | | | | | | 1,032,442 |
Capital Appreciation, senior lien, Refunding, zero cpn., 1/01/39 | | | 2,545,000 | | | | | | | 1,042,687 |
senior lien, Pre-Refunded, 5.75%, 1/01/25 | | | 2,350,000 | | | | | | | 2,526,509 |
senior lien, Pre-Refunded, 5.75%, 1/01/31 | | | 2,500,000 | | | | | | | 2,769,800 |
senior lien, Pre-Refunded, 6.00%, 1/01/41 | | | 7,925,000 | | | | | | | 8,834,631 |
senior lien, Pre-Refunded, 6.25%, 1/01/46 | | | 24,340,000 | | | | | | | 27,300,961 |
senior lien, Series A, 5.00%, 1/01/45 | | | 5,000,000 | | | | | | | 5,474,250 |
Clifton Higher Education Finance Corp. Revenue, Education, Uplift Education, Series A, 5.00%, 12/01/45 | | | 3,855,000 | | | | | | | 4,140,501 |
Dallas/Fort Worth International Airport Revenue, | | | | | | | | | | |
Joint Improvement, Series A, 5.00%, 11/01/42 | | | 12,000,000 | | | | | | | 12,893,400 |
Joint Improvement, Series A, 5.00%, 11/01/45 | | | 50,000,000 | | | | | | | 53,682,000 |
Joint Improvement, Series B, 5.00%, 11/01/44 | | | 11,385,000 | | | | | | | 12,519,629 |
El Paso Downtown Development Corp. Special Revenue, Downtown Ballpark Venue Project, Series A, 7.25%, 8/15/38 | | | 15,000,000 | | | | | | | 18,627,900 |
Fort Worth Special Assessment Revenue, | | | | | | | | | | |
Fort Worth Public ID No. 17, Rock Creek Ranch Major Improvement Project, 5.00%, 9/01/27 | | | 1,965,000 | | | | | | | 2,014,282 |
Fort Worth Public ID No. 17, Rock Creek Ranch Major Improvement Project, 5.00%, 9/01/32 | | | 1,270,000 | | | | | | | 1,260,945 |
Fort Worth Public ID No. 17, Rock Creek Ranch Major Improvement Project, 5.125%, 9/01/37 | | | 1,650,000 | | | | | | | 1,613,205 |
Grand Parkway Transportation Corp. System Toll Revenue, | | | | | | | | | | |
Capital Appreciation, Series B, zero cpn. to 9/30/23, 5.80% thereafter, 10/01/45 | | | 10,000,000 | | | | | | | 9,201,200 |
First Tier Toll, Series A, 5.125%, 10/01/43 | | | 2,850,000 | | | | | | | 3,146,657 |
Harris County Cultural Education Facilities Finance Corp. Revenue, | | | | | | | | | | |
Brazos Presbyterian Homes Inc. Project, first mortgage, Refunding, 5.00%, 1/01/48 | | | 10,000,000 | | | | | | | 10,199,600 |
Brazos Presbyterian Homes Inc. Project, first mortgage, Series B, Pre-Refunded, 7.00%, 1/01/43 | | | 3,000,000 | | | | | | | 3,660,990 |
Brazos Presbyterian Homes Inc. Project, first mortgage, Series B, Pre-Refunded, 7.00%, 1/01/48 | | | 5,250,000 | | | | | | | 6,406,732 |
Harris County Health Facilities Development Corp. Hospital Revenue, Memorial Hermann Healthcare System, Series B, Pre-Refunded, 7.25%, 12/01/35 | | | 13,500,000 | | | | | | | 14,085,630 |
Houston Airport System Revenue, Special Facilities, United Airlines Terminal E Project, Refunding, 4.75%, 7/01/24 | | | 10,000,000 | | | | | | | 10,969,200 |
Lufkin Health Facilities Development Corp. Revenue, Memorial Health System of East Texas, Pre-Refunded, 6.25%, 2/15/37 | | | 5,000,000 | | | | | | | 5,225,750 |
Matagorda County Navigation District No. 1 PCR, Central Power and Light Co. Project, Refunding, Series A, 6.30%, 11/01/29 | | | 10,000,000 | | | | | | | 10,757,700 |
| | | | | | |
96 | | Annual Report | | | | franklintempleton.com |
FRANKLIN TAX-FREE TRUST
STATEMENT OF INVESTMENTS
Franklin High Yield Tax-Free Income Fund (continued)
| | | | | | | | | | |
| | | Principal
Amount | | | | | | Value |
Municipal Bonds (continued) | | | | | | | | | | |
Texas (continued) | | | | | | | | | | |
Mesquite Health Facilities Development Corp. Retirement Facility Revenue, | | | | | | | | | | |
Christian Care Centers Inc. Project, Refunding, 5.00%, 2/15/35 | | $ | 5,175,000 | | | | | | | $ 5,409,635 |
Christian Care Centers Inc. Project, Refunding, 5.00%, 2/15/36 | | | 1,000,000 | | | | | | | 1,034,280 |
Christian Care Centers Inc. Project, Refunding, 5.125%, 2/15/42 | | | 3,750,000 | | | | | | | 3,888,938 |
Mission Economic Development Corp. Revenue, Natgasoline Project, senior lien, Series B, 5.75%, 10/01/31 | | | 7,000,000 | | | | | | | 7,292,390 |
New Hope Cultural Education Facilities Finance Corp. First Mortgage Revenue, Morningside Ministries Project, 6.50%, 1/01/43 | | | 4,350,000 | | | | | | | 4,849,380 |
New Hope Cultural Education Facilities Finance Corp. Retirement Facility Revenue, | | | | | | | | | | |
Longhorn Village Project, Refunding, 5.00%, 1/01/42 | | | 3,000,000 | | | | | | | 3,168,570 |
Longhorn Village Project, Refunding, 5.00%, 1/01/47 | | | 5,000,000 | | | | | | | 5,262,150 |
MRC Crestview Project, Refunding, 5.00%, 11/15/36 | | | 1,020,000 | | | | | | | 1,062,289 |
MRC Crestview Project, Refunding, 5.00%, 11/15/46 | | | 4,100,000 | | | | | | | 4,231,077 |
Wesleyan Homes Inc. Project, Refunding, 5.50%, 1/01/43 | | | 3,200,000 | | | | | | | 3,415,232 |
New Hope Cultural Education Facilities Finance Corp. Senior Living Revenue, | | | | | | | | | | |
Cardinal Bay Inc., Village on the Park/Carriage Inn Project, Fourth Tier, Series D, 6.00%, 7/01/26 | | | 175,000 | | | | | | | 176,880 |
Cardinal Bay Inc., Village on the Park/Carriage Inn Project, Fourth Tier, Series D, 7.00%, 7/01/51 | | | 5,110,000 | | | | | | | 5,294,829 |
New Hope Cultural Education Facilities Finance Corp. Student Housing Revenue, | | | | | | | | | | |
CHF - Collegiate Housing Stephenville III LLC, Tarleton State University Project, Series A, 5.00%, 4/01/47 | | | 6,420,000 | | | | | | | 6,909,846 |
CHF-Collegiate Housing Island Campus LLC, Series A, 5.00%, 4/01/42 | | | 3,500,000 | | | | | | | 3,805,865 |
CHF-Stephenville LLC, Tarleton State University Project, Series A, 6.00%, 4/01/45 | | | 3,000,000 | | | | | | | 3,284,820 |
NCCD-College Station Properties LLC, Texas A&M University Project, Series A, 5.00%, 7/01/47 | | | 30,000,000 | | | | | | | 24,752,100 |
North Texas Tollway Authority Revenue, | | | | | | | | | | |
first tier, Series A, 6.25%, 1/01/39 | | | 2,350,000 | | | | | | | 2,433,966 |
first tier, Series A, Pre-Refunded, 6.25%, 1/01/39 | | | 10,150,000 | | | | | | | 10,547,068 |
Special Projects System, Capital Appreciation, first tier, Refunding, Series I, 6.50%, 1/01/43 | | | 25,000,000 | | | | | | | 30,383,750 |
Special Projects System, Capital Appreciation, Series B, Pre-Refunded, zero cpn., 9/01/37 | | | 7,500,000 | | | | | | | 3,208,050 |
Special Projects System, Capital Appreciation, Series C, Pre-Refunded, zero cpn. to 9/01/21, 6.75% thereafter, 9/01/45 | | | 25,000,000 | | | | | | | 29,713,250 |
Special Projects System, Capital Appreciation, Series C, Pre-Refunded, zero cpn. to 9/01/23, 7.00% thereafter, 9/01/43 | | | 10,000,000 | | | | | | | 10,863,800 |
System, first tier, Refunding, Series B, 5.00%, 1/01/38 | | | 10,000,000 | | | | | | | 10,698,600 |
System, first tier, Series K, Subseries K-2, Assured Guaranty, Pre-Refunded, 6.00%, 1/01/38 | | | 15,000,000 | | | | | | | 15,568,650 |
Red River Education Financing Corp. Higher Education Revenue, Houston Baptist University Project, Refunding, 5.50%, 10/01/46 | | | 4,250,000 | | | | | | | 4,663,695 |
Red River Health Facilities Development Corp. First Mortgage Revenue, | | | | | | | | | | |
g Eden Home Project, 7.25%, 12/15/42 | | | 11,000,000 | | | | | | | 7,370,000 |
Wichita Falls Retirement Foundation Project, Refunding, 5.50%, 1/01/32 | | | 1,500,000 | | | | | | | 1,578,000 |
Wichita Falls Retirement Foundation Project, Refunding, 5.125%, 1/01/41 | | | 2,000,000 | | | | | | | 2,058,300 |
Tarrant County Cultural Education Facilities Finance Corp. Revenue, | | | | | | | | | | |
Texas Health Resources System, Refunding, 5.00%, 11/15/40 | | | 15,225,000 | | | | | | | 16,164,382 |
Trinity Terrace Project, The Cumberland Rest Inc., Refunding, Series A-1, 5.00%, 10/01/44 | | | 2,500,000 | | | | | | | 2,643,300 |
Trinity Terrace Project, The Cumberland Rest Inc., Refunding, Series A-1, 5.00%, 10/01/49 | | | 2,625,000 | | | | | | | 2,752,260 |
Texas State Municipal Gas Acquisition and Supply Corp. III Gas Supply Revenue, | | | | | | | | | | |
5.00%, 12/15/30 | | | 25,000,000 | | | | | | | 27,317,500 |
5.00%, 12/15/31 | | | 24,500,000 | | | | | | | 26,725,580 |
5.00%, 12/15/32 | | | 10,000,000 | | | | | | | 10,894,400 |
Texas State Transportation Commission Turnpike System Revenue, | | | | | | | | | | |
first tier, Refunding, Series A, 5.00%, 8/15/41 | | | 5,000,000 | | | | | | | 5,466,200 |
second tier, Refunding, Series C, 5.00%, 8/15/42 | | | 15,965,000 | | | | | | | 17,569,482 |
| | | | | | |
franklintempleton.com | | | | Annual Report | | 97 |
FRANKLIN TAX-FREE TRUST
STATEMENT OF INVESTMENTS
Franklin High Yield Tax-Free Income Fund (continued)
| | | | | | | | | | |
| | | Principal
Amount | | | | | | Value |
Municipal Bonds (continued) | | | | | | | | | | |
Texas (continued) | | | | | | | | | | |
Wood County Central Hospital District Hospital Revenue, East Texas Medical Center Quitman Project, 6.00%, 11/01/41 | | $ | 9,350,000 | | | | | | | $ 10,050,782 |
| | | | | | | | | | |
| | | |
| | | | | | | | | | 580,529,577 |
| | | | | | | | | | |
Virginia 1.2% | | | | | | | | | | |
Henrico County EDA Residential Care Facilities Revenue, | | | | | | | | | | |
LifeSpire of Virginia, Refunding, Series C, 5.00%, 12/01/37 | | | 765,000 | | | | | | | 819,820 |
LifeSpire of Virginia, Refunding, Series C, 5.00%, 12/01/47 | | | 2,200,000 | | | | | | | 2,339,458 |
Norfolk EDA Health Care Facilities Revenue, Sentara Healthcare, Refunding, Series B, 5.00%, 11/01/43 | | | 17,575,000 | | | | | | | 19,226,347 |
Tobacco Settlement FICO Revenue, Capital Appreciation, Second Subordinate, Refunding, Series D, zero cpn., 6/01/47 | | | 50,000,000 | | | | | | | 3,541,500 |
Virginia Small Business Financing Authority Revenue, | | | | | | | | | | |
Elizabeth River Crossings OPCO LLC Project, senior lien, 6.00%, 1/01/37 | | | 6,485,000 | | | | | | | 7,297,311 |
Elizabeth River Crossings OPCO LLC Project, senior lien, 5.50%, 1/01/42 | | | 35,790,000 | | | | | | | 39,457,759 |
Virginia State Small Business Financing Authority Residential Care Facility Revenue, Pinnacle Living, Series C, 5.00%, 6/01/52 | | | 6,000,000 | | | | | | | 6,267,480 |
| | | | | | | | | | |
| | | |
| | | | | | | | | | 78,949,675 |
| | | | | | | | | | |
Washington 2.1% | | | | | | | | | | |
FYI Properties Lease Revenue, | | | | | | | | | | |
Washington State District Project, 5.50%, 6/01/34 | | | 11,935,000 | | | | | | | 12,508,715 |
Washington State District Project, 5.50%, 6/01/39 | | | 16,250,000 | | | | | | | 17,020,738 |
Greater Wenatchee Regional Events Center Public Facilities District Revenue, Refunding, Series A, 5.50%, 9/01/42 | | | 3,150,000 | | | | | | | 3,220,371 |
Ocean Shores Local ID No. 1 Tax Allocation, 7.25%, 2/01/31 | | | 5,475,000 | | | | | | | 6,699,539 |
Skagit County Public Hospital District No. 1 Revenue, Skagit Valley Hospital, 5.75%, 12/01/35 | | | 5,355,000 | | | | | | | 5,677,746 |
Washington Health Care Facilities Authority Revenue, | | | | | | | | | | |
Central Washington Health Services Assn., Pre-Refunded, 7.00%, 7/01/39 | | | 8,500,000 | | | | | | | 9,082,930 |
Fred Hutchinson Cancer Research Center, Series A, Pre-Refunded, 6.00%, 1/01/33 | | | 7,500,000 | | | | | | | 7,931,475 |
Providence Health and Services, Refunding, Series A, 5.00%, 10/01/42 | | | 19,725,000 | | | | | | | 21,503,603 |
Washington State Economic Development Finance Authority Environmental Facilities Revenue, | | | | | | | | | | |
Coalview Centralia LLC Project, 8.25%, 8/01/25 | | | 3,800,000 | | | | | | | 3,266,860 |
Coalview Centralia LLC Project, 9.50%, 8/01/25 | | | 12,855,000 | | | | | | | 11,663,470 |
Columbia Pulp I LLC Project, Series A, 7.50%, 1/01/32 | | | 5,000,000 | | | | | | | 5,905,500 |
f Washington State Economic Development Finance Authority Revenue, Propeller Airports Paine Field LLC Project, Mandatory Put, Series A, 6.50%, 3/01/24 | | | 25,000,000 | | | | | | | 25,117,500 |
Washington State Higher Education Facilities Authority Revenue, Whitworth University Project, Pre-Refunded, 5.625%, 10/01/40 | | | 5,235,000 | | | | | | | 5,558,261 |
Washington State Housing Finance Commission Revenue, Nonprofit Housing, Presbyterian Retirement Communities Northwest Project, Refunding, Series A, 5.00%, 1/01/31 | | | 2,000,000 | | | | | | | 2,161,420 |
| | | | | | | | | | |
| | | |
| | | | | | | | | | 137,318,128 |
| | | | | | | | | | |
West Virginia 0.8% | | | | | | | | | | |
County Commission of Harrison County Solid Waste Disposal Revenue, Allegheny Energy Supply Co. LLC Harrison Station Project, Refunding, Series D, 5.50%, 10/15/37 | | | 14,745,000 | | | | | | | 14,701,945 |
Kanawha County Commission Student Housing Revenue, The West Virginia State University Foundation Project, 6.75%, 7/01/45 | | | 6,650,000 | | | | | | | 7,019,474 |
Pleasants County PCR, County Commission, Series F, 5.25%, 10/15/37 | | | 27,250,000 | | | | | | | 27,005,022 |
West Virginia Hospital Finance Authority Revenue, Hospital, Improvement, West Virginia University Health System Obligated Group, Series A, 5.00%, 6/01/47 | | | 5,000,000 | | | | | | | 5,435,550 |
| | | | | | | | | | |
| | | |
| | | | | | | | | | 54,161,991 |
| | | | | | | | | | |
| | | | | | |
98 | | Annual Report | | | | franklintempleton.com |
FRANKLIN TAX-FREE TRUST
STATEMENT OF INVESTMENTS
Franklin High Yield Tax-Free Income Fund (continued)
| | | | | | | | | | |
| | | Principal
Amount | | | | | | Value |
Municipal Bonds (continued) | | | | | | | | | | |
Wisconsin 1.2% | | | | | | | | | | |
PFA Education Revenue, | | | | | | | | | | |
Coral Academy of Science Las Vegas, Series A, 5.00%, 7/01/45 | | $ | 2,805,000 | | | | | | | $ 2,961,070 |
Coral Academy of Science Las Vegas, Series A, 5.00%, 7/01/53 | | | 4,345,000 | | | | | | | 4,545,870 |
PFA Limited Obligation Grant Revenue, American Dream at Meadowlands Project, Series A, 6.75%, 8/01/31 | | | 10,000,000 | | | | | | | 10,798,900 |
PFA Limited Obligation PILOT Revenue, American Dream at Meadowlands Project, 6.75%, 12/01/42 | | | 10,000,000 | | | | | | | 11,545,100 |
PFA Retirement Facilities Revenue, | | | | | | | | | | |
Whitestone Retirement Facilities, first mortgage, Refunding, 5.00%, 3/01/37 | | | 625,000 | | | | | | | 687,444 |
Whitestone Retirement Facilities, first mortgage, Refunding, 5.00%, 3/01/52 | | | 1,800,000 | | | | | | | 1,954,854 |
Wisconsin Health and Educational Facilities Authority Revenue, | | | | | | | | | | |
Beaver Dam Community Hospitals Inc., Refunding, Series A, 5.25%, 8/15/34 | | | 5,000,000 | | | | | | | 5,288,300 |
St. Johns Communities Inc., Refunding, Series B, 5.00%, 9/15/45 | | | 1,500,000 | | | | | | | 1,594,890 |
Thedacare Inc., Series A, 5.50%, 12/15/38 | | | 5,000,000 | | | | | | | 5,230,500 |
Wisconsin PFA Exempt Facilities Revenue, Celanese Project, Refunding, Series C, 4.30%, 11/01/30 | | | 11,000,000 | | | | | | | 11,265,980 |
Wisconsin State General Fund Annual Appropriation Revenue, | | | | | | | | | | |
Series A, Pre-Refunded, 6.00%, 5/01/33 | | | 13,590,000 | | | | | | | 14,297,496 |
Series A, Pre-Refunded, 6.00%, 5/01/33 | | | 1,410,000 | | | | | | | 1,484,251 |
Wisconsin State Public Finance Authority Revenue, Adams-Columbia Electric Cooperative, Series A, NATL Insured, 5.50%, 12/01/40 | | | 6,755,000 | | | | | | | 7,376,122 |
| | | | | | | | | | |
| | | |
| | | | | | | | | | 79,030,777 |
| | | | | | | | | | |
Wyoming 0.2% | | | | | | | | | | |
Campbell County Solid Waste Facilities Revenue, Basin Electric Power Cooperative, Dry Fork Station Facilities, Series A, 5.75%, 7/15/39 | | | 5,500,000 | | | | | | | 5,778,630 |
West Park Hospital District Revenue, West Park Hospital Project, Series A, 7.00%, 6/01/40 | | | 5,500,000 | | | | | | | 6,002,590 |
Wyoming CDA Student Housing Revenue, | | | | | | | | | | |
CHF-Wyoming LLC, University of Wyoming Project, 6.25%, 7/01/31 | | | 600,000 | | | | | | | 642,630 |
CHF-Wyoming LLC, University of Wyoming Project, 6.50%, 7/01/43 | | | 1,600,000 | | | | | | | 1,708,032 |
| | | | | | | | | | |
| | | |
| | | | | | | | | | 14,131,882 |
| | | | | | | | | | |
U.S. Territories 3.3% | | | | | | | | | | |
Guam 1.3% | | | | | | | | | | |
Government of Guam GO, | | | | | | | | | | |
Series A, 6.00%, 11/15/19 | | | 3,480,000 | | | | | | | 3,624,211 |
Series A, Pre-Refunded, 6.75%, 11/15/29 | | | 10,000,000 | | | | | | | 10,847,200 |
Series A, Pre-Refunded, 7.00%, 11/15/39 | | | 15,000,000 | | | | | | | 16,333,500 |
Guam Government Department of Education COP, | | | | | | | | | | |
John F. Kennedy High School Project, Series A, 6.625%, 12/01/30 | | | 5,065,000 | | | | | | | 5,240,097 |
John F. Kennedy High School Project, Series A, 6.875%, 12/01/40 | | | 4,000,000 | | | | | | | 4,146,960 |
Guam Government Hotel Occupancy Tax Revenue, Refunding, Series A, 6.50%, 11/01/40 | | | 10,380,000 | | | | | | | 11,527,924 |
Guam Government Limited Obligation Revenue, | | | | | | | | | | |
Section 30, Series A, Pre-Refunded, 5.625%, 12/01/29 | | | 3,850,000 | | | | | | | 4,123,466 |
Section 30, Series A, Pre-Refunded, 5.75%, 12/01/34 | | | 8,430,000 | | | | | | | 9,046,908 |
Guam Government Waterworks Authority Water and Wastewater System Revenue, Pre-Refunded, 5.625%, 7/01/40 | | | 4,000,000 | | | | | | | 4,364,840 |
Guam International Airport Authority Revenue, | | | | | | | | | | |
General, Refunding, Series B, AGMC Insured, 5.50%, 10/01/33 | | | 2,000,000 | | | | | | | 2,229,000 |
General, Refunding, Series B, AGMC Insured, 5.75%, 10/01/43 | | | 3,000,000 | | | | | | | 3,384,810 |
Guam Power Authority Revenue, Series A, Pre-Refunded, 5.50%, 10/01/40 | | | 10,000,000 | | | | | | | 10,957,900 |
| | | | | | | | | | |
| | | |
| | | | | | | | | | 85,826,816 |
| | | | | | | | | | |
| | | | | | |
franklintempleton.com | | | | Annual Report | | 99 |
FRANKLIN TAX-FREE TRUST
STATEMENT OF INVESTMENTS
Franklin High Yield Tax-Free Income Fund (continued)
| | | | | | | | | | |
| | | Principal
Amount | | | | | | Value |
Municipal Bonds (continued) | | | | | | | | | | |
U.S. Territories (continued) | | | | | | | | | | |
Northern Mariana Islands 0.2% | | | | | | | | | | |
Northern Mariana Islands Commonwealth Ports Authority Seaport Revenue, Senior Series A, 6.60%, 3/15/28 | | $ | 12,680,000 | | | | | | | $ 12,616,600 |
| | | | | | | | | | |
Puerto Rico 1.7% | | | | | | | | | | |
Children’s Trust Fund Tobacco Settlement Revenue, | | | | | | | | | | |
Asset-Backed, Refunding, 5.50%, 5/15/39 | | | 9,500,000 | | | | | | | 8,966,005 |
Asset-Backed, Refunding, 5.625%, 5/15/43 | | | 2,500,000 | | | | | | | 2,338,750 |
g Puerto Rico Electric Power Authority Power Revenue, | | | | | | | | | | |
Refunding, Series A, 5.00%, 7/01/42 | | | 26,990,000 | | | | | | | 10,154,988 |
Series A, 7.25%, 7/01/30 | | | 25,000,000 | | | | | | | 9,406,250 |
Series A, 6.75%, 7/01/36 | | | 29,750,000 | | | | | | | 11,193,437 |
Series A, 7.00%, 7/01/43 | | | 5,000,000 | | | | | | | 1,881,250 |
Series A-4, zero cpn., 7/01/19 | | | 5,500,000 | | | | | | | 2,069,375 |
Series B, zero cpn., 7/01/19 | | | 5,500,000 | | | | | | | 2,069,375 |
Series E-1, zero cpn., 1/01/21 | | | 6,000,000 | | | | | | | 2,257,500 |
Series E-2, zero cpn., 7/01/21 | | | 6,000,000 | | | | | | | 2,257,500 |
Series E-3, zero cpn., 1/01/22 | | | 1,989,500 | | | | | | | 748,549 |
Series E-4, zero cpn., 7/01/22 | | | 1,989,499 | | | | | | | 748,549 |
Series WW, 5.50%, 7/01/38 | | | 16,355,000 | | | | | | | 6,153,569 |
Series XX, 5.75%, 7/01/36 | | | 23,620,000 | | | | | | | 8,887,025 |
Series XX, 5.25%, 7/01/40 | | | 71,780,000 | | | | | | | 27,007,225 |
Puerto Rico HFAR, Capital Fund Modernization Program, Puerto Rico Public Housing Projects, Refunding, 5.125%, 12/01/27 | | | 3,000,000 | | | | | | | 3,061,650 |
Puerto Rico Industrial Tourist Educational Medical and Environmental Control Facilities Financing Authority Revenue, Cogeneration Facility, AES Puerto Rico Project, 6.625%, 6/01/26 | | | 17,835,000 | | | | | | | 14,869,931 |
g Puerto Rico Sales Tax FICO Sales Tax Revenue, | | | | | | | | | | |
Capital Appreciation, First Subordinate, Series A, zero cpn., 8/01/34 | | | 29,465,000 | | | | | | | 1,517,153 |
Capital Appreciation, First Subordinate, Series A, zero cpn., 8/01/36 | | | 17,800,000 | | | | | | | 847,280 |
| | | | | | | | | | |
| | | |
| | | | | | | | | | 116,435,361 |
| | | | | | | | | | |
U.S. Virgin Islands 0.1% | | | | | | | | | | |
Virgin Islands PFAR, | | | | | | | | | | |
Virgin Islands Matching Fund Loan Note, Cruzan Project, Series A, 6.00%, 10/01/39 | | | 5,000,000 | | | | | | | 2,912,500 |
Virgin Islands Matching Fund Loan Note, Diageo Project, Series A, 6.625%, 10/01/29 | | | 7,500,000 | | | | | | | 4,631,250 |
| | | | | | | | | | |
| | | |
| | | | | | | | | | 7,543,750 |
| | | | | | | | | | |
| | | |
Total U.S. Territories | | | | | | | | | | 222,422,527 |
| | | | | | | | | | |
| | | |
Total Municipal Bonds (Cost $6,037,108,125) | | | | | | | | | | 6,600,951,698 |
| | | | | | | | | | |
| | | |
Total Investments before Short Term Investments (Cost $6,042,361,804) | | | | | | | | | | 6,606,206,190 |
| | | | | | | | | | |
| | | |
Short Term Investments 0.4% | | | | | | | | | | |
Municipal Bonds 0.4% | | | | | | | | | | |
Florida 0.1% | | | | | | | | | | |
i St. Lucie County PCR, Florida Power and Light Co. Project, Refunding, Daily VRDN and Put, 1.17%, 9/01/28 | | | 5,800,000 | | | | | | | 5,800,000 |
| | | | | | | | | | |
| | | |
Georgia 0.0%† | | | | | | | | | | |
i Athens-Clarke County Unified Government Development Authority Revenue, University of Georgia Athletic Assn. Project, Series B, LOC Wells Fargo Bank, Daily VRDN and Put, 1.10%, 7/01/35 | | | 1,750,000 | | | | | | | 1,750,000 |
g Baldwin County Hospital Authority Revenue, Oconee Regional Medical Center, 6.50%, 4/30/17 | | | 3,625,000 | | | | | | | 2,610,000 |
| | | | | | | | | | |
| | | |
| | | | | | | | | | 4,360,000 |
| | | | | | | | | | |
| | | | | | |
100 | | Annual Report | | | | franklintempleton.com |
FRANKLIN TAX-FREE TRUST
STATEMENT OF INVESTMENTS
Franklin High Yield Tax-Free Income Fund (continued)
| | | | | | | | | | |
| | | Principal
Amount | | | | | | Value |
Short Term Investments (continued) | | | | | | | | | | |
Municipal Bonds (continued) | | | | | | | | | | |
Kentucky 0.2% | | | | | | | | | | |
i Louisville/Jefferson County Metro Government Health System Revenue, Norton Healthcare Inc., Series B, LOC PNC Bank, Daily VRDN and Put, 1.09%, 10/01/39 | | $ | 11,300,000 | | | | | | | $ 11,300,000 |
| | | | | | | | | | |
Tennessee 0.1% | | | | | | | | | | |
i Shelby County Health Educational and Housing Facility Board Revenue, Methodist Le Bonheur Healthcare, Refunding, Series A, AGMC Insured, SPA US Bank National Association, Daily VRDN and Put, 1.11%, 6/01/42 | | | 6,000,000 | | | | | | | 6,000,000 |
| | | | | | | | | | |
Virginia 0.0%† | | | | | | | | | | |
i Virginia College Building Authority Educational Facilities Revenue, University of Richmond Project, SPA Wells Fargo Bank, Daily VRDN and Put, 1.09%, 11/01/36 | | | 1,450,000 | | | | | | | 1,450,000 |
| | | | | | | | | | |
| | | |
Total Short Term Investments (Cost $29,925,000) | | | | | | | | | | 28,910,000 |
| | | | | | | | | | |
Total Investments (Cost $6,072,286,804) 99.0% | | | | | | | | | | 6,635,116,190 |
Other Assets, less Liabilities 1.0% | | | | | | | | | | 66,541,664 |
| | | | | | | | | | |
| | | |
Net Assets 100.0% | | | | | | | | | | $ 6,701,657,854 |
| | | | | | | | | | |
See Abbreviations on page 140.
†Rounds to less than 0.1% of net assets.
aNon-income producing.
bFair valued using significant unobservable inputs. See Note 11 regarding fair value measurements.
cSee Note 9 regarding restricted securities.
dIncome may be received in additional securities and/or cash.
eThe bond pays interest and/or principal based upon the issuer’s ability to pay, which may be less than the stated interest rate or principal paydown.
fThe maturity date shown represents the mandatory put date.
gSee Note 7 regarding defaulted securities.
hSecurity purchased on a when-issued basis. See Note 1(b).
iVariable rate demand notes (VRDNs) are obligations which contain a floating or variable interest rate adjustment formula and an unconditional right of demand to receive payment of the principal balance plus accrued interest at specified dates. Unless otherwise noted, the coupon rate is determined based on factors including supply and demand, underlying credit, tax treatment, and current short term rates. The coupon rate shown represents the rate at period end.
| | | | | | |
franklintempleton.com | | | | The accompanying notes are an integral part of these financial statements. | Annual Report | | 101 |
FRANKLIN TAX-FREE TRUST
Financial Highlights
Franklin Massachusetts Tax-Free Income Fund
| | | | | | | | | | | | | | | | | | | | |
| | | Year Ended February 28, | |
| | | 2018 | | | 2017 | | | 2016a | | | 2015 | | | 2014 | |
| | | | | |
Class A | | | | | | | | | | | | | | | | | | | | |
| | | | | |
Per share operating performance (for a share outstanding throughout the year) | | | | | | | | | | | | | | | | | | | | |
| | | | | |
Net asset value, beginning of year | | | $11.63 | | | | $11.94 | | | | $11.93 | | | | $11.42 | | | | $12.16 | |
| | | | |
| | | | | |
Income from investment operationsb: | | | | | | | | | | | | | | | | | | | | |
| | | | | |
Net investment incomec | | | 0.35 | | | | 0.39 | | | | 0.40 | | | | 0.42 | | | | 0.42 | |
| | | | | |
Net realized and unrealized gains (losses) | | | (0.15 | ) | | | (0.31 | ) | | | 0.01 | | | | 0.51 | | | | (0.76 | ) |
| | | | |
| | | | | |
Total from investment operations | | | 0.20 | | | | 0.08 | | | | 0.41 | | | | 0.93 | | | | (0.34 | ) |
| | | | |
| | | | | |
Less distributions from net investment income | | | (0.36 | ) | | | (0.39 | ) | | | (0.40 | ) | | | (0.42 | ) | | | (0.40 | ) |
| | | | |
| | | | | |
Net asset value, end of year | | | $11.47 | | | | $11.63 | | | | $11.94 | | | | $11.93 | | | | $11.42 | |
| | | | |
| | | | | |
Total returnd | | | 1.66% | | | | 0.62% | | | | 3.50% | | | | 8.28% | | | | (2.75)% | |
| | | | | |
Ratios to average net assets | | | | | | | | | | | | | | | | | | | | |
| | | | | |
Expenses | | | 0.68% | | | | 0.67% | | | | 0.66% | | | | 0.67% | | | | 0.66% | |
| | | | | |
Net investment income | | | 3.02% | | | | 3.23% | | | | 3.38% | | | | 3.56% | | | | 3.64% | |
| | | | | |
Supplemental data | | | | | | | | | | | | | | | | | | | | |
| | | | | |
Net assets, end of year (000’s) | | | $363,555 | | | | $375,435 | | | | $400,201 | | | | $439,041 | | | | $419,556 | |
| | | | | |
Portfolio turnover rate | | | 23.50% | | | | 7.16% | | | | 4.90% | | | | 6.51% | | | | 7.12% | |
a For the year ended February 29.
b The amount shown for a share outstanding throughout the period may not correlate with the Statement of Operations for the period due to the timing of sales and repurchases of the Fund’s shares in relation to income earned and/or fluctuating fair value of the investments of the Fund.
c Based on average daily shares outstanding.
d Total return does not reflect sales commissions or contingent deferred sales charges, if applicable.
| | | | | | |
102 | | Annual Report | | | The accompanying notes are an integral part of these financial statements. | | franklintempleton.com |
FRANKLIN TAX-FREE TRUST
FINANCIAL HIGHLIGHTS
Franklin Massachusetts Tax-Free Income Fund (continued)
| | | | | | | | | | | | | | | | | | | | |
| | | Year Ended February 28, | |
| | | 2018 | | | 2017 | | | 2016a | | | 2015 | | | 2014 | |
| | | | | |
Class C | | | | | | | | | | | | | | | | | | | | |
| | | | | |
Per share operating performance | | | | | | | | | | | | | | | | | | | | |
(for a share outstanding throughout the year) | | | | | | | | | | | | | | | | | | | | |
| | | | | |
Net asset value, beginning of year | | | $11.77 | | | | $12.07 | | | | $12.06 | | | | $11.53 | | | | $12.29 | |
| | | | | |
Income from investment operationsb: | | | | | | | | | | | | | | | | | | | | |
| | | | | |
Net investment incomec | | | 0.29 | | | | 0.32 | | | | 0.34 | | | | 0.36 | | | | 0.36 | |
| | | | | |
Net realized and unrealized gains (losses) | | | (0.16 | ) | | | (0.30 | ) | | | — | | | | 0.53 | | | | (0.78 | ) |
| | | | | |
Total from investment operations | | | 0.13 | | | | 0.02 | | | | 0.34 | | | | 0.89 | | | | (0.42 | ) |
| | | | | |
Less distributions from net investment income | | | (0.29 | ) | | | (0.32 | ) | | | (0.33 | ) | | | (0.36 | ) | | | (0.34 | ) |
| | | | | |
Net asset value, end of year | | | $11.61 | | | | $11.77 | | | | $12.07 | | | | $12.06 | | | | $11.53 | |
| | | | | |
Total returnd | | | 1.08% | | | | 0.13% | | | | 2.89% | | | | 7.79% | | | | (3.41)% | |
| | | | | |
Ratios to average net assets | | | | | | | | | | | | | | | | | | | | |
| | | | | |
Expenses | | | 1.23% | | | | 1.22% | | | | 1.21% | | | | 1.22% | | | | 1.21% | |
| | | | | |
Net investment income | | | 2.47% | | | | 2.68% | | | | 2.83% | | | | 3.01% | | | | 3.09% | |
| | | | | |
Supplemental data | | | | | | | | | | | | | | | | | | | | |
| | | | | |
Net assets, end of year (000’s) | | | $56,607 | | | | $60,441 | | | | $61,834 | | | | $62,878 | | | | $61,760 | |
| | | | | |
Portfolio turnover rate | | | 23.50% | | | | 7.16% | | | | 4.90% | | | | 6.51% | | | | 7.12% | |
a For the year ended February 29.
b The amount shown for a share outstanding throughout the period may not correlate with the Statement of Operations for the period due to the timing of sales and repurchases of the Fund’s shares in relation to income earned and/or fluctuating fair value of the investments of the Fund.
c Based on average daily shares outstanding.
d Total return does not reflect sales commissions or contingent deferred sales charges, if applicable.
| | | | | | |
franklintempleton.com | | | | The accompanying notes are an integral part of these financial statements. | Annual Report | | 103 |
FRANKLIN TAX-FREE TRUST
FINANCIAL HIGHLIGHTS
Franklin Massachusetts Tax-Free Income Fund (continued)
| | | | |
| | | Year Ended February 28, | |
| | | 2018a | |
| |
Class R6 | | | | |
| |
Per share operating performance | | | | |
(for a share outstanding throughout the year) | | | | |
| |
Net asset value, beginning of year | | | $11.76 | |
| |
Income from investment operationsb: | | | | |
| |
Net investment incomec | | | 0.21 | |
| |
Net realized and unrealized gains (losses) | | | (0.28 | ) |
| |
Total from investment operations | | | (0.07 | ) |
| |
Less distributions from net investment income | | | (0.21 | ) |
| |
Net asset value, end of year | | | $11.48 | |
| |
Total returnd | | | (0.65)% | |
| |
Ratios to average net assetse | | | | |
| |
Expenses before waiver and payments by affiliates | | | 0.60% | |
| |
Expenses net of waiver and payments by affiliates | | | 0.55% | |
| |
Net investment income | | | 3.15% | |
| |
Supplemental data | | | | |
| |
Net assets, end of year (000’s) | | | $1,688 | |
| |
Portfolio turnover rate | | | 23.50% | |
a For the period August 1, 2017 (effective date) to February 28, 2018.
b The amount shown for a share outstanding throughout the period may not correlate with the Statement of Operations for the period due to the timing of sales and repurchases of the Fund’s shares in relation to income earned and/or fluctuating fair value of the investments of the Fund.
c Based on average daily shares outstanding.
d Total return is not annualized for periods less than one year.
e Ratios are annualized for periods less than one year.
| | | | | | |
104 | | Annual Report | | | The accompanying notes are an integral part of these financial statements. | | franklintempleton.com |
FRANKLIN TAX-FREE TRUST
FINANCIAL HIGHLIGHTS
Franklin Massachusetts Tax-Free Income Fund (continued)
| | | | | | | | | | | | | | | | | | | | |
| | | Year Ended February 28, | |
| | | 2018 | | | 2017 | | | 2016a | | | 2015 | | | 2014 | |
| | | | | |
Advisor Class | | | | | | | | | | | | | | | | | | | | |
| | | | | |
Per share operating performance | | | | | | | | | | | | | | | | | | | | |
(for a share outstanding throughout the year) | | | | | | | | | | | | | | | | | | | | |
| | | | | |
Net asset value, beginning of year | | | $11.63 | | | | $11.94 | | | | $11.93 | | | | $11.41 | | | | $12.16 | |
| | | | | |
Income from investment operationsb: | | | | | | | | | | | | | | | | | | | | |
| | | | | |
Net investment incomec | | | 0.36 | | | | 0.40 | | | | 0.41 | | | | 0.43 | | | | 0.43 | |
| | | | | |
Net realized and unrealized gains (losses) | | | (0.14 | ) | | | (0.31 | ) | | | 0.01 | | | | 0.53 | | | | (0.77 | ) |
| | | | | |
Total from investment operations | | | 0.22 | | | | 0.09 | | | | 0.42 | | | | 0.96 | | | | (0.34 | ) |
| | | | | |
Less distributions from net investment income | | | (0.37 | ) | | | (0.40 | ) | | | (0.41 | ) | | | (0.44 | ) | | | (0.41 | ) |
| | | | | |
Net asset value, end of year | | | $11.48 | | | | $11.63 | | | | $11.94 | | | | $11.93 | | | | $11.41 | |
| | | | | |
Total return | | | 1.84% | | | | 0.72% | | | | 3.60% | | | | 8.48% | | | | (2.74)% | |
| | | | | |
Ratios to average net assets | | | | | | | | | | | | | | | | | | | | |
| | | | | |
Expenses | | | 0.58% | | | | 0.57% | | | | 0.56% | | | | 0.57% | | | | 0.56% | |
| | | | | |
Net investment income | | | 3.12% | | | | 3.33% | | | | 3.48% | | | | 3.66% | | | | 3.74% | |
| | | | | |
Supplemental data | | | | | | | | | | | | | | | | | | | | |
| | | | | |
Net assets, end of year (000’s) | | | $63,366 | | | | $34,909 | | | | $12,614 | | | | $10,274 | | | | $4,574 | |
| | | | | |
Portfolio turnover rate | | | 23.50% | | | | 7.16% | | | | 4.90% | | | | 6.51% | | | | 7.12% | |
a For the year ended February 29.
b The amount shown for a share outstanding throughout the period may not correlate with the Statement of Operations for the period due to the timing of sales and repurchases of the Fund’s shares in relation to income earned and/or fluctuating fair value of the investments of the Fund.
c Based on average daily shares outstanding.
| | | | | | |
franklintempleton.com | | | | The accompanying notes are an integral part of these financial statements. | Annual Report | | 105 |
FRANKLIN TAX-FREE TRUST
Statement of Investments, February 28, 2018
Franklin Massachusetts Tax-Free Income Fund
| | | | | | | | | | | | |
| | | Principal
Amount | | | | | | Value | |
Municipal Bonds 98.9% | | | | | | | | | | | | |
Massachusetts 98.9% | | | | | | | | | | | | |
Boston GO, Refunding, Series B, 5.00%, 4/01/26 | | | $ 6,160,000 | | | | | | | | $ 7,245,330 | |
Boston Water and Sewer Commission Revenue, General, Refunding, Senior Series A, 4.00%, 11/01/28 | | | 4,400,000 | | | | | | | | 4,738,228 | |
Braintree GO, Refunding, 5.00%, 5/15/27 | | | 2,000,000 | | | | | | | | 2,372,540 | |
City of Quincy GO, Muni Purpose Loan, Refunding, 4.00%, 6/01/32 | | | 2,565,000 | | | | | | | | 2,690,634 | |
Dudley-Charlton Regional School District GO, Series B, NATL Insured, 5.25%, 5/01/19 | | | 3,140,000 | | | | | | | | 3,274,549 | |
Massachusetts Bay Transportation Authority Sales Tax Revenue, | | | | | | | | | | | | |
Refunding, Senior Series A, 5.25%, 7/01/30 | | | 4,000,000 | | | | | | | | 4,963,800 | |
Refunding, Series B, 5.00%, 7/01/33 | | | 2,500,000 | | | | | | | | 2,869,250 | |
Series A, 5.00%, 7/01/40 | | | 5,000,000 | | | | | | | | 5,664,000 | |
Subordinate, Series A, Subseries A-2, 5.00%, 7/01/45 | | | 2,000,000 | | | | | | | | 2,279,680 | |
Subordinate, Series A, Subseries A-2, 5.00%, 7/01/46 | | | 5,000,000 | | | | | | | | 5,694,850 | |
Massachusetts Commonwealth GO, Refunding, Series A, AMBAC Insured, 5.50%, 8/01/30 | | | 5,000,000 | | | | | | | | 6,200,300 | |
Massachusetts Development Finance Agency Revenue, | | | | | | | | | | | | |
Boston College Issue, Refunding, Series T, 5.00%, 7/01/42 | | | 3,750,000 | | | | | | | | 4,297,125 | |
Boston University Issue, Series BB1, 4.00%, 10/01/46 | | | 5,000,000 | | | | | | | | 5,116,700 | |
Brandeis University Issue, Series N, 5.00%, 10/01/39 | | | 5,000,000 | | | | | | | | 5,096,900 | |
The Broad Institute Issue, Refunding, 4.00%, 4/01/41 | | | 5,000,000 | | | | | | | | 5,132,150 | |
The Broad Institute Issue, Series A, Pre-Refunded, 5.375%, 4/01/41 | | | 15,000,000 | | | | | | | | 16,623,600 | |
Dana-Farber Cancer Institute Issue, Series N, 5.00%, 12/01/46 | | | 6,890,000 | | | | | | | | 7,723,277 | |
Harvard University Issue, Refunding, Series A, 4.00%, 7/15/29 | | | 7,500,000 | | | | | | | | 8,279,100 | |
Harvard University Issue, Refunding, Series A, 5.00%, 7/15/33 | | | 5,000,000 | | | | | | | | 5,872,550 | |
Lahey Clinic Obligated Group Issue, Refunding, Series F, 5.00%, 8/15/32 | | | 2,975,000 | | | | | | | | 3,363,327 | |
Northeastern University Issue, Series A, 5.00%, 3/01/44 | | | 8,520,000 | | | | | | | | 9,345,929 | |
Partners Healthcare System Issue, Refunding, Series O-2, 5.00%, 7/01/30 | | | 5,000,000 | | | | | | | | 5,724,250 | |
Partners Healthcare System Issue, Refunding, Series Q, 5.00%, 7/01/34 | | | 5,000,000 | | | | | | | | 5,688,650 | |
Partners Healthcare System Issue, Refunding, Series S, 4.00%, 7/01/41 | | | 7,500,000 | | | | | | | | 7,646,475 | |
Partners Healthcare System Issue, Series L, Pre-Refunded, 5.00%, 7/01/41 | | | 5,000,000 | | | | | | | | 5,530,250 | |
Sterling and Francine Clark Art Institute Issue, Pre-Refunded, 5.00%, 7/01/41 | | | 12,900,000 | | | | | | | | 14,268,045 | |
Williams College Issue, Refunding, Series Q, 5.00%, 7/01/46 | | | 5,000,000 | | | | | | | | 5,676,850 | |
Williams College Issue, Refunding, Series S, 4.00%, 7/01/46 | | | 9,550,000 | | | | | | | | 9,926,938 | |
Worcester Polytech Institute Issue, Refunding, 5.00%, 9/01/42 | | | 1,090,000 | | | | | | | | 1,233,379 | |
Worcester Polytechnic Institute Issue, 4.00%, 9/01/49 | | | 4,825,000 | | | | | | | | 4,878,461 | |
Massachusetts State College Building Authority Project Revenue, | | | | | | | | | | | | |
Refunding, Series B, XLCA Insured, 5.50%, 5/01/39 | | | 5,000,000 | | | | | | | | 6,503,500 | |
Series A, Assured Guaranty, Pre-Refunded, 5.00%, 5/01/33 | | | 10,000,000 | | | | | | | | 10,062,000 | |
Series B, Pre-Refunded, 5.00%, 5/01/40 | | | 4,625,000 | | | | | | | | 4,964,197 | |
Massachusetts State College Building Authority Revenue, Federally Taxable, Refunding, Series D, 4.00%, 5/01/38 | | | 4,350,000 | | | | | | | | 4,538,311 | |
Massachusetts State Department of Transportation Metropolitan Highway System Revenue, Commonwealth Contract Assistance Secured, Series B, 5.00%, 1/01/35 | | | 16,165,000 | | | | | | | | 17,037,910 | |
Massachusetts State Educational Financing Authority Education Loan Revenue, | | | | | | | | | | | | |
Issue I, 6.00%, 1/01/28 | | | 4,540,000 | | | | | | | | 4,738,807 | |
Issue I, Refunding, Series A, 5.50%, 1/01/22 | | | 3,000,000 | | | | | | | | 3,163,830 | |
Massachusetts State GO, | | | | | | | | | | | | |
Consolidated Loan of 2014, Series F, 4.00%, 11/01/29 | | | 6,000,000 | | | | | | | | 6,393,720 | |
Consolidated Loan of 2017, Series A, 5.25%, 4/01/42 | | | 5,000,000 | | | | | | | | 5,823,500 | |
Series A, 5.00%, 1/01/47 | | | 5,000,000 | | | | | | | | 5,690,400 | |
Massachusetts State Health and Educational Facilities Authority Revenue, | | | | | | | | | | | | |
Boston College Issue, Series M-2, 5.50%, 6/01/35 | | | 8,600,000 | | | | | | | | 11,007,484 | |
Cable Housing and Health Services Issue, Series A, NATL Insured, 5.25%, 7/01/23 | | | 675,000 | | | | | | | | 675,587 | |
Cape Cod Healthcare Obligated Group Issue, Assured Guaranty, Pre-Refunded, 6.00%, 11/15/28 | | | 3,000,000 | | | | | | | | 3,222,870 | |
| | | | | | |
106 | | Annual Report | | | | franklintempleton.com |
FRANKLIN TAX-FREE TRUST
STATEMENT OF INVESTMENTS
Franklin Massachusetts Tax-Free Income Fund (continued)
| | | | | | | | | | | | |
| | | Principal
Amount | | | | | | Value | |
Municipal Bonds (continued) | | | | | | | | | | | | |
Massachusetts (continued) | | | | | | | | | | | | |
Massachusetts State Health and Educational Facilities Authority Revenue, (continued) | | | | | | | | | | | | |
Cape Cod Healthcare Obligated Group Issue, Assured Guaranty, Pre-Refunded, 5.125%, 11/15/35 | | | $ 3,150,000 | | | | | | | | $ 3,337,897 | |
Children’s Hospital Issue, Series M, 5.25%, 12/01/39 | | | 7,000,000 | | | | | | | | 7,442,050 | |
Lesley University Issue, Series A, Assured Guaranty, Pre-Refunded, 5.25%, 7/01/39 | | | 9,350,000 | | | | | | | | 9,808,711 | |
Partners Healthcare System Issue, Series J-1, Pre-Refunded, 5.00%, 7/01/39 | | | 4,345,000 | | | | | | | | 4,546,869 | |
Southcoast Health System Obligated Group Issue, Series D, 5.00%, 7/01/39 | | | 5,500,000 | | | | | | | | 5,683,810 | |
Sterling and Francine Clark Art Institute Issue, Series B, Pre-Refunded, 5.00%, 7/01/40 | | | 5,000,000 | | | | | | | | 5,393,250 | |
Massachusetts State HFA, MFHR, Section 8 Assisted, Series A, ETM, 7.00%, 4/01/21 | | | 430,000 | | | | | | | | 476,522 | |
Massachusetts State HFAR, | | | | | | | | | | | | |
Housing, Refunding, Series A, 3.25%, 12/01/27 | | | 4,000,000 | | | | | | | | 4,038,520 | |
Housing, Refunding, Series A, 3.50%, 12/01/31 | | | 5,805,000 | | | | | | | | 5,857,942 | |
Housing, Series C, 5.125%, 12/01/39 | | | 1,700,000 | | | | | | | | 1,730,209 | |
Housing, Series C, 5.35%, 12/01/49 | | | 4,500,000 | | | | | | | | 4,579,515 | |
Housing, Series D, 5.05%, 6/01/40 | | | 3,360,000 | | | | | | | | 3,419,136 | |
Housing, Series F, 3.15%, 12/01/32 | | | 1,305,000 | | | | | | | | 1,268,838 | |
Housing, Series F, 3.45%, 12/01/37 | | | 570,000 | | | | | | | | 555,602 | |
SF Housing, Series 159, 4.05%, 12/01/32 | | | 1,810,000 | | | | | | | | 1,850,327 | |
SF Housing, Series 162, 3.15%, 12/01/32 | | | 10,905,000 | | | | | | | | 10,590,500 | |
Massachusetts State Port Authority Revenue, Refunding, Series A, 5.00%, 7/01/34 | | | 2,260,000 | | | | | | | | 2,601,689 | |
Massachusetts State School Building Authority Dedicated Sales Tax Revenue, | | | | | | | | | | | | |
Senior, Refunding, Series C, 5.00%, 8/15/31 | | | 6,000,000 | | | | | | | | 6,930,300 | |
Senior, Refunding, Series C, 5.00%, 11/15/34 | | | 5,000,000 | | | | | | | | 5,777,300 | |
Senior, Series B, 5.00%, 10/15/41 | | | 10,000,000 | | | | | | | | 10,928,600 | |
Massachusetts State Special Obligation Dedicated Tax Revenue, | | | | | | | | | | | | |
Refunding, NATL Insured, 5.50%, 1/01/25 | | | 10,900,000 | | | | | | | | 13,001,629 | |
Refunding, NATL Insured, 5.50%, 1/01/34 | | | 16,900,000 | | | | | | | | 21,559,161 | |
Massachusetts State Transportation Fund Revenue, | | | | | | | | | | | | |
Accelerated Bridge Program, Series A, Pre-Refunded, 4.00%, 6/01/31 | | | 5,555,000 | | | | | | | | 5,956,849 | |
Rail Enhancement and Accelerated Bridge Programs, Series A, 5.00%, 6/01/41 | | | 2,200,000 | | | | | | | | 2,510,640 | |
Rail Enhancement and Accelerated Bridge Programs, Series A, 5.00%, 6/01/42 | | | 5,000,000 | | | | | | | | 5,736,800 | |
Rail Enhancement and Accelerated Bridge Programs, Series B, 4.00%, 6/01/45 | | | 7,175,000 | | | | | | | | 7,408,977 | |
Massachusetts State Water Pollution Abatement Trust Revenue, | | | | | | | | | | | | |
Pooled Loan Program, Series 6, 5.50%, 8/01/30 | | | 195,000 | | | | | | | | 195,663 | |
Pooled Loan Program, Series 7, 5.125%, 2/01/31 | | | 260,000 | | | | | | | | 260,806 | |
State Revolving Fund, Refunding, 5.00%, 8/01/23 | | | 3,000,000 | | | | | | | | 3,457,920 | |
Water Pollution Abatement, MWRA Program, Subordinate, Refunding, Series A, 5.75%, 8/01/29 | | | 250,000 | | | | | | | | 250,898 | |
Massachusetts Water Resources Authority Revenue, | | | | | | | | | | | | |
General, Green Bonds, Refunding, Series C, 5.00%, 8/01/40 | | | 6,875,000 | | | | | | | | 7,885,075 | |
General, Green Bonds, Series B, 5.00%, 8/01/40 | | | 1,140,000 | | | | | | | | 1,318,672 | |
General, Green Bonds, Series B, 5.00%, 8/01/42 | | | 3,145,000 | | | | | | | | 3,629,582 | |
General, Refunding, Series B, AGMC Insured, 5.25%, 8/01/28 | | | 5,490,000 | | | | | | | | 6,821,050 | |
Metropolitan Boston Transit Parking Corp. Systemwide Parking Revenue, | | | | | | | | | | | | |
senior lien, 5.00%, 7/01/41 | | | 7,500,000 | | | | | | | | 8,112,825 | |
senior lien, Refunding, 5.25%, 7/01/36 | | | 5,585,000 | | | | | | | | 6,132,777 | |
Plymouth GO, Municipal Purpose Loan, Refunding, 4.00%, 5/01/47 | | | 5,000,000 | | | | | | | | 5,119,400 | |
Springfield Water and Sewer Commission Revenue, General, Series C, 5.00%, 4/15/37 | | | 1,260,000 | | | | | | | | 1,466,262 | |
Tewksbury GO, | | | | | | | | | | | | |
Fire Station, 3.00%, 6/01/34 | | | 750,000 | | | | | | | | 711,165 | |
Fire Station, 3.00%, 6/01/35 | | | 750,000 | | | | | | | | 705,060 | |
Fire Station, 3.00%, 6/01/36 | | | 750,000 | | | | | | | | 691,732 | |
| | | | | | |
franklintempleton.com | | | | Annual Report | | 107 |
FRANKLIN TAX-FREE TRUST
STATEMENT OF INVESTMENTS
Franklin Massachusetts Tax-Free Income Fund (continued)
| | | | | | | | | | | | |
| | | Principal
Amount | | | | | | Value | |
Municipal Bonds (continued) | | | | | | | | | | | | |
Massachusetts (continued) | | | | | | | | | | | | |
University of Massachusetts Building Authority Project Revenue, | | | | | | | | | | | | |
Refunding, Senior Series 1, 5.00%, 11/01/44 | | $ | 4,000,000 | | | | | | | | $ 4,487,480 | |
Senior Series 1, 5.25%, 11/01/42. | | | 5,000,000 | | | | | | | | 5,914,500 | |
Worcester GO, | | | | | | | | | | | | |
Municipal Purpose Loan, 3.25%, 11/01/25 | | | 3,370,000 | | | | | | | | 3,443,634 | |
Municipal Purpose Loan, 3.50%, 11/01/26 | | | 3,000,000 | | | | | | | | 3,071,520 | |
| | | | | | | | | | | | |
Total Municipal Bonds before Short Term Investments (Cost $465,404,327) | | | | | | | | | | | 479,906,897 | |
| | | | | | | | | | | | |
Short Term Investments (Cost $600,000) 0.1% | | | | | | | | | | | | |
Municipal Bonds 0.1% | | | | | | | | | | | | |
Massachusetts 0.1% | | | | | | | | | | | | |
a Massachusetts State Health and Educational Facilities Authority Revenue, Harvard University Issue,
Refunding, Series R, Daily VRDN and Put, 0.82%, 11/01/49 | | | 600,000 | | | | | | | | 600,000 | |
| | | | | | | | | | | | |
Total Investments (Cost $466,004,327) 99.0% | | | | | | | | | | | 480,506,897 | |
Other Assets, less Liabilities 1.0% | | | | | | | | | | | 4,708,250 | |
| | | | | | | | | | | | |
Net Assets 100.0%. | | | | | | | | | | | $485,215,147 | |
| | | | | | | | | | | | |
See Abbreviations on page 140.
a Variable rate demand notes (VRDNs) are obligations which contain a floating or variable interest rate adjustment formula and an unconditional right of demand to receive payment of the principal balance plus accrued interest at specified dates. Unless otherwise noted, the coupon rate is determined based on factors including supply and demand, underlying credit, tax treatment, and current short term rates. The coupon rate shown represents the rate at period end.
| | | | | | |
108 | | Annual Report | | | The accompanying notes are an integral part of these financial statements. | | franklintempleton.com |
FRANKLIN TAX-FREE TRUST
Financial Highlights
Franklin New Jersey Tax-Free Income Fund
| | | | | | | | | | | | | | | | | | | | |
| | | Year Ended February 28, | |
| | | 2018 | | | 2017 | | | 2016a | | | 2015 | | | 2014 | |
| | | | | |
Class A | | | | | | | | | | | | | | | | | | | | |
| | | | | |
Per share operating performance | | | | | | | | | | | | | | | | | | | | |
(for a share outstanding throughout the year) | | | | | | | | | | | | | | | | | | | | |
| | | | | |
Net asset value, beginning of year | | | $11.45 | | | | $11.73 | | | | $11.95 | | | | $11.76 | | | | $12.62 | |
| | | | | |
Income from investment operationsb: | | | | | | | | | | | | | | | | | | | | |
| | | | | |
Net investment incomec | | | 0.39 | | | | 0.44 | | | | 0.46 | | | | 0.47 | | | | 0.46 | |
| | | | | |
Net realized and unrealized gains (losses) | | | (0.31 | ) | | | (0.27 | ) | | | (0.23 | ) | | | 0.20 | | | | (0.87 | ) |
| | | | | |
Total from investment operations | | | 0.08 | | | | 0.17 | | | | 0.23 | | | | 0.67 | | | | (0.41 | ) |
| | | | | |
Less distributions from net investment income | | | (0.42 | ) | | | (0.45 | ) | | | (0.45 | ) | | | (0.48 | ) | | | (0.45 | ) |
| | | | | |
Net asset value, end of year. | | | $11.11 | | | | $11.45 | | | | $11.73 | | | | $11.95 | | | | $11.76 | |
| | | | | |
Total returnd | | | 0.68% | | | | 1.44% | | | | 1.99% | | | | 5.75% | | | | (3.22)% | |
| | | | | |
Ratios to average net assets | | | | | | | | | | | | | | | | | | | | |
| | | | | |
Expenses | | | 0.67% | | | | 0.65% | | | | 0.64% | | | | 0.64% | | | | 0.63% | |
| | | | | |
Net investment income | | | 3.46% | | | | 3.79% | | | | 3.96% | | | | 3.98% | | | | 3.88% | |
| | | | | |
Supplemental data | | | | | | | | | | | | | | | | | | | | |
| | | | | |
Net assets, end of year (000’s) | | | $650,527 | | | | $742,824 | | | | $793,062 | | | | $893,018 | | | | $974,154 | |
| | | | | |
Portfolio turnover rate | | | 12.70% | | | | 9.20% | | | | 5.24% | | | | 4.81% | | | | 9.73% | |
a For the year ended February 29.
b The amount shown for a share outstanding throughout the period may not correlate with the Statement of Operations for the period due to the timing of sales and repurchases of the Fund’s shares in relation to income earned and/or fluctuating fair value of the investments of the Fund.
c Based on average daily shares outstanding.
d Total return does not reflect sales commissions or contingent deferred sales charges, if applicable.
| | | | | | |
franklintempleton.com | | | | The accompanying notes are an integral part of these financial statements. | Annual Report | | 109 |
FRANKLIN TAX-FREE TRUST
FINANCIAL HIGHLIGHTS
Franklin New Jersey Tax-Free Income Fund (continued)
| | | | | | | | | | | | | | | | | | | | |
| | | Year Ended February 28, | |
| | | 2018 | | | 2017 | | | 2016a | | | 2015 | | | 2014 | |
| | | | | |
Class C | | | | | | | | | | | | | | | | | | | | |
| | | | | |
Per share operating performance (for a share outstanding throughout the year) | | | | | | | | | | | | | | | | | | | | |
| | | | | |
Net asset value, beginning of year | | | $11.60 | | | | $11.87 | | | | $12.09 | | | | $11.89 | | | | $12.76 | |
| | | | |
| | | | | |
Income from investment operationsb: | | | | | | | | | | | | | | | | | | | | |
| | | | | |
Net investment incomec | | | 0.33 | | | | 0.38 | | | | 0.40 | | | | 0.41 | | | | 0.40 | |
| | | | | |
Net realized and unrealized gains (losses) | | | (0.32 | ) | | | (0.27 | ) | | | (0.24 | ) | | | 0.20 | | | | (0.89 | ) |
| | | | |
| | | | | |
Total from investment operations | | | 0.01 | | | | 0.11 | | | | 0.16 | | | | 0.61 | | | | (0.49 | ) |
| | | | |
| | | | | |
Less distributions from net investment income | | | (0.35 | ) | | | (0.38 | ) | | | (0.38 | ) | | | (0.41 | ) | | | (0.38 | ) |
| | | | |
| | | | | |
Net asset value, end of year | | | $11.26 | | | | $11.60 | | | | $11.87 | | | | $12.09 | | | | $11.89 | |
| | | | |
| | | | | |
Total returnd | | | 0.11% | | | | 0.95% | | | | 1.42% | | | | 5.20% | | | | (3.80)% | |
| | | | | |
Ratios to average net assets | | | | | | | | | | | | | | | | | | | | |
| | | | | |
Expenses | | | 1.22% | | | | 1.20% | | | | 1.19% | | | | 1.19% | | | | 1.18% | |
| | | | | |
Net investment income | | | 2.91% | | | | 3.24% | | | | 3.41% | | | | 3.43% | | | | 3.33% | |
| | | | | |
Supplemental data | | | | | | | | | | | | | | | | | | | | |
| | | | | |
Net assets, end of year (000’s) | | | $188,806 | | | | $217,952 | | | | $216,813 | | | | $231,740 | | | | $247,538 | |
| | | | | |
Portfolio turnover rate | | | 12.70% | | | | 9.20% | | | | 5.24% | | | | 4.81% | | | | 9.73% | |
a For the year ended February 29.
b The amount shown for a share outstanding throughout the period may not correlate with the Statement of Operations for the period due to the timing of sales and repurchases of the Fund’s shares in relation to income earned and/or fluctuating fair value of the investments of the Fund.
c Based on average daily shares outstanding.
d Total return does not reflect sales commissions or contingent deferred sales charges, if applicable.
| | | | | | |
110 | | Annual Report | | | The accompanying notes are an integral part of these financial statements. | | franklintempleton.com |
FRANKLIN TAX-FREE TRUST
FINANCIAL HIGHLIGHTS
Franklin New Jersey Tax-Free Income Fund (continued)
| | | | |
| | | Year Ended February 28, 2018a | |
| |
Class R6 | | | | |
| |
Per share operating performance (for a share outstanding throughout the year) | | | | |
| |
Net asset value, beginning of year | | | $11.37 | |
| | | | |
| |
Income from investment operationsb: | | | | |
| |
Net investment incomec | | | 0.25 | |
| |
Net realized and unrealized gains (losses) | | | (0.26 | ) |
| | | | |
| |
Total from investment operations | | | (0.01 | ) |
| | | | |
| |
Less distributions from net investment income | | | (0.24 | ) |
| | | | |
| |
Net asset value, end of year | | | $11.12 | |
| | | | |
| |
Total returnd | | | (0.11)% | |
| |
Ratios to average net assetse | | | | |
| |
Expenses before waiver and payments by affiliates | | | 0.54% | |
| |
Expenses net of waiver and payments by affiliates | | | 0.53% | |
| |
Net investment income | | | 3.60% | |
| |
Supplemental data | | | | |
| |
Net assets, end of year (000’s) | | | $19,936 | |
| |
Portfolio turnover rate | | | 12.70% | |
a For the period August 1, 2017 (effective date) to February 28, 2018.
b The amount shown for a share outstanding throughout the period may not correlate with the Statement of Operations for the period due to the timing of sales and repurchases of the Fund’s shares in relation to income earned and/or fluctuating fair value of the investments of the Fund.
c Based on average daily shares outstanding.
d Total return is not annualized for periods less than one year.
e Ratios are annualized for periods less than one year.
| | | | | | |
franklintempleton.com | | | | The accompanying notes are an integral part of these financial statements. | Annual Report | | 111 |
FRANKLIN TAX-FREE TRUST
FINANCIAL HIGHLIGHTS
Franklin New Jersey Tax-Free Income Fund (continued)
| | | | | | | | | | | | | | | | | | | | |
| | | Year Ended February 28, | |
| | | 2018 | | | 2017 | | | 2016a | | | 2015 | | | 2014 | |
| | | | | |
Advisor Class | | | | | | | | | | | | | | | | | | | | |
| | | | | |
Per share operating performance (for a share outstanding throughout the year) | | | | | | | | | | | | | | | | | | | | |
| | | | | |
Net asset value, beginning of year | | | $11.46 | | | | $11.74 | | | | $11.96 | | | | $11.77 | | | | $12.63 | |
| | | | |
| | | | | |
Income from investment operationsb: | | | | | | | | | | | | | | | | | | | | |
| | | | | |
Net investment incomec | | | 0.40 | | | | 0.46 | | | | 0.47 | | | | 0.49 | | | | 0.47 | |
| | | | | |
Net realized and unrealized gains (losses) | | | (0.31 | ) | | | (0.28 | ) | | | (0.23 | ) | | | 0.19 | | | | (0.87 | ) |
| | | | |
| | | | | |
Total from investment operations | | | 0.09 | | | | 0.18 | | | | 0.24 | | | | 0.68 | | | | (0.40 | ) |
| | | | |
| | | | | |
Less distributions from net investment income | | | (0.43 | ) | | | (0.46 | ) | | | (0.46 | ) | | | (0.49 | ) | | | (0.46 | ) |
| | | | |
| | | | | |
Net asset value, end of year | | | $11.12 | | | | $11.46 | | | | $11.74 | | | | $11.96 | | | | $11.77 | |
| | | | |
| | | | | |
Total return | | | 0.77% | | | | 1.54% | | | | 2.10% | | | | 5.86% | | | | (3.12)% | |
| | | | | |
Ratios to average net assets | | | | | | | | | | | | | | | | | | | | |
| | | | | |
Expenses | | | 0.57% | | | | 0.55% | | | | 0.54% | | | | 0.54% | | | | 0.53% | |
| | | | | |
Net investment income | | | 3.56% | | | | 3.89% | | | | 4.06% | | | | 4.08% | | | | 3.98% | |
| | | | | |
Supplemental data | | | | | | | | | | | | | | | | | | | | |
| | | | | |
Net assets, end of year (000’s) | | | $79,286 | | | | $107,087 | | | | $91,175 | | | | $92,059 | | | | $63,162 | |
| | | | | |
Portfolio turnover rate | | | 12.70% | | | | 9.20% | | | | 5.24% | | | | 4.81% | | | | 9.73% | |
a For the year ended February 29.
b The amount shown for a share outstanding throughout the period may not correlate with the Statement of Operations for the period due to the timing of sales and repurchases of the Fund’s shares in relation to income earned and/or fluctuating fair value of the investments of the Fund.
c Based on average daily shares outstanding.
| | | | | | |
112 | | Annual Report | | | The accompanying notes are an integral part of these financial statements. | | franklintempleton.com |
FRANKLIN TAX-FREE TRUST
Statement of Investments, February 28, 2018
Franklin New Jersey Tax-Free Income Fund
| | | | | | | | |
| | | Principal
Amount | | | Value | |
Municipal Bonds 98.8% | | | | | | | | |
Delaware 0.7% | | | | | | | | |
Delaware River and Bay Authority Revenue, Series A, 5.00%, 1/01/42 | | $ | 6,000,000 | | | $ | 6,555,420 | |
| | | | | | | | |
New Jersey 84.5% | | | | | | | | |
Cape May County Industrial PCFA Revenue, Atlantic City Electric Co. Project, Refunding, Series A, NATL
Insured, 6.80%, 3/01/21 | | | 5,400,000 | | | | 6,039,954 | |
Cumberland County Improvement Authority Revenue, Technical High School Project, AGMC Insured,
5.00%, 9/01/39 | | | 2,000,000 | | | | 2,232,040 | |
Gloucester County Improvement Authority Revenue, Rowan University Business and Engineering School
Projects, Series C, 5.00%, 7/01/44 | | | 3,500,000 | | | | 3,836,700 | |
Hudson County Improvement Authority Lease Revenue, County Secured, Hudson County Vocational-
Technical Schools Project, 5.00%, 5/01/46 | | | 6,000,000 | | | | 6,733,620 | |
Hudson County Improvement Authority Parking Revenue, County-Guaranteed, Harrison Parking Facility Redevelopment Project, Series C, Assured Guaranty, 5.125%, 1/01/34 | | | 2,000,000 | | | | 2,055,880 | |
Middlesex County COP, Capital Appreciation, NATL Insured, zero cpn., 6/15/24 | | | 1,000,000 | | | | 834,960 | |
Middlesex County Improvement Authority Lease Revenue, County Guaranteed, Regional Educational
Services Commission Projects, Pre-Refunded, 5.25%, 12/15/33 | | | 3,000,000 | | | | 3,092,550 | |
New Brunswick Parking Authority Revenue, City Guaranteed, Refunding, Series A, BAM Insured, 5.00%,
9/01/39 | | | 5,000,000 | | | | 5,613,550 | |
New Jersey EDA, | | | | | | | | |
GO Lease Revenue, Rutgers University, College Avenue Redevelopment Project, 5.00%, 6/15/38 | | | 5,000,000 | | | | 5,557,550 | |
GO Lease Revenue, Rutgers University, College Avenue Redevelopment Project, 5.00%, 6/15/46 | | | 7,500,000 | | | | 8,305,200 | |
New Jersey EDA Revenue, | | | | | | | | |
Cigarette Tax, Refunding, 5.00%, 6/15/28 | | | 3,000,000 | | | | 3,223,260 | |
Cigarette Tax, Refunding, 5.00%, 6/15/29 | | | 1,000,000 | | | | 1,071,930 | |
Cigarette Tax, Refunding, Assured Guaranty, 5.00%, 6/15/22 | | | 10,000,000 | | | | 10,882,300 | |
Montclair State University Student Housing Project, Provident Group, Montclair Properties LLC, Series A, Pre-Refunded, 5.875%, 6/01/42 | | | 17,950,000 | | | | 19,640,890 | |
Municipal Rehabilitation, Series A, AMBAC Insured, 5.00%, 4/01/28 | | | 15,000,000 | | | | 15,223,800 | |
Provident Group-Kean Properties LLC, Kean University Student Housing Project, Series A, 5.00%,
7/01/32 | | | 640,000 | | | | 698,125 | |
Provident Group-Kean Properties LLC, Kean University Student Housing Project, Series A, 5.00%,
7/01/37 | | | 600,000 | | | | 645,162 | |
Provident Group-Kean Properties LLC, Kean University Student Housing Project, Series A, 5.00%,
7/01/47 | | | 1,500,000 | | | | 1,599,090 | |
Provident Group-Montclair Properties LLC, State University Student Housing Project, Refunding,
AGMC Insured, 5.00%, 6/01/37 | | | 3,000,000 | | | | 3,347,700 | |
Provident Group-Montclair Properties LLC, State University Student Housing Project, Refunding,
AGMC Insured, 5.00%, 6/01/42 | | | 3,000,000 | | | | 3,325,200 | |
Provident Group-Rowan Properties LLC, Rowan University Student Housing Project, Series A, 5.00%,
1/01/48 | | | 7,000,000 | | | | 7,392,980 | |
School Facilities Construction, Refunding, Series K, NATL Insured, 5.25%, 12/15/21 | | | 10,000,000 | | | | 10,949,200 | |
School Facilities Construction, Refunding, Series N-1, NATL Insured, 5.50%, 9/01/27 | | | 8,660,000 | | | | 10,056,858 | |
School Facilities Construction, Series WW, 5.00%, 6/15/37 | | | 4,760,000 | | | | 4,993,573 | |
School Facilities Construction, Series Z, Assured Guaranty, 5.50%, 12/15/34 | | | 25,000 | | | | 25,686 | |
School Facilities Construction, Series Z, Assured Guaranty, Pre-Refunded, 5.50%, 12/15/34 | | | 1,960,000 | | | | 2,024,288 | |
School Facilities Construction, Series Z, Assured Guaranty, Pre-Refunded, 5.50%, 12/15/34 | | | 1,015,000 | | | | 1,047,886 | |
New Jersey EDA Water Facilities Revenue, | | | | | | | | |
New Jersey-American Water Co. Inc. Project, Refunding, Series A, 5.70%, 10/01/39 | | | 10,000,000 | | | | 10,535,800 | |
New Jersey-American Water Co. Inc. Project, Refunding, Series B, 5.00%, 10/01/39 | | | 8,750,000 | | | | 9,181,462 | |
| | | | | | |
franklintempleton.com | | | | Annual Report | | 113 |
FRANKLIN TAX-FREE TRUST
STATEMENT OF INVESTMENTS
Franklin New Jersey Tax-Free Income Fund (continued)
| | | | | | | | |
| | | Principal
Amount | | | Value | |
Municipal Bonds (continued) | | | | | | | | |
New Jersey (continued) | | | | | | | | |
New Jersey Health Care Facilities Financing Authority Revenue, | | | | | | | | |
Atlantic Health System Hospital Corp. Issue, Pre-Refunded, 6.00%, 7/01/41 | | $ | 10,600,000 | | | $ | 12,047,324 | |
Atlantic Health System Hospital Corp. Issue, Refunding, 4.00%, 7/01/41 | | | 10,000,000 | | | | 10,081,400 | |
Atlantic Health System Hospital Corp. Issue, Refunding, Series A, 5.00%, 7/01/27 | | | 220,000 | | | | 222,468 | |
Atlantic Health System Hospital Corp. Issue, Series A, Pre-Refunded, 5.00%, 7/01/27 | | | 7,780,000 | | | | 7,875,772 | |
Barnabas Health Issue, Series A, Pre-Refunded, 5.625%, 7/01/32 | | | 5,500,000 | | | | 6,156,150 | |
Barnabas Health Obligated Group Issue, Refunding, Series A, 5.00%, 7/01/44 | | | 15,530,000 | | | | 16,780,165 | |
Hackensack Meridian Health Obligated Group Issue, Refunding, Series A, 5.00%, 7/01/38 | | | 3,000,000 | | | | 3,406,590 | |
Hackensack Meridian Health Obligated Group Issue, Refunding, Series A, 5.00%, 7/01/39 | | | 5,000,000 | | | | 5,660,450 | |
Hunterdon Medical Center Obligated Group Issue, Refunding, Series A, 5.00%, 7/01/45 | | | 2,650,000 | | | | 2,861,788 | |
Inspira Health Obligated Group Issue, Refunding, Series A, 5.00%, 7/01/37 | | | 1,600,000 | | | | 1,793,632 | |
Inspira Health Obligated Group Issue, Refunding, Series A, 5.00%, 7/01/46 | | | 18,500,000 | | | | 20,366,095 | |
Inspira Health Obligated Group Issue, Series A, 5.00%, 7/01/42 | | | 8,000,000 | | | | 8,900,720 | |
Inspira Health Obligated Group Issue, Series A, 4.00%, 7/01/47 | | | 8,700,000 | | | | 8,746,806 | |
Meridian Health System Obligated Group Issue, Refunding, 5.00%, 7/01/27 | | | 2,500,000 | | | | 2,750,375 | |
Meridian Health System Obligated Group Issue, Tranche I, Assured Guaranty, Pre-Refunded, 5.00%,
7/01/38 | | | 9,465,000 | | | | 9,581,514 | |
Meridian Health System Obligated Group Issue, Tranche II, Assured Guaranty, Pre-Refunded, 5.00%,
7/01/38 | | | 6,000,000 | | | | 6,073,860 | |
Robert Wood Johnson University Hospital Issue, Series A, 5.00%, 7/01/43 | | | 3,650,000 | | | | 4,013,394 | |
Robert Wood Johnson University Hospital Issue, Series A, 5.50%, 7/01/43 | | | 4,000,000 | | | | 4,511,320 | |
RWJ Barnabas Health Obligated Group Issue, Refunding, Series A, 5.00%, 7/01/43 | | | 15,000,000 | | | | 16,558,500 | |
St. Luke’s Warren Hospital Obligated Group Issue, Refunding, 5.00%, 8/15/31 | | | 2,935,000 | | | | 3,208,836 | |
St. Luke’s Warren Hospital Obligated Group Issue, Refunding, 5.00%, 8/15/34 | | | 1,500,000 | | | | 1,627,395 | |
St. Peter’s University Hospital Obligated Group Issue, Refunding, 6.00%, 7/01/26 | | | 1,000,000 | | | | 1,070,740 | |
St. Peter’s University Hospital Obligated Group Issue, Refunding, 6.25%, 7/01/35 | | | 3,400,000 | | | | 3,654,728 | |
Virtua Health Issue, Series A, Assured Guaranty, 5.50%, 7/01/38 | | | 10,000,000 | | | | 10,455,600 | |
New Jersey Health Care Facilities Financing Authority State Contract Revenue, | | | | | | | | |
Hospital Asset Transformation Program, Series A, 5.75%, 10/01/31 | | | 10,000,000 | | | | 10,506,700 | |
Hospital Asset Transformation Program, Series A, Pre-Refunded, 5.25%, 10/01/38 | | | 15,000,000 | | | | 15,342,434 | |
New Jersey Institute of Technology GO, | | | | | | | | |
Series A, 5.00%, 7/01/42 | | | 4,860,000 | | | | 5,305,468 | |
Series A, 5.00%, 7/01/45 | | | 6,000,000 | | | | 6,712,920 | |
Series A, Pre-Refunded, 5.00%, 7/01/42 | | | 2,140,000 | | | | 2,418,286 | |
New Jersey State COP, Equipment Lease Purchase Agreement, Series A, Pre-Refunded, 5.25%, 6/15/29 | | | 1,000,000 | | | | 1,046,520 | |
New Jersey State Educational Facilities Authority Revenue, | | | | | | | | |
The College of New Jersey Issue, Refunding, Series F, 4.00%, 7/01/35 | | | 1,850,000 | | | | 1,897,416 | |
Kean University Issue, Refunding, Series D, BAM Insured, 4.00%, 9/01/38 | | | 1,150,000 | | | | 1,188,594 | |
Kean University Issue, Refunding, Series H, AGMC Insured, 5.00%, 7/01/34 | | | 2,205,000 | | | | 2,445,698 | |
Kean University Issue, Refunding, Series H, AGMC Insured, 5.00%, 7/01/35 | | | 5,000,000 | | | | 5,532,100 | |
Kean University Issue, Series A, Pre-Refunded, 5.50%, 9/01/36 | | | 8,500,000 | | | | 8,984,585 | |
Montclair State University Issue, Refunding, Series A, 5.00%, 7/01/44 | | | 10,415,000 | | | | 11,525,135 | |
Montclair State University Issue, Refunding, Series B, 5.00%, 7/01/34 | | | 2,325,000 | | | | 2,626,994 | |
Montclair State University Issue, Refunding, Series D, 5.00%, 7/01/35 | | | 2,245,000 | | | | 2,502,434 | |
Montclair State University Issue, Refunding, Series D, 5.00%, 7/01/36 | | | 1,210,000 | | | | 1,346,246 | |
Montclair State University Issue, Series A, 5.00%, 7/01/39 | | | 5,000,000 | | | | 5,554,200 | |
Montclair State University Issue, Series J, Pre-Refunded, 5.25%, 7/01/38 | | | 2,000,000 | | | | 2,025,920 | |
Princeton University, Refunding, Series B, 5.00%, 7/01/44 | | | 15,000,000 | | | | 17,041,500 | |
Princeton University, Series B, 5.00%, 7/01/39 | | | 15,000,000 | | | | 16,422,150 | |
Princeton University, Series B, 4.375%, 7/01/41 | | | 10,000,000 | | | | 10,516,700 | |
Ramapo College of New Jersey Issue, Series A, AGMC insured, 5.00%, 7/01/35 | | | 3,955,000 | | | | 4,491,021 | |
| | | | | | |
114 | | Annual Report | | | | franklintempleton.com |
FRANKLIN TAX-FREE TRUST
STATEMENT OF INVESTMENTS
Franklin New Jersey Tax-Free Income Fund (continued)
| | | | | | | | |
| | | Principal
Amount | | | Value | |
Municipal Bonds (continued) | | | | | | | | |
New Jersey (continued) | | | | | | | | |
New Jersey State Educational Facilities Authority Revenue, (continued) | | | | | | | | |
Ramapo College of New Jersey Issue, Series B, 5.00%, 7/01/37 | | $ | 1,000,000 | | | $ | 1,088,250 | |
Ramapo College of New Jersey Issue, Series B, 5.00%, 7/01/42 | | | 1,000,000 | | | | 1,084,850 | |
The Richard Stockton College of New Jersey Issue, Series A, Pre-Refunded, 5.375%, 7/01/38 | | | 5,000,000 | | | | 5,066,050 | |
Seton Hall University Issue, Refunding, Series C, 5.00%, 7/01/34 | | | 400,000 | | | | 443,388 | |
Seton Hall University Issue, Refunding, Series C, 5.00%, 7/01/37 | | | 1,300,000 | | | | 1,433,016 | |
Seton Hall University Issue, Refunding, Series D, 5.00%, 7/01/42 | | | 4,945,000 | | | | 5,530,884 | |
Seton Hall University Issue, Series E, Pre-Refunded, 6.25%, 7/01/37 | | | 5,000,000 | | | | 5,310,900 | |
Stevens Institute of Technology Issue, Refunding, Series A, 5.00%, 7/01/42 | | | 6,250,000 | | | | 6,958,937 | |
Stevens Institute of Technology Issue, Refunding, Series A, 5.00%, 7/01/47 | | | 4,085,000 | | | | 4,531,205 | |
Stevens Institute of Technology Issue, Series I, ETM, 5.00%, 7/01/18 | | | 100,000 | | | | 101,197 | |
Stevens Institute of Technology Issue, Series I, ETM, 5.00%, 7/01/28 | | | 710,000 | | | | 814,043 | |
The William Paterson University of New Jersey Issue, Refunding, Series C, Assured Guaranty, 5.00%,
7/01/38 | | | 395,000 | | | | 398,551 | |
New Jersey State Higher Education Assistance Authority Student Loan Revenue, | | | | | | | | |
Refunding, Series 1, 5.875%, 12/01/33 | | | 2,140,000 | | | | 2,316,122 | |
Refunding, Series 1A, 5.125%, 12/01/27 | | | 2,670,000 | | | | 2,793,274 | |
Refunding, Series 1A, 5.25%, 12/01/28 | | | 2,680,000 | | | | 2,809,122 | |
Series 2, 5.00%, 12/01/26 | | | 580,000 | | | | 614,754 | |
Series 2, 5.00%, 12/01/27 | | | 425,000 | | | | 449,773 | |
Series 2, 5.00%, 12/01/28 | | | 440,000 | | | | 465,287 | |
Series 2, 5.00%, 12/01/30 | | | 1,500,000 | | | | 1,583,355 | |
Series 2, 5.00%, 12/01/36 | | | 1,000,000 | | | | 1,053,940 | |
Series A, 5.625%, 6/01/30 | | | 14,500,000 | | | | 15,092,470 | |
Series A, Assured Guaranty, 6.125%, 6/01/30 | | | 4,730,000 | | | | 4,763,961 | |
New Jersey State Housing and Mortgage Finance Agency MFHR, Series I, 5.75%, 11/01/38 | | | 2,490,000 | | | | 2,497,520 | |
New Jersey State Transportation Trust Fund Authority Revenue, | | | | | | | | |
Transportation Program, Series AA, 5.25%, 6/15/31 | | | 10,000,000 | | | | 10,702,700 | |
Transportation System, Capital Appreciation, Series A, zero cpn., 12/15/29 | | | 5,000,000 | | | | 2,969,500 | |
Transportation System, Capital Appreciation, Series A, zero cpn., 12/15/32 | | | 10,000,000 | | | | 5,082,400 | |
Transportation System, Capital Appreciation, Series C, AGMC Insured, zero cpn., 12/15/33 | | | 10,000,000 | | | | 5,148,500 | |
Transportation System, Series A, 6.00%, 12/15/38 | | | 16,110,000 | | | | 16,587,661 | |
Transportation System, Series A, 5.50%, 6/15/41 | | | 5,000,000 | | | | 5,267,850 | |
Transportation System, Series A, AGMC Insured, 5.00%, 12/15/34 | | | 15,000,000 | | | | 15,031,950 | |
Transportation System, Series A, AMBAC Insured, 5.00%, 12/15/32 | | | 10,000,000 | | | | 10,021,400 | |
Transportation System, Series A, Pre-Refunded, 6.00%, 12/15/38 | | | 8,890,000 | | | | 9,212,707 | |
New Jersey State Turnpike Authority Revenue, | | | | | | | | |
Turnpike, Refunding, Series B, 5.00%, 1/01/40 | | | 20,745,000 | | | | 23,553,666 | |
Turnpike, Refunding, Series G, 4.00%, 1/01/43 | | | 5,000,000 | | | | 5,118,350 | |
Turnpike, Series A, 5.00%, 1/01/34 | | | 6,505,000 | | | | 7,420,774 | |
Turnpike, Series A, 5.00%, 1/01/35 | | | 3,495,000 | | | | 3,975,458 | |
Turnpike, Series E, Pre-Refunded, 5.25%, 1/01/40 | | | 30,000,000 | | | | 30,965,100 | |
Turnpike, Series H, Pre-Refunded, 5.00%, 1/01/36 | | | 9,100,000 | | | | 9,374,001 | |
Turnpike, Series H, Pre-Refunded, 5.00%, 1/01/36 | | | 4,900,000 | | | | 5,043,423 | |
Turnpike, Series I, Pre-Refunded, 5.00%, 1/01/35 | | | 5,000,000 | | | | 5,312,850 | |
Newark Housing Authority Port Authority Revenue, Newark Marine Terminal, City of Newark
Redevelopment Projects, Refunding, 4.00%, 1/01/37 | | | 20,745,000 | | | | 21,664,626 | |
North Hudson Sewerage Authority Gross Revenue, Lease Certificates, Refunding, Series A, 5.00%,
6/01/42 | | | 17,800,000 | | | | 19,305,168 | |
Passaic County Improvement Authority County Guaranteed Parking Revenue, 200 Hospital Plaza Corp.
Project, Pre-Refunded, 5.00%, 5/01/42 | | | 3,200,000 | | | | 3,434,688 | |
| | | | | | |
franklintempleton.com | | | | Annual Report | | 115 |
FRANKLIN TAX-FREE TRUST
STATEMENT OF INVESTMENTS
Franklin New Jersey Tax-Free Income Fund (continued)
| | | | | | | | |
| | | Principal
Amount | | | Value | |
Municipal Bonds (continued) | | | | | | | | |
New Jersey (continued) | | | | | | | | |
Rutgers State University GO, | | | | | | | | |
Series F, Pre-Refunded, 5.00%, 5/01/39 | | $ | 20,000,000 | | | $ | 20,823,200 | |
Series L, 5.00%, 5/01/43 | | | 12,000,000 | | | | 13,248,480 | |
Salem County PCFA, PCR, Atlantic City Electric Co. Project, Refunding, Series A, 4.875%, 6/01/29 | | | 5,000,000 | | | | 5,263,750 | |
Somerset County GO, | | | | | | | | |
Refunding, 4.00%, 8/01/27 | | | 1,000,000 | | | | 1,124,220 | |
Refunding, 4.00%, 8/01/28 | | | 1,405,000 | | | | 1,568,289 | |
Refunding, 4.00%, 8/01/29 | | | 1,000,000 | | | | 1,108,290 | |
Sussex County Municipal Utilities Authority Wastewater Facilities Revenue, | | | | | | | | |
Capital Appreciation, Series B, AGMC Insured, Pre-Refunded, zero cpn., 12/01/35 | | | 2,815,000 | | | | 1,103,564 | |
Capital Appreciation, Series B, AGMC Insured, Pre-Refunded, zero cpn., 12/01/36 | | | 2,810,000 | | | | 1,037,761 | |
Capital Appreciation, Series B, AGMC Insured, Pre-Refunded, zero cpn., 12/01/37 | | | 2,815,000 | | | | 980,802 | |
Capital Appreciation, Series B, AGMC Insured, Pre-Refunded, zero cpn., 12/01/38 | | | 2,810,000 | | | | 921,680 | |
| | | | | | | | |
| | | | | | | 793,579,494 | |
| | | | | | | | |
New York 8.5% | | | | | | | | |
Port Authority of New York and New Jersey Revenue, | | | | | | | | |
Consolidated, One Hundred Fifty-Third Series, Refunding, 5.00%, 7/15/38 | | | 8,850,000 | | | | 8,969,475 | |
Consolidated, One Hundred Sixty-First Series, 5.00%, 10/15/33 | | | 10,000,000 | | | | 10,534,600 | |
Consolidated, Refunding, One Hundred Seventy-First Series, 5.00%, 7/15/30 | | | 12,200,000 | | | | 13,450,622 | |
Consolidated, Refunding, One Hundred Seventy-Ninth Series, 5.00%, 12/01/38 | | | 15,000,000 | | | | 16,969,650 | |
Consolidated, Refunding, One Hundred Sixtieth Series, 5.00%, 9/15/36 | | | 15,000,000 | | | | 15,751,950 | |
Consolidated, Refunding, One Hundred Sixty-Sixth Series, 5.25%, 7/15/36 | | | 5,000,000 | | | | 5,468,450 | |
Port Authority of New York and New Jersey Special Project Revenue, JFK International Air Terminal LLC
Project, NATL Insured, 5.75%, 12/01/22 | | | 8,000,000 | | | | 8,400,480 | |
| | | | | | | | |
| | | | | | | 79,545,227 | |
| | | | | | | | |
Pennsylvania 4.3% | | | | | | | | |
Delaware River Joint Toll Bridge Commission Revenue, Bridge System, 5.00%, 7/01/42 | | | 12,500,000 | | | | 14,140,500 | |
Delaware River Port Authority Revenue, | | | | | | | | |
5.00%, 1/01/37 | | | 10,000,000 | | | | 11,050,900 | |
Series E, 5.00%, 1/01/35 | | | 14,000,000 | | | | 14,756,000 | |
| | | | | | | | |
| | | | | | | 39,947,400 | |
| | | | | | | | |
U.S. Territories 0.8% | | | | | | | | |
Puerto Rico 0.8% | | | | | | | | |
a Puerto Rico Electric Power Authority Power Revenue, | | | | | | | | |
Series WW, 5.50%, 7/01/38 | | | 16,620,000 | | | | 6,253,275 | |
Series XX, 5.25%, 7/01/40 | | | 3,125,000 | | | | 1,175,781 | |
| | | | | | | | |
| | | | | | | 7,429,056 | |
| | | | | | | | |
Total Municipal Bonds before Short Term Investments (Cost $906,570,999) | | | | | | | 927,056,597 | |
| | | | | | | | |
| | | | | | |
116 | | Annual Report | | | | franklintempleton.com |
FRANKLIN TAX-FREE TRUST
STATEMENT OF INVESTMENTS
��
Franklin New Jersey Tax-Free Income Fund (continued)
| | | | | | | | |
| | | Principal
Amount | | | Value | |
Short Term Investments 0.4% | | | | | | | | |
Municipal Bonds 0.4% | | | | | | | | |
New Jersey 0.4% | | | | | | | | |
b New Jersey Health Care Facilities Financing Authority Revenue, | | | | | | | | |
Virtua Health Issue, Series B, LOC JPMorgan Chase Bank, Daily VRDN and Put, 1.00%, 7/01/43 | | $ | 1,400,000 | | | $ | 1,400,000 | |
Virtua Health Issue, Series C, LOC JPMorgan Chase Bank, Daily VRDN and Put, 1.00%, 7/01/43 | | | 3,000,000 | | | | 3,000,000 | |
| | | | | | | | |
Total Short Term Investments (Cost $4,400,000) | | | | | | | 4,400,000 | |
| | | | | | | | |
Total Investments (Cost $910,970,999) 99.2% | | | | | | | 931,456,597 | |
Other Assets, less Liabilities 0.8% | | | | | | | 7,098,416 | |
| | | | | | | | |
Net Assets 100.0% | | | | | | $ | 938,555,013 | |
| | | | | | | | |
See Abbreviations on page 140.
a See Note 7 regarding defaulted securities.
b Variable rate demand notes (VRDNs) are obligations which contain a floating or variable interest rate adjustment formula and an unconditional right of demand to receive payment of the principal balance plus accrued interest at specified dates. Unless otherwise noted, the coupon rate is determined based on factors including supply and demand, underlying credit, tax treatment, and current short term rates. The coupon rate shown represents the rate at period end.
| | | | | | |
franklintempleton.com | | | | The accompanying notes are an integral part of these financial statements. | Annual Report | | 117 |
FRANKLIN TAX-FREE TRUST
Financial Statements
Statements of Assets and Liabilities
February 28, 2018
| | | | | | | | | | | | | | | | |
| | | Franklin Federal
Intermediate-Term
Tax-Free
Income Fund | | | Franklin Federal
Limited-Term
Tax-Free
Income Fund | | | Franklin High Yield
Tax-Free
Income Fund | | | Franklin
Massachusetts
Tax-Free
Income Fund | |
| |
Assets: | | | | | | | | | | | | | | | | |
Investments in securities: | | | | | | | | | | | | | | | | |
Cost - Unaffiliated issuers | | | $3,941,936,858 | | | | $989,260,576 | | | | $6,072,286,804 | | | | $466,004,327 | |
| | | | |
Value - Unaffiliated issuers | | | $4,049,445,450 | | | | $985,354,594 | | | | $6,635,116,190 | | | | $480,506,897 | |
Cash | | | 67,956 | | | | 92,604 | | | | 98,252 | | | | 28,177 | |
Receivables: | | | | | | | | | | | | | | | | |
Investment securities sold | | | — | | | | — | | | | 11,029,300 | | | | — | |
Capital shares sold | | | 5,758,189 | | | | 1,457,485 | | | | 4,824,128 | | | | 1,383,089 | |
Interest | | | 43,888,626 | | | | 7,406,721 | | | | 80,176,971 | | | | 4,895,514 | |
Affiliates | | | — | | | | 17,439 | | | | — | | | | — | |
Other assets | | | 4,118 | | | | 987 | | | | 6,784 | | | | 485 | |
| | | | |
Total assets | | | 4,099,164,339 | | | | 994,329,830 | | | | 6,731,251,625 | | | | 486,814,162 | |
| | | | |
Liabilities: | | | | | | | | | | | | | | | | |
Payables: | | | | | | | | | | | | | | | | |
Investment securities purchased | | | 9,410,640 | | | | 5,704,400 | | | | 4,110,748 | | | | — | |
Capital shares redeemed | | | 9,148,630 | | | | 1,441,230 | | | | 17,506,023 | | | | 1,056,177 | |
Management fees | | | 1,236,173 | | | | 246,570 | | | | 2,530,331 | | | | 202,559 | |
Distribution fees | | | 322,527 | | | | 79,489 | | | | 793,113 | | | | 56,475 | |
Transfer agent fees | | | 502,295 | | | | — | | | | 1,016,858 | | | | 36,890 | |
Distributions to shareholders | | | 1,158,395 | | | | 209,524 | | | | 2,851,243 | | | | 189,789 | |
Accrued expenses and other liabilities | | | 256,662 | | | | 88,055 | | | | 785,455 | | | | 57,125 | |
| | | | |
Total liabilities | | | 22,035,322 | | | | 7,769,268 | | | | 29,593,771 | | | | 1,599,015 | |
| | | | |
Net assets, at value | | | $4,077,129,017 | | | | $986,560,562 | | | | $6,701,657,854 | | | | $485,215,147 | |
| | | | |
Net assets consist of: | | | | | | | | | | | | | | | | |
Paid-in capital | | | $4,031,400,695 | | | | $989,549,652 | | | | $7,007,047,929 | | | | $488,681,918 | |
Undistributed net investment income | | | 4,122,460 | | | | 2,317,090 | | | | 34,338,345 | | | | 397,440 | |
Net unrealized appreciation (depreciation) | | | 107,508,592 | | | | (3,905,982 | ) | | | 562,829,386 | | | | 14,502,570 | |
Accumulated net realized gain (loss) | | | (65,902,730 | ) | | | (1,400,198 | ) | | | (902,557,806 | ) | | | (18,366,781 | ) |
| | | | |
Net assets, at value | | | $4,077,129,017 | | | | $986,560,562 | | | | $6,701,657,854 | | | | $485,215,147 | |
| | | | |
| | | | | | |
118 | | Annual Report | | | The accompanying notes are an integral part of these financial statements. | | franklintempleton.com |
FRANKLIN TAX-FREE TRUST
FINANCIAL STATEMENTS
Statements of Assets and Liabilities (continued)
February 28, 2018
| | | | | | | | | | | | | | | | |
| | | Franklin Federal
Intermediate-Term
Tax-Free
Income Fund | | | Franklin Federal
Limited-Term
Tax-Free
Income Fund | | | Franklin
High Yield
Tax-Free
Income Fund | | | Franklin
Massachusetts
Tax-Free
Income Fund | |
| |
| Class A: | | | | | | | | | | | | | | | | |
Net assets, at value | | | $1,850,074,553 | | | | $687,196,920 | | | | $4,608,917,170 | | | | $363,554,876 | |
| | | | |
Shares outstanding | | | 154,903,912 | | | | 66,777,022 | | | | 463,797,460 | | | | 31,682,810 | |
| | | | |
Net asset value per sharea | | | $11.94 | | | | $10.29 | | | | $9.94 | | | | $11.47 | |
| | | | |
Maximum offering price per share (net asset value per share ÷ 97.75%, 97.75%, 95.75% and 95.75%, respectively) | | | $12.21 | | | | $10.53 | | | | $10.38 | | | | $11.98 | |
| | | | |
| Class M: | | | | | | | | | | | | | | | | |
Net assets, at value | | | | | | | | | | | $4,941 | | | | | |
| | | | | | | | | | | | | | | | |
Shares outstanding | | | | | | | | | | | 497 | | | | | |
| | | | | | | | | | | | | | | | |
Net asset value per sharea | | | | | | | | | | | $9.94 | | | | | |
| | | | | �� | | | | | | | | | | | |
Maximum offering price per share (net asset value per share ÷ 95.75%) | | | | | | | | | | | $10.38 | | | | | |
| | | | | | | | | | | | | | | | |
| Class C: | | | | | | | | | | | | | | | | |
Net assets, at value | | | $ 358,228,196 | | | | | | | | $ 870,227,015 | | | | $ 56,607,040 | |
| | | | | | | | | | | | |
Shares outstanding | | | 29,906,105 | | | | | | | | 85,910,993 | | | | 4,874,917 | |
| | | | | | | | | | | | |
Net asset value and maximum offering price per sharea | | | $11.98 | | | | | | | | $10.13 | | | | $11.61 | |
| | | | | | | | | | | | |
| Class R6: | | | | | | | | | | | | | | | | |
Net assets, at value | | | $ 672,199,306 | | | | $ 51,655,921 | | | | $ 152,254,959 | | | | $ 1,687,549 | |
| | | | |
Shares outstanding | | | 56,135,777 | | | | 5,024,500 | | | | 15,249,925 | | | | 147,018 | |
| | | | |
Net asset value and maximum offering price per share | | | $11.97 | | | | $10.28 | | | | $9.98 | | | | $11.48 | |
| | | | |
| Advisor Class: | | | | | | | | | | | | | | | | |
Net assets, at value | | | $1,196,626,962 | | | | $247,707,721 | | | | $1,070,253,769 | | | | $ 63,365,682 | |
| | | | |
Shares outstanding | | | 99,958,305 | | | | 24,084,298 | | | | 107,235,207 | | | | 5,520,812 | |
| | | | |
Net asset value and maximum offering price per share | | | $11.97 | | | | $10.29 | | | | $9.98 | | | | $11.48 | |
| | | | |
aRedemption price is equal to net asset value less contingent deferred sales charges, if applicable.
| | | | | | |
franklintempleton.com | | | | The accompanying notes are an integral part of these financial statements. | Annual Report | | 119 |
FRANKLIN TAX-FREE TRUST
FINANCIAL STATEMENTS
Statements of Assets and Liabilities (continued)
February 28, 2018
| | | | |
| | | Franklin
New Jersey
Tax-Free
Income Fund | |
| |
Assets: | | | | |
Investments in securities: | | | | |
Cost - Unaffiliated issuers | | | $ 910,970,999 | |
| | | | |
Value - Unaffiliated issuers | | | $ 931,456,597 | |
Cash | | | 26,841 | |
Receivables: | | | | |
Capital shares sold | | | 1,008,885 | |
Interest | | | 9,752,621 | |
Other assets | | | 941 | |
| | | | |
Total assets | | | 942,245,885 | |
| | | | |
Liabilities: | | | | |
Payables: | | | | |
Capital shares redeemed | | | 2,572,714 | |
Management fees | | | 372,412 | |
Distribution fees | | | 145,026 | |
Transfer agent fees | | | 122,147 | |
Distributions to shareholders | | | 393,818 | |
Accrued expenses and other liabilities | | | 84,755 | |
| | | | |
Total liabilities | | | 3,690,872 | |
| | | | |
Net assets, at value | | | $ 938,555,013 | |
| | | | |
Net assets consist of: | | | | |
Paid-in capital | | | $1,008,077,216 | |
Undistributed net investment income | | | 1,894,570 | |
Net unrealized appreciation (depreciation) | | | 20,485,598 | |
Accumulated net realized gain (loss) | | | (91,902,371 | ) |
| | | | |
Net assets, at value | | | $ 938,555,013 | |
| | | | |
| |
| Class A: | | | | |
Net assets, at value | | | $ 650,527,183 | |
| | | | |
Shares outstanding | | | 58,546,890 | |
| | | | |
Net asset value per sharea | | | $11.11 | |
| | | | |
Maximum offering price per share (net asset value per share ÷ 95.75%) | | | $11.60 | |
| | | | |
| Class C: | | | | |
Net assets, at value | | | $ 188,805,530 | |
| | | | |
Shares outstanding | | | 16,769,903 | |
| | | | |
Net asset value and maximum offering price per sharea | | | $11.26 | |
| | | | |
| Class R6: | | | | |
Net assets, at value | | | $ 19,936,206 | |
| | | | |
Shares outstanding | | | 1,792,710 | |
| | | | |
Net asset value and maximum offering price per share | | | $11.12 | |
| | | | |
| Advisor Class: | | | | |
Net assets, at value | | | $ 79,286,094 | |
| | | | |
Shares outstanding | | | 7,130,008 | |
| | | | |
Net asset value and maximum offering price per share | | | $11.12 | |
| | | | |
aRedemption price is equal to net asset value less contingent deferred sales charges, if applicable.
| | | | | | |
120 | | Annual Report | | | The accompanying notes are an integral part of these financial statements. | | franklintempleton.com |
FRANKLIN TAX-FREE TRUST
FINANCIAL STATEMENTS
Statements of Operations
for the year ended February 28, 2018
| | | | | | | | | | | | | | | | |
| | | Franklin Federal
Intermediate-Term
Tax-Free
Income Fund | | | Franklin Federal
Limited-Term
Tax-Free
Income Fund | | | Franklin
High Yield
Tax-Free
Income Fund | | | Franklin
Massachusetts
Tax-Free
Income Fund | |
| |
Investment income: | | | | | | | | | | | | | | | | |
Interest: | | | | | | | | | | | | | | | | |
Unaffiliated issuers | | | $138,584,650 | | | | $15,386,268 | | | | $ 357,186,953 | | | | $17,716,189 | |
| | | | |
Expenses: | | | | | | | | | | | | | | | | |
Management fees (Note 3a) | | | 19,554,244 | | | | 4,992,404 | | | | 32,965,008 | | | | 2,406,883 | |
Distribution fees: (Note 3c) | | | | | | | | | | | | | | | | |
Class A | | | 1,902,193 | | | | 1,126,676 | | | | 4,924,523 | | | | 371,302 | |
Class C | | | 2,525,928 | | | | — | | | | 6,212,824 | | | | 380,408 | |
Transfer agent fees: (Note 3e) | | | | | | | | | | | | | | | | |
Class A | | | 1,685,997 | | | | 457,766 | | | | 3,507,188 | | | | 190,258 | |
Class C | | | 347,206 | | | | — | | | | 680,782 | | | | 29,952 | |
Class R6 | | | 46,290 | | | | 3,503 | | | | 9,595 | | | | 356 | |
Advisor Class | | | 1,585,321 | | | | 177,879 | | | | 992,979 | | | | 24,610 | |
Custodian fees (Note 4) | | | 36,277 | | | | 9,171 | | | | 39,490 | | | | 4,052 | |
Reports to shareholders | | | 219,387 | | | | 45,921 | | | | 296,576 | | | | 14,805 | |
Registration and filing fees | | | 168,181 | | | | 94,141 | | | | 264,437 | | | | 42,958 | |
Professional fees | | | 78,070 | | | | 50,158 | | | | 1,561,545 | | | | 44,592 | |
Trustees’ fees and expenses | | | 23,552 | | | | 5,824 | | | | 40,896 | | | | 2,600 | |
Other | | | 251,092 | | | | 63,292 | | | | 945,945 | | | | 31,644 | |
| | | | |
Total expenses | | | 28,423,738 | | | | 7,026,735 | | | | 52,441,788 | | | | 3,544,420 | |
Expenses waived/paid by affiliates (Note 3f) | | | (312,198 | ) | | | (901,572 | ) | | | (2,084 | ) | | | (246 | ) |
| | | | |
Net expenses | | | 28,111,540 | | | | 6,125,163 | | | | 52,439,704 | | | | 3,544,174 | |
| | | | |
Net investment income | | | 110,473,110 | | | | 9,261,105 | | | | 304,747,249 | | | | 14,172,015 | |
| | | | |
Realized and unrealized gains (losses): | | | | | | | | | | | | | | | | |
Net realized gain (loss) from: | | | | | | | | | | | | | | | | |
Investments: | | | | | | | | | | | | | | | | |
Unaffiliated issuers | | | (4,320,540 | ) | | | 1,773 | | | | (287,662,623 | ) | | | 358,000 | |
| | | | |
Net change in unrealized appreciation (depreciation) on: | | | | | | | | | | | | | | | | |
Investments: | | | | | | | | | | | | | | | | |
Unaffiliated issuers | | | (50,836,613 | ) | | | (9,020,355 | ) | | | 75,982,772 | | | | (7,171,497 | ) |
| | | | |
Net realized and unrealized gain (loss) | | | (55,157,153 | ) | | | (9,018,582 | ) | | | (211,679,851 | ) | | | (6,813,497 | ) |
| | | | |
Net increase (decrease) in net assets resulting from operations | | | $ 55,315,957 | | | | $ 242,523 | | | | $ 93,067,398 | | | | $ 7,358,518 | |
| | | | |
| | | | | | |
franklintempleton.com | | | | The accompanying notes are an integral part of these financial statements. | Annual Report | | 121 |
FRANKLIN TAX-FREE TRUST
FINANCIAL STATEMENTS
Statements of Operations (continued)
for the year ended February 28, 2018
| | | | |
| | | Franklin
New Jersey
Tax-Free
Income Fund | |
| |
Investment income: | | | | |
Interest: | | | | |
Unaffiliated issuers | | | $42,207,199 | |
| | | | |
Expenses: | | | | |
Management fees (Note 3a) | | | 4,819,942 | |
Distribution fees: (Note 3c) | | | | |
Class A | | | 712,316 | |
Class C | | | 1,324,446 | |
Transfer agent fees: (Note 3e) | | | | |
Class A | | | 432,465 | |
Class C | | | 123,712 | |
Class R6 | | | 769 | |
Advisor Class | | | 62,582 | |
Custodian fees (Note 4) | | | 8,590 | |
Reports to shareholders | | | 37,719 | |
Registration and filing fees | | | 33,670 | |
Professional fees. | | | 202,624 | |
Trustees’ fees and expenses. | | | 5,722 | |
Other | | | 71,230 | |
| | | | |
Total expenses | | | 7,835,787 | |
Expenses waived/paid by affiliates (Note 3f) | | | (251 | ) |
| | | | |
Net expenses | | | 7,835,536 | |
| | | | |
Net investment income | | | 34,371,663 | |
| | | | |
Realized and unrealized gains (losses): | | | | |
Net realized gain (loss) from: | | | | |
Investments: | | | | |
Unaffiliated issuers. | | | (37,097,079 | ) |
| | | | |
Net change in unrealized appreciation (depreciation) on: | | | | |
Investments: | | | | |
Unaffiliated issuers. | | | 9,121,748 | |
| | | | |
Net realized and unrealized gain (loss) | | | (27,975,331 | ) |
| | | | |
Net increase (decrease) in net assets resulting from operations | | | $ 6,396,332 | |
| | | | |
| | | | | | |
122 | | Annual Report | | | The accompanying notes are an integral part of these financial statements. | | franklintempleton.com |
FRANKLIN TAX-FREE TRUST
FINANCIAL STATEMENTS
Statements of Changes in Net Assets
| | | | | | | | | | | | | | | | |
| | | Franklin Federal
Intermediate-Term
Tax-Free Income Fund | | | Franklin Federal
Limited-Term
Tax-Free Income Fund | |
| | | | |
| | | Year Ended February 28, | | | Year Ended February 28, | |
| | | | |
| | | 2018 | | | 2017 | | | 2018 | | | 2017 | |
| |
Increase (decrease) in net assets: | | | | | | | | | | | | | | | | |
Operations: | | | | | | | | | | | | | | | | |
Net investment income | | | $ 110,473,110 | | | | $ 111,732,300 | | | | $ 9,261,105 | | | | $ 9,487,093 | |
Net realized gain (loss) | | | (4,320,540 | ) | | | (6,891,021 | ) | | | 1,773 | | | | (229,300 | ) |
Net change in unrealized appreciation (depreciation) | | | (50,836,613 | ) | | | (138,812,381 | ) | | | (9,020,355 | ) | | | (7,716,027 | ) |
| | | | |
Net increase (decrease) in net assets resulting from operations | | | 55,315,957 | | | | (33,971,102 | ) | | | 242,523 | | | | 1,541,766 | |
| | | | |
Distributions to shareholders from: | | | | | | | | | | | | | | | | |
Net investment income: | | | | | | | | | | | | | | | | |
Class A | | | (48,484,336 | ) | | | (50,473,627 | ) | | | (5,901,817 | ) | | | (6,759,704 | ) |
Class C | | | (7,798,831 | ) | | | (8,745,487 | ) | | | — | | | | — | |
Class R6 | | | (6,133,119 | ) | | | — | | | | (96,780 | ) | | | — | |
Advisor Class | | | (47,080,920 | ) | | | (51,215,641 | ) | | | (2,718,263 | ) | | | (2,444,446 | ) |
| | | | |
Total distributions to shareholders | | | (109,497,206 | ) | | | (110,434,755 | ) | | | (8,716,860 | ) | | | (9,204,150 | ) |
| | | | |
Capital share transactions: (Note 2) | | | | | | | | | | | | | | | | |
Class A | | | (53,666,708 | ) | | | (22,092,610 | ) | | | (117,698,356 | ) | | | (70,013,052 | ) |
Class C | | | (62,882,244 | ) | | | (29,119,106 | ) | | | — | | | | — | |
Class R6 | | | 686,346,546 | | | | — | | | | 51,813,851 | | | | — | |
Advisor Class | | | (779,460,199 | ) | | | 29,809,308 | | | | (46,189,518 | ) | | | 58,463,383 | |
| | | | |
Total capital share transactions | | | (209,662,605 | ) | | | (21,402,408 | ) | | | (112,074,023 | ) | | | (11,549,669 | ) |
| | | | |
Net increase (decrease) in net assets | | | (263,843,854 | ) | | | (165,808,265 | ) | | | (120,548,360 | ) | | | (19,212,053 | ) |
Net assets: | | | | | | | | | | | | | | | | |
Beginning of year | | | 4,340,972,871 | | | | 4,506,781,136 | | | | 1,107,108,922 | | | | 1,126,320,975 | |
| | | | |
End of year | | | $4,077,129,017 | | | | $4,340,972,871 | | | | $ 986,560,562 | | | | $1,107,108,922 | |
| | | | |
Undistributed net investment income included in net assets: | | | | | | | | | | | | | | | | |
End of year | | | $ 4,122,460 | | | | $ 3,313,068 | | | | $ 2,317,090 | | | | $ 1,784,700 | |
| | | | |
| | | | | | |
franklintempleton.com | | | | The accompanying notes are an integral part of these financial statements. | Annual Report | | 123 |
FRANKLIN TAX-FREE TRUST
FINANCIAL STATEMENTS
Statements of Changes in Net Assets (continued)
| | | | | | | | | | | | | | | | |
| | | Franklin High Yield
Tax-Free Income Fund | | | Franklin Massachusetts
Tax-Free Income Fund | |
| | | | |
| | | Year Ended February 28, | | | Year Ended February 28, | |
| | | | |
| | | 2018 | | | 2017 | | | 2018 | | | 2017 | |
| |
Increase (decrease) in net assets: | | | | | | | | | | | | | | | | |
Operations: | | | | | | | | | | | | | | | | |
Net investment income | | | $ 304,747,249 | | | | $ 360,964,780 | | | | $ 14,172,015 | | | | $ 15,089,918 | |
Net realized gain (loss) | | | (287,662,623 | ) | | | (23,675,164 | ) | | | 358,000 | | | | 5,351 | |
Net change in unrealized appreciation (depreciation) | | | 75,982,772 | | | | (243,817,709 | ) | | | (7,171,497 | ) | | | (12,365,172 | ) |
| | | | |
Net increase (decrease) in net assets resulting from operations | | | 93,067,398 | | | | 93,471,907 | | | | 7,358,518 | | | | 2,730,097 | |
| | | | |
Distributions to shareholders from: | | | | | | | | | | | | | | | | |
Net investment income: | | | | | | | | | | | | | | | | |
Class A | | | (215,218,407 | ) | | | (225,087,572 | ) | | | (11,287,602 | ) | | | (12,958,046 | ) |
Class M | | | (21 | ) | | | — | | | | — | | | | — | |
Class C | | | (35,674,025 | ) | | | (39,420,525 | ) | | | (1,432,168 | ) | | | (1,642,419 | ) |
Class R6 | | | (1,683,296 | ) | | | — | | | | (16,359 | ) | | | — | |
Advisor Class | | | (62,100,734 | ) | | | (87,452,886 | ) | | | (1,489,315 | ) | | | (552,641 | ) |
| | | | |
Total distributions to shareholders | | | (314,676,483 | ) | | | (351,960,983 | ) | | | (14,225,444 | ) | | | (15,153,106 | ) |
| | | | |
Capital share transactions: (Note 2) | | | | | | | | | | | | | | | | |
Class A | | | (271,312,912 | ) | | | 77,573,432 | | | | (6,851,617 | ) | | | (14,369,915 | ) |
Class M | | | 5,000 | | | | — | | | | — | | | | — | |
Class C | | | (127,308,289 | ) | | | (4,569,990 | ) | | | (3,100,354 | ) | | | 188,116 | |
Class R6 | | | 154,732,700 | | | | — | | | | 1,727,309 | | | | — | |
Advisor Class | | | (787,584,522 | ) | | | (207,660,826 | ) | | | 29,521,099 | | | | 22,740,465 | |
| | | | |
Total capital share transactions | | | (1,031,468,023 | ) | | | (134,657,384 | ) | | | 21,296,437 | | | | 8,558,666 | |
| | | | |
Net increase (decrease) in net assets | | | (1,253,077,108 | ) | | | (393,146,460 | ) | | | 14,429,511 | | | | (3,864,343 | ) |
Net assets: | | | | | | | | | | | | | | | | |
Beginning of year. | | | 7,954,734,962 | | | | 8,347,881,422 | | | | 470,785,636 | | | | 474,649,979 | |
| | | | |
End of year | | | $6,701,657,854 | | | | $7,954,734,962 | | | | $485,215,147 | | | | $470,785,636 | |
| | | | |
Undistributed net investment income included in net assets: | | | | | | | | | | | | | | | | |
End of year | | | $ 34,338,345 | | | | $ 29,577,709 | | | | $ 397,440 | | | | $ 513,568 | |
| | | | |
| | | | | | |
124 | | Annual Report | | | The accompanying notes are an integral part of these financial statements. | | franklintempleton.com |
FRANKLIN TAX-FREE TRUST
FINANCIAL STATEMENTS
Statements of Changes in Net Assets (continued)
| | | | | | | | |
| | | Franklin New Jersey
Tax-Free Income Fund
| |
| | | Year Ended February 28, | |
| | | 2018 | | | 2017 | |
| |
Increase (decrease) in net assets: | | | | | | | | |
Operations: | | | | | | | | |
Net investment income | | $ | 34,371,663 | | | $ | 40,836,315 | |
Net realized gain (loss) | | | (37,097,079 | ) | | | 142,422 | |
Net change in unrealized appreciation (depreciation) | | | 9,121,748 | | | | (25,834,938 | ) |
| | | | |
Net increase (decrease) in net assets resulting from operations | | | 6,396,332 | | | | 15,143,799 | |
| | | | |
Distributions to shareholders from: | | | | | | | | |
Net investment income: | | | | | | | | |
Class A | | | (26,349,778 | ) | | | (30,243,264 | ) |
Class C | | | (6,305,931 | ) | | | (7,217,010 | ) |
Class R6 | | | (101,635 | ) | | | — | |
Advisor Class | | | (3,910,816 | ) | | | (3,904,866 | ) |
| | | | |
Total distributions to shareholders | | | (36,668,160 | ) | | | (41,365,140 | ) |
| | | | |
Capital share transactions: (Note 2) | | | | | | | | |
Class A | | | (71,112,191 | ) | | | (31,889,428 | ) |
Class C | | | (23,157,497 | ) | | | 6,466,214 | |
Class R6 | | | 20,184,362 | | | | — | |
Advisor Class | | | (24,950,926 | ) | | | 18,458,443 | |
| | | | |
Total capital share transactions | | | (99,036,252 | ) | | | (6,964,771 | ) |
| | | | |
Net increase (decrease) in net assets | | | (129,308,080 | ) | | | (33,186,112 | ) |
Net assets: | | | | | | | | |
Beginning of year | | | 1,067,863,093 | | | | 1,101,049,205 | |
| | | | |
End of year | | $ | 938,555,013 | | | $ | 1,067,863,093 | |
| | | | |
Undistributed net investment income included in net assets: | | | | | | | | |
End of year | | $ | 1,894,570 | | | $ | 3,231,820 | |
| | | | |
| | | | | | |
franklintempleton.com | | | | The accompanying notes are an integral part of these financial statements. | Annual Report | | 125 |
FRANKLIN TAX-FREE TRUST
Notes to Financial Statements
1. Organization and Significant Accounting Policies
Franklin Tax-Free Trust (Trust) is registered under the Investment Company Act of 1940 (1940 Act) as an open-end management investment company, consisting of twenty two separate funds, five of which are included in this report (Funds) and applies the specialized accounting and reporting guidance in U.S. Generally Accepted Accounting Principles (U.S. GAAP). The classes of shares offered within each of the Funds are indicated below. Each class of shares may differ by its initial sales load, contingent deferred sales charges, voting rights on matters affecting a single class, its exchange privilege and fees due to differing arrangements for distribution and transfer agent fees. Effective August 1, 2017, the Funds began offering a new class of shares, Class R6. Effective January 25, 2018, Franklin High Yield Tax-Free Income Fund began offering a new class of shares, Class M.
|
| Class A, Class R6 & Advisor Class |
|
Franklin Federal Limited-Term Tax-Free Income Fund |
|
| Class A, Class C, Class R6 & Advisor Class |
|
Franklin Federal Intermediate-Term Tax-Free Income Fund |
|
Franklin Massachusetts Tax-Free Income Fund |
|
Franklin New Jersey Tax-Free Income Fund |
|
| Class A, Class M, Class C, Class R6 & Advisor Class |
|
Franklin High Yield Tax-Free Income Fund |
The following summarizes the Funds’ significant accounting policies.
a. Financial Instrument Valuation
The Funds’ investments in financial instruments are carried at fair value daily. Fair value is the price that would be received to sell an asset or paid to transfer a liability in an orderly transaction between market participants on the measurement date. The Funds calculate the net asset value (NAV) per share as of 4 p.m. Eastern time each day the New York Stock Exchange (NYSE) is open for trading. Under compliance policies and procedures approved by the Trust’s Board of Trustees (the Board), the Funds’ administrator has responsibility for oversight of valuation, including leading the cross-functional Valuation Committee (VC). The VC provides administration and oversight of the Funds’ valuation policies and procedures, which are approved annually by the Board. Among other things, these procedures allow the Funds to utilize
independent pricing services, quotations from securities and financial instrument dealers, and other market sources to determine fair value.
Debt securities generally trade in the over-the-counter market rather than on a securities exchange. The Funds’ pricing services use multiple valuation techniques to determine fair value. In instances where sufficient market activity exists, the pricing services may utilize a market-based approach through which quotes from market makers are used to determine fair value. In instances where sufficient market activity may not exist or is limited, the pricing services also utilize proprietary valuation models which may consider market characteristics such as benchmark yield curves, credit spreads, estimated default rates, anticipated market interest rate volatility, coupon rates, anticipated timing of principal repayments, underlying collateral, and other unique security features in order to estimate the relevant cash flows, which are then discounted to calculate the fair value.
The Funds have procedures to determine the fair value of financial instruments for which market prices are not reliable or readily available. Under these procedures, the VC convenes on a regular basis to review such financial instruments and considers a number of factors, including significant unobservable valuation inputs, when arriving at fair value. The VC primarily employs a market-based approach which may use related or comparable assets or liabilities, recent transactions, market multiples, book values, and other relevant information for the investment to determine the fair value of the investment. An income-based valuation approach may also be used in which the anticipated future cash flows of the investment are discounted to calculate fair value. Discounts may also be applied due to the nature or duration of any restrictions on the disposition of the investments. Due to the inherent uncertainty of valuations of such investments, the fair values may differ significantly from the values that would have been used had an active market existed. The VC employs various methods for calibrating these valuation approaches including a regular review of key inputs and assumptions, transactional back-testing or disposition analysis, and reviews of any related market activity.
b. Securities Purchased on a When-Issued Basis
Certain or all Funds purchase securities on a when-issued basis, with payment and delivery scheduled for a future date. These transactions are subject to market fluctuations and are subject to
| | | | | | |
126 | | Annual Report | | | | franklintempleton.com |
FRANKLIN TAX-FREE TRUST
NOTES TO FINANCIAL STATEMENTS
the risk that the value at delivery may be more or less than the trade date purchase price. Although the Funds will generally purchase these securities with the intention of holding the securities, they may sell the securities before the settlement date. Sufficient assets have been segregated for these securities.
c. Income Taxes
It is each Fund’s policy to qualify as a regulated investment company under the Internal Revenue Code. Each Fund intends to distribute to shareholders substantially all of its income and net realized gains to relieve it from federal income and excise taxes. As a result, no provision for U.S. federal income taxes is required.
Each Fund may recognize an income tax liability related to its uncertain tax positions under U.S. GAAP when the uncertain tax position has a less than 50% probability that it will be sustained upon examination by the tax authorities based on its technical merits. As of February 28, 2018, each Fund has determined that no tax liability is required in its financial statements related to uncertain tax positions for any open tax years (or expected to be taken in future tax years). Open tax years are those that remain subject to examination and are based on the statute of limitations in each jurisdiction in which the Fund invests.
d. Security Transactions, Investment Income, Expenses and Distributions
Security transactions are accounted for on trade date. Realized gains and losses on security transactions are determined on a specific identification basis. Interest income and estimated expenses are accrued daily. Amortization of premium and accretion of discount on debt securities are included in interest income. Dividends from net investment income are normally declared daily; these dividends may be reinvested or paid monthly to shareholders. Distributions from realized capital gains and other distributions, if any, are recorded on the ex-dividend date. Distributable earnings are determined according to income tax regulations (tax basis) and may differ from earnings recorded in accordance with U.S. GAAP. These differences may be permanent or temporary. Permanent differences are reclassified among capital accounts to reflect their tax character. These reclassifications have no impact on net assets or the results of operations. Temporary differences are not reclassified, as they may reverse in subsequent periods.
Common expenses incurred by the Trust are allocated among the Funds based on the ratio of net assets of each Fund to the combined net assets of the Trust. Fund specific expenses are charged directly to the Fund that incurred the expense.
Realized and unrealized gains and losses and net investment income, excluding class specific expenses, are allocated daily to each class of shares based upon the relative proportion of net assets of each class. Differences in per share distributions by class are generally due to differences in class specific expenses.
e. Insurance
The scheduled payments of interest and principal for each insured municipal security in the Trust are insured by either a new issue insurance policy or a secondary insurance policy. Some municipal securities in the Funds are secured by collateral guaranteed by an agency of the U.S. government. Depending on the type of coverage, premiums for insurance are either added to the cost basis of the security or paid by a third party.
Insurance companies typically insure municipal bonds that tend to be of very high quality, with the majority of underlying municipal bonds rated A or better. However, an event involving an insurer could have an adverse effect on the value of the securities insured by that insurance company. There can be no assurance the insurer will be able to fulfill its obligations under the terms of the policy.
f. Accounting Estimates
The preparation of financial statements in accordance with U.S. GAAP requires management to make estimates and assumptions that affect the reported amounts of assets and liabilities at the date of the financial statements and the amounts of income and expenses during the reporting period. Actual results could differ from those estimates.
g. Guarantees and Indemnifications
Under the Trust’s organizational documents, its officers and trustees are indemnified by the Trust against certain liabilities arising out of the performance of their duties to the Trust. Additionally, in the normal course of business, the Trust, on behalf of the Funds, enters into contracts with service providers that contain general indemnification clauses. The Trust’s maximum exposure under these arrangements is unknown as this would involve future claims that may be made against the Trust that have not yet occurred. Currently, the Trust expects the risk of loss to be remote.
| | | | | | |
franklintempleton.com | | | | Annual Report | | 127 |
FRANKLIN TAX-FREE TRUST
NOTES TO FINANCIAL STATEMENTS
2. Shares of Beneficial Interest
At February 28, 2018, there were an unlimited number of shares authorized (without par value). Transactions in the Funds’ shares were as follows:
| | | | | | | | | | | | | | | | |
| | | Franklin Federal
Intermediate-Term
Tax-Free Income Fund | | | Franklin Federal
Limited-Term
Tax-Free Income Fund | |
| | | Shares | | | Amount | | | Shares | | | Amount | |
| | | | |
Class A Shares: | | | | | | | | | | | | | | | | |
Year ended February 28, 2018 | | | | | | | | | | | | | | | | |
Shares sold | | | 28,235,418 | | | $ | 343,329,113 | | | | 14,487,927 | | | $ | 149,741,605 | |
Shares issued in reinvestment of distributions | | | 3,696,574 | | | | 44,928,108 | | | | 523,384 | | | | 5,415,334 | |
| Shares redeemed | | | (36,368,046 | ) | | | (441,923,929 | ) | | | (26,389,284 | ) | | | (272,855,295) | |
| | | | |
| | | | |
Net increase (decrease) | | | (4,436,054 | ) | | $ | (53,666,708 | ) | | | (11,377,973 | ) | | $ | (117,698,356) | |
| | | | |
| | | | |
Year ended February 28, 2017 | | | | | | | | | | | | | | | | |
Shares sold | | | 38,289,747 | | | $ | 472,525,956 | | | | 23,057,263 | | | $ | 239,197,631 | |
Shares issued in reinvestment of distributions | | | 3,784,165 | | | | 46,770,260 | | | | 595,373 | | | | 6,190,350 | |
Shares redeemed | | | (44,205,794 | ) | | | (541,388,826 | ) | | | (30,359,342 | ) | | | (315,401,033) | |
| | | | |
| | | | |
| Net increase (decrease) | | | (2,131,882 | ) | | $ | (22,092,610 | ) | | | (6,706,706 | ) | | $ | (70,013,052) | |
| | | | |
| | | | |
Class C Shares: | | | | | | | | | | | | | | | | |
Year ended February 28, 2018 | | | | | | | | | | | | | | | | |
Shares sold | | | 2,827,863 | | | $ | 34,472,485 | | | | | | | | | |
Shares issued in reinvestment of distributions | | | 550,646 | | | | 6,712,386 | | | | | | | | | |
| Shares redeemed | | | (8,531,734 | ) | | | (104,067,115 | ) | | | | | | | | |
| | | | | | | | | | | | |
| | | | |
Net increase (decrease) | | | (5,153,225 | ) | | $ | (62,882,244 | ) | | | | | | | | |
| | | | | | | | | | | | |
| | | | |
Year ended February 28, 2017 | | | | | | | | | | | | | | | | |
Shares sold | | | 5,554,201 | | | $ | 68,930,265 | | | | | | | | | |
Shares issued in reinvestment of distributions | | | 596,489 | | | | 7,393,393 | | | | | | | | | |
Shares redeemed | | | (8,553,385 | ) | | | (105,442,764 | ) | | | | | | | | |
| | | | | | | | | | | | |
| | | | |
| Net increase (decrease) | | | (2,402,695 | ) | | $ | (29,119,106 | ) | | | | | | | | |
| | | | | | | | | | | | |
| | | | |
Class R6 Shares: | | | | | | | | | | | | | | | | |
Year ended February 28, 2018a | | | | | | | | | | | | | | | | |
Shares sold | | | 58,711,575 | | | $ | 717,585,816 | | | | 5,324,785 | | | $ | 54,905,710 | |
Shares issued in reinvestment of distributions | | | 505,941 | | | | 6,109,534 | | | | 8,308 | | | | 85,457 | |
| Shares redeemed | | | (3,081,739 | ) | | | (37,348,804 | ) | | | (308,593 | ) | | | (3,177,316) | |
| | | | |
| | | | |
Net increase (decrease) | | | 56,135,777 | | | $ | 686,346,546 | | | | 5,024,500 | | | $ | 51,813,851 | |
| | | | |
| | | | |
Advisor Class Shares: | | | | | | | | | | | | | | | | |
Year ended February 28, 2018 | | | | | | | | | | | | | | | | |
Shares sold | | | 42,866,671 | | | $ | 523,274,733 | | | | 10,412,288 | | | $ | 107,741,817 | |
Shares issued in reinvestment of distributions | | | 3,022,878 | | | | 36,894,235 | | | | 92,916 | | | | 960,863 | |
| Shares redeemed | | | (109,616,704 | ) | | | (1,339,629,167 | ) | | | (14,997,387 | ) | | | (154,892,198) | |
| | | | |
| | | | |
Net increase (decrease) | | | (63,727,155 | ) | | $ | (779,460,199 | ) | | | (4,492,183 | ) | | $ | (46,189,518) | |
| | | | |
| | | | |
Year ended February 28, 2017 | | | | | | | | | | | | | | | | |
Shares sold | | | 53,941,075 | | | $ | 666,134,370 | | | | 13,042,037 | | | $ | 135,264,338 | |
Shares issued in reinvestment of distributions | | | 3,362,680 | | | | 41,665,299 | | | | 79,269 | | | | 823,331 | |
Shares redeemed | | | (54,907,619 | ) | | | (677,990,361 | ) | | | (7,480,163 | ) | | | (77,624,286) | |
| | | | |
| | | | |
| Net increase (decrease) | | | 2,396,136 | | | $ | 29,809,308 | | | | 5,641,143 | | | $ | 58,463,383 | |
| | | | |
| aFor | the period August 1, 2017 (effective date) to February 28, 2018. |
| | | | | | |
128 | | Annual Report | | | | franklintempleton.com |
FRANKLIN TAX-FREE TRUST
NOTES TO FINANCIAL STATEMENTS
| | | | | | | | | | | | | | | | |
| | | Franklin High Yield
Tax-Free Income Fund | | | Franklin Massachusetts
Tax-Free Income Fund | |
| | | Shares | | | Amount | | | Shares | | | Amount | |
| | | | |
Class A Shares: | | | | | | | | | | | | | | | | |
Year ended February 28, 2018 | | | | | | | | | | | | | | | | |
Shares sold | | | 56,198,177 | | | $ | 573,018,809 | | | | 2,666,496 | | | $ | 31,220,999 | |
Shares issued in reinvestment of distributions | | | 18,862,623 | | | | 191,928,603 | | | | 806,617 | | | | 9,427,332 | |
Shares redeemed | | | (101,911,852 | ) | | | (1,036,260,324 | ) | | | (4,064,845 | ) | | | (47,499,948) | |
| | | | |
| | | | |
| Net increase (decrease) | | | (26,851,052 | ) | | $ | (271,312,912 | ) | | | (591,732 | ) | | $ | (6,851,617) | |
| | | | |
| | | | |
Year ended February 28, 2017 | | | | | | | | | | | | | | | | |
Shares sold | | | 67,462,588 | | | $ | 704,913,793 | | | | 4,147,699 | | | $ | 49,067,816 | |
Shares issued in reinvestment of distributions | | | 18,968,730 | | | | 200,305,510 | | | | 893,150 | | | | 10,624,768 | |
Shares issued on reorganization | | | 10,820,997 | | | | 123,762,243 | | | | — | | | | — | |
Shares redeemed | | | (90,689,443 | ) | | | (951,408,114 | ) | | | (6,284,781 | ) | | | (74,062,499) | |
| | | | |
| | | | |
| Net increase (decrease) | | | 6,562,872 | | | $ | 77,573,432 | | | | (1,243,932 | ) | | $ | (14,369,915) | |
| | | | |
| | | | |
Class M Shares: | | | | | | | | | | | | | | | | |
Year ended February 28, 2018b | | | | | | | | | | | | | | | | |
Shares sold | | | 497 | | | $ | 5,000 | | | | | | | | | |
| | | | | | | | | | | | |
| | | | |
Class C Shares: | | | | | | | | | | | | | | | | |
Year ended February 28, 2018 | | | | | | | | | | | | | | | | |
Shares sold | | | 6,926,046 | | | $ | 71,954,414 | | | | 488,118 | | | $ | 5,781,716 | |
Shares issued in reinvestment of distributions | | | 3,078,302 | | | | 31,915,955 | | | | 107,551 | | | | 1,272,013 | |
Shares redeemed | | | (22,269,857 | ) | | | (231,178,658 | ) | | | (857,320 | ) | | | (10,154,083) | |
| | | | |
| | | | |
| Net increase (decrease) | | | (12,265,509 | ) | | $ | (127,308,289 | ) | | | (261,651 | ) | | $ | (3,100,354) | |
| | | | |
| | | | |
Year ended February 28, 2017 | | | | | | | | | | | | | | | | |
Shares sold | | | 11,603,148 | | | $ | 123,635,212 | | | | 727,903 | | | $ | 8,769,583 | |
Shares issued in reinvestment of distributions | | | 3,191,076 | | | | 34,300,844 | | | | 117,593 | | | | 1,414,781 | |
Shares issued on reorganization | | | 2,131,065 | | | | 24,808,421 | | | | — | | | | — | |
Shares redeemed | | | (17,528,712 | ) | | | (187,314,467 | ) | | | (831,137 | ) | | | (9,996,248) | |
| | | | |
| | | | |
| Net increase (decrease) | | | (603,423 | ) | | $ | (4,569,990 | ) | | | 14,359 | | | $ | 188,116 | |
| | | | |
| | | | |
Class R6 Shares: | | | | | | | | | | | | | | | | |
Year ended February 28, 2018a | | | | | | | | | | | | | | | | |
Shares sold | | | 16,101,405 | | | $ | 163,359,180 | | | | 151,335 | | | $ | 1,777,784 | |
Shares issued in reinvestment of distributions | | | 163,224 | | | | 1,643,589 | | | | 1,401 | | | | 16,297 | |
Shares redeemed | | | (1,014,704 | ) | | | (10,270,069 | ) | | | (5,718 | ) | | | (66,772) | |
| | | | |
| | | | |
| Net increase (decrease) | | | 15,249,925 | | | $ | 154,732,700 | | | | 147,018 | | | $ | 1,727,309 | |
| | | | |
| | | | | | |
franklintempleton.com | | | | Annual Report | | 129 |
FRANKLIN TAX-FREE TRUST
NOTES TO FINANCIAL STATEMENTS
2. Shares of Beneficial Interest (continued)
| | | | | | | | | | | | | | | | |
| | | Franklin High Yield
Tax-Free Income Fund | | | Franklin Massachusetts
Tax-Free Income Fund | |
| | | Shares | | | Amount | | | Shares | | | Amount | |
| | | | | | | | | | | | | |
| | | | |
Advisor Class Shares: | | | | | | | | | | | | | | | | |
| Year ended February 28, 2018 | | | | | | | | | | | | | | | | |
| Shares sold | | | 44,136,332 | | | $ | 452,127,463 | | | | 3,335,672 | | | $ | 39,063,150 | |
| Shares issued in reinvestment of distributions | | | 4,909,254 | | | | 50,196,375 | | | | 91,243 | | | | 1,065,792 | |
| Shares redeemed | | | (126,207,763 | ) | | | (1,289,908,360 | ) | | | (906,916 | ) | | | (10,607,843 | ) |
| | | | |
| | | | |
| Net increase (decrease) | | | (77,162,177 | ) | | $ | (787,584,522 | ) | | | 2,519,999 | | | $ | 29,521,099 | |
| | | | |
Year ended February 28, 2017 | | | | | | | | | | | | | | | | |
Shares sold | | | 73,829,408 | | | $ | 775,219,149 | | | | 2,279,027 | | | $ | 26,671,706 | |
Shares issued in reinvestment of distributions | | | 6,812,943 | | | | 72,279,592 | | | | 35,321 | | | | 419,032 | |
Shares issued on reorganization | | | 135,594 | | | | 1,558,108 | | | | — | | | | — | |
Shares redeemed | | | (100,560,064 | ) | | | (1,056,717,675 | ) | | | (370,056 | ) | | | (4,350,273 | ) |
| | | | |
| | | | |
Net increase (decrease) | | | (19,782,119 | ) | | $ | (207,660,826 | ) | | | 1,944,292 | | | $ | 22,740,465 | |
| | | | |
| aFor | the period August 1, 2017 (effective date) to February 28, 2018. |
| bFor | the period January 25, 2018 (effective date) to February 28, 2018. |
| | | | | | | | |
| | | Franklin New Jersey
Tax-Free Income Fund | |
| | | Shares | | | Amount | |
| | |
Class A Shares: | | | | | | | | |
| Year ended February 28, 2018 | | | | | | | | |
| Shares sold | | | 4,941,051 | | | $ | 56,061,061 | |
| Shares issued in reinvestment of distributions | | | 1,952,307 | | | | 22,089,698 | |
| Shares redeemed | | | (13,196,549 | ) | | | (149,262,950) | |
| | | | |
| | |
| Net increase (decrease) | | | (6,303,191 | ) | | $ | (71,112,191) | |
| | | | |
| Year ended February 28, 2017 | | | | | | | | |
| Shares sold | | | 7,545,672 | | | $ | 88,084,612 | |
| Shares issued in reinvestment of distributions | | | 2,174,182 | | | | 25,432,571 | |
| Shares redeemed | | | (12,490,241 | ) | | | (145,406,611) | |
| | | | |
| | |
| Net increase (decrease) | | | (2,770,387 | ) | | $ | (31,889,428) | |
| | | | |
| | |
Class C Shares: | | | | | | | | |
| | |
Year ended February 28, 2018 | | | | | | | | |
Shares sold | | | 1,858,227 | | | $ | 21,362,122 | |
Shares issued in reinvestment of distributions | | | 479,069 | | | | 5,491,008 | |
| Shares redeemed | | | (4,355,972 | ) | | | (50,010,627) | |
| | | | |
| | |
| Net increase (decrease) | | | (2,018,676 | ) | | $ | (23,157,497) | |
| | | | |
Year ended February 28, 2017 | | | | | | | | |
Shares sold | | | 3,030,329 | | | $ | 36,020,383 | |
Shares issued in reinvestment of distributions | | | 508,134 | | | | 6,017,473 | |
Shares redeemed | | | (3,014,837 | ) | | | (35,571,642) | |
| | | | |
| | |
Net increase (decrease) | | | 523,626 | | | $ | 6,466,214 | |
| | | | |
| | | | | | |
130 | | Annual Report | | | | franklintempleton.com |
FRANKLIN TAX-FREE TRUST
NOTES TO FINANCIAL STATEMENTS
| | | | | | | | |
| | | Franklin New Jersey
Tax-Free Income Fund | |
| | | Shares | | | Amount | |
| | |
Class R6 Shares: | | | | | | | | |
| Year ended February 28, 2018a | | | 1,833,803 | | | $ | 20,642,358 | |
| Shares sold | | | | | | | | |
| Shares issued in reinvestment of distributions | | | 9,106 | | | | 101,530 | |
| Shares redeemed | | | (50,199 | ) | | | (559,526) | |
| | | | |
| | |
| Net increase (decrease) | | | 1,792,710 | | | $ | 20,184,362 | |
| | | | |
| | |
Advisor Class Shares: | | | | | | | | |
| | |
Year ended February 28, 2018 | | | | | | | | |
Shares sold | | | 3,204,232 | | | $ | 36,260,398 | |
Shares issued in reinvestment of distributions | | | 303,995 | | | | 3,443,949 | |
| Shares redeemed | | | (5,720,414 | ) | | | (64,655,273) | |
| | | | |
| | |
| Net increase (decrease) | | | (2,212,187 | ) | | $ | (24,950,926) | |
| | | | |
Year ended February 28, 2017 | | | | | | | | |
Shares sold | | | 4,274,428 | | | $ | 49,644,523 | |
Shares issued in reinvestment of distributions | | | 278,161 | | | | 3,255,153 | |
Shares redeemed | | | (2,979,644 | ) | | | (34,441,233) | |
| | | | |
| | |
Net increase (decrease) | | | 1,572,945 | | | $ | 18,458,443 | |
| | | | |
| aFor | the period August 1, 2017 (effective date) to February 28, 2018. |
3. Transactions with Affiliates
Franklin Resources, Inc. is the holding company for various subsidiaries that together are referred to as Franklin Templeton Investments. Certain officers and trustees of the Trust are also officers and/or directors of the following subsidiaries:
| | | | |
Subsidiary | | Affiliation | | |
Franklin Advisers, Inc. (Advisers) | | Investment manager | | |
Franklin Templeton Services, LLC (FT Services) | | Administrative manager | | |
Franklin Templeton Distributors, Inc. (Distributors) | | Principal underwriter | | |
Franklin Templeton Investor Services, LLC (Investor Services) | | Transfer agent | | |
| | | | | | |
franklintempleton.com | | | | Annual Report | | 131 |
FRANKLIN TAX-FREE TRUST
NOTES TO FINANCIAL STATEMENTS
3. Transactions with Affiliates (continued)
a. Management Fees
The Funds, except Franklin Federal Limited-Term Tax-Free Income Fund, pay an investment management fee to Advisers based on the month-end net assets of each of the Funds and Franklin Federal Limited-Term Tax-Free Income Fund pays an investment management fee to Advisers based on the average daily net assets of the fund as follows:
| | | | |
Annualized Fee Rate | | Net Assets | | |
0.625% | | Up to and including $100 million | | |
0.500% | | Over $100 million, up to and including $250 million | | |
0.450% | | Over $250 million, up to and including $7.5 billion | | |
0.440% | | Over $7.5 billion, up to and including $10 billion | | |
0.430% | | Over $10 billion, up to and including $12.5 billion | | |
0.420% | | Over $12.5 billion, up to and including $15 billion | | |
0.400% | | Over $15 billion, up to and including $17.5 billion | | |
0.380% | | Over $17.5 billion, up to and including $20 billion | | |
0.360% | | In excess of $20 billion | | |
For the year ended February 28, 2018, each Fund’s effective investment management fee rate based on daily average net assets was as follows:
| | | | |
Franklin Federal
Intermediate-Term
Tax-Free
Income Fund | | Franklin Federal
Limited-Term
Tax-Free
Income Fund | | Franklin
High Yield
Tax-Free
Income Fund |
0.454% | | 0.474% | | 0.451% |
| | | | | | |
| | | Franklin
Massachusetts
Tax-Free
Income Fund | | Franklin
New Jersey
Tax-Free
Income Fund | | |
| | 0.502% | | 0.471% | | |
b. Administrative Fees
Under an agreement with Advisers, FT Services provides administrative services to the Funds. The fee is paid by Advisers based on each of the Funds’ average daily net assets, and is not an additional expense of the Funds.
c. Distribution Fees
The Board has adopted distribution plans for each share class, with the exception of Class R6 and Advisor Class shares, pursuant to Rule 12b-1 under the 1940 Act. Under the Funds’ Class A and M reimbursement distribution plans, the Funds reimburse Distributors for costs incurred in connection with the servicing, sale and distribution of each Fund’s shares up to the maximum annual plan rate. Under the Class A and M reimbursement distribution plans, costs exceeding the maximum for the current plan year cannot be reimbursed in subsequent periods. In addition, under the Funds’ Class C compensation distribution plans, the Funds pay Distributors for costs incurred in connection with the servicing, sale and distribution of each Fund’s shares up to the maximum annual plan rate. The plan year, for purposes of monitoring compliance with the maximum annual plan rates, is February 1 through January 31 for each Fund.
| | | | | | |
132 | | Annual Report | | | | franklintempleton.com |
FRANKLIN TAX-FREE TRUST
NOTES TO FINANCIAL STATEMENTS
The maximum annual plan rates, based on the average daily net assets, for each class, are as follows:
| | | | | | | | | | | | |
| | | Franklin Federal
Intermediate-Term
Tax-Free
Income Fund | | | Franklin Federal
Limited-Term
Tax-Free Income Fund | | | Franklin
High Yield
Tax-Free Income Fund | |
Reimbursement Plans: | | | | | | | | | | | | |
Class A | | | 0.10% | | | | 0.15% | | | | 0.10% | |
Class M | | | — | | | | — | | | | 0.25% | |
Compensation Plans: | | | | | | | | | | | | |
Class C | | | 0.65% | | | | — | | | | 0.65% | |
| | | |
| | | | | | Franklin
Massachusetts
Tax-Free
Income Fund | | | Franklin
New Jersey
Tax-Free Income Fund | |
Reimbursement Plans: | | | | | | | | | | | | |
Class A | | | | | | | 0.10% | | | | 0.10% | |
Compensation Plans: | | | | | | | | | | | | |
Class C | | | | | | | 0.65% | | | | 0.65% | |
d. Sales Charges/Underwriting Agreements
Front-end sales charges and contingent deferred sales charges (CDSC) do not represent expenses of the Funds. These charges are deducted from the proceeds of sales of fund shares prior to investment or from redemption proceeds prior to remittance, as applicable. Distributors has advised the Funds of the following commission transactions related to the sales and redemptions of the Funds’ shares for the year:
| | | | | | | | | | | | |
| | | Franklin Federal
Intermediate-Term
Tax-Free
Income Fund | | | Franklin Federal
Limited-Term
Tax-Free
Income Fund | | | Franklin
High Yield
Tax-Free
Income Fund | |
Sales charges retained net of commissions paid to unaffiliated brokers/dealers | | | $197,429 | | | | $61,805 | | | | $868,966 | |
| | | |
CDSC retained | | | $ 62,388 | | | | $50,524 | | | | $ 75,349 | |
| | | |
| | | Franklin
Massachusetts
Tax-Free Income Fund | | | Franklin
New Jersey
Tax-Free
Income Fund | | | | |
Sales charges retained net of commissions paid to unaffiliated brokers/dealers | | | $31,758 | | | | $84,915 | | | | | |
| | | |
CDSC retained | | | $ 3,767 | | | | $25,504 | | | | | |
e. Transfer Agent Fees
Each class of shares pays transfer agent fees to Investor Services for its performance of shareholder servicing obligations. Effective November 1, 2017, the fees are based on an annualized asset based fee of 0.02% plus a transaction based fee. Prior to November 1, 2017, the fees were account based fees that varied based on fund or account type. In addition, each class reimburses Investor Services for out of pocket expenses incurred and, except for Class R6, reimburses shareholder servicing fees paid to third parties. These fees are allocated daily based upon their relative proportion of such classes’ aggregate net assets. Class R6 pays Investor Services transfer agent fees specific to that class.
| | | | | | |
franklintempleton.com | | | | Annual Report | | 133 |
FRANKLIN TAX-FREE TRUST
NOTES TO FINANCIAL STATEMENTS
3. Transactions with Affiliates (continued)
e. Transfer Agent Fees (continued)
For the year ended February 28, 2018, the Funds paid transfer agent fees as noted in the Statements of Operations of which the following amounts were retained by Investor Services:
| | | | | | | | | | | | |
| | | Franklin Federal
Intermediate-Term
Tax-Free Income Fund | | | Franklin Federal
Limited-Term
Tax-Free
Income Fund | | | Franklin
High Yield
Tax-Free
Income Fund | |
Transfer agent fees | | | $816,722 | | | | $161,362 | | | | $1,329,375 | |
| | | |
| | | Franklin
Massachusetts
Tax-Free Income Fund | | | Franklin New Jersey
Tax-Free
Income Fund | | | | |
Transfer agent fees | | | $ 81,925 | | | | $186,259 | | | | | |
f. Waiver and Expense Reimbursements
Effective February 1, 2018, Advisers has contractually agreed in advance to waive or limit its fees and to assume as its own expense certain expenses otherwise payable by Franklin Federal Intermediate-Term Tax-Free Income Fund and Franklin Federal Limited-Term Tax-Free Income Fund so that the expenses (excluding distribution fees, and acquired fund fees and expenses) for each class of the Funds do not exceed 0.46% and 0.40%, respectively, based on the average net assets of each class (other than certain non-routine expenses or costs, including those relating to litigation, indemnification, reorganizations, and liquidations) until June 30, 2019. Total expenses waived or paid are not subject to recapture subsequent to the Funds’ fiscal year end. Prior to February 1, 2018, the expenses (excluding distribution fees, and acquired fund fees and expenses) for each class of the Franklin Federal Limited-Term Tax-Free Income Fund were limited to 0.48% based on the average net assets of each class (other than certain non-routine expenses or costs, including those relating to litigation, indemnification, reorganizations, and liquidations).
Investor Services has voluntarily agreed in advance to waive or limit its fees so that the Class R6 transfer agent fees do not exceed 0.03%. Investor Services may discontinue this waiver in the future.
g. Interfund Transactions
Certain or all Funds engaged in purchases and sales of investments with funds or other accounts that have common investment managers (or affiliated investment managers), directors, trustees or officers. These purchases and sales for the year ended February 28, 2018, were as follows:
| | | | | | | | | | | | |
| | | Franklin Federal
Intermediate-Term
Tax-Free Income Fund | | | Franklin Federal
Limited-Term
Tax-Free
Income Fund | | | Franklin High Yield
Tax-Free
Income Fund | |
Purchases | | | $255,795,000 | | | | $70,080,000 | | | | $217,795,000 | |
Sales | | | $211,860,000 | | | | $85,870,000 | | | | $321,709,492 | |
| | | |
| | | Franklin
Massachusetts
Tax-Free Income Fund | | | Franklin New Jersey
Tax-Free
Income Fund | | | | |
Purchases | | | $ 1,300,000 | | | | $ 7,000,000 | | | | | |
Sales | | | $ 1,400,000 | | | | $12,000,000 | | | | | |
| | | | | | |
134 | | Annual Report | | | | franklintempleton.com |
FRANKLIN TAX-FREE TRUST
NOTES TO FINANCIAL STATEMENTS
4. Expense Offset Arrangement
Effective December 1, 2017, the Funds have entered into an arrangement with their custodian whereby credits realized as a result of uninvested cash balances are used to reduce a portion of the Funds’ custodian expenses. During the period ended February 28, 2018, there were no credits earned.
5. Income Taxes
For tax purposes, capital losses may be carried over to offset future capital gains. Capital loss carryforwards with no expiration, if any, must be fully utilized before those losses with expiration dates.
At February 28, 2018, the capital loss carryforwards were as follows:
| | | | | | | | | | | | |
| | | Franklin
Federal
Intermediate-Term
Tax-Free
Income Fund | | | Franklin
Federal
Limited-Term
Tax-Free
Income Fund | | | Franklin
High Yield
Tax-Free
Income Fund | |
| Capital loss carryforwards subject to expiration: | | | | | | | | | | | | |
2019 | | | $ 1,793,931 | | | | $ — | | | | $ 1,436,742 | |
| | | |
| Capital loss carryforwards not subject to expiration: | | | | | | | | | | | | |
Short term | | | 40,690,118 | | | | 138 | | | | 180,482,313 | |
Long term | | | 23,112,168 | | | | 1,400,060 | | | | 704,643,717 | |
| | | | |
Total capital loss carryforwards | | | $65,596,217 | | | | $1,400,198 | | | | $886,562,772a | |
| | | | |
| | | |
| | | Franklin
Massachusetts
Tax-Free
Income Fund | | | Franklin
New Jersey
Tax-Free
Income Fund | | | | |
| | | | | | | | | | | | |
| | | |
| Capital loss carryforwards not subject to expiration: | | | | | | | | | | | | |
Short term | | | $ 8,312,826 | | | | $11,282,819 | | | | | |
Long term | | | 10,053,954 | | | | 79,915,600 | | | | | |
| | | | | | | | |
Total capital loss carryforwards | | | $18,366,780 | | | | $91,198,419 | | | | | |
| | | | | | | | |
aIncludes $97,859,993 from the merged Franklin Double Tax-Free Income Fund, which may be carried over to offset future capital gains, subject to certain limitations.
During the year ended February 28, 2018, the Funds utilized capital loss carryforwards as follows:
| | | | | | | | | | |
Franklin
Federal
Limited-Term
Tax-Free
Income Fund | | | Franklin
Massachusetts
Tax-Free
Income Fund | | | | |
| | $13,628 | | | | $420,699 | | | | | |
On February 28, 2018, the following Funds had expired capital loss carryforwards, which were reclassified to paid-in capital.
| | | | | | | | | | |
Franklin
Federal
Intermediate-Term
Tax-Free
Income Fund | | | Franklin
Federal
Limited-Term
Tax-Free
Income Fund | | | Franklin
High Yield
Tax-Free
Income Fund | |
| | $223,211 | | | | $567 | | | | $56,142,304 | |
| | | | | | |
franklintempleton.com | | | | Annual Report | | 135 |
FRANKLIN TAX-FREE TRUST
NOTES TO FINANCIAL STATEMENTS
5. Income Taxes (continued)
The tax character of distributions paid during the years ended February 28, 2018 and 2017 was as follows:
| | | | | | | | | | | | | | | | | | | | | | | | |
| | | Franklin Federal
Intermediate-Term
Tax-Free Income Fund | | | Franklin Federal Limited-Term
Tax-Free Income Fund | | | Franklin High Yield
Tax-Free Income Fund | |
| | | 2018 | | | 2017 | | | 2018 | | | 2017 | | | 2018 | | | 2017 | |
Distributions paid from tax exempt income | | $ | 109,497,206 | | | $ | 110,434,755 | | | $ | 8,716,860 | | | $ | 9,204,150 | | | $ | 314,676,483 | | | $ | 351,960,983 | |
| | | | |
| | | | | | | | | | | | | | | | |
| | | Franklin Massachusetts
Tax-Free Income Fund | | | Franklin New Jersey
Tax-Free Income Fund | |
| | | 2018 | | | 2017 | | | 2018 | | | 2017 | |
Distributions paid from tax exempt income | | $ | 14,225,444 | | | $ | 15,153,106 | | | $ | 36,668,160 | | | $ | 41,365,140 | |
| | | | |
At February 28, 2018, the cost of investments and net unrealized appreciation (depreciation) for income tax purposes were as follows:
| | | | | | | | | | | | |
| | | Franklin Federal
Intermediate-Term
Tax-Free
Income Fund | | | Franklin Federal
Limited-Term
Tax-Free
Income Fund | | | Franklin
High Yield
Tax-Free
Income Fund | |
| Cost of investments | | $ | 3,942,187,637 | | | $ | 989,260,576 | | | $ | 6,084,573,070 | |
| | | | |
| | | |
Unrealized appreciation | | $ | 119,512,062 | | | $ | 1,429,244 | | | $ | 747,195,828 | |
| Unrealized depreciation | | | (12,254,249 | ) | | | (5,335,226 | ) | | | (196,652,708 | ) |
| | | | |
| Net unrealized appreciation (depreciation) | | $ | 107,257,813 | | | $ | (3,905,982 | ) | | $ | 550,543,120 | |
| | | | |
| | | |
Undistributed tax exempt income | | $ | 5,225,118 | | | $ | 2,300,479 | | | $ | 40,093,875 | |
| Undistributed ordinary income | | | — | | | | 226,143 | | | | 1,678,207 | |
| | | | |
| Distributable earnings | | $ | 5,225,118 | | | $ | 2,526,622 | | | $ | 41,772,082 | |
| | | | |
| | | | | | | | |
| | | Franklin
Massachusetts
Tax-Free
Income Fund | | | Franklin
New Jersey
Tax-Free
Income Fund | |
| Cost of investments | | $ | 465,985,657 | | | $ | 911,721,447 | |
| | | | |
| | |
Unrealized appreciation | | $ | 17,567,318 | | | $ | 36,352,384 | |
| Unrealized depreciation | | | (3,046,078 | ) | | | (16,617,234 | ) |
| | | | |
| Net unrealized appreciation (depreciation) | | $ | 14,521,240 | | | $ | 19,735,150 | |
| | | | |
| | |
| Distributable earnings – undistributed tax exempt income | | $ | 568,557 | | | $ | 2,870,967 | |
| | | | |
Differences between income and/or capital gains as determined on a book basis and a tax basis are primarily due to differing treatments of defaulted securities and bond discounts.
| | | | | | |
136 | | Annual Report | | | | franklintempleton.com |
FRANKLIN TAX-FREE TRUST
NOTES TO FINANCIAL STATEMENTS
On December 22, 2017, the Tax Cuts and Jobs Act (the “Act”) was signed into law. Certain provisions of the Act were effective upon enactment with the remainder becoming effective for tax years beginning after December 31, 2017. Management has reviewed the requirements and believes the adoption of these provisions of the Act will not have a material impact on the financial statements.
6. Investment Transactions
Purchases and sales of investments (excluding short term securities) for the year ended February 28, 2018, were as follows:
| | | | | | | | | | | | |
| | | Franklin Federal
Intermediate-Term
Tax-Free
Income Fund | | | Franklin Federal
Limited-Term
Tax-Free
Income Fund | | | Franklin High
Yield Tax-Free
Income Fund | |
Purchases | | | $443,735,761 | | | | $351,773,262 | | | | $ 502,539,417 | |
| | | |
Sales | | | $555,826,673 | | | | $345,020,000 | | | | $1,572,723,119 | |
| | | |
| | | Franklin
Massachusetts
Tax-Free
Income Fund | | | Franklin
New Jersey
Tax-Free
Income Fund | | | | |
Purchases | | | $133,861,189 | | | | $127,593,710 | | | | | |
| | | |
Sales | | | $110,629,371 | | | | $207,884,142 | | | | | |
7. Credit Risk and Defaulted Securities
At February 28, 2018, Franklin High Yield Tax-Free Income Fund had 18.6% of its portfolio invested in high yield securities, or other securities rated below investment grade and unrated securities, if any. These securities may be more sensitive to economic conditions causing greater price volatility and are potentially subject to a greater risk of loss due to default than higher rated securities.
Certain or all Funds held defaulted securities and/or other securities for which the income has been deemed uncollectible. At February 28, 2018, the aggregate value of these securities for Franklin High Yield Tax-Free Income Fund and Franklin New Jersey Tax-Free Income Fund was $100,116,728 and $7,429,056, representing 1.5% and 0.8%, respectively, of each Fund’s net assets. The Funds discontinue accruing income on securities for which income has been deemed uncollectible and provide an estimate for losses on interest receivable. The securities have been identified in the accompanying Statements of Investments.
8. Concentration of Risk
Certain or all Funds invest a large percentage of their total assets in obligations of issuers within their respective state and U.S. territories. Such concentration may subject the Funds to risks associated with industrial or regional matters, and economic, political or legal developments occurring within those states and U.S. territories. Investing in Puerto Rico securities may expose the Funds to heightened risks due to recent adverse economic and market changes, credit downgrades and ongoing restructuring discussions. In addition, investments in these securities are sensitive to interest rate changes and credit risk of the issuer and may subject the Funds to increased market volatility. The market for these investments may be limited, which may make them difficult to buy or sell.
| | | | | | |
franklintempleton.com | | | | Annual Report | | 137 |
FRANKLIN TAX-FREE TRUST
NOTES TO FINANCIAL STATEMENTS
9. Restricted Securities
Certain or all Funds invest in securities that are restricted under the Securities Act of 1933 (1933 Act). Restricted securities are often purchased in private placement transactions, and cannot be sold without prior registration unless the sale is pursuant to an exemption under the 1933 Act. Disposal of these securities may require greater effort and expense, and prompt sale at an acceptable price may be difficult. The Funds may have registration rights for restricted securities. The issuer generally incurs all registration costs.
At February 28, 2018, investments in restricted securities, excluding securities exempt from registration under the 1933 Act deemed to be liquid, were as follows:
| | | | | | | | | | | | | | |
| Units | | Issuer | | Acquisition
Date | | | Cost | | | Value | |
Franklin High Yield Tax-Free Income Fund | | | | | | | | | | | | |
9,185,586 | | a 1155 Island Avenue LLC, LP (Value is 0.0%† of Net Assets) | | | 12/04/14 | | | $ | 717,086 | | | $ | 717,082 | |
| | | | | | | | | | |
†Rounds to less than 0.1% of net assets.
aThe Fund also invests in unrestricted securities or other investments in the issuer, valued at $4,537,410 as of February 28, 2018.
10. Credit Facility
The Funds, together with other U.S. registered and foreign investment funds (collectively, Borrowers), managed by Franklin Templeton Investments, are borrowers in a joint syndicated senior unsecured credit facility totaling $2 billion (Global Credit Facility) which matures on February 8, 2019. This Global Credit Facility provides a source of funds to the Borrowers for temporary and emergency purposes, including the ability to meet future unanticipated or unusually large redemption requests.
Under the terms of the Global Credit Facility, the Funds shall, in addition to interest charged on any borrowings made by the Funds and other costs incurred by the Funds, pay their share of fees and expenses incurred in connection with the implementation and maintenance of the Global Credit Facility, based upon their relative share of the aggregate net assets of all of the Borrowers, including an annual commitment fee of 0.15% based upon the unused portion of the Global Credit Facility. These fees are reflected in other expenses in the Statements of Operations. During the year ended February 28, 2018, the Funds did not use the Global Credit Facility.
11. Fair Value Measurements
The Funds follow a fair value hierarchy that distinguishes between market data obtained from independent sources (observable inputs) and the Funds’ own market assumptions (unobservable inputs). These inputs are used in determining the value of the Funds’ financial instruments and are summarized in the following fair value hierarchy:
| | • | | Level 1 – quoted prices in active markets for identical financial instruments |
| | • | | Level 2 – other significant observable inputs (including quoted prices for similar financial instruments, interest rates, prepayment speed, credit risk, etc.) |
| | • | | Level 3 – significant unobservable inputs (including the Funds’ own assumptions in determining the fair value of financial instruments) |
The input levels are not necessarily an indication of the risk or liquidity associated with financial instruments at that level.
For movements between the levels within the fair value hierarchy, the Funds have adopted a policy of recognizing the transfers as of the date of the underlying event which caused the movement.
| | | | | | |
138 | | Annual Report | | | | franklintempleton.com |
FRANKLIN TAX-FREE TRUST
NOTES TO FINANCIAL STATEMENTS
A summary of inputs used as of February 28, 2018, in valuing the Funds’ assets carried at fair value, is as follows:
| | | | | | | | | | | | | | | | |
| | | Level 1 | | | Level 2 | | | Level 3 | | | Total | |
Franklin Federal Intermediate-Term Tax-Free Income Fund | | | | | | | | | | | | | | | | |
Assets: | | | | | | | | | | | | | | | | |
Investments in Securities:a | | | | | | | | | | | | | | | | |
Municipal Bonds | | $ | — | | | $ | 3,933,145,450 | | | $ | — | | | $ | 3,933,145,450 | |
Short Term Investments | | | — | | | | 116,300,000 | | | | — | | | | 116,300,000 | |
Total Investments in Securities | | $ | — | | | $ | 4,049,445,450 | | | $ | — | | | $ | 4,049,445,450 | |
Franklin Federal Limited-Term Tax-Free Income Fund | | | | | | | | | | | | | | | | |
Assets: | | | | | | | | | | | | | | | | |
Investments in Securities:a | | | | | | | | | | | | | | | | |
Municipal Bonds | | $ | — | | | $ | 879,412,687 | | | $ | — | | | $ | 879,412,687 | |
Short Term Investments | | | — | | | | 105,941,907 | | | | — | | | | 105,941,907 | |
Total Investments in Securities | | $ | — | | | $ | 985,354,594 | | | $ | — | | | $ | 985,354,594 | |
Franklin High Yield Tax-Free Income Fund | | | | | | | | | | | | | | | | |
Assets: | | | | | | | | | | | | | | | | |
Investments in Securities:a | | | | | | | | | | | | | | | | |
Common Stocks and Other Equity Interests | | $ | — | | | $ | — | | | $ | 717,082 | | | $ | 717,082 | |
Corporate Bonds | | | — | | | | 4,537,410 | | | | — | | | | 4,537,410 | |
Municipal Bonds | | | — | | | | 6,600,951,683 | | | | 15 | | | | 6,600,951,698 | |
Short Term Investments | | | — | | | | 28,910,000 | | | | — | | | | 28,910,000 | |
Total Investments in Securities | | $ | — | | | $ | 6,634,399,093 | | | $ | 717,097 | | | $ | 6,635,116,190 | |
Franklin Massachusetts Tax-Free Income Fund | | | | | | | | | | | | | | | | |
Assets: | | | | | | | | | | | | | | | | |
Investments in Securities:a | | | | | | | | | | | | | | | | |
Municipal Bonds | | $ | — | | | $ | 479,906,897 | | | $ | — | | | $ | 479,906,897 | |
Short Term Investments | | | — | | | | 600,000 | | | | — | | | | 600,000 | |
Total Investments in Securities | | $ | — | | | $ | 480,506,897 | | | $ | — | | | $ | 480,506,897 | |
Franklin New Jersey Tax-Free Income Fund | | | | | | | | | | | | | | | | |
Assets: | | | | | | | | | | | | | | | | |
Investments in Securities:a | | | | | | | | | | | | | | | | |
Municipal Bonds | | $ | — | | | $ | 927,056,597 | | | $ | — | | | $ | 927,056,597 | |
Short Term Investments | | | — | | | | 4,400,000 | | | | — | | | | 4,400,000 | |
Total Investments in Securities | | $ | — | | | $ | 931,456,597 | | | $ | — | | | $ | 931,456,597 | |
aFor detailed categories, see the accompanying Statement of Investments.
A reconciliation of assets in which Level 3 inputs are used in determining fair value is presented when there are significant Level 3 financial instruments at the beginning and/or end of the year.
12. New Accounting Pronouncements
In March 2017, the Financial Accounting Standards Board issued Accounting Standards Update (ASU) No. 2017-08, Receivables—
Nonrefundable Fees and Other Costs (Subtopic 310-20): Premium Amortization on Purchased Callable Debt Securities. The amendments in the ASU shorten the amortization period for certain callable debt securities acquired at a premium, to be amortized to the earliest call date. The ASU does not require an accounting change for securities acquired at a discount, which continues to be amortized to maturity. The ASU is effective for fiscal years and interim periods within those fiscal years beginning after December 15, 2018. Management has reviewed the requirements and believes the adoption of this ASU will not have a material impact on the financial statements.
| | | | | | |
franklintempleton.com | | | | Annual Report | | 139 |
FRANKLIN TAX-FREE TRUST
NOTES TO FINANCIAL STATEMENTS
13. Subsequent Events
The Funds have evaluated subsequent events through the issuance of the financial statements and determined that no events have occurred that require disclosure.
Abbreviations
Selected Portfolio
| | | | | | |
| AGMC | | Assured Guaranty Municipal Corp. | | IDBR | | Industrial Development Board Revenue |
| AMBAC | | American Municipal Bond Assurance Corp. | | IDR | | Industrial Development Revenue |
| BAM | | Build America Mutual Assurance Co. | | ISD | | Independent School District |
| BAN | | Bond Anticipation Note | | LIBOR | | London InterBank Offered Rate |
| BHAC | | Berkshire Hathaway Assurance Corp. | | LOC | | Letter of Credit |
| CDA | | Community Development Authority/Agency | | MAC | | Municipal Assurance Corp. |
| CDD | | Community Development District | | MFHR | | Multi-Family Housing Revenue |
| CFD | | Community Facilities District | | MFMR | | Multi-Family Mortgage Revenue |
| COP | | Certificate of Participation | | MTA | | Metropolitan Transit Authority |
| EDA | | Economic Development Authority | | MUNIPSA | | SIFMA Municipal Swap Index |
| EDC | | Economic Development Corp. | | NATL | | National Public Financial Guarantee Corp. |
| EDR | | Economic Development Revenue | | PBA | | Public Building Authority |
| ETM | | Escrow to Maturity | | PCC | | Pollution Control Corp. |
| FHA | | Federal Housing Authority/Agency | | PCFA | | Pollution Control Financing Authority |
| FICO | | Financing Corp. | | PCR | | Pollution Control Revenue |
| FRN | | Floating Rate Note | | PFA | | Public Financing Authority |
| GARB | | General Airport Revenue Bonds | | PFAR | | Public Financing Authority Revenue |
| GNMA | | Government National Mortgage Association | | PIK | | Payment-In-Kind |
| GO | | General Obligation | | PSF | | Permanent School Fund |
| HDA | | Housing Development Authority/Agency | | RDA | | Redevelopment Agency/Authority |
| HDC | | Housing Development Corp. | | SF | | Single Family |
| HFA | | Housing Finance Authority/Agency | | SPA | | Standby Purchase Agreement |
| HFAR | | Housing Finance Authority Revenue | | TAN | | Tax Anticipation Note |
| ID | | Improvement District | | TRAN | | Tax and Revenue Anticipation Note |
| IDA | | Industrial Development Authority/Agency | | UHSD | | Unified/Union High School District |
| IDAR | | Industrial Development Authority Revenue | | USD | | Unified/Union School District |
| IDB | | Industrial Development Bond/Board | | XLCA | | XL Capital Assurance |
| | | | | | |
140 | | Annual Report | | | | franklintempleton.com |
FRANKLIN TAX-FREE TRUST
Report of Independent Registered Public Accounting Firm
To the Board of Trustees of Franklin Tax-Free Trust and Shareholders of Franklin Federal Intermediate-Term Tax-Free Income Fund, Franklin Federal Limited-Term Tax-Free Income Fund, Franklin High Yield Tax-Free Income Fund, Franklin Massachusetts Tax-Free Income Fund, and Franklin New Jersey Tax-Free Income Fund
Opinions on the Financial Statements
We have audited the accompanying statements of assets and liabilities, including the statements of investments, of Franklin Federal Intermediate-Term Tax-Free Income Fund, Franklin Federal Limited-Term Tax-Free Income Fund, Franklin High Yield Tax-Free Income Fund, Franklin Massachusetts Tax-Free Income Fund, and Franklin New Jersey Tax-Free Income Fund (the “Funds”) as of February 28, 2018, the related statements of operations for the year ended February 28, 2018, the statements of changes in net assets for each of the two years in the period ended February 28, 2018, including the related notes, and the financial highlights for each of the periods indicated therein (collectively referred to as the “financial statements”). In our opinion, the financial statements present fairly, in all material respects, the financial position of each of the Funds as of February 28, 2018, the results of each of their operations for the year then ended, the changes in each of their net assets for each of the two years in the period ended February 28, 2018, and each of the financial highlights for each of the periods indicated therein, in conformity with accounting principles generally accepted in the United States of America.
Basis for Opinions
These financial statements are the responsibility of the Funds’ management. Our responsibility is to express an opinion on the Funds’ financial statements based on our audits. We are a public accounting firm registered with the Public Company Accounting Oversight Board (United States) (“PCAOB”) and are required to be independent with respect to the Funds in accordance with the U.S. federal securities laws and the applicable rules and regulations of the Securities and Exchange Commission and the PCAOB.
We conducted our audits of these financial statements in accordance with the standards of the PCAOB. Those standards require that we plan and perform the audit to obtain reasonable assurance about whether the financial statements are free of material misstatement, whether due to error or fraud.
Our audits included performing procedures to assess the risks of material misstatement of the financial statements, whether due to error or fraud, and performing procedures that respond to those risks. Such procedures included examining, on a test basis, evidence regarding the amounts and disclosures in the financial statements. Our audits also included evaluating the accounting principles used and significant estimates made by management, as well as evaluating the overall presentation of the financial statements. Our procedures included confirmation of securities owned as of February 28, 2018 by correspondence with the custodian and brokers; when replies were not received from brokers, we performed other auditing procedures. We believe that our audits provide a reasonable basis for our opinions.
PricewaterhouseCoopers LLP
San Francisco, California
April 17, 2018
We have served as the auditor of one or more investment companies in the Franklin Templeton Group of Funds since 1948.
| | | | | | |
franklintempleton.com | | | | Annual Report | | 141 |
FRANKLIN TAX-FREE TRUST
Tax Information (unaudited)
Under Section 852(b)(5)(A) of the Internal Revenue Code, the Funds hereby report 100% of the distributions paid from net investment income as exempt-interest dividends for the fiscal year ended February 28, 2018. A portion of the Funds’ exempt-interest dividends may be subject to the federal alternative minimum tax. By mid-February 2019, shareholders will be notified of amounts for use in preparing their 2018 income tax returns.
| | | | | | |
142 | | Annual Report | | | | franklintempleton.com |
FRANKLIN TAX-FREE TRUST
Special Meeting of Shareholders
MEETING OF SHAREHOLDERS: OCTOBER 30, 2017 AND RECONVENED ON DECEMBER 15, 2017 AND DECEMBER 29, 2017
(UNAUDITED)
A Special Meeting of Shareholders of Franklin Tax-Free Trust was held at the offices of Franklin Templeton Investments, One Franklin Parkway, San Mateo, California on October 30, 2017 and reconvened on December 15, 2017 and December 29, 2017. The purpose of the meeting was to elect Trustees of Franklin Tax-Free Trust and to vote on the following proposals: for each Fund, to approve the use of a “manager of managers” structure whereby the Fund’s investment manager would be able to hire and replace subadvisers without shareholder approval; for each Fund, to approve an amended fundamental investment restriction regarding investments in commodities; and for each of Franklin High Yield Tax-Free Income Fund and Franklin Federal Intermediate-Term Tax-Free Income Fund, to consider a shareholder proposal. At the meeting, (i) the following persons were elected by the shareholders to serve as Trustees of Franklin Tax-Free Trust: Harris J. Ashton, Terrence J. Checki, Mary C. Choksi, Edith E. Holiday, Gregory E. Johnson, Rupert H. Johnson, Jr., J. Michael Luttig, Larry D. Thompson, and John B. Wilson; (ii) the proposal to use a “manager of managers” structure was approved by shareholders of each Fund, except for Franklin New Jersey Tax-Free Income Fund; (iii) the proposal to approve the amended fundamental investment restriction regarding investments in commodities was approved by shareholders of each Fund; and (iv) sufficient votes were not received to pass the shareholder proposals for Franklin High Yield Tax-Free Income Fund and Franklin Federal Intermediate-Term Tax-Free Income Fund. No other business was transacted at the meeting.
In connection with the meeting, management is aware that some shareholders received from the proxy solicitor numerous calls and mailings that may have been distracting. Management is taking steps to ensure that, in the future, for any new shareholder meeting solicitations that occur, such activity is not repeated. Management apologizes for any inconvenience that may have been caused as a result of such calls and mailings.
The results of the voting at the meeting are as follows:
Proposal 1. To elect a Board of Trustees:
| | | | | | | | |
| Name | | For | | | Withheld | |
| | |
Harris J. Ashton. | | | 1,485,764,192 | | | | 48,269,290 | |
| | |
Terrence J. Checki | | | 1,485,932,300 | | | | 48,101,184 | |
| | |
Mary C. Choksi | | | 1,486,925,610 | | | | 47,110,941 | |
| | |
Edith E. Holiday. | | | 1,487,685,965 | | | | 46,349,353 | |
| | |
Gregory E. Johnson | | | 1,487,506,272 | | | | 46,527,212 | |
| | |
Rupert H. Johnson, Jr. | | | 1,486,183,613 | | | | 47,849,870 | |
| | |
J. Michael Luttig | | | 1,487,803,427 | | | | 46,228,223 | |
| | |
Larry D. Thompson | | | 1,486,866,073 | | | | 47,167,412 | |
| | |
John B. Wilson | | | 1,488,071,744 | | | | 45,961,741 | |
| | |
Total Trust Shares Outstanding*: 2,524,132,627 | | | | | | | | |
*As of the record date.
| | | | | | |
franklintempleton.com | | | | Annual Report | | 143 |
FRANKLIN TAX-FREE TRUST
SPECIAL MEETING OF SHAREHOLDERS
| Proposal 2. | To approve the use of a “manager of managers” structure whereby the Fund’s investment manager would be able to hire and replace subadvisers without shareholder approval: |
Franklin Federal Intermediate-Term Tax-Free Income Fund
| | | | |
| | | Shares | |
For | | | 174,555,376 | |
Against | | | 6,186,915 | |
Abstain | | | 4,085,857 | |
Broker Non-Votes | | | 56,243,497 | |
Total Fund Shares Voted | | | 241,071,639 | |
Total Fund Shares Outstanding* | | | 361,063,110 | |
Franklin Federal Limited-Term Tax-Free Income Fund
| | | | |
| | | Shares | |
For | | | 45,695,413 | |
Against | | | 1,814,469 | |
Abstain | | | 1,417,296 | |
Broker Non-Votes | | | 13,166,655 | |
Total Fund Shares Voted | | | 62,093,835 | |
Total Fund Shares Outstanding* | | | 102,015,166 | |
Franklin High Yield Tax-Free Income Fund
| | | | |
| | | Shares | |
For | | | 288,791,333 | |
Against | | | 20,101,690 | |
Abstain | | | 16,435,160 | |
Broker Non-Votes | | | 94,212,997 | |
Total Fund Shares Voted | | | 419,541,192 | |
Total Fund Shares Outstanding* | | | 721,264,232 | |
Franklin Massachusetts Tax-Free Income Fund
| | | | |
| | | Shares | |
For | | | 18,190,354 | |
Against | | | 970,903 | |
Abstain | | | 1,032,767 | |
Broker Non-Votes | | | 6,309,149 | |
Total Fund Shares Voted | | | 26,503,175 | |
Total Fund Shares Outstanding* | | | 40,913,927 | |
Franklin New Jersey Tax-Free Income Fund
| | | | |
| | | Shares | |
For | | | 36,159,797 | |
Against | | | 3,621,396 | |
Abstain | | | 2,411,248 | |
Broker Non-Votes | | | 12,025,886 | |
Total Fund Shares Voted | | | 54,218,331 | |
Total Fund Shares Outstanding* | | | 91,399,205 | |
| | | | | | |
144 | | Annual Report | | | | franklintempleton.com |
FRANKLIN TAX-FREE TRUST
SPECIAL MEETING OF SHAREHOLDERS
| Proposal 3. | To approve an amended fundamental investment restriction regarding investments in commodities: |
Franklin Federal Intermediate-Term Tax-Free Income Fund
| | | | |
| | | Shares | |
For | | | 174,291,537 | |
Against | | | 5,023,615 | |
Abstain | | | 5,512,990 | |
Broker Non-Votes | | | 56,243,497 | |
Total Fund Shares Voted | | | 241,071,639 | |
Total Fund Shares Outstanding* | | | 361,063,110 | |
Franklin Federal Limited-Term Tax-Free Income Fund
| | | | |
| | | Shares | |
For | | | 45,655,570 | |
Against | | | 1,340,292 | |
Abstain | | | 1,931,318 | |
Broker Non-Votes | | | 13,166,655 | |
Total Fund Shares Voted | | | 62,093,835 | |
Total Fund Shares Outstanding* | | | 102,015,166 | |
Franklin High Yield Tax-Free Income Fund
| | | | |
| | | Shares | |
For | | | 289,614,209 | |
Against | | | 18,140,655 | |
Abstain | | | 17,573,332 | |
Broker Non-Votes | | | 94,212,997 | |
Total Fund Shares Voted | | | 419,541,192 | |
Total Fund Shares Outstanding* | | | 721,264,232 | |
Franklin Massachusetts Tax-Free Income Fund
| | | | |
| | | Shares | |
For | | | 17,856,890 | |
Against | | | 937,275 | |
Abstain | | | 1,399,861 | |
Broker Non-Votes | | | 6,309,149 | |
Total Fund Shares Voted | | | 26,503,175 | |
Total Fund Shares Outstanding* | | | 40,913,927 | |
Franklin New Jersey Tax-Free Income Fund
| | | | |
| | | Shares | |
For | | | 36,632,698 | |
Against | | | 2,568,382 | |
Abstain | | | 2,991,365 | |
Broker Non-Votes | | | 12,025,886 | |
Total Fund Shares Voted | | | 54,218,331 | |
Total Fund Shares Outstanding* | | | 91,399,205 | |
| | | | | | |
franklintempleton.com | | | | Annual Report | | 145 |
FRANKLIN TAX-FREE TRUST
SPECIAL MEETING OF SHAREHOLDERS
Proposal 4. | Shareholder proposal requesting that Franklin High Yield Tax-Free Income Fund’s Board institute procedures to prevent holding investments in companies that, in the judgement of the Board, substantially contribute to genocide or crimes against humanity: |
| | | | |
| | | Shares | |
For | | | 67,331,109 | |
Against | | | 235,901,407 | |
Abstain | | | 22,095,672 | |
Broker Non-Votes | | | 94,212,997 | |
Total Fund Shares Voted | | | 419,541,192 | |
Total Fund Shares Outstanding* | | | 721,264,232 | |
Proposal 5. | Shareholder proposal requesting that Franklin Federal Intermediate-Term Tax-Free Income Fund’s Board institute transparent procedures to prevent holding investments in companies that, in the judgement of management, substantially contribute to genocide or crimes against humanity: |
| | | | |
| | | Shares | |
For | | | 22,991,945 | |
Against | | | 154,428,889 | |
Abstain | | | 7,407,308 | |
Broker Non-Votes | | | 56,243,497 | |
Total Fund Shares Voted | | | 241,071,639 | |
Total Fund Shares Outstanding* | | | 361,063,110 | |
| | | | | | |
146 | | Annual Report | | | | franklintempleton.com |
FRANKLIN TAX-FREE TRUST
Board Members and Officers
The name, year of birth and address of the officers and board members, as well as their affiliations, positions held with the Trust, principal occupations during at least the past five years and number of US registered portfolios overseen in the Franklin Templeton Investments fund complex, are shown below. Generally, each board member serves until that person’s successor is elected and qualified.
Independent Board Members
| | | | | | | | |
Name, Year of Birth and Address | | Position | | Length of
Time Served | | Number of Portfolios in
Fund Complex Overseen
by Board Member* | | Other Directorships Held During at Least the Past 5 Years |
Harris J. Ashton (1932) One Franklin Parkway San Mateo, CA 94403-1906 | | Trustee | | Since 1984 | | 139 | | Bar-S Foods (meat packing company) (1981-2010). |
Principal Occupation During at Least the Past 5 Years: Director of various companies; and formerly, Director, RBC Holdings, Inc. (bank holding company) (until 2002); and President, Chief Executive Officer and Chairman of the Board, General Host Corporation (nursery and craft centers) (until 1998). |
Terrence J. Checki (1945) One Franklin Parkway San Mateo, CA 94403-1906 | | Trustee | | Since December 2017 | | 113 | | Hess Corporation (exploration of oil and gas) (2014-present). |
|
Principal Occupation During at Least the Past 5 Years: |
Member of the Council on Foreign Relations (1996-present); Member of the National Committee on U.S.-China Relations (1999-present); member of the Board of Trustees of the Economic Club of New York (2013-present); member of the Board of Trustees of the Foreign Policy Association (2005-present) and member of various other boards of trustees and advisory boards; and formerly, Executive Vice President of the Federal Reserve Bank of New York and Head of its Emerging Markets and Internal Affairs Group and Member of Management Committee (1995-2014); and Visiting Fellow at the Council on Foreign Relations (2014). |
Mary C. Choksi (1950) One Franklin Parkway San Mateo, CA 94403-1906 | | Trustee | | Since 2014 | | 139 | | Avis Budget Group Inc. (car rental) (2007-present), Omnicom Group Inc. (advertising and marketing communications services) (2011-present) and White Mountains Insurance Group, Ltd. (holding company) (2017-present). |
Principal Occupation During at Least the Past 5 Years: |
Director of various companies; and formerly, Founder and Senior Advisor, Strategic Investment Group (investment management group) (2015-2017); Founding Partner and Senior Managing Director, Strategic Investment Group (1987–2015); Founding Partner and Managing Director, Emerging Markets Management LLC (investment management firm) (1987-2011); and Loan Officer/Senior Loan Officer/Senior Pension Investment Officer, World Bank Group (international financial institution) (1977-1987). |
Edith E. Holiday (1952) One Franklin Parkway San Mateo, CA 94403-1906 | | Trustee | | Since 1998 | | 139 | | Hess Corporation (exploration of oil and gas) (1993-present), Canadian National Railway (railroad) (2001-present), White Mountains Insurance Group, Ltd. (holding company) (2004-present), Santander Consumer USA Holdings, Inc. (consumer finance) (2016-present), RTI International Metals, Inc. (manufacture and distribution of titanium) (1999-2015) and H.J. Heinz Company (processed foods and allied products) (1994-2013). |
Principal Occupation During at Least the Past 5 Years: |
Director or Trustee of various companies and trusts; and formerly, Assistant to the President of the United States and Secretary of the Cabinet (1990-
1993); General Counsel to the United States Treasury Department (1989-1990); and Counselor to the Secretary and Assistant Secretary for Public
Affairs and Public Liaison – United States Treasury Department (1988-1989). |
J. Michael Luttig (1954) One Franklin Parkway San Mateo, CA 94403-1906 | | Trustee | | Since 2009 | | 139 | | Boeing Capital Corporation (aircraft financing) (2006-2013). |
Principal Occupation During at Least the Past 5 Years: |
Executive Vice President, General Counsel and member of the Executive Council, The Boeing Company (aerospace company) (2006-present); and formerly, Federal Appeals Court Judge, U.S. Court of Appeals for the Fourth Circuit (1991-2006). |
| | | | | | |
franklintempleton.com | | | | Annual Report | | 147 |
FRANKLIN TAX-FREE TRUST
Independent Board Members (continued)
| | | | | | | | |
Name, Year of Birth
and Address | | Position | | Length of
Time Served | | Number of Portfolios in
Fund Complex Overseen
by Board Member* | | Other Directorships Held
During at Least the Past 5 Years |
Larry D. Thompson (1945) One Franklin Parkway San Mateo, CA 94403-1906 | | Trustee | | Since 2007 | | 139 | | The Southern Company (energy company) (2014-present; previously 2010-2012), Graham Holdings Company (education and media organization) (2011-present) and Cbeyond, Inc. (business communications provider) (2010-2012). |
Principal Occupation During at Least the Past 5 Years: Director of various companies; Counsel, Finch McCranie, LLP (law firm) (2015-present); Independent Compliance Monitor and Auditor, Volkswagen AG (manufacturer of automobiles and commercial vehicles) (2017 – present); John A. Sibley Professor of Corporate and Business Law, University of Georgia School of Law (2015-present; previously 2011-2012); and formerly, Executive Vice President – Government Affairs, General Counsel and Corporate Secretary, PepsiCo, Inc. (consumer products) (2012-2014); Senior Vice President – Government Affairs, General Counsel and Secretary, PepsiCo, Inc. (2004-2011); Senior Fellow of The Brookings Institution (2003-2004); Visiting Professor, University of Georgia School of Law (2004); and Deputy Attorney General, U.S. Department of Justice (2001-2003). |
John B. Wilson (1959) One Franklin Parkway San Mateo, CA 94403-1906 | | Lead
Independent
Trustee | | Trustee since 2007 and Lead Independent Trustee since 2008 | | 113 | | None |
| Principal Occupation During at Least the Past 5 Years: | | | | |
President and Founder, Hyannis Port Capital, Inc. (real estate and private equity investing) (2002-present); Senior Advisor, McKinsey & Co. (consulting) (2017-present); serves on private and non-profit boards; and formerly, President, Staples International and Head of Global Transformation (office supplies) (2012-2016); Chief Operating Officer and Executive Vice President, Gap, Inc. (retail) (1996-2000); Chief Financial Officer and Executive Vice President – Finance and Strategy, Staples, Inc. (1992-1996); Senior Vice President – Corporate Planning, Northwest Airlines, Inc. (airlines) (1990-1992); and Vice President and Partner, Bain & Company (consulting firm) (1986-1990). |
| Interested Board Members and Officers |
Name, Year of Birth and Address | | Position | | Length of
Time Served | | Number of Portfolios in
Fund Complex Overseen
by Board Member* | | Other Directorships Held During at Least the Past 5 Years |
| | | | |
**Gregory E. Johnson (1961) One Franklin Parkway San Mateo, CA 94403-1906 | | Trustee | | Since 2007 | | 153 | | None |
Principal Occupation During at Least the Past 5 Years: Chairman of the Board, Member – Office of the Chairman, Director and Chief Executive Officer, Franklin Resources, Inc.; officer and/or director or trustee, as the case may be, of some of the other subsidiaries of Franklin Resources, Inc. and of 43 of the investment companies in Franklin Templeton Investments; Vice Chairman, Investment Company Institute; and formerly, President, Franklin Resources, Inc. (1994-2015). |
**Rupert H. Johnson, Jr. (1940) One Franklin Parkway San Mateo, CA 94403-1906 | | Chairman of
the Board
and Trustee | | Since 2013 | | 139 | | None |
Principal Occupation During at Least the Past 5 Years: |
Vice Chairman, Member – Office of the Chairman and Director, Franklin Resources, Inc.; Director, Franklin Advisers, Inc.; Senior Vice President, Franklin Advisory Services, LLC; and officer and/or director or trustee, as the case may be, of some of the other subsidiaries of Franklin Resources, Inc. and of 41 of the investment companies in Franklin Templeton Investments. |
Sheila Amoroso (1959) One Franklin Parkway San Mateo, CA 94403-1906 | | Vice
President | | Since 1999 | | Not Applicable | | Not Applicable |
Principal Occupation During at Least the Past 5 Years: |
Senior Vice President, Franklin Advisers, Inc.; and officer of seven of the investment companies in Franklin Templeton Investments. |
| | | | | | |
148 | | Annual Report | | | | franklintempleton.com |
FRANKLIN TAX-FREE TRUST
Interested Board Members and Officers (continued)
| | | | | | | | |
Name, Year of Birth
and Address | | Position | | Length of
Time Served | | Number of Portfolios in
Fund Complex Overseen
by Board Member* | | Other Directorships Held
During at Least the Past 5 Years |
| | | | |
Alison E. Baur (1964) One Franklin Parkway
San Mateo, CA 94403-1906 | | Vice President | | Since 2012 | | Not Applicable | | Not Applicable |
|
| Principal Occupation During at Least the Past 5 Years: |
| Deputy General Counsel, Franklin Templeton Investments; and officer of some of the other subsidiaries of Franklin Resources, Inc. and of 45 of the investment companies in Franklin Templeton Investments. |
| | | | |
Rafael R. Costas, Jr. (1965) One Franklin Parkway
San Mateo, CA 94403-1906 | | Vice President | | Since 1999 | | Not Applicable | | Not Applicable |
|
| Principal Occupation During at Least the Past 5 Years: |
| Senior Vice President, Franklin Advisers, Inc.; and officer of seven of the investment companies in Franklin Templeton Investments. |
| | | | |
Gaston Gardey (1967) One Franklin Parkway
San Mateo, CA 94403-1906 | | Chief Financial Officer, Chief Accounting Officer and Treasurer | | Since 2009 | | Not Applicable | | Not Applicable |
|
| Principal Occupation During at Least the Past 5 Years: |
| Treasurer, U.S. Fund Administration & Reporting, Franklin Templeton Investments; and officer of 28 of the investment companies in Franklin Templeton Investments. |
| | | | |
Aliya S. Gordon (1973) One Franklin Parkway
San Mateo, CA 94403-1906 | | Vice President | | Since 2009 | | Not Applicable | | Not Applicable |
|
| Principal Occupation During at Least the Past 5 Years: |
| Senior Associate General Counsel, Franklin Templeton Investments; and officer of 45 of the investment companies in Franklin Templeton Investments. |
| | | | |
Steven J. Gray (1955) One Franklin Parkway
San Mateo, CA 94403-1906 | | Vice President | | Since 2009 | | Not Applicable | | Not Applicable |
|
| Principal Occupation During at Least the Past 5 Years: |
| Senior Associate General Counsel, Franklin Templeton Investments; Vice President, Franklin Templeton Distributors, Inc. and FASA, LLC; and officer of 45 of the investment companies in Franklin Templeton Investments. |
| | | | |
Matthew T. Hinkle (1971) One Franklin Parkway
San Mateo, CA 94403-1906 | | Chief Executive Officer – Finance and Administration | | Since June 2017 | | Not Applicable | | Not Applicable |
|
| Principal Occupation During at Least the Past 5 Years: |
| Senior Vice President, Franklin Templeton Services, LLC; officer of 45 of the investment companies in Franklin Templeton Investments; and formerly, Vice President, Global Tax (2012-April 2017) and Treasurer/Assistant Treasurer, Franklin Templeton Investments (2009-2017). |
| | | | |
Robert Lim (1948) One Franklin Parkway
San Mateo, CA 94403-1906 | | Vice President - AML Compliance | | Since 2016 | | Not Applicable | | Not Applicable |
|
| Principal Occupation During at Least the Past 5 Years: |
| Vice President, Franklin Templeton Companies, LLC; Chief Compliance Officer, Franklin Templeton Distributors, Inc. and Franklin Templeton Investor Services, LLC; and officer of 45 of the investment companies in Franklin Templeton Investments. |
| | | | | | |
franklintempleton.com | | | | Annual Report | | 149 |
FRANKLIN TAX-FREE TRUST
Interested Board Members and Officers (continued)
| | | | | | | | |
Name, Year of Birth
and Address | | Position | | Length of
Time Served | | Number of Portfolios in
Fund Complex Overseen
by Board Member* | | Other Directorships Held
During at Least the Past 5 Years |
| | | | |
Christopher J. Molumphy (1962) One Franklin Parkway San Mateo, CA 94403-1906 | | President and Chief Executive Officer – Investment Management | | Since 2010 | | Not Applicable | | Not Applicable |
|
| Principal Occupation During at Least the Past 5 Years: |
| Director and Executive Vice President, Franklin Advisers, Inc.; Executive Vice President, Franklin Templeton Institutional, LLC; and officer of some of the other subsidiaries of Franklin Resources, Inc. and of 21 of the investment companies in Franklin Templeton Investments. |
| | | | |
Kimberly H. Novotny (1972) 300 S.E. 2nd Street Fort Lauderdale, FL 33301-1923 | | Vice President | | Since 2013 | | Not Applicable | | Not Applicable |
|
| Principal Occupation During at Least the Past 5 Years: |
| Associate General Counsel, Franklin Templeton Investments; Vice President and Corporate Secretary, Fiduciary Trust International of the South; Vice President, Templeton Investment Counsel, LLC; Assistant Secretary, Franklin Resources, Inc.; and officer of 45 of the investment companies in Franklin Templeton Investments. |
| | | | |
Robert C. Rosselot (1960) 300 S.E. 2nd Street Fort Lauderdale, FL 33301-1923 | | Chief Compliance Officer | | Since 2013 | | Not Applicable | | Not Applicable |
|
| Principal Occupation During at Least the Past 5 Years: |
| Director, Global Compliance, Franklin Templeton Investments; Vice President, Franklin Templeton Companies, LLC; officer of 45 of the investment companies in Franklin Templeton Investments; and formerly, Senior Associate General Counsel, Franklin Templeton Investments (2007-2013); and Secretary and Vice President, Templeton Group of Funds (2004-2013). |
| | | | |
Karen L. Skidmore (1952) One Franklin Parkway San Mateo, CA 94403-1906 | | Vice President and Secretary | | Since 2006 | | Not Applicable | | Not Applicable |
|
| Principal Occupation During at Least the Past 5 Years: |
| Senior Associate General Counsel, Franklin Templeton Investments; and officer of 45 of the investment companies in Franklin Templeton Investments. |
| | | | |
Navid J. Tofigh (1972) One Franklin Parkway San Mateo, CA 94403-1906 | | Vice President | | Since 2015 | | Not Applicable | | Not Applicable |
|
| Principal Occupation During at Least the Past 5 Years: |
| Associate General Counsel, Franklin Templeton Investments; and officer of 45 of the investment companies in Franklin Templeton Investments. |
| | | | |
Craig S. Tyle (1960) One Franklin Parkway San Mateo, CA 94403-1906 | | Vice President | | Since 2005 | | Not Applicable | | Not Applicable |
|
| Principal Occupation During at Least the Past 5 Years: |
| General Counsel and Executive Vice President, Franklin Resources, Inc.; and officer of some of the other subsidiaries of Franklin Resources, Inc. and of 45 of the investment companies in Franklin Templeton Investments. |
| | | | |
Thomas Walsh (1961) One Franklin Parkway San Mateo, CA 94403-1906 | | Vice President | | Since 1999 | | Not Applicable | | Not Applicable |
|
| Principal Occupation During at Least the Past 5 Years: |
| Senior Vice President, Franklin Advisers, Inc.; and officer of seven of the investment companies in Franklin Templeton Investments. |
| | | | | | |
150 | | Annual Report | | | | franklintempleton.com |
FRANKLIN TAX-FREE TRUST
Interested Board Members and Officers (continued)
| | | | | | | | |
Name, Year of Birth
and Address | | Position | | Length of
Time Served | | Number of Portfolios in
Fund Complex Overseen
by Board Member* | | Other Directorships Held
During at Least the Past 5 Years |
| | | | |
Lori A. Weber (1964) 300 S.E. 2nd Street Fort Lauderdale, FL 33301-1923 | | Vice President | | Since 2011 | | Not Applicable | | Not Applicable |
|
| Principal Occupation During at Least the Past 5 Years: |
| Senior Associate General Counsel, Franklin Templeton Investments; Assistant Secretary, Franklin Resources, Inc.; Vice President and Secretary, Templeton Investment Counsel, LLC; and officer of 45 of the investment companies in Franklin Templeton Investments. |
*We base the number of portfolios on each separate series of the US registered investment companies within the Franklin Templeton Investments fund complex. These portfolios have a common investment manager or affiliated investment managers.
**Gregory E. Johnson is considered to be an interested person of the Fund under the federal securities laws due to his position as an officer and director of Franklin Resources, Inc. (Resources), which is the parent company of the Fund’s investment manager and distributor. Rupert H. Johnson, Jr. is considered to be an interested person of the Fund under the federal securities laws due to his position as officer and director and major shareholder of Resources.
Note 1: Rupert H. Johnson, Jr. is the uncle of Gregory E. Johnson.
Note 2: Officer information is current as of the date of this report. It is possible that after this date, information about officers may change.
The Sarbanes-Oxley Act of 2002 and Rules adopted by the Securities and Exchange Commission require the Fund to disclose whether the Fund’s Audit Committee includes at least one member who is an audit committee financial expert within the meaning of such Act and Rules. The Fund’s Board has determined that there is at least one such financial expert on the Audit Committee and has designated John B. Wilson as its audit committee financial expert. The Board believes that Mr. Wilson qualifies as such an expert in view of his extensive business background and experience, including service as chief financial officer of Staples, Inc. from 1992 to 1996. Mr. Wilson has been a Member and Chairman of the Fund’s Audit Committee since 2007. As a result of such background and experience, the Board believes that Mr. Wilson has acquired an understanding of generally accepted accounting principles and financial statements, the general application of such principles in connection with the accounting estimates, accruals and reserves, and analyzing and evaluating financial statements that present a breadth and level of complexity of accounting issues generally comparable to those of the Fund, as well as an understanding of internal controls and procedures for financial reporting and an understanding of audit committee functions. Mr. Wilson is an independent Board member as that term is defined under the relevant Securities and Exchange Commission Rules and Releases.
The Statement of Additional Information (SAI) includes additional information about the board members and is available, without charge, upon request. Shareholders may call (800) DIAL BEN/342-5236 to request the SAI.
| | | | | | |
franklintempleton.com | | | | Annual Report | | 151 |
FRANKLIN TAX-FREE TRUST
Shareholder Information
Board Approval of Investment Management Agreements
FRANKLIN TAX-FREE TRUST
Franklin Federal Intermediate-Term Tax-Free Income Fund
Franklin Federal Limited-Term Tax-Free Income Fund
Franklin High Yield Tax-Free Income Fund
Franklin Massachusetts Tax-Free Income Fund
Franklin New Jersey Tax-Free Income Fund
(each a Fund)
At an in-person meeting held on February 27, 2018 (Meeting), the Board of Trustees (Board) of Franklin Tax-Free Trust (Trust), including a majority of the trustees who are not “interested persons” as defined in the Investment Company Act of 1940 (Independent Trustees), reviewed and approved the continuance of the investment management agreement between Franklin Advisers, Inc. (Manager) and the Trust, on behalf of each Fund (each a Management Agreement) for an additional one-year period. The Independent Trustees received advice from and met separately with Independent Trustee counsel in considering whether to approve the continuation of each Management Agreement. Although the Management Agreements for the Funds were considered at the same Board meeting, the Board considered the information provided to it about the Funds together and with respect to each Fund separately as the Board deemed appropriate.
In considering the continuation of each Management Agreement, the Board reviewed and considered information provided by the Manager at the Meeting and throughout the year at meetings of the Board and its committees. The Board also reviewed and considered information provided in response to a detailed set of requests for information submitted to the Manager by Independent Trustee counsel on behalf of the Independent Trustees in connection with the annual contract renewal process. In addition, prior to the Meeting, the Independent Trustees held a telephonic contract renewal meeting at which the Independent Trustees conferred amongst themselves and Independent Trustee counsel about contract renewal matters. The Board reviewed and considered all of the factors it deemed relevant in approving the continuance of each Management Agreement, including, but not limited to: (i) the nature, extent and quality of the services provided by the Manager; (ii) the investment performance of each Fund; (iii) the costs of the services provided and profits realized by the Manager and its affiliates from the relationship with each Fund; (iv) the extent to which economies of scale are realized as each
Fund grows; and (v) whether fee levels reflect these economies of scale for the benefit of Fund investors.
In approving the continuance of each Management Agreement, the Board, including a majority of the Independent Trustees, determined that the terms of the Management Agreement are fair and reasonable and that the continuance of such Management Agreement is in the interests of the applicable Fund and its shareholders. While attention was given to all information furnished, the following discusses some primary factors relevant to the Board’s determination.
Nature, Extent and Quality of Services
The Board reviewed and considered information regarding the nature, extent and quality of investment management services provided by the Manager and its affiliates to the Funds and their shareholders. This information included, among other things, the qualifications, background and experience of the senior management and investment personnel of the Manager; the structure of investment personnel compensation; oversight of third-party service providers; investment performance reports and related financial information for each Fund; reports on expenses, shareholder services, marketing support payments made to financial intermediaries and third party servicing arrangements; legal and compliance matters; risk controls; pricing and other services provided by the Manager and its affiliates; and management fees charged by the Manager and its affiliates to U.S. funds and other accounts, including management’s explanation of differences among accounts where relevant. The Board also reviewed and considered an annual report on payments made by Franklin Templeton Investments (FTI) or the Funds to financial intermediaries, as well as a memorandum relating to third-party servicing arrangements in response to a guidance update in 2016 from the U.S. Securities and Exchange Commission (SEC) relating to mutual fund distribution and sub-accounting fees. The Board noted management’s continuing efforts and expenditures in establishing effective business continuity plans and developing strategies to address areas of heightened concern in the mutual fund industry, such as cybersecurity and liquidity risk management. The Board also recognized management’s commitment to facilitating Board oversight of particular areas, including derivatives and payments to intermediaries, by enhanced reporting.
The Board also reviewed and considered the benefits provided to Fund shareholders of investing in a fund that is part of the Franklin Templeton family of funds. The Board noted the financial position of Franklin Resources, Inc. (FRI), the
| | | | | | |
152 | | Annual Report | | | | franklintempleton.com |
FRANKLIN TAX-FREE TRUST
SHAREHOLDER INFORMATION
Manager’s parent, and its commitment to the mutual fund business as evidenced by its continued introduction of new funds, reassessment of the fund offerings in response to the market environment and project initiatives and capital investments relating to the services provided to the Funds by the FTI organization.
Following consideration of such information, the Board was satisfied with the nature, extent and quality of services provided by the Manager and its affiliates to the Funds and their shareholders.
Fund Performance
The Board reviewed and considered the performance results of each Fund over various time periods ended December 31, 2017. The Board considered the performance returns for each Fund in comparison to the performance returns of mutual funds deemed comparable to the Fund included in a universe (Performance Universe) selected by Broadridge Financial Solutions, Inc. (Broadridge), an independent provider of investment company data. The Board received a description of the methodology used by Broadridge to select the mutual funds included in a Performance Universe. The Board also reviewed and considered Fund performance reports provided and discussions that occurred with portfolio managers at Board meetings throughout the year. A summary of each Fund’s performance results is below.
Franklin Federal Intermediate-Term Tax-Free Income Fund - The Performance Universe for this Fund included the Fund and all retail and institutional intermediate municipal debt funds. The Board noted that the Fund’s annualized income return for the one-, three-, five- and 10-year periods was above the median of its Performance Universe. The Board also noted that the Fund’s annualized total return for the one-, three- and five-year periods was below the median of its Performance Universe, but for the 10-year period was above the median of its Performance Universe. Given the Fund’s income-oriented investment objective, the Board concluded that the Fund’s performance was satisfactory.
Franklin Federal Limited-Term Tax-Free Income Fund - The Performance Universe for this Fund included the Fund and all retail and institutional short municipal debt funds. The Board noted that the Fund’s annualized income return for the one- and three-year periods was below the median of its Performance Universe, but for the five- and 10-year periods was above the median of its Performance Universe. The Board also noted that the Fund’s annualized total return for the one-, three- and five-year periods was below the median of its Performance
Universe, but for the 10-year period was above the median of its Performance Universe. Given the Fund’s income-oriented investment objective, the Board concluded that the Fund’s performance was satisfactory. In doing so, the Board noted that the Fund had positive annualized income return and annualized total return for each of the one-, three-, five- and 10-year periods and took into account management’s explanation that the holdings in the Fund tend to be shorter term and more conservative than peers.
Franklin High Yield Tax-Free Income Fund - The Performance Universe for this Fund included the Fund and all retail and institutional high yield municipal debt funds. The Board noted that the Fund’s annualized income return for the one-, three-, five- and 10-year periods was above the median of its Performance Universe. The Board also noted that the Fund’s annualized total return for the one-, three- and five-year periods was below the median of its Performance Universe, but for the 10-year period was equal to the median of its Performance Universe. Given the Fund’s income-oriented investment objective, the Board concluded that the Fund’s performance was satisfactory.
Franklin Massachusetts Tax-Free Income Fund - The Performance Universe for this Fund included the Fund and all retail and institutional Massachusetts municipal debt funds. The Board noted that the Fund’s annualized income return and annualized total return for the one-, three-, five- and 10-year periods were above the medians of its Performance Universe. The Board concluded that the Fund’s performance was satisfactory.
Franklin New Jersey Tax-Free Income Fund - The Performance Universe for this Fund included the Fund and all retail and institutional New Jersey municipal debt funds. The Board noted that the Fund’s annualized income return for the one-, three-, five- and 10-year periods was above the median of its Performance Universe. The Board also noted that the Fund’s annualized total return for the one-, three-, five- and 10-year periods was below the median of its Performance Universe. Given the Fund’s income-oriented investment objective, the Board concluded that the Fund’s performance was satisfactory.
Comparative Fees and Expenses
The Board reviewed and considered information regarding each Fund’s actual total expense ratio and its various components, including, as applicable, management fees; transfer agent expenses; underlying fund expenses; Rule 12b-1 and non-Rule 12b-1 service fees; and other non-management fees. The Board also noted the quarterly and annual reports it
| | | | | | |
franklintempleton.com | | | | Annual Report | | 153 |
FRANKLIN TAX-FREE TRUST
SHAREHOLDER INFORMATION
receives on all marketing support payments made by FTI to financial intermediaries. The Board considered the actual total expense ratio and, separately, the contractual management fee rate, without the effect of fee waivers, if any (Management Rate) of each Fund in comparison to the median expense ratio and median Management Rate, respectively, of other mutual funds deemed comparable to and with a similar expense structure as the Fund selected by Broadridge (Expense Group). Broadridge fee and expense data is based upon information taken from each fund’s most recent annual report, which reflects historical asset levels that may be quite different from those currently existing, particularly in a period of market volatility. While recognizing such inherent limitation and the fact that expense ratios and Management Rates generally increase as assets decline and decrease as assets grow, the Board believed the independent analysis conducted by Broadridge to be an appropriate measure of comparative fees and expenses. The Broadridge Management Rate includes administrative charges, and the actual total expense ratio, for comparative consistency, was shown for Class A shares for funds with multiple classes of shares. The Board received a description of the methodology used by Broadridge to select the mutual funds included in an Expense Group.
Franklin Federal Intermediate-Term Tax-Free Income Fund, Franklin Federal Limited-Term Tax-Free Income Fund, and Franklin Massachusetts Tax-Free Income Fund - The Expense Group for the Franklin Federal Intermediate-Term Tax-Free Income Fund included the Fund and twelve other intermediate municipal debt funds. The Expense Group for the Franklin Federal Limited-Term Tax-Free Income Fund included the Fund and ten other short municipal debt funds. The Expense Group for the Franklin Massachusetts Tax-Free Income Fund included the Fund and eight other Massachusetts municipal debt funds. The Board noted that the Management Rates for the Funds were above the medians of their respective Expense Groups, but their actual total expense ratios were below the medians and in the first quintiles (least expensive) of their respective Expense Groups. The Board concluded that the Management Rates charged to these Funds are reasonable. In doing so, the Board noted that the Franklin Federal Limited-Term Tax-Free Income Fund’s actual total expense ratio reflected a fee waiver from management. The Board also noted that management agreed to cap the Franklin Federal Intermediate-Term Tax-Free Income Fund’s operating expenses effective February 1, 2018.
Franklin High Yield Tax-Free Income Fund and Franklin New Jersey Tax-Free Income Fund - The Expense Group for the
Franklin High Yield Tax-Free Income Fund included the Fund and nine other high yield municipal debt funds. The Expense Group for the Franklin New Jersey Tax-Free Income Fund included the Fund and eight other New Jersey municipal debt funds. The Board noted that the Management Rates and actual total expense ratios for the Funds were below the medians of their respective Expense Groups. The Board concluded that the Management Rates charged to these Funds are reasonable.
Profitability
The Board reviewed and considered information regarding the profits realized by the Manager and its affiliates in connection with the operation of each Fund. In this respect, the Board considered the Fund profitability analysis provided by the Manager that addresses the overall profitability of FTI’s U.S. fund business, as well as its profits in providing investment management and other services to each of the individual funds during the 12-month period ended September 30, 2017, being the most recent fiscal year-end for FRI. The Board noted that although management continually makes refinements to its methodologies used in calculating profitability in response to organizational and product-related changes, the overall methodology has remained consistent with that used in the Funds’ profitability report presentations from prior years. Additionally, PricewaterhouseCoopers LLP, auditor to Franklin Resources, Inc. and certain Franklin Templeton funds, has been engaged by the Manager to periodically review and assess the allocation methodologies to be used solely by the Funds’ Board with respect to the profitability analysis.
The Board noted management’s belief that costs incurred in establishing the infrastructure necessary for the type of mutual fund operations conducted by the Manager and its affiliates may not be fully reflected in the expenses allocated to each Fund in determining its profitability, as well as the fact that the level of profits, to a certain extent, reflected operational cost savings and efficiencies initiated by management. The Board also noted management’s expenditures in improving shareholder services provided to the Funds, as well as the need to implement systems and meet additional regulatory and compliance requirements resulting from recent SEC and other regulatory requirements.
The Board also considered the extent to which the Manager and its affiliates might derive ancillary benefits from fund operations, including revenues generated from transfer agent services, potential benefits resulting from personnel and systems enhancements necessitated by fund growth, as well as increased leverage with service providers and counterparties.
| | | | | | |
154 | | Annual Report | | | | franklintempleton.com |
FRANKLIN TAX-FREE TRUST
SHAREHOLDER INFORMATION
Based upon its consideration of all these factors, the Board concluded that the level of profits realized by the Manager and its affiliates from providing services to each Fund was not excessive in view of the nature, extent and quality of services provided to each Fund.
Economies of Scale
The Board reviewed and considered the extent to which the Manager may realize economies of scale, if any, as each Fund grows larger and whether the Fund’s management fee structure reflects any economies of scale for the benefit of shareholders. With respect to possible economies of scale, the Board noted the existence of management fee breakpoints, which operate generally to share any economies of scale with a Fund’s shareholders by reducing the Fund’s effective management fees as the Fund grows in size. The Board considered the Manager’s view that any analyses of potential economies of scale in managing a particular fund are inherently limited in light of the joint and common costs and investments the Manager incurs across the Franklin Templeton family of funds as a whole. The Board concluded that to the extent economies of scale may be realized by the Manager and its affiliates, each Fund’s management fee structure provided a sharing of benefits with the Fund and its shareholders as the Fund grows.
Conclusion
Based on its review, consideration and evaluation of all factors it believed relevant, including the above-described factors and conclusions, the Board unanimously approved the continuation of each Management Agreement for an additional one-year period.
Proxy Voting Policies and Procedures
The Trust’s investment manager has established Proxy Voting Policies and Procedures (Policies) that the Trust uses to determine how to vote proxies relating to portfolio securities. Shareholders may view the Trust’s complete Policies online at franklintempleton.com. Alternatively, shareholders may request copies of the Policies free of charge by calling the Proxy Group collect at (954) 527-7678 or by sending a written request to: Franklin Templeton Companies, LLC, 300 S.E. 2nd Street, Fort Lauderdale, FL 33301, Attention: Proxy Group. Copies of the Trust’s proxy voting records are also made available online at franklintempleton.com and posted on the US Securities and Exchange Commission’s website at sec.gov and reflect the most recent 12-month period ended June 30.
Quarterly Statement of Investments
The Trust files a complete statement of investments with the US Securities and Exchange Commission for the first and third quarters for each fiscal year on Form N-Q. Shareholders may view the filed Form N-Q by visiting the Commission’s website at sec.gov. The filed form may also be viewed and copied at the Commission’s Public Reference Room in Washington, DC. Information regarding the operations of the Public Reference Room may be obtained by calling (800) SEC-0330.
Householding of Reports and Prospectuses
You will receive each Fund’s financial reports every six months as well as an annual updated summary prospectus (prospectus available upon request). To reduce Fund expenses, we try to identify related shareholders in a household and send only one copy of the financial reports and summary prospectus. This process, called “householding,” will continue indefinitely unless you instruct us otherwise. If you prefer not to have these documents householded, please call us at (800) 632-2301. At any time you may view current prospectuses/summary prospectuses and financial reports on our website. If you choose, you may receive these documents through electronic delivery.
| | | | | | |
franklintempleton.com | | | | Annual Report | | 155 |
| | |
 | | Annual Report and Shareholder Letter Franklin Tax-Free Trust Investment Manager Franklin Advisers, Inc. Distributor Franklin Templeton Distributors, Inc. (800) DIAL BEN® / 342-5236 franklintempleton.com Shareholder Services (800) 632-2301 |
Authorized for distribution only when accompanied or preceded by a summary prospectus and/or prospectus. Investors should carefully consider a fund’s investment goals, risks, charges and expenses before investing. A prospectus contains this and other information; please read it carefully before investing.
To help ensure we provide you with quality service, all calls to and from our service areas are monitored and/or recorded.
| | |
| © 2018 Franklin Templeton Investments. All rights reserved. | | TF1 A 04/18 |
(a) The Registrant has adopted a code of ethics that applies to its principal executive officers and principal financial and accounting officer.
(c) N/A
(d) N/A
(f) Pursuant to Item 12(a)(1), the Registrant is attaching as an exhibit a copy of its code of ethics that applies to its principal executive officers and principal financial and accounting officer.
| Item 3. | Audit Committee Financial Expert. |
(a)(1) The Registrant has an audit committee financial expert serving on its audit committee.
(2) The audit committee financial expert is John B. Wilson, and he is “independent” as defined under the relevant Securities and Exchange Commission Rules and Releases.
| Item 4. | Principal Accountant Fees and Services |
(a) Audit Fees
The aggregate fees paid to the principal accountant for professional services rendered by the principal accountant for the audit of the registrant’s annual financial statements or for services that are normally provided by the principal accountant in connection with statutory and regulatory filings or engagements were $805,084 for the fiscal year ended February 28, 2018 and $818,858 for the fiscal year ended February 28, 2017.
(b) Audit-Related Fees
There were no fees paid to the principal accountant for assurance and related services rendered by the principal accountant to the registrant that are reasonably related to the performance of the audit of the registrant’s financial statements and are not reported under paragraph (a) of Item 4.
There were no fees paid to the principal accountant for assurance and related services rendered by the principal accountant to the registrant’s investment adviser and any entity controlling, controlled by or under common control with the investment adviser that provides ongoing services to the registrant that are reasonably related to the performance of the audit of their financial statements.
(c) Tax Fees
There were no fees paid to the principal accountant for professional services rendered by the principal accountant to the registrant for tax compliance, tax advice and tax planning.
3
There were no fees paid to the principal accountant for professional services rendered by the principal accountant to the registrant’s investment adviser and any entity controlling, controlled by or under common control with the investment adviser that provides ongoing services to the registrant for tax compliance, tax advice and tax planning.
(d) All Other Fees
There were no fees paid to the principal accountant for products and services rendered by the principal accountant to the registrant not reported in paragraphs (a)-(c) of Item 4.
The aggregate fees paid to the principal accountant for products and services rendered by the principal accountant to the registrant’s investment adviser and any entity controlling, controlled by or under common control with the investment adviser that provides ongoing services to the registrant other than services reported in paragraphs (a)-(c) of Item 4 were $14,000 for the fiscal year ended February 28, 2018 and $255,000 for the fiscal year ended February 28, 2017. The services for which these fees were paid included review of materials provided to the fund Board in connection with the investment management contract renewal process and derivatives assessments and benchmarking services in connection with the 2015 ICI TA Survey.
(e) (1) The registrant’s audit committee is directly responsible for approving the services to be provided by the auditors, including:
(i) pre-approval of all audit and audit related services;
(ii) pre-approval of all non-audit related services to be provided to the Fund by the auditors;
(iii) pre-approval of all non-audit related services to be provided to the registrant by the auditors to the registrant’s investment adviser or to any entity that controls, is controlled by or is under common control with the registrant’s investment adviser and that provides ongoing services to the registrant where the non-audit services relate directly to the operations or financial reporting of the registrant; and
(iv) establishment by the audit committee, if deemed necessary or appropriate, as an alternative to committee pre-approval of services to be provided by the auditors, as required by paragraphs (ii) and (iii) above, of policies and procedures to permit such services to be pre-approved by other means, such as through establishment of guidelines or by action of a designated member or members of the committee; provided the policies and procedures are detailed as to the particular service and the committee is informed of each service and such policies and procedures do not include delegation of audit committee responsibilities, as contemplated under the Securities Exchange Act of 1934, to management; subject, in the case of (ii) through (iv), to any waivers, exceptions or exemptions that may be available under applicable law or rules.
(e) (2) None of the services provided to the registrant described in paragraphs (b)-(d) of Item 4 were approved by the audit committee pursuant to paragraph (c)(7)(i)(C) of Rule 2-01 of regulation S-X.
4
(f) No disclosures are required by this Item 4(f).
(g) The aggregate non-audit fees paid to the principal accountant for services rendered by the principal accountant to the registrant and the registrant’s investment adviser and any entity controlling, controlled by or under common control with the investment adviser that provides ongoing services to the registrant were $14,000 for the fiscal year ended February 28, 2018 and $255,000 for the fiscal year ended February 28, 2017.
(h) The registrant’s audit committee of the board has considered whether the provision of non-audit services that were rendered to the registrant’s investment adviser (not including any sub-adviser whose role is primarily portfolio management and is subcontracted with or overseen by another investment adviser), and any entity controlling, controlled by, or under common control with the investment adviser that provides ongoing services to the registrant that were not pre-approved pursuant to paragraph (c)(7)(ii) of Rule 2-01 of Regulation S-X is compatible with maintaining the principal accountant’s independence.
| Item 5. | Audit Committee of Listed Registrants. N/A |
| Item 6. | Schedule of Investments. N/A |
| Item 7. | Disclosure of Proxy Voting Policies and Procedures for Closed-End Management Investment Companies. N/A |
| Item 8. | Portfolio Managers of Closed-End Management Investment Companies. N/A |
| Item 9. | Purchases of Equity Securities by Closed-End Management Investment Company and Affiliated Purchasers. N/A |
| Item 10. | Submission of Matters to a Vote of Security Holders. |
There have been no changes to the procedures by which shareholders may recommend nominees to the Registrant’s Board of Trustees that would require disclosure herein.
| Item 11. | Controls and Procedures. |
(a) Evaluation of Disclosure Controls and Procedures. The Registrant maintains disclosure controls and procedures that are designed to ensure that information required to be disclosed in the Registrant’s filings under the Securities Exchange Act of 1934 and the Investment Company Act of 1940 is recorded, processed, summarized and reported within the periods specified in the rules and forms of the Securities and Exchange Commission. Such information is accumulated and communicated to the Registrant’s management, including its principal executive officer and principal financial officer, as appropriate, to
5
allow timely decisions regarding required disclosure. The Registrant’s management, including the principal executive officer and the principal financial officer, recognizes that any set of controls and procedures, no matter how well designed and operated, can provide only reasonable assurance of achieving the desired control objectives.
Within 90 days prior to the filing date of this Shareholder Report on Form N-CSR, the Registrant had carried out an evaluation, under the supervision and with the participation of the Registrant’s management, including the Registrant’s principal executive officer and the Registrant’s principal financial officer, of the effectiveness of the design and operation of the Registrant’s disclosure controls and procedures. Based on such evaluation, the Registrant’s principal executive officer and principal financial officer concluded that the Registrant’s disclosure controls and procedures are effective.
(b) Changes in Internal Controls. There have been no changes in the Registrant’s internal controls or in other factors that could materially affect the internal controls over financial reporting subsequent to the date of their evaluation in connection with the preparation of this Shareholder Report on Form N-CSR.
(a)(1) Code of Ethics
(a)(2) Certifications pursuant to Section 302 of the Sarbanes-Oxley Act of 2002 of Matthew T. Hinkle, Chief Executive Officer - Finance and Administration, and Gaston Gardey, Chief Financial Officer and Chief Accounting Officer
(b) Certifications pursuant to Section 906 of the Sarbanes-Oxley Act of 2002 of Matthew T. Hinkle , Chief Executive Officer - Finance and Administration, and Gaston Gardey, Chief Financial Officer and Chief Accounting Officer
6
SIGNATURES
Pursuant to the requirements of the Securities Exchange Act of 1934 and the Investment Company Act of 1940, the registrant has duly caused this report to be signed on its behalf by the undersigned, thereunto duly authorized.
| | |
| FRANKLIN TAX-FREE TRUST |
| |
| By | | /s/ MATTHEW T. HINKLE |
| | Matthew T. Hinkle |
| | Chief Executive Officer – Finance and Administration |
| |
| Date | | April 26, 2018 |
Pursuant to the requirements of the Securities Exchange Act of 1934 and the Investment Company Act of 1940, this report has been signed below by the following persons on behalf of the registrant and in the capacities and on the dates indicated.
| | |
| By | | /s/ MATTHEW T. HINKLE |
| | Matthew T. Hinkle |
| | Chief Executive Officer – Finance and Administration |
| |
| Date | | April 26, 2018 |
| |
| By | | /s/ GASTON GARDEY |
| | Gaston Gardey |
| | Chief Financial Officer and Chief Accounting Officer |
| |
| Date | | April 26, 2018 |
7