UNITED STATES
SECURITIES AND EXCHANGE COMMISSION
Washington, DC 20549
FORM N-CSR
CERTIFIED SHAREHOLDER REPORT OF REGISTERED
MANAGEMENT INVESTMENT COMPANIES
Investment Company Act file number 811-04149
Franklin Tax-Free Trust
(Exact name of registrant as specified in charter)
One Franklin Parkway, San Mateo, CA 94403-1906
(Address of principal executive offices) (Zip code)
Craig S. Tyle, One Franklin Parkway, San Mateo, CA 94403-1906
(Name and address of agent for service)
Registrant’s telephone number, including area code: (650) 312-2000
Date of fiscal year end: 2/28
Date of reporting period: 02/28/18
| Item 1. | Reports to Stockholders. |
2
| | | | |

| | | | Annual Report and Shareholder Letter |
| | | February 28, 2018 |

Franklin Arizona Tax-Free Income Fund
Franklin Colorado Tax-Free Income Fund
Franklin Connecticut Tax-Free Income Fund
Franklin Michigan Tax-Free Income Fund
Franklin Minnesota Tax-Free Income Fund
Franklin Ohio Tax-Free Income Fund
Franklin Oregon Tax-Free Income Fund
Franklin Pennsylvania Tax-Free Income Fund

Sign up for electronic delivery at franklintempleton.com/edelivery
Franklin Templeton Investments
Why choose Franklin Templeton Investments?
Successful investing begins with ambition. And achievement only comes when you reach for it. That’s why we continually strive to deliver better outcomes for investors. No matter what your goals are, our deep, global investment expertise allows us to offer solutions that can help.
During our more than 70 years of experience, we’ve managed through all kinds of markets—up, down and those in between. We’re always preparing for what may come next. It’s because of this, combined with our strength as one of the world’s largest asset managers that we’ve earned the trust of millions of investors around the world.
Dear Shareholder:
The 12 months ended February 28, 2018, benefited from mostly upbeat economic data as the US job market continued to improve and the unemployment rate declined. Accordingly, the US Federal Reserve (Fed) increased its target range for the federal funds rate a quarter point to 1.25%–1.50% at its past December meeting.
During the period, the municipal bond market posted modest performance similar to other US fixed income classes, with generally higher returns for longer term and lower rated municipal bonds. Factors contributing to this positive investment environment for municipals included consistently low inflation and relatively steady interest rates, stagnant wage growth and geopolitical concerns. Federal government fiscal reform uncertainty also benefited tax-free municipals during most of the period, despite some volatility toward period-end in reaction to the government’s tax code revision efforts.
Shortly after the end of the reporting period, the Fed, under new chairman Jerome Powell, raised the federal funds rate
another quarter point to a range of 1.50%-1.75%. The Fed based its decision on a stronger economic outlook in recent months.
In addition, Franklin Tax Free Trust’s annual report includes more detail about municipal bond market conditions and a discussion from the portfolio managers. On our website, franklintempleton.com, you can find updated commentary by our municipal bond experts. Municipal bonds can provide tax-free income and diversification from equities. Despite periods of volatility, municipal bonds historically have had a solid long-term record of performance, driven mostly by their income component. Please remember all securities markets fluctuate, as do mutual fund share prices.
As always, we recommend investors consult their financial advisors to help them make the best decisions for the long term. In a constantly changing market environment, we remain committed to our disciplined strategy as we manage the Fund, keeping in mind the trust you have placed in us.
| | |
| | Not FDIC Insured | May Lose Value | No Bank Guarantee |
| | | | |
franklintempleton.com | | Not part of the annual report | | 1 |
We appreciate your confidence in us and encourage you to contact us when you have questions about your Franklin Templeton tax-free investment.
Sincerely,

Rupert H. Johnson, Jr.
Chairman
Franklin Tax-Free Trust

Sheila Amoroso

Rafael R. Costas Jr.
Senior Vice Presidents and Co-Directors
Franklin Municipal Bond Department
This letter reflects our analysis and opinions as of February 28, 2018, unless otherwise indicated. The information is not a complete analysis of every aspect of any market, state, industry, security or fund. Statements of fact are from sources considered reliable.
Visit franklintempleton.com for fund updates, to access your account, or to find helpful financial planning tools.
| | | | |
2 | | Not part of the annual report | | franklintempleton.com |
Annual Report
Municipal Bond Market Overview
The municipal bond market outperformed the US Treasury market but underperformed US stock markets during the 12-month period ended February 28, 2018. Investment-grade municipal bonds, as measured by the Bloomberg Barclays Municipal Bond Index, generated a +2.50% total return for the period, while US Treasuries, as measured by the Bloomberg Barclays US Treasury Index, had a -0.56% total return.1 Both high-yield corporate bonds and high-yield municipal bonds outperformed their investment-grade counterparts. US stocks, as represented by the Standard & Poor’s® 500 Index, outperformed both municipals and US Treasuries with a +17.10% total return for the reporting period.1 US stocks generated strong returns through the first eleven months of the reporting period, but experienced a significant bout of volatility in early February that led to losses in that month and dragged down overall returns. Recent indications of stronger inflation and rising interest rates contributed to the volatility in stock markets and also drove losses in both the municipal bond market and US Treasury market during the first two months of 2018.
Municipal issuance during the reporting period totaled $414 billion.2 This represents an almost 8% decline from total issuance in the previous 12-month period ended February 28, 2017.2 Subdued issuance at the beginning of 2018 largely contributed to this decline, with only $37 billion issued thus far in 2018 (down 38% from the first two months of 2017).2 After accounting for redemptions (bonds that matured or were called out of the market), net issuance stood at $64 billion in 2017, which marked a third consecutive year of positive net issuance.3 However, net issuance turned negative in the first two months of 2018, standing at -$19 billion at period-end.3 According to the Investment Company Institute Trends in Mutual Fund Investing, municipal bond funds reported inflows for 10 of the 12 months of the reporting period, with the only negative flows occurring in December 2017 and February 2018. The total inflows for the period were approximately $28 billion.4
Impending tax reform contained potential implications for the municipal bond market and caused a deluge of supply in December, as issuers rushed to market before the end of the 2017. December supply of $63 billion and fourth-quarter 2017
supply of $145 billion eclipsed previous monthly and quarterly records of municipal bond issuance, respectively.2 Despite this extraordinary supply weighing on the market, strong demand buoyed returns through the end of the 2017. However, diminished issuance, heavy dealer inventories and selling pressures in 2018 led municipals to have a -1.47% total return during the first two months of 2018, as measured by the Bloomberg Barclays Municipal Bond Index, although it still performed better than the -2.10% total return for US Treasuries during the same period, as measured by the Bloomberg Barclays US Treasury Index.1
The Federal Reserve (Fed) raised its target range for the federal funds rate 0.25% at its December 2017 meeting. The target range stood at 1.25%–1.50% at period-end. The Fed also increased the discount rate 0.25% to 2.00% in December. The Fed decided to raise interest rates at its December meeting due to the strength of the US jobs market and continued economic growth. This was the third rate hike of 2017, following increases of 0.25% in March and June.
Jerome Powell spoke before Congress for the first time as Fed Chair after succeeding Janet Yellen in that role. He indicated that the Fed saw signs of a continued strong labor market and economic growth. He reiterated the Fed’s intention to gradually raise interest rates in an effort to keep the economy from overheating as inflation increases toward the Fed’s 2% target. He noted that there was no evidence of the economy overheating and that he had yet to see a clear move upward in wages.
Investors continued to favor risky assets through most of the period. Municipal bonds with longer maturities generally performed better than bonds with shorter maturities, and high yield tax-exempt bonds outperformed their investment-grade counterparts. The Bloomberg Barclays High Yield Municipal Bond Index generated a +4.74% total return for the period and the Bloomberg Barclays Municipal Long Bond (22+ Years) Index returned +4.30% during the 12-month reporting period.1
Several developments affected Puerto Rico bonds over the reporting period. Please visit
1. Source: Morningstar. Treasuries, if held to maturity, offer a fixed rate of return and a fixed principal value; their interest payments and principal are guaranteed.
2. Source: The Bond Buyer, Thomson Reuters.
3. Source: Barclays Municipal Credit Research.
4. Source: Investment Company Institute, Trends in Mutual Fund Investing February 2018, 3/28/18.
See www.franklintempletondatasources.com for additional data provider information.
| | | | |
franklintempleton.com | | Annual Report | | 3 |
MUNICIPAL BOND MARKET OVERVIEW
franklintempleton.com/investor/products/fund-resources/puerto-rico for the latest Puerto Rico updates from Franklin Templeton.
At period-end, we maintained our positive view of the municipal bond market. We believe municipal bonds continue to be an attractive asset class among fixed income securities, and we intend to follow our solid discipline of investing to maximize income, while seeking value in the municipal bond market.
The foregoing information reflects our analysis, opinions and portfolio holdings as of February 28, 2018, the end of the reporting period. The way we implement our main investment strategies and the resulting portfolio holdings may change depending on factors such as market and economic conditions. These opinions may not be relied upon as investment advice or an offer for a particular security. The information is not a complete analysis of every aspect of any market, state, industry, security or fund. Statements of fact are from sources considered reliable, but the investment manager makes no representation or warranty as to their completeness or accuracy. Although historical performance is no guarantee of future results, these insights may help you understand our investment management philosophy.
| | | | | | |
4 | | Annual Report | | | | franklintempleton.com |
Investment Strategy and Manager’s Discussion
Investment Strategy
We use a consistent, disciplined strategy with the objective of maximizing tax-free income and capital preservation by focusing on credit selection. We seek to maintain exposure to higher coupon securities, while balancing risk and return within each Fund’s range of allowable investments. We do not purchase high yield securities in our investment-grade funds, however if a security is downgraded we are not required to sell it. Our security selection process includes purchasing securities that we believe are undervalued in the market and which have met our credit selection criteria. We do not use leverage or derivatives, which could add volatility and contribute to underperformance in adverse markets.
Manager’s Discussion
Due to the positive sloping municipal yield curve, we found value in higher quality securities in the 15–30 year maturity range, which allowed us to achieve our objective of maximizing income for our investors. Typically, in declining rate environments, our turnover declines as we maintain exposure to securities that are producing income that exceeds their replacement value in the market. However, when rates rise, our turnover increases as opportunities to purchase securities that have the potential to increase income in the portfolios become available. We believe our consistent, disciplined strategy can help our investors achieve high, tax-free income over the long term.
We invite you to read your Fund report for more detailed performance and portfolio information. Thank you for your participation in Franklin Tax-Free Trust. We look forward to serving your future investment needs
The foregoing information reflects our analysis, opinions and portfolio holdings as of February 28, 2018, the end of the reporting period. The way we implement our main investment strategies and the resulting portfolio holdings may change depending on factors such as market and economic conditions. These opinions may not be relied upon as investment advice or an offer for a particular security. The information is not a complete analysis of every aspect of any market, state, industry, security or fund. Statements of fact are from sources considered reliable, but the investment manager makes no representation or warranty as to their completeness or accuracy. Although historical performance is no guarantee of future results, these insights may help you understand our investment management philosophy.
| | | | |
franklintempleton.com | | Annual Report | | 5 |
Franklin Arizona Tax-Free Income Fund
This annual report for Franklin Arizona Tax-Free Income Fund covers the fiscal year ended February 28, 2018.
Your Fund’s Goal and Main Investments
The Fund seeks to provide as high a level of income exempt from federal and Arizona personal income taxes as is consistent with prudent investment management and preservation of capital by investing at least 80% of its net assets in securities that pay interest free from such taxes.1
Credit Quality Composition*
2/28/18
| | |
| Ratings | | % of Total
Investments |
| |
AAA | | 7.66% |
| |
AA | | 54.03% |
| |
A | | 17.43% |
| |
BBB | | 6.70% |
| |
Refunded | | 9.87% |
| |
Not Rated | | 4.31% |
*Securities, except for those labeled Not Rated, are assigned ratings by one or more Nationally Recognized Statistical Credit Rating Organizations (NRSROs), such as Standard & Poor’s, Moody’s and Fitch, that can be considered by the investment manager as part of its independent securities analysis. When ratings from multiple agencies are available, the highest is used, consistent with the portfolio investment process. Ratings reflect an NRSRO’s opinion of an issuer’s creditworthiness and typically range from AAA (highest) to D (lowest). The Below Investment Grade category consists of bonds rated below BBB-. The Refunded category generally consists of refunded bonds secured by US government or other high-quality securities and not rerated by an NRSRO. The Not Rated category consists of ratable securities that have not been rated by an NRSRO. Cash and equivalents are excluded from this composition.
Performance Overview
The Fund’s Class A share price, as measured by net asset value, decreased from $10.78 on February 28, 2017, to $10.58 on February 28, 2018. The Fund’s Class A shares paid dividends totaling 37.50 cents per share for the reporting period.2 The Performance Summary beginning on page 8 shows that at the end of this reporting period the Fund’s Class A shares’ distribution rate was 3.20% based on an annualization of February’s 2.95 cent per share dividend and the maximum offering price of $11.05 on February 28, 2018. An investor in the 2018 maximum combined effective federal and Arizona
Dividend Distributions*
3/1/17–2/28/18
| | | | | | | | | | | | | | | | |
| | | Dividend per Share (cents) | |
| | | | |
| Month | | Class A | | | Class C | | | Class R6** | | | Advisor
Class | |
March | | | 3.21 | | | | 2.70 | | | | — | | | | 3.30 | |
April | | | 3.21 | | | | 2.70 | | | | — | | | | 3.30 | |
May | | | 3.21 | | | | 2.70 | | | | — | | | | 3.30 | |
June | | | 3.21 | | | | 2.70 | | | | — | | | | 3.30 | |
July | | | 3.11 | | | | 2.60 | | | | — | | | | 3.20 | |
August | | | 3.11 | | | | 2.60 | | | | 3.12 | | | | 3.20 | |
September | | | 3.11 | | | | 2.60 | | | | 3.22 | | | | 3.20 | |
October | | | 3.11 | | | | 2.60 | | | | 3.22 | | | | 3.20 | |
November | | | 3.11 | | | | 2.60 | | | | 3.22 | | | | 3.20 | |
December | | | 3.11 | | | | 2.60 | | | | 3.22 | | | | 3.20 | |
January | | | 3.05 | | | | 2.54 | | | | 3.16 | | | | 3.14 | |
February | | | 2.95 | | | | 2.44 | | | | 3.06 | | | | 3.04 | |
Total | | | 37.50 | | | | 31.38 | | | | 22.22 | | | | 38.58 | |
*The distribution amount is the sum of all net investment income distributions for the period shown. Assumes shares were purchased and held for the entire accrual period. Since dividends accrue daily, your actual distributions will vary depending on the date you purchased your shares and any account activity. All Fund distributions will vary depending upon current market conditions, and past distributions are not indicative of future trends.
**Effective 8/1/17, the Fund began offering Class R6 shares. See the prospectus for details.
personal income tax bracket of 45.34% (including 3.80% Medicare tax) would need to earn a distribution rate of 5.85% from a taxable investment to match the Fund’s Class A tax-free distribution rate. For other performance data, please see the Performance Summary. Dividend distributions were affected by low interest rates during the period. This and other factors resulted in reduced income for the portfolio and caused dividends to be lower at the end of the period.
Performance data represent past performance, which does not guarantee future results. Investment return and principal value will fluctuate, and you may have a gain or loss when you sell your shares. Current performance may differ from figures shown. For most recent month-end performance, go to franklintempleton.com or call (800) 342-5236.
1. For state personal income taxes, the 80% minimum is measured by total Fund assets. For investors subject to alternative minimum tax, a small portion of Fund dividends may be taxable. Distributions of capital gains are generally taxable. To avoid imposition of 28% backup withholding on all Fund distributions and redemption proceeds, US investors must be properly certified on Form W-9 and non-US investors on Form W-8BEN.
2. The distribution amount is the sum of all net investment income distributions for the period shown. Assumes shares were purchased and held for the entire accrual period. Since dividends accrue daily, your actual distributions will vary depending on the date you purchased your shares and any account activity. All Fund distributions will vary depending upon current market conditions, and past distributions are not indicative of future trends.
The dollar value, number of shares or principal amount, and names of all portfolio holdings are listed in the Fund’s Statement of Investments (SOI).
The SOI begins on page 68.
| | | | |
6 | | Annual Report | | franklintempleton.com |
FRANKLIN ARIZONA TAX-FREE INCOME FUND
State Update
Arizona’s economy continued to expand during the period under review. The state’s unemployment rate fell marginally from 5.1% in February 2017 to 4.9% in February 2018, but remained higher than the 4.1% national rate.3 In the state’s housing market, which was significantly hurt by the most recent recession, home prices rose during the period, however foreclosure rates increased.
The state concluded fiscal year (FY) 2017 on June 30 with a slight budget surplus, which exceeded expectations. Collections across the state’s major revenue categories were mixed, with sales and use tax and individual income tax collections contributing to general fund revenues. The state legislature approved higher spending in FY 2018 on K-12 and higher education, the Department of Economic Security, the Department of Child Safety and Arizona Health Care Cost Containment System compared to FY 2017. Lawmakers expect sales and use taxes and individual income tax collections to contribute significantly to revenue generation. The budget also provided a modest income-tax cut for residents. The forecasted budget is structurally balanced, as ongoing revenues are projected to exceed ongoing spending in FY 2018. Arizona’s proposed budget for FY 2019 included spending increases, largely on K-12 education, while preserving the general fund’s structural balance.
Arizona does not issue general obligation bonds but instead issues appropriation-backed lease debt and revenue bonds. The state had moderate debt levels, with net tax-supported debt of $696 per capita and 1.8% of personal income, compared with the national medians of $1,006 and 2.5%, respectively.4 Independent credit rating agency Standard & Poor’s (S&P) affirmed Arizona’s AA issuer credit rating with a stable outlook.5 The rating reflected S&P’s view of Arizona’s long-term creditworthiness based on ongoing improvement in the state’s economy and continued population and job growth that are outpacing the nation’s. S&P further cited Arizona’s strong financial position, relatively low average combined pension funded ratio and moderate debt burden.
Manager’s Discussion
We used various investment strategies during the 12 months under review as we sought to maximize tax-free income for
| | |
| Portfolio Composition | | |
2/28/18 | | |
| |
| | | % of Total
Investments* |
Utilities | | 19.3% |
Refunded** | | 18.5% |
Higher Education | | 15.0% |
Hospital & Health Care | | 12.1% |
Tax-Supported | | 8.2% |
Subject to Government Appropriations | | 7.3% |
Housing | | 5.7% |
Other Revenue | | 5.4% |
Transportation | | 5.2% |
General Obligation | | 3.3% |
*Does not include cash and cash equivalents.
**Includes all refunded bonds; the percentage may differ from that in the Credit Quality Composition.
shareholders. Please read the Investment Strategy and Manager’s Discussion on page 5 for more information.
Thank you for your continued participation in Franklin Arizona Tax-Free Income Fund. We believe our conservative, buy-and-hold investment strategy can help us achieve high, current, tax-free income for shareholders.
The foregoing information reflects our analysis, opinions and portfolio holdings as of February 28, 2018, the end of the reporting period. The way we implement our main investment strategies and the resulting portfolio holdings may change depending on factors such as market and economic conditions. These opinions may not be relied upon as investment advice or an offer for a particular security. The information is not a complete analysis of every aspect of any market, state, industry, security or the Fund. Statements of fact are from sources considered reliable, but the investment manager makes no representation or warranty as to their completeness or accuracy. Although historical performance is no guarantee of future results, these insights may help you understand our investment management philosophy.
3. Source: Bureau of Labor Statistics.
4. Source: Moody’s Investors Service, State Government - US Medians - Total State Debt Remains Essentially Flat in 2017, 5/3/17.
5. This does not indicate S&P’s rating of the Fund.
| | | | | | | | |
franklintempleton.com | | | | | | Annual Report | | 7 |
FRANKLIN ARIZONA TAX-FREE INCOME FUND
Performance Summary as of February 28, 2018
The performance tables and graphs do not reflect any taxes that a shareholder would pay on Fund dividends, capital gain distributions, if any, or any realized gains on the sale of Fund shares. Total return reflects reinvestment of the Fund’s dividends and capital gain distributions, if any, and any unrealized gains or losses. Your dividend income will vary depending on dividends or interest paid by securities in the Fund’s portfolio, adjusted for operating expenses of each class. Capital gain distributions are net profits realized from the sale of portfolio securities.
Performance as of 2/28/18
Cumulative total return excludes sales charges. Average annual total return includes maximum sales charges. Sales charges will vary depending on the size of the investment and the class of share purchased. The maximum is 4.25% and the minimum is 0%. Class A: 4.25% maximum initial sales charge; Advisor Class: no sales charges. For other share classes, visit franklintempleton.com.
| | | | |
| Share Class | | Cumulative
Total Return1 | | Average Annual
Total Return2 |
| | |
A | | | | |
1-Year | | +1.62% | | -2.71% |
5-Year | | +10.52% | | +1.14% |
10-Year | | +53.77% | | +3.94% |
| | |
Advisor3 | | | | |
1-Year | | +1.72% | | +1.72% |
5-Year | | +11.05% | | +2.12% |
10-Year | | +55.57% | | +4.52% |
| | | | | | | | |
| Share Class | | Distribution
Rate4 | | Taxable Equivalent
Distribution Rate5 | | 30-Day
Standardized Yield6 | | Taxable Equivalent 30-Day
Standardized Yield5 |
A | | 3.20% | | 5.85% | | 1.97% | | 3.60% |
Advisor | | 3.44% | | 6.29% | | 2.15% | | 3.93% |
Performance data represent past performance, which does not guarantee future results. Investment return and principal value will fluctuate, and you may have a gain or loss when you sell your shares. Current performance may differ from figures shown. For most recent month-end performance, go to franklintempleton.com or call (800) 342-5236.
See page 11 for Performance Summary footnotes.
| | | | | | |
8 | | Annual Report | | | | franklintempleton.com |
FRANKLIN ARIZONA TAX-FREE INCOME FUND
PERFORMANCE SUMMARY
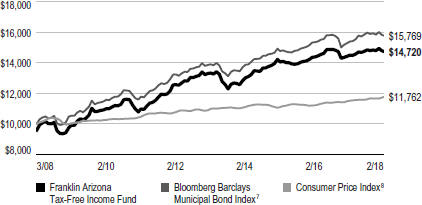
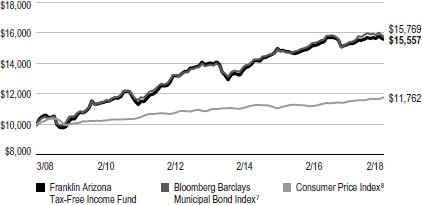
Total Return Index Comparison for a Hypothetical $10,000 Investment
Total return represents the change in value of an investment over the periods shown. It includes any applicable maximum sales charge, Fund expenses, account fees and reinvested distributions. The unmanaged indexes include reinvestment of any income or distributions. They differ from the Fund in composition and do not pay management fees or expenses. One cannot invest directly in an index.
Class A (3/1/08–2/28/18)
Advisor Class (3/1/08–2/28/18)3
See page 11 for Performance Summary footnotes.
| | | | | | | | |
franklintempleton.com | | | | | | Annual Report | | 9 |
FRANKLIN ARIZONA TAX-FREE INCOME FUND
PERFORMANCE SUMMARY
Net Asset Value
| | | | | | | | | | | | | | | | |
| Share Class (Symbol) | | 2/28/18 | | | 8/1/17 | | | 2/28/17 | | | Change | |
A (FTAZX) | | | $10.58 | | | | N/A | | | | $10.78 | | | | -$0.20 | |
C (FAZIX) | | | $10.75 | | | | N/A | | | | $10.95 | | | | -$0.20 | |
R6 (FAZRX) | | | $10.60 | | | | $10.84 | | | | N/A | | | | -$0.24 | |
Advisor (FAZZX) | | | $10.61 | | | | N/A | | | | $10.81 | | | | -$0.20 | |
Distributions (3/1/17–2/28/18)
| | | | |
| Share Class | | Net Investment
Income | |
| |
A | | | $0.3750 | |
| |
C | | | $0.3138 | |
| |
R6 (8/1/17–2/28/18) | | | $0.2222 | |
| |
Advisor | | | $0.3858 | |
Total Annual Operating Expenses9
| | | | |
| Share Class | | | |
| |
A | | | 0.63% | |
| |
Advisor | | | 0.53% | |
| | | | | | |
10 | | Annual Report | | | | franklintempleton.com |
FRANKLIN ARIZONA TAX-FREE INCOME FUND
PERFORMANCE SUMMARY
Each class of shares is available to certain eligible investors and has different annual fees and expenses, as described in the prospectus.
All investments involve risks, including possible loss of principal. Because municipal bonds are sensitive to interest rate movements, the Fund’s yield and share price will fluctuate with market conditions. Bond prices generally move in the opposite direction of interest rates. Thus, as prices of bonds in the Fund adjust to a rise in interest rates, the Fund’s share price may decline. Because the Fund invests principally in a single state, it is subject to greater risk of adverse economic and regulatory changes in that state than a geographically diversified fund. Changes in the credit rating of a bond, or in the credit rating or financial strength of a bond’s issuer, insurer or guarantor, may affect the bond’s value. The Fund may invest a significant part of its assets in municipal securities that finance similar types of projects, such as utilities, hospitals, higher education and transportation. A change that affects one project would likely affect all similar projects, thereby increasing market risk. The Fund is actively managed but there is no guarantee that the manager’s investment decisions will produce the desired results. The Fund’s prospectus also includes a description of the main investment risks.
1. Cumulative total return represents the change in value of an investment over the periods indicated.
2. Average annual total return represents the average annual change in value of an investment over the periods indicated. Return for less than one year, if any, has not been annualized.
3. Effective 7/1/08, the Fund began offering Advisor Class shares, which do not have sales charges or a Rule 12b-1 plan. Performance quotations for this class reflect the following methods of calculation: (a) For periods prior to 7/1/08, a restated figure is used based upon the Fund’s Class A performance, excluding the effect of Class A’s maximum initial sales charge, but reflecting the effect of the Class A Rule 12b-1 fees; and (b) for periods after 7/1/08, actual Advisor Class performance is used reflecting all charges and fees applicable to that class. Since 7/1/08 (commencement of sales), the cumulative and average annual total returns of Advisor Class shares were +48.40% and +4.17%.
4. Distribution rate is based on an annualization of the respective class’s February dividend and the maximum offering price (NAV for Advisor class) per share on 2/28/18.
5. Taxable equivalent distribution rate and yield assume the published rates as of 1/15/18 for the maximum combined effective federal and Arizona personal income tax rate of 45.34%, based on the federal income tax rate of 37.00% plus 3.80% Medicare tax.
6. The Fund’s 30-day standardized yield is calculated over a trailing 30-day period using the yield to maturity on bonds and/or the dividends accrued on stocks. It may not equal the Fund’s actual income distribution rate, which reflects the Fund’s past dividends paid to shareholders.
7. Source: Morningstar. The Bloomberg Barclays Municipal Bond Index is a market value-weighted index engineered for the long-term tax-exempt bond market. To be included in the index, bonds must be fixed rate, have at least one year to final maturity and be rated investment grade (Baa3/BBB- or higher) by at least two of the following agencies: Moody’s, S&P and Fitch.
8. Source: Bureau of Labor Statistics, bls.gov/cpi. The Consumer Price Index is a commonly used measure of the inflation rate.
9. Figures are as stated in the Fund’s current prospectus and may differ from the expense ratios disclosed in the Your Fund’s Expenses and Financial Highlights sections in this report. In periods of market volatility, assets may decline significantly, causing total annual Fund operating expenses to become higher than the figures shown.
See www.franklintempletondatasources.com for additional data provider information.
| | | | | | | | |
franklintempleton.com | | | | | | Annual Report | | 11 |
FRANKLIN ARIZONA TAX-FREE INCOME FUND
Your Fund’s Expenses
As a Fund shareholder, you can incur two types of costs: (1) transaction costs, including sales charges (loads) on Fund purchases and redemptions; and (2) ongoing Fund costs, including management fees, distribution and service (12b-1) fees, and other Fund expenses. All mutual funds have ongoing costs, sometimes referred to as operating expenses. The table below shows ongoing costs of investing in the Fund and can help you understand these costs and compare them with those of other mutual funds. The table assumes a $1,000 investment held for the six months indicated.
Actual Fund Expenses
The table below provides information about actual account values and actual expenses in the columns under the heading “Actual.” In these columns the Fund’s actual return, which includes the effect of Fund expenses, is used to calculate the “Ending Account Value” for each class of shares. You can estimate the expenses you paid during the period by following these steps (of course, your account value and expenses will differ from those in this illustration): Divide your account value by $1,000 (if your account had an $8,600 value, then $8,600 ÷ $1,000 = 8.6). Then multiply the result by the number in the row for your class of shares under the headings “Actual” and “Expenses Paid During Period” (if Actual Expenses Paid During Period were $7.50, then 8.6 x $7.50 = $64.50). In this illustration, the actual expenses paid this period are $64.50.
Hypothetical Example for Comparison with Other Funds
Under the heading “Hypothetical” in the table, information is provided about hypothetical account values and hypothetical expenses based on the Fund’s actual expense ratio and an assumed rate of return of 5% per year before expenses, which is not the Fund’s actual return. This information may not be used to estimate the actual ending account balance or expenses you paid for the period, but it can help you compare ongoing costs of investing in the Fund with those of other funds. To do so, compare this 5% hypothetical example for the class of shares you hold with the 5% hypothetical examples that appear in the shareholder reports of other funds.
Please note that expenses shown in the table are meant to highlight ongoing costs and do not reflect any transactional costs. Therefore, information under the heading “Hypothetical” is useful in comparing ongoing costs only, and will not help you compare total costs of owning different funds. In addition, if transactional costs were included, your total costs would have been higher.
| | | | | | | | | | | | |
| | | | | Actual (actual return after expenses) | | Hypothetical (5% annual return before expenses) | | |
| | | | | | | | |
Share
Class | | Beginning
Account
Value 9/1/17 | | Ending
Account
Value 2/28/18 | | Expenses
Paid During
Period
9/1/17–2/28/181,2 | | Ending
Account
Value 2/28/18 | | Expenses
Paid During
Period
9/1/17–2/28/181,2 | | Net
Annualized
Expense
Ratio2 |
| | | | | | |
A | | $1,000 | | $992.00 | | $3.26 | | $1,021.52 | | $3.31 | | 0.66% |
C | | $1,000 | | $988.50 | | $5.97 | | $1,018.79 | | $6.06 | | 1.21% |
R6 | | $1,000 | | $992.60 | | $2.52 | | $1,022.27 | | $2.56 | | 0.51% |
Advisor | | $1,000 | | $992.50 | | $2.77 | | $1,022.02 | | $2.81 | | 0.56% |
1. Expenses are equal to the annualized expense ratio for the six-month period as indicated above—in the far right column—multiplied by the simple average account value over the period indicated, and then multiplied by 181/365 to reflect the one-half year period.
2. Reflects expenses after fee waivers and expense reimbursements, for Class R6.
| | | | | | |
12 | | Annual Report | | | | franklintempleton.com |
Franklin Colorado Tax-Free Income Fund
This annual report for Franklin Colorado Tax-Free Income Fund covers the fiscal year ended February 28, 2018.
Your Fund’s Goal and Main Investments
The Fund seeks to provide as high a level of income exempt from federal and Colorado personal income taxes as is consistent with prudent investment management and preservation of capital by investing at least 80% of its net assets in securities that pay interest free from such taxes.1
Credit Quality Composition*
2/28/18
| | |
| Ratings | | % of Total
Investments |
| |
AAA | | 1.65% |
| |
AA | | 51.01% |
| |
A | | 17.85% |
| |
BBB | | 10.11% |
| |
Below Investment Grade | | 0.61% |
| |
Refunded | | 16.67% |
| |
Not Rated | | 2.10% |
*Securities, except for those labeled Not Rated, are assigned ratings by one or more Nationally Recognized Statistical Credit Rating Organizations (NRSROs), such as Standard & Poor’s, Moody’s and Fitch, that can be considered by the investment manager as part of its independent securities analysis. When ratings from multiple agencies are available, the highest is used, consistent with the portfolio investment process. Ratings reflect an NRSRO’s opinion of an issuer’s creditworthiness and typically range from AAA (highest) to D (lowest). The Below Investment Grade category consists of bonds rated below BBB-. The Refunded category generally consists of refunded bonds secured by US government or other high-quality securities and not rerated by an NRSRO. The Not Rated category consists of ratable securities that have not been rated by an NRSRO. Cash and equivalents are excluded from this composition.
Performance Overview
The Fund’s Class A share price, as measured by net asset value, decreased from $11.66 on February 28, 2017, to $11.32 on February 28, 2018. The Fund’s Class A shares paid dividends totaling 38.63 cents per share for the reporting period.2 The Performance Summary beginning on page 15 shows that at the end of this reporting period the Fund’s Class A shares’ distribution rate was 2.99% based on an annualization of February’s 2.95 cent per share dividend and the maximum
Dividend Distributions*
3/1/17–2/28/18
| | | | | | | | | | | | | | | | |
| | | Dividend per Share (cents) | |
| | | | |
| Month | | Class A | | | Class C | | | Class R6** | | | Advisor
Class | |
March | | | 3.62 | | | | 3.07 | | | | — | | | | 3.71 | |
April | | | 3.52 | | | | 2.97 | | | | — | | | | 3.61 | |
May | | | 3.52 | | | | 2.97 | | | | — | | | | 3.61 | |
June | | | 3.37 | | | | 2.83 | | | | — | | | | 3.46 | |
July | | | 3.37 | | | | 2.83 | | | | — | | | | 3.46 | |
August | | | 3.17 | | | | 2.63 | | | | 3.18 | | | | 3.26 | |
September | | | 3.07 | | | | 2.52 | | | | 3.19 | | | | 3.16 | |
October | | | 3.03 | | | | 2.48 | | | | 3.15 | | | | 3.12 | |
November | | | 3.03 | | | | 2.48 | | | | 3.15 | | | | 3.12 | |
December | | | 3.03 | | | | 2.49 | | | | 3.15 | | | | 3.12 | |
January | | | 2.95 | | | | 2.41 | | | | 3.07 | | | | 3.04 | |
February | | | 2.95 | | | | 2.41 | | | | 3.07 | | | | 3.04 | |
Total | | | 38.63 | | | | 32.09 | | | | 21.96 | | | | 39.71 | |
*The distribution amount is the sum of all net investment income distributions for the period shown. Assumes shares were purchased and held for the entire accrual period. Since dividends accrue daily, your actual distributions will vary depending on the date you purchased your shares and any account activity. All Fund distributions will vary depending upon current market conditions, and past distributions are not indicative of future trends.
**Effective 8/1/17, the Fund began offering Class R6 shares. See the prospectus for details.
offering price of $11.82 on February 28, 2018. An investor in the 2018 maximum combined effective federal and Colorado personal income tax bracket of 45.43% (including 3.80% Medicare tax) would need to earn a distribution rate of 5.48% from a taxable investment to match the Fund’s Class A tax-free distribution rate. For other performance data, please see the Performance Summary. Dividend distributions were affected by low interest rates during the period. This and other factors resulted in reduced income for the portfolio and caused dividends to be lower at the end of the period.
Performance data represent past performance, which does not guarantee future results. Investment return and principal value will fluctuate, and you may have a gain or loss when you sell your shares. Current performance may differ from figures shown. For most recent month-end performance, go to franklintempleton.com or call (800) 342-5236.
1. For state personal income taxes, the 80% minimum is measured by total Fund assets. For investors subject to alternative minimum tax, a small portion of Fund dividends may be taxable. Distributions of capital gains are generally taxable. To avoid imposition of 28% backup withholding on all Fund distributions and redemption proceeds, US investors must be properly certified on Form W-9 and non-US investors on Form W-8BEN.
2. The distribution amount is the sum of all net investment income distributions for the period shown. Assumes shares were purchased and held for the entire accrual period. Since dividends accrue daily, your actual distributions will vary depending on the date you purchased your shares and any account activity. All Fund distributions will vary depending upon current market conditions, and past distributions are not indicative of future trends.
The dollar value, number of shares or principal amount, and names of all portfolio holdings are listed in the Fund’s Statement of Investments (SOI).
The SOI begins on page 77.
| | | | |
franklintempleton.com | | Annual Report | | 13 |
FRANKLIN COLORADO TAX-FREE INCOME FUND
State Update
During the 12 months under review, Colorado’s economy has continued to be strong. The state’s economy is diverse, with several technology and service sector strengths. Solid growth in the health care, retail, leisure/hospitality and home construction industries has offset slowing in industries including mining and oil. Colorado’s long-term economic outlook is favorable amid a growing population and workforce, a relatively stable housing market, relatively low costs of living and conducting business, and a positive mix of technology and service industries. In this environment, Colorado had one of the lowest unemployment rates in the nation during the period. The state’s unemployment rate rose from 2.7% in February 2017 to 3.0% at period-end, which was lower than the 4.1% national rate.3
In May 2017, Colorado’s governor signed into law the budget for the 2017–2018 fiscal year. The budget included increased spending on education, affordable housing and a homeless prevention program. Driven by the strong economy, state revenues have shown steady growth, although reserves have remained narrow. In its September 2017 economic and revenue forecast, the state estimated that revenue growth was relatively slow in fiscal year 2017 despite a generally stronger economy and some recovery in the oil and gas industry. The governor’s recently released fiscal year 2019 budget included an increase to the state’s statutory reserve.
Colorado’s debt levels were lower than those of most other states, with net tax-supported debt of $353 per capita and 0.7% of personal income, compared with the $1,006 and 2.5% national medians.4 Independent credit rating agency Moody’s Investors Service assigned Colorado an issuer credit rating of Aa1 with a stable outlook.5 The rating reflected the state’s strong economic performance, higher-than-average income levels and low debt levels relative to other states. Headwinds included narrow reserves, above-average pension liabilities, and constitutional restrictions and voter initiatives that constrain budgeting flexibility. The stable outlook is based on the state’s generally conservative fiscal practices, as well as an economy that has continued to exhibit positive trends and debt levels that are expected to remain moderate.
Manager’s Discussion
We used various investment strategies during the 12 months under review as we sought to maximize tax-free income for
| | |
| Portfolio Composition | | |
2/28/18 | | |
| |
| | | % of Total
Investments* |
Refunded** | | 19.9% |
Tax-Supported | | 17.1% |
Hospital & Health Care | | 16.0% |
Higher Education | | 12.3% |
Utilities | | 11.9% |
General Obligation | | 9.6% |
Subject to Government Appropriations | | 7.8% |
Transportation | | 3.1% |
Other Revenue | | 2.3% |
*Does not include cash and cash equivalents.
**Includes all refunded bonds; the percentage may differ from that in the Credit Quality Composition.
shareholders. Please read the Investment Strategy and Manager’s Discussion on page 5 for more information.
The Fund holds a very small portion of its assets in Puerto Rico bonds, which decreased in price over the period. Puerto Rico and its municipal issuers continue to experience significant financial difficulties and we continue to monitor developments affecting them.
Thank you for your continued participation in Franklin Colorado Tax-Free Income Fund. We believe our conservative, buy-and-hold investment strategy can help us achieve high, current, tax-free income for shareholders.
The foregoing information reflects our analysis, opinions and portfolio holdings as of February 28, 2018, the end of the reporting period. The way we implement our main investment strategies and the resulting portfolio holdings may change depending on factors such as market and economic conditions. These opinions may not be relied upon as investment advice or an offer for a particular security. The information is not a complete analysis of every aspect of any market, state, industry, security or the Fund. Statements of fact are from sources considered reliable, but the investment manager makes no representation or warranty as to their completeness or accuracy. Although historical performance is no guarantee of future results, these insights may help you understand our investment management philosophy.
3. Source: Bureau of Labor Statistics.
4. Source: Moody’s Investors Service, State Government - US: Medians - Total State Debt Remains Essentially Flat in 2017, 5/3/17.
5. This does not indicate Moody’s rating of the Fund.
| | | | | | |
14 | | Annual Report | | | | franklintempleton.com |
FRANKLIN COLORADO TAX-FREE INCOME FUND
Performance Summary as of February 28, 2018
The performance tables and graphs do not reflect any taxes that a shareholder would pay on Fund dividends, capital gain distributions, if any, or any realized gains on the sale of Fund shares. Total return reflects reinvestment of the Fund’s dividends and capital gain distributions, if any, and any unrealized gains or losses. Your dividend income will vary depending on dividends or interest paid by securities in the Fund’s portfolio, adjusted for operating expenses of each class. Capital gain distributions are net profits realized from the sale of portfolio securities.
Performance as of 2/28/18
Cumulative total return excludes sales charges. Average annual total return includes maximum sales charges. Sales charges will vary depending on the size of the investment and the class of share purchased. The maximum is 4.25% and the minimum is 0%. Class A: 4.25% maximum initial sales charge; Advisor Class: no sales charges. For other share classes, visit franklintempleton.com.
| | | | |
| Share Class | | Cumulative
Total Return1 | | Average Annual Total Return2 |
| | |
A | | | | |
1-Year | | +0.38% | | -3.90% |
5-Year | | +9.67% | | +0.99% |
10-Year | | +52.02% | | +3.83% |
| | |
Advisor3 | | | | |
1-Year | | +0.48% | | +0.48% |
5-Year | | +10.29% | | +1.98% |
10-Year | | +53.31% | | +4.37% |
| | | | | | | | |
| Share Class | | Distribution
Rate4 | | Taxable Equivalent
Distribution Rate5 | | 30-Day
Standardized Yield6 | | Taxable Equivalent 30-Day
Standardized Yield5 |
| | | | |
A | | 2.99% | | 5.48% | | 1.87% | | 3.43% |
| | | | |
Advisor | | 3.22% | | 5.90% | | 2.05% | | 3.76% |
Performance data represent past performance, which does not guarantee future results. Investment return and principal value will fluctuate, and you may have a gain or loss when you sell your shares. Current performance may differ from figures shown. For most recent month-end performance, go to franklintempleton.com or call (800) 342-5236.
See page 18 for Performance Summary footnotes.
| | | | | | | | |
franklintempleton.com | | | | | | Annual Report | | 15 |
FRANKLIN COLORADO TAX-FREE INCOME FUND
PERFORMANCE SUMMARY
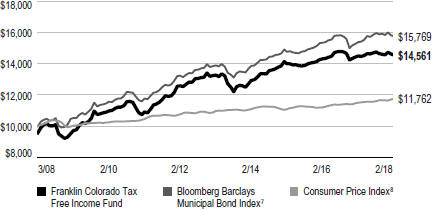
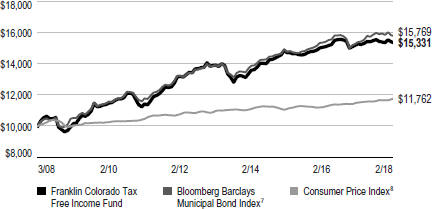
Total Return Index Comparison for a Hypothetical $10,000 Investment
Total return represents the change in value of an investment over the periods shown. It includes any applicable maximum sales charge, Fund expenses, account fees and reinvested distributions. The unmanaged indexes include reinvestment of any income or distributions. They differ from the Fund in composition and do not pay management fees or expenses. One cannot invest directly in an index.
Class A (3/1/08–2/28/18)
Advisor Class (3/1/08–2/28/18)3
See page 18 for Performance Summary footnotes.
| | | | | | |
16 | | Annual Report | | | | franklintempleton.com |
FRANKLIN COLORADO TAX-FREE INCOME FUND
PERFORMANCE SUMMARY
Net Asset Value
| | | | | | | | | | | | | | | | |
| Share Class (Symbol) | | 2/28/18 | | | 8/1/17 | | | 2/28/17 | | | Change | |
A (FRCOX) | | | $11.32 | | | | N/A | | | | $11.66 | | | | -$0.34 | |
C (FCOIX) | | | $11.46 | | | | N/A | | | | $11.79 | | | | -$0.33 | |
R6 (FKTLX) | | | $11.33 | | | | $11.64 | | | | N/A | | | | -$0.31 | |
Advisor (FCOZX) | | | $11.32 | | | | N/A | | | | $11.66 | | | | -$0.34 | |
Distributions (3/1/17–2/28/18)
| | | | |
| Share Class | | Net Investment
Income | |
| |
A | | | $0.3863 | |
| |
C | | | $0.3209 | |
| |
R6 (8/1/17–2/28/18) | | | $0.2196 | |
| |
Advisor | | | $0.3971 | |
Total Annual Operating Expenses9
| | | | |
| Share Class | | | |
| |
A | | | 0.65% | |
| |
Advisor | | | 0.55% | |
| | | | | | | | |
franklintempleton.com | | | | | | Annual Report | | 17 |
FRANKLIN COLORADO TAX-FREE INCOME FUND
PERFORMANCE SUMMARY
Each class of shares is available to certain eligible investors and has different annual fees and expenses, as described in the prospectus.
All investments involve risks, including possible loss of principal. Because municipal bonds are sensitive to interest rate movements, the Fund’s yield and share price will fluctuate with market conditions. Bond prices generally move in the opposite direction of interest rates. Thus, as prices of bonds in the Fund adjust to a rise in interest rates, the Fund’s share price may decline. Because the Fund invests principally in a single state, it is subject to greater risk of adverse economic and regulatory changes in that state than a geographically diversified fund. The Fund holds a very small portion of its assets in Puerto Rico municipal bonds that have been impacted by recent adverse economic and market changes, which may cause the Fund’s share price to decline. Changes in the credit rating of a bond, or in the credit rating or financial strength of a bond’s issuer, insurer or guarantor, may affect the bond’s value. The Fund may invest a significant part of its assets in municipal securities that finance similar types of projects, such as utilities, hospitals, higher education and transportation. A change that affects one project would likely affect all similar projects, thereby increasing market risk. The Fund is actively managed but there is no guarantee that the manager’s investment decisions will produce the desired results. The Fund’s prospectus also includes a description of the main investment risks.
1. Cumulative total return represents the change in value of an investment over the periods indicated.
2. Average annual total return represents the average annual change in value of an investment over the periods indicated. Return for less than one year, if any, has not been annualized.
3. Effective 7/15/09, the Fund began offering Advisor Class shares, which do not have sales charges or a Rule 12b-1 plan. Performance quotations for this class reflect the following methods of calculation: (a) For periods prior to 7/15/09, a restated figure is used based upon the Fund’s Class A performance, excluding the effect of Class A’s maximum initial sales charge, but reflecting the effect of the Class A Rule 12b-1 fees; and (b) for periods after 7/15/09, actual Advisor Class performance is used reflecting all charges and fees applicable to that class. Since 7/15/09 (commencement of sales), the cumulative and average annual total returns of Advisor Class shares were +42.80% and +4.22%.
4. Distribution rate is based on an annualization of the respective class’s February dividend and the maximum offering price (NAV for Advisor Class) per share on 2/28/18.
5. Taxable equivalent distribution rate and yield assume the published rates as of 1/15/18 for the maximum combined effective federal and Colorado personal income tax rate of 45.43%, based on the federal income tax rate of 37.00% plus 3.80% Medicare tax.
6. The Fund’s 30-day standardized yield is calculated over a trailing 30-day period using the yield to maturity on bonds and/or the dividends accrued on stocks. It may not equal the Fund’s actual income distribution rate, which reflects the Fund’s past dividends paid to shareholders.
7. Source: Morningstar. The Bloomberg Barclays Municipal Bond Index is a market value-weighted index engineered for the long-term tax-exempt bond market. To be included in the index, bonds must be fixed rate, have at least one year to final maturity and be rated investment grade (Baa3/BBB- or higher) by at least two of the following agencies: Moody’s, S&P and Fitch.
8. Source: Bureau of Labor Statistics, bls.gov/cpi. The Consumer Price Index is a commonly used measure of the inflation rate.
9. Figures are as stated in the Fund’s current prospectus and may differ from the expense ratios disclosed in the Your Fund’s Expenses and Financial Highlights sections in this report. In periods of market volatility, assets may decline significantly, causing total annual Fund operating expenses to become higher than the figures shown.
See www.franklintempletondatasources.com for additional data provider information.
| | | | | | |
18 | | Annual Report | | | | franklintempleton.com |
FRANKLIN COLORADO TAX-FREE INCOME FUND
Your Fund’s Expenses
As a Fund shareholder, you can incur two types of costs: (1) transaction costs, including sales charges (loads) on Fund purchases and redemptions; and (2) ongoing Fund costs, including management fees, distribution and service (12b-1) fees, and other Fund expenses. All mutual funds have ongoing costs, sometimes referred to as operating expenses. The table below shows ongoing costs of investing in the Fund and can help you understand these costs and compare them with those of other mutual funds. The table assumes a $1,000 investment held for the six months indicated.
Actual Fund Expenses
The table below provides information about actual account values and actual expenses in the columns under the heading “Actual.” In these columns the Fund’s actual return, which includes the effect of Fund expenses, is used to calculate the “Ending Account Value” for each class of shares. You can estimate the expenses you paid during the period by following these steps (of course, your account value and expenses will differ from those in this illustration): Divide your account value by $1,000 (if your account had an $8,600 value, then $8,600 ÷ $1,000 = 8.6). Then multiply the result by the number in the row for your class of shares under the headings “Actual” and “Expenses Paid During Period” (if Actual Expenses Paid During Period were $7.50, then 8.6 x $7.50 = $64.50). In this illustration, the actual expenses paid this period are $64.50.
Hypothetical Example for Comparison with Other Funds
Under the heading “Hypothetical” in the table, information is provided about hypothetical account values and hypothetical expenses based on the Fund’s actual expense ratio and an assumed rate of return of 5% per year before expenses, which is not the Fund’s actual return. This information may not be used to estimate the actual ending account balance or expenses you paid for the period, but it can help you compare ongoing costs of investing in the Fund with those of other funds. To do so, compare this 5% hypothetical example for the class of shares you hold with the 5% hypothetical examples that appear in the shareholder reports of other funds.
Please note that expenses shown in the table are meant to highlight ongoing costs and do not reflect any transactional costs. Therefore, information under the heading “Hypothetical” is useful in comparing ongoing costs only, and will not help you compare total costs of owning different funds. In addition, if transactional costs were included, your total costs would have been higher.
| | | | | | | | | | | | |
| | | | | Actual (actual return after expenses) | | Hypothetical (5% annual return before expenses) | | |
| | | | | | | | |
Share
Class | | Beginning
Account
Value 9/1/17 | | Ending
Account
Value 2/28/18 | | Expenses
Paid During
Period
9/1/17–2/28/181,2 | | Ending
Account
Value 2/28/18 | | Expenses
Paid During
Period
9/1/17–2/28/181,2 | | Net
Annualized
Expense
Ratio2 |
| | | | | | |
A | | $1,000 | | $986.30 | | $3.45 | | $1,021.32 | | $3.51 | | 0.70% |
C | | $1,000 | | $983.70 | | $6.15 | | $1,018.60 | | $6.26 | | 1.25% |
R6 | | $1,000 | | $987.70 | | $2.71 | | $1,022.07 | | $2.76 | | 0.55% |
Advisor | | $1,000 | | $986.70 | | $2.96 | | $1,021.82 | | $3.01 | | 0.60% |
1. Expenses are equal to the annualized expense ratio for the six-month period as indicated above—in the far right column—multiplied by the simple average account value over the period indicated, and then multiplied by 181/365 to reflect the one-half year period.
2. Reflects expenses after fee waivers and expense reimbursements.
| | | | | | | | |
franklintempleton.com | | | | | | Annual Report | | 19 |
Franklin Connecticut Tax-Free Income Fund
This annual report for Franklin Connecticut Tax-Free Income Fund covers the fiscal year ended February 28, 2018.
Your Fund’s Goal and Main Investments
The Fund seeks to provide as high a level of income exempt from federal and Connecticut personal income taxes as is consistent with prudent investment management and preservation of capital by investing at least 80% of its net assets in securities that pay interest free from such taxes.1
Credit Quality Composition*
2/28/18
| | |
| Ratings | | % of Total
Investments |
| |
AAA | | 7.64% |
| |
AA | | 38.61% |
| |
A | | 35.09% |
| |
Refunded | | 18.66% |
*Securities, except for those labeled Not Rated, are assigned ratings by one or more Nationally Recognized Statistical Credit Rating Organizations (NRSROs), such as Standard & Poor’s, Moody’s and Fitch, that can be considered by the investment manager as part of its independent securities analysis. When ratings from multiple agencies are available, the highest is used, consistent with the portfolio investment process. Ratings reflect an NRSRO’s opinion of an issuer’s creditworthiness and typically range from AAA (highest) to D (lowest). The Below Investment Grade category consists of bonds rated below BBB-. The Refunded category generally consists of refunded bonds secured by US government or other high-quality securities and not rerated by an NRSRO. The Not Rated category consists of ratable securities that have not been rated by an NRSRO. Cash and equivalents are excluded from this composition.
Performance Overview
The Fund’s Class A share price, as measured by net asset value, decreased from $10.42 on February��28, 2017, to $10.08 on February 28, 2018. The Fund’s Class A shares paid dividends totaling 34.44 cents per share for the reporting period.2 The Performance Summary beginning on page 22 shows that at the end of this reporting period the Fund’s Class A shares’ distribution rate was 3.17% based on an annualization of February’s 2.78 cent per share dividend and the maximum offering price of $10.53 on February 28, 2018. An investor in the 2018 maximum combined effective federal and Connecticut personal income tax bracket of 47.79% (including 3.80% Medicare tax) would need to earn a distribution rate of 6.07%
Dividend Distributions*
3/1/17–2/28/18
| | | | | | | | | | | | | | | | |
| | | Dividend per Share (cents) | |
| | | | |
| Month | | Class A | | | Class C | | | Class R6** | | | Advisor
Class | |
March | | | 3.04 | | | | 2.55 | | | | — | | | | 3.12 | |
April | | | 3.06 | | | | 2.57 | | | | — | | | | 3.14 | |
May | | | 3.06 | | | | 2.57 | | | | — | | | | 3.14 | |
June | | | 2.91 | | | | 2.43 | | | | — | | | | 2.99 | |
July | | | 2.91 | | | | 2.43 | | | | — | | | | 2.99 | |
August | | | 2.78 | | | | 2.30 | | | | 2.79 | | | | 2.86 | |
September | | | 2.78 | | | | 2.30 | | | | 2.89 | | | | 2.86 | |
October | | | 2.78 | | | | 2.30 | | | | 2.89 | | | | 2.86 | |
November | | | 2.78 | | | | 2.30 | | | | 2.89 | | | | 2.86 | |
December | | | 2.78 | | | | 2.30 | | | | 2.89 | | | | 2.86 | |
January | | | 2.78 | | | | 2.30 | | | | 2.89 | | | | 2.86 | |
February | | | 2.78 | | | | 2.30 | | | | 2.89 | | | | 2.86 | |
Total | | | 34.44 | | | | 28.65 | | | | 20.13 | | | | 35.40 | |
*The distribution amount is the sum of all net investment income distributions for the period shown. Assumes shares were purchased and held for the entire accrual period. Since dividends accrue daily, your actual distributions will vary depending on the date you purchased your shares and any account activity. All Fund distributions will vary depending upon current market conditions, and past distributions are not indicative of future trends.
**Effective 8/1/17, the Fund began offering Class R6 shares. See the prospectus for details.
from a taxable investment to match the Fund’s Class A tax-free distribution rate. For other performance data, please see the Performance Summary. Dividend distributions were affected by low interest rates during the period. This and other factors resulted in reduced income for the portfolio and caused dividends to be lower at the end of the period.
Performance data represent past performance, which does not guarantee future results. Investment return and principal value will fluctuate, and you may have a gain or loss when you sell your shares. Current performance may differ from figures shown. For most recent month-end performance, go to franklintempleton.com or call (800) 342-5236.
State Update
Connecticut’s economy grew during the 12 months under review. The state remained among the nation’s wealthiest, with
1. For state personal income taxes, the 80% minimum is measured by total Fund assets. For investors subject to alternative minimum tax, a small portion of Fund dividends may be taxable. Distributions of capital gains are generally taxable. To avoid imposition of 28% backup withholding on all Fund distributions and redemption proceeds, US investors must be properly certified on Form W-9 and non-US investors on Form W-8BEN.
2. The distribution amount is the sum of all net investment income distributions for the period shown. Assumes shares were purchased and held for the entire accrual period. Since dividends accrue daily, your actual distributions will vary depending on the date you purchased your shares and any account activity. All Fund distributions will vary depending upon current market conditions, and past distributions are not indicative of future trends.
The dollar value, number of shares or principal amount, and names of all portfolio holdings are listed in the Fund’s Statement of Investments (SOI).
The SOI begins on page 86.
| | | | |
20 | | Annual Report | | franklintempleton.com |
FRANKLIN CONNECTICUT TAX-FREE INCOME FUND
strong per-capita income well above national levels. During the period under review, home prices rose modestly and foreclosure rates generally declined. Connecticut’s unemployment rate declined from 4.9% in February 2017 to 4.6% at period-end, which was higher than the 4.1% national rate.3
During the state’s fiscal year (FY) 2017, lawmakers anticipated weaker-than-projected revenue growth. Lower income and sales tax collections led to lower-than-expected general fund revenues. Connecticut concluded FY 2017 (ended June 30, 2017) with a budget deficit, which was covered by a transfer from the state’s budget stabilization fund. Connecticut started its FYs 2018–2019 (beginning July 1, 2017) without an enacted biennial budget, which prompted the governor to sign an executive order taking over the state’s spending authority. The FY 2018–2019 biennial budget included budget cuts, consisting of workforce savings, education-related grant cuts to localities and reduced spending on higher education, among other items. Additionally, the budget included various revenue enhancement measures. In December 2017, Connecticut projected a revenue shortfall in mid-2018 and the governor proposed mid-year budget cuts and tax increases. Furthermore, mid-term budget adjustments for FY 2019 were announced in February 2018 that included spending cuts and revenue enhancement measures.
Connecticut’s debt levels remained among the nation’s highest, with net tax-supported debt at 9.7% of personal income and $6,505 per capita, compared with the national medians of 2.5% and $1,006, respectively.4 Independent credit rating agency Standard & Poor’s (S&P) downgraded its rating on Connecticut’s general obligation bonds from AA- to A+, and changed its outlook from stable to negative.5 The rating reflects S&P’s view of the state’s diverse economy, high income levels, active monitoring of revenue and expenditures to identify and resolve mid-year budget gaps and adequate operating liquidity. In S&P’s view, these strengths were offset by cyclical budget performance, recent population declines and slow economic growth. Additionally, S&P believes that the state’s above-average debt, large, unfunded pension liabilities, and other post-employment benefits create significant and growing fixed-cost pressure that restrains Connecticut’s budgetary flexibility. The negative outlook reflects S&P’s expectation that the state is likely to continue facing increasing constraints,
including revenue weakness and reduced revenue-raising flexibility, to achieve long-term structural balance.
| | |
| Portfolio Composition | | |
2/28/18 | | |
| |
| | | % of Total
Investments* |
Hospital & Health Care | | 25.2% |
Refunded** | | 21.6% |
Higher Education | | 19.0% |
Utilities | | 18.6% |
General Obligation | | 9.3% |
Transportation | | 5.3% |
Housing | | 0.8% |
Other Revenue | | 0.2% |
*Does not include cash and cash equivalents.
**Includes all refunded bonds; the percentage may differ from that in the Credit Quality Composition.
Manager’s Discussion
We used various investment strategies during the 12 months under review as we sought to maximize tax-free income for shareholders. Please read the Investment Strategy and Manager’s Discussion on page 5 for more information.
Thank you for your continued participation in Franklin Connecticut Tax-Free Income Fund. We believe our conservative, buy-and-hold investment strategy can help us achieve high, current, tax-free income for shareholders.
The foregoing information reflects our analysis, opinions and portfolio holdings as of February 28, 2018, the end of the reporting period. The way we implement our main investment strategies and the resulting portfolio holdings may change depending on factors such as market and economic conditions. These opinions may not be relied upon as investment advice or an offer for a particular security. The information is not a complete analysis of every aspect of any market, state, industry, security or the Fund. Statements of fact are from sources considered reliable, but the investment manager makes no representation or warranty as to their completeness or accuracy. Although historical performance is no guarantee of future results, these insights may help you understand our investment management philosophy.
3. Source: Bureau of Labor Statistics.
4. Source: Moody’s Investors Service, State Government - US: Medians - Total State Debt Remains Essentially Flat in 2017, 5/3/17.
5. This does not indicate S&P’s rating of the Fund.
| | | | | | | | |
franklintempleton.com | | | | | | Annual Report | | 21 |
FRANKLIN CONNECTICUT TAX-FREE INCOME FUND
Performance Summary as of February 28, 2018
The performance tables and graphs do not reflect any taxes that a shareholder would pay on Fund dividends, capital gain distributions, if any, or any realized gains on the sale of Fund shares. Total return reflects reinvestment of the Fund’s dividends and capital gain distributions, if any, and any unrealized gains or losses. Your dividend income will vary depending on dividends or interest paid by securities in the Fund’s portfolio, adjusted for operating expenses of each class. Capital gain distributions are net profits realized from the sale of portfolio securities.
Performance as of 2/28/18
Cumulative total return excludes sales charges. Average annual total return includes maximum sales charges. Sales charges will vary depending on the size of the investment and the class of share purchased. The maximum is 4.25% and the minimum is 0%. Class A: 4.25% maximum initial sales charge; Advisor Class: no sales charges. For other share classes, visit franklintempleton.com.
| | | | |
| Share Class | | Cumulative
Total Return1 | | Average Annual
Total Return2 |
| | |
A | | | | |
1-Year | | +0.03% | | -4.19% |
5-Year | | +5.28% | | +0.16% |
10-Year | | +42.09% | | +3.13% |
| | |
Advisor3 | | | | |
1-Year | | +0.13% | | +0.13% |
5-Year | | +5.90% | | +1.15% |
10-Year | | +43.32% | | +3.67% |
| | | | | | | | |
| Share Class | | Distribution
Rate4 | | Taxable Equivalent
Distribution Rate5 | | 30-Day
Standardized Yield6 | | Taxable Equivalent 30-Day
Standardized Yield5 |
| | | | |
A | | 3.17% | | 6.07% | | 1.72% | | 3.29% |
| | | | |
Advisor | | 3.40% | | 6.51% | | 1.87% | | 3.58% |
Performance data represent past performance, which does not guarantee future results. Investment return and principal value will fluctuate, and you may have a gain or loss when you sell your shares. Current performance may differ from figures shown. For most recent month-end performance, go to franklintempleton.com or call (800) 342-5236.
See page 25 for Performance Summary footnotes.
| | | | | | |
22 | | Annual Report | | | | franklintempleton.com |
FRANKLIN CONNECTICUT TAX-FREE INCOME FUND
PERFORMANCE SUMMARY
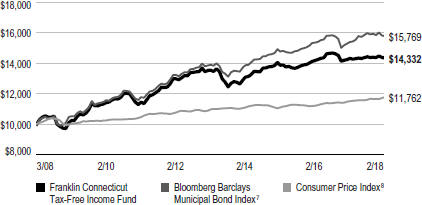
Total Return Index Comparison for a Hypothetical $10,000 Investment
Total return represents the change in value of an investment over the periods shown. It includes any applicable maximum sales charge, Fund expenses, account fees and reinvested distributions. The unmanaged indexes include reinvestment of any income or distributions. They differ from the Fund in composition and do not pay management fees or expenses. One cannot invest directly in an index.
Class A (3/1/08–2/28/18)
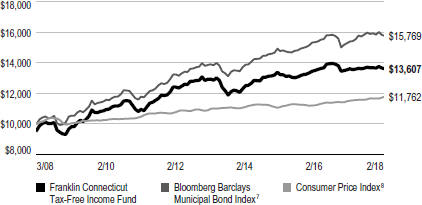
Advisor Class (3/1/08–2/28/18)3
See page 25 for Performance Summary footnotes.
| | | | | | | | |
franklintempleton.com | | | | | | Annual Report | | 23 |
FRANKLIN CONNECTICUT TAX-FREE INCOME FUND
PERFORMANCE SUMMARY
Net Asset Value
| | | | | | | | | | | | | | | | |
| Share Class (Symbol) | | 2/28/18 | | | 8/1/17 | | | 2/28/17 | | | Change | |
A (FXCTX) | | | $10.08 | | | | N/A | | | | $10.42 | | | | -$0.34 | |
C (FCTIX) | | | $10.16 | | | | N/A | | | | $10.50 | | | | -$0.34 | |
R6 (FCTQX) | | | $10.08 | | | | $10.30 | | | | N/A | | | | -$0.22 | |
Advisor (FCNZX) | | | $10.08 | | | | N/A | | | | $10.42 | | | | -$0.34 | |
Distributions (3/1/17–2/28/18)
| | | | |
| Share Class | | Net Investment
Income | |
| |
A | | | $0.3444 | |
| |
C | | | $0.2865 | |
| |
R6 (8/1/17–2/28/18) | | | $0.2013 | |
| |
Advisor | | | $0.3540 | |
Total Annual Operating Expenses9
| | | | |
| Share Class | | | |
| |
A | | | 0.71% | |
| |
Advisor | | | 0.61% | |
| | | | | | |
24 | | Annual Report | | | | franklintempleton.com |
FRANKLIN CONNECTICUT TAX-FREE INCOME FUND
PERFORMANCE SUMMARY
Each class of shares is available to certain eligible investors and has different annual fees and expenses, as described in the prospectus.
All investments involve risks, including possible loss of principal. Because municipal bonds are sensitive to interest rate movements, the Fund’s yield and share price will fluctuate with market conditions. Bond prices generally move in the opposite direction of interest rates. Thus, as prices of bonds in the Fund adjust to a rise in interest rates, the Fund’s share price may decline. Because the Fund invests principally in a single state, it is subject to greater risk of adverse economic and regulatory changes in that state than a geographically diversified fund. Changes in the credit rating of a bond, or in the credit rating or financial strength of a bond’s issuer, insurer or guarantor, may affect the bond’s value. The Fund may invest a significant part of its assets in municipal securities that finance similar types of projects, such as utilities, hospitals, higher education and transportation. A change that affects one project would likely affect all similar projects, thereby increasing market risk. The Fund is actively managed but there is no guarantee that the manager’s investment decisions will produce the desired results. The Fund’s prospectus also includes a description of the main investment risks.
1. Cumulative total return represents the change in value of an investment over the periods indicated.
2. Average annual total return represents the average annual change in value of an investment over the periods indicated. Return for less than one year, if any, has not been annualized.
3. Effective 7/15/09, the Fund began offering Advisor Class shares, which do not have sales charges or a Rule 12b-1 plan. Performance quotations for this class reflect the following methods of calculation: (a) For periods prior to 7/15/09, a restated figure is used based upon the Fund’s Class A performance, excluding the effect of Class A’s maximum initial sales charge, but reflecting the effect of the Class A Rule 12b-1 fees; and (b) for periods after 7/15/09, actual Advisor Class performance is used reflecting all charges and fees applicable to that class. Since 7/15/09 (commencement of sales), the cumulative and average annual total returns of Advisor Class shares were +34.21% and +3.47%.
4. Distribution rate is based on an annualization of the respective class’s February dividend and the maximum offering price (NAV for Advisor Class) per share on 2/28/18.
5. Taxable equivalent distribution rate and yield assume the published rates as of 1/15/18 for the maximum combined effective federal and Connecticut personal income tax rate of 47.79%, based on the federal income tax rate of 37.00% plus 3.80% Medicare tax.
6. The Fund’s 30-day standardized yield is calculated over a trailing 30-day period using the yield to maturity on bonds and/or the dividends accrued on stocks. It may not equal the Fund’s actual income distribution rate, which reflects the Fund’s past dividends paid to shareholders.
7. Source: Morningstar. The Bloomberg Barclays Municipal Bond Index is a market value-weighted index engineered for the long-term tax-exempt bond market. To be included in the index, bonds must be fixed rate, have at least one year to final maturity and be rated investment grade (Baa3/BBB- or higher) by at least two of the following agencies: Moody’s, S&P and Fitch.
8. Source: Bureau of Labor Statistics, bls.gov/cpi. The Consumer Price Index is a commonly used measure of the inflation rate.
9. Figures are as stated in the Fund’s current prospectus and may differ from the expense ratios disclosed in the Your Fund’s Expenses and Financial Highlights sections in this report. In periods of market volatility, assets may decline significantly, causing total annual Fund operating expenses to become higher than the figures shown.
See www.franklintempletondatasources.com for additional data provider information.
| | | | | | | | |
franklintempleton.com | | | | | | Annual Report | | 25 |
FRANKLIN CONNECTICUT TAX-FREE INCOME FUND
Your Fund’s Expenses
As a Fund shareholder, you can incur two types of costs: (1) transaction costs, including sales charges (loads) on Fund purchases and redemptions; and (2) ongoing Fund costs, including management fees, distribution and service (12b-1) fees, and other Fund expenses. All mutual funds have ongoing costs, sometimes referred to as operating expenses. The table below shows ongoing costs of investing in the Fund and can help you understand these costs and compare them with those of other mutual funds. The table assumes a $1,000 investment held for the six months indicated.
Actual Fund Expenses
The table below provides information about actual account values and actual expenses in the columns under the heading “Actual.” In these columns the Fund’s actual return, which includes the effect of Fund expenses, is used to calculate the “Ending Account Value” for each class of shares. You can estimate the expenses you paid during the period by following these steps (of course, your account value and expenses will differ from those in this illustration): Divide your account value by $1,000 (if your account had an $8,600 value, then $8,600 ÷ $1,000 = 8.6). Then multiply the result by the number in the row for your class of shares under the headings “Actual” and “Expenses Paid During Period” (if Actual Expenses Paid During Period were $7.50, then 8.6 x $7.50 = $64.50). In this illustration, the actual expenses paid this period are $64.50.
Hypothetical Example for Comparison with Other Funds
Under the heading “Hypothetical” in the table, information is provided about hypothetical account values and hypothetical expenses based on the Fund’s actual expense ratio and an assumed rate of return of 5% per year before expenses, which is not the Fund’s actual return. This information may not be used to estimate the actual ending account balance or expenses you paid for the period, but it can help you compare ongoing costs of investing in the Fund with those of other funds. To do so, compare this 5% hypothetical example for the class of shares you hold with the 5% hypothetical examples that appear in the shareholder reports of other funds.
Please note that expenses shown in the table are meant to highlight ongoing costs and do not reflect any transactional costs. Therefore, information under the heading “Hypothetical” is useful in comparing ongoing costs only, and will not help you compare total costs of owning different funds. In addition, if transactional costs were included, your total costs would have been higher.
| | | | | | | | | | | | |
| | | | | Actual (actual return after expenses) | | Hypothetical (5% annual return before expenses) | | |
| | | | | | | | |
Share Class | | Beginning
Account
Value 9/1/17 | | Ending
Account
Value 2/28/18 | | Expenses
Paid During
Period
9/1/17–2/28/181,2 | | Ending
Account
Value 2/28/18 | | Expenses
Paid During
Period
9/1/17–2/28/181,2 | | Net
Annualized
Expense
Ratio2 |
| | | | | | |
A | | $1,000 | | $992.80 | | $3.85 | | $1,020.93 | | $3.91 | | 0.78% |
C | | $1,000 | | $990.10 | | $6.56 | | $1,018.20 | | $6.66 | | 1.33% |
R6 | | $1,000 | | $994.40 | | $3.07 | | $1,021.72 | | $3.11 | | 0.62% |
Advisor | | $1,000 | | $994.30 | | $3.36 | | $1,021.42 | | $3.41 | | 0.68% |
1. Expenses are equal to the annualized expense ratio for the six-month period as indicated above—in the far right column—multiplied by the simple average account value over the period indicated, and then multiplied by 181/365 to reflect the one-half year period.
2. Reflects expenses after fee waivers and expense reimbursements, for Class R6.
| | | | | | |
26 | | Annual Report | | | | franklintempleton.com |
Franklin Michigan Tax-Free Income Fund
This annual report for Franklin Michigan Tax-Free Income Fund covers the fiscal year ended February 28, 2018.
Your Fund’s Goal and Main Investments
The Fund seeks to provide as high a level of income exempt from federal and Michigan personal income taxes as is consistent with prudent investment management and preservation of capital by investing at least 80% of its total assets in securities that pay interest free from such taxes.1
Credit Quality Composition*
2/28/18
| | |
| Ratings | | % of Total
Investments |
| |
AAA | | 7.41% |
| |
AA | | 61.71% |
| |
A | | 12.12% |
| |
Refunded | | 18.76% |
*Securities, except for those labeled Not Rated, are assigned ratings by one or more Nationally Recognized Statistical Credit Rating Organizations (NRSROs), such as Standard & Poor’s, Moody’s and Fitch, that can be considered by the investment manager as part of its independent securities analysis. When ratings from multiple agencies are available, the highest is used, consistent with the portfolio investment process. Ratings reflect an NRSRO’s opinion of an issuer’s creditworthiness and typically range from AAA (highest) to D (lowest). The Below Investment Grade category consists of bonds rated below BBB-. The Refunded category generally consists of refunded bonds secured by US government or other high-quality securities and not rerated by an NRSRO. The Not Rated category consists of ratable securities that have not been rated by an NRSRO. Cash and equivalents are excluded from this composition.
Performance Overview
The Fund’s Class A share price, as measured by net asset value, decreased from $11.52 on February 28, 2017, to $11.25 on February 28, 2018. The Fund’s Class A shares paid dividends totaling 36.82 cents per share for the reporting period.2 The Performance Summary beginning on page 29 shows that at the end of this reporting period the Fund’s Class A shares’ distribution rate was 2.99% based on an annualization of February’s 2.93 cent per share dividend and the maximum offering price of $11.75 on February 28, 2018. An investor in the 2018 maximum combined effective federal and Michigan personal income tax bracket of 45.05% (including 3.80% Medicare tax) would need to earn a distribution rate of 5.44% from a taxable investment to match the Fund’s Class A tax-free
Dividend Distributions*
3/1/17–2/28/18
| | | | | | | | | | | | | | | | |
| | | Dividend per Share (cents) | |
| | | | |
| Month | | Class A | | | Class C | | | Class R6** | | | Advisor
Class | |
March | | | 3.24 | | | | 2.70 | | | | — | | | | 3.33 | |
April | | | 3.24 | | | | 2.70 | | | | — | | | | 3.33 | |
May | | | 3.24 | | | | 2.70 | | | | — | | | | 3.33 | |
June | | | 3.06 | | | | 2.52 | | | | — | | | | 3.15 | |
July | | | 3.06 | | | | 2.52 | | | | — | | | | 3.15 | |
August | | | 3.06 | | | | 2.52 | | | | 3.08 | | | | 3.15 | |
September | | | 3.06 | | | | 2.52 | | | | 3.18 | | | | 3.15 | |
October | | | 3.06 | | | | 2.52 | | | | 3.18 | | | | 3.15 | |
November | | | 3.01 | | | | 2.47 | | | | 3.13 | | | | 3.10 | |
December | | | 2.93 | | | | 2.39 | | | | 3.05 | | | | 3.02 | |
January | | | 2.93 | | | | 2.39 | | | | 3.05 | | | | 3.02 | |
February | | | 2.93 | | | | 2.39 | | | | 3.05 | | | | 3.02 | |
Total | | | 36.82 | | | | 30.34 | | | | 21.72 | | | | 37.90 | |
*The distribution amount is the sum of all net investment income distributions for the period shown. Assumes shares were purchased and held for the entire accrual period. Since dividends accrue daily, your actual distributions will vary depending on the date you purchased your shares and any account activity. All Fund distributions will vary depending upon current market conditions, and past distributions are not indicative of future trends.
**Effective 8/1/17, the Fund began offering Class R6 shares. See the prospectus for details.
distribution rate. For other performance data, please see the Performance Summary. Dividend distributions were affected by low interest rates during the period. This and other factors resulted in reduced income for the portfolio and caused dividends to be lower at the end of the period.
Performance data represent past performance, which does not guarantee future results. Investment return and principal value will fluctuate, and you may have a gain or loss when you sell your shares. Current performance may differ from figures shown. For most recent month-end performance, go to franklintempleton.com or call (800) 342-5236.
State Update
Michigan’s economy generally expanded for the 12 months under review. Although the state’s economy was diversified, the manufacturing sector continued to serve as a major employment source. Michigan’s unemployment rate began the
1. For investors subject to alternative minimum tax, a small portion of Fund dividends may be taxable. Distributions of capital gains are generally taxable. To avoid imposition of 28% backup withholding on all Fund distributions and redemption proceeds, US investors must be properly certified on Form W-9 and non-US investors on Form W-8BEN.
2. The distribution amount is the sum of all net investment income distributions for the period shown. Assumes shares were purchased and held for the entire accrual period. Since dividends accrue daily, your actual distributions will vary depending on the date you purchased your shares and any account activity. All Fund distributions will vary depending upon current market conditions, and past distributions are not indicative of future trends.
The dollar value, number of shares or principal amount, and names of all portfolio holdings are listed in the Fund’s Statement of Investments (SOI).
The SOI begins on page 102.
| | | | |
franklintempleton.com | | Annual Report | | 27 |
FRANKLIN MICHIGAN TAX-FREE INCOME FUND
period at 4.8% in February 2017 and slightly declined, but crept back up to 4.8% at period-end, which was above the 4.1% national average.3 The housing market was positive, as home prices rose and the foreclosure rate remained below the national rate during the review period.
Michigan’s fiscal year (FY) 2017 general fund-general purpose and school funding revenues were above FY 2016 levels, mainly due to higher sales tax, corporate income tax and individual income tax receipts, and lower refunds under the Michigan Business Tax, which was partially offset by higher individual income tax refunds and lower use tax revenues. The FY 2018 budget prioritizes sectors such as education and health and human services. The budget included increased spending on economic development, education and infrastructure. The budget also identified additional deposits to the budget stabilization fund (BSF) in FY 2018. In February 2018, the governor announced FY 2019 budget recommendations. For FY 2019, a large portion of the budget was dedicated to education and health and human services. The budget recommendations included tax relief measures and increased spending in economic development, education and infrastructure.
Michigan maintained relatively low debt levels, with net tax-supported debt at $689 per capita and 1.6% of personal income, compared with the national medians of $1,006 and 2.5%, respectively.4 Independent credit rating agency Standard & Poor’s (S&P) affirmed its AA- rating of Michigan’s general obligation bonds and upwardly revised its outlook to positive from stable.5 The rating reflected S&P’s view of state’s cyclical but growing economy, adequate BSF balance, low pension plan and other postemployment benefit liabilities and structural budget balance. The revised positive outlook reflected S&P’s view of Michigan’s employment and demographic indicators and projected growth in reserve levels.
Manager’s Discussion
We used various investment strategies during the 12 months under review as we sought to maximize tax-free income for shareholders. Please read the Investment Strategy and Manager’s Discussion on page 5 for more information.
Thank you for your continued participation in Franklin Michigan Tax-Free Income Fund. We believe our conservative,
| | |
| Portfolio Composition | | |
2/28/18 | | |
| |
| | | % of Total
Investments* |
General Obligation | | 31.6% |
Refunded** | | 23.3% |
Hospital & Health Care | | 22.2% |
Higher Education | | 14.3% |
Utilities | | 4.5% |
Subject to Government Appropriations | | 4.0% |
Housing | | 0.1% |
*Does not include cash and cash equivalents.
**Includes all refunded bonds; the percentage may differ from that in the Credit Quality Composition.
buy-and-hold investment strategy can help us achieve high, current, tax-free income for shareholders.
The foregoing information reflects our analysis, opinions and portfolio holdings as of February 28, 2018, the end of the reporting period. The way we implement our main investment strategies and the resulting portfolio holdings may change depending on factors such as market and economic conditions. These opinions may not be relied upon as investment advice or an offer for a particular security. The information is not a complete analysis of every aspect of any market, state, industry, security or the Fund. Statements of fact are from sources considered reliable, but the investment manager makes no representation or warranty as to their completeness or accuracy. Although historical performance is no guarantee of future results, these insights may help you understand our investment management philosophy.
3. Source: Bureau of Labor Statistics.
4. Source: Moody’s Investors Service, State Government - US: Medians - Total State Debt Remains Essentially Flat in 2017, 5/3/17.
5. This does not indicate S&P’s rating of the Fund.
| | | | | | |
28 | | Annual Report | | | | franklintempleton.com |
FRANKLIN MICHIGAN TAX-FREE INCOME FUND
Performance Summary as of February 28, 2018
The performance tables and graphs do not reflect any taxes that a shareholder would pay on Fund dividends, capital gain distributions, if any, or any realized gains on the sale of Fund shares. Total return reflects reinvestment of the Fund’s dividends and capital gain distributions, if any, and any unrealized gains or losses. Your dividend income will vary depending on dividends or interest paid by securities in the Fund’s portfolio, adjusted for operating expenses of each class. Capital gain distributions are net profits realized from the sale of portfolio securities.
Performance as of 2/28/18
Cumulative total return excludes sales charges. Average annual total return includes maximum sales charges. Sales charges will vary depending on the size of the investment and the class of share purchased. The maximum is 4.25% and the minimum is 0%. Class A: 4.25% maximum initial sales charge; Advisor Class: no sales charges. For other share classes, visit franklintempleton.com.
| | | | |
| Share Class | | Cumulative
Total Return1 | | Average Annual
Total Return2 |
| | |
A | | | | |
1-Year | | +0.85% | | -3.43% |
5-Year | | +8.71% | | +0.80% |
10-Year | | +41.27% | | +3.07% |
| | |
Advisor3 | | | | |
1-Year | | +1.03% | | +1.03% |
5-Year | | +9.32% | | +1.80% |
10-Year | | +43.00% | | +3.64% |
| | | | | | | | |
| Share Class | | Distribution
Rate4 | | Taxable Equivalent
Distribution Rate5 | | 30-Day
Standardized Yield6 | | Taxable Equivalent 30-Day
Standardized Yield5 |
| | | | |
A | | 2.99% | | 5.44% | | 1.84% | | 3.35% |
| | | | |
Advisor | | 3.21% | | 5.84% | | 2.01% | | 3.66% |
Performance data represent past performance, which does not guarantee future results. Investment return and principal value will fluctuate, and you may have a gain or loss when you sell your shares. Current performance may differ from figures shown. For most recent month-end performance, go to franklintempleton.com or call (800) 342-5236.
See page 32 for Performance Summary footnotes.
| | | | | | | | |
franklintempleton.com | | | | | | Annual Report | | 29 |
FRANKLIN MICHIGAN TAX-FREE INCOME FUND
PERFORMANCE SUMMARY
Total Return Index Comparison for a Hypothetical $10,000 Investment
Total return represents the change in value of an investment over the periods shown. It includes any applicable maximum sales charge, Fund expenses, account fees and reinvested distributions. The unmanaged indexes include reinvestment of any income or distributions. They differ from the Fund in composition and do not pay management fees or expenses. One cannot invest directly in an index.
Class A (3/1/08–2/28/18)
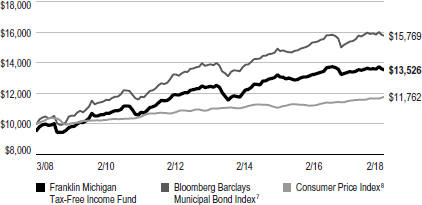
Advisor Class (3/1/08–2/28/18)3
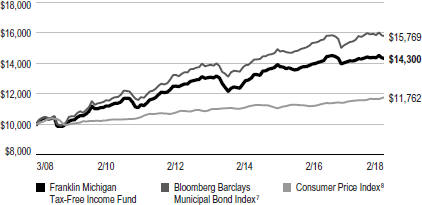
See page 32 for Performance Summary footnotes.
| | | | | | |
30 | | Annual Report | | | | franklintempleton.com |
FRANKLIN MICHIGAN TAX-FREE INCOME FUND
PERFORMANCE SUMMARY
Net Asset Value
| | | | | | | | | | | | | | | | |
| Share Class (Symbol) | | 2/28/18 | | | 8/1/17 | | | 2/28/17 | | | Change | |
A (FTTMX) | | | $11.25 | | | | N/A | | | | $11.52 | | | | -$0.27 | |
C (FRMTX) | | | $11.43 | | | | N/A | | | | $11.69 | | | | -$0.26 | |
R6 (FKTNX) | | | $11.29 | | | | $11.53 | | | | N/A | | | | -$0.24 | |
Advisor (FMTFX) | | | $11.29 | | | | N/A | | | | $11.55 | | | | -$0.26 | |
Distributions (3/1/17–2/28/18)
| | | | |
| Share Class | | Net Investment
Income | |
| |
A | | | $0.3682 | |
| |
C | | | $0.3034 | |
| |
R6 (8/1/17–2/28/18) | | | $0.2172 | |
| |
Advisor | | | $0.3790 | |
Total Annual Operating Expenses9
| | | | |
| Share Class | | | |
| |
A | | | 0.65% | |
| |
Advisor | | | 0.55% | |
| | | | | | | | |
franklintempleton.com | | | | | | Annual Report | | 31 |
FRANKLIN MICHIGAN TAX-FREE INCOME FUND
PERFORMANCE SUMMARY
Each class of shares is available to certain eligible investors and has different annual fees and expenses, as described in the prospectus.
All investments involve risks, including possible loss of principal. Because municipal bonds are sensitive to interest rate movements, the Fund’s yield and share price will fluctuate with market conditions. Bond prices generally move in the opposite direction of interest rates. Thus, as prices of bonds in the Fund adjust to a rise in interest rates, the Fund’s share price may decline. Because the Fund invests principally in a single state, it is subject to greater risk of adverse economic and regulatory changes in that state than a geographically diversified fund. The Fund holds a very small portion of its assets in Puerto Rico municipal bonds that have been impacted by recent adverse economic and market changes, which may cause the Fund’s share price to decline. Changes in the credit rating of a bond, or in the credit rating or financial strength of a bond’s issuer, insurer or guarantor, may affect the bond’s value. The Fund may invest a significant part of its assets in municipal securities that finance similar types of projects, such as utilities, hospitals, higher education and transportation. A change that affects one project would likely affect all similar projects, thereby increasing market risk. The Fund is actively managed but there is no guarantee that the manager’s investment decisions will produce the desired results. The Fund’s prospectus also includes a description of the main investment risks.
1. Cumulative total return represents the change in value of an investment over the periods indicated.
2. Average annual total return represents the average annual change in value of an investment over the periods indicated. Return for less than one year, if any, has not been annualized.
3. Effective 7/1/08, the Fund began offering Advisor Class shares, which do not have sales charges or a Rule 12b-1 plan. Performance quotations for this class reflect the following methods of calculation: (a) For periods prior to 7/1/08, a restated figure is used based upon the Fund’s Class A performance, excluding the effect of Class A’s maximum initial sales charge, but reflecting the effect of the Class A Rule 12b-1 fees; and (b) for periods after 7/1/08, actual Advisor Class performance is used reflecting all charges and fees applicable to that class. Since 7/1/08 (commencement of sales), the cumulative and average annual total returns of Advisor Class shares were +38.14% and +3.40%.
4. Distribution rate is based on an annualization of the respective class’s February dividend and the maximum offering price (NAV for Advisor Class) per share on 2/28/18.
5. Taxable equivalent distribution rate and yield assume the published rates as of 1/15/18 for the maximum combined effective federal and Michigan personal income tax rate of 45.05%, based on the federal income tax rate of 37.00% plus 3.80% Medicare tax.
6. The Fund’s 30-day standardized yield is calculated over a trailing 30-day period using the yield to maturity on bonds and/or the dividends accrued on stocks. It may not equal the Fund’s actual income distribution rate, which reflects the Fund’s past dividends paid to shareholders.
7. Source: Morningstar. The Bloomberg Barclays Municipal Bond Index is a market value-weighted index engineered for the long-term tax-exempt bond market. To be included in the index, bonds must be fixed rate, have at least one year to final maturity and be rated investment grade (Baa3/BBB- or higher) by at least two of the following agencies: Moody’s, S&P and Fitch.
8. Source: Bureau of Labor Statistics, bls.gov/cpi. The Consumer Price Index is a commonly used measure of the inflation rate.
9. Figures are as stated in the Fund’s current prospectus and may differ from the expense ratios disclosed in the Your Fund’s Expenses and Financial Highlights sections in this report. In periods of market volatility, assets may decline significantly, causing total annual Fund operating expenses to become higher than the figures shown.
See www.franklintempletondatasources.com for additional data provider information.
| | | | | | |
32 | | Annual Report | | | | franklintempleton.com |
FRANKLIN MICHIGAN TAX-FREE INCOME FUND
Your Fund’s Expenses
As a Fund shareholder, you can incur two types of costs: (1) transaction costs, including sales charges (loads) on Fund purchases and redemptions; and (2) ongoing Fund costs, including management fees, distribution and service (12b-1) fees, and other Fund expenses. All mutual funds have ongoing costs, sometimes referred to as operating expenses. The table below shows ongoing costs of investing in the Fund and can help you understand these costs and compare them with those of other mutual funds. The table assumes a $1,000 investment held for the six months indicated.
Actual Fund Expenses
The table below provides information about actual account values and actual expenses in the columns under the heading “Actual.” In these columns the Fund’s actual return, which includes the effect of Fund expenses, is used to calculate the “Ending Account Value” for each class of shares. You can estimate the expenses you paid during the period by following these steps (of course, your account value and expenses will differ from those in this illustration): Divide your account value by $1,000 (if your account had an $8,600 value, then $8,600 ÷ $1,000 = 8.6). Then multiply the result by the number in the row for your class of shares under the headings “Actual” and “Expenses Paid During Period” (if Actual Expenses Paid During Period were $7.50, then 8.6 x $7.50 = $64.50). In this illustration, the actual expenses paid this period are $64.50.
Hypothetical Example for Comparison with Other Funds
Under the heading “Hypothetical” in the table, information is provided about hypothetical account values and hypothetical expenses based on the Fund’s actual expense ratio and an assumed rate of return of 5% per year before expenses, which is not the Fund’s actual return. This information may not be used to estimate the actual ending account balance or expenses you paid for the period, but it can help you compare ongoing costs of investing in the Fund with those of other funds. To do so, compare this 5% hypothetical example for the class of shares you hold with the 5% hypothetical examples that appear in the shareholder reports of other funds.
Please note that expenses shown in the table are meant to highlight ongoing costs and do not reflect any transactional costs. Therefore, information under the heading “Hypothetical” is useful in comparing ongoing costs only, and will not help you compare total costs of owning different funds. In addition, if transactional costs were included, your total costs would have been higher.
| | | | | | | | | | | | |
| | | | | Actual (actual return after expenses) | | Hypothetical (5% annual return before expenses) | | |
| | | | | | | | |
Share Class | | Beginning
Account
Value 9/1/17 | | Ending
Account
Value 2/28/18 | | Expenses
Paid During
Period
9/1/17–2/28/181,2 | | Ending
Account
Value 2/28/18 | | Expenses
Paid During
Period
9/1/17–2/28/181,2 | | Net
Annualized
Expense
Ratio2 |
| | | | | | |
A | | $1,000 | | $992.00 | | $3.36 | | $1,021.42 | | $3.41 | | 0.68% |
C | | $1,000 | | $989.40 | | $6.07 | | $1,018.70 | | $6.16 | | 1.23% |
R6 | | $1,000 | | $992.70 | | $2.67 | | $1,022.12 | | $2.71 | | 0.54% |
Advisor | | $1,000 | | $992.50 | | $2.87 | | $1,021.82 | | $2.91 | | 0.58% |
1. Expenses are equal to the annualized expense ratio for the six-month period as indicated above—in the far right column—multiplied by the simple average account value over the period indicated, and then multiplied by 181/365 to reflect the one-half year period.
2. Reflects expenses after fee waivers and expense reimbursements, for Class R6.
| | | | | | | | |
franklintempleton.com | | | | | | Annual Report | | 33 |
Franklin Minnesota Tax-Free Income Fund
This annual report for Franklin Minnesota Tax-Free Income Fund covers the fiscal year ended February 28, 2018.
Your Fund’s Goal and Main Investments
The Fund seeks to provide as high a level of income exempt from federal and Minnesota personal income taxes as is consistent with prudent investment management and preservation of capital by investing at least 80% of its total assets in securities that pay interest free from such taxes.1
Credit Quality Composition*
2/28/18
| | |
| Ratings | | % of Total
Investments |
| |
AAA | | 10.87% |
| |
AA | | 67.24% |
| |
A | | 12.52% |
| |
Refunded | | 9.10% |
| |
Not Rated | | 0.27% |
*Securities, except for those labeled Not Rated, are assigned ratings by one or more Nationally Recognized Statistical Credit Rating Organizations (NRSROs), such as Standard & Poor’s, Moody’s and Fitch, that can be considered by the investment manager as part of its independent securities analysis. When ratings from multiple agencies are available, the highest is used, consistent with the portfolio investment process. Ratings reflect an NRSRO’s opinion of an issuer’s creditworthiness and typically range from AAA (highest) to D (lowest). The Below Investment Grade category consists of bonds rated below BBB-. The Refunded category generally consists of refunded bonds secured by US government or other high-quality securities and not rerated by an NRSRO. The Not Rated category consists of ratable securities that have not been rated by an NRSRO. Cash and equivalents are excluded from this composition.
Performance Overview
The Fund’s Class A share price, as measured by net asset value, decreased from $12.27 on February 28, 2017, to $12.07 on February 28, 2018. The Fund’s Class A shares paid dividends totaling 35.30 cents per share for the reporting period.2 The Performance Summary beginning on page 36 shows that at the end of this reporting period the Fund’s Class A shares’ distribution rate was 2.76% based on an annualization of February’s 2.90 cent per share dividend and the maximum offering price of $12.61 on February 28, 2018. An investor in the 2018 maximum combined effective federal and Minnesota personal income tax bracket of 50.65% (including 3.80%
Medicare tax) would need to earn a distribution rate of 5.59% from a taxable investment to match the Fund’s Class A tax-free distribution rate. For other performance data, please see the Performance Summary. Dividend distributions were affected by low interest rates during the period. This and other factors resulted in reduced income for the portfolio and caused dividends to be lower at the end of the period.
Dividend Distributions*
3/1/17–2/28/18
| | | | | | | | | | | | | | | | |
| | | Dividend per Share (cents) | |
| | | | |
| Month | | Class A | | | Class C | | | Class R6** | | | Advisor
Class | |
March | | | 3.00 | | | | 2.43 | | | | — | | | | 3.10 | |
April | | | 3.00 | | | | 2.43 | | | | — | | | | 3.10 | |
May | | | 3.00 | | | | 2.43 | | | | — | | | | 3.10 | |
June | | | 3.00 | | | | 2.42 | | | | — | | | | 3.10 | |
July | | | 3.00 | | | | 2.42 | | | | — | | | | 3.10 | |
August | | | 2.90 | | | | 2.32 | | | | 2.95 | | | | 3.00 | |
September | | | 2.90 | | | | 2.32 | | | | 3.05 | | | | 3.00 | |
October | | | 2.90 | | | | 2.32 | | | | 3.05 | | | | 3.00 | |
November | | | 2.90 | | | | 2.32 | | | | 3.05 | | | | 3.00 | |
December | | | 2.90 | | | | 2.32 | | | | 3.05 | | | | 3.00 | |
January | | | 2.90 | | | | 2.32 | | | | 3.05 | | | | 3.00 | |
February | | | 2.90 | | | | 2.32 | | | | 3.05 | | | | 3.00 | |
Total | | | 35.30 | | | | 28.37 | | | | 21.25 | | | | 36.50 | |
*The distribution amount is the sum of all net investment income distributions for the period shown. Assumes shares were purchased and held for the entire accrual period. Since dividends accrue daily, your actual distributions will vary depending on the date you purchased your shares and any account activity. All Fund distributions will vary depending upon current market conditions, and past distributions are not indicative of future trends.
**Effective 8/1/17, the Fund began offering Class R6 shares. See the prospectus for details.
Performance data represent past performance, which does not guarantee future results. Investment return and principal value will fluctuate, and you may have a gain or loss when you sell your shares. Current performance may differ from figures shown. For most recent month-end performance, go to franklintempleton.com or call (800) 342-5236.
1. For investors subject to alternative minimum tax, a small portion of Fund dividends may be taxable. Distributions of capital gains are generally taxable. To avoid imposition of 28% backup withholding on all Fund distributions and redemption proceeds, US investors must be properly certified on Form W-9 and non-US investors on Form W-8BEN.
2. The distribution amount is the sum of all net investment income distributions for the period shown. Assumes shares were purchased and held for the entire accrual period. Since dividends accrue daily, your actual distributions will vary depending on the date you purchased your shares and any account activity. All Fund distributions will vary depending upon current market conditions, and past distributions are not indicative of future trends.
The dollar value, number of shares or principal amount, and names of all portfolio holdings are listed in the Fund’s Statement of Investments (SOI).
The SOI begins on page 102.
| | | | |
34 | | Annual Report | | franklintempleton.com |
FRANKLIN MINNESOTA TAX-FREE INCOME FUND
State Update
Minnesota’s broad-based economy expanded during the 12 months under review, although growth continued to lag that of the national rate. The state’s unemployment rate moved from 3.7% in February 2017 to 3.2% at period-end, significantly lower than the 4.1% national average.3 Overall, the state’s labor force participation improved during the review period. Home prices and building permits in the state rose, while foreclosure rates remained lower than the national rate.
The state ended its fiscal year 2017 on June 30, 2017, with net general fund receipts relatively unchanged from February 2017 revenue forecasts, as lower-than-expected individual income tax receipts were offset by higher-than-expected corporate franchise and general sales and use tax and other revenue receipts. The enacted budget for the 2018–2019 biennium is balanced and includes increased spending in education, health and human services, transportation and public safety. Additionally, it also included increased funding to local government and county program aid. The budget outlook for 2018–2019 improved with a revision in February 2018, as revenue forecasts increased for individual income, general sales, corporate and other tax revenue. The projected revenues were estimated to exceed higher spending over 2018–2019.
Minnesota’s net tax-supported debt was 2.9% of personal income and $1,480 per capita, compared with the national medians of 2.5% and $1,006, respectively.4 Independent credit rating agency Moody’s Investors Service assigned an Aa1 rating with a stable outlook on Minnesota’s general obligation debt, citing the state’s strong and growing economy supporting healthy revenue growth in recent years, strong financial management that resulted in replenishment of budget reserves and sound management practices.5 According to Moody’s, some of Minnesota’s challenges include a history of budgetary gridlocks and a slight slowdown in personal income tax growth. Overall, the rating agency believes Minnesota’s economic fundamentals to be strong.
| | |
| Portfolio Composition | | |
2/28/18 | | |
| |
| | | % of Total
Investments* |
General Obligation | | 30.3% |
Hospital & Health Care | | 16.9% |
Refunded** | | 16.5% |
Utilities | | 14.8% |
Transportation | | 7.0% |
Higher Education | | 6.9% |
Housing | | 3.3% |
Subject to Government Appropriations | | 3.1% |
Other Revenue | | 1.0% |
Tax-Supported | | 0.2% |
*Does not include cash and cash equivalents.
**Includes all refunded bonds; the percentage may differ from that in the Credit Quality Composition.
Manager’s Discussion
We used various investment strategies during the 12 months under review as we sought to maximize tax-free income for shareholders. Please read the Investment Strategy and Manager’s Discussion on page 5 for more information.
Thank you for your continued participation in Franklin Minnesota Tax-Free Income Fund. We believe our conservative, buy-and-hold investment strategy can help us achieve high, current, tax-free income for shareholders.
The foregoing information reflects our analysis, opinions and portfolio holdings as of February 28, 2018, the end of the reporting period. The way we implement our main investment strategies and the resulting portfolio holdings may change depending on factors such as market and economic conditions. These opinions may not be relied upon as investment advice or an offer for a particular security. The information is not a complete analysis of every aspect of any market, state, industry, security or the Fund. Statements of fact are from sources considered reliable, but the investment manager makes no representation or warranty as to their completeness or accuracy. Although historical performance is no guarantee of future results, these insights may help you understand our investment management philosophy.
3. Source: Bureau of Labor Statistics.
4. Source: Moody’s Investors Service, State Government – US: Medians – Total Debt Remains Essentially Flat in 2017, 5/3/17.
5. This does not indicate Moody’s rating of the Fund.
| | | | | | | | |
franklintempleton.com | | | | | | Annual Report | | 35 |
FRANKLIN MINNESOTA TAX-FREE INCOME FUND
Performance Summary as of February 28, 2018
The performance tables and graphs do not reflect any taxes that a shareholder would pay on Fund dividends, capital gain distributions, if any, or any realized gains on the sale of Fund shares. Total return reflects reinvestment of the Fund’s dividends and capital gain distributions, if any, and any unrealized gains or losses. Your dividend income will vary depending on dividends or interest paid by securities in the Fund’s portfolio, adjusted for operating expenses of each class. Capital gain distributions are net profits realized from the sale of portfolio securities.
Performance as of 2/28/18
Cumulative total return excludes sales charges. Average annual total return includes maximum sales charges. Sales charges will vary depending on the size of the investment and the class of share purchased. The maximum is 4.25% and the minimum is 0%. Class A: 4.25% maximum initial sales charge; Advisor Class: no sales charges. For other share classes, visit franklintempleton.com.
| | | | |
| Share Class | | Cumulative
Total Return1 | | Average Annual
Total Return2 |
| | |
A | | | | |
1-Year | | +1.23% | | -3.04% |
5-Year | | +8.52% | | +0.76% |
10-Year | | +47.83% | | +3.54% |
| | |
Advisor3 | | | | |
1-Year | | +1.41% | | +1.41% |
5-Year | | +9.13% | | +1.76% |
10-Year | | +49.31% | | +4.09% |
| | | | | | | | |
| Share Class | | Distribution
Rate4 | | Taxable Equivalent
Distribution Rate5 | | 30-Day
Standardized Yield6 | | Taxable Equivalent 30-Day
Standardized Yield5 |
A | | 2.76% | | 5.59% | | 1.72% | | 3.49% |
Advisor | | 2.98% | | 6.04% | | 1.90% | | 3.85% |
Performance data represent past performance, which does not guarantee future results. Investment return and principal value will fluctuate, and you may have a gain or loss when you sell your shares. Current performance may differ from figures shown. For most recent month-end performance, go to franklintempleton.com or call (800) 342-5236.
See page 39 for Performance Summary footnotes.
| | | | | | |
36 | | Annual Report | | | | franklintempleton.com |
FRANKLIN MINNESOTA TAX-FREE INCOME FUND
PERFORMANCE SUMMARY
Total Return Index Comparison for a Hypothetical $10,000 Investment
Total return represents the change in value of an investment over the periods shown. It includes any applicable maximum sales charge, Fund expenses, account fees and reinvested distributions. The unmanaged indexes include reinvestment of any income or distributions. They differ from the Fund in composition and do not pay management fees or expenses. One cannot invest directly in an index.
Class A (3/1/08–2/28/18)
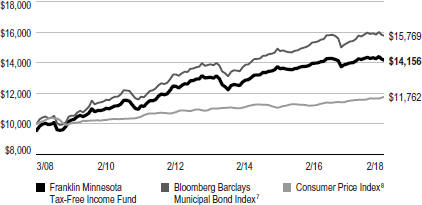
Advisor Class (3/1/08–2/28/18)3
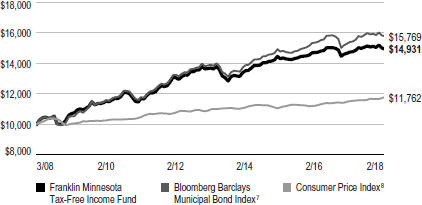
See page 39 for Performance Summary footnotes.
| | | | | | | | |
franklintempleton.com | | | | | | Annual Report | | 37 |
FRANKLIN MINNESOTA TAX-FREE INCOME FUND
PERFORMANCE SUMMARY
Net Asset Value
| | | | | | | | | | | | | | | | |
| Share Class (Symbol) | | 2/28/18 | | | 8/1/17 | | | 2/28/17 | | | Change | |
A (FMINX) | | | $12.07 | | | | N/A | | | | $12.27 | | | | -$0.20 | |
C (FMNIX) | | | $12.21 | | | | N/A | | | | $12.40 | | | | -$0.19 | |
R6 (FKTDX) | | | $12.09 | | | | $12.40 | | | | N/A | | | | -$0.31 | |
Advisor (FMNZX) | | | $12.09 | | | | N/A | | | | $12.28 | | | | -$0.19 | |
Distributions (3/1/17–2/28/18)
| | | | |
| Share Class | | Net Investment
Income | |
| |
A | | | $0.3530 | |
| |
C | | | $0.2837 | |
| |
R6 (8/1/17–2/28/18) | | | $0.2125 | |
| |
Advisor | | | $0.3650 | |
Total Annual Operating Expenses9
| | | | |
| Share Class | | | |
| |
A | | | 0.65% | |
| |
Advisor | | | 0.55% | |
| | | | | | |
38 | | Annual Report | | | | franklintempleton.com |
FRANKLIN MINNESOTA TAX-FREE INCOME FUND
PERFORMANCE SUMMARY
Each class of shares is available to certain eligible investors and has different annual fees and expenses, as described in the prospectus.
All investments involve risks, including possible loss of principal. Because municipal bonds are sensitive to interest rate movements, the Fund’s yield and share price will fluctuate with market conditions. Bond prices generally move in the opposite direction of interest rates. Thus, as prices of bonds in the Fund adjust to a rise in interest rates, the Fund’s share price may decline. Because the Fund invests principally in a single state, it is subject to greater risk of adverse economic and regulatory changes in that state than a geographically diversified fund. Changes in the credit rating of a bond, or in the credit rating or financial strength of a bond’s issuer, insurer or guarantor, may affect the bond’s value. The Fund may invest a significant part of its assets in municipal securities that finance similar types of projects, such as utilities, hospitals, higher education and transportation. A change that affects one project would likely affect all similar projects, thereby increasing market risk. The Fund is actively managed but there is no guarantee that the manager’s investment decisions will produce the desired results. The Fund’s prospectus also includes a description of the main investment risks.
1. Cumulative total return represents the change in value of an investment over the periods indicated.
2. Average annual total return represents the average annual change in value of an investment over the periods indicated. Return for less than one year, if any, has not been annualized.
3. Effective 7/1/09, the Fund began offering Advisor Class shares, which do not have sales charges or a Rule 12b-1 plan. Performance quotations for this class reflect the following methods of calculation: (a) For periods prior to 7/1/09, a restated figure is used based upon the Fund’s Class A performance, excluding the effect of Class A’s maximum initial sales charge, but reflecting the effect of the Class A Rule 12b-1 fees; and (b) for periods after 7/1/09, actual Advisor Class performance is used reflecting all charges and fees applicable to that class. Since 7/1/09 (commencement of sales), the cumulative and average annual total returns of Advisor Class shares were +36.47% and +3.65%.
4. Distribution rate is based on an annualization of the respective class’s February dividend and the maximum offering price (NAV for Advisor Class) per share on 2/28/18.
5. Taxable equivalent distribution rate and yield assume the published rates as of 1/15/18 for the maximum combined effective federal and Minnesota personal income tax rate of 50.65%, based on the federal income tax rate of 37.00% plus 3.80% Medicare tax.
6. The Fund’s 30-day standardized yield is calculated over a trailing 30-day period using the yield to maturity on bonds and/or the dividends accrued on stocks. It may not equal the Fund’s actual income distribution rate, which reflects the Fund’s past dividends paid to shareholders.
7. Source: Morningstar. The Bloomberg Barclays Municipal Bond Index is a market value-weighted index engineered for the long-term tax-exempt bond market. To be included in the index, bonds must be fixed rate, have at least one year to final maturity and be rated investment grade (Baa3/BBB- or higher) by at least two of the following agencies: Moody’s, S&P and Fitch.
8. Source: Bureau of Labor Statistics, bls.gov/cpi. The Consumer Price Index is a commonly used measure of the inflation rate.
9. Figures are as stated in the Fund’s current prospectus and may differ from the expense ratios disclosed in the Your Fund’s Expenses and Financial Highlights sections in this report. In periods of market volatility, assets may decline significantly, causing total annual Fund operating expenses to become higher than the figures shown.
See www.franklintempletondatasources.com for additional data provider information.
| | | | | | | | |
franklintempleton.com | | | | | | Annual Report | | 39 |
FRANKLIN MINNESOTA TAX-FREE INCOME FUND
Your Fund’s Expenses
As a Fund shareholder, you can incur two types of costs: (1) transaction costs, including sales charges (loads) on Fund purchases and redemptions; and (2) ongoing Fund costs, including management fees, distribution and service (12b-1) fees, and other Fund expenses. All mutual funds have ongoing costs, sometimes referred to as operating expenses. The table below shows ongoing costs of investing in the Fund and can help you understand these costs and compare them with those of other mutual funds. The table assumes a $1,000 investment held for the six months indicated.
Actual Fund Expenses
The table below provides information about actual account values and actual expenses in the columns under the heading “Actual.” In these columns the Fund’s actual return, which includes the effect of Fund expenses, is used to calculate the “Ending Account Value” for each class of shares. You can estimate the expenses you paid during the period by following these steps (of course, your account value and expenses will differ from those in this illustration): Divide your account value by $1,000 (if your account had an $8,600 value, then $8,600 ÷ $1,000 = 8.6). Then multiply the result by the number in the row for your class of shares under the headings “Actual” and “Expenses Paid During Period” (if Actual Expenses Paid During Period were $7.50, then 8.6 x $7.50 = $64.50). In this illustration, the actual expenses paid this period are $64.50.
Hypothetical Example for Comparison with Other Funds
Under the heading “Hypothetical” in the table, information is provided about hypothetical account values and hypothetical expenses based on the Fund’s actual expense ratio and an assumed rate of return of 5% per year before expenses, which is not the Fund’s actual return. This information may not be used to estimate the actual ending account balance or expenses you paid for the period, but it can help you compare ongoing costs of investing in the Fund with those of other funds. To do so, compare this 5% hypothetical example for the class of shares you hold with the 5% hypothetical examples that appear in the shareholder reports of other funds.
Please note that expenses shown in the table are meant to highlight ongoing costs and do not reflect any transactional costs. Therefore, information under the heading “Hypothetical” is useful in comparing ongoing costs only, and will not help you compare total costs of owning different funds. In addition, if transactional costs were included, your total costs would have been higher.
| | | | | | | | | | | | |
| | | | | Actual (actual return after expenses) | | Hypothetical (5% annual return before expenses) | | |
| | | | | | | | |
Share Class | | Beginning
Account
Value 9/1/17 | | Ending
Account
Value 2/28/18 | | Expenses
Paid During
Period
9/1/17–2/28/181,2 | | Ending
Account
Value 2/28/18 | | Expenses
Paid During
Period
9/1/17–2/28/181,2 | | Net
Annualized
Expense
Ratio2 |
| | | | | | |
A | | $1,000 | | $986.50 | | $3.40 | | $1,021.37 | | $3.46 | | 0.69% |
C | | $1,000 | | $983.90 | | $6.10 | | $1,018.65 | | $6.21 | | 1.24% |
R6 | | $1,000 | | $987.30 | | $2.56 | | $1,022.22 | | $2.61 | | 0.52% |
Advisor | | $1,000 | | $987.00 | | $2.91 | | $1,021.87 | | $2.96 | | 0.59% |
1. Expenses are equal to the annualized expense ratio for the six-month period as indicated above—in the far right column—multiplied by the simple average account value over the period indicated, and then multiplied by 181/365 to reflect the one-half year period.
2. Reflects expenses after fee waivers and expense reimbursements, for Class R6.
| | | | | | |
40 | | Annual Report | | | | franklintempleton.com |
Franklin Ohio Tax-Free Income Fund
This annual report for Franklin Ohio Tax-Free Income Fund covers the fiscal year ended February 28, 2018.
Your Fund’s Goal and Main Investments
The Fund seeks to provide as high a level of income exempt from federal and Ohio personal income taxes as is consistent with prudent investment management and preservation of capital by investing at least 80% of its total assets in securities that pay interest free from such taxes.1
Credit Quality Composition*
2/28/18
| | |
| Ratings | | % of Total
Investments |
| |
AAA | | 10.95% |
| |
AA | | 61.06% |
| |
A | | 12.55% |
| |
BBB | | 0.54% |
| |
Refunded | | 14.90% |
*Securities, except for those labeled Not Rated, are assigned ratings by one or more Nationally Recognized Statistical Credit Rating Organizations (NRSROs), such as Standard & Poor’s, Moody’s and Fitch, that can be considered by the investment manager as part of its independent securities analysis. When ratings from multiple agencies are available, the highest is used, consistent with the portfolio investment process. Ratings reflect an NRSRO’s opinion of an issuer’s creditworthiness and typically range from AAA (highest) to D (lowest). The Below Investment Grade category consists of bonds rated below BBB-. The Refunded category generally consists of refunded bonds secured by US government or other high-quality securities and not rerated by an NRSRO. The Not Rated category consists of ratable securities that have not been rated by an NRSRO. Cash and equivalents are excluded from this composition.
Performance Overview
The Fund’s Class A share price, as measured by net asset value, decreased from $12.56 on February 28, 2017, to $12.46 on February 28, 2018. The Fund’s Class A shares paid dividends totaling 38.46 cents per share for the reporting period.2 The Performance Summary beginning on page 43 shows that at the end of this reporting period the Fund’s Class A shares’ distribution rate was 2.93% based on an annualization of February’s 3.18 cent per share dividend and the maximum offering price of $13.01 on February 28, 2018. An investor in the 2018 maximum combined effective federal and Ohio personal income tax bracket of 45.80% (including 3.80% Medicare tax) would need to earn a distribution rate of 5.41%
Dividend Distributions*
3/1/17–2/28/18
| | | | | | | | | | | | | | | | |
| | | Dividend per Share (cents) | |
| | | | |
| Month | | Class A | | | Class C | | | Class R6** | | | Advisor
Class | |
March | | | 3.28 | | | | 2.69 | | | | — | | | | 3.38 | |
April | | | 3.28 | | | | 2.69 | | | | — | | | | 3.38 | |
May | | | 3.28 | | | | 2.69 | | | | — | | | | 3.38 | |
June | | | 3.18 | | | | 2.59 | | | | — | | | | 3.28 | |
July | | | 3.18 | | | | 2.59 | | | | — | | | | 3.28 | |
August | | | 3.18 | | | | 2.59 | | | | 3.21 | | | | 3.28 | |
September | | | 3.18 | | | | 2.58 | | | | 3.32 | | | | 3.28 | |
October | | | 3.18 | | | | 2.58 | | | | 3.32 | | | | 3.28 | |
November | | | 3.18 | | | | 2.58 | | | | 3.32 | | | | 3.28 | |
December | | | 3.18 | | | | 2.58 | | | | 3.32 | | | | 3.28 | |
January | | | 3.18 | | | | 2.58 | | | | 3.32 | | | | 3.28 | |
February | | | 3.18 | | | | 2.58 | | | | 3.32 | | | | 3.28 | |
Total | | | 38.46 | | | | 31.32 | | | | 23.13 | | | | 39.66 | |
*The distribution amount is the sum of all net investment income distributions for the period shown. Assumes shares were purchased and held for the entire accrual period. Since dividends accrue daily, your actual distributions will vary depending on the date you purchased your shares and any account activity. All Fund distributions will vary depending upon current market conditions, and past distributions are not indicative of future trends.
**Effective 8/1/17, the Fund began offering Class R6 shares. See the prospectus for details.
from a taxable investment to match the Fund’s Class A tax-free distribution rate. For other performance data, please see the Performance Summary. Dividend distributions were affected by low interest rates during the period. This and other factors resulted in reduced income for the portfolio and caused dividends to be lower at the end of the period.
Performance data represent past performance, which does not guarantee future results. Investment return and principal value will fluctuate, and you may have a gain or loss when you sell your shares. Current performance may differ from figures shown. For most recent month-end performance, go to franklintempleton.com or call (800) 342-5236.
State Update
Ohio’s broad and diverse economy continued to expand during the period under review. The state’s housing market improved as home sales increased and home prices rose. However,
1. For investors subject to alternative minimum tax, a small portion of Fund dividends may be taxable. Distributions of capital gains are generally taxable. To avoid imposition of 28% backup withholding on all Fund distributions and redemption proceeds, US investors must be properly certified on Form W-9 and non-US investors on Form W-8BEN.
2. The distribution amount is the sum of all net investment income distributions for the period shown. Assumes shares were purchased and held for the entire accrual period. Since dividends accrue daily, your actual distributions will vary depending on the date you purchased your shares and any account activity. All Fund distributions will vary depending upon current market conditions, and past distributions are not indicative of future trends.
The dollar value, number of shares or principal amount, and names of all portfolio holdings are listed in the Fund’s Statement of Investments (SOI).
The SOI begins on page 113.
| | | | | | | | |
franklintempleton.com | | | | | | Annual Report | | 41 |
FRANKLIN OHIO TAX-FREE INCOME FUND
population growth remained slow and while employers in the state have added jobs, they have been doing it at a slower pace than the US economy. Ohio’s unemployment rate decreased from 5.1% in February 2017 to 4.5% by period-end, which was higher than the national rate of 4.1%.3
The state ended fiscal year 2017 on June 30, 2017, with a relatively balanced budget, despite lower-than-projected income and sales tax revenues, which were offset by lower-than-expected Medicaid spending. However, the general fund balance for FY 2017 was lower-than-estimated. Ohio’s adopted FY 2018–2019 biennium budget was largely balanced and incorporated a mix of targeted and across-the-board cuts and modestly increased non-recurring resources relative to the proposed budget. The budget continued to build upon previously enacted tax reforms, such as providing simplification of the small-business tax filing process, reducing the number of income tax brackets, increased funding for K-12 education, and support for developmental disabilities, higher education, health and human services and Medicaid. Through January 2018, the year-to-date FY 2018 general revenue fund receipts were higher than estimated, primarily due to higher personal income tax receipts, auto sales taxes and commercial activity taxes. Ohio has a strong history of implementing budget adjustments regularly and on a timely basis.
Ohio’s net tax-supported debt was $1,087 per capita and 2.5% of personal income compared with the $1,006 and 2.5% national medians, respectively.4 Independent credit rating agency Standard & Poor’s (S&P) affirmed Ohio’s AA+ general obligation debt rating with a stable outlook.5 The rating reflected S&P’s view of Ohio’s long history of proactive financial and budget management, including frequent and prompt budget modifications to offset decreased revenue. The rating also reflected S&P’s view of the state’s commitment to funding budget reserves, improved revenue and budget performance, renewal of the budget stabilization fund, moderate debt levels, and significant pension reform changes coupled with a steady progress in funding other postem-ployment benefits. In S&P’s view, the stable outlook reflected Ohio’s improved structural budget alignment and steady economic growth that has allowed recent contributions to its budget stabilization fund.
| | |
| Portfolio Composition | | |
2/28/18 | | |
| |
| | | % of Total
Investments* |
General Obligation | | 34.8% |
Refunded** | | 19.9% |
Utilities | | 12.2% |
Higher Education | | 11.5% |
Hospital & Health Care | | 9.5% |
Transportation | | 5.2% |
Subject to Government Appropriations | | 3.0% |
Other Revenue | | 2.7% |
Tax-Supported | | 0.8% |
Housing | | 0.4% |
*Does not include cash and cash equivalents.
**Includes all refunded bonds; the percentage may differ from that in the Credit Quality Composition.
Manager’s Discussion
We used various investment strategies during the 12 months under review as we sought to maximize tax-free income for shareholders. Please read the Investment Strategy and Manager’s Discussion on page 5 for more information.
Thank you for your continued participation in Franklin Ohio Tax-Free Income Fund. We believe our conservative, buy-and-hold investment strategy can help us achieve high, current, tax-free income for shareholders.
The foregoing information reflects our analysis, opinions and portfolio holdings as of February 28, 2018, the end of the reporting period. The way we implement our main investment strategies and the resulting portfolio holdings may change depending on factors such as market and economic conditions. These opinions may not be relied upon as investment advice or an offer for a particular security. The information is not a complete analysis of every aspect of any market, state, industry, security or the Fund. Statements of fact are from sources considered reliable, but the investment manager makes no representation or warranty as to their completeness or accuracy. Although historical performance is no guarantee of future results, these insights may help you understand our investment management philosophy.
3. Source: Bureau of Labor Statistics.
4. Source: Moody’s Investors Service, State Government - US: Medians - Total State Debt Remains Essentially Flat in 2017, 5/3/17
5. This does not indicate S&P’s rating of the Fund.
| | | | | | |
42 | | Annual Report | | | | franklintempleton.com |
FRANKLIN OHIO TAX-FREE INCOME FUND
Performance Summary as of February 28, 2018
The performance tables and graphs do not reflect any taxes that a shareholder would pay on Fund dividends, capital gain distributions, if any, or any realized gains on the sale of Fund shares. Total return reflects reinvestment of the Fund’s dividends and capital gain distributions, if any, and any unrealized gains or losses. Your dividend income will vary depending on dividends or interest paid by securities in the Fund’s portfolio, adjusted for operating expenses of each class. Capital gain distributions are net profits realized from the sale of portfolio securities.
Performance as of 2/28/18
Cumulative total return excludes sales charges. Average annual total return includes maximum sales charges. Sales charges will vary depending on the size of the investment and the class of share purchased. The maximum is 4.25% and the minimum is 0%. Class A: 4.25% maximum initial sales charge; Advisor Class: no sales charges. For other share classes, visit franklintempleton.com.
| | | | |
| Share Class | | Cumulative
Total Return1 | | Average Annual
Total Return2 |
| | |
A | | | | |
1-Year | | +2.26% | | -2.10% |
5-Year | | +12.64% | | +1.53% |
10-Year | | +51.82% | | +3.81% |
| | |
Advisor3 | | | | |
1-Year | | +2.36% | | +2.36% |
5-Year | | +13.26% | | +2.52% |
10-Year | | +53.37% | | +4.37% |
| | | | | | | | |
| Share Class | | Distribution
Rate4 | | Taxable Equivalent
Distribution Rate5 | | 30-Day
Standardized Yield6 | | Taxable Equivalent 30-Day
Standardized Yield5 |
| | | | |
A | | 2.93% | | 5.41% | | 1.89% | | 3.49% |
| | | | |
Advisor | | 3.16% | | 5.83% | | 2.07% | | 3.82% |
Performance data represent past performance, which does not guarantee future results. Investment return and principal value will fluctuate, and you may have a gain or loss when you sell your shares. Current performance may differ from figures shown. For most recent month-end performance, go to franklintempleton.com or call (800) 342-5236.
See page 46 for Performance Summary footnotes.
| | | | | | | | |
franklintempleton.com | | | | | | Annual Report | | 43 |
FRANKLIN OHIO TAX-FREE INCOME FUND
PERFORMANCE SUMMARY
Total Return Index Comparison for a Hypothetical $10,000 Investment
Total return represents the change in value of an investment over the periods shown. It includes any applicable maximum sales charge, Fund expenses, account fees and reinvested distributions. The unmanaged indexes include reinvestment of any income or distributions. They differ from the Fund in composition and do not pay management fees or expenses. One cannot invest directly in an index.
Class A (3/1/08–2/28/18)
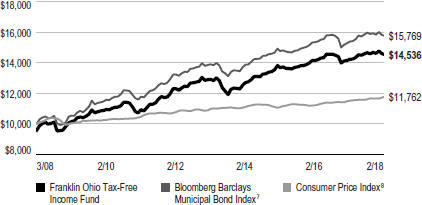
Advisor Class (3/1/08–2/28/18)3
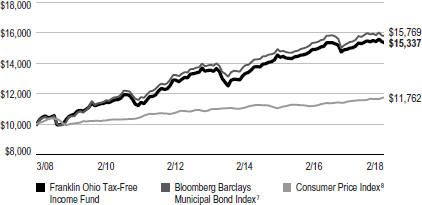
See page 46 for Performance Summary footnotes.
| | | | | | |
44 | | Annual Report | | | | franklintempleton.com |
FRANKLIN OHIO TAX-FREE INCOME FUND
PERFORMANCE SUMMARY
Net Asset Value
| | | | | | | | | | | | | | | | |
| Share Class (Symbol) | | 2/28/18 | | | 8/1/17 | | | 2/28/17 | | | Change | |
A (FTOIX) | | | $12.46 | | | | N/A | | | | $12.56 | | | | -$0.10 | |
C (FOITX) | | | $12.63 | | | | N/A | | | | $12.72 | | | | -$0.09 | |
R6 (FKTOX) | | | $12.47 | | | | $12.73 | | | | N/A | | | | -$0.26 | |
Advisor (FROZX) | | | $12.47 | | | | N/A | | | | $12.57 | | | | -$0.10 | |
Distributions (3/1/17–2/28/18)
| | | | |
| Share Class | | Net Investment
Income | |
| |
A | | | $0.3846 | |
| |
C | | | $0.3132 | |
| |
R6 (8/1/17–2/28/18) | | | $0.2313 | |
| |
Advisor | | | $0.3966 | |
Total Annual Operating Expenses9
| | | | |
| Share Class | | | |
| |
A | | | 0.63% | |
| |
Advisor | | | 0.53% | |
| | | | | | | | |
franklintempleton.com | | | | | | Annual Report | | 45 |
FRANKLIN OHIO TAX-FREE INCOME FUND
PERFORMANCE SUMMARY
Each class of shares is available to certain eligible investors and has different annual fees and expenses, as described in the prospectus.
All investments involve risks, including possible loss of principal. Because municipal bonds are sensitive to interest rate movements, the Fund’s yield and share price will fluctuate with market conditions. Bond prices generally move in the opposite direction of interest rates. Thus, as prices of bonds in the Fund adjust to a rise in interest rates, the Fund’s share price may decline. Because the Fund invests principally in a single state, it is subject to greater risk of adverse economic and regulatory changes in that state than a geographically diversified fund. Changes in the credit rating of a bond, or in the credit rating or financial strength of a bond’s issuer, insurer or guarantor, may affect the bond’s value. The Fund may invest a significant part of its assets in municipal securities that finance similar types of projects, such as utilities, hospitals, higher education and transportation. A change that affects one project would likely affect all similar projects, thereby increasing market risk. The Fund is actively managed but there is no guarantee that the manager’s investment decisions will produce the desired results. The Fund’s prospectus also includes a description of the main investment risks.
1. Cumulative total return represents the change in value of an investment over the periods indicated.
2. Average annual total return represents the average annual change in value of an investment over the periods indicated. Return for less than one year, if any, has not been annualized.
3. Effective 7/1/08, the Fund began offering Advisor Class shares, which do not have sales charges or a Rule 12b-1 plan. Performance quotations for this class reflect the following methods of calculation: (a) For periods prior to 7/1/08, a restated figure is used based upon the Fund’s Class A performance, excluding the effect of Class A’s maximum initial sales charge, but reflecting the effect of the Class A Rule 12b-1 fees; and (b) for periods after 7/1/08, actual Advisor Class performance is used reflecting all charges and fees applicable to that class. Since 7/1/08 (commencement of sales), the cumulative and average annual total returns of Advisor Class shares were +46.82% and +4.05%.
4. Distribution rate is based on an annualization of the respective class’s February dividend and the maximum offering price (NAV for Advisor Class) per share on 2/28/18.
5. Taxable equivalent distribution rate and yield assume the published rates as of 1/15/18 for the maximum combined effective federal and Ohio personal income tax rate of 45.80%, based on the federal income tax rate of 37.00% plus 3.80% Medicare tax.
6. The Fund’s 30-day standardized yield is calculated over a trailing 30-day period using the yield to maturity on bonds and/or the dividends accrued on stocks. It may not equal the Fund’s actual income distribution rate, which reflects the Fund’s past dividends paid to shareholders.
7. Source: Morningstar. The Bloomberg Barclays Municipal Bond Index is a market value-weighted index engineered for the long-term tax-exempt bond market. To be included in the index, bonds must be fixed rate, have at least one year to final maturity and be rated investment grade (Baa3/BBB- or higher) by at least two of the following agencies: Moody’s, S&P or Fitch.
8. Source: Bureau of Labor Statistics, bls.gov/cpi. The Consumer Price Index is a commonly used measure of the inflation rate.
9. Figures are as stated in the Fund’s current prospectus and may differ from the expense ratios disclosed in the Your Funds’ Expenses and Financial Highlights sections in this report. In periods of market volatility, assets may decline significantly, causing total annual Fund operating expenses to become higher than the figures shown.
See www.franklintempletondatasources.com for additional data provider information.
| | | | | | |
46 | | Annual Report | | | | franklintempleton.com |
FRANKLIN OHIO TAX-FREE INCOME FUND
Your Fund’s Expenses
As a Fund shareholder, you can incur two types of costs: (1) transaction costs, including sales charges (loads) on Fund purchases and redemptions; and (2) ongoing Fund costs, including management fees, distribution and service (12b-1) fees, and other Fund expenses. All mutual funds have ongoing costs, sometimes referred to as operating expenses. The table below shows ongoing costs of investing in the Fund and can help you understand these costs and compare them with those of other mutual funds. The table assumes a $1,000 investment held for the six months indicated.
Actual Fund Expenses
The table below provides information about actual account values and actual expenses in the columns under the heading “Actual.” In these columns the Fund’s actual return, which includes the effect of Fund expenses, is used to calculate the “Ending Account Value” for each class of shares. You can estimate the expenses you paid during the period by following these steps (of course, your account value and expenses will differ from those in this illustration): Divide your account value by $1,000 (if your account had an $8,600 value, then $8,600 ÷ $1,000 = 8.6). Then multiply the result by the number in the row for your class of shares under the headings “Actual” and “Expenses Paid During Period” (if Actual Expenses Paid During Period were $7.50, then 8.6 x $7.50 = $64.50). In this illustration, the actual expenses paid this period are $64.50.
Hypothetical Example for Comparison with Other Funds
Under the heading “Hypothetical” in the table, information is provided about hypothetical account values and hypothetical expenses based on the Fund’s actual expense ratio and an assumed rate of return of 5% per year before expenses, which is not the Fund’s actual return. This information may not be used to estimate the actual ending account balance or expenses you paid for the period, but it can help you compare ongoing costs of investing in the Fund with those of other funds. To do so, compare this 5% hypothetical example for the class of shares you hold with the 5% hypothetical examples that appear in the shareholder reports of other funds.
Please note that expenses shown in the table are meant to highlight ongoing costs and do not reflect any transactional costs. Therefore, information under the heading “Hypothetical” is useful in comparing ongoing costs only, and will not help you compare total costs of owning different funds. In addition, if transactional costs were included, your total costs would have been higher.
| | | | | | | | | | | | |
| | | | | Actual (actual return after expenses) | | Hypothetical (5% annual return before expenses) | | |
| | | | | | | | |
Share Class | | Beginning
Account
Value 9/1/17 | | Ending
Account
Value 2/28/18 | | Expenses
Paid During
Period
9/1/17–2/28/181,2 | | Ending
Account
Value 2/28/18 | | Expenses
Paid During
Period
9/1/17–2/28/181,2 | | Net
Annualized
Expense
Ratio2 |
| | | | | | |
A | | $1,000 | | $992.10 | | $3.26 | | $1,021.52 | | $3.31 | | 0.66% |
C | | $1,000 | | $989.50 | | $5.97 | | $1,018.79 | | $6.06 | | 1.21% |
R6 | | $1,000 | | $992.80 | | $2.52 | | $1,022.27 | | $2.56 | | 0.51% |
Advisor | | $1,000 | | $991.80 | | $2.77 | | $1,022.02 | | $2.81 | | 0.56% |
1. Expenses are equal to the annualized expense ratio for the six-month period as indicated above—in the far right column—multiplied by the simple average account value over the period indicated, and then multiplied by 181/365 to reflect the one-half year period.
2. Reflects expenses after fee waivers and expense reimbursements, for Class R6.
| | | | | | | | |
franklintempleton.com | | | | | | Annual Report | | 47 |
Franklin Oregon Tax-Free Income Fund
This annual report for Franklin Oregon Tax-Free Income Fund covers the fiscal year ended February 28, 2018.
Your Fund’s Goal and Main Investments
The Fund seeks to provide as high a level of income exempt from federal and Oregon personal income taxes as is consistent with prudent investment management and preservation of capital by investing at least 80% of its net assets in securities that pay interest free from such taxes.1
Credit Quality Composition*
2/28/18
| | |
| Ratings | | % of Total
Investments |
| |
AAA | | 12.65% |
| |
AA | | 55.85% |
| |
A | | 14.02% |
| |
BBB | | 4.56% |
| |
Below Investment Grade | | 1.38% |
| |
Refunded | | 11.54% |
*Securities, except for those labeled Not Rated, are assigned ratings by one or more Nationally Recognized Statistical Credit Rating Organizations (NRSROs), such as Standard & Poor’s, Moody’s and Fitch, that can be considered by the investment manager as part of its independent securities analysis. When ratings from multiple agencies are available, the highest is used, consistent with the portfolio investment process. Ratings reflect an NRSRO’s opinion of an issuer’s creditworthiness and typically range from AAA (highest) to D (lowest). The Below Investment Grade category consists of bonds rated below BBB-. The Refunded category generally consists of refunded bonds secured by US government or other high-quality securities and not rerated by an NRSRO. The Not Rated category consists of ratable securities that have not been rated by an NRSRO. Cash and equivalents are excluded from this composition.
Performance Overview
The Fund’s Class A share price, as measured by net asset value, decreased from $11.60 on February 28, 2017, to $11.37 on February 28, 2018. The Fund’s Class A shares paid dividends totaling 38.08 cents per share for the reporting period.2 The Performance Summary beginning on page 51 shows that at the end of this reporting period the Fund’s Class A shares’ distribution rate was 3.04% based on an annualization of February’s 3.01 cent per share dividend and the maximum offering price of $11.87 on February 28, 2018. An investor in the 2018 maximum combined effective federal and Oregon
Dividend Distributions*
3/1/17–2/28/18
| | | | | | | | | | | | | | | | |
| | | Dividend per Share (cents) | |
| | | | |
| Month | | Class A | | | Class C | | | Class R6** | | | Advisor
Class | |
March | | | 3.31 | | | | 2.77 | | | | — | | | | 3.40 | |
April | | | 3.36 | | | | 2.82 | | | | — | | | | 3.45 | |
May | | | 3.36 | | | | 2.82 | | | | — | | | | 3.45 | |
June | | | 3.27 | | | | 2.73 | | | | — | | | | 3.36 | |
July | | | 3.21 | | | | 2.67 | | | | — | | | | 3.30 | |
August | | | 3.11 | | | | 2.57 | | | | 3.12 | | | | 3.20 | |
September | | | 3.11 | | | | 2.56 | | | | 3.23 | | | | 3.20 | |
October | | | 3.11 | | | | 2.56 | | | | 3.23 | | | | 3.20 | |
November | | | 3.11 | | | | 2.56 | | | | 3.23 | | | | 3.20 | |
December | | | 3.11 | | | | 2.57 | | | | 3.23 | | | | 3.20 | |
January | | | 3.01 | | | | 2.47 | | | | 3.13 | | | | 3.10 | |
February | | | 3.01 | | | | 2.47 | | | | 3.13 | | | | 3.10 | |
Total | | | 38.08 | | | | 31.57 | | | | 22.30 | | | | 39.16 | |
*The distribution amount is the sum of all net investment income distributions for the period shown. Assumes shares were purchased and held for the entire accrual period. Since dividends accrue daily, your actual distributions will vary depending on the date you purchased your shares and any account activity. All Fund distributions will vary depending upon current market conditions, and past distributions are not indicative of future trends.
**Effective 8/1/17, the Fund began offering Class R6 shares. See the prospectus for details.
personal income tax bracket of 50.70% (including 3.80% Medicare tax) would need to earn a distribution rate of 6.17% from a taxable investment to match the Fund’s Class A tax-free distribution rate. For other performance data, please see the Performance Summary. Dividend distributions were affected by low interest rates during the period. This and other factors resulted in reduced income for the portfolio and caused dividends to be lower at the end of the period.
Performance data represent past performance, which does not guarantee future results. Investment return and principal value will fluctuate, and you may have a gain or loss when you sell your shares. Current performance may differ from figures shown. For most recent month-end performance, go to franklintempleton.com or call (800) 342-5236.
1. For state personal income taxes, the 80% minimum is measured by total Fund assets. For investors subject to alternative minimum tax, a small portion of Fund dividends may be taxable. Distributions of capital gains are generally taxable. To avoid imposition of 28% backup withholding on all Fund distributions and redemption proceeds, US investors must be properly certified on Form W-9 and non-US investors on Form W-8BEN.
2. The distribution amount is the sum of all net investment income distributions for the period shown. Assumes shares were purchased and held for the entire accrual period. Since dividends accrue daily, your actual distributions will vary depending on the date you purchased your shares and any account activity. All Fund distributions will vary depending upon current market conditions, and past distributions are not indicative of future trends.
The dollar value, number of shares or principal amount, and names of all portfolio holdings are listed in the Fund’s Statement of Investments (SOI).
The SOI begins on page 124.
| | | | |
48 | | Annual Report | | franklintempleton.com |
FRANKLIN OREGON TAX-FREE INCOME FUND
State Update
Oregon’s economy continued to expand during the 12 months under review. The state’s job market continued to grow and expanded faster than the nation’s. Oregon’s future economic growth may benefit from the technology sector and the state’s high concentration of semiconductor manufacturing. Oregon’s unemployment rate began the period at 4.1%, rose slightly, but crept back down to 4.1% at period-end, which matched the 4.1% national average.3 The state’s personal income growth increased along with accelerating population growth.
| | |
| Portfolio Composition | | |
2/28/18 | | |
| |
| | | % of Total
Investments* |
General Obligation | | 28.9% |
Refunded** | | 23.4% |
Hospital & Health Care | | 17.9% |
Utilities | | 9.1% |
Higher Education | | 8.4% |
Transportation | | 4.8% |
Other Revenue | | 2.1% |
Housing | | 2.1% |
Tax-Supported | | 1.9% |
Subject to Government Appropriations | | 1.4% |
*Does not include cash and cash equivalents.
**Includes all refunded bonds; the percentage may differ from that in the Credit Quality Composition.
According to March 2018 forecasts, Oregon’s combined general fund and lottery revenues for the 2017–2019 biennium are expected to be lower than original estimates, largely due to lower-than-expected growth in corporate income tax collections. The state’s 2017–2019 biennial general fund budget was larger than the previous biennium, but it continued to prioritize replenishment of rainy day funds. The state expects total reserves at the end of fiscal year 2019 to continue to rise from recent levels. These reserves potentially offer a fiscal cushion against revenue volatility and Oregon’s unusually high dependence on personal income taxes. Additionally, budget increases in spending on education, Medicaid and human services, pension contributions and commitments related to new ballot measures were balanced by projected revenue growth.
Oregon’s net tax-supported debt was 4.4% of personal income and $1,842 per capita, compared with the national medians of 2.5% and $1,006, respectively.4 Independent credit rating agency, Standard & Poor’s (S&P) rated Oregon’s general obligation debt AA+ with a stable outlook.5 The rating and outlook reflected S&P’s assessment of the state’s willingness to adjust revenue and spending to correct structural imbalances that may arise, mechanisms to build up rainy day funds, strong budget reserve levels, sound financial policies and a well-funded retirement system. However, S&P cited challenges such as the state’s propensity for revenue volatility due to dependence on personal income taxes and a constitutional requirement to provide income tax rebates if certain criteria are met. Overall, S&P’s stable outlook reflected its view that Oregon’s finances were poised to remain strong and that solid reserves may mitigate potential future revenue cyclicality.
Manager’s Discussion
We used various investment strategies during the 12 months under review as we sought to maximize tax-free income for shareholders. Please read the Investment Strategy and Manager’s Discussion on page 5 for more information.
The Fund holds a very small portion of its assets in Puerto Rico bonds, which decreased in price over the period. Puerto Rico and its municipal issuers continue to experience significant financial difficulties and we continue to monitor developments affecting them.
Thank you for your continued participation in Franklin Oregon Tax-Free Income Fund. We believe our conservative, buy-and-hold investment strategy can help us achieve high, current, tax-free income for shareholders.
3. Source: Bureau of Labor Statistics.
4. Source: Moody’s Investors Service, State Government - US: Medians - Total State Debt Remains Essentially Flat in 2017, 5/3/17.
5. This does not indicate S&P’s rating of the Fund.
| | | | | | | | |
franklintempleton.com | | | | | | Annual Report | | 49 |
FRANKLIN OREGON TAX-FREE INCOME FUND
The foregoing information reflects our analysis, opinions and portfolio holdings as of February 28, 2018, the end of the reporting period. The way we implement our main investment strategies and the resulting portfolio holdings may change depending on factors such as market and economic conditions. These opinions may not be relied upon as investment advice or an offer for a particular security. The information is not a complete analysis of every aspect of any market, state, industry, security or the Fund. Statements of fact are from sources considered reliable, but the investment manager makes no representation or warranty as to their completeness or accuracy. Although historical performance is no guarantee of future results, these insights may help you understand our investment management philosophy.
| | | | | | |
50 | | Annual Report | | | | franklintempleton.com |
FRANKLIN OREGON TAX-FREE INCOME FUND
Performance Summary as of February 28, 2018
The performance tables and graphs do not reflect any taxes that a shareholder would pay on Fund dividends, capital gain distributions, if any, or any realized gains on the sale of Fund shares. Total return reflects reinvestment of the Fund’s dividends and capital gain distributions, if any, and any unrealized gains or losses. Your dividend income will vary depending on dividends or interest paid by securities in the Fund’s portfolio, adjusted for operating expenses of each class. Capital gain distributions are net profits realized from the sale of portfolio securities.
Performance as of 2/28/18
Cumulative total return excludes sales charges. Average annual total return includes maximum sales charges. Sales charges will vary depending on the size of the investment and the class of share purchased. The maximum is 4.25% and the minimum is 0%. Class A: 4.25% maximum initial sales charge; Advisor Class: no sales charges. For other share classes, visit franklintempleton.com.
| | | | |
| Share Class | | Cumulative
Total Return1 | | Average Annual
Total Return2 |
| | |
A | | | | |
1-Year | | +1.29% | | -2.97% |
5-Year | | +8.09% | | +0.69% |
10-Year | | +48.40% | | +3.58% |
| | |
Advisor3 | | | | |
1-Year | | +1.38% | | +1.38% |
5-Year | | +8.61% | | +1.67% |
10-Year | | +49.75% | | +4.12% |
| | | | | | | | |
| Share Class | | Distribution
Rate4 | | Taxable Equivalent
Distribution Rate5 | | 30-Day
Standardized Yield6 | | Taxable Equivalent 30-Day
Standardized Yield5 |
| | | | |
A | | 3.04% | | 6.17% | | 1.71% | | 3.47% |
| | | | |
Advisor | | 3.27% | | 6.63% | | 1.86% | | 3.77% |
Performance data represent past performance, which does not guarantee future results. Investment return and principal value will fluctuate, and you may have a gain or loss when you sell your shares. Current performance may differ from figures shown. For most recent month-end performance, go to franklintempleton.com or call (800) 342-5236.
See page 54 for Performance Summary footnotes.
| | | | | | | | |
franklintempleton.com | | | | | | Annual Report | | 51 |
FRANKLIN OREGON TAX-FREE INCOME FUND
PERFORMANCE SUMMARY
Total Return Index Comparison for a Hypothetical $10,000 Investment
Total return represents the change in value of an investment over the periods shown. It includes any applicable maximum sales charge, Fund expenses, account fees and reinvested distributions. The unmanaged indexes include reinvestment of any income or distributions. They differ from the Fund in composition and do not pay management fees or expenses. One cannot invest directly in an index.
Class A (3/1/08–2/28/18)

Advisor Class (3/1/08–2/28/18)3
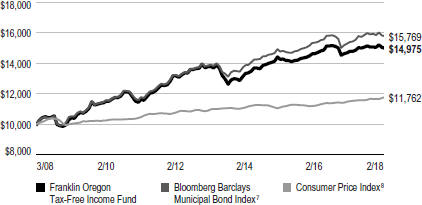
See page 54 for Performance Summary footnotes.
| | | | | | |
52 | | Annual Report | | | | franklintempleton.com |
FRANKLIN OREGON TAX-FREE INCOME FUND
PERFORMANCE SUMMARY
| | | | | | | | |
Net Asset Value |
| | | | |
| Share Class (Symbol) | | 2/28/18 | | 8/1/17 | | 2/28/17 | | Change |
| | | | |
A (FRORX) | | $11.37 | | N/A | | $11.60 | | -$0.23 |
| | | | |
C (FORIX) | | $11.55 | | N/A | | $11.77 | | -$0.22 |
| | | | |
R6 (FOFRX) | | $11.38 | | $11.66 | | N/A | | -$0.28 |
| | | | |
Advisor (FOFZX) | | $11.38 | | N/A | | $11.61 | | -$0.23 |
|
| Distributions (3/1/17–2/28/18) |
| | | | |
| Share Class | | Net Investment
Income | | | | | | |
| | | | |
A | | $0.3808 | | | | | | |
| | | | |
C | | $0.3157 | | | | | | |
| | | | |
R6 (8/1/17–2/28/18) | | $0.2230 | | | | | | |
| | | | |
Advisor | | $0.3916 | | | | | | |
|
| Total Annual Operating Expenses9 |
| | | | |
| Share Class | | | | | | | | |
| | | | |
A | | 0.63% | | | | | | |
| | | | |
Advisor | | 0.53% | | | | | | |
| | | | | | | | |
franklintempleton.com | | | | | | Annual Report | | 53 |
FRANKLIN OREGON TAX-FREE INCOME FUND
PERFORMANCE SUMMARY
Each class of shares is available to certain eligible investors and has different annual fees and expenses, as described in the prospectus.
All investments involve risks, including possible loss of principal. Because municipal bonds are sensitive to interest rate movements, the Fund’s yield and share price will fluctuate with market conditions. Bond prices generally move in the opposite direction of interest rates. Thus, as prices of bonds in the Fund adjust to a rise in interest rates, the Fund’s share price may decline. Because the Fund invests principally in a single state, it is subject to greater risk of adverse economic and regulatory changes in that state than a geographically diversified fund. The Fund holds a very small portion of its assets in Puerto Rico municipal bonds that have been impacted by recent adverse economic and market changes, which may cause the Fund’s share price to decline. Changes in the credit rating of a bond, or in the credit rating or financial strength of a bond’s issuer, insurer or guarantor, may affect the bond’s value. The Fund may invest a significant part of its assets in municipal securities that finance similar types of projects, such as utilities, hospitals, higher education and transportation. A change that affects one project would likely affect all similar projects, thereby increasing market risk. The Fund is actively managed but there is no guarantee that the manager’s investment decisions will produce the desired results. The Fund’s prospectus also includes a description of the main investment risks.
1. Cumulative total return represents the change in value of an investment over the periods indicated.
2. Average annual total return represents the average annual change in value of an investment over the periods indicated. Return for less than one year, if any, has not been annualized.
3. Effective 7/15/09, the Fund began offering Advisor Class shares, which do not have sales charges or a Rule 12b-1 plan. Performance quotations for this class reflect the following methods of calculation: (a) For periods prior to 7/15/09, a restated figure is used based upon the Fund’s Class A performance, excluding the effect of Class A’s maximum initial sales charge, but reflecting the effect of the Class A Rule 12b-1 fees; and (b) for periods after 7/15/09, actual Advisor Class performance is used reflecting all charges and fees applicable to that class. Since 7/15/09 (commencement of sales), the cumulative and average annual total returns of Advisor Class shares were +38.68% and +3.86%.
4. Distribution rate is based on an annualization of the respective class’s February dividend and the maximum offering price (NAV for Advisor Class) per share on 2/28/18.
5. Taxable equivalent distribution rate and yield assume the published rates as of 1/15/18 for the maximum combined effective federal and Oregon personal income tax rate of 50.70%, based on the federal income tax rate of 37.00% plus 3.80% Medicare tax.
6. The Fund’s 30-day standardized yield is calculated over a trailing 30-day period using the yield to maturity on bonds and/or the dividends accrued on stocks. It may not equal the Fund’s actual income distribution rate, which reflects the Fund’s past dividends paid to shareholders.
7. Source: Morningstar. The Bloomberg Barclays Municipal Bond Index is a market value-weighted index engineered for the long-term tax-exempt bond market. To be included in the index, bonds must be fixed rate, have at least one year to final maturity and be rated investment grade (Baa3/BBB- or higher) by at least two of the following agencies: Moody’s, S&P or Fitch.
8. Source: Bureau of Labor Statistics, bls.gov/cpi. The Consumer Price Index is a commonly used measure of the inflation rate.
9. Figures are as stated in the Fund’s current prospectus and may differ from the expense ratios disclosed in the Your Funds’ Expenses and Financial Highlights sections in this report. In periods of market volatility, assets may decline significantly, causing total annual Fund operating expenses to become higher than the figures shown.
See www.franklintempletondatasources.com for additional data provider information.
| | | | | | |
54 | | Annual Report | | | | franklintempleton.com |
FRANKLIN OREGON TAX-FREE INCOME FUND
Your Fund’s Expenses
As a Fund shareholder, you can incur two types of costs: (1) transaction costs, including sales charges (loads) on Fund purchases and redemptions; and (2) ongoing Fund costs, including management fees, distribution and service (12b-1) fees, and other Fund expenses. All mutual funds have ongoing costs, sometimes referred to as operating expenses. The table below shows ongoing costs of investing in the Fund and can help you understand these costs and compare them with those of other mutual funds. The table assumes a $1,000 investment held for the six months indicated.
Actual Fund Expenses
The table below provides information about actual account values and actual expenses in the columns under the heading “Actual.” In these columns the Fund’s actual return, which includes the effect of Fund expenses, is used to calculate the “Ending Account Value” for each class of shares. You can estimate the expenses you paid during the period by following these steps (of course, your account value and expenses will differ from those in this illustration): Divide your account value by $1,000 (if your account had an $8,600 value, then $8,600 ÷ $1,000 = 8.6). Then multiply the result by the number in the row for your class of shares under the headings “Actual” and “Expenses Paid During Period” (if Actual Expenses Paid During Period were $7.50, then 8.6 x $7.50 = $64.50). In this illustration, the actual expenses paid this period are $64.50.
Hypothetical Example for Comparison with Other Funds
Under the heading “Hypothetical” in the table, information is provided about hypothetical account values and hypothetical expenses based on the Fund’s actual expense ratio and an assumed rate of return of 5% per year before expenses, which is not the Fund’s actual return. This information may not be used to estimate the actual ending account balance or expenses you paid for the period, but it can help you compare ongoing costs of investing in the Fund with those of other funds. To do so, compare this 5% hypothetical example for the class of shares you hold with the 5% hypothetical examples that appear in the shareholder reports of other funds.
Please note that expenses shown in the table are meant to highlight ongoing costs and do not reflect any transactional costs. Therefore, information under the heading “Hypothetical” is useful in comparing ongoing costs only, and will not help you compare total costs of owning different funds. In addition, if transactional costs were included, your total costs would have been higher.
| | | | | | | | | | | | |
| | | | | Actual (actual return after expenses) | | Hypothetical (5% annual return before expenses) | | |
| | | | | | | | |
Share
Class | | Beginning
Account
Value 9/1/17 | | Ending
Account
Value 2/28/18 | | Expenses
Paid During
Period
9/1/17–2/28/181,2 | | Ending
Account
Value 2/28/18 | | Expenses
Paid During
Period
9/1/17–2/28/181,2 | | Net
Annualized
Expense
Ratio2 |
| | | | | | |
A | | $1,000 | | $989.20 | | $3.26 | | $1,021.52 | | $3.31 | | 0.66% |
C | | $1,000 | | $986.60 | | $5.96 | | $1,018.79 | | $6.06 | | 1.21% |
R6 | | $1,000 | | $989.80 | | $2.57 | | $1,022.22 | | $2.61 | | 0.52% |
Advisor | | $1,000 | | $989.60 | | $2.76 | | $1,022.02 | | $2.81 | | 0.56% |
1. Expenses are equal to the annualized expense ratio for the six-month period as indicated above—in the far right column—multiplied by the simple average account value over the period indicated, and then multiplied by 181/365 to reflect the one-half year period.
2. Reflects expenses after fee waivers and expense reimbursements, for Class R6.
| | | | | | | | |
franklintempleton.com | | | | | | Annual Report | | 55 |
Franklin Pennsylvania Tax-Free Income Fund
This annual report for Franklin Pennsylvania Tax-Free Income Fund covers the fiscal year ended February 28, 2018.
Your Fund’s Goal and Main Investments
The Fund seeks to provide as high a level of income exempt from federal and Pennsylvania personal income taxes as is consistent with prudent investment management and preservation of capital by investing at least 80% of its net assets in securities that pay interest free from such taxes.1
Credit Quality Composition*
2/28/18
| | | | |
| Ratings | | % of Total
Investments | |
| |
AAA | | | 0.10% | |
| |
AA | | | 41.09% | |
| |
A | | | 26.42% | |
| |
BBB | | | 6.38% | |
| |
Below Investment Grade | | | 0.99% | |
| |
Refunded | | | 24.53% | |
| |
Not Rated | | | 0.49% | |
*Securities, except for those labeled Not Rated, are assigned ratings by one or more Nationally Recognized Statistical Credit Rating Organizations (NRSROs), such as Standard & Poor’s, Moody’s and Fitch, that can be considered by the investment manager as part of its independent securities analysis. When ratings from multiple agencies are available, the highest is used, consistent with the portfolio investment process. Ratings reflect an NRSRO’s opinion of an issuer’s creditworthiness and typically range from AAA (highest) to D (lowest). The Below Investment Grade category consists of bonds rated below BBB-. The Refunded category generally consists of refunded bonds secured by US government or other high-quality securities and not rerated by an NRSRO. The Not Rated category consists of ratable securities that have not been rated by an NRSRO. Cash and equivalents are excluded from this composition.
Performance Overview
The Fund’s Class A share price, as measured by net asset value, decreased from $10.12 on February 28, 2017, to $9.78 on February 28, 2018. The Fund’s Class A shares paid dividends totaling 37.30 cents per share for the reporting period.2 The Performance Summary beginning on page 59 shows that at the end of this reporting period the Fund’s Class A shares’ distribution rate was 3.47% based on an annualization of February’s 2.95 cent per share dividend and the maximum
offering price of $10.21 on February 28, 2018. An investor in the 2018 maximum combined effective federal and Pennsylvania personal income tax bracket of 43.87% (including 3.80% Medicare tax) would need to earn a distribution rate of 6.18% from a taxable investment to match the Fund’s Class A tax-free distribution rate. For other performance data, please see the Performance Summary. Dividend distributions were affected by low interest rates during the period. This and other factors resulted in reduced income for the portfolio and caused dividends to be lower at the end of the period.
Performance data represent past performance, which does not guarantee future results. Investment return and principal value will fluctuate, and you may have a gain or loss when you sell your shares. Current performance may differ from figures shown. For most recent month-end performance, go to franklintempleton.com or call (800) 342-5236.
Commonwealth Update
Pennsylvania has a large, diverse and generally well-performing economy. The commonwealth recently experienced the strongest growth since the Great Recession, and per-capita income was above that of the nation. Its performance has been on par with the Northeast region and its economic growth rate is similar to national and regional levels, as is its unemployment rate. The housing market has been doing well, and the education and health care sectors remained key drivers of the commonwealth’s economy. During the 12 months under review, Pennsylvania’s unemployment rate declined from 5.1% at the beginning of the period to 4.8% at period-end, which was higher than the 4.1% national average.3
The commonwealth finished fiscal year 2017 (ended June 30, 2017) with a deficit, driven mainly by tax revenues that came in below forecasts, with personal income and corporate taxes representing most of the shortfall. For fiscal year 2018, in contrast to past budget impasses, Pennsylvania has a budget. The annual imbalance projected for 2018 is smaller than for 2017, due to restrained spending growth and higher projected revenues. With the legislature unable to come up with a balanced budget, the governor has outlined plans to do so using
1. For state personal income taxes, the 80% minimum is measured by total Fund assets. For investors subject to alternative minimum tax, a small portion of Fund dividends may be taxable. Distributions of capital gains are generally taxable. To avoid imposition of 28% backup withholding on all Fund distributions and redemption proceeds, US investors must be properly certified on Form W-9 and non-US investors on Form W-8BEN.
2. The distribution amount is the sum of all net investment income distributions for the period shown. Assumes shares were purchased and held for the entire accrual period. Since dividends accrue daily, your actual distributions will vary depending on the date you purchased your shares and any account activity. All Fund distributions will vary depending upon current market conditions, and past distributions are not indicative of future trends.
3. Source: Bureau of Labor Statistics.
The dollar value, number of shares or principal amount, and names of all portfolio holdings are listed in the Fund’s Statement of Investments (SOI).
The SOI begins on page 134.
| | | | |
56 | | Annual Report | | franklintempleton.com |
FRANKLIN PENNSYLVANIA TAX-FREE INCOME FUND
| | | | | | | | | | | | | | |
| Dividend Distributions* | |
3/1/17–2/28/18 | |
| | | Dividend per Share (cents) | |
| | | |
| Month | | Class A | | Class C | | | Class R6** | | | Advisor
Class | |
| | | | |
March | | 3.25 | | | 2.78 | | | | — | | | | 3.33 | |
| | | | |
April | | 3.25 | | | 2.78 | | | | — | | | | 3.33 | |
| | | | |
May | | 3.25 | | | 2.78 | | | | — | | | | 3.33 | |
| | | | |
June | | 3.25 | | | 2.78 | | | | — | | | | 3.33 | |
| | | | |
July | | 3.25 | | | 2.78 | | | | — | | | | 3.33 | |
| | | | |
August | | 3.05 | | | 2.58 | | | | 3.06 | | | | 3.13 | |
| | | | |
September | | 3.05 | | | 2.58 | | | | 3.16 | | | | 3.13 | |
| | | | |
October | | 3.05 | | | 2.58 | | | | 3.16 | | | | 3.13 | |
| | | | |
November | | 3.05 | | | 2.58 | | | | 3.16 | | | | 3.13 | |
| | | | |
December | | 2.95 | | | 2.48 | | | | 3.06 | | | | 3.03 | |
| | | | |
January | | 2.95 | | | 2.48 | | | | 3.06 | | | | 3.03 | |
| | | | |
February | | 2.95 | | | 2.48 | | | | 3.06 | | | | 3.03 | |
Total | | 37.30 | | | 31.66 | | | | 21.72 | | | | 38.26 | |
*The distribution amount is the sum of all net investment income distributions for the period shown. Assumes shares were purchased and held for the entire accrual period. Since dividends accrue daily, your actual distributions will vary depending on the date you purchased your shares and any account activity. All Fund distributions will vary depending upon current market conditions, and past distributions are not indicative of future trends.
**Effective 8/1/17, the Fund began offering Class R6 shares. See the prospectus for details.
one-time deficit financing techniques, including securitizing profits from the commonwealth’s liquor system and doing a lease-leaseback deal for the Pennsylvania Farm Show Complex & Expo Center. The proceeds from these combined one-off deals, as well as savings from refunding bonds, would close 2017’s deficit. Although pension liabilities have continued to be a challenge, Pennsylvania in fiscal year 2017 made all of the required contribution to the Public School Employees’ Retirement System for the first time in 15 years. In addition, the commonwealth passed pension reform, which moves new employees to either a defined-contribution or a hybrid plan and shifts more investment risk from the state onto employees.
Pennsylvania has moderate debt levels, slightly above the national medians. The commonwealth’s net tax-supported debt was 2.7% of personal income and $1,337 per capita, compared with the 2.5% and $1,006 national medians.4 Independent credit rating agency Moody’s Investors Service assigned Pennsylvania’s general obligation debt a rating of Aa3, with a stable outlook.5 The rating reflected the commonwealth’s diverse and generally well-performing economy, as well as substantial progress toward better funding its pension liabilities.
Headwinds included still above-average net pension liabilities and a weak fiscal governance system that tends to result in chronically late and often imbalanced budgets. The stable outlook reflected Pennsylvania’s solid capacity to meet its obligations using its resources, a trend unlikely to change given the commonwealth’s economic growth trajectory and steady improvements in pension funding. The outlook also recognized the narrow general fund liquidity, which is offset by adequate liquidity outside the general fund.
| | |
| Portfolio Composition | | |
2/28/18 | | |
| |
| | | % of Total
Investments* |
Refunded** | | 31.1% |
Hospital & Health Care | | 21.2% |
Higher Education | | 17.0% |
Utilities | | 13.6% |
General Obligation | | 7.6% |
Housing | | 3.3% |
Transportation | | 3.1% |
Subject to Government Appropriations | | 2.5% |
Other Revenue | | 0.6% |
*Does not include cash and cash equivalents.
**Includes all refunded bonds; the percentage may differ from that in the Credit Quality Composition.
Manager’s Discussion
We used various investment strategies during the 12 months under review as we sought to maximize tax-free income for shareholders. Please read the Investment Strategy and Manager’s Discussion on page 5 for more information.
The Fund holds a very small portion of its assets in Puerto Rico bonds, which decreased in price over the period. Puerto Rico and its municipal issuers continue to experience significant financial difficulties and we continue to monitor developments affecting them.
Thank you for your continued participation in Franklin Pennsylvania Tax-Free Income Fund. We believe our conservative, buy-and-hold investment strategy can help us achieve high, current, tax-free income for shareholders.
4. Source: Moody’s Investors Service, State Government - US: Medians - Total State Debt Remains Essentially Flat in 2017, 5/3/17.
5. This does not indicate Moody’s rating of the Fund.
| | | | | | | | |
franklintempleton.com | | | | | | Annual Report | | 57 |
FRANKLIN PENNSYLVANIA TAX-FREE INCOME FUND
The foregoing information reflects our analysis, opinions and portfolio holdings as of February 28, 2018, the end of the reporting period. The way we implement our main investment strategies and the resulting portfolio holdings may change depending on factors such as market and economic conditions. These opinions may not be relied upon as investment advice or an offer for a particular security. The information is not a complete analysis of every aspect of any market, state, industry, security or the Fund. Statements of fact are from sources considered reliable, but the investment manager makes no representation or warranty as to their completeness or accuracy. Although historical performance is no guarantee of future results, these insights may help you understand our investment management philosophy.
| | | | | | |
58 | | Annual Report | | | | franklintempleton.com |
FRANKLIN PENNSYLVANIA TAX-FREE INCOME FUND
Performance Summary as of February 28, 2018
The performance tables and graphs do not reflect any taxes that a shareholder would pay on Fund dividends, capital gain distributions, if any, or any realized gains on the sale of Fund shares. Total return reflects reinvestment of the Fund’s dividends and capital gain distributions, if any, and any unrealized gains or losses. Your dividend income will vary depending on dividends or interest paid by securities in the Fund’s portfolio, adjusted for operating expenses of each class. Capital gain distributions are net profits realized from the sale of portfolio securities.
Performance as of 2/28/18
Cumulative total return excludes sales charges. Average annual total return includes maximum sales charges. Sales charges will vary depending on the size of the investment and the class of share purchased. The maximum is 4.25% and the minimum is 0%. Class A: 4.25% maximum initial sales charge; Advisor Class: no sales charges. For other share classes, visit franklintempleton.com.
| | | | |
| Share Class | | Cumulative
Total Return1 | | Average Annual
Total Return2 |
| | |
A | | | | |
1-Year | | +0.31% | | -3.96% |
5-Year | | +8.49% | | +0.76% |
10-Year | | +49.47% | | +3.65% |
| | |
Advisor3 | | | | |
1-Year | | +0.51% | | +0.51% |
5-Year | | +9.12% | | +1.76% |
10-Year | | +50.99% | | +4.21% |
| | | | | | | | |
| Share Class | | Distribution
Rate4 | | Taxable Equivalent
Distribution Rate5 | | 30-Day
Standardized Yield6 | | Taxable Equivalent 30-Day
Standardized Yield5 |
| | | | |
A | | 3.47% | | 6.18% | | 1.73% | | 3.08% |
| | | | |
Advisor | | 3.71% | | 6.61% | | 1.90% | | 3.38% |
Performance data represent past performance, which does not guarantee future results. Investment return and principal value will fluctuate, and you may have a gain or loss when you sell your shares. Current performance may differ from figures shown. For most recent month-end performance, go to franklintempleton.com or call (800) 342-5236.
See page 62 for Performance Summary footnotes.
| | | | | | | | |
franklintempleton.com | | | | | | Annual Report | | 59 |
FRANKLIN PENNSYLVANIA TAX-FREE INCOME FUND
PERFORMANCE SUMMARY
Total Return Index Comparison for a Hypothetical $10,000 Investment
Total return represents the change in value of an investment over the periods shown. It includes any applicable maximum sales charge, Fund expenses, account fees and reinvested distributions. The unmanaged indexes include reinvestment of any income or distributions. They differ from the Fund in composition and do not pay management fees or expenses. One cannot invest directly in an index.
Class A (3/1/08–2/28/18)
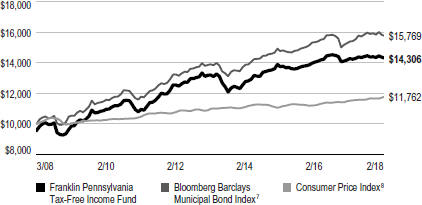
Advisor Class (3/1/08–2/28/18)3
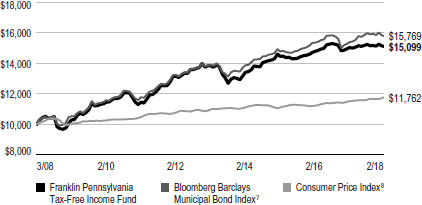
See page 62 for Performance Summary footnotes.
| | | | | | |
60 | | Annual Report | | | | franklintempleton.com |
FRANKLIN PENNSYLVANIA TAX-FREE INCOME FUND
PERFORMANCE SUMMARY
| | | | | | | | |
Net Asset Value |
| | | | |
| Share Class (Symbol) | | 2/28/18 | | 8/1/17 | | 2/28/17 | | Change |
| | | | |
A (FRPAX) | | $9.78 | | N/A | | $10.12 | | -$0.34 |
| | | | |
C (FRPTX) | | $9.91 | | N/A | | $10.24 | | -$0.33 |
| | | | |
R6 (FRPRX) | | $9.80 | | $10.06 | | N/A | | -$0.26 |
| | | | |
Advisor (FPFZX) | | $9.80 | | N/A | | $10.13 | | -$0.33 |
|
| Distributions (3/1/17–2/28/18) |
| | | | |
| Share Class | | Net Investment
Income | | | | | | |
| | | | |
A | | $0.3730 | | | | | | |
| | | | |
C | | $0.3166 | | | | | | |
| | | | |
R6 (8/1/17–2/28/18) | | $0.2172 | | | | | | |
| | | | |
Advisor | | $0.3826 | | | | | | |
|
| Total Annual Operating Expenses9 |
| | | | |
| Share Class | | | | | | | | |
| | | | |
A | | 0.64% | | | | | | |
| | | | |
Advisor | | 0.54% | | | | | | |
| | | | | | | | |
franklintempleton.com | | | | | | Annual Report | | 61 |
FRANKLIN PENNSYLVANIA TAX-FREE INCOME FUND
PERFORMANCE SUMMARY
Each class of shares is available to certain eligible investors and has different annual fees and expenses, as described in the prospectus.
All investments involve risks, including possible loss of principal. Because municipal bonds are sensitive to interest rate movements, the Fund’s yield and share price will fluctuate with market conditions. Bond prices generally move in the opposite direction of interest rates. Thus, as prices of bonds in the Fund adjust to a rise in interest rates, the Fund’s share price may decline. Because the Fund invests principally in a single state, it is subject to greater risk of adverse economic and regulatory changes in that state than a geographically diversified fund. The Fund holds a very small portion of its assets in Puerto Rico municipal bonds that have been impacted by recent adverse economic and market changes, which may cause the Fund’s share price to decline. Changes in the credit rating of a bond, or in the credit rating or financial strength of a bond’s issuer, insurer or guarantor, may affect the bond’s value. The Fund may invest a significant part of its assets in municipal securities that finance similar types of projects, such as utilities, hospitals, higher education and transportation. A change that affects one project would likely affect all similar projects, thereby increasing market risk. The Fund is actively managed but there is no guarantee that the manager’s investment decisions will produce the desired results. The Fund’s prospectus also includes a description of the main investment risks.
1. Cumulative total return represents the change in value of an investment over the periods indicated.
2. Average annual total return represents the average annual change in value of an investment over the periods indicated. Return for less than one year, if any, has not been annualized.
3. Effective 7/15/09, the Fund began offering Advisor Class shares, which do not have sales charges or a Rule 12b-1 plan. Performance quotations for this class reflect the following methods of calculation: (a) For periods prior to 7/15/09, a restated figure is used based upon the Fund’s Class A performance, excluding the effect of Class A’s maximum initial sales charge, but reflecting the effect of the Class A Rule 12b-1 fees; and (b) for periods after 7/15/09, actual Advisor Class performance is used reflecting all charges and fees applicable to that class. Since 7/15/09 (commencement of sales), the cumulative and average annual total returns of Advisor Class shares were +40.56% and +4.03%.
4. Distribution rate is based on an annualization of the respective class’s February dividend and the maximum offering price (NAV for Advisor Class) per share on 2/28/18.
5. Taxable equivalent distribution rate and yield assume the published rates as of 1/15/18 for the maximum combined effective federal and Pennsylvania personal income tax rate of 43.87%, based on the federal income tax rate of 37.00% plus 3.80% Medicare tax.
6. The Fund’s 30-day standardized yield is calculated over a trailing 30-day period using the yield to maturity on bonds and/or the dividends accrued on stocks. It may not equal the Fund’s actual income distribution rate, which reflects the Fund’s past dividends paid to shareholders.
7. Source: Morningstar. The Bloomberg Barclays Municipal Bond Index is a market value-weighted index engineered for the long-term tax-exempt bond market. To be included in the index, bonds must be fixed rate, have at least one year to final maturity and be rated investment grade (Baa3/BBB- or higher) by at least two of the following agencies: Moody’s, S&P or Fitch.
8. Source: Bureau of Labor Statistics, bls.gov/cpi. The Consumer Price Index is a commonly used measure of the inflation rate.
9. Figures are as stated in the Fund’s current prospectus and may differ from the expense ratios disclosed in the Your Fund’s and Financial Highlights sections in this report. In periods of market volatility, assets may decline significantly, causing total annual Fund operating expenses to become higher than the figures shown.
See www.franklintempletondatasources.com for additional data provider information.
| | | | | | |
62 | | Annual Report | | | | franklintempleton.com |
FRANKLIN PENNSYLVANIA TAX-FREE INCOME FUND
Your Fund’s Expenses
As a Fund shareholder, you can incur two types of costs: (1) transaction costs, including sales charges (loads) on Fund purchases and redemptions; and (2) ongoing Fund costs, including management fees, distribution and service (12b-1) fees, and other Fund expenses. All mutual funds have ongoing costs, sometimes referred to as operating expenses. The table below shows ongoing costs of investing in the Fund and can help you understand these costs and compare them with those of other mutual funds. The table assumes a $1,000 investment held for the six months indicated.
Actual Fund Expenses
The table below provides information about actual account values and actual expenses in the columns under the heading ���Actual.” In these columns the Fund’s actual return, which includes the effect of Fund expenses, is used to calculate the “Ending Account Value” for each class of shares. You can estimate the expenses you paid during the period by following these steps (of course, your account value and expenses will differ from those in this illustration): Divide your account value by $1,000 (if your account had an $8,600 value, then $8,600 ÷ $1,000 = 8.6). Then multiply the result by the number in the row for your class of shares under the headings “Actual” and “Expenses Paid During Period” (if Actual Expenses Paid During Period were $7.50, then 8.6 x $7.50 = $64.50). In this illustration, the actual expenses paid this period are $64.50.
Hypothetical Example for Comparison with Other Funds
Under the heading “Hypothetical” in the table, information is provided about hypothetical account values and hypothetical expenses based on the Fund’s actual expense ratio and an assumed rate of return of 5% per year before expenses, which is not the Fund’s actual return. This information may not be used to estimate the actual ending account balance or expenses you paid for the period, but it can help you compare ongoing costs of investing in the Fund with those of other funds. To do so, compare this 5% hypothetical example for the class of shares you hold with the 5% hypothetical examples that appear in the shareholder reports of other funds.
Please note that expenses shown in the table are meant to highlight ongoing costs and do not reflect any transactional costs. Therefore, information under the heading “Hypothetical” is useful in comparing ongoing costs only, and will not help you compare total costs of owning different funds. In addition, if transactional costs were included, your total costs would have been higher.
| | | | | | | | | | | | |
| | | | | Actual (actual return after expenses) | | Hypothetical (5% annual return before expenses) | | |
| | | | | | | | |
Share
Class | | Beginning
Account
Value 9/1/17 | | Ending
Account
Value 2/28/18 | | Expenses
Paid During
Period
9/1/17–2/28/181,2 | | Ending
Account
Value 2/28/18 | | Expenses
Paid During
Period
9/1/17–2/28/181,2 | | Net
Annualized
Expense
Ratio2 |
| | | | | | |
A | | $1,000 | | $990.00 | | $3.45 | | $1,021.32 | | $3.51 | | 0.70% |
C | | $1,000 | | $988.30 | | $6.16 | | $1,018.60 | | $6.26 | | 1.25% |
R6 | | $1,000 | | $991.70 | | $2.67 | | $1,022.12 | | $2.71 | | 0.54% |
Advisor | | $1,000 | | $991.50 | | $2.96 | | $1,021.82 | | $3.01 | | 0.60% |
1. Expenses are equal to the annualized expense ratio for the six-month period as indicated above—in the far right column—multiplied by the simple average account value over the period indicated, and then multiplied by 181/365 to reflect the one-half year period.
2. Reflects expenses after fee waivers and expense reimbursements, for Class R6.
| | | | | | | | |
franklintempleton.com | | | | | | Annual Report | | 63 |
FRANKLIN TAX-FREE TRUST
Financial Highlights
Franklin Arizona Tax-Free Income Fund
| | | | | | | | | | | | | | | | | | | | |
| | | Year Ended February 28, | |
| | | 2018 | | | 2017 | | | 2016a | | | 2015 | | | 2014 | |
Class A | | | | | | | | | | | | | | | | | | | | |
Per share operating performance | | | | | | | | | | | | | | | | | | | | |
(for a share outstanding throughout the year) | | | | | | | | | | | | | | | | | | | | |
Net asset value, beginning of year | | | $10.78 | | | | $11.07 | | | | $11.22 | | | | $10.80 | | | | $11.52 | |
| | | | | |
Income from investment operationsb: | | | | | | | | | | | | | | | | | | | | |
Net investment incomec | | | 0.37 | | | | 0.38 | | | | 0.41 | | | | 0.43 | | | | 0.45 | |
Net realized and unrealized gains (losses) | | | (0.19) | | | | (0.29) | | | | (0.15) | | | | 0.42 | | | | (0.73) | |
| | | | | |
Total from investment operations | | | 0.18 | | | | 0.09 | | | | 0.26 | | | | 0.85 | | | | (0.28) | |
| | | | | |
Less distributions from net investment income | | | (0.38) | | | | (0.38) | | | | (0.41) | | | | (0.43) | | | | (0.44) | |
| | | | | |
Net asset value, end of year | | | $10.58 | | | | $10.78 | | | | $11.07 | | | | $11.22 | | | | $10.80 | |
| | | | | |
Total returnd | | | 1.62% | | | | 0.77% | | | | 2.39% | | | | 7.98% | | | | (2.37)% | |
| | | | | |
Ratios to average net assets | | | | | | | | | | | | | | | | | | | | |
Expenses | | | 0.65% | | | | 0.63% | | | | 0.62% | | | | 0.62% | | | | 0.62% | |
Net investment income | | | 3.39% | | | | 3.47% | | | | 3.69% | | | | 3.93% | | | | 4.10% | |
| | | | | |
Supplemental data | | | | | | | | | | | | | | | | | | | | |
Net assets, end of year (000’s) | | | $737,426 | | | | $769,835 | | | | $799,510 | | | | $815,973 | | | | $798,957 | |
Portfolio turnover rate | | | 17.47% | | | | 13.02% | | | | 13.28% | | | | 12.31% | | | | 14.75% | |
aFor the year ended February 29.
bThe amount shown for a share outstanding throughout the period may not correlate with the Statement of Operations for the period due to the timing of sales and repurchases of the Fund’s shares in relation to income earned and/or fluctuating fair value of the investments of the Fund.
cBased on average daily shares outstanding.
dTotal return does not reflect sales commissions or contingent deferred sales charges, if applicable.
| | | | | | |
64 | | Annual Report | | | The accompanying notes are an integral part of these financial statements. | | franklintempleton.com |
FRANKLIN TAX-FREE TRUST
FINANCIAL HIGHLIGHTS
Franklin Arizona Tax-Free Income Fund (continued)
| | | | | | | | | | | | | | | | | | | | |
| | | Year Ended February 28, | |
| | | 2018 | | | 2017 | | | 2016a | | | 2015 | | | 2014 | |
Class C | | | | | | | | | | | | | | | | | | | | |
Per share operating performance | | | | | | | | | | | | | | | | | | | | |
(for a share outstanding throughout the year) | | | | | | | | | | | | | | | | | | | | |
Net asset value, beginning of year | | | $10.95 | | | | $11.24 | | | | $11.39 | | | | $10.96 | | | | $11.68 | |
| | | | | |
Income from investment operationsb: | | | | | | | | | | | | | | | | | | | | |
Net investment incomec | | | 0.31 | | | | 0.33 | | | | 0.35 | | | | 0.38 | | | | 0.39 | |
Net realized and unrealized gains (losses) | | | (0.20) | | | | (0.30) | | | | (0.15) | | | | 0.42 | | | | (0.73) | |
| | | | | |
Total from investment operations | | | 0.11 | | | | 0.03 | | | | 0.20 | | | | 0.80 | | | | (0.34) | |
| | | | | |
Less distributions from net investment income | | | (0.31) | | | | (0.32) | | | | (0.35) | | | | (0.37) | | | | (0.38) | |
| | | | | |
Net asset value, end of year | | | $10.75 | | | | $10.95 | | | | $11.24 | | | | $11.39 | | | | $10.96 | |
| | | | | |
Total returnd | | | 1.03% | | | | 0.19% | | | | 1.79% | | | | 7.36% | | | | (2.87)% | |
| | | | | |
Ratios to average net assets | | | | | | | | | | | | | | | | | | | | |
Expenses | | | 1.20% | | | | 1.18% | | | | 1.17% | | | | 1.17% | | | | 1.17% | |
Net investment income | | | 2.84% | | | | 2.92% | | | | 3.14% | | | | 3.38% | | | | 3.55% | |
| | | | | |
Supplemental data | | | | | | | | | | | | | | | | | | | | |
Net assets, end of year (000’s) | | | $105,010 | | | | $118,381 | | | | $113,370 | | | | $107,612 | | | | $100,188 | |
Portfolio turnover rate | | | 17.47% | | | | 13.02% | | | | 13.28% | | | | 12.31% | | | | 14.75% | |
aFor the year ended February 29.
bThe amount shown for a share outstanding throughout the period may not correlate with the Statement of Operations for the period due to the timing of sales and repurchases of the Fund’s shares in relation to income earned and/or fluctuating fair value of the investments of the Fund.
cBased on average daily shares outstanding.
dTotal return does not reflect sales commissions or contingent deferred sales charges, if applicable.
| | | | | | | | |
franklintempleton.com | | | | The accompanying notes are an integral part of these financial statements. | | | Annual Report | | 65 |
FRANKLIN TAX-FREE TRUST
FINANCIAL HIGHLIGHTS
Franklin Arizona Tax-Free Income Fund (continued)
| | |
| | | Year Ended
February 28,
2018a |
Class R6 | | |
| Per share operating performance | | |
(for a share outstanding throughout the year) | | |
Net asset value, beginning of year | | $10.84 |
| |
Income from investment operationsb: | | |
Net investment incomec | | 0.22 |
Net realized and unrealized gains (losses) | | (0.24) |
| |
Total from investment operations | | (0.02) |
| |
Less distributions from net investment income | | (0.22) |
| |
Net asset value, end of year | | $10.60 |
| |
Total returnd | | (0.18)% |
| |
Ratios to average net assetse | | |
Expenses before waiver and payments by affiliates | | 0.53% |
Expenses net of waiver and payments by affiliates | | 0.51% |
Net investment income | | 3.53% |
| |
Supplemental data | | |
Net assets, end of year (000’s) | | $10,816 |
Portfolio turnover rate | | 17.47% |
aFor the period August 1, 2017 (effective date) to February 28, 2018.
bThe amount shown for a share outstanding throughout the period may not correlate with the Statement of Operations for the period due to the timing of sales and repurchases of the Fund’s shares in relation to income earned and/or fluctuating fair value of the investments of the Fund.
cBased on average daily shares outstanding.
dTotal return is not annualized for periods less than one year.
eRatios are annualized for periods less than one year.
| | | | | | |
66 | | Annual Report | | | The accompanying notes are an integral part of these financial statements. | | franklintempleton.com |
FRANKLIN TAX-FREE TRUST
FINANCIAL HIGHLIGHTS
Franklin Arizona Tax-Free Income Fund (continued)
| | | | | | | | | | | | | | | | | | | | |
| | | Year Ended February 28, | |
| | | 2018 | | | 2017 | | | 2016a | | | 2015 | | | 2014 | |
Advisor Class | | | | | | | | | | | | | | | | | | | | |
Per share operating performance | | | | | | | | | | | | | | | | | | | | |
(for a share outstanding throughout the year) | | | | | | | | | | | | | | | | | | | | |
Net asset value, beginning of year | | | $10.81 | | | | $11.10 | | | | $11.25 | | | | $10.83 | | | | $11.55 | |
| | | | | |
Income from investment operationsb: | | | | | | | | | | | | | | | | | | | | |
Net investment incomec | | | 0.38 | | | | 0.40 | | | | 0.42 | | | | 0.45 | | | | 0.46 | |
Net realized and unrealized gains (losses) | | | (0.19) | | | | (0.30) | | | | (0.15) | | | | 0.41 | | | | (0.73) | |
| | | | | |
Total from investment operations | | | 0.19 | | | | 0.10 | | | | 0.27 | | | | 0.86 | | | | (0.27) | |
| | | | | |
Less distributions from net investment income | | | (0.39) | | | | (0.39) | | | | (0.42) | | | | (0.44) | | | | (0.45) | |
| | | | | |
Net asset value, end of year | | | $10.61 | | | | $10.81 | | | | $11.10 | | | | $11.25 | | | | $10.83 | |
| | | | | |
Total return | | | 1.72% | | | | 0.86% | | | | 2.48% | | | | 8.07% | | | | (2.26)% | |
| | | | | |
Ratios to average net assets | | | | | | | | | | | | | | | | | | | | |
Expenses | | | 0.55% | | | | 0.53% | | | | 0.52% | | | | 0.52% | | | | 0.52% | |
Net investment income | | | 3.49% | | | | 3.57% | | | | 3.79% | | | | 4.03% | | | | 4.20% | |
| | | | | |
Supplemental data | | | | | | | | | | | | | | | | | | | | |
Net assets, end of year (000’s) | | | $86,795 | | | | $90,707 | | | | $57,674 | | | | $48,670 | | | | $29,842 | |
Portfolio turnover rate | | | 17.47% | | | | 13.02% | | | | 13.28% | | | | 12.31% | | | | 14.75% | |
aFor the year ended February 29.
bThe amount shown for a share outstanding throughout the period may not correlate with the Statement of Operations for the period due to the timing of sales and repurchases of the Fund’s shares in relation to income earned and/or fluctuating fair value of the investments of the Fund.
cBased on average daily shares outstanding.
| | | | | | | | |
franklintempleton.com | | | | The accompanying notes are an integral part of these financial statements. | | | Annual Report | | 67 |
FRANKLIN TAX-FREE TRUST
Statement of Investments, February 28, 2018
Franklin Arizona Tax-Free Income Fund
| | | | | | | | |
| | | Principal
Amount | | | Value | |
| Municipal Bonds 99.7% | | | | | | | | |
Arizona 98.4% | | | | | | | | |
Arizona Board of Regents Arizona State University System Revenue, | | | | | | | | |
Green Bond, Series B, 5.00%, 7/01/42 | | $ | 2,000,000 | | | $ | 2,264,480 | |
Polytechnic Campus Project, Series C, Pre-Refunded, 6.00%, 7/01/26 | | | 2,500,000 | | | | 2,538,575 | |
Polytechnic Campus Project, Series C, Pre-Refunded, 6.00%, 7/01/27 | | | 3,000,000 | | | | 3,046,290 | |
Polytechnic Campus Project, Series C, Pre-Refunded, 6.00%, 7/01/28 | | | 3,350,000 | | | | 3,401,691 | |
Refunding, Series B, 5.00%, 7/01/41 | | | 14,070,000 | | | | 15,839,865 | |
Series C, 5.00%, 7/01/46 | | | 10,000,000 | | | | 11,291,100 | |
Series D, 5.00%, 7/01/41 | | | 5,000,000 | | | | 5,628,950 | |
Series D, 5.00%, 7/01/46 | | | 7,000,000 | | | | 7,856,100 | |
Stimulus Plan for Economic and Educational Dent, 5.00%, 8/01/33 | | | 2,200,000 | | | | 2,496,120 | |
Stimulus Plan for Economic and Educational Dent, 5.00%, 8/01/34 | | | 3,320,000 | | | | 3,760,597 | |
Stimulus Plan for Economic and Educational Dent, 5.00%, 8/01/44 | | | 4,145,000 | | | | 4,645,840 | |
Arizona Board of Regents Northern Arizona University System Revenue, | | | | | | | | |
Refunding, 5.00%, 6/01/40 | | | 7,365,000 | | | | 8,136,263 | |
Refunding, 5.00%, 6/01/44 | | | 8,005,000 | | | | 8,805,100 | |
Stimulus Plan for Economic and Educational Development, 5.00%, 8/01/26 | | | 2,380,000 | | | | 2,674,358 | |
Stimulus Plan for Economic and Educational Development, 5.00%, 8/01/38 | | | 5,000,000 | | | | 5,467,400 | |
Arizona Board of Regents University of Arizona Revenue, Stimulus Plan for Economic and Educational Development, 5.00%, 8/01/38 | | | 10,150,000 | | | | 11,280,507 | |
Arizona Board of Regents University of Arizona System Revenue, | | | | | | | | |
Refunding, 5.00%, 6/01/39 | | | 2,750,000 | | | | 3,121,113 | |
Series A, 5.00%, 6/01/43 | | | 5,000,000 | | | | 5,743,100 | |
Series A, Pre-Refunded, 5.00%, 6/01/39 | | | 8,650,000 | | | | 9,024,718 | |
Arizona Health Facilities Authority Healthcare Education Facilities Revenue, Kirksville College of Osteopathic Medicine Inc., Arizona School of Health Sciences Project, 5.125%, 1/01/30 | | | 2,250,000 | | | | 2,370,285 | |
Arizona Health Facilities Authority Hospital Revenue, Phoenix Children’s Hospital, Refunding, Series A, 5.00%, 2/01/42 | | | 8,000,000 | | | | 8,417,120 | |
Arizona Health Facilities Authority Revenue, | | | | | | | | |
Catholic Healthcare West, Series B, AGMC Insured, 5.00%, 3/01/41 | | | 5,000,000 | | | | 5,271,150 | |
Catholic Healthcare West, Series B, Sub Series B-1, 5.25%, 3/01/39 | | | 10,000,000 | | | | 10,721,700 | |
Scottsdale Lincoln Hospital Project, Refunding, Series A, 5.00%, 12/01/39 | | | 15,000,000 | | | | 16,606,950 | |
Scottsdale Lincoln Hospital Project, Refunding, Series A, 5.00%, 12/01/42 | | | 9,535,000 | | | | 10,519,965 | |
Arizona IDA Education Revenue, | | | | | | | | |
Academies of Math and Science Projects, Refunding, Series A, 5.00%, 7/01/42 | | | 1,045,000 | | | | 1,153,920 | |
Academies of Math and Science Projects, Refunding, Series A, 5.00%, 7/01/47 | | | 1,150,000 | | | | 1,266,047 | |
Academies of Math and Science Projects, Refunding, Series A, 5.00%, 7/01/48 | | | 2,000,000 | | | | 2,214,280 | |
Academies of Math and Science Projects, Refunding, Series A, 5.00%, 7/01/51 | | | 1,080,000 | | | | 1,181,844 | |
Arizona Agribusiness and Equine Center Inc. Project, Credit Enhanced, Series A, 5.00%, 3/01/48 | | | 1,555,000 | | | | 1,720,887 | |
Basis Schools Projects, Credit Enhanced, Refunding, Series F, 5.00%, 7/01/37 | | | 1,000,000 | | | | 1,117,640 | |
Basis Schools Projects, Credit Enhanced, Refunding, Series F, 5.00%, 7/01/47 | | | 2,350,000 | | | | 2,598,842 | |
Arizona School Facilities Board COP, Pre-Refunded, 5.50%, 9/01/23 | | | 10,000,000 | | | | 10,210,000 | |
Arizona Sports and Tourism Authority Senior Revenue, Multipurpose Stadium Facility Project, Refunding, Series A, 5.00%, 7/01/36 | | | 3,160,000 | | | | 3,352,697 | |
Arizona State Board of Regents COP, University of Arizona, Refunding, Series C, 5.00%, 6/01/31 | | | 7,025,000 | | | | 7,731,223 | |
Arizona State COP, | | | | | | | | |
Department of Administration, Series A, AGMC Insured, 5.25%, 10/01/26 | | | 8,500,000 | | | | 8,958,915 | |
Department of Administration, Series A, AGMC Insured, 5.00%, 10/01/29 | | | 5,855,000 | | | | 6,144,647 | |
Department of Administration, Series B, AGMC Insured, 5.00%, 10/01/28 | | | 5,000,000 | | | | 5,318,900 | |
Department of Administration, Series B, AGMC Insured, 5.00%, 10/01/29 | | | 3,000,000 | | | | 3,190,050 | |
| | | | | | |
68 | | Annual Report | | | | franklintempleton.com |
FRANKLIN TAX-FREE TRUST
STATEMENT OF INVESTMENTS
Franklin Arizona Tax-Free Income Fund (continued)
| | | | | | | | |
| | | Principal
Amount | | | Value | |
| Municipal Bonds (continued) | | | | | | | | |
Arizona (continued) | | | | | | | | |
Arizona State Lottery Revenue, | | | | | | | | |
Series A, AGMC Insured, 5.00%, 7/01/28 | | $ | 15,540,000 | | | $ | 16,425,314 | |
Series A, AGMC Insured, 5.00%, 7/01/29 | | | 7,500,000 | | | | 7,923,150 | |
Arizona Transportation Board Highway Revenue, | | | | | | | | |
Refunding, 5.00%, 7/01/31 | | | 10,000,000 | | | | 11,442,400 | |
Subordinated, Refunding, Series A, 5.00%, 7/01/38 | | | 5,750,000 | | | | 6,343,802 | |
Subordinated, Series A, Pre-Refunded, 5.00%, 7/01/36 | | | 10,000,000 | | | | 11,043,400 | |
Central Arizona Water Conservation District Water Delivery O and M Revenue, | | | | | | | | |
Central Arizona Project, 5.00%, 1/01/34 | | | 1,000,000 | | | | 1,137,870 | |
Central Arizona Project, 5.00%, 1/01/36 | | | 1,000,000 | | | | 1,132,650 | |
El Mirage GO, AGMC Insured, 5.00%, 7/01/42 | | | 2,200,000 | | | | 2,407,306 | |
Gilbert Public Facilities Municipal Property Corp. Revenue, Pre-Refunded, 5.50%, 7/01/28 | | | 10,000,000 | | | | 10,530,200 | |
Glendale IDAR, | | | | | | | | |
Midwestern University, 5.00%, 5/15/35 | | | 5,000,000 | | | | 5,300,400 | |
Midwestern University, 5.125%, 5/15/40 | | | 10,000,000 | | | | 10,614,200 | |
Midwestern University, Refunding, 5.00%, 5/15/31 | | | 3,455,000 | | | | 3,795,974 | |
Senior Living, Royal Oaks Life Care Community, Refunding, 5.00%, 5/15/39 | | | 8,500,000 | | | | 9,328,750 | |
Glendale Municipal Property Corp. Excise Tax Revenue, | | | | | | | | |
Subordinate, Refunding, Series C, 5.00%, 7/01/38 | | | 12,000,000 | | | | 13,156,200 | |
Subordinate, Refunding, Series C, AGMC Insured, 5.00%, 7/01/38 | | | 6,530,000 | | | | 7,174,642 | |
Goodyear GO, 4.00%, 7/01/34 | | | 1,100,000 | | | | 1,160,456 | |
Goodyear Water and Sewer Revenue, | | | | | | | | |
Obligation, sub. lien, AGMC Insured, 5.00%, 7/01/45 | | | 1,000,000 | | | | 1,116,720 | |
Obligation, sub. lien, Refunding, AGMC Insured, 5.25%, 7/01/31 | | | 1,000,000 | | | | 1,104,180 | |
Obligation, sub. lien, Refunding, AGMC Insured, 5.50%, 7/01/41 | | | 1,500,000 | | | | 1,668,810 | |
Lake Havasu Wastewater System Revenue, | | | | | | | | |
senior lien, Refunding, Series B, AGMC Insured, 5.00%, 7/01/40 | | | 15,000,000 | | | | 16,637,400 | |
senior lien, Refunding, Series B, AGMC Insured, 5.00%, 7/01/43 | | | 9,155,000 | | | | 10,141,817 | |
Maricopa County Cartwright Elementary School District No. 83 GO, School Improvement, Project of 2010, Series A, AGMC Insured, 5.375%, 7/01/30 | | | 5,415,000 | | | | 5,960,399 | |
Maricopa County Hospital Revenue, Sun Health Corp., Pre-Refunded, 5.00%, 4/01/35 | | | 12,090,000 | | | | 14,006,628 | |
Maricopa County IDA, MFHR, Senior, Western Groves Apartments Project, Series A-1, AMBAC Insured, 5.30%, 12/01/22 | | | 990,000 | | | | 990,723 | |
Maricopa County IDA Education Revenue, | | | | | | | | |
Greathearts Arizona Projects, Refunding, Series A, 5.00%, 7/01/37 | | | 1,000,000 | | | | 1,126,110 | |
Greathearts Arizona Projects, Refunding, Series A, 5.00%, 7/01/52 | | | 1,000,000 | | | | 1,106,730 | |
Greathearts Arizona Projects, Series C, 5.00%, 7/01/37 | | | 850,000 | | | | 960,823 | |
Greathearts Arizona Projects, Series C, 5.00%, 7/01/48 | | | 1,350,000 | | | | 1,508,814 | |
Reid Traditional Schools Projects, 5.00%, 7/01/36 | | | 1,120,000 | | | | 1,193,718 | |
Reid Traditional Schools Projects, 5.00%, 7/01/47 | | | 2,125,000 | | | | 2,207,174 | |
Maricopa County IDA Health Facility Revenue, Catholic Healthcare West, Refunding, Series A, 6.00%, 7/01/39 | | | 4,860,000 | | | | 5,093,523 | |
Maricopa County IDA Senior Living Facilities Revenue, | | | | | | | | |
Christian Care Retirement Apartments Inc. Project, Refunding, Series A, 5.00%, 1/01/36 | | | 5,000,000 | | | | 5,585,950 | |
Christian Care Retirement Apartments Inc. Project, Refunding, Series D, 5.00%, 1/01/40 | | | 9,840,000 | | | | 10,935,586 | |
Maricopa County IDAR, | | | | | | | | |
Banner Health, Refunding, Series A, 5.00%, 1/01/38 | | | 20,000,000 | | | | 22,471,200 | |
Banner Health, Series A, 5.00%, 1/01/41 | | | 16,750,000 | | | | 18,928,002 | |
| | | | | | | | |
franklintempleton.com | | | | | | Annual Report | | 69 |
FRANKLIN TAX-FREE TRUST
STATEMENT OF INVESTMENTS
Franklin Arizona Tax-Free Income Fund (continued)
| | | | | | | | |
| | | Principal
Amount | | | Value | |
| Municipal Bonds (continued) | | | | | | | | |
Arizona (continued) | | | | | | | | |
Maricopa County PCC, | | | | | | | | |
PCR, El Paso Electric Co. Palo Verde Project, Refunding, Series A, 4.50%, 8/01/42 | | $ | 10,000,000 | | | $ | 10,384,700 | |
PCR, El Paso Electric Co. Palo Verde Project, Series A, 7.25%, 2/01/40 | | | 10,000,000 | | | | 10,467,200 | |
PCR, Public Service Co. of New Mexico Palo Verde Project, Refunding, Series A, 6.25%, 1/01/38 | | | 5,000,000 | | | | 5,397,000 | |
PCR, Southern California Edison Co., Refunding, Series B, 5.00%, 6/01/35 | | | 14,745,000 | | | | 15,658,305 | |
a Maricopa County School District No. 214 Tolleson Union High School GO, School Improvement, Project of 2017, Series A, 5.00%, 7/01/37 | | | 1,000,000 | | | | 1,153,510 | |
Maricopa County USD No. 11 Peoria GO, School Improvement, 5.00%, 7/01/31 | | | 5,100,000 | | | | 5,705,421 | |
a Maricopa County USD No. 95 Queen Creek GO, | | | | | | | | |
School Improvement, 5.00%, 7/01/33 | | | 500,000 | | | | 572,395 | |
School Improvement, 5.00%, 7/01/37 | | | 1,200,000 | | | | 1,360,200 | |
McAllister Academic Village LLC Revenue, | | | | | | | | |
Arizona State University Hassayampa Academic Village Project, Pre-Refunded, 5.25%, 7/01/33 | | | 2,000,000 | | | | 2,026,260 | |
Arizona State University Hassayampa Academic Village Project, Pre-Refunded, 5.00%, 7/01/38 | | | 5,000,000 | | | | 5,061,550 | |
Arizona State University Hassayampa Academic Village Project, Refunding, 5.00%, 7/01/33 | | | 2,000,000 | | | | 2,297,600 | |
Arizona State University Hassayampa Academic Village Project, Refunding, 5.00%, 7/01/36 | | | 4,140,000 | | | | 4,713,431 | |
Arizona State University Hassayampa Academic Village Project, Refunding, 5.00%, 7/01/38 | | | 4,515,000 | | | | 5,122,629 | |
Arizona State University Hassayampa Academic Village Project, Refunding, 5.00%, 7/01/39 | | | 4,150,000 | | | | 4,702,033 | |
Mohave County Union High School District No. 2 Colorado River GO, School Improvement, 5.00%, 7/01/35 | | | 1,000,000 | | | | 1,130,380 | |
Navajo County USD No. 6 Heber-Overgaard GO, School Improvement, Project of 2008, Assured Guaranty, Pre-Refunded, 5.50%, 7/01/28 | | | 1,045,000 | | | | 1,099,695 | |
Phoenix Civic Improvement Corp. Airport Revenue, | | | | | | | | |
junior lien, Refunding, Series D, 4.00%, 7/01/40 | | | 10,000,000 | | | | 10,194,900 | |
junior lien, Series A, Pre-Refunded, 5.00%, 7/01/40 | | | 10,000,000 | | | | 10,774,500 | |
senior lien, Series A, 5.00%, 7/01/47 | | | 9,710,000 | | | | 10,844,031 | |
Phoenix Civic Improvement Corp. Distribution Revenue, | | | | | | | | |
Capital Appreciation, Civic Plaza Expansion Project, Series B, NATL Insured, 5.50%, 7/01/27 | | | 3,945,000 | | | | 4,713,920 | |
Capital Appreciation, Civic Plaza Expansion Project, Series B, NATL Insured, 5.50%, 7/01/28 | | | 2,000,000 | | | | 2,401,840 | |
Capital Appreciation, Civic Plaza Expansion Project, Series B, NATL Insured, 5.50%, 7/01/29 | | | 2,000,000 | | | | 2,410,940 | |
Capital Appreciation, Civic Plaza Expansion Project, Series B, NATL Insured, 5.50%, 7/01/36 | | | 5,000,000 | | | | 6,243,450 | |
Capital Appreciation, Civic Plaza Expansion Project, Series B, NATL Insured, 5.50%, 7/01/37 | | | 7,000,000 | | | | 8,773,100 | |
Phoenix Civic Improvement Corp. Excise Tax Revenue, Subordinate, Refunding, Series A, 5.00%, 7/01/41 | | | 10,000,000 | | | | 11,292,900 | |
Phoenix Civic Improvement Corp. Wastewater System Revenue, senior lien, Refunding, 5.50%, 7/01/24 | | | 2,500,000 | | | | 2,534,050 | |
Phoenix Civic Improvement Corp. Water System Revenue, | | | | | | | | |
junior lien, 5.00%, 7/01/39 | | | 5,000,000 | | | | 5,720,200 | |
junior lien, Series A, 5.00%, 7/01/39 | | | 10,000,000 | | | | 11,298,700 | |
junior lien, Series A, Pre-Refunded, 5.00%, 7/01/39 | | | 14,780,000 | | | | 15,466,679 | |
Phoenix IDA Education Revenue, | | | | | | | | |
Facility, Great Hearts Academies Projects, Refunding, Series A, 5.00%, 7/01/36 | | | 4,065,000 | | | | 4,434,102 | |
Facility, Great Hearts Academies Projects, Refunding, Series A, 5.00%, 7/01/41 | | | 1,225,000 | | | | 1,311,987 | |
Facility, Great Hearts Academies Projects, Refunding, Series A, 5.00%, 7/01/46 | | | 1,335,000 | | | | 1,405,341 | |
Facility, JMF-Higley 2012 LLC Project, 5.00%, 12/01/34 | | | 1,355,000 | | | | 1,475,270 | |
Facility, JMF-Higley 2012 LLC Project, 5.00%, 12/01/39 | | | 5,610,000 | | | | 6,076,920 | |
Phoenix IDA Student Housing Revenue, | | | | | | | | |
Downtown Phoenix Student Housing LLC, Arizona State University Project, Series A, AMBAC Insured, 5.00%, 7/01/37 | | | 18,095,000 | | | | 18,104,409 | |
Downtown Phoenix Student Housing LLC, Arizona State University Project, Subordinate, Series C, AMBAC Insured, 5.00%, 7/01/37 | | | 8,735,000 | | | | 8,739,018 | |
Pima County IDA Lease Revenue, | | | | | | | | |
Clark County Detention Facility Project, 5.125%, 9/01/27 | | | 8,655,000 | | | | 8,680,273 | |
Clark County Detention Facility Project, 5.00%, 9/01/39 | | | 15,000,000 | | | | 15,039,000 | |
| | | | | | |
70 | | Annual Report | | | | franklintempleton.com |
FRANKLIN TAX-FREE TRUST
STATEMENT OF INVESTMENTS
Franklin Arizona Tax-Free Income Fund (continued)
| | | | | | | | |
| | | Principal
Amount | | | Value | |
| Municipal Bonds (continued) | | | | | | | | |
Arizona (continued) | | | | | | | | |
Pima County IDAR, | | | | | | | | |
Senior Living Facility, Christian Care Tucson Inc. Project, Refunding, Series A, 5.00%, 12/15/32 | | $ | 1,765,000 | | | $ | 1,978,300 | |
Senior Living Facility, Christian Care Tucson Inc. Project, Refunding, Series A, 5.00%, 6/15/37 | | | 2,240,000 | | | | 2,478,403 | |
Senior Living Facility, Christian Care Tucson Inc. Project, Series C, 5.00%, 12/15/47 | | | 3,840,000 | | | | 4,220,045 | |
Pima County USD No. 6 Marana GO, School Improvement, Project of 2014, Series C, BAM Insured, 5.00%, 7/01/36 | | | 2,385,000 | | | | 2,714,392 | |
Pima County USD No. 20 Vail GO, School Improvement and Refunding, BAM Insured, 5.00%, 7/01/36 | | | 3,305,000 | | | | 3,716,307 | |
Pima County USD No. 30 Sahuarita GO, | | | | | | | | |
School Improvement, BAM Insured, 5.00%, 7/01/33 | | | 2,665,000 | | | | 3,046,895 | |
School Improvement, BAM Insured, 5.00%, 7/01/34 | | | 2,800,000 | | | | 3,189,116 | |
Pinal County Community College District Revenue, Central Arizona College, BAM Insured, 5.00%, 7/01/34 | | | 1,065,000 | | | | 1,206,666 | |
Pinal County Electrical District No. 3 Electric System Revenue, | | | | | | | | |
Pre-Refunded, 5.25%, 7/01/33 | | | 1,500,000 | | | | 1,671,165 | |
Pre-Refunded, 5.25%, 7/01/41 | | | 6,800,000 | | | | 7,575,948 | |
Refunding, 5.00%, 7/01/35 | | | 1,195,000 | | | | 1,352,083 | |
Pinal County Electrical District No. 4 Electric System Revenue, | | | | | | | | |
Pre-Refunded, 6.00%, 12/01/28 | | | 740,000 | | | | 765,537 | |
Pre-Refunded, 6.00%, 12/01/38 | | | 1,150,000 | | | | 1,189,687 | |
Queen Creek Excise Tax and State Shared Revenue, | | | | | | | | |
Series A, 5.00%, 8/01/42 | | | 2,500,000 | | | | 2,871,925 | |
Series A, 5.00%, 8/01/47 | | | 3,000,000 | | | | 3,432,060 | |
Rio Nuevo Multipurpose Facilities District Excise Tax Revenue, sub. lien, Assured Guaranty, Pre-Refunded, 6.50%, 7/15/24 | | | 4,220,000 | | | | 4,299,716 | |
Salt River Project Agricultural Improvement and Power District Electric System Revenue, | | | | | | | | |
Salt River Project, Refunding, Series A, 5.00%, 12/01/30 | | | 4,500,000 | | | | 5,023,575 | |
Salt River Project, Refunding, Series A, 5.00%, 1/01/37 | | | 5,000,000 | | | | 5,841,050 | |
Salt River Project, Refunding, Series A, 5.00%, 1/01/38 | | | 13,395,000 | | | | 15,425,548 | |
Salt River Project, Refunding, Series A, 5.00%, 1/01/38 | | | 10,000,000 | | | | 11,663,600 | |
Salt River Project, Refunding, Series A, 5.00%, 1/01/39 | | | 8,680,000 | | | | 10,107,947 | |
Salt River Project, Refunding, Series A, 5.00%, 12/01/41 | | | 5,340,000 | | | | 6,023,360 | |
Salt River Project, Series A, Pre-Refunded, 5.00%, 1/01/39 | | | 5,000,000 | | | | 5,150,550 | |
Salt Verde Financial Corp. Senior Gas Revenue, | | | | | | | | |
5.00%, 12/01/32 | | | 10,000,000 | | | | 11,653,000 | |
5.00%, 12/01/37 | | | 5,000,000 | | | | 5,866,150 | |
Scottsdale Municipal Property Corp. Excise Tax Revenue, Water and Sewer Improvements Project, Pre-Refunded, 5.00%, 7/01/33 | | | 10,660,000 | | | | 11,498,409 | |
Student and Academic Services LLC Lease Revenue, | | | | | | | | |
Northern Arizona University Project, BAM Insured, 5.00%, 6/01/33 | | | 1,000,000 | | | | 1,120,380 | |
Northern Arizona University Project, BAM Insured, 5.00%, 6/01/39 | | | 1,400,000 | | | | 1,539,930 | |
Northern Arizona University Project, BAM Insured, 5.00%, 6/01/44 | | | 3,155,000 | | | | 3,451,665 | |
Tempe Excise Tax Revenue, Series A, Pre-Refunded, 5.00%, 7/01/31 | | | 2,325,000 | | | | 2,571,566 | |
Town of Gilbert Pledged Revenue, sub. lien, Obligations, 5.00%, 7/01/45 | | | 10,000,000 | | | | 11,181,300 | |
Tucson Airport Authority Inc. Revenue, sub. lien, AMBAC Insured, 5.35%, 6/01/31 | | | 10,000,000 | | | | 10,030,400 | |
Tucson IDA Lease Revenue, University of Arizona/Marshall Foundation Project, Series A, AMBAC Insured, 5.00%, 7/15/32 | | | 985,000 | | | | 986,389 | |
Tucson Water System Revenue, | | | | | | | | |
Pre-Refunded, 5.00%, 7/01/28 | | | 1,165,000 | | | | 1,217,542 | |
Pre-Refunded, 5.00%, 7/01/29 | | | 1,670,000 | | | | 1,745,317 | |
Pre-Refunded, 5.00%, 7/01/32 | | | 5,000,000 | | | | 5,530,250 | |
Refunding, 5.00%, 7/01/28 | | | 65,000 | | | | 67,888 | |
Refunding, 5.00%, 7/01/29 | | | 95,000 | | | | 99,195 | |
| | | | | | | | |
franklintempleton.com | | | | | | Annual Report | | 71 |
FRANKLIN TAX-FREE TRUST
STATEMENT OF INVESTMENTS
Franklin Arizona Tax-Free Income Fund (continued)
| | | | | | | | |
| | | Principal
Amount | | | Value | |
| Municipal Bonds (continued) | | | | | | | | |
Arizona (continued) | | | | | | | | |
University Medical Center Corp. Hospital Revenue, | | | | | | | | |
Tucson, Pre-Refunded, 5.625%, 7/01/36 | | $ | 5,000,000 | | | $ | 5,867,750 | |
Tucson, Pre-Refunded, 6.00%, 7/01/39 | | | 5,000,000 | | | | 5,665,350 | |
Tucson, Pre-Refunded, 6.50%, 7/01/39 | | | 4,750,000 | | | | 5,051,150 | |
Yavapai County IDA Hospital Revenue, | | | | | | | | |
Yavapai Regional Medical Center, Refunding, 5.00%, 8/01/34 | | | 4,250,000 | | | | 4,620,600 | |
Yavapai Regional Medical Center, Refunding, 5.00%, 8/01/36 | | | 1,310,000 | | | | 1,418,337 | |
Yavapai Regional Medical Center, Series B, Pre-Refunded, 5.625%, 8/01/33 | | | 2,315,000 | | | | 2,355,188 | |
Yavapai Regional Medical Center, Series B, Pre-Refunded, 5.625%, 8/01/37 | | | 12,435,000 | | | | 12,650,872 | |
| | | | | | | | |
| | | | | | | 924,670,592 | |
| | | | | | | | |
| | |
U.S. Territories 1.3% | | | | | | | | |
Guam 1.3% | | | | | | | | |
Guam Power Authority Revenue, | | | | | | | | |
Series A, AGMC Insured, 5.00%, 10/01/39 | | | 6,490,000 | | | | 7,002,191 | |
Series A, AGMC Insured, 5.00%, 10/01/44 | | | 5,325,000 | | | | 5,722,671 | |
| | | | | | | | |
| | | | | | | 12,724,862 | |
| | | | | | | | |
Total Municipal Bonds before Short Term Investments (Cost $905,960,949) | | | | | | | 937,395,454 | |
| | | | | | | | |
Short Term Investments (Cost $300,000) 0.0%† | | | | | | | | |
Municipal Bonds 0.0%† | | | | | | | | |
Arizona 0.0%† | | | | | | | | |
b Arizona Health Facilities Authority Revenue, Banner Health, Series C, LOC Bank of America, Daily VRDN and Put, 1.09%, 1/01/46 | | | 300,000 | | | | 300,000 | |
| | | | | | | | |
Total Investments (Cost $906,260,949) 99.7% | | | | | | | 937,695,454 | |
Other Assets, less Liabilities 0.3% | | | | | | | 2,351,321 | |
| | | | | | | | |
Net Assets 100.0% | | | | | | $ | 940,046,775 | |
| | | | | | | | |
See Abbreviations on page 162.
†Rounds to less than 0.1% of net assets.
aSecurity purchased on a when-issued basis. See Note 1(b).
bVariable rate demand notes (VRDNs) are obligations which contain a floating or variable interest rate adjustment formula and an unconditional right of demand to receive payment of the principal balance plus accrued interest at specified dates. Unless otherwise noted, the coupon rate is determined based on factors including supply and demand, underlying credit, tax treatment, and current short term rates. The coupon rate shown represents the rate at period end.
| | | | | | |
72 | | Annual Report | | | The accompanying notes are an integral part of these financial statements. | | franklintempleton.com |
FRANKLIN TAX-FREE TRUST
Financial Highlights
Franklin Colorado Tax-Free Income Fund
| | | | | | | | | | | | | | | | | | | | |
| | | Year Ended February 28, | |
| | | 2018 | | | 2017 | | | 2016a | | | 2015 | | | 2014 | |
Class A | | | | | | | | | | | | | | | | | | | | |
Per share operating performance | | | | | | | | | | | | | | | | | | | | |
(for a share outstanding throughout the year) | | | | | | | | | | | | | | | | | | | | |
Net asset value, beginning of year | | | $11.66 | | | | $11.94 | | | | $12.13 | | | | $11.66 | | | | $12.44 | |
| | | | | |
Income from investment operationsb: | | | | | | | | | | | | | | | | | | | | |
Net investment incomec | | | 0.37 | | | | 0.44 | | | | 0.46 | | | | 0.47 | | | | 0.47 | |
Net realized and unrealized gains (losses) | | | (0.32) | | | | (0.28) | | | | (0.20) | | | | 0.47 | | | | (0.79) | |
| | | | | |
Total from investment operations | | | 0.05 | | | | 0.16 | | | | 0.26 | | | | 0.94 | | | | (0.32) | |
| | | | | |
Less distributions from net investment income | | | (0.39) | | | | (0.44) | | | | (0.45) | | | | (0.47) | | | | (0.46) | |
| | | | | |
Net asset value, end of year | | | $11.32 | | | | $11.66 | | | | $11.94 | | | | $12.13 | | | | $11.66 | |
| | | | | |
Total returnd | | | 0.38% | | | | 1.31% | | | | 2.26% | | | | 8.22% | | | | (2.56)% | |
| | | | | |
Ratios to average net assets | | | | | | | | | | | | | | | | | | | | |
Expenses | | | 0.68% | e | | | 0.65% | | | | 0.65% | | | | 0.65% | | | | 0.64% | |
Net investment income | | | 3.23% | | | | 3.67% | | | | 3.87% | | | | 3.94% | | | | 4.00% | |
| | | | | |
Supplemental data | | | | | | | | | | | | | | | | | | | | |
Net assets, end of year (000’s) | | | $521,249 | | | | $553,317 | | | | $553,114 | | | | $549,134 | | | | $520,275 | |
Portfolio turnover rate | | | 16.78% | | | | 13.61% | | | | 5.17% | | | | 2.20% | | | | 7.74% | |
aFor the year ended February 29.
bThe amount shown for a share outstanding throughout the period may not correlate with the Statement of Operations for the period due to the timing of sales and repurchases of the Fund’s shares in relation to income earned and/or fluctuating fair value of the investments of the Fund.
cBased on average daily shares outstanding.
dTotal return does not reflect sales commissions or contingent deferred sales charges, if applicable.
eBenefit of waiver and payments by affiliates rounds to less than 0.01%.
| | | | | | | | |
franklintempleton.com | | | | The accompanying notes are an integral part of these financial statements. | | | Annual Report | | 73 |
FRANKLIN TAX-FREE TRUST
FINANCIAL HIGHLIGHTS
Franklin Colorado Tax-Free Income Fund (continued)
| | | | | | | | | | | | | | | | | | | | |
| | | Year Ended February 28, | |
| | | 2018 | | | 2017 | | | 2016a | | | 2015 | | | 2014 | |
Class C | | | | | | | | | | | | | | | | | | | | |
Per share operating performance | | | | | | | | | | | | | | | | | | | | |
(for a share outstanding throughout the year) | | | | | | | | | | | | | | | | | | | | |
Net asset value, beginning of year | | | $11.79 | | | | $12.07 | | | | $12.26 | | | | $11.78 | | | | $12.56 | |
| | | | | |
Income from investment operationsb: | | | | | | | | | | | | | | | | | | | | |
Net investment incomec | | | 0.32 | | | | 0.38 | | | | 0.40 | | | | 0.41 | | | | 0.41 | |
Net realized and unrealized gains (losses) | | | (0.33) | | | | (0.29) | | | | (0.20) | | | | 0.48 | | | | (0.80) | |
| | | | | |
Total from investment operations | | | (0.01) | | | | 0.09 | | | | 0.20 | | | | 0.89 | | | | (0.39) | |
| | | | | |
Less distributions from net investment income | | | (0.32) | | | | (0.37) | | | | (0.39) | | | | (0.41) | | | | (0.39) | |
| | | | | |
Net asset value, end of year | | | $11.46 | | | | $11.79 | | | | $12.07 | | | | $12.26 | | | | $11.78 | |
| | | | | |
Total returnd | | | (0.10)% | | | | 0.73% | | | | 1.67% | | | | 7.64% | | | | (3.07)% | |
| | | | | |
Ratios to average net assets | | | | | | | | | | | | | | | | | | | | |
Expenses | | | 1.23% | e | | | 1.20% | | | | 1.20% | | | | 1.20% | | | | 1.19% | |
Net investment income | | | 2.68% | | | | 3.12% | | | | 3.32% | | | | 3.39% | | | | 3.45% | |
| | | | | |
Supplemental data | | | | | | | | | | | | | | | | | | | | |
Net assets, end of year (000’s) | | | $99,811 | | | | $115,472 | | | | $111,450 | | | | $109,552 | | | | $107,705 | |
Portfolio turnover rate | | | 16.78% | | | | 13.61% | | | | 5.17% | | | | 2.20% | | | | 7.74% | |
aFor the year ended February 29.
bThe amount shown for a share outstanding throughout the period may not correlate with the Statement of Operations for the period due to the timing of sales and repurchases of the Fund’s shares in relation to income earned and/or fluctuating fair value of the investments of the Fund.
cBased on average daily shares outstanding.
dTotal return does not reflect sales commissions or contingent deferred sales charges, if applicable.
eBenefit of waiver and payments by affiliates rounds to less than 0.01%.
| | | | | | |
74 | | Annual Report | | | The accompanying notes are an integral part of these financial statements. | | franklintempleton.com |
FRANKLIN TAX-FREE TRUST
FINANCIAL HIGHLIGHTS
Franklin Colorado Tax-Free Income Fund (continued)
| | |
| | | Year Ended
February 28,
2018a |
Class R6 | | |
| Per share operating performance | | |
(for a share outstanding throughout the year) | | |
Net asset value, beginning of year | | $11.64 |
| |
Income from investment operationsb: | | |
Net investment incomec | | 0.23 |
Net realized and unrealized gains (losses) | | (0.32) |
| |
Total from investment operations | | (0.09) |
| |
Less distributions from net investment income | | (0.22) |
| |
Net asset value, end of year | | $11.33 |
| |
Total returnd | | (0.79)% |
| |
Ratios to average net assetse | | |
Expenses before waiver and payments by affiliates | | 0.57% |
Expenses net of waiver and payments by affiliates | | 0.54% |
Net investment income | | 3.37% |
| |
Supplemental data | | |
Net assets, end of year (000’s) | | $7,678 |
Portfolio turnover rate | | 16.78% |
aFor the period August 1, 2017 (effective date) to February 28, 2018.
bThe amount shown for a share outstanding throughout the period may not correlate with the Statement of Operations for the period due to the timing of sales and repurchases of the Fund’s shares in relation to income earned and/or fluctuating fair value of the investments of the Fund.
cBased on average daily shares outstanding.
dTotal return is not annualized for periods less than one year.
eRatios are annualized for periods less than one year.
| | | | | | | | |
franklintempleton.com | | | | The accompanying notes are an integral part of these financial statements. | | | Annual Report | | 75 |
FRANKLIN TAX-FREE TRUST
FINANCIAL HIGHLIGHTS
Franklin Colorado Tax-Free Income Fund (continued)
| | | | | | | | | | | | | | | | | | | | |
| | | Year Ended February 28, | |
| | | 2018 | | | 2017 | | | 2016a | | | 2015 | | | 2014 | |
Advisor Class | | | | | | | | | | | | | | | | | | | | |
Per share operating performance | | | | | | | | | | | | | | | | | | | | |
(for a share outstanding throughout the year) | | | | | | | | | | | | | | | | | | | | |
Net asset value, beginning of year | | | $11.66 | | | | $11.94 | | | | $12.13 | | | | $11.66 | | | | $12.43 | |
| | | | | |
Income from investment operationsb: | | | | | | | | | | | | | | | | | | | | |
Net investment incomec | | | 0.39 | | | | 0.45 | | | | 0.47 | | | | 0.48 | | | | 0.48 | |
Net realized and unrealized gains (losses) | | | (0.33) | | | | (0.28) | | | | (0.19) | | | | 0.48 | | | | (0.78) | |
| | | | | |
Total from investment operations | | | 0.06 | | | | 0.17 | | | | 0.28 | | | | 0.96 | | | | (0.30) | |
| | | | | |
Less distributions from net investment income | | | (0.40) | | | | (0.45) | | | | (0.47) | | | | (0.49) | | | | (0.47) | |
| | | | | |
Net asset value, end of year. | | | $11.32 | | | | $11.66 | | | | $11.94 | | | | $12.13 | | | | $11.66 | |
| | | | | |
Total return | | | 0.48% | | | | 1.41% | | | | 2.36% | | | | 8.34% | | | | (2.39)% | |
| | | | | |
Ratios to average net assets | | | | | | | | | | | | | | | | | | | | |
Expenses | | | 0.58%d | | | | 0.55% | | | | 0.55% | | | | 0.55% | | | | 0.54% | |
Net investment income | | | 3.33% | | | | 3.77% | | | | 3.97% | | | | 4.04% | | | | 4.10% | |
| | | | | |
Supplemental data | | | | | | | | | | | | | | | | | | | | |
Net assets, end of year (000’s) | | | $79,093 | | | | $73,538 | | | | $50,589 | | | | $44,988 | | | | $34,393 | |
Portfolio turnover rate | | | 16.78% | | | | 13.61% | | | | 5.17% | | | | 2.20% | | | | 7.74% | |
aFor the year ended February 29.
bThe amount shown for a share outstanding throughout the period may not correlate with the Statement of Operations for the period due to the timing of sales and repurchases of the Fund’s shares in relation to income earned and/or fluctuating fair value of the investments of the Fund.
cBased on average daily shares outstanding.
dBenefit of waiver and payments by affiliates rounds to less than 0.01%.
| | | | | | |
76 | | Annual Report | | | The accompanying notes are an integral part of these financial statements. | | franklintempleton.com |
FRANKLIN TAX-FREE TRUST
Statement of Investments, February 28, 2018
Franklin Colorado Tax-Free Income Fund
| | | | | | | | |
| | | Principal
Amount | | | Value | |
Municipal Bonds 98.6% | | | | | | | | |
Colorado 97.1% | | | | | | | | |
Adams 12 Five Star Schools GO, Series B, 5.00%, 12/15/36 | | $ | 5,000,000 | | | $ | 5,713,150 | |
Adams and Weld Counties School District No. 27J Brighton GO, | | | | | | | | |
5.00%, 12/01/40 | | | 7,500,000 | | | | 8,496,450 | |
5.00%, 12/01/42 | | | 10,000,000 | | | | 11,496,600 | |
Adams State College Board of Trustees Auxiliary Facilities Revenue, | | | | | | | | |
Improvement, Series A, Pre-Refunded, 5.50%, 5/15/34 | | | 2,000,000 | | | | 2,095,700 | |
Improvement, Series A, Pre-Refunded, 5.50%, 5/15/39 | | | 2,150,000 | | | | 2,252,878 | |
Adams State College Board of Trustees Institutional Enterprise Revenue, 5.00%, 5/15/37 | | | 630,000 | | | | 696,686 | |
Pre-Refunded, 5.00%, 5/15/37 | | | 370,000 | | | | 410,419 | |
Anthem West Metropolitan District GO, City and County of Broomfield, Refunding, BAM Insured, 5.00%, 12/01/35 | | | 3,000,000 | | | | 3,315,750 | |
Arapahoe County School District No. 1 GO, Englewood Schools, 5.00%, 12/01/42 | | | 7,000,000 | | | | 7,983,080 | |
Auraria Higher Education Center Parking Enterprise Revenue, 5th and Walnut Parking Garage Project, Series A, AGMC Insured, 5.00%, 4/01/34 | | | 6,150,000 | | | | 6,786,463 | |
Aurora COP, Refunding, Series A, 5.00%, 12/01/30 | | | 5,680,000 | | | | 5,986,038 | |
Aurora Hospital Revenue, The Children’s Hospital Assn. Project, Series A, 5.00%, 12/01/40 | | | 2,500,000 | | | | 2,641,275 | |
Aurora Water Revenue, Green Bond, first lien, Refunding, 5.00%, 8/01/46 | | | 5,000,000 | | | | 5,643,400 | |
Board of Trustees for Western State College Revenue, | | | | | | | | |
Pre-Refunded, 5.00%, 5/15/34 | | | 2,000,000 | | | | 2,083,820 | |
Pre-Refunded, 5.00%, 5/15/39 | | | 2,000,000 | | | | 2,083,820 | |
Board of Trustees of the Colorado School of Mines Revenue, Golden, Enterprise Improvement, Series A, Pre-Refunded, 5.25%, 12/01/37 | | | 2,000,000 | | | | 2,058,660 | |
Boulder Larimer and Weld Counties St. Vrain Valley School District No. RE-1J GO, Pre-Refunded, 5.00%, 12/15/33 | | | 5,300,000 | | | | 5,451,103 | |
Boulder Valley School District No. RE-2 Boulder GO, | | | | | | | | |
5.00%, 12/01/34 | | | 6,000,000 | | | | 6,249,240 | |
5.00%, 12/01/41 | | | 5,000,000 | | | | 5,657,200 | |
Brighton Water Activity Enterprise Revenue, Water System Project, Series A, Assured Guaranty, Pre- Refunded, 5.25%, 12/01/34 | | | 5,380,000 | | | | 5,724,589 | |
Castle Rock Sales and Use Tax Revenue, | | | | | | | | |
5.00%, 6/01/31 | | | 1,800,000 | | | | 2,016,180 | |
5.00%, 6/01/32 | | | 1,845,000 | | | | 2,062,728 | |
5.00%, 6/01/35 | | | 2,775,000 | | | | 3,092,377 | |
Colorado Educational and Cultural Facilities Authority Revenue, | | | | | | | | |
Alexander Dawson School, Colorado Project, 5.00%, 2/15/40 | | | 5,280,000 | | | | 5,561,002 | |
Student Housing, Campus Village Apartments Project, Refunding, 5.50%, 6/01/38 | | | 13,500,000 | | | | 13,712,625 | |
University of Denver Project, Refunding, NATL Insured, 5.00%, 3/01/35 | | | 5,000,000 | | | | 6,090,800 | |
University of Denver Project, Series A, 5.00%, 3/01/47. | | | 3,950,000 | | | | 4,436,363 | |
Colorado Health Facilities Authority Revenue, | | | | | | | | |
Catholic Health Initiatives, Refunding, Series A, 5.00%, 7/01/39 | | | 5,000,000 | | | | 5,128,600 | |
Catholic Health Initiatives, Series D, 6.125%, 10/01/28 | | | 2,500,000 | | | | 2,558,150 | |
Catholic Health Initiatives, Series D, 6.25%, 10/01/33 | | | 2,000,000 | | | | 2,049,580 | |
Children’s Hospital Colorado Project, Series A, 5.00%, 12/01/44 | | | 5,000,000 | | | | 5,511,250 | |
Covenant Retirement Communities Inc., Refunding, Series A, 5.00%, 12/01/35 | | | 7,150,000 | | | | 7,807,013 | |
Covenant Retirement Communities Inc., Series A, 5.75%, 12/01/36 | | | 5,000,000 | | | | 5,729,200 | |
The Evangelical Lutheran Good Samaritan Society Project, 5.50%, 6/01/33 | | | 1,000,000 | | | | 1,128,260 | |
The Evangelical Lutheran Good Samaritan Society Project, 5.625%, 6/01/43 | | | 4,000,000 | | | | 4,479,280 | |
The Evangelical Lutheran Good Samaritan Society Project, Refunding, 5.00%, 12/01/33 | | | 2,500,000 | | | | 2,651,750 | |
The Evangelical Lutheran Good Samaritan Society Project, Refunding, 5.00%, 6/01/47 | | | 6,000,000 | | | | 6,498,240 | |
The Evangelical Lutheran Good Samaritan Society Project, Refunding, Series A, 5.00%, 6/01/40 | | | 4,000,000 | | | | 4,288,280 | |
| | | | | | | | |
franklintempleton.com | | | | | | Annual Report | | 77 |
FRANKLIN TAX-FREE TRUST
STATEMENT OF INVESTMENTS
Franklin Colorado Tax-Free Income Fund (continued)
| | | | | | | | |
| | | Principal
Amount | | | Value | |
Municipal Bonds (continued) | | | | | | | | |
Colorado (continued) | | | | | | | | |
Colorado Health Facilities Authority Revenue, (continued) | | | | | | | | |
The Evangelical Lutheran Good Samaritan Society Project, Refunding, Series A, 5.00%, 6/01/45 | | $ | 2,750,000 | | | $ | 2,939,200 | |
Hospital, Boulder Community Hospital Project, Series A, 6.00%, 10/01/35 | | | 5,460,000 | | | | 5,948,888 | |
Hospital, Boulder Community Hospital Project, Series A, Pre-Refunded, 6.00%, 10/01/35 | | | 40,000 | | | | 44,302 | |
Hospital, NCMC Inc. Project, Series A, AGMC Insured, Pre-Refunded, 5.50%, 5/15/30 | | | 7,900,000 | | | | 8,268,298 | |
Hospital, Parkview Medical Center Inc. Project, 5.00%, 9/01/46 | | | 5,000,000 | | | | 5,424,700 | |
Hospital, Refunding, Series C, AGMC Insured, 5.25%, 3/01/40 | | | 5,000,000 | | | | 5,162,600 | |
Poudre Valley Health Care Inc. and Medical Center of the Rockies, Refunding, Series A, AGMC Insured, 5.20%, 3/01/31 | | | 9,500,000 | | | | 9,817,490 | |
Sisters of Charity of Leavenworth Health System, Refunding, Series A, 5.00%, 1/01/40 | | | 7,320,000 | | | | 7,672,092 | |
Valley View Hospital Assn. Project, 5.00%, 5/15/40 | | | 2,000,000 | | | | 2,184,120 | |
Valley View Hospital Assn. Project, 5.00%, 5/15/45 | | | 1,000,000 | | | | 1,088,080 | |
Valley View Hospital Assn. Project, Pre-Refunded, 5.75%, 5/15/36 | | | 2,000,000 | | | | 2,018,160 | |
Colorado High Performance Transportation Enterprise Revenue, C-470 Express Lanes, 5.00%, 12/31/47 | | | 2,555,000 | | | | 2,776,237 | |
Colorado Mesa University Enterprise Revenue, Board of Trustees, Colorado Mesa University, 5.00%, 5/15/45 | | | 4,000,000 | | | | 4,481,960 | |
Colorado School of Mines Institutional Enterprise Revenue, | | | | | | | | |
Board of Trustees, Series A, 5.00%, 12/01/42 | | | 2,450,000 | | | | 2,774,968 | |
Board of Trustees, Series A, 5.00%, 12/01/47 | | | 3,000,000 | | | | 3,381,990 | |
junior lien, Series B, 5.00%, 12/01/47 | | | 5,000,000 | | | | 5,636,650 | |
Refunding, Series B, 5.00%, 12/01/32 | | | 110,000 | | | | 123,123 | |
Colorado Springs Public Facilities Authority COP, U.S. Olympic Committee Project, Assured Guaranty, Pre-Refunded, 5.00%, 11/01/39 | | | 11,305,000 | | | | 11,950,629 | |
Colorado Springs Utilities System Revenue, Improvement, Series B-1, 5.00%, 11/15/38 | | | 4,000,000 | | | | 4,528,280 | |
Refunding, Series A, 5.00%, 11/15/40 | | | 3,000,000 | | | | 3,407,580 | |
Refunding, Series A, 5.00%, 11/15/45 | | | 2,665,000 | | | | 3,017,286 | |
Refunding, Series A-2, 5.00%, 11/15/44 | | | 5,000,000 | | | | 5,677,600 | |
Refunding, Series A-2, 5.00%, 11/15/47 | | | 5,000,000 | | | | 5,722,950 | |
Series D-1, Pre-Refunded, 5.25%, 11/15/33 | | | 5,000,000 | | | | 5,483,550 | |
Colorado State Board of Governors University Enterprise System Revenue, | | | | | | | | |
Pre-Refunded, 5.00%, 3/01/44 | | | 2,675,000 | | | | 3,056,214 | |
Refunding, Series A, 4.00%, 3/01/40 | | | 5,000,000 | | | | 5,175,950 | |
Refunding, Series B, 5.00%, 3/01/41 | | | 1,000,000 | | | | 1,136,410 | |
Refunding, Series C, 5.00%, 3/01/43 | | | 5,000,000 | | | | 5,700,550 | |
Series A, 5.00%, 3/01/34 | | | 20,000 | | | | 20,646 | |
Series A, 5.00%, 3/01/39 | | | 145,000 | | | | 149,639 | |
Series A, 5.00%, 3/01/40 | | | 3,010,000 | | | | 3,359,250 | |
Series A, Pre-Refunded, 5.00%, 3/01/34 | | | 2,230,000 | | | | 2,307,426 | |
Series A, Pre-Refunded, 5.00%, 3/01/39 | | | 7,055,000 | | | | 7,299,950 | |
Series A, Pre-Refunded, 5.00%, 3/01/40 | | | 3,990,000 | | | | 4,688,250 | |
Series C, Pre-Refunded, 5.00%, 3/01/44 | | | 2,460,000 | | | | 2,804,277 | |
Colorado State Building Excellent Schools Today COP, | | | | | | | | |
Series G, Pre-Refunded, 5.00%, 3/15/32 | | | 10,000,000 | | | | 10,972,400 | |
Series I, 5.00%, 3/15/36 | | | 3,000,000 | | | | 3,337,740 | |
Series J, 5.25%, 3/15/42. | | | 5,000,000 | | | | 5,794,500 | |
Colorado State COP, UCDHSC Fitzsimons Academic Projects, Refunding, Series A, 5.00%, 11/01/29 | | | 3,105,000 | | | | 3,517,748 | |
Colorado State Higher Education Capital Construction Lease Purchase Financing Program COP, Pre-Refunded, 5.50%, 11/01/27 | | | 7,275,000 | | | | 7,478,628 | |
| | | | | | |
78 | | Annual Report | | | | franklintempleton.com |
FRANKLIN TAX-FREE TRUST
STATEMENT OF INVESTMENTS
Franklin Colorado Tax-Free Income Fund (continued)
| | | | | | | | |
| | | Principal
Amount | | | Value | |
Municipal Bonds (continued) | | | | | | | | |
Colorado (continued) | | | | | | | | |
Colorado Water Resources and Power Development Authority Water Resources Revenue, | | | | | | | | |
Donala Water and Sanitation District Project, Series C, 5.00%, 9/01/36 | | $ | 1,900,000 | | | $ | 2,065,433 | |
Fountain Colorado Electric Water and Wastewater Utility Enterprise Project, Series A, AGMC Insured, 5.00%, 9/01/38 | | | 1,210,000 | | | | 1,327,116 | |
Commerce City Northern Infrastructure General Improvement District GO, Refunding and Improvement, AGMC Insured, 5.00%, 12/01/31 | | | 2,040,000 | | | | 2,278,517 | |
Commerce City Sales and Use Tax Revenue, AGMC Insured, 5.00%, 8/01/41 | | | 4,000,000 | | | | 4,467,880 | |
Consolidated Bell Mountain Ranch Metropolitan District GO, Douglas County, Refunding, AGMC Insured, 5.00%, 12/01/39 | | | 3,160,000 | | | | 3,314,240 | |
Denver City and County Airport System Revenue, Subordinate, Series B, 5.00%, 11/15/43 | | | 5,000,000 | | | | 5,509,350 | |
Denver City and County Board of Water Commissioners Water Revenue, Green Bonds, Series A, 5.00%, 9/15/47 | | | 10,000,000 | | | | 11,558,100 | |
Denver City and County Dedicated Tax Revenue, | | | | | | | | |
Refunding and Improvement, Series A, 5.00%, 8/01/44 | | | 6,915,000 | | | | 7,815,679 | |
Refunding and Improvement, Series A, 4.00%, 8/01/46 | | | 8,040,000 | | | | 8,277,341 | |
Denver City and County School District No. 1 COP, Series C, 5.00%, 12/15/30 | | | 4,000,000 | | | | 4,494,160 | |
Denver City and County School District No. 1 GO, 5.00%, 12/01/41 | | | 12,440,000 | | | | 14,248,403 | |
Denver Convention Center Hotel Authority Revenue, Senior, Refunding, 5.00%, 12/01/40 | | | 9,775,000 | | | | 10,709,001 | |
Denver Health and Hospital Authority Healthcare Revenue, | | | | | | | | |
Recovery Zone Facility, 5.50%, 12/01/30 | | | 1,500,000 | | | | 1,589,145 | |
Recovery Zone Facility, 5.625%, 12/01/40 | | | 4,000,000 | | | | 4,205,560 | |
Series A, 5.25%, 12/01/45 | | | 9,250,000 | | | | 9,911,467 | |
E-470 Public Highway Authority Revenue, | | | | | | | | |
senior bond, Capital Appreciation, Series B, NATL Insured, zero cpn., 9/01/32 | | | 7,800,000 | | | | 3,690,258 | |
senior bond, Capital Appreciation, Series B, NATL Insured, zero cpn., 9/01/33 | | | 3,000,000 | | | | 1,339,530 | |
senior bond, Capital Appreciation, Series B, NATL Insured, zero cpn., 9/01/34 | | | 14,075,000 | | | | 5,932,753 | |
senior bond, Series C, 5.25%, 9/01/25 | | | 2,500,000 | | | | 2,691,250 | |
Eagle River Water and Sanitation District Enterprise Wastewater Revenue, 5.00%, 12/01/42 | | | 3,500,000 | | | | 3,895,885 | |
Eagle River Water and Sanitation District GO, 5.00%, 12/01/45 | | | 1,360,000 | | | | 1,536,569 | |
Erie Wastewater Enterprise Revenue, | | | | | | | | |
Series A, Assured Guaranty, Pre-Refunded, 5.00%, 12/01/33 | | | 2,860,000 | | | | 3,030,914 | |
Series A, Assured Guaranty, Pre-Refunded, 5.00%, 12/01/37 | | | 5,120,000 | | | | 5,425,971 | |
Fort Lewis College Board of Trustees Enterprise Revenue, Series B, NATL Insured, 5.00%, 10/01/37 | | | 1,515,000 | | | | 1,519,454 | |
Gunnison Watershed School District No. RE-1J GO, Gunnison and Saguache Counties, Pre-Refunded, 5.25%, 12/01/33 | | | 1,240,000 | | | | 1,275,898 | |
Ignacio School District 11JT GO, La Plata and Archuleta Counties, Pre-Refunded, 5.00%, 12/01/31 | | | 1,215,000 | | | | 1,355,247 | |
Meridian Metropolitan District GO, In Douglas County, Refunding, Series A, 5.00%, 12/01/41 | | | 5,000,000 | | | | 5,420,050 | |
Mesa State College Board of Trustees Auxiliary Facilities System Enterprise Revenue, Refunding, Series A, 5.00%, 5/15/33 | | | 3,455,000 | | | | 3,583,353 | |
Metropolitan State University of Denver Institutional Enterprise Revenue, Aerospace and Engineering Sciences Building Project, 5.00%, 12/01/45 | | | 4,000,000 | | | | 4,481,640 | |
Park 70 Metropolitan District GO, | | | | | | | | |
City of Aurora, Refunding and Improvement, 5.00%, 12/01/36 | | | 1,000,000 | | | | 1,055,000 | |
City of Aurora, Refunding and Improvement, 5.00%, 12/01/46 | | | 1,500,000 | | | | 1,573,545 | |
Park Creek Metropolitan District Revenue, | | | | | | | | |
Senior Limited Property Tax Supported, Improvement, Assured Guaranty, Pre-Refunded, 6.375%, 12/01/37 | | | 7,000,000 | | | | 7,577,220 | |
Senior Limited Property Tax Supported, Refunding, Series A, 5.00%, 12/01/41 | | | 3,000,000 | | | | 3,315,750 | |
Senior Limited Property Tax Supported, Refunding, Series A, 5.00%, 12/01/45 | | | 7,000,000 | | | | 7,746,760 | |
Senior Limited Property Tax Supported, Refunding, Series A, 5.00%, 12/01/46 | | | 2,500,000 | | | | 2,754,200 | |
Senior Limited Property Tax Supported, Series A, AGMC Insured, Pre-Refunded, 6.00%, 12/01/38 | | | 2,500,000 | | | | 2,789,400 | |
| | | | | | | | |
franklintempleton.com | | | | | | Annual Report | | 79 |
FRANKLIN TAX-FREE TRUST
STATEMENT OF INVESTMENTS
Franklin Colorado Tax-Free Income Fund (continued)
| | | | | | | | |
| | | Principal
Amount | | | Value | |
Municipal Bonds (continued) | | | | | | | | |
Colorado (continued) | | | | | | | | |
Park Creek Metropolitan District Revenue, (continued) | | | | | | | | |
Senior Limited Property Tax Supported, Series A, AGMC Insured, Pre-Refunded, 6.125%, 12/01/41 | | $ | 2,500,000 | | | $ | 2,797,775 | |
Platte River Power Authority Power Revenue, Series II, 5.00%, 6/01/37 | | | 12,000,000 | | | | 13,313,760 | |
Poudre Tech Metropolitan District Unlimited Property Tax Supported Revenue, Refunding and | | | | | | | | |
Improvement, Series A, AGMC Insured, 5.00%, 12/01/39 | | | 7,435,000 | | | | 7,797,902 | |
Public Authority for Colorado Energy Natural Gas Purchase Revenue, 6.50%, 11/15/38 | | | 9,900,000 | | | | 13,619,331 | |
Pueblo County COP, County Judicial Complex Project, AGMC Insured, 5.00%, 9/15/42 | | | 10,000,000 | | | | 10,890,900 | |
Pueblo Urban Renewal Authority Revenue, | | | | | | | | |
Refunding and Improvement, Series B, 5.25%, 12/01/28 | | | 1,000,000 | | | | 1,104,920 | |
Refunding and Improvement, Series B, 5.50%, 12/01/31 | | | 1,010,000 | | | | 1,127,291 | |
Refunding and Improvement, Series B, 5.25%, 12/01/38 | | | 3,615,000 | | | | 3,981,959 | |
Rangeview Library District COP, Rangeview Library District Projects, Assured Guaranty, Pre-Refunded, 5.00%, 12/15/30 | | | 3,840,000 | | | | 3,950,976 | |
Regional Transportation District COP, Series A, 5.375%, 6/01/31 | | | 19,000,000 | | | | 20,371,230 | |
Regional Transportation District Sales Tax Revenue, | | | | | | | | |
FasTracks Project, Series A, 5.00%, 11/01/38 | | | 10,000,000 | | | | 10,804,000 | |
FasTracks Project, Series A, 5.00%, 11/01/41 | | | 10,000,000 | | | | 11,400,900 | |
FasTracks Project, Series A, 5.00%, 11/01/46 | | | 11,000,000 | | | | 12,496,330 | |
South Timnath Metropolitan District No. 2 GO, Limited Tax, Refunding and Improvement, 5.00%, 12/01/42 | | | 5,690,000 | | | | 6,229,241 | |
Sterling Hills West Metropolitan District GO, Arapahoe County, Refunding, 5.00%, 12/01/39 | | | 1,125,000 | | | | 1,217,835 | |
Thompson Crossing Metropolitan District No. 5 GO, Series B, AGMC Insured, 5.00%, 12/01/46 | | | 4,500,000 | | | | 4,901,895 | |
Triview Metropolitan District GO, El Paso County, Pre-Refunded, 5.00%, 11/01/34 | | | 10,855,000 | | | | 11,456,584 | |
University of Colorado Enterprise Revenue, | | | | | | | | |
Refunding, Series A, 5.00%, 6/01/38 | | | 5,655,000 | | | | 6,414,071 | |
Series A, Pre-Refunded, 5.375%, 6/01/38 | | | 3,000,000 | | | | 3,143,790 | |
University of Colorado Hospital Authority Revenue, Refunding, Series A, 6.00%, 11/15/29 | | | 5,000,000 | | | | 5,312,350 | |
University of Northern Colorado Greeley Institutional Enterprise Revenue, | | | | | | | | |
Refunding, Series A, 5.00%, 6/01/30 | | | 1,690,000 | | | | 1,851,378 | |
Series A, 5.00%, 6/01/46 | | | 4,000,000 | | | | 4,414,320 | |
Weld County School District No. Re-4 GO, 5.25%, 12/01/41 | | | 5,000,000 | | | | 5,822,000 | |
Woodmoor Water and Sanitation District No. 1 Enterprise Water and Wastewater Revenue, 5.00%, 12/01/36 | | | 5,000,000 | | | | 5,478,100 | |
| | | | | | | | |
| | | | | | | 687,619,187 | |
| | | | | | | | |
U.S. Territories 1.5% | | | | | | | | |
Guam 0.9% | | | | | | | | |
Guam Government Limited Obligation Revenue, | | | | | | | | |
Section 30, Series A, Pre-Refunded, 5.375%, 12/01/24 | | | 2,000,000 | | | | 2,133,460 | |
Section 30, Series A, Pre-Refunded, 5.75%, 12/01/34 | | | 3,565,000 | | | | 3,825,887 | |
| | | | | | | | |
| | | | | | | 5,959,347 | |
| | | | | | | | |
Puerto Rico 0.6% | | | | | | | | |
a Puerto Rico Electric Power Authority Power Revenue, Series XX, 5.25%, 7/01/40 | | | 11,410,000 | | | | 4,293,012 | |
| | | | | | | | |
Total U.S. Territories | | | | | | | 10,252,359 | |
| | | | | | | | |
Total Municipal Bonds before Short Term Investments (Cost $678,331,357) | | | | | | | 697,871,546 | |
| | | | | | | | |
| | | | | | |
80 | | Annual Report | | | | franklintempleton.com |
FRANKLIN TAX-FREE TRUST
STATEMENT OF INVESTMENTS
Franklin Colorado Tax-Free Income Fund (continued)
| | | | | | | | |
| | | Principal
Amount | | | Value | |
Short Term Investments (Cost $1,100,000) 0.1% | | | | | | | | |
Municipal Bonds 0.1% | | | | | | | | |
Colorado 0.1% | | | | | | | | |
b Denver City and County COP, Wellington E. Webb Municipal Office Building, Refunding, Series A2, SPA JPMorgan Chase Bank, Daily VRDN and Put, 1.09%, 12/01/29 | | $ | 1,100,000 | | | $ | 1,100,000 | |
| | | | | | | | |
Total Investments (Cost $679,431,357) 98.7% | | | | | | | 698,971,546 | |
Other Assets, less Liabilities 1.3% | | | | | | | 8,859,759 | |
| | | | | | | | |
Net Assets 100.0%. | | | | | | $ | 707,831,305 | |
| | | | | | | | |
See Abbreviations on page 162.
aSee Note 7 regarding defaulted securities.
bVariable rate demand notes (VRDNs) are obligations which contain a floating or variable interest rate adjustment formula and an unconditional right of demand to receive payment of the principal balance plus accrued interest at specified dates. Unless otherwise noted, the coupon rate is determined based on factors including supply and demand, underlying credit, tax treatment, and current short term rates. The coupon rate shown represents the rate at period end.
| | | | | | | | |
franklintempleton.com | | | | The accompanying notes are an integral part of these financial statements. | | | Annual Report | | 81 |
FRANKLIN TAX-FREE TRUST
Financial Highlights
Franklin Connecticut Tax-Free Income Fund
| | | | | | | | | | | | | | | | | | | | |
| | | Year Ended February 28, | |
| | | 2018 | | | 2017 | | | 2016a | | | 2015 | | | 2014 | |
Class A | | | | | | | | | | | | | | | | | | | | |
Per share operating performance | | | | | | | | | | | | | | | | | | | | |
(for a share outstanding throughout the year) | | | | | | | | | | | | | | | | | | | | |
Net asset value, beginning of year | | | $10.42 | | | | $10.69 | | | | $10.86 | | | | $10.65 | | | | $11.43 | |
| | | | | |
Income from investment operationsb: | | | | | | | | | | | | | | | | | | | | |
Net investment incomec | | | 0.32 | | | | 0.37 | | | | 0.39 | | | | 0.41 | | | | 0.40 | |
Net realized and unrealized gains (losses) | | | (0.32) | | | | (0.28) | | | | (0.17) | | | | 0.21 | | | | (0.80) | |
| | | | | |
Total from investment operations | | | — | | | | 0.09 | | | | 0.22 | | | | 0.62 | | | | (0.40) | |
| | | | | |
Less distributions from net investment income | | | (0.34) | | | | (0.36) | | | | (0.39) | | | | (0.41) | | | | (0.38) | |
| | | | | |
Net asset value, end of year | | | $10.08 | | | | $10.42 | | | | $10.69 | | | | $10.86 | | | | $10.65 | |
| | | | | |
Total returnd | | | 0.03% | | | | 0.82% | | | | 2.09% | | | | 5.88% | | | | (3.34)% | |
| | | | | |
Ratios to average net assets | | | | | | | | | | | | | | | | | | | | |
Expenses | | | 0.74% | | | | 0.71% | | | | 0.69% | | | | 0.68% | | | | 0.67% | |
Net investment income | | | 3.15% | | | | 3.42% | | | | 3.66% | | | | 3.76% | | | | 3.71% | |
| | | | | |
Supplemental data | | | | | | | | | | | | | | | | | | | | |
Net assets, end of year (000’s) | | | $187,638 | | | | $222,705 | | | | $253,012 | | | | $282,020 | | | | $301,323 | |
Portfolio turnover rate | | | 4.27% | | | | 12.40% | | | | 7.86% | | | | 4.63% | | | | 8.24% | |
aFor the year ended February 29.
bThe amount shown for a share outstanding throughout the period may not correlate with the Statement of Operations for the period due to the timing of sales and repurchases of the Fund’s shares in relation to income earned and/or fluctuating fair value of the investments of the Fund.
cBased on average daily shares outstanding.
dTotal return does not reflect sales commissions or contingent deferred sales charges, if applicable.
| | | | | | |
82 | | Annual Report | | | The accompanying notes are an integral part of these financial statements. | | franklintempleton.com |
FRANKLIN TAX-FREE TRUST
FINANCIAL HIGHLIGHTS
Franklin Connecticut Tax-Free Income Fund (continued)
| | | | | | | | | | | | | | | | | | | | |
| | | Year Ended February 28, | |
| | | 2018 | | | 2017 | | | 2016a | | | 2015 | | | 2014 | |
Class C | | | | | | | | | | | | | | | | | | | | |
Per share operating performance | | | | | | | | | | | | | | | | | | | | |
(for a share outstanding throughout the year) | | | | | | | | | | | | | | | | | | | | |
Net asset value, beginning of year | | | $10.50 | | | | $10.77 | | | | $10.93 | | | | $10.73 | | | | $11.51 | |
| | | | | |
Income from investment operationsb: | | | | | | | | | | | | | | | | | | | | |
Net investment incomec | | | 0.27 | | | | 0.31 | | | | 0.33 | | | | 0.35 | | | | 0.34 | |
Net realized and unrealized gains (losses) | | | (0.32) | | | | (0.28) | | | | (0.16) | | | | 0.20 | | | | (0.80) | |
| | | | | |
Total from investment operations | | | (0.05) | | | | 0.03 | | | | 0.17 | | | | 0.55 | | | | (0.46) | |
| | | | | |
Less distributions from net investment income | | | (0.29) | | | | (0.30) | | | | (0.33) | | | | (0.35) | | | | (0.32) | |
| | | | | |
Net asset value, end of year | | | $10.16 | | | | $10.50 | | | | $10.77 | | | | $10.93 | | | | $10.73 | |
| | | | | |
Total returnd | | | (0.52)% | | | | 0.25% | | | | 1.62% | | | | 5.17% | | | | (3.94)% | |
| | | | | |
Ratios to average net assets | | | | | | | | | | | | | | | | | | | | |
Expenses | | | 1.29% | | | | 1.26% | | | | 1.24% | | | | 1.23% | | | | 1.22% | |
Net investment income | | | 2.60% | | | | 2.87% | | | | 3.11% | | | | 3.21% | | | | 3.16% | |
| | | | | |
Supplemental data | | | | | | | | | | | | | | | | | | | | |
Net assets, end of year (000’s) | | | $45,183 | | | | $61,813 | | | | $68,311 | | | | $73,569 | | | | $75,730 | |
Portfolio turnover rate | | | 4.27% | | | | 12.40% | | | | 7.86% | | | | 4.63% | | | | 8.24% | |
aFor the year ended February 29.
bThe amount shown for a share outstanding throughout the period may not correlate with the Statement of Operations for the period due to the timing of sales and repurchases of the Fund’s shares in relation to income earned and/or fluctuating fair value of the investments of the Fund.
cBased on average daily shares outstanding.
dTotal return does not reflect sales commissions or contingent deferred sales charges, if applicable.
| | | | | | | | |
franklintempleton.com | | | | The accompanying notes are an integral part of these financial statements. | | | Annual Report | | 83 |
FRANKLIN TAX-FREE TRUST
FINANCIAL HIGHLIGHTS
Franklin Connecticut Tax-Free Income Fund (continued)
| | |
| | | Year Ended
February 28,
2018a |
Class R6 | | |
| Per share operating performance | | |
(for a share outstanding throughout the year) | | |
Net asset value, beginning of year | | $10.30 |
| |
Income from investment operationsb: | | |
Net investment incomec | | 0.20 |
Net realized and unrealized gains (losses) | | (0.22) |
| |
Total from investment operations | | (0.02) |
| |
Less distributions from net investment income | | (0.20) |
| |
Net asset value, end of year | | $10.08 |
| |
Total returnd | | (0.19)% |
| |
Ratios to average net assetse | | |
Expenses before waiver and payments by affiliates | | 0.77% |
Expenses net of waiver and payments by affiliates | | 0.60% |
Net investment income | | 3.29% |
| |
Supplemental data | | |
Net assets, end of year (000’s) | | $324 |
Portfolio turnover rate | | 4.27% |
aFor the period August 1, 2017 (effective date) to February 28, 2018.
bThe amount shown for a share outstanding throughout the period may not correlate with the Statement of Operations for the period due to the timing of sales and repurchases of the Fund’s shares in relation to income earned and/or fluctuating fair value of the investments of the Fund.
cBased on average daily shares outstanding.
dTotal return is not annualized for periods less than one year.
eRatios are annualized for periods less than one year.
| | | | | | |
84 | | Annual Report | | | The accompanying notes are an integral part of these financial statements. | | franklintempleton.com |
FRANKLIN TAX-FREE TRUST
FINANCIAL HIGHLIGHTS
Franklin Connecticut Tax-Free Income Fund (continued)
| | | | | | | | | | | | | | | | | | | | |
| | | Year Ended February 28, | |
| | | 2018 | | | 2017 | | | 2016a | | | 2015 | | | 2014 | |
Advisor Class | | | | | | | | | | | | | | | | | | | | |
Per share operating performance | | | | | | | | | | | | | | | | | | | | |
(for a share outstanding throughout the year) | | | | | | | | | | | | | | | | | | | | |
Net asset value, beginning of year | | | $10.42 | | | | $10.68 | | | | $10.85 | | | | $10.64 | | | | $11.42 | |
| | | | | |
Income from investment operationsb: | | | | | | | | | | | | | | | | | | | | |
Net investment incomec | | | 0.33 | | | | 0.38 | | | | 0.40 | | | | 0.42 | | | | 0.41 | |
Net realized and unrealized gains (losses) | | | (0.32) | | | | (0.27) | | | | (0.17) | | | | 0.21 | | | | (0.80) | |
| | | | | |
Total from investment operations | | | 0.01 | | | | 0.11 | | | | 0.23 | | | | 0.63 | | | | (0.39) | |
| | | | | |
Less distributions from net investment income | | | (0.35) | | | | (0.37) | | | | (0.40) | | | | (0.42) | | | | (0.39) | |
| | | | | |
Net asset value, end of year | | | $10.08 | | | | $10.42 | | | | $10.68 | | | | $10.85 | | | | $10.64 | |
| | | | | |
Total return | | | 0.13% | | | | 1.01% | | | | 2.19% | | | | 6.00% | | | | (3.34)% | |
| | | | | |
Ratios to average net assets | | | | | | | | | | | | | | | | | | | | |
Expenses | | | 0.64% | | | | 0.61% | | | | 0.59% | | | | 0.58% | | | | 0.57% | |
Net investment income | | | 3.25% | | | | 3.52% | | | | 3.76% | | | | 3.86% | | | | 3.81% | |
| | | | | |
Supplemental data | | | | | | | | | | | | | | | | | | | | |
Net assets, end of year (000’s) | | | $20,855 | | | | $26,253 | | | | $21,254 | | | | $20,384 | | | | $15,904 | |
Portfolio turnover rate | | | 4.27% | | | | 12.40% | | | | 7.86% | | | | 4.63% | | | | 8.24% | |
aFor the year ended February 29.
bThe amount shown for a share outstanding throughout the period may not correlate with the Statement of Operations for the period due to the timing of sales and repurchases of the Fund’s shares in relation to income earned and/or fluctuating fair value of the investments of the Fund.
cBased on average daily shares outstanding.
| | | | | | | | |
franklintempleton.com | | | | The accompanying notes are an integral part of these financial statements. | | | Annual Report | | 85 |
FRANKLIN TAX-FREE TRUST
Statement of Investments, February 28, 2018
Franklin Connecticut Tax-Free Income Fund
| | | | | | | | |
| | | Principal
Amount | | | Value | |
Municipal Bonds 98.7% | | | | | | | | |
Connecticut 98.7% | | | | | | | | |
City of Bridgeport GO, Series A, 5.00%, 2/15/32 | | $ | 10,000,000 | | | $ | 10,720,800 | |
Connecticut State GO, Series A, 5.00%, 2/15/29 | | | 10,000,000 | | | | 10,273,000 | |
Connecticut State Health and Educational Facilities Authority Revenue, | | | | | | | | |
Ascension Health Senior Credit Group, Series A, 5.00%, 11/15/40 | | | 18,520,000 | | | | 19,258,022 | |
Connecticut College Issue, Refunding, Series L-1, 4.00%, 7/01/46 | | | 5,000,000 | | | | 5,010,350 | |
Connecticut State University System Issue, Series N, 5.00%, 11/01/29 | | | 5,060,000 | | | | 5,547,430 | |
Fairfield University Issue, Refunding, Series M, 5.00%, 7/01/26. | | | 90,000 | | | | 90,900 | |
Fairfield University Issue, Refunding, Series M, 5.00%, 7/01/34 | | | 180,000 | | | | 181,577 | |
Fairfield University Issue, Series M, Pre-Refunded, 5.00%, 7/01/26 | | | 360,000 | | | | 364,432 | |
Fairfield University Issue, Series M, Pre-Refunded, 5.00%, 7/01/34 | | | 820,000 | | | | 830,094 | |
Fairfield University Issue, Series N, 5.00%, 7/01/29 | | | 7,000,000 | | | | 7,064,820 | |
Fairfield University Issues, New Money, Series O, Pre-Refunded, 5.00%, 7/01/35 | | | 4,000,000 | | | | 4,309,800 | |
Fairfield University Issues, New Money, Series O, Pre-Refunded, 5.00%, 7/01/40 | | | 5,000,000 | | | | 5,387,250 | |
Hartford Healthcare Issue, Refunding, Series A, 5.00%, 7/01/41 | | | 12,000,000 | | | | 12,675,720 | |
Lutheran General Health Care System, ETM, 7.375%, 7/01/19 | | | 95,000 | | | | 99,386 | |
Quinnipiac University Issue, Refunding, Series L, 5.00%, 7/01/45 | | | 8,250,000 | | | | 9,049,260 | |
Quinnipiac University Issue, Refunding, Series M, 5.00%, 7/01/36 | | | 1,400,000 | | | | 1,551,620 | |
Quinnipiac University Issue, Series J, NATL Insured, 5.00%, 7/01/37 | | | 385,000 | | | | 389,246 | |
Quinnipiac University Issue, Series J, NATL Insured, Pre-Refunded, 5.00%, 7/01/37 | | | 9,135,000 | | | | 9,247,452 | |
Sacred Heart University Issue, Refunding, Series I-1, 5.00%, 7/01/35 | | | 1,125,000 | | | | 1,267,830 | |
Sacred Heart University Issue, Refunding, Series I-1, 5.00%, 7/01/37 | | | 1,000,000 | | | | 1,118,480 | |
Sacred Heart University Issue, Refunding, Series I-1, 5.00%, 7/01/42 | | | 2,125,000 | | | | 2,357,114 | |
Sacred Heart University Issue, Series G, Pre-Refunded, 5.375%, 7/01/31 | | | 1,500,000 | | | | 1,674,630 | |
Sacred Heart University Issue, Series G, Pre-Refunded, 5.625%, 7/01/41 | | | 5,500,000 | | | | 6,184,585 | |
Sacred Heart University Issue, Series H, AGMC Insured, Pre-Refunded, 5.00%, 7/01/27 | | | 1,190,000 | | | | 1,342,106 | |
Sacred Heart University Issue, Series H, AGMC Insured, Pre-Refunded, 5.00%, 7/01/28 | | | 2,290,000 | | | | 2,582,708 | |
Stamford Hospital Issue, Series I, 5.00%, 7/01/30 | | | 5,000,000 | | | | 5,266,000 | |
Stamford Hospital Issue, Series J, 5.00%, 7/01/42. | | | 5,000,000 | | | | 5,308,000 | |
Trinity Health Credit Group, Refunding, Series CT, 5.00%, 12/01/45. | | | 7,060,000 | | | | 7,882,207 | |
Wesleyan University Issue, Series G, Pre-Refunded, 5.00%, 7/01/39 | | | 10,000,000 | | | | 10,786,500 | |
Western Connecticut Health Network Issue, Series M, 5.375%, 7/01/41 | | | 7,000,000 | | | | 7,499,940 | |
Yale University Issue, Series A-2, Pre-Refunded, 5.00%, 7/01/40 | | | 3,000,000 | | | | 3,036,930 | |
Yale-New Haven Hospital Issue, Series N, 5.00%, 7/01/48 | | | 5,000,000 | | | | 5,370,800 | |
Connecticut State HFAR, | | | | | | | | |
State Supported Special Obligation, Series 10, 5.00%, 6/15/28 | | | 420,000 | | | | 436,779 | |
State Supported Special Obligation, Series 13, 5.00%, 6/15/40 | | | 1,500,000 | | | | 1,592,400 | |
Connecticut State Higher Education Supplemental Loan Authority Revenue, CHESLA Loan Program, Series A, 5.05%, 11/15/27. | | | 560,000 | | | | 582,971 | |
Connecticut State Municipal Electric Energy Cooperative Power Supply System Revenue, Refunding, Series A, 5.00%, 1/01/38 | | | 3,000,000 | | | | 3,306,120 | |
Connecticut State Revolving Fund General Revenue, | | | | | | | | |
Green Bonds, Series A, 5.00%, 3/01/34 | | | 5,000,000 | | | | 5,704,800 | |
Green Bonds, Series A, 5.00%, 3/01/35 | | | 1,000,000 | | | | 1,138,920 | |
Green Bonds, Series A, 5.00%, 5/01/35 | | | 2,000,000 | | | | 2,316,600 | |
Green Bonds, Series A, 5.00%, 5/01/37 | | | 3,000,000 | | | | 3,454,140 | |
Series A, 5.00%, 3/01/25 | | | 3,000,000 | | | | 3,415,260 | |
Connecticut State Special Tax Obligation Revenue, | | | | | | | | |
Transportation Infrastructure Purposes, Series A, 5.00%, 10/01/30 | | | 5,000,000 | | | | 5,472,550 | |
Transportation Infrastructure Purposes, Series A, 5.00%, 9/01/32 | | | 1,000,000 | | | | 1,116,440 | |
Transportation Infrastructure Purposes, Series A, 5.00%, 9/01/34 | | | 5,000,000 | | | | 5,472,000 | |
Transportation Infrastructure Purposes, Series A, 5.00%, 1/01/36 | | | 1,000,000 | | | | 1,112,370 | |
| | | | | | |
86 | | Annual Report | | | | franklintempleton.com |
FRANKLIN TAX-FREE TRUST
STATEMENT OF INVESTMENTS
Franklin Connecticut Tax-Free Income Fund (continued)
| | | | | | | | |
| | | Principal
Amount | | | Value | |
Municipal Bonds (continued) | | | | | | | | |
Connecticut (continued) | | | | | | | | |
Connecticut Transmission Municipal Electric Energy Cooperative Transmission System Revenue, Series A, 5.00%, 1/01/42 | | $ | 5,000,000 | | | $ | 5,451,800 | |
Greater New Haven Water Pollution Control Authority Regional Wastewater System Revenue, Series A, AGMC Insured, Pre-Refunded, 5.00%, 11/15/37 | | | 3,000,000 | | | | 3,076,260 | |
Hartford County Metropolitan District Clean Water Project Revenue, | | | | | | | | |
Green Bonds, Refunding, Series A, 5.00%, 11/01/42 | | | 5,000,000 | | | | 5,536,050 | |
Refunding, Series A, 5.00%, 4/01/36 | | | 5,000,000 | | | | 5,473,800 | |
New Britain GO, Series C, AGMC Insured, 5.00%, 3/01/36 | | | 1,000,000 | | | | 1,124,780 | |
New Haven GO, | | | | | | | | |
Issue of 2002, Series C, NATL Insured, ETM, 5.00%, 11/01/22 | | | 25,000 | | | | 25,073 | |
Issue of 2009, Series A, Assured Guaranty, Pre-Refunded, 5.00%, 3/01/29 | | | 1,000,000 | | | | 1,033,200 | |
South Central Regional Water Authority Water System Revenue, | | | | | | | | |
Eighteenth Series B, NATL Insured, 5.25%, 8/01/29 | �� | | 1,000,000 | | | | 1,003,320 | |
Eighteenth Series B, NATL Insured, 5.25%, 8/01/32 | | | 1,000,000 | | | | 1,003,320 | |
Refunding, Thirty-Second Series B, 5.00%, 8/01/38 | | | 3,720,000 | | | | 4,284,473 | |
Thirtieth Series A, 5.00%, 8/01/39 | | | 1,500,000 | | | | 1,692,480 | |
Thirtieth Series A, 5.00%, 8/01/44 | | | 1,615,000 | | | | 1,817,182 | |
Twenty-Second Series, AGMC Insured, Pre-Refunded, 5.00%, 8/01/38 | | | 4,000,000 | | | | 4,061,680 | |
Stamford Water Pollution Control System and Facility Revenue, Refunding, Series A, 5.25%, 8/15/43 | | | 1,000,000 | | | | 1,143,740 | |
Stratford GO, Refunding, 5.00%, 7/01/33 | | | 1,000,000 | | | | 1,115,360 | |
University of Connecticut GO, | | | | | | | | |
Series A, 5.00%, 8/15/28 | | | 6,590,000 | | | | 7,385,611 | |
Series A, 5.00%, 2/15/31 | | | 2,000,000 | | | | 2,233,880 | |
Series A, 5.00%, 1/15/37 | | | 4,000,000 | | | | 4,405,840 | |
| | | | | | | | |
Total Municipal Bonds (Cost $243,472,868) 98.7% | | | | | | | 250,718,188 | |
Other Assets, less Liabilities 1.3% | | | | | | | 3,281,415 | |
| | | | | | | | |
Net Assets 100.0% | | | | | | $ | 253,999,603 | |
| | | | | | | | |
See Abbreviations on page 162.
| | | | | | | | |
franklintempleton.com | | | | The accompanying notes are an integral part of these financial statements. | | | Annual Report | | 87 |
FRANKLIN TAX-FREE TRUST
Financial Highlights
Franklin Michigan Tax-Free Income Fund
| | | | | | | | | | | | | | | | | | | | |
| | | Year Ended February 28, | |
| | | 2018 | | | 2017 | | | 2016a | | | 2015 | | | 2014 | |
Class A | | | | | | | | | | | | | | | | | | | | |
Per share operating performance | | | | | | | | | | | | | | | | | | | | |
(for a share outstanding throughout the year) | | | | | | | | | | | | | | | | | | | | |
Net asset value, beginning of year | | | $11.52 | | | | $11.78 | | | | $12.02 | | | | $11.67 | | | | $12.36 | |
| | | | | |
Income from investment operationsb: | | | | | | | | | | | | | | | | | | | | |
Net investment incomec | | | 0.36 | | | | 0.40 | | | | 0.42 | | | | 0.44 | | | | 0.46 | |
Net realized and unrealized gains (losses) | | | (0.26 | ) | | | (0.25 | ) | | | (0.25 | ) | | | 0.36 | | | | (0.70 | ) |
| | | | | |
Total from investment operations | | | 0.10 | | | | 0.15 | | | | 0.17 | | | | 0.80 | | | | (0.24 | ) |
| | | | | |
Less distributions from net investment income | | | (0.37 | ) | | | (0.41 | ) | | | (0.41 | ) | | | (0.45 | ) | | | (0.45 | ) |
| | | | | |
Net asset value, end of year. | | | $11.25 | | | | $11.52 | | | | $11.78 | | | | $12.02 | | | | $11.67 | |
| | | | | |
Total returnd | | | 0.85% | | | | 1.24% | | | | 1.48% | | | | 6.96% | | | | (1.90 | )% |
| | | | | |
Ratios to average net assets | | | | | | | | | | | | | | | | | | | | |
Expenses | | | 0.67% | | | | 0.65% | | | | 0.64% | | | | 0.65% | | | | 0.63% | |
Net investment income | | | 3.11% | | | | 3.43% | | | | 3.55% | | | | 3.73% | | | | 3.91% | |
| | | | | |
Supplemental data | | | | | | | | | | | | | | | | | | | | |
Net assets, end of year (000’s) | | | $797,935 | | | | $861,662 | | | | $896,978 | | | | $953,732 | | | | $951,409 | |
Portfolio turnover rate | | | 12.74% | | | | 12.35% | | | | 12.04% | | | | 12.80% | | | | 9.37% | |
aFor the year ended February 29.
bThe amount shown for a share outstanding throughout the period may not correlate with the Statement of Operations for the period due to the timing of sales and repurchases of the Fund’s shares in relation to income earned and/or fluctuating fair value of the investments of the Fund.
cBased on average daily shares outstanding.
dTotal return does not reflect sales commissions or contingent deferred sales charges, if applicable.
| | | | | | |
88 | | Annual Report | | | The accompanying notes are an integral part of these financial statements. | | franklintempleton.com |
FRANKLIN TAX-FREE TRUST
FINANCIAL HIGHLIGHTS
Franklin Michigan Tax-Free Income Fund (continued)
| | | | | | | | | | | | | | | | | | | | |
| | | Year Ended February 28, | |
| | | 2018 | | | 2017 | | | 2016a | | | 2015 | | | 2014 | |
Class C | | | | | | | | | | | | | | | | | | | | |
Per share operating performance | | | | | | | | | | | | | | | | | | | | |
(for a share outstanding throughout the year) | | | | | | | | | | | | | | | | | | | | |
Net asset value, beginning of year | | | $11.69 | | | | $11.95 | | | | $12.20 | | | | $11.83 | | | | $12.52 | |
| | | | | |
Income from investment operationsb: | | | | | | | | | | | | | | | | | | | | |
Net investment incomec | | | 0.30 | | | | 0.35 | | | | 0.36 | | | | 0.38 | | | | 0.40 | |
Net realized and unrealized gains (losses) | | | (0.26) | | | | (0.27) | | | | (0.26) | | | | 0.37 | | | | (0.71) | |
| | | | | |
Total from investment operations | | | 0.04 | | | | 0.08 | | | | 0.10 | | | | 0.75 | | | | (0.31) | |
| | | | | |
Less distributions from net investment income | | | (0.30) | | | | (0.34) | | | | (0.35) | | | | (0.38) | | | | (0.38) | |
| | | | | |
Net asset value, end of year | | | $11.43 | | | | $11.69 | | | | $11.95 | | | | $12.20 | | | | $11.83 | |
| | | | | |
Total returnd | | | 0.36% | | | | 0.66% | | | | 0.83% | | | | 6.45% | | | | (2.42)% | |
| | | | | |
Ratios to average net assets | | | | | | | | | | | | | | | | | | | | |
Expenses | | | 1.22% | | | | 1.20% | | | | 1.19% | | | | 1.20% | | | | 1.18% | |
Net investment income | | | 2.56% | | | | 2.88% | | | | 3.00% | | | | 3.18% | | | | 3.36% | |
| | | | | |
Supplemental data | | | | | | | | | | | | | | | | | | | | |
Net assets, end of year (000’s) | | | $124,683 | | | | $142,248 | | | | $145,491 | | | | $148,898 | | | | $148,136 | |
Portfolio turnover rate | | | 12.74% | | | | 12.35% | | | | 12.04% | | | | 12.80% | | | | 9.37% | |
aFor the year ended February 29.
bThe amount shown for a share outstanding throughout the period may not correlate with the Statement of Operations for the period due to the timing of sales and repurchases of the Fund’s shares in relation to income earned and/or fluctuating fair value of the investments of the Fund.
cBased on average daily shares outstanding.
dTotal return does not reflect sales commissions or contingent deferred sales charges, if applicable.
| | | | | | | | |
franklintempleton.com | | | | The accompanying notes are an integral part of these financial statements. | | | Annual Report | | 89 |
FRANKLIN TAX-FREE TRUST
FINANCIAL HIGHLIGHTS
Franklin Michigan Tax-Free Income Fund (continued)
| | |
| | | Year Ended
February 28,
2018a |
Class R6 | | |
Per share operating performance | | |
(for a share outstanding throughout the year) | | |
Net asset value, beginning of year | | $11.53 |
| |
Income from investment operationsb: | | |
Net investment incomec | | 0.22 |
Net realized and unrealized gains (losses) | | (0.24) |
| |
Total from investment operations | | (0.02) |
| |
Less distributions from net investment income | | (0.22) |
| |
Net asset value, end of year | | $11.29 |
| |
Total returnd | | (0.21)% |
| |
Ratios to average net assetse | | |
Expenses before waiver and payments by affiliates | | 0.58% |
Expenses net of waiver and payments by affiliates | | 0.53% |
Net investment income | | 3.25% |
| |
Supplemental data | | |
Net assets, end of year (000’s) | | $2,510 |
Portfolio turnover rate | | 12.74% |
aFor the period August 1, 2017 (effective date) to February 28, 2018.
bThe amount shown for a share outstanding throughout the period may not correlate with the Statement of Operations for the period due to the timing of sales and repurchases of the Fund’s shares in relation to income earned and/or fluctuating fair value of the investments of the Fund.
cBased on average daily shares outstanding.
dTotal return is not annualized for periods less than one year.
eRatios are annualized for periods less than one year.
| | | | | | |
90 | | Annual Report | | | The accompanying notes are an integral part of these financial statements. | | franklintempleton.com |
FRANKLIN TAX-FREE TRUST
FINANCIAL HIGHLIGHTS
Franklin Michigan Tax-Free Income Fund (continued)
| | | | | | | | | | | | | | | | | | | | |
| | | Year Ended February 28, | |
| | | 2018 | | | 2017 | | | 2016a | | | 2015 | | | 2014 | |
Advisor Class | | | | | | | | | | | | | | | | | | | | |
Per share operating performance | | | | | | | | | | | | | | | | | | | | |
(for a share outstanding throughout the year) | | | | | | | | | | | | | | | | | | | | |
Net asset value, beginning of year | | | $11.55 | | | | $11.81 | | | | $12.06 | | | | $11.70 | | | | $12.39 | |
| | | | | |
Income from investment operationsb: | | | | | | | | | | | | | | | | | | | | |
Net investment incomec | | | 0.37 | | | | 0.42 | | | | 0.43 | | | | 0.46 | | | | 0.47 | |
Net realized and unrealized gains (losses) | | | (0.25) | | | | (0.26) | | | | (0.26) | | | | 0.36 | | | | (0.70) | |
| | | | | |
Total from investment operations | | | 0.12 | | | | 0.16 | | | | 0.17 | | | | 0.82 | | | | (0.23) | |
| | | | | |
Less distributions from net investment income | | | (0.38) | | | | (0.42) | | | | (0.42) | | | | (0.46) | | | | (0.46) | |
| | | | | |
Net asset value, end of year | | | $11.29 | | | | $11.55 | | | | $11.81 | | | | $12.06 | | | | $11.70 | |
| | | | | |
Total return | | | 1.03% | | | | 1.33% | | | | 1.50% | | | | 7.13% | | | | (1.80)% | |
| | | | | |
Ratios to average net assets | | | | | | | | | | | | | | | | | | | | |
Expenses | | | 0.57% | | | | 0.55% | | | | 0.54% | | | | 0.55% | | | | 0.53% | |
Net investment income | | | 3.21% | | | | 3.53% | | | | 3.65% | | | | 3.83% | | | | 4.01% | |
| | | | | |
Supplemental data | | | | | | | | | | | | | | | | | | | | |
Net assets, end of year (000’s) | | | $53,587 | | | | $67,672 | | | | $39,846 | | | | $36,020 | | | | $26,577 | |
Portfolio turnover rate | | | 12.74% | | | | 12.35% | | | | 12.04% | | | | 12.80% | | | | 9.37% | |
aFor the year ended February 29.
bThe amount shown for a share outstanding throughout the period may not correlate with the Statement of Operations for the period due to the timing of sales and repurchases of the Fund’s shares in relation to income earned, and/or fluctuating fair value of the investments of the Fund.
cBased on average daily shares outstanding.
| | | | | | | | |
franklintempleton.com | | | | The accompanying notes are an integral part of these financial statements. | | | Annual Report | | 91 |
FRANKLIN TAX-FREE TRUST
Statement of Investments, February 28, 2018
Franklin Michigan Tax-Free Income Fund
| | | | | | | | |
| | | Principal
Amount | | | Value | |
Municipal Bonds 100.2% | | | | | | | | |
Michigan 100.2% | | | | | | | | |
Ann Arbor Public School District GO, | | | | | | | | |
County of Washtenaw, Refunding, 5.00%, 5/01/26 | | $ | 750,000 | | | $ | 869,063 | |
County of Washtenaw, Refunding, 5.00%, 5/01/28 | | | 1,000,000 | | | | 1,143,270 | |
County of Washtenaw, Refunding, 5.00%, 5/01/29 | | | 1,235,000 | | | | 1,405,912 | |
Battle Creek Water and Wastewater System Revenue, Series A, 5.00%, 6/01/36 | | | 1,300,000 | | | | 1,449,422 | |
Bloomfield Charter Township GO, | | | | | | | | |
County of Oakland, Refunding, 5.00%, 5/01/27 | | | 680,000 | | | | 797,688 | |
County of Oakland, Refunding, 5.00%, 5/01/29 | | | 470,000 | | | | 544,979 | |
County of Oakland, Refunding, 5.00%, 5/01/32 | | | 1,000,000 | | | | 1,148,510 | |
Byron Center Public Schools GO, | | | | | | | | |
School Building and Site, Series I, 5.00%, 5/01/34 | | | 1,000,000 | | | | 1,135,990 | |
School Building and Site, Series I, 5.00%, 5/01/35 | | | 1,920,000 | | | | 2,172,979 | |
School Building and Site, Series I, 5.00%, 5/01/36 | | | 650,000 | | | | 733,454 | |
School Building and Site, Series I, 5.00%, 5/01/37 | | | 1,480,000 | | | | 1,666,288 | |
School Building and Site, Series I, 5.00%, 5/01/38 | | | 1,330,000 | | | | 1,494,055 | |
School Building and Site, Series I, 5.00%, 5/01/39 | | | 2,290,000 | | | | 2,568,647 | |
School Building and Site, Series I, 5.00%, 5/01/43 | | | 2,250,000 | | | | 2,512,530 | |
School Building and Site, Series I, 5.00%, 5/01/47 | | | 4,140,000 | | | | 4,609,310 | |
Caledonia Community Schools GO, | | | | | | | | |
Counties of Kent, Allegan and Barry, Refunding, 5.00%, 5/01/25 | | | 1,000,000 | | | | 1,160,170 | |
Counties of Kent, Allegan and Barry, Refunding, 5.00%, 5/01/26 | | | 1,000,000 | | | | 1,165,080 | |
Central Michigan University Revenue, | | | | | | | | |
Board of Trustees, General, Refunding, 5.00%, 10/01/30 | | | 1,910,000 | | | | 2,196,786 | |
Board of Trustees, General, Refunding, 5.00%, 10/01/31 | | | 1,055,000 | | | | 1,209,969 | |
Board of Trustees, General, Refunding, 5.00%, 10/01/34 | | | 1,600,000 | | | | 1,821,504 | |
Board of Trustees, General, Refunding, 5.00%, 10/01/39 | | | 2,000,000 | | | | 2,273,020 | |
Chippewa Valley Schools GO, | | | | | | | | |
County of Macomb, Refunding, 5.00%, 5/01/28 | | | 6,075,000 | | | | 6,872,344 | |
County of Macomb, Refunding, 5.00%, 5/01/29 | | | 6,425,000 | | | | 7,251,576 | |
County of Macomb, Refunding, 5.00%, 5/01/30 | | | 6,420,000 | | | | 7,229,241 | |
County of Macomb, Refunding, 5.00%, 5/01/31 | | | 3,000,000 | | | | 3,368,850 | |
County of Macomb, Refunding, 5.00%, 5/01/32 | | | 6,590,000 | | | | 7,383,238 | |
Commerce Charter Township GO, Capital Improvement, Refunding, 5.00%, 12/01/38 | | | 3,250,000 | | | | 3,660,312 | |
Detroit City School District GO, School Building and Site Improvement, Series A, AGMC Insured, 6.00%, 5/01/29 | | | 10,000,000 | | | | 11,894,000 | |
Detroit Water and Sewerage Department Sewage Disposal System Revenue, senior lien, Refunding, Series A, AGMC Insured, 5.00%, 7/01/39 | | | 5,000,000 | | | | 5,329,750 | |
Detroit Water Supply System Revenue, | | | | | | | | |
second lien, Series B, NATL Insured, 5.00%, 7/01/34 | | | 25,000 | | | | 25,069 | |
senior lien, Series A, AGMC Insured, 5.00%, 7/01/34 | | | 30,000 | | | | 30,087 | |
senior lien, Series B, BHAC Insured, Pre-Refunded, 5.25%, 7/01/35 | | | 17,500,000 | | | | 17,721,025 | |
DeWitt Public Schools GO, | | | | | | | | |
School Building and Site, 5.00%, 5/01/30 | | | 500,000 | | | | 578,715 | |
School Building and Site, 5.00%, 5/01/33 | | | 815,000 | | | | 931,382 | |
School Building and Site, 5.00%, 5/01/34 | | | 1,000,000 | | | | 1,135,990 | |
School Building and Site, 5.00%, 5/01/35 | | | 1,000,000 | | | | 1,131,760 | |
School Building and Site, 5.00%, 5/01/36 | | | 1,000,000 | | | | 1,128,390 | |
East Lansing School District GO, | | | | | | | | |
Counties of Ingham and Clinton, School Building and Site, Series I, 5.00%, 5/01/35 | | | 1,500,000 | | | | 1,697,640 | |
Counties of Ingham and Clinton, School Building and Site, Series I, 5.00%, 5/01/37 | | | 1,100,000 | | | | 1,238,457 | |
Counties of Ingham and Clinton, School Building and Site, Series I, 5.00%, 5/01/42 | | | 3,500,000 | | | | 3,911,285 | |
| | | | | | |
92 | | Annual Report | | | | franklintempleton.com |
FRANKLIN TAX-FREE TRUST
STATEMENT OF INVESTMENTS
Franklin Michigan Tax-Free Income Fund (continued)
| | | | | | | | |
| | | Principal
Amount | | | Value | |
| |
Municipal Bonds (continued) | | | | | | | | |
Michigan (continued) | | | | | | | | |
Farmington Public School District GO, | | | | | | | | |
School Building and Site, Refunding, AGMC Insured, 5.00%, 5/01/27 | | $ | 1,000,000 | | | $ | 1,147,460 | |
School Building and Site, Refunding, AGMC Insured, 5.00%, 5/01/28 | | | 2,000,000 | | | | 2,286,540 | |
School Building and Site, Refunding, AGMC Insured, 5.00%, 5/01/32 | | | 4,035,000 | | | | 4,557,129 | |
School Building and Site, Refunding, AGMC Insured, 5.00%, 5/01/33 | | | 2,900,000 | | | | 3,267,285 | |
School Building and Site, Refunding, AGMC Insured, 5.00%, 5/01/34 | | | 3,000,000 | | | | 3,371,730 | |
School Building and Site, Refunding, AGMC Insured, 5.00%, 5/01/35 | | | 1,000,000 | | | | 1,123,230 | |
Grand Rapids Building Authority Revenue, County of Kent, Series A, AMBAC Insured, 5.00%, 10/01/28 | | | 3,590,000 | | | | 3,600,555 | |
Grand Rapids Sanitary Sewer System Revenue, | | | | | | | | |
County of Kent, Improvement and Refunding, 5.00%, 1/01/28 | | | 1,560,000 | | | | 1,796,824 | |
County of Kent, Improvement and Refunding, 5.00%, 1/01/29 | | | 1,000,000 | | | | 1,150,040 | |
County of Kent, Improvement and Refunding, 5.00%, 1/01/31 | | | 2,095,000 | | | | 2,394,564 | |
County of Kent, Improvement and Refunding, 5.00%, 1/01/32 | | | 1,175,000 | | | | 1,338,889 | |
County of Kent, Improvement and Refunding, 5.00%, 1/01/33 | | | 1,125,000 | | | | 1,279,294 | |
County of Kent, Improvement and Refunding, 5.00%, 1/01/34 | | | 1,000,000 | | | | 1,135,400 | |
County of Kent, Improvement and Refunding, 5.00%, 1/01/35 | | | 1,500,000 | | | | 1,701,360 | |
County of Kent, Improvement and Refunding, 5.00%, 1/01/39 | | | 880,000 | | | | 994,057 | |
County of Kent, Improvement and Refunding, 5.00%, 1/01/44 | | | 2,000,000 | | | | 2,255,760 | |
County of Kent, Refunding, 5.00%, 1/01/36 | | | 1,250,000 | | | | 1,411,175 | |
County of Kent, Refunding, 5.00%, 1/01/38 | | | 1,000,000 | | | | 1,125,240 | |
Grand Rapids Water Supply System Revenue, | | | | | | | | |
Assured Guaranty, Pre-Refunded, 5.10%, 1/01/39 | | | 3,000,000 | | | | 3,092,790 | |
County of Kent, Improvement and Refunding, 5.00%, 1/01/46 | | | 2,525,000 | | | | 2,806,083 | |
Grand Traverse County Hospital Finance Authority Revenue, | | | | | | | | |
Munson Healthcare Obligated Group, Series A, 5.00%, 7/01/44 | | | 2,000,000 | | | | 2,150,440 | |
Munson Healthcare Obligated Group, Series A, 5.00%, 7/01/47 | | | 2,500,000 | | | | 2,685,125 | |
Grand Valley State University Revenue, | | | | | | | | |
General, Refunding, Series A, 5.00%, 12/01/32 | | | 4,295,000 | | | | 4,844,674 | |
General, Series A, AGMC Insured, Pre-Refunded, 5.00%, 12/01/28 | | | 17,165,000 | | | | 17,321,716 | |
General, Series A, AGMC Insured, Pre-Refunded, 5.00%, 12/01/33 | | | 8,570,000 | | | | 8,648,244 | |
Grandville Public School District GO, | | | | | | | | |
School Building and Site, Series II, AGMC Insured, 5.00%, 5/01/29 | | | 750,000 | | | | 837,818 | |
School Building and Site, Series II, AGMC Insured, 5.00%, 5/01/30 | | | 1,000,000 | | | | 1,114,380 | |
School Building and Site, Series II, AGMC Insured, 5.00%, 5/01/31 | | | 1,150,000 | | | | 1,277,650 | |
School Building and Site, Series II, AGMC Insured, 5.00%, 5/01/32 | | | 1,165,000 | | | | 1,291,962 | |
School Building and Site, Series II, AGMC Insured, 5.00%, 5/01/34 | | | 1,315,000 | | | | 1,449,472 | |
School Building and Site, Series II, AGMC Insured, 5.00%, 5/01/35 | | | 1,225,000 | | | | 1,348,639 | |
School Building and Site, Series II, AGMC Insured, 5.00%, 5/01/37 | | | 2,915,000 | | | | 3,201,428 | |
School Building and Site, Series II, AGMC Insured, 5.00%, 5/01/40 | | | 6,215,000 | | | | 6,809,154 | |
Holly Area School District GO, | | | | | | | | |
County of Oakland, Refunding, 5.00%, 5/01/30 | | | 1,045,000 | | | | 1,184,403 | |
County of Oakland, Refunding, 5.00%, 5/01/32 | | | 1,040,000 | | | | 1,169,917 | |
Hudsonville Public Schools GO, | | | | | | | | |
Counties of Ottawa and Allegan, Refunding, 5.00%, 5/01/37 | | | 1,550,000 | | | | 1,755,530 | |
Counties of Ottawa and Allegan, Refunding, 5.00%, 5/01/39 | | | 2,500,000 | | | | 2,816,775 | |
Counties of Ottawa and Allegan, Refunding, 5.00%, 5/01/41 | | | 2,500,000 | | | | 2,806,300 | |
Jackson County Hospital Finance Authority Revenue, W.A. Foote Memorial Hospital, Series C, Assured Guaranty, Pre-Refunded, 5.00%, 6/01/26 | | | 10,000,000 | | | | 10,738,100 | |
| | | | | | | | |
franklintempleton.com | | | | | | Annual Report | | 93 |
FRANKLIN TAX-FREE TRUST
STATEMENT OF INVESTMENTS
Franklin Michigan Tax-Free Income Fund (continued)
| | | | | | | | |
| | | Principal
Amount | | | Value | |
Municipal Bonds (continued) | | | | | | | | |
Michigan (continued) | | | | | | | | |
Kalamazoo Hospital Finance Authority Hospital Facility Revenue, | | | | | | | | |
Bronson Methodist Hospital, AGMC Insured, Pre-Refunded, 5.25%, 5/15/36 | | $ | 5,530,000 | | | $ | 5,953,764 | |
Bronson Methodist Hospital, Refunding, AGMC Insured, 5.25%, 5/15/36 | | | 4,470,000 | | | | 4,700,205 | |
Bronson Methodist Hospital, Refunding, Series B, AGMC Insured, 5.00%, 5/15/26 | | | 7,000,000 | | | | 7,045,430 | |
Kelloggsville Public School District GO, | | | | | | | | |
School Building and Site, AGMC Insured, 5.00%, 5/01/33 | | | 1,045,000 | | | | 1,177,349 | |
School Building and Site, AGMC Insured, 5.00%, 5/01/35 | | | 1,150,000 | | | | 1,291,715 | |
School Building and Site, AGMC Insured, 5.00%, 5/01/38 | | | 3,815,000 | | | | 4,261,698 | |
Kent County GO, | | | | | | | | |
Capital Improvement, 5.00%, 6/01/32 | | | 1,305,000 | | | | 1,511,947 | |
Capital Improvement, 5.00%, 6/01/33 | | | 1,275,000 | | | | 1,471,108 | |
Kentwood Public Schools GO, | | | | | | | | |
School Building and Site, 5.00%, 5/01/35 | | | 1,205,000 | | | | 1,350,504 | |
School Building and Site, 5.00%, 5/01/36 | | | 1,205,000 | | | | 1,346,853 | |
School Building and Site, 5.00%, 5/01/38 | | | 1,210,000 | | | | 1,346,948 | |
School Building and Site, 5.00%, 5/01/41 | | | 1,120,000 | | | | 1,244,230 | |
School Building and Site, 5.00%, 5/01/44 | | | 1,800,000 | | | | 1,995,606 | |
L’Anse Creuse Public Schools GO, | | | | | | | | |
Refunding, 5.00%, 5/01/28 | | | 5,230,000 | | | | 5,979,302 | |
Refunding, 5.00%, 5/01/30 | | | 5,560,000 | | | | 6,306,319 | |
Refunding, 5.00%, 5/01/32 | | | 5,890,000 | | | | 6,619,830 | |
Refunding, 5.00%, 5/01/34 | | | 6,220,000 | | | | 6,931,444 | |
Refunding, 5.00%, 5/01/35 | | | 2,840,000 | | | | 3,157,143 | |
Lansing Board of Water and Light Utility System Revenue, Series A, 5.50%, 7/01/41 | | | 10,000,000 | | | | 11,094,700 | |
Lansing Community College GO, | | | | | | | | |
College Building and Site, Pre-Refunded, 5.00%, 5/01/32 | | | 2,310,000 | | | | 2,594,338 | |
College Building and Site, Refunding, 5.00%, 5/01/30 | | | 1,000,000 | | | | 1,168,490 | |
College Building and Site, Refunding, 5.00%, 5/01/32 | | | 2,000,000 | | | | 2,320,580 | |
College Building and Site, Refunding, 5.00%, 5/01/32 | | | 690,000 | | | | 766,742 | |
Lansing School District GO, | | | | | | | | |
Counties of Ingham, Eaton and Clinton, School Building and Site, Series I, 5.00%, 5/01/36 | | | 1,395,000 | | | | 1,566,627 | |
Counties of Ingham, Eaton and Clinton, School Building and Site, Series I, 5.00%, 5/01/37 | | | 1,490,000 | | | | 1,669,917 | |
Counties of Ingham, Eaton and Clinton, School Building and Site, Series I, 5.00%, 5/01/39 | | | 2,125,000 | | | | 2,373,540 | |
Counties of Ingham, Eaton and Clinton, School Building and Site, Series I, 5.00%, 5/01/40 | | | 2,200,000 | | | | 2,453,990 | |
Lapeer Community Schools GO, | | | | | | | | |
School Building and Site, AGMC Insured, Pre-Refunded, 5.00%, 5/01/33 | | | 4,400,000 | | | | 4,427,280 | |
School Building and Site, AGMC Insured, Pre-Refunded, 5.00%, 5/01/37 | | | 4,325,000 | | | | 4,351,815 | |
Lenawee County Hospital Finance Authority Hospital Revenue, ProMedica Healthcare Obligated Group, Series B, Pre-Refunded, 6.00%, 11/15/35 | | | 5,000,000 | | | | 5,731,400 | |
Livonia Public Schools School District GO, | | | | | | | | |
County of Wayne, School Building and Site, Series I, AGMC Insured, 5.00%, 5/01/36 | | | 5,725,000 | | | | 6,390,588 | |
County of Wayne, School Building and Site, Series I, AGMC Insured, 5.00%, 5/01/38 | | | 6,000,000 | | | | 6,682,200 | |
County of Wayne, School Building and Site, Series I, AGMC Insured, 5.00%, 5/01/43 | | | 16,850,000 | | | | 18,722,877 | |
Macomb Interceptor Drain Drainage District GO, | | | | | | | | |
Drain, Limited Tax, Refunding, Series A, 5.00%, 5/01/34 | | | 2,000,000 | | | | 2,307,940 | |
Drain, Limited Tax, Refunding, Series A, 5.00%, 5/01/42 | | | 7,500,000 | | | | 8,564,625 | |
Mason County CSD, | | | | | | | | |
GO, Counties of Mason, Lake and Oceana, Refunding, 5.00%, 5/01/25 | | | 1,050,000 | | | | 1,218,179 | |
GO, Counties of Mason, Lake and Oceana, Refunding, 5.00%, 5/01/26 | | | 1,100,000 | | | | 1,274,625 | |
| | | | | | |
94 | | Annual Report | | | | franklintempleton.com |
FRANKLIN TAX-FREE TRUST
STATEMENT OF INVESTMENTS
Franklin Michigan Tax-Free Income Fund (continued)
| | | | | | | | |
| | | Principal
Amount | | | Value | |
Municipal Bonds (continued) | | | | | | | | |
Michigan (continued) | | | | | | | | |
Mattawan Consolidated School District GO, | | | | | | | | |
Counties of Van Buren and Kalamazoo, School Building and Site, Series I, 5.00%, 5/01/30 | | $ | 1,000,000 | | | $ | 1,134,920 | |
Counties of Van Buren and Kalamazoo, School Building and Site, Series I, 5.00%, 5/01/31 | | | 1,915,000 | | | | 2,164,122 | |
Counties of Van Buren and Kalamazoo, School Building and Site, Series I, 5.00%, 5/01/32 | | | 1,110,000 | | | | 1,249,827 | |
Counties of Van Buren and Kalamazoo, School Building and Site, Series I, 5.00%, 5/01/34 | | | 2,325,000 | | | | 2,597,234 | |
Counties of Van Buren and Kalamazoo, School Building and Site, Series I, 5.00%, 5/01/39 | | | 3,375,000 | | | | 3,724,650 | |
Meridian Public Schools District GO, | | | | | | | | |
County of Midland, Refunding, 5.00%, 5/01/27 | | | 735,000 | | | | 845,448 | |
County of Midland, Refunding, 5.00%, 5/01/29 | | | 775,000 | | | | 882,252 | |
County of Midland, Refunding, 5.00%, 5/01/31 | | | 1,130,000 | | | | 1,274,674 | |
Michigan Finance Authority Revenue, | | | | | | | | |
Clean Water Revolving Fund, Refunding, Series B, 4.00%, 10/01/30 | | | 2,750,000 | | | | 2,954,462 | |
Hospital, Henry Ford Health System, Refunding, 5.00%, 11/15/30 | | | 4,930,000 | | | | 5,587,169 | |
Hospital, Henry Ford Health System, Refunding, 5.00%, 11/15/32 | | | 2,725,000 | | | | 3,072,819 | |
Hospital, Henry Ford Health System, Refunding, 5.00%, 11/15/37 | | | 4,235,000 | | | | 4,707,838 | |
Hospital, Henry Ford Health System, Refunding, 5.00%, 11/15/41 | | | 27,780,000 | | | | 30,596,892 | |
Hospital, Oakwood Obligated Group, Refunding, 5.00%, 8/15/28 | | | 5,585,000 | | | | 6,181,925 | |
Hospital, Oakwood Obligated Group, Refunding, 5.00%, 8/15/29 | | | 5,865,000 | | | | 6,471,910 | |
Hospital, Oakwood Obligated Group, Refunding, AGMC Insured, 5.00%, 11/01/32 | | | 10,005,000 | | | | 10,951,573 | |
Hospital, Oakwood Obligated Group, Refunding, AGMC Insured, 5.00%, 11/01/42 | | | 12,000,000 | | | | 12,966,240 | |
Hospital, Sparrow Obligated Group, AGMC Insured, 5.00%, 11/15/42 | | | 8,000,000 | | | | 8,776,000 | |
Hospital, Trinity Health Credit Group, Refunding, Series A, 5.00%, 12/01/42 | | | 3,500,000 | | | | 3,930,220 | |
Hospital, Trinity Health Credit Group, Refunding, Series MI, 5.00%, 12/01/45 | | | 20,000,000 | | | | 22,253,200 | |
State Revolving Fund, Clean Water, Pre-Refunded, 5.00%, 10/01/28 | | | 3,000,000 | | | | 3,407,490 | |
State Revolving Fund, Clean Water, Pre-Refunded, 5.00%, 10/01/29 | | | 3,000,000 | | | | 3,407,490 | |
State Revolving Fund, Clean Water, Pre-Refunded, 5.00%, 10/01/32 | | | 2,000,000 | | | | 2,271,660 | |
Michigan Hospital Finance Authority Revenue, | | | | | | | | |
Ascension Health Senior Credit Group, Refunding, Series F-7, 5.00%, 11/15/46 | | | 5,000,000 | | | | 5,630,150 | |
Ascension Health Senior Credit Group, Refunding, Series F-8, 5.00%, 11/15/47 | | | 10,000,000 | | | | 11,252,300 | |
McLaren Healthcare, Refunding, Series A, 5.00%, 6/01/26 | | | 2,065,000 | | | | 2,272,594 | |
McLaren Healthcare, Refunding, Series A, 5.00%, 6/01/27 | | | 2,285,000 | | | | 2,506,005 | |
McLaren Healthcare, Refunding, Series A, 5.00%, 6/01/28 | | | 2,615,000 | | | | 2,860,209 | |
McLaren Healthcare, Refunding, Series A, 5.00%, 6/01/35 | | | 2,250,000 | | | | 2,427,165 | |
MidMichigan Obligated Group, Series A, Pre-Refunded, 6.125%, 6/01/39 | | | 5,000,000 | | | | 5,289,050 | |
Trinity Health Credit Group, Refunding, Series A-1, 6.50%, 12/01/33 | | | 915,000 | | | | 947,418 | |
Trinity Health Credit Group, Series A-1, Pre-Refunded, 6.50%, 12/01/33 | | | 24,085,000 | | | | 24,986,742 | |
Trinity Health Credit Group, Series B, 5.00%, 12/01/48 | | | 20,000,000 | | | | 21,377,000 | |
Michigan State Building Authority Revenue, | | | | | | | | |
Facilities Program, Refunding, Series I, 6.25%, 10/15/38 | | | 555,000 | | | | 571,184 | |
Facilities Program, Refunding, Series I, 5.00%, 4/15/41 | | | 13,000,000 | | | | 14,573,260 | |
Facilities Program, Refunding, Series I, 5.00%, 10/15/46 | | | 6,500,000 | | | | 7,214,740 | |
Facilities Program, Refunding, Series I-A, 5.00%, 10/15/33 | | | 5,000,000 | | | | 5,601,250 | |
Facilities Program, Refunding, Series I-A, 5.50%, 10/15/45 | | | 2,000,000 | | | | 2,226,880 | |
Facilities Program, Refunding, Series I-A, 5.25%, 10/15/47 | | | 5,000,000 | | | | 5,596,850 | |
Facilities Program, Series I, Pre-Refunded, 6.25%, 10/15/38 | | | 14,445,000 | | | | 14,875,317 | |
Michigan State HDA Rental Housing Revenue, Series A, 5.25%, 10/01/46 | | | 565,000 | | | | 591,595 | |
Michigan State Hospital Finance Authority Revenue, | | | | | | | | |
Ascension Health Credit Group, Series B-3, 4.00%, 11/15/32 | | | 5,000,000 | | | | 5,252,200 | |
Ascension Health Credit Group, Series B-3, 4.00%, 11/15/33 | | | 5,370,000 | | | | 5,617,288 | |
Michigan State Strategic Fund Limited Obligation Revenue, The Detroit Edison Co. Pollution Control Bonds Project, Refunding, Collateralized Series BB, AMBAC Insured, 7.00%, 5/01/21 | | | 3,000,000 | | | | 3,441,630 | |
| | | | | | | | |
franklintempleton.com | | | | | | Annual Report | | 95 |
FRANKLIN TAX-FREE TRUST
STATEMENT OF INVESTMENTS
Franklin Michigan Tax-Free Income Fund (continued)
| | | | | | | | |
| | | Principal
Amount | | | Value | |
Municipal Bonds (continued) | | | | | | | | |
Michigan (continued) | | | | | | | | |
Michigan State Technological University Revenue, Board of Control, General, Refunding, Series A, 5.00%, 10/01/45 | | $ | 2,400,000 | | | $ | 2,686,968 | |
Michigan State University Revenue, | | | | | | | | |
Board of Trustees, General, Refunding, Series C, 5.00%, 2/15/44 | | | 14,630,000 | | | | 15,446,061 | |
Board of Trustees, General, Series A, 5.00%, 8/15/40 | | | 8,500,000 | | | | 9,603,470 | |
Muskegon County GO, | | | | | | | | |
Waste Water Management System No. 1, Refunding, 5.00%, 11/01/33 | | | 1,360,000 | | | | 1,543,940 | |
Waste Water Management System No. 1, Refunding, 5.00%, 11/01/36 | | | 1,735,000 | | | | 1,959,526 | |
Northview Public Schools District GO, School Building and Site, 5.00%, 5/01/41 | | | 3,000,000 | | | | 3,189,600 | |
Oakland Schools Intermediate School District GO, | | | | | | | | |
Refunding, 5.00%, 5/01/35 | | | 1,500,000 | | | | 1,704,105 | |
Refunding, 5.00%, 5/01/36 | | | 1,005,000 | | | | 1,140,203 | |
Oakland University Board of Trustees Revenue, | | | | | | | | |
General, 5.00%, 3/01/47 | | | 7,230,000 | | | | 8,012,720 | |
General, Refunding, 5.00%, 3/01/27 | | | 1,000,000 | | | | 1,127,150 | |
General, Refunding, 5.00%, 3/01/30 | | | 1,010,000 | | | | 1,130,109 | |
General, Refunding, 5.00%, 3/01/31 | | | 1,260,000 | | | | 1,407,634 | |
General, Refunding, 5.00%, 3/01/32 | | | 1,000,000 | | | | 1,116,000 | |
General, Refunding, 5.00%, 3/01/33 | | | 1,285,000 | | | | 1,431,811 | |
General, Refunding, 5.00%, 3/01/34 | | | 1,000,000 | | | | 1,113,090 | |
General, Refunding, 5.00%, 3/01/39 | | | 3,000,000 | | | | 3,323,610 | |
Rochester Community School District GO, | | | | | | | | |
Counties of Oakland and Macomb, School Building and Site, Series I, 5.00%, 5/01/30 | | | 350,000 | | | | 399,795 | |
Counties of Oakland and Macomb, School Building and Site, Series I, 5.00%, 5/01/31 | | | 1,500,000 | | | | 1,712,250 | |
Counties of Oakland and Macomb, School Building and Site, Series I, 5.00%, 5/01/32 | | | 5,575,000 | | | | 6,342,231 | |
Counties of Oakland and Macomb, School Building and Site, Series I, 5.00%, 5/01/35 | | | 6,450,000 | | | | 7,219,033 | |
Counties of Oakland and Macomb, School Building and Site, Series I, 5.00%, 5/01/36 | | | 2,800,000 | | | | 3,125,360 | |
Roseville Community Schools District GO, | | | | | | | | |
County of Macomb, Refunding, 5.00%, 5/01/26 | | | 1,400,000 | | | | 1,622,250 | |
County of Macomb, Refunding, 5.00%, 5/01/27 | | | 1,370,000 | | | | 1,575,870 | |
County of Macomb, Refunding, 5.00%, 5/01/28 | | | 3,040,000 | | | | 3,475,541 | |
County of Macomb, Refunding, 5.00%, 5/01/29 | | | 3,300,000 | | | | 3,756,687 | |
County of Macomb, Refunding, 5.00%, 5/01/30 | | | 1,620,000 | | | | 1,837,453 | |
County of Macomb, Refunding, 5.00%, 5/01/31 | | | 1,585,000 | | | | 1,787,928 | |
Royal Oak Hospital Finance Authority Hospital Revenue, | | | | | | | | |
William Beaumont Hospital Obligated Group, Refunding, Series D, 5.00%, 9/01/27 | | | 3,350,000 | | | | 3,742,117 | |
William Beaumont Hospital Obligated Group, Refunding, Series D, 5.00%, 9/01/28 | | | 2,500,000 | | | | 2,776,575 | |
William Beaumont Hospital Obligated Group, Refunding, Series D, 5.00%, 9/01/39 | | | 17,500,000 | | | | 18,981,200 | |
William Beaumont Hospital Obligated Group, Series V, Pre-Refunded, 8.25%, 9/01/39 | | | 10,000,000 | | | | 10,341,800 | |
Saginaw City School District GO, School Building and Site, AGMC Insured, Pre-Refunded, 5.00%, 5/01/38 | | | 10,555,000 | | | | 10,620,441 | |
Saginaw Valley State University Revenue, | | | | | | | | |
General, AGMC Insured, Pre-Refunded, 5.00%, 7/01/28 | | | 7,050,000 | | | | 7,135,587 | |
General, Refunding, Series A, 5.00%, 7/01/30 | | | 1,750,000 | | | | 1,986,897 | |
General, Refunding, Series A, 5.00%, 7/01/31 | | | 2,170,000 | | | | 2,456,961 | |
General, Refunding, Series A, 5.00%, 7/01/33 | | | 1,240,000 | | | | 1,394,318 | |
Saline Area Schools GO, | | | | | | | | |
County of Washtenaw, School Building and Site, 5.00%, 5/01/30 | | | 1,400,000 | | | | 1,585,108 | |
County of Washtenaw, School Building and Site, 5.00%, 5/01/31 | | | 500,000 | | | | 564,190 | |
County of Washtenaw, School Building and Site, 5.00%, 5/01/34 | | | 2,750,000 | | | | 3,065,397 | |
County of Washtenaw, School Building and Site, 5.00%, 5/01/36 | | | 2,950,000 | | | | 3,268,364 | |
| | | | | | |
96 | | Annual Report | | | | franklintempleton.com |
FRANKLIN TAX-FREE TRUST
STATEMENT OF INVESTMENTS
Franklin Michigan Tax-Free Income Fund (continued)
| | | | | | | | |
| | | Principal
Amount | | | Value | |
| |
Municipal Bonds (continued) | | | | | | | | |
Michigan (continued) | | | | | | | | |
South Haven Public Schools GO, | | | | | | | | |
School Building and Site, Series B, AGMC Insured, 5.00%, 5/01/33 | | $ | 350,000 | | | $ | 394,328 | |
School Building and Site, Series B, AGMC Insured, 5.00%, 5/01/35 | | | 1,575,000 | | | | 1,769,087 | |
Trenton Public Schools GO, School Building and Site, AGMC Insured, Pre-Refunded, 5.00%, 5/01/38 | | | 6,150,000 | | | | 6,188,130 | |
Troy City School District GO, Refunding, 5.00%, 5/01/26 | | | 1,230,000 | | | | 1,425,263 | |
University of Michigan Revenue, | | | | | | | | |
Regents, Refunding, Refunding, 5.00%, 4/01/46 | | | 2,000,000 | | | | 2,274,320 | |
Regents, General, Refunding, Series A, 5.00%, 4/01/37 | | | 2,700,000 | | | | 3,142,719 | |
Regents, General, Refunding, Series A, 5.00%, 4/01/42 | | | 26,635,000 | | | | 30,772,481 | |
Regents, General, Refunding, Series A, 5.00%, 4/01/47 | | | 5,000,000 | | | | 5,755,300 | |
Warren Consolidated Schools District GO, Counties of Macomb and Oakland, School Building and Site, 5.00%, 5/01/32 | | | 2,500,000 | | | | 2,718,750 | |
Wayne State University Revenue, | | | | | | | | |
General, AGMC Insured, Pre-Refunded, 5.00%, 11/15/28 | | | 23,550,000 | | | | 24,165,597 | |
General, AGMC Insured, Pre-Refunded, 5.00%, 11/15/35 | | | 22,435,000 | | | | 23,021,451 | |
General, Refunding, Series A, 5.00%, 11/15/31 | | | 1,860,000 | | | | 2,116,959 | |
General, Refunding, Series A, 5.00%, 11/15/33 | | | 1,500,000 | | | | 1,710,180 | |
a General, Series A, 5.00%, 11/15/43 | | | 4,500,000 | | | | 5,109,255 | |
a General, Series A, 4.00%, 11/15/48 | | | 10,000,000 | | | | 10,086,200 | |
Western Michigan University Revenue, | | | | | | | | |
General, AGMC Insured, Pre-Refunded, 5.00%, 11/15/28 | | | 5,500,000 | | | | 5,541,635 | |
General, AGMC Insured, Pre-Refunded, 5.00%, 11/15/32 | | | 6,410,000 | | | | 6,458,524 | |
General, Refunding, Series A, 5.00%, 11/15/26 | | | 1,500,000 | | | | 1,723,335 | |
General, Refunding, Series A, 5.00%, 11/15/27 | | | 2,160,000 | | | | 2,473,999 | |
General, Refunding, Series A, 5.00%, 11/15/28 | | | 1,635,000 | | | | 1,865,797 | |
General, Refunding, Series A, 5.00%, 11/15/29 | | | 2,000,000 | | | | 2,278,140 | |
General, Refunding, Series A, 5.00%, 11/15/30 | | | 2,500,000 | | | | 2,837,200 | |
General, Refunding, Series A, 5.00%, 11/15/40 | | | 1,560,000 | | | | 1,742,473 | |
General, Refunding, Series A, 5.00%, 11/15/45 | | | 2,000,000 | | | | 2,227,140 | |
Zeeland Public Schools GO, | | | | | | | | |
School Building and Site, Series A, AGMC Insured, 5.00%, 5/01/31 | | | 1,530,000 | | | | 1,733,260 | |
School Building and Site, Series A, AGMC Insured, 5.00%, 5/01/33 | | | 2,000,000 | | | | 2,253,300 | |
School Building and Site, Series A, AGMC Insured, 5.00%, 5/01/34 | | | 2,000,000 | | | | 2,247,820 | |
School Building and Site, Series A, AGMC Insured, 5.00%, 5/01/35 | | | 2,000,000 | | | | 2,246,460 | |
| | | | | | | | |
Total Municipal Bonds (Cost $956,542,422) 100.2% | | | | | | | 980,766,012 | |
Other Assets, less Liabilities (0.2)% | | | | | | | (2,050,963 | ) |
| | | | | | | | |
Net Assets 100.0% | | | | | | $ | 978,715,049 | |
| | | | | | | | |
See Abbreviations on page 162.
aSecurity purchased on a when-issued basis. See Note 1(b).
| | | | | | | | |
franklintempleton.com | | | | The accompanying notes are an integral part of these financial statements. | | | Annual Report | | 97 |
FRANKLIN TAX-FREE TRUST
Financial Highlights
Franklin Minnesota Tax-Free Income Fund
| | | | | | | | | | | | | | | | | | | | |
| | | Year Ended February 28, | |
| | | 2018 | | | 2017 | | | 2016a | | | 2015 | | | 2014 | |
Class A | | | | | | | | | | | | | | | | | | | | |
Per share operating performance | | | | | | | | | | | | | | | | | | | | |
(for a share outstanding throughout the year) | | | | | | | | | | | | | | | | | | | | |
Net asset value, beginning of year | | | $12.27 | | | | $12.63 | | | | $12.69 | | | | $12.39 | | | | $12.98 | |
| | | | | |
Income from investment operationsb: | | | | | | | | | | | | | | | | | | | | |
Net investment incomec | | | 0.35 | | | | 0.37 | | | | 0.40 | | | | 0.41 | | | | 0.41 | |
Net realized and unrealized gains (losses) | | | (0.20) | | | | (0.35) | | | | (0.06) | | | | 0.30 | | | | (0.60) | |
| | | | | |
Total from investment operations | | | 0.15 | | | | 0.02 | | | | 0.34 | | | | 0.71 | | | | (0.19) | |
| | | | | |
Less distributions from net investment income | | | (0.35) | | | | (0.38) | | | | (0.40) | | | | (0.41) | | | | (0.40) | |
| | | | | |
Net asset value, end of year | | | $12.07 | | | | $12.27 | | | | $12.63 | | | | $12.69 | | | | $12.39 | |
| | | | | |
Total returnd | | | 1.23% | | | | 0.11% | | | | 2.71% | | | | 5.78% | | | | (1.45)% | |
| | | | | |
Ratios to average net assets | | | | | | | | | | | | | | | | | | | | |
Expenses | | | 0.66% | | | | 0.65% | | | | 0.64% | | | | 0.65% | | | | 0.64% | |
Net investment income | | | 2.87% | | | | 2.99% | | | | 3.16% | | | | 3.23% | | | | 3.27% | |
| | | | | |
Supplemental data | | | | | | | | | | | | | | | | | | | | |
Net assets, end of year (000’s) | | | $657,415 | | | | $695,040 | | | | $731,215 | | | | $719,848 | | | | $717,104 | |
Portfolio turnover rate | | | 13.77% | | | | 13.80% | | | | 8.61% | | | | 6.53% | | | | 6.93% | |
aFor the year ended February 29.
bThe amount shown for a share outstanding throughout the period may not correlate with the Statement of Operations for the period due to the timing of sales and repurchases of the Fund’s shares in relation to income earned and/or fluctuating fair value of the investments of the Fund.
cBased on average daily shares outstanding.
dTotal return does not reflect sales commissions or contingent deferred sales charges, if applicable.
| | | | | | |
98 | | Annual Report | | | The accompanying notes are an integral part of these financial statements. | | franklintempleton.com |
FRANKLIN TAX-FREE TRUST
FINANCIAL HIGHLIGHTS
Franklin Minnesota Tax-Free Income Fund (continued)
| | | | | | | | | | | | | | | | | | | | |
| | | Year Ended February 28, | |
| | | 2018 | | | 2017 | | | 2016a | | | 2015 | | | 2014 | |
Class C | | | | | | | | | | | | | | | | | | | | |
Per share operating performance | | | | | | | | | | | | | | | | | | | | |
(for a share outstanding throughout the year) | | | | | | | | | | | | | | | | | | | | |
Net asset value, beginning of year | | | $12.40 | | | | $12.76 | | | | $12.82 | | | | $12.51 | | | | $13.10 | |
| | | | | |
Income from investment operationsb: | | | | | | | | | | | | | | | | | | | | |
Net investment incomec | | | 0.29 | | | | 0.31 | | | | 0.33 | | | | 0.34 | | | | 0.34 | |
Net realized and unrealized gains (losses) | | | (0.20) | | | | (0.37) | | | | (0.06) | | | | 0.31 | | | | (0.60) | |
| | | | | |
Total from investment operations | | | 0.09 | | | | (0.06) | | | | 0.27 | | | | 0.65 | | | | (0.26) | |
| | | | | |
Less distributions from net investment income | | | (0.28) | | | | (0.30) | | | | (0.33) | | | | (0.34) | | | | (0.33) | |
| | | | | |
Net asset value, end of year | | | $12.21 | | | | $12.40 | | | | $12.76 | | | | $12.82 | | | | $12.51 | |
| | | | | |
Total returnd | | | 0.74% | | | | (0.45)% | | | | 2.12% | | | | 5.23% | | | | (1.97)% | |
| | | | | |
Ratios to average net assets | | | | | | | | | | | | | | | | | | | | |
Expenses | | | 1.21% | | | | 1.20% | | | | 1.19% | | | | 1.20% | | | | 1.19% | |
Net investment income | | | 2.32% | | | | 2.44% | | | | 2.61% | | | | 2.68% | | | | 2.72% | |
| | | | | |
Supplemental data | | | | | | | | | | | | | | | | | | | | |
Net assets, end of year (000’s) | | | $203,925 | | | | $223,444 | | | | $217,904 | | | | $211,768 | | | | $205,745 | |
Portfolio turnover rate | | | 13.77% | | | | 13.80% | | | | 8.61% | | | | 6.53% | | | | 6.93% | |
aFor the year ended February 29.
bThe amount shown for a share outstanding throughout the period may not correlate with the Statement of Operations for the period due to the timing of sales and repurchases of the Fund’s shares in relation to income earned and/or fluctuating fair value of the investments of the Fund.
cBased on average daily shares outstanding.
dTotal return does not reflect sales commissions or contingent deferred sales charges, if applicable.
| | | | | | | | |
franklintempleton.com | | | | The accompanying notes are an integral part of these financial statements. | | | Annual Report | | 99 |
FRANKLIN TAX-FREE TRUST
FINANCIAL HIGHLIGHTS
Franklin Minnesota Tax-Free Income Fund (continued)
| | | | |
| | | Year Ended
February 28,
2018a | |
Class R6 | | | | |
Per share operating performance
(for a share outstanding throughout the year) | | | | |
| |
Net asset value, beginning of year | | | $12.40 | |
| |
Income from investment operationsb: | | | | |
| |
Net investment incomec | | | 0.22 | |
| |
Net realized and unrealized gains (losses) | | | (0.32 | ) |
| |
Total from investment operations | | | (0.10 | ) |
| |
Less distributions from net investment income | | | (0.21 | ) |
| |
Net asset value, end of year | | | $12.09 | |
| |
Total returnd | | | (0.80)% | |
| |
Ratios to average net assetse | | | | |
| |
Expenses before waiver and payments by affiliates | | | 0.54% | |
| |
Expenses net of waiver and payments by affiliates | | | 0.51% | |
| |
Net investment income | | | 3.02% | |
| |
Supplemental data | | | | |
| |
Net assets, end of year (000’s) | | | $8,342 | |
| |
Portfolio turnover rate | | | 13.77% | |
aFor the period August 1, 2017 (effective date) to February 28, 2018.
bThe amount shown for a share outstanding throughout the period may not correlate with the Statement of Operations for the period due to the timing of sales and repurchases of the Fund’s shares in relation to income earned and/or fluctuating fair value of the investments of the Fund.
cBased on average daily shares outstanding.
dTotal return is not annualized for periods less than one year.
eRatios are annualized for periods less than one year.
| | | | | | |
100 | | Annual Report | | | The accompanying notes are an integral part of these financial statements. | | franklintempleton.com |
FRANKLIN TAX-FREE TRUST
FINANCIAL HIGHLIGHTS
Franklin Minnesota Tax-Free Income Fund (continued)
| | | | | | | | | | | | | | | | | | | | |
| | | Year Ended February 28, | |
| | | 2018 | | | 2017 | | | 2016a | | | 2015 | | | 2014 | |
Advisor Class | | | | | | | | | | | | | | | | | | | | |
Per share operating performance
(for a share outstanding throughout the year) | | | | | | | | | | | | | | | | | | | | |
| | | | | |
Net asset value, beginning of year | | | $12.28 | | | | $12.64 | | | | $12.70 | | | | $12.40 | | | | $12.99 | |
| | | | | |
Income from investment operationsb: | | | | | | | | | | | | | | | | | | | | |
| | | | | |
Net investment incomec | | | 0.37 | | | | 0.39 | | | | 0.41 | | | | 0.42 | | | | 0.42 | |
| | | | | |
Net realized and unrealized gains (losses) | | | (0.19 | ) | | | (0.36 | ) | | | (0.06 | ) | | | 0.30 | | | | (0.60 | ) |
| | | | | |
Total from investment operations | | | 0.18 | | | | 0.03 | | | | 0.35 | | | | 0.72 | | | | (0.18 | ) |
| | | | | |
Less distributions from net investment income | | | (0.37 | ) | | | (0.39 | ) | | | (0.41 | ) | | | (0.42 | ) | | | (0.41 | ) |
| | | | | |
Net asset value, end of year | | | $12.09 | | | | $12.28 | | | | $12.64 | | | | $12.70 | | | | $12.40 | |
| | | | | |
Total return | | | 1.41% | | | | 0.20% | | | | 2.81% | | | | 5.88% | | | | (1.35)% | |
| | | | | |
Ratios to average net assets | | | | | | | | | | | | | | | | | | | | |
| | | | | |
Expenses | | | 0.56% | | | | 0.55% | | | | 0.54% | | | | 0.55% | | | | 0.54% | |
| | | | | |
Net investment income | | | 2.97% | | | | 3.09% | | | | 3.26% | | | | 3.33% | | | | 3.37% | |
| | | | | |
Supplemental data | | | | | | | | | | | | | | | | | | | | |
| | | | | |
Net assets, end of year (000’s) | | | $160,199 | | | | $169,533 | | | | $121,685 | | | | $123,174 | | | | $98,382 | |
| | | | | |
Portfolio turnover rate | | | 13.77% | | | | 13.80% | | | | 8.61% | | | | 6.53% | | | | 6.93% | |
aFor the year ended February 29.
bThe amount shown for a share outstanding throughout the period may not correlate with the Statement of Operations for the period due to the timing of sales and repurchases of the Fund’s shares in relation to income earned and/or fluctuating fair value of the investments of the Fund.
cBased on average daily shares outstanding.
| | | | | | | | |
franklintempleton.com | | | | The accompanying notes are an integral part of these financial statements. | | | Annual Report | | 101 |
FRANKLIN TAX-FREE TRUST
Statement of Investments, February 28, 2018
Franklin Minnesota Tax-Free Income Fund
| | | | | | | | |
| | | Principal
Amount | | | Value | |
Municipal Bonds 98.5% | | | | | | | | |
Minnesota 98.5% | | | | | | | | |
Alexandria ISD No. 206 GO, | | | | | | | | |
School Building, Minnesota School District Credit Enhancement Program, Refunding, Series A,
3.00%, 2/01/37 | | $ | 29,905,000 | | | $ | 28,046,404 | |
School Building, Minnesota School District Credit Enhancement Program, Refunding, Series A,
5.00%, 2/01/37 | | | 11,700,000 | | | | 12,698,946 | |
Anoka-Hennepin ISD No. 11 GO, | | | | | | | | |
Anoka and Hennepin Counties, School Building, Minnesota School District Credit Enhancement Program,
Refunding, Series A, Assured Guaranty, 5.00%, 2/01/20 | | | 5,870,000 | | | | 6,242,334 | |
School Building, Minnesota School District Credit Enhancement Program, Series A, 3.25%, 2/01/37 | | | 5,355,000 | | | | 5,149,261 | |
School Building, Minnesota School District Credit Enhancement Program, Series A, 3.375%, 2/01/43 | | | 6,020,000 | | | | 5,769,568 | |
Bemidji GO, Sales Tax, Pre-Refunded, 5.25%, 2/01/38 | | | 12,055,000 | | | | 13,251,941 | |
Big Lake ISD No. 727 GO, | | | | | | | | |
Refunding, Series B, 5.00%, 2/01/23 | | | 2,990,000 | | | | 3,337,976 | |
Refunding, Series B, 5.00%, 2/01/24 | | | 3,000,000 | | | | 3,345,540 | |
Refunding, Series B, 5.00%, 2/01/25 | | | 1,225,000 | | | | 1,363,156 | |
Brainerd ISD No. 181 GO, | | | | | | | | |
School Building, Refunding, Series A, 4.00%, 2/01/19 | | | 5,025,000 | | | | 5,144,092 | |
School Building, Refunding, Series A, 4.00%, 2/01/20 | | | 5,025,000 | | | | 5,139,922 | |
Cambridge ISD No. 911 GO, | | | | | | | | |
School Building, Minnesota School District Credit Enhancement Program, Refunding, Series A,
3.00%, 2/01/27 | | | 3,410,000 | | | | 3,470,596 | |
School Building, Minnesota School District Credit Enhancement Program, Refunding, Series A,
3.00%, 2/01/30 | | | 5,585,000 | | | | 5,551,658 | |
Central Municipal Power Agency Revenue, | | | | | | | | |
Brookings, South East Twin Cities Transmission Project, 5.00%, 1/01/32 | | | 1,150,000 | | | | 1,241,253 | |
Brookings, South East Twin Cities Transmission Project, 5.00%, 1/01/42 | | | 1,615,000 | | | | 1,727,372 | |
Circle Pines ISD No. 12 GO, | | | | | | | | |
School Building, Minnesota School District Credit Enhancement Program, Capital Appreciation,
Series A, zero cpn., 2/01/32 | | | 1,450,000 | | | | 878,845 | |
School Building, Minnesota School District Credit Enhancement Program, Capital Appreciation,
Series A, zero cpn., 2/01/34 | | | 1,600,000 | | | | 884,256 | |
School Building, Minnesota School District Credit Enhancement Program, Capital Appreciation,
Series A, zero cpn., 2/01/35 | | | 350,000 | | | | 184,870 | |
Cloquet Public Schools ISD No. 94 GO, School Building, Series B, 5.00%, 2/01/32 | | | 3,615,000 | | | | 4,116,545 | |
Dakota County CDA, SFMR, MBS Program, Series A, GNMA Secured, 4.875%, 12/01/33 | | | 850,000 | | | | 884,026 | |
Duluth ISD No. 709 COP, | | | | | | | | |
Full Term Certificates, Series B, AGMC Insured, Pre-Refunded, 5.00%, 2/01/28 | | | 18,890,000 | | | | 19,512,237 | |
Full Term Certificates, Series B, Pre-Refunded, 4.75%, 2/01/25 | | | 8,445,000 | | | | 8,704,008 | |
Refunding, Series A, 5.00%, 2/01/25 | | | 1,015,000 | | | | 1,157,882 | |
Refunding, Series A, 5.00%, 2/01/26 | | | 2,740,000 | | | | 3,150,479 | |
Refunding, Series A, 4.00%, 2/01/27 | | | 3,750,000 | | | | 4,006,912 | |
Refunding, Series A, 4.00%, 2/01/28 | | | 1,500,000 | | | | 1,592,985 | |
Duluth ISD No. 709 GO, | | | | | | | | |
Refunding, Series B, 4.00%, 2/01/25 | | | 3,450,000 | | | | 3,753,772 | |
Refunding, Series B, 2.50%, 2/01/26 | | | 2,840,000 | | | | 2,777,889 | |
Elk River ISD No. 728 GO, School Building, Elk River Area Schools, Series A, 4.00%, 2/01/32 | | | 6,130,000 | | | | 6,463,227 | |
Farmington ISD No. 192 GO, | | | | | | | | |
School Building, Refunding, Series C, 5.00%, 2/01/24 | | | 7,165,000 | | | | 8,237,386 | |
School Building, Series A, 4.00%, 2/01/28 | | | 5,230,000 | | | | 5,653,316 | |
Fridley ISD No. 14 GO, School Building, Fridley Public Schools, Series A, 4.00%, 2/01/28 | | | 1,005,000 | | | | 1,087,088 | |
| | | | | | |
102 | | Annual Report | | | | franklintempleton.com |
FRANKLIN TAX-FREE TRUST
STATEMENT OF INVESTMENTS
Franklin Minnesota Tax-Free Income Fund (continued)
| | | | | | | | |
| | | Principal
Amount | | | Value | |
Municipal Bonds (continued) | | | | | | | | |
Minnesota (continued) | | | | | | | | |
Hennepin County Regional Railroad Authority GO, | | | | | | | | |
Refunding, Series A, 4.00%, 12/01/27 | | $ | 2,475,000 | | | $ | 2,570,362 | |
Refunding, Series A, 4.00%, 12/01/28 | | | 1,590,000 | | | | 1,649,307 | |
Hermantown ISD No. 700 GO, School Building, Series A, 4.00%, 2/01/29 | | | 2,310,000 | | | | 2,454,883 | |
Hutchinson ISD No. 423 GO, School Building, Minnesota School District Credit Enhancement Program,
Series A, 5.00%, 2/01/28 | | | 1,685,000 | | | | 1,965,991 | |
Jackson County GO, Capital Improvement Plan, Series A, 3.125%, 2/01/38 | | | 3,000,000 | | | | 2,827,200 | |
Jordan ISD No. 717 GO, | | | | | | | | |
School Building, Refunding, Series A, 5.00%, 2/01/32 | | | 1,605,000 | | | | 1,809,204 | |
School Building, Series A, 5.00%, 2/01/31 | | | 1,460,000 | | | | 1,645,756 | |
School Building, Series A, 5.00%, 2/01/33 | | | 1,700,000 | | | | 1,916,291 | |
School Building, Series A, 5.00%, 2/01/34 | | | 1,805,000 | | | | 2,034,650 | |
School Building, Series A, 5.00%, 2/01/35 | | | 1,000,000 | | | | 1,127,230 | |
School Building, Series A, Pre-Refunded, 5.00%, 2/01/32 | | | 395,000 | | | | 445,256 | |
Lakeville GO, Refunding, Series B, 3.00%, 2/01/30 | | | 4,690,000 | | | | 4,662,001 | |
Lakeville ISD No. 194 GO, Alternative Facilities, Series B, 3.00%, 2/01/25 | | | 3,560,000 | | | | 3,641,987 | |
Metropolitan Council Minneapolis St. Paul Metropolitan Area GO, Wastewater Revenue, Refunding,
Series C, 3.00%, 3/01/30 | | | 7,305,000 | | | | 7,268,548 | |
Minneapolis and St. Paul Housing and RDA Health Care Facilities Revenue, Children’s Hospitals and Clinics,
Series A-1, AGMC Insured, 5.00%, 8/15/34 | | | 1,000,000 | | | | 1,058,200 | |
Minneapolis and St. Paul Housing and RDA Health Care System Revenue, | | | | | | | | |
Allina Health System, Refunding, Series A, 5.00%, 11/15/26 | | | 2,000,000 | | | | 2,353,900 | |
Allina Health System, Refunding, Series A, 5.00%, 11/15/27 | | | 2,000,000 | | | | 2,370,760 | |
Minneapolis Health Care System Revenue, | | | | | | | | |
Fairview Health Services, Refunding, Series A, 5.00%, 11/15/44 | | | 10,000,000 | | | | 11,097,200 | |
Fairview Health Services, Series B, Assured Guaranty, 6.50%, 11/15/38 | | | 29,485,000 | | | | 30,453,877 | |
Fairview Health Services, Series B, Assured Guaranty, Pre-Refunded, 6.50%, 11/15/38 | | | 5,515,000 | | | | 5,712,878 | |
Minneapolis Special School District No. 1 GO, | | | | | | | | |
Long Term Facilities Maintenance, Series B, 5.00%, 2/01/30 | | | 2,590,000 | | | | 3,095,102 | |
Long-Term Facilities Maintenance, Series B, 4.00%, 2/01/32 | | | 2,595,000 | | | | 2,799,875 | |
Minneapolis-St. Paul Metropolitan Airports Commission Revenue, | | | | | | | | |
Airport, senior bond, Refunding, Series A, 5.00%, 1/01/26 | | | 6,000,000 | | | | 7,074,600 | |
Airport, senior bond, Refunding, Series A, 5.00%, 1/01/35 | | | 9,295,000 | | | | 9,819,424 | |
Airport, senior bond, Refunding, Series C, 5.00%, 1/01/34 | | | 2,870,000 | | | | 3,321,939 | |
Airport, senior bond, Refunding, Series C, 5.00%, 1/01/35 | | | 4,025,000 | | | | 4,645,252 | |
Airport, senior bond, Refunding, Series C, 5.00%, 1/01/41 | | | 19,655,000 | | | | 22,536,030 | |
Airport, senior bond, Refunding, Series C, 5.00%, 1/01/46 | | | 15,500,000 | | | | 17,643,650 | |
Airport, sub. bond, Refunding, Series B, 5.00%, 1/01/26 | | | 1,250,000 | | | | 1,378,837 | |
Airport, sub. bond, Refunding, Series B, 5.00%, 1/01/27 | | | 1,500,000 | | | | 1,653,435 | |
Airport, sub. bond, Refunding, Series B, 5.00%, 1/01/28 | | | 2,250,000 | | | | 2,478,420 | |
Minnesota Agricultural and Economic Development Board Revenue, | | | | | | | | |
Health Care Facilities, Essentia Health Obligated Group, Series C-1, Assured Guaranty, 5.00%, 2/15/30 | | | 14,600,000 | | | | 15,383,290 | |
Health Care Facilities, Essentia Health Obligated Group, Series E, Assured Guaranty, 5.00%, 2/15/37 | | | 20,600,000 | | | | 20,639,964 | |
Minnesota Public Facilities Authority State Revenue, | | | | | | | | |
Revolving Fund, Refunding, Series A, 5.00%, 3/01/24 | | | 17,010,000 | | | | 19,786,372 | |
Revolving Fund, Series C, Pre-Refunded, 5.00%, 3/01/26 | | | 16,530,000 | | | | 17,650,569 | |
| | | | | | | | |
franklintempleton.com | | | | | | Annual Report | | 103 |
FRANKLIN TAX-FREE TRUST
STATEMENT OF INVESTMENTS
Franklin Minnesota Tax-Free Income Fund (continued)
| | | | | | | | |
| | | Principal
Amount | | | Value | |
Municipal Bonds (continued) | | | | | | | | |
Minnesota (continued) | | | | | | | | |
Minnesota State 911 Revenue, | | | | | | | | |
Public Safety Radio Communications System Project, Assured Guaranty, Pre-Refunded, 4.50%, 6/01/22 | | $ | 1,000,000 | | | $ | 1,037,160 | |
Public Safety Radio Communications System Project, Assured Guaranty, Pre-Refunded, 4.50%, 6/01/24 | | | 3,745,000 | | | | 3,884,164 | |
Public Safety Radio Communications System Project, Assured Guaranty, Pre-Refunded, 5.00%, 6/01/24 | | | 3,000,000 | | | | 3,027,390 | |
Minnesota State Colleges and Universities Revenue, | | | | | | | | |
Board of Trustees, Fund, Refunding, Series A, 5.00%, 10/01/22 | | | 1,410,000 | | | | 1,592,919 | |
Board of Trustees, Fund, Series A, 4.00%, 10/01/24 | | | 1,535,000 | | | | 1,658,921 | |
Board of Trustees, Fund, Series A, 5.00%, 10/01/28 | | | 2,135,000 | | | | 2,351,340 | |
Board of Trustees, Fund, Series A, 4.625%, 10/01/29 | | | 6,615,000 | | | | 6,912,212 | |
Minnesota State COP, Legislative Office Facility Project, 5.00%, 6/01/36 | | | 3,615,000 | | | | 4,074,394 | |
Minnesota State General Fund Revenue, | | | | | | | | |
Appropriation, Refunding, Series A, 4.00%, 3/01/26 | | | 4,000,000 | | | | 4,247,240 | |
Appropriation, Refunding, Series A, 3.00%, 3/01/30 | | | 5,000,000 | | | | 4,910,800 | |
Appropriation, Refunding, Series B, 5.00%, 3/01/22 | | | 1,530,000 | | | | 1,710,479 | |
Appropriation, Series A, 5.00%, 6/01/38 | | | 8,500,000 | | | | 9,480,985 | |
Minnesota State GO, | | | | | | | | |
Various Purpose, Refunding, Series F, 4.00%, 10/01/25 | | | 15,000,000 | | | | 16,369,200 | |
Various Purpose, Series A, 5.00%, 8/01/28 | | | 5,570,000 | | | | 6,611,311 | |
Various Purpose, Series A, Pre-Refunded, 4.25%, 12/01/27 | | | 5,000,000 | | | | 5,234,400 | |
Various Purpose, Series A, Pre-Refunded, 4.50%, 12/01/28 | | | 15,540,000 | | | | 16,335,182 | |
Various Purpose, Series H, 5.00%, 11/01/27 | | | 325,000 | | | | 343,119 | |
Various Purpose, Series H, Pre-Refunded, 5.00%, 11/01/27 | | | 2,175,000 | | | | 2,295,538 | |
Minnesota State HFA Homeownership Finance Revenue, | | | | | | | | |
MBS Program, Series E, GNMA Secured, 4.45%, 7/01/31 | | | 2,565,000 | | | | 2,656,391 | |
MBS Program, Series G, GNMA Secured, 4.00%, 7/01/26 | | | 1,370,000 | | | | 1,421,443 | |
MBS Program, Series G, GNMA Secured, 4.40%, 7/01/32 | | | 2,320,000 | | | | 2,400,666 | |
Minnesota State HFAR, | | | | | | | | |
Nonprofit Housing State Appropriation, 4.00%, 8/01/29 | | | 3,675,000 | | | | 3,759,304 | |
Nonprofit Housing State Appropriation, 5.00%, 8/01/31 | | | 2,225,000 | | | | 2,447,277 | |
Residential Housing Finance, Refunding, Series B, 3.10%, 7/01/35 | | | 8,215,000 | | | | 7,956,967 | |
Residential Housing Finance, Series E, 4.90%, 7/01/29 | | | 5,800,000 | | | | 5,941,056 | |
Residential Housing Finance, Series E, 5.10%, 1/01/40 | | | 5,485,000 | | | | 5,590,641 | |
Minnesota State Higher Education Facilities Authority Revenue, | | | | | | | | |
Carleton College, Series 7-D, Pre-Refunded, 5.00%, 3/01/40 | | | 4,000,000 | | | | 4,142,920 | |
College of St. Olaf, Refunding, Series 8-N, 4.00%, 10/01/33 | | | 1,500,000 | | | | 1,590,540 | |
College of St. Olaf, Refunding, Series 8-N, 4.00%, 10/01/35 | | | 500,000 | | | | 526,725 | |
Macalester College, Refunding, 3.00%, 3/01/33 | | | 3,010,000 | | | | 2,821,574 | |
Macalester College, Refunding, 4.00%, 3/01/42 | | | 900,000 | | | | 941,553 | |
Macalester College, Refunding, 4.00%, 3/01/48 | | | 2,150,000 | | | | 2,235,720 | |
Macalester College, Series 7-I, Pre-Refunded, 5.00%, 6/01/35 | | | 5,000,000 | | | | 5,380,550 | |
University of St. Thomas, Refunding, Series 8-L, 5.00%, 4/01/35 | | | 750,000 | | | | 843,735 | |
University of St. Thomas, Refunding, Series 8-M, 4.00%, 4/01/22 | | | 1,215,000 | | | | 1,302,346 | |
University of St. Thomas, Refunding, Series A, 4.00%, 10/01/36 | | | 750,000 | | | | 781,523 | |
University of St. Thomas, Refunding, Series A, 4.00%, 10/01/37 | | | 750,000 | | | | 779,663 | |
University of St. Thomas, Series 7-A, Pre-Refunded, 5.00%, 10/01/29 | | | 5,420,000 | | | | 5,710,783 | |
University of St. Thomas, Series 7-A, Pre-Refunded, 5.00%, 10/01/39 | | | 4,485,000 | | | | 4,725,620 | |
University of St. Thomas, Series 8-L, 4.00%, 4/01/31 | | | 4,200,000 | | | | 4,465,188 | |
| | | | | | |
104 | | Annual Report | | | | franklintempleton.com |
FRANKLIN TAX-FREE TRUST
STATEMENT OF INVESTMENTS
Franklin Minnesota Tax-Free Income Fund (continued)
| | | | | | | | |
| | | Principal
Amount | | | Value | |
Municipal Bonds (continued) | | | | | | | | |
Minnesota (continued) | | | | | | | | |
Minnesota State Municipal Power Agency Electric Revenue, | | | | | | | | |
4.00%, 10/01/41 | | $ | 4,680,000 | | | $ | 4,852,037 | |
5.00%, 10/01/47 | | | 4,650,000 | | | | 5,203,210 | |
Refunding, Series A, 4.00%, 10/01/31 | | | 1,265,000 | | | | 1,322,305 | |
Refunding, Series A, 4.00%, 10/01/32 | | | 1,200,000 | | | | 1,252,188 | |
Refunding, Series A, 4.00%, 10/01/33 | | | 1,000,000 | | | | 1,035,090 | |
Refunding, Series A, 5.00%, 10/01/34 | | | 1,000,000 | | | | 1,135,220 | |
Refunding, Series A, 5.00%, 10/01/35 | | | 1,005,000 | | | | 1,138,956 | |
Series A, 5.25%, 10/01/35 | | | 12,000,000 | | | | 12,944,400 | |
New London-Spicer Schools ISD No. 345 GO, | | | | | | | | |
School Building, Series A, 4.00%, 2/01/28 | | | 1,160,000 | | | | 1,254,749 | |
School Building, Series A, 4.00%, 2/01/29 | | | 1,095,000 | | | | 1,172,406 | |
School Building, Series A, 4.00%, 2/01/31 | | | 1,300,000 | | | | 1,375,907 | |
New Prague ISD No. 721 GO, | | | | | | | | |
School Building, Minnesota School District Credit Enhancement Program, Refunding, Series A, 4.00%, 2/01/22 | | | 3,090,000 | | | | 3,284,824 | |
School Building, Minnesota School District Credit Enhancement Program, Refunding, Series A, 4.00%, 2/01/23 | | | 3,045,000 | | | | 3,230,745 | |
School Building, Minnesota School District Credit Enhancement Program, Refunding, Series A, 4.00%, 2/01/24 | | | 3,245,000 | | | | 3,436,293 | |
School Building, Minnesota School District Credit Enhancement Program, Refunding, Series A, 4.00%, 2/01/25 | | | 3,300,000 | | | | 3,481,071 | |
Northern Municipal Power Agency Electric System Revenue, | | | | | | | | |
Refunding, 5.00%, 1/01/41 | | | 800,000 | | | | 895,600 | |
Series A, 5.00%, 1/01/30 | | | 1,190,000 | | | | 1,304,657 | |
Northfield ISD No. 659 GO, School Building, Refunding, Series A, 4.00%, 2/01/20 | | | 3,420,000 | | | | 3,502,319 | |
Prior Lake ISD No. 719 GO, | | | | | | | | |
Capital Appreciation, School Building, Minnesota School District Credit Enhancement Program,
Series B, zero cpn., 2/01/27 | | | 10,545,000 | | | | 8,070,194 | |
Capital Appreciation, School Building, Minnesota School District Credit Enhancement Program,
Series B, zero cpn., 2/01/28 | | | 13,055,000 | | | | 9,609,263 | |
Capital Appreciation, School Building, Minnesota School District Credit Enhancement Program,
Series B, zero cpn., 2/01/30 | | | 9,010,000 | | | | 6,069,947 | |
Capital Appreciation, School Building, Minnesota School District Credit Enhancement Program,
Series B, zero cpn., 2/01/31 | | | 5,310,000 | | | | 3,431,322 | |
Ramsey GO, | | | | | | | | |
Capital Improvement Plan, Refunding, Series A, 3.00%, 12/15/28 | | | 1,105,000 | | | | 1,114,846 | |
Capital Improvement Plan, Refunding, Series A, 3.375%, 12/15/31 | | | 1,215,000 | | | | 1,221,197 | |
Rochester Electricity Utility Revenue, | | | | | | | | |
Refunding, Series A, 5.00%, 12/01/42 | | | 2,000,000 | | | | 2,279,240 | |
Refunding, Series A, 5.00%, 12/01/47 | | | 9,210,000 | | | | 10,458,139 | |
Series B, 5.00%, 12/01/43 | | | 1,000,000 | | | | 1,116,560 | |
Rochester Health Care Facilities Revenue, | | | | | | | | |
a Mayo Clinic, Mandatory Put, Series C, 4.50%, 11/15/21 | | | 10,190,000 | | | | 11,167,119 | |
Mayo Clinic, Refunding, Series B, 5.00%, 11/15/33 | | | 4,425,000 | | | | 5,451,334 | |
Mayo Clinic, Refunding, Series B, 5.00%, 11/15/34 | | | 10,235,000 | | | | 12,603,891 | |
Mayo Clinic, Refunding, Series B, 5.00%, 11/15/35 | | | 5,000,000 | | | | 6,178,250 | |
Mayo Clinic, Refunding, Series B, 5.00%, 11/15/36 | | | 4,200,000 | | | | 5,210,394 | |
Mayo Clinic, Series D, 5.00%, 11/15/38 | | | 5,000,000 | | | | 5,319,300 | |
Mayo Clinic, Series E, 5.00%, 11/15/38 | | | 20,000,000 | | | | 21,277,200 | |
| | | | | | | | |
franklintempleton.com | | | | | | Annual Report | | 105 |
FRANKLIN TAX-FREE TRUST
STATEMENT OF INVESTMENTS
Franklin Minnesota Tax-Free Income Fund (continued)
| | | | | | | | |
| | | Principal
Amount | | | Value | |
Municipal Bonds (continued) | | | | | | | | |
Minnesota (continued) | | | | | | | | |
Rosemount ISD No. 196 GO, | | | | | | | | |
School Building, Refunding, Series C, 4.00%, 2/01/21 | | $ | 1,365,000 | | | $ | 1,453,466 | |
School Building, Refunding, Series C, 4.00%, 2/01/22 | | | 2,380,000 | | | | 2,567,639 | |
Roseville ISD No. 623 GO, Ramsey County, School Building, Minnesota School District Credit
Enhancement Program, Series A, 4.00%, 2/01/34 | | | 9,535,000 | | | | 10,024,050 | |
Sartell ISD No. 748 GO, | | | | | | | | |
Capital Appreciation, School Building, Series B, zero cpn., 2/01/36 | | | 3,000,000 | | | | 1,510,380 | |
Capital Appreciation, School Building, Series B, zero cpn., 2/01/37 | | | 2,820,000 | | | | 1,352,303 | |
Capital Appreciation, School Building, Series B, zero cpn., 2/01/38 | | | 5,220,000 | | | | 2,384,183 | |
Capital Appreciation, School Building, Series B, zero cpn., 2/01/39 | | | 3,020,000 | | | | 1,315,784 | |
School Building, Series A, 5.00%, 2/01/27 | | | 2,075,000 | | | | 2,408,162 | |
South Washington County ISD No. 833 GO, | | | | | | | | |
School Building, Series A, 4.00%, 2/01/29 | | | 4,220,000 | | | | 4,518,312 | |
School Building, Series A, 4.00%, 2/01/30 | | | 9,640,000 | | | | 10,237,584 | |
Southern Minnesota Municipal Power Agency Power Supply System Revenue, | | | | | | | | |
Capital Appreciation, Refunding, Series A, NATL Insured, zero cpn., 1/01/19 | | | 5,875,000 | | | | 5,793,925 | |
Capital Appreciation, Refunding, Series A, NATL Insured, zero cpn., 1/01/20 | | | 14,035,000 | | | | 13,562,442 | |
Capital Appreciation, Refunding, Series A, NATL Insured, zero cpn., 1/01/23 | | | 4,000,000 | | | | 3,552,720 | |
Capital Appreciation, Refunding, Series A, NATL Insured, zero cpn., 1/01/26 | | | 5,395,000 | | | | 4,306,019 | |
Capital Appreciation, Refunding, Series A, NATL Insured, zero cpn., 1/01/27 | | | 6,600,000 | | | | 5,056,326 | |
Refunding, Series A, 5.00%, 1/01/46 | | | 9,345,000 | | | | 10,412,479 | |
Series A, 5.00%, 1/01/42 | | | 1,315,000 | | | | 1,497,759 | |
Series A, Pre-Refunded, 5.00%, 1/01/21 | | | 1,000,000 | | | | 1,029,690 | |
Series A, Pre-Refunded, 5.00%, 1/01/22 | | | 2,060,000 | | | | 2,121,161 | |
Series A, Pre-Refunded, 5.50%, 1/01/24 | | | 1,000,000 | | | | 1,033,800 | |
Series A, Pre-Refunded, 5.25%, 1/01/30 | | | 2,000,000 | | | | 2,063,500 | |
St. Cloud Health Care Revenue, | | | | | | | | |
CentraCare Health System, Refunding, Series A, 5.125%, 5/01/30 | | | 750,000 | | | | 795,930 | |
CentraCare Health System, Refunding, Series A, 4.00%, 5/01/37 | | | 12,310,000 | | | | 12,806,339 | |
CentraCare Health System, Series A, Pre-Refunded, 5.125%, 5/01/30 | | | 9,250,000 | | | | 9,932,372 | |
CentraCare Health System Project, Series D, Assured Guaranty, Pre-Refunded, 5.375%, 5/01/31 | | | 1,000,000 | | | | 1,044,280 | |
CentraCare Health System Project, Series D, Assured Guaranty, Pre-Refunded, 5.50%, 5/01/39 | | | 27,400,000 | | | | 28,652,728 | |
St. Cloud Public Schools ISD No. 742 COP, 4.00%, 2/01/38 | | | 1,000,000 | | | | 1,009,610 | |
St. Cloud Public Schools ISD No. 742 GO, | | | | | | | | |
Series A, 4.00%, 2/01/28 | | | 2,080,000 | | | | 2,246,733 | |
Series A, 4.00%, 2/01/29 | | | 1,000,000 | | | | 1,074,940 | |
Series B, 4.00%, 2/01/30 | | | 4,060,000 | | | | 4,355,893 | |
Series B, 4.00%, 2/01/36 | | | 2,500,000 | | | | 2,620,950 | |
Series B, 4.00%, 2/01/37 | | | 2,250,000 | | | | 2,354,062 | |
St. Francis ISD No. 15 GO, | | | | | | | | |
School Building, Series A, 4.00%, 2/01/37 | | | 1,025,000 | | | | 1,056,334 | |
School Building, Series A, 3.50%, 2/01/41 | | | 6,350,000 | | | | 6,231,890 | |
St. Michael ISD No. 885 GO, Refunding, Series A, 4.25%, 2/01/32 | | | 10,295,000 | | | | 10,871,932 | |
St. Paul Housing and RDA Health Care System Revenue, | | | | | | | | |
Allina Health System, Refunding, Series A-1, 5.25%, 11/15/29 | | | 2,440,000 | | | | 2,590,255 | |
Allina Health System, Series A-1, Pre-Refunded, 5.25%, 11/15/29 | | | 2,560,000 | | | | 2,718,054 | |
Fairview Health Services, Refunding, Series A, 3.125%, 11/15/32 | | | 2,000,000 | | | | 1,897,700 | |
Fairview Health Services, Refunding, Series A, 4.00%, 11/15/43 | | | 3,000,000 | | | | 3,049,410 | |
| | | | | | |
106 | | Annual Report | | | | franklintempleton.com |
FRANKLIN TAX-FREE TRUST
STATEMENT OF INVESTMENTS
Franklin Minnesota Tax-Free Income Fund (continued)
| | | | | | | | |
| | | Principal
Amount | | | Value | |
Municipal Bonds (continued) | | | | | | | | |
Minnesota (continued) | | | | | | | | |
St. Paul ISD No. 625 GO, | | | | | | | | |
School Building, Minnesota School District Credit Enhancement Program, Refunding, Series B,
5.00%, 2/01/24 | | $ | 2,925,000 | | | $ | 3,323,414 | |
School Building, Minnesota School District Credit Enhancement Program, Series A, 3.00%, 2/01/30 | | | 1,385,000 | | | | 1,376,732 | |
School Building, Minnesota School District Credit Enhancement Program, Series A, 3.00%, 2/01/31 | | | 1,195,000 | | | | 1,162,448 | |
St. Paul Sales Tax Revenue, | | | | | | | | |
Series G, 5.00%, 11/01/31 | | | 1,000,000 | | | | 1,132,860 | |
Series G, 5.00%, 11/01/32 | | | 1,000,000 | | | | 1,138,070 | |
University of Minnesota GO, | | | | | | | | |
Series A, 5.00%, 4/01/41 | | | 5,000,000 | | | | 5,705,050 | |
Series A, 5.00%, 9/01/41 | | | 5,000,000 | | | | 5,785,300 | |
Series A, 5.00%, 9/01/42 | | | 4,410,000 | | | | 5,098,710 | |
Series A, Pre-Refunded, 5.25%, 4/01/29 | | | 1,000,000 | | | | 1,040,470 | |
Series A, Pre-Refunded, 5.125%, 4/01/34 | | | 1,000,000 | | | | 1,039,140 | |
Series B, 5.00%, 1/01/38 | | | 4,500,000 | | | | 5,057,325 | |
University of Minnesota Revenue, | | | | | | | | |
Special Purpose, State Supported Stadium Debt, Refunding, Series A, 5.00%, 8/01/25 | | | 5,000,000 | | | | 5,904,050 | |
Special Purpose, State Supported Stadium Debt, Refunding, Series A, 5.00%, 8/01/28 | | | 7,225,000 | | | | 8,424,350 | |
State Supported Biomedical Science Research Facilities Funding Program, Series B, 5.00%, 8/01/36 | | | 5,000,000 | | | | 5,480,400 | |
Waconia ISD No. 110 GO, School Building, Refunding, Series B, 4.125%, 2/01/22 | | | 3,000,000 | | | | 3,034,320 | |
Western Minnesota Municipal Power Agency Revenue, | | | | | | | | |
Refunding, Series A, 5.00%, 1/01/24 | | | 5,000,000 | | | | 5,635,650 | |
Refunding, Series A, 5.00%, 1/01/25 | | | 3,370,000 | | | | 3,798,428 | |
Refunding, Series A, 5.00%, 1/01/29 | | | 1,200,000 | | | | 1,339,728 | |
Refunding, Series A, 5.00%, 1/01/35 | | | 3,000,000 | | | | 3,391,260 | |
Refunding, Series A, 5.00%, 1/01/36 | | | 2,035,000 | | | | 2,295,867 | |
Series A, 5.00%, 1/01/40 | | | 8,075,000 | | | | 9,005,805 | |
Series A, 5.00%, 1/01/46 | | | 11,870,000 | | | | 13,231,608 | |
Willmar GO, Rice Memorial Hospital Project, Refunding, Series A, 3.00%, 2/01/29 | | | 1,000,000 | | | | 994,450 | |
| | | | | | | | |
Total Municipal Bonds before Short Term Investments (Cost $993,482,856) | | | | | | | 1,014,303,625 | |
| | | | | | | | |
| | | | | | | | |
franklintempleton.com | | | | | | Annual Report | | 107 |
FRANKLIN TAX-FREE TRUST
STATEMENT OF INVESTMENTS
Franklin Minnesota Tax-Free Income Fund (continued)
| | | | | | | | |
| | | Principal
Amount | | | Value | |
| |
Short Term Investments 0.7% | | | | | | | | |
Municipal Bonds 0.7% | | | | | | | | |
Minnesota 0.7% | | | | | | | | |
b Minneapolis and St. Paul Housing and RDA Health Care Facilities Revenue, Children’s Hospitals and Clinics,
Series B, AGMC Insured, SPA US Bank National Association, Daily VRDN and Put, 1.10%, 8/15/25 | | $ | 6,300,000 | | | $ | 6,300,000 | |
b Minneapolis and St. Paul Housing and RDA Health Care System Revenue, Allina Health System, Refunding,
Series B-1, LOC JPMorgan Chase Bank, Daily VRDN and Put, 1.09%, 11/15/35 | | | 1,300,000 | | | | 1,300,000 | |
| | | | | | | | |
Total Short Term Investments (Cost $7,600,000) | | | | | | | 7,600,000 | |
| | | | | | | | |
Total Investments (Cost $1,001,082,856) 99.2% | | | | | | | 1,021,903,625 | |
Other Assets, less Liabilities 0.8% | | | | | | | 7,977,834 | |
| | | | | | | | |
Net Assets 100.0% | | | | | | $ | 1,029,881,459 | |
| | | | | | | | |
See Abbreviations on page 162.
aThe maturity date shown represents the mandatory put date.
bVariable rate demand notes (VRDNs) are obligations which contain a floating or variable interest rate adjustment formula and an unconditional right of demand to receive payment of the principal balance plus accrued interest at specified dates. Unless otherwise noted, the coupon rate is determined based on factors including supply and demand, underlying credit, tax treatment, and current short term rates. The coupon rate shown represents the rate at period end.
| | | | | | |
108 | | Annual Report | | | The accompanying notes are an integral part of these financial statements. | | franklintempleton.com |
FRANKLIN TAX-FREE TRUST
Financial Highlights
Franklin Ohio Tax-Free Income Fund
| | | | | | | | | | | | | | | | | | | | |
| | | Year Ended February 28, | |
| | | 2018 | | | 2017 | | | 2016a | | | 2015 | | | 2014 | |
| | | | | |
| Class A | | | | | | | | | | | | | | | | | | | | |
| | | | | |
Per share operating performance | | | | | | | | | | | | | | | | | | | | |
(for a share outstanding throughout the year) | | | | | | | | | | | | | | | | | | | | |
Net asset value, beginning of year | | | $12.56 | | | | $12.90 | | | | $12.91 | | | | $12.44 | | | | $13.12 | |
| | | | | |
Income from investment operationsb: | | | | | | | | | | | | | | | | | | | | |
Net investment incomec | | | 0.38 | | | | 0.41 | | | | 0.44 | | | | 0.46 | | | | 0.48 | |
Net realized and unrealized gains (losses) | | | (0.10 | ) | | | (0.34 | ) | | | (0.01 | ) | | | 0.49 | | | | (0.71 | ) |
| | | | | |
Total from investment operations | | | 0.28 | | | | 0.07 | | | | 0.43 | | | | 0.95 | | | | (0.23 | ) |
| | | | | |
Less distributions from net investment income | | | (0.38 | ) | | | (0.41 | ) | | | (0.44 | ) | | | (0.48 | ) | | | (0.45 | ) |
| | | | | |
Net asset value, end of year | | | $12.46 | | | | $12.56 | | | | $12.90 | | | | $12.91 | | | | $12.44 | |
| | | | | |
Total returnd | | | 2.26% | | | | 0.52% | | | | 3.43% | | | | 7.76% | | | | (1.69)% | |
| | | | | |
Ratios to average net assets | | | | | | | | | | | | | | | | | | | | |
Expenses | | | 0.64% | | | | 0.63% | | | | 0.63% | | | | 0.63% | | | | 0.63% | |
Net investment income | | | 3.02% | | | | 3.17% | | | | 3.41% | | | | 3.65% | | | | 3.86% | |
| | | | | |
Supplemental data | | | | | | | | | | | | | | | | | | | | |
Net assets, end of year (000’s) | | | $1,090,194 | | | | $1,120,704 | | | | $1,186,318 | | | | $1,160,630 | | | | $1,144,885 | |
Portfolio turnover rate | | | 15.46% | | | | 14.17% | | | | 6.53% | | | | 13.88% | | | | 8.78% | |
aFor the year ended February 29.
bThe amount shown for a share outstanding throughout the period may not correlate with the Statement of Operations for the period due to the timing of sales and repurchases of the Fund’s shares in relation to income earned and/or fluctuating fair value of the investments of the Fund.
cBased on average daily shares outstanding.
dTotal return does not reflect sales commissions or contingent deferred sales charges, if applicable.
| | | | | | | | |
franklintempleton.com | | | | The accompanying notes are an integral part of these financial statements. | | | Annual Report | | 109 |
FRANKLIN TAX-FREE TRUST
FINANCIAL HIGHLIGHTS
Franklin Ohio Tax-Free Income Fund (continued)
| | | | | | | | | | |
| | | | | | | | | | | |
| | | Year Ended February 28, |
| | | 2018 | | 2017 | | 2016a | | 2015 | | 2014 |
Class C | | | | | | | | | | |
Per share operating performance | | | | | | | | | | |
(for a share outstanding throughout the year) | | | | | | | | | | |
Net asset value, beginning of year | | $12.72 | | $13.06 | | $13.07 | | $12.58 | | $13.27 |
| | | | | |
Income from investment operationsb: | | | | | | | | | | |
Net investment incomec | | 0.32 | | 0.34 | | 0.37 | | 0.40 | | 0.42 |
Net realized and unrealized gains (losses) | | (0.10) | | (0.34) | | (0.01) | | 0.50 | | (0.73) |
| | | | | |
Total from investment operations | | 0.22 | | — | | 0.36 | | 0.90 | | (0.31) |
| | | | | |
Less distributions from net investment income | | (0.31) | | (0.34) | | (0.37) | | (0.41) | | (0.38) |
| | | | | |
Net asset value, end of year | | $12.63 | | $12.72 | | $13.06 | | $13.07 | | $12.58 |
| | | | | |
Total returnd | | 1.75% | | (0.05)% | | 2.82% | | 7.25% | | (2.28)% |
| | | | | |
Ratios to average net assets | | | | | | | | | | |
Expenses | | 1.19% | | 1.18% | | 1.18% | | 1.18% | | 1.18% |
Net investment income | | 2.47% | | 2.62% | | 2.86% | | 3.10% | | 3.31% |
| | | | | |
Supplemental data | | | | | | | | | | |
Net assets, end of year (000’s) | | $308,088 | | $330,566 | | $322,560 | | $312,055 | | $301,447 |
Portfolio turnover rate | | 15.46% | | 14.17% | | 6.53% | | 13.88% | | 8.78% |
aFor the year ended February 29.
bThe amount shown for a share outstanding throughout the period may not correlate with the Statement of Operations for the period due to the timing of sales and repurchases of the Fund’s shares in relation to income earned and/or fluctuating fair value of the investments of the Fund.
cBased on average daily shares outstanding.
dTotal return does not reflect sales commissions or contingent deferred sales charges, if applicable.
| | | | | | |
110 | | Annual Report | | | The accompanying notes are an integral part of these financial statements. | | franklintempleton.com |
FRANKLIN TAX-FREE TRUST
FINANCIAL HIGHLIGHTS
Franklin Ohio Tax-Free Income Fund (continued)
| | |
| | | Year Ended
February 28,
2018a |
Class R6 | | |
Per share operating performance | | |
(for a share outstanding throughout the year) | | |
Net asset value, beginning of year | | $12.73 |
| |
Income from investment operationsb: | | |
Net investment incomec | | 0.23 |
Net realized and unrealized gains (losses) | | (0.26) |
| |
Total from investment operations | | (0.03) |
| |
Less distributions from net investment income | | (0.23) |
| |
Net asset value, end of year | | $12.47 |
| |
Total returnd | | (0.24)% |
| |
Ratios to average net assetse | | |
Expenses before waiver and payments by affiliates | | 0.52% |
Expenses net of waiver and payments by affiliates | | 0.50% |
Net investment income | | 3.16% |
| |
Supplemental data | | |
Net assets, end of year (000’s) | | $7,847 |
Portfolio turnover rate | | 15.46% |
aFor the period August 1, 2017 (effective date) to February 28, 2018.
bThe amount shown for a share outstanding throughout the period may not correlate with the Statement of Operations for the period due to the timing of sales and repurchases of the Fund’s shares in relation to income earned and/or fluctuating fair value of the investments of the Fund.
cBased on average daily shares outstanding.
dTotal return is not annualized for periods less than one year.
eRatios are annualized for periods less than one year.
| | | | | | | | |
franklintempleton.com | | | | The accompanying notes are an integral part of these financial statements. | | | Annual Report | | 111 |
FRANKLIN TAX-FREE TRUST
FINANCIAL HIGHLIGHTS
Franklin Ohio Tax-Free Income Fund (continued)
| | | | | | | | | | |
| | | | | | | | | | | |
| | | Year Ended February 28, |
| | | 2018 | | 2017 | | 2016a | | 2015 | | 2014 |
Advisor Class | | | | | | | | | | |
Per share operating performance | | | | | | | | | | |
(for a share outstanding throughout the year) | | | | | | | | | | |
Net asset value, beginning of year | | $12.57 | | $12.91 | | $12.92 | | $12.44 | | $13.12 |
| | | | | |
Income from investment operationsb: | | | | | | | | | | |
Net investment incomec | | 0.40 | | 0.42 | | 0.45 | | 0.48 | | 0.49 |
Net realized and unrealized gains (losses) | | (0.10) | | (0.34) | | (0.01) | | 0.49 | | (0.71) |
| | | | | |
Total from investment operations | | 0.30 | | 0.08 | | 0.44 | | 0.97 | | (0.22) |
| | | | | |
Less distributions from net investment income | | (0.40) | | (0.42) | | (0.45) | | (0.49) | | (0.46) |
| | | | | |
Net asset value, end of year | | $12.47 | | $12.57 | | $12.91 | | $12.92 | | $12.44 |
| | | | | |
Total return | | 2.36% | | 0.62% | | 3.53% | | 7.95% | | (1.59)% |
| | | | | |
Ratios to average net assets | | | | | | | | | | |
Expenses | | 0.54% | | 0.53% | | 0.53% | | 0.53% | | 0.53% |
Net investment income | | 3.12% | | 3.27% | | 3.51% | | 3.75% | | 3.96% |
| | | | | |
Supplemental data | | | | | | | | | | |
Net assets, end of year (000’s) | | $170,329 | | $143,603 | | $80,279 | | $73,386 | | $37,153 |
Portfolio turnover rate | | 15.46% | | 14.17% | | 6.53% | | 13.88% | | 8.78% |
aFor the year ended February 29.
bThe amount shown for a share outstanding throughout the period may not correlate with the Statement of Operations for the period due to the timing of sales and repurchases of the Fund’s shares in relation to income earned and/or fluctuating fair value of the investments of the Fund.
cBased on average daily shares outstanding.
| | | | | | |
112 | | Annual Report | | | The accompanying notes are an integral part of these financial statements. | | franklintempleton.com |
FRANKLIN TAX-FREE TRUST
Statement of Investments, February 28, 2018
Franklin Ohio Tax-Free Income Fund
| | | | | | | | |
| | | Principal
Amount | | | Value | |
Municipal Bonds 99.2% | | | | | | | | |
Ohio 99.2% | | | | | | | | |
Akron Income Tax Revenue, | | | | | | | | |
Community Learning Centers, Pre-Refunded, 5.00%, 12/01/33 | | $ | 4,250,000 | | | $ | 4,792,428 | |
Community Learning Centers, Series A, Pre-Refunded, 4.50%, 12/01/33 | | | 10,000,000 | | | | 10,651,100 | |
Allen County Hospital Facilities Revenue, | | | | | | | | |
Catholic Healthcare Partners, Series A, Pre-Refunded, 5.25%, 6/01/38 | | | 15,000,000 | | | | 16,206,900 | |
Catholic Healthcare Partners, Series B, Pre-Refunded, 5.25%, 9/01/27 | | | 7,570,000 | | | | 8,243,730 | |
American Municipal Power Inc. Revenue, | | | | | | | | |
Combined Hydroelectric Projects, Green Bonds, Refunding, Series A, 5.00%, 2/15/46 | | | 7,500,000 | | | | 8,253,075 | |
Greenup Hydroelectric Project, Series A, 4.00%, 2/15/36 | | | 1,000,000 | | | | 1,027,430 | |
Prairie State Energy Campus Project, Refunding, Series A, 5.00%, 2/15/28 | | | 5,000,000 | | | | 5,619,650 | |
Prairie State Energy Campus Project, Refunding, Series A, 5.00%, 2/15/37 | | | 3,700,000 | | | | 4,196,281 | |
Prairie State Energy Campus Project, Refunding, Series A, 5.00%, 2/15/38 | | | 3,500,000 | | | | 3,963,120 | |
Prairie State Energy Campus Project, Refunding, Series A, BAM Insured, 5.25%, 2/15/31 | | | 10,000,000 | | | | 11,140,500 | |
Anthony Wayne Local School District GO, Lucas Wood and Fulton Counties, School Facilities Construction and Improvement, Series A, 4.00%, 12/01/39 | | | 3,000,000 | | | | 3,074,250 | |
Apollo Career Center Joint Vocational School District GO, Counties of Allen Auglaize Hardin Hancock Putnam and Van Wert, Various Purpose School Improvement, Refunding, 4.00%, 12/01/39 | | | 6,530,000 | | | | 6,742,813 | |
Ashland City School District GO, Classroom Facilities and School Improvement, Series 2, 4.00%, 11/01/49 | | | 6,685,000 | | | | 6,801,185 | |
Bath Local School District GO, | | | | | | | | |
School Improvement, AGMC Insured, 4.00%, 12/01/44 | | | 1,295,000 | | | | 1,305,671 | |
School Improvement, AGMC Insured, 5.00%, 12/01/49 | | | 5,380,000 | | | | 5,748,046 | |
Beaver Local School District GO, School Facilities, 4.00%, 12/01/40 | | | 3,000,000 | | | | 3,112,620 | |
Bluffton Village Hospital Facilities Revenue, | | | | | | | | |
Blanchard Valley Health System, Refunding, 4.00%, 12/01/33 | | | 1,655,000 | | | | 1,684,376 | |
Blanchard Valley Health System, Refunding, 4.00%, 12/01/34 | | | 1,900,000 | | | | 1,925,973 | |
Bowling Green State University Revenue, General Receipts, Refunding, Series B, 5.00%, 6/01/42 | | | 3,250,000 | | | | 3,618,550 | |
Brooklyn City School District GO, | | | | | | | | |
School Improvement, AGMC Insured, Pre-Refunded, 5.25%, 12/01/43 | | | 3,000,000 | | | | 3,287,130 | |
School Improvement, AGMC Insured, Pre-Refunded, 5.50%, 12/01/49 | | | 7,780,000 | | | | 8,576,672 | |
School Improvement, Refunding, AGMC Insured, 5.00%, 12/01/38 | | | 1,905,000 | | | | 2,148,230 | |
School Improvement, Refunding, AGMC Insured, 5.00%, 12/01/49 | | | 9,000,000 | | | | 10,095,930 | |
Butler County Hospital Facilities Revenue, | | | | | | | | |
Cincinnati Children’s Hospital Medical Center, Refunding, Series X, 5.00%, 5/15/29 | | | 6,750,000 | | | | 8,009,415 | |
Kettering Health Network Obligated Group Project, 6.375%, 4/01/36 | | | 5,000,000 | | | | 5,581,900 | |
Kettering Health Network Obligated Group Project, 5.625%, 4/01/41 | | | 5,000,000 | | | | 5,420,150 | |
UC Health, Refunding, 4.00%, 11/15/35 | | | 2,000,000 | | | | 2,032,120 | |
UC Health, Refunding, 4.00%, 11/15/36 | | | 2,140,000 | | | | 2,169,147 | |
UC Health, Refunding, 4.00%, 11/15/37 | | | 1,500,000 | | | | 1,511,955 | |
UC Health, Refunding, 5.00%, 11/15/45 | | | 20,270,000 | | | | 22,261,730 | |
Canal Winchester Local School District GO, | | | | | | | | |
Capital Appreciation, NATL Insured, zero cpn., 12/01/32 | | | 3,955,000 | | | | 2,336,851 | |
Capital Appreciation, NATL Insured, zero cpn., 12/01/33 | | | 2,000,000 | | | | 1,128,020 | |
Central Solid Waste Authority GO, | | | | | | | | |
Improvement, Solid Waste Facilities, Pre-Refunded, 4.00%, 12/01/32 | | | 1,505,000 | | | | 1,629,494 | |
Improvement and Refunding, Solid Waste Facilities, 4.00%, 12/01/32 | | | 15,440,000 | | | | 16,157,651 | |
Chillicothe City School District GO, | | | | | | | | |
Capital Appreciation, School Improvement, Refunding, NATL Insured, zero cpn., 12/01/22 | | | 1,905,000 | | | | 1,690,688 | |
Capital Appreciation, School Improvement, Refunding, NATL Insured, zero cpn., 12/01/23 | | | 1,905,000 | | | | 1,635,652 | |
Capital Appreciation, School Improvement, Refunding, NATL Insured, zero cpn., 12/01/24 | | | 1,905,000 | | | | 1,580,178 | |
| | | | | | | | |
franklintempleton.com | | | | | | Annual Report | | 113 |
FRANKLIN TAX-FREE TRUST
STATEMENT OF INVESTMENTS
Franklin Ohio Tax-Free Income Fund (continued)
| | | | | | | | |
| | | Principal
Amount | | | Value | |
Municipal Bonds (continued) | | | | | | | | |
Ohio (continued) | | | | | | | | |
Chillicothe Hospital Facilities Revenue, Adena Health System Obligated Group Project, Refunding and Improvement, 5.00%, 12/01/37 | | $ | 5,000,000 | | | $ | 5,540,550 | |
Cincinnati City School District GO, | | | | | | | | |
Classroom Facilities Construction and Improvement, Refunding, NATL Insured, 5.25%, 12/01/27 | | | 14,900,000 | | | | 18,022,742 | |
Classroom Facilities Construction and Improvement, Refunding, NATL Insured, 5.25%, 12/01/28 | | | 8,180,000 | | | | 9,977,555 | |
Cincinnati GO, Various Purpose, Improvement and Refunding, Series A, 5.25%, 12/01/40 | | | 6,500,000 | | | | 7,546,955 | |
City of Akron Waterworks System Mortgage Revenue, Refunding and Improvement, Assured Guaranty, 5.00%, 3/01/34 | | | 1,000,000 | | | | 1,030,580 | |
Cleveland Airport System Revenue, | | | | | | | | |
Refunding, Series A, AGMC Insured, 5.00%, 1/01/30 | | | 3,000,000 | | | | 3,273,390 | |
Refunding, Series A, AGMC Insured, 5.00%, 1/01/31 | | | 1,500,000 | | | | 1,635,540 | |
Series C, Assured Guaranty, 5.00%, 1/01/27 | | | 27,385,000 | | | | 28,131,241 | |
Cleveland GO, Various Purpose, Refunding, 5.00%, 12/01/30 | | | 3,000,000 | | | | 3,366,510 | |
Cleveland Municipal School District GO, | | | | | | | | |
School Improvement, Refunding, 5.00%, 12/01/25 | | | 3,600,000 | | | | 4,060,548 | |
School Improvement, Refunding, 5.00%, 12/01/27 | | | 1,000,000 | | | | 1,123,130 | |
Cleveland Public Power System Revenue, | | | | | | | | |
Capital Appreciation, Series B-2, NATL Insured, zero cpn., 11/15/38 | | | 10,000,000 | | | | 4,247,000 | |
Series B-1, NATL Insured, 5.00%, 11/15/28 | | | 2,000,000 | | | | 2,014,220 | |
Series B-1, NATL Insured, 5.00%, 11/15/38 | | | 10,000,000 | | | | 10,067,400 | |
Cleveland Water PCR, Green Bonds, 5.00%, 11/15/41 | | | 2,000,000 | | | | 2,233,820 | |
Columbus GO, | | | | | | | | |
Various Purpose, Refunding, Series 1, 4.00%, 4/01/30 | | | 6,000,000 | | | | 6,569,580 | |
Various Purpose, Refunding, Series 3, 5.00%, 2/15/27 | | | 15,000,000 | | | | 18,004,650 | |
Various Purpose, Series A, 5.00%, 2/15/23 | | | 14,365,000 | | | | 16,358,287 | |
Various Purpose, Series A, 5.00%, 2/15/24 | | | 12,655,000 | | | | 14,660,058 | |
Various Purpose, Series A, 5.00%, 2/15/25 | | | 5,000,000 | | | | 5,783,100 | |
Columbus Metropolitan Library Special Obligation Revenue, | | | | | | | | |
Library Fund Facilities Notes, Series 1, 4.00%, 12/01/28 | | | 2,970,000 | | | | 3,114,104 | |
Library Fund Facilities Notes, Series 1, 4.00%, 12/01/29 | | | 4,125,000 | | | | 4,319,535 | |
Library Fund Facilities Notes, Series 1, 4.00%, 12/01/37 | | | 6,620,000 | | | | 6,824,889 | |
Library Fund Facilities Notes, Series 1, Pre-Refunded, 4.00%, 12/01/27 | | | 3,765,000 | | | | 4,004,755 | |
Columbus Sewerage System Revenue, | | | | | | | | |
Refunding, 5.00%, 6/01/29 | | | 5,000,000 | | | | 5,853,000 | |
Refunding, 4.00%, 6/01/31 | | | 15,000,000 | | | | 15,871,950 | |
Coventry Local School District GO, School Improvement, 5.25%, 11/01/47 | | | 5,000,000 | | | | 5,240,300 | |
Cuyahoga Community College District General Receipts Revenue, Series D, 5.00%, 8/01/32 | | | 2,310,000 | | | | 2,551,903 | |
Cuyahoga County EDR, Recovery Zone Facility, Medical Mart/Convention Center Project, Series F, 5.00%, 12/01/27 | | | 15,000,000 | | | | 16,263,750 | |
Cuyahoga County Excise Tax Revenue, | | | | | | | | |
Sports Facilities Improvement Project, 5.00%, 12/01/24 | | | 1,000,000 | | | | 1,135,890 | |
Sports Facilities Improvement Project, 5.00%, 12/01/25 | | | 500,000 | | | | 565,940 | |
Dayton City School District GO, School Facilities Construction and Improvement, Refunding, 5.00%, 11/01/30 | | | 5,000,000 | | | | 5,965,400 | |
Dayton Metro Library GO, Library Improvement, Series A, 4.75%, 12/01/38 | | | 20,000,000 | | | | 21,651,600 | |
Deer Park Community City School District GO, County of Hamilton, School Improvement, Refunding, Series A, 5.25%, 12/01/53 | | | 3,000,000 | | | | 3,368,010 | |
Defiance City School District GO, Defiance and Paulding Counties, Various Purpose, Refunding, 5.00%, 12/01/46 | | | 6,635,000 | | | | 7,363,523 | |
Delaware City School District GO, School Facilities Construction and Improvement, 5.75%, 12/01/49 | | | 6,000,000 | | | | 6,842,160 | |
Delaware General Income Tax Special Obligation, 4.75%, 12/01/37 | | | 4,000,000 | | | | 4,184,320 | |
| | | | | | |
114 | | Annual Report | | | | franklintempleton.com |
FRANKLIN TAX-FREE TRUST
STATEMENT OF INVESTMENTS
Franklin Ohio Tax-Free Income Fund (continued)
| | | | | | | | |
| | | Principal
Amount | | | Value | |
Municipal Bonds (continued) | | | | | | | | |
Ohio (continued) | | | | | | | | |
Elyria City School District GO, Classroom Facilities and School Improvement, Series A, 5.00%, 12/01/43 | | $ | 5,500,000 | | | $ | 6,187,335 | |
Franklin County Convention Facilities Authority Revenue, Tax and Lease Revenue Anticipation, Refunding, 5.00%, 12/01/35 | | | 20,000,000 | | | | 22,753,200 | |
Franklin County Hospital Facilities Revenue, | | | | | | | | |
Nationwide Children’s Hospital Project, Refunding, Series A, 4.00%, 11/01/44 | | | 7,050,000 | | | | 7,151,450 | |
Nationwide Children’s Hospital Project, Refunding, Series C, 5.00%, 11/01/34 | | | 2,600,000 | | | | 2,984,644 | |
Nationwide Children’s Hospital Project, Refunding, Series C, 4.00%, 11/01/40 | | | 5,000,000 | | | | 5,088,200 | |
OhioHealth Corp., 5.00%, 5/15/33 | | | 6,290,000 | | | | 7,120,972 | |
Franklin County Hospital Revenue, Improvement, Nationwide Children’s Hospital Project, Pre-Refunded, 5.25%, 11/01/40 | | | 15,000,000 | | | | 15,918,000 | |
Franklin County Revenue, Trinity Health Credit Group, Series OH, 5.00%, 12/01/46 | | | 7,500,000 | | | | 8,344,200 | |
Fremont City School District GO, Sandusky County, School Facilities Construction and Improvement, Series A, 5.00%, 1/15/49 | | | 13,970,000 | | | | 15,430,284 | |
Greene County Hospital Facilities Revenue, Kettering Health Network Obligated Group Project, 5.50%, 4/01/39 | | | 12,930,000 | | | | 13,413,970 | |
Greenville City School District GO, School Improvement, 5.25%, 1/01/41 | | | 2,000,000 | | | | 2,218,960 | |
Groveport-Madison Local School District GO, School Facilities Construction and Improvement, Pre- Refunded, 5.00%, 10/01/44 | | | 6,205,000 | | | | 7,033,243 | |
Hamilton County Hospital Facilities Revenue, TriHealth Inc. Obligated Group Project, Series A, 5.00%, 8/15/42 | | | 5,000,000 | | | | 5,515,200 | |
Hamilton County Sewer System Revenue, The Metropolitan Sewer District of Greater Cincinnati, Refunding, Series A, 5.00%, 12/01/27 | | | 6,875,000 | | | | 7,958,913 | |
Hamilton County Student Housing Revenue, | | | | | | | | |
Stratford Heights Project, University of Cincinnati, Refunding, AGMC Insured, 5.00%, 6/01/30 | | | 7,000,000 | | | | 7,451,080 | |
Stratford Heights Project, University of Cincinnati, Refunding, AGMC Insured, 4.75%, 6/01/39 | | | 7,000,000 | | | | 7,338,730 | |
Hilliard School District GO, | | | | | | | | |
Capital Appreciation, School Construction, Refunding, NATL Insured, zero cpn., 12/01/19 | | | 2,190,000 | | | | 2,128,395 | |
Capital Appreciation, School Construction, Refunding, NATL Insured, zero cpn., 12/01/20 | | | 4,525,000 | | | | 4,314,678 | |
School Improvement, 4.00%, 12/01/46 | | | 10,000,000 | | | | 10,320,200 | |
Huber Heights City School District GO, | | | | | | | | |
School Improvement, Pre-Refunded, 5.00%, 12/01/33 | | | 4,500,000 | | | | 4,760,865 | |
School Improvement, Pre-Refunded, 5.00%, 12/01/36 | | | 5,000,000 | | | | 5,289,850 | |
a Hudson City School District GO, School Improvement, 4.00%, 12/01/45. | | | 18,870,000 | | | | 19,321,748 | |
JobsOhio Beverage System Statewide Liquor Profits Revenue, senior lien, Series A, 5.00%, 1/01/38 | | | 26,010,000 | | | | 28,726,224 | |
Kent State University Revenues, General Receipts, Series B, Assured Guaranty, 4.25%, 5/01/31 | | | 2,395,000 | | | | 2,446,325 | |
Lakewood City School District GO, School Facilities Improvement, Series A, Pre-Refunded, 5.00%, 11/01/43 | | | 10,895,000 | | | | 12,395,350 | |
Lakota Local School District GO, | | | | | | | | |
Butler County, Refunding, Series A, NATL Insured, 5.25%, 12/01/26 | | | 2,000,000 | | | | 2,417,420 | |
Butler County, Refunding, Series C, 5.00%, 12/01/30 | | | 4,035,000 | | | | 4,684,756 | |
Lancaster City School District GO, Fairfield County, School Facilities Construction and Improvement, 5.00%, 10/01/49 | | | 10,000,000 | | | | 10,912,400 | |
Lorain County Hospital Revenue, | | | | | | | | |
Facilities, Catholic Healthcare Partners, Series C-1, AGMC Insured, 5.00%, Pre-Refunded, 4/01/33 | | | 19,410,000 | | | | 19,541,018 | |
Facilities, Catholic Healthcare Partners, Series C-2, AGMC Insured, 5.00%, Pre-Refunded, 4/01/33 | | | 8,000,000 | | | | 8,054,800 | |
Lucas County GO, Various Purpose, Pre-Refunded, 4.50%, 10/01/35 | | | 10,685,000 | | | | 10,885,130 | |
Lucas-Plaza HDC Revenue, Refunding, FHA Insured, ETM, zero cpn., 6/01/24. | | | 35,230,000 | | | | 30,072,328 | |
Madeira City School District GO, School Improvement, Refunding, AGMC Insured, 5.25%, 12/01/32 | | | 9,605,000 | | | | 11,896,561 | |
Mahoning County Hospital Facilities Revenue, Western Reserve Care System Project, NATL Insured, ETM, 5.50%, 10/15/25 | | | 3,995,000 | | | | 4,506,998 | |
| | | | | | | | |
franklintempleton.com | | | | | | Annual Report | | 115 |
FRANKLIN TAX-FREE TRUST
STATEMENT OF INVESTMENTS
Franklin Ohio Tax-Free Income Fund (continued)
| | | | | | | | |
| | | Principal
Amount | | | Value | |
Municipal Bonds (continued) | | | | | | | | |
Ohio (continued) | | | | | | | | |
Marysville Exempted Village School District GO, | | | | | | | | |
Capital Appreciation, Refunding, NATL Insured, zero cpn., 12/01/20 | | $ | 1,000,000 | | | $ | 948,860 | |
Capital Appreciation, Refunding, NATL Insured, zero cpn., 12/01/21 | | | 1,000,000 | | | | 924,700 | |
Marysville Wastewater Treatment System Revenue, | | | | | | | | |
Refunding, BAM Insured, 4.00%, 12/01/40 | | | 3,015,000 | | | | 3,082,898 | |
Refunding, BAM Insured, 4.00%, 12/01/46 | | | 9,370,000 | | | | 9,557,400 | |
Refunding, BAM Insured, 5.00%, 12/01/47 | | | 5,035,000 | | | | 5,685,119 | |
Medina School District COP, School Facilities Project, Assured Guaranty, Pre-Refunded, 5.25%, 12/01/31 | | | 5,725,000 | | | | 5,781,506 | |
Miami University Revenue, | | | | | | | | |
General Receipts, Refunding, 5.00%, 9/01/31 | | | 4,000,000 | | | | 4,386,320 | |
General Receipts, Refunding, 5.00%, 9/01/31 | | | 2,320,000 | | | | 2,630,114 | |
General Receipts, Refunding, 5.00%, 9/01/34 | | | 3,500,000 | | | | 3,941,245 | |
General Receipts, Refunding, 5.00%, 9/01/41 | | | 5,000,000 | | | | 5,657,050 | |
Middletown City School District GO, | | | | | | | | |
Counties of Butler and Warren, School Improvement, 5.25%, 12/01/40 | | | 2,625,000 | | | | 2,949,896 | |
Counties of Butler and Warren, School Improvement, 5.25%, 12/01/48 | | | 15,000,000 | | | | 16,792,350 | |
Montgomery County Revenue, | | | | | | | | |
Catholic Health Initiatives, Refunding, Series A, 5.50%, 5/01/34 | | | 8,165,000 | | | | 8,433,465 | |
Catholic Health Initiatives, Series A, Pre-Refunded, 5.50%, 5/01/34 | | | 4,335,000 | | | | 4,533,196 | |
Catholic Health Initiatives, Series C-1, AGMC Insured, Pre-Refunded, 5.00%, 10/01/41 | | | 10,000,000 | | | | 10,059,500 | |
Napoleon City School District GO, School Facilities Construction and Improvement, 5.00%, 12/01/49 | | | 11,460,000 | | | | 12,291,423 | |
The New Albany Community Authority Community Facilities Revenue, | | | | | | | | |
Refunding, Series C, 5.00%, 10/01/23 | | | 1,100,000 | | | | 1,228,909 | |
Refunding, Series C, 5.00%, 10/01/24 | | | 1,250,000 | | | | 1,393,600 | |
New Albany Plain Local School District GO, School Improvement, Refunding, 4.00%, 12/01/49 | | | 10,000,000 | | | | 10,309,300 | |
Northeast Regional Sewer District Revenue, | | | | | | | | |
Wastewater Improvement, Refunding, 5.00%, 11/15/32 | | | 5,500,000 | | | | 6,325,220 | |
Wastewater Improvement, Refunding, 4.00%, 11/15/43 | | | 10,000,000 | | | | 10,347,300 | |
Wastewater Improvement, Refunding, 4.00%, 11/15/49 | | | 6,000,000 | | | | 6,120,000 | |
Northmont City School District GO, School Improvement, Series A, Pre-Refunded, 5.00%, 11/01/49 | | | 5,130,000 | | | | 5,721,027 | |
Northwest Local School District GO, Hamilton and Butler Counties, School Improvement, 5.00%, 12/01/45 | | | 3,760,000 | | | | 4,215,261 | |
Norwood City School District GO, | | | | | | | | |
School Improvement, Series A, 5.00%, 11/01/46 | | | 5,000,000 | | | | 5,543,350 | |
School Improvement, Series A, 5.25%, 11/01/51 | | | 7,645,000 | | | | 8,610,640 | |
Ohio Center for Local Government Capital Asset Financing Program Fractionalized Interests GO, | | | | | | | | |
AGMC Insured, 4.875%, 12/01/18 | | | 88,973 | | | | 89,225 | |
AGMC Insured, 5.25%, 12/01/23 | | | 540,000 | | | | 541,809 | |
Ohio HFA Capital Fund Revenue, Series A, AGMC Insured, 5.00%, 4/01/27 | | | 5,545,000 | | | | 5,602,169 | |
Ohio State Air Quality Development Authority Revenue, Environmental Improvement, Buckeye Power Inc. Project, 6.00%, 12/01/40 | | | 6,020,000 | | | | 6,670,581 | |
Ohio State GO, | | | | | | | | |
Common School, Series A, 5.00%, 3/15/36 | | | 5,000,000 | | | | 5,639,500 | |
Infrastructure Improvement, Refunding, Series A, 5.00%, 9/01/28 | | | 5,465,000 | | | | 6,646,314 | |
Ohio State Higher Educational Facility Commission Revenue, | | | | | | | | |
Case Western Reserve University Project, Refunding, 5.00%, 12/01/40 | | | 6,000,000 | | | | 6,715,980 | |
Denison University Project, Refunding and Improvement, 5.00%, 11/01/26 | | | 1,445,000 | | | | 1,588,171 | |
Hospital Facilities, Summa Health System, 2010 Project, Refunding, AGMC Insured, 5.25%, 11/15/40 | | | 21,805,000 | | | | 22,997,297 | |
Hospital Facilities, Summa Health System, AGMC Insured, 5.75%, 11/15/40 | | | 1,665,000 | | | | 1,778,636 | |
Hospital Facilities, Summa Health System, AGMC Insured, Pre-Refunded, 5.75%, 11/15/40 | | | 2,835,000 | | | | 3,089,214 | |
| | | | | | |
116 | | Annual Report | | | | franklintempleton.com |
FRANKLIN TAX-FREE TRUST
STATEMENT OF INVESTMENTS
Franklin Ohio Tax-Free Income Fund (continued)
| | | | | | | | |
| | | Principal
Amount | | | Value | |
Municipal Bonds (continued) | | | | | | | | |
Ohio (continued) | | | | | | | | |
Ohio State Higher Educational Facility Commission Revenue, (continued) | | | | | | | | |
Kenyon College Project, 5.00%, 7/01/42 | | $ | 1,250,000 | | | $ | 1,395,988 | |
Kenyon College Project, 4.00%, 7/01/47 | | | 5,000,000 | | | | 5,065,950 | |
Kenyon College Project, Pre-Refunded, 5.25%, 7/01/44 | | | 20,460,000 | | | | 22,136,697 | |
Kenyon College Project, Refunding, 5.00%, 7/01/42 | | | 10,500,000 | | | | 11,629,065 | |
Kenyon College Project, Refunding, 4.00%, 7/01/44 | | | 10,000,000 | | | | 10,198,600 | |
Kenyon College Project, Refunding, 5.25%, 7/01/44 | | | 9,540,000 | | | | 10,063,364 | |
Xavier University Project, 5.00%, 5/01/40 | | | 14,500,000 | | | | 15,245,880 | |
Xavier University Project, 4.375%, 5/01/42 | | | 8,070,000 | | | | 8,222,281 | |
Ohio State Hospital Revenue, Cleveland Clinic Health System Obligated Group, Refunding, Series A, 3.25%, 1/01/35 | | | 10,000,000 | | | | 9,560,700 | |
Ohio State Turnpike and Infrastructure Commission Revenue, | | | | | | | | |
Capital Appreciation, junior lien, Series A-2, zero cpn., 2/15/43 | | | 10,485,000 | | | | 3,808,467 | |
Infrastructure Projects, junior lien, Series A-1, 5.25%, 2/15/33 | | | 4,200,000 | | | | 4,697,448 | |
Ohio State Turnpike Commission Revenue, Capital Appreciation, junior lien, Series A-2, BAM Insured,zero cpn., 2/15/38 | | | 3,665,000 | | | | 1,685,900 | |
Ohio State Turnpike Revenue, Series A, 5.00%, 2/15/43 | | | 33,350,000 | | | | 38,309,145 | |
Ohio State University Revenue, General Receipts, Series A, 4.00%, 12/01/30 | | | 4,325,000 | | | | 4,581,819 | |
Ohio State Water Development Authority Revenue, | | | | | | | | |
Drinking Water Assistance Fund, 4.00%, 12/01/32 | | | 3,000,000 | | | | 3,186,450 | |
Drinking Water Assistance Fund, 4.00%, 12/01/33 | | | 6,000,000 | | | | 6,349,380 | |
Ohio State Water Development Authority Water PCR, | | | | | | | | |
Series A, 5.00%, 12/01/25 | | | 6,350,000 | | | | 7,525,449 | |
Series A, 5.00%, 6/01/26 | | | 10,000,000 | | | | 11,893,400 | |
Olentangy Local School District GO, | | | | | | | | |
Delaware and Franklin Counties, School Facilities Construction and Improvement, 5.00%, 12/01/41 | | | 2,125,000 | | | | 2,408,475 | |
Delaware and Franklin Counties, School Facilities Construction and Improvement, 4.00%, 12/01/46 | | | 15,235,000 | | | | 15,621,969 | |
Delaware and Franklin Counties, School Facilities Construction and Improvement, Assured Guaranty, Pre-Refunded, 5.00%, 12/01/36 | | | 7,505,000 | | | | 7,574,421 | |
Perrysburg Exempted Village School GO, School Facilities Construction and Improvement, 5.00%, 12/01/38 | | | 3,225,000 | | | | 3,618,289 | |
Princeton City School District COP, Board of Education, School Facilities Project, 4.50%, 12/01/41 | | | 3,000,000 | | | | 3,107,550 | |
Princeton City School District GO, | | | | | | | | |
School Improvement, Capital Appreciation, Refunding, zero cpn., 12/01/40 | | | 6,000,000 | | | | 2,431,800 | |
School Improvement, Capital Appreciation, Refunding, zero cpn., 12/01/41 | | | 6,000,000 | | | | 2,320,860 | |
School Improvement, Refunding, 5.00%, 12/01/39 | | | 12,000,000 | | | | 13,580,880 | |
Reading Community City School District GO, Classroom Facilities, Refunding, Series A, 5.00%, 11/01/46 | | | 2,000,000 | | | | 2,256,640 | |
Revere Local School District GO, | | | | | | | | |
School Facilities Improvement, Series A, Pre-Refunded, 5.00%, 12/01/42 | | | 3,025,000 | | | | 3,411,081 | |
School Facilities Improvement, Series A, Pre-Refunded, 5.00%, 12/01/45 | | | 2,560,000 | | | | 2,886,733 | |
Reynoldsburg City School District GO, School Facilities Construction, AGMC Insured, Pre-Refunded, 5.00%, 12/01/32 | | | 3,000,000 | | | | 3,027,390 | |
Riverside Local School District GO, School Construction and Improvement, Refunding, Series A, BAM Insured, 5.00%, 10/01/47 | | | 5,000,000 | | | | 5,587,300 | |
Ross County Hospital Revenue, Facilities, Adena Health System, Assured Guaranty, Pre-Refunded, 5.25%, 12/01/38 | | | 15,000,000 | | | | 15,428,550 | |
Sandusky City School District GO, Classroom Facilities and School Improvement, Series 1, 5.00%, 11/01/50 | | | 6,000,000 | | | | 6,502,920 | |
Sheffield Lake City School District GO, | | | | | | | | |
School Improvement, Pre-Refunded, 5.00%, 12/01/37 | | | 7,715,000 | | | | 8,162,239 | |
School Improvement, Pre-Refunded, 5.00%, 12/01/37 | | | 1,920,000 | | | | 2,033,011 | |
| | | | | | | | |
franklintempleton.com | | | | | | Annual Report | | 117 |
FRANKLIN TAX-FREE TRUST
STATEMENT OF INVESTMENTS
Franklin Ohio Tax-Free Income Fund (continued)
| | | | | | | | |
| | | Principal
Amount | | | Value | |
Municipal Bonds (continued) | | | | | | | | |
Ohio (continued) | | | | | | | | |
South-Western City School District of Ohio Franklin and Pickaway Counties GO, School Facilities Construction and Improvement, 4.00%, 12/01/42 | | $ | 10,000,000 | | | $ | 10,243,000 | |
Springboro Community City School District GO, | | | | | | | | |
Refunding, AGMC Insured, 5.25%, 12/01/27 | | | 5,175,000 | | | | 6,196,028 | |
Refunding, AGMC Insured, 5.25%, 12/01/28 | | | 2,000,000 | | | | 2,406,620 | |
St. Bernard Income Tax Revenue, Various Purpose, Special Obligations, AGMC Insured, 5.00%, 12/01/43 | | | 3,760,000 | | | | 4,129,119 | |
St. Mary’s City School District GO, School Facilities Construction and Improvement, AGMC Insured, Pre-Refunded, 5.00%, 12/01/35 | | | 3,500,000 | | | | 3,532,376 | |
Strongsville City School District GO, School Improvement, 4.00%, 12/01/45 | | | 17,515,000 | | | | 17,893,850 | |
Summit County Port Authority Lease Revenue, | | | | | | | | |
The University of Akron Student Housing Project, 6.00%, 1/01/42 | | | 3,420,000 | | | | 3,746,986 | |
The University of Akron Student Housing Project, Pre-Refunded, 6.00%, 1/01/42 | | | 8,160,000 | | | | 9,132,672 | |
Switzerland of Ohio Local School District GO, Counties Monroe Belmont and Noble, School Improvement, Refunding, 4.00%, 12/01/37 | | | 5,500,000 | | | | 5,617,315 | |
Sylvania City School District GO, School Improvement, Refunding, BAM Insured, 5.00%, 12/01/36 | | | 9,700,000 | | | | 10,914,440 | |
Three Rivers Local School District GO, Refunding, 5.00%, 12/01/39 | | | 5,885,000 | | | | 6,675,709 | |
Toledo City School District GO, | | | | | | | | |
School Facilities Improvement, Pre-Refunded, 5.375%, 12/01/35 | | | 4,565,000 | | | | 4,703,137 | |
School Facilities Improvement, Refunding, Series B, 5.00%, 12/01/32 | | | 7,830,000 | | | | 8,767,877 | |
Toledo GO, | | | | | | | | |
Capital Improvement, Refunding, Assured Guaranty, 5.00%, 12/01/29 | | | 2,500,000 | | | | 2,626,300 | |
Various Purpose Improvement, Refunding, AGMC Insured, 5.00%, 12/01/28 | | | 3,000,000 | | | | 3,234,300 | |
Toledo Special Obligation, Industrial Development, Vehicle Storage Project, AMBAC Insured, 5.25%, 12/01/26 | | | 1,500,000 | | | | 1,504,680 | |
Toledo Water System Revenue, | | | | | | | | |
Improvement and Refunding, 5.00%, 11/15/38 | | | 19,395,000 | | | | 21,407,231 | |
Series A, 4.00%, 11/15/36 | | | 9,125,000 | | | | 9,390,538 | |
University of Akron General Receipts Revenue, | | | | | | | | |
Refunding, Series A, 5.00%, 1/01/31 | | | 4,365,000 | | | | 4,943,581 | |
Refunding, Series A, 5.00%, 1/01/36 | | | 11,065,000 | | | | 12,390,587 | |
Refunding, Series A, 5.00%, 1/01/38 | | | 13,225,000 | | | | 14,768,622 | |
Refunding, Series A, BAM Insured, 5.00%, 1/01/34 | | | 6,000,000 | | | | 6,760,680 | |
University of Cincinnati General Receipts Revenue, | | | | | | | | |
Refunding, Series F, 5.00%, 6/01/32 | | | 5,805,000 | | | | 6,256,745 | |
Series C, 5.00%, 6/01/39 | | | 6,255,000 | | | | 6,977,077 | |
Series C, AGMC Insured, 5.00%, 6/01/31 | | | 775,000 | | | | 781,161 | |
Series C, AGMC Insured, Pre-Refunded, 5.00%, 6/01/31 | | | 7,225,000 | | | | 7,291,831 | |
University of Ohio General Receipts Revenue, Refunding, Series A, 5.00%, 12/01/44 | | | 7,000,000 | | | | 7,917,560 | |
Westerville City School District GO, Refunding, XLCA Insured, 5.00%, 12/01/27 | | | 3,820,000 | | | | 4,549,314 | |
Westerville Ohio Special Obligation Non-Tax Revenue, 5.00%, 12/01/30 | | | 2,765,000 | | | | 3,138,441 | |
Willoughby Eastlake City School District GO, School Improvement, 5.00%, 12/01/46 | | | 10,000,000 | | | | 11,196,800 | |
Winton Woods City School District GO, County of Hamilton, Board of Education, Classroom Facilities, Refunding, 4.00%, 11/01/43 | | | 7,000,000 | | | | 7,169,050 | |
Wyoming City School District GO, School Improvement, Pre-Refunded, 5.00%, 12/01/42 | | | 7,250,000 | | | | 8,175,318 | |
Xenia Community School District GO, School Facilities Construction and Improvement, Refunding, 5.00%, 12/01/40 | | | 7,285,000 | | | | 8,182,876 | |
Youngstown State University General Receipts Revenue, | | | | | | | | |
Assured Guaranty, Pre-Refunded, 5.25%, 12/15/29 | | | 4,000,000 | | | | 4,191,320 | |
Assured Guaranty, Pre-Refunded, 5.50%, 12/15/33 | | | 4,225,000 | | | | 4,440,475 | |
| | | | | | | | |
| Total Municipal Bonds before Short Term Investments (Cost $1,518,266,766) | | | | | | | 1,564,310,175 | |
| | | | | | | | |
| | | | | | |
118 | | Annual Report | | | | franklintempleton.com |
FRANKLIN TAX-FREE TRUST
STATEMENT OF INVESTMENTS
Franklin Ohio Tax-Free Income Fund (continued)
| | | | | | | | |
| | | Principal
Amount | | | Value | |
| Short Term Investments (Cost $12,620,000) 0.8% | | | | | | | | |
Municipal Bonds 0.8% | | | | | | | | |
Ohio 0.8% | | | | | | | | |
b Ohio State Hospital Revenue, Cleveland Clinic Health System Obligated Group, Refunding, Series B, SPA Wells Fargo Bank, Daily VRDN and Put, 1.08%, 1/01/39 | | $ | 12,620,000 | | | $ | 12,620,000 | |
| | | | | | | | |
| Total Investments (Cost $1,530,886,766) 100.0% | | | | | | | 1,576,930,175 | |
| Other Assets, less Liabilities (0.0)%† | | | | | | | (472,496 | ) |
| | | | | | | | |
| Net Assets 100.0% | | | | | | $ | 1,576,457,679 | |
| | | | | | | | |
See Abbreviations on page 162.
†Rounds to less than 0.1% of net assets.
aSecurity purchased on a when-issued basis. See Note 1(b).
bVariable rate demand notes (VRDNs) are obligations which contain a floating or variable interest rate adjustment formula and an unconditional right of demand to receive payment of the principal balance plus accrued interest at specified dates. Unless otherwise noted, the coupon rate is determined based on factors including supply and demand, underlying credit, tax treatment, and current short term rates. The coupon rate shown represents the rate at period end.
| | | | | | | | |
franklintempleton.com | | | | The accompanying notes are an integral part of these financial statements. | | | Annual Report | | 119 |
FRANKLIN TAX-FREE TRUST
Financial Highlights
Franklin Oregon Tax-Free Income Fund
| | | | | | | | | | | | | | | | | | | | |
| | | Year Ended February 28, | |
| | | 2018 | | | 2017 | | | 2016a | | | 2015 | | | 2014 | |
Class A | | | | | | | | | | | | | | | | | | | | |
Per share operating performance | | | | | | | | | | | | | | | | | | | | |
(for a share outstanding throughout the year) | | | | | | | | | | | | | | | | | | | | |
Net asset value, beginning of year | | | $11.60 | | | | $11.89 | | | | $12.02 | | | | $11.69 | | | | $12.58 | |
| | | | | |
Income from investment operationsb: | | | | | | | | | | | | | | | | | | | | |
Net investment incomec | | | 0.37 | | | | 0.40 | | | | 0.42 | | | | 0.46 | | | | 0.46 | |
Net realized and unrealized gains (losses) | | | (0.22 | ) | | | (0.29 | ) | | | (0.12 | ) | | | 0.33 | | | | (0.91 | ) |
| | | | | |
Total from investment operations | | | 0.15 | | | | 0.11 | | | | 0.30 | | | | 0.79 | | | | (0.45 | ) |
| | | | | |
Less distributions from net investment income | | | (0.38 | ) | | | (0.40 | ) | | | (0.43 | ) | | | (0.46 | ) | | | (0.44 | ) |
| | | | | |
Net asset value, end of year | | | $11.37 | | | | $11.60 | | | | $11.89 | | | | $12.02 | | | | $11.69 | |
| | | | | |
Total returnd | | | 1.29% | | | | 0.90% | | | | 2.54% | | | | 6.88% | | | | (3.50)% | |
| | | | | |
Ratios to average net assets | | | | | | | | | | | | | | | | | | | | |
Expenses | | | 0.64% | | | | 0.63% | | | | 0.63% | | | | 0.63% | | | | 0.62% | |
Net investment income | | | 3.22% | | | | 3.37% | | | | 3.55% | | | | 3.84% | | | | 3.88% | |
| | | | | |
Supplemental data | | | | | | | | | | | | | | | | | | | | |
Net assets, end of year (000’s) | | | $932,929 | | | | $962,953 | | | | $960,516 | | | | $951,107 | | | | $924,611 | |
Portfolio turnover rate | | | 12.63% | | | | 16.89% | | | | 11.84% | | | | 7.87% | | | | 8.28% | |
aFor the year ended February 29.
bThe amount shown for a share outstanding throughout the period may not correlate with the Statement of Operations for the period due to the timing of sales and repurchases of the Fund’s shares in relation to income earned and/or fluctuating fair value of the investments of the Fund.
cBased on average daily shares outstanding.
dTotal return does not reflect sales commissions or contingent deferred sales charges, if applicable.
| | | | | | |
120 | | Annual Report | | | The accompanying notes are an integral part of these financial statements. | | franklintempleton.com |
FRANKLIN TAX-FREE TRUST
FINANCIAL HIGHLIGHTS
Franklin Oregon Tax-Free Income Fund (continued)
| | | | | | | | | | | | | | | | | | | | |
| | | Year Ended February 28, | |
| | | 2018 | | | 2017 | | | 2016a | | | 2015 | | | 2014 | |
Class C | | | | | | | | | | | | | | | | | | | | |
Per share operating performance | | | | | | | | | | | | | | | | | | | | |
(for a share outstanding throughout the year) | | | | | | | | | | | | | | | | | | | | |
Net asset value, beginning of year | | | $11.77 | | | | $12.06 | | | | $12.19 | | | | $11.84 | | | | $12.74 | |
| | | | | |
Income from investment operationsb: | | | | | | | | | | | | | | | | | | | | |
Net investment incomec | | | 0.32 | | | | 0.34 | | | | 0.36 | | | | 0.40 | | | | 0.40 | |
Net realized and unrealized gains (losses) | | | (0.22 | ) | | | (0.30 | ) | | | (0.13 | ) | | | 0.35 | | | | (0.92 | ) |
| | | | | |
Total from investment operations | | | 0.10 | | | | 0.04 | | | | 0.23 | | | | 0.75 | | | | (0.52 | ) |
| | | | | |
Less distributions from net investment income | | | (0.32 | ) | | | (0.33 | ) | | | (0.36 | ) | | | (0.40 | ) | | | (0.38 | ) |
| | | | | |
Net asset value, end of year | | | $11.55 | | | | $11.77 | | | | $12.06 | | | | $12.19 | | | | $11.84 | |
| | | | | |
Total returnd | | | 0.80% | | | | 0.32% | | | | 1.95% | | | | 6.38% | | | | (4.07)% | |
| | | | | |
Ratios to average net assets | | | | | | | | | | | | | | | | | | | | |
Expenses | | | 1.19% | | | | 1.18% | | | | 1.18% | | | | 1.18% | | | | 1.17% | |
Net investment income | | | 2.67% | | | | 2.82% | | | | 3.00% | | | | 3.29% | | | | 3.33% | |
| | | | | |
Supplemental data | | | | | | | | | | | | | | | | | | | | |
Net assets, end of year (000’s) | | | $175,054 | | | | $197,041 | | | | $190,047 | | | | $186,572 | | | | $188,147 | |
Portfolio turnover rate | | | 12.63% | | | | 16.89% | | | | 11.84% | | | | 7.87% | | | | 8.28% | |
aFor the year ended February 29.
bThe amount shown for a share outstanding throughout the period may not correlate with the Statement of Operations for the period due to the timing of sales and repurchases of the Fund’s shares in relation to income earned and/or fluctuating fair value of the investments of the Fund.
cBased on average daily shares outstanding.
dTotal return does not reflect sales commissions or contingent deferred sales charges, if applicable.
| | | | | | | | |
franklintempleton.com | | | | The accompanying notes are an integral part of these financial statements. | | | Annual Report | | 121 |
FRANKLIN TAX-FREE TRUST
FINANCIAL HIGHLIGHTS
Franklin Oregon Tax-Free Income Fund (continued)
| | | | |
| | | Year Ended
February 28,
2018a | |
Class R6 | | | | |
Per share operating performance | | | | |
(for a share outstanding throughout the year) | | | | |
Net asset value, beginning of year | | | $11.66 | |
| |
Income from investment operationsb: | | | | |
Net investment incomec | | | 0.23 | |
Net realized and unrealized gains (losses) | | | (0.29 | ) |
| |
Total from investment operations | | | (0.06 | ) |
| |
Less distributions from net investment income | | | (0.22 | ) |
| |
Net asset value, end of year | | | $11.38 | |
| |
Total returnd | | | (0.50)% | |
| |
Ratios to average net assetse | | | | |
Expenses before waiver and payments by affiliates | | | 0.53% | |
Expenses net of waiver and payments by affiliates | | | 0.51% | |
Net investment income | | | 3.35% | |
| |
Supplemental data | | | | |
Net assets, end of year (000’s) | | | $13,217 | |
Portfolio turnover rate | | | 12.63% | |
aFor the period August 1, 2017 (effective date) to February 28, 2018.
bThe amount shown for a share outstanding throughout the period may not correlate with the Statement of Operations for the period due to the timing of sales and repurchases of the Fund’s shares in relation to income earned and/or fluctuating fair value of the investments of the Fund.
cBased on average daily shares outstanding.
dTotal return is not annualized for periods less than one year.
eRatios are annualized for periods less than one year.
| | | | | | |
122 | | Annual Report | | | The accompanying notes are an integral part of these financial statements. | | franklintempleton.com |
FRANKLIN TAX-FREE TRUST
FINANCIAL HIGHLIGHTS
Franklin Oregon Tax-Free Income Fund (continued)
| | | | | | | | | | | | | | | | | | | | |
| | | | | | Year Ended February 28, | |
| | | 2018 | | | 2017 | | | 2016a | | | 2015 | | | 2014 | |
Advisor Class | | | | | | | | | | | | | | | | | | | | |
Per share operating performance | | | | | | | | | | | | | | | | | | | | |
(for a share outstanding throughout the year) | | | | | | | | | | | | | | | | | | | | |
Net asset value, beginning of year | | | $11.61 | | | | $11.90 | | | | $12.03 | | | | $11.70 | | | | $12.59 | |
| | | | | |
Income from investment operationsb: | | | | | | | | | | | | | | | | | | | | |
Net investment incomec | | | 0.39 | | | | 0.41 | | | | 0.43 | | | | 0.47 | | | | 0.47 | |
Net realized and unrealized gains (losses) | | | (0.23 | ) | | | (0.29 | ) | | | (0.12 | ) | | | 0.33 | | | | (0.90 | ) |
| | | | | |
Total from investment operations | | | 0.16 | | | | 0.12 | | | | 0.31 | | | | 0.80 | | | | (0.43 | ) |
| | | | | |
Less distributions from net investment income | | | (0.39 | ) | | | (0.41 | ) | | | (0.44 | ) | | | (0.47 | ) | | | (0.46 | ) |
| | | | | |
Net asset value, end of year. | | | $11.38 | | | | $11.61 | | | | $11.90 | | | | $12.03 | | | | $11.70 | |
| | | | | |
Total return | | | 1.38% | | | | 0.99% | | | | 2.64% | | | | 6.99% | | | | (3.41)% | |
| | | | | |
Ratios to average net assets | | | | | | | | | | | | | | | | | | | | |
Expenses | | | 0.54% | | | | 0.53% | | | | 0.53% | | | | 0.53% | | | | 0.52% | |
Net investment income | | | 3.32% | | | | 3.47% | | | | 3.65% | | | | 3.94% | | | | 3.98% | |
| | | | | |
Supplemental data | | | | | | | | | | | | | | | | | | | | |
Net assets, end of year (000’s) | | | $101,300 | | | | $96,539 | | | | $51,607 | | | | $50,011 | | | | $34,225 | |
Portfolio turnover rate | | | 12.63% | | | | 16.89% | | | | 11.84% | | | | 7.87% | | | | 8.28% | |
aFor the year ended February 29.
bThe amount shown for a share outstanding throughout the period may not correlate with the Statement of Operations for the period due to the timing of sales and repurchases of the Fund’s shares in relation to income earned and/or fluctuating fair value of the investments of the Fund.
cBased on average daily shares outstanding.
| | | | | | | | |
franklintempleton.com | | | | The accompanying notes are an integral part of these financial statements. | | | Annual Report | | 123 |
FRANKLIN TAX-FREE TRUST
Statement of Investments, February 28, 2018
Franklin Oregon Tax-Free Income Fund
| | | | | | | | |
| | | Principal
Amount | | | Value | |
| Municipal Bonds 98.7% | | | | | | | | |
Oregon 97.6% | | | | | | | | |
Astoria Hospital Facilities Authority Revenue, | | | | | | | | |
Columbia Memorial Hospital, 5.00%, 8/01/41 | | $ | 4,250,000 | | | $ | 4,507,295 | |
Columbia Memorial Hospital, 4.00%, 8/01/46 | | | 1,750,000 | | | | 1,695,873 | |
Columbia Memorial Hospital, Refunding, 5.00%, 8/01/28 | | | 1,325,000 | | | | 1,410,622 | |
Beaverton School District Full Faith and Credit Obligation, | | | | | | | | |
Washington and Multnomah Counties, Assured Guaranty, Pre-Refunded, 5.00%, 6/01/31 | | | 1,280,000 | | | | 1,336,256 | |
Washington and Multnomah Counties, Assured Guaranty, Pre-Refunded, 5.125%, 6/01/36 | | | 1,000,000 | | | | 1,045,490 | |
Central Lincoln People’s Utility District Revenue, Electric System, 5.00%, 12/01/45 | | | 2,900,000 | | | | 3,223,988 | |
Chemeketa Community College District GO, | | | | | | | | |
Marion, Polk, Yamhill and Linn Counties, Pre-Refunded, 5.00%, 6/15/25 | | | 1,500,000 | | | | 1,516,065 | |
Marion, Polk, Yamhill and Linn Counties, Pre-Refunded, 5.00%, 6/15/26 | | | 2,615,000 | | | | 2,643,007 | |
City of Redmond Airport Revenue, 6.25%, 6/01/39 | | | 1,010,000 | | | | 1,063,601 | |
City of Tigard Water System Revenue, | | | | | | | | |
Washington County, 5.00%, 8/01/37 | | | 11,050,000 | | | | 12,207,156 | |
Washington County, 5.00%, 8/01/42 | | | 20,915,000 | | | | 23,059,206 | |
Washington County, 5.00%, 8/01/45 | | | 23,545,000 | | | | 26,223,244 | |
Clackamas Community College District GO, | | | | | | | | |
Convertible Deferred Interest, Series A, zero cpn. to 6/15/20, 5.00% thereafter, 6/15/38 | | | 760,000 | | | | 774,501 | |
Convertible Deferred Interest, Series A, zero cpn. to 6/15/20, 5.00% thereafter, 6/15/39 | | | 1,000,000 | | | | 1,017,410 | |
Convertible Deferred Interest, Series A, zero cpn. to 6/15/20, 5.00% thereafter, 6/15/40 | | | 1,250,000 | | | | 1,269,675 | |
Clackamas County Hospital Facility Authority Revenue, Legacy Health System, Series A,
Pre-Refunded, 5.50%, 7/15/35 | | | 6,525,000 | | | | 6,862,734 | |
Clackamas County School District No. 7J Lake Oswego GO, Refunding, AGMC Insured, 5.25%, 6/01/25 | | | 3,075,000 | | | | 3,684,065 | |
Clackamas County School District No. 12 North Clackamas GO, | | | | | | | | |
Capital Appreciation, Series A, zero cpn., 6/15/40 | | | 10,000,000 | | | | 3,876,200 | |
Capital Appreciation, Series A, zero cpn., 6/15/41 | | | 17,030,000 | | | | 6,291,223 | |
Capital Appreciation, Series A, zero cpn., 6/15/42 | | | 16,625,000 | | | | 5,857,486 | |
Series B, 5.00%, 6/15/34 | | | 8,000,000 | | | | 9,316,240 | |
Series B, 5.00%, 6/15/37 | | | 10,000,000 | | | | 11,557,400 | |
Clackamas County School District No. 46 Oregon Trail GO, | | | | | | | | |
Capital Appreciation, Refunding, zero cpn., 6/15/37 | | | 12,130,000 | | | | 5,902,458 | |
Capital Appreciation, Refunding, zero cpn., 6/15/38 | | | 12,495,000 | | | | 5,822,295 | |
Series A, Pre-Refunded, 5.00%, 6/15/28 | | | 2,210,000 | | | | 2,310,135 | |
Series A, Pre-Refunded, 5.00%, 6/15/29 | | | 2,655,000 | | | | 2,775,298 | |
Series A, Pre-Refunded, 5.00%, 6/15/32 | | | 6,855,000 | | | | 7,165,600 | |
Clackamas County School District No. 62C Oregon City GO, | | | | | | | | |
Refunding, MAC Insured, 5.00%, 6/01/29 | | | 1,000,000 | | | | 1,133,210 | |
Refunding, MAC Insured, 5.00%, 6/01/34 | | | 1,770,000 | | | | 1,989,533 | |
Refunding, MAC Insured, 5.00%, 6/01/39 | | | 1,250,000 | | | | 1,398,200 | |
Clackamas River Water Revenue, Clackamas County, 5.00%, 11/01/43 | | | 1,970,000 | | | | 2,214,103 | |
Columbia and Washington Counties School District No. 47J Vernonia GO, Pre-Refunded, 5.00%, 6/15/35 | | | 5,175,000 | | | | 5,569,542 | |
Crook County GO, 5.00%, 6/15/43 | | | 2,445,000 | | | | 2,793,926 | |
Crook County School District GO, | | | | | | | | |
Crook and Deschutes Counties, 5.00%, 6/15/34 | | | 4,475,000 | | | | 5,004,437 | |
Crook and Deschutes Counties, 5.00%, 6/15/37 | | | 8,090,000 | | | | 9,009,024 | |
Deschutes County Hospital Facility Authority Hospital Revenue, | | | | | | | | |
Cascade Healthcare Community Inc., Pre-Refunded, 8.25%, 1/01/38 | | | 20,000,000 | | | | 21,097,400 | |
St. Charles Health System Inc., Refunding, Series A, 5.00%, 1/01/48 | | | 8,440,000 | | | | 9,149,044 | |
| | | | | | |
124 | | Annual Report | | | | franklintempleton.com |
FRANKLIN TAX-FREE TRUST
STATEMENT OF INVESTMENTS
Franklin Oregon Tax-Free Income Fund (continued)
| | | | | | | | |
| | | Principal
Amount | | | Value | |
Municipal Bonds (continued) | | | | | | | | |
Oregon (continued) | | | | | | | | |
Eugene Electric Utility System Revenue, | | | | | | | | |
5.00%, 8/01/41 | | $ | 1,875,000 | | | $ | 2,157,281 | |
5.00%, 8/01/43 | | | 1,250,000 | | | | 1,435,988 | |
5.00%, 8/01/47 | | | 3,580,000 | | | | 4,100,138 | |
Pre-Refunded, 5.00%, 8/01/33 | | | 10,060,000 | | | | 10,215,125 | |
Series A, Pre-Refunded, 5.00%, 8/01/40 | | | 6,745,000 | | | | 7,475,349 | |
Eugene Water Utility System Revenue, Refunding, 5.00%, 8/01/40 | | | 4,425,000 | | | | 4,845,552 | |
Forest Grove Revenue, | | | | | | | | |
Campus Improvement, Pacific University Project, Refunding, Series A, 5.00%, 5/01/36 | | | 2,500,000 | | | | 2,710,875 | |
Student Housing, Oak Tree Foundation Project, Refunding, 4.00%, 3/01/37 | | | 3,500,000 | | | | 3,529,785 | |
Independence GO, | | | | | | | | |
Full Faith and Credit Obligations, City Hall Project, AGMC Insured, Pre-Refunded, 5.00%, 6/15/35 | | | 2,110,000 | | | | 2,270,866 | |
Full Faith and Credit Obligations, City Hall Project, AGMC Insured, Pre-Refunded, 5.00%, 6/15/40 | | | 3,975,000 | | | | 4,278,054 | |
Jackson County School District No. 549C Medford GO, | | | | | | | | |
Pre-Refunded, 5.00%, 6/15/33 | | | 3,225,000 | | | | 3,259,088 | |
Pre-Refunded, 5.00%, 6/15/34 | | | 5,000,000 | | | | 5,052,850 | |
Jefferson County School District No. 509J GO, | | | | | | | | |
Jefferson and Wasco Counties, Refunding, 5.00%, 6/15/30 | | | 1,000,000 | | | | 1,130,970 | |
Jefferson and Wasco Counties, Refunding, 5.00%, 6/15/31 | | | 1,410,000 | | | | 1,592,426 | |
Jefferson and Wasco Counties, Series B, 5.00%, 6/15/30 | | | 2,000,000 | | | | 2,261,940 | |
Jefferson School District No. 14J GO, Marion and Linn Counties, Series B, 5.00%, 6/15/41 | | | 1,795,000 | | | | 2,046,515 | |
Keizer Special Assessment, Full Faith and Credit, Keizer Station Area A Local ID, 5.20%, 6/01/31 | | | 1,905,000 | | | | 1,921,212 | |
Klamath County School District GO, | | | | | | | | |
5.00%, 6/15/29 | | | 1,155,000 | | | | 1,308,118 | |
5.00%, 6/15/30 | | | 1,095,000 | | | | 1,238,412 | |
5.00%, 6/15/31 | | | 1,000,000 | | | | 1,129,380 | |
Klamath Falls Intercommunity Hospital Authority Revenue, Sky Lakes Medical Center Project, Refunding, 5.00%, 9/01/46 | | | 1,000,000 | | | | 1,101,710 | |
Lake Oswego GO, Clackamas Multnomah and Washington Counties, Full Faith and Credit Obligations,
Series A, Pre-Refunded, 5.00%, 12/01/31 | | | 6,400,000 | | | | 6,681,280 | |
Lane and Douglas Counties School District No. 28J Fern Ridge GO, | | | | | | | | |
Series A, 5.00%, 6/15/26 | | | 1,265,000 | | | | 1,502,403 | |
Series A, 5.00%, 6/15/30 | | | 3,175,000 | | | | 3,695,890 | |
Series A, 5.00%, 6/15/33 | | | 2,115,000 | | | | 2,429,902 | |
Series A, 5.00%, 6/15/36 | | | 2,000,000 | | | | 2,278,860 | |
Lane County Metropolitan Wastewater Management Commission Revenue, Wastewater, Pre-Refunded, 5.25%, 11/01/28 | | | 5,000,000 | | | | 5,131,750 | |
Medford Hospital Facilities Authority Revenue, | | | | | | | | |
Hospital, Asante Health System, Refunding, AGMC Insured, 5.125%, 8/15/40 | | | 25,000,000 | | | | 26,478,000 | |
Hospital, Asante Health System, Series A, AGMC Insured, 5.00%, 8/15/40 | | | 10,050,000 | | | | 10,609,584 | |
Rogue Valley Manor, Refunding, Series A, 5.00%, 10/01/33 | | | 1,500,000 | | | | 1,628,160 | |
Rogue Valley Manor, Refunding, Series A, 5.00%, 10/01/42 | | | 9,420,000 | | | | 10,125,464 | |
Metro Dedicated Tax Revenue, | | | | | | | | |
Oregon Convention Center Hotel Project, 5.00%, 6/15/42 | | | 10,025,000 | | | | 11,378,074 | |
Oregon Convention Center Hotel Project, 5.00%, 6/15/47 | | | 7,450,000 | | | | 8,423,715 | |
Multnomah and Clackamas Counties School District No. 10Jt Gresham-Barlow GO, Series B, 5.00%, 6/15/37 | | | 7,885,000 | | | | 9,113,010 | |
Multnomah County David Douglas School District No. 40 GO, | | | | | | | | |
Series B, zero cpn., 6/15/24 | | | 1,640,000 | | | | 1,415,992 | |
Series B, zero cpn., 6/15/25 | | | 1,325,000 | | | | 1,107,992 | |
Series B, zero cpn., 6/15/26 | | | 2,585,000 | | | | 2,073,273 | |
| | | | | | | | |
franklintempleton.com | | | | | | Annual Report | | 125 |
FRANKLIN TAX-FREE TRUST
STATEMENT OF INVESTMENTS
Franklin Oregon Tax-Free Income Fund (continued)
| | | | | | | | |
| | | Principal
Amount | | | Value | |
Municipal Bonds (continued) | | | | | | | | |
Oregon (continued) | | | | | | | | |
Multnomah County David Douglas School District No. 40 GO, (continued) | | | | | | | | |
Series B, zero cpn., 6/15/27 | | $ | 2,655,000 | | | $ | 2,037,713 | |
Series B, zero cpn., 6/15/28 | | | 2,495,000 | | | | 1,829,309 | |
Series B, zero cpn., 6/15/29 | | | 2,595,000 | | | | 1,811,544 | |
Series B, zero cpn., 6/15/30 | | | 1,885,000 | | | | 1,250,245 | |
Series B, zero cpn., 6/15/31 | | | 2,030,000 | | | | 1,285,254 | |
Series B, zero cpn., 6/15/32 | | | 2,000,000 | | | | 1,214,880 | |
Multnomah County Hospital Facilities Authority Revenue, | | | | | | | | |
Adventist Health System/West, Series A, 5.125%, 9/01/40 | | | 6,500,000 | | | | 6,760,910 | |
Terwilliger Plaza Inc., Refunding, 5.00%, 12/01/29 | | | 3,690,000 | | | | 3,995,421 | |
Multnomah County School District No. 1J GO, Portland Public Schools, Series B, 3.00%, 6/15/33 | | | 8,635,000 | | | | 8,315,678 | |
Multnomah County School District No. 3 Park Rose GO, | | | | | | | | |
Series A, 5.00%, 6/30/35 | | | 2,000,000 | | | | 2,192,180 | |
Series A, 5.00%, 6/30/36 | | | 1,500,000 | | | | 1,642,620 | |
Multnomah County School District No. 7 Reynolds GO, Refunding, 5.00%, 6/01/35 | | | 6,605,000 | | | | 7,059,226 | |
North Bend School District No. 13 GO, Coos County, AGMC Insured, 5.00%, 6/15/22 | | | 55,000 | | | | 55,163 | |
Oregon Health and Science University Revenue, | | | | | | | | |
Capital Appreciation, Refunding, Series A, NATL Insured, zero cpn., 7/01/21 | | | 9,055,000 | | | | 8,016,210 | |
Series A, 5.00%, 7/01/42 | | | 10,000,000 | | | | 11,355,300 | |
Series A, Pre-Refunded, 5.875%, 7/01/33 | | | 2,500,000 | | | | 2,643,150 | |
Series A, Pre-Refunded, 5.75%, 7/01/39 | | | 13,175,000 | | | | 13,907,793 | |
Oregon State Department of Administrative Services COP, | | | | | | | | |
Series A, Pre-Refunded, 5.25%, 5/01/39 | | | 3,800,000 | | | | 3,967,352 | |
Series C, 5.00%, 11/01/34 | | | 4,435,000 | | | | 4,666,507 | |
Series C, Pre-Refunded, 5.00%, 11/01/34 | | | 3,565,000 | | | | 3,762,572 | |
Oregon State Department of Administrative Services Lottery Revenue, | | | | | | | | |
Series A, 5.00%, 4/01/28 | | | 5,800,000 | | | | 6,534,860 | |
Series A, 5.00%, 4/01/32 | | | 5,000,000 | | | | 5,587,750 | |
Series A, Pre-Refunded, 5.00%, 4/01/27 | | | 17,880,000 | | | | 18,565,698 | |
Series A, Pre-Refunded, 5.00%, 4/01/28 | | | 18,225,000 | | | | 18,923,929 | |
Series A, Pre-Refunded, 5.00%, 4/01/29 | | | 1,750,000 | | | | 1,817,113 | |
Oregon State Department of Transportation Highway User Tax Revenue, senior lien, | | | | | | | | |
Series A, Pre-Refunded, 5.00%, 11/15/29 | | | 3,085,000 | | | | 3,216,174 | |
senior lien, Series A, Pre-Refunded, 5.00%, 11/15/33 | | | 21,530,000 | | | | 22,445,456 | |
Oregon State Facilities Authority Revenue, | | | | | | | | |
College Housing North West Project, Series A, 4.00%, 10/01/26 | | | 1,675,000 | | | | 1,684,883 | |
College Housing North West Project, Series A, 5.00%, 10/01/36 | | | 1,670,000 | | | | 1,714,472 | |
College Housing North West Project, Series A, 5.00%, 10/01/48 | | | 4,000,000 | | | | 4,086,600 | |
Legacy Health Project, Refunding, Series A, 5.00%, 6/01/46 | | | 17,500,000 | | | | 19,458,250 | |
Legacy Health System, Refunding, Series A, 5.00%, 3/15/30 | | | 1,500,000 | | | | 1,570,785 | |
Lewis and Clark College Project, Refunding, Series A, 5.75%, 10/01/41 | | | 30,000,000 | | | | 33,625,200 | |
Limited College Project, Refunding, Series A, 5.00%, 10/01/31 | | | 2,000,000 | | | | 2,101,620 | |
Limited College Project, Refunding, Series A, 5.00%, 10/01/34 | | | 2,975,000 | | | | 3,114,825 | |
Limited College Project, Refunding, Series A, 5.25%, 10/01/40 | | | 3,750,000 | | | | 3,939,825 | |
PeaceHealth, Refunding, Series A, 5.00%, 11/01/39 | | | 32,790,000 | | | | 33,918,632 | |
Providence Health and Services, Series C, 5.00%, 10/01/45 | | | 4,000,000 | | | | 4,436,400 | |
Reed College Project, Series A, Pre-Refunded, 5.00%, 7/01/29 | | | 1,500,000 | | | | 1,617,975 | |
Reed College Project, Series A, Pre-Refunded, 4.75%, 7/01/32 | | | 2,000,000 | | | | 2,145,900 | |
Reed College Project, Series A, Pre-Refunded, 5.125%, 7/01/41 | | | 10,000,000 | | | | 10,815,000 | |
Samaritan Health Services, Refunding, Series A, 5.25%, 10/01/40 | | | 13,990,000 | | | | 14,769,243 | |
Samaritan Health Services Project, Refunding, Series A, 5.00%, 10/01/41 | | | 7,800,000 | | | | 8,503,482 | |
| | | | | | |
126 | | Annual Report | | | | franklintempleton.com |
FRANKLIN TAX-FREE TRUST
STATEMENT OF INVESTMENTS
Franklin Oregon Tax-Free Income Fund (continued)
| | | | | | | | |
| | | Principal
Amount | | | Value | |
Municipal Bonds (continued) | | | | | | | | |
Oregon (continued) | | | | | | | | |
Oregon State Facilities Authority Revenue, (continued) | | | | | | | | |
Samaritan Health Services Project, Refunding, Series A, 5.00%, 10/01/46. | | $ | 3,500,000 | | | $ | 3,796,975 | |
Student Housing, CHF Ashland LLC, Southern Oregon University Project, Assured Guaranty, 5.00%, 7/01/44 | | | 8,910,000 | | | | 9,719,028 | |
University of Portland Projects, Series A, Pre-Refunded, 5.00%, 4/01/32 | | | 8,795,000 | | | | 8,822,089 | |
Willamette University Projects, Refunding, Series B, 5.00%, 10/01/40 | | | 1,950,000 | | | | 2,206,815 | |
Oregon State GO, | | | | | | | | |
Alternative Energy Project, Series B, Pre-Refunded, 6.00%, 10/01/26 | | | 1,680,000 | | | | 1,725,494 | |
Article XI-G OHSU Project, Series H, 5.00%, 8/01/42 | | | 15,000,000 | | | | 17,364,150 | |
Article XI-Q State Projects, Series A, 5.00%, 5/01/42 | | | 10,000,000 | | | | 11,539,700 | |
Elderly and Disabled Housing, Series A, 6.00%, 8/01/21 | | | 95,000 | | | | 95,321 | |
Elderly and Disabled Housing, Series A, 4.70%, 8/01/42 | | | 3,050,000 | | | | 3,053,447 | |
Higher Education, Article XI-F(1), Series M, 5.00%, 8/01/45 | | | 3,315,000 | | | | 3,785,829 | |
Higher Education, Article XI-G, Series O, 5.00%, 8/01/40 | | | 7,005,000 | | | | 8,030,112 | |
Higher Education, Article XI-G University Projects, Refunding, Series L, 5.00%, 8/01/42 | | | 8,385,000 | | | | 9,706,560 | |
State Board of Higher Education, Refunding, Series B, 5.00%, 8/01/38 | | | 1,020,000 | | | | 1,035,086 | |
State Board of Higher Education, Series A, Pre-Refunded, 5.00%, 8/01/34 | | | 5,000,000 | | | | 5,077,100 | |
State Board of Higher Education, Series B, Pre-Refunded, 5.00%, 8/01/38 | | | 5,480,000 | | | | 5,564,300 | |
Various Projects, Series H, 5.00%, 5/01/36 | | | 1,000,000 | | | | 1,107,010 | |
Oregon State Housing and Community Services Department Mortgage Revenue, SFM Program, Series C, 4.75%, 7/01/42 | | | 1,020,000 | | | | 1,037,493 | |
Oregon State University General Revenue, Series A, 5.00%, 4/01/45 | | | 12,500,000 | | | | 14,016,000 | |
Philomath School District No. 17J GO, Benton and Polk Counties, Series B, zero cpn., 6/15/31 | | | 1,000,000 | | | | 633,130 | |
Port of Portland International Airport Revenue, | | | | | | | | |
Series Nineteen, Pre-Refunded, 5.50%, 7/01/38 | | | 23,000,000 | | | | 23,316,940 | |
Series Twenty-Four A, 5.00%, 7/01/47 | | | 3,700,000 | | | | 4,157,172 | |
Series Twenty-Four B, 5.00%, 7/01/47 | | | 9,395,000 | | | | 10,404,493 | |
Portland Community College District GO, | | | | | | | | |
Multnomah Washington Yamhill Clackamas and Columbia Counties, Refunding, 5.00%, 6/15/28 | | | 2,000,000 | | | | 2,357,300 | |
Multnomah Washington Yamhill Clackamas and Columbia Counties, Refunding, 5.00%, 6/15/29 | | | 3,000,000 | | | | 3,518,850 | |
Portland EDR, Broadway Project, Series A, Pre-Refunded, 6.50%, 4/01/35 | | | 5,000,000 | | | | 5,148,350 | |
Portland GO, | | | | | | | | |
Oregon Convention Center Completion Project, Limited Tax, Capital Appreciation, Series B, zero cpn., 6/01/21 | | | 1,000,000 | | | | 939,840 | |
Oregon Convention Center Completion Project, Limited Tax, Refunding, Series A, 5.00%, 6/01/28 | | | 7,840,000 | | | | 8,625,019 | |
Oregon Convention Center Completion Project, Limited Tax, Refunding, Series A, 5.00%, 6/01/29 | | | 8,330,000 | | | | 9,158,585 | |
Oregon Convention Center Completion Project, Limited Tax, Refunding, Series A, 5.00%, 6/01/30 | | | 8,750,000 | | | | 9,611,612 | |
Portland River District Urban Renewal and Redevelopment Tax Allocation, | | | | | | | | |
Refunding, Series B, 5.00%, 6/15/22 | | | 1,035,000 | | | | 1,159,635 | |
Series C, 5.00%, 6/15/28 | | | 1,000,000 | | | | 1,108,710 | |
Series C, 5.00%, 6/15/30 | | | 1,000,000 | | | | 1,105,260 | |
Portland Sewer System Revenue, second lien, Series A, 5.00%, 3/01/34 | | | 25,270,000 | | | | 26,823,852 | |
Portland Urban Renewal and Redevelopment Tax Allocation, | | | | | | | | |
Interstate Corridor, Series B, 5.00%, 6/15/29 | | | 1,000,000 | | | | 1,093,590 | |
Interstate Corridor, Series B, 5.00%, 6/15/30 | | | 1,000,000 | | | | 1,093,250 | |
Interstate Corridor, Series B, 5.00%, 6/15/31 | | | 1,000,000 | | | | 1,091,590 | |
Lents Town Center, Series B, 5.00%, 6/15/27 | | | 2,500,000 | | | | 2,678,325 | |
Lents Town Center, Series B, 5.00%, 6/15/28 | | | 1,175,000 | | | | 1,258,261 | |
Lents Town Center, Series B, 4.75%, 6/15/29 | | | 1,000,000 | | | | 1,060,200 | |
Lents Town Center, Series B, 5.00%, 6/15/30 | | | 1,800,000 | | | | 1,924,200 | |
North Macadam, Series B, 5.00%, 6/15/29 | | | 4,250,000 | | | | 4,549,200 | |
| | | | | | | | |
franklintempleton.com | | | | | | Annual Report | | 127 |
FRANKLIN TAX-FREE TRUST
STATEMENT OF INVESTMENTS
Franklin Oregon Tax-Free Income Fund (continued)
| | | | | | | | |
| | | Principal
Amount | | | Value | |
Municipal Bonds (continued) | | | | | | | | |
Oregon (continued) | | | | | | | | |
Portland Urban Renewal and Redevelopment Tax Allocation, (continued) | | | | | | | | |
North Macadam, Series B, 5.00%, 6/15/30 | | $ | 4,725,000 | | | $ | 5,051,025 | |
Redmond GO, Full Faith and Credit Obligation, Terminal Expansion Project, 5.00%, 6/01/39 | | | 1,000,000 | | | | 1,038,760 | |
Redmond School District No. 2J GO, | | | | | | | | |
Deschutes and Jefferson Counties, Series A, NATL Insured, 5.00%, 6/15/21 | | | 85,000 | | | | 85,255 | |
Deschutes and Jefferson Counties, Series A, Pre-Refunded, 5.50%, 6/15/34 | | | 5,000,000 | | | | 5,060,650 | |
Salem Hospital Facility Authority Revenue, | | | | | | | | |
Salem Health Projects, Refunding, Series A, 5.00%, 5/15/46 | | | 31,000,000 | | | | 34,080,470 | |
Salem Hospital Project, Series A, Pre-Refunded, 5.75%, 8/15/23 | | | 10,000,000 | | | | 10,195,500 | |
Salem-Keizer School District No. 24J GO, Marion and Polk Counties, Series B, zero cpn., 6/15/30 | | | 8,500,000 | | | | 5,658,195 | |
Seaside School District No. 10 GO, | | | | | | | | |
Clatsop County, Series B, 5.00%, 6/15/35 | | | 2,000,000 | | | | 2,322,020 | |
Clatsop County, Series B, 5.00%, 6/15/36 | | | 2,500,000 | | | | 2,895,925 | |
Sherwood GO, Washington County, Full Faith and Credit Obligations, Refunding, AGMC Insured, 5.00%, 6/01/36 | | | 4,240,000 | | | | 4,612,738 | |
Tri-County Metropolitan Transportation District Revenue, | | | | | | | | |
Capital Grant Receipt, Series A, 5.00%, 10/01/31 | | | 5,000,000 | | | | 5,779,450 | |
Capital Grant Receipt, Series A, 5.00%, 10/01/32 | | | 6,865,000 | | | | 7,915,963 | |
Payroll Tax, senior lien, Series A, 5.00%, 9/01/40 | | | 6,000,000 | | | | 6,817,560 | |
Payroll Tax, senior lien, Series A, 5.00%, 9/01/41 | | | 18,650,000 | | | | 21,444,516 | |
Payroll Tax, senior lien, Series A, Pre-Refunded, 5.00%, 9/01/37 | | | 11,000,000 | | | | 12,473,340 | |
Umatilla County Pendleton School District No. 16R GO, Series A, 5.00%, 6/15/37 | | | 4,970,000 | | | | 5,638,912 | |
University of Oregon General Revenue, | | | | | | | | |
Series A, 5.00%, 4/01/45 | | | 20,000,000 | | | | 22,520,600 | |
Series A, 5.00%, 4/01/48 | | | 14,500,000 | | | | 16,639,040 | |
Washington and Clackamas Counties School District No. 23J GO, | | | | | | | | |
Tigard-Tualatin, 5.00%, 6/15/36 | | | 9,400,000 | | | | 10,888,678 | |
Tigard-Tualatin, 5.00%, 6/15/37 | | | 6,000,000 | | | | 6,934,440 | |
Washington Clackamas and Yamhill Counties Sherwood School District No. 88J GO, | | | | | | | | |
Series A, zero cpn., 6/15/38 | | | 2,350,000 | | | | 1,027,491 | |
Series A, zero cpn., 6/15/39 | | | 3,275,000 | | | | 1,368,983 | |
Series B, 5.00%, 6/15/33 | | | 2,500,000 | | | | 2,922,400 | |
Washington Counties School District No. 48J Beaverton GO, | | | | | | | | |
Series B, 5.00%, 6/15/32 | | | 10,750,000 | | | | 12,270,372 | |
Series B, 5.00%, 6/15/33 | | | 8,000,000 | | | | 9,116,480 | |
Series B, 5.00%, 6/15/34 | | | 11,000,000 | | | | 12,521,520 | |
Series D, zero cpn. to 6/15/18, 5.00% thereafter, 6/15/35 | | | 10,000,000 | | | | 11,337,800 | |
Series D, zero cpn. to 6/15/18, 5.00% thereafter, 6/15/36 | | | 10,000,000 | | | | 11,311,800 | |
Washington County School District No. 15 Forest Grove GO, | | | | | | | | |
Series B, zero cpn., 6/15/29 | | | 2,545,000 | | | | 1,776,639 | |
Series B, zero cpn., 6/15/30 | | | 2,490,000 | | | | 1,651,517 | |
Series B, zero cpn., 6/15/31 | | | 3,140,000 | | | | 1,980,272 | |
Woodburn School District No. 103 GO, | | | | | | | | |
Marion County, 5.00%, 6/15/33 | | | 2,930,000 | | | | 3,352,066 | |
Marion County, 5.00%, 6/15/34 | | | 3,200,000 | | | | 3,651,904 | |
Marion County, 5.00%, 6/15/35 | | | 2,075,000 | | | | 2,360,707 | |
Yachats Rural Fire Protection District GO, Lincoln County, AGMC Insured, 5.00%, 6/15/47 | | | 1,600,000 | | | | 1,780,736 | |
| | | | | | | | |
| | | | | | | 1,192,254,621 | |
| | | | | | | | |
| | | | | | |
128 | | Annual Report | | | | franklintempleton.com |
FRANKLIN TAX-FREE TRUST
STATEMENT OF INVESTMENTS
Franklin Oregon Tax-Free Income Fund (continued)
| | | | | | | | |
| | | Principal
Amount | | | Value | |
Municipal Bonds (continued) | | | | | | | | |
U.S. Territories 1.1% | | | | | | | | |
Guam 0.4% | | | | | | | | |
Guam Government Limited Obligation Revenue, | | | | | | | | |
Section 30, Series A, Pre-Refunded, 5.625%, 12/01/24 | | $ | 840,000 | | | $ | 899,665 | |
Section 30, Series A, Pre-Refunded, 5.625%, 12/01/29 | | | 3,250,000 | | | | 3,480,848 | |
| | | | | | | | |
| | | | | | | 4,380,513 | |
| | | | | | | | |
Puerto Rico 0.7% | | | | | | | | |
Children’s Trust Fund Tobacco Settlement Revenue, Asset-Backed, Refunding, 5.625%, 5/15/43 | | | 6,000,000 | | | | 5,613,000 | |
a Puerto Rico Electric Power Authority Power Revenue, Series WW, 5.25%, 7/01/33 | | | 9,690,000 | | | | 3,645,862 | |
| | | | | | | | |
| | | | | | | 9,258,862 | |
| | | | | | | | |
Total U.S. Territories | | | | | | | 13,639,375 | |
| | | | | | | | |
Total Municipal Bonds before Short Term Investments (Cost $1,168,105,501) | | | | | | | 1,205,893,996 | |
| | | | | | | | |
Short Term Investments (Cost $125,000) 0.0%† | | | | | | | | |
Municipal Bonds 0.0%† | | | | | | | | |
Oregon 0.0%† | | | | | | | | |
b Oregon State Facilities Authority Revenue, Providence Health and Services, Refunding, Series C, Weekly | | | | | | | | |
VRDN and Put, 2.09%, (MUNIPSA + 1.00%), 9/15/18 | | | 125,000 | | | | 125,087 | |
| | | | | | | | |
Total Investments (Cost $1,168,230,501) 98.7% | | | | | | | 1,206,019,083 | |
Other Assets, less Liabilities 1.3%. | | | | | | | 16,481,350 | |
| | | | | | | | |
Net Assets 100.0% | | | | | | $ | 1,222,500,433 | |
| | | | | | | | |
See Abbreviations on page 162.
†Rounds to less than 0.1% of net assets.
aSee Note 7 regarding defaulted securities.
bVariable rate demand notes (VRDNs) are obligations which contain a floating or variable interest rate adjustment formula and an unconditional right of demand to receive payment of the principal balance plus accrued interest at specified dates. Unless otherwise noted, the coupon rate is determined based on factors including supply and demand, underlying credit, tax treatment, and current short term rates. The coupon rate shown represents the rate at period end.
| | | | | | | | |
franklintempleton.com | | | | The accompanying notes are an integral part of these financial statements. | | | Annual Report | | 129 |
FRANKLIN TAX-FREE TRUST
Financial Highlights
Franklin Pennsylvania Tax-Free Income Fund
| | | | | | | | | | |
| | | Year Ended February 28, |
| | | 2018 | | 2017 | | 2016a | | 2015 | | 2014 |
Class A | | | | | | | | | | |
Per share operating performance | | | | | | | | | | |
(for a share outstanding throughout the year) | | | | | | | | | | |
Net asset value, beginning of year | | $10.12 | | $10.33 | | $10.51 | | $10.17 | | $10.94 |
| | | | | |
Income from investment operationsb: | | | | | | | | | | |
Net investment incomec | | 0.35 | | 0.39 | | 0.40 | | 0.43 | | 0.42 |
Net realized and unrealized gains (losses) | | (0.32) | | (0.22) | | (0.18) | | 0.34 | | (0.78) |
| | | | | |
Total from investment operations | | 0.03 | | 0.17 | | 0.22 | | 0.77 | | (0.36) |
| | | | | |
Less distributions from net investment income | | (0.37) | | (0.38) | | (0.40) | | (0.43) | | (0.41) |
| | | | | |
Net asset value, end of year | | $9.78 | | $10.12 | | $10.33 | | $10.51 | | $10.17 |
| | | | | |
Total returnd | | 0.31% | | 1.62% | | 2.15% | | 7.72% | | (3.28)% |
| | | | | |
Ratios to average net assets | | | | | | | | | | |
Expenses | | 0.66% | | 0.64% | | 0.64% | | 0.64% | | 0.63% |
Net investment income | | 3.49% | | 3.73% | | 3.92% | | 4.15% | | 4.04% |
| | | | | |
Supplemental data | | | | | | | | | | |
Net assets, end of year (000’s) | | $860,737 | | $942,320 | | $965,479 | | $1,001,684 | | $981,992 |
Portfolio turnover rate | | 13.33% | | 10.88% | | 4.73% | | 6.04% | | 7.04% |
aFor the year ended February 29.
bThe amount shown for a share outstanding throughout the period may not correlate with the Statement of Operations for the period due to the timing of sales and repurchases of the Fund’s shares in relation to income earned and/or fluctuating fair value of the investments of the Fund.
cBased on average daily shares outstanding.
dTotal return does not reflect sales commissions or contingent deferred sales charges, if applicable.
| | | | | | |
130 | | Annual Report | | | The accompanying notes are an integral part of these financial statements. | | franklintempleton.com |
FRANKLIN TAX-FREE TRUST
FINANCIAL HIGHLIGHTS
Franklin Pennsylvania Tax-Free Income Fund (continued)
| | | | | | | | | | |
| | | Year Ended February 28, |
| | | 2018 | | 2017 | | 2016a | | 2015 | | 2014 |
Class C | | | | | | | | | | |
Per share operating performance | | | | | | | | | | |
(for a share outstanding throughout the year) | | | | | | | | | | |
Net asset value, beginning of year | | $10.24 | | $10.45 | | $10.63 | | $10.28 | | $11.06 |
| | | | | |
Income from investment operationsb: | | | | | | | | | | |
Net investment incomec | | 0.30 | | 0.33 | | 0.35 | | 0.38 | | 0.36 |
Net realized and unrealized gains (losses) | | (0.31) | | (0.22) | | (0.19) | | 0.34 | | (0.79) |
| | | | | |
Total from investment operations | | (0.01) | | 0.11 | | 0.16 | | 0.72 | | (0.43) |
| | | | | |
Less distributions from net investment income | | (0.32) | | (0.32) | | (0.34) | | (0.37) | | (0.35) |
| | | | | |
Net asset value, end of year | | $9.91 | | $10.24 | | $10.45 | | $10.63 | | $10.28 |
| | | | | |
Total returnd | | (0.15)% | | 1.04% | | 1.56% | | 7.15% | | (3.86)% |
| | | | | |
Ratios to average net assets | | | | | | | | | | |
Expenses | | 1.21% | | 1.19% | | 1.19% | | 1.19% | | 1.18% |
Net investment income | | 2.94% | | 3.18% | | 3.37% | | 3.60% | | 3.49% |
| | | | | |
Supplemental data | | | | | | | | | | |
Net assets, end of year (000’s) | | $245,520 | | $283,260 | | $282,541 | | $279,987 | | $268,291 |
Portfolio turnover rate | | 13.33% | | 10.88% | | 4.73% | | 6.04% | | 7.04% |
aFor the year ended February 29.
bThe amount shown for a share outstanding throughout the period may not correlate with the Statement of Operations for the period due to the timing of sales and repurchases of the Fund’s shares in relation to income earned and/or fluctuating fair value of the investments of the Fund.
cBased on average daily shares outstanding.
dTotal return does not reflect sales commissions or contingent deferred sales charges, if applicable.
| | | | | | | | |
franklintempleton.com | | | | The accompanying notes are an integral part of these financial statements. | | | Annual Report | | 131 |
FRANKLIN TAX-FREE TRUST
FINANCIAL HIGHLIGHTS
Franklin Pennsylvania Tax-Free Income Fund (continued)
| | |
| | | Year Ended
February 28,
2018a |
Class R6 | | |
Per share operating performance | | |
(for a share outstanding throughout the year) | | |
Net asset value, beginning of year | | $10.06 |
| |
Income from investment operationsb: | | |
Net investment incomec | | 0.21 |
Net realized and unrealized gains (losses) | | (0.25) |
| |
Total from investment operations | | (0.04) |
| |
Less distributions from net investment income | | (0.22) |
| |
Net asset value, end of year | | $9.80 |
| |
Total returnd | | (0.43)% |
| |
Ratios to average net assetse | | |
Expenses before waiver and payments by affiliates | | 0.57% |
Expenses net of waiver and payments by affiliates | | 0.52% |
Net investment income | | 3.63% |
| |
Supplemental data | | |
Net assets, end of year (000’s) | | $2,085 |
Portfolio turnover rate | | 13.33% |
aFor the period August 1, 2017 (effective date) to February 28, 2018.
bThe amount shown for a share outstanding throughout the period may not correlate with the Statement of Operations for the period due to the timing of sales and repurchases of the Fund’s shares in relation to income earned and/or fluctuating fair value of the investments of the Fund.
cBased on average daily shares outstanding.
dTotal return is not annualized for periods less than one year.
eRatios are annualized for periods less than one year.
| | | | | | |
132 | | Annual Report | | | The accompanying notes are an integral part of these financial statements. | | franklintempleton.com |
FRANKLIN TAX-FREE TRUST
FINANCIAL HIGHLIGHTS
Franklin Pennsylvania Tax-Free Income Fund (continued)
| | | | | | | | | | |
| | | Year Ended February 28, |
| | | 2018 | | 2017 | | 2016a | | 2015 | | 2014 |
Advisor Class | | | | | | | | | | |
Per share operating performance | | | | | | | | | | |
(for a share outstanding throughout the year) | | | | | | | | | | |
Net asset value, beginning of year | | $10.13 | | $10.34 | | $10.52 | | $10.18 | | $10.95 |
| | | | | |
Income from investment operationsb: | | | | | | | | | | |
Net investment incomec | | 0.36 | | 0.40 | | 0.41 | | 0.44 | | 0.43 |
Net realized and unrealized gains (losses) | | (0.31) | | (0.22) | | (0.18) | | 0.34 | | (0.78) |
| | | | | |
Total from investment operations | | 0.05 | | 0.18 | | 0.23 | | 0.78 | | (0.35) |
| | | | | |
Less distributions from net investment income | | (0.38) | | (0.39) | | (0.41) | | (0.44) | | (0.42) |
| | | | | |
Net asset value, end of year | | $9.80 | | $10.13 | | $10.34 | | $10.52 | | $10.18 |
| | | | | |
Total return | | 0.51% | | 1.72% | | 2.25% | | 7.82% | | (3.18)% |
| | | | | |
Ratios to average net assets | | | | | | | | | | |
Expenses | | 0.56% | | 0.54% | | 0.54% | | 0.54% | | 0.53% |
Net investment income | | 3.59% | | 3.83% | | 4.02% | | 4.25% | | 4.14% |
| | | | | |
Supplemental data | | | | | | | | | | |
Net assets, end of year (000’s) | | $79,153 | | $85,753 | | $52,807 | | $49,301 | | $42,043 |
Portfolio turnover rate | | 13.33% | | 10.88% | | 4.73% | | 6.04% | | 7.04% |
aFor the year ended February 29.
bThe amount shown for a share outstanding throughout the period may not correlate with the Statement of Operations for the period due to the timing of sales and repurchases of the Fund’s shares in relation to income earned and/or fluctuating fair value of the investments of the Fund.
cBased on average daily shares outstanding.
| | | | | | | | |
franklintempleton.com | | | | The accompanying notes are an integral part of these financial statements. | | | Annual Report | | 133 |
FRANKLIN TAX-FREE TRUST
Statement of Investments, February 28, 2018
Franklin Pennsylvania Tax-Free Income Fund
| | | | | | | | |
| | | Principal
Amount | | | Value | |
Municipal Bonds 98.7% | | | | | | | | |
Pennsylvania 97.9% | | | | | | | | |
Abington School District GO, Montgomery County, Series A, 4.00%, 10/01/42 | | $ | 12,000,000 | | | $ | 12,405,480 | |
Allegheny County GO, | | | | | | | | |
Refunding, Series C-76, 5.00%, 11/01/41. | | | 5,620,000 | | | | 6,303,111 | |
Series C-65, 5.375%, 5/01/31 | | | 2,160,000 | | | | 2,380,255 | |
Series C-65, Pre-Refunded, 5.375%, 5/01/31 | | | 2,840,000 | | | | 3,150,810 | |
Allegheny County Higher Education Building Authority University Revenue, | | | | | | | | |
Duquesne University, Series A, Pre-Refunded, 5.50%, 3/01/31 | | | 3,000,000 | | | | 3,331,740 | |
Robert Morris University, 5.00%, 10/15/37 | | | 1,000,000 | | | | 1,087,480 | |
Robert Morris University, 5.00%, 10/15/47 | | | 1,625,000 | | | | 1,753,635 | |
Robert Morris University, Refunding, 5.00%, 10/15/34 | | | 2,555,000 | | | | 2,776,493 | |
Robert Morris University, Refunding, 5.00%, 10/15/38 | | | 2,080,000 | | | | 2,244,466 | |
Allegheny County Hospital Development Authority Revenue, University of Pittsburgh Medical Center, Series A, 5.625%, 8/15/39 | | | 12,000,000 | | | | 12,577,320 | |
Allegheny County Sanitary Authority Sewer Revenue, | | | | | | | | |
AGMC Insured, 5.00%, 6/01/40 | | | 5,000,000 | | | | 5,383,550 | |
Refunding, AGMC Insured, 4.00%, 12/01/35 | | | 2,650,000 | | | | 2,769,330 | |
Berks County IDA Health System Revenue, Tower Health Project, 5.00%, 11/01/47 | | | 5,000,000 | | | | 5,498,250 | |
Berks County IDA Healthcare Facilities Revenue, | | | | | | | | |
The Highlands at Wyomissing, Refunding, Series A, 5.00%, 5/15/42 | | | 500,000 | | | | 540,950 | |
The Highlands at Wyomissing, Refunding, Series A, 5.00%, 5/15/47 | | | 600,000 | | | | 644,346 | |
The Highlands at Wyomissing, Series C, 5.00%, 5/15/37 | | | 1,245,000 | | | | 1,358,556 | |
The Berks County Municipal Authority Revenue, The Reading Hospital and Medical Center Project, Series A, 5.00%, 11/01/44 | | | 10,000,000 | | | | 10,634,000 | |
Bethel Park School District GO, Pre-Refunded, 5.10%, 8/01/33 | | | 3,600,000 | | | | 3,782,160 | |
Bethlehem Area School District GO, AGMC Insured, Pre-Refunded, 5.25%, 1/15/26 | | | 6,605,000 | | | | 7,050,970 | |
Bethlehem GO, Lehigh and Northampton Counties, Refunding, Series B, AGMC Insured, 6.50%, 12/01/32 | | | 4,975,000 | | | | 5,504,788 | |
Bucks County IDAR, George School Project, 5.00%, 9/15/41 | | | 5,000,000 | | | | 5,445,250 | |
Bucks County Water and Sewer Authority Sewer System Revenue, Series A, AGMC Insured, Pre- Refunded, 5.00%, 12/01/35. | | | 2,500,000 | | | | 2,722,575 | |
Bucks County Water and Sewer Authority Water System Revenue, AGMC Insured, Pre-Refunded, 5.00%, 12/01/41 | | | 10,000,000 | | | | 11,154,300 | |
Butler County Hospital Authority Hospital Revenue, | | | | | | | | |
Butler Health System Project, Refunding, Series A, 5.00%, 7/01/39 | | | 1,625,000 | | | | 1,765,936 | |
Butler Health System Project, Series B, Pre-Refunded, 7.25%, 7/01/39 | | | 4,500,000 | | | | 4,826,430 | |
Cambria County General Financing Authority Revenue, St. Francis University Project, Refunding, Series PP3, 5.00%, 11/01/29 | | | 1,000,000 | | | | 1,109,140 | |
Centennial School District Bucks County GO, Series A, 5.00%, 12/15/37 | | | 5,855,000 | | | | 6,310,343 | |
Central Bradford Progress Authority Revenue, Guthrie Health Issue, Refunding, 5.375%, 12/01/41 | | | 3,000,000 | | | | 3,285,060 | |
Centre County Hospital Authority Revenue, | | | | | | | | |
a Mount Nittany Medical Center Project, Refunding, Series A, 5.00%, 11/15/42 | | | 1,215,000 | | | | 1,349,440 | |
Mount Nittany Medical Center Project, Refunding, Series A, 5.00%, 11/15/46 | | | 6,050,000 | | | | 6,590,386 | |
a Mount Nittany Medical Center Project, Refunding, Series A, 4.00%, 11/15/47 | | | 1,840,000 | | | | 1,839,908 | |
Chester County Health and Education Facilities Authority Revenue, Main Line Health System, Refunding,
Series A, 5.00%, 10/01/35 | | | 2,775,000 | | | | 3,175,016 | |
Chester County IDA Student Housing Revenue, | | | | | | | | |
University Student Housing LLC Project at West Chester University of Pennsylvania, Series A, 5.00%, 8/01/35 | | | 500,000 | | | | 531,860 | |
University Student Housing LLC Project at West Chester University of Pennsylvania, Series A, 5.00%, 8/01/45 | | | 1,500,000 | | | | 1,572,315 | |
| | | | | | |
134 | | Annual Report | | | | franklintempleton.com |
FRANKLIN TAX-FREE TRUST
STATEMENT OF INVESTMENTS
Franklin Pennsylvania Tax-Free Income Fund (continued)
| | | | | | | | |
| | | Principal
Amount | | | Value | |
Municipal Bonds (continued) | | | | | | | | |
Pennsylvania (continued) | | | | | | | | |
Clarion County IDA Student Housing Revenue, Clarion University Foundation Inc., Student Housing Project at Clarion University, Series A, 5.00%, 7/01/45 | | $ | 2,335,000 | | | $ | 2,380,509 | |
Commonwealth Financing Authority Revenue, | | | | | | | | |
Series A, 5.00%, 6/01/34 | | | 10,000,000 | | | | 11,224,300 | |
Series B, 5.00%, 6/01/32 | | | 5,000,000 | | | | 5,309,700 | |
Cumberland County Municipal Authority College Revenue, Dickinson College Project, Assn. of Independent Colleges and Universities of Pennsylvania Financing Program, Series HH1, Pre-Refunded, 5.00%, 11/01/39 | | | 1,200,000 | | | | 1,268,532 | |
Cumberland County Municipal Authority Revenue, Dickinson College Project, 5.00%, 11/01/42 | | | 4,500,000 | | | | 4,929,885 | |
Dallas Area Municipal Authority University Revenue, Misericordia University Project, Refunding, 5.00%, 5/01/37 | | | 2,500,000 | | | | 2,663,350 | |
Dauphin County General Authority Health System Revenue, | | | | | | | | |
Pinnacle Health System Project, Series A, 6.00%, 6/01/36 | | | 1,610,000 | | | | 1,676,670 | |
Pinnacle Health System Project, Series A, 5.00%, 6/01/42 | | | 15,590,000 | | | | 17,012,587 | |
Pinnacle Health System Project, Series A, Pre-Refunded, 6.00%, 6/01/36 | | | 8,390,000 | | | | 8,856,736 | |
Deer Lakes School District GO, Assured Guaranty, Pre-Refunded, 5.50%, 4/01/39 | | | 7,500,000 | | | | 7,819,425 | |
Delaware County Authority Revenue, | | | | | | | | |
Elwyn Project, Refunding, 5.00%, 6/01/27 | | | 3,040,000 | | | | 3,380,936 | |
Elwyn Project, Refunding, 5.00%, 6/01/32 | | | 1,620,000 | | | | 1,768,878 | |
Elwyn Project, Refunding, 5.00%, 6/01/37 | | | 1,750,000 | | | | 1,895,705 | |
Haverford College, Pre-Refunded, 5.00%, 11/15/40 | | | 2,375,000 | | | | 2,544,219 | |
Haverford College, Refunding, 5.00%, 11/15/40 | | | 625,000 | | | | 661,575 | |
Villanova University, 4.00%, 8/01/45 | | | 2,120,000 | | | | 2,184,448 | |
Delaware County Authority University Revenue, | | | | | | | | |
Neumann University, 5.00%, 10/01/25 | | | 1,250,000 | | | | 1,335,963 | |
Neumann University, 5.25%, 10/01/31 | | | 1,250,000 | | | | 1,310,100 | |
Delaware County Regional Water Quality Control Authority Revenue, Sewer, 4.00%, 11/01/36 | | | 2,005,000 | | | | 2,076,258 | |
Delaware County Vocational and Technical School Authority Lease Revenue, Intermediate No. 25 Project, BAM Insured, 5.00%, 11/01/38 | | | 1,250,000 | | | | 1,366,338 | |
East Hempfield Township IDAR, | | | | | | | | |
Student Services Inc., Student Housing Project at Millersville University of Pennsylvania, 5.00%, 7/01/45 | | | 3,250,000 | | | | 3,415,620 | |
Student Services Inc., Student Housing Project at Millersville University of Pennsylvania, 5.00%, 7/01/47 | | | 3,750,000 | | | | 3,956,775 | |
Erie Parking Authority Parking Facilities Revenue, | | | | | | | | |
Guaranteed, AGMC Insured, Pre-Refunded, 5.125%, 9/01/32 | | | 1,100,000 | | | | 1,194,545 | |
Guaranteed, Refunding, AGMC Insured, 5.125%, 9/01/32 | | | 3,150,000 | | | | 3,368,736 | |
Erie Water Authority Water Revenue, | | | | | | | | |
AGMC Insured, Pre-Refunded, 5.00%, 12/01/43 | | | 5,575,000 | | | | 5,721,845 | |
Refunding, 5.00%, 12/01/43 | | | 6,000,000 | | | | 6,653,700 | |
Refunding, AGMC Insured, 5.00%, 12/01/43 | | | 1,425,000 | | | | 1,458,872 | |
Falls Township Authority Water and Sewer Revenue, Bucks County, Guaranteed, 5.00%, 12/01/41 | | | 2,210,000 | | | | 2,428,834 | |
Franklin County IDAR, The Chambersburg Hospital Project, 5.375%, 7/01/42 | | | 10,000,000 | | | | 10,626,700 | |
Geisinger Authority Revenue, Geisinger Health System, Refunding, Series A, Sub Series A-1, 5.00%, 2/15/45 | | | 13,500,000 | | | | 15,055,605 | |
General Authority of Southcentral Pennsylvania Revenue, | | | | | | | | |
Assn. of Independent Colleges and Universities, Financing Program, York College of Pennsylvania Project, Series II, Pre-Refunded, 5.75%, 11/01/41 | | | 9,500,000 | | | | 10,648,740 | |
WellSpan Health Obligated Group, Refunding, Series A, 5.00%, 6/01/44 | | | 11,955,000 | | | | 12,961,970 | |
WellSpan Health Obligated Group, Series A, Pre-Refunded, 6.00%, 6/01/25 | | | 10,000,000 | | | | 10,113,855 | |
| | | | | | | | |
franklintempleton.com | | | | | | Annual Report | | 135 |
FRANKLIN TAX-FREE TRUST
STATEMENT OF INVESTMENTS
Franklin Pennsylvania Tax-Free Income Fund (continued)
| | | | | | | | |
| | | Principal
Amount | | | Value | |
Municipal Bonds (continued) | | | | | | | | |
Pennsylvania (continued) | | | | | | | | |
Indiana County Hospital Authority Hospital Revenue, Indiana Regional Medical Center, Series A, 6.00%, 6/01/39 | | $ | 1,625,000 | | | $ | 1,761,338 | |
Lackawanna County GO, | | | | | | | | |
Refunding, Series B, AGMC Insured, 5.00%, 9/01/30 | | | 3,025,000 | | | | 3,229,702 | |
Refunding, Series B, AGMC Insured, 5.00%, 9/01/35 | | | 2,735,000 | | | | 2,909,794 | |
Series B, AGMC Insured, Pre-Refunded, 5.00%, 9/01/30 | | | 5,075,000 | | | | 5,495,768 | |
Series B, AGMC Insured, Pre-Refunded, 5.00%, 9/01/35 | | | 4,765,000 | | | | 5,160,066 | |
Lancaster County Hospital Authority Revenue, University of Pennsylvania Health System, Refunding, Series B, 5.00%, 8/15/46 | | | 4,165,000 | | | | 4,647,723 | |
Latrobe IDA College Revenue, St. Vincent College Project, 5.00%, 5/01/43 | | | 4,120,000 | | | | 4,320,067 | |
Lehigh County Authority Water and Sewer Revenue, City of Allentown Concession, Series A, 5.00%, 12/01/43 | | | 5,240,000 | | | | 5,765,991 | |
Lehigh County General Purpose Authority Revenue, Muhlenberg College Project, Pre-Refunded, 5.25%, 2/01/34 | | | 1,500,000 | | | | 1,552,095 | |
Luzerne County IDA Water Facility Revenue, Pennsylvania American Water Co. Water Facilities, Refunding, 5.50%, 12/01/39 | | | 10,000,000 | | | | 10,599,500 | |
Lycoming County Authority Health System Revenue, Susquehanna Health System Project, Refunding,
Series A, 5.75%, 7/01/39 | | | 25,000,000 | | | | 26,258,000 | |
Lycoming County Authority Revenue, | | | | | | | | |
AICUP Financing Program, Lycoming College Project, Series MM1, 5.25%, 11/01/38 | | | 1,400,000 | | | | 1,572,984 | |
AICUP Financing Program, Lycoming College Project, Series MM1, 5.25%, 11/01/43 | | | 1,495,000 | | | | 1,675,566 | |
Lycoming County Water and Sewer Authority Revenue, Guaranteed Sewer, AGMC Insured, Pre- Refunded, 5.00%, 11/15/35. | | | 5,835,000 | | | | 6,170,863 | |
Marple Newtown School District GO, Delaware County, AGMC Insured, Pre-Refunded, 5.00%, 6/01/31 | | | 11,225,000 | | | | 11,711,267 | |
McKeesport Municipal Authority Sewer Revenue, Pre-Refunded, 5.75%, 12/15/39 | | | 5,000,000 | | | | 5,366,550 | |
Monroe County Hospital Authority Hospital Revenue, Pocono Medical Center, Series A, Pre-Refunded, 5.00%, 1/01/41 | | | 4,000,000 | | | | 4,451,240 | |
Montgomery County Higher Education and Health Authority Revenue, Arcadia University, 5.625%, 4/01/40 | | | 5,750,000 | | | | 6,010,590 | |
Montgomery County IDA Health System Revenue, Jefferson Health System, Series A, 5.00%, 10/01/41 | | | 9,600,000 | | | | 10,220,160 | |
Montgomery County IDAR, | | | | | | | | |
Foulkeways at Gwynedd Project, Refunding, 5.00%, 12/01/46 | | | 2,000,000 | | | | 2,121,880 | |
New Regional Medical Center Project, Mortgage, FHA Insured, Pre-Refunded, 5.375%, 8/01/38 | | | 4,995,000 | | | | 5,433,461 | |
Northampton County General Purpose Authority College Revenue, Lafayette College, Refunding, 5.00%, 11/01/47 | | | 2,500,000 | | | | 2,818,225 | |
Northampton County General Purpose Authority Hospital Revenue, | | | | | | | | |
St. Luke’s Hospital Project, Series A, Pre-Refunded, 5.50%, 8/15/35 | | | 10,000,000 | | | | 10,182,000 | |
St. Luke’s Hospital Project, Series B, 5.50%, 8/15/33. | | | 2,200,000 | | | | 2,347,070 | |
St. Luke’s University Health Network Project, Refunding, Series A, 5.00%, 8/15/46 | | | 10,000,000 | | | | 10,779,300 | |
Northampton County General Purpose Authority Revenue, Higher Education, Lehigh University, Series A, Pre-Refunded, 5.00%, 11/15/39. | | | 20,000,000 | | | | 20,850,400 | |
Northeastern Hospital and Education Authority Revenue, Wilkes University Project, Series A, 5.25%, 3/01/42 | | | 2,400,000 | | | | 2,548,968 | |
Pennsylvania State Economic Development Financing Authority Revenue, | | | | | | | | |
UPMC, Refunding, Series A, 4.00%, 11/15/42 | | | 5,000,000 | | | | 5,064,050 | |
UPMC, Series A, 5.00%, 2/01/45 | | | 5,000,000 | | | | 5,476,450 | |
Water Facilities, Aqua Pennsylvania Inc. Project, Series B, 5.00%, 12/01/43 | | | 25,000,000 | | | | 26,848,500 | |
Water Facility, Pennsylvania-American Water Co. Project, 6.20%, 4/01/39 | | | 12,000,000 | | | | 12,554,400 | |
Pennsylvania State GO, Second Series, Pre-Refunded, 5.00%, 4/15/23 | | | 10,000,000 | | | | 10,397,200 | |
| | | | | | |
136 | | Annual Report | | | | franklintempleton.com |
FRANKLIN TAX-FREE TRUST
STATEMENT OF INVESTMENTS
Franklin Pennsylvania Tax-Free Income Fund (continued)
| | | | | | | | |
| | | Principal
Amount | | | Value | |
Municipal Bonds (continued) | | | | | | | | |
Pennsylvania (continued) | | | | | | | | |
Pennsylvania State Higher Educational Facilities Authority Revenue, | | | | | | | | |
AICUP Financing Program, Gwynedd Mercy College Project, Series KK1, 5.375%, 5/01/42 | | $ | 1,800,000 | | | $ | 1,870,848 | |
AICUP Financing Program, St. Francis University Project, Series JJ2, Pre-Refunded, 6.25%, 11/01/41 | | | 3,840,000 | | | | 4,437,235 | |
Bryn Mawr College, Refunding, 5.00%, 12/01/44 | | | 6,365,000 | | | | 7,207,662 | |
Edinboro University Foundation, Student Housing Project, Pre-Refunded, 6.00%, 7/01/43 | | | 3,500,000 | | | | 3,842,370 | |
Foundation for Indiana University, Student Housing Project, Series B, Pre-Refunded, 5.00%, 7/01/41 | | | 1,250,000 | | | | 1,401,475 | |
Shippensburg University Student Services Inc. Student Housing Project at Shippensburg University of Pennsylvania, 5.00%, 10/01/35 | | | 1,400,000 | | | | 1,457,428 | |
Shippensburg University Student Services Inc. Student Housing Project at Shippensburg University of Pennsylvania, 6.25%, 10/01/43 | | | 7,000,000 | | | | 7,697,690 | |
Shippensburg University Student Services Inc. Student Housing Project at Shippensburg University of Pennsylvania, 5.00%, 10/01/44 | | | 2,000,000 | | | | 2,078,640 | |
St. Joseph’s University, Series A, 5.00%, 11/01/40 | | | 15,000,000 | | | | 16,012,200 | |
Temple University, First Series, 5.00%, 4/01/42 | | | 15,000,000 | | | | 16,281,900 | |
Thomas Jefferson University, Pre-Refunded, 5.00%, 3/01/40 | | | 16,980,000 | | | | 18,096,435 | |
Thomas Jefferson University, Refunding, Series A, 5.00%, 9/01/45 | | | 7,465,000 | | | | 8,188,582 | |
The Trustees of the University of Pennsylvania, Series A, 5.00%, 8/15/36 | | | 2,750,000 | | | | 3,167,313 | |
The Trustees of the University of Pennsylvania, Series A, 4.00%, 8/15/41 | | | 5,705,000 | | | | 5,971,709 | |
The Trustees of the University of Pennsylvania, Series A, 5.00%, 8/15/46 | | | 14,000,000 | | | | 15,924,720 | |
The Trustees of the University of Pennsylvania, Series A, Pre-Refunded, 5.00%, 9/01/41 | | | 25,000,000 | | | | 27,400,750 | |
University of the Sciences in Philadelphia, 5.00%, 11/01/42 | | | 5,000,000 | | | | 5,445,650 | |
University of the Sciences in Philadelphia, Series A, 5.00%, 11/01/36 | | | 4,250,000 | | | | 4,657,150 | |
University of Pennsylvania Health System, 5.00%, 8/15/40 | | | 6,475,000 | | | | 7,233,158 | |
University of Pennsylvania Health System, Pre-Refunded, 5.75%, 8/15/41 | | | 3,950,000 | | | | 4,474,283 | |
University of Pennsylvania Health System, Series A, 4.00%, 8/15/42 | | | 5,000,000 | | | | 5,102,650 | |
University of Pennsylvania Health System, Series A, 5.00%, 8/15/42 | | | 9,000,000 | | | | 10,062,990 | |
University of Pennsylvania Health System, Series B, Pre-Refunded, 6.00%, 8/15/26 | | | 5,000,000 | | | | 5,106,850 | |
University of Pittsburgh Medical Center, Series E, 5.00%, 5/15/31. | | | 13,000,000 | | | | 13,740,610 | |
Pennsylvania State Higher Educational Facilities Authority Student Housing Revenue, | | | | | | | | |
University Properties Inc. Student Housing Project at East Stroudsburg University of Pennsylvania, 5.00%, 7/01/42 | | | 5,500,000 | | | | 5,662,910 | |
University Properties Inc. Student Housing Project at East Stroudsburg University of Pennsylvania, Refunding, Series A, 5.00%, 7/01/35 | | | 1,000,000 | | | | 1,065,820 | |
Pennsylvania State Public School Building Authority Community College Revenue, Community College of Philadelphia Project, Pre-Refunded, 6.00%, 6/15/28 | | | 5,000,000 | | | | 5,177,450 | |
Pennsylvania State Turnpike Commission Turnpike Revenue, | | | | | | | | |
Series C, 5.00%, 12/01/43 | | | 10,000,000 | | | | 10,893,800 | |
Special, Motor License Fund Enhanced Turnpike, Series A, Pre-Refunded, 5.50%, 12/01/41 | | | 5,000,000 | | | | 5,483,650 | |
Subordinate, Series A, Assured Guaranty, Pre-Refunded, 5.00%, 6/01/39 | | | 17,200,000 | | | | 17,945,104 | |
Subordinate, Series C, Subseries C-1, Assured Guaranty, Pre-Refunded, 6.25%, 6/01/38 | | | 5,000,000 | | | | 5,061,000 | |
Subordinate, Series D, Pre-Refunded, 5.125%, 12/01/40 | | | 10,000,000 | | | | 10,601,200 | |
Subseries A, Assured Guaranty, Pre-Refunded, 5.00%, 6/01/39 | | | 2,800,000 | | | | 2,921,296 | |
Pennsylvania State University Revenue, 5.00%, 3/01/40 | | | 1,500,000 | | | | 1,595,280 | |
Series A, 5.00%, 9/01/40 | | | 10,490,000 | | | | 11,896,814 | |
Series A, 5.00%, 9/01/41 | | | 10,000,000 | | | | 11,377,800 | |
Series A, 5.00%, 9/01/42 | | | 15,750,000 | | | | 18,097,852 | |
Series A, 5.00%, 9/01/47 | | | 10,000,000 | | | | 11,446,500 | |
| | | | | | | | |
franklintempleton.com | | | | | | Annual Report | | 137 |
FRANKLIN TAX-FREE TRUST
STATEMENT OF INVESTMENTS
Franklin Pennsylvania Tax-Free Income Fund (continued)
| | | | | | | | |
| | | Principal
Amount | | | Value | |
Municipal Bonds (continued) | | | | | | | | |
Pennsylvania (continued) | | | | | | | | |
Philadelphia Airport Revenue, | | | | | | | | |
Refunding, Series B, 5.00%, 7/01/42 | | $ | 10,000,000 | | | $ | 11,058,900 | |
Series A, AGMC Insured, 5.00%, 6/15/35 | | | 5,000,000 | | | | 5,312,600 | |
Series A, AGMC Insured, 5.00%, 6/15/40 | | | 5,000,000 | | | | 5,301,100 | |
Philadelphia Authority for IDR, | | | | | | | | |
The Children’s Hospital of Philadelphia Project, Series A, 5.00%, 7/01/42 | | | 5,000,000 | | | | 5,616,650 | |
International Apartments at Temple University, Series A, 5.625%, 6/15/42 | | | 4,000,000 | | | | 4,144,840 | |
Temple University, First Series, 5.00%, 4/01/40 | | | 5,000,000 | | | | 5,586,200 | |
Temple University, Second Series, 5.00%, 4/01/36 | | | 5,000,000 | | | | 5,613,200 | |
Thomas Jefferson University, Refunding, Series A, 5.00%, 9/01/47 | | | 11,150,000 | | | | 12,268,679 | |
Philadelphia Gas Works Revenue, | | | | | | | | |
1998 General Ordinance, Ninth Series, 5.25%, 8/01/40 | | | 3,490,000 | | | | 3,732,031 | |
1998 General Ordinance, Ninth Series, Pre-Refunded, 5.25%, 8/01/40 | | | 2,230,000 | | | | 2,419,171 | |
1998 General Ordinance, Refunding, Fifteenth Series, 5.00%, 8/01/42 | | | 5,000,000 | | | | 5,596,950 | |
1998 General Ordinance, Refunding, Fifteenth Series, 5.00%, 8/01/47 | | | 6,000,000 | | | | 6,690,840 | |
1998 General Ordinance, Refunding, Fourteenth Series, 5.00%, 10/01/32 | | | 1,000,000 | | | | 1,134,100 | |
Twelfth Series B, NATL Insured, ETM, 7.00%, 5/15/20 | | | 295,000 | | | | 313,143 | |
Philadelphia GO, | | | | | | | | |
Refunding, Series A, Assured Guaranty, 5.125%, 8/01/25 | | | 4,480,000 | | | | 4,697,907 | |
Refunding, Series A, Assured Guaranty, 5.25%, 8/01/26 | | | 4,460,000 | | | | 4,685,319 | |
Series A, 5.25%, 7/15/33 | | | 5,000,000 | | | | 5,465,250 | |
Series A, Assured Guaranty, Pre-Refunded, 5.125%, 8/01/25 | | | 520,000 | | | | 546,114 | |
Series A, Assured Guaranty, Pre-Refunded, 5.25%, 8/01/26 | | | 540,000 | | | | 568,064 | |
Philadelphia Hospitals and Higher Education Facilities Authority Revenue, The Children’s Hospital of Philadelphia Project, Series C, 5.00%, 7/01/41 | | | 5,000,000 | | | | 5,459,000 | |
Philadelphia Housing Authority Capital Fund Program Revenue, Series A, AGMC Insured, 5.00%, 12/01/21 | | | 5,000,000 | | | | 5,016,351 | |
Philadelphia Municipal Authority Lease Revenue, | | | | | | | | |
Pre-Refunded, 6.50%, 4/01/34 | | | 3,250,000 | | | | 3,423,127 | |
Pre-Refunded, 6.50%, 4/01/39 | | | 2,500,000 | | | | 2,633,175 | |
Philadelphia School District GO, Series E, Pre-Refunded, 6.00%, 9/01/38 | | | 5,000,000 | | | | 5,116,076 | |
Philadelphia Water and Wastewater Revenue, | | | | | | | | |
Refunding, Series B, 5.00%, 11/01/34 | | | 1,200,000 | | | | 1,372,920 | |
Series A, 5.00%, 7/01/40 | | | 10,000,000 | | | | 11,126,700 | |
Series A, 5.00%, 1/01/41 | | | 13,000,000 | | | | 13,875,030 | |
Series A, 5.00%, 10/01/42 | | | 10,000,000 | | | | 11,255,100 | |
Series A, 5.125%, 1/01/43 | | | 5,000,000 | | | | 5,424,950 | |
Series A, 5.00%, 7/01/45 | | | 5,000,000 | | | | 5,545,100 | |
Series A, 5.00%, 10/01/47 | | | 5,000,000 | | | | 5,605,900 | |
Series A, Pre-Refunded, 5.25%, 1/01/36 | | | 3,000,000 | | | | 3,095,250 | |
Series C, AGMC Insured, 5.00%, 8/01/35 | | | 1,620,000 | | | | 1,724,458 | |
Series C, AGMC Insured, Pre-Refunded, 5.00%, 8/01/35 | | | 5,380,000 | | | | 5,818,040 | |
Pine-Richland School District GO, Allegheny County, Assured Guaranty, 5.00%, 3/01/39 | | | 15,130,000 | | | | 16,108,306 | |
Pocono Mountains Industrial Park Authority Hospital Revenue, St. Luke’s Hospital, Monroe Project, Series A, 5.00%, 8/15/40 | | | 5,000,000 | | | | 5,367,350 | |
Reading GO, AGMC Insured, Pre-Refunded, 6.00%, 11/01/28 | | | 2,000,000 | | | | 2,061,901 | |
Scranton-Lackawanna Health and Welfare Authority Revenue, University of Scranton, Refunding, 5.00%, 11/01/37 | | | 4,000,000 | | | | 4,348,640 | |
South Fork Municipal Authority Hospital Revenue, Conemaugh Valley Memorial Hospital, Series B, Assured Guaranty, Pre-Refunded, 5.375%, 7/01/35 | | | 10,000,000 | | | | 10,824,000 | |
State College Area School District GO, 5.00%, 3/15/40 | | | 16,400,000 | | | | 18,312,076 | |
| | | | | | |
138 | | Annual Report | | | | franklintempleton.com |
FRANKLIN TAX-FREE TRUST
STATEMENT OF INVESTMENTS
Franklin Pennsylvania Tax-Free Income Fund (continued)
| | | | | | | | |
| | | Principal
Amount | | | Value | |
Municipal Bonds (continued) | | | | | | | | |
Pennsylvania (continued) | | | | | | | | |
State Public School Building Authority Revenue, | | | | | | | | |
Commonwealth of Pennsylvania, School Lease, The School District of Philadelphia Project,
Refunding, Series A, AGMC Insured, 5.00%, 6/01/32 | | $ | 7,095,000 | | | $ | 7,778,532 | |
Commonwealth of Pennsylvania, School Lease, The School District of Philadelphia Project,
Refunding, Series A, AGMC Insured, 5.00%, 6/01/33 | | | 3,000,000 | | | | 3,277,290 | |
State Public School Building Authority School Lease Revenue, The School District of the City of Harrisburg Project, Series A, Assured Guaranty, Pre-Refunded, 5.00%, 11/15/33 | | | 5,000,000 | | | | 5,206,500 | |
Swarthmore Borough Authority Revenue, Swarthmore College, 5.00%, 9/15/43 | | | 1,000,000 | | | | 1,126,840 | |
Union County Higher Educational Facilities Financing Authority University Revenue, Bucknell University, Series A, 5.00%, 4/01/42 | | | 5,000,000 | | | | 5,492,150 | |
University of Pittsburgh of the Commonwealth System of Higher Education Revenue, | | | | | | | | |
University Capital Project, Series B, Pre-Refunded, 5.00%, 9/15/31 | | | 10,000,000 | | | | 10,371,100 | |
University Capital Project, Series C, Pre-Refunded, 5.00%, 9/15/35 | | | 5,000,000 | | | | 5,262,400 | |
Washington County IDA College Revenue, | | | | | | | | |
Washington and Jefferson College, Pre-Refunded, 5.25%, 11/01/30 | | | 7,525,000 | | | | 8,108,413 | |
Washington and Jefferson College, Pre-Refunded, 5.00%, 11/01/36 | | | 8,470,000 | | | | 9,081,788 | |
West Mifflin Area School District GO, Allegheny County, AGMC Insured, Pre-Refunded, 5.125%, 4/01/31 | | | 1,000,000 | | | | 1,022,040 | |
Whitehall-Coplay School District GO, | | | | | | | | |
Series A, AGMC Insured, 5.375%, 11/15/34 | | | 555,000 | | | | 576,934 | |
Series A, AGMC Insured, Pre-Refunded, 5.375%, 11/15/34 | | | 5,445,000 | | | | 5,697,430 | |
| | | | | | | | |
| | | | | | | 1,161,781,427 | |
| | | | | | | | |
| | |
U.S. Territories 0.8% | | | | | | | | |
Puerto Rico 0.8% | | | | | | | | |
b Puerto Rico Electric Power Authority Power Revenue, | | | | | | | | |
Refunding, Series A, 5.00%, 7/01/42 | | | 5,000,000 | | | | 1,881,250 | |
Series TT, 5.00%, 7/01/32 | | | 5,100,000 | | | | 1,918,875 | |
Series XX, 5.25%, 7/01/40 | | | 16,020,000 | | | | 6,027,525 | |
| | | | | | | | |
| | | | | | | 9,827,650 | |
| | | | | | | | |
| Total Municipal Bonds before Short Term Investments (Cost $1,138,849,081) | | | | | | | 1,171,609,077 | |
| | | | | | | | |
Short Term Investments 0.6% | | | | | | | | |
Municipal Bonds 0.6% | | | | | | | | |
Pennsylvania 0.6% | | | | | | | | |
c Emmaus General Authority Revenue, SPA Wells Fargo Bank, Weekly VRDN and Put, 1.17%, 12/01/28 | | | 4,725,000 | | | | 4,725,000 | |
c Geisinger Authority Revenue, Geisinger Health System, Montour County, Series A, SPA Wells Fargo Bank, Daily VRDN and Put, 1.06%, 10/01/43 | | | 2,600,000 | | | | 2,600,000 | |
| | | | | | | | |
Total Short Term Investments (Cost $7,325,000) | | | | | | | 7,325,000 | |
| | | | | | | | |
Total Investments (Cost $1,146,174,081) 99.3% | | | | | | | 1,178,934,077 | |
Other Assets, less Liabilities 0.7%. | | | | | | | 8,560,007 | |
| | | | | | | | |
Net Assets 100.0% | | | | | | $ | 1,187,494,084 | |
| | | | | | | | |
See Abbreviations on page 162.
aSecurity purchased on a when-issued basis. See Note 1(b).
bSee Note 7 regarding defaulted securities.
cVariable rate demand notes (VRDNs) are obligations which contain a floating or variable interest rate adjustment formula and an unconditional right of demand to receive payment of the principal balance plus accrued interest at specified dates. Unless otherwise noted, the coupon rate is determined based on factors including supply and demand, underlying credit, tax treatment, and current short term rates. The coupon rate shown represents the rate at period end.
| | | | | | | | |
franklintempleton.com | | | | The accompanying notes are an integral part of these financial statements. | | | Annual Report | | 139 |
FRANKLIN TAX-FREE TRUST
Financial Statements
Statements of Assets and Liabilities
February 28, 2018
| | | | | | | | | | | | | | | | |
| | | Franklin
Arizona
Tax-Free
Income Fund | | | Franklin
Colorado
Tax-Free
Income Fund | | | Franklin
Connecticut
Tax-Free
Income Fund | | | Franklin
Michigan
Tax-Free
Income Fund | |
Assets: | | | | | | | | | | | | | | | | |
Investments in securities: | | | | | | | | | | | | | | | | |
Cost - Unaffiliated issuers | | $ | 906,260,949 | | | $ | 679,431,357 | | | $ | 243,472,868 | | | $ | 956,542,422 | |
Value - Unaffiliated issuers | | $ | 937,695,454 | | | $ | 698,971,546 | | | $ | 250,718,188 | | | $ | 980,766,012 | |
Cash | | | 13,625 | | | | 1,453,055 | | | | 1,538,916 | | | | 1,348,728 | |
Receivables: | | | | | | | | | | | | | | | | |
Capital shares sold | | | 686,142 | | | | 404,882 | | | | 44,540 | | | | 201,031 | |
Interest | | | 8,902,005 | | | | 9,559,808 | | | | 2,374,618 | | | | 13,654,628 | |
Other assets | | | 947 | | | | 711 | | | | 256 | | | | 982 | |
Total assets | | | 947,298,173 | | | | 710,390,002 | | | | 254,676,518 | | | | 995,971,381 | |
Liabilities: | | | | | | | | | | | | | | | | |
Payables: | | | | | | | | | | | | | | | | |
Investment securities purchased | | | 3,879,651 | | | | — | | | | — | | | | 15,204,010 | |
Capital shares redeemed | | | 2,368,054 | | | | 1,910,377 | | | | 296,106 | | | | 942,503 | |
Management fees | | | 373,242 | | | | 285,999 | | | | 115,966 | | | | 387,325 | |
Distribution fees | | | 109,618 | | | | 90,387 | | | | 37,266 | | | | 124,066 | |
Transfer agent fees | | | 81,932 | | | | 69,116 | | | | 41,958 | | | | 157,597 | |
Professional fees | | | 41,053 | | | | 41,836 | | | | 38,743 | | | | 49,103 | |
Distributions to shareholders | | | 357,626 | | | | 126,762 | | | | 129,323 | | | | 330,537 | |
Accrued expenses and other liabilities | | | 40,222 | | | | 34,220 | | | | 17,553 | | | | 61,191 | |
Total liabilities | | | 7,251,398 | | | | 2,558,697 | | | | 676,915 | | | | 17,256,332 | |
Net assets, at value | | $ | 940,046,775 | | | $ | 707,831,305 | | | $ | 253,999,603 | | | $ | 978,715,049 | |
Net assets consist of: | | | | | | | | | | | | | | | | |
Paid-in capital | | $ | 964,871,582 | | | $ | 733,180,277 | | | $ | 281,159,036 | | | $ | 1,023,520,286 | |
Undistributed net investment income | | | 1,436,990 | | | | 1,080,758 | | | | 703,005 | | | | 2,023,498 | |
Net unrealized appreciation (depreciation) | | | 31,434,505 | | | | 19,540,189 | | | | 7,245,320 | | | | 24,223,590 | |
Accumulated net realized gain (loss) | | | (57,696,302 | ) | | | (45,969,919 | ) | | | (35,107,758 | ) | | | (71,052,325 | ) |
Net assets, at value | | $ | 940,046,775 | | | $ | 707,831,305 | | | $ | 253,999,603 | | | $ | 978,715,049 | |
| | | | | | |
140 | | Annual Report | | | The accompanying notes are an integral part of these financial statements. | | franklintempleton.com |
FRANKLIN TAX-FREE TRUST
FINANCIAL STATEMENTS
Statements of Assets and Liabilities (continued)
February 28, 2018
| | | | | | | | | | | | | | | | |
| | | Franklin
Arizona
Tax-Free
Income Fund | | | Franklin
Colorado
Tax-Free
Income Fund | | | Franklin
Connecticut
Tax-Free
Income Fund | | | Franklin
Michigan
Tax-Free
Income Fund | |
Class A: | | | | | | | | | | | | | | | | |
Net assets, at value | | $ | 737,425,509 | | | $ | 521,248,901 | | | $ | 187,637,530 | | | $ | 797,934,690 | |
Shares outstanding | | | 69,726,818 | | | | 46,027,109 | | | | 18,610,891 | | | | 70,931,023 | |
Net asset value per sharea | | | $10.58 | | | | $11.32 | | | | $10.08 | | | | $11.25 | |
Maximum offering price per share (net asset value per share ÷ 95.75%) | | | $11.05 | | | | $11.82 | | | | $10.53 | | | | $11.75 | |
Class C: | | | | | | | | | | | | | | | | |
Net assets, at value | | $ | 105,010,076 | | | $ | 99,811,268 | | | $ | 45,183,330 | | | $ | 124,683,378 | |
Shares outstanding | | | 9,764,913 | | | | 8,708,164 | | | | 4,445,690 | | | | 10,910,396 | |
Net asset value and maximum offering price per sharea | | | $10.75 | | | | $11.46 | | | | $10.16 | | | | $11.43 | |
Class R6: | | | | | | | | | | | | | | | | |
Net assets, at value | | $ | 10,816,267 | | | $ | 7,678,382 | | | $ | 323,875 | | | $ | 2,510,097 | |
Shares outstanding | | | 1,019,937 | | | | 677,655 | | | | 32,121 | | | | 222,285 | |
Net asset value and maximum offering price per share | | | $10.60 | | | | $11.33 | | | | $10.08 | | | | $11.29 | |
Advisor Class: | | | | | | | | | | | | | | | | |
Net assets, at value | | $ | 86,794,923 | | | $ | 79,092,754 | | | $ | 20,854,868 | | | $ | 53,586,884 | |
Shares outstanding | | | 8,182,556 | | | | 6,984,013 | | | | 2,069,805 | | | | 4,748,412 | |
Net asset value and maximum offering price per share | | | $10.61 | | | | $11.32 | | | | $10.08 | | | | $11.29 | |
aRedemption price is equal to net asset value less contingent deferred sales charges, if applicable.
| | | | | | | | |
franklintempleton.com | | | | The accompanying notes are an integral part of these financial statements. | | | Annual Report | | 141 |
FRANKLIN TAX-FREE TRUST
FINANCIAL STATEMENTS
Statements of Assets and Liabilities (continued)
February 28, 2018
| | | | | | | | | | | | | | | | |
| | | Franklin
Minnesota
Tax-Free
Income Fund | | | Franklin
Ohio
Tax-Free
Income Fund | | | Franklin
Oregon
Tax-Free
Income Fund | | | Franklin
Pennsylvania
Tax-Free
Income Fund | |
Assets: | | | | | | | | | | | | | | | | |
Investments in securities: | | | | | | | | | | | | | | | | |
Cost - Unaffiliated issuers | | $ | 1,001,082,856 | | | $ | 1,530,886,766 | | | $ | 1,168,230,501 | | | $ | 1,146,174,081 | |
Value - Unaffiliated issuers | | $ | 1,021,903,625 | | | $ | 1,576,930,175 | | | $ | 1,206,019,083 | | | $ | 1,178,934,077 | |
Cash | | | 53,085 | | | | 4,488,653 | | | | 3,293,504 | | | | 57,678 | |
Receivables: | | | | | | | | | | | | | | | | |
Investment securities sold | | | — | | | | — | | | | 2,759,903 | | | | — | |
Capital shares sold | | | 3,353,230 | | | | 1,505,417 | | | | 844,022 | | | | 385,151 | |
Interest | | | 8,913,117 | | | | 16,728,117 | | | | 12,983,717 | | | | 15,461,625 | |
Other assets | | | 1,020 | | | | 1,575 | | | | 1,223 | | | | 1,191 | |
Total assets | | | 1,034,224,077 | | | | 1,599,653,937 | | | | 1,225,901,452 | | | | 1,194,839,722 | |
Liabilities: | | | | | | | | | | | | | | | | |
Payables: | | | | | | | | | | | | | | | | |
Investment securities purchased | | | — | | | | 19,335,145 | | | | — | | | | 3,181,961 | |
Capital shares redeemed | | | 3,383,564 | | | | 2,389,864 | | | | 2,321,578 | | | | 2,858,930 | |
Management fees | | | 406,195 | | | | 611,056 | | | | 478,710 | | | | 465,669 | |
Distribution fees | | | 152,742 | | | | 238,287 | | | | 159,703 | | | | 189,966 | |
Transfer agent fees | | | 141,366 | | | | 171,277 | | | | 100,460 | | | | 162,387 | |
Professional fees | | | 41,678 | | | | 45,558 | | | | 42,695 | | | | 53,688 | |
Distributions to shareholders | | | 162,731 | | | | 318,144 | | | | 246,611 | | | | 363,872 | |
Accrued expenses and other liabilities | | | 54,342 | | | | 86,927 | | | | 51,262 | | | | 69,165 | |
Total liabilities | | | 4,342,618 | | | | 23,196,258 | | | | 3,401,019 | | | | 7,345,638 | |
Net assets, at value | | $ | 1,029,881,459 | | | $ | 1,576,457,679 | | | $ | 1,222,500,433 | | | $ | 1,187,494,084 | |
Net assets consist of: | | | | | | | | | | | | | | | | |
Paid-in capital | | $ | 1,018,798,917 | | | $ | 1,563,308,792 | | | $ | 1,257,596,815 | | | $ | 1,245,373,278 | |
Undistributed net investment income | | | 565,639 | | | | 1,086,855 | | | | 1,052,087 | | | | 2,166,579 | |
Net unrealized appreciation (depreciation) | | | 20,820,769 | | | | 46,043,409 | | | | 37,788,582 | | | | 32,759,996 | |
Accumulated net realized gain (loss) | | | (10,303,866 | ) | | | (33,981,377 | ) | | | (73,937,051 | ) | | | (92,805,769 | ) |
Net assets, at value | | $ | 1,029,881,459 | | | $ | 1,576,457,679 | | | $ | 1,222,500,433 | | | $ | 1,187,494,084 | |
| | | | | | |
142 | | Annual Report | | | The accompanying notes are an integral part of these financial statements. | | franklintempleton.com |
FRANKLIN TAX-FREE TRUST
FINANCIAL STATEMENTS
Statements of Assets and Liabilities (continued)
February 28, 2018
| | | | | | | | | | | | | | | | |
| | | Franklin
Minnesota
Tax-Free
Income Fund | | | Franklin
Ohio
Tax-Free
Income Fund | | | Franklin
Oregon
Tax-Free
Income Fund | | | Franklin
Pennsylvania
Tax-Free
Income Fund | |
Class A: | | | | | | | | | | | | | | | | |
Net assets, at value | | $ | 657,415,226 | | | $ | 1,090,194,369 | | | $ | 932,928,700 | | | $ | 860,736,999 | |
Shares outstanding | | | 54,458,010 | | | | 87,491,868 | | | | 82,056,003 | | | | 87,975,861 | |
Net asset value per sharea | | $ | 12.07 | | | $ | 12.46 | | | $ | 11.37 | | | $ | 9.78 | |
Maximum offering price per share (net asset value per share ÷ 95.75%) | | $ | 12.61 | | | $ | 13.01 | | | $ | 11.87 | | | $ | 10.21 | |
Class C: | | | | | | | | | | | | | | | | |
Net assets, at value | | $ | 203,925,437 | | | $ | 308,087,937 | | | $ | 175,054,483 | | | $ | 245,519,707 | |
Shares outstanding | | | 16,705,042 | | | | 24,393,497 | | | | 15,161,512 | | | | 24,774,930 | |
Net asset value and maximum offering price per sharea | | $ | 12.21 | | | $ | 12.63 | | | $ | 11.55 | | | $ | 9.91 | |
Class R6: | | | | | | | | | | | | | | | | |
Net assets, at value | | $ | 8,341,917 | | | $ | 7,846,607 | | | $ | 13,217,147 | | | $ | 2,084,591 | |
Shares outstanding | | | 690,029 | | | | 629,009 | | | | 1,161,873 | | | | 212,790 | |
Net asset value and maximum offering price per share | | $ | 12.09 | | | $ | 12.47 | | | $ | 11.38 | | | $ | 9.80 | |
Advisor Class: | | | | | | | | | | | | | | | | |
Net assets, at value | | $ | 160,198,879 | | | $ | 170,328,766 | | | $ | 101,300,103 | | | $ | 79,152,787 | |
Shares outstanding | | | 13,254,983 | | | | 13,655,225 | | | | 8,898,689 | | | | 8,079,435 | |
Net asset value and maximum offering price per share | | $ | 12.09 | | | $ | 12.47 | | | $ | 11.38 | | | $ | 9.80 | |
aRedemption price is equal to net asset value less contingent deferred sales charges, if applicable.
| | | | | | | | |
franklintempleton.com | | | | The accompanying notes are an integral part of these financial statements. | | | Annual Report | | 143 |
FRANKLIN TAX-FREE TRUST
FINANCIAL STATEMENTS
Statements of Operations
for the year ended February 28, 2018
| | | | | | | | | | | | | | | | |
| | | Franklin
Arizona
Tax-Free
Income Fund | | | Franklin
Colorado
Tax-Free
Income Fund | | | Franklin
Connecticut
Tax-Free
Income Fund | | | Franklin
Michigan
Tax-Free
Income Fund | |
Investment income: | | | | | | | | | | | | | | | | |
Interest: | | | | | | | | | | | | | | | | |
Unaffiliated issuers | | $ | 39,473,221 | | | $ | 28,959,510 | | | $ | 11,108,384 | | | $ | 39,258,906 | |
Expenses: | | | | | | | | | | | | | | | | |
Management fees (Note 3a) | | | 4,620,547 | | | | 3,564,179 | | | | 1,523,037 | | | | 4,889,726 | |
Distribution fees: (Note 3c) | | | | | | | | | | | | | | | | |
Class A | | | 763,756 | | | | 546,616 | | | | 205,667 | | | | 835,060 | |
Class C | | | 734,327 | | | | 708,740 | | | | 349,879 | | | | 873,627 | |
Transfer agent fees: (Note 3e) | | | | | | | | | | | | | | | | |
Class A | | | 361,020 | | | | 302,179 | | | | 127,013 | | | | 546,700 | |
Class C | | | 53,406 | | | | 60,496 | | | | 33,250 | | | | 87,958 | |
Class R6 | | | 1,013 | | | | 985 | | | | 218 | | | | 546 | |
Advisor Class | | | 44,100 | | | | 44,579 | | | | 15,884 | | | | 43,098 | |
Custodian fees (Note 4) | | | 8,215 | | | | 6,168 | | | | 2,407 | | | | 8,726 | |
Reports to shareholders | | | 35,728 | | | | 31,186 | | | | 14,140 | | | | 62,895 | |
Registration and filing fees | | | 41,266 | | | | 26,956 | | | | 20,673 | | | | 51,803 | |
Professional fees | | | 83,501 | | | | 153,047 | | | | 71,689 | | | | 171,188 | |
Trustees’ fees and expenses | | | 5,325 | | | | 4,305 | | | | 1,596 | | | | 5,701 | |
Other | | | 61,412 | | | | 61,070 | | | | 27,638 | | | | 85,781 | |
Total expenses | | | 6,813,616 | | | | 5,510,506 | | | | 2,393,091 | | | | 7,662,809 | |
Expenses waived/paid by affiliates (Note 3f) | | | (679 | ) | | | (875 | ) | | | (194 | ) | | | (386 | ) |
Net expenses | | | 6,812,937 | | | | 5,509,631 | | | | 2,392,897 | | | | 7,662,423 | |
Net investment income | | | 32,660,284 | | | | 23,449,879 | | | | 8,715,487 | | | | 31,596,483 | |
Realized and unrealized gains (losses): | | | | | | | | | | | | | | | | |
Net realized gain (loss) from: | | | | | | | | | | | | | | | | |
Investments: | | | | | | | | | | | | | | | | |
Unaffiliated issuers | | | (14,984,713 | ) | | | (23,453,587 | ) | | | (13,014,576 | ) | | | (46,516,786 | ) |
Net change in unrealized appreciation (depreciation) on: | | | | | | | | | | | | | | | | |
Investments: | | | | | | | | | | | | | | | | |
Unaffiliated issuers | | | (2,273,761 | ) | | | 2,975,926 | | | | 4,284,014 | | | | 23,897,263 | |
Net realized and unrealized gain (loss) | | | (17,258,474 | ) | | | (20,477,661 | ) | | | (8,730,562 | ) | | | (22,619,523 | ) |
Net increase (decrease) in net assets resulting from operations | | $ | 15,401,810 | | | $ | 2,972,218 | | | $ | (15,075 | ) | | $ | 8,976,960 | |
| | | | | | |
144 | | Annual Report | | | The accompanying notes are an integral part of these financial statements. | | franklintempleton.com |
FRANKLIN TAX-FREE TRUST
FINANCIAL STATEMENTS
Statements of Operations (continued)
for the year ended February 28, 2018
| | | | | | | | | | | | | | | | |
| | | Franklin
Minnesota
Tax-Free
Income Fund | | | Franklin Ohio Tax-Free
Income Fund | | | Franklin
Oregon
Tax-Free
Income Fund | | | Franklin
Pennsylvania
Tax-Free
Income Fund | |
Investment income: | | | | | | | | | | | | | | | | |
Interest: | | | | | | | | | | | | | | | | |
Unaffiliated issuers | | $ | 37,955,893 | | | $ | 58,774,588 | | | $ | 48,745,622 | | | $ | 52,614,165 | |
Expenses: | | | | | | | | | | | | | | | | |
Management fees (Note 3a) | | | 5,051,506 | | | | 7,443,982 | | | | 5,898,858 | | | | 5,915,978 | |
Distribution fees: (Note 3c) | | | | | | | | | | | | | | | | |
Class A | | | 684,616 | | | | 1,116,774 | | | | 961,359 | | | | 912,776 | |
Class C | | | 1,396,849 | | | | 2,094,300 | | | | 1,226,251 | | | | 1,737,763 | |
Transfer agent fees: (Note 3e) | | | | | | | | | | | | | | | | |
Class A | | | 494,897 | | | | 678,467 | | | | 481,358 | | | | 575,707 | |
Class C | | | 155,374 | | | | 195,769 | | | | 94,472 | | | | 168,643 | |
Class R6 | | | 1,181 | | | | 1,007 | | | | 1,658 | | | | 505 | |
Advisor Class | | | 122,047 | | | | 96,906 | | | | 51,640 | | | | 53,522 | |
Custodian fees (Note 4) | | | 9,066 | | | | 13,466 | | | | 10,572 | | | | 10,627 | |
Reports to shareholders | | | 62,364 | | | | 72,787 | | | | 50,049 | | | | 73,111 | |
Registration and filing fees | | | 47,842 | | | | 52,976 | | | | 24,022 | | | | 27,089 | |
Professional fees | | | 51,535 | | | | 57,083 | | | | 117,394 | | | | 221,096 | |
Trustees’ fees and expenses | | | 5,859 | | | | 8,724 | | | | 6,859 | | | | 6,972 | |
Other | | | 80,139 | | | | 89,571 | | | | 83,924 | | | | 98,632 | |
Total expenses | | | 8,163,275 | | | | 11,921,812 | | | | 9,008,416 | | | | 9,802,421 | |
Expenses waived/paid by affiliates (Note 3f) | | | (675 | ) | | | (514 | ) | | | (672 | ) | | | (362 | ) |
Net expenses | | | 8,162,600 | | | | 11,921,298 | | | | 9,007,744 | | | | 9,802,059 | |
Net investment income | | | 29,793,293 | | | | 46,853,290 | | | | 39,737,878 | | | | 42,812,106 | |
Realized and unrealized gains (losses): | | | | | | | | | | | | | | | | |
Net realized gain (loss) from: | | | | | | | | | | | | | | | | |
Investments: | | | | | | | | | | | | | | | | |
Unaffiliated issuers | | | 238,072 | | | | 1,282,032 | | | | (17,017,568 | ) | | | (37,289,599 | ) |
Net change in unrealized appreciation (depreciation) on: | | | | | | | | | | | | | | | | |
Investments: | | | | | | | | | | | | | | | | |
Unaffiliated issuers | | | (16,428,118 | ) | | | (13,653,246 | ) | | | (6,677,925 | ) | | | (1,099,927 | ) |
Net realized and unrealized gain (loss) | | | (16,190,046 | ) | | | (12,371,214 | ) | | | (23,695,493 | ) | | | (38,389,526 | ) |
Net increase (decrease) in net assets resulting from operations | | $ | 13,603,247 | | | $ | 34,482,076 | | | $ | 16,042,385 | | | $ | 4,422,580 | |
| | | | | | | | |
franklintempleton.com | | | | The accompanying notes are an integral part of these financial statements. | | | Annual Report | | 145 |
FRANKLIN TAX-FREE TRUST
FINANCIAL STATEMENTS
Statements of Changes in Net Assets
| | | | | | | | | | | | | | | | |
| | | Franklin Arizona
Tax-Free Income Fund | | | Franklin Colorado
Tax-Free Income Fund | |
| | | Year Ended February 28, | | | Year Ended February 28, | |
| | | 2018 | | | 2017 | | | 2018 | | | 2017 | |
Increase (decrease) in net assets: | | | | | | | | | | | | | | | | |
Operations: | | | | | | | | | | | | | | | | |
Net investment income | | $ | 32,660,284 | | | $ | 34,283,523 | | | $ | 23,449,879 | | | $ | 26,807,717 | |
Net realized gain (loss) | | | (14,984,713 | ) | | | (2,425,011 | ) | | | (23,453,587 | ) | | | (4,235,549 | ) |
Net change in unrealized appreciation (depreciation) | | | (2,273,761 | ) | | | (26,538,485 | ) | | | 2,975,926 | | | | (14,628,581 | ) |
Net increase (decrease) in net assets resulting from operations | | | 15,401,810 | | | | 5,320,027 | | | | 2,972,218 | | | | 7,943,587 | |
Distributions to shareholders from: | | | | | | | | | | | | | | | | |
Net investment income: | | | | | | | | | | | | | | | | |
Class A | | | (26,610,495 | ) | | | (27,754,363 | ) | | | (18,282,843 | ) | | | (20,966,161 | ) |
Class C | | | (3,243,314 | ) | | | (3,399,047 | ) | | | (3,001,669 | ) | | | (3,588,003 | ) |
Class R6 | | | (129,261 | ) | | | — | | | | (71,781 | ) | | | — | |
Advisor Class | | | (3,329,518 | ) | | | (2,517,420 | ) | | | (2,766,502 | ) | | | (2,221,484 | ) |
Total distributions to shareholders | | | (33,312,588 | ) | | | (33,670,830 | ) | | | (24,122,795 | ) | | | (26,775,648 | ) |
Capital share transactions: (Note 2) | | | | | | | | | | | | | | | | |
Class A | | | (18,324,428 | ) | | | (7,095,706 | ) | | | (16,401,065 | ) | | | 14,540,649 | |
Class C | | | (11,446,462 | ) | | | 8,471,828 | | | | (12,655,152 | ) | | | 6,939,231 | |
Class R6 | | | 11,045,004 | | | | — | | | | 7,801,728 | | | | — | |
Advisor Class | | | (2,238,528 | ) | | | 35,343,590 | | | | 7,909,813 | | | | 24,526,227 | |
Total capital share transactions | | | (20,964,414 | ) | | | 36,719,712 | | | | (13,344,676 | ) | | | 46,006,107 | |
Net increase (decrease) in net assets | | | (38,875,192 | ) | | | 8,368,909 | | | | (34,495,253 | ) | | | 27,174,046 | |
Net assets: | | | | | | | | | | | | | | | | |
Beginning of year | | | 978,921,967 | | | | 970,553,058 | | | | 742,326,558 | | | | 715,152,512 | |
End of year | | $ | 940,046,775 | | | $ | 978,921,967 | | | $ | 707,831,305 | | | $ | 742,326,558 | |
Undistributed net investment income included in net assets: | | | | | | | | | | | | | | | | |
End of year | | $ | 1,436,990 | | | $ | 1,742,964 | | | $ | 1,080,758 | | | $ | 1,272,599 | |
| | | | | | |
146 | | Annual Report | | | The accompanying notes are an integral part of these financial statements. | | franklintempleton.com |
FRANKLIN TAX-FREE TRUST
FINANCIAL STATEMENTS
Statements of Changes in Net Assets (continued)
| | | | | | | | | | | | | | | | |
| | | Franklin Connecticut
Tax-Free Income Fund | | | Franklin Michigan
Tax-Free Income Fund | |
| | | Year Ended February 28, | | | Year Ended February 28, | |
| | | 2018 | | | 2017 | | | 2018 | | | 2017 | |
Increase (decrease) in net assets: | | | | | | | | | | | | | | | | |
Operations: | | | | | | | | | | | | | | | | |
Net investment income | | $ | 8,715,487 | | | $ | 11,031,683 | | | $ | 31,596,483 | | | $ | 36,720,476 | |
Net realized gain (loss) | | | (13,014,576 | ) | | | 18,221 | | | | (46,516,786 | ) | | | (9,548,801 | ) |
Net change in unrealized appreciation (depreciation) | | | 4,284,014 | | | | (8,567,551 | ) | | | 23,897,263 | | | | (14,769,293 | ) |
Net increase (decrease) in net assets resulting from operations | | | (15,075 | ) | | | 2,482,353 | | | | 8,976,960 | | | | 12,402,382 | |
Distributions to shareholders from: | | | | | | | | | | | | | | | | |
Net investment income: | | | | | | | | | | | | | | | | |
Class A | | | (6,906,409 | ) | | | (8,261,296 | ) | | | (26,876,219 | ) | | | (31,200,232 | ) |
Class C | | | (1,495,568 | ) | | | (1,857,149 | ) | | | (3,512,927 | ) | | | (4,174,362 | ) |
Class R6 | | | (3,923 | ) | | | — | | | | (25,224 | ) | | | — | |
Advisor Class | | | (887,475 | ) | | | (752,290 | ) | | | (2,184,292 | ) | | | (1,616,095 | ) |
Total distributions to shareholders | | | (9,293,375 | ) | | | (10,870,735 | ) | | | (32,598,662 | ) | | | (36,990,689 | ) |
Capital share transactions: (Note 2) | | | | | | | | | | | | | | | | |
Class A | | | (28,309,571 | ) | | | (24,113,740 | ) | | | (44,541,564 | ) | | | (14,936,884 | ) |
Class C | | | (14,902,294 | ) | | | (4,847,400 | ) | | | (14,593,391 | ) | | | 20,592 | |
Class R6 | | | 329,749 | | | | — | | | | 2,560,407 | | | | — | |
Advisor Class | | | (4,581,302 | ) | | | 5,543,976 | | | | (12,671,584 | ) | | | 28,771,520 | |
Total capital share transactions | | | (47,463,418 | ) | | | (23,417,164 | ) | | | (69,246,132 | ) | | | 13,855,228 | |
Net increase (decrease) in net assets | | | (56,771,868 | ) | | | (31,805,546 | ) | | | (92,867,834 | ) | | | (10,733,079 | ) |
Net assets: | | | | | | | | | | | | | | | | |
Beginning of year | | | 310,771,471 | | | | 342,577,017 | | | | 1,071,582,883 | | | | 1,082,315,962 | |
End of year | | $ | 253,999,603 | | | $ | 310,771,471 | | | $ | 978,715,049 | | | $ | 1,071,582,883 | |
Undistributed net investment income included in net assets: | | | | | | | | | | | | | | | | |
End of year | | $ | 703,005 | | | $ | 921,122 | | | $ | 2,023,498 | | | $ | 1,908,459 | |
| | | | | | | | |
franklintempleton.com | | | | The accompanying notes are an integral part of these financial statements. | | | Annual Report | | 147 |
FRANKLIN TAX-FREE TRUST
FINANCIAL STATEMENTS
Statements of Changes in Net Assets (continued)
| | | | | | | | | | | | | | | | |
| | | Franklin Minnesota
Tax-Free Income Fund | | | Franklin Ohio
Tax-Free Income Fund | |
| | | Year Ended February 28, | | | Year Ended February 28, | |
| | | 2018 | | | 2017 | | | 2018 | | | 2017 | |
Increase (decrease) in net assets: | | | | | | | | | | | | | | | | |
Operations: | | | | | | | | | | | | | | | | |
Net investment income | | $ | 29,793,293 | | | $ | 31,547,709 | | | $ | 46,853,290 | | | $ | 50,152,446 | |
Net realized gain (loss) | | | 238,072 | | | | 148,317 | | | | 1,282,032 | | | | 3,543,771 | |
Net change in unrealized appreciation (depreciation) | | | (16,428,118 | ) | | | (32,958,290 | ) | | | (13,653,246 | ) | | | (48,565,678 | ) |
Net increase (decrease) in net assets resulting from operations | | | 13,603,247 | | | | (1,262,264 | ) | | | 34,482,076 | | | | 5,130,539 | |
Distributions to shareholders from: | | | | | | | | | | | | | | | | |
Net investment income: | | | | | | | | | | | | | | | | |
Class A | | | (19,638,537 | ) | | | (21,864,587 | ) | | | (33,959,387 | ) | | | (38,215,219 | ) |
Class C | | | (4,903,572 | ) | | | (5,442,955 | ) | | | (7,877,542 | ) | | | (8,697,787 | ) |
Class R6 | | | (72,721 | ) | | | — | | | | (74,707 | ) | | | — | |
Advisor Class | | | (5,002,534 | ) | | | (4,322,349 | ) | | | (4,990,817 | ) | | | (3,359,379 | ) |
Total distributions to shareholders | | | (29,617,364 | ) | | | (31,629,891 | ) | | | (46,902,453 | ) | | | (50,272,385 | ) |
Capital share transactions: (Note 2) | | | | | | | | | | | | | | | | |
Class A | | | (27,201,954 | ) | | | (14,505,341 | ) | | | (21,952,169 | ) | | | (32,847,434 | ) |
Class C | | | (16,402,602 | ) | | | 12,283,388 | | | | (20,293,902 | ) | | | 17,312,799 | |
Class R6 | | | 8,500,525 | | | | — | | | | 7,992,613 | | | | — | |
Advisor Class | | | (7,017,726 | ) | | | 52,327,393 | | | | 28,257,939 | | | | 66,393,085 | |
Total capital share transactions | | | (42,121,757 | ) | | | 50,105,440 | | | | (5,995,519 | ) | | | 50,858,450 | |
Net increase (decrease) in net assets | | | (58,135,874 | ) | | | 17,213,285 | | | | (18,415,896 | ) | | | 5,716,604 | |
Net assets: | | | | | | | | | | | | | | | | |
Beginning of year | | | 1,088,017,333 | | | | 1,070,804,048 | | | | 1,594,873,575 | | | | 1,589,156,971 | |
End of year | | $ | 1,029,881,459 | | | $ | 1,088,017,333 | | | $ | 1,576,457,679 | | | $ | 1,594,873,575 | |
Undistributed net investment income included in net assets: | | | | | | | | | | | | | | | | |
End of year | | $ | 565,639 | | | $ | 558,759 | | | $ | 1,086,855 | | | $ | 1,372,978 | |
| | | | | | |
148 | | Annual Report | | | The accompanying notes are an integral part of these financial statements. | | franklintempleton.com |
FRANKLIN TAX-FREE TRUST
FINANCIAL STATEMENTS
Statements of Changes in Net Assets (continued)
| | | | | | | | | | | | | | | | |
| | | Franklin Oregon
Tax-Free Income Fund | | | Franklin Pennsylvania
Tax-Free Income Fund | |
| | | Year Ended February 28, | | | Year Ended February 28, | |
| | | 2018 | | | 2017 | | | 2018 | | | 2017 | |
Increase (decrease) in net assets: | | | | | | | | | | | | | | | | |
Operations: | | | | | | | | | | | | | | | | |
Net investment income | | $ | 39,737,878 | | | $ | 41,154,735 | | | $ | 42,812,106 | | | $ | 48,256,944 | |
Net realized gain (loss) | | | (17,017,568 | ) | | | (4,282,919 | ) | | | (37,289,599 | ) | | | (5,382,806 | ) |
Net change in unrealized appreciation (depreciation) | | | (6,677,925 | ) | | | (29,228,138 | ) | | | (1,099,927 | ) | | | (23,695,785 | ) |
Net increase (decrease) in net assets resulting from operations | | | 16,042,385 | | | | 7,643,678 | | | | 4,422,580 | | | | 19,178,353 | |
Distributions to shareholders from: | | | | | | | | | | | | | | | | |
Net investment income: | | | | | | | | | | | | | | | | |
Class A | | | (31,619,580 | ) | | | (33,229,698 | ) | | | (34,112,085 | ) | | | (35,941,849 | ) |
Class C | | | (5,073,659 | ) | | | (5,480,046 | ) | | | (8,381,395 | ) | | | (8,844,832 | ) |
Class R6 | | | (159,854 | ) | | | — | | | | (26,238 | ) | | | — | |
Advisor Class | | | (3,476,937 | ) | | | (2,253,961 | ) | | | (3,248,628 | ) | | | (2,398,738 | ) |
Total distributions to shareholders | | | (40,330,030 | ) | | | (40,963,705 | ) | | | (45,768,346 | ) | | | (47,185,419 | ) |
Capital share transactions: (Note 2) | | | | | | | | | | | | | | | | |
Class A | | | (11,437,538 | ) | | | 28,510,410 | | | | (51,611,257 | ) | | | (2,589,605 | ) |
Class C | | | (18,599,251 | ) | | | 12,176,238 | | | | (29,162,038 | ) | | | 6,619,909 | |
Class R6 | | | 13,497,349 | | | | — | | | | 2,118,466 | | | | — | |
Advisor Class | | | 6,794,464 | | | | 46,995,666 | | | | (3,837,951 | ) | | | 34,481,884 | |
Total capital share transactions | | | (9,744,976 | ) | | | 87,682,314 | | | | (82,492,780 | ) | | | 38,512,188 | |
Net increase (decrease) in net assets | | | (34,032,621 | ) | | | 54,362,287 | | | | (123,838,546 | ) | | | 10,505,122 | |
Net assets: | | | | | | | | | | | | | | | | |
Beginning of year | | | 1,256,533,054 | | | | 1,202,170,767 | | | | 1,311,332,630 | | | | 1,300,827,508 | |
End of year | | $ | 1,222,500,433 | | | $ | 1,256,533,054 | | | $ | 1,187,494,084 | | | $ | 1,311,332,630 | |
Undistributed net investment income included in net assets: | | | | | | | | | | | | | | | | |
End of year | | $ | 1,052,087 | | | $ | 1,502,275 | | | $ | 2,166,579 | | | $ | 4,270,822 | |
| | | | | | | | |
franklintempleton.com | | | | The accompanying notes are an integral part of these financial statements. | | | Annual Report | | 149 |
FRANKLIN TAX-FREE TRUST
Notes to Financial Statements
1. Organization and Significant Accounting Policies
Franklin Tax-Free Trust (Trust) is registered under the Investment Company Act of 1940 (1940 Act) as an open-end management investment company, consisting of twenty-two separate funds, eight of which are included in this report (Funds) and applies the specialized accounting and reporting guidance in U.S. Generally Accepted Accounting Principles (U.S. GAAP). The Funds offer four classes of shares: Class A, Class C, Class R6 and Advisor Class. Each class of shares may differ by its initial sales load, contingent deferred sales charges, voting rights on matters affecting a single class, its exchange privilege and fees due to differing arrangements for distribution and transfer agent fees. Effective August 1, 2017, the Funds began offering a new class of shares, Class R6.
The following summarizes the Funds’ significant accounting policies.
a. Financial Instrument Valuation
The Funds’ investments in financial instruments are carried at fair value daily. Fair value is the price that would be received to sell an asset or paid to transfer a liability in an orderly transaction between market participants on the measurement date. The Funds calculate the net asset value (NAV) per share as of 4 p.m. Eastern time each day the New York Stock Exchange (NYSE) is open for trading. Under compliance policies and procedures approved by the Trust’s Board of Trustees (the Board), the Funds’ administrator has responsibility for oversight of valuation, including leading the cross-functional Valuation Committee (VC). The VC provides administration and oversight of the Funds’ valuation policies and procedures, which are approved annually by the Board. Among other things, these procedures allow the Funds to utilize independent pricing services, quotations from securities and financial instrument dealers, and other market sources to determine fair value.
Debt securities generally trade in the over-the-counter market rather than on a securities exchange. The Funds’ pricing services use multiple valuation techniques to determine fair value. In instances where sufficient market activity exists, the pricing services may utilize a market-based approach through which quotes from market makers are used to determine fair value. In instances where sufficient market activity may not exist or is limited, the pricing services also utilize proprietary valuation models which may consider market characteristics
such as benchmark yield curves, credit spreads, estimated default rates, anticipated market interest rate volatility, coupon rates, anticipated timing of principal repayments, underlying collateral, and other unique security features in order to estimate the relevant cash flows, which are then discounted to calculate the fair value.
The Funds have procedures to determine the fair value of financial instruments for which market prices are not reliable or readily available. Under these procedures, the VC convenes on a regular basis to review such financial instruments and considers a number of factors, including significant unobservable valuation inputs, when arriving at fair value. The VC primarily employs a market-based approach which may use related or comparable assets or liabilities, recent transactions, market multiples, book values, and other relevant information for the investment to determine the fair value of the investment. An income-based valuation approach may also be used in which the anticipated future cash flows of the investment are discounted to calculate fair value. Discounts may also be applied due to the nature or duration of any restrictions on the disposition of the investments. Due to the inherent uncertainty of valuations of such investments, the fair values may differ significantly from the values that would have been used had an active market existed. The VC employs various methods for calibrating these valuation approaches including a regular review of key inputs and assumptions, transactional back-testing or disposition analysis, and reviews of any related market activity.
b. Securities Purchased on a When-Issued Basis
Certain or all Funds purchase securities on a when-issued basis, with payment and delivery scheduled for a future date. These transactions are subject to market fluctuations and are subject to the risk that the value at delivery may be more or less than the trade date purchase price. Although the Funds will generally purchase these securities with the intention of holding the securities, they may sell the securities before the settlement date. Sufficient assets have been segregated for these securities.
c. Income Taxes
It is each Fund’s policy to qualify as a regulated investment company under the Internal Revenue Code. Each Fund intends to distribute to shareholders substantially all of its income and net realized gains to relieve it from federal income and excise taxes. As a result, no provision for U.S. federal income taxes is required.
| | | | | | |
150 | | Annual Report | | | | franklintempleton.com |
FRANKLIN TAX-FREE TRUST
NOTES TO FINANCIAL STATEMENTS
Each Fund may recognize an income tax liability related to its uncertain tax positions under U.S. GAAP when the uncertain tax position has a less than 50% probability that it will be sustained upon examination by the tax authorities based on its technical merits. As of February 28, 2018, each Fund has determined that no tax liability is required in its financial statements related to uncertain tax positions for any open tax years (or expected to be taken in future tax years). Open tax years are those that remain subject to examination and are based on the statute of limitations in each jurisdiction in which the Fund invests.
d. Security Transactions, Investment Income, Expenses and Distributions
Security transactions are accounted for on trade date. Realized gains and losses on security transactions are determined on a specific identification basis. Interest income and estimated expenses are accrued daily. Amortization of premium and accretion of discount on debt securities are included in interest income. Dividends from net investment income are normally declared daily; these dividends may be reinvested or paid monthly to shareholders. Distributions from realized capital gains and other distributions, if any, are recorded on the ex-dividend date. Distributable earnings are determined according to income tax regulations (tax basis) and may differ from earnings recorded in accordance with U.S. GAAP. These differences may be permanent or temporary. Permanent differences are reclassified among capital accounts to reflect their tax character. These reclassifications have no impact on net assets or the results of operations. Temporary differences are not reclassified, as they may reverse in subsequent periods.
Common expenses incurred by the Trust are allocated among the Funds based on the ratio of net assets of each Fund to the combined net assets of the Trust. Fund specific expenses are charged directly to the Fund that incurred the expense.
Realized and unrealized gains and losses and net investment income, excluding class specific expenses, are allocated daily to each class of shares based upon the relative proportion of net assets of each class. Differences in per share distributions by class are generally due to differences in class specific expenses.
e. Insurance
The scheduled payments of interest and principal for each insured municipal security in the Trust are insured by either a new issue insurance policy or a secondary insurance policy. Some municipal securities in the Funds are secured by collateral guaranteed by an agency of the U.S. government. Depending on the type of coverage, premiums for insurance are either added to the cost basis of the security or paid by a third party.
Insurance companies typically insure municipal bonds that tend to be of very high quality, with the majority of underlying municipal bonds rated A or better. However, an event involving an insurer could have an adverse effect on the value of the securities insured by that insurance company. There can be no assurance the insurer will be able to fulfill its obligations under the terms of the policy.
f. Accounting Estimates
The preparation of financial statements in accordance with U.S. GAAP requires management to make estimates and assumptions that affect the reported amounts of assets and liabilities at the date of the financial statements and the amounts of income and expenses during the reporting period. Actual results could differ from those estimates.
g. Guarantees and Indemnifications
Under the Trust’s organizational documents, its officers and trustees are indemnified by the Trust against certain liabilities arising out of the performance of their duties to the Trust. Additionally, in the normal course of business, the Trust, on behalf of the Funds, enters into contracts with service providers that contain general indemnification clauses. The Trust’s maximum exposure under these arrangements is unknown as this would involve future claims that may be made against the Trust that have not yet occurred. Currently, the Trust expects the risk of loss to be remote.
| | | | | | | | |
franklintempleton.com | | | | | | Annual Report | | 151 |
FRANKLIN TAX-FREE TRUST
NOTES TO FINANCIAL STATEMENTS
2. Shares of Beneficial Interest
At February 28, 2018, there were an unlimited number of shares authorized (without par value). Transactions in the Funds’ shares were as follows:
| | | | | | | | | | | | | | | | |
| | | Franklin Arizona Tax-Free Income Fund | | | Franklin Colorado Tax-Free Income Fund | |
| | | | |
| | | Shares | | | Amount | | | Shares | | | Amount | |
| |
Class A Shares: | | | | | | | | | | | | | | | | |
Year ended February 28, 2018 | | | | | | | | | | | | | | | | |
Shares sold | | | 7,581,370 | | | $ | 81,621,335 | | | | 5,644,016 | | | $ | 65,302,273 | |
Shares issued in reinvestment of distributions | | | 2,115,434 | | | | 22,760,771 | | | | 1,463,062 | | | | 16,892,541 | |
Shares redeemed | | | (11,404,577 | ) | | | (122,706,534 | ) | | | (8,546,116 | ) | | | (98,595,879 | ) |
| | | | |
Net increase (decrease) | | | (1,707,773 | ) | | $ | (18,324,428 | ) | | | (1,439,038 | ) | | $ | (16,401,065 | ) |
| | | | |
Year ended February 28, 2017 | | | | | | | | | | | | | | | | |
Shares sold | | | 9,237,877 | | | $ | 102,364,427 | | | | 7,242,713 | | | $ | 86,248,755 | |
Shares issued in reinvestment of distributions | | | 2,125,764 | | | | 23,459,688 | | | | 1,627,285 | | | | 19,343,269 | |
Shares redeemed | | | (12,132,210 | ) | | | (132,919,821 | ) | | | (7,727,443 | ) | | | (91,051,375 | ) |
| | | | |
Net increase (decrease) | | | (768,569 | ) | | $ | (7,095,706 | ) | | | 1,142,555 | | | $ | 14,540,649 | |
| | | | |
Class C Shares: | | | | | | | | | | | | | | | | |
Year ended February 28, 2018 | | | | | | | | | | | | | | | | |
Shares sold | | | 1,187,924 | | | $ | 13,019,083 | | | | 800,776 | | | $ | 9,366,769 | |
Shares issued in reinvestment of distributions | | | 274,355 | | | | 3,000,651 | | | | 245,197 | | | | 2,865,298 | |
Shares redeemed | | | (2,507,365 | ) | | | (27,466,196 | ) | | | (2,129,605 | ) | | | (24,887,219 | ) |
| | | | |
Net increase (decrease) | | | (1,045,086 | ) | | $ | (11,446,462 | ) | | | (1,083,632 | ) | | $ | (12,655,152 | ) |
| | | | |
Year ended February 28, 2017 | | | | | | | | | | | | | | | | |
Shares sold | | | 2,365,215 | | | $ | 26,698,263 | | | | 1,681,407 | | | $ | 20,327,936 | |
Shares issued in reinvestment of distributions | | | 272,122 | | | | 3,049,633 | | | | 281,326 | | | | 3,381,970 | |
Shares redeemed | | | (1,909,414 | ) | | | (21,276,068 | ) | | | (1,402,403 | ) | | | (16,770,675 | ) |
| | | | |
Net increase (decrease) | | | 727,923 | | | $ | 8,471,828 | | | | 560,330 | | | $ | 6,939,231 | |
| | | | |
Class R6 Shares: | | | | | | | | | | | | | | | | |
Year ended February 28, 2018a | | | | | | | | | | | | | | | | |
Shares sold | | | 1,108,115 | | | $ | 11,991,745 | | | | 744,909 | | | $ | 8,574,409 | |
Shares issued in reinvestment of distributions | | | 12,055 | | | | 129,187 | | | | 6,279 | | | | 71,686 | |
Shares redeemed | | | (100,233 | ) | | | (1,075,928 | ) | | | (73,533 | ) | | | (844,367 | ) |
| | | | |
Net increase (decrease) | | | 1,019,937 | | | $ | 11,045,004 | | | | 677,655 | | | $ | 7,801,728 | |
| | | | |
Advisor Class Shares: | | | | | | | | | | | | | | | | |
Year ended February 28, 2018 | | | | | | | | | | | | | | | | |
Shares sold | | | 3,528,139 | | | $ | 38,136,887 | | | | 2,948,349 | | | $ | 34,133,539 | |
Shares issued in reinvestment of distributions | | | 242,266 | | | | 2,613,946 | | | | 222,976 | | | | 2,573,865 | |
Shares redeemed | | | (3,981,127 | ) | | | (42,989,361 | ) | | | (2,496,011 | ) | | | (28,797,591 | ) |
| | | | |
Net increase (decrease) | | | (210,722 | ) | | $ | (2,238,528 | ) | | | 675,314 | | | $ | 7,909,813 | |
| | | | |
Year ended February 28, 2017 | | | | | | | | | | | | | | | | |
Shares sold | | | 4,756,945 | | | $ | 52,442,293 | | | | 3,276,844 | | | $ | 38,742,143 | |
Shares issued in reinvestment of distributions | | | 164,917 | | | | 1,820,725 | | | | 168,230 | | | | 1,996,514 | |
Shares redeemed | | | (1,723,987 | ) | | | (18,919,428 | ) | | | (1,373,600 | ) | | | (16,212,430 | ) |
| | | | |
Net increase (decrease) | | | 3,197,875 | | | $ | 35,343,590 | | | | 2,071,474 | | | $ | 24,526,227 | |
| | | | |
aFor the period August 1, 2017 (effective date) to February 28, 2018.
| | | | | | |
152 | | Annual Report | | | | franklintempleton.com |
FRANKLIN TAX-FREE TRUST
NOTES TO FINANCIAL STATEMENTS
| | | | | | | | | | | | | | | | |
| | | Franklin Connecticut
Tax-Free Income Fund | | | Franklin Michigan Tax-Free Income Fund | |
| | | | |
| | | Shares | | | Amount | | | Shares | | | Amount | |
| |
Class A Shares: | | | | | | | | | | | | | | | | |
Year ended February 28, 2018 | | | | | | | | | | | | | | | | |
Shares sold | | | 1,262,137 | | | $ | 12,977,178 | | | | 4,102,045 | | | $ | 46,993,713 | |
Shares issued in reinvestment of distributions | | | 544,987 | | | | 5,593,991 | | | | 2,015,968 | | | | 23,061,519 | |
Shares redeemed | | | (4,561,589 | ) | | | (46,880,740 | ) | | | (10,006,401 | ) | | | (114,596,796 | ) |
| | | | |
Net increase (decrease) | | | (2,754,465 | ) | | $ | (28,309,571 | ) | | | (3,888,388 | ) | | $ | (44,541,564 | ) |
| | | | |
Year ended February 28, 2017 | | | | | | | | | | | | | | | | |
Shares sold | | | 1,622,002 | | | $ | 17,341,618 | | | | 6,459,022 | | | $ | 76,066,528 | |
Shares issued in reinvestment of distributions | | | 637,140 | | | | 6,791,610 | | | | 2,251,666 | | | | 26,484,885 | |
Shares redeemed | | | (4,555,924 | ) | | | (48,246,968 | ) | | | (10,035,981 | ) | | | (117,488,297 | ) |
| | | | |
Net increase (decrease) | | | (2,296,782 | ) | | $ | (24,113,740 | ) | | | (1,325,293 | ) | | $ | (14,936,884 | ) |
| | | | |
Class C Shares: | | | | | | | | | | | | | | | | |
Year ended February 28, 2018 | | | | | | | | | | | | | | | | |
Shares sold | | | 194,279 | | | $ | 2,010,772 | | | | 1,043,672 | | | $ | 12,148,527 | |
Shares issued in reinvestment of distributions | | | 123,869 | | | | 1,281,858 | | | | 272,056 | | | | 3,161,178 | |
Shares redeemed | | | (1,756,924 | ) | | | (18,194,924 | ) | | | (2,570,832 | ) | | | (29,903,096 | ) |
| | | | |
Net increase (decrease) | | | (1,438,776 | ) | | $ | (14,902,294 | ) | | | (1,255,104 | ) | | $ | (14,593,391 | ) |
| | | | |
Year ended February 28, 2017 | | | | | | | | | | | | | | | | |
Shares sold | | | 488,307 | | | $ | 5,280,801 | | | | 1,762,233 | | | $ | 21,071,556 | |
Shares issued in reinvestment of distributions | | | 141,126 | | | | 1,515,449 | | | | 308,143 | | | | 3,678,444 | |
Shares redeemed | | | (1,086,835 | ) | | | (11,643,650 | ) | | | (2,076,800 | ) | | | (24,729,408 | ) |
| | | | |
Net increase (decrease) | | | (457,402 | ) | | $ | (4,847,400 | ) | | | (6,424 | ) | | $ | 20,592 | |
| | | | |
Class R6 Shares: | | | | | | | | | | | | | | | | |
Year ended February 28, 2018a | | | | | | | | | | | | | | | | |
Shares sold | | | 32,701 | | | $ | 335,695 | | | | 255,467 | | | $ | 2,939,820 | |
Shares issued in reinvestment of distributions | | | 379 | | | | 3,853 | | | | 2,205 | | | | 25,129 | |
Shares redeemed | | | (959 | ) | | | (9,799 | ) | | | (35,387 | ) | | | (404,542 | ) |
| | | | |
Net increase (decrease) | | | 32,121 | | | $ | 329,749 | | | | 222,285 | | | $ | 2,560,407 | |
| | | | |
Advisor Class Shares: | | | | | | | | | | | | | | | | |
Year ended February 28, 2018 | | | | | | | | | | | | | | | | |
Shares sold | | | 718,610 | | | $ | 7,408,151 | | | | 1,933,147 | | | $ | 22,242,090 | |
Shares issued in reinvestment of distributions | | | 61,414 | | | | 630,028 | | | | 172,187 | | | | 1,976,958 | |
Shares redeemed | | | (1,230,629 | ) | | | (12,619,481 | ) | | | (3,214,623 | ) | | | (36,890,632 | ) |
| | | | |
Net increase (decrease) | | | (450,605 | ) | | $ | (4,581,302 | ) | | | (1,109,289 | ) | | $ | (12,671,584 | ) |
| | | | |
Year ended February 28, 2017 | | | | | | | | | | | | | | | | |
Shares sold | | | 1,126,599 | | | $ | 11,865,928 | | | | 3,745,258 | | | $ | 43,561,070 | |
Shares issued in reinvestment of distributions | | | 44,211 | | | | 470,164 | | | | 119,547 | | | | 1,407,210 | |
Shares redeemed | | | (639,735 | ) | | | (6,792,116 | ) | | | (1,380,497 | ) | | | (16,196,760 | ) |
| | | | |
Net increase (decrease) | | | 531,075 | | | $ | 5,543,976 | | | | 2,484,308 | | | $ | 28,771,520 | |
| | | | |
aFor the period August 1, 2017 (effective date) to February 28, 2018.
| | | | | | | | |
franklintempleton.com | | | | | | Annual Report | | 153 |
FRANKLIN TAX-FREE TRUST
NOTES TO FINANCIAL STATEMENTS
2. Shares of Beneficial Interest (continued)
| | | | | | | | | | | | | | | | |
| | | Franklin Minnesota Tax-Free Income Fund | | | Franklin Ohio Tax-Free Income Fund | |
| | | | |
| | | Shares | | | Amount | | | Shares | | | Amount | |
| |
Class A Shares: | | | | | | | | | | | | | | | | |
Year ended February 28, 2018 | | | | | | | | | | | | | | | | |
Shares sold | | | 5,907,491 | | | $ | 72,730,009 | | | | 8,107,342 | | | $ | 102,625,714 | |
Shares issued in reinvestment of distributions | | | 1,481,264 | | | | 18,218,129 | | | | 2,455,835 | | | | 31,048,512 | |
Shares redeemed | | | (9,596,366 | ) | | | (118,150,092 | ) | | | (12,301,390 | ) | | | (155,626,395 | ) |
| | | | |
Net increase (decrease) | | | (2,207,611 | ) | | $ | (27,201,954 | ) | | | (1,738,213 | ) | | $ | (21,952,169 | ) |
| | | | |
Year ended February 28, 2017 | | | | | | | | | | | | | | | | |
Shares sold | | | 8,156,603 | | | $ | 102,076,942 | | | | 10,587,873 | | | $ | 136,479,455 | |
Shares issued in reinvestment of distributions | | | 1,626,236 | | | | 20,344,858 | | | | 2,720,099 | | | | 34,929,118 | |
Shares redeemed | | | (10,998,862 | ) | | | (136,927,141 | ) | | | (16,026,550 | ) | | | (204,256,007 | ) |
| | | | |
Net increase (decrease) | | | (1,216,023 | ) | | $ | (14,505,341 | ) | | | (2,718,578 | ) | | $ | (32,847,434 | ) |
| | | | |
Class C Shares: | | | | | | | | | | | | | | | | |
Year ended February 28, 2018 | | | | | | | | | | | | | | | | |
Shares sold | | | 1,486,120 | | | $ | 18,509,643 | | | | 2,420,867 | | | $ | 31,064,739 | |
Shares issued in reinvestment of distributions | | | 374,274 | | | | 4,654,024 | | | | 577,410 | | | | 7,397,332 | |
Shares redeemed | | | (3,176,734 | ) | | | (39,566,269 | ) | | | (4,583,484 | ) | | | (58,755,973 | ) |
| | | | |
Net increase (decrease) | | | (1,316,340 | ) | | $ | (16,402,602 | ) | | | (1,585,207 | ) | | $ | (20,293,902 | ) |
| | | | |
Year ended February 28, 2017 | | | | | | | | | | | | | | | | |
Shares sold | | | 3,399,245 | | | $ | 43,148,979 | | | | 4,055,318 | | | $ | 53,011,032 | |
Shares issued in reinvestment of distributions | | | 402,154 | | | | 5,082,798 | | | | 618,103 | | | | 8,036,545 | |
Shares redeemed | | | (2,851,451 | ) | | | (35,948,389 | ) | | | (3,384,895 | ) | | | (43,734,778 | ) |
| | | | |
Net increase (decrease) | | | 949,948 | | | $ | 12,283,388 | | | | 1,288,526 | | | $ | 17,312,799 | |
| | | | |
Class R6 Shares: | | | | | | | | | | | | | | | | |
Year ended February 28, 2018a | | | | | | | | | | | | | | | | |
Shares sold | | | 746,692 | | | $ | 9,196,721 | | | | 660,808 | | | $ | 8,394,607 | |
Shares issued in reinvestment of distributions | | | 5,943 | | | | 72,660 | | | | 5,926 | | | | 74,642 | |
Shares redeemed | | | (62,606 | ) | | | (768,856 | ) | | | (37,725 | ) | | | (476,636 | ) |
| | | | |
Net increase (decrease) | | | 690,029 | | | $ | 8,500,525 | | | | 629,009 | | | $ | 7,992,613 | |
| | | | |
Advisor Class Shares: | | | | | | | | | | | | | | | | |
Year ended February 28, 2018 | | | | | | | | | | | | | | | | |
Shares sold | | | 4,979,847 | | | $ | 61,292,751 | | | | 4,734,280 | | | $ | 59,960,883 | |
Shares issued in reinvestment of distributions | | | 390,891 | | | | 4,814,057 | | | | 355,937 | | | | 4,504,773 | |
Shares redeemed | | | (5,922,205 | ) | | | (73,124,534 | ) | | | (2,858,102 | ) | | | (36,207,717 | ) |
| | | | |
Net increase (decrease) | | | (551,467 | ) | | $ | (7,017,726 | ) | | | 2,232,115 | | | $ | 28,257,939 | |
| | | | |
Year ended February 28, 2017 | | | | | | | | | | | | | | | | |
Shares sold | | | 7,033,639 | | | $ | 87,704,285 | | | | 6,898,103 | | | $ | 87,905,592 | |
Shares issued in reinvestment of distributions | | | 327,395 | | | | 4,094,145 | | | | 221,234 | | | | 2,833,912 | |
Shares redeemed | | | (3,178,413 | ) | | | (39,471,037 | ) | | | (1,914,258 | ) | | | (24,346,419 | ) |
| | | | |
Net increase (decrease) | | | 4,182,621 | | | $ | 52,327,393 | | | | 5,205,079 | | | $ | 66,393,085 | |
| | | | |
aFor the period August 1, 2017 (effective date) to February 28, 2018.
| | | | | | |
154 | | Annual Report | | | | franklintempleton.com |
FRANKLIN TAX-FREE TRUST
NOTES TO FINANCIAL STATEMENTS
| | | | | | | | | | | | | | | | |
| | | Franklin Oregon Tax-Free Income Fund | | | Franklin Pennsylvania
Tax-Free Income Fund | |
| | | | |
| | | Shares | | | Amount | | | Shares | | | Amount | |
| |
Class A Shares: | | | | | | | | | | | | | | | | |
Year ended February 28, 2018 | | | | | | | | | | | | | | | | |
Shares sold | | | 10,292,829 | | | $ | 119,270,001 | | | | 7,025,877 | | | $ | 70,231,758 | |
Shares issued in reinvestment of distributions | | | 2,495,298 | | | | 28,873,297 | | | | 3,048,256 | | | | 30,425,960 | |
Shares redeemed | | | (13,778,003 | ) | | | (159,580,836 | ) | | | (15,257,473 | ) | | | (152,268,975 | ) |
| | | | |
Net increase (decrease) | | | (989,876 | ) | | $ | (11,437,538 | ) | | | (5,183,340 | ) | | $ | (51,611,257 | ) |
| | | | |
Year ended February 28, 2017 | | | | | | | | | | | | | | | | |
Shares sold | | | 13,156,595 | | | $ | 156,419,128 | | | | 10,758,583 | | | $ | 110,974,434 | |
Shares issued in reinvestment of distributions | | | 2,541,956 | | | | 30,150,645 | | | | 3,111,483 | | | | 32,062,824 | |
Shares redeemed | | | (13,416,469 | ) | | | (158,059,363 | ) | | | (14,204,397 | ) | | | (145,626,863 | ) |
| | | | |
Net increase (decrease) | | | 2,282,082 | | | $ | 28,510,410 | | | | (334,331 | ) | | $ | (2,589,605 | ) |
| | | | |
Class C Shares: | | | | | | | | | | | | | | | | |
Year ended February 28, 2018 | | | | | | | | | | | | | | | | |
Shares sold | | | 1,711,960 | | | $ | 20,147,603 | | | | 1,783,883 | | | $ | 18,075,813 | |
Shares issued in reinvestment of distributions | | | 411,760 | | | | 4,838,216 | | | | 748,545 | | | | 7,565,175 | |
Shares redeemed | | | (3,703,982 | ) | | | (43,585,070 | ) | | | (5,419,009 | ) | | | (54,803,026 | ) |
| | | | |
Net increase (decrease) | | | (1,580,262 | ) | | $ | (18,599,251 | ) | | | (2,886,581 | ) | | $ | (29,162,038 | ) |
| | | | |
Year ended February 28, 2017 | | | | | | | | | | | | | | | | |
Shares sold | | | 3,068,701 | | | $ | 37,077,563 | | | | 3,576,800 | | | $ | 37,364,636 | |
Shares issued in reinvestment of distributions | | | 428,575 | | | | 5,157,276 | | | | 750,267 | | | | 7,823,427 | |
Shares redeemed | | | (2,508,529 | ) | | | (30,058,601 | ) | | | (3,706,894 | ) | | | (38,568,154 | ) |
| | | | |
Net increase (decrease) | | | 988,747 | | | $ | 12,176,238 | | | | 620,173 | | | $ | 6,619,909 | |
| | | | |
Class R6 Shares: | | | | | | | | | | | | | | | | |
Year ended February 28, 2018a | | | | | | | | | | | | | | | | |
Shares sold | | | 1,346,401 | | | $ | 15,614,361 | | | | 232,146 | | | $ | 2,310,364 | |
Shares issued in reinvestment of distributions | | | 13,907 | | | | 159,785 | | | | 2,649 | | | | 26,160 | |
Shares redeemed | | | (198,435 | ) | | | (2,276,797 | ) | | | (22,005 | ) | | | (218,058 | ) |
| | | | |
Net increase (decrease) | | | 1,161,873 | | | $ | 13,497,349 | | | | 212,790 | | | $ | 2,118,466 | |
| | | | |
Advisor Class Shares: | | | | | | | | | | | | | | | | |
Year ended February 28, 2018 | | | | | | | | | | | | | | | | |
Shares sold | | | 4,121,131 | | | $ | 47,835,882 | | | | 2,605,534 | | | $ | 26,076,834 | |
Shares issued in reinvestment of distributions | | | 280,098 | | | | 3,245,399 | | | | 278,136 | | | | 2,779,673 | |
Shares redeemed | | | (3,818,615 | ) | | | (44,286,817 | ) | | | (3,271,411 | ) | | | (32,694,458 | ) |
| | | | |
Net increase (decrease) | | | 582,614 | | | $ | 6,794,464 | | | | (387,741 | ) | | $ | (3,837,951 | ) |
| | | | |
Year ended February 28, 2017 | | | | | | | | | | | | | | | | |
Shares sold | | | 5,383,920 | | | $ | 63,458,721 | | | | 4,468,007 | | | $ | 45,826,070 | |
Shares issued in reinvestment of distributions | | | 174,059 | | | | 2,061,686 | | | | 192,811 | | | | 1,986,481 | |
Shares redeemed | | | (1,577,190 | ) | | | (18,524,741 | ) | | | (1,302,399 | ) | | | (13,330,667 | ) |
| | | | |
Net increase (decrease) | | | 3,980,789 | | | $ | 46,995,666 | | | | 3,358,419 | | | $ | 34,481,884 | |
| | | | |
aFor the period August 1, 2017 (effective date) to February 28, 2018.
| | | | | | | | |
franklintempleton.com | | | | | | Annual Report | | 155 |
FRANKLIN TAX-FREE TRUST
NOTES TO FINANCIAL STATEMENTS
3. Transactions with Affiliates
Franklin Resources, Inc. is the holding company for various subsidiaries that together are referred to as Franklin Templeton Investments. Certain officers and trustees of the Trust are also officers and/or directors of the following subsidiaries:
| | |
| Subsidiary | | Affiliation |
Franklin Advisers, Inc. (Advisers) | | Investment manager |
Franklin Templeton Services, LLC (FT Services) | | Administrative manager |
Franklin Templeton Distributors, Inc. (Distributors) | | Principal underwriter |
Franklin Templeton Investor Services, LLC (Investor Services) | | Transfer agent |
a. Management Fees
The Funds pay an investment management fee to Advisers based on the month-end net assets of each of the Funds as follows:
| | |
| Annualized Fee Rate | | Net Assets |
0.625% | | Up to and including $100 million |
0.500% | | Over $100 million, up to and including $250 million |
0.450% | | Over $250 million, up to and including $7.5 billion |
0.440% | | Over $7.5 billion, up to and including $10 billion |
0.430% | | Over $10 billion, up to and including $12.5 billion |
0.420% | | Over $12.5 billion, up to and including $15 billion |
0.400% | | Over $15 billion, up to and including $17.5 billion |
0.380% | | Over $17.5 billion, up to and including $20 billion |
0.360% | | In excess of $20 billion |
For the year ended February 28, 2018, each Fund’s gross effective investment management fee rate based on average daily net assets was as follows:
| | | | | | | | | | | | | | |
Franklin
Arizona
Tax-Free
Income Fund | | | Franklin
Colorado
Tax-Free
Income Fund | | | Franklin
Connecticut
Tax-Free
Income Fund | | | Franklin
Michigan
Tax-Free
Income Fund | |
| | 0.473% | | | | 0.481% | | | | 0.533% | | | | 0.471% | |
| | | |
Franklin
Minnesota
Tax-Free
Income Fund | | | Franklin
Ohio
Tax-Free
Income Fund | | | Franklin
Oregon
Tax-Free
Income Fund | | | Franklin
Pennsylvania
Tax-Free
Income Fund | |
| | 0.471% | | | | 0.464% | | | | 0.467% | | | | 0.467% | |
b. Administrative Fees
Under an agreement with Advisers, FT Services provides administrative services to the Funds. The fee is paid by Advisers based on each of the Funds’ average daily net assets, and is not an additional expense of the Funds.
c. Distribution Fees
The Board has adopted distribution plans for each share class, with the exception of Class R6 and Advisor Class shares, pursuant to Rule 12b-1 under the 1940 Act. Under the Funds’ Class A reimbursement distribution plans, the Funds reimburse Distributors for costs incurred in connection with the servicing, sale and distribution of each Fund’s shares up to the maximum annual plan rate.
| | | | | | |
156 | | Annual Report | | | | franklintempleton.com |
FRANKLIN TAX-FREE TRUST
NOTES TO FINANCIAL STATEMENTS
Under the Class A reimbursement distribution plans, costs exceeding the maximum for the current plan year cannot be reimbursed in subsequent periods. In addition, under the Funds’ Class C compensation distribution plans, the Funds pay Distributors for costs incurred in connection with the servicing, sale and distribution of each Fund’s shares up to the maximum annual plan rate. The plan year, for purposes of monitoring compliance with the maximum annual plan rates, is February 1 through January 31 for each Fund.
The maximum annual plan rates, based on the average daily net assets, for each class, are as follows:
| | | | |
Class A | | | 0.10 | % |
Class C | | | 0.65 | % |
d. Sales Charges/Underwriting Agreements
Front-end sales charges and contingent deferred sales charges (CDSC) do not represent expenses of the Funds. These charges are deducted from the proceeds of sales of fund shares prior to investment or from redemption proceeds prior to remittance, as applicable. Distributors has advised the Funds of the following commission transactions related to the sales and redemptions of the Funds’ shares for the year:
| | | | | | | | | | | | | | | | |
| | | Franklin
Arizona
Tax-Free
Income Fund | | | Franklin
Colorado
Tax-Free
Income Fund | | | Franklin
Connecticut
Tax-Free
Income Fund | | | Franklin
Michigan
Tax-Free
Income Fund | |
Sales charges retained net of commissions paid to unaffiliated brokers/dealers | | | $147,196 | | | | $119,552 | | | | $23,310 | | | | $119,855 | |
CDSC retained | | | $ 25,287 | | | | $ 3,826 | | | | $ 5,538 | | | | $ 17,240 | |
| | | | |
| | | Franklin
Minnesota
Tax-Free
Income Fund | | | Franklin
Ohio
Tax-Free
Income Fund | | | Franklin
Oregon
Tax-Free
Income Fund | | | Franklin
Pennsylvania
Tax-Free
Income Fund | |
Sales charges retained net of commissions paid to unaffiliated brokers/dealers | | | $141,078 | | | | $220,702 | | | | $280,425 | | | | $168,607 | |
CDSC retained | | | $ 12,447 | | | | $ 20,503 | | | | $ 18,684 | | | | $ 15,623 | |
e. Transfer Agent Fees
Each class of shares pays transfer agent fees to Investor Services for its performance of shareholder servicing obligations. Effective November 1, 2017, the fees are based on an annualized asset based fee of 0.02% plus a transaction based fee. Prior to November 1, 2017, the fees were account based fees that varied based on fund or account type. In addition, each class reimburses Investor Services for out of pocket expenses incurred and, except for Class R6, reimburses shareholder servicing fees paid to third parties. These fees are allocated daily based upon their relative proportion of such classes’ aggregate net assets. Class R6 pays Investor Services transfer agent fees specific to that class.
For the year ended February 28, 2018, the Funds paid transfer agent fees as noted in the Statements of Operations of which the following amounts were retained by Investor Services:
| | | | | | | | | | | | | | | | |
| | | Franklin
Arizona
Tax-Free
Income Fund | | | Franklin
Colorado
Tax-Free
Income Fund | | | Franklin
Connecticut
Tax-Free
Income Fund | | | Franklin
Michigan
Tax-Free
Income Fund | |
Transfer agent fees | | | $138,372 | | | | $114,303 | | | | $51,158 | | | | $213,640 | |
| | | | | | | | |
franklintempleton.com | | | | | | Annual Report | | 157 |
FRANKLIN TAX-FREE TRUST
NOTES TO FINANCIAL STATEMENTS
3. Transactions with Affiliates (continued)
e. Transfer Agent Fees (continued)
| | | | | | | | | | | | | | | | |
| | | Franklin
Minnesota
Tax-Free
Income Fund | | | Franklin
Ohio
Tax-Free
Income Fund | | | Franklin
Oregon
Tax-Free
Income Fund | | | Franklin
Pennsylvania
Tax-Free
Income Fund | |
Transfer agent fees | | | $194,736 | | | | $277,194 | | | | $188,960 | | | | $246,351 | |
f. Waiver and Expense Reimbursements
For Franklin Colorado Tax-Free Income Fund, Investor Services has voluntarily agreed in advance to waive or limit its fees so that the new transfer agent fee arrangement effective November 1, 2017 will not increase the fees retained by more than 0.02% based on the average net assets of each class. Investor Services may discontinue this waiver in the future.
Investor Services has voluntarily agreed in advance to waive or limit its fees so that the Class R6 transfer agent fees do not exceed 0.03%. Investor Services may discontinue this waiver in the future.
g. Interfund Transactions
Certain or all Funds engaged in purchases and sales of investments with funds or other accounts that have common investment managers (or affiliated investment managers), directors, trustees or officers. These purchases and sales for the year ended February 28, 2018, were as follows:
| | | | | | | | | | | | | | | | |
| | | Franklin
Arizona
Tax-Free
Income Fund | | | Franklin
Colorado
Tax-Free
Income Fund | | | Franklin
Connecticut
Tax-Free
Income Fund | | | Franklin
Michigan
Tax-Free
Income Fund | |
Purchases | | | $16,218,192 | | | | $ 9,300,000 | | | | $2,200,000 | | | | $55,900,000 | |
Sales | | | $22,600,000 | | | | $11,300,000 | | | | $ 400,000 | | | | $58,900,000 | |
| | | | |
| | | Franklin
Minnesota
Tax-Free
Income Fund | | | Franklin
Ohio
Tax-Free
Income Fund | | | Franklin
Oregon
Tax-Free
Income Fund | | | Franklin
Pennsylvania
Tax-Free
Income Fund | |
Purchases | | | $22,870,000 | | | | $24,400,000 | | | | $27,000,000 | | | | $45,010,000 | |
Sales | | | $ 8,070,000 | | | | $26,400,000 | | | | $28,600,000 | | | | $30,385,000 | |
4. Expense Offset Arrangement
Effective December 1, 2017, the Funds have entered into an arrangement with their custodian whereby credits realized as a result of uninvested cash balances are used to reduce a portion of the Funds’ custodian expenses. During the year ended February 28, 2018, there were no credits earned.
5. Income Taxes
For tax purposes, capital losses may be carried over to offset future capital gains. Capital loss carryforwards with no expiration, if any, must be fully utilized before those losses with expiration dates.
| | | | | | |
158 | | Annual Report | | | | franklintempleton.com |
FRANKLIN TAX-FREE TRUST
NOTES TO FINANCIAL STATEMENTS
At February 28, 2018, the capital loss carryforwards were as follows:
| | | | | | | | | | | | | | | | |
| | | Franklin
Arizona
Tax-Free
Income Fund | | | Franklin
Colorado
Tax-Free
Income Fund | | | Franklin
Connecticut
Tax-Free
Income Fund | | | Franklin
Michigan
Tax-Free
Income Fund | |
Capital loss carryforwards subject to expiration: | | | | | | | | | | | | | | | | |
2019 | | | $ — | | | | $ 1,448,482 | | | | $ — | | | | $ — | |
Capital loss carryforwards not subject to expiration: | | | | | | | | | | | | | | | | |
Short term | | | 13,620,162 | | | | 14,344,709 | | | | 7,153,673 | | | | 12,135,309 | |
Long term | | | 43,259,466 | | | | 29,312,230 | | | | 27,219,298 | | | | 58,032,842 | |
Total capital loss carryforwards | | | $56,879,628 | | | | $45,105,421 | | | | $34,372,971 | | | | $70,168,151 | |
| | | | |
| | | Franklin
Minnesota
Tax-Free
Income Fund | | | Franklin
Ohio
Tax-Free
Income Fund | | | Franklin
Oregon
Tax-Free
Income Fund | | | Franklin
Pennsylvania
Tax-Free
Income Fund | |
Capital loss carryforwards not subject to expiration: | | | | | | | | | | | | | | | | |
Short term | | | $ 7,640,952 | | | | $18,183,738 | | | | $17,616,566 | | | | $12,513,011 | |
Long term | | | 2,662,912 | | | | 15,086,637 | | | | 56,163,559 | | | | 76,666,046 | |
Total capital loss carryforwards | | | $10,303,864 | | | | $33,270,375 | | | | $73,780,125 | | | | $89,179,057 | |
During the year ended February 28, 2018, Franklin Minnesota Tax-Free Income Fund utilized $407,122 of capital loss carryforwards.
On February 28, 2018, the following Funds had expired capital loss carryforwards, which were reclassified to paid-in capital.
| | | | | | | | | | |
Franklin Colorado
Tax-Free Income
Fund | | | Franklin
Minnesota
Tax-Free Income
Fund | | | Franklin
Pennsylvania
Tax-Free Income
Fund | |
| | $2,700,288 | | | | $286,131 | | | | $3,499,532 | |
The tax character of distributions paid during the years ended February 28, 2018 and 2017, was as follows:
| | | | | | | | | | | | | | | | | | | | | | | | |
| | | Franklin Arizona Tax-Free Income Fund | | | Franklin Colorado Tax-Free Income Fund | | | Franklin Connecticut Tax-Free Income Fund | |
| | | 2018 | | | 2017 | | | 2018 | | | 2017 | | | 2018 | | | 2017 | |
Distributions paid from tax exempt income | | $ | 33,312,588 | | | $ | 33,670,830 | | | $ | 24,122,795 | | | $ | 26,775,648 | | | $ | 9,293,375 | | | $ | 10,870,735 | |
| | | |
| | | Franklin Michigan
Tax-Free Income Fund | | | Franklin Minnesota
Tax-Free Income Fund | | | Franklin Ohio
Tax-Free Income Fund | |
| | | 2018 | | | 2017 | | | 2018 | | | 2017 | | | 2018 | | | 2017 | |
Distributions paid from tax exempt income | | $ | 32,598,662 | | | $ | 36,990,689 | | | $ | 29,617,364 | | | $ | 31,629,891 | | | $ | 46,902,453 | | | $ | 50,272,385 | |
| | | |
| | | Franklin Oregon Tax-Free
Income Fund | | | Franklin Pennsylvania
Tax-Free Income Fund | | | | |
| | | 2018 | | | 2017 | | | 2018 | | | 2017 | | | | | | | |
Distributions paid from tax exempt income | | $ | 40,330,030 | | | $ | 40,963,705 | | | $ | 45,768,346 | | | $ | 47,185,419 | | | | | | | | | |
| | | | | | | | |
franklintempleton.com | | | | | | Annual Report | | 159 |
FRANKLIN TAX-FREE TRUST
NOTES TO FINANCIAL STATEMENTS
5. Income Taxes (continued)
At February 28, 2018, the cost of investments, net unrealized appreciation (depreciation), undistributed tax exempt and ordinary income for income tax purposes were as follows:
| | | | | | | | | | | | | | | | |
| | | Franklin Arizona Tax-Free Income Fund | | | Franklin Colorado
Tax-Free Income Fund | | | Franklin
Connecticut
Tax-Free Income Fund | | | Franklin Michigan
Tax-Free Income Fund | |
Cost of investments | | | $906,902,549 | | | | $680,308,529 | | | | $244,176,697 | | | | $957,433,158 | |
| | | | |
| | | | |
Unrealized appreciation | | | $ 35,547,999 | | | | $ 29,694,554 | | | | $ 8,507,240 | | | | $ 27,219,215 | |
Unrealized depreciation | | | (4,755,094 | ) | | | (11,031,537 | ) | | | (1,965,749 | ) | | | (3,886,361 | ) |
| | | | |
Net unrealized appreciation (depreciation) | | | $ 30,792,905 | | | | $ 18,663,017 | | | | $ 6,541,491 | | | | $ 23,332,854 | |
| | | | |
| | | | |
Undistributed tax exempt income | | | $ 1,619,544 | | | | $ 1,518,045 | | | | $ 801,367 | | | | $ 2,237,672 | |
Undistributed ordinary income | | | — | | | | — | | | | — | | | | 122,929 | |
| | | | |
Distributable earnings | | | $ 1,619,544 | | | | $ 1,518,045 | | | | $ 801,367 | | | | $ 2,360,601 | |
| | | | |
| | | | |
| | | Franklin
Minnesota
Tax-Free Income Fund | | | Franklin Ohio Tax-Free Income Fund | | | Franklin Oregon
Tax-Free Income Fund | | | Franklin
Pennsylvania
Tax-Free Income Fund | |
Cost of investments | | | $1,001,039,517 | | | | $1,531,490,631 | | | | $1,168,327,828 | | | | $1,149,835,244 | |
| | | | |
| | | | |
Unrealized appreciation | | | $ 28,860,616 | | | | $ 54,086,729 | | | | $ 47,287,238 | | | | $ 52,988,080 | |
Unrealized depreciation | | | (7,996,508 | ) | | | (8,647,185 | ) | | | (9,595,983 | ) | | | (23,889,247 | ) |
| | | | |
Net unrealized appreciation (depreciation) | | | $ 20,864,108 | | | | $ 45,439,544 | | | | $ 37,691,255 | | | | $ 29,098,833 | |
| | | | |
| | | | |
Distributable earnings - undistributed tax exempt income | | | $ 685,032 | | | | $ 1,297,862 | | | | $ 1,492,048 | | | | $ 3,234,188 | |
| | | | |
Differences between income and/or capital gains as determined on a book basis and a tax basis are primarily due to differing treatments of bond discounts, bond workout expenditures and wash sales.
On December 22, 2017, the Tax Cuts and Jobs Act (the “Act”) was signed into law. Certain provisions of the Act were effective upon enactment with the remainder becoming effective for tax years beginning after December 31, 2017. Management has reviewed the requirements and believes the adoption of these provisions of the Act will not have a material impact on the financial statements.
6. Investment Transactions
Purchases and sales of investments (excluding short term securities) for the year ended February 28, 2018, were as follows:
| | | | | | | | | | | | | | | | |
| | | Franklin
Arizona
Tax-Free
Income Fund | | | Franklin
Colorado
Tax-Free
Income Fund | | | Franklin
Connecticut
Tax-Free
Income Fund | | | Franklin
Michigan
Tax-Free
Income Fund | |
Purchases | | | $167,131,829 | | | | $120,706,133 | | | | $12,026,263 | | | | $129,992,925 | |
Sales | | | $169,609,713 | | | | $129,123,207 | | | | $60,085,719 | | | | $163,210,464 | |
| | | | | | |
160 | | Annual Report | | | | franklintempleton.com |
FRANKLIN TAX-FREE TRUST
NOTES TO FINANCIAL STATEMENTS
| | | | | | | | | | | | | | | | |
| | | Franklin
Minnesota
Tax-Free
Income Fund | | | Franklin
Ohio
Tax-Free
Income Fund | | | Franklin
Oregon
Tax-Free
Income Fund | | | Franklin
Pennsylvania
Tax-Free
Income Fund | |
Purchases | | | $146,045,478 | | | | $244,785,346 | | | | $155,020,683 | | | | $166,518,342 | |
Sales | | | $189,995,390 | | | | $247,034,543 | | | | $159,359,164 | | | | $241,031,540 | |
7. Defaulted Securities
Certain or all Funds held defaulted securities and/or other securities for which the income has been deemed uncollectible. The Funds discontinue accruing income on securities for which income has been deemed uncollectible and provide an estimate for losses on interest receivable. The securities have been identified in the accompanying Statements of Investments. At February 28, 2018, the aggregate value of these securities was as follows:
| | | | | | | | |
| | | Value | | | Percentage of
Net Assets | |
Franklin Colorado Tax-Free Income Fund | | | $4,293,012 | | | | 0.6% | |
Franklin Oregon Tax-Free Income Fund | | | 3,645,862 | | | | 0.3% | |
Franklin Pennsylvania Tax-Free Income Fund | | | 9,827,650 | | | | 0.8% | |
8. Concentration of Risk
Certain or all Funds invest a large percentage of their total assets in obligations of issuers within their respective state and U.S. territories. Such concentration may subject the Funds to risks associated with industrial or regional matters, and economic, political or legal developments occurring within those states and U.S. territories. Investing in Puerto Rico securities may expose the Funds to heightened risks due to recent adverse economic and market changes, credit downgrades and ongoing restructuring discussions. In addition, investments in these securities are sensitive to interest rate changes and credit risk of the issuer and may subject the Funds to increased market volatility. The market for these investments may be limited, which may make them difficult to buy or sell.
9. Credit Facility
The Funds, together with other U.S. registered and foreign investment funds (collectively, Borrowers), managed by Franklin Templeton Investments, are borrowers in a joint syndicated senior unsecured credit facility totaling $2 billion (Global Credit Facility) which matures on February 8, 2019. This Global Credit Facility provides a source of funds to the Borrowers for temporary and emergency purposes, including the ability to meet future unanticipated or unusually large redemption requests.
Under the terms of the Global Credit Facility, the Funds shall, in addition to interest charged on any borrowings made by the Funds and other costs incurred by the Funds, pay their share of fees and expenses incurred in connection with the implementation and maintenance of the Global Credit Facility, based upon their relative share of the aggregate net assets of all of the Borrowers, including an annual commitment fee of 0.15% based upon the unused portion of the Global Credit Facility. These fees are reflected in other expenses in the Statements of Operations. During the year ended February 28, 2018, the Funds did not use the Global Credit Facility.
| | | | | | | | |
franklintempleton.com | | | | | | Annual Report | | 161 |
FRANKLIN TAX-FREE TRUST
NOTES TO FINANCIAL STATEMENTS
10. Fair Value Measurements
The Funds follow a fair value hierarchy that distinguishes between market data obtained from independent sources (observable inputs) and the Funds’ own market assumptions (unobservable inputs). These inputs are used in determining the value of the Funds’ financial instruments and are summarized in the following fair value hierarchy:
| | • | | Level 1 – quoted prices in active markets for identical financial instruments |
| | • | | Level 2 – other significant observable inputs (including quoted prices for similar financial instruments, interest rates, prepayment speed, credit risk, etc.) |
| | • | | Level 3 – significant unobservable inputs (including the Funds’ own assumptions in determining the fair value of financial instruments) |
The input levels are not necessarily an indication of the risk or liquidity associated with financial instruments at that level.
For movements between the levels within the fair value hierarchy, the Funds have adopted a policy of recognizing the transfers as of the date of the underlying event which caused the movement.
At February 28, 2018, all of the Funds’ investments in financial instruments carried at fair value were valued using Level 2 inputs.
11. Subsequent Events
The Funds have evaluated subsequent events through the issuance of the financial statements and determined that no events have occurred that require disclosure.
Abbreviations
Selected Portfolio
| | |
AGMC | | Assured Guaranty Municipal Corp. |
AMBAC | | American Municipal Bond Assurance Corp. |
BAM | | Build America Mutual Assurance Co. |
BHAC | | Berkshire Hathaway Assurance Corp. |
CDA | | Community Development Authority/Agency |
COP | | Certificate of Participation |
CSD | | Central School District |
EDR | | Economic Development Revenue |
ETM | | Escrow to Maturity |
FHA | | Federal Housing Authority/Agency |
GNMA | | Government National Mortgage Association |
GO | | General Obligation |
HDA | | Housing Development Authority/Agency |
HDC | | Housing Development Corp. |
HFA | | Housing Finance Authority/Agency |
HFAR | | Housing Finance Authority Revenue |
ID | | Improvement District |
IDA | | Industrial Development Authority/Agency |
| | |
IDAR | | Industrial Development Authority Revenue |
IDR | | Industrial Development Revenue |
ISD | | Independent School District |
LOC | | Letter of Credit |
MAC | | Municipal Assurance Corp. |
MBS | | Mortgage-Backed Security |
MFHR | | Multi-Family Housing Revenue |
MUNIPSA | | SIFMA Municipal Swap Index |
NATL | | National Public Financial Guarantee Corp. |
PCC | | Pollution Control Corp. |
PCR | | Pollution Control Revenue |
RDA | | Redevelopment Agency/Authority |
SFM | | Single Family Mortgage |
SFMR | | Single Family Mortgage Revenue |
SPA | | Standby Purchase Agreement |
USD | | Unified/Union School District |
XLCA | | XL Capital Assurance |
| | | | | | |
162 | | Annual Report | | | | franklintempleton.com |
Report of Independent Registered Public Accounting Firm
To the Board of Trustees of Franklin Tax-Free Trust and Shareholders of Franklin Arizona Tax-Free Income Fund, Franklin Colorado Tax-Free Income Fund, Franklin Connecticut Tax-Free Income Fund, Franklin Michigan Tax-Free Income Fund, Franklin Minnesota Tax-Free Income Fund, Franklin Ohio Tax-Free Income Fund, Franklin Oregon Tax-Free Income Fund, and Franklin Pennsylvania Tax-Free Income Fund
Opinions on the Financial Statements
We have audited the accompanying statements of assets and liabilities, including the statements of investments, of Franklin Arizona Tax-Free Income Fund, Franklin Colorado Tax-Free Income Fund, Franklin Connecticut Tax-Free Income Fund, Franklin Michigan Tax-Free Income Fund, Franklin Minnesota Tax-Free Income Fund, Franklin Ohio Tax-Free Income Fund, Franklin Oregon Tax-Free Income Fund, and Franklin Pennsylvania Tax-Free Income Fund (the “Funds”) as of February 28, 2018, the related statements of operations for the year ended February 28, 2018, the statements of changes in net assets for each of the two years in the period ended February 28, 2018, including the related notes, and the financial highlights for each of the periods indicated therein (collectively referred to as the “financial statements”). In our opinion, the financial statements present fairly, in all material respects, the financial position of each of the Funds as of February 28, 2018, the results of each of their operations for the year then ended, the changes in each of their net assets for each of the two years in the period ended February 28, 2018, and each of the financial highlights for each of the periods indicated therein, in conformity with accounting principles generally accepted in the United States of America.
Basis for Opinions
These financial statements are the responsibility of the Funds’ management. Our responsibility is to express an opinion on the Funds’ financial statements based on our audits. We are a public accounting firm registered with the Public Company Accounting Oversight Board (United States) (“PCAOB”) and are required to be independent with respect to the Funds in accordance with the U.S. federal securities laws and the applicable rules and regulations of the Securities and Exchange Commission and the PCAOB.
We conducted our audits of these financial statements in accordance with the standards of the PCAOB. Those standards require that we plan and perform the audit to obtain reasonable assurance about whether the financial statements are free of material misstatement, whether due to error or fraud.
Our audits included performing procedures to assess the risks of material misstatement of the financial statements, whether due to error or fraud, and performing procedures that respond to those risks. Such procedures included examining, on a test basis, evidence regarding the amounts and disclosures in the financial statements. Our audits also included evaluating the accounting principles used and significant estimates made by management, as well as evaluating the overall presentation of the financial statements. Our procedures included confirmation of securities owned as of February 28, 2018 by correspondence with the custodian and brokers; when replies were not received from brokers, we performed other auditing procedures. We believe that our audits provide a reasonable basis for our opinions.
PricewaterhouseCoopers LLP
San Francisco, California
April 17, 2018
We have served as the auditor of one or more investment companies in the Franklin Templeton Group of Funds since 1948.
| | | | |
franklintempleton.com | | Annual Report | | 163 |
FRANKLIN TAX-FREE TRUST
Tax Information (unaudited)
Under Section 852(b)(5)(A) of the Internal Revenue Code, the Funds hereby report 100% of the distributions paid from net investment income as exempt-interest dividends for the fiscal year ended February 28, 2018. A portion of the Funds’ exempt-interest dividends may be subject to the federal alternative minimum tax. By mid-February 2019, shareholders will be notified of amounts for use in preparing their 2018 income tax returns.
| | | | | | |
164 | | Annual Report | | | | franklintempleton.com |
FRANKLIN TAX-FREE TRUST
Special Meeting of Shareholders
MEETING OF SHAREHOLDERS: OCTOBER 30, 2017 AND RECONVENED ON DECEMBER 15, 2017 AND DECEMBER 29, 2017
(UNAUDITED)
A Special Meeting of Shareholders of Franklin Tax-Free Trust was held at the offices of Franklin Templeton Investments, One Franklin Parkway, San Mateo, California on October 30, 2017 and reconvened on December 15, 2017 and December 29, 2017. The purpose of the meeting was to elect Trustees of Franklin Tax-Free Trust and to vote on the following proposals for each Fund: to approve the use of a “manager of managers” structure whereby the Fund’s investment manager would be able to hire and replace subadvisers without shareholder approval; and to approve an amended fundamental investment restriction regarding investments in commodities. At the meeting, (i) the following persons were elected by the shareholders to serve as Trustees of Franklin Tax-Free Trust: Harris J. Ashton, Terrence J. Checki, Mary C. Choksi, Edith E. Holiday, Gregory E. Johnson, Rupert H. Johnson, Jr., J. Michael Luttig, Larry D. Thompson, and John B. Wilson; (ii) the proposal to use a “manager of managers” structure was approved by shareholders of each Fund, except for Franklin Michigan Tax-Free Income Fund, Franklin Ohio Tax-Free Income Fund and Franklin Pennsylvania Tax-Free Income Fund; and (iii) the proposal to approve the amended fundamental investment restriction regarding investments in commodities was approved by shareholders of each Fund, except for Franklin Ohio Tax-Free Income Fund. No other business was transacted at the meeting.
In connection with the meeting, management is aware that some shareholders received from the proxy solicitor numerous calls and mailings that may have been distracting. Management is taking steps to ensure that, in the future, for any new shareholder meeting solicitations that occur, such activity is not repeated. Management apologizes for any inconvenience that may have been caused as a result of such calls and mailings.
The results of the voting at the meeting are as follows:
Proposal 1. To elect a Board of Trustees:
| | | | | | | | |
| Name | | For | | | Withheld | |
| | |
Harris J. Ashton | | | 1,485,764,192 | | | | 48,269,290 | |
Terrence J. Checki | | | 1,485,932,300 | | | | 48,101,184 | |
Mary C. Choksi | | | 1,486,925,610 | | | | 47,110,941 | |
Edith E. Holiday | | | 1,487,685,965 | | | | 46,349,353 | |
Gregory E. Johnson | | | 1,487,506,272 | | | | 46,527,212 | |
Rupert H. Johnson, Jr. | | | 1,486,183,613 | | | | 47,849,870 | |
J. Michael Luttig | | | 1,487,803,427 | | | | 46,228,223 | |
Larry D. Thompson | | | 1,486,866,073 | | | | 47,167,412 | |
John B. Wilson | | | 1,488,071,744 | | | | 45,961,741 | |
Total Trust Shares Outstanding*: 2,524,132,627
* As of the record date.
| | | | |
franklintempleton.com | | Annual Report | | 165 |
FRANKLIN TAX-FREE TRUST
SPECIAL MEETING OF SHAREHOLDERS
| Proposal 2. | To approve the use of a “manager of managers” structure whereby the Fund’s investment manager would be able to hire and replace subadvisers without shareholder approval: |
Franklin Arizona Tax-Free Income Fund
| | | | |
| | | | Shares | |
| |
For | | | 36,288,407 | |
Against | | | 4,391,906 | |
Abstain | | | 2,770,577 | |
Broker Non-Votes | | | 7,926,836 | |
Total Fund Shares Voted | | | 51,377,724 | |
Total Fund Shares Outstanding* | | | 91,045,520 | |
Franklin Colorado Tax-Free Income Fund
| | | | |
| | | | Shares | |
| |
For | | | 22,718,989 | |
Against | | | 2,445,297 | |
Abstain | | | 1,832,571 | |
Broker Non-Votes | | | 6,077,390 | |
Total Fund Shares Voted | | | 33,074,248 | |
Total Fund Shares Outstanding* | | | 64,406,684 | |
Franklin Connecticut Tax-Free Income Fund
| | | | |
| | | | Shares | |
| |
For | | | 12,020,104 | |
Against | | | 1,238,548 | |
Abstain | | | 697,040 | |
Broker Non-Votes | | | 3,844,320 | |
Total Fund Shares Voted | | | 17,800,011 | |
Total Fund Shares Outstanding* | | | 28,114,907 | |
Franklin Michigan Tax-Free Income Fund
| | | | |
| | | | Shares | |
| |
For | | | 35,809,478 | |
Against | | | 4,175,361 | |
Abstain | | | 3,271,519 | |
Broker Non-Votes | | | 11,165,517 | |
Total Fund Shares Voted | | | 54,421,874 | |
Total Fund Shares Outstanding* | | | 90,807,551 | |
Franklin Minnesota Tax-Free Income Fund
| | | | |
| | | | Shares | |
| |
For | | | 38,210,708 | |
Against | | | 2,761,831 | |
Abstain | | | 2,681,162 | |
Broker Non-Votes | | | 11,245,552 | |
Total Fund Shares Voted | | | 54,899,257 | |
Total Fund Shares Outstanding* | | | 86,891,312 | |
| | | | | | |
166 | | Annual Report | | | | franklintempleton.com |
FRANKLIN TAX-FREE TRUST
SPECIAL MEETING OF SHAREHOLDERS
Franklin Ohio Tax-Free Income Fund
| | | | |
| | | | Shares | |
| |
For | | | 52,519,349 | |
Against | | | 4,486,446 | |
Abstain | | | 3,959,671 | |
Broker Non-Votes | | | 23,989,237 | |
Total Fund Shares Voted | | | 84,954,698 | |
Total Fund Shares Outstanding* | | | 126,234,213 | |
Franklin Oregon Tax-Free Income Fund
| | | | |
| | | | Shares | |
| |
For | | | 44,422,929 | |
Against | | | 3,601,294 | |
Abstain | | | 4,175,367 | |
Broker Non-Votes | | | 12,468,574 | |
Total Fund Shares Voted | | | 64,668,161 | |
Total Fund Shares Outstanding* | | | 109,514,043 | |
Franklin Pennsylvania Tax-Free Income Fund
| | | | |
| | | | Shares | |
| |
For | | | 55,652,812 | |
Against | | | 6,571,988 | |
Abstain | | | 3,396,845 | |
Broker Non-Votes | | | 17,790,338 | |
Total Fund Shares Voted | | | 83,411,987 | |
Total Fund Shares Outstanding* | | | 127,042,358 | |
| Proposal 3. | To approve an amended fundamental investment restriction regarding investments in commodities: |
Franklin Arizona Tax-Free Income Fund
| | | | |
| | | | Shares | |
| |
For | | | 35,996,698 | |
Against | | | 3,875,968 | |
Abstain | | | 3,578,222 | |
Broker Non-Votes | | | 7,926,836 | |
Total Fund Shares Voted | | | 51,377,724 | |
Total Fund Shares Outstanding* | | | 91,045,520 | |
Franklin Colorado Tax-Free Income Fund
| | | | |
| | | | Shares | |
| |
For | | | 22,636,795 | |
Against | | | 2,155,730 | |
Abstain | | | 2,204,334 | |
Broker Non-Votes | | | 6,077,390 | |
Total Fund Shares Voted | | | 33,074,248 | |
Total Fund Shares Outstanding* | | | 64,406,684 | |
| | | | | | | | |
franklintempleton.com | | | | | | Annual Report | | 167 |
FRANKLIN TAX-FREE TRUST
SPECIAL MEETING OF SHAREHOLDERS
Franklin Connecticut Tax-Free Income Fund
| | | | |
| | | | Shares | |
| |
For | | | 12,552,020 | |
Against | | | 520,117 | |
Abstain | | | 883,554 | |
Broker Non-Votes | | | 3,844,320 | |
Total Fund Shares Voted | | | 17,800,011 | |
Total Fund Shares Outstanding* | | | 28,114,907 | |
Franklin Michigan Tax-Free Income Fund
| | | | |
| | | | Shares | |
| |
For | | | 36,645,710 | |
Against | | | 2,890,999 | |
Abstain | | | 3,719,648 | |
Broker Non-Votes | | | 11,165,517 | |
Total Fund Shares Voted | | | 54,421,874 | |
Total Fund Shares Outstanding* | | | 90,807,551 | |
Franklin Minnesota Tax-Free Income Fund
| | | | |
| | | | Shares | |
| |
For | | | 38,152,336 | |
Against | | | 2,034,191 | |
Abstain | | | 3,467,177 | |
Broker Non-Votes | | | 11,245,552 | |
Total Fund Shares Voted | | | 54,899,257 | |
Total Fund Shares Outstanding* | | | 86,891,312 | |
Franklin Ohio Tax-Free Income Fund
| | | | |
| | | | Shares | |
| |
For | | | 52,984,998 | |
Against | | | 3,230,365 | |
Abstain | | | 4,750,098 | |
Broker Non-Votes | | | 23,989,237 | |
Total Fund Shares Voted | | | 84,954,698 | |
Total Fund Shares Outstanding* | | | 126,234,213 | |
Franklin Oregon Tax-Free Income Fund
| | | | |
| | | | Shares | |
| |
For | | | 43,969,456 | |
Against | | | 3,121,678 | |
Abstain | | | 5,108,452 | |
Broker Non-Votes | | | 12,468,574 | |
Total Fund Shares Voted | | | 64,668,161 | |
Total Fund Shares Outstanding* | | | 109,514,043 | |
| | | | | | |
168 | | Annual Report | | | | franklintempleton.com |
FRANKLIN TAX-FREE TRUST
SPECIAL MEETING OF SHAREHOLDERS
Franklin Pennsylvania Tax-Free Income Fund
| | | | |
| | | | Shares | |
| |
For | | | 56,932,528 | |
Against | | | 4,263,250 | |
Abstain | | | 4,425,871 | |
Broker Non-Votes | | | 17,790,338 | |
Total Fund Shares Voted | | | 83,411,987 | |
Total Fund Shares Outstanding* | | | 127,042,358 | |
| | | | | | | | |
franklintempleton.com | | | | | | Annual Report | | 169 |
FRANKLIN TAX-FREE TRUST
Board Members and Officers
The name, year of birth and address of the officers and board members, as well as their affiliations, positions held with the Trust, principal occupations during at least the past five years and number of US registered portfolios overseen in the Franklin Templeton Investments fund complex, are shown below. Generally, each board member serves until that person’s successor is elected and qualified.
Independent Board Members
| | | | | | | | |
Name, Year of Birth
and Address | | Position | | Length of
Time Served | | Number of Portfolios in
Fund Complex Overseen
by Board Member* | | Other Directorships Held
During at Least the Past 5 Years |
Harris J. Ashton (1932) One Franklin Parkway San Mateo, CA 94403-1906 | | Trustee | | Since 1984 | | 139 | | Bar-S Foods (meat packing company) (1981-2010). |
| | |
| Principal Occupation During at Least the Past 5 Years: | | | | |
| Director of various companies; and formerly, Director, RBC Holdings, Inc. (bank holding company) (until 2002); and President, Chief Executive Officer and Chairman of the Board, General Host Corporation (nursery and craft centers) (until 1998). |
| | | | | | | | | |
| | | | |
Terrence J. Checki (1945) One Franklin Parkway San Mateo, CA 94403-1906 | | Trustee | | Since December
2017 | | 113 | | Hess Corporation (exploration of oil and gas) (2014-present). |
| | |
| Principal Occupation During at Least the Past 5 Years: | | | | |
| Member of the Council on Foreign Relations (1996-present); Member of the National Committee on U.S.-China Relations (1999-present); member of the Board of Trustees of the Economic Club of New York (2013-present); member of the Board of Trustees of the Foreign Policy Association (2005-present) and member of various other boards of trustees and advisory boards; and formerly, Executive Vice President of the Federal Reserve Bank of New York and Head of its Emerging Markets and Internal Affairs Group and Member of Management Committee (1995-2014); and Visiting Fellow at the Council on Foreign Relations (2014). |
| | | | | | | | | |
| | | | |
Mary C. Choksi (1950) One Franklin Parkway San Mateo, CA 94403-1906 | | Trustee | | Since 2014 | | 139 | | Avis Budget Group Inc. (car rental) (2007-present), Omnicom Group Inc. (advertising and marketing communications services) (2011-present) and White Mountains Insurance Group, Ltd. (holding company) (2017-present). |
| | |
| Principal Occupation During at Least the Past 5 Years: | | | | |
| Director of various companies; and formerly, Founder and Senior Advisor, Strategic Investment Group (investment management group) (2015-2017); Founding Partner and Senior Managing Director, Strategic Investment Group (1987–2015); Founding Partner and Managing Director, Emerging Markets Management LLC (investment management firm) (1987-2011); and Loan Officer/Senior Loan Officer/Senior Pension Investment Officer, World Bank Group (international financial institution) (1977-1987). |
| | | | | | | | | |
| | | | |
Edith E. Holiday (1952) One Franklin Parkway San Mateo, CA 94403-1906 | | Trustee | | Since 1998 | | 139 | | Hess Corporation (exploration of oil and gas) (1993-present), Canadian National Railway (railroad) (2001-present), White Mountains Insurance Group, Ltd. (holding company) (2004-present), Santander Consumer USA Holdings, Inc. (consumer finance) (2016-present), RTI International Metals, Inc. (manufacture and distribution of titanium) (1999-2015) and H.J. Heinz Company (processed foods and allied products) (1994-2013). |
| | |
| Principal Occupation During at Least the Past 5 Years: | | | | |
| Director or Trustee of various companies and trusts; and formerly, Assistant to the President of the United States and Secretary of the Cabinet (1990-1993); General Counsel to the United States Treasury Department (1989-1990); and Counselor to the Secretary and Assistant Secretary for Public Affairs and Public Liaison – United States Treasury Department (1988-1989). |
| | | | | | | | | |
| | | | |
J. Michael Luttig (1954) One Franklin Parkway San Mateo, CA 94403-1906 | | Trustee | | Since 2009 | | 139 | | Boeing Capital Corporation (aircraft financing) (2006-2013). |
| | |
| Principal Occupation During at Least the Past 5 Years: | | | | |
| Executive Vice President, General Counsel and member of the Executive Council, The Boeing Company (aerospace company) (2006-present); and formerly, Federal Appeals Court Judge, U.S. Court of Appeals for the Fourth Circuit (1991-2006). |
| | | | | | | | | |
| | | | | | |
170 | | Annual Report | | | | franklintempleton.com |
FRANKLIN TAX-FREE TRUST
Independent Board Members (continued)
| | | | | | | | |
Name, Year of Birth
and Address | | Position | | Length of
Time Served | | Number of Portfolios in
Fund Complex Overseen
by Board Member* | | Other Directorships Held
During at Least the Past 5 Years |
| | | | |
Larry D. Thompson (1945) One Franklin Parkway San Mateo, CA 94403-1906 | | Trustee | | Since 2007 | | 139 | | The Southern Company (energy company) (2014-present; previously 2010-2012), Graham Holdings Company (education and media organization) (2011-present) and Cbeyond, Inc. (business communications provider) (2010-2012). |
| | |
| Principal Occupation During at Least the Past 5 Years: | | | | |
| Director of various companies; Counsel, Finch McCranie, LLP (law firm) (2015-present); Independent Compliance Monitor and Auditor, Volkswagen AG (manufacturer of automobiles and commercial vehicles) (2017 – present); John A. Sibley Professor of Corporate and Business Law, University of Georgia School of Law (2015-present; previously 2011-2012); and formerly, Executive Vice President - Government Affairs, General Counsel and Corporate Secretary, PepsiCo, Inc. (consumer products) (2012-2014); Senior Vice President - Government Affairs, General Counsel and Secretary, PepsiCo, Inc. (2004-2011); Senior Fellow of The Brookings Institution (2003-2004); Visiting Professor, University of Georgia School of Law (2004); and Deputy Attorney General, U.S. Department of Justice (2001-2003). |
| | | | | | | | | |
| | | | |
John B. Wilson (1959) One Franklin Parkway San Mateo, CA 94403-1906 | | Lead Independent Trustee | | Trustee
since 2007
and Lead
Independent
Trustee
since 2008 | | 113 | | None |
| | |
| Principal Occupation During at Least the Past 5 Years: | | | | |
| President and Founder, Hyannis Port Capital, Inc. (real estate and private equity investing) (2002-present); Senior Advisor, McKinsey & Co. (consulting) (2017-present); serves on private and non-profit boards; and formerly, President, Staples International and Head of Global Transformation (office supplies) (2012-2016); Chief Operating Officer and Executive Vice President, Gap, Inc. (retail) (1996-2000); Chief Financial Officer and Executive Vice President – Finance and Strategy, Staples, Inc. (1992-1996); Senior Vice President – Corporate Planning, Northwest Airlines, Inc. (airlines) (1990-1992); and Vice President and Partner, Bain & Company (consulting firm) (1986-1990). |
| | | | | | | | | |
Interested Board Members and Officers
| | | | | | | | |
Name, Year of Birth
and Address | | Position | | Length of
Time Served | | Number of Portfolios in
Fund Complex Overseen
by Board Member* | | Other Directorships Held
During at Least the Past 5 Years |
| | | | |
**Gregory E. Johnson (1961) One Franklin Parkway San Mateo, CA 94403-1906 | | Trustee | | Since 2007 | | 153 | | None |
| | |
| Principal Occupation During at Least the Past 5 Years: | | | | |
| Chairman of the Board, Member - Office of the Chairman, Director and Chief Executive Officer, Franklin Resources, Inc.; officer and/or director or trustee, as the case may be, of some of the other subsidiaries of Franklin Resources, Inc. and of 43 of the investment companies in Franklin Templeton Investments; Vice Chairman, Investment Company Institute; and formerly, President, Franklin Resources, Inc. (1994-2015). |
| | | | | | | | | |
| | | | |
**Rupert H. Johnson, Jr. (1940) One Franklin Parkway San Mateo, CA 94403-1906 | | Chairman of the Board and Trustee | | Since 2013 | | 139 | | None |
| | |
| Principal Occupation During at Least the Past 5 Years: | | | | |
| Vice Chairman, Member – Office of the Chairman and Director, Franklin Resources, Inc.; Director, Franklin Advisers, Inc.; Senior Vice President, Franklin Advisory Services, LLC; and officer and/or director or trustee, as the case may be, of some of the other subsidiaries of Franklin Resources, Inc. and of 41 of the investment companies in Franklin Templeton Investments. |
| | | | | | | | | |
| | | | |
Sheila Amoroso (1959) One Franklin Parkway
San Mateo, CA 94403-1906 | | Vice President | | Since 1999 | | Not Applicable | | Not Applicable |
| | |
| Principal Occupation During at Least the Past 5 Years: | | | | |
| Senior Vice President, Franklin Advisers, Inc.; and officer of seven of the investment companies in Franklin Templeton Investments. |
| | | | | | | | | |
| | | | | | | | |
franklintempleton.com | | | | | | Annual Report | | 171 |
FRANKLIN TAX-FREE TRUST
Interested Board Members and Officers (continued)
| | | | | | | | |
Name, Year of Birth
and Address | | Position | | Length of
Time Served | | Number of Portfolios in
Fund Complex Overseen
by Board Member* | | Other Directorships Held
During at Least the Past 5 Years |
| | | | |
Alison E. Baur (1964) One Franklin Parkway San Mateo, CA 94403-1906 | | Vice President | | Since 2012 | | Not Applicable | | Not Applicable |
| | |
| Principal Occupation During at Least the Past 5 Years: | | | | |
| Deputy General Counsel, Franklin Templeton Investments; and officer of some of the other subsidiaries of Franklin Resources, Inc. and of 45 of the investment companies in Franklin Templeton Investments. |
| | | | | | | | | |
| | | | |
Rafael R. Costas, Jr. (1965) One Franklin Parkway San Mateo, CA 94403-1906 | | Vice President | | Since 1999 | | Not Applicable | | Not Applicable |
| | |
| Principal Occupation During at Least the Past 5 Years: | | | | |
| Senior Vice President, Franklin Advisers, Inc.; and officer of seven of the investment companies in Franklin Templeton Investments. |
| | | | | | | | | |
| | | | |
Gaston Gardey (1967) One Franklin Parkway San Mateo, CA 94403-1906 | | Chief Financial Officer, Chief Accounting Officer and Treasurer | | Since 2009 | | Not Applicable | | Not Applicable |
| | |
| Principal Occupation During at Least the Past 5 Years: | | | | |
| Treasurer, U.S. Fund Administration & Reporting, Franklin Templeton Investments; and officer of 28 of the investment companies in Franklin Templeton Investments. |
| | | | | | | | | |
| | | | |
Aliya S. Gordon (1973) One Franklin Parkway San Mateo, CA 94403-1906 | | Vice President | | Since 2009 | | Not Applicable | | Not Applicable |
| | |
| Principal Occupation During at Least the Past 5 Years: | | | | |
| Senior Associate General Counsel, Franklin Templeton Investments; and officer of 45 of the investment companies in Franklin Templeton Investments. |
| | | | | | | | | |
| | | | |
Steven J. Gray (1955) One Franklin Parkway San Mateo, CA 94403-1906 | | Vice President | | Since 2009 | | Not Applicable | | Not Applicable |
| | |
| Principal Occupation During at Least the Past 5 Years: | | | | |
| Senior Associate General Counsel, Franklin Templeton Investments; Vice President, Franklin Templeton Distributors, Inc. and FASA, LLC; and officer of 45 of the investment companies in Franklin Templeton Investments. |
| | | | | | | | | |
| | | | |
Matthew T. Hinkle (1971) One Franklin Parkway San Mateo, CA 94403-1906 | | Chief Executive Officer – Finance and Administration | | Since June
2017 | | Not Applicable | | Not Applicable |
| | |
| Principal Occupation During at Least the Past 5 Years: | | | | |
| Senior Vice President, Franklin Templeton Services, LLC; officer of 45 of the investment companies in Franklin Templeton Investments; and formerly, Vice President, Global Tax (2012-April 2017) and Treasurer/Assistant Treasurer, Franklin Templeton Investments (2009-2017). |
| | | | | | | | | |
| | | | |
Robert Lim (1948) One Franklin Parkway San Mateo, CA 94403-1906 | | Vice President - AML Compliance | | Since 2016 | | Not Applicable | | Not Applicable |
| | |
| Principal Occupation During at Least the Past 5 Years: | | | | |
| Vice President, Franklin Templeton Companies, LLC; Chief Compliance Officer, Franklin Templeton Distributors, Inc. and Franklin Templeton Investor Services, LLC; and officer of 45 of the investment companies in Franklin Templeton Investments. |
| | | | | | | | | |
| | | | | | |
172 | | Annual Report | | | | franklintempleton.com |
FRANKLIN TAX-FREE TRUST
Interested Board Members and Officers (continued)
| | | | | | | | |
Name, Year of Birth
and Address | | Position | | Length of
Time Served | | Number of Portfolios in
Fund Complex Overseen
by Board Member* | | Other Directorships Held
During at Least the Past 5 Years |
| | | | |
Christopher J. Molumphy (1962) One Franklin Parkway San Mateo, CA 94403-1906 | | President and Chief Executive Officer – Investment Management | | Since 2010 | | Not Applicable | | Not Applicable |
| | |
| Principal Occupation During at Least the Past 5 Years: | | | | |
| Director and Executive Vice President, Franklin Advisers, Inc.; Executive Vice President, Franklin Templeton Institutional, LLC; and officer of some of the other subsidiaries of Franklin Resources, Inc. and of 21 of the investment companies in Franklin Templeton Investments. |
| | | | | | | | | |
| | | | |
Kimberly H. Novotny (1972) 300 S.E. 2nd Street Fort Lauderdale, FL 33301-1923 | | Vice President | | Since 2013 | | Not Applicable | | Not Applicable |
| | |
| Principal Occupation During at Least the Past 5 Years: | | | | |
| Associate General Counsel, Franklin Templeton Investments; Vice President and Corporate Secretary, Fiduciary Trust International of the South; Vice President, Templeton Investment Counsel, LLC; Assistant Secretary, Franklin Resources, Inc.; and officer of 45 of the investment companies in Franklin Templeton Investments. |
| | | | | | | | | |
| | | | |
Robert C. Rosselot (1960) 300 S.E. 2nd Street Fort Lauderdale, FL 33301-1923 | | Chief Compliance Officer | | Since 2013 | | Not Applicable | | Not Applicable |
| | |
| Principal Occupation During at Least the Past 5 Years: | | | | |
| Director, Global Compliance, Franklin Templeton Investments; Vice President, Franklin Templeton Companies, LLC; officer of 45 of the investment companies in Franklin Templeton Investments; and formerly, Senior Associate General Counsel, Franklin Templeton Investments (2007-2013); and Secretary and Vice President, Templeton Group of Funds (2004-2013). |
| | | | | | | | | |
| | | | |
Karen L. Skidmore (1952) One Franklin Parkway San Mateo, CA 94403-1906 | | Vice President and Secretary | | Since 2006 | | Not Applicable | | Not Applicable |
| | |
| Principal Occupation During at Least the Past 5 Years: | | | | |
| Senior Associate General Counsel, Franklin Templeton Investments; and officer of 45 of the investment companies in Franklin Templeton Investments. |
| | | | | | | | | |
| | | | |
Navid J. Tofigh (1972) One Franklin Parkway San Mateo, CA 94403-1906 | | Vice President | | Since 2015 | | Not Applicable | | Not Applicable |
| | |
| Principal Occupation During at Least the Past 5 Years: | | | | |
| Associate General Counsel, Franklin Templeton Investments; and officer of 45 of the investment companies in Franklin Templeton Investments. |
| | | | | | | | | |
| | | | |
Craig S. Tyle (1960) One Franklin Parkway San Mateo, CA 94403-1906 | | Vice President | | Since 2005 | | Not Applicable | | Not Applicable |
| | |
| Principal Occupation During at Least the Past 5 Years: | | | | |
| General Counsel and Executive Vice President, Franklin Resources, Inc.; and officer of some of the other subsidiaries of Franklin Resources, Inc. and of 45 of the investment companies in Franklin Templeton Investments. |
| | | | | | | | | |
| | | | |
Thomas Walsh (1961) One Franklin Parkway San Mateo, CA 94403-1906 | | Vice President | | Since 1999 | | Not Applicable | | Not Applicable |
| | |
| Principal Occupation During at Least the Past 5 Years: | | | | |
| Senior Vice President, Franklin Advisers, Inc.; and officer of seven of the investment companies in Franklin Templeton Investments. |
| | | | | | | | | |
| | | | | | | | |
franklintempleton.com | | | | | | Annual Report | | 173 |
FRANKLIN TAX-FREE TRUST
Interested Board Members and Officers (continued)
| | | | | | | | |
Name, Year of Birth
and Address | | Position | | Length of
Time Served | | Number of Portfolios in
Fund Complex Overseen
by Board Member* | | Other Directorships Held
During at Least the Past 5 Years |
| | | | |
Lori A. Weber (1964) 300 S.E. 2nd Street Fort Lauderdale, FL 33301-1923 | | Vice President | | Since 2011 | | Not Applicable | | Not Applicable |
| | |
| Principal Occupation During at Least the Past 5 Years: | | | | |
| Senior Associate General Counsel, Franklin Templeton Investments; Assistant Secretary, Franklin Resources, Inc.; Vice President and Secretary, Templeton Investment Counsel, LLC; and officer of 45 of the investment companies in Franklin Templeton Investments. |
| | | | | | | | | |
*We base the number of portfolios on each separate series of the US registered investment companies within the Franklin Templeton Investments fund complex. These portfolios have a common investment manager or affiliated investment managers.
**Gregory E. Johnson is considered to be an interested person of the Fund under the federal securities laws due to his position as an officer and director of Franklin Resources, Inc. (Resources), which is the parent company of the Fund’s investment manager and distributor. Rupert H. Johnson, Jr. is considered to be an interested person of the Fund under the federal securities laws due to his position as officer and director and major shareholder of Resources.
Note 1: Rupert H. Johnson, Jr. is the uncle of Gregory E. Johnson.
Note 2: Officer information is current as of the date of this report. It is possible that after this date, information about officers may change.
The Sarbanes-Oxley Act of 2002 and Rules adopted by the Securities and Exchange Commission require the Fund to disclose whether the Fund’s Audit Committee includes at least one member who is an audit committee financial expert within the meaning of such Act and Rules. The Fund’s Board has determined that there is at least one such financial expert on the Audit Committee and has designated John B. Wilson as its audit committee financial expert. The Board believes that Mr. Wilson qualifies as such an expert in view of his extensive business background and experience, including service as chief financial officer of Staples, Inc. from 1992 to 1996. Mr. Wilson has been a Member and Chairman of the Fund’s Audit Committee since 2007. As a result of such background and experience, the Board believes that Mr. Wilson has acquired an understanding of generally accepted accounting principles and financial statements, the general application of such principles in connection with the accounting estimates, accruals and reserves, and analyzing and evaluating financial statements that present a breadth and level of complexity of accounting issues generally comparable to those of the Fund, as well as an understanding of internal controls and procedures for financial reporting and an understanding of audit committee functions. Mr. Wilson is an independent Board member as that term is defined under the relevant Securities and Exchange Commission Rules and Releases.
The Statement of Additional Information (SAI) includes additional information about the board members and is available, without charge, upon request. Shareholders may call (800) DIAL BEN/342-5236 to request the SAI.
| | | | | | |
174 | | Annual Report | | | | franklintempleton.com |
FRANKLIN TAX-FREE TRUST
Shareholder Information
Board Approval of Investment
Management Agreements
FRANKLIN TAX-FREE TRUST
Franklin Arizona Tax-Free Income Fund
Franklin Colorado Tax-Free Income Fund
Franklin Connecticut Tax-Free Income Fund
Franklin Michigan Tax-Free Income Fund
Franklin Minnesota Tax-Free Income Fund
Franklin Ohio Tax-Free Income Fund
Franklin Oregon Tax-Free Income Fund
Franklin Pennsylvania Tax-Free Income Fund
At an in-person meeting held on February 27, 2018 (Meeting), the Board of Trustees (Board) of Franklin Tax-Free Trust (Trust), including a majority of the trustees who are not “interested persons” as defined in the Investment Company Act of 1940 (Independent Trustees), reviewed and approved the continuance of the investment management agreement between Franklin Advisers, Inc. (Manager) and the Trust, on behalf of each Fund (each a Management Agreement) for an additional one-year period. The Independent Trustees received advice from and met separately with Independent Trustee counsel in considering whether to approve the continuation of each Management Agreement. Although the Management Agreements for the Funds were considered at the same Board meeting, the Board considered the information provided to it about the Funds together and with respect to each Fund separately as the Board deemed appropriate.
In considering the continuation of each Management Agreement, the Board reviewed and considered information provided by the Manager at the Meeting and throughout the year at meetings of the Board and its committees. The Board also reviewed and considered information provided in response to a detailed set of requests for information submitted to the Manager by Independent Trustee counsel on behalf of the Independent Trustees in connection with the annual contract renewal process. In addition, prior to the Meeting, the Independent Trustees held a telephonic contract renewal meeting at which the Independent Trustees conferred amongst themselves and Independent Trustee counsel about contract renewal matters. The Board reviewed and considered all of the factors it deemed relevant in approving the continuance of each Management Agreement, including, but not limited to: (i) the nature, extent and quality of the services provided by the Manager; (ii) the investment performance of each Fund; (iii) the costs of the services provided and profits realized by the Manager and its affiliates from the relationship with each Fund;
(iv) the extent to which economies of scale are realized as each Fund grows; and (v) whether fee levels reflect these economies of scale for the benefit of Fund investors.
In approving the continuance of each Management Agreement, the Board, including a majority of the Independent Trustees, determined that the terms of the Management Agreement are fair and reasonable and that the continuance of such Management Agreement is in the interests of the applicable Fund and its shareholders. While attention was given to all information furnished, the following discusses some primary factors relevant to the Board’s determination.
Nature, Extent and Quality of Services
The Board reviewed and considered information regarding the nature, extent and quality of investment management services provided by the Manager and its affiliates to the Funds and their shareholders. This information included, among other things, the qualifications, background and experience of the senior management and investment personnel of the Manager; the structure of investment personnel compensation; oversight of third-party service providers; investment performance reports and related financial information for each Fund; reports on expenses, shareholder services, marketing support payments made to financial intermediaries and third party servicing arrangements; legal and compliance matters; risk controls; pricing and other services provided by the Manager and its affiliates; and management fees charged by the Manager and its affiliates to U.S. funds and other accounts, including management’s explanation of differences among accounts where relevant. The Board also reviewed and considered an annual report on payments made by Franklin Templeton Investments (FTI) or the Funds to financial intermediaries, as well as a memorandum relating to third-party servicing arrangements in response to a guidance update in 2016 from the U.S. Securities and Exchange Commission (SEC) relating to mutual fund distribution and sub-accounting fees. The Board noted management’s continuing efforts and expenditures in establishing effective business continuity plans and developing strategies to address areas of heightened concern in the mutual fund industry, such as cybersecurity and liquidity risk management. The Board also recognized management’s commitment to facilitating Board oversight of particular areas, including derivatives and payments to intermediaries, by enhanced reporting.
The Board also reviewed and considered the benefits provided to Fund shareholders of investing in a fund that is part of the Franklin Templeton family of funds. The Board noted the
| | | | | | | | |
franklintempleton.com | | | | | | Annual Report | | 175 |
FRANKLIN TAX-FREE TRUST
SHAREHOLDER INFORMATION
financial position of Franklin Resources, Inc. (FRI), the Manager’s parent, and its commitment to the mutual fund business as evidenced by its continued introduction of new funds, reassessment of the fund offerings in response to the market environment and project initiatives and capital investments relating to the services provided to the Funds by the FTI organization.
Following consideration of such information, the Board was satisfied with the nature, extent and quality of services provided by the Manager and its affiliates to the Funds and their shareholders.
Fund Performance
The Board reviewed and considered the performance results of each Fund over various time periods ended December 31, 2017. The Board considered the performance returns for each Fund in comparison to the performance returns of mutual funds deemed comparable to the Fund included in a universe (Performance Universe) selected by Broadridge Financial Solutions, Inc. (Broadridge), an independent provider of investment company data. The Board received a description of the methodology used by Broadridge to select the mutual funds included in a Performance Universe. The Board also reviewed and considered Fund performance reports provided and discussions that occurred with portfolio managers at Board meetings throughout the year. A summary of each Fund’s performance results is below.
Franklin Arizona Tax-Free Income Fund and Franklin Ohio Tax-Free Income Fund - The Performance Universe for the Franklin Arizona Tax-Free Income Fund included the Fund and all retail and institutional “other states” municipal debt funds. The Performance Universe for the Franklin Ohio Tax-Free Income Fund included the Fund and all retail and institutional Ohio municipal debt funds. The Board noted that the Funds’ annualized income returns and annualized total returns for the one-, three-, five- and 10-year periods were above the medians of their respective Performance Universes. The Board concluded that the Funds’ performance was satisfactory.
Franklin Oregon Tax-Free Income Fund - The Performance Universe for this Fund included the Fund and all retail and institutional “other states” municipal debt funds. The Board noted that the Fund’s annualized income return for the one-, three-, five- and 10-year periods was above the median of its Performance Universe. The Board also noted that the Fund’s annualized total return for the one-year period was equal to the median of its Performance Universe, for the three- and 10-year periods was above the median of its Performance Universe, and
for the five-year period was below the median of its Performance Universe. The Board concluded that the Fund’s performance was satisfactory.
Franklin Colorado Tax-Free Income Fund - The Performance Universe for this Fund included the Fund and all retail and institutional “other states” municipal debt funds. The Board noted that the Fund’s annualized income return for the one-, three-, five- and 10-year periods was above the median of its Performance Universe. The Board also noted that the Fund’s annualized total return for the one- and three-year periods was below the median of its Performance Universe, but for the five-and 10-year periods was above the median of its Performance Universe. Given the Fund’s income-oriented investment objective, the Board concluded that the Fund’s performance was satisfactory.
Franklin Minnesota Tax-Free Income Fund – The Performance Universe for this Fund included the Fund and all retail and institutional Minnesota municipal debt funds. The Board noted that the Fund’s annualized income return for the one-, three-, five- and 10-year periods was above the median of its Performance Universe. The Board also noted that the Fund’s annualized total return for the one-, three- and five-year periods was below the median of its Performance Universe, but for the 10-year period was above the median of its Performance Universe. Given the Fund’s income-oriented investment objective, the Board concluded that the Fund’s performance was satisfactory.
Franklin Michigan Tax-Free Income Fund - The Performance Universe for this Fund included the Fund and all retail and institutional “other states” municipal debt funds. The Board noted that the Fund’s annualized income return for the one-, three-, five- and 10-year periods was above the median of its Performance Universe. The Board also noted that the Fund’s annualized total return for the one-, three- and 10-year periods was below the median of its Performance Universe, but for the five-year period was equal to the median of its Performance Universe. Given the Fund’s income-oriented investment objective, the Board concluded that the Fund’s performance was satisfactory.
Franklin Pennsylvania Tax-Free Income Fund - The Performance Universe for this Fund included the Fund and all retail and institutional Pennsylvania municipal debt funds. The Board noted that the Fund’s annualized income return for the one-, three-, five- and 10-year periods was above the median of its Performance Universe. The Board also noted that the Fund’s annualized total return for the one-, three- and five-year periods
| | | | | | |
176 | | Annual Report | | | | franklintempleton.com |
FRANKLIN TAX-FREE TRUST
SHAREHOLDER INFORMATION
was below the median of its Performance Universe, but for the 10-year period was equal to the median of its Performance Universe. Given the Fund’s income-oriented investment objective, the Board concluded that the Fund’s performance was satisfactory.
Franklin Connecticut Tax-Free Income Fund - The Performance Universe for this Fund included the Fund and all retail and institutional “other states” municipal debt funds. The Board noted that the Fund’s annualized income return for the one-, three-, five- and 10-year periods was above the median of its Performance Universe. The Board also noted that the Fund’s annualized total return for the one-, three-, five- and 10-year periods was below the median of its Performance Universe. Given the Fund’s income-oriented investment objective, the Board concluded that the Fund’s performance was satisfactory.
Comparative Fees and Expenses
The Board reviewed and considered information regarding each Fund’s actual total expense ratio and its various components, including, as applicable, management fees; transfer agent expenses; underlying fund expenses; Rule 12b-1 and non-Rule 12b-1 service fees; and other non-management fees. The Board also noted the quarterly and annual reports it receives on all marketing support payments made by FTI to financial intermediaries. The Board considered the actual total expense ratio and, separately, the contractual management fee rate, without the effect of fee waivers, if any (Management Rate) of each Fund in comparison to the median expense ratio and median Management Rate, respectively, of other mutual funds deemed comparable to and with a similar expense structure as the Fund selected by Broadridge (Expense Group). Broadridge fee and expense data is based upon information taken from each fund’s most recent annual report, which reflects historical asset levels that may be quite different from those currently existing, particularly in a period of market volatility. While recognizing such inherent limitation and the fact that expense ratios and Management Rates generally increase as assets decline and decrease as assets grow, the Board believed the independent analysis conducted by Broadridge to be an appropriate measure of comparative fees and expenses. The Broadridge Management Rate includes administrative charges, and the actual total expense ratio, for comparative consistency, was shown for Class A shares for funds with multiple classes of shares. The Board received a description of the methodology used by Broadridge to select the mutual funds included in an Expense Group.
Franklin Arizona Tax-Free Income Fund, Franklin Colorado Tax-Free Income Fund, Franklin Michigan Tax-Free Income Fund, Franklin Minnesota Tax-Free Income Fund, Franklin Oregon Tax-Free Income Fund, and Franklin Pennsylvania Tax-Free Income Fund - The Expense Group for each Fund, except for the Franklin Minnesota Tax-Free Income Fund and the Franklin Pennsylvania Tax-Free Income Fund, included the Fund and between five and ten other “other states” municipal debt funds. The Expense Group for the Franklin Minnesota Tax-Free Income Fund included the Fund and seven other Minnesota municipal debt funds. The Expense Group for the Franklin Pennsylvania Tax-Free Income Fund included the Fund and nine other Pennsylvania municipal debt funds. The Board noted that the Management Rates and actual total expense ratios for these Funds were below the medians of their respective Expense Groups. The Board concluded that the Management Rates charged to these Funds are reasonable.
Franklin Ohio Tax-Free Income Fund - The Expense Group for this Fund included the Fund and five other Ohio municipal debt funds. The Board noted that the Management Rate for the Fund was equal to the median of its Expense Group, but its actual total expense ratio was below the median of its Expense Group. The Board concluded that the Management Rate charged to the Fund is reasonable.
Franklin Connecticut Tax-Free Income Fund - The Expense Group for this Fund included the Fund and twelve other “other states” municipal debt funds. The Board noted that the Management Rate for the Fund was above the median of its Expense Group, but its actual total expense ratio was below the median of its Expense Group. The Board concluded that the Management Rate charged to the Fund is reasonable.
Profitability
The Board reviewed and considered information regarding the profits realized by the Manager and its affiliates in connection with the operation of each Fund. In this respect, the Board considered the Fund profitability analysis provided by the Manager that addresses the overall profitability of FTI’s U.S. fund business, as well as its profits in providing investment management and other services to each of the individual funds during the 12-month period ended September 30, 2017, being the most recent fiscal year-end for FRI. The Board noted that although management continually makes refinements to its methodologies used in calculating profitability in response to organizational and product-related changes, the overall methodology has remained consistent with that used in the Funds’ profitability report presentations from prior years.
| | | | | | | | |
franklintempleton.com | | | | | | Annual Report | | 177 |
FRANKLIN TAX-FREE TRUST
SHAREHOLDER INFORMATION
Additionally, PricewaterhouseCoopers LLP, auditor to Franklin Resources, Inc. and certain Franklin Templeton funds, has been engaged by the Manager to periodically review and assess the allocation methodologies to be used solely by the Funds’ Board with respect to the profitability analysis.
The Board noted management’s belief that costs incurred in establishing the infrastructure necessary for the type of mutual fund operations conducted by the Manager and its affiliates may not be fully reflected in the expenses allocated to each Fund in determining its profitability, as well as the fact that the level of profits, to a certain extent, reflected operational cost savings and efficiencies initiated by management. The Board also noted management’s expenditures in improving shareholder services provided to the Funds, as well as the need to implement systems and meet additional regulatory and compliance requirements resulting from recent SEC and other regulatory requirements.
The Board also considered the extent to which the Manager and its affiliates might derive ancillary benefits from fund operations, including revenues generated from transfer agent services, potential benefits resulting from personnel and systems enhancements necessitated by fund growth, as well as increased leverage with service providers and counterparties. Based upon its consideration of all these factors, the Board concluded that the level of profits realized by the Manager and its affiliates from providing services to each Fund was not excessive in view of the nature, extent and quality of services provided to each Fund.
Economies of Scale
The Board reviewed and considered the extent to which the Manager may realize economies of scale, if any, as each Fund grows larger and whether the Fund’s management fee structure reflects any economies of scale for the benefit of shareholders. With respect to possible economies of scale, the Board noted the existence of management fee breakpoints, which operate generally to share any economies of scale with a Fund’s shareholders by reducing the Fund’s effective management fees as the Fund grows in size. The Board considered the Manager’s view that any analyses of potential economies of scale in managing a particular fund are inherently limited in light of the joint and common costs and investments the Manager incurs across the Franklin Templeton family of funds as a whole. The Board concluded that to the extent economies of scale may be realized by the Manager and its affiliates, each Fund’s management fee structure provided a sharing of benefits with the Fund and its shareholders as the Fund grows.
Conclusion
Based on its review, consideration and evaluation of all factors it believed relevant, including the above-described factors and conclusions, the Board unanimously approved the continuation of each Management Agreement for an additional one-year period.
Proxy Voting Policies and Procedures
The Trust’s investment manager has established Proxy Voting Policies and Procedures (Policies) that the Trust uses to determine how to vote proxies relating to portfolio securities. Shareholders may view the Trust’s complete Policies online at franklintempleton.com. Alternatively, shareholders may request copies of the Policies free of charge by calling the Proxy Group collect at (954) 527-7678 or by sending a written request to: Franklin Templeton Companies, LLC, 300 S.E. 2nd Street, Fort Lauderdale, FL 33301, Attention: Proxy Group. Copies of the Trust’s proxy voting records are also made available online at franklintempleton.com and posted on the US Securities and Exchange Commission’s website at sec.gov and reflect the most recent 12-month period ended June 30.
Quarterly Statement of Investments
The Trust files a complete statement of investments with the US Securities and Exchange Commission for the first and third quarters for each fiscal year on Form N-Q. Shareholders may view the filed Form N-Q by visiting the Commission’s website at sec.gov. The filed form may also be viewed and copied at the Commission’s Public Reference Room in Washington, DC. Information regarding the operations of the Public Reference Room may be obtained by calling (800) SEC-0330.
Householding of Reports and Prospectuses
You will receive each Fund’s financial reports every six months as well as an annual updated summary prospectus (prospectus available upon request). To reduce Fund expenses, we try to identify related shareholders in a household and send only one copy of the financial reports and summary prospectus. This process, called “householding,” will continue indefinitely unless you instruct us otherwise. If you prefer not to have these documents householded, please call us at (800) 632-2301. At any time you may view current prospectuses/summary prospectuses and financial reports on our website. If you choose, you may receive these documents through electronic delivery.
| | | | | | |
178 | | Annual Report | | | | franklintempleton.com |
| | | | |
| |  | | Annual Report and Shareholder Letter Franklin Tax-Free Trust Investment Manager Franklin Advisers, Inc. Distributor Franklin Templeton Distributors, Inc. (800) DIAL BEN® / 342-5236 franklintempleton.com Shareholder Services (800) 632-2301 |
Authorized for distribution only when accompanied or preceded by a summary prospectus and/or prospectus. Investors should carefully consider a fund’s investment goals, risks, charges and expenses before investing. A prospectus contains this and other information; please read it carefully before investing.
To help ensure we provide you with quality service, all calls to and from our service areas are monitored and/or recorded.
| | |
© 2018 Franklin Templeton Investments. All rights reserved. | | TF3 A 04/18 |
(a) The Registrant has adopted a code of ethics that applies to its principal executive officers and principal financial and accounting officer.
(c) N/A
(d) N/A
(f) Pursuant to Item 12(a)(1), the Registrant is attaching as an exhibit a copy of its code of ethics that applies to its principal executive officers and principal financial and accounting officer.
| Item 3. | Audit Committee Financial Expert. |
(a)(1) The Registrant has an audit committee financial expert serving on its audit committee.
(2) The audit committee financial expert is John B. Wilson, and he is “independent” as defined under the relevant Securities and Exchange Commission Rules and Releases.
| Item 4. | Principal Accountant Fees and Services |
(a) Audit Fees
The aggregate fees paid to the principal accountant for professional services rendered by the principal accountant for the audit of the registrant’s annual financial statements or for services that are normally provided by the principal accountant in connection with statutory and regulatory filings or engagements were $805,084 for the fiscal year ended February 28, 2018 and $818,858 for the fiscal year ended February 28, 2017.
(b) Audit-Related Fees
There were no fees paid to the principal accountant for assurance and related services rendered by the principal accountant to the registrant that are reasonably related to the performance of the audit of the registrant’s financial statements and are not reported under paragraph (a) of Item 4.
There were no fees paid to the principal accountant for assurance and related services rendered by the principal accountant to the registrant’s investment adviser and any entity controlling, controlled by or under common control with the investment adviser that provides ongoing services to the registrant that are reasonably related to the performance of the audit of their financial statements.
(c) Tax Fees
There were no fees paid to the principal accountant for professional services rendered by the principal accountant to the registrant for tax compliance, tax advice and tax planning.
3
There were no fees paid to the principal accountant for professional services rendered by the principal accountant to the registrant’s investment adviser and any entity controlling, controlled by or under common control with the investment adviser that provides ongoing services to the registrant for tax compliance, tax advice and tax planning.
(d) All Other Fees
There were no fees paid to the principal accountant for products and services rendered by the principal accountant to the registrant not reported in paragraphs (a)-(c) of Item 4.
The aggregate fees paid to the principal accountant for products and services rendered by the principal accountant to the registrant’s investment adviser and any entity controlling, controlled by or under common control with the investment adviser that provides ongoing services to the registrant other than services reported in paragraphs (a)-(c) of Item 4 were $14,000 for the fiscal year ended February 28, 2018 and $255,000 for the fiscal year ended February 28, 2017. The services for which these fees were paid included review of materials provided to the fund Board in connection with the investment management contract renewal process and derivatives assessments and benchmarking services in connection with the 2015 ICI TA Survey.
(e) (1) The registrant’s audit committee is directly responsible for approving the services to be provided by the auditors, including:
(i) pre-approval of all audit and audit related services;
(ii) pre-approval of all non-audit related services to be provided to the Fund by the auditors;
(iii) pre-approval of all non-audit related services to be provided to the registrant by the auditors to the registrant’s investment adviser or to any entity that controls, is controlled by or is under common control with the registrant’s investment adviser and that provides ongoing services to the registrant where the non-audit services relate directly to the operations or financial reporting of the registrant; and
(iv) establishment by the audit committee, if deemed necessary or appropriate, as an alternative to committee pre-approval of services to be provided by the auditors, as required by paragraphs (ii) and (iii) above, of policies and procedures to permit such services to be pre-approved by other means, such as through establishment of guidelines or by action of a designated member or members of the committee; provided the policies and procedures are detailed as to the particular service and the committee is informed of each service and such policies and procedures do not include delegation of audit committee responsibilities, as contemplated under the Securities Exchange Act of 1934, to management; subject, in the case of (ii) through (iv), to any waivers, exceptions or exemptions that may be available under applicable law or rules.
(e) (2) None of the services provided to the registrant described in paragraphs (b)-(d) of Item 4 were approved by the audit committee pursuant to paragraph (c)(7)(i)(C) of Rule 2-01 of regulation S-X.
4
(f) No disclosures are required by this Item 4(f).
(g) The aggregate non-audit fees paid to the principal accountant for services rendered by the principal accountant to the registrant and the registrant’s investment adviser and any entity controlling, controlled by or under common control with the investment adviser that provides ongoing services to the registrant were $14,000 for the fiscal year ended February 28, 2018 and $255,000 for the fiscal year ended February 28, 2017.
(h) The registrant’s audit committee of the board has considered whether the provision of non-audit services that were rendered to the registrant’s investment adviser (not including any sub-adviser whose role is primarily portfolio management and is subcontracted with or overseen by another investment adviser), and any entity controlling, controlled by, or under common control with the investment adviser that provides ongoing services to the registrant that were not pre-approved pursuant to paragraph (c)(7)(ii) of Rule 2-01 of Regulation S-X is compatible with maintaining the principal accountant’s independence.
| Item 5. | Audit Committee of Listed Registrants. N/A |
| Item 6. | Schedule of Investments. N/A |
| Item 7. | Disclosure of Proxy Voting Policies and Procedures for Closed-End Management Investment Companies. N/A |
| Item 8. | Portfolio Managers of Closed-End Management Investment Companies. N/A |
| Item 9. | Purchases of Equity Securities by Closed-End Management Investment Company and Affiliated Purchasers. N/A |
| Item 10. | Submission of Matters to a Vote of Security Holders. |
There have been no changes to the procedures by which shareholders may recommend nominees to the Registrant’s Board of Trustees that would require disclosure herein.
| Item 11. | Controls and Procedures. |
(a) Evaluation of Disclosure Controls and Procedures. The Registrant maintains disclosure controls and procedures that are designed to ensure that information required to be disclosed in the Registrant’s filings under the Securities Exchange Act of 1934 and the Investment Company Act of 1940 is recorded, processed, summarized and reported within the periods specified in the rules and forms of the Securities and Exchange Commission. Such information is accumulated and communicated to the Registrant’s management, including its principal executive officer and principal financial officer, as appropriate, to
5
allow timely decisions regarding required disclosure. The Registrant’s management, including the principal executive officer and the principal financial officer, recognizes that any set of controls and procedures, no matter how well designed and operated, can provide only reasonable assurance of achieving the desired control objectives.
Within 90 days prior to the filing date of this Shareholder Report on Form N-CSR, the Registrant had carried out an evaluation, under the supervision and with the participation of the Registrant’s management, including the Registrant’s principal executive officer and the Registrant’s principal financial officer, of the effectiveness of the design and operation of the Registrant’s disclosure controls and procedures. Based on such evaluation, the Registrant’s principal executive officer and principal financial officer concluded that the Registrant’s disclosure controls and procedures are effective.
(b) Changes in Internal Controls. There have been no changes in the Registrant’s internal controls or in other factors that could materially affect the internal controls over financial reporting subsequent to the date of their evaluation in connection with the preparation of this Shareholder Report on Form N-CSR.
(a)(1) Code of Ethics
(a)(2) Certifications pursuant to Section 302 of the Sarbanes-Oxley Act of 2002 of Matthew T. Hinkle, Chief Executive Officer - Finance and Administration, and Gaston Gardey, Chief Financial Officer and Chief Accounting Officer
(b) Certifications pursuant to Section 906 of the Sarbanes-Oxley Act of 2002 of Matthew T. Hinkle , Chief Executive Officer - Finance and Administration, and Gaston Gardey, Chief Financial Officer and Chief Accounting Officer
6
SIGNATURES
Pursuant to the requirements of the Securities Exchange Act of 1934 and the Investment Company Act of 1940, the registrant has duly caused this report to be signed on its behalf by the undersigned, thereunto duly authorized.
| | |
| FRANKLIN TAX-FREE TRUST |
| |
| By | | /s/ MATTHEW T. HINKLE |
| | Matthew T. Hinkle |
| | Chief Executive Officer – Finance and Administration |
| |
| Date | | April 26, 2018 |
Pursuant to the requirements of the Securities Exchange Act of 1934 and the Investment Company Act of 1940, this report has been signed below by the following persons on behalf of the registrant and in the capacities and on the dates indicated.
| | |
| By | | /s/ MATTHEW T. HINKLE |
| | Matthew T. Hinkle |
| | Chief Executive Officer – Finance and Administration |
| |
| Date | | April 26, 2018 |
| |
| By | | /s/ GASTON GARDEY |
| | Gaston Gardey |
| | Chief Financial Officer and Chief Accounting Officer |
| |
| Date | | April 26, 2018 |
7