UNITED STATES
SECURITIES AND EXCHANGE COMMISSION
Washington, DC 20549
FORMN-CSR
CERTIFIED SHAREHOLDER REPORT OF REGISTERED
MANAGEMENT INVESTMENT COMPANIES
Investment Company Act file number811-04149
FranklinTax-Free Trust
(Exact name of registrant as specified in charter)
One Franklin Parkway, San Mateo, CA 94403-1906
(Address of principal executive offices) (Zip code)
Craig S. Tyle, One Franklin Parkway, San Mateo, CA 94403-1906
(Name and address of agent for service)
Registrant’s telephone number, including area code: (650)312-2000
Date of fiscal year end: 2/28
Date of reporting period: 02/28/19
| Item 1. | Reports to Stockholders. |
Internet Delivery of Fund Reports Unless You Request Paper Copies:Effective January 1, 2021, as permitted by the SEC, paper copies of the Fund’s shareholder reports will no longer be sent by mail, unless you specifically request them from the Fund or your financial intermediary. Instead, the reports will be made available on a website, and you will be notified by mail each time a report is posted and provided with a website link to access the report.
If you already elected to receive shareholder reports electronically, you will not be affected by this change and you need not take any action. If you have not signed up for electronic delivery, we would encourage you to join fellow shareholders who have. You may elect to receive shareholder reports and other communications electronically from the Fund by calling (800)632-2301 or by contacting your financial intermediary.
You may elect to continue to receive paper copies of all your future shareholder reports free of charge by contacting your financial intermediary or, if you invest directly with a Fund, calling (800)632-2301 to let the Fund know of your request. Your election to receive reports in paper will apply to all funds held in your account.
Franklin Templeton
Successful investing begins with ambition. And achievement only comes when you reach for it. That’s why we continually strive to deliver better outcomes for investors. No matter what your goals are, our deep, global investment expertise allows us to offer solutions that can help.
During our more than 70 years of experience, we’ve managed through all kinds of markets—up, down and those in between. We’re always preparing for what may come next. It’s because of this, combined with our strength as one of the world’s largest asset managers that we’ve earned the trust of millions of investors around the world.
Dear Shareholder:
During the 12 months ended February 28, 2019, the U.S. economy continued to grow amid positive economic data and corporate earnings, but financial markets experienced their usual volatility due to trade concerns and geopolitical issues. The U.S. Federal Reserve (Fed) increased its federal funds rate by 0.25% at its March, June, September and December 2018 meetings, bringing the rate from 1.50% at the start of the period to 2.50% byperiod-end. Afterperiod-end, the Fed indicated at its March 2019 meeting that further rate increases may be on hold for the calendar year.
During the12-month period, the municipal bond market posted largely modest returns. However, the municipal bond market outperformed the corporate bond and U.S. Treasury bond markets, with generally higher returns for longer-term and lower-rated municipal bonds. Factors contributing to this positive investment environment for municipals included relatively low inflation, increased employment and the strength of the U.S. economy.
FranklinTax-Free Trust’s annual report includes more detail about municipal bond market conditions and a discussion from the portfolio managers. In addition, on our website,franklintempleton.com, you can find updated commentary by our municipal bond experts. Municipal bonds providetax-free income and diversification from equities. Despite periods of volatility, municipal bonds historically have had a solid long-term record of performance, driven mostly by their compounding income component. Please remember all securities markets fluctuate, as do mutual fund share prices.
As always, we recommend investors consult their financial advisors to help them make the best decisions for the long term.
In a constantly changing market environment, we remain committed to our disciplined strategy as we manage the Funds, keeping in mind the trust you have placed in us. We appreciate your confidence and encourage you to contact us or your financial advisor when you have questions about your Franklin Templetontax-free investment.
Sincerely,

Rupert H. Johnson, Jr.
Chairman
FranklinTax-Free Trust

Sheila Amoroso
Senior Vice President and Director
Franklin Municipal Bond Department
This letter reflects our analysis and opinions as of February 28, 2019, unless otherwise indicated. The information is not a complete analysis of every aspect of any market, state, industry, security or fund. Statements of fact are from sources considered reliable.
Not FDIC Insured | May Lose Value | No Bank Guarantee
| | | | |
franklintempleton.com | | Not part of the annual report | | 1 |
Visitfranklintempleton.comfor fund updates, to access your account, or to find helpful financial planning tools.
| | | | | | |
2 | | Annual Report | | | | franklintempleton.com |
Annual Report
Municipal Bond Market Overview
The financial markets experienced volatility during the12-month reporting period due to trade concerns and geopolitical stress. Equity markets sold off sharply during the fourth quarter of 2018, spurring a flight to perceived quality that benefited high-quality fixed income assets such as municipal bonds and U.S. Treasuries. Stocks quickly reversed course and rallied sharply to start 2019, and municipal bonds performed well in January and February. Overall, the municipal bond market outperformed both the corporate bond and U.S. Treasury markets, but underperformed the equity markets during the period.
Investment-grade municipal bonds, as measured by the Bloomberg Barclays Municipal Bond Index, posted a +4.13% total return for the period, while U.S. Treasuries, as measured by the Bloomberg Barclays U.S. Treasury Index, posted a +3.23% total return, and investment-grade corporate bonds, as measured by the Bloomberg Barclays U.S. Corporate Bond Index, posted a +2.63% total return.1 U.S. stocks, as represented by the Standard & Poor’s® 500 Index, outperformed the fixed income markets with a +4.68% total return.1
Municipal bonds with intermediate and long maturities generally outperformed bonds with shorter maturities during the12-month period. The best-performing maturity group in the Bloomberg Barclays Municipal Bond Index was the8-12 year group, which returned +5.13% for the period.1 High-yield municipal bonds generally outperformed investment-grade municipal bonds, with the Bloomberg Barclays High Yield Municipal Bond Index posting a +6.96% total return, compared with a +4.13% total return for the Bloomberg Barclays Municipal Bond Index.1
Municipal issuance during the reporting period totaled approximately $347 billion, a 19% decline from total issuance for the preceding12-month period.2 Issuance remains diminished as the Tax Cuts and Jobs Act of 2017 eliminated advanced refundings beginning in January 2018. Calendar-year 2018 issuance was approximately $339 billion, which represented a 24% decline from 2017.2 The Investment Company Institute reported negative municipal bond fund flows during the fourth quarter of 2018, but flows turned positive in the first two months of 2019. Overall, total net
municipal bond fund inflows for the12-month period were approximately $14 billion.3 In our view, investor demand remains healthy.
The U.S. Federal Reserve (Fed) raised its target range for the federal funds rate 0.25% at its March, June, September and December 2018 meetings. The target range stood at 2.25%–2.50% atperiod-end. The Fed also increased the discount rate 0.25% at all four meetings, to finish the period at 3.00%. After the Fed’s December rate hike, it noted in its press release that “the labor market has continued to strengthen and that economic activity has been rising at a strong rate.” Although the Fed had previously indicated further rate hikes in 2019, after the January meeting, Chair Powell indicated a patient approach in 2019.
Atperiod-end, we maintained our positive view of the municipal bond market. We believe municipal bonds continue to be an attractive asset class among fixed income securities, and we intend to follow our disciplined approach of investing to maximize income, while seeking value in the municipal bond market.
The foregoing information reflects our analysis, opinions and portfolio holdings as of February 28, 2019, the end of the reporting period. The way we implement our main investment strategies and the resulting portfolio holdings may change depending on factors such as market and economic conditions. These opinions may not be relied upon as investment advice or an offer for a particular security. The information is not a complete analysis of every aspect of any market, state, industry, security or fund. Statements of fact are from sources considered reliable, but the investment manager makes no representation or warranty as to their completeness or accuracy. Although historical performance is no guarantee of future results, these insights may help you understand our investment management philosophy.
1. Source: Morningstar. Treasuries, if held to maturity, offer a fixed rate of return and a fixed principal value; their interest payments and principal are guaranteed.
2. Source: The Bond Buyer, Thomson Reuters.
3. Source: Investment Company Institute.
See www.franklintempletondatasources.com for additional data provider information.
| | | | |
franklintempleton.com | | Annual Report | | 3 |
Investment Strategy and Manager’s Discussion
Investment Strategy
We use a consistent, disciplined strategy with the objective of maximizingtax-free income and capital preservation by focusing on credit selection. We seek to maintain exposure to higher coupon securities, while balancing risk and return within each Fund’s range of allowable investments. We do not purchase high-yield securities in our investment-grade funds, however if a security is downgraded we are not required to sell it. Our security selection process includes purchasing securities that we believe are undervalued in the market and which have met our credit selection criteria. We do not use leverage or derivatives, which could add volatility and contribute to underperformance in adverse markets.
Manager’s Discussion
Due to the positive sloping municipal yield curve, we found value in higher quality securities in the 15–30 year maturity range, which allowed us to achieve our objective of maximizing income for our investors. Typically, in declining rate environments, our turnover declines as we maintain exposure to securities that are producing income that exceeds their replacement value in the market. However, when rates rise, our turnover increases as opportunities to purchase securities that have the potential to increase income in the portfolios become available. We believe our consistent, disciplined strategy can help our investors achieve high,tax-free income over the long term.
We invite you to read your Fund report for more detailed performance and portfolio information. Thank you for your participation in FranklinTax-Free Trust. We look forward to serving your future investment needs
The foregoing information reflects our analysis, opinions and portfolio holdings as of February 28, 2019, the end of the reporting period. The way we implement our main investment strategies and the resulting portfolio holdings may change depending on factors such as market and economic conditions. These opinions may not be relied upon as investment advice or an offer for a particular security. The information is not a complete analysis of every aspect of any market, state, industry, security or fund. Statements of fact are from sources considered reliable, but the investment manager makes no representation or warranty as to their completeness or accuracy. Although historical performance is no guarantee of future results, these insights may help you understand our investment management philosophy.
| | | | |
4 | | Annual Report | | franklintempleton.com |
Franklin AlabamaTax-Free Income Fund
We are pleased to bring you Franklin AlabamaTax-Free Income Fund’s annual report for the fiscal year ended February 28, 2019.
Your Fund’s Goal and Main Investments
The Fund seeks to provide as high a level of income exempt from federal and Alabama personal income taxes as is consistent with prudent investment management and preservation of capital by investing at least 80% of its total assets in securities that pay interest free from such taxes.1
Credit Quality Composition*
2/28/19
| | |
| Ratings | | % of Total
Investments |
| |
AAA | | 7.68% |
| |
AA | | 76.46% |
| |
A | | 2.39% |
| |
BBB | | 4.12% |
| |
Refunded | | 9.35% |
*Securities, except for those labeled Not Rated, are assigned ratings by one or more Nationally Recognized Statistical Credit Rating Organizations (NRSROs), such as Standard & Poor’s, Moody’s and Fitch, that can be considered by the investment manager as part of its independent securities analysis. When ratings from multiple agencies are available, the highest is used, consistent with the portfolio investment process. Ratings reflect an NRSRO’s opinion of an issuer’s creditworthiness and typically range from AAA (highest) to D (lowest). The Below Investment Grade category consists of bonds rated belowBBB-. The Refunded category generally consists of refunded bonds secured by U.S. government or other high-quality securities and not rerated by an NRSRO. The Not Rated category consists of ratable securities that have not been rated by an NRSRO. Cash and equivalents are excluded from this composition.
Performance Overview
The Fund’s Class A share price, as measured by net asset value, increased from $10.79 on September 10, 2018, to $10.85 on February 28, 2019. The Fund’s Class A shares paid dividends totaling 14.82 cents per share for the same period.2 The Performance Summary beginning on page 7 shows that at the end of this reporting period the Fund’s Class A shares’ distribution rate was 2.70% based on an annualization of February’s 2.55 cent per share monthly dividend and the maximum offering price of $11.33 on February 28, 2019. An investor in the 2019 maximum combined effective federal and Alabama personal income tax bracket of 45.80% (including
Dividend Distributions*
3/1/18–2/28/19
| | | | | | | | | | | | | | | | | | | | |
| | | | | | Dividend per Share (cents) | |
| Month | | Class
A** | | | Class
A1 | | | Class C | | | Class R6 | | | Advisor
Class | |
March | | | — | | | | 2.89 | | | | 2.38 | | | | 2.99 | | | | 2.98 | |
April | | | — | | | | 2.79 | | | | 2.28 | | | | 2.89 | | | | 2.88 | |
May | | | — | | | | 2.84 | | | | 2.33 | | | | 2.94 | | | | 2.93 | |
June | | | — | | | | 2.84 | | | | 2.33 | | | | 2.95 | | | | 2.93 | |
July | | | — | | | | 2.74 | | | | 2.23 | | | | 2.85 | | | | 2.83 | |
August | | | — | | | | 2.74 | | | | 2.23 | | | | 2.85 | | | | 2.83 | |
September | | | 1.67 | | | | 2.74 | | | | 2.23 | | | | 2.85 | | | | 2.83 | |
October | | | 2.65 | | | | 2.79 | | | | 2.28 | | | | 2.90 | | | | 2.88 | |
November | | | 2.65 | | | | 2.79 | | | | 2.28 | | | | 2.90 | | | | 2.88 | |
December | | | 2.65 | | | | 2.79 | | | | 2.29 | | | | 2.89 | | | | 2.87 | |
January | | | 2.65 | | | | 2.79 | | | | 2.29 | | | | 2.89 | | | | 2.87 | |
February | | | 2.55 | | | | 2.69 | | | | 2.19 | | | | 2.79 | | | | 2.77 | |
Total | | | 14.82 | | | | 33.43 | | | | 27.34 | | | | 34.69 | | | | 34.48 | |
*The distribution amount is the sum of all net investment income distributions for the period shown. Assumes shares were purchased and held for the entire accrual period. Since dividends accrue daily, your actual distributions will vary depending on the date you purchased your shares and any account activity. All Fund distributions will vary depending upon current market conditions, and past distributions are not indicative of future trends.
**Effective 9/10/18, the Fund began offering Class A shares. See the prospectus for details.
3.80% Medicare tax) would need to earn a distribution rate of 4.98% from a taxable investment to match the Fund’s Class Atax-free distribution rate. For other performance data, please see the Performance Summary. Dividend distributions were affected by low interest rates during the period. This and other factors resulted in reduced income for the portfolio and caused dividends to be lower at the end of the period.
Performance data represent past performance, which does not guarantee future results. Investment return and principal value will fluctuate, and you may have a gain or loss when you sell your shares. Current performance may differ from figures shown. For most recentmonth-end performance, go tofranklintempleton.comor call(800)342-5236.
State Update
Alabama’s economy grew but lagged the nation’s during the 12 months under review. Business sentiment in the state improved
1. For investors subject to alternative minimum tax, a small portion of Fund dividends may be taxable. Distributions of capital gains are generally taxable. To avoid imposition of 28% backup withholding on all Fund distributions and redemption proceeds, U.S. investors must be properly certified on FormW-9 andnon-U.S. investors on FormW-8BEN.
2. The distribution amount is the sum of all net investment income distributions for the period shown. Assumes shares were purchased and held for the entire accrual period. Since dividends accrue daily, your actual distributions will vary depending on the date you purchased your shares and any account activity. All Fund distributions will vary depending upon current market conditions, and past distributions are not indicative of future trends.
The dollar value, number of shares or principal amount, and names of all portfolio holdings are listed in the Fund’s Statement of Investments (SOI). The SOI begins on page 81.
| | | | |
franklintempleton.com | | Annual Report | | 5 |
FRANKLIN ALABAMATAX-FREE INCOME FUND
and remained generally positive, with firms in many industries expecting growth in capital expenditures, hiring, sales and profits. The state’s housing market improved, as home prices and sales increased. The state’s unemployment rate fell from 4.0% in February 2018 to 3.7% atperiod-end, which was lower than the 3.8% national average.3
Alabama has two major operating funds: the Education Trust Fund (ETF), the main funding source for education programs; and the general fund, the primary funding source for Medicaid and othernon-education government programs. For the fiscal year (FY) 2018, which ended on September 30, 2018, tax collections contributing to the state’s revenue were up compared with the same prior-year period. The rise was mainly attributed to increased sales taxes, use taxes and corporate and individual income taxes. The general fund budget for FY 2019, passed in March 2018, was modestly higher compared to the prior year’s budget. Highlights includedcost-of-living raises for state employees and spending increases for Medicaid, mental health programs and department of corrections compared to FY 2018. The state’s approved ETF budget for FY 2019 was modestly larger than the previous year’s spending plan. The enacted budget featured increased spending onpre-kindergarten,K-12 and higher education, and pay raises forK-12 and community college education employees. During the first four months of FY 2019, tax collections, which contribute to the state’s revenue, were up compared with the same prior-year period, mainly due to increases in sales and use taxes and corporate income tax.
Alabama’s nettax-supported debt was 2.3% of personal income and $898 per capita compared with the 2.3% and $987 national medians, respectively.4 Independent credit rating agency Standard & Poor’s (S&P) affirmed its AA rating with a stable outlook on Alabama’s general obligation debt.5 The rating reflected S&P’s view of the state’s largely stable economic base with prime industries and expanding diversification. S&P’s rating also took into account Alabama’s constitutional requirement to cut expenses when revenue declines, dedicated revenue for capital projects and debt service, and recent replenishment of reserves. Some challenges cited by S&P were the state’s restrictive tax structure that limits revenue, Alabama’s lower economic performance relative to the nation, and its below-average pension obligation funding. The stable outlook reflected S&P’s view that Alabama’s broad-based and consistent economic growth should maintain strong credit
| | | | |
| Portfolio Composition | | | | |
2/28/19 | | | | |
| |
| % of Total
Investments |
* |
| |
Utilities | | | 33.60% | |
| |
Higher Education | | | 16.57% | |
| |
Tax-Supported | | | 14.08% | |
| |
Refunded** | | | 11.63% | |
| |
General Obligation | | | 11.60% | |
| |
Hospital & Health Care | | | 7.73% | |
| |
Corporate-Backed | | | 2.73% | |
| |
Transportation | | | 2.06% | |
| |
*Does not include cash and cash equivalents.
**Includes all refunded bonds; the percentage may differ from that in the Credit Quality Composition.
support. S&P expected the state would maintain budgetary structural balance, and the rating agency also viewed the state’s trust fund reserves as positive
Manager’s Discussion
We used various investment strategies during the 12 months under review as we sought to maximizetax-free income for shareholders. Please read the Investment Strategy and Manager’s Discussion on page 4 for more information.
Thank you for your continued participation in Franklin AlabamaTax-Free Income Fund. We believe our conservative,buy-and-hold investment strategy can help us achieve high, current,tax-free income for shareholders.
The foregoing information reflects our analysis, opinions and portfolio holdings as of February 28, 2019, the end of the reporting period. The way we implement our main investment strategies and the resulting portfolio holdings may change depending on factors such as market and economic conditions. These opinions may not be relied upon as investment advice or an offer for a particular security. The information is not a complete analysis of every aspect of any market, state, industry, security or the Fund. Statements of fact are from sources considered reliable, but the investment manager makes no representation or warranty as to their completeness or accuracy. Although historical performance is no guarantee of future results, these insights may help you understand our investment management philosophy.
3. Source: Bureau of Labor Statistics.
4. Source:Moody’s Investors Service,“States - US: Medians - State debt continues slow growth trend,” 4/24/18.
5. This does not indicate S&P’s rating of the Fund.
| | | | | | |
6 | | Annual Report | | | | franklintempleton.com |
FRANKLIN ALABAMATAX-FREE INCOME FUND
Performance Summary as of February 28, 2019
The performance tables and graphs do not reflect any taxes that a shareholder would pay on Fund dividends, capital gain distributions, if any, or any realized gains on the sale of Fund shares. Total return reflects reinvestment of the Fund’s dividends and capital gain distributions, if any, and any unrealized gains or losses. Your dividend income will vary depending on dividends or interest paid by securities in the Fund’s portfolio, adjusted for operating expenses of each class. Capital gain distributions are net profits realized from the sale of portfolio securities.
Performance as of 2/28/19
Cumulative total return excludes sales charges. Average annual total return includes maximum sales charges. Sales charges will vary depending on the size of the investment and the class of share purchased. The maximum is 4.25% and the minimum is 0%.Class A:4.25% maximum initial sales charge;Advisor Class:no sales charges. For other share classes, visitfranklintempleton.com.
| | | | |
| Share Class | | Cumulative Total Return1 | | Average Annual Total Return2 |
| | |
A3 | | | | |
1-Year | | +2.77% | | -1.60% |
5-Year | | +15.21% | | +1.98% |
10-Year | | +49.15% | | +3.63% |
| | |
Advisor4 | | | | |
1-Year | | +2.86% | | +2.86% |
5-Year | | +15.50% | | +2.92% |
10-Year | | +49.53% | | +4.11% |
| | | | | | | | | | | | | | |
| Share Class | | Distribution Rate5 | | | | Taxable Equivalent Distribution Rate6 | | | 30-Day Standardized Yield7 | | |
| Taxable Equivalent
30-Day Standardized Yield6 |
|
A | | 2.70% | | | | 4.98% | | | 1.77% | | | | 3.27% | |
Advisor | | 3.07% | | | | 5.66% | | | 2.07% | | | | 3.82% | |
Performance data represent past performance, which does not guarantee future results. Investment return and principal value will fluctuate, and you may have a gain or loss when you sell your shares. Current performance may differ from figures shown. For most recentmonth-end performance, go tofranklintempleton.comor call(800)342-5236.
See page 10 for Performance Summary footnotes.
| | | | |
franklintempleton.com | | Annual Report | | 7 |
FRANKLIN ALABAMATAX-FREE INCOME FUND
PERFORMANCE SUMMARY
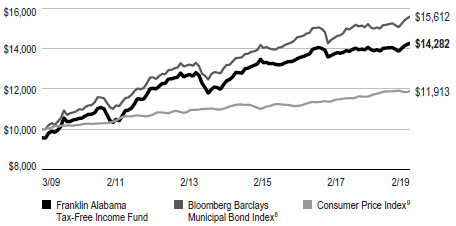
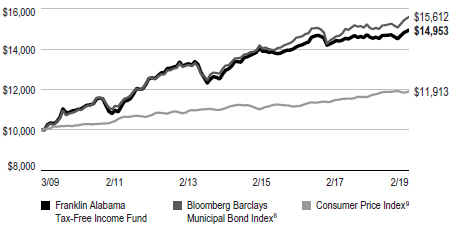
Total Return Index Comparison for a Hypothetical $10,000 Investment
Total return represents the change in value of an investment over the periods shown. It includes any applicable maximum sales charge, Fund expenses, account fees and reinvested distributions. The unmanaged indexes include reinvestment of any income or distributions. They differ from the Fund in composition and do not pay management fees or expenses. One cannot invest directly in an index.
Class A(3/1/09–2/28/19)
Advisor Class(3/1/09–2/28/19)
See page 10 for Performance Summary footnotes.
| | | | | | |
8 | | Annual Report | | | | franklintempleton.com |
FRANKLIN ALABAMATAX-FREE INCOME FUND
PERFORMANCE SUMMARY
Net Asset Value
| | | | | | | | | | | | | | |
| Share Class(Symbol) | | 2/28/19 | | 9/10/18 | | | 2/28/18 | | | Change | |
A (FALQX) | | $10.85 | | | $10.79 | | | | N/A | | | | +$0.06 | |
A1(FRALX) | | $10.84 | | | N/A | | | | $10.88 | | | | -$0.04 | |
C (FALEX) | | $10.98 | | | N/A | | | | $11.02 | | | | -$0.04 | |
R6(FALRX) | | $10.84 | | | N/A | | | | $10.88 | | | | -$0.04 | |
Advisor(FALZX) | | $10.84 | | | N/A | | | | $10.88 | | | | -$0.04 | |
Distributions(3/1/18–2/28/19) | |
| Share Class | | Net Investment Income | | | | | | | | | |
A (9/10/18–2/28/19) | | $0.1482 | | | | | | | | | | | | |
A1 | | $0.3343 | | | | | | | | | | | | |
C | | $0.2734 | | | | | | | | | | | | |
R6 | | $0.3469 | | | | | | | | | | | | |
Advisor | | $0.3448 | | | | | | | | | | | | |
|
| Total Annual Operating Expenses10 | |
| | | | |
| Share Class | | | | | | | | | | | |
A | | 0.89% | | | | | | | | | | | | |
Advisor | | 0.64% | | | | | | | | | | | | |
See page 10 for Performance Summary footnotes.
| | | | | | | | |
franklintempleton.com | | | | | | Annual Report | | 9 |
FRANKLIN ALABAMATAX-FREE INCOME FUND
PERFORMANCE SUMMARY
Each class of shares is available to certain eligible investors and has different annual fees and expenses, as described in the prospectus.
All investments involve risks, including possible loss of principal. Because municipal bonds are sensitive to interest rate movements, the Fund’s yield and share price will fluctuate with market conditions. Bond prices generally move in the opposite direction of interest rates. Thus, as prices of bonds in the Fund adjust to a rise in interest rates, the Fund’s share price may decline. Because the Fund invests principally in a single state, it is subject to greater risk of adverse economic and regulatory changes in that state than a geographically diversified fund. Changes in the credit rating of a bond, or in the credit rating or financial strength of a bond’s issuer, insurer or guarantor, may affect the bond’s value. The Fund may invest a significant part of its assets in municipal securities that finance similar types of projects, such as utilities, hospitals, higher education and transportation. A change that affects one project would likely affect all similar projects, thereby increasing market risk. The Fund is actively managed but there is no guarantee that the manager’s investment decisions will produce the desired results. The Fund’s prospectus also includes a description of the main investment risks.
1. Cumulative total return represents the change in value of an investment over the periods indicated.
2. Average annual total return represents the average annual change in value of an investment over the periods indicated. Return for less than one year, if any, has not been annualized.
3. Effective 9/10/18, Class A shares closed to new investors, were renamed Class A1 shares, and a new Class A share with a different expense structure became available. Class A performance shown has been calculated as follows: (a) for periods prior to 9/10/18, a restated figure is used based on the Fund’s Class A1 performance that includes any Rule12b-1 rate differential that exists between Class A1 and Class A; and (b) for periods after 9/10/18, actual Class A performance is used, reflecting all charges and fees applicable to that class.
4. Effective 9/15/16, the Fund began offering Advisor Class shares, which do not have sales charges or a Rule12b-1 plan. Performance quotations for this class reflect the following methods of calculation: (a) For periods prior to 9/15/16, a restated figure is used based upon the Fund’s Class A performance, excluding the effect of Class A’s maximum initial sales charge, but reflecting the effect of the Class A Rule12b-1 fees; and (b) for periods after 9/15/16, actual Advisor Class performance is used reflecting all charges and fees applicable to that class. Since 9/15/16 (commencement of sales), the cumulative and average annual total returns of Advisor Class shares were +2.33% and +0.94%.
5. Distribution rate is based on an annualization of the respective class’s February dividend and the maximum offering price (NAV for Advisor Class) per share on 2/28/19.
6. Taxable equivalent distribution rate and yield assume the published rates as of 12/18/18 for the maximum combined effective federal and Alabama personal income tax rate of 45.80%, based on the federal income tax rate of 37.00% plus 3.80% Medicare tax.
7. The Fund’s30-day standardized yield is calculated over a trailing30-day period using the yield to maturity on bonds and/or the dividends accrued on stocks. It may not equal the Fund’s actual income distribution rate, which reflects the Fund’s past dividends paid to shareholders.
8. Source: Morningstar. The Bloomberg Barclays Municipal Bond Index is a market value-weighted index engineered for the long-termtax-exempt bond market. To be included in the index, bonds must be fixed rate, have at least one year to final maturity and be rated investment grade(Baa3/BBB- or higher) by at least two of the following agencies: Moody’s, S&P and Fitch.
9. Source: Bureau of Labor Statistics, bls.gov/cpi. The Consumer Price Index is a commonly used measure of the inflation rate.
10. Figures are as stated in the Fund’s current prospectus and may differ from the expense ratios disclosed in the Your Fund’s Expenses and Financial Highlights sections in this report. In periods of market volatility, assets may decline significantly, causing total annual Fund operating expenses to become higher than the figures shown.
See www.franklintempletondatasources.com for additional data provider information.
| | | | | | |
10 | | Annual Report | | | | franklintempleton.com |
FRANKLIN ALABAMATAX-FREE INCOME FUND
Your Fund’s Expenses
As a Fund shareholder, you can incur two types of costs: (1) transaction costs, including sales charges (loads) on Fund purchases and redemptions; and (2) ongoing Fund costs, including management fees, distribution and service(12b-1) fees, and other Fund expenses. All mutual funds have ongoing costs, sometimes referred to as operating expenses. The table below shows ongoing costs of investing in the Fund and can help you understand these costs and compare them with those of other mutual funds. The table assumes a $1,000 investment held for the six months indicated.
Actual Fund Expenses
The table below provides information about actual account values and actual expenses in the columns under the heading “Actual.” In these columns the Fund’s actual return, which includes the effect of Fund expenses, is used to calculate the “Ending Account Value” for each class of shares. You can estimate the expenses you paid during the period by following these steps (ofcourse, your account value and expenses will differ from those in this illustration):Divide your account value by $1,000 (ifyour account had an $8,600 value, then $8,600÷ $1,000 = 8.6). Then multiply the result by the number in the row for your class of shares under the headings “Actual” and “Expenses Paid During Period” (ifActual Expenses Paid During Period were $7.50, then 8.6 x $7.50 = $64.50). In this illustration, the actual expenses paid this period are $64.50.
Hypothetical Example for Comparison with Other Funds
Under the heading “Hypothetical” in the table, information is provided about hypothetical account values and hypothetical expenses based on the Fund’s actual expense ratio and an assumed rate of return of 5% per year before expenses, which is not the Fund’s actual return. This information may not be used to estimate the actual ending account balance or expenses you paid for the period, but it can help you compare ongoing costs of investing in the Fund with those of other funds. To do so, compare this 5% hypothetical example for the class of shares you hold with the 5% hypothetical examples that appear in the shareholder reports of other funds.
Please note that expenses shown in the table are meant to highlight ongoing costs and do not reflect any transactional costs. Therefore, information under the heading “Hypothetical” is useful in comparing ongoing costs only, and will not help you compare total costs of owning different funds. In addition, if transactional costs were included, your total costs would have been higher.
| | | | | | | | | | | | |
| | | | | Actual (actual return after expenses) | | Hypothetical (5% annual return before expenses) | | |
| | | | | | | | |
Share
Class | | Beginning
Account
Value1 | | Ending
Account
Value 2/28/19 | | Expenses
Paid During
Period2,3,4 | | Ending
Account
Value 2/28/19 | | Expenses Paid During
Period 9/1/18–2/28/193,4 | | Net
Annualized
Expense
Ratio4 |
| | | | | | |
A | | $1,000 | | $1,019.80 | | $4.35 | | $1,020.23 | | $4.61 | | 0.92% |
A1 | | $1,000 | | $1,016.50 | | $3.95 | | $1,020.88 | | $3.96 | | 0.79% |
C | | $1,000 | | $1,012.50 | | $6.69 | | $1,018.15 | | $6.71 | | 1.34% |
R6 | | $1,000 | | $1,017.10 | | $3.20 | | $1,021.62 | | $3.21 | | 0.64% |
Advisor | | $1,000 | | $1,016.90 | | $3.45 | | $1,021.37 | | $3.46 | | 0.69% |
1. For Classes A1, C, R6 and Advisor 9/1/18 for Actual and Hypothetical. For Class A, 9/10/18 for Actual and 9/1/18 for Hypothetical.
2. For Classes A1, C, R6 and Advisor, 9/1/18–2/28/19. For Class A, 9/10/18–2/28/19.
3. Expenses are equal to the annualized expense ratio for thesix-month period as indicated above—in the far right column—multiplied by the simple average account value over the period indicated, and then multiplied by 181/365 to reflect theone-half year period. The multiplier is 171/365 for Actual Class A expenses to reflect the number of days since inception.
4. Reflects expenses after fee waivers and expense reimbursements, for Class R6.
| | | | | | | | |
franklintempleton.com | | | | | | Annual Report | | 11 |
Franklin FloridaTax-Free Income Fund
This annual report for Franklin FloridaTax-Free Income Fund covers the fiscal year ended February 28, 2019.
Your Fund’s Goal and Main Investments
The Fund seeks to provide as high a level of income exempt from federal income taxes and any Florida personal income taxes as is consistent with prudent investment management and preservation of capital by investing at least 80% of its total assets in securities that pay interest free from such taxes.1
Credit Quality Composition*
2/28/19
| | | | |
| Ratings | | % of Total
Investments | |
| |
| |
AAA | | | 9.90% | |
| |
| |
AA | | | 27.34% | |
| |
| |
A | | | 37.53% | |
| |
| |
BBB | | | 5.80% | |
| |
| |
Below Investment Grade | | | 3.22% | |
| |
| |
Refunded | | | 15.85% | |
| |
| |
Not Rated | | | 0.36% | |
| |
*Securities, except for those labeled Not Rated, are assigned ratings by one or more Nationally Recognized Statistical Credit Rating Organizations (NRSROs), such as Standard & Poor’s, Moody’s and Fitch, that can be considered by the investment manager as part of its independent securities analysis. When ratings from multiple agencies are available, the highest is used, consistent with the portfolio investment process. Ratings reflect an NRSRO’s opinion of an issuer’s creditworthiness and typically range from AAA (highest) to D (lowest). The Below Investment Grade category consists of bonds rated belowBBB-. The Refunded category generally consists of refunded bonds secured by U.S. government or other high-quality securities and not rerated by an NRSRO. The Not Rated category consists of ratable securities that have not been rated by an NRSRO. Cash and equivalents are excluded from this composition.
Performance Overview
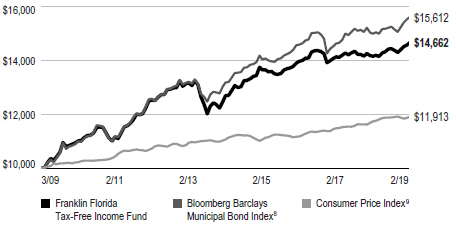
The Fund’s Class A share price, as measured by net asset value, remained unchanged from $10.44 on September 10, 2018, to $10.44 on February 28, 2019. The Fund’s Class A shares paid dividends totaling 17.28 cents per share for the same period.2 The Performance Summary beginning on page 15 shows that at the end of this reporting period the Fund’s Class A shares’ distribution rate was 3.31% based on an annualization of February’s 3.01 cent per share monthly dividend and the maximum offering price of $10.90 on February 28, 2019. An
Dividend Distributions*
3/1/18–2/28/19
| | | | | | | | | | | | | | | | | | | | |
| | | Dividend per Share (cents) | |
| | | | |
| Month | | Class A** | | | Class A1 | | | Class C | | | Class R6 | | | Advisor
Class | |
| |
March | | | — | | | | 3.21 | | | | 2.71 | | | | 3.30 | | | | 3.29 | |
| |
April | | | — | | | | 3.21 | | | | 2.71 | | | | 3.30 | | | | 3.29 | |
| |
May | | | — | | | | 3.21 | | | | 2.71 | | | | 3.30 | | | | 3.29 | |
| |
June | | | — | | | | 3.21 | | | | 2.72 | | | | 3.31 | | | | 3.29 | |
| |
July | | | — | | | | 3.21 | | | | 2.72 | | | | 3.31 | | | | 3.29 | |
| |
August | | | — | | | | 3.21 | | | | 2.72 | | | | 3.31 | | | | 3.29 | |
| |
September | | | 1.97 | | | | 3.21 | | | | 2.71 | | | | 3.31 | | | | 3.29 | |
| |
October | | | 3.07 | | | | 3.21 | | | | 2.71 | | | | 3.31 | | | | 3.29 | |
| |
November | | | 3.07 | | | | 3.21 | | | | 2.71 | | | | 3.31 | | | | 3.29 | |
| |
December | | | 3.08 | | | | 3.21 | | | | 2.72 | | | | 3.32 | | | | 3.29 | |
| |
January | | �� | 3.08 | | | | 3.21 | | | | 2.72 | | | | 3.32 | | | | 3.29 | |
| |
February | | | 3.01 | | | | 3.14 | | | | 2.65 | | | | 3.25 | | | | 3.22 | |
| |
Total | | | 17.28 | | | | 38.45 | | | | 32.51 | | | | 39.65 | | | | 39.41 | |
| |
*The distribution amount is the sum of all net investment income distributions for the period shown. Assumes shares were purchased and held for the entire accrual period. Since dividends accrue daily, your actual distributions will vary depending on the date you purchased your shares and any account activity. All Fund distributions will vary depending upon current market conditions, and past distributions are not indicative of future trends.
**Effective 9/10/18, the Fund began offering Class A shares. See the prospectus for details.
investor in the 2019 maximum federal income tax bracket of 37.00% (plus 3.80% Medicare tax) would need to earn a distribution rate of 5.59% from a taxable investment to match the Fund’s Class Atax-free distribution rate. For other performance data, please see the Performance Summary. Dividend distributions were affected by low interest rates during the period. This and other factors resulted in reduced income for the portfolio and caused dividends to be lower at the end of the period.
Performance data represent past performance, which does not guarantee future results. Investment return and principal value will fluctuate, and you may have a gain or loss when you sell your shares. Current performance may differ from figures shown. For most recentmonth-end performance, go tofranklintempleton.comor call(800)342-5236.
1. For investors subject to alternative minimum tax, a small portion of Fund dividends may be taxable. Distributions of capital gains are generally taxable. To avoid imposition of 28% backup withholding on all Fund distributions and redemption proceeds, U.S. investors must be properly certified on FormW-9 andnon-U.S. investors on FormW-8BEN.
2. The distribution amount is the sum of all net investment income distributions for the period shown. Assumes shares were purchased and held for the entire accrual period. Since dividends accrue daily, your actual distributions will vary depending on the date you purchased your shares and any account activity. All Fund distributions will vary depending upon current market conditions, and past distributions are not indicative of future trends.
The dollar value, number of shares or principal amount, and names of all portfolio holdings are listed in the Fund’s Statement of Investments (SOI). The SOI begins on page 88.
| | | | |
12 | | Annual Report | | franklintempleton.com |
FRANKLIN FLORIDATAX-FREE INCOME FUND
State Update
During the 12 months under review, Florida’s economy and job growth continued to outperform the nation’s, helped by healthy population growth and positive net migration. Florida’s job growth was broad-based across most job sectors and especially supported by construction, professional and business services, and leisure and hospitality. The state’s unemployment rate declined from 3.9% in February 2018 to 3.5% atperiod-end, which was lower than the 3.8% national average.3 The state’s growing economy, favorable climate and increased housing affordability attracted new residents and foreign buyers, which pressured Florida’s housing market by tightening supply levels and increasing prices. However, the state’s foreclosure rate remained higher than the national rate.
Florida’s net general revenue collections in fiscal year (FY) 2018 (ended June 30, 2018) increased compared with FY 2017, primarily reflecting higher sales tax and corporate income tax collections, which remained the state’s largest revenue sources. Due to positive general revenue trends, Florida ended FY 2018 with higher general fund and budget stabilization fund balances, when compared to FY 2017. In March 2018, the governor signed the FY 2019 budget into law. The enacted budget was larger than the previous year’s and was based on increased revenue collections. Other features included reduced sales tax on commercial rent; increased corporate tax credits, sales tax exemptions and holidays; and augmented spending for transportation, economic development, health care and human services and education. In February 2019, the governor’s proposed FY 2020 budget increased spending compared to the enacted FY 2019 budget, largely in education and environmental protection. The proposal also included tax reductions.
The strategy employed by the state to pay down debt and slow the pace of issuance led to positive results. Florida’s nettax-supported debt was 2.0% of personal income and $889 per capita, comparable with the 2.3% and $987 national medians, respectively.4 Independent credit rating agency Standard & Poor’s (S&P) maintained its AAA rating with a stable outlook for Florida’s general obligation debt, reflecting its assessment of the state’s continued strong employment and population growth, revenue growth, structurally balanced budgeting, strong reserve levels, relatively well-funded pensions and moderate debt burden.5 The stable outlook reflected S&P’s assessment of Florida’s strong economic growth and the rating
Portfolio Composition
2/28/19
| | | | |
| |
| % of Total
Investments |
* |
| |
Hospital & Health Care | | | 24.75% | |
| |
Transportation | | | 18.60% | |
| |
Refunded** | | | 17.55% | |
| |
Utilities | | | 16.66% | |
| |
General Obligation | | | 8.73% | |
| |
Tax-Supported | | | 7.46% | |
| |
Higher Education | | | 2.52% | |
| |
Other Revenue | | | 1.73% | |
| |
Housing | | | 1.04% | |
| |
Subject to Government Appropriations | | | 0.96% | |
| |
*Does not include cash and cash equivalents.
**Includes all refunded bonds; the percentage may differ from that in the Credit Quality Composition.
agency’s expectation that Florida would maintain strong budget balances. Some potential risks that S&P believes could return Florida to structural budgetary imbalance include a major economic downturn or withdrawal of federal aid. S&P also believes that economic damage or increased debt resulting from catastrophic hurricanes could pressure the state’s credit rating.
Manager’s Discussion
We used various investment strategies during the 12 months under review as we sought to maximizetax-free income for shareholders. Please read the Investment Strategy and Manager’s Discussion on page 4 for more information.
Thank you for your continued participation in Franklin FloridaTax-Free Income Fund. We believe our conservative,buy-and-hold investment strategy can help us achieve high, current,tax-free income for shareholders.
3. Source: Bureau of Labor Statistics.
4. Source:Moody’s Investors Service, “States - US: Medians - State debt continues slow growth trend,” 4/24/18.
5. This does not indicate S&P’s rating of the Fund.
| | | | | | | | |
franklintempleton.com | | | | | | Annual Report | | 13 |
FRANKLIN FLORIDA TAX-FREE INCOME FUND
The foregoing information reflects our analysis, opinions and portfolio holdings as of February 28, 2019, the end of the reporting period. The way we implement our main investment strategies and the resulting portfolio holdings may change depending on factors such as market and economic conditions. These opinions may not be relied upon as investment advice or an offer for a particular security. The information is not a complete analysis of every aspect of any market, state, industry, security or the Fund. Statements of fact are from sources considered reliable, but the investment manager makes no representation or warranty as to their completeness or accuracy. Although historical performance is no guarantee of future results, these insights may help you understand our investment management philosophy.
| | | | | | |
14 | | Annual Report | | | | franklintempleton.com |
FRANKLIN FLORIDA TAX-FREE INCOME FUND
Performance Summary as of February 28, 2019
The performance tables and graphs do not reflect any taxes that a shareholder would pay on Fund dividends, capital gain distributions, if any, or any realized gains on the sale of Fund shares. Total return reflects reinvestment of the Fund’s dividends and capital gain distributions, if any, and any unrealized gains or losses. Your dividend income will vary depending on dividends or interest paid by securities in the Fund’s portfolio, adjusted for operating expenses of each class. Capital gain distributions are net profits realized from the sale of portfolio securities.
Performance as of 2/28/19
Cumulative total return excludes sales charges. Average annual total return includes maximum sales charges. Sales charges will vary depending on the size of the investment and the class of share purchased. The maximum is 4.25% and the minimum is 0%.Class A:4.25% maximum initial sales charge;Advisor Class:no sales charges. For other share classes, visitfranklintempleton.com.
| | | | |
| Share Class | | Cumulative Total Return1 | | Average Annual Total Return2 |
A3 | | | | |
1-Year | | +3.37% | | -1.02% |
5-Year | | +14.91% | | +1.93% |
10-Year | | +45.88% | | +3.40% |
| | |
| Advisor4 | | | | |
1-Year | | +3.54% | | +3.54% |
5-Year | | +15.51% | | +2.93% |
10-Year | | +46.62% | | +3.90% |
| | | | | | | | | | |
| Share Class | | Distribution
Rate5 | | | | Taxable Equivalent
Distribution Rate6 | | 30-Day Standardized Yield7 | | Taxable Equivalent 30-Day Standardized Yield6 |
A | | 3.31% | | | | 5.59% | | 1.75% | | 2.96% |
Advisor | | 3.69% | | | | 6.23% | | 2.07% | | 3.50% |
Performance data represent past performance, which does not guarantee future results. Investment return and principal value will fluctuate, and you may have a gain or loss when you sell your shares. Current performance may differ from figures shown. For most recentmonth-end performance, go tofranklintempleton.comor call(800)342-5236.
See page 18 for Performance Summary footnotes.
| | | | | | | | |
franklintempleton.com | | | | | | Annual Report | | 15 |
FRANKLIN FLORIDATAX-FREE INCOME FUND
PERFORMANCE SUMMARY
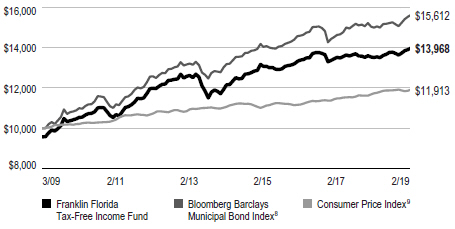
Total Return Index Comparison for a Hypothetical $10,000 Investment
Total return represents the change in value of an investment over the periods shown. It includes any applicable maximum sales charge, Fund expenses, account fees and reinvested distributions. The unmanaged indexes include reinvestment of any income or distributions. They differ from the Fund in composition and do not pay management fees or expenses. One cannot invest directly in an index.
Class A(3/1/09–2/28/19)
Advisor Class(3/1/09–2/28/19)
See page 18 for Performance Summary footnotes.
| | | | | | |
16 | | Annual Report | | | | franklintempleton.com |
FRANKLIN FLORIDA TAX-FREE INCOME FUND
PERFORMANCE SUMMARY
Net Asset Value
| | | | | | | | | | | | | | | | |
| Share Class(Symbol) | | 2/28/19 | | | 9/10/18 | | | 2/28/18 | | | Change | |
A (FQFLX) | | | $10.44 | | | $ | 10.44 | | | | N/A | | | | $0.00 | |
A1(FRFLX) | | | $10.43 | | | | N/A | | | | $10.47 | | | | -$0.04 | |
C (FRFIX) | | | $10.66 | | | | N/A | | | | $10.69 | | | | -$0.03 | |
R6(FRFQX) | | | $10.46 | | | | N/A | | | | $10.49 | | | | -$0.03 | |
Advisor(FFTZX) | | | $10.46 | | | | N/A | | | | $10.49 | | | | -$0.03 | |
| |
| Distributions(3/1/18–2/28/19) | | | | | |
| | | | |
| Share Class | | Net Investment Income | | | | | | | | | | |
A (9/10/18–2/28/19) | | | $0.1728 | | | | | | | | | | | | | |
A1 | | | $0.3845 | | | | | | | | | | | | | |
C | | | $0.3251 | | | | | | | | | | | | | |
R6 | | | $0.3965 | | | | | | | | | | | | | |
Advisor | | | $0.3941 | | | | | | | | | | | | | |
|
| Total Annual Operating Expenses10 | |
| | | | |
| Share Class | | | | | | | | | | | | |
A | | | 0.82% | | | | | | | | | | | | | |
Advisor | | | 0.57% | | | | | | | | | | | | | |
See page 18 for Performance Summary footnotes.
| | | | | | | | |
franklintempleton.com | | | | | | Annual Report | | 17 |
FRANKLIN FLORIDA TAX-FREE INCOME FUND
PERFORMANCE SUMMARY
Each class of shares is available to certain eligible investors and has different annual fees and expenses, as described in the prospectus.
All investments involve risks, including possible loss of principal. Because municipal bonds are sensitive to interest rate movements, the Fund’s yield and share price will fluctuate with market conditions. Bond prices generally move in the opposite direction of interest rates. Thus, as prices of bonds in the Fund adjust to a rise in interest rates, the Fund’s share price may decline. Because the Fund invests principally in a single state, it is subject to greater risk of adverse economic and regulatory changes in that state than a geographically diversified fund. Puerto Rico municipal bonds have been impacted by recent adverse economic and market changes, which may cause the Fund’s share price to decline. Changes in the credit rating of a bond, or in the credit rating or financial strength of a bond’s issuer, insurer or guarantor, may affect the bond’s value. The Fund may invest a significant part of its assets in municipal securities that finance similar types of projects, such as utilities, hospitals, higher education and transportation. A change that affects one project would likely affect all similar projects, thereby increasing market risk. The Fund is actively managed but there is no guarantee that the manager’s investment decisions will produce the desired results. The Fund’s prospectus also includes a description of the main investment risks.
1. Cumulative total return represents the change in value of an investment over the periods indicated.
2. Average annual total return represents the average annual change in value of an investment over the periods indicated. Return for less than one year, if any, has not been annualized.
3. Effective 9/10/18, Class A shares closed to new investors, were renamed Class A1 shares, and a new Class A share with a different expense structure became available. Class A performance shown has been calculated as follows: (a) for periods prior to 9/10/18, a restated figure is used based on the Fund’s Class A1 performance that includes any Rule12b-1 rate differential that exists between Class A1 and Class A; and (b) for periods after 9/10/18, actual Class A performance is used, reflecting all charges and fees applicable to that class.
4. Effective 9/15/16, the Fund began offering Advisor Class shares, which do not have sales charges or a Rule12b-1 plan. Performance quotations for this class reflect the following methods of calculation: (a) For periods prior to 9/15/16, a restated figure is used based upon the Fund’s Class A performance, excluding the effect of Class A’s maximum initial sales charge, but reflecting the effect of the Class A Rule12b-1 fees; and (b) for periods after 9/15/16, actual Advisor Class performance is used reflecting all charges and fees applicable to that class. Since 9/15/16 (commencement of sales), the cumulative and average annual total returns of Advisor Class shares were +2.42% and +0.98%.
5. Distribution rate is based on an annualization of the respective class’s February dividend and the maximum offering price (NAV for Advisor Class) per share on 2/28/19.
6. Taxable equivalent distribution rate and yield assume the 2019 maximum federal income tax rate of 37.00% plus 3.80% Medicare tax.
7. The Fund’s30-day standardized yield is calculated over a trailing30-day period using the yield to maturity on bonds and/or the dividends accrued on stocks. It may not equal the Fund’s actual income distribution rate, which reflects the Fund’s past dividends paid to shareholders.
8. Source: Morningstar. The Bloomberg Barclays Municipal Bond Index is a market value-weighted index engineered for the long-termtax-exempt bond market. To be included in the index, bonds must be fixed rate, have at least one year to final maturity and be rated investment grade(Baa3/BBB- or higher) by at least two of the following agencies: Moody’s, S&P and Fitch.
9. Source: Bureau of Labor Statistics, bls.gov/cpi. The Consumer Price Index is a commonly used measure of the inflation rate.
10. Figures are as stated in the Fund’s current prospectus and may differ from the expense ratios disclosed in the Your Fund’s Expenses and Financial Highlights sections in this report. In periods of market volatility, assets may decline significantly, causing total annual Fund operating expenses to become higher than the figures shown.
See www.franklintempletondatasources.com for additional data provider information.
| | | | | | |
18 | | Annual Report | | | | franklintempleton.com |
FRANKLIN FLORIDA TAX-FREE INCOME FUND
Your Fund’s Expenses
As a Fund shareholder, you can incur two types of costs: (1) transaction costs, including sales charges (loads) on Fund purchases and redemptions; and (2) ongoing Fund costs, including management fees, distribution and service(12b-1) fees, and other Fund expenses. All mutual funds have ongoing costs, sometimes referred to as operating expenses. The table below shows ongoing costs of investing in the Fund and can help you understand these costs and compare them with those of other mutual funds. The table assumes a $1,000 investment held for the six months indicated.
Actual Fund Expenses
The table below provides information about actual account values and actual expenses in the columns under the heading “Actual.” In these columns the Fund’s actual return, which includes the effect of Fund expenses, is used to calculate the “Ending Account Value” for each class of shares. You can estimate the expenses you paid during the period by following these steps (of course, your account value and expenses will differ from those in this illustration): Divide your account value by $1,000 (if your account had an $8,600 value, then $8,600÷ $1,000 = 8.6). Then multiply the result by the number in the row for your class of shares under the headings “Actual” and “Expenses Paid During Period” (if Actual Expenses Paid During Period were $7.50, then 8.6 x $7.50 =$64.50). In this illustration, the actual expenses paid this period are $64.50.
Hypothetical Example for Comparison with Other Funds
Under the heading “Hypothetical” in the table, information is provided about hypothetical account values and hypothetical expenses based on the Fund’s actual expense ratio and an assumed rate of return of 5% per year before expenses, which is not the Fund’s actual return. This information may not be used to estimate the actual ending account balance or expenses you paid for the period, but it can help you compare ongoing costs of investing in the Fund with those of other funds. To do so, compare this 5% hypothetical example for the class of shares you hold with the 5% hypothetical examples that appear in the shareholder reports of other funds.
Please note that expenses shown in the table are meant to highlight ongoing costs and do not reflect any transactional costs. Therefore, information under the heading “Hypothetical” is useful in comparing ongoing costs only, and will not help you compare total costs of owning different funds. In addition, if transactional costs were included, your total costs would have been higher.
| | | | | | | | | | | | |
| | | | | Actual (actual return after expenses) | | Hypothetical (5% annual return before expenses) | | |
| | | | | | | | |
Share Class | | Beginning
Account
Value1 | | Ending Account
Value 2/28/19 | | Expenses
Paid During
Period2,3,4 | | Ending Account
Value 2/28/19 | | Expenses Paid During Period 9/1/18–2/28/193,4 | | Net
Annualized
Expense
Ratio4 |
| | | | | | |
A | | $1,000 | | $1,017.10 | | $4.02 | | $1,020.58 | | $4.26 | | 0.85% |
A1 | | $1,000 | | $1,013.80 | | $3.60 | | $1,021.22 | | $3.61 | | 0.72% |
C | | $1,000 | | $1,010.60 | | $6.33 | | $1,018.50 | | $6.36 | | 1.27% |
R6 | | $1,000 | | $1,015.30 | | $2.85 | | $1,021.97 | | $2.86 | | 0.57% |
Advisor | | $1,000 | | $1,015.20 | | $3.10 | | $1,021.72 | | $3.11 | | 0.62% |
1. For Classes A1, C, R6 and Advisor 9/1/18 for Actual and Hypothetical. For Class A, 9/10/18 for Actual and 9/1/18 for Hypothetical.
2. For Classes A1, C, R6 and Advisor, 9/1/18–2/28/19. For Class A, 9/10/18–2/28/19.
3. Expenses are equal to the annualized expense ratio for thesix-month period as indicated above—in the far right column—multiplied by the simple average account value over the period indicated, and then multiplied by 181/365 to reflect theone-half year period. The multiplier is 171/365 for Actual Class A expenses to reflect the number of days since inception.
4. Reflects expenses after fee waivers and expense reimbursements, for Class R6.
| | | | | | | | |
franklintempleton.com | | | | | | Annual Report | | 19 |
Franklin GeorgiaTax-Free Income Fund
We are pleased to bring you Franklin GeorgiaTax-Free Income Fund’s annual report for the fiscal year ended February 28, 2019.
Your Fund’s Goal and Main Investments
The Fund seeks to provide as high a level of income exempt from federal and Georgia personal income taxes as is consistent with prudent investment management and preservation of capital by investing at least 80% of its total assets in securities that pay interest free from such taxes.1
Credit Quality Composition*
2/28/19
| | |
| | | % of Total |
| Ratings | | Investments |
| |
AAA | | 8.33% |
| |
AA | | 63.43% |
| |
A | | 13.06% |
| |
BBB | | 2.82% |
| |
Below Investment Grade | | 0.77% |
| |
Refunded | | 10.96% |
| |
Not Rated | | 0.63% |
*Securities, except for those labeled Not Rated, are assigned ratings by one or more Nationally Recognized Statistical Credit Rating Organizations (NRSROs), such as Standard & Poor’s, Moody’s and Fitch, that can be considered by the investment manager as part of its independent securities analysis. When ratings from multiple agencies are available, the highest is used, consistent with the portfolio investment process. Ratings reflect an NRSRO’s opinion of an issuer’s creditworthiness and typically range from AAA (highest) to D (lowest). The Below Investment Grade category consists of bonds rated belowBBB-. The Refunded category generally consists of refunded bonds secured by U.S. government or other high-quality securities and not rerated by an NRSRO. The Not Rated category consists of ratable securities that have not been rated by an NRSRO. Cash and equivalents are excluded from this composition.
Performance Overview
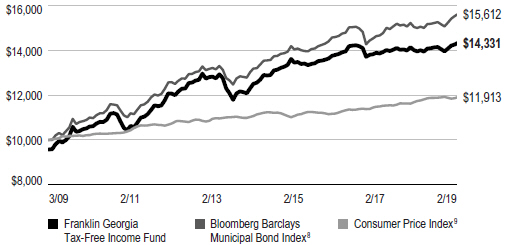
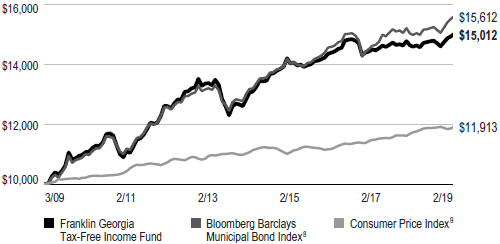
The Fund’s Class A share price, as measured by net asset value, increased from $11.57 on September 10, 2018, to $11.59 on February 28, 2019. The Fund’s Class A shares paid dividends totaling 17.12 cents per share for the same period.2 The Performance Summary beginning on page 23 shows that at the end of this reporting period the Fund’s Class A shares’ distribution rate was 2.95% based on an annualization of February’s 2.97 cent per share monthly dividend and the
Dividend Distributions*
3/1/18–2/28/19
| | | | | | | | | | | | | | | | | | | | |
| | | Dividend per Share (cents) | |
| | | Class | | | Class | | | | | | | | | Advisor | |
| Month | | A** | | | A1 | | | Class C | | | Class R6 | | | Class | |
March | | | — | | | | 3.17 | | | | 2.62 | | | | 3.28 | | | | 3.26 | |
April | | | — | | | | 3.17 | | | | 2.62 | | | | 3.28 | | | | 3.26 | |
May | | | — | | | | 3.17 | | | | 2.62 | | | | 3.28 | | | | 3.26 | |
June | | | — | | | | 3.22 | | | | 2.68 | | | | 3.34 | | | | 3.31 | |
July | | | — | | | | 3.22 | | | | 2.68 | | | | 3.34 | | | | 3.31 | |
August | | | — | | | | 3.22 | | | | 2.68 | | | | 3.34 | | | | 3.31 | |
September | | | 1.97 | | | | 3.22 | | | | 2.67 | | | | 3.34 | | | | 3.31 | |
October | | | 3.07 | | | | 3.22 | | | | 2.67 | | | | 3.34 | | | | 3.31 | |
November | | | 3.07 | | | | 3.22 | | | | 2.67 | | | | 3.34 | | | | 3.31 | |
December | | | 3.07 | | | | 3.22 | | | | 2.68 | | | | 3.34 | | | | 3.31 | |
January | | | 2.97 | | | | 3.12 | | | | 2.58 | | | | 3.24 | | | | 3.21 | |
February | | | 2.97 | | | | 3.12 | | | | 2.58 | | | | 3.24 | | | | 3.21 | |
Total | | | 17.12 | | | | 38.29 | | | | 31.75 | | | | 39.70 | | | | 39.37 | |
*The distribution amount is the sum of all net investment income distributions for the period shown. Assumes shares were purchased and held for the entire accrual period. Since dividends accrue daily, your actual distributions will vary depending on the date you purchased your shares and any account activity. All Fund distributions will vary depending upon current market conditions, and past distributions are not indicative of future trends.
**Effective 9/10/18, the Fund began offering Class A shares. See the prospectus for details.
maximum offering price of $12.10 on February 28, 2019. An investor in the 2019 maximum combined effective federal and Georgia personal income tax bracket of 46.80% (including 3.80% Medicare tax) would need to earn a distribution rate of 5.55% from a taxable investment to match the Fund’s Class Atax-free distribution rate. For other performance data, please see the Performance Summary. Dividend distributions were affected by low interest rates during the period. This and other factors resulted in reduced income for the portfolio and caused dividends to be lower at the end of the period.
Performance data represent past performance, which does not guarantee future results. Investment return and principal value will fluctuate, and you may have a gain or loss when you sell your shares. Current performance may differ from figures shown. For most recentmonth-end performance, go tofranklintempleton.comor call(800)342-5236.
1. For investors subject to alternative minimum tax, a small portion of Fund dividends may be taxable. Distributions of capital gains are generally taxable. To avoid imposition of 28% backup withholding on all Fund distributions and redemption proceeds, U.S. investors must be properly certified on FormW-9 andnon-U.S. investors on FormW-8BEN.
2. The distribution amount is the sum of all net investment income distributions for the period shown. Assumes shares were purchased and held for the entire accrual period. Since dividends accrue daily, your actual distributions will vary depending on the date you purchased your shares and any account activity. All Fund distributions will vary depending upon current market conditions, and past distributions are not indicative of future trends.
The dollar value, number of shares or principal amount, and names of all portfolio holdings are listed in the Fund’s Statement of Investments (SOI). The SOI begins on page 97.
| | | | |
20 | | Annual Report | | franklintempleton.com |
FRANKLIN GEORGIA TAX-FREE INCOME FUND
State Update
During the 12 months under review, Georgia’s well-diversified and broad-based economy outpaced the nation. The Atlanta metropolitan area is the engine of the state’s economic performance, and has recently experienced one of the largest population increases in the U.S. Stateper-capita income is lower than the nation’s, but recent economic growth is closing the gap. Georgia’s low cost of living, strong transportation network, solid population growth, and favorable weather and business costs have attracted business investment and job creation. Ongoing job growth has bolstered income tax and sales tax receipts that account for the majority of general fund revenue. Georgia’s unemployment rate declined from 4.2% in February 2018 to 3.9% atperiod-end, which was higher than the nation’s 3.8% unemployment rate.3
In March 2018, the governor signed an amended fiscal year 2018 budget, which assumed increased net revenue collections compared with the previous fiscal year. The amended budget, although reflecting few changes to what was enacted, did provide additional funding to local governments, public education, and economic development efforts. The budget adopted for the 2019 fiscal year, which began on July 1, 2018, assumed net revenue growth over the 2018 amended budget, including expected tax growth. Budget priorities included eliminating remaining austerity adjustments, providing additional funds for the Quality Basic Education (QBE) program to fund enrollment growth and teacher training, and fully funding the QBE funding formula. Additional funds were added for contributions to the Teachers’ Retirement System and for Medicaid services, although Georgia is not a Medicaid expansion state. Georgia’s legislature proposed a $27.5 billion fiscal year 2020 budget to increase spending forK-12 education with smaller raises for teachers. The budget would also increase public health care funding, including nursing home care for the elderly and disabled.
The state’s nettax-supported debt was 2.4% of personal income and $986 per capita, compared with the 2.3% and $987 national medians.4 Independent credit rating agency Standard & Poor’s (S&P) affirmed Georgia’s general obligation AAA debt rating with a stable outlook.5 In S&P’s view the rating reflected Georgia’s well-diversified and broad-based economic growth that outpaces the nation, strong financial monitoring and oversight including a history of budget adjustments (usually through spending cuts) when needed to restore fiscal
Portfolio Composition
2/28/19
| | | | |
| |
| % of Total
Investments |
* |
| |
Utilities | | | 19.41% | |
| |
Hospital & Health Care | | | 17.74% | |
| |
General Obligation | | | 13.87% | |
| |
Subject to Government Appropriations | | | 12.95% | |
| |
Refunded** | | | 11.45% | |
| |
Higher Education | | | 8.03% | |
| |
Tax-Supported | | | 6.58% | |
| |
Transportation | | | 5.81% | |
| |
Housing | | | 4.16% | |
| |
*Does not include cash and cash equivalents.
**Includes all refunded bonds; the percentage may differ from that in the Credit Quality Composition.
balance, continued growth in the state’s revenue shortfall reserve, a moderate debt position coupled with rapid amortization, and proactive management of long-term liabilities through full funding of state pension contributions and creation of reserves for other post-employment benefits. The state’s stable outlook is due to active management of its budget and revenue forecast coupled with Georgia’s willingness to adjust to unforeseen economic events.
Manager’s Discussion
We used various investment strategies during the 12 months under review as we sought to maximizetax-free income for shareholders. Please read the Investment Strategy and Manager’s Discussion on page 4 for more information.
Thank you for your continued participation in Franklin GeorgiaTax-Free Income Fund. We believe our conservative,buy-and-hold investment strategy can help us achieve high, current,tax-free income for shareholders.
3. Source: Bureau of Labor Statistics.
4. Source:Moody’s Investors Service, “States - US: Medians - State debt continues slow growth trend,” 4/24/18.
5. This does not indicate S&P’s rating of the Fund.
| | | | | | | | |
franklintempleton.com | | | | | | Annual Report | | 21 |
FRANKLIN GEORGIATAX-FREE INCOME FUND
The foregoing information reflects our analysis, opinions and portfolio holdings as of February 28, 2019, the end of the reporting period. The way we implement our main investment strategies and the resulting portfolio holdings may change depending on factors such as market and economic conditions. These opinions may not be relied upon as investment advice or an offer for a particular security. The information is not a complete analysis of every aspect of any market, state, industry, security or the Fund. Statements of fact are from sources considered reliable, but the investment manager makes no representation or warranty as to their completeness or accuracy. Although historical performance is no guarantee of future results, these insights may help you understand our investment management philosophy.
| | | | | | |
22 | | Annual Report | | | | franklintempleton.com |
FRANKLIN GEORGIATAX-FREE INCOME FUND
Performance Summary as of February 28, 2019
The performance tables and graphs do not reflect any taxes that a shareholder would pay on Fund dividends, capital gain distributions, if any, or any realized gains on the sale of Fund shares. Total return reflects reinvestment of the Fund’s dividends and capital gain distributions, if any, and any unrealized gains or losses. Your dividend income will vary depending on dividends or interest paid by securities in the Fund’s portfolio, adjusted for operating expenses of each class. Capital gain distributions are net profits realized from the sale of portfolio securities.
Performance as of 2/28/19
Cumulative total return excludes sales charges. Average annual total return includes maximum sales charges. Sales charges will vary depending on the size of the investment and the class of share purchased. The maximum is 4.25% and the minimum is 0%.Class A:4.25% maximum initial sales charge;Advisor Class:no sales charges. For other share classes, visitfranklintempleton.com.
| | | | |
| Share Class | | Cumulative Total Return1 | | Average Annual
Total Return2 |
| | |
A3 | | | | |
1-Year | | +2.74% | | -1.62% |
5-Year | | +14.63% | | +1.88% |
10-Year | | +49.67% | | +3.66% |
| | |
Advisor4 | | | | |
1-Year | | +2.83% | | +2.83% |
5-Year | | +15.03% | | +2.84% |
10-Year | | +50.12% | | +4.15% |
| | | | | | | | | | | | | | | | | | |
| Share Class | | Distribution Rate5 | | | | | Taxable Equivalent
Distribution Rate6 | | | 30-Day Standardized Yield7 | | | Taxable Equivalent
30-Day Standardized Yield6 | |
A | | | 2.95% | | | | | | 5.55% | | | | 1.80% | | | | 3.38% | |
Advisor | | | 3.32% | | | | | | 6.24% | | | | 2.12% | | | | 3.98% | |
Performance data represent past performance, which does not guarantee future results. Investment return and principal value will fluctuate, and you may have a gain or loss when you sell your shares. Current performance may differ from figures shown. For most recentmonth-end performance, go tofranklintempleton.comor call(800)342-5236.
See page 26 for Performance Summary footnotes.
| | | | | | | | |
franklintempleton.com | | | | | | Annual Report | | 23 |
FRANKLIN GEORGIATAX-FREE INCOME FUND
PERFORMANCE SUMMARY
Total Return Index Comparison for a Hypothetical $10,000 Investment
Total return represents the change in value of an investment over the periods shown. It includes any applicable maximum sales charge, Fund expenses, account fees and reinvested distributions. The unmanaged indexes include reinvestment of any income or distributions. They differ from the Fund in composition and do not pay management fees or expenses. One cannot invest directly in an index.
Class A(3/1/09–2/28/19)
Advisor Class(3/1/09–2/28/19)
See page 26 for Performance Summary footnotes.
| | | | | | |
24 | | Annual Report | | | | franklintempleton.com |
FRANKLIN GEORGIATAX-FREE INCOME FUND
PERFORMANCE SUMMARY
Net Asset Value
| | | | | | | | | | | | | | | | |
| Share Class(Symbol) | | 2/28/19 | | | 9/10/18 | | | 2/28/18 | | | Change | |
A (FGAQX) | | | $11.59 | | | | $11.57 | | | | N/A | | | | +$0.02 | |
A1(FTGAX) | | | $11.59 | | | | N/A | | | | $11.65 | | | | -$0.06 | |
C (FGAIX) | | | $11.77 | | | | N/A | | | | $11.83 | | | | -$0.06 | |
R6(FGFQX) | | | $11.59 | | | | N/A | | | | $11.66 | | | | -$0.07 | |
Advisor(FGFZX) | | | $11.59 | | | | N/A | | | | $11.66 | | | | -$0.07 | |
|
| Distributions(3/1/18–2/28/19) | |
| | | | |
| | | Net Investment | | | | | | | | | | |
| Share Class | | Income | | | | | | | | | | |
| | | | | | | | | | | | | |
A (9/10/18–2/28/19) | | | $0.1712 | | | | | | | | | | | | | |
| | | | | | | | | | | | | |
A1 | | | $0.3829 | | | | | | | | | | | | | |
| | | | | | | | | | | | | |
C | | | $0.3175 | | | | | | | | | | | | | |
| | | | | | | | | | | | | |
R6 | | | $0.3970 | | | | | | | | | | | | | |
| | | | | | | | | | | | | |
Advisor | | | $0.3937 | | | | | | | | | | | | | |
| | | | | | | | | | | | | |
|
| Total Annual Operating Expenses10 | |
| | | |
| Share Class | | | | | | | | | | |
| | | | | | | | | | | | | |
A | | | 0.84% | | | | | | | | | | | | | |
| | | | | | | | | | | | | |
Advisor | | | 0.59% | | | | | | | | | | | | | |
| | | | | | | | | | | | | |
See page 26 for Performance Summary footnotes.
| | | | | | | | |
franklintempleton.com | | | | | | Annual Report | | 25 |
FRANKLIN GEORGIATAX-FREE INCOME FUND
PERFORMANCE SUMMARY
Each class of shares is available to certain eligible investors and has different annual fees and expenses, as described in the prospectus.
All investments involve risks, including possible loss of principal. Because municipal bonds are sensitive to interest rate movements, the Fund’s yield and shareprice will fluctuate with market conditions. Bond prices generally move in the opposite direction of interest rates. Thus, as prices of bonds in the Fund adjust to a rise in interest rates, the Fund’s share price may decline. Because the Fund invests principally in a single state, it is subject to greater risk of adverse economic and regulatory changes in that state than a geographically diversified fund. Puerto Rico municipal bonds have been impacted by recent adverse economic and market changes, which may cause the Fund’s share price to decline. Changes in the credit rating of a bond, or in the credit rating or financial strength of a bond’s issuer, insurer or guarantor, may affect the bond’s value. The Fund may invest a significant part of its assets in municipal securities that finance similar types of projects, such as utilities, hospitals, higher education and transportation. A change that affects one project would likely affect all similar projects, thereby increasing market risk. The Fund is actively managed but there is no guarantee that the manager’s investment decisions will produce the desired results. The Fund’s prospectus also includes a description of the main investment risks.
1. Cumulative total return represents the change in value of an investment over the periods indicated.
2. Average annual total return represents the average annual change in value of an investment over the periods indicated. Return for less than one year, if any, has not been annualized.
3. Effective 9/10/18, Class A shares closed to new investors, were renamed Class A1 shares, and a new Class A share with a different expense structure became available. Class A performance shown has been calculated as follows: (a) for periods prior to 9/10/18, a restated figure is used based on the Fund’s Class A1 performance that includes any Rule12b-1 rate differential that exists between Class A1 and Class A; and (b) for periods after 9/10/18, actual Class A performance is used, reflecting all charges and fees applicable to that class.
4. Effective 9/15/16, the Fund began offering Advisor Class shares, which do not have sales charges or a Rule12b-1 plan. Performance quotations for this class reflect the following methods of calculation: (a) For periods prior to 9/15/16, a restated figure is used based upon the Fund’s Class A performance, excluding the effect of Class A’s maximum initial sales charge, but reflecting the effect of the Class A Rule12b-1 fees; and (b) for periods after 9/15/16, actual Advisor Class performance is used reflecting all charges and fees applicable to that class. Since 9/15/16 (commencement of sales), the cumulative and average annual total returns of Advisor Class shares were +1.61% and +0.65%.
5. Distribution rate is based on an annualization of the respective class’s February dividend and the maximum offering price (NAV for Advisor Class) per share on 2/28/19.
6. Taxable equivalent distribution rate and yield assume the published rates as of 12/18/18 for the maximum combined effective federal and Georgia personal income tax rate of 46.80%, based on the federal income tax rate of 37.00% plus 3.80% Medicare tax.
7. The Fund’s30-day standardized yield is calculated over a trailing30-day period using the yield to maturity on bonds and/or the dividends accrued on stocks. It may not equal the Fund’s actual income distribution rate, which reflects the Fund’s past dividends paid to shareholders.
8. Source: Morningstar. The Bloomberg Barclays Municipal Bond Index is a market value-weighted index engineered for the long-termtax-exempt bond market. To be included in the index, bonds must be fixed rate, have at least one year to final maturity and be rated investment grade(Baa3/BBB- or higher) by at least two of the following agencies: Moody’s, S&P and Fitch.
9. Source: Bureau of Labor Statistics, bls.gov/cpi. The Consumer Price Index is a commonly used measure of the inflation rate.
10. Figures are as stated in the Fund’s current prospectus and may differ from the expense ratios disclosed in the Your Fund’s Expenses and Financial Highlights sections in this report. In periods of market volatility, assets may decline significantly, causing total annual Fund operating expenses to become higher than the figures shown.
See www.franklintempletondatasources.com for additional data provider information.
| | | | | | |
26 | | Annual Report | | | | franklintempleton.com |
FRANKLIN GEORGIATAX-FREE INCOME FUND
Your Fund’s Expenses
As a Fund shareholder, you can incur two types of costs: (1) transaction costs, including sales charges (loads) on Fund purchases and redemptions; and (2) ongoing Fund costs, including management fees, distribution and service(12b-1) fees, and other Fund expenses. All mutual funds have ongoing costs, sometimes referred to as operating expenses. The table below shows ongoing costs of investing in the Fund and can help you understand these costs and compare them with those of other mutual funds. The table assumes a $1,000 investment held for the six months indicated.
Actual Fund Expenses
The table below provides information about actual account values and actual expenses in the columns under the heading “Actual.” In these columns the Fund’s actual return, which includes the effect of Fund expenses, is used to calculate the “Ending Account Value” for each class of shares. You can estimate the expenses you paid during the period by following these steps (of course, your account value and expenses will differ from those in this illustration): Divide your account value by $1,000 (if your account had an $8,600 value, then $8,600÷ $1,000 = 8.6). Then multiply the result by the number in the row for your class of shares under the headings “Actual” and “Expenses Paid During Period” (if Actual Expenses Paid During Period were $7.50, then 8.6 x $7.50 =$64.50). In this illustration, the actual expenses paid this period are $64.50.
Hypothetical Example for Comparison with Other Funds
Under the heading “Hypothetical” in the table, information is provided about hypothetical account values and hypothetical expenses based on the Fund’s actual expense ratio and an assumed rate of return of 5% per year before expenses, which is not the Fund’s actual return. This information may not be used to estimate the actual ending account balance or expenses you paid for the period, but it can help you compare ongoing costs of investing in the Fund with those of other funds. To do so, compare this 5% hypothetical example for the class of shares you hold with the 5% hypothetical examples that appear in the shareholder reports of other funds.
Please note that expenses shown in the table are meant to highlight ongoing costs and do not reflect any transactional costs. Therefore, information under the heading “Hypothetical” is useful in comparing ongoing costs only, and will not help you compare total costs of owning different funds. In addition, if transactional costs were included, your total costs would have been higher.
| | | | | | | | | | | | | | | | | | |
| | | | | | | Actual | | | | Hypothetical | | | | |
| | | | | | | (actual return after expenses) | | | | (5% annual return before expenses) | | | | |
| | | | | | | | | | | | | | |
| | | | | | | | | | | | | | | Expenses | | | | Net |
| | | Beginning | | | | Ending | | Expenses | | | | Ending | | Paid During | | | | Annualized |
| Share | | Account | | | | Account | | Paid During | | | | Account | | Period | | | | Expense |
| Class | | Value1 | | | | Value 2/28/19 | | Period2,3,4 | | | | Value 2/28/19 | | 9/1/18–2/28/193,4
| | | | Ratio4 |
| | | | | | | | | | | | |
A | | $1,000 | | | | $1,017.00 | | $4.11 | | | | $1,020.48 | | $4.36 | | | | 0.87% |
A1 | | $1,000 | | | | $1,014.10 | | $3.65 | | | | $1,021.17 | | $3.66 | | | | 0.73% |
C | | $1,000 | | | | $1,011.90 | | $6.39 | | | | $1,018.45 | | $6.41 | | | | 1.28% |
R6 | | $1,000 | | | | $1,014.70 | | $2.90 | | | | $1,021.92 | | $2.91 | | | | 0.58% |
Advisor | | $1,000 | | | | $1,014.60 | | $3.15 | | | | $1,021.67 | | $3.16 | | | | 0.63% |
1. For Classes A1, C, R6 and Advisor 9/1/18 for Actual and Hypothetical. For Class A, 9/10/18 for Actual and 9/1/18 for Hypothetical.
2. For Classes A1, C, R6 and Advisor, 9/1/18–2/28/19. For Class A, 9/10/18–2/28/19.
3. Expenses are equal to the annualized expense ratio for thesix-month period as indicated above—in the far right column—multiplied by the simple average account value over the period indicated, and then multiplied by 181/365 to reflect theone-half year period. The multiplier is 171/365 for Actual Class A expenses to reflect the number of days since inception.
4. Reflects expenses after fee waivers and expense reimbursements, for Class R6.
| | | | | | | | |
franklintempleton.com | | | | | | Annual Report | | 27 |
Franklin KentuckyTax-Free Income Fund
We are pleased to bring you Franklin KentuckyTax-Free Income Fund’s annual report for the fiscal year ended February 28, 2019.
Your Fund’s Goal and Main Investments
The Fund seeks to provide as high a level of income exempt from federal and Kentucky personal income taxes as is consistent with prudent investment management and preservation of capital by investing at least 80% of its total assets in securities that pay interest free from such taxes.1
Credit Quality Composition*
2/28/19
| | | | |
| Ratings | | % of Total
Investments | |
| |
| |
AAA | | | 4.84% | |
| |
| |
AA | | | 40.27% | |
| |
| |
A | | | 32.94% | |
| |
| |
BBB | | | 11.48% | |
| |
| |
Refunded | | | 10.47% | |
| |
*Securities, except for those labeled Not Rated, are assigned ratings by one or more Nationally Recognized Statistical Credit Rating Organizations (NRSROs), such as Standard & Poor’s, Moody’s and Fitch, that can be considered by the investment manager as part of its independent securities analysis. When ratings from multiple agencies are available, the highest is used, consistent with the portfolio investment process. Ratings reflect an NRSRO’s opinion of an issuer’s creditworthiness and typically range from AAA (highest) to D (lowest). The Below Investment Grade category consists of bonds rated belowBBB-. The Refunded category generally consists of refunded bonds secured by U.S. government or other high-quality securities and not rerated by an NRSRO. The Not Rated category consists of ratable securities that have not been rated by an NRSRO. Cash and equivalents are excluded from this composition.
Performance Overview
The Fund’s Class A share price, as measured by net asset value, increased from $10.68 on September 10, 2018, to $10.76 on February 28, 2019. The Fund’s Class A shares paid dividends totaling 14.55 cents per share for the same period.2 The Performance Summary beginning on page 31 shows that at the end of this reporting period the Fund’s Class A shares’ distribution rate was 2.83% based on an annualization of February’s 2.65 cent per share monthly dividend and the maximum offering price of $11.24 on February 28, 2019. An investor in the 2019 maximum combined effective federal and Kentucky personal income tax bracket of 46.80% (including
Dividend Distributions*
3/1/18–2/28/19
| | | | | | | | | | | | | | | | |
| | | Dividend per Share (cents) | |
| | | | |
| Month | | Class
A** | | | Class
A1 | | | Class R6 | | | Advisor
Class | |
March | | | — | | | | 3.00 | | | | 3.11 | | | | 3.09 | |
April | | | — | | | | 3.00 | | | | 3.11 | | | | 3.09 | |
May | | | — | | | | 3.00 | | | | 3.11 | | | | 3.09 | |
June | | | — | | | | 2.93 | | | | 3.04 | | | | 3.01 | |
July | | | — | | | | 2.83 | | | | 2.94 | | | | 2.91 | |
August | | | — | | | | 2.68 | | | | 2.79 | | | | 2.76 | |
September | | | 1.63 | | | | 2.68 | | | | 2.80 | | | | 2.76 | |
October | | | 2.54 | | | | 2.68 | | | | 2.80 | | | | 2.76 | |
November | | | 2.54 | | | | 2.68 | | | | 2.80 | | | | 2.76 | |
December | | | 2.54 | | | | 2.68 | | | | 2.79 | | | | 2.76 | |
January | | | 2.65 | | | | 2.79 | | | | 2.90 | | | | 2.87 | |
February | | | 2.65 | | | | 2.79 | | | | 2.90 | | | | 2.87 | |
Total | | | 14.55 | | | | 33.74 | | | | 35.09 | | | | 34.73 | |
*The distribution amount is the sum of all net investment income distributions for the period shown. Assumes shares were purchased and held for the entire accrual period. Since dividends accrue daily, your actual distributions will vary depending on the date you purchased your shares and any account activity. All Fund distributions will vary depending upon current market conditions, and past distributions are not indicative of future trends.
**Effective 9/10/18, the Fund began offering Class A shares. See the prospectus for details.
3.80% Medicare tax) would need to earn a distribution rate of 5.32% from a taxable investment to match the Fund’s Class Atax-free distribution rate. For other performance data, please see the Performance Summary. Dividend distributions were affected by low interest rates during the period. This and other factors resulted in reduced income for the portfolio and caused dividends to be lower at the end of the period.
Performance data represent past performance, which does not guarantee future results. Investment return and principal value will fluctuate, and you may have a gain or loss when you sell your shares. Current performance may differ from figures shown. For most recentmonth-end performance, go tofranklintempleton.comor call(800)342-5236.
Commonwealth Update
During the 12 months under review, Kentucky’s economy continued to grow modestly, given slow population gains and
1. For investors subject to alternative minimum tax, a small portion of Fund dividends may be taxable. Distributions of capital gains are generally taxable. To avoid imposition of 28% backup withholding on all Fund distributions and redemption proceeds, U.S. investors must be properly certified on FormW-9 andnon-U.S. investors on FormW-8BEN.
2. The distribution amount is the sum of all net investment income distributions for the period shown. Assumes shares were purchased and held for the entire accrual period. Since dividends accrue daily, your actual distributions will vary depending on the date you purchased your shares and any account activity. All Fund distributions will vary depending upon current market conditions, and past distributions are not indicative of future trends.
The dollar value, number of shares or principal amount, and names of all portfolio holdings are listed in the Fund’s Statement of Investments (SOI). The SOI begins on page 105.
| | | | |
28 | | Annual Report | | franklintempleton.com |
FRANKLIN KENTUCKY TAX-FREE INCOME FUND
marginal expansion in a number of job sectors. The health care sector is an important component of economic stability and employment in Kentucky, as Kentucky expanded Medicare under the Affordable Care Act. However, the commonwealth’s economy continued to be hindered by relatively low wealth levels and a weak demographic profile that includes an aging population. Kentucky’s unemployment rate declined from 4.3% in February 2018 to end the period at 4.1%, which was higher than the nation’s 3.8% unemployment rate.3
Growth in fiscal year 2018 general fund collections over the prior fiscal year may assist efforts to achieve structural balance across the commonwealth’s operations despite higher fixed costs, which are an important aspect of Kentucky’s budget. Kentucky’s 2019– 2020 biennium budget was passed in April 2018 after being revised to address the governor’s concerns about funding for a statewide broadband construction project. The new budget included a plan to replenish the commonwealth’s rainy day fund, reduced higher education funding and modest reductions to employee benefits. Kentucky’s pension reforms, also approved in April 2018, were struck down by a lower court in June 2018 after being challenged by the state attorney general. The governor filed an appeal to the Kentucky Supreme Court, and in December 2018, the court struck down the pension reforms. Kentucky has increased pension funding in recent years, but unfunded pension liabilities remain a significant budgetary issue. Nearperiod-end the governor proposed issuing park improvement bonds, increased higher education funding andnon-profit sales tax exemptions in the 2020 fiscal year. The proposal was approved by a state house committee despite lower state revenues and pension worries.
Kentucky’s nettax-supported debt was 5.1% of personal income and $1,995 per capita, compared with the 2.3% and $987 national medians.4 In May 2018, Standard & Poor’s (S&P) downgraded Kentucky’s issuer credit rating to A with a stable outlook.5 The rating reflected increased vulnerability to fiscal strain resulting from rising pension costs and years of uneven budgetary management that has relied on spending and reserve reductions amid economic expansion. Kentucky’s moderately high debt burden, including a large unfunded pension liability, and increasing Medicaid costs to cover expansion under the Affordable Care Act are likely to further pressure future budgets. Income levels well below the national average and economic growth that has consistently lagged the nation may also hinder Kentucky’s long-term fiscal health. The
Portfolio Composition
2/28/19
| | | | |
| |
| % of Total
Investments |
* |
| |
Utilities | | | 23.81% | |
| |
Subject to Government Appropriations | | | 22.89% | |
| |
Higher Education | | | 18.96% | |
| |
Refunded** | | | 16.03% | |
| |
Hospital & Health Care | | | 12.26% | |
| |
Housing | | | 3.13% | |
| |
Tax-Supported | | | 1.99% | |
| |
Transportation | | | 0.93% | |
| |
*Does not include cash and cash equivalents.
**Includes all refunded bonds; the percentage may differ from that in the Credit Quality Composition.
stable outlook reflected the implementation of pension reform, the adoption of a biennium budget that fully funds its required pension plan contributions, and the transfer of funds for reserves. Future rating upgrades from S&P will depend on reducing unfunded pension liabilities and achieving structural budgetary balance.
Manager’s Discussion
We used various investment strategies during the 12 months under review as we sought to maximizetax-free income for shareholders. Please read the Investment Strategy and Manager’s Discussion on page 4 for more information.
Thank you for your continued participation in Franklin KentuckyTax-Free Income Fund. We believe our conservative,buy-and-hold investment strategy can help us achieve high, current,tax-free income for shareholders.
3. Source: Bureau of Labor Statistics.
4. Source:Moody’s Investors Service, “States - US: Medians - State debt continues slow growth trend,” 4/24/18.
5. This does not indicate S&P’s rating of the Fund.
| | | | | | | | |
franklintempleton.com | | | | | | Annual Report | | 29 |
FRANKLIN KENTUCKY TAX-FREE INCOME FUND
The foregoing information reflects our analysis, opinions and portfolio holdings as of February 28, 2019, the end of the reporting period. The way we implement our main investment strategies and the resulting portfolio holdings may change depending on factors such as market and economic conditions. These opinions may not be relied upon as investment advice or an offer for a particular security. The information is not a complete analysis of every aspect of any market, state, industry, security or the Fund. Statements of fact are from sources considered reliable, but the investment manager makes no representation or warranty as to their completeness or accuracy. Although historical performance is no guarantee of future results, these insights may help you understand our investment management philosophy.
| | | | | | |
30 | | Annual Report | | | | franklintempleton.com |
FRANKLIN KENTUCKY TAX-FREE INCOME FUND
Performance Summary as of February 28, 2019
The performance tables and graphs do not reflect any taxes that a shareholder would pay on Fund dividends, capital gain distributions, if any, or any realized gains on the sale of Fund shares. Total return reflects reinvestment of the Fund’s dividends and capital gain distributions, if any, and any unrealized gains or losses. Your dividend income will vary depending on dividends or interest paid by securities in the Fund’s portfolio, adjusted for operating expenses of each class. Capital gain distributions are net profits realized from the sale of portfolio securities.
Performance as of 2/28/19
Cumulative total return excludes sales charges. Average annual total return includes maximum sales charges. Sales charges will vary depending on the size of the investment and the class of share purchased. The maximum is 4.25% and the minimum is 0%.Class A:4.25% maximum initial sales charge;Advisor Class:no sales charges. For other share classes, visitfranklintempleton.com.
| | | | |
| Share Class | | Cumulative Total Return1 | | Average Annual Total Return2 |
| | |
A3 | | | | |
1-Year | | +3.02% | | -1.36% |
5-Year | | +15.17% | | +1.98% |
10-Year | | +48.73% | | +3.60% |
| | |
Advisor4 | | | | |
1-Year | | +3.10% | | +3.10% |
5-Year | | +15.46% | | +2.92% |
10-Year | | +49.09% | | +4.07% |
| | | | | | | | | | | | | | | | |
| | | Distribution | | | Taxable Equivalent | | | | | | Taxable Equivalent | |
| Share Class | | Rate5 | | | Distribution Rate6 | | | 30-Day Standardized Yield7 | | | 30-Day Standardized Yield6 | |
A | | | 2.83% | | | | 5.32% | | | | 1.79% | | | | 3.36% | |
Advisor | | | 3.20% | | | | 6.02% | | | | 2.09% | | | | 3.93% | |
Performance data represent past performance, which does not guarantee future results. Investment return and principal value will fluctuate, and you may have a gain or loss when you sell your shares. Current performance may differ from figures shown. For most recentmonth-end performance, go tofranklintempleton.comor call(800)342-5236.
See page 34 for Performance Summary footnotes.
| | | | | | | | |
franklintempleton.com | | | | | | Annual Report | | 31 |
FRANKLIN KENTUCKY TAX-FREE INCOME FUND
PERFORMANCE SUMMARY
Total Return Index Comparison for a Hypothetical $10,000 Investment
Total return represents the change in value of an investment over the periods shown. It includes any applicable maximum sales charge, Fund expenses, account fees and reinvested distributions. The unmanaged indexes include reinvestment of any income or distributions. They differ from the Fund in composition and do not pay management fees or expenses. One cannot invest directly in an index.
Class A(3/1/09–2/28/19)
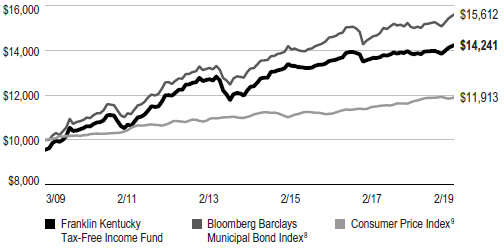
Advisor Class(3/1/09–2/28/19)
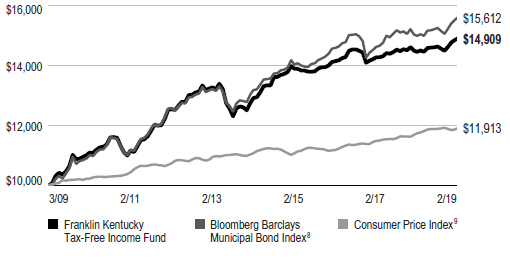
| | | | | | |
32 | | Annual Report | | | | franklintempleton.com |
FRANKLIN KENTUCKY TAX-FREE INCOME FUND
PERFORMANCE SUMMARY
Net Asset Value
| | | | | | | | | | | | | | | | |
| Share Class(Symbol) | | 2/28/19 | | | 9/10/18 | | | 2/28/18 | | | Change | |
A (FRKQX) | | | $10.76 | | | | $10.68 | | | | N/A | | | | +$0.08 | |
A1(FRKYX) | | | $10.75 | | | | N/A | | | | $10.77 | | | | -$0.02 | |
R6 (FKTRX) | | | $10.75 | | | | N/A | | | | $10.77 | | | | -$0.02 | |
Advisor (FKTZX) | | | $10.75 | | | | N/A | | | | $10.77 | | | | -$0.02 | |
Distributions(3/1/18–2/28/19) | | | | | | | | | | | | | |
| Share Class | | Net Investment Income | | | | | | | | | | |
| | | | | | | | | | | | | |
A (9/10/18–2/28/19) | | | $0.1455 | | | | | | | | | | | | | |
| | | | | | | | | | | | | |
A1 | | | $0.3374 | | | | | | | | | | | | | |
| | | | | | | | | | | | | |
R6 | | | $0.3509 | | | | | | | | | | | | | |
| | | | | | | | | | | | | |
Advisor | | | $0.3473 | | | | | | | | | | | | | |
| | | | | | | | | | | | | |
Total Annual Operating Expenses10 | | | | | | | | | |
| | | | |
| Share Class | | | | | | | | | | | | |
| | | | | | | | | | | | | |
A | | | 0.93% | | | | | | | | | | | | | |
| | | | | | | | | | | | | |
Advisor | | | 0.68% | | | | | | | | | | | | | |
| | | | | | | | | | | | | |
See page 34 for Performance Summary footnotes.
| | | | | | | | |
franklintempleton.com | | | | | | Annual Report | | 33 |
FRANKLIN KENTUCKYTAX-FREE INCOME FUND
PERFORMANCE SUMMARY
Each class of shares is available to certain eligible investors and has different annual fees and expenses, as described in the prospectus.
All investments involve risks, including possible loss of principal. Because municipal bonds are sensitive to interest rate movements, the Fund’s yield and share price will fluctuate with market conditions. Bond prices generally move in the opposite direction of interest rates. Thus, as prices of bonds in the Fund adjust to a rise in interest rates, the Fund’s share price may decline. Because the Fund invests principally in a single state, it is subject to greater risk of adverse economic and regulatory changes in that state than a geographically diversified fund. Changes in the credit rating of a bond, or in the credit rating or financial strength of a bond’s issuer, insurer or guarantor, may affect the bond’s value. The Fund may invest a significant part of its assets in municipal securities that finance similar types of projects, such as utilities, hospitals, higher education and transportation. A change that affects one project would likely affect all similar projects, thereby increasing market risk. The Fund is actively managed but there is no guarantee that the manager’s investment decisions will produce the desired results. The Fund’s prospectus also includes a description of the main investment risks.
1. Cumulative total return represents the change in value of an investment over the periods indicated.
2. Average annual total return represents the average annual change in value of an investment over the periods indicated. Return for less than one year, if any, has not been annualized.
3. Effective 9/10/18, Class A shares closed to new investors, were renamed Class A1 shares, and a new Class A share with a different expense structure became available. Class A performance shown has been calculated as follows: (a) for periods prior to 9/10/18, a restated figure is used based on the Fund’s Class A1 performance that includes any Rule12b-1 rate differential that exists between Class A1 and Class A; and (b) for periods after 9/10/18, actual Class A performance is used, reflecting all charges and fees applicable to that class.
4. Effective 9/15/16, the Fund began offering Advisor Class shares, which do not have sales charges or a Rule12b-1 plan. Performance quotations for this class reflect the following methods of calculation: (a) For periods prior to 9/15/16, a restated figure is used based upon the Fund’s Class A performance, excluding the effect of Class A’s maximum initial sales charge, but reflecting the effect of the Class A Rule12b-1 fees; and (b) for periods after 9/15/16, actual Advisor Class performance is used reflecting all charges and fees applicable to that class. Since 9/15/16 (commencement of sales), the cumulative and average annual total returns of Advisor Class shares were +3.01% and +1.22%.
5. Distribution rate is based on an annualization of the respective class’s February dividend and the maximum offering price (NAV for Advisor Class) per share on 2/28/19.
6. Taxable equivalent distribution rate and yield assume the published rates as of 12/18/18 for the maximum combined effective federal and Kentucky personal income tax rate of 46.80%, based on the federal income tax rate of 37.00% plus 3.80% Medicare tax.
7. The Fund’s30-day standardized yield is calculated over a trailing30-day period using the yield to maturity on bonds and/or the dividends accrued on stocks. It may not equal the Fund’s actual income distribution rate, which reflects the Fund’s past dividends paid to shareholders.
8. Source: Morningstar. The Bloomberg Barclays Municipal Bond Index is a market value-weighted index engineered for the long-term tax-exempt bond market. To be included in the index, bonds must be fixed rate, have at least one year to final maturity and be rated investment grade(Baa3/BBB- or higher) by at least two of the following agencies: Moody’s, S&P and Fitch.
9. Source: Bureau of Labor Statistics, bls.gov/cpi. The Consumer Price Index is a commonly used measure of the inflation rate.
10. Figures are as stated in the Fund’s current prospectus and may differ from the expense ratios disclosed in the Your Fund’s Expenses and Financial Highlights sections in this report. In periods of market volatility, assets may decline significantly, causing total annual Fund operating expenses to become higher than the figures shown.
See www.franklintempletondatasources.com for additional data provider information.
| | | | | | |
34 | | Annual Report | | | | franklintempleton.com |
FRANKLIN KENTUCKY TAX-FREE INCOME FUND
Your Fund’s Expenses
As a Fund shareholder, you can incur two types of costs: (1) transaction costs, including sales charges (loads) on Fund purchases and redemptions; and (2) ongoing Fund costs, including management fees, distribution and service(12b-1) fees, and other Fund expenses. All mutual funds have ongoing costs, sometimes referred to as operating expenses. The table below shows ongoing costs of investing in the Fund and can help you understand these costs and compare them with those of other mutual funds. The table assumes a $1,000 investment held for the six months indicated.
Actual Fund Expenses
The table below provides information about actual account values and actual expenses in the columns under the heading “Actual.” In these columns the Fund’s actual return, which includes the effect of Fund expenses, is used to calculate the “Ending Account Value.” You can estimate the expenses you paid during the period by following these steps (of course, your account value and expenses will differ from those in this illustration): Divide your account value by $1,000 (if your account had an $8,600 value, then $8,600÷ $1,000 = 8.6). Then multiply the result by the number in the row for your class of shares under the headings “Actual” and “Expenses Paid During Period” (if Actual Expenses Paid During Period were $7.50, then 8.6 x $7.50 = $64.50). In this illustration, the actual expenses paid this period are $64.50.
Hypothetical Example for Comparison with Other Funds
Under the heading “Hypothetical” in the table, information is provided about hypothetical account values and hypothetical expenses based on the Fund’s actual expense ratio and an assumed rate of return of 5% per year before expenses, which is not the Fund’s actual return. This information may not be used to estimate the actual ending account balance or expenses you paid for the period, but it can help you compare ongoing costs of investing in the Fund with those of other funds. To do so, compare this 5% hypothetical example for the class of shares you hold with the 5% hypothetical examples that appear in the shareholder reports of other funds.
Please note that expenses shown in the table are meant to highlight ongoing costs and do not reflect any transactional costs. Therefore, information under the heading “Hypothetical” is useful in comparing ongoing costs only, and will not help you compare total costs of owning different funds. In addition, if transactional costs were included, your total costs would have been higher.
| | | | | | | | | | | | | | | | | | |
| | | | | | | Actual (actual return after expenses) | | Hypothetical (5% annual return before expenses) | | | | |
| | | | | | | | | | | | | | |
Share
Class | | Beginning
Account
Value 9/1/181 | | | | Ending
Account
Value 2/28/19 | | Expenses
Paid During
Period
9/1/18–2/28/192,3,4 | | | | Ending
Account
Value 2/28/19 | | Expenses
Paid During
Period
9/1/18–2/28/193,4
| | | | Net
Annualized
Expense
Ratio4 |
| | | | | | | | | | | | |
A | | $1,000 | | | | $1,021.60 | | $4.59 | | | | $1,019.98 | | $4.86 | | | | 0.97% |
A1 | | $1,000 | | | | $1,019.20 | | $4.21 | | | | $1,020.63 | | $4.21 | | | | 0.84% |
R6 | | $1,000 | | | | $1,019.80 | | $3.46 | | | | $1,021.37 | | $3.46 | | | | 0.69% |
Advisor | | $1,000 | | | | $1,018.70 | | $3.70 | | | | $1,021.12 | | $3.71 | | | | 0.74% |
1. For Classes A1, R6 and Advisor, 9/1/18 for Actual and Hypothetical. For Class A, 9/10/18 for Actual and 9/1/18 for Hypothetical.
2. For Classes A1, R6 and Advisor, 9/1/18–2/28/19. For Class A,9//10/18-2/28/19.
3. Expenses are equal to the annualized expense ratio for thesix-month period as indicated above—in the far right column—multiplied by the simple average account value over the period indicated, and then multiplied by 181/365 to reflect theone-half year period. The multiplier is 171/365 for Actual Class A expenses to reflect the number of days since inception.
4. Reflects expenses after fee waivers and expense reimbursements, for Class R6.
| | | | |
franklintempleton.com | | Annual Report | | 35 |
Franklin LouisianaTax-Free Income Fund
We are pleased to bring you Franklin LouisianaTax-Free Income Fund’s annual report for the fiscal year ended February 28, 2019.
Your Fund’s Goal and Main Investments
The Fund seeks to provide as high a level of income exempt from federal and Louisiana personal income taxes as is consistent with prudent investment management and preservation of capital by investing at least 80% of its total assets in securities that pay interest free from such taxes.1
Credit Quality Composition*
2/28/19
| | | | |
| Ratings | | % of Total
Investments | |
| |
AAA | | | 0.93% | |
| |
AA | | | 34.41% | |
| |
A | | | 42.85% | |
| |
BBB | | | 2.88% | |
| |
Below Investment Grade | | | 1.24% | |
| |
Refunded | | | 17.69% | |
*Securities, except for those labeled Not Rated, are assigned ratings by one or more Nationally Recognized Statistical Credit Rating Organizations (NRSROs), such as Standard & Poor’s, Moody’s and Fitch, that can be considered by the investment manager as part of its independent securities analysis. When ratings from multiple agencies are available, the highest is used, consistent with the portfolio investment process. Ratings reflect an NRSRO’s opinion of an issuer’s creditworthiness and typically range from AAA (highest) to D (lowest). The Below Investment Grade category consists of bonds rated belowBBB-. The Refunded category generally consists of refunded bonds secured by U.S. government or other high-quality securities and not rerated by an NRSRO. The Not Rated category consists of ratable securities that have not been rated by an NRSRO. Cash and equivalents are excluded from this composition.
Performance Overview
The Fund’s Class A share price, as measured by net asset value, increased from $10.85 on September 10, 2018, to $10.93 on February 28, 2019. The Fund’s Class A shares paid dividends totaling 15.52 cents per share for the same period.2 The Performance Summary beginning on page 39 shows that at the end of this reporting period the Fund’s Class A shares’ distribution rate was 2.89% based on an annualization of February’s 2.75 cent per share monthly dividend and the maximum offering price of $11.42 on February 28, 2019. An
| | | | | | | | | | | | | | | | | | | | |
| Dividend Distributions* | | | | | | | | | | | | | |
3/1/18–2/28/19 | | | | | | | | | | | | | | | | | | | | |
| | | Dividend per Share (cents) | |
| | | | |
| Month | | Class A** | | | Class A1 | | | Class C | | | Class R6 | | | Advisor
Class | |
March | | | — | | | | 2.94 | | | | 2.42 | | | | 3.04 | | | | 3.03 | |
April | | | — | | | | 2.94 | | | | 2.42 | | | | 3.04 | | | | 3.03 | |
May | | | — | | | | 2.94 | | | | 2.42 | | | | 3.04 | | | | 3.03 | |
June | | | — | | | | 2.94 | | | | 2.43 | | | | 3.05 | | | | 3.03 | |
July | | | — | | | | 2.94 | | | | 2.43 | | | | 3.05 | | | | 3.03 | |
August | | | — | | | | 2.89 | | | | 2.38 | | | | 3.00 | | | | 2.98 | |
September | | | 1.77 | | | | 2.89 | | | | 2.38 | | | | 3.00 | | | | 2.98 | |
October | | | 2.75 | | | | 2.89 | | | | 2.38 | | | | 3.00 | | | | 2.98 | |
November | | | 2.75 | | | | 2.89 | | | | 2.38 | | | | 3.00 | | | | 2.98 | |
December | | | 2.75 | | | | 2.89 | | | | 2.39 | | | | 3.00 | | | | 2.97 | |
January | | | 2.75 | | | | 2.89 | | | | 2.39 | | | | 3.00 | | | | 2.97 | |
February | | | 2.75 | | | | 2.89 | | | | 2.39 | | | | 3.00 | | | | 2.97 | |
Total | | | 15.52 | | | | 34.93 | | | | 28.81 | | | | 36.22 | | | | 35.98 | |
*The distribution amount is the sum of all net investment income distributions for the period shown. Assumes shares were purchased and held for the entire accrual period. Since dividends accrue daily, your actual distributions will vary depending on the date you purchased your shares and any account activity. All Fund distributions will vary depending upon current market conditions, and past distributions are not indicative of future trends.
**Effective 9/10/18, the Fund began offering Class A shares. See the prospectus for details.
investor in the 2019 maximum combined effective federal and Louisiana personal income tax bracket of 46.80% (including 3.80% Medicare tax) would need to earn a distribution rate of 5.43% from a taxable investment to match the Fund’s Class Atax-free distribution rate. For other performance data, please see the Performance Summary. Dividend distributions were affected by low interest rates during the period. This and other factors resulted in reduced income for the portfolio and caused dividends to be lower at the end of the period.
Performance data represent past performance, which does not guarantee future results. Investment return and principal value will fluctuate, and you may have a gain or loss when you sell your shares. Current performance may differ from figures shown. For most recentmonth-end performance, go tofranklintempleton.comor call(800)342-5236.
1. For investors subject to alternative minimum tax, a small portion of Fund dividends may be taxable. Distributions of capital gains are generally taxable. To avoid imposition of 28% backup withholding on all Fund distributions and redemption proceeds, U.S. investors must be properly certified on FormW-9 andnon-U.S. investors on FormW-8BEN.
2. The distribution amount is the sum of all net investment income distributions for the period shown. Assumes shares were purchased and held for the entire accrual period. Since dividends accrue daily, your actual distributions will vary depending on the date you purchased your shares and any account activity. All Fund distributions will vary depending upon current market conditions, and past distributions are not indicative of future trends.
The dollar value, number of shares or principal amount, and names of all portfolio holdings are listed in the Fund’s Statement of Investments (SOI). The SOI begins on page 112.
| | | | |
36 | | Annual Report | | franklintempleton.com |
FRANKLIN LOUISIANA TAX-FREE INCOME FUND
State Update
Louisiana’s economy grew during the 12 months under review, as evidenced by improved employment in manufacturing, health and social services and hospitality. However, the state’s slow population growth, high poverty rate and low per capita income relative to the nation’s constrained Louisiana’s economic base, which remained exposed to energy sector fluctuations. Crude oil prices were mixed during the period and did not translate to higher rig counts or other signs of oil industry revival. The state’s unemployment rate increased from 4.7% in February 2018 to 4.9% atperiod-end, which was significantly higher than the 3.8% national average.3
The state initially balanced the fiscal year (FY) 2018 budget (ended June 30, 2018), primarily through a higher revenue forecast and health care spending cuts made possible by increased federal funding. Higher-than-projected tax collections also enabled the state to release some budgeted funds it originally withheld in FY 2018 to help address possiblemid-year shortfalls. The state ended FY 2018 with a budget surplus. In June 2018, the governor signed a balanced FY 2019 budget by enacting a new sales tax effective July 2018 and applying some nonrecurring measures. The budget avoided funding cuts for most state agencies, while including full funding for the Taylor Opportunity Program for Students (TOPS) and higher education and raising pay for state workers. The budget also increased spending for the Department of Children and Family and the Office of Juvenile Justice. In February 2019, the governor proposed the FY 2019–2020 budget, which included fully funding TOPS, maintaining Medicaid funding, increasing spending on education and health care, as well as raising pay for teachers and school employees.
Louisiana’s nettax-supported debt was 3.8% of personal income and $1,627 per capita, compared with the 2.3% and $987 national medians, respectively.4 Independent credit rating agency Moody’s Investors Service (Moody’s) affirmed its rating of Aa3 on Louisiana’s general obligation debt, but changed its outlook from negative to stable earlier in the period.5 The rating reflected Moody’s view of the state’s large and diverse tax base, moderate combined debt and pension burden and adherence to certain financial best practices. According to Moody’s, the state’s challenges include financial and economic strain amid energy sector volatility, difficulty in closing large structural budget gaps, and erosion of reserves and liquidity after years of structural budgetary imbalance. The
| | | | |
Portfolio Composition | | | | |
2/28/19 | | | | |
| | | | |
| |
| % of Total
Investments |
* |
| |
Refunded** | | | 18.49% | |
| |
Hospital & Health Care | | | 15.76% | |
| |
Tax-Supported | | | 14.82% | |
| |
Utilities | | | 13.20% | |
| |
Higher Education | | | 13.04% | |
| |
Transportation | | | 9.21% | |
| |
General Obligation | | | 6.40% | |
| |
Subject to Government Appropriations | | | 5.76% | |
| |
Other Revenue | | | 2.16% | |
| |
Housing | | | 1.16% | |
| |
*Does not include cash and cash equivalents.
**Includes all refunded bonds; the percentage may differ from that in the Credit Quality Composition.
stable outlook reflected the state’s recent stabilization of its economic base and implementation of recurring, although time-limited, solutions to large structural budget gaps.
Manager’s Discussion
We used various investment strategies during the 12 months under review as we sought to maximizetax-free income for shareholders. Please read the Investment Strategy and Manager’s Discussion on page 4 for more information.
Thank you for your continued participation in Franklin LouisianaTax-Free Income Fund. We believe our conservative,buy-and-hold investment strategy can help us achieve high, current,tax-free income for shareholders.
3. Source: Bureau of Labor Statistics.
4. Source:Moody’s Investors Service, “States - US: Medians - State debt continues slow growth trend,” 4/24/18.
5. This does not indicate Moody’s rating of the Fund.
| | | | |
franklintempleton.com | | Annual Report | | 37 |
FRANKLIN LOUISIANA TAX-FREE INCOME FUND
The foregoing information reflects our analysis, opinions and portfolio holdings as of February 28, 2019, the end of the reporting period. The way we implement our main investment strategies and the resulting portfolio holdings may change depending on factors such as market and economic conditions. These opinions may not be relied upon as investment advice or an offer for a particular security. The information is not a complete analysis of every aspect of any market, state, industry, security or the Fund. Statements of fact are from sources considered reliable, but the investment manager makes no representation or warranty as to their completeness or accuracy. Although historical performance is no guarantee of future results, these insights may help you understand our investment management philosophy.
| | | | | | |
38 | | Annual Report | | | | franklintempleton.com |
FRANKLIN LOUISIANA TAX-FREE INCOME FUND
Performance Summary as of February 28, 2019
The performance tables and graphs do not reflect any taxes that a shareholder would pay on Fund dividends, capital gain distributions, if any, or any realized gains on the sale of Fund shares. Total return reflects reinvestment of the Fund’s dividends and capital gain distributions, if any, and any unrealized gains or losses. Your dividend income will vary depending on dividends or interest paid by securities in the Fund’s portfolio, adjusted for operating expenses of each class. Capital gain distributions are net profits realized from the sale of portfolio securities.
Performance as of 2/28/19
Cumulative total return excludes sales charges. Average annual total return includes maximum sales charges. Sales charges will vary depending on the size of the investment and the class of share purchased. The maximum is 4.25% and the minimum is 0%.Class A:4.25% maximum initial sales charge;Advisor Class:no sales charges. For other share classes, visitfranklintempleton.com.
| | | | |
| Share Class | | Cumulative Total Return1 | | Average Annual Total Return2 |
| | |
A3 | | | | |
1-Year | | +3.47% | | -0.93% |
5-Year | | +15.84% | | +2.09% |
10-Year | | +53.18% | | +3.90% |
| | |
Advisor4 | | | | |
1-Year | | +3.65% | | +3.65% |
5-Year | | +16.23% | | +3.05% |
10-Year | | +53.70% | | +4.39% |
| | | | | | | | | | | | | | | | | | | | |
| | | Distribution | | | | | | Taxable Equivalent | | | | | | Taxable Equivalent | |
| Share Class | | Rate5 | | | | | | Distribution Rate6 | | | 30-Day Standardized Yield7 | | | 30-Day Standardized Yield6 | |
A | | | 2.89% | | | | | | | | 5.43% | | | | 1.78% | | | | 3.35% | |
Advisor | | | 3.26% | | | | | | | | 6.13% | | | | 2.09% | | | | 3.93% | |
Performance data represent past performance, which does not guarantee future results. Investment return and principal value will fluctuate, and you may have a gain or loss when you sell your shares. Current performance may differ from figures shown. For most recentmonth-end performance, go tofranklintempleton.comor call(800)342-5236.
See page 42 for Performance Summary footnotes.
| | | | |
franklintempleton.com | | Annual Report | | 39 |
FRANKLIN LOUISIANATAX-FREE INCOME FUND
PERFORMANCE SUMMARY
Total Return Index Comparison for a Hypothetical $10,000 Investment
Total return represents the change in value of an investment over the periods shown. It includes any applicable maximum sales charge, Fund expenses, account fees and reinvested distributions. The unmanaged indexes include reinvestment of any income or distributions. They differ from the Fund in composition and do not pay management fees or expenses. One cannot invest directly in an index.
Class A(3/1/09-2/28/19)
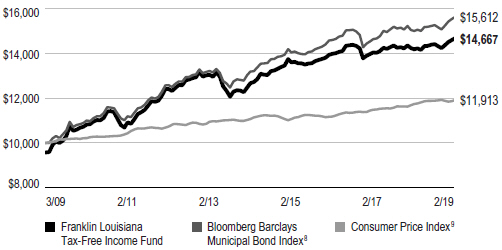
Advisor Class(3/1/09-2/28/19)
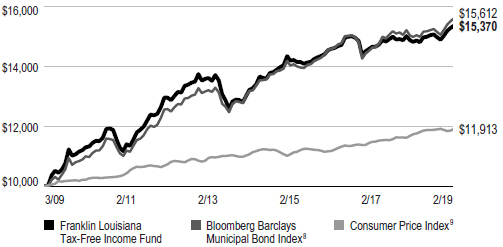
See page 42 for Performance Summary footnotes.
| | | | | | |
40 | | Annual Report | | | | franklintempleton.com |
FRANKLIN LOUISIANA TAX-FREE INCOME FUND
PERFORMANCE SUMMARY
Net Asset Value
| | | | | | | | | | | | | | |
| Share Class(Symbol) | | 2/28/19 | | 9/10/18 | | | 2/28/18 | | | Change | |
A (FQLAX) | | $10.93 | | | $10.85 | | | | N/A | | | | +$0.08 | |
A1(FKLAX) | | $10.92 | | | N/A | | | | $10.90 | | | | +$0.02 | |
C (FLAIX) | | $11.10 | | | N/A | | | | $11.07 | | | | +$0.03 | |
R6(FLAQX) | | $10.93 | | | N/A | | | | $10.90 | | | | +$0.03 | |
Advisor(FLTZX) | | $10.93 | | | N/A | | | | $10.90 | | | | +$0.03 | |
Distributions(3/1/18–2/28/19) | |
| Share Class | | Net Investment Income | | | | | | | | | |
A (9/10/18–2/28/19) | | $0.1552 | | | | | | | | | | | | |
A1 | | $0.3493 | | | | | | | | | | | | |
C | | $0.2881 | | | | | | | | | | | | |
R6 | | $0.3622 | | | | | | | | | | | | |
Advisor | | $0.3598 | | | | | | | | | | | | |
|
| Total Annual Operating Expenses10 | |
| | | | |
| Share Class | | | | | | | | | | | |
A | | 0.85% | | | | | | | | | | | | |
Advisor | | 0.60% | | | | | | | | | | | | |
See page 42 for Performance Summary footnotes.
| | | | | | | | |
franklintempleton.com | | | | | | Annual Report | | 41 |
FRANKLIN LOUISIANA TAX-FREE INCOME FUND
PERFORMANCE SUMMARY
Each class of shares is available to certain eligible investors and has different annual fees and expenses, as described in the prospectus.
All investments involve risks, including possible loss of principal. Because municipal bonds are sensitive to interest rate movements, the Fund’s yield and share price will fluctuate with market conditions. Bond prices generally move in the opposite direction of interest rates. Thus, as prices of bonds in the Fund adjust to a rise in interest rates, the Fund’s share price may decline. Because the Fund invests principally in a single state, it is subject to greater risk of adverse economic and regulatory changes in that state than a geographically diversified fund. Puerto Rico municipal bonds have been impacted by recent adverse economic and market changes, which may cause the Fund’s share price to decline. Changes in the credit rating of a bond, or in the credit rating or financial strength of a bond’s issuer, insurer or guarantor, may affect the bond’s value. The Fund may invest a significant part of its assets in municipal securities that finance similar types of projects, such as utilities, hospitals, higher education and transportation. A change that affects one project would likely affect all similar projects, thereby increasing market risk. The Fund is actively managed but there is no guarantee that the manager’s investment decisions will produce the desired results. The Fund’s prospectus also includes a description of the main investment risks.
1. Cumulative total return represents the change in value of an investment over the periods indicated.
2. Average annual total return represents the average annual change in value of an investment over the periods indicated. Return for less than one year, if any, has not been annualized.
3. Effective 9/10/18, Class A shares closed to new investors, were renamed Class A1 shares, and a new Class A share with a different expense structure became available. Class A performance shown has been calculated as follows: (a) for periods prior to 9/10/18, a restated figure is used based on the Fund’s Class A1 performance that includes any Rule12b-1 rate differential that exists between Class A1 and Class A; and (b) for periods after 9/10/18, actual Class A performance is used, reflecting all charges and fees applicable to that class.
4. Effective 9/15/16, the Fund began offering Advisor Class shares, which do not have sales charges or a Rule12b-1 plan. Performance quotations for this class reflect the following methods of calculation: (a) For periods prior to 9/15/16, a restated figure is used based upon the Fund’s Class A performance, excluding the effect of Class A’s maximum initial sales charge, but reflecting the effect of the Class A Rule12b-1 fees; and (b) for periods after 9/15/16, actual Advisor Class performance is used reflecting all charges and fees applicable to that class. Since 9/15/16 (commencement of sales), the cumulative and average annual total returns of Advisor Class shares were +2.95% and +1.19%.
5. Distribution rate is based on an annualization of the respective class’s February dividend and the maximum offering price (NAV for Advisor Class) per share on 2/28/19.
6. Taxable equivalent distribution rate and yield assume the published rates as of 12/18/18 for the maximum combined effective federal and Louisiana personal income tax rate of 46.80%, based on the federal income tax rate of 37.00% plus 3.80% Medicare tax.
7. The Fund’s30-day standardized yield is calculated over a trailing30-day period using the yield to maturity on bonds and/or the dividends accrued on stocks. It may not equal the Fund’s actual income distribution rate, which reflects the Fund’s past dividends paid to shareholders.
8. Source: Morningstar. The Bloomberg Barclays Municipal Bond Index is a market value-weighted index engineered for the long-termtax-exempt bond market. To be included in the index, bonds must be fixed rate, have at least one year to final maturity and be rated investment grade(Baa3/BBB- or higher) by at least two of the following agencies: Moody’s, S&P and Fitch.
9. Source: Bureau of Labor Statistics, bls.gov/cpi. The Consumer Price Index is a commonly used measure of the inflation rate.
10. Figures are as stated in the Fund’s current prospectus and may differ from the expense ratios disclosed in the Your Fund’s Expenses and Financial Highlights sections in this report. In periods of market volatility, assets may decline significantly, causing total annual Fund operating expenses to become higher than the figures shown.
See www.franklintempletondatasources.com for additional data provider information.
| | | | | | |
42 | | Annual Report | | | | franklintempleton.com |
FRANKLIN LOUISIANA TAX-FREE INCOME FUND
Your Fund’s Expenses
As a Fund shareholder, you can incur two types of costs: (1) transaction costs, including sales charges (loads) on Fund purchases and redemptions; and (2) ongoing Fund costs, including management fees, distribution and service(12b-1) fees, and other Fund expenses. All mutual funds have ongoing costs, sometimes referred to as operating expenses. The table below shows ongoing costs of investing in the Fund and can help you understand these costs and compare them with those of other mutual funds. The table assumes a $1,000 investment held for the six months indicated.
Actual Fund Expenses
The table below provides information about actual account values and actual expenses in the columns under the heading “Actual.” In these columns the Fund’s actual return, which includes the effect of Fund expenses, is used to calculate the “Ending Account Value” for each class of shares. You can estimate the expenses you paid during the period by following these steps (of course, your account value and expenses will differ from those in this illustration): Divide your account value by $1,000 (if your account had an $8,600 value, then $8,600÷ $1,000 = 8.6). Then multiply the result by the number in the row for your class of shares under the headings “Actual” and “Expenses Paid During Period” (if Actual Expenses Paid During Period were $7.50, then 8.6 x $7.50 =$64.50). In this illustration, the actual expenses paid this period are $64.50.
Hypothetical Example for Comparison with Other Funds
Under the heading “Hypothetical” in the table, information is provided about hypothetical account values and hypothetical expenses based on the Fund’s actual expense ratio and an assumed rate of return of 5% per year before expenses, which is not the Fund’s actual return. This information may not be used to estimate the actual ending account balance or expenses you paid for the period, but it can help you compare ongoing costs of investing in the Fund with those of other funds. To do so, compare this 5% hypothetical example for the class of shares you hold with the 5% hypothetical examples that appear in the shareholder reports of other funds.
Please note that expenses shown in the table are meant to highlight ongoing costs and do not reflect any transactional costs. Therefore, information under the heading “Hypothetical” is useful in comparing ongoing costs only, and will not help you compare total costs of owning different funds. In addition, if transactional costs were included, your total costs would have been higher.
| | | | | | | | | | | | |
| | | | | Actual
(actual return after expenses) | | Hypothetical (5% annual return before expenses) | | |
| | | | | | | | |
Share Class | | Beginning
Account
Value1 | | Ending Account Value 2/28/19 | | Expenses Paid During Period2,3,4 | | Ending Account Value 2/28/19 | | Expenses Paid During Period 9/1/18–2/28/193,4 | | Net Annualized Expense Ratio4 |
| | | | | | |
| A | | $1,000 | | $1,022.20 | | $4.17 | | $1,020.43 | | $4.41 | | 0.88% |
| A1 | | $1,000 | | $1,018.00 | | $3.75 | | $1,021.08 | | $3.76 | | 0.75% |
| C | | $1,000 | | $1,015.80 | | $6.50 | | $1,018.35 | | $6.51 | | 1.30% |
| R6 | | $1,000 | | $1,019.50 | | $3.00 | | $1,021.82 | | $3.01 | | 0.60% |
| Advisor | | $1,000 | | $1,019.40 | | $3.25 | | $1,021.57 | | $3.26 | | 0.65% |
1. For Classes A1, C, R6 and Advisor 9/1/18 for Actual and Hypothetical. For Class A, 9/10/18 for Actual and 9/1/18 for Hypothetical.
2. For Classes A1, C, R6 and Advisor, 9/1/18–2/28/19. For Class A, 9/10/18–2/28/19.
3. Expenses are equal to the annualized expense ratio for thesix-month period as indicated above—in the far right column—multiplied by the simple average account value over the period indicated, and then multiplied by 181/365 to reflect theone-half year period. The multiplier is 171/365 for Actual Class A expenses to reflect the number of days since inception.
4. Reflects expenses after fee waivers and expense reimbursements, for Class R6.
| | | | |
franklintempleton.com | | Annual Report | | 43 |
Franklin MarylandTax-Free Income Fund
We are pleased to bring you Franklin MarylandTax-Free Income Fund’s annual report for the fiscal year ended February 28, 2019.
Your Fund’s Goal and Main Investments
The Fund seeks to provide as high a level of income exempt from federal and Maryland personal income taxes as is consistent with prudent investment management and preservation of capital by investing at least 80% of its total assets in securities that pay interest free from such taxes.1
Credit Quality Composition*
2/28/19
| | | | |
| | | % of Total | |
| Ratings | | Investments | |
| |
AAA | | | 17.16% | |
| |
AA | | | 35.16% | |
| |
A | | | 26.73% | |
| |
BBB | | | 11.14% | |
| |
Below Investment Grade | | | 1.72% | |
| |
Refunded | | | 5.12% | |
| |
Not Rated | | | 2.97% | |
*Securities, except for those labeled Not Rated, are assigned ratings by one or more Nationally Recognized Statistical Credit Rating Organizations (NRSROs), such as Standard & Poor’s, Moody’s and Fitch, that can be considered by the investment manager as part of its independent securities analysis. When ratings from multiple agencies are available, the highest is used, consistent with the portfolio investment process. Ratings reflect an NRSRO’s opinion of an issuer’s creditworthiness and typically range from AAA (highest) to D (lowest). The Below Investment Grade category consists of bonds rated belowBBB-. The Refunded category generally consists of refunded bonds secured by U.S. government or other high-quality securities and not rerated by an NRSRO. The Not Rated category consists of ratable securities that have not been rated by an NRSRO. Cash and equivalents are excluded from this composition.
Performance Overview
The Fund’s Class A share price, as measured by net asset value, increased from $10.76 on September 10, 2018, to $10.80 on February 28, 2019. The Fund’s Class A shares paid dividends totaling 15.27 cents per share for the same period.2 The Performance Summary beginning on page 47 shows that at the end of this reporting period the Fund’s Class A shares’ distribution rate was 2.95% based on an annualization of February’s 2.77 cent per share monthly dividend and the
| | | | | | | | | | | | | | | | | | | | |
| Dividend Distributions* | | | | | | | | | | | | | |
3/1/18–2/28/19 | | | | | | | | | | | | | | | | | |
| | | Dividend per Share (cents) | |
| | | Class | | | Class | | | | | | | | | | |
| Month | | A** | | | A1 | | | Class C | | | Class R6 | | | Advisor Class | |
March | | | — | | | | 2.81 | | | | 2.30 | | | | 2.92 | | | | 2.90 | |
April | | | — | | | | 2.81 | | | | 2.30 | | | | 2.92 | | | | 2.90 | |
May | | | — | | | | 2.81 | | | | 2.30 | | | | 2.92 | | | | 2.90 | |
June | | | — | | | | 2.81 | | | | 2.30 | | | | 2.92 | | | | 2.89 | |
July | | | — | | | | 2.81 | | | | 2.30 | | | | 2.92 | | | | 2.89 | |
August | | | — | | | | 2.81 | | | | 2.30 | | | | 2.92 | | | | 2.89 | |
September | | | 1.72 | | | | 2.81 | | | | 2.30 | | | | 2.93 | | | | 2.90 | |
October | | | 2.67 | | | | 2.81 | | | | 2.30 | | | | 2.93 | | | | 2.90 | |
November | | | 2.67 | | | | 2.81 | | | | 2.30 | | | | 2.93 | | | | 2.90 | |
December | | | 2.67 | | | | 2.81 | | | | 2.31 | | | | 2.93 | | | | 2.89 | |
January | | | 2.77 | | | | 2.91 | | | | 2.41 | | | | 3.03 | | | | 2.99 | |
February | | | 2.77 | | | | 2.91 | | | | 2.41 | | | | 3.03 | | | | 2.99 | |
Total | | | 15.27 | | | | 33.92 | | | | 27.83 | | | | 35.30 | | | | 34.94 | |
*The distribution amount is the sum of all net investment income distributions for the period shown. Assumes shares were purchased and held for the entire accrual period. Since dividends accrue daily, your actual distributions will vary depending on the date you purchased your shares and any account activity. All Fund distributions will vary depending upon current market conditions, and past distributions are not indicative of future trends.
**Effective 9/10/18, the Fund began offering Class A shares. See the prospectus for details.
maximum offering price of $11.28 on February 28, 2019. An investor in the 2019 maximum combined effective federal and Maryland personal income tax bracket of 49.75% (including 3.80% Medicare tax) would need to earn a distribution rate of 5.87% from a taxable investment to match the Fund’s Class Atax-free distribution rate. For other performance data, please see the Performance Summary.
Performance data represent past performance, which does not guarantee future results. Investment return and principal value will fluctuate, and you may have a gain or loss when you sell your shares. Current performance may differ from figures shown. For most recentmonth-end performance, go tofranklintempleton.comor call(800)342-5236.
1. For investors subject to alternative minimum tax, a small portion of Fund dividends may be taxable. Distributions of capital gains are generally taxable. To avoid imposition of 28% backup withholding on all Fund distributions and redemption proceeds, U.S. investors must be properly certified on FormW-9 andnon-U.S. investors on FormW-8BEN.
2. The distribution amount is the sum of all net investment income distributions for the period shown. Assumes shares were purchased and held for the entire accrual period. Since dividends accrue daily, your actual distributions will vary depending on the date you purchased your shares and any account activity. All Fund distributions will vary depending upon current market conditions, and past distributions are not indicative of future trends.
The dollar value, number of shares or principal amount, and names of all portfolio holdings are listed in the Fund’s Statement of Investments (SOI). The SOI begins on page 120.
| | | | |
44 | | Annual Report | | franklintempleton.com |
FRANKLIN MARYLAND TAX-FREE INCOME FUND
State Update
Maryland’s economy continued to grow slowly during the 12 months under review amid mixed housing market conditions. The state’s home prices rose slightly, and housing starts and new residential permits increased, while home sales decreased amid lower demand. Maryland’s foreclosure rate declined but still significantly exceeded the nation’s. Maryland’s economic strengths consist of strong wealth and income indicators and a relatively diversified industry base that includes a significant federal government presence, which provides well-paying civilian and national defense jobs. Maryland’s unemployment rate fell from 4.2% in February 2018 to 3.7% atperiod-end, which was lower than the 3.8% national average.3
Maryland’s state revenues for fiscal year (FY) 2018 were above its March 2018 estimates and resulted in a general fund surplus, largely due to higher individual and corporate income taxes, higher business franchise, insurance company and sales and use taxes, and increased state lottery receipts. Maryland’s enacted FY 2019 budget was larger in comparison to the previous year’s plan, with increased investments in areas such as education and health care. It included structural resolution for a budget gap for FY 2019 by suspending various mandated spending measures and reducing prescription drug costs for retirees among other cost savings. The budget also featured year-over-year growth in current revenue for FY 2019. The governor’s proposed FY 2020 budget, which exceeds the FY 2019 budget, is structurally balanced and prioritizes investments in education, health care, transportation and environmental protection.
The state’s nettax-supported debt was 3.7% of personal income and $2,164 per capita, compared with the 2.3% and $987 national medians, respectively.4 Independent credit rating agency Standard & Poor’s (S&P) affirmed the state’s general obligation debt rating at AAA with a stable outlook.5 S&P cited the state’s broad and diverse economy, continued strong wealth and income levels, proactive financial and budget management, well-developed financial and debt management policies and moderate debt levels. The outlook reflected S&P’s view of the state’s continued practice of structural budget alignment, maintenance of healthy reserve levels, and proactivemid-year budget adjustments in case of slower-than-anticipated revenue growth. However, S&P expressed concern about the state’s funding levels for pensions and other long-term liabilities.
| | | | |
| Portfolio Composition | | | | |
| 2/28/19 | | | | |
| |
| % of Total
Investments |
* |
| |
Hospital & Health Care | | | 22.48% | |
| |
Utilities | | | 20.81% | |
| |
Higher Education | | | 13.00% | |
| |
General Obligation | | | 12.83% | |
| |
Housing | | | 12.28% | |
| |
Refunded** | | | 5.45% | |
| |
Transportation | | | 5.25% | |
| |
Other Revenue | | | 4.56% | |
| |
Subject to Government Appropriations | | | 3.34% | |
| |
*Does not include cash and cash equivalents.
**Includes all refunded bonds; the percentage may differ from that in the Credit Quality Composition.
Manager’s Discussion
We used various investment strategies during the 12 months under review as we sought to maximizetax-free income for shareholders. Please read the Investment Strategy and Manager’s Discussion on page 4 for more information.
Thank you for your continued participation in Franklin MarylandTax-Free Income Fund. We believe our conservative,buy-and-hold investment strategy can help us achieve high, current,tax-free income for shareholders.
3. Source: Bureau of Labor Statistics.
4. Source:Moody’s Investors Service, “States - US: Medians - State debt continues slow growth trend,” 4/24/18.
5. This does not indicate S&P’s rating of the Fund.
| | | | | | | | |
franklintempleton.com | | | | | | Annual Report | | 45 |
FRANKLIN MARYLAND TAX-FREE INCOME FUND
The foregoing information reflects our analysis, opinions and portfolio holdings as of February 28, 2019, the end of the reporting period. The way we implement our main investment strategies and the resulting portfolio holdings may change depending on factors such as market and economic conditions. These opinions may not be relied upon as investment advice or an offer for a particular security. The information is not a complete analysis of every aspect of any market, state, industry, security or the Fund. Statements of fact are from sources considered reliable, but the investment manager makes no representation or warranty as to their completeness or accuracy. Although historical performance is no guarantee of future results, these insights may help you understand our investment management philosophy.
| | | | | | |
46 | | Annual Report | | | | franklintempleton.com |
FRANKLIN MARYLAND TAX-FREE INCOME FUND
Performance Summary as of February 28, 2019
The performance tables and graphs do not reflect any taxes that a shareholder would pay on Fund dividends, capital gain distributions, if any, or any realized gains on the sale of Fund shares. Total return reflects reinvestment of the Fund’s dividends and capital gain distributions, if any, and any unrealized gains or losses. Your dividend income will vary depending on dividends or interest paid by securities in the Fund’s portfolio, adjusted for operating expenses of each class. Capital gain distributions are net profits realized from the sale of portfolio securities.
Performance as of 2/28/19
Cumulative total return excludes sales charges. Average annual total return includes maximum sales charges. Sales charges will vary depending on the size of the investment and the class of share purchased. The maximum is 4.25% and the minimum is 0%.Class A:4.25% maximum initial sales charge;Advisor Class:no sales charges. For other share classes, visitfranklintempleton.com.
| | | | | | | | |
| Share Class | | Cumulative Total Return1 | | | Average Annual Total Return2 | |
A3 | | | | | | | | |
1-Year | | | +3.50% | | | | -0.89% | |
5-Year | | | +14.37% | | | | +1.83% | |
10-Year | | | +50.87% | | | | +3.75% | |
| | |
| Advisor4 | | | | | | | | |
1-Year | | | +3.68% | | | | +3.68% | |
5-Year | | | +15.14% | | | | +2.86% | |
10-Year | | | +52.53% | | | | +4.31% | |
| | | | | | | | | | |
| Share Class | | Distribution
Rate5 | | | | Taxable Equivalent
Distribution Rate6 | | 30-Day Standardized Yield7 | | Taxable Equivalent 30-Day Standardized Yield6 |
A | | 2.95% | | | | 5.87% | | 1.86% | | 3.70% |
Advisor | | 3.32% | | | | 6.61% | | 2.18% | | 4.34% |
Performance data represent past performance, which does not guarantee future results. Investment return and principal value will fluctuate, and you may have a gain or loss when you sell your shares. Current performance may differ from figures shown. For most recentmonth-end performance, go tofranklintempleton.comor call(800)342-5236.
See page 50 for Performance Summary footnotes.
| | | | |
franklintempleton.com | | Annual Report | | 47 |
FRANKLIN MARYLAND TAX-FREE INCOME FUND
PERFORMANCE SUMMARY
Total Return Index Comparison for a Hypothetical $10,000 Investment
Total return represents the change in value of an investment over the periods shown. It includes any applicable maximum sales charge, Fund expenses, account fees and reinvested distributions. The unmanaged indexes include reinvestment of any income or distributions. They differ from the Fund in composition and do not pay management fees or expenses. One cannot invest directly in an index.
Class A(3/1/09–2/28/19)
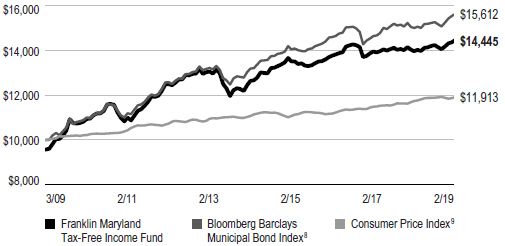
Advisor Class(3/1/09–2/28/19)
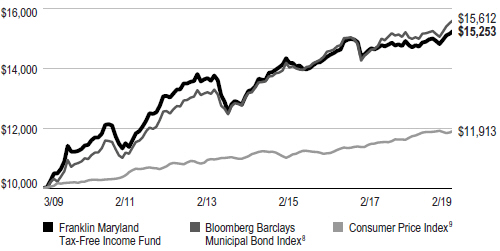
See page 50 for Performance Summary footnotes.
| | | | | | |
48 | | Annual Report | | | | franklintempleton.com |
FRANKLIN MARYLANDTAX-FREE INCOME FUND
PERFORMANCE SUMMARY
Net Asset Value
| | | | | | | | |
| Share Class(Symbol) | | 2/28/19 | | 9/10/18 | | 2/28/18 | | Change |
A (FQMDX) | | $10.80 | | $10.76 | | N/A | | +$0.04 |
A1(FMDTX) | | $10.80 | | N/A | | $10.76 | | +$0.04 |
C (FMDIX) | | $11.02 | | N/A | | $10.98 | | +$0.04 |
R6(FMDQX) | | $10.82 | | N/A | | $10.78 | | +$0.04 |
Advisor(FMDZX) | | $10.81 | | N/A | | $10.77 | | +$0.04 |
Distributions(3/1/18–2/28/19)
| | | | |
| Share Class | | Net Investment Income | |
A (9/10/18–2/28/19) | | | $0.1527 | |
A1 | | | $0.3392 | |
C | | | $0.2783 | |
R6 | | | $0.3530 | |
Advisor | | | $0.3494 | |
Total Annual Operating Expenses10
| | | | |
| Share Class | | | |
A | | | 0.84 | % |
Advisor | | | 0.59 | % |
See page 50 for Performance Summary footnotes.
| | | | | | | | |
franklintempleton.com | | | | | | Annual Report | | 49 |
FRANKLIN MARYLANDTAX-FREE INCOME FUND
PERFORMANCE SUMMARY
Each class of shares is available to certain eligible investors and has different annual fees and expenses, as described in the prospectus.
All investments involve risks, including possible loss of principal. Because municipal bonds are sensitive to interest rate movements, the Fund’s yield and share price will fluctuate with market conditions. Bond prices generally move in the opposite direction of interest rates. Thus, as prices of bonds in the Fund adjust to a rise in interest rates, the Fund’s share price may decline. Because the Fund invests principally in a single state, it is subject to greater risk of adverse economic and regulatory changes in that state than a geographically diversified fund. Puerto Rico municipal bonds have been impacted by recent adverse economic and market changes, which may cause the Fund’s share price to decline. Changes in the credit rating of a bond, or in the credit rating or financial strength of a bond’s issuer, insurer or guarantor, may affect the bond’s value. The Fund may invest a significant part of its assets in municipal securities that finance similar types of projects, such as utilities, hospitals, higher education and transportation. A change that affects one project would likely affect all similar projects, thereby increasing market risk. The Fund is actively managed but there is no guarantee that the manager’s investment decisions will produce the desired results. The Fund’s prospectus also includes a description of the main investment risks.
1. Cumulative total return represents the change in value of an investment over the periods indicated.
2. Average annual total return represents the average annual change in value of an investment over the periods indicated. Return for less than one year, if any, has not been annualized.
3. Effective 9/10/18, Class A shares closed to new investors, were renamed Class A1 shares, and a new Class A share with a different expense structure became available. Class A performance shown has been calculated as follows: (a) for periods prior to 9/10/18, a restated figure is used based on the Fund’s Class A1 performance that includes any Rule12b-1 rate differential that exists between Class A1 and Class A; and (b) for periods after 9/10/18, actual Class A performance is used, reflecting all charges and fees applicable to that class.
4. Effective 7/1/09, the Fund began offering Advisor Class shares, which do not have sales charges or a Rule12b-1 plan. Performance quotations for this class reflect the following methods of calculation: (a) For periods prior to 7/1/09, a restated figure is used based upon the Fund’s Class A performance, excluding the effect of Class A’s maximum initial sales charge, but reflecting the effect of the Class A Rule12b-1 fees; and (b) for periods after 7/1/09, actual Advisor Class performance is used reflecting all charges and fees applicable to that class. Since 7/1/09 (commencement of sales), the cumulative and average annual total returns of Advisor Class shares were +45.32% and +3.94%.
5. Distribution rate is based on an annualization of the respective class’s February dividend and the maximum offering price (NAV for Advisor Class) per share on 2/28/19.
6. Taxable equivalent distribution rate and yield assume the published rates as of 12/18/18 for the maximum combined effective federal and Maryland state and local personal income tax rate of 49.75%, based on the federal income tax rate of 37.00% plus 3.80% Medicare tax.
7. The Fund’s30-day standardized yield is calculated over a trailing30-day period using the yield to maturity on bonds and/or the dividends accrued on stocks. It may not equal the Fund’s actual income distribution rate, which reflects the Fund’s past dividends paid to shareholders.
8. Source: Morningstar. The Bloomberg Barclays Municipal Bond Index is a market value-weighted index engineered for the long-termtax-exempt bond market. To be included in the index, bonds must be fixed rate, have at least one year to final maturity and be rated investment grade(Baa3/BBB- or higher) by at least two of the following agencies: Moody’s, S&P and Fitch.
9. Source: Bureau of Labor Statistics, bls.gov/cpi. The Consumer Price Index is a commonly used measure of the inflation rate.
10. Figures are as stated in the Fund’s current prospectus and may differ from the expense ratios disclosed in the Your Fund’s Expenses and Financial Highlights sections in this report. In periods of market volatility, assets may decline significantly, causing total annual Fund operating expenses to become higher than the figures shown.
See www.franklintempletondatasources.com for additional data provider information.
| | | | | | |
50 | | Annual Report | | | | franklintempleton.com |
FRANKLIN MARYLANDTAX-FREE INCOME FUND
Your Fund’s Expenses
As a Fund shareholder, you can incur two types of costs: (1) transaction costs, including sales charges (loads) on Fund purchases and redemptions; and (2) ongoing Fund costs, including management fees, distribution and service(12b-1) fees, and other Fund expenses. All mutual funds have ongoing costs, sometimes referred to as operating expenses. The table below shows ongoing costs of investing in the Fund and can help you understand these costs and compare them with those of other mutual funds. The table assumes a $1,000 investment held for the six months indicated.
Actual Fund Expenses
The table below provides information about actual account values and actual expenses in the columns under the heading “Actual.” In these columns the Fund’s actual return, which includes the effect of Fund expenses, is used to calculate the “Ending Account Value” for each class of shares. You can estimate the expenses you paid during the period by following these steps (of course, your account value and expenses will differ from those in this illustration): Divide your account value by $1,000 (if your account had an $8,600 value, then $8,600÷ $1,000 = 8.6). Then multiply the result by the number in the row for your class of shares under the headings “Actual” and “Expenses Paid During Period” (if Actual Expenses Paid During Period were $7.50, then 8.6 x $7.50 =$64.50). In this illustration, the actual expenses paid this period are $64.50.
Hypothetical Example for Comparison with Other Funds
Under the heading “Hypothetical” in the table, information is provided about hypothetical account values and hypothetical expenses based on the Fund’s actual expense ratio and an assumed rate of return of 5% per year before expenses, which is not the Fund’s actual return. This information may not be used to estimate the actual ending account balance or expenses you paid for the period, but it can help you compare ongoing costs of investing in the Fund with those of other funds. To do so, compare this 5% hypothetical example for the class of shares you hold with the 5% hypothetical examples that appear in the shareholder reports of other funds.
Please note that expenses shown in the table are meant to highlight ongoing costs and do not reflect any transactional costs. Therefore, information under the heading “Hypothetical” is useful in comparing ongoing costs only, and will not help you compare total costs of owning different funds. In addition, if transactional costs were included, your total costs would have been higher.
| | | | | | | | | | | | |
| | | | | Actual | | Hypothetical | | |
| | | | | (actual return after expenses) | | (5% annual return before expenses) | | |
| | | | | | | | |
Share Class | | Beginning Account Value 9/1/181 | | Ending Account Value 2/28/19 | | Expenses Paid During Period 9/1/18–2/28/192,3,4 | | Ending Account Value 2/28/19 | | Expenses Paid During Period 9/1/18–2/28/193,4 | | Net Annualized Expense Ratio4 |
| | | | | | |
A | | $1,000 | | $1,018.40 | | $4.16 | | $1,020.43 | | $4.41 | | 0.88% |
A1 | | $1,000 | | $1,016.00 | | $3.75 | | $1,021.08 | | $3.76 | | 0.75% |
C | | $1,000 | | $1,013.80 | | $6.49 | | $1,018.35 | | $6.51 | | 1.30% |
R6 | | $1,000 | | $1,017.60 | | $2.95 | | $1,021.87 | | $2.96 | | 0.59% |
Advisor | | $1,000 | | $1,016.50 | | $3.25 | | $1,021.57 | | $3.26 | | 0.65% |
1. For Classes A1, C, R6 and Advisor 9/1/18 for Actual and Hypothetical. For Class A, 9/10/18 for Actual and 9/1/18 for Hypothetical.
2. For Classes A1, C, R6 and Advisor, 9/1/18–2/28/19. For Class A, 9/10/18–2/28/19.
3. Expenses are equal to the annualized expense ratio for thesix-month period as indicated above—in the far right column—multiplied by the simple average account value over the period indicated, and then multiplied by 181/365 to reflect theone-half year period. The multiplier is 171/365 for Actual Class A expenses to reflect the number of days since inception.
4. Reflects expenses after fee waivers and expense reimbursements, for Class R6.
| | | | |
| franklintempleton.com | | Annual Report | | 51 |
Franklin MissouriTax-Free Income Fund
We are pleased to bring you Franklin MissouriTax-Free Income Fund’s annual report for the fiscal year ended February 28, 2019.
Your Fund’s Goal and Main Investments
The Fund seeks to provide as high a level of income exempt from federal and Missouri personal income taxes as is consistent with prudent investment management and preservation of capital by investing at least 80% of its total assets in securities that pay interest free from such taxes.1
Credit Quality Composition*
2/28/19
| | |
| | | % of Total |
| Ratings | | Investments |
AAA | | 9.29% |
AA | | 46.37% |
A | | 21.09% |
BBB | | 10.68% |
Below Investment Grade | | 4.16% |
Refunded | | 8.20% |
Not Rated | | 0.21% |
*Securities, except for those labeled Not Rated, are assigned ratings by one or more Nationally Recognized Statistical Credit Rating Organizations (NRSROs), such as Standard & Poor’s, Moody’s and Fitch, that can be considered by the investment manager as part of its independent securities analysis. When ratings from multiple agencies are available, the highest is used, consistent with the portfolio investment process. Ratings reflect an NRSRO’s opinion of an issuer’s creditworthiness and typically range from AAA (highest) to D (lowest). The Below Investment Grade category consists of bonds rated belowBBB-. The Refunded category generally consists of refunded bonds secured by U.S. government or other high-quality securities and not rerated by an NRSRO. The Not Rated category consists of ratable securities that have not been rated by an NRSRO. Cash and equivalents are excluded from this composition.
Performance Overview
The Fund’s Class A share price, as measured by net asset value, increased from $11.41 on September 10, 2018, to $11.47 on February 28, 2019. The Fund’s Class A shares paid dividends totaling 16.01 cents per share for the same period.2 The Performance Summary beginning on page 55 shows that at the end of this reporting period the Fund’s Class A shares’ distribution rate was 2.84% based on an annualization of February’s 2.84 cent per share monthly dividend and the
Dividend Distributions*
3/1/18–2/28/19
| | | | | | | | | | | | | | | | | | | | |
| | | Dividend per Share (cents) | |
| | | Class | | | Class | | | | | | | | | Advisor | |
| Month | | A** | | | A1 | | | Class C | | | Class R6 | | | Class | |
March | | | — | | | | 2.91 | | | | 2.37 | | | | 3.02 | | | | 3.00 | |
April | | | — | | | | 2.91 | | | | 2.37 | | | | 3.02 | | | | 3.00 | |
May | | | — | | | | 2.97 | | | | 2.43 | | | | 3.08 | | | | 3.06 | |
June | | | — | | | | 2.97 | | | | 2.44 | | | | 3.10 | | | | 3.06 | |
July | | | — | | | | 2.97 | | | | 2.44 | | | | 3.10 | | | | 3.06 | |
August | | | — | | | | 2.97 | | | | 2.44 | | | | 3.10 | | | | 3.06 | |
September | | | 1.81 | | | | 2.97 | | | | 2.43 | | | | 3.10 | | | | 3.06 | |
October | | | 2.84 | | | | 2.99 | | | | 2.45 | | | | 3.12 | | | | 3.08 | |
November | | | 2.84 | | | | 2.99 | | | | 2.45 | | | | 3.12 | | | | 3.08 | |
December | | | 2.84 | | | | 2.99 | | | | 2.46 | | | | 3.12 | | | | 3.08 | |
January | | | 2.84 | | | | 2.99 | | | | 2.46 | | | | 3.12 | | | | 3.08 | |
February | | | 2.84 | | | | 2.99 | | | | 2.46 | | | | 3.12 | | | | 3.08 | |
Total | | | 16.01 | | | | 35.62 | | | | 29.20 | | | | 37.12 | | | | 36.70 | |
*The distribution amount is the sum of all net investment income distributions for the period shown. Assumes shares were purchased and held for the entire accrual period. Since dividends accrue daily, your actual distributions will vary depending on the date you purchased your shares and any account activity. All Fund distributions will vary depending upon current market conditions, and past distributions are not indicative of future trends.
**Effective 9/10/18, the Fund began offering Class A shares. See the prospectus for details.
maximum offering price of $11.98 on February 28, 2019. An investor in the 2019 maximum combined effective federal and Missouri personal income tax bracket of 46.80% (including 3.80% Medicare tax) would need to earn a distribution rate of 5.34% from a taxable investment to match the Fund’s Class Atax-free distribution rate. For other performance data, please see the Performance Summary.
Performance data represent past performance, which does not guarantee future results. Investment return and principal value will fluctuate, and you may have a gain or loss when you sell your shares. Current performance may differ from figures shown. For most recentmonth-end performance, go tofranklintempleton.comor call(800)342-5236.
State Update
Missouri’s economy continued to steadily expand during the 12 months under review, but underperformed the national
1. For investors subject to alternative minimum tax, a small portion of Fund dividends may be taxable. Distributions of capital gains are generally taxable. To avoid imposition of 28% backup withholding on all Fund distributions and redemption proceeds, U.S. investors must be properly certified on FormW-9 andnon-U.S. investors on FormW-8BEN.
2. The distribution amount is the sum of all net investment income distributions for the period shown. Assumes shares were purchased and held for the entire accrual period. Since dividends accrue daily, your actual distributions will vary depending on the date you purchased your shares and any account activity. All Fund distributions will vary depending upon current market conditions, and past distributions are not indicative of future trends.
The dollar value, number of shares or principal amount, and names of all portfolio holdings are listed in the Fund’s Statement of Investments (SOI). The SOI begins on page 128.
| | | | |
52 | | Annual Report | | franklintempleton.com |
FRANKLIN MISSOURI TAX-FREE INCOME FUND
economy. The state’s personal income and population growth also remained below the nation’s. Missouri’s housing market improved, as home prices and sales rose, and the foreclosure rate, which was below the national average, declined. Missouri’s economy benefited from employment sector diversity that approximated the nation’s, and the state’s unemployment rate fell from 3.5% in February 2018 to 3.2% at period-end, which was well below the 3.8% national average.3
The state concluded fiscal year (FY) 2018 on June 30, 2018, with higher year-to-date general revenue collections than the prior year, mainly because of growth in collections of individual income, corporate, and sales and use taxes, and other collections, while refunds increased. In June 2018, the state’s new governor signed the FY 2019 budget that included increased spending on K-12 schools and school transportation, infrastructure and workforce development, but held steady the funding for public colleges and universities. The budget also cut some health care spending and released all the funding restrictions enforced in the previous year’s budget, freeing additional funds to be carried over to FY 2019. In July 2018, the governor signed a bill to reduce individual income taxes, limit some deductions and exemptions, and place a ceiling on a tax reduction for pass-through entities, including limited liability companies. In January 2019, Governor Mike Parson announced the budget proposal for FY 2020, which included increased funding for workforce development, infrastructure, education, public safety, as well as cost of living pay raises for state employees.
Missouri’s net tax-supported debt was 1.2% of personal income and $532 per capita compared with the 2.3% and $987 national medians, respectively.4 Independent credit rating agency Moody’s Investors Service rated Missouri’s general obligation bonds Aaa with a stable outlook.5 The rating reflected Moody’s view of the state’s history of solid reserve levels, sound fiscal management controls and affordable debt and pension burden. It also incorporated the state’s below-average wealth and demographic indicators, revenue-raising constraints and expectations that the state’s economy would continue to lag the nation’s. Furthermore, it reflected the concerns regarding the state’s ability to balance an income tax cut that will incrementally reduce revenues over the next few years. The rating agency also noted any economic weakening that negatively affects the state’s revenue collections could lead to a downgrade.
Portfolio Composition
2/28/19
| | |
| | | % of Total
Investments* |
Utilities | | 31.07% |
Hospital & Health Care | | 23.36% |
General Obligation | | 9.06% |
Higher Education | | 8.91% |
Tax-Supported | | 8.24% |
Refunded** | | 8.20% |
Transportation | | 6.01% |
Subject to Government Appropriations | | 3.74% |
Corporate-Backed | | 1.12% |
Housing | | 0.29% |
*Does not include cash and cash equivalents.
**Includes all refunded bonds; the percentage may differ from that in the Credit Quality Composition.
Manager’s Discussion
We used various investment strategies during the 12 months under review as we sought to maximize tax-free income for shareholders. Please read the Investment Strategy and Manager’s Discussion on page 4 for more information.
Thank you for your continued participation in Franklin Missouri Tax-Free Income Fund. We believe our conservative, buy-and-hold investment strategy can help us achieve high, current, tax-free income for shareholders.
3. Source: Bureau of Labor Statistics.
4. Source:Moody’s Investors Service, “States - US: Medians - State debt continues slow growth trend,” 4/24/18.
5. This does not indicate Moody’s rating of the Fund.
| | | | |
franklintempleton.com | | Annual Report | | 53 |
FRANKLIN MISSOURITAX-FREE INCOME FUND
The foregoing information reflects our analysis, opinions and portfolio holdings as of February 28, 2019, the end of the reporting period. The way we implement our main investment strategies and the resulting portfolio holdings may change depending on factors such as market and economic conditions. These opinions may not be relied upon as investment advice or an offer for a particular security. The information is not a complete analysis of every aspect of any market, state, industry, security or the Fund. Statements of fact are from sources considered reliable, but the investment manager makes no representation or warranty as to their completeness or accuracy. Although historical performance is no guarantee of future results, these insights may help you understand our investment management philosophy.
| | | | | | |
54 | | Annual Report | | | | franklintempleton.com |
FRANKLIN MISSOURITAX-FREE INCOME FUND
Performance Summary as of February 28, 2019
The performance tables and graphs do not reflect any taxes that a shareholder would pay on Fund dividends, capital gain distributions, if any, or any realized gains on the sale of Fund shares. Total return reflects reinvestment of the Fund’s dividends and capital gain distributions, if any, and any unrealized gains or losses. Your dividend income will vary depending on dividends or interest paid by securities in the Fund’s portfolio, adjusted for operating expenses of each class. Capital gain distributions are net profits realized from the sale of portfolio securities.
Performance as of 2/28/19
Cumulative total return excludes sales charges. Average annual total return includes maximum sales charges. Sales charges will vary depending on the size of the investment and the class of share purchased. The maximum is 4.25% and the minimum is 0%.Class A:4.25% maximum initial sales charge;Advisor Class:no sales charges. For other share classes, visitfranklintempleton.com.
| | | | |
| Share Class | | Cumulative Total Return1 | | Average Annual Total Return2 |
| | |
A3 | | | | |
1-Year | | +3.90% | | -0.51% |
5-Year | | +14.66% | | +1.89% |
10-Year | | +47.64% | | +3.52% |
| | |
Advisor4 | | | | |
1-Year | | +4.09% | | +4.09% |
5-Year | | +15.34% | | +2.90% |
10-Year | | +49.16% | | +4.08% |
| | | | | | | | | | | | | | | | |
| Share Class | | Distribution Rate5 | | | Taxable Equivalent Distribution Rate6 | | | 30-Day Standardized Yield7 | | | Taxable Equivalent 30-Day Standardized Yield6 | |
A | | | 2.84% | | | | 5.34% | | | | 1.83% | | | | 3.44% | |
Advisor | | | 3.22% | | | | 6.05% | | | | 2.13% | | | | 4.00% | |
Performance data represent past performance, which does not guarantee future results. Investment return and principal value will fluctuate, and you may have a gain or loss when you sell your shares. Current performance may differ from figures shown. For most recentmonth-end performance, go tofranklintempleton.comor call(800)342-5236.
See page 58 for Performance Summary footnotes.
| | | | |
franklintempleton.com | | Annual Report | | 55 |
FRANKLIN MISSOURITAX-FREE INCOME FUND
PERFORMANCE SUMMARY
Total Return Index Comparison for a Hypothetical $10,000 Investment
Total return represents the change in value of an investment over the periods shown. It includes any applicable maximum sales charge, Fund expenses, account fees and reinvested distributions. The unmanaged indexes include reinvestment of any income or distributions. They differ from the Fund in composition and do not pay management fees or expenses. One cannot invest directly in an index.
Class A(3/1/09–2/28/19)
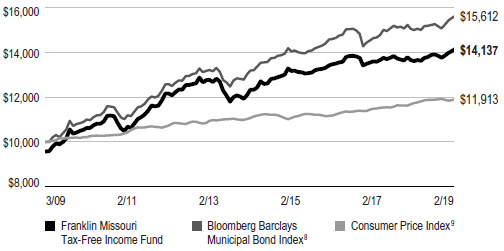
Advisor Class(3/1/09–2/28/19)
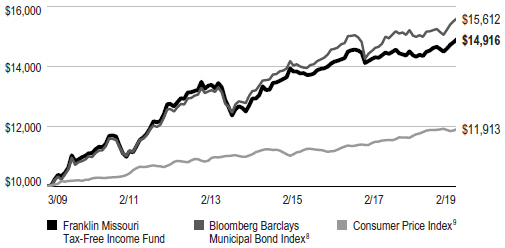
See page 58 for Performance Summary footnotes.
| | | | | | |
56 | | Annual Report | | | | franklintempleton.com |
FRANKLIN MISSOURITAX-FREE INCOME FUND
PERFORMANCE SUMMARY
Net Asset Value
| | | | | | | | |
| Share Class(Symbol) | | 2/28/19 | | 9/10/18 | | 2/28/18 | | Change |
A (FMQOX) | | $11.47 | | $11.41 | | N/A | | +$0.06 |
A1(FRMOX) | | $11.46 | | N/A | | $11.38 | | +$0.08 |
C (FMOIX) | | $11.58 | | N/A | | $11.49 | | +$0.09 |
R6(FMOQX) | | $11.47 | | N/A | | $11.38 | | +$0.09 |
Advisor(FRMZX) | | $11.47 | | N/A | | $11.38 | | +$0.09 |
Distributions(3/1/18–2/28/19)
| | |
| Share Class | | Net Investment
Income |
A (9/10/18–2/28/19) | | $0.1601 |
A1 | | $0.3562 |
C | | $0.2920 |
R6 | | $0.3712 |
Advisor | | $0.3670 |
|
Total Annual Operating Expenses10 |
| Share Class | | |
A | | 0.81% |
Advisor | | 0.56% |
See page 58 for Performance Summary footnotes.
| | | | |
franklintempleton.com | | Annual Report | | 57 |
FRANKLIN MISSOURITAX-FREE INCOME FUND
PERFORMANCE SUMMARY
Each class of shares is available to certain eligible investors and has different annual fees and expenses, as described in the prospectus.
All investments involve risks, including possible loss of principal. Because municipal bonds are sensitive to interest rate movements, the Fund’s yield and share price will fluctuate with market conditions. Bond prices generally move in the opposite direction of interest rates. Thus, as prices of bonds in the Fund adjust to a rise in interest rates, the Fund’s share price may decline. Because the Fund invests principally in a single state, it is subject to greater risk of adverse economic and regulatory changes in that state than a geographically diversified fund. Puerto Rico municipal bonds have been impacted by recent adverse economic and market changes, which may cause the Fund’s share price to decline. Changes in the credit rating of a bond, or in the credit rating or financial strength of a bond’s issuer, insurer or guarantor, may affect the bond’s value. The Fund may invest a significant part of its assets in municipal securities that finance similar types of projects, such as utilities, hospitals, higher education and transportation. A change that affects one project would likely affect all similar projects, thereby increasing market risk. The Fund is actively managed but there is no guarantee that the manager’s investment decisions will produce the desired results. The Fund’s prospectus also includes a description of the main investment risks.
1. Cumulative total return represents the change in value of an investment over the periods indicated.
2. Average annual total return represents the average annual change in value of an investment over the periods indicated. Return for less than one year, if any, has not been annualized.
3. Effective 9/10/18, Class A shares closed to new investors, were renamed Class A1 shares, and a new Class A share with a different expense structure became available. Class A performance shown has been calculated as follows: (a) for periods prior to 9/10/18, a restated figure is used based on the Fund’s Class A1 performance that includes any Rule12b-1 rate differential that exists between Class A1 and Class A; and (b) for periods after 9/10/18, actual Class A performance is used, reflecting all charges and fees applicable to that class.
4. Effective 7/1/09, the Fund began offering Advisor Class shares, which do not have sales charges or a Rule12b-1 plan. Performance quotations for this class reflect the following methods of calculation: (a) For periods prior to 7/1/09, a restated figure is used based upon the Fund’s Class A performance, excluding the effect of Class A’s maximum initial sales charge, but reflecting the effect of the Class A Rule12b-1 fees; and (b) for periods after 7/1/09, actual Advisor Class performance is used reflecting all charges and fees applicable to that class. Since 7/1/09 (commencement of sales), the cumulative and average annual total returns of Advisor Class shares were +44.31% and +3.87%.
5. Distribution rate is based on an annualization of the respective class’s February dividend and the maximum offering price (NAV for Advisor Class) per share on 2/28/19.
6. Taxable equivalent distribution rate and yield assume the published rates as of 12/18/18 for the maximum combined effective federal and Missouri personal income tax rate of 46.80%, based on the federal income tax rate of 37.00% plus 3.80% Medicare tax.
7. The Fund’s30-day standardized yield is calculated over a trailing30-day period using the yield to maturity on bonds and/or the dividends accrued on stocks. It may not equal the Fund’s actual income distribution rate, which reflects the Fund’s past dividends paid to shareholders.
8. Source: Morningstar. The Bloomberg Barclays Municipal Bond Index is a market value-weighted index engineered for the long-termtax-exempt bond market. To be included in the index, bonds must be fixed rate, have at least one year to final maturity and be rated investment grade(Baa3/BBB- or higher) by at least two of the following agencies: Moody’s, S&P and Fitch.
9. Source: Bureau of Labor Statistics, bls.gov/cpi. The Consumer Price Index is a commonly used measure of the inflation rate.
10. Figures are as stated in the Fund’s current prospectus and may differ from the expense ratios disclosed in the Your Fund’s Expenses and Financial Highlights sections in this report. In periods of market volatility, assets may decline significantly, causing total annual Fund operating expenses to become higher than the figures shown.
See www.franklintempletondatasources.com for additional data provider information.
| | | | | | |
58 | | Annual Report | | | | franklintempleton.com |
FRANKLIN MISSOURITAX-FREE INCOME FUND
Your Fund’s Expenses
As a Fund shareholder, you can incur two types of costs: (1) transaction costs, including sales charges (loads) on Fund purchases and redemptions; and (2) ongoing Fund costs, including management fees, distribution and service(12b-1) fees, and other Fund expenses. All mutual funds have ongoing costs, sometimes referred to as operating expenses. The table below shows ongoing costs of investing in the Fund and can help you understand these costs and compare them with those of other mutual funds. The table assumes a $1,000 investment held for the six months indicated.
Actual Fund Expenses
The table below provides information about actual account values and actual expenses in the columns under the heading “Actual.” In these columns the Fund’s actual return, which includes the effect of Fund expenses, is used to calculate the “Ending Account Value” for each class of shares. You can estimate the expenses you paid during the period by following these steps (of course, your account value and expenses will differ from those in this illustration): Divide your account value by $1,000 (if your account had an $8,600 value, then $8,600÷ $1,000 = 8.6). Then multiply the result by the number in the row for your class of shares under the headings “Actual” and “Expenses Paid During Period” (if Actual Expenses Paid During Period were $7.50, then 8.6 x $7.50 =$64.50). In this illustration, the actual expenses paid this period are $64.50.
Hypothetical Example for Comparison with Other Funds
Under the heading “Hypothetical” in the table, information is provided about hypothetical account values and hypothetical expenses based on the Fund’s actual expense ratio and an assumed rate of return of 5% per year before expenses, which is not the Fund’s actual return. This information may not be used to estimate the actual ending account balance or expenses you paid for the period, but it can help you compare ongoing costs of investing in the Fund with those of other funds. To do so, compare this 5% hypothetical example for the class of shares you hold with the 5% hypothetical examples that appear in the shareholder reports of other funds.
Please note that expenses shown in the table are meant to highlight ongoing costs and do not reflect any transactional costs. Therefore, information under the heading “Hypothetical” is useful in comparing ongoing costs only, and will not help you compare total costs of owning different funds. In addition, if transactional costs were included, your total costs would have been higher.
| | | | | | | | | | | | |
| | | | | Actual | | Hypothetical | | |
| | | | | (actual return after expenses) | | (5% annual return before expenses) | | |
| | | | | | | | |
Share Class | | Beginning
Account
Value 9/1/181 | | Ending
Account
Value 2/28/19 | | Expenses
Paid During
Period 9/1/18–2/28/192,3,4 | | Ending Account
Value 2/28/19 | | Expenses
Paid During Period 9/1/18–2/28/193,4 | | Net
Annualized
Expense
Ratio4 |
| | | | | | |
A | | $1,000 | | $1,019.80 | | $3.97 | | $1,020.63 | | $4.21 | | 0.84% |
A1 | | $1,000 | | $1,016.80 | | $3.55 | | $1,021.27 | | $3.56 | | 0.71% |
C | | $1,000 | | $1,013.80 | | $6.29 | | $1,018.55 | | $6.31 | | 1.26% |
R6 | | $1,000 | | $1,017.40 | | $2.75 | | $1,022.07 | | $2.76 | | 0.55% |
Advisor | | $1,000 | | $1,017.20 | | $3.05 | | $1,021.77 | | $3.06 | | 0.61% |
1. For Classes A1, C, R6 and Advisor 9/1/18 for Actual and Hypothetical. For Class A, 9/10/18 for Actual and 9/1/18 for Hypothetical.
2. For Classes A1, C, R6 and Advisor, 9/1/18–2/28/19. For Class A, 9/10/18–2/28/19.
3. Expenses are equal to the annualized expense ratio for thesix-month period as indicated above—in the far right column—multiplied by the simple average account value over the period indicated, and then multiplied by 181/365 to reflect theone-half year period. The multiplier is 171/365 for Actual Class A expenses to reflect the number of days since inception.
4. Reflects expenses after fee waivers and expense reimbursements, for Class R6.
| | | | |
franklintempleton.com | | Annual Report | | 59 |
Franklin North CarolinaTax-Free Income Fund
We are pleased to bring you Franklin North CarolinaTax-Free Income Fund’s annual report for the fiscal year ended February 28, 2019.
Your Fund’s Goal and Main Investments
The Fund seeks to provide as high a level of income exempt from federal and North Carolina personal income taxes as is consistent with prudent investment management and preservation of capital by investing at least 80% of its total assets in securities that pay interest free from such taxes.1
Credit Quality Composition*
2/28/19
| | |
| Ratings | | % of Total
Investments |
AAA | | 24.66% |
AA | | 53.60% |
A | | 9.21% |
BBB | | 2.22% |
Below Investment Grade | | 2.71% |
Refunded | | 7.60% |
*Securities, except for those labeled Not Rated, are assigned ratings by one or more Nationally Recognized Statistical Credit Rating Organizations (NRSROs), such as Standard & Poor’s, Moody’s and Fitch, that can be considered by the investment manager as part of its independent securities analysis. When ratings from multiple agencies are available, the highest is used, consistent with the portfolio investment process. Ratings reflect an NRSRO’s opinion of an issuer’s creditworthiness and typically range from AAA (highest) to D (lowest). The Below Investment Grade category consists of bonds rated belowBBB-. The Refunded category generally consists of refunded bonds secured by U.S. government or other high-quality securities and not rerated by an NRSRO. The Not Rated category consists of ratable securities that have not been rated by an NRSRO. Cash and equivalents are excluded from this composition.
Performance Overview
The Fund’s Class A share price, as measured by net asset value, increased from $11.26 on September 10, 2018, to $11.30 on February 28, 2019. The Fund’s Class A shares paid dividends totaling 15.36 cents per share for the same period.2 The Performance Summary beginning on page 63 shows that at the end of this reporting period the Fund’s Class A shares’ distribution rate was 2.67% based on an annualization of February’s 2.63 cent per share monthly dividend and the maximum offering price of $11.80 on February 28, 2019. An
Dividend Distributions*
3/1/18–2/28/19
| | | | | | | | | | | | | | | | | | | | |
| | | Dividend per Share (cents) | |
| Month | | Class A** | | | Class A1 | | | Class C | | | Class R6 | | | Advisor
Class | |
March | | | — | | | | 2.92 | | | | 2.39 | | | | 3.02 | | | | 3.01 | |
April | | | — | | | | 2.92 | | | | 2.39 | | | | 3.02 | | | | 3.01 | |
May | | | — | | | | 2.92 | | | | 2.39 | | | | 3.02 | | | | 3.01 | |
June | | | — | | | | 2.92 | | | | 2.39 | | | | 3.04 | | | | 3.01 | |
July | | | — | | | | 2.92 | | | | 2.39 | | | | 3.04 | | | | 3.01 | |
August | | | — | | | | 2.92 | | | | 2.39 | | | | 3.04 | | | | 3.01 | |
September | | | 1.78 | | | | 2.92 | | | | 2.39 | | | | 3.04 | | | | 3.01 | |
October | | | 2.77 | | | | 2.92 | | | | 2.39 | | | | 3.04 | | | | 3.01 | |
November | | | 2.77 | | | | 2.92 | | | | 2.39 | | | | 3.04 | | | | 3.01 | |
December | | | 2.78 | | | | 2.92 | | | | 2.40 | | | | 3.04 | | | | 3.01 | |
January | | | 2.63 | | | | 2.77 | | | | 2.25 | | | | 2.89 | | | | 2.86 | |
February | | | 2.63 | | | | 2.77 | | | | 2.25 | | | | 2.89 | | | | 2.86 | |
Total | | | 15.36 | | | | 34.74 | | | | 28.41 | | | | 36.12 | | | | 35.82 | |
*The distribution amount is the sum of all net investment income distributions for the period shown. Assumes shares were purchased and held for the entire accrual period. Since dividends accrue daily, your actual distributions will vary depending on the date you purchased your shares and any account activity. All Fund distributions will vary depending upon current market conditions, and past distributions are not indicative of future trends.
**Effective 9/10/18, the Fund began offering Class A shares. See the prospectus for details.
investor in the 2019 maximum combined effective federal and North Carolina personal income tax bracket of 46.30% (including 3.80% Medicare tax) would need to earn a distribution rate of 4.97% from a taxable investment to match the Fund’s Class Atax-free distribution rate. For other performance data, please see the Performance Summary. Dividend distributions were affected by low interest rates during the period. This and other factors resulted in reduced income for the portfolio and caused dividends to be lower at the end of the period.
Performance data represent past performance, which does not guarantee future results. Investment return and principal value will fluctuate, and you may have a gain or loss when you sell your shares. Current performance may differ from figures shown. For most recentmonth-end performance, go tofranklintempleton.comor call(800)342-5236.
1. For investors subject to alternative minimum tax, a small portion of Fund dividends may be taxable. Distributions of capital gains are generally taxable. To avoid imposition of 28% backup withholding on all Fund distributions and redemption proceeds, U.S. investors must be properly certified on FormW-9 andnon-U.S. investors on FormW-8BEN.
2. The distribution amount is the sum of all net investment income distributions for the period shown. Assumes shares were purchased and held for the entire accrual period. Since dividends accrue daily, your actual distributions will vary depending on the date you purchased your shares and any account activity. All Fund distributions will vary depending upon current market conditions, and past distributions are not indicative of future trends.
The dollar value, number of shares or principal amount, and names of all portfolio holdings are listed in the Fund’s Statement of Investments (SOI). The SOI begins on page 138.
| | | | |
60 | | Annual Report | | franklintempleton.com |
FRANKLIN NORTH CAROLINATAX-FREE INCOME FUND
State Update
North Carolina’s diverse economy continued to grow during the 12 months under review, helped by strong employment and population growth and a favorable business climate. Nevertheless, personal income was lower than the national average and migration into the state offset some job creation. The housing market improved, as home prices rose and foreclosures generally trended downward to equal the national rate nearperiod-end. North Carolina’s unemployment rate fell from 4.2% in February 2018 to 3.9% atperiod-end, which was higher than the 3.8% national average.3
The state ended fiscal year (FY) 2018 on June 30, 2018, with available reserves that were higher than those in the prior year and higher than forecasted, largely due to growth in individual income tax collections. In June 2018, the state legislature overrode the governor’s veto to enact the FY 2019 budget that preserved prior income tax reductions scheduled to take effect in January 2019. The budget included significant raises for teachers, correctional officers and state troopers, and raised the minimum pay for all full-time state employees. The budget also featured acost-of-living adjustment for retirees, a dedicated contribution to the state’s reserve fund, and tax break incentives to attract large employers. Revenue growth for FY 2019 in the enacted budget was revised downward, when compared to the May 2017 consensus revenue forecast, due to higher-than-expected FY 2018 revenue growth. In October 2018, the Hurricane Florence Disaster Recovery Act was signed into law, which allocated spending toward hurricane relief efforts by drawing from available reserves. As of January 2019, the general fund revenue for the 2019 fiscalyear-to-date was higher than the prior-year period’s.
North Carolina’s nettax-supported debt remained relatively low at 1.5% of personal income and $611 per capita, compared with the 2.3% and $987 national medians, respectively.4 Independent credit rating agency Standard & Poor’s (S&P) affirmed its AAA rating and stable outlook for the state’s general obligation debt.5 S&P cited the state’s strengths, including its diverse economic base, prudent fiscal management,low-to-moderate debt burden, well-funded pension system and progress in addressing other postem-ployment benefit liabilities. The stable outlook reflected the strength of the state’s growing economy and budgetary performance in recent years that has led to increasing reserves. S&P expects North Carolina to continue to focus on structural
Portfolio Composition
2/28/19
| | |
| | | % of Total
Investments* |
Refunded** | | 28.09% |
Higher Education | | 20.15% |
Hospital & Health Care | | 19.15% |
Utilities | | 16.13% |
Transportation | | 7.11% |
General Obligation | | 7.08% |
Subject to Government Appropriations | | 1.53% |
Housing | | 0.43% |
Corporate-Backed | | 0.33% |
*Does not include cash and cash equivalents.
**Includes all refunded bonds; the percentage may differ from that in the Credit Quality Composition.
budget adjustments, as the state monitors revenue performance in the light of recent tax reforms.
Manager’s Discussion
We used various investment strategies during the 12 months under review as we sought to maximizetax-free income for shareholders. Please read the Investment Strategy and Manager’s Discussion on page 4 for more information.
Thank you for your continued participation in Franklin North CarolinaTax-Free Income Fund. We believe our conservative,buy-and-hold investment strategy can help us achieve high, current,tax-free income for shareholders.
3. Source: Bureau of Labor Statistics.
4. Source:Moody’s Investors Service, “States - US: Medians - State debt continues slow growth trend,” 4/24/18.
5. This does not indicate S&P’s rating of the Fund.
| | | | |
franklintempleton.com | | Annual Report | | 61 |
FRANKLIN NORTH CAROLINATAX-FREE INCOME FUND
The foregoing information reflects our analysis, opinions and portfolio holdings as of February 28, 2019, the end of the reporting period. The way we implement our main investment strategies and the resulting portfolio holdings may change depending on factors such as market and economic conditions. These opinions may not be relied upon as investment advice or an offer for a particular security. The information is not a complete analysis of every aspect of any market, state, industry, security or the Fund. Statements of fact are from sources considered reliable, but the investment manager makes no representation or warranty as to their completeness or accuracy. Although historical performance is no guarantee of future results, these insights may help you understand our investment management philosophy.
| | | | | | |
62 | | Annual Report | | | | franklintempleton.com |
FRANKLIN NORTH CAROLINATAX-FREE INCOME FUND
Performance Summary as of February 28, 2019
The performance tables and graphs do not reflect any taxes that a shareholder would pay on Fund dividends, capital gain distributions, if any, or any realized gains on the sale of Fund shares. Total return reflects reinvestment of the Fund’s dividends and capital gain distributions, if any, and any unrealized gains or losses. Your dividend income will vary depending on dividends or interest paid by securities in the Fund’s portfolio, adjusted for operating expenses of each class. Capital gain distributions are net profits realized from the sale of portfolio securities.
Performance as of 2/28/19
Cumulative total return excludes sales charges. Average annual total return includes maximum sales charges. Sales charges will vary depending on the size of the investment and the class of share purchased. The maximum is 4.25% and the minimum is 0%.Class A:4.25% maximum initial sales charge;Advisor Class:no sales charges. For other share classes, visitfranklintempleton.com.
| | | | |
| Share Class | | Cumulative
Total Return1
| | Average Annual Total Return2 |
| | |
A3 | | | | |
1-Year | | +3.24% | | -1.15% |
5-Year | | +12.10% | | +1.43% |
10-Year | | +43.34% | | +3.22% |
| | |
Advisor4 | | | | |
1-Year | | +3.42% | | +3.42% |
5-Year | | +12.78% | | +2.43% |
10-Year | | +44.83% | | +3.77% |
| | | | | | | | |
| Share Class | | Distribution Rate5 | | Taxable Equivalent
Distribution Rate6 | | 30-Day Standardized Yield7 | | Taxable Equivalent 30-Day Standardized Yield6 |
A | | 2.67% | | 4.97% | | 1.54% | | 2.87% |
Advisor | | 3.04% | | 5.66% | | 1.83% | | 3.41% |
Performance data represent past performance, which does not guarantee future results. Investment return and principal value will fluctuate, and you may have a gain or loss when you sell your shares. Current performance may differ from figures shown. For most recentmonth-end performance, go tofranklintempleton.comor call(800)342-5236.
See page 66 for Performance Summary footnotes.
| | | | |
franklintempleton.com | | Annual Report | | 63 |
FRANKLIN NORTH CAROLINATAX-FREE INCOME FUND
PERFORMANCE SUMMARY
Total Return Index Comparison for a Hypothetical $10,000 Investment
Total return represents the change in value of an investment over the periods shown. It includes any applicable maximum sales charge, Fund expenses, account fees and reinvested distributions. The unmanaged indexes include reinvestment of any income or distributions. They differ from the Fund in composition and do not pay management fees or expenses. One cannot invest directly in an index.
Class A(3/1/09–2/28/19)
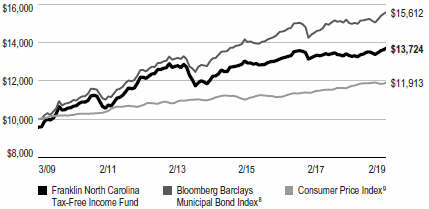
Advisor Class(3/1/09–2/28/19)

See page 66 for Performance Summary footnotes.
| | | | | | |
64 | | Annual Report | | | | franklintempleton.com |
FRANKLIN NORTH CAROLINATAX-FREE INCOME FUND
PERFORMANCE SUMMARY
Net Asset Value
| | | | | | | | |
Share Class(Symbol) | | 2/28/19 | | 9/10/18 | | 2/28/18 | | Change |
A (FQNCX) | | $11.30 | | $11.26 | | N/A | | +$0.04 |
A1(FXNCX) | | $11.30 | | N/A | | $11.28 | | +$0.02 |
C (FNCIX) | | $11.49 | | N/A | | $11.46 | | +$0.03 |
R6(FNCQX) | | $11.29 | | N/A | | $11.27 | | +$0.02 |
Advisor(FNCZX) | | $11.30 | | N/A | | $11.28 | | +$0.02 |
Distributions(3/1/18–2/28/19)
| | |
| Share Class | | Net Investment
Income |
A (9/10/18–2/28/19) | | $0.1536 |
A1 | | $0.3474 |
C | | $0.2841 |
R6 | | $0.3612 |
Advisor | | $0.3582 |
Total Annual Operating Expenses10
| | | | |
| Share Class | | | |
A | | | 0.81 | % |
Advisor | | | 0.56 | % |
See page 66 for Performance Summary footnotes.
| | | | | | | | |
franklintempleton.com | | | | | | Annual Report | | 65 |
FRANKLIN NORTH CAROLINATAX-FREE INCOME FUND
PERFORMANCE SUMMARY
Each class of shares is available to certain eligible investors and has different annual fees and expenses, as described in the prospectus.
All investments involve risks, including possible loss of principal. Because municipal bonds are sensitive to interest rate movements, the Fund’s yield and share price will fluctuate with market conditions. Bond prices generally move in the opposite direction of interest rates. Thus, as prices of bonds in the Fund adjust to a rise in interest rates, the Fund’s share price may decline. Because the Fund invests principally in a single state, it is subject to greater risk of adverse economic and regulatory changes in that state than a geographically diversified fund. Puerto Rico municipal bonds have been impacted by recent adverse economic and market changes, which may cause the Fund’s share price to decline. Changes in the credit rating of a bond, or in the credit rating or financial strength of a bond’s issuer, insurer or guarantor, may affect the bond’s value. The Fund may invest a significant part of its assets in municipal securities that finance similar types of projects, such as utilities, hospitals, higher education and transportation. A change that affects one project would likely affect all similar projects, thereby increasing market risk. The Fund is actively managed but there is no guarantee that the manager’s investment decisions will produce the desired results. The Fund’s prospectus also includes a description of the main investment risks.
1. Cumulative total return represents the change in value of an investment over the periods indicated.
2. Average annual total return represents the average annual change in value of an investment over the periods indicated. Return for less than one year, if any, has not been annualized.
3. Effective 9/10/18, Class A shares closed to new investors, were renamed Class A1 shares, and a new Class A share with a different expense structure became available. Class A performance shown has been calculated as follows: (a) for periods prior to 9/10/18, a restated figure is used based on the Fund’s Class A1 performance that includes any Rule12b-1 rate differential that exists between Class A1 and Class A; and (b) for periods after 9/10/18, actual Class A performance is used, reflecting all charges and fees applicable to that class.
4. Effective 7/1/09, the Fund began offering Advisor Class shares, which do not have sales charges or a Rule12b-1 plan. Performance quotations for this class reflect the following methods of calculation: (a) For periods prior to 7/1/09, a restated figure is used based upon the Fund’s Class A performance, excluding the effect of Class A’s maximum initial sales charge, but reflecting the effect of the Class A Rule12b-1 fees; and (b) for periods after 7/1/09, actual Advisor Class performance is used reflecting all charges and fees applicable to that class. Since 7/1/09 (commencement of sales), the cumulative and average annual total returns of Advisor Class shares were +39.37% and +3.50%.
5. Distribution rate is based on an annualization of the respective class’s February dividend and the maximum offering price (NAV for Advisor Class) per share on 2/28/19.
6. Taxable equivalent distribution rate and yield assume the published rates as of 12/18/18 for the maximum combined effective federal and North Carolina personal income tax rate of 46.30%, based on the federal income tax rate of 37.00% plus 3.80% Medicare tax.
7. The Fund’s30-day standardized yield is calculated over a trailing30-day period using the yield to maturity on bonds and/or the dividends accrued on stocks. It may not equal the Fund’s actual income distribution rate, which reflects the Fund’s past dividends paid to shareholders.
8. Source: Morningstar. The Bloomberg Barclays Municipal Bond Index is a market value-weighted index engineered for the long-termtax-exempt bond market. To be included in the index, bonds must be fixed rate, have at least one year to final maturity and be rated investment grade(Baa3/BBB- or higher) by at least two of the following agencies: Moody’s, S&P and Fitch.
9. Source: Bureau of Labor Statistics, bls.gov/cpi. The Consumer Price Index is a commonly used measure of the inflation rate.
10. Figures are as stated in the Fund’s current prospectus and may differ from the expense ratios disclosed in the Your Fund’s Expenses and Financial Highlights sections in this report. In periods of market volatility, assets may decline significantly, causing total annual Fund operating expenses to become higher than the figures shown.
See www.franklintempletondatasources.com for additional data provider information.
| | | | | | |
66 | | Annual Report | | | | franklintempleton.com |
FRANKLIN NORTH CAROLINATAX-FREE INCOME FUND
Your Fund’s Expenses
As a Fund shareholder, you can incur two types of costs: (1) transaction costs, including sales charges (loads) on Fund purchases and redemptions; and (2) ongoing Fund costs, including management fees, distribution and service(12b-1) fees, and other Fund expenses. All mutual funds have ongoing costs, sometimes referred to as operating expenses. The table below shows ongoing costs of investing in the Fund and can help you understand these costs and compare them with those of other mutual funds. The table assumes a $1,000 investment held for the six months indicated.
Actual Fund Expenses
The table below provides information about actual account values and actual expenses in the columns under the heading “Actual.” In these columns the Fund’s actual return, which includes the effect of Fund expenses, is used to calculate the “Ending Account Value” for each class of shares. You can estimate the expenses you paid during the period by following these steps (of course, your account value and expenses will differ from those in this illustration): Divide your account value by $1,000 (if your account had an $8,600 value, then $8,600÷ $1,000 = 8.6). Then multiply the result by the number in the row for your class of shares under the headings “Actual” and “Expenses Paid During Period” (if Actual Expenses Paid During Period were $7.50, then 8.6 x $7.50 =$64.50). In this illustration, the actual expenses paid this period are $64.50.
Hypothetical Example for Comparison with Other Funds
Under the heading “Hypothetical” in the table, information is provided about hypothetical account values and hypothetical expenses based on the Fund’s actual expense ratio and an assumed rate of return of 5% per year before expenses, which is not the Fund’s actual return. This information may not be used to estimate the actual ending account balance or expenses you paid for the period, but it can help you compare ongoing costs of investing in the Fund with those of other funds. To do so, compare this 5% hypothetical example for the class of shares you hold with the 5% hypothetical examples that appear in the shareholder reports of other funds.
Please note that expenses shown in the table are meant to highlight ongoing costs and do not reflect any transactional costs. Therefore, information under the heading “Hypothetical” is useful in comparing ongoing costs only, and will not help you compare total costs of owning different funds. In addition, if transactional costs were included, your total costs would have been higher.
| | | | | | | | | | | | |
| | | | | Actual | | Hypothetical | | |
| | | | | (actual return after expenses) | | (5% annual return before expenses) | | |
| | | | | | | | |
Share Class | | Beginning
Account
Value 9/1/181 | | Ending
Account
Value 2/28/19 | | Expenses Paid During Period 9/1/18–2/28/192,3,4 | | Ending
Account
Value 2/28/19 | | Expenses Paid During Period 9/1/18–2/28/193,4 | | Net
Annualized
Expense
Ratio4 |
| | | | | | |
A | | $1,000 | | $1,017.70 | | $3.92 | | $1,020.68 | | $4.16 | | 0.83% |
A1 | | $1,000 | | $1,015.40 | | $3.45 | | $1,021.37 | | $3.46 | | 0.69% |
C | | $1,000 | | $1,012.40 | | $6.19 | | $1,018.65 | | $6.21 | | 1.24% |
R6 | | $1,000 | | $1,015.20 | | $2.75 | | $1,022.07 | | $2.76 | | 0.55% |
Advisor | | $1,000 | | $1,015.90 | | $2.95 | | $1,021.87 | | $2.96 | | 0.59% |
1. For Classes A1, C, R6 and Advisor 9/1/18 for Actual and Hypothetical. For Class A, 9/10/18 for Actual and 9/1/18 for Hypothetical.
2. For Classes A1, C, R6 and Advisor, 9/1/18–2/28/19. For Class A, 9/10/18–2/28/19.
3. Expenses are equal to the annualized expense ratio for thesix-month period as indicated above—in the far right column—multiplied by the simple average account value over the period indicated, and then multiplied by 181/365 to reflect theone-half year period. The multiplier is 171/365 for Actual Class A expenses to reflect the number of days since inception.
4. Reflects expenses after fee waivers and expense reimbursements, for Class R6.
| | | | |
franklintempleton.com | | Annual Report | | 67 |
Franklin VirginiaTax-Free Income Fund
We are pleased to bring you Franklin VirginiaTax-Free Income Fund’s annual report for the fiscal year ended February 28, 2019.
Your Fund’s Goal and Main Investments
The Fund seeks to provide as high a level of income exempt from federal and Virginia personal income taxes as is consistent with prudent investment management and preservation of capital by investing at least 80% of its total assets in securities that pay interest free from such taxes.1
Credit Quality Composition*
2/28/19
| | |
| Ratings | | % of Total
Investments |
| | | | |
AAA | | | 17.56 | % |
AA | | | 57.55 | % |
A | | | 7.68 | % |
BBB | | | 3.89 | % |
Below Investment Grade | | | 1.61 | % |
Refunded | | | 10.65 | % |
Not Rated | | | 1.06 | % |
*Securities, except for those labeled Not Rated, are assigned ratings by one or more Nationally Recognized Statistical Credit Rating Organizations (NRSROs), such as Standard & Poor’s, Moody’s and Fitch, that can be considered by the investment manager as part of its independent securities analysis. When ratings from multiple agencies are available, the highest is used, consistent with the portfolio investment process. Ratings reflect an NRSRO’s opinion of an issuer’s creditworthiness and typically range from AAA (highest) to D (lowest). The Below Investment Grade category consists of bonds rated belowBBB-. The Refunded category generally consists of refunded bonds secured by U.S. government or other high-quality securities and not rerated by an NRSRO. The Not Rated category consists of ratable securities that have not been rated by an NRSRO. Cash and equivalents are excluded from this composition.
Performance Overview
The Fund’s Class A share price, as measured by net asset value, increased from $10.87 on September 10, 2018, to $10.92 on February 28, 2019. The Fund’s Class A shares paid dividends totaling 15.18 cents per share for the same period.2 The Performance Summary beginning on page 71 shows that at the end of this reporting period the Fund’s Class A shares’ distribution rate was 2.83% based on an annualization of February’s 2.69 cent per share monthly dividend and the
Dividend Distributions*
3/1/18–2/28/19
| | | | | | | | | | | | | | | | | | | | |
| | | Dividend per Share (cents) | |
| | | | |
| | | Class | | | Class | | | | | | | | | Advisor | |
| Month | | A** | | | A1 | | | Class C | | | Class R6 | | | Class | |
March | | | — | | | | 2.93 | | | | 2.41 | | | | 3.04 | | | | 3.02 | |
April | | | — | | | | 2.93 | | | | 2.41 | | | | 3.04 | | | | 3.02 | |
May | | | — | | | | 2.93 | | | | 2.41 | | | | 3.04 | | | | 3.02 | |
June | | | — | | | | 2.93 | | | | 2.42 | | | | 3.05 | | | | 3.02 | |
July | | | — | | | | 2.93 | | | | 2.42 | | | | 3.05 | | | | 3.02 | |
August | | | — | | | | 2.83 | | | | 2.32 | | | | 2.95 | | | | 2.92 | |
September | | | 1.73 | | | | 2.83 | | | | 2.31 | | | | 2.95 | | | | 2.92 | |
October | | | 2.69 | | | | 2.83 | | | | 2.31 | | | | 2.95 | | | | 2.92 | |
November | | | 2.69 | | | | 2.83 | | | | 2.31 | | | | 2.95 | | | | 2.92 | |
December | | | 2.69 | | | | 2.83 | | | | 2.32 | | | | 2.95 | | | | 2.92 | |
January | | | 2.69 | | | | 2.83 | | | | 2.32 | | | | 2.95 | | | | 2.92 | |
February | | | 2.69 | | | | 2.83 | | | | 2.32 | | | | 2.95 | | | | 2.92 | |
Total | | | 15.18 | | | | 34.46 | | | | 28.28 | | | | 35.87 | | | | 35.54 | |
*The distribution amount is the sum of all net investment income distributions for the period shown. Assumes shares were purchased and held for the entire accrual period. Since dividends accrue daily, your actual distributions will vary depending on the date you purchased your shares and any account activity. All Fund distributions will vary depending upon current market conditions, and past distributions are not indicative of future trends.
**Effective 9/10/18, the Fund began offering Class A shares. See the prospectus for details.
maximum offering price of $11.40 on February 28, 2019. An investor in the 2019 maximum combined effective federal and Virginia personal income tax bracket of 46.55% (including 3.80% Medicare tax) would need to earn a distribution rate of 5.29% from a taxable investment to match the Fund’s Class Atax-free distribution rate. For other performance data, please see the Performance Summary. Dividend distributions were affected by low interest rates during the period. This and other factors resulted in reduced income for the portfolio and caused dividends to be lower at the end of the period.
Performance data represent past performance, which does not guarantee future results. Investment return and principal value will fluctuate, and you may have a gain or loss when you sell your shares. Current performance may differ from figures shown. For most recentmonth-end performance, go tofranklintempleton.comor call(800)342-5236.
1. For investors subject to alternative minimum tax, a small portion of Fund dividends may be taxable. Distributions of capital gains are generally taxable. To avoid imposition of 28% backup withholding on all Fund distributions and redemption proceeds, U.S. investors must be properly certified on FormW-9 andnon-U.S. investors on FormW-8BEN.
2. The distribution amount is the sum of all net investment income distributions for the period shown. Assumes shares were purchased and held for the entire accrual period. Since dividends accrue daily, your actual distributions will vary depending on the date you purchased your shares and any account activity. All Fund distributions will vary depending upon current market conditions, and past distributions are not indicative of future trends.
The dollar value, number of shares or principal amount, and names of all portfolio holdings are listed in the Fund’s Statement of Investments (SOI). The SOI begins on page 147.
| | | | |
68 | | Annual Report | | franklintempleton.com |
FRANKLIN VIRGINIATAX-FREE INCOME FUND
Commonwealth Update
Virginia’s economy remained stable and continued to grow during the 12 months under review, helped by a sizable federal government presence. However, the commonwealth’s economic growth lagged that of the nation’s, partly due to slower growing federal employment, and most of the recent job growth has been in lower wage industries. Virginia’s home sales and prices increased, and the foreclosure rate rose before ending the period relatively unchanged and below the national rate. The commonwealth’s unemployment rate declined from 3.2% in February 2018 to 2.9% atperiod-end, which was significantly lower than the 3.8% national average.3
The commonwealth ended fiscal year (FY) 2018 on June 30, 2018, with a budget surplus after strong revenue growth, outperforming lawmakers’ expectations. The strong performance was largely due to payroll withholding andnon-withholding income tax collections that were higher than in previous years. The state planned to deposit the majority of the surplus into cash reserves. In June 2018, the governor signed the 2018–2020 biennial budget into law, which included revenue enhancement and savings initiatives, without significant spending cuts. The enacted budget increased spending for Medicaid expansion, including behavioral health and development services. The budget also increased funding forK-12 education, workforce development, raises for teachers and other state employees, infrastructure projects and reserves. The budget fully funded the actuarially determined contributions for the Virginia Retirement System. In December 2018, the governor proposed amendments to the biennial budget to improve cash reserves and increase spending largely across the same categories.
Virginia’s nettax-supported debt was 2.9% of personal income and $1,515 per capita, compared with the 2.3% and $987 national medians, respectively.4 Independent credit rating agency Standard & Poor’s (S&P) affirmed the commonwealth’s general obligation debt rating at AAA, and upgraded its outlook from negative to stable earlier in the period.5 The rating reflected S&P’s view of Virginia’s strong and diverse economy, strong financial policies and practices, long history of proactive and conservative financial management, and the state’s moderate debt levels. The stable outlook reflected S&P’s opinion that the commonwealth should experience positive revenue performance in the 2018–2020 biennium and remain committed to structural budget solutions and the
Portfolio Composition
2/28/19
| | |
| | | % of Total
Investments* |
Utilities | | 23.28% |
Refunded** | | 19.64% |
Hospital & Health Care | | 14.23% |
Transportation | | 13.59% |
Higher Education | | 13.41% |
Housing | | 6.71% |
General Obligation | | 4.58% |
Subject to Government Appropriations | | 3.14% |
Other Revenue | | 1.42% |
*Does not include cash and cash equivalents.
**Includes all refunded bonds; the percentage may differ from that in the Credit Quality Composition.
rebuilding of reserve balances. S&P stated that if the commonwealth reversed its efforts to rebuild its reserves, returned to structural imbalance or experienced weaker economic performance relative to the nation’s, it might lead the rating agency to consider a lower rating.
Manager’s Discussion
We used various investment strategies during the 12 months under review as we sought to maximizetax-free income for shareholders. Please read the Investment Strategy and Manager’s Discussion on page 4 for more information.
Thank you for your continued participation in Franklin VirginiaTax-Free Income Fund. We believe our conservative,buy-and-hold investment strategy can help us achieve high, current,tax-free income for shareholders.
3. Source: Bureau of Labor Statistics.
4. Source:Moody’s Investors Service, “States - US: Medians - State debt continues slow growth trend,” 4/24/18.
5. This does not indicate S&P’s rating of the Fund.
| | | | |
franklintempleton.com | | Annual Report | | 69 |
FRANKLIN VIRGINIATAX-FREE INCOME FUND
The foregoing information reflects our analysis, opinions and portfolio holdings as of February 28, 2019, the end of the reporting period. The way we implement our main investment strategies and the resulting portfolio holdings may change depending on factors such as market and economic conditions. These opinions may not be relied upon as investment advice or an offer for a particular security. The information is not a complete analysis of every aspect of any market, state, industry, security or the Fund. Statements of fact are from sources considered reliable, but the investment manager makes no representation or warranty as to their completeness or accuracy. Although historical performance is no guarantee of future results, these insights may help you understand our investment management philosophy.
| | | | | | |
70 | | Annual Report | | | | franklintempleton.com |
FRANKLIN VIRGINIATAX-FREE INCOME FUND
Performance Summary as of February 28, 2019
The performance tables and graphs do not reflect any taxes that a shareholder would pay on Fund dividends, capital gain distributions, if any, or any realized gains on the sale of Fund shares. Total return reflects reinvestment of the Fund’s dividends and capital gain distributions, if any, and any unrealized gains or losses. Your dividend income will vary depending on dividends or interest paid by securities in the Fund’s portfolio, adjusted for operating expenses of each class. Capital gain distributions are net profits realized from the sale of portfolio securities.
Performance as of 2/28/19
Cumulative total return excludes sales charges. Average annual total return includes maximum sales charges. Sales charges will vary depending on the size of the investment and the class of share purchased. The maximum is 4.25% and the minimum is 0%.Class A:4.25% maximum initial sales charge;Advisor Class:no sales charges. For other share classes, visitfranklintempleton.com.
| | | | |
| Share Class | | Cumulative
Total Return1
| | Average Annual
Total Return2 |
| | |
A3 | | | | |
1-Year | | +3.23% | | -1.16% |
5-Year | | +13.63% | | +1.70% |
10-Year | | +44.48% | | +3.30% |
| | |
Advisor4 | | | | |
1-Year | | +3.32% | | +3.32% |
5-Year | | +14.30% | | +2.71% |
10-Year | | +45.96% | | +3.85% |
| | | | | | | | |
| Share Class | | Distribution
Rate5 | | Taxable Equivalent
Distribution Rate6 | | 30-Day Standardized Yield7 | | Taxable Equivalent 30-Day Standardized Yield6 |
A | | 2.83% | | 5.29% | | 1.52% | | 2.84% |
Advisor | | 3.21% | | 6.01% | | 1.83% | | 3.42% |
Performance data represent past performance, which does not guarantee future results. Investment return and principal value will fluctuate, and you may have a gain or loss when you sell your shares. Current performance may differ from figures shown. For most recentmonth-end performance, go tofranklintempleton.comor call(800)342-5236.
See page 74 for Performance Summary footnotes.
| | | | |
franklintempleton.com | | Annual Report | | 71 |
FRANKLIN VIRGINIATAX-FREE INCOME FUND
PERFORMANCE SUMMARY
Total Return Index Comparison for a Hypothetical $10,000 Investment
Total return represents the change in value of an investment over the periods shown. It includes any applicable maximum sales charge, Fund expenses, account fees and reinvested distributions. The unmanaged indexes include reinvestment of any income or distributions. They differ from the Fund in composition and do not pay management fees or expenses. One cannot invest directly in an index.
Class A(3/1/09–2/28/19)
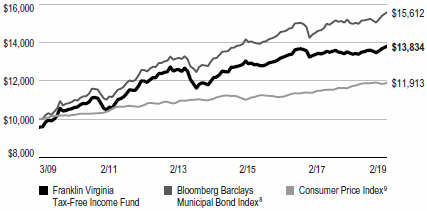
Advisor Class(3/1/09–2/28/19)
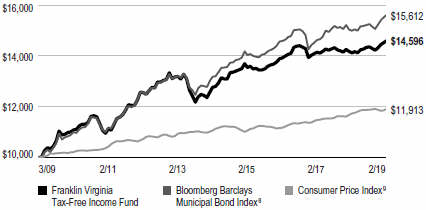
See page 74 for Performance Summary footnotes.
| | | | | | |
72 | | Annual Report | | | | franklintempleton.com |
FRANKLIN VIRGINIATAX-FREE INCOME FUND
PERFORMANCE SUMMARY
Net Asset Value
| | | | | | | | | | | | | | | | |
Share Class(Symbol) | | | 2/28/19 | | | | 9/10/18 | | | | 2/28/18 | | | | Change | |
A(FVAQX) | | | $10.92 | | | | $10.87 | | | | N/A | | | | +$0.05 | |
A1(FRVAX) | | | $10.91 | | | | N/A | | | | $10.91 | | | | $0.00 | |
C(FVAIX) | | | $11.10 | | | | N/A | | | | $11.09 | | | | +$0.01 | |
R6(FRVRX) | | | $10.92 | | | | N/A | | | | $10.91 | | | | +$0.01 | |
Advisor(FRVZX) | | | $10.92 | | | | N/A | | | | $10.92 | | | | $0.00 | |
Distributions(3/1/18–2/28/19)
| | | | |
| Share Class | | Net Investment
Income | |
A (9/10/18–2/28/19) | | | $0.1518 | |
A1 | | | $0.3446 | |
C | | | $0.2828 | |
R6 | | | $0.3587 | |
Advisor | | | $0.3554 | |
Total Annual Operating Expenses10
| | | | |
| Share Class | | | |
A | | | 0.82 | % |
Advisor | | | 0.57 | % |
See page 74 for Performance Summary footnotes.
| | | | | | | | |
franklintempleton.com | | | | | | Annual Report | | 73 |
FRANKLIN VIRGINIATAX-FREE INCOME FUND
PERFORMANCE SUMMARY
Each class of shares is available to certain eligible investors and has different annual fees and expenses, as described in the prospectus.
All investments involve risks, including possible loss of principal. Because municipal bonds are sensitive to interest rate movements, the Fund’s yield and share price will fluctuate with market conditions. Bond prices generally move in the opposite direction of interest rates. Thus, as prices of bonds in the Fund adjust to a rise in interest rates, the Fund’s share price may decline. Because the Fund invests principally in a single state, it is subject to greater risk of adverse economic and regulatory changes in that state than a geographically diversified fund. Puerto Rico municipal bonds have been impacted by recent adverse economic and market changes, which may cause the Fund’s share price to decline. Changes in the credit rating of a bond, or in the credit rating or financial strength of a bond’s issuer, insurer or guarantor, may affect the bond’s value. The Fund may invest a significant part of its assets in municipal securities that finance similar types of projects, such as utilities, hospitals, higher education and transportation. A change that affects one project would likely affect all similar projects, thereby increasing market risk. The Fund is actively managed but there is no guarantee that the manager’s investment decisions will produce the desired results. The Fund’s prospectus also includes a description of the main investment risks.
1. Cumulative total return represents the change in value of an investment over the periods indicated.
2. Average annual total return represents the average annual change in value of an investment over the periods indicated. Return for less than one year, if any, has not been annualized.
3. Effective 9/10/18, Class A shares closed to new investors, were renamed Class A1 shares, and a new Class A share with a different expense structure became available. Class A performance shown has been calculated as follows: (a) for periods prior to 9/10/18, a restated figure is used based on the Fund’s Class A1 performance that includes any Rule12b-1 rate differential that exists between Class A1 and Class A; and (b) for periods after 9/10/18, actual Class A performance is used, reflecting all charges and fees applicable to that class.
4. Effective 7/1/09, the Fund began offering Advisor Class shares, which do not have sales charges or a Rule12b-1 plan. Performance quotations for this class reflect the following methods of calculation: (a) For periods prior to 7/1/09, a restated figure is used based upon the Fund’s Class A performance, excluding the effect of Class A’s maximum initial sales charge, but reflecting the effect of the Class A Rule12b-1 fees; and (b) for periods after 7/1/09, actual Advisor Class performance is used reflecting all charges and fees applicable to that class. Since 7/1/09 (commencement of sales), the cumulative and average annual total returns of Advisor Class shares were +41.20% and +3.64%.
5. Distribution rate is based on an annualization of the respective class’s February dividend and the maximum offering price (NAV for Advisor Class) per share on 2/28/19.
6. Taxable equivalent distribution rate and yield assume the published rates as of 12/18/18 for the maximum combined effective federal and Virginia personal income tax rate of 46.55%, based on the federal income tax rate of 37.00% plus 3.80% Medicare tax.
7. The Fund’s30-day standardized yield is calculated over a trailing30-day period using the yield to maturity on bonds and/or the dividends accrued on stocks. It may not equal the Fund’s actual income distribution rate, which reflects the Fund’s past dividends paid to shareholders.
8. Source: Morningstar. The Bloomberg Barclays Municipal Bond Index is a market value-weighted index engineered for the long-termtax-exempt bond market. To be included in the index, bonds must be fixed rate, have at least one year to final maturity and be rated investment grade(Baa3/BBB- or higher) by at least two of the following agencies: Moody’s, S&P and Fitch.
9. Source: Bureau of Labor Statistics, bls.gov/cpi. The Consumer Price Index is a commonly used measure of the inflation rate.
10. Figures are as stated in the Fund’s current prospectus and may differ from the expense ratios disclosed in the Your Fund’s Expenses and Financial Highlights sections in this report. In periods of market volatility, assets may decline significantly, causing total annual Fund operating expenses to become higher than the figures shown.
See www.franklintempletondatasources.com for additional data provider information.
| | | | | | |
74 | | Annual Report | | | | franklintempleton.com |
FRANKLIN VIRGINIATAX-FREE INCOME FUND
Your Fund’s Expenses
As a Fund shareholder, you can incur two types of costs: (1) transaction costs, including sales charges (loads) on Fund purchases and redemptions; and (2) ongoing Fund costs, including management fees, distribution and service(12b-1) fees, and other Fund expenses. All mutual funds have ongoing costs, sometimes referred to as operating expenses. The table below shows ongoing costs of investing in the Fund and can help you understand these costs and compare them with those of other mutual funds. The table assumes a $1,000 investment held for the six months indicated.
Actual Fund Expenses
The table below provides information about actual account values and actual expenses in the columns under the heading “Actual.” In these columns the Fund’s actual return, which includes the effect of Fund expenses, is used to calculate the “Ending Account Value” for each class of shares. You can estimate the expenses you paid during the period by following these steps (of course, your account value and expenses will differ from those in this illustration): Divide your account value by $1,000 (if your account had an $8,600 value, then $8,600÷ $1,000 = 8.6). Then multiply the result by the number in the row for your class of shares under the headings “Actual” and “Expenses Paid During Period” (if Actual Expenses Paid During Period were $7.50, then 8.6 x $7.50 =$64.50). In this illustration, the actual expenses paid this period are $64.50.
Hypothetical Example for Comparison with Other Funds
Under the heading “Hypothetical” in the table, information is provided about hypothetical account values and hypothetical expenses based on the Fund’s actual expense ratio and an assumed rate of return of 5% per year before expenses, which is not the Fund’s actual return. This information may not be used to estimate the actual ending account balance or expenses you paid for the period, but it can help you compare ongoing costs of investing in the Fund with those of other funds. To do so, compare this 5% hypothetical example for the class of shares you hold with the 5% hypothetical examples that appear in the shareholder reports of other funds.
Please note that expenses shown in the table are meant to highlight ongoing costs and do not reflect any transactional costs. Therefore, information under the heading “Hypothetical” is useful in comparing ongoing costs only, and will not help you compare total costs of owning different funds. In addition, if transactional costs were included, your total costs would have been higher.
| | | | | | | | | | | | |
| | | | | Actual | | Hypothetical | | |
| | | | | (actual return after expenses) | | (5% annual return before expenses) | | |
| | | | | | | | |
Share Class | | Beginning
Account Value 9/1/181 | | Ending
Account
Value 2/28/19 | | Expenses Paid During
Period 9/1/18–2/28/192,3,4 | | Ending
Account
Value 2/28/19 | | Expenses Paid During
Period 9/1/18–2/28/193,4 | | Net Annualized
Expense
Ratio4 |
| | | | | | |
A | | $1,000 | | $1,019.00 | | $3.97 | | $1,020.63 | | $4.21 | | 0.84% |
A1 | | $1,000 | | $1,015.80 | | $3.55 | | $1,021.27 | | $3.56 | | 0.71% |
C | | $1,000 | | $1,013.60 | | $6.29 | | $1,018.55 | | $6.31 | | 1.26% |
R6 | | $1,000 | | $1,017.40 | | $2.80 | | $1,022.02 | | $2.81 | | 0.56% |
Advisor | | $1,000 | | $1,016.30 | | $3.05 | | $1,021.77 | | $3.06 | | 0.61% |
1. For Classes A1, C, R6 and Advisor 9/1/18 for Actual and Hypothetical. For Class A, 9/10/18 for Actual and 9/1/18 for Hypothetical.
2. For Classes A1, C, R6 and Advisor, 9/1/18–2/28/19. For Class A, 9/10/18–2/28/19.
3. Expenses are equal to the annualized expense ratio for thesix-month period as indicated above—in the far right column—multiplied by the simple average account value over the period indicated, and then multiplied by 181/365 to reflect theone-half year period. The multiplier is 171/365 for Actual Class A expenses to reflect the number of days since inception.
4. Reflects expenses after fee waivers and expense reimbursements, for Class R6.
| | | | |
franklintempleton.com | | Annual Report | | 75 |
FRANKLIN TAX-FREE TRUST
Financial Highlights
Franklin AlabamaTax-Free Income Fund
| | | | |
| | | Year Ended | |
| | | February 28,
2019a | |
| |
Class A | | | | |
| |
Per share operating performance | | | | |
(for a share outstanding throughout the year) | | | | |
| |
Net asset value, beginning of year | | | $10.79 | |
| | | | |
| |
Income from investment operationsb: | | | | |
| |
Net investment incomec | | | 0.15 | |
| |
Net realized and unrealized gains (losses) | | | 0.06 | |
| | | | |
| |
Total from investment operations | | | 0.21 | |
| | | | |
| |
Less distributions from net investment income | | | (0.15 | ) |
| | | | |
| |
Net asset value, end of year | | | $10.85 | |
| | | | |
| |
Total returnd | | | 1.98% | |
| |
Ratios to average net assetse | | | | |
| |
Expensesf | | | 0.92% | |
| |
Net investment income | | | 2.91% | |
| |
Supplemental data | | | | |
| |
Net assets, end of year (000’s) | | | $7,334 | |
| |
Portfolio turnover rate | | | 8.57% | |
aFor the period September 10, 2018 (effective date) to February 28, 2019.
bThe amount shown for a share outstanding throughout the period may not correlate with the Statement of Operations for the period due to the timing of sales and repurchases of the Fund’s shares in relation to income earned and/or fluctuating fair value of the investments of the Fund.
cBased on average daily shares outstanding.
dTotal return does not reflect sales commissions or contingent deferred sales charges, if applicable, and is not annualized for periods less than one year.
eRatios are annualized for periods less than one year.
fBenefit of expense reduction rounds to less than 0.01%.
| | | | | | |
76 | | Annual Report | | | The accompanying notes are an integral part of these financial statements. | | franklintempleton.com |
FRANKLIN TAX-FREE TRUST
FINANCIAL HIGHLIGHTS
Franklin AlabamaTax-Free Income Fund(continued)
| | | | | | | | | | | | | | | | | | | | |
| | | Year Ended February 28, | |
| | | 2019 | | | 2018 | | | 2017 | | | 2016a | | | 2015 | |
| | | | | |
Class A1 | | | | | | | | | | | | | | | | | | | | |
| | | | | |
Per share operating performance | | | | | | | | | | | | | | | | | | | | |
(for a share outstanding throughout the year) | | | | | | | | | | | | | | | | | | | | |
| | | | | |
Net asset value, beginning of year | | | $10.88 | | | | $11.16 | | | | $11.35 | | | | $11.55 | | | | $11.18 | |
| | | | |
| | | | | |
Income from investment operationsb: | | | | | | | | | | | | | | | | | | | | |
| | | | | |
Net investment incomec | | | 0.33 | | | | 0.35 | | | | 0.39 | | | | 0.42 | | | | 0.44 | |
| | | | | |
Net realized and unrealized gains (losses) | | | (0.04 | ) | | | (0.27 | ) | | | (0.20 | ) | | | (0.20 | ) | | | 0.37 | |
| | | | |
| | | | | |
Total from investment operations | | | 0.29 | | | | 0.08 | | | | 0.19 | | | | 0.22 | | | | 0.81 | |
| | | | |
| | | | | |
Less distributions from net investment income | | | (0.33 | ) | | | (0.36 | ) | | | (0.38 | ) | | | (0.42 | ) | | | (0.44 | ) |
| | | | |
| | | | | |
Net asset value, end of year | | | $10.84 | | | | $10.88 | | | | $11.16 | | | | $11.35 | | | | $11.55 | |
| | | | |
| | | | | |
Total returnd | | | 2.76% | | | | 0.72% | | | | 1.69% | | | | 1.99% | | | | 7.35% | |
| | | | | |
Ratios to average net assets | | | | | | | | | | | | | | | | | | | | |
| | | | | |
Expenses | | | 0.77% | e | | | 0.74% | | | | 0.72% | | | | 0.71% | | | | 0.72% | |
| | | | | |
Net investment income | | | 3.06% | | | | 3.16% | | | | 3.38% | | | | 3.73% | | | | 3.83% | |
| | | | | |
Supplemental data | | | | | | | | | | | | | | | | | | | | |
| | | | | |
Net assets, end of year (000’s) | | | $188,290 | | | | $208,340 | | | | $225,050 | | | | $228,212 | | | | $224,586 | |
| | | | | |
Portfolio turnover rate | | | 8.57% | | | | 14.66% | | | | 16.81% | | | | 10.70% | | | | 6.46% | |
aFor the year ended February 29.
bThe amount shown for a share outstanding throughout the period may not correlate with the Statement of Operations for the period due to the timing of sales and repurchases of the Fund’s shares in relation to income earned and/or fluctuating fair value of the investments of the Fund.
cBased on average daily shares outstanding.
dTotal return does not reflect sales commissions or contingent deferred sales charges, if applicable.
eBenefit of expense reduction rounds to less than 0.01%.
| | | | | | | | |
franklintempleton.com | | | | The accompanying notes are an integral part of these financial statements. | | | Annual Report | | 77 |
FRANKLINTAX-FREE TRUST
FINANCIAL HIGHLIGHTS
Franklin Alabama Tax-Free Income Fund(continued)
| | | | | | | | | | | | | | | | | | | | |
| | | Year Ended February 28, | |
| | | 2019 | | | 2018 | | | 2017 | | | 2016a | | | 2015 | |
| | | | | |
Class C | | | | | | | | | | | | | | | | | | | | |
| | | | | |
Per share operating performance | | | | | | | | | | | | | | | | | | | | |
(for a share outstanding throughout the year) | | | | | | | | | | | | | | | | | | | | |
| | | | | |
Net asset value, beginning of year | | | $11.02 | | | | $11.30 | | | | $11.49 | | | | $11.69 | | | | $11.31 | |
| | | | |
| | | | | |
Income from investment operationsb: | | | | | | | | | | | | | | | | | | | | |
| | | | | |
Net investment incomec | | | 0.27 | | | | 0.29 | | | | 0.33 | | | | 0.37 | | | | 0.38 | |
| | | | | |
Net realized and unrealized gains (losses) | | | (0.04 | ) | | | (0.27 | ) | | | (0.20 | ) | | | (0.21 | ) | | | 0.38 | |
| | | | |
| | | | | |
Total from investment operations | | | 0.23 | | | | 0.02 | | | | 0.13 | | | | 0.16 | | | | 0.76 | |
| | | | |
| | | | | |
Less distributions from net investment income | | | (0.27 | ) | | | (0.30 | ) | | | (0.32 | ) | | | (0.36 | ) | | | (0.38 | ) |
| | | | |
| | | | | |
Net asset value, end of year | | | $10.98 | | | | $11.02 | | | | $11.30 | | | | $11.49 | | | | $11.69 | |
| | | | |
| | | | | |
Total returnd | | | 2.15% | | | | 0.16% | | | | 1.11% | | | | 1.41% | | | | 6.77% | |
| | | | | |
Ratios to average net assets | | | | | | | | | | | | | | | | | | | | |
| | | | | |
Expenses | | | 1.32% | e | | | 1.29% | | | | 1.27% | | | | 1.26% | | | | 1.27% | |
| | | | | |
Net investment income | | | 2.51% | | | | 2.61% | | | | 2.83% | | | | 3.18% | | | | 3.28% | |
| | | | | |
Supplemental data | | | | | | | | | | | | | | | | | | | | |
| | | | | |
Net assets, end of year (000’s) | | | $30,641 | | | | $45,422 | | | | $55,619 | | | | $54,075 | | | | $53,424 | |
| | | | | |
Portfolio turnover rate | | | 8.57% | | | | 14.66% | | | | 16.81% | | | | 10.70% | | | | 6.46% | |
aFor the year ended February 29.
bThe amount shown for a share outstanding throughout the period may not correlate with the Statement of Operations for the period due to the timing of sales and repurchases of the Fund’s shares in relation to income earned and/or fluctuating fair value of the investments of the Fund.
cBased on average daily shares outstanding.
dTotal return does not reflect sales commissions or contingent deferred sales charges, if applicable.
eBenefit of expense reduction rounds to less than 0.01%.
| | | | | | |
78 | | Annual Report | | | The accompanying notes are an integral part of these financial statements. | | franklintempleton.com |
FRANKLIN TAX-FREE TRUST
FINANCIAL HIGHLIGHTS
Franklin Alabama Tax-Free Income Fund(continued)
| | | | |
| | | Year Ended February 28, |
| | | 2019 | | 2018a |
| | |
Class R6 | | | | |
| | |
Per share operating performance | | | | |
(for a share outstanding throughout the year) | | | | |
| | |
Net asset value, beginning of year | | $10.88 | | $11.13 |
| | |
Income from investment operationsb: | | | | |
| | |
Net investment incomec | | 0.35 | | 0.22 |
| | |
Net realized and unrealized gains (losses) | | (0.04) | | (0.26) |
| | |
Total from investment operations | | 0.31 | | (0.04) |
| | |
Less distributions from net investment income | | (0.35) | | (0.21) |
| | |
Net asset value, end of year | | $10.84 | | $10.88 |
| | |
Total returnd | | 2.78% | | (0.26)% |
| | |
Ratios to average net assetse | | | | |
| | |
Expenses before waiver and payments by affiliates | | 0.65% | | 0.66% |
| | |
Expenses net of waiver and payments by affiliates | | 0.63%f | | 0.61% |
| | |
Net investment income | | 3.20% | | 3.29% |
| | |
Supplemental data | | | | |
| | |
Net assets, end of year (000’s) | | $824 | | $1,516 |
| | |
Portfolio turnover rate | | 8.57% | | 14.66% |
aFor the period August 1, 2017 (effective date) to February 28, 2018.
bThe amount shown for a share outstanding throughout the period may not correlate with the Statement of Operations for the period due to the timing of sales and repurchases of the Fund’s shares in relation to income earned and/or fluctuating fair value of the investments of the Fund.
cBased on average daily shares outstanding.
dTotal return is not annualized for periods less than one year.
eRatios are annualized for periods less than one year.
fBenefit of expense reduction rounds to less than 0.01%.
| | | | | | | | |
franklintempleton.com | | | | The accompanying notes are an integral part of these financial statements. | | | Annual Report | | 79 |
FRANKLIN TAX-FREE TRUST
FINANCIAL HIGHLIGHTS
Franklin Alabama Tax-Free Income Fund(continued)
| | | | | | |
| | | �� Year Ended February 28, |
| | | 2019 | | 2018 | | 2017a |
| | | |
Advisor Class | | | | | | |
| | | |
Per share operating performance | | | | | | |
(for a share outstanding throughout the year) | | | | | | |
| | | |
Net asset value, beginning of year | | $10.88 | | $11.16 | | $11.49 |
| | | |
Income from investment operationsb: | | | | | | |
| | | |
Net investment incomec | | 0.34 | | 0.36 | | 0.18 |
| | | |
Net realized and unrealized gains (losses) | | (0.04) | | (0.27) | | (0.33) |
| | | |
Total from investment operations. | | 0.30 | | 0.09 | | (0.15) |
| | | |
Less distributions from net investment income | | (0.34) | | (0.37) | | (0.18) |
| | | |
Net asset value, end of year | | $10.84 | | $10.88 | | $11.16 |
| | | |
Total returnd | | 2.86% | | 0.82% | | (1.33)% |
| | | |
Ratios to average net assetse | | | | | | |
| | | |
Expenses | | 0.67%f | | 0.64% | | 0.62% |
| | | |
Net investment income | | 3.16% | | 3.26% | | 3.48% |
| | | |
Supplemental data | | | | | | |
| | | |
Net assets, end of year (000’s) | | $8,335 | | $7,689 | | $5,149 |
| | | |
Portfolio turnover rate | | 8.57% | | 14.66% | | 16.81% |
aFor the period September 15, 2016 (effective date) to February 28, 2017.
bThe amount shown for a share outstanding throughout the period may not correlate with the Statement of Operations for the period due to the timing of sales and repurchases of the Fund’s shares in relation to income earned and/or fluctuating fair value of the investments of the Fund.
cBased on average daily shares outstanding.
dTotal return is not annualized for periods less than one year.
eRatios are annualized for periods less than one year.
fBenefit of expense reduction rounds to less than 0.01%.
| | | | | | |
80 | | Annual Report | | | The accompanying notes are an integral part of these financial statements. | | franklintempleton.com |
FRANKLIN TAX-FREE TRUST
Statement of Investments, February 28, 2019
Franklin AlabamaTax-Free Income Fund
| | | | | | | | |
| | | Principal
Amount | | | Value | |
Municipal Bonds 98.6% | | | | | | | | |
Alabama 98.6% | | | | | | | | |
Alabama Federal Aid Highway Finance Authority Special Obligation Revenue, Series A, 5.00%, 6/01/37 | | $ | 4,130,000 | | | $ | 4,788,858 | |
Alabama Special Care Facilities Financing Authority Birmingham Revenue, Ascension Senior Credit Group, | | | | | | | | |
Refunding, Series B, 5.00%, 11/15/46 | | | 3,000,000 | | | | 3,310,740 | |
Alabama State Port Authority Docks Facilities Revenue,Pre-Refunded, 6.00%, 10/01/40 | | | 3,000,000 | | | | 3,205,920 | |
Anniston PBA Building Revenue, Judicial Center Project, AGMC Insured,Pre-Refunded, 5.00%, 3/01/43 | | | 4,120,000 | | | | 4,391,014 | |
Auburn University General Fee Revenue, Refunding, Series A, 5.00%, 6/01/33 | | | 2,500,000 | | | | 2,878,900 | |
Baldwin County Board of Education Revenue, | | | | | | | | |
Capital Outlay School wts., Refunding, 5.00%, 6/01/27 | | | 3,015,000 | | | | 3,279,868 | |
School wts., Refunding, 5.00%, 6/01/24 | | | 2,605,000 | | | | 2,851,824 | |
School wts., Refunding, 5.00%, 6/01/26 | | | 2,870,000 | | | | 3,123,048 | |
Bessemer Governmental Utility Services Corp. Water Supply Revenue, Refunding, BAM Insured, 5.00%, 6/01/39 | | | 6,000,000 | | | | 6,698,880 | |
Bessemer Water Revenue, wts., Refunding, AGMC Insured, 5.00%, 1/01/47. | | | 2,590,000 | | | | 2,839,262 | |
Birmingham GO, Convertible, Capital Appreciation, Series A, 5.00%, 3/01/43 | | | 5,000,000 | | | | 5,418,200 | |
Birmingham Special Care Facilities Financing Authority Health Care Facility Revenue, Children’s Hospital, | | | | | | | | |
Assured Guaranty,Pre-Refunded, 6.00%, 6/01/39 | | | 4,000,000 | | | | 4,041,720 | |
Birmingham Water Works Board Water Revenue, | | | | | | | | |
Senior, Refunding, Series A, 4.00%, 1/01/35 | | | 4,000,000 | | | | 4,206,840 | |
Series B, 5.00%, 1/01/43 | | | 3,745,000 | | | | 4,088,866 | |
Subordinate, Refunding, Series B, 5.00%, 1/01/43 | | | 10,000,000 | | | | 11,182,900 | |
Calhoun County Board of Education Special Tax School wts. Revenue, BAM Insured, 5.00%, 2/01/46 | | | 6,000,000 | | | | 6,591,780 | |
Chatom IDB Gulf Opportunity Zone Revenue, | | | | | | | | |
PowerSouth Energy Cooperative, Refunding, Series A, Assured Guaranty, 5.00%, 8/01/30 | | | 5,250,000 | | | | 5,448,502 | |
PowerSouth Energy Cooperative, Refunding, Series A, Assured Guaranty, 5.00%, 8/01/37 | | | 5,000,000 | | | | 5,176,350 | |
Cullman Utilities Board Water Revenue, AGMC Insured, 5.00%, 9/01/41 | | | 3,000,000 | | | | 3,117,780 | |
DCH Health Care Authority Health Care Facilities Revenue, Refunding, 5.00%, 6/01/36 | | | 2,000,000 | | | | 2,210,520 | |
East Alabama Health Care Authority Health Care Facilities Revenue, Series A, 5.00%, 9/01/41 | | | 3,000,000 | | | | 3,343,410 | |
Homewood Educational Building Authority Revenue, Educational Facilities, Samford University, Series A, | | | | | | | | |
AGMC Insured, 5.00%, 12/01/41 | | | 10,000,000 | | | | 10,817,700 | |
Homewood GO, Capital Improvement wts.,Pre-Refunded, 5.00%, 9/01/42 | | | 4,000,000 | | | | 4,455,720 | |
Huntsville GO, wts., Series B, 5.00%, 5/01/38 | | | 4,775,000 | | | | 5,563,639 | |
Huntsville Water System Revenue, wts., 5.00%, 11/01/35 | | | 4,000,000 | | | | 4,539,520 | |
Infirmary Health System Special Care Facilities Financing Authority of Mobile Revenue, Infirmary Health | | | | | | | | |
System Inc., Series A, 5.00%, 2/01/41 | | | 3,000,000 | | | | 3,236,310 | |
Jacksonville State University Tuition and Fee Revenue, Refunding, AGMC Insured, 5.00%, 12/01/36 | | | 5,000,000 | | | | 5,709,450 | |
Limestone County Water and Sewer Authority Water Revenue, | | | | | | | | |
AGMC Insured, 5.00%, 12/01/39 | | | 3,750,000 | | | | 3,820,275 | |
Refunding, Series B, BAM Insured, 5.00%, 12/01/43 | | | 5,920,000 | | | | 6,592,394 | |
Madison GO, wts., Series A, 5.00%, 4/01/37 | | | 2,590,000 | | | | 2,930,481 | |
Madison Water and Wastewater Board Water and Sewer Revenue, Refunding, 5.00%, 12/01/41 | | | 4,610,000 | | | | 5,153,934 | |
Marshall County Board of Education Special Tax, School wts., AGMC Insured, 4.00%, 3/01/41 | | | 1,750,000 | | | | 1,777,790 | |
Mobile Water and Sewer Commissioners Water and Sewer Revenue, Refunding, 5.00%, 1/01/36 | | | 10,000,000 | | | | 11,002,700 | |
Morgan County Board of Education Capital Outlay School wts. Revenue, | | | | | | | | |
Pre-Refunded, 5.00%, 3/01/35 | | | 4,300,000 | | | | 4,763,368 | |
Refunding, 5.00%, 3/01/35 | | | 2,720,000 | | | | 2,960,230 | |
Opelika Utilities Board Utility Revenue, | | | | | | | | |
Assured Guaranty,Pre-Refunded, 5.00%, 6/01/37 | | | 3,000,000 | | | | 3,075,960 | |
Refunding, 4.00%, 6/01/41 | | | 2,000,000 | | | | 2,055,500 | |
Oxford GO, wts., Series C, 5.00%, 10/01/29 | | | 1,435,000 | | | | 1,582,590 | |
Pelham GO, wts., 5.00%, 2/01/34 | | | 2,635,000 | | | | 2,945,719 | |
Phenix City GO, School wts., Series A, 5.00%, 8/01/43 | | | 3,000,000 | | | | 3,295,800 | |
| | | | | | | | |
franklintempleton.com | | | | | | Annual Report | | 81 |
FRANKLIN TAX-FREE TRUST
STATEMENT OF INVESTMENTS
Franklin Alabama Tax-Free Income Fund(continued)
| | | | | | | | |
| | | Principal
Amount | | | Value | |
| |
Municipal Bonds(continued) | | | | | | | | |
Alabama(continued) | | | | | | | | |
Phenix City Water and Sewer Revenue, wts., Series A, AGMC Insured, 5.00%, 8/15/40 | | $ | 2,000,000 | | | $ | 2,074,480 | |
Selma IDBR, | | | | | | | | |
Gulf Opportunity Zone, International Paper Co. Project, Series A, 5.80%, 5/01/34 | | | 3,000,000 | | | | 3,116,100 | |
Gulf Opportunity Zone, International Paper Co. Project, Series A, 5.375%, 12/01/35 | | | 3,000,000 | | | | 3,225,510 | |
Talladega County Board of Education Special Tax School wts. Revenue, Sales Tax, Refunding, BAM Insured,
5.00%, 11/01/39 | | | 2,000,000 | | | | 2,253,060 | |
Troy Public Educational Building Authority Educational Facilities Revenue, | | | | | | | | |
AGMC Insured, 5.25%, 12/01/40 | | | 295,000 | | | | 309,865 | |
AGMC Insured,Pre-Refunded, 5.25%, 12/01/40 | | | 1,705,000 | | | | 1,809,294 | |
Trussville GO, | | | | | | | | |
wts., Series A, 4.00%, 8/01/41 | | | 3,000,000 | | | | 3,099,300 | |
wts., Series B, 5.00%, 10/01/39. | | | 1,895,000 | | | | 2,111,030 | |
wts., Series B,Pre-Refunded, 5.00%, 10/01/39 | | | 1,105,000 | | | | 1,261,170 | |
Tuscaloosa City Board of Education School Tax wts. Revenue, 5.00%, 8/01/41 | | | 4,000,000 | | | | 4,429,120 | |
Tuscaloosa County Board of Education Special Tax, School wts., 4.00%, 2/01/47 | | | 5,000,000 | | | | 5,115,950 | |
University of Alabama at Birmingham Medicine Finance Authority Revenue, Refunding, Series B, 5.00%, 9/01/29 | | | 5,000,000 | | | | 5,855,600 | |
University of Alabama General Fee Revenue, University of Alabama in Huntsville, SeriesB-2, 5.00%, 9/01/48 | | | 5,000,000 | | | | 5,658,150 | |
University of Alabama General Revenue, University of Alabama at Birmingham, Refunding, SeriesD-2, 5.00%, 10/01/37. | | | 7,520,000 | | | | 8,373,821 | |
University of Montevallo Revenue, Refunding, BAM Insured, 5.00%, 5/01/42 | | | 2,500,000 | | | | 2,810,350 | |
University of South Alabama Revenue, University Facilities, Series A, BAM Insured, 5.00%, 4/01/49 | | | 2,000,000 | | | | 2,224,960 | |
| | | | | | | | |
Total Municipal Bonds (Cost $224,210,195) 98.6% | | | | | | | 232,202,022 | |
Other Assets, less Liabilities 1.4% | | | | | | | 3,222,148 | |
| | | | | | | | |
Net Assets 100.0% | | | | | | $ | 235,424,170 | |
| | | | | | | | |
See Abbreviations on page 183.
| | | | | | |
82 | | Annual Report | | | The accompanying notes are an integral part of these financial statements. | | franklintempleton.com |
FRANKLIN TAX-FREE TRUST
Financial Highlights
Franklin FloridaTax-Free Income Fund
| | | | |
| | | Year Ended February 28, 2019a | |
| |
| |
Class A | | | | |
| |
Per share operating performance | | | | |
(for a share outstanding throughout the year) | | | | |
| |
Net asset value, beginning of year | | | $10.44 | |
| | | | |
| |
Income from investment operationsb: | | | | |
| |
Net investment incomec | | | 0.17 | |
| |
Net realized and unrealized gains (losses) | | | —d | |
| | | | |
| |
Total from investment operations | | | 0.17 | |
| | | | |
| |
Less distributions from net investment income | | | (0.17) | |
| | | | |
| |
Net asset value, end of year | | | $10.44 | |
| | | | |
| |
Total returne | | | 1.71% | |
| |
Ratios to average net assetsf | | | | |
| |
Expensesg | | | 0.85% | |
| |
Net investment income | | | 3.48% | |
| |
Supplemental data | | | | |
| |
Net assets, end of year (000’s) | | | $29,086 | |
| |
Portfolio turnover rate | | | 10.03% | |
aFor the period September 10, 2018 (effective date) to February 28, 2019.
bThe amount shown for a share outstanding throughout the period may not correlate with the Statement of Operations for the period due to the timing of sales and repurchases of the Fund’s shares in relation to income earned and/or fluctuating fair value of the investments of the Fund.
cBased on average daily shares outstanding.
dAmount rounds to less than $0.01 per share.
eTotal return does not reflect sales commissions or contingent deferred sales charges, if applicable and is not annualized for periods less than one year.
fRatios are annualized for periods less than one year.
gBenefit of expense reduction rounds to less than 0.01%.
| | | | | | | | |
franklintempleton.com | | | | The accompanying notes are an integral part of these financial statements. | | | Annual Report | | 83 |
FRANKLIN TAX-FREE TRUST
FINANCIAL HIGHLIGHTS
Franklin Florida Tax-Free Income Fund(continued)
| | | | | | | | | | | | | | | | | | | | |
| | | Year Ended February 28, | |
| | | 2019 | | | 2018 | | | 2017 | | | 2016a | | | 2015 | |
| |
| | | | | |
Class A1 | | | | | | | | | | | | | | | | | | | | |
| | | | | |
Per share operating performance | | | | | | | | | | | | | | | | | | | | |
(for a share outstanding throughout the year) | | | | | | | | | | | | | | | | | | | | |
| | | | | |
Net asset value, beginning of year | | | $10.47 | | | | $10.88 | | | | $11.19 | | | | $11.38 | | | | $11.05 | |
| | | | |
| | | | | |
Income from investment operationsb: | | | | | | | | | | | | | | | | | | | | |
| | | | | |
Net investment incomec | | | 0.38 | | | | 0.39 | | | | 0.43 | | | | 0.45 | | | | 0.48 | |
| | | | | |
Net realized and unrealized gains (losses) | | | (0.04) | | | | (0.39) | | | | (0.31) | | | | (0.20) | | | | 0.34 | |
| | | | |
| | | | | |
Total from investment operations | | | 0.34 | | | | — | | | | 0.12 | | | | 0.25 | | | | 0.82 | |
| | | | |
| | | | | |
Less distributions from net investment income | | | (0.38) | | | | (0.41) | | | | (0.43) | | | | (0.44) | | | | (0.49) | |
| | | | |
| | | | | |
Net asset value, end of year | | | $10.43 | | | | $10.47 | | | | $10.88 | | | | $11.19 | | | | $11.38 | |
| | | | |
| | | | | |
Total returnd | | | 3.36% | | | | (0.02)% | | | | 1.05% | | | | 2.32% | | | | 7.57% | |
| | | | | |
Ratios to average net assets | | | | | | | | | | | | | | | | | | | | |
| | | | | |
Expenses | | | 0.70%e | | | | 0.67%f | | | | 0.65% | | | | 0.64% | | | | 0.64% | |
| | | | | |
Net investment income | | | 3.63% | | | | 3.63% | | | | 3.82% | | | | 4.01% | | | | 4.25% | |
| | | | | |
Supplemental data | | | | | | | | | | | | | | | | | | | | |
| | | | | |
Net assets, end of year (000’s) | | | $462,869 | | | | $536,099 | | | | $635,594 | | | | $689,641 | | | | $725,177 | |
| | | | | |
Portfolio turnover rate | | | 10.03% | | | | 10.10% | | | | 13.84% | | | | 5.17% | | | | 5.17% | |
aFor the year ended February 29.
bThe amount shown for a share outstanding throughout the period may not correlate with the Statement of Operations for the period due to the timing of sales and repurchases of the Fund’s shares in relation to income earned and/or fluctuating fair value of the investments of the Fund.
cBased on average daily shares outstanding.
dTotal return does not reflect sales commissions or contingent deferred sales charges, if applicable.
eBenefit of expense reduction rounds to less than 0.01%.
fBenefit of waiver and payments by affiliates rounds to less than 0.01%.
| | | | | | |
84 | | Annual Report | | | The accompanying notes are an integral part of these financial statements. | | franklintempleton.com |
FRANKLIN TAX-FREE TRUST
FINANCIAL HIGHLIGHTS
Franklin Florida Tax-Free Income Fund(continued)
| | | | | | | | | | | | | | | | | | | | |
| | | Year Ended February 28, | |
| | | 2019 | | | 2018 | | | 2017 | | | 2016a | | | 2015 | |
| |
Class C | | | | | | | | | | | | | | | | | | | | |
| | | | | |
Per share operating performance | | | | | | | | | | | | | | | | | | | | |
(for a share outstanding throughout the year) | | | | | | | | | | | | | | | | | | | | |
| | | | | |
Net asset value, beginning of year | | | $10.69 | | | | $11.10 | | | | $11.41 | | | | $11.59 | | | | $11.25 | |
| | | | |
| | | | | |
Income from investment operationsb: | | | | | | | | | | | | | | | | | | | | |
| | | | | |
Net investment incomec | | | 0.33 | | | | 0.34 | | | | 0.37 | | | | 0.39 | | | | 0.42 | |
| | | | | |
Net realized and unrealized gains (losses) | | | (0.03) | | | | (0.40) | | | | (0.32) | | | | (0.19) | | | | 0.35 | |
| | | | |
| | | | | |
Total from investment operations | | | 0.30 | | | | (0.06) | | | | 0.05 | | | | 0.20 | | | | 0.77 | |
| | | | |
| | | | | |
Less distributions from net investment income | | | (0.33) | | | | (0.35) | | | | (0.36) | | | | (0.38) | | | | (0.43) | |
| | | | |
| | | | | |
Net asset value, end of year | | | $10.66 | | | | $10.69 | | | | $11.10 | | | | $11.41 | | | | $11.59 | |
| | | | |
| | | | | |
Total returnd | | | 2.81% | | | | (0.58)% | | | | 0.46% | | | | 1.81% | | | | 6.94% | |
| | | | | |
Ratios to average net assets | | | | | | | | | | | | | | | | | | | | |
| | | | | |
Expenses | | | 1.25%e | | | | 1.22%f | | | | 1.20% | | | | 1.19% | | | | 1.19% | |
| | | | | |
Net investment income | | | 3.08% | | | | 3.08% | | | | 3.27% | | | | 3.46% | | | | 3.70% | |
| | | | | |
Supplemental data | | | | | | | | | | | | | | | | | | | | |
| | | | | |
Net assets, end of year (000’s) | | | $39,117 | | | | $73,237 | | | | $90,754 | | | | $88,734 | | | | $89,809 | |
| | | | | |
Portfolio turnover rate | | | 10.03% | | | | 10.10% | | | | 13.84% | | | | 5.17% | | | | 5.17% | |
aFor the year ended February 29.
bThe amount shown for a share outstanding throughout the period may not correlate with the Statement of Operations for the period due to the timing of sales and repurchases of the Fund’s shares in relation to income earned and/or fluctuating fair value of the investments of the Fund.
cBased on average daily shares outstanding.
dTotal return does not reflect sales commissions or contingent deferred sales charges, if applicable.
eBenefit of expense reduction rounds to less than 0.01%.
fBenefit of waiver and payments by affiliates rounds to less than 0.01%.
| | | | | | | | |
franklintempleton.com | | | | The accompanying notes are an integral part of these financial statements. | | | Annual Report | | 85 |
FRANKLIN TAX-FREE TRUST
FINANCIAL HIGHLIGHTS
Franklin Florida Tax-Free Income Fund(continued)
| | | | | | | | |
| | | Year Ended February 28, | |
| | | 2019 | | | 2018a | |
| |
| | |
Class R6 | | | | | | | | |
| | |
Per share operating performance | | | | | | | | |
(for a share outstanding throughout the year) | | | | | | | | |
| | |
Net asset value, beginning of year | | | $10.49 | | | | $10.82 | |
| | | | |
| | |
Income from investment operationsb: | | | | | | | | |
| | |
Net investment incomec | | | 0.39 | | | | 0.24 | |
| | |
Net realized and unrealized gains (losses) | | | (0.02) | | | | (0.33) | |
| | | | |
| | |
Total from investment operations | | | 0.37 | | | | (0.09) | |
| | | | |
| | |
Less distributions from net investment income | | | (0.40) | | | | (0.24) | |
| | | | |
| | |
Net asset value, end of year | | | $10.46 | | | | $10.49 | |
| | | | |
| | |
Total returnd | | | 3.57% | | | | (0.88)% | |
| | |
Ratios to average net assetse | | | | | | | | |
| | |
Expenses before waiver and payments by affiliates | | | 0.58% | | | | 0.58% | |
| | |
Expenses net of waiver and payments by affiliates | | | 0.56%f | | | | 0.54% | |
| | |
Net investment income | | | 3.77% | | | | 3.76% | |
| | |
Supplemental data | | | | | | | | |
| | |
Net assets, end of year (000’s) | | | $2,343 | | | | $2,387 | |
| | |
Portfolio turnover rate | | | 10.03% | | | | 10.10% | |
aFor the period August 1, 2017 (effective date) to February 28, 2018.
bThe amount shown for a share outstanding throughout the period may not correlate with the Statement of Operations for the period due to the timing of sales and repurchases of the Fund’s shares in relation to income earned and/or fluctuating fair value of the investments of the Fund.
cBased on average daily shares outstanding.
dTotal return is not annualized for periods less than one year.
eRatios are annualized for periods less than one year.
fBenefit of expense reduction rounds to less than 0.01%.
| | | | | | |
86 | | Annual Report | | | The accompanying notes are an integral part of these financial statements. | | franklintempleton.com |
FRANKLIN TAX-FREE TRUST
FINANCIAL HIGHLIGHTS
Franklin Florida Tax-Free Income Fund(continued)
| | | | | | | | | | | | |
| | | Year Ended February 28, | |
| | | 2019 | | | 2018 | | | 2017a | |
| |
Advisor Class | | | | | | | | | | | | |
| | | |
Per share operating performance | | | | | | | | | | | | |
(for a share outstanding throughout the year) | | | | | | | | | | | | |
| | | |
Net asset value, beginning of year | | | $10.49 | | | | $10.89 | | | | $11.23 | |
| | | | |
| | | |
Income from investment operationsb: | | | | | | | | | | | | |
| | | |
Net investment incomec | | | 0.39 | | | | 0.40 | | | | 0.20 | |
| | | |
Net realized and unrealized gains (losses) | | | (0.03) | | | | (0.38) | | | | (0.34) | |
| | | | |
| | | |
Total from investment operations. | | | 0.36 | | | | 0.02 | | | | (0.14) | |
| | | | |
| | | |
Less distributions from net investment income | | | (0.39) | | | | (0.42) | | | | (0.20) | |
| | | | |
| | | |
Net asset value, end of year | | | $10.46 | | | | $10.49 | | | | $10.89 | |
| | | | |
| | | |
Total returnd | | | 3.54% | | | | 0.17% | | | | (1.25)% | |
| | | |
Ratios to average net assetse | | | | | | | | | | | | |
| | | |
Expenses | | | 0.60%f | | | | 0.57%g | | | | 0.55% | |
| | | |
Net investment income | | | 3.73% | | | | 3.73% | | | | 3.92% | |
| | | |
Supplemental data | | | | | | | | | | | | |
| | | |
Net assets, end of year (000’s) | | | $25,472 | | | | $20,467 | | | | $10,916 | |
| | | |
Portfolio turnover rate | | | 10.03% | | | | 10.10% | | | | 13.84% | |
aFor the period September 15, 2016 (effective date) to February 28, 2017.
bThe amount shown for a share outstanding throughout the period may not correlate with the Statement of Operations for the period due to the timing of sales and repurchases of the Fund’s shares in relation to income earned and/or fluctuating fair value of the investments of the Fund.
cBased on average daily shares outstanding.
dTotal return is not annualized for periods less than one year.
eRatios are annualized for periods less than one year.
fBenefit of expense reduction rounds to less than 0.01%.
gBenefit of waiver and payments by affiliates rounds to less than 0.01%.
| | | | | | | | |
franklintempleton.com | | | | The accompanying notes are an integral part of these financial statements. | | | Annual Report | | 87 |
FRANKLIN TAX-FREE TRUST
Statement of Investments, February 28, 2019
Franklin FloridaTax-Free Income Fund
| | | | | | | | |
| | | Principal
Amount | | | Value | |
Municipal Bonds 97.3% | | | | | | | | |
Florida 94.2% | | | | | | | | |
Atlantic Beach Health Care Facilities Revenue, Fleet Landing Project, Refunding, Series A, 5.00%, 11/15/38 | | $ | 1,105,000 | | | $ | 1,192,096 | |
Brevard County Health Facilities Authority Health Facilities Revenue, Health First Inc. Project, Refunding,
5.00%, 4/01/39 | | | 5,000,000 | | | | 5,394,700 | |
Central Expressway Authority Revenue, | | | | | | | | |
senior lien, Refunding, Series B, 4.00%, 7/01/39 | | | 5,000,000 | | | | 5,173,700 | |
senior lien, Refunding, Series B, 4.00%, 7/01/40 | | | 5,825,000 | | | | 6,004,527 | |
Citizens Property Insurance Corp. Revenue, Personal Lines Account/Commercial Lines Account, senior secured, SeriesA-1, 5.00%, 6/01/22 | | | 5,000,000 | | | | 5,513,550 | |
City of Winter Park Water and Sewer Revenue, Improvement,Pre-Refunded, 5.00%, 12/01/34 | | | 2,000,000 | | | | 2,049,880 | |
Clearwater City Water and Sewer Revenue, Series A,Pre-Refunded, 5.25%, 12/01/39 | | | 2,000,000 | | | | 2,054,300 | |
Collier County Educational Facilities Authority Revenue, Hodges University Inc. Project, 5.625%, 11/01/28 | | | 2,860,000 | | | | 3,080,763 | |
Collier County IDA Health Care Facilities Revenue, NCH Healthcare System Project, 6.25%, 10/01/39 | | | 5,000,000 | | | | 5,420,700 | |
Duval County School Board COP, Master Lease Program, Series A, Assured Guaranty,Pre-Refunded, 5.25%, 7/01/35 | | | 10,000,000 | | | | 10,119,200 | |
Escambia County Health Facilities Authority Health Facility Revenue, | | | | | | | | |
Baptist Hospital Inc. Project, Refunding, Series A, 5.75%, 8/15/29 | | | 7,195,000 | | | | 7,555,038 | |
Baptist Hospital Inc. Project, Series A, 6.00%, 8/15/36 | | | 11,000,000 | | | | 11,578,050 | |
Florida Higher Educational Facilities Financing Authority Revenue, | | | | | | | | |
Nova Southeastern University Project, 6.375%, 4/01/31 | | | 2,750,000 | | | | 2,961,530 | |
Rollins College Project,Pre-Refunded, 5.00%, 12/01/37 | | | 10,000,000 | | | | 10,560,200 | |
The University of Tampa Project, Refunding, Series A, 5.25%, 4/01/42 | | | 2,000,000 | | | | 2,172,020 | |
Florida State Board of Education GO, | | | | | | | | |
Full Faith and Credit, Public Education Capital Outlay, Refunding, Series C, 4.00%, 6/01/35 | | | 5,340,000 | | | | 5,750,112 | |
Full Faith and Credit, Public Education Capital Outlay, Refunding, Series F, 4.00%, 6/01/37 | | | 8,000,000 | | | | 8,522,480 | |
Public Education Capital Outlay, Refunding, Series D, 6.00%, 6/01/23 | | | 15,000,000 | | | | 17,670,900 | |
Public Education Capital Outlay, Series H, 5.00%, 6/01/40 | | | 7,295,000 | | | | 7,560,611 | |
Florida State Governmental Utility Authority Revenue, Lehigh Utility System,Pre-Refunded, 5.25%, 10/01/40 | | | 5,000,000 | | | | 5,445,300 | |
Florida StateMid-Bay Bridge Authority Revenue, | | | | | | | | |
Exchangeable, Series D, ETM, 6.10%, 10/01/22 | | | 3,545,000 | | | | 3,997,307 | |
first senior lien, Refunding, Series A, 5.00%, 10/01/40 | | | 5,000,000 | | | | 5,407,550 | |
Series A, ETM, 6.875%, 10/01/22 | | | 5,000,000 | | | | 5,489,200 | |
Florida State Municipal Loan Council Revenue, Series D, AGMC Insured, 5.50%, 10/01/41 | | | 3,750,000 | | | | 4,069,988 | |
Florida State Municipal Power Agency Revenue, | | | | | | | | |
All-Requirements Power Supply Project, Series A,Pre-Refunded, 6.25%, 10/01/31 | | | 2,000,000 | | | | 2,053,220 | |
Stanton Project, Refunding, 5.50%, 10/01/19 | | | 1,000,000 | | | | 1,022,220 | |
Fort Pierce Utilities Authority Revenue, | | | | | | | | |
Capital Appreciation, Series B, AMBAC Insured, zero cpn., 10/01/20 | | | 3,090,000 | | | | 2,989,142 | |
Capital Appreciation, Series B, AMBAC Insured, zero cpn., 10/01/21 | | | 2,585,000 | | | | 2,444,686 | |
Capital Appreciation, Series B, AMBAC Insured, zero cpn., 10/01/22 | | | 3,090,000 | | | | 2,854,079 | |
Capital Appreciation, Series B, AMBAC Insured, zero cpn., 10/01/23 | | | 3,060,000 | | | | 2,752,745 | |
Capital Appreciation, Series B, AMBAC Insured, zero cpn., 10/01/24 | | | 2,560,000 | | | | 2,236,211 | |
Greater Orlando Aviation Authority Airport Facilities Revenue, Series A, 5.00%, 10/01/39 | | | 5,000,000 | | | | 5,237,850 | |
Halifax Hospital Medical Center Hospital Revenue, | | | | | | | | |
Daytona Beach, Refunding, 5.00%, 6/01/46 | | | 4,250,000 | | | | 4,506,360 | |
Daytona Beach, Refunding and Improvement, 5.00%, 6/01/36 | | | 2,500,000 | | | | 2,722,975 | |
Hillsborough County Aviation Authority Revenue, | | | | | | | | |
Tampa International Airport, Customer Facility Charge, Series A, 5.00%, 10/01/44 | | | 5,000,000 | | | | 5,506,950 | |
Tampa International Airport, Series E, 5.00%, 10/01/43 | | | 5,000,000 | | | | 5,636,650 | |
Jacksonville Sales Tax Revenue, Better Jacksonville, Refunding, 5.00%, 10/01/30 | | | 2,000,000 | | | | 2,176,100 | |
| | | | | | |
88 | | Annual Report | | | | franklintempleton.com |
FRANKLIN TAX-FREE TRUST
STATEMENT OF INVESTMENTS
Franklin Florida Tax-Free Income Fund(continued)
| | | | | | | | |
| | | Principal
Amount | | | Value | |
Municipal Bonds(continued) | | | | | | | | |
Florida(continued) | | | | | | | | |
Lakeland Hospital Revenue, Lakeland Regional Health Systems, 5.00%, 11/15/45 | | $ | 12,300,000 | | | $ | 13,348,698 | |
Martin County Health Facilities Authority Hospital Revenue, Martin Memorial Medical Center, 5.50%, 11/15/42 | | | 2,100,000 | | | | 2,239,461 | |
Melbourne Water and Sewer Improvement Revenue, Capital Appreciation, FGIC Insured, ETM, zero cpn., 10/01/26 | | | 1,500,000 | | | | 1,268,040 | |
Melbourne Water and Sewer Revenue, | | | | | | | | |
Capital Appreciation, Refunding, Series B, NATL Insured, zero cpn., 10/01/22 | | | 1,785,000 | | | | 1,649,893 | |
Capital Appreciation, Refunding, Series B, NATL Insured, zero cpn., 10/01/26 | | | 4,500,000 | | | | 3,682,395 | |
Miami Beach RDA Tax Increment Revenue, City Center/Historic Convention Village, Refunding, Series A, AGMC Insured, 5.00%, 2/01/40 | | | 5,000,000 | | | | 5,606,800 | |
Miami Beach Stormwater Revenue, 5.00%, 9/01/41 | | | 10,000,000 | | | | 11,179,900 | |
Miami Health Facilities Authority Revenue, Miami Jewish Health Systems Inc. Project, Refunding, 5.125%, 7/01/46 | | | 2,250,000 | | | | 2,388,015 | |
Miami Parking System Revenue, Refunding, Assured Guaranty, 5.00%, 10/01/39 | | | 4,000,000 | | | | 4,065,440 | |
Miami Special Obligation Revenue, Parking, Marlins Stadium Project, Series A, AGMC Insured, 5.25%, 7/01/35 | | | 5,000,000 | | | | 5,225,100 | |
Miami-Dade County Aviation Revenue, | | | | | | | | |
Miami International Airport, Hub of the Americas, Series A,Pre-Refunded, 5.50%, 10/01/36 | | | 5,000,000 | | | | 5,111,700 | |
Miami International Airport, Refunding, SeriesA-1, 5.375%, 10/01/35 | | | 1,580,000 | | | | 1,660,533 | |
Miami International Airport, Refunding, Series B, 5.00%, 10/01/37 | | | 10,000,000 | | | | 11,122,400 | |
Miami International Airport, Refunding, Series B, 5.00%, 10/01/40 | | | 5,000,000 | | | | 5,572,350 | |
Miami International Airport, SeriesA-1,Pre-Refunded, 5.375%, 10/01/35 | | | 5,920,000 | | | | 6,264,248 | |
Miami-Dade County Expressway Authority Toll System Revenue, Series A, 5.00%, 7/01/40 | | | 18,770,000 | | | | 19,453,416 | |
Miami-Dade County Health Facilities Authority Hospital Revenue, | | | | | | | | |
Miami Children’s Hospital Project, Series A, 6.125%, 8/01/42 | | | 1,055,000 | | | | 1,111,400 | |
Miami Children’s Hospital Project, Series A,Pre-Refunded, 6.125%, 8/01/42 | | | 2,945,000 | | | | 3,122,554 | |
Nicklaus Children’s Hospital Project, Refunding, 5.00%, 8/01/42 | | | 3,000,000 | | | | 3,331,800 | |
Nicklaus Children’s Hospital Project, Refunding, 4.00%, 8/01/47 | | | 3,500,000 | | | | 3,553,550 | |
Miami-Dade County School District GO, School, 5.00%, 3/15/43 | | | 2,465,000 | | | | 2,716,331 | |
Miami-Dade County Seaport Revenue, Series A, 6.00%, 10/01/38 | | | 10,000,000 | | | | 11,459,100 | |
Miami-Dade County Transit System Sales Surtax Revenue, | | | | | | | | |
5.00%, 7/01/42 | | | 15,000,000 | | | | 16,209,150 | |
5.00%, 7/01/43 | | | 10,000,000 | | | | 11,446,100 | |
4.00%, 7/01/47 | | | 5,000,000 | | | | 5,139,300 | |
Miami-Dade County Water and Sewer System Revenue, | | | | | | | | |
Assured Guaranty,Pre-Refunded, 5.00%, 10/01/39 | | | 10,000,000 | | | | 10,523,400 | |
Refunding, 5.00%, 10/01/43 | | | 5,000,000 | | | | 5,724,500 | |
Refunding, Series A, 5.00%, 10/01/42 | | | 10,000,000 | | | | 10,876,900 | |
North Sumter County Utility Dependent District Utility Revenue, 5.75%, 10/01/43 | | | 5,000,000 | | | | 5,298,150 | |
Orange County Health Facilities Authority Revenue, | | | | | | | | |
Hospital, Orlando Health Inc., Series A, 5.00%, 10/01/42 | | | 10,000,000 | | | | 10,602,900 | |
Hospital, Orlando Health Obligated Group, Series A, 5.00%, 10/01/47 | | | 5,000,000 | | | | 5,583,650 | |
Presbyterian Retirement Communities Project, 5.00%, 8/01/41 | | | 5,000,000 | | | | 5,353,000 | |
Orange County School Board COP, Series A, Assured Guaranty,Pre-Refunded, 5.50%, 8/01/34 | | | 10,000,000 | | | | 10,161,200 | |
Orlando-Orange County Expressway Authority Revenue, | | | | | | | | |
Refunding, Series A, 5.00%, 7/01/35 | | | 8,330,000 | | | | 9,253,630 | |
Series A,Pre-Refunded, 5.00%, 7/01/40 | | | 3,145,000 | | | | 3,283,726 | |
Series A,Pre-Refunded, 5.00%, 7/01/40 | | | 1,855,000 | | | | 1,935,581 | |
Series C,Pre-Refunded, 5.00%, 7/01/35 | | | 4,000,000 | | | | 4,176,440 | |
Series C,Pre-Refunded, 5.00%, 7/01/40 | | | 2,755,000 | | | | 2,876,523 | |
| | | | | | | | |
franklintempleton.com | | | | | | Annual Report | | 89 |
FRANKLIN TAX-FREE TRUST
STATEMENT OF INVESTMENTS
Franklin Florida Tax-Free Income Fund(continued)
| | | | | | | | |
| | | Principal
Amount | | | Value | |
Municipal Bonds(continued) | | | | | | | | |
Florida(continued) | | | | | | | | |
Palm Beach County Health Facilities Authority Revenue, Lifespace Communities Inc., Refunding, Series B,
5.00%, 5/15/47 | | $ | 5,000,000 | | | $ | 5,182,150 | |
Palm Beach County Water and Sewer Revenue, 5.00%, 10/01/40 | | | 5,000,000 | | | | 5,090,750 | |
Palm Beach GO, Underground Utility Project, 4.00%, 7/01/43 | | | 5,000,000 | | | | 5,260,700 | |
Sarasota County Health Facilities Authority Revenue, | | | | | | | | |
Retirement Facility, Improvement, Sunnyside Village Project, 5.00%, 5/15/33 | | | 600,000 | | | | 653,934 | |
Retirement Facility, Improvement, Sunnyside Village Project, 5.00%, 5/15/38 | | | 1,025,000 | | | | 1,109,101 | |
Retirement Facility, Improvement, Sunnyside Village Project, 5.00%, 5/15/48 | | | 1,850,000 | | | | 1,990,360 | |
Retirement Facility, Improvement, Village On The Isle Project, Series A, 5.00%, 1/01/37 | | | 2,350,000 | | | | 2,461,367 | |
Retirement Facility, Improvement, Village On The Isle Project, Series A, 5.00%, 1/01/42 | | | 1,600,000 | | | | 1,659,664 | |
Retirement Facility, Improvement, Village On The Isle Project, Series A, 5.00%, 1/01/47 | | | 2,450,000 | | | | 2,533,153 | |
Sarasota County Public Hospital District Revenue, Hospital, Sarasota Memorial Hospital Project, 4.00%, 7/01/48 | | | 10,000,000 | | | | 10,056,700 | |
South Lake County Hospital District Revenue, South Lake Hospital Inc., Refunding, 5.25%, 10/01/34 | | | 5,000,000 | | | | 5,165,300 | |
South Miami Health Facilities Authority Hospital Revenue, | | | | | | | | |
Baptist Health South Florida, Refunding, 4.00%, 8/15/42 | | | 5,000,000 | | | | 5,074,200 | |
Baptist Health South Florida, Refunding, 5.00%, 8/15/42 | | | 6,500,000 | | | | 7,266,675 | |
St. Petersburg Public Utility Revenue, Series A,Pre-Refunded, 5.00%, 10/01/36 | | | 2,180,000 | | | | 2,223,120 | |
Sunrise Utilities System Revenue, AMBAC Insured,Pre-Refunded, 5.20%, 10/01/22 | | | 1,050,000 | | | | 1,084,797 | |
Tamarac Utility System Revenue, Assured Guaranty,Pre-Refunded, 5.00%, 10/01/39 | | | 1,585,000 | | | | 1,616,351 | |
Tampa Bay Water Regional Water Supply Authority Utility System Revenue, 5.00%, 10/01/38 | | | 10,000,000 | | | | 11,190,700 | |
Tampa Hospital Revenue, H. Lee Moffitt Cancer Center Project, Refunding, Series B, 5.00%, 7/01/37 | | | 5,000,000 | | | | 5,482,750 | |
Tampa Sports Authority Revenue, | | | | | | | | |
Guaranteed Package, Tampa Bay Arena Project, NATL Insured, 6.05%, 10/01/20 | | | 745,000 | | | | 767,112 | |
Guaranteed Package, Tampa Bay Arena Project, NATL Insured, 6.10%, 10/01/26 | | | 2,695,000 | | | | 3,133,962 | |
Tampa-Hillsborough County Expressway Authority Revenue, 5.00%, 7/01/47 | | | 5,000,000 | | | | 5,577,700 | |
University of North Florida FICO Revenue, Capital Improvement, Housing Project, Refunding, AGMC Insured,
5.00%, 11/01/35 | | | 5,000,000 | | | | 5,645,200 | |
Volusia County Educational Facility Authority Revenue, | | | | | | | | |
Educational Facilities, Embry-Riddle Aeronautical University Inc. Project, Refunding, 5.00%, 10/15/42 | | | 1,500,000 | | | | 1,652,235 | |
Educational Facilities, Embry-Riddle Aeronautical University Inc. Project, Refunding, 5.00%, 10/15/47 | | | 3,500,000 | | | | 3,841,530 | |
| | | | | | | | |
| | | | | | | 526,179,675 | |
| | | | | | | | |
U.S. Territories 3.1% | | | | | | | | |
Puerto Rico 3.1% | | | | | | | | |
aPuerto Rico Electric Power Authority Power Revenue, | | | | | | | | |
Refunding, Series A, 5.00%, 7/01/42 | | | 10,000,000 | | | | 6,862,500 | |
Series XX, 5.25%, 7/01/40 | | | 10,000,000 | | | | 6,862,500 | |
Puerto Rico Industrial Tourist Educational Medical and Environmental Control Facilities Financing Authority Revenue, Cogeneration Facility, AES Puerto Rico Project, 6.625%, 6/01/26. | | | 3,900,000 | | | | 3,807,375 | |
| | | | | | | | |
| | | | | | | 17,532,375 | |
| | | | | | | | |
Total Municipal Bonds before Short Term Investments (Cost $524,380,321) | | | | | | | 543,712,050 | |
| | | | | | | | |
| | | | | | |
90 | | Annual Report | | | | franklintempleton.com |
FRANKLIN TAX-FREE TRUST
STATEMENT OF INVESTMENTS
Franklin Florida Tax-Free Income Fund(continued)
| | | | | | | | |
| | | Principal
Amount | | | Value | |
Short Term Investments (Cost $10,400,000) 1.8% | | | | | | | | |
| | |
Municipal Bonds 1.8% | | | | | | | | |
Florida 1.8% | | | | | | | | |
bSt. Lucie County PCR, Florida Power and Light Co. Project, Refunding, Daily VRDN and Put, 1.72%, 9/01/28 | | $ | 10,400,000 | | | $ | 10,400,000 | |
| | | | | | | | |
| | |
Total Investments (Cost $534,780,321) 99.1% | | | | | | | 554,112,050 | |
Other Assets, less Liabilities 0.9% | | | | | | | 4,774,935 | |
| | | | | | | | |
| | |
Net Assets 100.0% | | | | | | $ | 558,886,985 | |
| | | | | | | | |
See Abbreviations on page 183.
aSee Note 7 regarding defaulted securities.
bVariable rate demand notes (VRDNs) are obligations which contain a floating or variable interest rate adjustment formula and an unconditional right of demand to receive payment of the principal balance plus accrued interest at specified dates. Unless otherwise noted, the coupon rate is determined based on factors including supply and demand, underlying credit, tax treatment, and current short term rates. The coupon rate shown represents the rate at period end.
| | | | | | | | |
franklintempleton.com | | | | The accompanying notes are an integral part of these financial statements. | | | Annual Report | | 91 |
FRANKLIN TAX-FREE TRUST
Financial Highlights
Franklin GeorgiaTax-Free Income Fund
| | | | |
| | | Year Ended February 28, 2019a | |
| |
| |
Class A | | | | |
| |
Per share operating performance | | | | |
(for a share outstanding throughout the year) | | | | |
| |
Net asset value, beginning of year | | | $11.57 | |
| | | | |
| |
Income from investment operationsb: | | | | |
| |
Net investment incomec | | | 0.17 | |
| |
Net realized and unrealized gains (losses) | | | 0.02 | |
| | | | |
| |
Total from investment operations | | | 0.19 | |
| | | | |
| |
Less distributions from net investment income | | | (0.17) | |
| | | | |
| |
Net asset value, end of year | | | $11.59 | |
| | | | |
| |
Total returnd | | | 1.70% | |
| |
Ratios to average net assetse | | | | |
| |
Expensesf | | | 0.87% | |
| |
Net investment income | | | 3.10% | |
| |
Supplemental data | | | | |
| |
Net assets, end of year (000’s) | | | $19,705 | |
| |
Portfolio turnover rate | | | 11.78% | |
aFor the period September 10, 2018 (effective date) to February 28, 2019.
bThe amount shown for a share outstanding throughout the period may not correlate with the Statement of Operations for the period due to the timing of sales and repurchases of the Fund’s shares in relation to income earned and/or fluctuating fair value of the investments of the Fund.
cBased on average daily shares outstanding.
dTotal return does not reflect sales commissions or contingent deferred sales charges, if applicable, and is not annualized for periods less than one year.
eRatios are annualized for periods less than one year.
fBenefit of expense reduction rounds to less than 0.01%.
| | | | | | |
92 | | Annual Report | | | The accompanying notes are an integral part of these financial statements. | | franklintempleton.com |
FRANKLIN TAX-FREE TRUST
FINANCIAL HIGHLIGHTS
Franklin Georgia Tax-Free Income Fund(continued)
| | | | | | | | | | | | | | | | | | | | |
| | | Year Ended February 28, | |
| | | 2019 | | | 2018 | | | 2017 | | | 2016a | | | 2015 | |
| |
| | | | | |
Class A1 | | | | | | | | | | | | | | | | | | | | |
| | | | | |
Per share operating performance | | | | | | | | | | | | | | | | | | | | |
(for a share outstanding throughout the year) | | | | | | | | | | | | | | | | | | | | |
| | | | | |
Net asset value, beginning of year | | | $11.65 | | | | $11.99 | | | | $12.32 | | | | $12.46 | | | | $12.02 | |
| | | | |
| | | | | |
Income from investment operationsb: | | | | | | | | | | | | | | | | | | | | |
| | | | | |
Net investment incomec | | | 0.38 | | | | 0.39 | | | | 0.42 | | | | 0.45 | | | | 0.46 | |
| | | | | |
Net realized and unrealized gains (losses) | | | (0.06) | | | | (0.33) | | | | (0.33) | | | | (0.14) | | | | 0.44 | |
| | | | |
| | | | | |
Total from investment operations | | | 0.32 | | | | 0.06 | | | | 0.09 | | | | 0.31 | | | | 0.90 | |
| | | | |
| | | | | |
Less distributions from net investment income | | | (0.38) | | | | (0.40) | | | | (0.42) | | | | (0.45) | | | | (0.46) | |
| | | | |
| | | | | |
Net asset value, end of year | | | $11.59 | | | | $11.65 | | | | $11.99 | | | | $12.32 | | | | $12.46 | |
| | | | |
| | | | | |
Total returnd | | | 2.83% | | | | 0.46% | | | | 0.69% | | | | 2.56% | | | | 7.57% | |
| | | | | |
Ratios to average net assets | | | | | | | | | | | | | | | | | | | | |
| | | | | |
Expenses | | | 0.72%e | | | | 0.69%f | | | | 0.67% | | | | 0.67% | | | | 0.67% | |
| | | | | |
Net investment income | | | 3.25% | | | | 3.25% | | | | 3.36% | | | | 3.67% | | | | 3.73% | |
| | | | | |
Supplemental data | | | | | | | | | | | | | | | | | | | | |
| | | | | |
Net assets, end of year (000’s) | | | $313,940 | | | | $363,390 | | | | $428,301 | | | | $429,103 | | | | $410,603 | |
| | | | | |
Portfolio turnover rate | | | 11.78% | | | | 9.33% | | | | 8.34% | | | | 4.92% | | | | 11.89% | |
aFor the year ended February 29.
bThe amount shown for a share outstanding throughout the period may not correlate with the Statement of Operations for the period due to the timing of sales and repurchases of the Fund’s shares in relation to income earned and/or fluctuating fair value of the investments of the Fund.
cBased on average daily shares outstanding.
dTotal return does not reflect sales commissions or contingent deferred sales charges, if applicable.
eBenefit of expense reduction rounds to less than 0.01%.
fBenefit of waiver and payments by affiliates rounds to less than 0.01%.
| | | | | | | | |
franklintempleton.com | | | | The accompanying notes are an integral part of these financial statements. | | | Annual Report | | 93 |
FRANKLIN TAX-FREE TRUST
FINANCIAL HIGHLIGHTS
Franklin Georgia Tax-Free Income Fund(continued)
| | | | | | | | | | | | | | | | | | | | |
| | | Year Ended February 28, | |
| | | 2019 | | | 2018 | | | 2017 | | | 2016a | | | 2015 | |
| |
| | | | | |
Class C | | | | | | | | | | | | | | | | | | | | |
| | | | | |
Per share operating performance | | | | | | | | | | | | | | | | | | | | |
(for a share outstanding throughout the year) | | | | | | | | | | | | | | | | | | | | |
| | | | | |
Net asset value, beginning of year | | | $11.83 | | | | $12.16 | | | | $12.49 | | | | $12.63 | | | | $12.17 | |
| | | | |
| | | | | |
Income from investment operationsb: | | | | | | | | | | | | | | | | | | | | |
| | | | | |
Net investment incomec | | | 0.32 | | | | 0.33 | | | | 0.35 | | | | 0.39 | | | | 0.40 | |
| | | | | |
Net realized and unrealized gains (losses) | | | (0.06) | | | | (0.33) | | | | (0.33) | | | | (0.15) | | | | 0.45 | |
| | | | |
| | | | | |
Total from investment operations | | | 0.26 | | | | — | | | | 0.02 | | | | 0.24 | | | | 0.85 | |
| | | | |
| | | | | |
Less distributions from net investment income | | | (0.32) | | | | (0.33) | | | | (0.35) | | | | (0.38) | | | | (0.39) | |
| | | | |
| | | | | |
Net asset value, end of year | | | $11.77 | | | | $11.83 | | | | $12.16 | | | | $12.49 | | | | $12.63 | |
| | | | |
| | | | | |
Total returnd | | | 2.22% | | | | (0.02)% | | | | 0.12% | | | | 1.97% | | | | 7.06% | |
| | | | | |
Ratios to average net assets | | | | | | | | | | | | | | | | | | | | |
| | | | | |
Expenses | | | 1.27%e | | | | 1.24%f | | | | 1.22% | | | | 1.22% | | | | 1.22% | |
| | | | | |
Net investment income | | | 2.70% | | | | 2.70% | | | | 2.81% | | | | 3.12% | | | | 3.18% | |
| | | | | |
Supplemental data | | | | | | | | | | | | | | | | | | | | |
| | | | | |
Net assets, end of year (000’s) | | | $72,542 | | | | $109,722 | | | | $128,544 | | | | $126,117 | | | | $123,265 | |
| | | | | |
Portfolio turnover rate | | | 11.78% | | | | 9.33% | | | | 8.34% | | | | 4.92% | | | | 11.89% | |
aFor the year ended February 29.
bThe amount shown for a share outstanding throughout the period may not correlate with the Statement of Operations for the period due to the timing of sales and repurchases of the Fund’s shares in relation to income earned and/or fluctuating fair value of the investments of the Fund.
cBased on average daily shares outstanding.
dTotal return does not reflect sales commissions or contingent deferred sales charges, if applicable.
eBenefit of expense reduction rounds to less than 0.01%.
fBenefit of waiver and payments by affiliates rounds to less than 0.01%.
| | | | | | |
94 | | Annual Report | | | The accompanying notes are an integral part of these financial statements. | | franklintempleton.com |
FRANKLIN TAX-FREE TRUST
FINANCIAL HIGHLIGHTS
Franklin Georgia Tax-Free Income Fund(continued)
| | | | | | | | |
| | | Year Ended February 28, | |
| | | 2019 | | | 2018a | |
| |
| | |
Class R6 | | | | | | | | |
| | |
Per share operating performance | | | | | | | | |
(for a share outstanding throughout the year) | | | | | | | | |
| | |
Net asset value, beginning of year | | | $11.66 | | | | $11.94 | |
| | | | |
| | |
Income from investment operationsb: | | | | | | | | |
| | |
Net investment incomec | | | 0.39 | | | | 0.24 | |
| | |
Net realized and unrealized gains (losses) | | | (0.06) | | | | (0.29) | |
| | | | |
| | |
Total from investment operations | | | 0.33 | | | | (0.05) | |
| | | | |
| | |
Less distributions from net investment income | | | (0.40) | | | | (0.23) | |
| | | | |
| | |
Net asset value, end of year | | | $11.59 | | | | $11.66 | |
| | | | |
| | |
Total returnd | | | 2.86% | | | | (0.40)% | |
| | |
Ratios to average net assetse | | | | | | | | |
| | |
Expenses before waiver and payments by affiliates | | | 0.59% | | | | 4.47% | |
| | |
Expenses net of waiver and payments by affiliates | | | 0.57%f | | | | 0.55% | |
| | |
Net investment income | | | 3.40% | | | | 3.39% | |
| | |
Supplemental data | | | | | | | | |
| | |
Net assets, end of year (000’s) | | | $3,786 | | | | $5 | |
| | |
Portfolio turnover rate | | | 11.78% | | | | 9.33% | |
aFor the period August 1, 2017 (effective date) to February 28, 2018.
bThe amount shown for a share outstanding throughout the period may not correlate with the Statement of Operations for the period due to the timing of sales and repurchases of the Fund’s shares in relation to income earned and/or fluctuating fair value of the investments of the Fund.
cBased on average daily shares outstanding.
dTotal return is not annualized for periods less than one year.
eRatios are annualized for periods less than one year.
fBenefit of expense reduction rounds to less than 0.01%.
| | | | | | | | |
franklintempleton.com | | | | The accompanying notes are an integral part of these financial statements. | | | Annual Report | | 95 |
FRANKLIN TAX-FREE TRUST
FINANCIAL HIGHLIGHTS
Franklin Georgia Tax-Free Income Fund(continued)
| | | | | | | | | | | | |
| | | Year Ended February 28, | |
| | | 2019 | | | 2018 | | | 2017a | |
| |
| | | |
Advisor Class | | | | | | | | | | | | |
| | | |
Per share operating performance | | | | | | | | | | | | |
(for a share outstanding throughout the year) | | | | | | | | | | | | |
| | | |
Net asset value, beginning of year | | | $11.66 | | | | $11.99 | | | | $12.41 | |
| | | | |
| | | |
Income from investment operationsb: | | | | | | | | | | | | |
| | | |
Net investment incomec | | | 0.39 | | | | 0.40 | | | | 0.20 | |
| | | |
Net realized and unrealized gains (losses) | | | (0.07) | | | | (0.32) | | | | (0.43) | |
| | | | |
| | | |
Total from investment operations | | | 0.32 | | | | 0.08 | | | | (0.23) | |
| | | | |
| | | |
Less distributions from net investment income | | | (0.39) | | | | (0.41) | | | | (0.19) | |
| | | | |
| | | |
Net asset value, end of year | | | $11.59 | | | | $11.66 | | | | $11.99 | |
| | | | |
| | | |
Total returnd | | | 2.83% | | | | 0.64% | | | | (1.82)% | |
| | | |
Ratios to average net assetse | | | | | | | | | | | | |
| | | |
Expenses | | | 0.62%f | | | | 0.59%g | | | | 0.57% | |
| | | |
Net investment income | | | 3.35% | | | | 3.35% | | | | 3.46% | |
| | | |
Supplemental data | | | | | | | | | | | | |
| | | |
Net assets, end of year (000’s) | | | $40,142 | | | | $35,389 | | | | $21,454 | |
| | | |
Portfolio turnover rate | | | 11.78% | | | | 9.33% | | | | 8.34% | |
aFor the period September 15, 2016 (effective date) to February 28, 2017.
bThe amount shown for a share outstanding throughout the period may not correlate with the Statement of Operations for the period due to the timing of sales and repurchases of the Fund’s shares in relation to income earned and/or fluctuating fair value of the investments of the Fund.
cBased on average daily shares outstanding.
dTotal return is not annualized for periods less than one year.
eRatios are annualized for periods less than one year.
fBenefit of expense reduction rounds to less than 0.01%.
gBenefit of waiver and payments by affiliates rounds to less than 0.01%.
| | | | | | |
96 | | Annual Report | | | The accompanying notes are an integral part of these financial statements. | | franklintempleton.com |
FRANKLIN TAX-FREE TRUST
Statement of Investments, February 28, 2019
Franklin GeorgiaTax-Free Income Fund
| | | | | | | | |
| | | Principal
Amount | | | Value | |
Municipal Bonds 99.0% | | | | | | | | |
Georgia 98.2% | | | | | | | | |
Athens Housing Authority Revenue, | | | | | | | | |
UGAREF East Campus Housing Phase II LLC Project, Refunding, 5.00%, 6/15/36 | | $ | 2,390,000 | | | $ | 2,726,393 | |
UGAREF Fraternity Row LLC Project, Refunding, 4.00%, 6/15/40 | | | 5,000,000 | | | | 5,168,300 | |
Atlanta Airport General Revenue, | | | | | | | | |
Refunding, Series B, 5.00%, 1/01/42 | | | 2,000,000 | | | | 2,133,720 | |
Refunding, Series C, 6.00%, 1/01/30 | | | 6,000,000 | | | | 6,453,480 | |
Series A, 5.00%, 1/01/40 | | | 9,000,000 | | | | 9,198,630 | |
Atlanta Airport Passenger Facility Charge Revenue, | | | | | | | | |
General, sub. lien, Refunding, Series A, 5.00%, 1/01/33 | | | 4,005,000 | | | | 4,484,158 | |
General, sub. lien, Refunding, Series A, 5.00%, 1/01/34 | | | 3,250,000 | | | | 3,632,525 | |
Atlanta and Fulton County Recreation Authority Revenue, Park Improvement, Refunding, Series A, 5.00%, 12/01/35 | | | 3,530,000 | | | | 4,023,141 | |
The Atlanta Development Authority Revenue, | | | | | | | | |
New Downtown Atlanta Stadium Project, senior lien, SeriesA-1, 5.25%, 7/01/40 | | | 7,750,000 | | | | 8,767,265 | |
New Downtown Atlanta Stadium Project, senior lien, SeriesA-1, 5.25%, 7/01/44 | | | 3,000,000 | | | | 3,382,230 | |
Tuff Yamacraw LLC Project, Refunding, Series A, AMBAC Insured, 5.00%, 1/01/26 | | | 2,555,000 | | | | 2,815,738 | |
Atlanta Development Authority Student Housing Facilities Revenue, Piedmont/Ellis LLC University Commons Project Located on the Campus of Georgia State University,Pre-Refunded, 5.00%, 9/01/32 | | | 2,000,000 | | | | 2,277,740 | |
Atlanta Tax Allocation, Beltline Project, Refunding, Series B, 5.00%, 1/01/31 | | | 1,780,000 | | | | 2,055,402 | |
Atlanta Water and Wastewater Revenue, | | | | | | | | |
Refunding, 5.00%, 11/01/43 | | | 10,000,000 | | | | 11,110,700 | |
Refunding, Series B, 5.00%, 11/01/47 | | | 5,000,000 | | | | 5,700,650 | |
Series A, AGMC Insured, 5.50%, 11/01/27 | | | 5,000,000 | | | | 6,080,800 | |
Series A,Pre-Refunded, 6.00%, 11/01/28 | | | 5,055,000 | | | | 5,201,646 | |
Bainbridge PFAR, Decatur County Projects, AGMC Insured, 4.00%, 3/01/43 | | | 4,000,000 | | | | 4,076,280 | |
aBaldwin County Hospital Authority Revenue, | | | | | | | | |
Oconee Regional Medical Center, 5.25%, 12/01/22 | | | 2,500,000 | | | | 25 | |
Oconee Regional Medical Center, 5.375%, 12/01/28 | | | 2,000,000 | | | | 20 | |
Bartow-Cartersville Joint Development Authority Revenue, GHC Student Center LLC Project, AGMC Insured,
5.00%, 6/15/36 | | | 4,155,000 | | | | 4,405,920 | |
Bibb County Development Authority Revenue, Macon State College Foundation Real Estate II LLC Project, AGMC Insured, 5.00%, 7/01/40 | | | 5,000,000 | | | | 5,406,400 | |
Brunswick and Glynn County Joint Water and Sewer Commission Revenue, Series C, AGMC Insured,Pre-Refunded, 5.00%, 6/01/33 | | | 2,045,000 | | | | 2,128,293 | |
Buford GO, Refunding, Series C, 4.00%, 1/01/43 | | | 5,000,000 | | | | 5,164,950 | |
Bulloch County Development Authority Student Housing Revenue, Georgia Southern University Housing Foundation Five LLC Project, AGMC Insured, 5.00%, 7/01/36 | | | 2,055,000 | | | | 2,181,444 | |
Burke County Development Authority PCR, Oglethorpe Power Corp. Vogtle Project, Refunding, Series D,
4.125%, 11/01/45 | | | 7,000,000 | | | | 6,880,230 | |
Carroll City-County Hospital Authority Revenue, | | | | | | | | |
Anticipation Certificates, Tanner Medical Center Inc. Project, 5.00%, 7/01/41 | | | 2,000,000 | | | | 2,208,220 | |
Anticipation Certificates, Tanner Medical Center Inc. Project,Pre-Refunded, 5.00%, 7/01/40 | | | 5,000,000 | | | | 5,217,200 | |
Carrollton Payroll Development Authority Revenue, UWG Athletic Complex LLC Project, Anticipation Certificates, Refunding, AGMC Insured, 5.00%, 6/15/37 | | | 3,140,000 | | | | 3,588,612 | |
Clayton County Development Authority Revenue, Tuff ArchivesLLC-Secretary of State of Georgia Project, Refunding, 5.00%, 7/01/33 | | | 5,000,000 | | | | 5,475,150 | |
Clayton County Development Authority Student Housing Revenue, CSU Foundation Real Estate II LLC Project, AGMC Insured, 5.00%, 7/01/36 | | | 3,000,000 | | | | 3,181,080 | |
| | | | | | | | |
franklintempleton.com | | | | | | Annual Report | | 97 |
FRANKLIN TAX-FREE TRUST
STATEMENT OF INVESTMENTS
Franklin Georgia Tax-Free Income Fund(continued)
| | | | | | | | |
| | | Principal
Amount | | | Value | |
Municipal Bonds(continued) | | | | | | | | |
Georgia(continued) | | | | | | | | |
Clayton County Hospital Authority Revenue, | | | | | | | | |
Anticipation Certificates, Southern Regional Medical Center Project, Series A,Pre-Refunded, 5.00%, 8/01/30 | | $ | 2,000,000 | | | $ | 2,089,440 | |
Anticipation Certificates, Southern Regional Medical Center Project, Series A,Pre-Refunded, 5.25%, 8/01/35 | | | 1,000,000 | | | | 1,048,180 | |
Clayton County Urban RDAR, Clayton County Project, Refunding, 5.00%, 2/01/28 | | | 1,285,000 | | | | 1,398,234 | |
Cobb County Development Authority Revenue, Georgia Tech Cobb Research Campus, Series A, 4.00%, 6/01/42 | | | 1,600,000 | | | | 1,653,664 | |
Cobb County Development Authority Student Housing Revenue, Kennesaw State University Real Estate Foundations Projects, Senior, Refunding, Series A, 5.00%, 7/15/38 | | | 2,000,000 | | | | 2,208,800 | |
Cobb County Development Authority Student Recreation and Activities Center Revenue, | | | | | | | | |
KSU SRAC Real Estate Foundation LLC Project, 5.00%, 7/15/35 | | | 2,500,000 | | | | 2,707,950 | |
KSU SRAC Real Estate Foundation LLC Project, 5.00%, 7/15/38 | | | 2,500,000 | | | | 2,704,575 | |
Columbus Water and Sewerage Revenue, Series A, 5.00%, 5/01/33 | | | 1,030,000 | | | | 1,170,296 | |
Coweta County Development Authority Revenue, Piedmont Healthcare Inc. Project, 5.00%, 6/15/40 | | | 5,000,000 | | | | 5,181,200 | |
Dalton GO, 5.00%, 2/01/48 | | | 3,000,000 | | | | 3,440,250 | |
Dalton-Whitfield County Joint Development Authority Revenue, Hamilton Health Care System Obligated Group,
4.00%, 8/15/41 | | | 3,000,000 | | | | 3,092,580 | |
Decatur Urban RDAR, City of Decatur Projects, Series A, 5.00%, 1/01/38 | | | 6,195,000 | | | | 6,797,092 | |
DeKalb County Water and Sewerage Revenue, | | | | | | | | |
Refunding, Series B, AGMC Insured, 5.00%, 10/01/35 | | | 10,655,000 | | | | 12,363,742 | |
Second Resolution, Series A, 5.25%, 10/01/41 | | | 11,425,000 | | | | 12,274,906 | |
DeKalb Newton and Gwinnett County Joint Development Authority Revenue, | | | | | | | | |
GGC Student Center LLC Project,Pre-Refunded, 5.50%, 7/01/34 | | | 3,000,000 | | | | 3,037,680 | |
GGCF Athletic Fields LLC Project, Series A, AGMC Insured, 5.00%, 7/01/39 | | | 5,000,000 | | | | 5,408,050 | |
DeKalb Private Hospital Authority Revenue, Anticipation Certificates, Children’s Healthcare of Atlanta Inc. Project, Refunding, 5.25%, 11/15/39 | | | 5,000,000 | | | | 5,106,900 | |
Fairburn GO, AGMC Insured,Pre-Refunded, 5.75%, 12/01/31 | | | 2,000,000 | | | | 2,218,860 | |
Floyd County Hospital Authority Revenue, Anticipation Certificates, Floyd Medical Center Project, Refunding, Series A, 4.00%, 7/01/43 | | | 7,735,000 | | | | 7,840,660 | |
Forsyth County School District GO, 5.00%, 2/01/38 | | | 2,650,000 | | | | 3,112,929 | |
Fulton County Development Authority Hospital Revenue, Anticipation Certificates, Wellstar Health System Inc. Project, Series A, 5.00%, 4/01/47 | | | 1,000,000 | | | | 1,092,820 | |
Fulton County Development Authority Revenue, | | | | | | | | |
AMC Campus Project I LLC Project, AGMC Insured, 5.00%, 6/15/37 | | | 3,075,000 | | | | 3,256,456 | |
Georgia Tech Facilities, 4.00%, 3/01/43 | | | 2,000,000 | | | | 2,059,700 | |
Georgia Tech Facilities Inc. Project, Refunding, Series A, 5.00%, 6/01/34 | | | 4,000,000 | | | | 4,028,400 | |
Georgia Tech Facilities Inc. Project, Series A, 5.00%, 6/01/41 | | | 3,500,000 | | | | 3,628,310 | |
Piedmont Healthcare Inc. Project, Refunding, Series A, 5.00%, 7/01/44 | | | 10,000,000 | | | | 10,858,600 | |
Piedmont Healthcare Inc. Project, Series A,Pre-Refunded, 5.25%, 6/15/37 | | | 5,000,000 | | | | 5,051,550 | |
Fulton County GO, Library Bond, 4.00%, 7/01/40 | | | 5,000,000 | | | | 5,212,650 | |
Fulton County Residential Care Facilities Elderly Authority Retirement Facility Revenue, Lenbrook Square Foundation Inc. Project, Refunding, 5.00%, 7/01/42 | | | 5,500,000 | | | | 5,666,430 | |
Gainesville and Hall County Hospital Authority Revenue, | | | | | | | | |
Anticipation Certificates, Northeast Georgia Health System Inc. Project, Refunding, Series A, 5.375%, 2/15/40 | | | 1,245,000 | | | | 1,286,720 | |
Anticipation Certificates, Northeast Georgia Health System Inc. Project, Refunding, Series A, 5.00%, 2/15/42 | | | 7,000,000 | | | | 7,713,370 | |
Anticipation Certificates, Northeast Georgia Health System Inc. Project, Series A,Pre-Refunded, 5.375%, 2/15/40 | | | 3,755,000 | | | | 3,884,097 | |
| | | | | | |
98 | | Annual Report | | | | franklintempleton.com |
FRANKLIN TAX-FREE TRUST
STATEMENT OF INVESTMENTS
Franklin Georgia Tax-Free Income Fund(continued)
| | | | | | | | |
| | | Principal
Amount | | | Value | |
Municipal Bonds(continued) | | | | | | | | |
Georgia(continued) | | | | | | | | |
Georgia State GO, | | | | | | | | |
Series A, 4.00%, 7/01/36 | | $ | 5,000,000 | | | $ | 5,380,800 | |
SeriesA-2, 4.00%, 2/01/36 | | | 5,000,000 | | | | 5,331,950 | |
Georgia State HFAR, | | | | | | | | |
SFM, Series A, 3.80%, 12/01/37 | | | 5,000,000 | | | | 5,028,450 | |
SFM, Series A, 3.85%, 12/01/38 | | | 6,150,000 | | | | 6,222,509 | |
SFM, Series A, 3.95%, 12/01/43 | | | 3,000,000 | | | | 3,024,840 | |
SFM, Series B, 4.05%, 12/01/38 | | | 2,000,000 | | | | 2,062,020 | |
Georgia State Municipal Electric Authority Revenue, Power, Series GG, 5.00%, 1/01/39 | | | 7,000,000 | | | | 7,450,940 | |
Georgia State Municipal Gas Authority Revenue, | | | | | | | | |
Gas Portfolio III Project, Refunding, Series S, 5.00%, 10/01/25 | | | 2,500,000 | | | | 2,758,050 | |
Gas Portfolio III Project, Refunding, Series S, 5.00%, 10/01/26 | | | 2,500,000 | | | | 2,758,050 | |
Glynn-Brunswick Memorial Hospital Authority Revenue, Anticipation Certificates, Southeast Georgia Health System Project, 5.00%, 8/01/47 | | | 5,000,000 | | | | 5,407,500 | |
Gwinnett County Development Authority COP, | | | | | | | | |
Gwinnett County Public Schools Project, Refunding, NATL Insured, 5.25%, 1/01/22 | | | 3,000,000 | | | | 3,294,090 | |
Gwinnett County Public Schools Project, Refunding, NATL Insured, 5.25%, 1/01/24 | | | 2,000,000 | | | | 2,318,340 | |
Gwinnett County Hospital Authority Revenue, Anticipation Certificates, Gwinnett Hospital System Inc. Project, Series D, AGMC Insured, 5.50%, 7/01/37 | | | 4,000,000 | | | | 4,038,760 | |
Gwinnett County School District GO, 5.00%, 2/01/41 | | | 3,000,000 | | | | 3,534,300 | |
Henry County School District GO, 4.00%, 8/01/33 | | | 5,000,000 | | | | 5,372,950 | |
Hogansville Combined Public Utility System Revenue, Refunding, AGMC Insured, 6.00%, 10/01/23 | | | 2,240,000 | | | | 2,408,806 | |
Lawrenceville Building Authority Revenue, 5.00%, 4/01/35 | | | 2,270,000 | | | | 2,572,500 | |
Lincoln County School District GO,Pre-Refunded, 5.50%, 4/01/37 | | | 2,200,000 | | | | 2,206,600 | |
Macon Water Authority Revenue, Water and Sewer, 4.00%, 10/01/35 | | | 2,810,000 | | | | 3,130,171 | |
Macon-Bibb County Hospital Authority Revenue, Anticipation Certificates, The Medical Center of Central Georgia Inc. Project,Pre-Refunded, 5.00%, 8/01/35 | | | 5,000,000 | | | | 5,068,400 | |
Main Street Natural Gas Inc. Gas Supply Revenue, Series A, 5.00%, 5/15/38 | | | 2,500,000 | | | | 2,844,675 | |
Main Street Natural Gas Inc. Revenue, Gas Project, Series A, 5.50%, 9/15/27 | | | 5,000,000 | | | | 6,096,450 | |
Medical Center Hospital Authority Revenue, Anticipation Certificates, Columbus Regional Healthcare System Inc. Project, AGMC Insured,Pre-Refunded, 5.00%, 8/01/41 | | | 5,000,000 | | | | 5,227,150 | |
Metropolitan Atlanta Rapid Transit Authority Sales Tax Revenue, Third Indenture Series, Series B, 5.00%, 7/01/45 | | | 5,000,000 | | | | 5,636,500 | |
Moultrie-Colquitt County Development Authority Revenue, Philadelphia College of Osteopathic Medicine Project, 5.00%, 12/01/43 | | | 4,815,000 | | | | 5,410,278 | |
Paulding County Hospital Authority Revenue, Anticipation Certificates, Series A, 5.00%, 4/01/42 | | | 3,500,000 | | | | 3,728,025 | |
Pierce County School District GO, 4.00%, 1/01/43 | | | 3,725,000 | | | | 3,854,667 | |
Private Colleges and Universities Authority Revenue, | | | | | | | | |
Emory University, Refunding, Series A, 5.00%, 9/01/41 | | | 8,695,000 | | | | 9,299,998 | |
Emory University, Refunding, Series A, 5.00%, 10/01/43 | | | 5,000,000 | | | | 5,531,100 | |
Emory University, Refunding, Series B, 5.00%, 9/01/35 | | | 10,000,000 | | | | 10,152,000 | |
Richmond County Hospital Authority Revenue, Anticipation Certificates, University Health Services Inc. Project, Refunding, 4.00%, 1/01/35 | | | 10,055,000 | | | | 10,399,484 | |
Sandy Springs PFAR, City Center Project, 5.00%, 5/01/41 | | | 3,000,000 | | | | 3,416,010 | |
Thomasville Hospital Authority Revenue, | | | | | | | | |
Anticipation Certificates, John D. Archbold Memorial Hospital Inc. Project,Pre-Refunded, 5.25%, 11/01/35 | | | 1,000,000 | | | | 1,058,390 | |
Anticipation Certificates, John D. Archbold Memorial Hospital Inc. Project,Pre-Refunded, 5.375%, 11/01/40 | | | 5,000,000 | | | | 5,302,150 | |
Tift County Hospital Revenue, Anticipation Certificates, Refunding, 5.00%, 12/01/38 | | | 2,000,000 | | | | 2,195,720 | |
| | | | | | | | |
franklintempleton.com | | | | | | Annual Report | | 99 |
FRANKLIN TAX-FREE TRUST
STATEMENT OF INVESTMENTS
Franklin Georgia Tax-Free Income Fund(continued)
| | | | | | | | |
| | | Principal
Amount | | | Value | |
Municipal Bonds(continued) | | | | | | | | |
Georgia(continued) | | | | | | | | |
Valdosta and Lowndes County Hospital Authority Revenue, Certificates, South Georgia Medical Center Project,
Series B, 5.00%, 10/01/41 | | $ | 3,000,000 | | | $ | 3,189,810 | |
Worth County School District GO, 5.00%, 12/01/42 | | | 5,000,000 | | | | 5,681,700 | |
| | | | | | | | |
| | | | | | | 442,115,566 | |
| | | | | | | | |
U.S. Territories 0.8% | | | | | | | | |
Puerto Rico 0.8% | | | | | | | | |
aPuerto Rico Electric Power Authority Power Revenue, Series XX, 5.25%, 7/01/40 | | | 5,000,000 | | | | 3,431,250 | |
| | | | | | | | |
Total Municipal Bonds (Cost $436,891,754) 99.0% | | | | | | | 445,546,816 | |
Other Assets, less Liabilities 1.0% | | | | | | | 4,568,202 | |
| | | | | | | | |
Net Assets 100.0% | | | | | | $ | 450,115,018 | |
| | | | | | | | |
See Abbreviations on page 183.
aSee Note 7 regarding defaulted securities.
| | | | | | |
100 | | Annual Report | | | The accompanying notes are an integral part of these financial statements. | | franklintempleton.com |
FRANKLIN TAX-FREE TRUST
Financial Highlights
Franklin KentuckyTax-Free Income Fund
| | | | |
| | | Year Ended February 28, 2019a | |
| |
| |
Class A | | | | |
| |
Per share operating performance | | | | |
(for a share outstanding throughout the year) | | | | |
| |
Net asset value, beginning of year | | | $10.68 | |
| | | | |
| |
Income from investment operationsb: | | | | |
| |
Net investment incomec | | | 0.15 | |
| |
Net realized and unrealized gains (losses) | | | 0.08 | |
| | | | |
| |
Total from investment operations | | | 0.23 | |
| | | | |
| |
Less distributions from net investment income | | | (0.15) | |
| | | | |
| |
Net asset value, end of year | | | $10.76 | |
| | | | |
| |
Total returnd | | | 2.16% | |
| |
Ratios to average net assetse | | | | |
| |
Expensesf | | | 0.97% | |
| |
Net investment income | | | 3.00% | |
| |
Supplemental data | | | | |
| |
Net assets, end of year (000’s) | | | $2,785 | |
| |
Portfolio turnover rate | | | 18.61% | |
aFor the period September 10, 2018 (effective date) to February 28, 2019.
bThe amount shown for a share outstanding throughout the period may not correlate with the Statement of Operations for the period due to the timing of sales and repurchases of the Fund’s shares in relation to income earned and/or fluctuating fair value of the investments of the Fund.
cBased on average daily shares outstanding.
dTotal return does not reflect sales commissions or contingent deferred sales charges, if applicable, and is not annualized for periods less than one year.
eRatios are annualized for periods less than one year.
fBenefit of expense reduction rounds to less than 0.01%.
| | | | | | | | |
franklintempleton.com | | | | The accompanying notes are an integral part of these financial statements. | | | Annual Report | | 101 |
FRANKLIN TAX-FREE TRUST
FINANCIAL HIGHLIGHTS
Franklin Kentucky Tax-Free Income Fund(continued)
| | | | | | | | | | | | | | | | | | | | |
| | | Year Ended February 28, | |
| | | 2019 | | | 2018 | | | 2017 | | | 2016a | | | 2015 | |
| |
| | | | | |
Class A1 | | | | | | | | | | | | | | | | | | | | |
| | | | | |
Per share operating performance | | | | | | | | | | | | | | | | | | | | |
(for a share outstanding throughout the year) | | | | | | | | | | | | | | | | | | | | |
| | | | | |
Net asset value, beginning of year | | | $10.77 | | | | $11.01 | | | | $11.31 | | | | $11.52 | | | | $11.12 | |
| | | | |
| | | | | |
Income from investment operationsb: | | | | | | | | | | | | | | | | | | | | |
| | | | | |
Net investment incomec | | | 0.34 | | | | 0.37 | | | | 0.40 | | | | 0.41 | | | | 0.43 | |
| | | | | |
Net realized and unrealized gains (losses) | | | (0.02) | | | | (0.24) | | | | (0.30) | | | | (0.21) | | | | 0.40 | |
| | | | |
| | | | | |
Total from investment operations | | | 0.32 | | | | 0.13 | | | | 0.10 | | | | 0.20 | | | | 0.83 | |
| | | | |
| | | | | |
Less distributions from net investment income | | | (0.34) | | | | (0.37) | | | | (0.40) | | | | (0.41) | | | | (0.43) | |
| | | | |
| | | | | |
Net asset value, end of year | | | $10.75 | | | | $10.77 | | | | $11.01 | | | | $11.31 | | | | $11.52 | |
| | | | |
| | | | | |
Total returnd | | | 3.01% | | | | 1.20% | | | | 0.86% | | | | 1.82% | | | | 7.61% | |
| | | | | |
Ratios to average net assets | | | | | | | | | | | | | | | | | | | | |
| | | | | |
Expenses | | | 0.82%e | | | | 0.79% | | | | 0.77% | | | | 0.76% | | | | 0.78% | |
| | | | | |
Net investment income | | | 3.15% | | | | 3.40% | | | | 3.51% | | | | 3.61% | | | | 3.81% | |
| | | | | |
Supplemental data | | | | | | | | | | | | | | | | | | | | |
| | | | | |
Net assets, end of year (000’s) | | | $130,267 | | | | $150,182 | | | | $165,613 | | | | $173,093 | | | | $168,278 | |
| | | | | |
Portfolio turnover rate | | | 18.61% | | | | 13.90% | | | | 9.14% | | | | 5.91% | | | | 6.35% | |
aFor the year ended February 29.
bThe amount shown for a share outstanding throughout the period may not correlate with the Statement of Operations for the period due to the timing of sales and repurchases of the Fund’s shares in relation to income earned and/or fluctuating fair value of the investments of the Fund.
cBased on average daily shares outstanding.
dTotal return does not reflect sales commissions or contingent deferred sales charges, if applicable.
eBenefit of expense reduction rounds to less than 0.01%.
| | | | | | |
102 | | Annual Report | | | The accompanying notes are an integral part of these financial statements. | | franklintempleton.com |
FRANKLIN TAX-FREE TRUST
FINANCIAL HIGHLIGHTS
Franklin Kentucky Tax-Free Income Fund(continued)
| | | | | | | | |
| | | Year Ended February 28, | |
| | | 2019 | | | 2018a | |
| |
| | |
Class R6 | | | | | | | | |
| | |
Per share operating performance | | | | | | | | |
(for a share outstanding throughout the year) | | | | | | | | |
| | |
Net asset value, beginning of year | | | $10.77 | | | | $10.98 | |
| | | | |
| | |
Income from investment operationsb: | | | | | | | | |
| | |
Net investment incomec | | | 0.35 | | | | 0.23 | |
| | |
Net realized and unrealized gains (losses) | | | (0.02) | | | | (0.22) | |
| | | | |
| | |
Total from investment operations | | | 0.33 | | | | 0.01 | |
| | | | |
| | |
Less distributions from net investment income | | | (0.35) | | | | (0.22) | |
| | | | |
| | |
Net asset value, end of year | | | $10.75 | | | | $10.77 | |
| | | | |
| | |
Total returnd | | | 3.13% | | | | 0.07% | |
| | |
Ratios to average net assetse | | | | | | | | |
| | |
Expenses before waiver and payments by affiliates | | | 0.70% | | | | 0.70% | |
| | |
Expenses net of waiver and payments by affiliates | | | 0.67%f | | | | 0.65% | |
| | |
Net investment income | | | 3.30% | | | | 3.54% | |
| | |
Supplemental data | | | | | | | | |
| | |
Net assets, end of year (000’s) | | | $1,843 | | | | $2,085 | |
| | |
Portfolio turnover rate | | | 18.61% | | | | 13.90% | |
aFor the period August 1, 2017 (effective date) to February 28, 2018.
bThe amount shown for a share outstanding throughout the period may not correlate with the Statement of Operations for the period due to the timing of sales and repurchases of the Fund’s shares in relation to income earned and/or fluctuating fair value of the investments of the Fund.
cBased on average daily shares outstanding.
dTotal return is not annualized for periods less than one year.
eRatios are annualized for periods less than one year.
fBenefit of expense reduction rounds to less than 0.01%.
| | | | | | | | |
franklintempleton.com | | | | The accompanying notes are an integral part of these financial statements. | | | Annual Report | | 103 |
FRANKLIN TAX-FREE TRUST
FINANCIAL HIGHLIGHTS
Franklin Kentucky Tax-Free Income Fund(continued)
| | | | | | | | | | | | |
| | | Year Ended February 28, | |
| | | 2019 | | | 2018 | | | 2017a | |
| |
| | | |
Advisor Class | | | | | | | | | | | | |
| | | |
Per share operating performance | | | | | | | | | | | | |
(for a share outstanding throughout the year) | | | | | | | | | | | | |
| | | |
Net asset value, beginning of year | | | $10.77 | | | | $11.01 | | | | $11.35 | |
| | | | |
| | | |
Income from investment operationsb: | | | | | | | | | | | | |
| | | |
Net investment incomec | | | 0.35 | | | | 0.38 | | | | 0.19 | |
| | | |
Net realized and unrealized gains (losses) | | | (0.02) | | | | (0.24) | | | | (0.35) | |
| | | | |
| | | |
Total from investment operations | | | 0.33 | | | | 0.14 | | | | (0.16) | |
| | | | |
| | | |
Less distributions from net investment income | | | (0.35) | | | | (0.38) | | | | (0.18) | |
| | | | |
| | | |
Net asset value, end of year | | | $10.75 | | | | $10.77 | | | | $11.01 | |
| | | | |
| | | |
Total returnd | | | 3.10% | | | | 1.30% | | | | (1.36)% | |
| | | |
Ratios to average net assetse | | | | | | | | | | | | |
| | | |
Expenses | | | 0.72%f | | | | 0.69% | | | | 0.67% | |
| | | |
Net investment income | | | 3.25% | | | | 3.50% | | | | 3.61% | |
| | | |
Supplemental data | | | | | | | | | | | | |
| | | |
Net assets, end of year (000’s) | | | $9,298 | | | | $7,438 | | | | $6,896 | |
| | | |
Portfolio turnover rate | | | 18.61% | | | | 13.90% | | | | 9.14% | |
aFor the period September 15, 2016 (effective date) to February 28, 2017.
bThe amount shown for a share outstanding throughout the period may not correlate with the Statement of Operations for the period due to the timing of sales and repurchases of the Fund’s shares in relation to income earned and/or fluctuating fair value of the investments of the Fund.
cBased on average daily shares outstanding.
dTotal return is not annualized for periods less than one year.
eRatios are annualized for periods less than one year.
fBenefit of expense reduction rounds to less than 0.01%.
| | | | | | |
104 | | Annual Report | | | The accompanying notes are an integral part of these financial statements. | | franklintempleton.com |
FRANKLIN TAX-FREE TRUST
Statement of Investments, February 28, 2019
Franklin KentuckyTax-Free Income Fund
| | | | | | | | |
| | | Principal
Amount | | | Value | |
Municipal Bonds 97.2% | | | | | | | | |
Kentucky 97.2% | | | | | | | | |
Boyle County Revenue, Educational Facilities, Centre College of Kentucky, Refunding, 5.00%, 6/01/37 | | $ | 2,000,000 | | | $ | 2,192,100 | |
Eastern Kentucky University General Receipts Revenue, Series A, 4.00%, 10/01/37 | | | 1,540,000 | | | | 1,600,476 | |
Fayette County School District Finance Corp. Revenue, | | | | | | | | |
School Building, Series A, 4.00%, 5/01/38 | | | 1,000,000 | | | | 1,036,840 | |
School Building, Series D, 5.00%, 8/01/34 | | | 1,985,000 | | | | 2,242,951 | |
Glasgow Healthcare Revenue, T.J. Samson Community Hospital Project, 6.45%, 2/01/41 | | | 2,000,000 | | | | 2,108,200 | |
Greater Kentucky Housing Assistance Corp. Mortgage Revenue, Section 8 Assisted Projects, Refunding, Series A, NATL Insured, 6.10%, 1/01/24 | | | 160,000 | | | | 160,451 | |
Jefferson County School District Finance Corp. School Building Revenue, Refunding, Series B, 4.00%, 12/01/26 | | | 3,500,000 | | | | 3,963,645 | |
Kentucky Bond Development Corp. Transient Room Tax Revenue, Lexington Center Corp. Project, Refunding, Series A, 5.00%, 9/01/48 | | | 2,500,000 | | | | 2,786,075 | |
Kentucky Economic Development Finance Authority Revenue, | | | | | | | | |
Catholic Health Initiatives, Refunding, Series A, 5.00%, 5/01/29 | | | 5,670,000 | | | | 5,693,304 | |
Hospital, Baptist Healthcare System Obligated Group, 5.25%, 8/15/46 | | | 5,000,000 | | | | 5,216,150 | |
Kentucky Rural Water Finance Corp. Public Project Revenue, | | | | | | | | |
Multimodal, Flexible Term Program, Series A, 5.00%, 2/01/26 | | | 485,000 | | | | 486,251 | |
Multimodal, Flexible Term Program, Series I, 5.00%, 2/01/34 | | | 1,010,000 | | | | 1,012,141 | |
Kentucky State Housing Corp. Conduit MFHR, | | | | | | | | |
Collateral Mortgage Loan, Country Place Apartments Project, GNMA Secured, 5.00%, 4/20/40 | | | 2,280,000 | | | | 2,335,176 | |
Collateral Mortgage Loan, Country Place Apartments Project, GNMA Secured, 5.25%, 4/20/45 | | | 1,850,000 | | | | 1,893,808 | |
Kentucky State Infrastructure Authority Revenue, | | | | | | | | |
Wastewater and Drinking Water Revolving Fund, Series A,Pre-Refunded, 5.00%, 2/01/28 | | | 2,000,000 | | | | 2,192,460 | |
Wastewater and Drinking Water Revolving Fund, Series A,Pre-Refunded, 5.00%, 2/01/31 | | | 4,190,000 | | | | 4,593,204 | |
Kentucky State Municipal Power Agency Power System Revenue, Prairie State Project, Refunding, Series A, NATL Insured, 5.00%, 9/01/36 | | | 3,000,000 | | | | 3,313,950 | |
Kentucky State Property and Buildings Commission Revenue, | | | | | | | | |
Project No. 108, Refunding, Series A, 5.00%, 8/01/34 | | | 3,500,000 | | | | 3,922,100 | |
Project No. 115, 5.00%, 4/01/38 | | | 2,500,000 | | | | 2,763,400 | |
Kentucky State Turnpike Authority Economic Development Road Revenue, | | | | | | | | |
Revitalization Projects, Refunding, Series A, 5.00%, 7/01/30 | | | 2,500,000 | | | | 2,671,450 | |
Revitalization Projects, Refunding, Series A, 5.00%, 7/01/36 | | | 550,000 | | | | 624,201 | |
Revitalization Projects, Refunding, Series A, 5.00%, 7/01/37 | | | 700,000 | | | | 790,657 | |
Revitalization Projects, Series A, 5.00%, 7/01/32 | | | 2,000,000 | | | | 2,225,260 | |
Revitalization Projects, Series A, 5.00%, 7/01/33 | | | 3,000,000 | | | | 3,415,920 | |
Revitalization Projects, Series A,Pre-Refunded, 5.00%, 7/01/29 | | | 1,000,000 | | | | 1,010,950 | |
Lexington-Fayette Urban County Airport Board Revenue, | | | | | | | | |
General Airport, Refunding, Series B, 5.00%, 7/01/29 | | | 1,185,000 | | | | 1,296,805 | |
General Airport, Series A,Pre-Refunded, 5.00%, 7/01/27 | | | 2,000,000 | | | | 2,022,560 | |
Lexington-Fayette Urban County Government Public Facilities Corp. Lease Revenue, Eastern State Hospital Project, Refunding, Series A, 5.25%, 6/01/32 | | | 3,000,000 | | | | 3,152,730 | |
Louisville and Jefferson County Metro Government Parking Authority Revenue, first mortgage, Series A,Pre-Refunded, 5.375%, 12/01/39 | | | 1,995,000 | | | | 2,051,000 | |
Louisville and Jefferson County Metropolitan Sewer District Revenue, | | | | | | | | |
Sewer and Drainage System, Refunding, Series A, 4.00%, 5/15/38 | | | 5,000,000 | | | | 5,272,750 | |
Sewer and Drainage System, Series A, 4.00%, 5/15/48 | | | 2,750,000 | | | | 2,824,222 | |
Louisville/Jefferson County Metro Government Revenue, | | | | | | | | |
College, Bellarmine University Project, Refunding and Improvement, Series A, 5.00%, 5/01/36 | | | 2,715,000 | | | | 2,915,937 | |
College, Improvement and Refunding, Bellarmine University Inc. Project, 5.00%, 5/01/31 | | | 2,000,000 | | | | 2,148,760 | |
Morehead State University General Receipts Revenue, Refunding, Series A, 5.00%, 10/01/28 | | | 1,910,000 | | | | 2,158,911 | |
| | | | | | | | |
franklintempleton.com | | | | | | Annual Report | | 105 |
FRANKLIN TAX-FREE TRUST
STATEMENT OF INVESTMENTS
Franklin Kentucky Tax-Free Income Fund(continued)
| | | | | | | | |
| | | Principal
Amount | | | Value | |
Municipal Bonds(continued) | | | | | | | | |
Kentucky(continued) | | | | | | | | |
Murray Hospital Facilities Revenue, Murray-Calloway County Public Hospital Corp. Project,Pre-Refunded,
6.375%, 8/01/40 | | $ | 2,500,000 | | | $ | 2,659,375 | |
Owen County Waterworks System Revenue, | | | | | | | | |
American Water Co. Project, Series A, 6.25%, 6/01/39 | | | 2,000,000 | | | | 2,019,260 | |
American Water Co. Project, Series A, 5.375%, 6/01/40 | | | 2,000,000 | | | | 2,082,980 | |
American Water Co. Project, Series B, 5.625%, 9/01/39 | | | 2,000,000 | | | | 2,033,200 | |
Owensboro Electric Light and Power System Revenue, Refunding, 4.00%, 1/01/27 | | | 1,250,000 | | | | 1,363,525 | |
Owensboro Water Revenue, Refunding and Improvement, 4.00%, 9/15/45 | | | 5,000,000 | | | | 5,119,700 | |
Paducah Electric Plant Board Revenue, | | | | | | | | |
Refunding, Series A, AGMC Insured, 5.00%, 10/01/34 | | | 5,700,000 | | | | 6,335,664 | |
Series A, Assured Guaranty,Pre-Refunded, 5.25%, 10/01/35 | | | 3,500,000 | | | | 3,509,730 | |
Pikeville Hospital Revenue, Pikeville Medical Center, Improvement and Refunding, 6.50%, 3/01/41 | | | 2,875,000 | | | | 3,071,937 | |
Princeton Electric Plant Board Revenue, Series A, Assured Guaranty, 5.00%, 11/01/37 | | | 1,500,000 | | | | 1,528,155 | |
Russell Revenue, Bon Secours Health System Inc.,Pre-Refunded, 5.00%, 11/01/26 | | | 4,000,000 | | | | 4,437,640 | |
Scott County School District Finance Corp. Revenue, School Building, 4.00%, 6/01/38 | | | 1,615,000 | | | | 1,687,352 | |
Shelby County School District Finance Corp. Revenue, School Building, 4.00%, 8/01/38 | | | 3,465,000 | | | | 3,589,359 | |
University of Kentucky General Receipts Revenue, | | | | | | | | |
Series A, 4.00%, 10/01/32 | | | 4,000,000 | | | | 4,291,720 | |
Series A, 4.00%, 4/01/44 | | | 2,250,000 | | | | 2,292,727 | |
University of Louisville Revenue, | | | | | | | | |
General Receipts, Series A, 5.00%, 9/01/28 | | | 2,220,000 | | | | 2,378,375 | |
General Receipts, Series D, 5.00%, 3/01/30 | | | 4,140,000 | | | | 4,841,068 | |
Warren County Hospital Facility Revenue, Bowling Green, Warren County, Series A, 5.00%, 10/01/33 | | | 1,000,000 | | | | 1,090,200 | |
Western Kentucky University Revenue, General Receipts, Series A, 5.00%, 5/01/32 | | | 1,625,000 | | | | 1,758,087 | |
| | | | | | | | |
Total Municipal Bonds (Cost $136,446,320) 97.2%. | | | | | | | 140,184,849 | |
Other Assets, less Liabilities 2.8% | | | | | | | 4,008,645 | |
| | | | | | | | |
Net Assets 100.0%. | | | | | | $ | 144,193,494 | |
| | | | | | | | |
See Abbreviations on page 183.
| | | | | | |
106 | | Annual Report | | | The accompanying notes are an integral part of these financial statements. | | franklintempleton.com |
FRANKLIN TAX-FREE TRUST
Financial Highlights
Franklin LouisianaTax-Free Income Fund
| | | | |
| | | Year Ended February 28, 2019a | |
| |
| |
Class A | | | | |
| |
Per share operating performance | | | | |
(for a share outstanding throughout the year) | | | | |
| |
Net asset value, beginning of year | | | $10.85 | |
| | | | |
| |
Income from investment operationsb: | | | | |
| |
Net investment incomec | | | 0.16 | |
| |
Net realized and unrealized gains (losses) | | | 0.08 | |
| | | | |
| |
Total from investment operations | | | 0.24 | |
| | | | |
| |
Less distributions from net investment income | | | (0.16) | |
| | | | |
| |
Net asset value, end of year | | | $10.93 | |
| | | | |
| |
Total returnd | | | 2.22% | |
| |
Ratios to average net assetse | | | | |
| |
Expensesf | | | 0.88% | |
| |
Net investment income | | | 3.06% | |
| |
Supplemental data | | | | |
| |
Net assets, end of year (000’s) | | | $18,110 | |
| |
Portfolio turnover rate | | | 9.46% | |
aFor the period September 10, 2018 (effective date) to February 28, 2019.
bThe amount shown for a share outstanding throughout the period may not correlate with the Statement of Operations for the period due to the timing of sales and repurchases of the Fund’s shares in relation to income earned and/or fluctuating fair value of the investments of the Fund.
cBased on average daily shares outstanding.
dTotal return does not reflect sales commissions or contingent deferred sales charges, if applicable, and is not annualized for periods less than one year.
eRatios are annualized for periods less than one year.
fBenefit of expense reduction rounds to less than 0.01%.
| | | | | | | | |
franklintempleton.com | | | | The accompanying notes are an integral part of these financial statements. | | | Annual Report | | 107 |
FRANKLIN TAX-FREE TRUST
FINANCIAL HIGHLIGHTS
Franklin Louisiana Tax-Free Income Fund(continued)
| | | | | | | | | | | | | | | | | | | | |
| | | Year Ended February 28, | |
| | | 2019 | | | 2018 | | | 2017 | | | 2016a | | | 2015 | |
| |
| | | | | |
Class A1 | | | | | | | | | | | | | | | | | | | | |
| | | | | |
Per share operating performance | | | | | | | | | | | | | | | | | | | | |
(for a share outstanding throughout the year) | | | | | | | | | | | | | | | | | | | | |
| | | | | |
Net asset value, beginning of year | | | $10.90 | | | | $11.15 | | | | $11.50 | | | | $11.62 | | | | $11.26 | |
| | | | |
| | | | | |
Income from investment operationsb: | | | | | | | | | | | | | | | | | | | | |
| | | | | |
Net investment incomec | | | 0.35 | | | | 0.36 | | | | 0.39 | | | | 0.43 | | | | 0.45 | |
| | | | | |
Net realized and unrealized gains (losses) | | | 0.02 | | | | (0.24) | | | | (0.34) | | | | (0.12) | | | | 0.37 | |
| | | | |
| | | | | |
Total from investment operations | | | 0.37 | | | | 0.12 | | | | 0.05 | | | | 0.31 | | | | 0.82 | |
| | | | |
| | | | | |
Less distributions from net investment income | | | (0.35) | | | | (0.37) | | | | (0.40) | | | | (0.43) | | | | (0.46) | |
| | | | |
| | | | | |
Net asset value, end of year | | | $10.92 | | | | $10.90 | | | | $11.15 | | | | $11.50 | | | | $11.62 | |
| | | | |
| | | | | |
Total returnd | | | 3.45% | | | | 1.04% | | | | 0.43% | | | | 2.78% | | | | 7.38% | |
| | | | | |
Ratios to average net assets | | | | | | | | | | | | | | | | | | | | |
| | | | | |
Expenses | | | 0.73%e | | | | 0.70% | | | | 0.68% | | | | 0.69% | | | | 0.69% | |
| | | | | |
Net investment income | | | 3.21% | | | | 3.23% | | | | 3.41% | | | | 3.77% | | | | 3.95% | |
| | | | | |
Supplemental data | | | | | | | | | | | | | | | | | | | | |
| | | | | |
Net assets, end of year (000’s) | | | $284,259 | | | | $322,080 | | | | $343,042 | | | | $335,785 | | | | $330,742 | |
| | | | | |
Portfolio turnover rate | | | 9.46% | | | | 21.83% | | | | 16.87% | | | | 4.13% | | | | 13.28% | |
aFor the year ended February 29.
bThe amount shown for a share outstanding throughout the period may not correlate with the Statement of Operations for the period due to the timing of sales and repurchases of the Fund’s shares in relation to income earned and/or fluctuating fair value of the investments of the Fund.
cBased on average daily shares outstanding.
dTotal return does not reflect sales commissions or contingent deferred sales charges, if applicable.
eBenefit of expense reduction rounds to less than 0.01%.
| | | | | | |
108 | | Annual Report | | | The accompanying notes are an integral part of these financial statements. | | franklintempleton.com |
FRANKLINTAX-FREE TRUST
FINANCIAL HIGHLIGHTS
Franklin LouisianaTax-Free Income Fund(continued)
| | | | | | | | | | | | | | | | | | | | |
| | | Year Ended February 28, | |
| | | | |
| | | 2019 | | | 2018 | | | 2017 | | | 2016a | | | 2015 | |
| |
| | | | | |
Class C | | | | | | | | | | | | | | | | | | | | |
| | | | | |
Per share operating performance | | | | | | | | | | | | | | | | | | | | |
(for a share outstanding throughout the year) | | | | | | | | | | | | | | | | | | | | |
| | | | | |
Net asset value, beginning of year | | | $11.07 | | | | $11.32 | | | | $11.67 | | | | $11.79 | | | | $11.41 | |
| | | | |
| | | | | |
Income from investment operationsb: | | | | | | | | | | | | | | | | | | | | |
| | | | | |
Net investment incomec | | | 0.29 | | | | 0.30 | | | | 0.33 | | | | 0.37 | | | | 0.40 | |
| | | | | |
Net realized and unrealized gains (losses) | | | 0.03 | | | | (0.25 | ) | | | (0.34 | ) | | | (0.12 | ) | | | 0.37 | |
| | | | |
| | | | | |
Total from investment operations | | | 0.32 | | | | 0.05 | | | | (0.01 | ) | | | 0.25 | | | | 0.77 | |
| | | | |
| | | | | |
Less distributions from net investment income | | | (0.29 | ) | | | (0.30 | ) | | | (0.34 | ) | | | (0.37 | ) | | | (0.39) | |
| |
| | | | |
| | | | | |
Net asset value, end of year | | | $11.10 | | | | $11.07 | | | | $11.32 | | | | $11.67 | | | | $11.79 | |
| | | | |
| | | | | |
Total returnd | | | 2.92% | | | | 0.46% | | | | (0.13)% | | | | 2.18% | | | | 6.87% | |
| | | | | |
Ratios to average net assets | | | | | | | | | | | | | | | | | | | | |
| | | | | |
Expenses | | | 1.28% | e | | | 1.25% | | | | 1.23% | | | | 1.24% | | | | 1.24% | |
| | | | | |
Net investment income | | | 2.66% | | | | 2.68% | | | | 2.86% | | | | 3.22% | | | | 3.40% | |
| | | | | |
Supplemental data | | | | | | | | | | | | | | | | | | | | |
| | | | | |
Net assets, end of year (000’s) | | | $42,188 | | | | $61,399 | | | | $67,154 | | | | $68,319 | | | | $68,272 | |
| | | | | |
Portfolio turnover rate | | | 9.46% | | | | 21.83% | | | | 16.87% | | | | 4.13% | | | | 13.28% | |
aFor the year ended February 29.
bThe amount shown for a share outstanding throughout the period may not correlate with the Statement of Operations for the period due to the timing of sales and repurchases of the Fund’s shares in relation to income earned and/or fluctuating fair value of the investments of the Fund.
cBased on average daily shares outstanding.
dTotal return does not reflect sales commissions or contingent deferred sales charges, if applicable.
eBenefit of expense reduction rounds to less than 0.01%.
| | | | | | | | |
franklintempleton.com | | | | The accompanying notes are an integral part of these financial statements. | | | Annual Report | | 109 |
FRANKLINTAX-FREE TRUST
FINANCIAL HIGHLIGHTS
Franklin LouisianaTax-Free Income Fund(continued)
| | | | | | | | |
| | | Year Ended February 28, | |
| | | | |
| | | 2019 | | | 2018a | |
| | |
Class R6 | | | | | | | | |
| | |
Per share operating performance | | | | | | | | |
(for a share outstanding throughout the year) | | | | | | | | |
| | |
Net asset value, beginning of year | | | $10.90 | | | | $11.18 | |
| | |
Income from investment operationsb: | | | | | | | | |
| | |
Net investment incomec | | | 0.36 | | | | 0.22 | |
| | |
Net realized and unrealized gains (losses) | | | 0.03 | | | | (0.28 | ) |
| | |
Total from investment operations | | | 0.39 | | | | (0.06 | ) |
| | |
Less distributions from net investment income | | | (0.36 | ) | | | (0.22 | ) |
| | |
Net asset value, end of year. | | | $10.93 | | | | $10.90 | |
| | |
Total returnd | | | 3.67% | | | | (0.59)% | |
| | |
Ratios to average net assetse | | | | | | | | |
| | |
Expenses before waiver and payments by affiliates | | | 0.61% | | | | 0.60% | |
| | |
Expenses net of waiver and payments by affiliates | | | 0.59% | f | | | 0.57% | |
| | |
Net investment income | | | 3.35% | | | | 3.36% | |
| | |
Supplemental data | | | | | | | | |
| | |
Net assets, end of year (000’s) | | | $3,865 | | | | $3,683 | |
| | |
Portfolio turnover rate | | | 9.46% | | | | 21.83% | |
aFor the period August 1, 2017 (effective date) to February 28, 2018.
bThe amount shown for a share outstanding throughout the period may not correlate with the Statement of Operations for the period due to the timing of sales and repurchases of the Fund’s shares in relation to income earned and/or fluctuating fair value of the investments of the Fund.
cBased on average daily shares outstanding.
dTotal return is not annualized for periods less than one year.
eRatios are annualized for periods less than one year.
fBenefit of expense reduction rounds to less than 0.01%.
| | | | | | |
110 | | Annual Report | | | The accompanying notes are an integral part of these financial statements. | | franklintempleton.com |
FRANKLINTAX-FREE TRUST
FINANCIAL HIGHLIGHTS
Franklin LouisianaTax-Free Income Fund(continued)
| | | | | | | | | | | | |
| | | Year Ended February 28, | |
| | | | |
| | | 2019 | | | 2018 | | | 2017a | |
| | | |
Advisor Class | | | | | | | | | | | | |
| | | |
Per share operating performance | | | | | | | | | | | | |
(for a share outstanding throughout the year) | | | | | | | | | | | | |
| | | |
Net asset value, beginning of year | | | $10.90 | | | | $11.15 | | | | $11.54 | |
| | | | |
| | | |
Income from investment operationsb: | | | | | | | | | | | | |
| | | |
Net investment incomec | | | 0.36 | | | | 0.37 | | | | 0.19 | |
| | | |
Net realized and unrealized gains (losses) | | | 0.03 | | | | (0.24 | ) | | | (0.40) | |
| | | | |
| | | |
Total from investment operations | | | 0.39 | | | | 0.13 | | | | (0.21) | |
| | | | |
| | | |
Less distributions from net investment income | | | (0.36 | ) | | | (0.38 | ) | | | (0.18) | |
| | | | |
| | | |
Net asset value, end of year | | | $10.93 | | | | $10.90 | | | | $11.15 | |
| | | | |
| | | |
Total returnd | | | 3.65% | | | | 1.14% | | | | (1.79)% | |
| | | |
Ratios to average net assetse | | | | | | | | | | | | |
| | | |
Expenses | | | 0.63% | f | | | 0.60% | | | | 0.58% | |
| | | |
Net investment income | | | 3.31% | | | | 3.33% | | | | 3.51% | |
| | | |
Supplemental data | | | | | | | | | | | | |
| | | |
Net assets, end of year (000’s) | | | $19,580 | | | | $14,091 | | | | $10,259 | |
| | | |
Portfolio turnover rate | | | 9.46% | | | | 21.83% | | | | 16.87% | |
aFor the period September 15, 2016 (effective date) to February 28, 2017.
bThe amount shown for a share outstanding throughout the period may not correlate with the Statement of Operations for the period due to the timing of sales and repurchases of the Fund’s shares in relation to income earned and/or fluctuating fair value of the investments of the Fund.
cBased on average daily shares outstanding.
dTotal return is not annualized for periods less than one year.
eRatios are annualized for periods less than one year.
fBenefit of expense reduction rounds to less than 0.01%.
| | | | | | | | |
franklintempleton.com | | | | The accompanying notes are an integral part of these financial statements. | | | Annual Report | | 111 |
FRANKLINTAX-FREE TRUST
Statement of Investments, February 28, 2019
Franklin LouisianaTax-Free Income Fund
| | | | |
| | | Principal
Amount | | Value |
Municipal Bonds 97.3% | | | | |
Louisiana 96.1% | | | | |
Alexandria Utilities Revenue, Series A, 5.00%, 5/01/38 | | $10,000,000 | | $ 10,997,100 |
Bossier City Public Improvement Sales Tax Revenue, Series ST, 5.00%, 12/01/36 | | 1,405,000 | | 1,585,219 |
Bossier City Utilities Revenue, Refunding, 5.00%, 10/01/37 | | 5,280,000 | | 6,024,691 |
Calcasieu Parish Public Trust Authority Student Lease Revenue, McNeese State University Student Housing, Cowboy Facilities Inc. Project, Refunding, AGMC Insured, 5.00%, 5/01/29 | | 2,050,000 | | 2,219,187 |
Calcasieu Parish School District No. 23 GO, Refunding, Series A, 5.00%, 2/15/29 | | 1,380,000 | | 1,494,085 |
Calcasieu Parish School District No. 31 GO, | | | | |
Public School Improvement, BAM Insured, 5.00%, 3/01/36 | | 1,000,000 | | 1,146,960 |
Public School Improvement, BAM Insured, 5.00%, 3/01/38 | | 1,000,000 | | 1,137,410 |
East Baton Rouge Mortgage Finance Authority SFMR, | | | | |
MBS Program, Refunding, SeriesA-3, GNMA Secured, 5.00%, 10/01/28 | | 290,000 | | 290,514 |
MBS Program, SeriesA-2, GNMA Secured, 5.10%, 10/01/40 | | 155,000 | | 155,803 |
East Baton Rouge Parish Sales Tax Revenue, | | | | |
Road and Street Improvement, Assured Guaranty,Pre-Refunded, 5.25%, 8/01/28 | | 1,000,000 | | 1,014,900 |
Road and Street Improvement, Assured Guaranty,Pre-Refunded, 5.50%, 8/01/30 | | 1,700,000 | | 1,727,047 |
East Baton Rouge Sewerage Commission Revenue, | | | | |
Refunding, Series B, 5.00%, 2/01/33 | | 1,000,000 | | 1,130,470 |
Refunding, Series B, 5.00%, 2/01/39 | | 5,000,000 | | 5,579,800 |
Greater New Orleans Expressway Commission Toll Revenue, sub. lien, AGMC Insured, 5.00%, 11/01/47 | | 4,000,000 | | 4,521,560 |
Jefferson Parish Hospital District No. 1 Hospital Revenue, Parish of Jefferson, West Jefferson Medical Center, Series A,Pre-Refunded, 6.00%, 1/01/39 | | 3,105,000 | | 3,339,179 |
Jefferson Sales Tax District Special Sales Tax Revenue, Parish of Jefferson, Series B, AGMC Insured, 5.00%, 12/01/42 | | 2,250,000 | | 2,561,895 |
Kenner Consolidated Sewerage District Revenue, AGMC Insured, 5.00%, 11/01/36 | | 4,000,000 | | 4,287,560 |
Kenner Sales Tax Revenue, Refunding, Series A, 5.00%, 6/01/33 | | 8,605,000 | | 9,532,361 |
Lafayette Communications System Revenue, | | | | |
Refunding, AGMC Insured, 5.00%, 11/01/28 | | 1,345,000 | | 1,559,272 |
Refunding, AGMC Insured, 5.00%, 11/01/31 | | 2,400,000 | | 2,750,544 |
Lafayette Parish School Board Sales Tax Revenue, 5.00%, 4/01/48 | | 6,000,000 | | 6,747,840 |
Lafayette Public Improvement Sales Tax Revenue,Pre-Refunded, 5.00%, 3/01/36 | | 1,865,000 | | 1,989,563 |
Lafayette Public Trust Financing Authority Revenue, | | | | |
Ragin’ Cajun Facilities Inc. Housing and Parking Project, AGMC Insured,Pre-Refunded, 5.25%, 10/01/30 | | 4,000,000 | | 4,224,840 |
Ragin’ Cajun Facilities Inc. Project, Assured Guaranty,Pre-Refunded, 5.75%, 10/01/29 | | 750,000 | | 767,820 |
Ragin’ Cajun Facilities Inc. Project, Assured Guaranty,Pre-Refunded, 6.00%, 10/01/34 | | 1,750,000 | | 1,794,083 |
Ragin’ Cajun Facilities Inc. Project, Assured Guaranty,Pre-Refunded, 6.00%, 10/01/38 | | 1,335,000 | | 1,368,629 |
Lafayette Utilities Revenue,Pre-Refunded, 5.00%, 11/01/33 | | 5,000,000 | | 5,275,300 |
Louisiana Local Government Environmental Facilities and CDA Revenue, | | | | |
Airport, Monroe Regional Airport Terminal Project, Assured Guaranty,Pre-Refunded, 5.50%, 2/01/39 | | 2,000,000 | | 2,070,020 |
Denham Springs Sewer District No. 1 Project, Assured Guaranty,Pre-Refunded, 5.00%, 12/01/39 | | 3,750,000 | | 3,843,525 |
East Ascension Consolidated Gravity Drainage District No. 1 Project, Refunding, BAM Insured, 5.00%, 12/01/40 | | 2,925,000 | | 3,346,434 |
East Baton Rouge Sewerage Commission Projects, sub. lien, Series A, 5.00%, 2/01/34 | | 2,550,000 | | 2,840,700 |
East Baton Rouge Sewerage Commission Projects, sub. lien, Series A, 5.00%, 2/01/43 | | 3,000,000 | | 3,275,190 |
Jefferson Parish Projects, Series A,Pre-Refunded, 5.375%, 4/01/31 | | 2,000,000 | | 2,005,820 |
LCTCS Act 360 Project, 5.00%, 10/01/32 | | 3,000,000 | | 3,408,000 |
LCTCS Act 360 Project, 5.00%, 10/01/33 | | 5,000,000 | | 5,663,250 |
Louisiana Tech University Student Housing, Innovative Student Facilities Inc. Project, Series A, AGMC Insured, 4.00%, 10/01/33 | | 800,000 | | 847,432 |
Louisiana Tech University Student Housing, Innovative Student Facilities Inc. Project, Series A, AGMC Insured, 4.00%, 10/01/34 | | 620,000 | | 653,449 |
| | | | | | |
112 | | Annual Report | | | | franklintempleton.com |
FRANKLINTAX-FREE TRUST
STATEMENT OF INVESTMENTS
Franklin LouisianaTax-Free Income Fund(continued)
| | | | | | | | |
| | | Principal
Amount | | | Value | |
Municipal Bonds(continued) | | | | | | | | |
Louisiana(continued) | | | | | | | | |
Louisiana Local Government Environmental Facilities and CDA Revenue, (continued) | | | | | | | | |
McNeese State University Student Parking, Cowboy Facilities Inc. Project, AGMC Insured, 5.00%, 3/01/36 | | $ | 1,800,000 | | | $ | 1,944,990 | |
Ragin’ Cajun Facilities Inc., Student Housing and Parking Project, AGMC Insured, 5.00%, 10/01/48 | | | 3,500,000 | | | | 3,837,260 | |
Ragin’ Cajun Facilities Inc., Student Housing and Parking Project, Refunding, AGMC Insured, 5.00%, 10/01/39 | | | 2,680,000 | | | | 3,009,372 | |
Southeastern Louisiana University Student Housing/University Facilities Inc. Project, Refunding, AGMC Insured, 4.00%, 8/01/34 | | | 1,000,000 | | | | 1,041,270 | |
Woman’s Hospital Foundation Project, Refunding, Series A, 5.00%, 10/01/44 | | | 5,000,000 | | | | 5,487,150 | |
Louisiana Public Facilities Authority Hospital Revenue, | | | | | | | | |
Franciscan Missionaries of Our Lady Health System Project, Refunding, Series A, 5.00%, 7/01/35 | | | 4,965,000 | | | | 5,483,495 | |
Franciscan Missionaries of Our Lady Health System Project, Series A, 5.00%, 7/01/47 | | | 5,000,000 | | | | 5,426,600 | |
Franciscan Missionaries of Our Lady Health System Project, Series A,Pre-Refunded, 5.00%, 7/01/35 | | | 35,000 | | | | 41,505 | |
Franciscan Missionaries of Our Lady Health System Project, Series A,Pre-Refunded, 6.75%, 7/01/39 | | | 3,500,000 | | | | 3,557,960 | |
Lafayette General Medical Center Project, Refunding, 5.50%, 11/01/40 | | | 5,000,000 | | | | 5,164,650 | |
Louisiana Children’s Medical Center Project, Series A1, 5.00%, 6/01/45. | | | 10,000,000 | | | | 11,120,200 | |
Louisiana Public Facilities Authority Revenue, | | | | | | | | |
Archdiocese of New Orleans Project, Refunding, 5.00%, 7/01/37 | | | 3,750,000 | | | | 4,036,800 | |
CHRISTUS Health, Series E, 5.00%, 7/01/48 | | | 5,000,000 | | | | 5,511,050 | |
Loyola University Project, 5.00%, 10/01/41 | | | 5,000,000 | | | | 5,141,100 | |
Loyola University Project,Pre-Refunded, 5.00%, 10/01/39 | | | 5,000,000 | | | | 5,176,600 | |
Ochsner Clinic Foundation Project,Pre-Refunded, 5.00%, 5/15/34 | | | 30,000 | | | | 36,004 | |
Ochsner Clinic Foundation Project,Pre-Refunded, 6.75%, 5/15/41 | | | 5,000,000 | | | | 5,541,000 | |
Ochsner Clinic Foundation Project,Pre-Refunded, 5.00%, 5/15/47 | | | 20,000 | | | | 24,003 | |
Ochsner Clinic Foundation Project, Refunding, 5.00%, 5/15/46 | | | 10,000,000 | | | | 10,859,800 | |
Ochsner Clinic Foundation Project, Refunding, 5.00%, 5/15/47 | | | 1,730,000 | | | | 1,870,545 | |
Ochsner Clinic Foundation Project, Series B, ETM, 5.75%, 5/15/23 | | | 2,500,000 | | | | 2,896,300 | |
Tulane University of Louisiana Project, Refunding, Series A, 5.00%, 12/15/41 | | | 3,000,000 | | | | 3,316,200 | |
Tulane University of Louisiana Project, Refunding, Series A, 4.00%, 12/15/50 | | | 2,000,000 | | | | 2,014,200 | |
Tulane University of Louisiana Project, Series B, 5.00%, 10/01/37 | | | 5,540,000 | | | | 6,062,754 | |
Louisiana State Gasoline and Fuels Tax Revenue, | | | | | | | | |
first lien, Refunding, Series A, 5.00%, 5/01/41 | | | 3,000,000 | | | | 3,396,630 | |
second lien, Refunding, Series C, 5.00%, 5/01/40 | | | 5,000,000 | | | | 5,686,600 | |
second lien, Refunding, Series C, 5.00%, 5/01/45 | | | 10,000,000 | | | | 11,291,300 | |
second lien, Refunding, SeriesC-1, 5.00%, 5/01/43 | | | 5,000,000 | | | | 5,484,000 | |
Louisiana State GO, | | | | | | | | |
Refunding, Series A, 5.00%, 9/01/36 | | | 5,000,000 | | | | 5,696,900 | |
Refunding, Series C, 5.00%, 8/01/27 | | | 7,200,000 | | | | 8,282,304 | |
Series A, 5.00%, 3/01/37 | | | 3,000,000 | | | | 3,498,540 | |
Louisiana State Highway Improvement Revenue, | | | | | | | | |
Series A, 5.00%, 6/15/30 | | | 2,860,000 | | | | 3,180,492 | |
Series A, 5.00%, 6/15/32 | | | 9,850,000 | | | | 11,143,699 | |
Louisiana State Public Facilities Authority Lease Revenue, | | | | | | | | |
Provident Group, Flagship Properties LLC, Louisiana State University Greenhouse District Project, 5.00%, 7/01/52 | | | 2,310,000 | | | | 2,482,673 | |
Provident Group, Flagship Properties LLC, Louisiana State University Nicholson Gateway Project, Series A, 5.00%, 7/01/46 | | | 6,500,000 | | | | 6,972,030 | |
Louisiana State Transportation Authority Revenue, Refunding, Series A, 5.00%, 8/15/38 | | | 4,500,000 | | | | 5,025,105 | |
Louisiana State Unclaimed Property Special Revenue,I-49 North Project, 5.00%, 9/01/33 | | | 5,860,000 | | | | 6,531,146 | |
| | | | | | | | |
franklintempleton.com | | | | | | Annual Report | | 113 |
FRANKLINTAX-FREE TRUST
STATEMENT OF INVESTMENTS
Franklin LouisianaTax-Free Income Fund(continued)
| | | | | | | | |
| | | Principal
Amount | | | Value | |
Municipal Bonds(continued) | | | | | | | | |
Louisiana(continued) | | | | | | | | |
Louisiana State University and Agricultural and Mechanical College Revenue, | | | | | | | | |
Board of Supervisors, Auxiliary, 5.00%, 7/01/37 | | $ | 4,000,000 | | | | $ 4,401,920 | |
Board of Supervisors, Auxiliary, Refunding, 5.00%, 7/01/29 | | | 1,000,000 | | | | 1,134,910 | |
Board of Supervisors, Auxiliary, Refunding, 5.00%, 7/01/30 | | | 1,040,000 | | | | 1,178,070 | |
Board of Supervisors, Auxiliary, Refunding, 5.00%, 7/01/34 | | | 1,000,000 | | | | 1,125,830 | |
Board of Supervisors, Auxiliary, Refunding, Series A, 5.00%, 7/01/40 | | | 4,500,000 | | | | 4,979,025 | |
Board of Supervisors, Auxiliary, Series A,Pre-Refunded, 5.00%, 7/01/40 | | | 5,000,000 | | | | 5,220,550 | |
Natchitoches Parish School District No. 9 GO, School, AGMC Insured, 5.00%, 3/01/38 | | | 1,440,000 | | | | 1,651,262 | |
New Orleans Aviation Board Revenue, General Airport, North Terminal Project, Series A, 5.00%, 1/01/48 | | | 10,000,000 | | | | 11,083,100 | |
New Orleans Sewage Service Revenue, Assured Guaranty,Pre-Refunded, 6.25%, 6/01/29 | | | 500,000 | | | | 505,640 | |
Port of New Orleans Board of Commissioners Port Facility Revenue, Series A, AGMC Insured, 5.00%, 4/01/48 | | | 2,750,000 | | | | 3,076,562 | |
Ruston Sales Tax Revenue, AGMC Insured, 5.00%, 6/01/35 | | | 1,085,000 | | | | 1,219,280 | |
Shreveport GO,Pre-Refunded, 5.00%, 8/01/29 | | | 4,790,000 | | | | 5,167,260 | |
Shreveport Limited Obligation Revenue, Independence Stadium Project, Refunding, BAM Insured, 5.00%, 3/01/27 | | | 1,500,000 | | | | 1,741,050 | |
Shreveport Water and Sewer Revenue, Series B, 5.00%, 12/01/41 | | | 4,000,000 | | | | 4,388,760 | |
St. Tammany Parish Hospital Service District No. 1 Hospital Revenue, St. Tammany Parish Hospital Project, | | | | | | | | |
Refunding, Series A, 5.00%, 7/01/48 | | | 5,000,000 | | | | 5,522,450 | |
St. Tammany Parish Utilities Revenue, | | | | | | | | |
Series B,Pre-Refunded, 5.50%, 8/01/35 | | | 2,650,000 | | | | 2,790,635 | |
Series B,Pre-Refunded, 5.00%, 8/01/44 | | | 3,290,000 | | | | 3,441,801 | |
Terrebonne Levee and Conservation District Public Improvement Sales Tax Revenue, 5.00%, 7/01/38 | | | 2,000,000 | | | | 2,208,740 | |
Terrebonne Parish Sales and Use Tax Revenue, Morganza Levee Improvement, Series ST, AGMC Insured, | | | | | | | | |
Pre-Refunded, 5.00%, 4/01/32 | | | 2,265,000 | | | | 2,419,609 | |
| | | | | | | | |
| | | | | | | 353,706,133 | |
| | | | | | | | |
U.S. Territories 1.2% | | | | | | | | |
Puerto Rico 1.2% | | | | | | | | |
aPuerto Rico Electric Power Authority Power Revenue, Series WW, 5.25%, 7/01/33 | | | 6,450,000 | | | | 4,426,313 | |
| | | | | | | | |
Total Municipal Bonds before Short Term Investments (Cost $348,129,725) | | | | | | | 358,132,446 | |
| | | | | | | | |
| | |
Short Term Investments (Cost $6,100,000) 1.7% | | | | | | | | |
Municipal Bonds 1.7% | | | | | | | | |
Louisiana 1.7% | | | | | | | | |
bEast Baton Rouge Parish PCR, Exxon Project, Refunding, Daily VRDN and Put, 1.73%, 11/01/19 | | | 6,100,000 | | | | 6,100,000 | |
| | | | | | | | |
Total Investments (Cost $354,229,725) 99.0% | | | | | | | 364,232,446 | |
Other Assets, less Liabilities 1.0% | | | | | | | 3,769,236 | |
| | | | | | | | |
Net Assets 100.0% | | | | | | | $368,001,682 | |
| | | | | | | | |
See Abbreviations on page 183.
aSee Note 7 regarding defaulted securities.
bVariable rate demand notes (VRDNs) are obligations which contain a floating or variable interest rate adjustment formula and an unconditional right of demand to receive payment of the principal balance plus accrued interest at specified dates. Unless otherwise noted, the coupon rate is determined based on factors including supply and demand, underlying credit, tax treatment, and current short term rates. The coupon rate shown represents the rate at period end.
| | | | | | |
114 | | Annual Report | | | The accompanying notes are an integral part of these financial statements. | | franklintempleton.com |
FRANKLIN TAX-FREE TRUST
Financial Highlights
Franklin MarylandTax-Free Income Fund
| | | | |
| | | Year Ended
February 28,
2019a | |
| |
Class A | | | | |
| |
Per share operating performance | | | | |
(for a share outstanding throughout the year) | | | | |
| |
| Net asset value, beginning of year | | | $10.76 | |
| | | | |
| |
Income from investment operationsb: | | | | |
| |
Net investment incomec | | | 0.15 | |
| |
Net realized and unrealized gains (losses) | | | 0.04 | |
| | | | |
| |
Total from investment operations | | | 0.19 | |
| | | | |
| |
Less distributions from net investment income | | | (0.15) | |
| | | | |
| |
Net asset value, end of year | | | $10.80 | |
| | | | |
| |
Total returnd | | | 1.84% | |
| |
Ratios to average net assetse | | | | |
| |
Expensesf | | | 0.88% | |
| |
Net investment income | | | 2.95% | |
| |
Supplemental data | | | | |
| |
Net assets, end of year (000’s) | | | $26,572 | |
| |
Portfolio turnover rate | | | 5.33% | |
aFor the period September 10, 2018 (effective date) to February 28, 2019.
bThe amount shown for a share outstanding throughout the period may not correlate with the Statement of Operations for the period due to the timing of sales and repurchases of the Fund’s shares in relation to income earned and/or fluctuating fair value of the investments of the Fund.
cBased on average daily shares outstanding.
dTotal return does not reflect sales commissions or contingent deferred sales charges, if applicable, and is not annualized for periods less than one year.
eRatios are annualized for periods less than one year.
fBenefit of expense reduction rounds to less than 0.01%.
| | | | | | | | |
franklintempleton.com | | | | The accompanying notes are an integral part of these financial statements. | | | Annual Report | | 115 |
FRANKLIN TAX-FREE TRUST
FINANCIAL HIGHLIGHTS
Franklin Maryland Tax-Free Income Fund(continued)
| | | | | | | | | | | | | | | | | | | | |
| | | | | | Year Ended February 28, | | | | |
| | | | |
| | | 2019 | | | 2018 | | | 2017 | | | 2016a | | | 2015 | |
| | | | | |
Class A1 | | | | | | | | | | | | | | | | | | | | |
| | | | | |
Per share operating performance | | | | | | | | | | | | | | | | | | | | |
(for a share outstanding throughout the year) | | | | | | | | | | | | | | | | | | | | |
| | | | | |
| Net asset value, beginning of year | | | $10.76 | | | | $11.10 | | | | $11.35 | | | | $11.55 | | | | $11.20 | |
| | | | | |
Income from investment operationsb: | | | | | | | | | | | | | | | | | | | | |
| | | | | |
Net investment incomec | | | 0.33 | | | | 0.34 | | | | 0.39 | | | | 0.42 | | | | 0.42 | |
| | | | | |
Net realized and unrealized gains (losses) | | | 0.05 | | | | (0.32 | ) | | | (0.24 | ) | | | (0.21 | ) | | | 0.35 | |
| | | | | |
Total from investment operations | | | 0.38 | | | | 0.02 | | | | 0.15 | | | | 0.21 | | | | 0.77 | |
| | | | | |
Less distributions from net investment income | | | (0.34 | ) | | | (0.36 | ) | | | (0.40 | ) | | | (0.41 | ) | | | (0.42) | |
| | | | | |
Net asset value, end of year | | | $10.80 | | | | $10.76 | | | | $11.10 | | | | $11.35 | | | | $11.55 | |
| | | | | |
Total returnd | | | 3.59% | | | | 0.13% | | | | 1.31% | | | | 1.88% | | | | 6.94% | |
| | | | | |
Ratios to average net assets | | | | | | | | | | | | | | | | | | | | |
| | | | | |
Expenses | | | 0.73% | e | | | 0.70% | | | | 0.67% | | | | 0.67% | | | | 0.67% | |
| | | | | |
Net investment income | | | 3.10% | | | | 3.07% | | | | 3.47% | | | | 3.70% | | | | 3.63% | |
| | | | | |
Supplemental data | | | | | | | | | | | | | | | | | | | | |
| | | | | |
Net assets, end of year (000’s) | | | $279,750 | | | | $319,120 | | | | $351,933 | | | | $369,661 | | | | $393,022 | |
| | | | | |
Portfolio turnover rate | | | 5.33% | | | | 11.36% | | | | 33.34% | | | | 9.77% | | | | 15.88% | |
aFor the year ended February 29.
bThe amount shown for a share outstanding throughout the period may not correlate with the Statement of Operations for the period due to the timing of sales and repurchases of the Fund’s shares in relation to income earned and/or fluctuating fair value of the investments of the Fund.
cBased on average daily shares outstanding.
dTotal return does not reflect sales commissions or contingent deferred sales charges , if applicable.
eBenefit of expense reduction rounds to less than 0.01%.
| | | | | | |
116 | | Annual Report | | | The accompanying notes are an integral part of these financial statements. | | franklintempleton.com |
FRANKLIN TAX-FREE TRUST
FINANCIAL HIGHLIGHTS
Franklin Maryland Tax-Free Income Fund(continued)
| | | | | | | | | | | | | | | | | | | | |
| | | Year Ended February 28, | |
| | | | |
| | | 2019 | | | 2018 | | | 2017 | | | 2016a | | | 2015 | |
| |
Class C | | | | | | | | | | | | | | | | | | | | |
| | | | | |
Per share operating performance | | | | | | | | | | | | | | | | | | | | |
(for a share outstanding throughout the year) | | | | | | | | | | | | | | | | | | | | |
| | | | | |
Net asset value, beginning of year | | | $10.98 | | | | $11.31 | | | | $11.56 | | | | $11.75 | | | | $11.39 | |
| | | | |
| | | | | |
Income from investment operationsb: | | | | | | | | | | | | | | | | | | | | |
| | | | | |
Net investment incomec | | | 0.28 | | | | 0.28 | | | | 0.34 | | | | 0.36 | | | | 0.36 | |
| | | | | |
Net realized and unrealized gains (losses) | | | 0.04 | | | | (0.32 | ) | | | (0.25 | ) | | | (0.20 | ) | | | 0.35 | |
| | | | |
| | | | | |
Total from investment operations | | | 0.32 | | | | (0.04 | ) | | | 0.09 | | | | 0.16 | | | | 0.71 | |
| | | | |
| | | | | |
Less distributions from net investment income | | | (0.28 | ) | | | (0.29 | ) | | | (0.34 | ) | | | (0.35 | ) | | | (0.35) | |
| | | | |
| | | | | |
Net asset value, end of year | | | $11.02 | | | | $10.98 | | | | $11.31 | | | | $11.56 | | | | $11.75 | |
| | | | |
| | | | | |
Total returnd | | | 2.94% | | | | (0.34)% | | | | 0.72% | | | | 1.38% | | | | 6.33% | |
| | | | | |
Ratios to average net assets | | | | | | | | | | | | | | | | | | | | |
| | | | | |
Expenses | | | 1.28% | e | | | 1.25% | | | | 1.22% | | | | 1.22% | | | | 1.22% | |
| | | | | |
Net investment income | | | 2.55% | | | | 2.52% | | | | 2.92% | | | | 3.15% | | | | 3.08% | |
| | | | | |
Supplemental data | | | | | | | | | | | | | | | | | | | | |
| | | | | |
Net assets, end of year (000’s) | | | $56,323 | | | | $92,553 | | | | $115,011 | | | | $117,167 | | | | $125,328 | |
| | | | | |
Portfolio turnover rate | | | 5.33% | | | | 11.36% | | | | 33.34% | | | | 9.77% | | | | 15.88% | |
aFor the year ended February 29.
bThe amount shown for a share outstanding throughout the period may not correlate with the Statement of Operations for the period due to the timing of sales and repurchases of the Fund’s shares in relation to income earned and/or fluctuating fair value of the investments of the Fund.
cBased on average daily shares outstanding.
dTotal return does not reflect sales commissions or contingent deferred sales charges, if applicable.
eBenefit of expense reduction rounds to less than 0.01%.
| | | | | | | | |
franklintempleton.com | | | | The accompanying notes are an integral part of these financial statements. | | | Annual Report | | 117 |
FRANKLIN TAX-FREE TRUST
FINANCIAL HIGHLIGHTS
Franklin Maryland Tax-Free Income Fund(continued)
| | | | | | |
| | | Year Ended February 28, |
| | | 2019 | | | 2018a |
| | |
Class R6 | | | | | | |
| | |
Per share operating performance | | | | | | |
(for a share outstanding throughout the year) | | | | | | |
| | |
Net asset value, beginning of year | | | $10.78 | | | $11.05 |
| | |
Income from investment operationsb: | | | | | | |
| | |
Net investment incomec | | | 0.35 | | | 0.21 |
| | |
Net realized and unrealized gains (losses) | | | 0.04 | | | (0.27) |
| | |
Total from investment operations | | | 0.39 | | | (0.06) |
| | |
Less distributions from net investment income | | | (0.35 | ) | | (0.21) |
| | |
Net asset value, end of year | | | $10.82 | | | $10.78 |
| | |
Total returnd | | | 3.71% | | | (0.58)% |
| | |
Ratios to average net assetse | | | | | | |
| | |
Expenses before waiver and payments by affiliates | | | 0.61% | | | 0.62% |
| | |
Expenses net of waiver and payments by affiliates | | | 0.58% | f | | 0.56% |
| | |
Net investment income | | | 3.25% | | | 3.21% |
| | |
Supplemental data | | | | | | |
| | |
Net assets, end of year (000’s) | | | $1,753 | | | $1,376 |
| | |
Portfolio turnover rate | | | 5.33% | | | 11.36% |
aFor the period August 1, 2017 (effective date) to February 28, 2018.
bThe amount shown for a share outstanding throughout the period may not correlate with the Statement of Operations for the period due to the timing of sales and repurchases of the Fund’s shares in relation to income earned and/or fluctuating fair value of the investments of the Fund.
cBased on average daily shares outstanding.
dTotal return is not annualized for periods less than one year.
eRatios are annualized for periods less than one year.
fBenefit of expense reduction rounds to less than 0.01%.
| | | | | | |
118 | | Annual Report | | | The accompanying notes are an integral part of these financial statements. | | franklintempleton.com |
FRANKLIN TAX-FREE TRUST
FINANCIAL HIGHLIGHTS
Franklin Maryland Tax-Free Income Fund(continued)
| | | | | | | | | | | | | | | | | | | | |
| | | Year Ended February 28, | |
| | | | |
| | | 2019 | | | 2018 | | | 2017 | | | 2016a | | | 2015 | |
| |
| | | | | |
Advisor Class | | | | | | | | | | | | | | | | | | | | |
| | | | | |
Per share operating performance | | | | | | | | | | | | | | | | | | | | |
(for a share outstanding throughout the year) | | | | | | | | | | | | | | | | | | | | |
| | | | | |
Net asset value, beginning of year | | | $10.77 | | | | $11.11 | | | | $11.35 | | | | $11.56 | | | | $11.20 | |
| | | | |
| | | | | |
Income from investment operationsb: | | | | | | | | | | | | | | | | | | | | |
| | | | | |
Net investment incomec | | | 0.34 | | | | 0.35 | | | | 0.41 | | | | 0.43 | | | | 0.43 | |
| | | | | |
Net realized and unrealized gains (losses) | | | 0.05 | | | | (0.32 | ) | | | (0.24 | ) | | | (0.22 | ) | | | 0.36 | |
| | | | |
| | | | | |
Total from investment operations | | | 0.39 | | | | 0.03 | | | | 0.17 | | | | 0.21 | | | | 0.79 | |
| | | | |
| | | | | |
Less distributions from net investment income | | | (0.35 | ) | | | (0.37 | ) | | | (0.41 | ) | | | (0.42 | ) | | | (0.43) | |
| | | | |
| | | | | |
Net asset value, end of year | | | $10.81 | | | | $10.77 | | | | $11.11 | | | | $11.35 | | | | $11.56 | |
| | | | |
| | | | | |
Total return | | | 3.68% | | | | 0.22% | | | | 1.50% | | | | 1.90% | | | | 7.13% | |
| | | | | |
Ratios to average net assets | | | | | | | | | | | | | | | | | | | | |
| | | | | |
Expenses | | | 0.63% | d | | | 0.60% | | | | 0.57% | | | | 0.57% | | | | 0.57% | |
| | | | | |
Net investment income | | | 3.20% | | | | 3.17% | | | | 3.57% | | | | 3.80% | | | | 3.73% | |
| | | | | |
Supplemental data | | | | | | | | | | | | | | | | | | | | |
| | | | | |
Net assets, end of year (000’s) | | | $44,264 | | | | $40,532 | | | | $42,625 | | | | $28,464 | | | | $27,131 | |
| | | | | |
Portfolio turnover rate | | | 5.33% | | | | 11.36% | | | | 33.34% | | | | 9.77% | | | | 15.88% | |
aFor the year ended February 29.
bThe amount shown for a share outstanding throughout the period may not correlate with the Statement of Operations for the period due to the timing of sales and repurchases of the Fund’s shares in relation to income earned and/or fluctuating fair value of the investments of the Fund.
cBased on average daily shares outstanding.
dBenefit of expense reduction rounds to less than 0.01%.
| | | | | | | | |
franklintempleton.com | | | | The accompanying notes are an integral part of these financial statements. | | | Annual Report | | 119 |
FRANKLIN TAX-FREE TRUST
Statement of Investments, February 28, 2019
Franklin MarylandTax-Free Income Fund
| | | | | | | | |
| | | Principal
Amount | | | Value | |
| Municipal Bonds 97.8% | | | | | | | | |
Maryland 93.3% | | | | | | | | |
Annapolis GO, Public Improvements,Pre-Refunded, 5.00%, 8/01/31 | | | $ 1,250,000 | | | | $ 1,350,000 | |
Anne Arundel County GO, | | | | | | | | |
Consolidated General Improvements, Refunding, 5.00%, 4/01/33 | | | 3,140,000 | | | | 3,500,692 | |
Consolidated Water and Sewer, 5.00%, 4/01/41 | | | 12,620,000 | | | | 13,313,090 | |
aAnne Arundel County MFHR, Glenview Gardens Apartments Project, Mandatory Put, SPA Freddie Mac,
5.00%, 1/01/27 | | | 1,920,000 | | | | 1,996,877 | |
Baltimore County GO, | | | | | | | | |
Metropolitan District, 78th Issue, Refunding, 5.00%, 2/01/39 | | | 2,900,000 | | | | 3,302,056 | |
Metropolitan District, 78th Issue, Refunding, 5.00%, 2/01/41 | | | 2,900,000 | | | | 3,288,977 | |
Baltimore Revenue, | | | | | | | | |
Mayor and City Council of Baltimore, Wastewater Projects, Series A, 5.00%, 7/01/41 | | | 14,435,000 | | | | 15,319,865 | |
Mayor and City Council of Baltimore, Wastewater Projects, Subordinate, Series A, 5.00%, 7/01/46 | | | 5,000,000 | | | | 5,614,100 | |
Mayor and City Council of Baltimore, Water Projects, Refunding, Series B, 5.00%, 7/01/38 | | | 5,000,000 | | | | 5,590,950 | |
Mayor and City Council of Baltimore, Water Projects, Series A, 5.00%, 7/01/38 | | | 8,930,000 | | | | 9,985,437 | |
Mayor and City Council of Baltimore, Water Projects, Series A, 5.00%, 7/01/41 | | | 7,845,000 | | | | 8,325,898 | |
Mayor and City Council of Baltimore, Water Projects, Subordinate, Series A,Pre-Refunded, 5.375%, 7/01/34 | | | 750,000 | | | | 759,120 | |
Mayor and City Council of Baltimore, Water Projects, Subordinate, Series A,Pre-Refunded, 5.75%, 7/01/39 | | | 1,250,000 | | | | 1,266,713 | |
Howard County Housing Commission Revenue, | | | | | | | | |
Gateway Village Apartments, 4.00%, 6/01/46 | | | 2,000,000 | | | | 2,014,840 | |
The Verona at Oakland Mills Project, 5.00%, 10/01/28 | | | 10,000,000 | | | | 11,027,000 | |
Woodfield Oxford Square Apartments, 5.00%, 12/01/46 | | | 5,000,000 | | | | 5,494,300 | |
Maryland Environmental Service Revenue,Mid-Shore II Regional Landfill Project, Refunding, 5.00%, 11/01/30 | | | 3,935,000 | | | | 4,139,108 | |
Maryland Stadium Authority Revenue, Baltimore City Public Schools, Construction and Revitalization Program, 5.00%, 5/01/46 | | | 10,085,000 | | | | 11,210,688 | |
Maryland State Community Development Administration Local Government Infrastructure Revenue, | | | | | | | | |
Senior Obligations, SeriesA-1, 4.00%, 6/01/47 | | | 2,300,000 | | | | 2,356,120 | |
Senior Obligations, SeriesA-1, 5.00%, 6/01/48 | | | 1,310,000 | | | | 1,475,479 | |
Subordinate Obligations, SeriesA-2, 5.00%, 6/01/34 | | | 3,500,000 | | | | 3,872,715 | |
Maryland State EDC, PCR, Potomac Electric Project, Refunding, 6.20%, 9/01/22 | | | 10,000,000 | | | | 10,032,600 | |
Maryland State EDC Student Housing Revenue, | | | | | | | | |
Salisbury University Project, Refunding, 5.00%, 6/01/34 | | | 2,040,000 | | | | 2,138,206 | |
Senior, Frostburg State University Project, Refunding, 5.00%, 10/01/33 | | | 5,000,000 | | | | 5,310,050 | |
Senior, Morgan State University Project, Refunding, 5.00%, 7/01/27 | | | 4,750,000 | | | | 5,003,650 | |
Senior, Morgan State University Project, Refunding, 5.00%, 7/01/34 | | | 2,150,000 | | | | 2,224,347 | |
Senior, Towson University Project, 5.00%, 7/01/27 | | | 1,145,000 | | | | 1,236,165 | |
University of Maryland, College Park Projects, Refunding, AGMC Insured, 5.00%, 6/01/35 | | | 4,225,000 | | | | 4,803,698 | |
University of Maryland, College Park Projects, Refunding, AGMC Insured, 5.00%, 6/01/43 | | | 3,305,000 | | | | 3,686,066 | |
University Village at Sheppard Pratt, 5.00%, 7/01/27 | | | 1,500,000 | | | | 1,578,165 | |
University Village at Sheppard Pratt, 5.00%, 7/01/33 | | | 2,495,000 | | | | 2,588,363 | |
Maryland State Health and Higher Educational Facilities Authority Revenue, | | | | | | | | |
Adventist HealthCare Issue, Series A, 5.50%, 1/01/46 | | | 8,000,000 | | | | 8,886,960 | |
Anne Arundel Health System Issue, Refunding, 5.00%, 7/01/39 | | | 10,000,000 | | | | 10,931,500 | |
Anne Arundel Health System Issue, Series A,Pre-Refunded, 6.75%, 7/01/29 | | | 2,000,000 | | | | 2,032,780 | |
Anne Arundel Health System Issue, Series A,Pre-Refunded, 6.75%, 7/01/39 | | | 2,000,000 | | | | 2,032,780 | |
Charlestown Community Issue, Refunding, Series A, 5.00%, 1/01/45 | | | 4,170,000 | | | | 4,554,182 | |
Goucher College Issue, Refunding, Series A, 5.00%, 7/01/34 | | | 1,500,000 | | | | 1,622,415 | |
Goucher College Issue, Refunding, Series A, 5.00%, 7/01/44 | | | 7,470,000 | | | | 8,198,624 | |
Helix Health Issue, AMBAC Insured, ETM, 5.00%, 7/01/27 | | | 10,345,000 | | | | 11,831,680 | |
| | | | | | |
120 | | Annual Report | | | | franklintempleton.com |
FRANKLIN TAX-FREE TRUST
STATEMENT OF INVESTMENTS
Franklin MarylandTax-Free Income Fund(continued)
| | | | | | | | |
| | | Principal
Amount | | | Value |
Municipal Bonds(continued) | | | | | | | | |
Maryland(continued) | | | | | | | | |
Maryland State Health and Higher Educational Facilities Authority Revenue, (continued) | | | | | | | | |
Johns Hopkins Medical Institutions Utilities Program Issue, Refunding, Series A, 5.00%, 5/15/37 | | | $10,000,000 | | | $ | 11,397,300 | |
The Johns Hopkins University Issue, Series A, 5.00%, 7/01/37 | | | 5,000,000 | | | | 5,485,300 | |
The Johns Hopkins University Issue, Series A, 5.00%, 7/01/41 | | | 15,000,000 | | | | 16,450,800 | |
The Johns Hopkins University Issue, Series B, 5.00%, 7/01/38 | | | 5,000,000 | | | | 5,576,250 | |
LifeBridge Health Issue, Refunding, 5.00%, 7/01/44 | | | 2,000,000 | | | | 2,213,260 | |
LifeBridge Health Issue, Refunding, 5.00%, 7/01/47 | | | 4,000,000 | | | | 4,391,480 | |
Loyola University Maryland, Refunding, 5.00%, 10/01/45 | | | 2,250,000 | | | | 2,522,273 | |
Loyola University Maryland, Refunding, Series A, 5.00%, 10/01/39 | | | 5,275,000 | | | | 5,728,175 | |
Maryland Institute College of Art Issue, Refunding, 5.00%, 6/01/29 | | | 1,000,000 | | | | 1,081,050 | |
Maryland Institute College of Art Issue, Refunding, 4.00%, 6/01/42 | | | 5,325,000 | | | | 5,325,799 | |
Medstar Health Issue, Series A, 5.00%, 8/15/38 | | | 5,000,000 | | | | 5,444,100 | |
Medstar Health Issue, Series A, 5.00%, 5/15/45 | | | 5,000,000 | | | | 5,498,350 | |
Meritus Medical Center Issue, Refunding, 5.00%, 7/01/45 | | | 8,535,000 | | | | 9,151,654 | |
Parking, The Johns Hopkins Medical Institutions Parking Facilities Issue, AMBAC Insured, 5.00%, 7/01/27 | | | 655,000 | | | | 656,729 | |
Parking, The Johns Hopkins Medical Institutions Parking Facilities Issue, AMBAC Insured, 5.00%, 7/01/34 | | | 5,000,000 | | | | 5,012,700 | |
Parking, The Johns Hopkins Medical Institutions Parking Facilities Issue, Refunding, Series B, AMBAC Insured, 5.00%, 7/01/38 | | | 6,200,000 | | | | 6,203,968 | |
Peninsula Regional Medical Center Issue, Refunding, 5.00%, 7/01/45 | | | 6,330,000 | | | | 6,858,618 | |
Trinity Health Credit Group, 5.00%, 12/01/46 | | | 1,680,000 | | | | 1,895,242 | |
University of Maryland Medical System Issue, Refunding, 5.00%, 7/01/35 | | | 2,100,000 | | | | 2,343,516 | |
University of Maryland Medical System Issue, Refunding, Series B, 5.00%, 7/01/39 | | | 10,000,000 | | | | 11,167,700 | |
University of Maryland Medical System Issue, Series D, 4.00%, 7/01/48 | | | 5,000,000 | | | | 5,086,850 | |
Maryland State Industrial Development Financing Authority EDR, | | | | | | | | |
McDonogh School Facilities, Refunding, 4.00%, 9/01/43 | | | 1,100,000 | | | | 1,128,567 | |
McDonogh School Facilities, Refunding, 4.00%, 9/01/48 | | | 610,000 | | | | 619,650 | |
Montgomery County GO, | | | | | | | | |
Consolidated Public Improvement, Refunding, Series A, 4.00%, 11/01/20 | | | 8,000,000 | | | | 8,129,360 | |
Consolidated Public Improvement, Refunding, Series A, 4.00%, 12/01/33 | | | 7,000,000 | | | | 7,429,030 | |
Montgomery County Revenue, | | | | | | | | |
Department of Liquor Control, Refunding, Series A, 5.00%, 4/01/27 | | | 1,625,000 | | | | 1,730,950 | |
Department of Liquor Control, Refunding, Series A, 5.00%, 4/01/28 | | | 2,230,000 | | | | 2,372,586 | |
Department of Liquor Control, Refunding, Series A, 5.00%, 4/01/31 | | | 2,470,000 | | | | 2,625,314 | |
Department of Liquor Control, Series A, 5.00%, 4/01/30. | | | 1,935,000 | | | | 2,057,486 | |
Montgomery County Water Quality Protection Charge Revenue, | | | | | | | | |
Series A, 5.00%, 4/01/30 | | | 1,855,000 | | | | 1,916,252 | |
Series A, 5.00%, 4/01/31 | | | 1,240,000 | | | | 1,280,548 | |
Prince George’s County COP, Public Safety Communications Center, 5.00%, 10/01/30 | | | 2,060,000 | | | | 2,159,642 | |
Prince George’s County GO, Consolidated Public Improvement, Series A, 4.00%, 7/15/35 | | | 11,405,000 | | | | 12,323,102 | |
Washington Suburban Sanitary District GO, | | | | | | | | |
Montgomery and Prince George’s Counties, Consolidated Public Improvement, Second Series, 5.00%, 6/01/37 | | | 5,000,000 | | | | 5,748,200 | |
Montgomery and Prince George’s Counties, Consolidated Public Improvement, Second Series, 4.00%, 6/01/43 | | | 8,070,000 | | | | 8,382,067 | |
| | | | | | | | |
| | |
| | | | | | | 381,290,124 | |
| | | | | | | | |
| | | | | | | | |
franklintempleton.com | | | | | | Annual Report | | 121 |
FRANKLIN TAX-FREE TRUST
STATEMENT OF INVESTMENTS
Franklin MarylandTax-Free Income Fund(continued)
| | | | | | | | |
| | | Principal
Amount | | | Value |
| Municipal Bonds(continued) | | | | | | | | |
District of Columbia 2.8% | | | | | | | | |
Washington Metropolitan Area Transit Authority Gross Revenue, | | | | | | | | |
Transit, Series A,Pre-Refunded, 5.125%, 7/01/32 | | $ | 2,500,000 | | | $ | 2,529,200 | |
Transit, Series B, 5.00%, 7/01/42 | | | 8,000,000 | | | | 9,095,360 | |
| | | | | | | | |
| | |
| | | | | | | 11,624,560 | |
| | | | | | | | |
U.S. Territories 1.7% | | | | | | | | |
Puerto Rico 1.7% | | | | | | | | |
bPuerto Rico Electric Power Authority Power Revenue, | | | | | | | | |
Series WW, 5.50%, 7/01/38. | | | 5,000,000 | | | | 3,443,750 | |
Series XX, 5.25%, 7/01/40 | | | 5,000,000 | | | | 3,431,250 | |
| | | | | | | | |
| | |
| | | | | | | 6,875,000 | |
| | | | | | | | |
Total Municipal Bonds (Cost $389,896,358) 97.8% | | | | | | | 399,789,684 | |
Other Assets, less Liabilities 2.2% | | | | | | | 8,872,666 | |
| | | | | | | | |
Net Assets 100.0% | | | | | | $ | 408,662,350 | |
| | | | | | | | |
See Abbreviations on page 183.
aThe maturity date shown represents the mandatory put date.
bSee Note 7 regarding defaulted securities.
| | | | | | |
122 | | Annual Report | | | The accompanying notes are an integral part of these financial statements. | | franklintempleton.com |
FRANKLIN TAX-FREE TRUST
Financial Highlights
Franklin MissouriTax-Free Income Fund
| | |
| | | Year Ended
February 28,
2019a |
| |
Class A | | |
| |
Per share operating performance | | |
(for a share outstanding throughout the year) | | |
| |
Net asset value, beginning of year | | $11.41 |
| |
Income from investment operationsb: | | |
| |
Net investment incomec | | 0.16 |
| |
Net realized and unrealized gains (losses) | | 0.06 |
| |
Total from investment operations | | 0.22 |
| |
Less distributions from net investment income | | (0.16) |
| |
Net asset value, end of year | | $11.47 |
| |
Total returnd | | 1.98% |
| |
Ratios to average net assetse | | |
| |
Expensesf | | 0.84% |
| |
Net investment income | | 2.96% |
| |
Supplemental data | | |
| |
Net assets, end of year (000’s) | | $63,400 |
| |
Portfolio turnover rate | | 9.79% |
aFor the period September 10, 2018 (effective date) to February 28, 2019.
bThe amount shown for a share outstanding throughout the period may not correlate with the Statement of Operations for the period due to the timing of sales and repurchases of the Fund’s shares in relation to income earned and/or fluctuating fair value of the investments of the Fund.
cBased on average daily shares outstanding.
dTotal return does not reflect sales commissions or contingent deferred sales charges, if applicable, and is not annualized for periods less than one year.
eRatios are annualized for periods less than one year.
fBenefit of expense reduction rounds to less than 0.01%.
| | | | | | | | |
franklintempleton.com | | | | The accompanying notes are an integral part of these financial statements. | | | Annual Report | | 123 |
FRANKLIN TAX-FREE TRUST
FINANCIAL HIGHLIGHTS
Franklin MissouriTax-Free Income Fund(continued)
| | | | | | | | | | | | | | | | | | | | |
| | | | | | Year Ended February 28, | | | | |
| | | | |
| | | 2019 | | | 2018 | | | 2017 | | | 2016a | | | 2015 | |
| | | | | |
Class A1 | | | | | | | | | | | | | | | | | | | | |
| | | | | |
Per share operating performance | | | | | | | | | | | | | | | | | | | | |
(for a share outstanding throughout the year) | | | | | | | | | | | | | | | | | | | | |
| | | | | |
| Net asset value, beginning of year | | | $11.38 | | | | $11.74 | | | | $12.05 | | | | $12.21 | | | | $11.88 | |
| | | | | |
Income from investment operationsb: | | | | | | | | | | | | | | | | | | | | |
| | | | | |
Net investment incomec | | | 0.35 | | | | 0.36 | | | | 0.42 | | | | 0.45 | | | | 0.47 | |
| | | | | |
Net realized and unrealized gains (losses) | | | 0.09 | | | | (0.34 | ) | | | (0.30 | ) | | | (0.18 | ) | | | 0.32 | |
| | | | | |
Total from investment operations | | | 0.44 | | | | 0.02 | | | | 0.12 | | | | 0.27 | | | | 0.79 | |
| | | | | |
Less distributions from net investment income | | | (0.36 | ) | | | (0.38 | ) | | | (0.43 | ) | | | (0.43 | ) | | | (0.46) | |
| | | | | |
Net asset value, end of year | | | $11.46 | | | | $11.38 | | | | $11.74 | | | | $12.05 | | | | $12.21 | |
| | | | | |
Total returnd | | | 3.90% | | | | 0.12% | | | | 0.94% | | | | 2.26% | | | | 6.80% | |
| | | | | |
Ratios to average net assets | | | | | | | | | | | | | | | | | | | | |
| | | | | |
Expenses | | | 0.69% | e | | | 0.66% | | | | 0.65% | | | | 0.64% | | | | 0.63% | |
| | | | | |
Net investment income | | | 3.11% | | | | 3.05% | | | | 3.52% | | | | 3.72% | | | | 3.87% | |
| | | | | |
Supplemental data | | | | | | | | | | | | | | | | | | | | |
| | | | | |
Net assets, end of year (000’s) | | | $700,839 | | | | $793,226 | | | | $873,204 | | | | $880,848 | | | | $890,228 | |
| | | | | |
Portfolio turnover rate | | | 9.79% | | | | 20.04% | | | | 11.66% | | | | 7.97% | | | | 4.73% | |
aFor the year ended February 29.
bThe amount shown for a share outstanding throughout the period may not correlate with the Statement of Operations for the period due to the timing of sales and repurchases of the Fund’s shares in relation to income earned and/or fluctuating fair value of the investments of the Fund.
cBased on average daily shares outstanding.
dTotal return does not reflect sales commissions or contingent deferred sales charges, if applicable.
eBenefit of expense reduction rounds to less than 0.01%.
| | | | | | |
124 | | Annual Report | | | The accompanying notes are an integral part of these financial statements. | | franklintempleton.com |
FRANKLIN TAX-FREE TRUST
FINANCIAL HIGHLIGHTS
Franklin MissouriTax-Free Income Fund(continued)
| | | | | | | | | | | | | | | | | | | | |
| | | | | | Year Ended February 28, | | | | |
| | | | |
| | | 2019 | | | 2018 | | | 2017 | | | 2016a | | | 2015 | |
| | | | | |
Class C | | | | | | | | | | | | | | | | | | | | |
| | | | | |
Per share operating performance | | | | | | | | | | | | | | | | | | | | |
(for a share outstanding throughout the year) | | | | | | | | | | | | | | | | | | | | |
| | | | | |
| Net asset value, beginning of year | | | $11.49 | | | | $11.86 | | | | $12.17 | | | | $12.32 | | | | $11.98 | |
| | | | | |
Income from investment operationsb: | | | | | | | | | | | | | | | | | | | | |
| | | | | |
Net investment incomec | | | 0.29 | | | | 0.29 | | | | 0.36 | | | | 0.38 | | | | 0.40 | |
| | | | | |
Net realized and unrealized gains (losses) | | | 0.09 | | | | (0.35 | ) | | | (0.31 | ) | | | (0.17 | ) | | | 0.34 | |
| | | | | |
Total from investment operations | | | 0.38 | | | | (0.06 | ) | | | 0.05 | | | | 0.21 | | | | 0.74 | |
| | | | | |
Less distributions from net investment income | | | (0.29 | ) | | | (0.31 | ) | | | (0.36 | ) | | | (0.36 | ) | | | (0.40) | |
| | | | | |
Net asset value, end of year | | | $11.58 | | | | $11.49 | | | | $11.86 | | | | $12.17 | | | | $12.32 | |
| | | | | |
Total returnd | | | 3.37% | | | | (0.53 | )% | | | 0.38% | | | | 1.77% | | | | 6.25% | |
| | | | | |
Ratios to average net assets | | | | | | | | | | | | | | | | | | | | |
| | | | | |
Expenses | | | 1.24% | e | | | 1.21% | | | | 1.20% | | | | 1.19% | | | | 1.18% | |
| | | | | |
Net investment income | | | 2.56% | | | | 2.50% | | | | 2.97% | | | | 3.17% | | | | 3.32% | |
| | | | | |
Supplemental data | | | | | | | | | | | | | | | | | | | | |
| | | | | |
Net assets, end of year (000’s) | | | $108,739 | | | | $149,306 | | | | $169,821 | | | | $167,284 | | | | $166,282 | |
| | | | | |
Portfolio turnover rate | | | 9.79% | | | | 20.04% | | | | 11.66% | | | | 7.97% | | | | 4.73% | |
aFor the year ended February 29.
bThe amount shown for a share outstanding throughout the period may not correlate with the Statement of Operations for the period due to the timing of sales and repurchases of the Fund’s shares in relation to income earned and/or fluctuating fair value of the investments of the Fund.
cBased on average daily shares outstanding.
dTotal return does not reflect sales commissions or contingent deferred sales charges, if applicable.
eBenefit of expense reduction rounds to less than 0.01%.
| | | | | | | | |
franklintempleton.com | | | | The accompanying notes are an integral part of these financial statements. | | | Annual Report | | 125 |
FRANKLIN TAX-FREE TRUST
FINANCIAL HIGHLIGHTS
Franklin MissouriTax-Free Income Fund(continued)
| | | | | | |
| | | Year Ended February 28, |
| | | 2019 | | | 2018a |
| | |
Class R6 | | | | | | |
| | |
Per share operating performance | | | | | | |
(for a share outstanding throughout the year) | | | | | | |
| | |
| Net asset value, beginning of year | | | $11.38 | | | $11.72 |
| | |
Income from investment operationsb: | | | | | | |
| | |
Net investment incomec | | | 0.37 | | | 0.22 |
| | |
Net realized and unrealized gains (losses) | | | 0.09 | | | (0.35) |
| | |
Total from investment operations | | | 0.46 | | | (0.13) |
| | |
Less distributions from net investment income | | | (0.37 | ) | | (0.21) |
| | |
Net asset value, end of year | | | $11.47 | | | $11.38 |
| | |
Total returnd | | | 4.12% | | | (1.11)% |
| | |
Ratios to average net assetse | | | | | | |
| | |
Expenses before waiver and payments by affiliates | | | 0.55% | | | 0.55% |
| | |
Expenses net of waiver and payments by affiliates | | | 0.54% | f | | 0.53% |
| | |
Net investment income | | | 3.26% | | | 3.18% |
| | |
Supplemental data | | | | | | |
| | |
Net assets, end of year (000’s) | | | $18,929 | | | $17,534 |
| | |
Portfolio turnover rate | | | 9.79% | | | 20.04% |
aFor the period August 1, 2017 (effective date) to February 28, 2018.
bThe amount shown for a share outstanding throughout the period may not correlate with the Statement of Operations for the period due to the timing of sales and repurchases of the Fund’s shares in relation to income earned and/or fluctuating fair value of the investments of the Fund.
cBased on average daily shares outstanding.
dTotal return is not annualized for periods less than one year.
eRatios are annualized for periods less than one year.
fBenefit of expense reduction rounds to less than 0.01%.
| | | | | | |
126 | | Annual Report | | | The accompanying notes are an integral part of these financial statements. | | franklintempleton.com |
FRANKLIN TAX-FREE TRUST
FINANCIAL HIGHLIGHTS
Franklin MissouriTax-Free Income Fund(continued)
| | | | | | | | | | | | | | | | | | | | |
| | | | | | Year Ended February 28, | | | | |
| | | | |
| | | 2019 | | | 2018 | | | 2017 | | | 2016a | | | 2015 | |
| | | | | |
Advisor Class | | | | | | | | | | | | | | | | | | | | |
| | | | | |
Per share operating performance | | | | | | | | | | | | | | | | | | | | |
(for a share outstanding throughout the year) | | | | | | | | | | | | | | | | | | | | |
| | | | | |
| Net asset value, beginning of year | | | $11.38 | | | | $11.75 | | | | $12.06 | | | | $12.22 | | | | $11.88 | |
| | | | | |
Income from investment operationsb: | | | | | | | | | | | | | | | | | | | | |
| | | | | |
Net investment incomec | | | 0.37 | | | | 0.37 | | | | 0.44 | | | | 0.46 | | | | 0.48 | |
| | | | | |
Net realized and unrealized gains (losses) | | | 0.09 | | | | (0.35 | ) | | | (0.31 | ) | | | (0.18 | ) | | | 0.34 | |
| | | | | |
Total from investment operations | | | 0.46 | | | | 0.02 | | | | 0.13 | | | | 0.28 | | | | 0.82 | |
| | | | | |
Less distributions from net investment income | | | (0.37 | ) | | | (0.39 | ) | | | (0.44 | ) | | | (0.44 | ) | | | (0.48) | |
| | | | | |
Net asset value, end of year | | | $11.47 | | | | $11.38 | | | | $11.75 | | | | $12.06 | | | | $12.22 | |
| | | | | |
Total return | | | 4.09% | | | | 0.12% | | | | 1.04% | | | | 2.37% | | | | 7.00% | |
| | | | | |
Ratios to average net assets | | | | | | | | | | | | | | | | | | | | |
| | | | | |
Expenses | | | 0.59% | d | | | 0.56% | | | | 0.55% | | | | 0.54% | | | | 0.53% | |
| | | | | |
Net investment income | | | 3.21% | | | | 3.15% | | | | 3.62% | | | | 3.82% | | | | 3.97% | |
| | | | | |
Supplemental data | | | | | | | | | | | | | | | | | | | | |
| | | | | |
Net assets, end of year (000’s) | | | $60,117 | | | | $72,460 | | | | $83,686 | | | | $46,051 | | | | $37,626 | |
| | | | | |
Portfolio turnover rate | | | 9.79% | | | | 20.04% | | | | 11.66% | | | | 7.97% | | | | 4.73% | |
aFor the year ended February 29.
bThe amount shown for a share outstanding throughout the period may not correlate with the Statement of Operations for the period due to the timing of sales and repurchases of the Fund’s shares in relation to income earned and/or fluctuating fair value of the investments of the Fund.
cBased on average daily shares outstanding.
dBenefit of expense reduction rounds to less than 0.01%.
| | | | | | | | |
franklintempleton.com | | | | The accompanying notes are an integral part of these financial statements. | | | Annual Report | | 127 |
FRANKLINTAX-FREE TRUST
Statement of Investments, February 28, 2019
Franklin MissouriTax-Free Income Fund
| | | | | | | | |
| | | Principal
Amount | | | Value | |
| Municipal Bonds 98.5% | | | | | | | | |
Missouri 95.3% | | | | | | | | |
Bi-State Development Agency Missouri-Illinois Metropolitan District Mass Transit Sales Tax Appropriation Revenue, | | | | | | | | |
combined lien, Refunding, Series A, 5.00%, 10/01/33 | | | $14,425,000 | | | | $ 15,950,732 | |
combined lien, Refunding, Series A, 5.00%, 10/01/44 | | | 10,000,000 | | | | 11,006,700 | |
Metrolink Cross County Extension Project, Refunding, Assured Guaranty, 5.00%, 10/01/35 | | | 5,500,000 | | | | 5,595,040 | |
Metrolink Cross County Extension Project, Refunding, Assured Guaranty, 5.00%, 10/01/39 | | | 30,300,000 | | | | 30,821,766 | |
Cape Girardeau County IDA Health Facilities Revenue, | | | | | | | | |
St. Francis Medical Center, Refunding, 5.00%, 6/01/39 | | | 7,110,000 | | | | 7,822,564 | |
St. Francis Medical Center, Refunding, Series A, 5.00%, 6/01/33 | | | 5,000,000 | | | | 5,396,850 | |
St. Francis Medical Center, Refunding, Series A, 5.00%, 6/01/37 | | | 11,000,000 | | | | 11,801,900 | |
St. Francis Medical Center, Series A,Pre-Refunded, 5.75%, 6/01/39 | | | 3,150,000 | | | | 3,181,374 | |
Cape Girardeau County IDA Solid Waste Disposal Revenue, The Procter and Gamble Paper Products Co. Project, 5.30%, 5/15/28 | | | 6,875,000 | | | | 6,887,856 | |
Cape Girardeau County Reorganized School District No.R-2 GO, | | | | | | | | |
Missouri Direct Deposit Program, JacksonR-2 School District, 4.00%, 3/01/32 | | | 1,000,000 | | | | 1,097,380 | |
Missouri Direct Deposit Program, JacksonR-2 School District, 4.00%, 3/01/33 | | | 1,000,000 | | | | 1,091,560 | |
Missouri Direct Deposit Program, JacksonR-2 School District, 5.00%, 3/01/38 | | | 2,195,000 | | | | 2,546,771 | |
Clay County Public School District No. 53 Liberty GO, School Building, 4.00%, 3/01/37 | | | 4,500,000 | | | | 4,724,730 | |
Clay County Reorganization School District No.R-1 Kearney GO, | | | | | | | | |
Direct Deposit Program, School Building, 3.00%, 3/01/34 | | | 1,670,000 | | | | 1,626,480 | |
Direct Deposit Program, School Building, 3.00%, 3/01/35 | | | 1,730,000 | | | | 1,671,163 | |
Direct Deposit Program, School Building, 3.00%, 3/01/36 | | | 1,540,000 | | | | 1,473,780 | |
Direct Deposit Program, School Building, 3.125%, 3/01/37 | | | 1,855,000 | | | | 1,785,011 | |
Curators of the University of Missouri System Facilities Revenue, Refunding, 5.00%, 11/01/27 | | | 1,065,000 | | | | 1,153,640 | |
Ferguson Reorganized School District No.R-2 GO, | | | | | | | | |
St. Louis County, Missouri Direct Deposit Program, 4.00%, 5/01/32 | | | 1,000,000 | | | | 1,078,690 | |
St. Louis County, Missouri Direct Deposit Program, 5.00%, 5/01/38 | | | 2,250,000 | | | | 2,577,825 | |
Fort OsageR-1 School District Jackson County GO, School Building, Missouri Direct Deposit Program, Refunding, 5.50%, 3/01/38 | | | 3,010,000 | | | | 3,660,852 | |
Greene County Reorganized School District No. 2 GO, Willard, School Building, Missouri Direct Deposit Program, 4.00%, 3/01/30 | | | 1,000,000 | | | | 1,100,690 | |
Independence School District GO, | | | | | | | | |
Missouri Direct Deposit Program, Refunding, Series A, 5.00%, 3/01/27 | | | 3,300,000 | | | | 3,402,663 | |
Missouri Direct Deposit Program, Refunding, Series A, 5.00%, 3/01/28 | | | 3,000,000 | | | | 3,093,330 | |
Missouri Direct Deposit Program, Series A, 5.00%, 3/01/29 | | | 3,000,000 | | | | 3,093,330 | |
Jackson County Reorganized School District No. 4 Blue Springs GO, | | | | | | | | |
Improvement, Series A,Pre-Refunded, 5.00%, 3/01/29 | | | 320,000 | | | | 320,000 | |
School Building, Missouri Direct Deposit Program, Series A, 5.50%, 3/01/36 | | | 3,000,000 | | | | 3,709,530 | |
School Building, Missouri Direct Deposit Program, Series A, 5.50%, 3/01/37 | | | 2,000,000 | | | | 2,458,560 | |
Jefferson City School District GO, Missouri Direct Deposit Program, 5.00%, 3/01/38 | | | 6,070,000 | | | | 6,951,485 | |
Joplin IDA Health Facilities Revenue, | | | | | | | | |
Freeman Health System Project, 5.125%, 2/15/26 | | | 6,000,000 | | | | 6,312,300 | |
Freeman Health System Project, 5.00%, 2/15/28 | | | 1,150,000 | | | | 1,203,774 | |
Freeman Health System Project, 5.50%, 2/15/31 | | | 2,055,000 | | | | 2,166,484 | |
Freeman Health System Project, Refunding, 5.00%, 2/15/35 | | | 4,000,000 | | | | 4,313,120 | |
Joplin Schools GO, Direct Deposit Program, Refunding, 4.00%, 3/01/32 | | | 4,000,000 | | | | 4,368,800 | |
Kansas City IDAR, | | | | | | | | |
Downtown Redevelopment District, Refunding, Series A, 5.50%, 9/01/29 | | | 5,000,000 | | | | 5,427,300 | |
Downtown Redevelopment District, Refunding, Series A, 5.50%, 9/01/30 | | | 12,000,000 | | | | 13,025,520 | |
Downtown Redevelopment District, Refunding, Series A, 5.00%, 9/01/32 | | | 3,000,000 | | | | 3,213,270 | |
| | | | | | |
128 | | Annual Report | | | | franklintempleton.com |
FRANKLIN TAX-FREE TRUST
STATEMENT OF INVESTMENTS
Franklin MissouriTax-Free Income Fund(continued)
| | | | | | | | |
| | | Principal
Amount | | | Value | |
Municipal Bonds(continued) | | | | | | | | |
Missouri(continued) | | | | | | | | |
Kansas City Sanitary Sewer System Revenue, | | | | | | | | |
Improvement, Series A, 4.00%, 1/01/35 | | | $ 1,500,000 | | | | $ 1,602,795 | |
Improvement and Refunding, Series A, 5.00%, 1/01/37 | | | 29,210,000 | | | | 30,792,598 | |
Sub Series A, 4.00%, 1/01/42 | | | 5,000,000 | | | | 5,148,050 | |
Kansas City Water Revenue, | | | | | | | | |
Refunding and Improvement, Series A, 5.25%, 12/01/32 | | | 12,725,000 | | | | 12,760,375 | |
Series A, 4.00%, 12/01/41 | | | 4,970,000 | | | | 5,184,257 | |
Lincoln University Auxiliary System Revenue, Subordinate, Assured Guaranty, 5.125%, 6/01/37 | | | 2,325,000 | | | | 2,355,644 | |
Metropolitan St. Louis Sewer District Wastewater System Revenue, | | | | | | | | |
Improvement and Refunding, Series A, 5.00%, 5/01/42 | | | 5,000,000 | | | | 5,720,850 | |
Improvement and Refunding, Series A, 5.00%, 5/01/47 | | | 10,000,000 | | | | 11,396,800 | |
Improvement and Refunding, Series B, 5.00%, 5/01/38 | | | 8,770,000 | | | | 9,982,891 | |
Improvement and Refunding, Series B, 5.00%, 5/01/45 | | | 7,500,000 | | | | 8,378,625 | |
Series C, 5.00%, 5/01/46 | | | 24,700,000 | | | | 27,843,816 | |
Missouri Joint Municipal Electric Utility Commission Power Supply System Revenue, | | | | | | | | |
MoPEP Facilities, 5.00%, 12/01/43 | | | 2,000,000 | | | | 2,243,300 | |
MoPEP Facilities,Pre-Refunded, 5.00%, 1/01/32 | | | 3,600,000 | | | | 3,813,840 | |
MoPEP Facilities,Pre-Refunded, 5.00%, 1/01/37 | | | 3,400,000 | | | | 3,601,960 | |
Missouri State Board of Public Buildings Special Obligation Revenue, Refunding, Series A, 4.00%, 10/01/25 | | | 3,870,000 | | | | 3,926,696 | |
Missouri State Development Finance Board Revenue, Infrastructure Facilities, City of Independence, Electric System, Dogwood Project, Series A, 5.00%, 6/01/37 | | | 5,000,000 | | | | 5,408,200 | |
Missouri State Development Finance Board Solid Waste Disposal Revenue, The Procter and Gamble Paper Products Co. Project, 5.20%, 3/15/29 | | | 3,000,000 | | | | 3,619,080 | |
Missouri State Environmental Improvement and Energy Resources Authority Water Pollution Control and Drinking Water Revenue, | | | | | | | | |
SRF Programs, Refunding, Series A, 5.00%, 1/01/23 | | | 12,485,000 | | | | 12,827,089 | |
SRF Programs, Refunding, Series A, 5.00%, 1/01/24 | | | 7,890,000 | | | | 8,104,213 | |
SRF Programs, Refunding, Series A, 5.00%, 1/01/26 | | | 2,315,000 | | | | 2,624,770 | |
SRF Programs, Refunding, Series B, 5.50%, 7/01/21 | | | 60,000 | | | | 60,173 | |
SRF Programs, Series A, 5.75%, 1/01/29 | | | 190,000 | | | | 190,580 | |
SRF Programs, Series A,Pre-Refunded, 5.00%, 1/01/23 | | | 15,000 | | | | 15,410 | |
Missouri State Health and Educational Facilities Authority Health Facilities Revenue, | | | | | | | | |
Bethesda Health Group Inc., 5.00%, 8/01/40 | | | 1,650,000 | | | | 1,723,673 | |
Bethesda Health Group Inc., 5.00%, 8/01/45 | | | 1,300,000 | | | | 1,355,003 | |
BJC Health System, 5.00%, 1/01/44 | | | 8,175,000 | | | | 8,811,505 | |
CoxHealth, Refunding, Series A, 5.00%, 11/15/39 | | | 17,000,000 | | | | 18,610,750 | |
CoxHealth, Series A, 5.00%, 11/15/38 | | | 11,680,000 | | | | 12,573,637 | |
CoxHealth, Series A, 5.00%, 11/15/44 | | | 2,760,000 | | | | 2,949,198 | |
Lake Regional Health System, Refunding, 5.00%, 2/15/24 | | | 4,000,000 | | | | 4,101,760 | |
Mercy Health, 4.00%, 11/15/42 | | | 8,000,000 | | | | 8,073,600 | |
Mercy Health, Refunding, Series C, 5.00%, 11/15/47 | | | 15,000,000 | | | | 16,782,450 | |
Mercy Health, Series F, 5.00%, 11/15/45 | | | 25,000,000 | | | | 27,267,000 | |
SSM Health, Series A, 5.00%, 6/01/48 | | | 5,000,000 | | | | 5,552,000 | |
SSM Health Care, Series B,Pre-Refunded, 5.00%, 6/01/30 | | | 16,150,000 | | | | 16,807,789 | |
SSM Health Care, Series B,Pre-Refunded, 5.00%, 6/01/34 | | | 7,000,000 | | | | 7,285,110 | |
St. Anthony’s Medical Center, Refunding, Series B, 5.00%, 2/01/45 | | | 6,870,000 | | | | 7,489,468 | |
St. Luke’s Health System Inc., Refunding, 5.00%, 11/15/35 | | | 3,950,000 | | | | 4,404,645 | |
St. Luke’s Health System Inc., Refunding, Series A, 5.00%, 11/15/43 | | | 2,000,000 | | | | 2,233,980 | |
| | | | | | | | |
franklintempleton.com | | | | | | Annual Report | | 129 |
FRANKLIN TAX-FREE TRUST
STATEMENT OF INVESTMENTS
Franklin MissouriTax-Free Income Fund(continued)
| | | | | | | | |
| | | Principal
Amount | | | Value | |
Municipal Bonds(continued) | | | | | | | | |
Missouri(continued) | | | | | | | | |
Missouri State Health and Educational Facilities Authority Revenue, | | | | | | | | |
Educational Facilities, A.T. Still University of Health Sciences, 5.00%, 10/01/26 | | | $ 3,095,000 | | | | $ 3,321,275 | |
Educational Facilities, A.T. Still University of Health Sciences, 5.25%, 10/01/31 | | | 1,200,000 | | | | 1,295,220 | |
Educational Facilities, A.T. Still University of Health Sciences, 5.00%, 10/01/39 | | | 1,250,000 | | | | 1,375,963 | |
Educational Facilities, A.T. Still University of Health Sciences, 5.25%, 10/01/41 | | | 4,500,000 | | | | 4,844,160 | |
Educational Facilities, Kansas City University Medicine and Biosciences, Refunding, Series A, 5.00%, 6/01/42 | | | 2,800,000 | | | | 3,111,668 | |
Educational Facilities, Kansas City University Medicine and Biosciences, Refunding, Series A, 5.00%, 6/01/47 | | | 4,875,000 | | | | 5,407,838 | |
Educational Facilities, Lake Regional Health System, Refunding, 5.00%, 2/15/34 | | | 7,000,000 | | | | 7,327,810 | |
Educational Facilities, Maryville University St. Louis Project, 5.00%, 6/15/44. | | | 5,000,000 | | | | 5,332,050 | |
Educational Facilities, Maryville University St. Louis Project, Series A, 5.00%, 6/15/45 | | | 4,000,000 | | | | 4,372,920 | |
Educational Facilities, St. Louis University, Series A, 5.00%, 10/01/38 | | | 10,000,000 | | | | 11,330,700 | |
Educational Facilities, St. Louis University, Series A, 5.00%, 10/01/46 | | | 5,775,000 | | | | 6,581,306 | |
Educational Facilities, St. Louis University, Series A, 5.00%, 10/01/47 | | | 15,000,000 | | | | 16,707,150 | |
Educational Facilities, University of Central Missouri, Series C, 5.00%, 10/01/34 | | | 5,000,000 | | | | 5,576,900 | |
Educational Facilities, The Washington University, Series B, 5.00%, 11/15/37 | | | 10,000,000 | | | | 10,791,800 | |
Educational Facilities, Webster University Project, Improvement,Pre-Refunded, 5.00%, 4/01/36 | | | 7,000,000 | | | | 7,470,400 | |
Health Facilities, The Children’s Mercy Hospital,Pre-Refunded, 5.625%, 5/15/39 | | | 7,785,000 | | | | 7,846,657 | |
Health Facilities, The Children’s Mercy Hospital, Refunding, 5.625%, 5/15/39 | | | 1,715,000 | | | | 1,728,514 | |
Lutheran Senior Services Projects, Refunding, Series B, 5.00%, 2/01/46 | | | 4,000,000 | | | | 4,164,160 | |
Senior Living Facilities, Lutheran Senior Services Projects, 5.75%, 2/01/31 | | | 1,900,000 | | | | 1,991,713 | |
Senior Living Facilities, Lutheran Senior Services Projects, 5.375%, 2/01/35 | | | 2,520,000 | | | | 2,562,008 | |
Senior Living Facilities, Lutheran Senior Services Projects, 6.00%, 2/01/41 | | | 4,250,000 | | | | 4,438,955 | |
Senior Living Facilities, Lutheran Senior Services Projects, 5.50%, 2/01/42 | | | 8,985,000 | | | | 9,123,189 | |
Senior Living Facilities, Lutheran Senior Services Projects, Series A, 5.00%, 2/01/46 | | | 11,575,000 | | | | 12,050,038 | |
Missouri State Highways and Transportation Commission State Road Revenue, | | | | | | | | |
Series A, 5.00%, 5/01/20 | | | 6,875,000 | | | | 6,912,537 | |
Series A, 5.00%, 5/01/21 | | | 5,000,000 | | | | 5,026,650 | |
Series A, 5.00%, 5/01/24 | | | 1,150,000 | | | | 1,156,015 | |
Missouri State Housing Development Commission SFMR, | | | | | | | | |
Homeownership Loan Program, First Place, Series B, 4.00%, 11/01/38 | | | 1,420,000 | | | | 1,454,620 | |
Homeownership Loan Program, Series C, GNMA Secured, 5.00%, 3/01/32 | | | 145,000 | | | | 146,298 | |
Homeownership Loan Program, Series D, GNMA Secured, 4.70%, 3/01/35 | | | 1,070,000 | | | | 1,080,828 | |
Missouri State Joint Municipal Electric Utility Commission Power Project Revenue, | | | | | | | | |
Iatan 2 Project, Refunding, Series A, 5.00%, 1/01/30 | | | 3,000,000 | | | | 3,358,920 | |
Iatan 2 Project, Refunding, Series A, 5.00%, 1/01/31 | | | 2,000,000 | | | | 2,233,480 | |
Iatan 2 Project, Refunding, Series A, 5.00%, 1/01/32 | | | 1,500,000 | | | | 1,670,760 | |
Iatan 2 Project, Refunding, Series A, 5.00%, 1/01/34 | | | 2,000,000 | | | | 2,219,040 | |
Iatan 2 Project, Series A, 5.00%, 12/01/35 | | | 7,335,000 | | | | 8,305,567 | |
Plum Point Project, Refunding, Series A, 5.00%, 1/01/32 | | | 10,000,000 | | | | 11,296,600 | |
Plum Point Project, Refunding, Series A, 5.00%, 1/01/33 | | | 7,500,000 | | | | 8,450,850 | |
Prairie State Project, Refunding, Series A, 5.00%, 12/01/30 | | | 4,000,000 | | | | 4,576,280 | |
Prairie State Project, Refunding, Series A, 5.00%, 12/01/31 | | | 6,000,000 | | | | 6,842,040 | |
Prairie State Project, Refunding, Series A, 5.00%, 12/01/40 | | | 27,950,000 | | | | 31,040,990 | |
Monarch-Chesterfield Levee District Special Tax, St. Louis County, Levee District, Refunding, 5.00%, 3/01/40 | | | 4,395,000 | | | | 4,833,665 | |
Move Rolla Transportation Development District Transportation Sales Tax Revenue, 4.75%, 6/01/47 | | | 5,000,000 | | | | 5,143,650 | |
Peculiar Combined Waterworks and Sewerage System Revenue, | | | | | | | | |
Assured Guaranty, 4.00%, 6/01/39 | | | 1,000,000 | | | | 1,068,370 | |
Assured Guaranty, 4.00%, 6/01/42 | | | 2,405,000 | | | | 2,551,056 | |
| | | | | | |
130 | | Annual Report | | | | franklintempleton.com |
FRANKLIN TAX-FREE TRUST
STATEMENT OF INVESTMENTS
Franklin MissouriTax-Free Income Fund(continued)
| | | | | | | | |
| | | Principal
Amount | | | Value | |
Municipal Bonds(continued) | | | | | | | | |
Missouri(continued) | | | | | | | | |
Riverside-Quindaro Bend Levee District Revenue, | | | | | | | | |
Platte County, Levee District Improvement,L-385 Project, Refunding, 5.00%, 3/01/26 | | | $ 1,000,000 | | | | $ 1,114,870 | |
Platte County, Levee District Improvement,L-385 Project, Refunding, 5.00%, 3/01/29 | | | 2,585,000 | | | | 2,844,172 | |
Sikeston Electric Revenue, | | | | | | | | |
Refunding, 5.00%, 6/01/20 | | | 5,000,000 | | | | 5,166,650 | |
Refunding, 5.00%, 6/01/21 | | | 13,130,000 | | | | 13,837,838 | |
Refunding, 5.00%, 6/01/22 | | | 12,570,000 | | | | 13,469,132 | |
Springfield School District No.R-12 GO, Missouri Direct Deposit Program, 5.00%, 3/01/33 | | | 1,000,000 | | | | 1,120,260 | |
Springfield Special Obligation Revenue, | | | | | | | | |
Sewer System Improvements Project, 5.00%, 4/01/31 | | | 1,795,000 | | | | 1,960,732 | |
Sewer System Improvements Project, 5.00%, 4/01/32 | | | 1,885,000 | | | | 2,057,855 | |
St. Charles School District GO, Missouri Direct Deposit Program, 4.00%, 3/01/36 | | | 2,000,000 | | | | 2,131,340 | |
St. Louis Airport Revenue, | | | | | | | | |
Lambert-St. Louis International Airport, Refunding, NATL Insured, 5.50%, 7/01/29 | | | 13,070,000 | | | | 16,693,788 | |
Lambert-St. Louis International Airport, SeriesA-1, 6.125%, 7/01/24 | | | 2,000,000 | | | | 2,027,760 | |
Lambert-St. Louis International Airport, SeriesA-1, 6.625%, 7/01/34 | | | 5,000,000 | | | | 5,075,150 | |
Series C, AGMC Insured, 5.00%, 7/01/42 | | | 3,930,000 | | | | 4,446,520 | |
Series C, AGMC Insured, 5.00%, 7/01/47 | | | 8,770,000 | | | | 9,891,771 | |
Series D, AGMC Insured, 5.00%, 7/01/33 | | | 1,000,000 | | | | 1,142,410 | |
Series D, AGMC Insured, 5.00%, 7/01/34 | | | 1,415,000 | | | | 1,611,034 | |
Series D, AGMC Insured, 5.00%, 7/01/36 | | | 1,125,000 | | | | 1,272,375 | |
Series D, AGMC Insured, 5.00%, 7/01/37 | | | 1,000,000 | | | | 1,126,400 | |
St. Louis County IDA Senior Living Facilities Revenue, | | | | | | | | |
Friendship Village, St. Louis Obligated Group, Refunding, 5.00%, 9/01/48 | | | 7,095,000 | | | | 7,192,982 | |
Friendship Village Chesterfield,Pre-Refunded, 5.00%, 9/01/42 | | | 3,165,000 | | | | 3,508,529 | |
Friendship Village Sunset Hills, Series A, 5.875%, 9/01/43 | | | 7,000,000 | | | | 7,487,200 | |
St. Louis County Pattonville School District No.R-3 GO, | | | | | | | | |
Series A, 5.00%, 3/01/37 | | | 2,750,000 | | | | 3,126,640 | |
Series A, 5.00%, 3/01/38 | | | 1,000,000 | | | | 1,132,900 | |
St. Louis County School District No. 101 Affton GO, | | | | | | | | |
Direct Deposit Program, Series A, 5.00%, 3/01/32 | | | 1,500,000 | | | | 1,741,920 | |
Direct Deposit Program, Series A, 5.00%, 3/01/33 | | | 1,595,000 | | | | 1,842,353 | |
Direct Deposit Program, Series A, 5.00%, 3/01/34 | | | 1,700,000 | | | | 1,958,196 | |
Direct Deposit Program, Series A, 5.00%, 3/01/35 | | | 1,810,000 | | | | 2,077,319 | |
Direct Deposit Program, Series A, 5.00%, 3/01/36 | | | 1,920,000 | | | | 2,193,485 | |
St. Louis Municipal Finance Corp. Leasehold Revenue, Convention Center Capital Improvement, Series B, Assured Guaranty,Pre-Refunded, 5.375%, 7/15/38 | | | 22,725,000 | | | | 23,038,605 | |
WentzvilleR-IV School District GO, Missouri Direct Deposit Program, Refunding and Improvement, 4.00%, 3/01/38 | | | 15,400,000 | | | | 16,066,974 | |
| | | | | | | | |
| | |
| | | | | | | 907,214,170 | |
| | | | | | | | |
U.S. Territories 3.2% | | | | | | | | |
Guam 0.6% | | | | | | | | |
Guam Power Authority Revenue, Refunding, Series A, AGMC Insured, 5.00%, 10/01/25 | | | 5,420,000 | | | | 5,954,249 | |
| | | | | | | | |
| | | | | | | | |
franklintempleton.com | | | | | | Annual Report | | 131 |
FRANKLIN TAX-FREE TRUST
STATEMENT OF INVESTMENTS
Franklin MissouriTax-Free Income Fund(continued)
| | | | | | | | |
| | | Principal
Amount | | | Value | |
| Municipal Bonds(continued) | | | | | | | | |
U.S. Territories(continued) | | | | | | | | |
Puerto Rico 2.6% | | | | | | | | |
aPuerto Rico Electric Power Authority Power Revenue, | | | | | | | | |
Series WW, 5.50%, 7/01/38 | | | $19,320,000 | | | | $ 13,306,650 | |
Series XX, 5.75%, 7/01/36 | | | 6,000,000 | | | | 4,132,500 | |
Series XX, 5.25%, 7/01/40 | | | 10,000,000 | | | | 6,862,500 | |
| | | | | | | | |
| | |
| | | | | | | 24,301,650 | |
| | | | | | | | |
| | |
Total U.S. Territories | | | | | | | 30,255,899 | |
| | | | | | | | |
Total Municipal Bonds (Cost $922,207,215) 98.5% | | | | | | | 937,470,069 | |
Other Assets, less Liabilities 1.5% | | | | | | | 14,553,453 | |
| | | | | | | | |
Net Assets 100.0% | | | | | | | $952,023,522 | |
| | | | | | | | |
See Abbreviations on page 183.
aSee Note 7 regarding defaulted securities.
| | | | | | |
132 | | Annual Report | | | The accompanying notes are an integral part of these financial statements. | | franklintempleton.com |
FRANKLIN TAX-FREE TRUST
Financial Highlights
Franklin North CarolinaTax-Free Income Fund
| | |
| | | Year Ended
February 28,
2019a |
| |
Class A | | |
| |
Per share operating performance | | |
(for a share outstanding throughout the year) | | |
| |
Net asset value, beginning of year | | $11.26 |
| |
Income from investment operationsb: | | |
| |
Net investment incomec | | 0.15 |
| |
Net realized and unrealized gains (losses) | | 0.04 |
| |
Total from investment operations | | 0.19 |
| |
Less distributions from net investment income | | (0.15) |
| |
Net asset value, end of year | | $11.30 |
| |
Total returnd | | 1.77% |
| |
Ratios to average net assetse | | |
| |
Expensesf | | 0.83% |
| |
Net investment income | | 2.86% |
| |
Supplemental data | | |
| |
Net assets, end of year (000’s) | | $49,192 |
| |
Portfolio turnover rate | | 11.61% |
aFor the period September 10, 2018 (effective date) to February 28, 2019.
bThe amount shown for a share outstanding throughout the period may not correlate with the Statement of Operations for the period due to the timing of sales and repurchases of the Fund’s shares in relation to income earned and/or fluctuating fair value of the investments of the Fund.
cBased on average daily shares outstanding.
dTotal return does not reflect sales commissions or contingent deferred sales charges, if applicable, and is not annualized for periods less than one year.
eRatios are annualized for periods less than one year.
fBenefit of expense reduction rounds to less than 0.01%.
| | | | | | | | |
franklintempleton.com | | | | The accompanying notes are an integral part of these financial statements. | | | Annual Report | | 133 |
FRANKLIN TAX-FREE TRUST
FINANCIAL HIGHLIGHTS
Franklin North CarolinaTax-Free Income Fund(continued)
| | | | | | | | | | | | | | | | | | | | |
| | | | | | Year Ended February 28, | | | | |
| | | | |
| | | | 2019 | | | | 2018 | | | | 2017 | | | | 2016 | a | | | 2015 | |
| | | | | |
Class A1 | | | | | | | | | | | | | | | | | | | | |
| | | | | |
Per share operating performance | | | | | | | | | | | | | | | | | | | | |
(for a share outstanding throughout the year) | | | | | | | | | | | | | | | | | | | | |
| | | | | |
| Net asset value, beginning of year | | | $11.28 | | | | $11.70 | | | | $11.97 | | | | $12.15 | | | | $11.95 | |
| | | | | |
Income from investment operationsb: | | | | | | | | | | | | | | | | | | | | |
| | | | | |
Net investment incomec | | | 0.34 | | | | 0.35 | | | | 0.41 | | | | 0.43 | | | | 0.46 | |
| | | | | |
Net realized and unrealized gains (losses) | | | 0.03 | | | | (0.40 | ) | | | (0.27 | ) | | | (0.19 | ) | | | 0.21 | |
| | | | | |
Total from investment operations | | | 0.37 | | | | (0.05 | ) | | | 0.14 | | | | 0.24 | | | | 0.67 | |
| | | | | |
Less distributions from net investment income | | | (0.35 | ) | | | (0.37 | ) | | | (0.41 | ) | | | (0.42 | ) | | | (0.47) | |
| | | | | |
Net asset value, end of year | | | $11.30 | | | | $11.28 | | | | $11.70 | | | | $11.97 | | | | $12.15 | |
| | | | | |
Total returnd | | | 3.32% | | | | (0.45)% | | | | 1.19% | | | | 2.01% | | | | 5.70% | |
| | | | | |
Ratios to average net assets | | | | | | | | | | | | | | | | | | | | |
| | | | | |
Expenses | | | 0.68% | e | | | 0.66% | | | | 0.64% | | | | 0.64% | | | | 0.63% | |
| | | | | |
Net investment income | | | 3.01% | | | | 3.00% | | | | 3.41% | | | | 3.62% | | | | 3.84% | |
| | | | | |
Supplemental data | | | | | | | | | | | | | | | | | | | | |
| | | | | |
Net assets, end of year (000’s) | | | $577,052 | | | | $660,167 | | | | $756,109 | | | | $794,675 | | | | $841,737 | |
| | | | | |
Portfolio turnover rate | | | 11.61% | | | | 10.07% | | | | 18.38% | | | | 7.23% | | | | 6.94% | |
aFor the year ended February 29.
bThe amount shown for a share outstanding throughout the period may not correlate with the Statement of Operations for the period due to the timing of sales and repurchases of the Fund’s shares in relation to income earned and/or fluctuating fair value of the investments of the Fund.
cBased on average daily shares outstanding.
dTotal return does not reflect sales commissions or contingent deferred sales charges, if applicable.
eBenefit of expense reduction rounds to less than 0.01%.
| | | | | | |
134 | | Annual Report | | | The accompanying notes are an integral part of these financial statements. | | franklintempleton.com |
FRANKLIN TAX-FREE TRUST
FINANCIAL HIGHLIGHTS
Franklin North CarolinaTax-Free Income Fund(continued)
| | | | | | | | | | | | | | | | | | | | |
| | | | | | Year Ended February 28, | | | | |
| | | | |
| | | | 2019 | | | | 2018 | | | | 2017 | | | | 2016 | a | | | 2015 | |
| | | | | |
Class C | | | | | | | | | | | | | | | | | | | | |
| | | | | |
Per share operating performance | | | | | | | | | | | | | | | | | | | | |
(for a share outstanding throughout the year) | | | | | | | | | | | | | | | | | | | | |
| | | | | |
| Net asset value, beginning of year | | | $11.46 | | | | $11.88 | | | | $12.15 | | | | $12.33 | | | | $12.12 | |
| | | | | |
Income from investment operationsb: | | | | | | | | | | | | | | | | | | | | |
| | | | | |
Net investment incomec | | | 0.28 | | | | 0.29 | | | | 0.35 | | | | 0.37 | | | | 0.40 | |
| | | | | |
Net realized and unrealized gains (losses) | | | 0.03 | | | | (0.41 | ) | | | (0.27 | ) | | | (0.20 | ) | | | 0.21 | |
| | | | | |
Total from investment operations | | | 0.31 | | | | (0.12 | ) | | | 0.08 | | | | 0.17 | | | | 0.61 | |
| | | | | |
Less distributions from net investment income | | | (0.28 | ) | | | (0.30 | ) | | | (0.35 | ) | | | (0.35 | ) | | | (0.40) | |
| | | | | |
Net asset value, end of year | | | $11.49 | | | | $11.46 | | | | $11.88 | | | | $12.15 | | | | $12.33 | |
| | | | | |
Total returnd | | | 2.78% | | | | (1.00)% | | | | 0.61% | | | | 1.43% | | | | 5.13% | |
| | | | | |
Ratios to average net assets | | | | | | | | | | | | | | | | | | | | |
| | | | | |
Expenses | | | 1.23% | e | | | 1.21% | | | | 1.19% | | | | 1.19% | | | | 1.18% | |
| | | | | |
Net investment income | | | 2.46% | | | | 2.45% | | | | 2.86% | | | | 3.07% | | | | 3.29% | |
| | | | | |
Supplemental data | | | | | | | | | | | | | | | | | | | | |
| | | | | |
Net assets, end of year (000’s) | | | $105,371 | | | | $159,556 | | | | $197,705 | | | | $206,283 | | | | $217,985 | |
| | | | | |
Portfolio turnover rate | | | 11.61% | | | | 10.07% | | | | 18.38% | | | | 7.23% | | | | 6.94% | |
aFor the year ended February 29.
bThe amount shown for a share outstanding throughout the period may not correlate with the Statement of Operations for the period due to the timing of sales and repurchases of the Fund’s shares in relation to income earned and/or fluctuating fair value of the investments of the Fund.
cBased on average daily shares outstanding.
dTotal return does not reflect sales commissions or contingent deferred sales charges, if applicable.
eBenefit of expense reduction rounds to less than 0.01%.
| | | | | | | | |
franklintempleton.com | | | | The accompanying notes are an integral part of these financial statements. | | | Annual Report | | 135 |
FRANKLIN TAX-FREE TRUST
FINANCIAL HIGHLIGHTS
Franklin North CarolinaTax-Free Income Fund(continued)
| | | | | | |
| | | Year Ended February 28, |
| | | 2019 | | | 2018a |
| | |
Class R6 | | | | | | |
| | |
Per share operating performance | | | | | | |
(for a share outstanding throughout the year) | | | | | | |
| | |
| Net asset value, beginning of year | | | $11.27 | | | $11.59 |
| | |
Income from investment operationsb: | | | | | | |
| | |
Net investment incomec | | | 0.35 | | | 0.22 |
| | |
Net realized and unrealized gains (losses) | | | 0.03 | | | (0.33) |
| | |
Total from investment operations | | | 0.38 | | | (0.11) |
| | |
Less distributions from net investment income | | | (0.36 | ) | | (0.21) |
| | |
Net asset value, end of year | | | $11.29 | | | $11.27 |
| | |
Total returnd | | | 3.45% | | | (0.97)% |
| | |
Ratios to average net assetse | | | | | | |
| | |
Expenses before waiver and payments by affiliates | | | 0.56% | | | 0.56% |
| | |
Expenses net of waiver and payments by affiliates | | | 0.54% | f | | 0.53% |
| | |
Net investment income | | | 3.15% | | | 3.13% |
| | |
Supplemental data | | | | | | |
| | |
Net assets, end of year (000’s) | | | $7,776 | | | $9,117 |
| | |
Portfolio turnover rate | | | 11.61% | | | 10.07% |
aFor the period August 1, 2017 (effective date) to February 28, 2018.
bThe amount shown for a share outstanding throughout the period may not correlate with the Statement of Operations for the period due to the timing of sales and repurchases of the Fund’s shares in relation to income earned and/or fluctuating fair value of the investments of the Fund.
cBased on average daily shares outstanding.
dTotal return is not annualized for periods less than one year.
eRatios are annualized for periods less than one year.
fBenefit of expense reduction rounds to less than 0.01%.
| | | | | | |
136 | | Annual Report | | | The accompanying notes are an integral part of these financial statements. | | franklintempleton.com |
FRANKLIN TAX-FREE TRUST
FINANCIAL HIGHLIGHTS
Franklin North CarolinaTax-Free Income Fund(continued)
| | | | | | | | | | | | | | | | | | | | |
| | | | | | Year Ended February 28, | | | | |
| | | | |
| | | | 2019 | | | | 2018 | | | | 2017 | | | | 2016 | a | | | 2015 | |
| | | | | |
Advisor Class | | | | | | | | | | | | | | | | | | | | |
| | | | | |
Per share operating performance | | | | | | | | | | | | | | | | | | | | |
(for a share outstanding throughout the year) | | | | | | | | | | | | | | | | | | | | |
| | | | | |
| Net asset value, beginning of year | | | $11.28 | | | | $11.70 | | | | $11.97 | | | | $12.15 | | | | $11.95 | |
| | | | | |
Income from investment operationsb: | | | | | | | | | | | | | | | | | | | | |
| | | | | |
Net investment incomec | | | 0.35 | | | | 0.36 | | | | 0.42 | | | | 0.45 | | | | 0.48 | |
| | | | | |
Net realized and unrealized gains (losses) | | | 0.03 | | | | (0.40 | ) | | | (0.26 | ) | | | (0.20 | ) | | | 0.20 | |
| | | | | |
Total from investment operations | | | 0.38 | | | | (0.04 | ) | | | 0.16 | | | | 0.25 | | | | 0.68 | |
| | | | | |
Less distributions from net investment income | | | (0.36 | ) | | | (0.38 | ) | | | (0.43 | ) | | | (0.43 | ) | | | (0.48 | ) |
| | | | | |
Net asset value, end of year | | | $11.30 | | | | $11.28 | | | | $11.70 | | | | $11.97 | | | | $12.15 | |
| | | | | |
Total return | | | 3.42% | | | | (0.36)% | | | | 1.29% | | | | 2.12% | | | | 5.81% | |
| | | | | |
Ratios to average net assets | | | | | | | | | | | | | | | | | | | | |
| | | | | |
Expenses | | | 0.58% | d | | | 0.56% | | | | 0.54% | | | | 0.54% | | | | 0.53% | |
| | | | | |
Net investment income | | | 3.11% | | | | 3.10% | | | | 3.51% | | | | 3.72% | | | | 3.94% | |
| | | | | |
Supplemental data | | | | | | | | | | | | | | | | | | | | |
| | | | | |
Net assets, end of year (000’s) | | | $84,506 | | | | $80,819 | | | | $109,365 | | | | $89,119 | | | | $76,935 | |
| | | | | |
Portfolio turnover rate | | | 11.61% | | | | 10.07% | | | | 18.38% | | | | 7.23% | | | | 6.94% | |
aFor the year ended February 29.
bThe amount shown for a share outstanding throughout the period may not correlate with the Statement of Operations for the period due to the timing of sales and repurchases of the Fund’s shares in relation to income earned and/or fluctuating fair value of the investments of the Fund.
cBased on average daily shares outstanding.
dBenefit of expense reduction rounds to less than 0.01%.
| | | | | | | | |
franklintempleton.com | | | | The accompanying notes are an integral part of these financial statements. | | | Annual Report | | 137 |
FRANKLINTAX-FREE TRUST
Statement of Investments, February 28, 2019
Franklin North CarolinaTax-Free Income Fund
| | | | | | | | |
| | | Principal
Amount | | | Value | |
| Municipal Bonds 94.8% | | | | | | | | |
North Carolina 92.2% | | | | | | | | |
Buncombe County Limited Obligation Revenue, Refunding, 5.00%, 6/01/34 | | | $ 3,000,000 | | | | $ 3,415,200 | |
Cape Fear Public Utility Authority Water and Sewer System Revenue, | | | | | | | | |
Pre-Refunded, 5.00%, 8/01/36 | | | 8,000,000 | | | | 8,630,080 | |
Refunding, 5.00%, 6/01/40 | | | 2,250,000 | | | | 2,534,332 | |
Cary Combined Enterprise System Revenue, 5.00%, 12/01/41 | | | 1,710,000 | | | | 1,958,326 | |
Pre-Refunded, 5.00%, 12/01/42 | | | 10,000,000 | | | | 11,198,900 | |
Refunding, Series B, 4.00%, 12/01/42 | | | 8,000,000 | | | | 8,353,120 | |
Charlotte Airport Revenue, | | | | | | | | |
Charlotte Douglas International Airport, Refunding, Series A, 5.50%, 7/01/34 | | | 3,765,000 | | | | 3,955,923 | |
Charlotte Douglas International Airport, Series A, 5.00%, 7/01/39 | | | 3,000,000 | | | | 3,121,650 | |
Charlotte Douglas International Airport, Series A, 5.00%, 7/01/41 | | | 10,000,000 | | | | 10,645,800 | |
Charlotte COP, | | | | | | | | |
Cultural Arts Facilities, Refunding, Series E, 5.00%, 6/01/39 | | | 6,000,000 | | | | 6,042,600 | |
Transit Projects, Phase II, Refunding, Series A, 5.00%, 6/01/33 | | | 2,500,000 | | | | 2,506,025 | |
Charlotte Storm Water Fee Revenue, Refunding, 5.00%, 12/01/39 | | | 7,970,000 | | | | 9,069,701 | |
Charlotte Water and Sewer System Revenue, | | | | | | | | |
Refunding, 4.00%, 7/01/37 | | | 5,000,000 | | | | 5,339,300 | |
Refunding, 5.00%, 7/01/40 | | | 10,000,000 | | | | 11,267,700 | |
Refunding, Series B, 5.00%, 7/01/38 | | | 10,000,000 | | | | 10,400,200 | |
The Charlotte-Mecklenburg Hospital Authority Health Care Revenue, | | | | | | | | |
Carolinas HealthCare System, Refunding, Series A, 5.00%, 1/15/40 | | | 20,000,000 | | | | 22,121,000 | |
Carolinas HealthCare System, Series A, 5.125%, 1/15/37 | | | 4,000,000 | | | | 4,228,080 | |
Carolinas HealthCare System, Series A, 5.25%, 1/15/42 | | | 10,000,000 | | | | 10,574,100 | |
Charlotte-Mecklenburg Hospital Authority Revenue, Atrium Health, Refunding, Series A, 5.00%, 1/15/36 | | | 5,000,000 | | | | 5,794,450 | |
Columbus County Industrial Facilities and PCFA Revenue, Recovery Zone Facility, International Paper Co. Projects, Series A, 5.70%, 5/01/34 | | | 2,500,000 | | | | 2,593,900 | |
Dare County Utilities Systems Revenue,Pre-Refunded, 5.00%, 2/01/41 | | | 5,000,000 | | | | 5,320,150 | |
Durham County COP, Series A,Pre-Refunded, 5.00%, 6/01/31 | | | 4,000,000 | | | | 4,033,240 | |
aDurham County GO, | | | | | | | | |
Refunding, 4.00%, 6/01/36 | | | 500,000 | | | | 543,345 | |
Refunding, 4.00%, 6/01/37 | | | 450,000 | | | | 486,527 | |
Refunding, 4.00%, 6/01/39 | | | 700,000 | | | | 750,127 | |
Durham Utility System Revenue,Pre-Refunded, 5.00%, 6/01/41 | | | 4,000,000 | | | | 4,298,200 | |
Fayetteville Public Works Commission Revenue, Refunding, 4.00%, 3/01/41 | | | 4,015,000 | | | | 4,200,373 | |
Greensboro GO, Public Improvement, Refunding, Series B, 5.00%, 10/01/29 | | | 5,000,000 | | | | 6,245,900 | |
Guilford County GO, Public Improvement, Series B, 4.00%, 5/01/33 | | | 5,000,000 | | | | 5,408,500 | |
Harnett County COP, | | | | | | | | |
Assured Guaranty,Pre-Refunded, 5.00%, 6/01/28 | | | 1,000,000 | | | | 1,008,180 | |
Assured Guaranty,Pre-Refunded, 5.00%, 6/01/29 | | | 500,000 | | | | 504,090 | |
Mecklenburg County GO, | | | | | | | | |
Public Improvement, Series A, 4.00%, 4/01/30 | | | 5,000,000 | | | | 5,578,350 | |
Series A, 5.00%, 4/01/28 | | | 5,000,000 | | | | 5,881,150 | |
Monroe COP, | | | | | | | | |
Assured Guaranty,Pre-Refunded, 5.50%, 3/01/34 | | | 2,425,000 | | | | 2,425,000 | |
Assured Guaranty,Pre-Refunded, 5.50%, 3/01/39 | | | 1,085,000 | | | | 1,085,000 | |
Nash Health Care System Health Care Facilities Revenue, | | | | | | | | |
5.00%, 11/01/41 | | | 5,000,000 | | | | 5,282,600 | |
AGMC Insured, 5.00%, 11/01/30 | | | 2,250,000 | | | | 2,254,635 | |
| | | | | | |
138 | | Annual Report | | | | franklintempleton.com |
FRANKLIN TAX-FREE TRUST
STATEMENT OF INVESTMENTS
Franklin North CarolinaTax-Free Income Fund(continued)
| | | | | | | | |
| | | Principal
Amount | | | Value | |
Municipal Bonds(continued) | | | | | | | | |
North Carolina(continued) | | | | | | | | |
New Hanover County Hospital Revenue, | | | | | | | | |
New Hanover Regional Medical Center, Refunding, 5.00%, 10/01/42 | | | $ 5,000,000 | | | | $ 5,533,200 | |
New Hanover Regional Medical Center, Refunding, 5.00%, 10/01/47 | | | 7,190,000 | | | | 7,928,197 | |
New Hanover Regional Medical Center Project, Series B, AGMC Insured,Pre-Refunded, 5.00%, 10/01/27 | | | 3,500,000 | | | | 3,567,375 | |
New Hanover Regional Medical Center Project, Series B, AGMC Insured,Pre-Refunded, 5.125%, 10/01/31 | | | 8,385,000 | | | | 8,552,448 | |
North Carolina Capital Facilities Finance Agency Educational Facilities Revenue, | | | | | | | | |
Wake Forest University, 4.00%, 1/01/48 | | | 10,000,000 | | | | 10,368,300 | |
Wake Forest University, 5.00%, 1/01/48 | | | 13,500,000 | | | | 15,443,595 | |
Wake Forest University, Refunding, 4.00%, 1/01/35 | | | 5,000,000 | | | | 5,355,050 | |
Wake Forest University, Refunding, 4.00%, 1/01/38 | | | 5,500,000 | | | | 5,785,505 | |
Wake Forest University, Refunding, 4.00%, 1/01/39 | | | 5,250,000 | | | | 5,509,507 | |
North Carolina Capital Facilities Finance Agency Revenue, | | | | | | | | |
Davidson College, 5.00%, 3/01/40 | | | 4,000,000 | | | | 4,304,160 | |
Davidson College, 5.00%, 3/01/45 | | | 3,500,000 | | | | 3,765,090 | |
Duke University Project, Refunding, Series B, 5.00%, 10/01/41 | | | 13,585,000 | | | | 15,410,281 | |
Duke University Project, Refunding, Series B, 5.00%, 7/01/42 | | | 10,000,000 | | | | 11,470,500 | |
Duke University Project, Refunding, Series B, 4.00%, 10/01/44 | | | 5,085,000 | | | | 5,323,436 | |
Duke University Project, Refunding, Series B, 5.00%, 10/01/44 | | | 11,000,000 | | | | 12,572,560 | |
Duke University Project, Series B,Pre-Refunded, 5.00%, 10/01/38 | | | 20,000,000 | | | | 20,052,800 | |
Methodist University, 5.00%, 3/01/34 | | | 1,500,000 | | | | 1,558,185 | |
North Carolina Municipal Power Agency No. 1 Catawba Electric Revenue, | | | | | | | | |
Refunding, Series A, 5.00%, 1/01/26 | | | 800,000 | | | | 801,880 | |
Refunding, Series A, 5.00%, 1/01/30 | | | 1,400,000 | | | | 1,403,192 | |
Refunding, Series A, 5.00%, 1/01/32 | | | 4,200,000 | | | | 4,829,958 | |
Refunding, Series B, 5.00%, 1/01/21 | | | 5,000,000 | | | | 5,134,900 | |
North Carolina State Capital Improvement Limited Obligation Revenue, Series C,Pre-Refunded, 5.00%, 5/01/29 | | | 10,000,000 | | | | 10,718,300 | |
North Carolina State GO, | | | | | | | | |
Public Improvement, Series A,Pre-Refunded, 5.00%, 5/01/23 | | | 10,000,000 | | | | 10,386,100 | |
Public Improvement, Series A,Pre-Refunded, 5.00%, 5/01/24 | | | 10,000,000 | | | | 10,386,100 | |
Refunding, Series A, 5.00%, 6/01/25 | | | 4,000,000 | | | | 4,767,320 | |
North Carolina State Medical Care Commission Health Care Facilities Revenue, | | | | | | | | |
Appalachian Regional Healthcare System, Series A,Pre-Refunded, 6.50%, 7/01/31 | | | 5,000,000 | | | | 5,543,500 | |
Appalachian Regional Healthcare System, Series A,Pre-Refunded, 6.625%, 7/01/34 | | | 6,000,000 | | | | 6,669,180 | |
Duke University Health System, Refunding, Series D, 4.00%, 6/01/42 | | | 7,000,000 | | | | 7,264,180 | |
Duke University Health System, Series A, 5.00%, 6/01/42 | | | 10,000,000 | | | | 10,862,100 | |
Duke University Health System, Series A,Pre-Refunded, 5.00%, 6/01/42 | | | 11,500,000 | | | | 11,595,565 | |
Duke University Health System, Series A,Pre-Refunded, 5.00%, 6/01/42 | | | 8,150,000 | | | | 8,481,949 | |
Novant Health Obligated Group, Refunding, Series A, 5.00%, 11/01/46 | | | 20,000,000 | | | | 21,472,000 | |
Presbyterian Homes, Refunding, Series C, 5.00%, 10/01/31 | | | 5,000,000 | | | | 5,610,750 | |
Rex Healthcare, Refunding, Series A, 5.00%, 7/01/30 | | | 5,000,000 | | | | 5,178,700 | |
Scotland Memorial Hospital Project, Assured Guaranty, 5.50%, 10/01/19 | | | 85,000 | | | | 85,232 | |
Scotland Memorial Hospital Project, Assured Guaranty, 5.50%, 10/01/29 | | | 1,220,000 | | | | 1,223,831 | |
Vidant Health, 5.00%, 6/01/40 | | | 5,000,000 | | | | 5,421,150 | |
Vidant Health, Refunding, Series A, 5.00%, 6/01/36 | | | 5,000,000 | | | | 5,382,250 | |
aWake Forest Baptist Obligated Group, Series A, 5.00%, 12/01/32 | | | 1,000,000 | | | | 1,169,160 | |
aWake Forest Baptist Obligated Group, Series A, 5.00%, 12/01/33 | | | 1,000,000 | | | | 1,164,470 | |
WakeMed Project, Refunding, Series A, 5.00%, 10/01/38 | | | 5,000,000 | | | | 5,417,050 | |
| | | | | | | | |
franklintempleton.com | | | | | | Annual Report | | 139 |
FRANKLIN TAX-FREE TRUST
STATEMENT OF INVESTMENTS
Franklin North CarolinaTax-Free Income Fund(continued)
| | | | | | | | |
| | | Principal
Amount | | | Value | |
Municipal Bonds(continued) | | | | | | | | |
North Carolina(continued) | | | | | | | | |
North Carolina State Medical Care Commission Hospital Revenue, North Carolina Baptist Hospital, Refunding, 5.00%, 6/01/34 | | | $10,000,000 | | | | $ 10,351,600 | |
North Carolina State Medical Care Commission Retirement Facilities First Mortgage Revenue, | | | | | | | | |
The United Methodist Retirement Homes, Refunding, Series A, 5.00%, 10/01/37 | | | 1,200,000 | | | | 1,289,880 | |
The United Methodist Retirement Homes, Refunding, Series A, 5.00%, 10/01/42 | | | 1,250,000 | | | | 1,311,263 | |
The United Methodist Retirement Homes, Refunding, Series A, 5.00%, 10/01/47 | | | 2,540,000 | | | | 2,655,926 | |
North Carolina State Ports Authority Port Facilities Revenue, senior lien, Refunding, Series A, 5.25%, 2/01/40 | | | 6,000,000 | | | | 6,133,260 | |
North Carolina State University at Raleigh Revenue, | | | | | | | | |
General, Refunding, Series A, 5.00%, 10/01/33 | | | 5,595,000 | | | | 6,292,305 | |
General, Refunding, Series A, 5.00%, 10/01/42 | | | 8,980,000 | | | | 10,040,897 | |
North Carolina Turnpike Authority Revenue, | | | | | | | | |
Monroe Connector System, State Appropriation, 5.00%, 7/01/41 | | | 5,000,000 | | | | 5,306,500 | |
Monroe Expressway Toll, Refunding, Series A, 5.00%, 7/01/47 | | | 2,500,000 | | | | 2,683,500 | |
Triangle Expressway System, Appropriation, Refunding, Series A, 4.00%, 1/01/39 | | | 7,500,000 | | | | 7,848,450 | |
Triangle Expressway System, senior lien, Refunding, AGMC Insured, 5.00%, 1/01/31 | | | 1,000,000 | | | | 1,155,480 | |
Triangle Expressway System, senior lien, Refunding, AGMC Insured, 5.00%, 1/01/39 | | | 1,200,000 | | | | 1,337,340 | |
Oak Island Enterprise System Revenue, | | | | | | | | |
AGMC Insured, Refunding, 5.00%, 6/01/33 | | | 1,000,000 | | | | 1,162,920 | |
Assured Guaranty,Pre-Refunded, 6.00%, 6/01/34 | | | 1,540,000 | | | | 1,556,493 | |
Assured Guaranty,Pre-Refunded, 6.00%, 6/01/36 | | | 1,000,000 | | | | 1,010,710 | |
Pitt County Revenue, Limited Obligation, Assured Guaranty,Pre-Refunded, 5.00%, 4/01/34 | | | 1,000,000 | | | | 1,036,410 | |
Raleigh Combined Enterprise System Revenue, | | | | | | | | |
Pre-Refunded, 5.00%, 3/01/40 | | | 11,915,000 | | | | 12,710,803 | |
Refunding, Series A, 5.00%, 3/01/43 | | | 10,000,000 | | | | 10,963,200 | |
Refunding, Series B, 4.00%, 3/01/34 | | | 1,000,000 | | | | 1,071,290 | |
Series A, 4.00%, 3/01/46 | | | 5,000,000 | | | | 5,195,050 | |
Raleigh GO, Refunding, Series A, 5.00%, 9/01/26 | | | 5,000,000 | | | | 6,099,100 | |
Raleigh-Durham Airport Authority Airport Revenue, | | | | | | | | |
Refunding, Series A, 5.00%, 5/01/27 | | | 350,000 | | | | 408,384 | |
Refunding, Series A, 5.00%, 5/01/29 | | | 1,000,000 | | | | 1,157,420 | |
Refunding, Series A, 5.00%, 5/01/30 | | | 550,000 | | | | 634,530 | |
Refunding, Series A, 5.00%, 5/01/36 | | | 10,785,000 | | | | 11,137,993 | |
Union County Enterprise System Revenue, 5.00%, 6/01/34. | | | 1,000,000 | | | | 1,145,890 | |
University of North Carolina at Charlotte Revenue, | | | | | | | | |
General, Board of Governors, 5.00%, 4/01/43 | | | 5,000,000 | | | | 5,623,500 | |
General, Board of Governors, 5.00%, 4/01/45 | | | 9,450,000 | | | | 10,737,751 | |
General, Board of Governors, Refunding, 5.00%, 10/01/47 | | | 10,000,000 | | | | 11,374,500 | |
General, Board of Governors, Refunding, Series A, 4.00%, 10/01/40 | | | 2,250,000 | | | | 2,351,970 | |
General, Board of Governors, Series A,Pre-Refunded, 5.00%, 4/01/37 | | | 12,995,000 | | | | 14,294,890 | |
General, Board of Governors, Series A,Pre-Refunded, 5.00%, 4/01/41 | | | 18,000,000 | | | | 19,800,540 | |
University of North Carolina at Greensboro Revenue, | | | | | | | | |
General, Board of Governors, 5.00%, 4/01/39 | | | 3,500,000 | | | | 3,956,120 | |
General, Board of Governors, 5.00%, 4/01/43 | | | 2,500,000 | | | | 2,871,125 | |
General, Board of Governors, Refunding, 4.00%, 4/01/35 | | | 1,205,000 | | | | 1,287,265 | |
General, Board of Governors, Refunding, 4.00%, 4/01/36 | | | 1,000,000 | | | | 1,062,650 | |
General, Board of Governors, Series A, Assured Guaranty,Pre-Refunded, 5.00%, 4/01/34 | | | 1,000,000 | | | | 1,002,640 | |
University of North Carolina at Wilmington Revenue, Student Housing Projects, Limited Obligation, Refunding, 5.00%, 6/01/37 | | | 3,000,000 | | | | 3,389,610 | |
University of North Carolina Hospitals at Chapel Hill Revenue, Board of Governors, 5.00%, 2/01/46 | | | 4,265,000 | | | | 4,709,541 | |
University of North Carolina System Pool Revenue, Series A, Assured Guaranty, 5.00%, 10/01/33 | | | 160,000 | | | | 160,331 | |
| | | | | | |
140 | | Annual Report | | | | franklintempleton.com |
FRANKLIN TAX-FREE TRUST
STATEMENT OF INVESTMENTS
Franklin North CarolinaTax-Free Income Fund(continued)
| | | | | | | | |
| | | Principal
Amount | | | Value | |
Municipal Bonds(continued) | | | | | | | | |
North Carolina(continued) | | | | | | | | |
Wake County GO, | | | | | | | | |
Public Improvement, Refunding, Series A, 5.00%, 3/01/30 | | $ | 8,000,000 | | | | $ 9,813,520 | |
Public Improvement, Refunding, Series A, 5.00%, 3/01/32 | | | 7,870,000 | | | | 9,686,789 | |
Wake County Revenue, | | | | | | | | |
Limited Obligation,Pre-Refunded, 5.00%, 1/01/33 | | | 10,820,000 | | | | 11,124,583 | |
Limited Obligation,Pre-Refunded, 5.00%, 6/01/36 | | | 5,000,000 | | | | 5,042,150 | |
Limited Obligation,Pre-Refunded, 5.00%, 1/01/37 | | | 12,000,000 | | | | 12,337,800 | |
Wilmington Storm Water Fee Revenue, Refunding, AMBAC Insured, 5.00%, 6/01/33 | | | 225,000 | | | | 225,590 | |
Winston-Salem City Water and Sewer System Revenue, 4.00%, 6/01/47 | | | 10,000,000 | | | | 10,337,900 | |
Pre-Refunded, 5.00%, 6/01/39 | | | 5,000,000 | | | | 5,041,550 | |
Refunding, Series A, 5.00%, 6/01/33 | | | 2,350,000 | | | | 2,675,522 | |
Refunding, Series A, 4.00%, 6/01/34 | | | 1,350,000 | | | | 1,443,217 | |
Refunding, Series A, 4.00%, 6/01/37 | | | 5,000,000 | | | | 5,283,150 | |
| | | | | | | | |
| | |
| | | | | | | 759,855,558 | |
| | | | | | | | |
U.S. Territories 2.6% | | | | | | | | |
Puerto Rico 2.6% | | | | | | | | |
bPuerto Rico Electric Power Authority Power Revenue, | | | | | | | | |
Series WW, 5.25%, 7/01/33 | | | 6,500,000 | | | | 4,460,625 | |
Series WW, 5.50%, 7/01/38 | | | 5,200,000 | | | | 3,581,500 | |
Series XX, 5.25%, 7/01/40 | | | 19,135,000 | | | | 13,131,394 | |
| | | | | | | | |
| | |
| | | | | | | 21,173,519 | |
| | | | | | | | |
Total Municipal Bonds before Short Term Investments (Cost $770,305,681) | | | | | | | 781,029,077 | |
| | | | | | | | |
| | |
Short Term Investments 3.5% | | | | | | | | |
| | |
Municipal Bonds 3.5% | | | | | | | | |
North Carolina 3.5% | | | | | | | | |
cThe Charlotte-Mecklenburg Hospital Authority Health Care Revenue, | | | | | | | | |
Carolinas HealthCare System, Refunding, Series B, SPA JPMorgan Chase Bank, Daily VRDN and Put, 1.71%, 1/15/38 | | | 5,230,000 | | | | 5,230,000 | |
Carolinas HealthCare System, Refunding, Series C, SPA JPMorgan Chase Bank, Daily VRDN and Put, 1.71%, 1/15/37 | | | 200,000 | | | | 200,000 | |
The Charlotte-Mecklenburg Hospital Authority Revenue, Carolinas HealthCare System, Series E, LOC TD | | | | | | | | |
Bank National Association, Daily VRDN and Put, 1.68%, 1/15/44 | | | 23,200,000 | | | | 23,200,000 | |
| | | | | | | | |
Total Short Term Investments (Cost $28,630,000) | | | | | | | 28,630,000 | |
| | | | | | | | |
Total Investments (Cost $798,935,681) 98.3% | | | | | | | 809,659,077 | |
Other Assets, less Liabilities 1.7% | | | | | | | 14,237,631 | |
| | | | | | | | |
Net Assets 100.0% | | | | | | $ | 823,896,708 | |
| | | | | | | | |
See Abbreviations on page 183.
aSecurity purchased on a when-issued basis. See Note 1(b).
bSee Note 7 regarding defaulted securities.
cVariable rate demand notes (VRDNs) are obligations which contain a floating or variable interest rate adjustment formula and an unconditional right of demand to receive payment of the principal balance plus accrued interest at specified dates. Unless otherwise noted, the coupon rate is determined based on factors including supply and demand, underlying credit, tax treatment, and current short term rates. The coupon rate shown represents the rate at period end.
| | | | | | | | |
franklintempleton.com | | | | The accompanying notes are an integral part of these financial statements. | | | Annual Report | | 141 |
FRANKLIN TAX-FREE TRUST
Financial Highlights
Franklin VirginiaTax-Free Income Fund
| | |
| | | Year Ended
February 28,
2019a |
| |
Class A | | |
| |
Per share operating performance | | |
(for a share outstanding throughout the year) | | |
| |
Net asset value, beginning of year | | $10.87 |
| |
Income from investment operationsb: | | |
| |
Net investment incomec | | 0.15 |
| |
Net realized and unrealized gains (losses) | | 0.05 |
| |
Total from investment operations | | 0.20 |
| |
Less distributions from net investment income | | (0.15) |
| |
Net asset value, end of year | | $10.92 |
| |
Total returnd | | 1.90% |
| |
Ratios to average net assetse | | |
| |
Expensesf | | 0.84% |
| |
Net investment income | | 3.01% |
| |
Supplemental data | | |
| |
Net assets, end of year (000’s) | | $39,565 |
| |
Portfolio turnover rate | | 9.60% |
aFor the period September 10, 2018 (effective date) to February 28, 2019.
bThe amount shown for a share outstanding throughout the period may not correlate with the Statement of Operations for the period due to the timing of sales and repurchases of the Fund’s shares in relation to income earned and/or fluctuating fair value of the investments of the Fund.
cBased on average daily shares outstanding.
dTotal return does not reflect sales commissions or contingent deferred sales charges, if applicable, and is not annualized for periods less than one year.
eRatios are annualized for periods less than one year.
fBenefit of expense reduction rounds to less than 0.01%.
| | | | | | |
142 | | Annual Report | | | The accompanying notes are an integral part of these financial statements. | | franklintempleton.com |
FRANKLIN TAX-FREE TRUST
FINANCIAL HIGHLIGHTS
Franklin VirginiaTax-Free Income Fund(continued)
| | | | | | | | | | | | | | | | | | | | |
| | | | | | Year Ended February 28, | | | | |
| | | | |
| | | | 2019 | | | | 2018 | | | | 2017 | | | | 2016 | a | | | 2015 | |
| | | | | |
Class A1 | | | | | | | | | | | | | | | | | | | | |
| | | | | |
Per share operating performance | | | | | | | | | | | | | | | | | | | | |
(for a share outstanding throughout the year) | | | | | | | | | | | | | | | | | | | | |
| | | | | |
| Net asset value, beginning of year | | | $10.91 | | | | $11.31 | | | | $11.54 | | | | $11.65 | | | | $11.42 | |
| | | | | |
Income from investment operationsb: | | | | | | | | | | | | | | | | | | | | |
| | | | | |
Net investment incomec | | | 0.34 | | | | 0.35 | | | | 0.40 | | | | 0.42 | | | | 0.44 | |
| | | | | |
Net realized and unrealized gains (losses) | | | — | d | | | (0.39 | ) | | | (0.23 | ) | | | (0.11 | ) | | | 0.23 | |
| | | | | |
Total from investment operations | | | 0.34 | | | | (0.04 | ) | | | 0.17 | | | | 0.31 | | | | 0.67 | |
| | | | | |
Less distributions from net investment income | | | (0.34 | ) | | | (0.36 | ) | | | (0.40 | ) | | | (0.42 | ) | | | (0.44) | |
| | | | | |
Net asset value, end of year | | | $10.91 | | | | $10.91 | | | | $11.31 | | | | $11.54 | | | | $11.65 | |
| | | | | |
Total returne | | | 3.22% | | | | (0.34)% | | | | 1.51% | | | | 2.72% | | | | 5.97% | |
| | | | | |
Ratios to average net assets | | | | | | | | | | | | | | | | | | | | |
| | | | | |
Expenses | | | 0.69% | f | | | 0.68% | g | | | 0.65% | | | | 0.65% | | | | 0.65% | |
| | | | | |
Net investment income | | | 3.16% | | | | 3.15% | | | | 3.46% | | | | 3.65% | | | | 3.82% | |
| | | | | |
Supplemental data | | | | | | | | | | | | | | | | | | | | |
| | | | | |
Net assets, end of year (000’s) | | | $402,739 | | | | $454,423 | | | | $509,170 | | | | $540,857 | | | | $558,068 | |
| | | | | |
Portfolio turnover rate | | | 9.60% | | | | 9.87% | | | | 17.44% | | | | 5.30% | | | | 8.16% | |
aFor the year ended February 29.
bThe amount shown for a share outstanding throughout the period may not correlate with the Statement of Operations for the period due to the timing of sales and repurchases of the Fund’s shares in relation to income earned and/or fluctuating fair value of the investments of the Fund.
cBased on average daily shares outstanding.
dAmount rounds to less than $0.01 per share.
eTotal return does not reflect sales commissions or contingent deferred sales charges, if applicable.
fBenefit of expense reduction rounds to less than 0.01%.
gBenefit of waiver and payments by affiliates rounds to less than 0.01%.
| | | | | | | | |
franklintempleton.com | | | | The accompanying notes are an integral part of these financial statements. | | | Annual Report | | 143 |
FRANKLIN TAX-FREE TRUST
FINANCIAL HIGHLIGHTS
Franklin VirginiaTax-Free Income Fund(continued)
| | | | | | | | | | | | | | | | | | | | |
| | | | | | Year Ended February 28, | | | | |
| | | | |
| | | | 2019 | | | | 2018 | | | | 2017 | | | | 2016 | a | | | 2015 | |
| | | | | |
Class C | | | | | | | | | | | | | | | | | | | | |
| | | | | |
Per share operating performance | | | | | | | | | | | | | | | | | | | | |
(for a share outstanding throughout the year) | | | | | | | | | | | | | | | | | | | | |
| | | | | |
| Net asset value, beginning of year | | | $11.09 | | | | $11.49 | | | | $11.72 | | | | $11.82 | | | | $11.58 | |
| | | | | |
Income from investment operationsb: | | | | | | | | | | | | | | | | | | | | |
| | | | | |
Net investment incomec | | | 0.29 | | | | 0.30 | | | | 0.34 | | | | 0.36 | | | | 0.38 | |
| | | | | |
Net realized and unrealized gains (losses) | | | — | d | | | (0.40 | ) | | | (0.23 | ) | | | (0.11 | ) | | | 0.24 | |
| | | | | |
Total from investment operations | | | 0.29 | | | | (0.10 | ) | | | 0.11 | | | | 0.25 | | | | 0.62 | |
| | | | | |
Less distributions from net investment income | | | (0.28 | ) | | | (0.30 | ) | | | (0.34 | ) | | | (0.35 | ) | | | (0.38) | |
| | | | | |
Net asset value, end of year | | | $11.10 | | | | $11.09 | | | | $11.49 | | | | $11.72 | | | | $11.82 | |
| | | | | |
Total returne | | | 2.68% | | | | (0.89)% | | | | 0.92% | | | | 2.20% | | | | 5.39% | |
| | | | | |
Ratios to average net assets | | | | | | | | | | | | | | | | | | | | |
| | | | | |
Expenses | | | 1.24% | f | | | 1.23% | g | | | 1.20% | | | | 1.20% | | | | 1.20% | |
| | | | | |
Net investment income | | | 2.61% | | | | 2.60% | | | | 2.91% | | | | 3.10% | | | | 3.27% | |
| | | | | |
Supplemental data | | | | | | | | | | | | | | | | | | | | |
| | | | | |
Net assets, end of year (000’s) | | | $62,041 | | | | $90,666 | | | | $107,936 | | | | $110,753 | | | | $116,566 | |
| | | | | |
Portfolio turnover rate | | | 9.60% | | | | 9.87% | | | | 17.44% | | | | 5.30% | | | | 8.16% | |
aFor the year ended February 29.
bThe amount shown for a share outstanding throughout the period may not correlate with the Statement of Operations for the period due to the timing of sales and repurchases of the Fund’s shares in relation to income earned and/or fluctuating fair value of the investments of the Fund.
cBased on average daily shares outstanding.
dAmount rounds to less than $0.01 per share.
eTotal return does not reflect sales commissions or contingent deferred sales charges, if applicable.
fBenefit of expense reduction rounds to less than 0.01%.
gBenefit of waiver and payments by affiliates rounds to less than 0.01%.
| | | | | | |
144 | | Annual Report | | | The accompanying notes are an integral part of these financial statements. | | franklintempleton.com |
FRANKLIN TAX-FREE TRUST
FINANCIAL HIGHLIGHTS
Franklin VirginiaTax-Free Income Fund(continued)
| | | | | | |
| | | Year Ended February 28, |
| | | 2019 | | | 2018a |
| | |
Class R6 | | | | | | |
| | |
Per share operating performance | | | | | | |
(for a share outstanding throughout the year) | | | | | | |
| | |
| Net asset value, beginning of year | | | $10.91 | | | $11.25 |
| | |
Income from investment operationsb: | | | | | | |
| | |
Net investment incomec | | | 0.36 | | | 0.22 |
| | |
Net realized and unrealized gains (losses) | | | 0.01 | | | (0.35) |
| | |
Total from investment operations | | | 0.37 | | | (0.13) |
| | |
Less distributions from net investment income | | | (0.36 | ) | | (0.21) |
| | |
Net asset value, end of year | | | $10.92 | | | $10.91 |
| | |
Total returnd | | | 3.44% | | | (1.14)% |
| | |
Ratios to average net assetse | | | | | | |
| | |
Expenses before waiver and payments by affiliates | | | 0.57% | | | 0.57% |
| | |
Expenses net of waiver and payments by affiliates | | | 0.55% | f | | 0.54% |
| | |
Net investment income | | | 3.30% | | | 3.29% |
| | |
Supplemental data | | | | | | |
| | |
Net assets, end of year (000’s) | | | $4,947 | | | $5,028 |
| | |
Portfolio turnover rate | | | 9.60% | | | 9.87% |
aFor the period August 1, 2017 (effective date) to February 28, 2018.
bThe amount shown for a share outstanding throughout the period may not correlate with the Statement of Operations for the period due to the timing of sales and repurchases of the Fund’s shares in relation to income earned and/or fluctuating fair value of the investments of the Fund.
cBased on average daily shares outstanding.
dTotal return is not annualized for periods less than one year.
eRatios are annualized for periods less than one year.
fBenefit of expense reduction rounds to less than 0.01%.
| | | | | | | | |
franklintempleton.com | | | | The accompanying notes are an integral part of these financial statements. | | | Annual Report | | 145 |
FRANKLIN TAX-FREE TRUST
FINANCIAL HIGHLIGHTS
Franklin VirginiaTax-Free Income Fund(continued)
| | | | | | | | | | | | | | | | | | | | |
| | | | | | Year Ended February 28, | | | | |
| | | | |
| | | | 2019 | | | | 2018 | | | | 2017 | | | | 2016 | a | | | 2015 | |
| | | | | |
Advisor Class | | | | | | | | | | | | | | | | | | | | |
| | | | | |
Per share operating performance | | | | | | | | | | | | | | | | | | | | |
(for a share outstanding throughout the year) | | | | | | | | | | | | | | | | | | | | |
| | | | | |
| Net asset value, beginning of year | | | $10.92 | | | | $11.31 | | | | $11.54 | | | | $11.65 | | | | $11.42 | |
| | | | | |
Income from investment operationsb: | | | | | | | | | | | | | | | | | | | | |
| | | | | |
Net investment incomec | | | 0.35 | | | | 0.36 | | | | 0.41 | | | | 0.43 | | | | 0.46 | |
| | | | | |
Net realized and unrealized gains (losses) | | | 0.01 | | | | (0.38 | ) | | | (0.22 | ) | | | (0.11 | ) | | | 0.22 | |
| | | | | |
Total from investment operations | | | 0.36 | | | | (0.02 | ) | | | 0.19 | | | | 0.32 | | | | 0.68 | |
| | | | | |
Less distributions from net investment income | | | (0.36 | ) | | | (0.37 | ) | | | (0.42 | ) | | | (0.43 | ) | | | (0.45) | |
| | | | | |
Net asset value, end of year | | | $10.92 | | | | $10.92 | | | | $11.31 | | | | $11.54 | | | | $11.65 | |
| | | | | |
Total return | | | 3.32% | | | | (0.15)% | | | | 1.60% | | | | 2.82% | | | | 6.07% | |
| | | | | |
Ratios to average net assets | | | | | | | | | | | | | | | | | | | | |
| | | | | |
Expenses | | | 0.59% | d | | | 0.58% | e | | | 0.55% | | | | 0.55% | | | | 0.55% | |
| | | | | |
Net investment income | | | 3.26% | | | | 3.25% | | | | 3.56% | | | | 3.75% | | | | 3.92% | |
| | | | | |
Supplemental data | | | | | | | | | | | | | | | | | | | | |
| | | | | |
Net assets, end of year (000’s) | | | $84,880 | | | | $85,293 | | | | $87,359 | | | | $52,952 | | | | $46,724 | |
| | | | | |
Portfolio turnover rate | | | 9.60% | | | | 9.87% | | | | 17.44% | | | | 5.30% | | | | 8.16% | |
aFor the year ended February 29.
bThe amount shown for a share outstanding throughout the period may not correlate with the Statement of Operations for the period due to the timing of sales and repurchases of the Fund’s shares in relation to income earned and/or fluctuating fair value of the investments of the Fund.
cBased on average daily shares outstanding.
dBenefit of expense reduction rounds to less than 0.01%.
eBenefit of waiver and payments by affiliates rounds to less than 0.01%.
| | | | | | |
146 | | Annual Report | | | The accompanying notes are an integral part of these financial statements. | | franklintempleton.com |
FRANKLIN TAX-FREE TRUST
Statement of Investments, February 28, 2019
Franklin VirginiaTax-Free Income Fund
| | | | | | | | |
| | | Principal
Amount | | | Value | |
| Municipal Bonds 97.6% | | | | | | | | |
Virginia 88.3% | | | | | | | | |
Bristol Utility System Revenue, AGMC Insured, ETM, 5.00%, 7/15/21 | | | $ 780,000 | | | | $ 811,629 | |
Chesterfield County EDA, PCR, Virginia Electric and Power Co. Project, Refunding, Series A, 5.00%, 5/01/23 | | | 5,000,000 | | | | 5,022,850 | |
Chesterfield County EDA Revenue, | | | | | | | | |
Bon Secours Health System Inc., SeriesC-1, AGMC Insured,Pre-Refunded, 5.00%, 11/01/42 | | | 2,250,000 | | | | 2,366,685 | |
Bon Secours Health System Inc., SeriesC-2, Assured Guaranty,Pre-Refunded, 5.00%, 11/01/42 | | | 8,000,000 | | | | 8,414,880 | |
Fairfax County EDA Residential Care Facilities Mortgage Revenue, | | | | | | | | |
Goodwin House Inc., Refunding, Series A, 4.00%, 10/01/42 | | | 1,500,000 | | | | 1,453,950 | |
Goodwin House Inc., Refunding, Series A, 5.00%, 10/01/42 | | | 5,840,000 | | | | 6,266,378 | |
Fairfax County EDA Revenue, Metrorail Parking System Project, 5.00%, 4/01/42 | | | 5,085,000 | | | | 5,769,594 | |
Fairfax County EDA Transportation District Improvement Revenue, Silver Line Phase I Project, Pre- Refunded, 5.00%, 4/01/36 | | | 10,000,000 | | | | 10,365,200 | |
Fairfax County IDAR, | | | | | | | | |
Health Care, Inova Health System Project, Series A, 5.00%, 5/15/44 | | | 2,500,000 | | | | 2,735,200 | |
Health Care, Inova Health System Project, Series A, 4.00%, 5/15/48 | | | 5,000,000 | | | | 5,129,600 | |
Health Care, Inova Health System Project, Series A,Pre-Refunded, 5.50%, 5/15/35 | | | 10,000,000 | | | | 10,076,999 | |
Health Care, Inova Health System Project, Series C,Pre-Refunded, 5.00%, 5/15/25 | | | 3,500,000 | | | | 3,523,520 | |
Fairfax County Sewer Revenue, 5.00%, 7/15/37 | | | 2,760,000 | | | | 3,224,260 | |
Fairfax County Water Authority Revenue, | | | | | | | | |
Refunding, 5.00%, 4/01/43 | | | 3,510,000 | | | | 4,034,569 | |
Refunding, 5.00%, 4/01/47 | | | 5,000,000 | | | | 5,734,950 | |
Farmville IDA Facilities Revenue, Educational Facilities, Longwood University Student Housing Projects, Refunding, Series A, 5.00%, 1/01/48 | | | 5,000,000 | | | | 5,310,750 | |
Hampton Roads Sanitation District Wastewater Revenue, | | | | | | | | |
Refunding, Subordinate, Series A, 5.00%, 8/01/31 | | | 6,200,000 | | | | 7,292,936 | |
Refunding, Subordinate, Series A, 5.00%, 8/01/33 | | | 5,115,000 | | | | 5,965,522 | |
Refunding, Subordinate, Series A, 5.00%, 8/01/43 | | | 11,840,000 | | | | 13,422,890 | |
Hampton Roads Transportation Accountability Commission Revenue, Transportation Fund, senior lien, Series A, 5.00%, 7/01/48 | | | 15,000,000 | | | | 17,177,250 | |
Henrico County EDA Revenue, Bon Secours Health System Inc.,Pre-Refunded, 5.00%, 11/01/30 | | | 7,000,000 | | | | 7,781,550 | |
Hopewell Sewer System Revenue, Refunding, Series A, 5.00%, 7/15/42 | | | 4,850,000 | | | | 5,144,055 | |
Lexington IDA Educational Facilities Revenue, | | | | | | | | |
VMI Development Board Inc. Project, Series C,Pre-Refunded, 5.00%, 12/01/36 | | | 5,000,000 | | | | 5,040,900 | |
Washington and Lee University, 5.00%, 1/01/43. | | | 10,000,000 | | | | 10,790,700 | |
Washington and Lee University, Refunding, Series A, 5.00%, 1/01/35 | | | 1,105,000 | | | | 1,301,845 | |
Washington and Lee University, Refunding, Series A, 5.00%, 1/01/48 | | | 1,500,000 | | | | 1,723,440 | |
Lexington IDA Residential Care Facility Revenue, | | | | | | | | |
Kendal at Lexington, Series A, 5.00%, 1/01/42 | | | 1,000,000 | | | | 1,062,230 | |
Kendal at Lexington, Series A, 5.00%, 1/01/48 | | | 1,250,000 | | | | 1,323,175 | |
Loudoun County Sanitation Authority Water and Sewer Revenue, Refunding, 5.00%, 1/01/29 | | | 4,770,000 | | | | 5,588,150 | |
Lynchburg EDA Hospital Revenue, Centra Health Obligated Group, Refunding, Series A, 5.00%, 1/01/47 | | | 4,500,000 | | | | 4,997,925 | |
Norfolk GO, | | | | | | | | |
Capital Improvement, Series A, 5.00%, 10/01/41 | | | 1,040,000 | | | | 1,192,329 | |
Capital Improvement, Series A, 5.00%, 10/01/46 | | | 2,500,000 | | | | 2,850,125 | |
Capital Improvement, Series A,Pre-Refunded, 5.00%, 8/01/32 | | | 5,845,000 | | | | 6,671,483 | |
Capital Improvement, Series C,Pre-Refunded, 5.00%, 10/01/42 | | | 7,825,000 | | | | 8,369,072 | |
Norfolk Water Revenue, | | | | | | | | |
5.00%, 11/01/43 | | | 6,920,000 | | | | 7,956,893 | |
5.00%, 11/01/47 | | | 6,925,000 | | | | 7,952,047 | |
Northern Virginia Transportation Authority Transportation Special Tax Revenue, 5.00%, 6/01/33 | | | 3,000,000 | | | | 3,429,930 | |
| | | | | | | | |
franklintempleton.com | | | | | | Annual Report | | 147 |
FRANKLIN TAX-FREE TRUST
STATEMENT OF INVESTMENTS
Franklin VirginiaTax-Free Income Fund(continued)
| | | | | | | | |
| | | Principal
Amount | | | Value | |
Municipal Bonds(continued) | | | | | | | | |
Virginia(continued) | | | | | | | | |
Portsmouth GO, | | | | | | | | |
Public Utility, Refunding, Series A, 5.00%, 7/15/41 | | | $ 4,010,000 | | | | $ 4,387,060 | |
Public Utility, Series A,Pre-Refunded, 5.00%, 7/15/41 | | | 5,990,000 | | | | 6,639,735 | |
Prince Edward County IDA Educational Facilities Revenue, Hampden-Sydney College Project, 5.00%, 9/01/48 | | | 2,050,000 | | | | 2,282,839 | |
Prince William County IDA Health Care Facilities Revenue, Novant Health Obligated Group, Prince William Hospital, Refunding, Series B, 5.00%, 11/01/46 | | | 10,000,000 | | | | 10,736,000 | |
Prince William County IDA Revenue, George Mason University Foundation, Prince William Life Sciences Lab LLC Project, Series AA,Pre-Refunded, 5.125%, 9/01/41 | | | 3,200,000 | | | | 3,467,104 | |
Richmond Public Utility Revenue, | | | | | | | | |
Refunding, Series A, 5.00%, 1/15/33 | | | 10,000,000 | | | | 11,532,500 | |
Refunding, Series A, 5.00%, 1/15/43 | | | 10,000,000 | | | | 11,031,700 | |
Riverside Regional Jail Authority Jail Facility Revenue, Refunding, 5.00%, 7/01/31 | | | 6,215,000 | | | | 7,250,108 | |
Roanoke EDA Hospital Revenue, Carilion Clinic Obligated Group, Refunding, 5.00%, 7/01/33 | | | 10,615,000 | | | | 11,029,834 | |
Roanoke IDA Hospital Revenue, | | | | | | | | |
Carilion Health System Obligated Group, Series B, AGMC Insured, 5.00%, 7/01/38 | | | 3,950,000 | | | | 4,079,086 | |
Carilion Health System Obligated Group, Series B, Assured Guaranty,Pre-Refunded, 5.00%, 7/01/38 | | | 50,000 | | | | 52,179 | |
Smyth County GO, Public Improvement, Series A,Pre-Refunded, 5.00%, 11/01/31 | | | 4,145,000 | | | | 4,500,102 | |
Stafford County and Staunton IDAR, Virginia Municipal League Assn. of Counties Finance Program, XLCA Insured, 5.00%, 8/01/37 | | | 960,000 | | | | 961,046 | |
Suffolk GO, | | | | | | | | |
Pre-Refunded, 5.00%, 2/01/41 | | | 7,395,000 | | | | 7,855,487 | |
Pre-Refunded, 5.00%, 2/01/41 | | | 2,605,000 | | | | 2,772,293 | |
Pre-Refunded, 5.00%, 6/01/42 | | | 10,000,000 | | | | 10,747,800 | |
University of Virginia Revenue, | | | | | | | | |
General, Pledge, Refunding, Series A, 5.00%, 6/01/43 | | | 15,000,000 | | | | 16,578,150 | |
General, Pledge, Refunding, Series A, 5.00%, 4/01/47 | | | 9,630,000 | | | | 11,052,929 | |
Upper Occoquan Sewage Authority Regional Sewerage Revenue, Refunding, Series B, 4.00%, 7/01/35 | | | 6,165,000 | | | | 6,561,471 | |
Virginia Beach Development Authority Residential Care Facility Revenue, | | | | | | | | |
Westminster-Canterbury on Chesapeake Bay, Refunding, 5.00%, 9/01/40 | | | 1,750,000 | | | | 1,947,103 | |
Westminster-Canterbury on Chesapeake Bay, Refunding, 5.00%, 9/01/44 | | | 2,215,000 | | | | 2,456,236 | |
Virginia College Building Authority Educational Facilities Revenue, | | | | | | | | |
21st Century College and Equipment Programs, Series A, 4.00%, 2/01/30 | | | 7,000,000 | | | | 7,616,910 | |
Liberty University Projects, 5.25%, 3/01/29 | | | 2,860,000 | | | | 2,958,270 | |
Liberty University Projects, 5.00%, 3/01/41 | | | 26,855,000 | | | | 27,655,548 | |
Public Higher Education Financing Program, Refunding, Series A, 5.00%, 9/01/27 | | | 4,000,000 | | | | 4,818,120 | |
Washington and Lee University, Refunding, Series A, 5.00%, 1/01/40 | | | 5,000,000 | | | | 5,680,150 | |
Virginia Port Authority Port Facilities Revenue,Pre-Refunded, 5.00%, 7/01/40 | | | 6,000,000 | | | | 6,065,880 | |
Virginia Small Business Financing Authority Revenue, Transform 66 P3 Project, 5.00%, 12/31/47 | | | 1,600,000 | | | | 1,731,056 | |
Virginia State Commonwealth Transportation Board Revenue, | | | | | | | | |
Federal Transportation Grant Anticipation Notes, 5.00%, 9/15/30 | | | 2,260,000 | | | | 2,685,242 | |
Federal Transportation Grant Anticipation Notes, 5.00%, 9/15/31 | | | 4,000,000 | | | | 4,722,280 | |
Virginia State HDA Revenue, | | | | | | | | |
Rental Housing, Series B, 5.625%, 6/01/39 | | | 7,240,000 | | | | 7,304,291 | |
Rental Housing, Series B, 5.00%, 6/01/45 | | | 3,050,000 | | | | 3,111,122 | |
Rental Housing, Series E, 5.00%, 10/01/44 | | | 6,540,000 | | | | 6,551,903 | |
Rental Housing, Series F, 5.05%, 12/01/44 | | | 12,125,000 | | | | 12,197,507 | |
Rental Housing, Series F, 5.00%, 4/01/45 | | | 2,125,000 | | | | 2,154,452 | |
Virginia State Public School Authority Revenue, | | | | | | | | |
School Financing, 1997 Resolution, Refunding, Series B, 5.00%, 8/01/24 | | | 10,000,000 | | | | 11,670,500 | |
School Financing, 1997 Resolution, Series B, 5.00%, 8/01/30 | | | 5,280,000 | | | | 6,471,802 | |
| | | | | | |
148 | | Annual Report | | | | franklintempleton.com |
FRANKLIN TAX-FREE TRUST
STATEMENT OF INVESTMENTS
Franklin VirginiaTax-Free Income Fund(continued)
| | | | | | | | |
| | | Principal
Amount | | | Value | |
Municipal Bonds(continued) | | | | | | | | |
Virginia(continued) | | | | | | | | |
Virginia State Resources Authority Infrastructure Revenue, | | | | | | | | |
State Moral Obligation, Virginia Pooled Financing Program, Refunding, Series B, 5.00%, 11/01/41 | | $ | 3,630,000 | | | $ | 3,917,351 | |
State Moral Obligation, Virginia Pooled Financing Program, Refunding, Series C, 5.00%, 11/01/48 | | | 7,655,000 | | | | 8,888,450 | |
State Moral Obligation, Virginia Pooled Financing Program, Series B,Pre-Refunded, 5.00%, 11/01/41 | | | 5,780,000 | | | | 6,290,952 | |
Virginia Pooled Financing Program, Refunding, 5.00%, 11/01/45 | | | 5,255,000 | | | | 6,113,247 | |
Virginia Pooled Financing Program, Senior Series A, 5.00%, 11/01/38 | | | 135,000 | | | | 135,331 | |
Virginia Pooled Financing Program, Series A, 5.00%, 11/01/38 | | | 5,165,000 | | | | 6,039,796 | |
Virginia State Small Business Financing Authority Healthcare Facilities Revenue, Sentara Healthcare, Refunding, 5.00%, 11/01/40 | | | 23,000,000 | | | | 23,806,380 | |
Virginia State Small Business Financing Authority Private Activity Revenue, Transform 66 P3 Project, 5.00%, 12/31/49 | | | 5,000,000 | | | | 5,398,450 | |
Winchester EDA Hospital Revenue, Valley Health System Obligated Group, Refunding, 5.00%, 1/01/44 | | | 5,000,000 | | | | 5,457,100 | |
| | | | | | | | |
| | |
| | | | | | | 524,638,313 | |
| | | | | | | | |
District of Columbia 7.7% | | | | | | | | |
Metropolitan Washington Airports Authority Airport System Revenue, | | | | | | | | |
Refunding, Series A, 5.00%, 10/01/35 | | | 12,000,000 | | | | 12,525,120 | |
Refunding, Series B, BHAC Insured, 5.00%, 10/01/29 | | | 3,000,000 | | | | 3,056,190 | |
Metropolitan Washington Airports Authority Dulles Toll Road Revenue, | | | | | | | | |
Dulles Metrorail and Capital Improvement Projects, first senior lien, Series A, 5.00%, 10/01/39 | | | 10,000,000 | | | | 10,157,200 | |
Dulles Metrorail and Capital Improvement Projects, first senior lien, Series A, 5.25%, 10/01/44 | | | 12,000,000 | | | | 12,187,680 | |
Washington Metropolitan Area Transit Authority Gross Revenue, | | | | | | | | |
Transit, Series A,Pre-Refunded, 5.125%, 7/01/32 | | | 2,000,000 | | | | 2,023,360 | |
Transit, Series B, 5.00%, 7/01/42 | | | 5,000,000 | | | | 5,684,600 | |
| | | | | | | | |
| | |
| | | | | | | 45,634,150 | |
| | | | | | | | |
U.S. Territories 1.6% | | | | | | | | |
Puerto Rico 1.6% | | | | | | | | |
aPuerto Rico Electric Power Authority Power Revenue, | | | | | | | | |
Series WW, 5.50%, 7/01/38 | | | 5,200,000 | | | | 3,581,500 | |
Series XX, 5.25%, 7/01/40 | | | 8,400,000 | | | | 5,764,500 | |
| | | | | | | | |
| | |
| | | | | | | 9,346,000 | |
| | | | | | | | |
Total Municipal Bonds before Short Term Investments (Cost $565,662,524) | | | | | | | 579,618,463 | |
| | | | | | | | |
| | | | | | | | |
franklintempleton.com | | | | | | Annual Report | | 149 |
FRANKLINTAX-FREE TRUST
STATEMENT OF INVESTMENTS
Franklin VirginiaTax-Free Income Fund(continued)
| | | | | | | | |
| | | Principal
Amount | | | Value | |
| | |
Short Term Investments 1.4% | | | | | | | | |
| | |
Municipal Bonds 1.4% | | | | | | | | |
Virginia 1.4% | | | | | | | | |
bAlbemarle County EDA Hospital Facilities Revenue, Sentara Martha Jefferson Hospital, Refunding, Series B, SPA TD Bank National Association, Daily VRDN and Put, 1.67%, 10/01/48 | | $ | 6,800,000 | | | $ | 6,800,000 | |
bVirginia College Building Authority Educational Facilities Revenue, University of Richmond Project, SPA Wells Fargo Bank, Daily VRDN and Put, 1.66%, 11/01/36 | | | 1,790,000 | | | | 1,790,000 | |
| | | | | | | | |
Total Short Term Investments (Cost $8,590,000) | | | | | | | 8,590,000 | |
| | | | | | | | |
Total Investments (Cost $574,252,524) 99.0% | | | | | | | 588,208,463 | |
Other Assets, less Liabilities 1.0% | | | | | | | 5,963,269 | |
| | | | | | | | |
Net Assets 100.0% | | | | | | $ | 594,171,732 | |
| | | | | | | | |
See Abbreviations on page 183.
aSee Note 7 regarding defaulted securities.
bVariable rate demand notes (VRDNs) are obligations which contain a floating or variable interest rate adjustment formula and an unconditional right of demand to receive payment of the principal balance plus accrued interest at specified dates. Unless otherwise noted, the coupon rate is determined based on factors including supply and demand, underlying credit, tax treatment, and current short term rates. The coupon rate shown represents the rate at period end.
| | | | | | |
150 | | Annual Report | | | The accompanying notes are an integral part of these financial statements. | | franklintempleton.com |
FRANKLINTAX-FREE TRUST
Financial Statements
Statements of Assets and Liabilities
February 28, 2019
| | | | | | | | | | | | |
| | | Franklin
Alabama
Tax-Free
Income Fund | | | Franklin Florida
Tax-Free
Income Fund | | | Franklin
Georgia
Tax-Free
Income Fund | |
| |
| Assets: | | | | | | | | | | | | |
Investments in securities: | | | | | | | | | | | | |
Cost - Unaffiliated issuers | | $ | 224,210,195 | | | $ | 534,780,321 | | | $ | 436,891,754 | |
| | | | |
Value - Unaffiliated issuers | | $ | 232,202,022 | | | $ | 554,112,050 | | | $ | 445,546,816 | |
Cash | | | 868,787 | | | | 101,215 | | | | 906,762 | |
Receivables: | | | | | | | | | | | | |
Capital shares sold | | | 10,751 | | | | 22,896 | | | | 126,394 | |
Interest | | | 2,864,551 | | | | 6,511,121 | | | | 4,687,122 | |
Other assets | | | 259 | | | | 611 | | | | 491 | |
| | | | |
Total assets | | | 235,946,370 | | | | 560,747,893 | | | | 451,267,585 | |
| | | | |
Liabilities: | | | | | | | | | | | | |
Payables: | | | | | | | | | | | | |
Capital shares redeemed | | | 268,625 | | | | 1,162,199 | | | | 670,985 | |
Management fees | | | 108,397 | | | | 230,182 | | | | 189,400 | |
Distribution fees | | | 31,174 | | | | 60,606 | | | | 64,296 | |
Transfer agent fees | | | 20,323 | | | | 53,823 | | | | 50,618 | |
Distributions to shareholders | | | 68,308 | | | | 316,386 | | | | 135,402 | |
Accrued expenses and other liabilities | | | 25,373 | | | | 37,712 | | | | 41,866 | |
| | | | |
Total liabilities | | | 522,200 | | | | 1,860,908 | | | | 1,152,567 | |
| | | | |
Net assets, at value | | $ | 235,424,170 | | | $ | 558,886,985 | | | $ | 450,115,018 | |
| | | | |
Net assets consist of: | | | | | | | | | | | | |
Paid-in capital | | $ | 244,685,806 | | | $ | 602,879,127 | | | $ | 463,925,465 | |
Total distributable earnings (loss) | | | (9,261,636 | ) | | | (43,992,142 | ) | | | (13,810,447 | ) |
| | | | |
Net assets, at value | | $ | 235,424,170 | | | $ | 558,886,985 | | | $ | 450,115,018 | |
| | | | |
| | | | | | | | |
franklintempleton.com | | | | The accompanying notes are an integral part of these financial statements. | | | Annual Report | | 151 |
FRANKLIN TAX-FREE TRUST
FINANCIAL STATEMENTS
Statements of Assets and Liabilities(continued)
February 28, 2019
| | | | | | | | | | | | |
| | | Franklin
Alabama
Tax-Free
Income Fund | | | Franklin
Florida
Tax-Free
Income Fund | | | Franklin
Georgia
Tax-Free
Income Fund | |
| |
Class A: | | | | | | | | | | | | |
Net assets, at value | | $ | 7,334,019 | | | $ | 29,085,757 | | | $ | 19,704,960 | |
| | | | |
Shares outstanding | | | 675,962 | | | | 2,785,786 | | | | 1,700,400 | |
| | | | |
Net asset value per sharea | | $ | 10.85 | | | $ | 10.44 | | | $ | 11.59 | |
| | | | |
Maximum offering price per share (net asset value per share ÷ 95.75%) | | $ | 11.33 | | | $ | 10.90 | | | $ | 12.10 | |
| | | | |
Class A1: | | | | | | | | | | | | |
Net assets, at value | | $ | 188,290,478 | | | $ | 462,869,104 | | | $ | 313,939,970 | |
| | | | |
Shares outstanding | | | 17,373,163 | | | | 44,371,845 | | | | 27,090,826 | |
| | | | |
Net asset value per sharea | | $ | 10.84 | | | $ | 10.43 | | | $ | 11.59 | |
| | | | |
Maximum offering price per share (net asset value per share ÷ 95.75%) | | $ | 11.32 | | | $ | 10.89 | | | $ | 12.10 | |
| | | | |
Class C: | | | | | | | | | | | | |
Net assets, at value | | $ | 30,641,162 | | | $ | 39,116,512 | | | $ | 72,542,245 | |
| | | | |
Shares outstanding | | | 2,789,618 | | | | 3,668,675 | | | | 6,164,825 | |
| | | | |
Net asset value and maximum offering price per sharea | | $ | 10.98 | | | $ | 10.66 | | | $ | 11.77 | |
| | | | |
Class R6: | | | | | | | | | | | | |
Net assets, at value | | $ | 823,965 | | | $ | 2,343,294 | | | $ | 3,785,668 | |
| | | | |
Shares outstanding | | | 76,015 | | | | 224,060 | | | | 326,592 | |
| | | | |
Net asset value and maximum offering price per share | | $ | 10.84 | | | $ | 10.46 | | | $ | 11.59 | |
| | | | |
Advisor Class: | | | | | | | | | | | | |
Net assets, at value | | $ | 8,334,546 | | | $ | 25,472,318 | | | $ | 40,142,175 | |
| | | | |
Shares outstanding | | | 768,921 | | | | 2,436,201 | | | | 3,462,729 | |
| | | | |
Net asset value and maximum offering price per share | | $ | 10.84 | | | $ | 10.46 | | | $ | 11.59 | |
| | | | |
aRedemption price is equal to net asset value less contingent deferred sales charges, if applicable.
| | | | | | |
152 | | Annual Report | | | The accompanying notes are an integral part of these financial statements. | | franklintempleton.com |
FRANKLIN TAX-FREE TRUST
FINANCIAL STATEMENTS
Statements of Assets and Liabilities(continued)
February 28, 2019
| | | | | | | | | | | | |
| | | Franklin
Kentucky
Tax-Free
Income Fund | | | Franklin
Louisiana
Tax-Free
Income Fund | | | Franklin
Maryland
Tax-Free
Income Fund | |
| |
Assets: | | | | | | | | | | | | |
Investments in securities: | | | | | | | | | | | | |
Cost - Unaffiliated issuers | | $ | 136,446,320 | | | $ | 354,229,725 | | | $ | 389,896,358 | |
| | | | |
Value - Unaffiliated issuers | | $ | 140,184,849 | | | $ | 364,232,446 | | | $ | 399,789,684 | |
Cash | | | 2,454,105 | | | | 27,693 | | | | 5,279,875 | |
Receivables: | | | | | | | | | | | | |
Capital shares sold | | | 64,998 | | | | 146,224 | | | | 496,383 | |
Interest | | | 1,829,697 | | | | 4,420,741 | | | | 4,163,367 | |
Other assets | | | 155 | | | | 401 | | | | 444 | |
| | | | |
Total assets | | | 144,533,804 | | | | 368,827,505 | | | | 409,729,753 | |
| | | | |
Liabilities: | | | | | | | | | | | | |
Payables: | | | | | | | | | | | | |
Capital shares redeemed | | | 211,948 | | | | 512,398 | | | | 628,347 | |
Management fees | | | 70,394 | | | | 158,622 | | | | 173,837 | |
Distribution fees | | | 10,377 | | | | 46,368 | | | | 54,396 | |
Transfer agent fees | | | 16,043 | | | | 34,689 | | | | 44,855 | |
Distributions to shareholders | | | 13,365 | | | | 43,636 | | | | 131,037 | |
Accrued expenses and other liabilities | | | 18,183 | | | | 30,110 | | | | 34,931 | |
| | | | |
Total liabilities | | | 340,310 | | | | 825,823 | | | | 1,067,403 | |
| | | | |
Net assets, at value | | $ | 144,193,494 | | | $ | 368,001,682 | | | $ | 408,662,350 | |
| | | | |
Net assets consist of: | | | | | | | | | | | | |
Paid-in capital | | $ | 150,100,987 | | | $ | 385,211,408 | | | $ | 439,807,168 | |
Total distributable earnings (loss) | | | (5,907,493 | ) | | | (17,209,726 | ) | | | (31,144,818 | ) |
| | | | |
Net assets, at value | | $ | 144,193,494 | | | $ | 368,001,682 | | | $ | 408,662,350 | |
| | | | |
| | | | | | |
franklintempleton.com | | The accompanying notes are an integral part of these financial statements. | | | Annual Report | | 153 |
FRANKLIN TAX-FREE TRUST
FINANCIAL STATEMENTS
Statements of Assets and Liabilities(continued)
February 28, 2019
| | | | | | | | | | | | |
| | | Franklin
Kentucky
Tax-Free
Income Fund | | | Franklin
Louisiana
Tax-Free
Income Fund | | | Franklin
Maryland
Tax-Free
Income Fund | |
| |
Class A: | | | | | | | | | | | | |
Net assets, at value | | $ | 2,785,258 | | | $ | 18,110,171 | | | $ | 26,572,194 | |
| | | | |
Shares outstanding | | | 258,964 | | | | 1,657,096 | | | | 2,461,395 | |
| | | | |
Net asset value per sharea | | $ | 10.76 | | | $ | 10.93 | | | $ | 10.80 | |
| | | | |
Maximum offering price per share (net asset value per share ÷ 95.75%) | | $ | 11.24 | | | $ | 11.42 | | | $ | 11.28 | |
| | | | |
Class A1: | | | | | | | | | | | | |
Net assets, at value | | $ | 130,267,193 | | | $ | 284,258,527 | | | $ | 279,750,001 | |
| | | | |
Shares outstanding | | | 12,121,201 | | | | 26,021,851 | | | | 25,904,720 | |
| | | | |
Net asset value per sharea | | $ | 10.75 | | | $ | 10.92 | | | $ | 10.80 | |
| | | | |
Maximum offering price per share (net asset value per share ÷ 95.75%) | | $ | 11.23 | | | $ | 11.40 | | | $ | 11.28 | |
| | | | |
Class C: | | | | | | | | | | | | |
Net assets, at value | | | | | | $ | 42,187,567 | | | $ | 56,322,662 | |
| | | | | | | | |
Shares outstanding | | | | | | | 3,799,066 | | | | 5,110,114 | |
| | | | | | | | |
Net asset value and maximum offering price per sharea | | | | | | $ | 11.10 | | | $ | 11.02 | |
| | | | | | | | |
Class R6: | | | | | | | | | | | | |
Net assets, at value | | $ | 1,843,403 | | | $ | 3,865,310 | | | $ | 1,753,178 | |
| | | | |
Shares outstanding | | | 171,448 | | | | 353,747 | | | | 162,103 | |
| | | | |
Net asset value and maximum offering price per share | | $ | 10.75 | | | $ | 10.93 | | | $ | 10.82 | |
| | | | |
Advisor Class: | | | | | | | | | | | | |
Net assets, at value | | $ | 9,297,640 | | | $ | 19,580,107 | | | $ | 44,264,315 | |
| | | | |
Shares outstanding | | | 864,756 | | | | 1,791,527 | | | | 4,094,064 | |
| | | | |
Net asset value and maximum offering price per share | | $ | 10.75 | | | $ | 10.93 | | | $ | 10.81 | |
| | | | |
aRedemption price is equal to net asset value less contingent deferred sales charges, if applicable.
| | | | | | |
154 | | Annual Report | | | The accompanying notes are an integral part of these financial statements. | | franklintempleton.com |
FRANKLIN TAX-FREE TRUST
FINANCIAL STATEMENTS
Statements of Assets and Liabilities(continued)
February 28, 2019
| | | | | | | | | | | | |
| | | Franklin
Missouri
Tax-Free Income Fund | | | Franklin
North Carolina
Tax-Free
Income Fund | | | Franklin
Virginia
Tax-Free
Income Fund | |
| |
Assets: | | | | | | | | | | | | |
Investments in securities: | | | | | | | | | | | | |
Cost - Unaffiliated issuers | | $ | 922,207,215 | | | $ | 798,935,681 | | | $ | 574,252,524 | |
| | | | |
Value - Unaffiliated issuers | | $ | 937,470,069 | | | $ | 809,659,077 | | | $ | 588,208,463 | |
Cash | | | 4,848,696 | | | | 9,008,134 | | | | 125,891 | |
Receivables: | | | | | | | | | | | | |
Capital shares sold | | | 528,503 | | | | 1,535,787 | | | | 181,683 | |
Interest | | | 11,843,311 | | | | 9,990,242 | | | | 7,266,143 | |
Other assets | | | 1,033 | | | | 891 | | | | 645 | |
| | | | |
Total assets | | | 954,691,612 | | | | 830,194,131 | | | | 595,782,825 | |
| | | | |
Liabilities: | | | | | | | | | | | | |
Payables: | | | | | | | | | | | | |
Investment securities purchased | | | — | | | | 4,100,747 | | | | — | |
Capital shares redeemed | | | 1,791,970 | | | | 1,409,828 | | | | 1,025,691 | |
Management fees | | | 377,270 | | | | 329,063 | | | | 243,441 | |
Distribution fees | | | 119,890 | | | | 106,319 | | | | 69,351 | |
Transfer agent fees | | | 100,368 | | | | 78,014 | | | | 67,654 | |
Distributions to shareholders | | | 195,462 | | | | 206,781 | | | | 159,653 | |
Accrued expenses and other liabilities | | | 83,130 | | | | 66,671 | | | | 45,303 | |
| | | | |
Total liabilities | | | 2,668,090 | | | | 6,297,423 | | | | 1,611,093 | |
| | | | |
Net assets, at value | | $ | 952,023,522 | | | $ | 823,896,708 | | | $ | 594,171,732 | |
| | | | |
Net assets consist of: | | | | | | | | | | | | |
Paid-in capital | | $ | 1,007,985,084 | | | $ | 901,352,687 | | | $ | 633,845,737 | |
Total distributable earnings (loss) | | | (55,961,562 | ) | | | (77,455,979 | ) | | | (39,674,005 | ) |
| | | | |
Net assets, at value | | $ | 952,023,522 | | | $ | 823,896,708 | | | $ | 594,171,732 | |
| | | | |
| | | | | | |
franklintempleton.com | | The accompanying notes are an integral part of these financial statements. | | | Annual Report | | 155 |
FRANKLIN TAX-FREE TRUST
FINANCIAL STATEMENTS
Statements of Assets and Liabilities(continued)
February 28, 2019
| | | | | | | | | | | | |
| | | Franklin
Missouri
Tax-Free
Income Fund | | | Franklin North Carolina Tax-Free Income Fund | | | Franklin
Virginia
Tax-Free
Income Fund | |
| |
Class A: | | | | | | | | | | | | |
Net assets, at value | | $ | 63,400,126 | | | $ | 49,191,563 | | | $ | 39,565,036 | |
| | | | |
Shares outstanding | | | 5,529,564 | | | | 4,352,606 | | | | 3,624,431 | |
| | | | |
Net asset value per sharea | | $ | 11.47 | | | $ | 11.30 | | | $ | 10.92 | |
| | | | |
Maximum offering price per share (net asset value per share ÷ 95.75%) | | $ | 11.98 | | | $ | 11.80 | | | $ | 11.40 | |
| | | | |
Class A1: | | | | | | | | | | | | |
Net assets, at value | | $ | 700,839,058 | | | $ | 577,051,835 | | | $ | 402,739,450 | |
| | | | |
Shares outstanding | | | 61,157,342 | | | | 51,072,505 | | | | 36,899,306 | |
| | | | |
Net asset value per sharea | | $ | 11.46 | | | $ | 11.30 | | | $ | 10.91 | |
| | | | |
Maximum offering price per share (net asset value per share ÷ 95.75%) | | $ | 11.97 | | | $ | 11.80 | | | $ | 11.39 | |
| | | | |
Class C: | | | | | | | | | | | | |
Net assets, at value | | $ | 108,739,013 | | | $ | 105,371,011 | | | $ | 62,040,766 | |
| | | | |
Shares outstanding | | | 9,390,172 | | | | 9,173,406 | | | | 5,587,289 | |
| | | | |
Net asset value and maximum offering price per sharea | | $ | 11.58 | | | $ | 11.49 | | | $ | 11.10 | |
| | | | |
Class R6: | | | | | | | | | | | | |
Net assets, at value | | $ | 18,928,657 | | | $ | 7,776,209 | | | $ | 4,946,791 | |
| | | | |
Shares outstanding | | | 1,650,208 | | | | 688,525 | | | | 452,949 | |
| | | | |
Net asset value and maximum offering price per share | | $ | 11.47 | | | $ | 11.29 | | | $ | 10.92 | |
| | | | |
Advisor Class: | | | | | | | | | | | | |
| | | | |
Net assets, at value | | $ | 60,116,668 | | | $ | 84,506,090 | | | $ | 84,879,689 | |
| | | | |
Shares outstanding | | | 5,242,437 | | | | 7,478,491 | | | | 7,769,807 | |
| | | | |
Net asset value and maximum offering price per share | | $ | 11.47 | | | $ | 11.30 | | | $ | 10.92 | |
| | | | |
aRedemption price is equal to net asset value less contingent deferred sales charges, if applicable.
| | | | | | |
156 | | Annual Report | | | The accompanying notes are an integral part of these financial statements. | | franklintempleton.com |
F FRANKLIN TAX-FREE TRUST
FINANCIAL STATEMENTS
Statements of Operations
for the year ended February 28, 2019
| | | | | | | | | | | | |
| | | Franklin
Alabama
Tax-Free
Income Fund | | | Franklin
Florida
Tax-Free
Income
Fund | | | Franklin
Georgia
Tax-Free
Income
Fund | |
| |
Investment income: | | | | | | | | | | | | |
Interest: | | | | | | | | | | | | |
Unaffiliated issuers | | $ | 9,501,544 | | | $ | 25,634,596 | | | $ | 18,889,899 | |
| | | | |
Expenses: | | | | | | | | | | | | |
Management fees (Note 3a) | | | 1,360,029 | | | | 2,899,968 | | | | 2,379,117 | |
Distribution fees: (Note 3c) | | | | | | | | | | | | |
Class A. | | | 6,071 | | | | 23,246 | | | | 15,280 | |
Class A1. | | | 198,365 | | | | 499,450 | | | | 338,521 | |
Class C | | | 251,665 | | | | 377,879 | | | | 594,308 | |
Transfer agent fees: (Note 3e) | | | | | | | | | | | | |
Class A. | | | 1,639 | | | | 6,302 | | | | 4,575 | |
Class A1. | | | 134,825 | | | | 341,049 | | | | 255,335 | |
Class C | | | 26,318 | | | | 39,701 | | | | 68,960 | |
Class R6. | | | 526 | | | | 1,152 | | | | 1,585 | |
Advisor Class | | | 5,344 | | | | 15,627 | | | | 27,790 | |
Custodian fees (Note 4) | | | 2,058 | | | | 4,927 | | | | 3,995 | |
Reports to shareholders | | | 17,228 | | | | 27,870 | | | | 36,711 | |
Registration and filing fees | | | 15,914 | | | | 32,473 | | | | 14,987 | |
Professional fees. | | | 61,555 | | | | 137,437 | | | | 86,092 | |
Trustees’ fees and expenses. | | | 2,001 | | | | 4,726 | | | | 3,811 | |
Other | | | 25,461 | | | | 31,215 | | | | 34,889 | |
| | | | |
| | | |
Total expenses | | | 2,108,999 | | | | 4,443,022 | | | | 3,865,956 | |
Expense reductions (Note 4) | | | (1,807 | ) | | | (3,895 | ) | | | (3,494 | ) |
Expenses waived/paid by affiliates (Note 3f) | | | (208 | ) | | | (460 | ) | | | (647 | ) |
| | | | |
| | | |
Net expenses | | | 2,106,984 | | | | 4,438,667 | | | | 3,861,815 | |
| | | | |
| | | |
Net investment income | | | 7,394,560 | | | | 21,195,929 | | | | 15,028,084 | |
| | | | |
Realized and unrealized gains (losses): | | | | | | | | | | | | |
Net realized gain (loss) from: | | | | | | | | | | | | |
Investments: | | | | | | | | | | | | |
Unaffiliated issuers. | | | (245,943 | ) | | | (1,619,441 | ) | | | (5,447 | ) |
| | | | |
Net change in unrealized appreciation (depreciation) on: | | | | | | | | | | | | |
Investments: | | | | | | | | | | | | |
Unaffiliated issuers. | | | (820,370 | ) | | | (289,840 | ) | | | (2,671,987 | ) |
| | | | |
| | | |
Net realized and unrealized gain (loss) | | | (1,066,313 | ) | | | (1,909,281 | ) | | | (2,677,434 | ) |
| | | | |
| | | |
Net increase (decrease) in net assets resulting from operations | | $ | 6,328,247 | | | $ | 19,286,648 | | | $ | 12,350,650 | |
| | | | |
| | | | | | | | |
franklintempleton.com | | | | The accompanying notes are an integral part of these financial statements. | | | Annual Report | | 157 |
FRANKLIN TAX-FREE TRUST
FINANCIAL STATEMENTS
Statements of Operations(continued)
for the year ended February 28, 2019
| | | | | | | | | | | | |
| | | Franklin
Kentucky
Tax-Free
Income Fund | | | Franklin
Louisiana
Tax-Free
Income Fund | | | Franklin
Maryland
Tax-Free
Income Fund | |
| |
Investment income: | | | | | | | | | | | | |
Interest: | | | | | | | | | | | | |
Unaffiliated issuers | | | $6,016,700 | | | | $14,976,711 | | | | $16,401,531 | |
| | | | |
Expenses: | | | | | | | | | | | | |
Management fees (Note 3a) | | | 879,121 | | | | 1,953,691 | | | | 2,168,883 | |
Distribution fees: (Note 3c) | | | | | | | | | | | | |
Class A. | | | 1,028 | | | | 11,924 | | | | 19,195 | |
Class A1 | | | 140,796 | | | | 301,645 | | | | 302,081 | |
Class C | | | — | | | | 344,205 | | | | 492,556 | |
Transfer agent fees: (Note 3e) | | | | | | | | | | | | |
Class A. | | | 318 | | | | 3,279 | | | | 5,969 | |
Class A1 | | | 109,584 | | | | 209,610 | | | | 237,016 | |
Class C | | | — | | | | 36,796 | | | | 59,455 | |
Class R6. | | | 1,155 | | | | 1,968 | | | | 897 | |
Advisor Class | | | 6,436 | | | | 11,787 | | | | 32,512 | |
Custodian fees (Note 4) | | | 1,257 | | | | 3,192 | | | | 3,556 | |
Reports to shareholders | | | 14,797 | | | | 23,955 | | | | 24,987 | |
Registration and filing fees | | | 6,762 | | | | 14,479 | | | | 15,424 | |
Professional fees | | | 49,996 | | | | 88,679 | | | | 102,292 | |
Trustees’ fees and expenses | | | 1,236 | | | | 3,031 | | | | 3,426 | |
Other | | | 20,755 | | | | 34,464 | | | | 29,874 | |
| | | | |
| | | |
Total expenses | | | 1,233,241 | | | | 3,042,705 | | | | 3,498,123 | |
Expense reductions (Note 4) | | | (1,097 | ) | | | (2,760 | ) | | | (3,109 | ) |
Expenses waived/paid by affiliates (Note 3f) | | | (532 | ) | | | (839 | ) | | | (440 | ) |
| | | | |
| | | |
Net expenses | | | 1,231,612 | | | | 3,039,106 | | | | 3,494,574 | |
| | | | |
| | | |
Net investment income | | | 4,785,088 | | | | 11,937,605 | | | | 12,906,957 | |
| | | | |
Realized and unrealized gains (losses): | | | | | | | | | | | | |
Net realized gain (loss) from: | | | | | | | | | | | | |
Investments: | | | | | | | | | | | | |
Unaffiliated issuers | | | 323,254 | | | | 167,552 | | | | 400,316 | |
| | | | |
Net change in unrealized appreciation (depreciation) on: | | | | | | | | | | | | |
Investments: | | | | | | | | | | | | |
Unaffiliated issuers | | | (737,766 | ) | | | 508,448 | | | | 986,079 | |
| | | | |
| | | |
Net realized and unrealized gain (loss) | | | (414,512 | ) | | | 676,000 | | | | 1,386,395 | |
| | | | |
| | | |
Net increase (decrease) in net assets resulting from operations | | | $4,370,576 | | | | $12,613,605 | | | | $14,293,352 | |
| | | | |
| | | | | | |
158 | | Annual Report | | | The accompanying notes are an integral part of these financial statements. | | franklintempleton.com |
FRANKLIN TAX-FREE TRUST
FINANCIAL STATEMENTS
Statements of Operations(continued)
for the year ended February 28, 2019
| | | | | | | | | | | | |
| | | Franklin
Missouri
Tax-Free
Income Fund | | | Franklin
North Carolina
Tax-Free
Income Fund | | | Franklin
Virginia
Tax-Free
Income Fund | |
| |
Investment income: | | | | | | | | | | | | |
Interest: | | | | | | | | | | | | |
Unaffiliated issuers | | | $37,494,794 | | | | $31,535,610 | | | | $23,296,576 | |
| | | | |
Expenses: | | | | | | | | | | | | |
Management fees (Note 3a) | | | 4,664,587 | | | | 4,078,956 | | | | 2,958,916 | |
Distribution fees: (Note 3c) | | | | | | | | | | | | |
Class A | | | 48,700 | | | | 33,465 | | | | 27,088 | |
Class A1. | | | 748,787 | | | | 615,858 | | | | 427,464 | |
Class C | | | 847,765 | | | | 883,753 | | | | 503,826 | |
Transfer agent fees: (Note 3e) | | | | | | | | | | | | |
Class A | | | 15,270 | | | | 8,803 | | | | 7,696 | |
Class A1. | | | 591,333 | | | | 408,086 | | | | 306,585 | |
Class C | | | 102,997 | | | | 90,097 | | | | 55,777 | |
Class R6 | | | 7,353 | | | | 4,028 | | | | 2,583 | |
Advisor Class | | | 54,606 | | | | 54,049 | | | | 59,289 | |
Custodian fees (Note 4) | | | 8,190 | | | | 7,157 | | | | 5,048 | |
Reports to shareholders. | | | 58,287 | | | | 45,796 | | | | 33,508 | |
Registration and filing fees | | | 18,314 | | | | 18,652 | | | | 18,989 | |
Professional fees | | | 207,129 | | | | 189,507 | | | | 114,358 | |
Trustees’ fees and expenses. | | | 7,794 | | | | 6,799 | | | | 4,779 | |
Other | | | 56,479 | | | | 48,567 | �� | | | 38,377 | |
| | | | |
| | | |
Total expenses | | | 7,437,591 | | | | 6,493,573 | | | | 4,564,283 | |
Expense reductions (Note 4) | | | (6,805 | ) | | | (6,014 | ) | | | (4,337 | ) |
Expenses waived/paid by affiliates (Note 3f) | | | (1,927 | ) | | | (1,581 | ) | | | (1,005 | ) |
| | | | |
| | | |
Net expenses | | | 7,428,859 | | | | 6,485,978 | | | | 4,558,941 | |
| | | | |
| | | |
Net investment income | | | 30,065,935 | | | | 25,049,632 | | | | 18,737,635 | |
| | | | |
Realized and unrealized gains (losses): | | | | | | | | | | | | |
Net realized gain (loss) from: | | | | | | | | | | | | |
Investments: | | | | | | | | | | | | |
Unaffiliated issuers. | | | (300,848 | ) | | | (2,252,420 | ) | | | 180,288 | |
| | | | |
Net change in unrealized appreciation (depreciation) on: | | | | | | | | | | | | |
Investments: | | | | | | | | | | | | |
Unaffiliated issuers. | | | 7,181,548 | | | | 4,246,848 | | | | 174,495 | |
| | | | |
| | | |
Net realized and unrealized gain (loss) | | | 6,880,700 | | | | 1,994,428 | | | | 354,783 | |
| | | | |
| | | |
Net increase (decrease) in net assets resulting from operations | | | $36,946,635 | | | | $27,044,060 | | | | $19,092,418 | |
| | | | |
| | | | | | |
franklintempleton.com | | The accompanying notes are an integral part of these financial statements. | | | Annual Report | | 159 |
FRANKLIN TAX-FREE TRUST
FINANCIAL HIGHLIGHTS
Statements of Changes in Net Assets
| | | | | | | | | | | | | | | | |
| | | Franklin Alabama
Tax-Free Income Fund | | | Franklin Florida
Tax-Free Income Fund | |
| | | | |
| | | Year Ended February 28, | | | Year Ended February 28, | |
| | | | |
| | | 2019 | | | 2018 | | | 2019 | | | 2018 | |
| |
Increase (decrease) in net assets: | | | | | | | | | | | | | | | | |
Operations: | | | | | | | | | | | | | | | | |
Net investment income | | | $ 7,394,560 | | | | $ 8,545,953 | | | | $ 21,195,929 | | | | $ 24,959,167 | |
Net realized gain (loss) | | | (245,943 | ) | | | (10,536,256 | ) | | | (1,619,441 | ) | | | (16,894,594 | ) |
Net change in unrealized appreciation (depreciation) | | | (820,370 | ) | | | 3,853,848 | | | | (289,840 | ) | | | (8,203,562) | |
| | | | |
Net increase (decrease) in net assets resulting from operations | | | 6,328,247 | | | | 1,863,545 | | | | 19,286,648 | | | | (138,989 | ) |
| | | | |
Distributions to shareholders: (Note 1d) | | | | | | | | | | | | | | | | |
Class A | | | (71,237 | ) | | | — | | | | (329,988 | ) | | | — | |
Class A1 | | | (6,142,736 | ) | | | (7,207,094 | ) | | | (18,447,866 | ) | | | (22,956,485 | ) |
Class C | | | (968,360 | ) | | | (1,347,293 | ) | | | (1,777,517 | ) | | | (2,635,993 | ) |
Class R6 | | | (34,300 | ) | | | (15,213 | ) | | | (87,569 | ) | | | (28,763 | ) |
Advisor Class | | | (251,020 | ) | | | (231,050 | ) | | | (863,827 | ) | | | (653,113 | ) |
| | | | |
Total distributions to shareholders | | | (7,467,653 | ) | | | (8,800,650 | ) | | | (21,506,767 | ) | | | (26,274,354 | ) |
| | | | |
Capital share transactions: (Note 2) | | | | | | | | | | | | | | | | |
Class A | | | 7,207,817 | | | | — | | | | 28,783,460 | | | | — | |
Class A1 | | | (19,123,204 | ) | | | (11,200,991 | ) | | | (71,237,247 | ) | | | (76,897,689 | ) |
Class C | | | (14,470,387 | ) | | | (8,984,893 | ) | | | (33,649,094 | ) | | | (14,489,834 | ) |
Class R6 | | | (686,600 | ) | | | 1,542,655 | | | | (38,437 | ) | | | 2,423,746 | |
Advisor Class | | | 667,839 | | | | 2,730,479 | | | | 5,059,211 | | | | 10,302,570 | |
| | | | |
Total capital share transactions | | | (26,404,535 | ) | | | (15,912,750 | ) | | | (71,082,107 | ) | | | (78,661,207 | ) |
| | | | |
Net increase (decrease) in net assets | | | (27,543,941 | ) | | | (22,849,855 | ) | | | (73,302,226 | ) | | | (105,074,550 | ) |
Net assets: | | | | | | | | | | | | | | | | |
Beginning of year | | | 262,968,111 | | | | 285,817,966 | | | | 632,189,211 | | | | 737,263,761 | |
| | | | |
End of year (Note 1d) | | | $235,424,170 | | | | $262,968,111 | | | | $558,886,985 | | | | $ 632,189,211 | |
| | | | |
| | | | | | |
160 | | Annual Report | | | The accompanying notes are an integral part of these financial statements. | | franklintempleton.com |
FRANKLIN TAX-FREE TRUST
FINANCIAL HIGHLIGHTS
Statements of Changes in Net Assets(continued)
| | | | | | | | | | | | | | | | |
| | | Franklin Georgia
Tax-Free Income Fund | | | Franklin Kentucky Tax-Free Income Fund | |
| | | | |
| | | Year Ended February 28, | | | Year Ended February 28, | |
| | | | |
| | | 2019 | | | 2018 | | | 2019 | | | 2018 | |
| |
Increase (decrease) in net assets: | | | | | | | | | | | | | | | | |
Operations: | | | | | | | | | | | | | | | | |
Net investment income. | | | $ 15,028,084 | | | | $ 17,356,690 | | | | $ 4,785,088 | | | | $ 5,770,618 | |
Net realized gain (loss) | | | (5,447 | ) | | | (12,804,183 | ) | | | 323,254 | | | | (2,905,578 | ) |
Net change in unrealized appreciation (depreciation) | | | (2,671,987 | ) | | | (2,113,811 | ) | | | (737,766 | ) | | | (772,667) | |
| | | | |
Net increase (decrease) in net assets resulting from operations | | | 12,350,650 | | | | 2,438,696 | | | | 4,370,576 | | | | 2,092,373 | |
| | | | |
Distributions to shareholders: (Note 1d) | | | | | | | | | | | | | | | | |
Class A | | | (192,559 | ) | | | — | | | | (12,224 | ) | | | — | |
Class A1. | | | (11,209,388 | ) | | | (13,339,164 | ) | | | (4,448,044 | ) | | | (5,478,565 | ) |
Class C | | | (2,473,306 | ) | | | (3,314,227 | ) | | | — | | | | — | |
Class R6 | | | (106,905 | ) | | | (98 | ) | | | (68,197 | ) | | | (25,079 | ) |
Advisor Class | | | (1,254,420 | ) | | | (1,084,844 | ) | | | (266,773 | ) | | | (255,715 | ) |
| | | | |
Total distributions to shareholders. | | | (15,236,578 | ) | | | (17,738,333 | ) | | | (4,795,238 | ) | | | (5,759,359 | ) |
| | | | |
Capital share transactions: (Note 2) | | | | | | | | | | | | | | | | |
Class A | | | 19,439,689 | | | | — | | | | 2,774,394 | | | | — | |
Class A1. | | | (47,287,178 | ) | | | (53,885,991 | ) | | | (19,454,667 | ) | | | (11,971,412 | ) |
Class C | | | (36,380,438 | ) | | | (15,541,922 | ) | | | — | | | | — | |
Class R6 | | | 3,796,257 | | | | 5,000 | | | | (236,052 | ) | | | 2,120,659 | |
Advisor Class | | | 4,927,052 | | | | 14,929,163 | | | | 1,830,270 | | | | 713,633 | |
| | | | |
Total capital share transactions | | | (55,504,618 | ) | | | (54,493,750 | ) | | | (15,086,055 | ) | | | (9,137,120 | ) |
| | | | |
Net increase (decrease) in net assets | | | (58,390,546 | ) | | | (69,793,387 | ) | | | (15,510,717 | ) | | | (12,804,106 | ) |
Net assets: | | | | | | | | | | | | | | | | |
Beginning of year | | | 508,505,564 | | | | 578,298,951 | | | | 159,704,211 | | | | 172,508,317 | |
| | | | |
End of year (Note 1d) | | | $450,115,018 | | | | $508,505,564 | | | | $144,193,494 | | | | $159,704,211 | |
| | | | |
| | | | | | | | |
franklintempleton.com | | | | The accompanying notes are an integral part of these financial statements. | | | Annual Report | | 161 |
FRANKLIN TAX-FREE TRUST
FINANCIAL HIGHLIGHTS
Statements of Changes in Net Assets(continued)
| | | | | | | | | | | | | | | | |
| | | Franklin Louisiana
Tax-Free Income Fund | | | Franklin Maryland
Tax-Free Income Fund | |
| | | | |
| | | Year Ended February 28, | | | Year Ended February 28, | |
| | | | |
| | | 2019 | | | 2018 | | | 2019 | | | 2018 | |
| |
Increase (decrease) in net assets: | | | | | | | | | | | | | | | | |
Operations: | | | | | | | | | | | | | | | | |
Net investment income. | | | $ 11,937,605 | | | | $ 13,166,677 | | | | $ 12,906,957 | | | | $ 14,520,447 | |
Net realized gain (loss) | | | 167,552 | | | | (9,832,164 | ) | | | 400,316 | | | | (20,536,163 | ) |
Net change in unrealized appreciation (depreciation) | | | 508,448 | | | | 635,988 | | | | 986,079 | | | | 6,645,446 | |
| | | | |
Net increase (decrease) in net assets resulting from operations | | | 12,613,605 | | | | 3,970,501 | | | | 14,293,352 | | | | 629,730 | |
| | | | |
Distributions to shareholders: (Note 1d) | | | | | | | | | | | | | | | | |
Class A | | | (145,782 | ) | | | — | | | | (235,272 | ) | | | — | |
Class A1 | | | (9,716,656 | ) | | | (11,166,810 | ) | | | (9,540,479 | ) | | | (11,061,560 | ) |
Class C | | | (1,385,099 | ) | | | (1,757,396.0 | ) | | | (1,920,744 | ) | | | (2,727,699 | ) |
Class R6 | | | (125,604 | ) | | | (41,484 | ) | | | (50,070 | ) | | | (14,141 | ) |
Advisor Class | | | (561,923 | ) | | | (423,547 | ) | | | (1,348,549 | ) | | | (1,438,849 | ) |
| | | | |
Total distributions to shareholders. | | | (11,935,064 | ) | | | (13,389,237 | ) | | | (13,095,114 | ) | | | (15,242,249 | ) |
| | | | |
Capital share transactions: (Note 2) | | | | | | | | | | | | | | | | |
Class A | | | 17,853,886 | | | | — | | | | 26,196,177 | | | | — | |
Class A1 | | | (38,269,400 | ) | | | (13,302,982 | ) | | | (40,101,404 | ) | | | (22,507,986 | ) |
Class C | | | (19,119,366 | ) | | | (4,347,097 | ) | | | (36,146,346 | ) | | | (19,453,172 | ) |
Class R6 | | | 176,147 | | | | 3,745,109 | | | | 372,355 | | | | 1,398,517 | |
Advisor Class | | | 5,429,362 | | | | 4,121,585 | | | | 3,562,182 | | | | (812,561 | ) |
| | | | |
Total capital share transactions | | | (33,929,371 | ) | | | (9,783,385 | ) | | | (46,117,036 | ) | | | (41,375,202 | ) |
| | | | |
Net increase (decrease) in net assets | | | (33,250,830 | ) | | | (19,202,121 | ) | | | (44,918,798 | ) | | | (55,987,721 | ) |
Net assets: | | | | | | | | | | | | | | | | |
Beginning of year | | | 401,252,512 | | | | 420,454,633 | | | | 453,581,148 | | | | 509,568,869 | |
| | | | |
End of year (Note 1d) | | | $368,001,682 | | | | $401,252,512 | | | | $408,662,350 | | | | $453,581,148 | |
| | | | |
| | | | | | |
162 | | Annual Report | | | The accompanying notes are an integral part of these financial statements. | | franklintempleton.com |
FRANKLIN TAX-FREE TRUST
FINANCIAL HIGHLIGHTS
Statements of Changes in Net Assets(continued)
| | | | | | | | | | | | | | | | |
| | | Franklin Missouri
Tax-Free Income Fund | | | Franklin North Carolina
Tax-Free Income Fund | |
| | | | |
| | | Year Ended February 28, | | | Year Ended February 28, | |
| | | | |
| | | 2019 | | | 2018 | | | 2019 | | | 2018 | |
| |
Increase (decrease) in net assets: | | | | | | | | | | | | | | | | |
Operations: | | | | | | | | | | | | | | | | |
Net investment income. | | | $ 30,065,935 | | | | $ 32,920,499 | | | | $ 25,049,632 | | | | $ 29,495,219 | |
Net realized gain (loss) | | | (300,848 | ) | | | (32,105,829 | ) | | | (2,252,420 | ) | | | (33,994,401 | ) |
Net change in unrealized appreciation (depreciation) | | | 7,181,548 | | | | (259,821 | ) | | | 4,246,848 | | | | (676,097) | |
| | | | |
Net increase (decrease) in net assets resulting from operations | | | 36,946,635 | | | | 554,849 | | | | 27,044,060 | | | | (5,175,279 | ) |
| | | | |
Distributions to shareholders: (Note 1d) | | | | | | | | | | | | | | | | |
Class A | | | (581,911 | ) | | | — | | | | (388,161 | ) | | | — | |
Class A1. | | | (23,445,068 | ) | | | (27,525,110 | ) | | | (19,060,559 | ) | | | (23,340,180 | ) |
Class C | | | (3,310,311 | ) | | | (4,322,246 | ) | | | (3,390,144 | ) | | | (4,668,358 | ) |
Class R6 | | | (589,965 | ) | | | (170,706 | ) | | | (262,721 | ) | | | (89,080 | ) |
Advisor Class | | | (2,227,907 | ) | | | (2,869,337 | ) | | | (2,600,985 | ) | | | (3,424,938 | ) |
| | | | |
Total distributions to shareholders. | | | (30,155,162 | ) | | | (34,887,399 | ) | | | (25,702,570 | ) | | | (31,522,556 | ) |
| | | | |
Capital share transactions: (Note 2) | | | | | | | | | | | | | | | | |
Class A | | | 62,711,301 | | | | — | | | | 48,618,185 | | | | — | |
Class A1. | | | (97,285,055 | ) | | | (53,544,231 | ) | | | (83,901,262 | ) | | | (69,441,146 | ) |
Class C | | | (41,216,598 | ) | | | (15,546,130 | ) | | | (54,000,034 | ) | | | (31,767,148 | ) |
Class R6 | | | 1,262,268 | | | | 17,861,593 | | | | (1,346,043 | ) | | | 9,261,452 | |
Advisor Class | | | (12,766,616 | ) | | | (8,622,682 | ) | | | 3,525,600 | | | | (24,876,085 | ) |
| | | | |
Total capital share transactions | | | (87,294,700 | ) | | | (59,851,450 | ) | | | (87,103,554 | ) | | | (116,822,927 | ) |
| | | | |
Net increase (decrease) in net assets | | | (80,503,227 | ) | | | (94,184,000 | ) | | | (85,762,064 | ) | | | (153,520,762 | ) |
Net assets: | | | | | | | | | | | | | | | | |
Beginning of year | | | 1,032,526,749 | | | | 1,126,710,749 | | | | 909,658,772 | | | | 1,063,179,534 | |
| | | | |
End of year (Note 1d) | | | $ 952,023,522 | | | | $1,032,526,749 | | | | $823,896,708 | | | | $ 909,658,772 | |
| | | | |
| | | | | | | | |
franklintempleton.com | | | | The accompanying notes are an integral part of these financial statements. | | | Annual Report | | 163 |
FRANKLIN TAX-FREE TRUST
FINANCIAL HIGHLIGHTS
Statements of Changes in Net Assets(continued)
| | | | | | | | |
| | | Franklin Virginia
Tax-Free Income Fund | |
| | | | |
| | | Year Ended February 28, | |
| | | | |
| | | 2019 | | | 2018 | |
| |
Increase (decrease) in net assets: | | | | | | | | |
Operations: | | | | | | | | |
Net investment income | | | $ 18,737,635 | | | | $ 21,024,923 | |
Net realized gain (loss) | | | 180,288 | | | | (20,798,156 | ) |
Net change in unrealized appreciation (depreciation) | | | 174,495 | | | | (2,459,040 | ) |
| | | | |
Net increase (decrease) in net assets resulting from operations. | | | 19,092,418 | | | | (2,232,273 | ) |
| | | | |
Distributions to shareholders: (Note 1d) | | | | | | | | |
Class A | | | (324,073 | ) | | | — | |
Class A1 | | | (13,569,976 | ) | | | (15,951,000 | ) |
Class C | | | (1,994,776 | ) | | | (2,656,037 | ) |
Class R6 | | | (173,726 | ) | | | (53,853 | ) |
Advisor Class | | | (2,703,347 | ) | | | (3,042,828 | ) |
| | | | |
Total distributions to shareholders | | | (18,765,898 | ) | | | (21,703,718 | ) |
| | | | |
Capital share transactions: (Note 2) | | | | | | | | |
Class A | | | 39,139,953 | | | | ��� | |
Class A1 | | | (51,675,061 | ) | | | (37,540,988 | ) |
Class C | | | (28,437,045 | ) | | | (13,850,790 | ) |
Class R6 | | | (82,877 | ) | | | 5,128,887 | |
Advisor Class | | | (509,044 | ) | | | 1,143,037 | |
| | | | |
Total capital share transactions | | | (41,564,074 | ) | | | (45,119,854 | ) |
| | | | |
Net increase (decrease) in net assets. | | | (41,237,554 | ) | | | (69,055,845 | ) |
Net assets: | | | | | | | | |
Beginning of year | | | 635,409,286 | | | | 704,465,131 | |
| | | | |
End of year (Note 1d) | | | $594,171,732 | | | | $635,409,286 | |
| | | | |
| | | | | | |
164 | | Annual Report | | | The accompanying notes are an integral part of these financial statements. | | franklintempleton.com |
FRANKLINTAX-FREE TRUST
Notes to Financial Statements
1. Organization and Significant Accounting Policies
FranklinTax-Free Trust (Trust) is registered under the Investment Company Act of 1940 (1940 Act) as anopen-end management investment company, consisting oftwenty-two separate funds, nine of which are included in this report (Funds) and applies the specialized accounting and reporting guidance in U.S. Generally Accepted Accounting Principles (U.S. GAAP). The classes of shares offered within each of the Funds are indicated below. Beginning on October 19, 2018, Class C shares automatically convert to Class A shares after they have been held for 10 years. Each class of shares may differ by its initial sales load, contingent deferred sales charges, voting rights on matters affecting a single class, its exchange privilege and fees due to differing arrangements for distribution and transfer agent fees.
Effective September 10, 2018, Class A shares were renamed Class A1, and Funds began offering a new class of shares, Class A. Class A1 shares are only offered to existing Class A1 shareholders.
Class A, Class A1, Class R6 & Advisor Class
Franklin KentuckyTax-Free Income Fund
Class A, Class A1, Class C, Class R6 & Advisor Class
Franklin AlabamaTax-Free Income Fund
Franklin FloridaTax-Free Income Fund
Franklin GeorgiaTax-Free Income Fund
Franklin LouisianaTax-Free Income Fund
Franklin MarylandTax-Free Income Fund
Franklin MissouriTax-Free Income Fund
Franklin North CarolinaTax-Free Income Fund
Franklin VirginiaTax-Free Income Fund
The following summarizes the Funds’ significant accounting policies.
a. Financial Instrument Valuation
The Funds’ investments in financial instruments are carried at fair value daily. Fair value is the price that would be received to sell an asset or paid to transfer a liability in an orderly transaction between market participants on the measurement date. The Funds calculate the net asset value (NAV) per share each business day as of 4 p.m. Eastern time or the regularly scheduled close of the New York Stock Exchange (NYSE), whichever is earlier. Under compliance policies and procedures approved by the Trust’s Board of Trustees (the Board), the
Funds’ administrator has responsibility for oversight of valuation, including leading the cross-functional Valuation Committee (VC). The Funds may utilize independent pricing services, quotations from securities and financial instrument dealers, and other market sources to determine fair value.
Debt securities generally trade in theover-the-counter market rather than on a securities exchange. The Funds’ pricing services use multiple valuation techniques to determine fair value. In instances where sufficient market activity exists, the pricing services may utilize a market-based approach through which quotes from market makers are used to determine fair value. In instances where sufficient market activity may not exist or is limited, the pricing services also utilize proprietary valuation models which may consider market characteristics such as benchmark yield curves, credit spreads, estimated default rates, anticipated market interest rate volatility, coupon rates, anticipated timing of principal repayments, underlying collateral, and other unique security features in order to estimate the relevant cash flows, which are then discounted to calculate the fair value.
The Funds have procedures to determine the fair value of financial instruments for which market prices are not reliable or readily available. Under these procedures, the Funds primarily employ a market-based approach which may use related or comparable assets or liabilities, recent transactions, market multiples, book values, and other relevant information for the investment to determine the fair value of the investment. An income-based valuation approach may also be used in which the anticipated future cash flows of the investment are discounted to calculate fair value. Discounts may also be applied due to the nature or duration of any restrictions on the disposition of the investments. Due to the inherent uncertainty of valuations of such investments, the fair values may differ significantly from the values that would have been used had an active market existed.
b. Securities Purchased on a When-Issued Basis
Certain or all Funds purchase securities on a when-issued basis, with payment and delivery scheduled for a future date. These transactions are subject to market fluctuations and are subject to the risk that the value at delivery may be more or less than the trade date purchase price. Although the Funds will generally purchase these securities with the intention of holding the securities, they may sell the securities before the settlement date. Sufficient assets have been segregated for these securities.
| | | | | | | | |
franklintempleton.com | | | | | | Annual Report | | 165 |
FRANKLINTAX-FREE TRUST
NOTES TO FINANCIAL STATEMENTS
1. Organization and Significant Accounting Policies(continued)
c. Income Taxes
It is each Fund’s policy to qualify as a regulated investment company under the Internal Revenue Code. Each Fund intends to distribute to shareholders substantially all of its income and net realized gains to relieve it from federal income and excise taxes. As a result, no provision for U.S. federal income taxes is required.
Each Fund may recognize an income tax liability related to its uncertain tax positions under U.S. GAAP when the uncertain tax position has a less than 50% probability that it will be sustained upon examination by the tax authorities based on its technical merits. As of February 28, 2019, each Fund has determined that no tax liability is required in its financial statements related to uncertain tax positions for any open tax years (or expected to be taken in future tax years). Open tax years are those that remain subject to examination and are based on the statute of limitations in each jurisdiction in which the Fund invests.
d. Security Transactions, Investment Income, Expenses and Distributions
Security transactions are accounted for on trade date. Realized gains and losses on security transactions are determined on a specific identification basis. Interest income and estimated expenses are accrued daily. Amortization of premium and accretion of discount on debt securities are included in interest income. Dividends from net investment income are normally declared daily; these dividends may be reinvested or paid monthly to shareholders. Distributions from realized capital gains and other distributions, if any, are recorded on theex-dividend date. Distributable earnings are determined according to income tax regulations (tax basis) and may differ from earnings recorded in accordance with U.S. GAAP. These differences may be permanent or temporary. Permanent differences are reclassified among capital accounts to reflect their tax character. These reclassifications have no impact on net assets or the results of operations. Temporary differences are not reclassified, as they may reverse in subsequent periods.*
Common expenses incurred by the Trust are allocated among the Funds based on the ratio of net assets of each Fund to the combined net assets of the Trust or based on the ratio of number
of shareholders of each Fund to the combined number of shareholders of the Trust. Fund specific expenses are charged directly to the Fund that incurred the expense.
Realized and unrealized gains and losses and net investment income, excluding class specific expenses, are allocated daily to each class of shares based upon the relative proportion of net assets of each class. Differences in per share distributions by class are generally due to differences in class specific expenses.
e. Insurance
The scheduled payments of interest and principal for each insured municipal security in the Trust are insured by either a new issue insurance policy or a secondary insurance policy. Some municipal securities in the Funds are secured by collateral guaranteed by an agency of the U.S. government. Depending on the type of coverage, premiums for insurance are either added to the cost basis of the security or paid by a third party.
Insurance companies typically insure municipal bonds that tend to be of very high quality, with the majority of underlying municipal bonds rated A or better. However, an event involving an insurer could have an adverse effect on the value of the securities insured by that insurance company. There can be no assurance the insurer will be able to fulfill its obligations under the terms of the policy.
f. Accounting Estimates
The preparation of financial statements in accordance with U.S. GAAP requires management to make estimates and assumptions that affect the reported amounts of assets and liabilities at the date of the financial statements and the amounts of income and expenses during the reporting period. Actual results could differ from those estimates.
g. Guarantees and Indemnifications
Under the Trust’s organizational documents, its officers and trustees are indemnified by the Trust against certain liabilities arising out of the performance of their duties to the Trust. Additionally, in the normal course of business, the Trust, on behalf of the Funds, enters into contracts with service providers that contain general indemnification clauses. The Trust’s maximum exposure under these arrangements is unknown as this would involve future claims that may be made against the Trust that have not yet occurred. Currently, the Trust expects the risk of loss to be remote.
| | | | | | |
166 | | Annual Report | | | | franklintempleton.com |
FRANKLINTAX-FREE TRUST
NOTES TO FINANCIAL STATEMENTS
*Effective during the current reporting period, it is no longer required to present certain line items in the Statements of Changes in Net Assets. The below prior period amounts affected by this change are shown as they were in the prior year Statements of Changes in Net Assets.
For the year ended February 28, 2018, distributions to shareholders were as follows:
| | | | | | | | | | | | | | | | |
| | | Franklin Alabama Tax-Free Income Fund | | | Franklin Florida Tax-Free Income Fund | | | Franklin
Georgia
Tax-Free
Income Fund | | | | |
| | | | | |
Distributions from net investment income: | | | | | | | | | | | | | | | | |
Class A1 | | | $(7,207,094 | ) | | | $(22,956,485 | ) | | | $(13,339,164 | ) | | | | |
Class C | | | (1,347,293 | ) | | | (2,635,993 | ) | | | (3,314,227 | ) | | | | |
Class R6 | | | (15,213 | ) | | | (28,763 | ) | | | (98 | ) | | | | |
Advisor Class | | | (231,050 | ) | | | (653,113 | ) | | | (1,084,844 | ) | | | | |
| | | | |
| | | Franklin Kentucky Tax-Free Income Fund | | | Franklin
Louisiana
Tax-Free
Income Fund | | | Franklin
Maryland
Tax-Free
Income Fund | | | | |
| | | | | |
Distributions from net investment income: | | | | | | | | | | | | | | | | |
Class A1 | | | $(5,478,565 | ) | | | $(11,166,810 | ) | | | $(11,061,560 | ) | | | | |
Class C | | | — | | | | (1,757,396 | ) | | | (2,727,699 | ) | | | | |
Class R6 | | | (25,079 | ) | | | (41,484 | ) | | | (14,141 | ) | | | | |
Advisor Class | | | (255,715 | ) | | | (423,547 | ) | | | (1,438,849 | ) | | | | |
| | | | |
| | | Franklin Missouri Tax-Free Income Fund | | | Franklin North Carolina Tax-Free Income Fund | | | Franklin Virginia Tax-Free Income Fund | | | | |
| | | | | |
Distributions from net investment income: | | | | | | | | | | | | | | | | |
Class A1 | | | $(27,525,110 | ) | | | $(23,340,180 | ) | | | $(15,951,000 | ) | | | | |
Class C | | | (4,322,246 | ) | | | (4,668,358 | ) | | | (2,656,037 | ) | | | | |
Class R6 | | | (170,706 | ) | | | (89,080 | ) | | | (53,853 | ) | | | | |
Advisor Class | | | (2,869,337 | ) | | | (3,424,938 | ) | | | (3,042,828 | ) | | | | |
|
For the year ended February 28, 2018, undistributed net investment income included in net assets were as follows: | |
| Fund | | Undistributed net
investment income | | | | | | | | | | |
| | | | | | | | | | | | | |
Franklin AlabamaTax-Free Income Fund | | | $ 456,670 | | | | | | | | | | | | | |
Franklin FloridaTax-Free Income Fund | | | $1,242,896 | | | | | | | | | | | | | |
Franklin GeorgiaTax-Free Income Fund | | | $1,191,002 | | | | | | | | | | | | | |
Franklin KentuckyTax-Free Income Fund | | | $ 294,106 | | | | | | | | | | | | | |
Franklin LouisianaTax-Free Income Fund | | | $ 501,096 | | | | | | | | | | | | | |
Franklin MarylandTax-Free Income Fund | | | $1,110,743 | | | | | | | | | | | | | |
Franklin MissouriTax-Free Income Fund | | | $1,623,790 | | | | | | | | | | | | | |
Franklin North CarolinaTax-Free Income Fund | | | $1,899,969 | | | | | | | | | | | | | |
Franklin VirginiaTax-Free Income Fund | | | $ 998,414 | | | | | | | | | | | | | |
| | | | | | | | |
franklintempleton.com | | | | | | Annual Report | | 167 |
FRANKLIN TAX-FREE TRUST
NOTES TO FINANCIAL STATEMENTS
2. Shares of Beneficial Interest
At February 28, 2019, there were an unlimited number of shares authorized (without par value). Transactions in the Funds’ shares were as follows:
| | | | | | | | | | | | | | | | | | |
| | | Franklin Alabama
Tax-Free Income Fund | | | | | Franklin Florida
Tax-Free Income Fund | |
| | | | |
| | | Shares | | | Amount | | | | | Shares | | | Amount | |
| |
Class A Shares: | | | | | | | | | | | | | | | | | | |
Year ended February 28, 2019a | | | | | | | | | | | | | | | | | | |
Shares soldb | | | 790,658 | | | $ | 8,444,521 | | | | | | 3,137,170 | | | $ | 32,435,068 | |
Shares issued in reinvestment of distributions | | | 6,200 | | | | 66,900 | | | | | | 30,204 | | | | 314,181 | |
Shares redeemed | | | (120,896 | ) | | | (1,303,604 | ) | | | | | (381,588 | ) | | | (3,965,789) | |
| | | | |
| | | | | |
Net increase (decrease) | | | 675,962 | | | $ | 7,207,817 | | | | | | 2,785,786 | | | $ | 28,783,460 | |
| | | | |
| | | | | |
Class A1 Shares: | | | | | | | | | | | | | | | | | | |
Year ended February 28, 2019 | | | | | | | | | | | | | | | | | | |
Shares sold | | | 801,040 | | | $ | 8,658,277 | | | | | | 1,920,172 | | | $ | 20,024,152 | |
Shares issued in reinvestment of distributions | | | 497,039 | | | | 5,370,959 | | | | | | 1,416,101 | | | | 14,755,224 | |
Shares redeemed | | | (3,071,377 | ) | | | (33,152,440 | ) | | | | | (10,186,874 | ) | | | (106,016,623) | |
| | | | |
| | | | | |
Net increase (decrease) | | | (1,773,298 | ) | | $ | (19,123,204 | ) | | | | | (6,850,601 | ) | | $ | (71,237,247) | |
| | | | |
| | | | | |
Year ended February 28, 2018 | | | | | | | | | | | | | | | | | | |
Shares sold | | | 1,666,942 | | | $ | 18,487,615 | | | | | | 3,793,760 | | | $ | 40,704,065 | |
Shares issued in reinvestment of distributions | | | 565,698 | | | | 6,260,259 | | | | | | 1,685,243 | | | | 18,050,680 | |
Shares redeemed | | | (3,245,676 | ) | | | (35,948,865 | ) | | | | | (12,690,069 | ) | | | (135,652,434) | |
| | | | |
| | | | | |
Net increase (decrease) | | | (1,013,036 | ) | | $ | (11,200,991 | ) | | | | | (7,211,066 | ) | | $ | (76,897,689) | |
| | | | |
| | | | | |
Class C Shares: | | | | | | | | | | | | | | | | | | |
Year ended February 28, 2019 | | | | | | | | | | | | | | | | | | |
Shares sold | | | 128,398 | | | $ | 1,407,713 | | | | | | 477,035 | | | $ | 5,072,186 | |
Shares issued in reinvestment of distributions | | | 80,163 | | | | 878,076 | | | | | | 150,924 | | | | 1,607,536 | |
Shares redeemedb | | | (1,539,197 | ) | | | (16,756,176 | ) | | | | | (3,810,382 | ) | | | (40,328,816) | |
| | | | |
| | | | | |
Net increase (decrease) | | | (1,330,636 | ) | | $ | (14,470,387 | ) | | | | | (3,182,423 | ) | | $ | (33,649,094) | |
| | | | |
| | | | | |
Year ended February 28, 2018 | | | | | | | | | | | | | | | | | | |
Shares sold | | | 290,913 | | | $ | 3,268,067 | | | | | | 771,415 | | | $ | 8,464,321 | |
Shares issued in reinvestment of distributions | | | 105,680 | | | | 1,184,857 | | | | | | 214,725 | | | | 2,348,038 | |
Shares redeemed | | | (1,196,247 | ) | | | (13,437,817 | ) | | | | | (2,310,372 | ) | | | (25,302,193) | |
| | | | |
| | | | | |
Net increase (decrease) | | | (799,654 | ) | | $ | (8,984,893 | ) | | | | | (1,324,232 | ) | | $ | (14,489,834) | |
| | | | |
| | | | | |
Class R6 Shares: | | | | | | | | | | | | | | | | | | |
Year ended February 28, 2019 | | | | | | | | | | | | | | | | | | |
Shares sold | | | 29,919 | | | $ | 323,892 | | | | | | 80,448 | | | $ | 839,303 | |
Shares issued in reinvestment of distributions | | | 3,171 | | | | 34,300 | | | | | | 8,384 | | | | 87,569 | |
Shares redeemed | | | (96,388 | ) | | | (1,044,792 | ) | | | | | (92,303 | ) | | | (965,309) | |
| | | | |
| | | | | |
Net increase (decrease) | | | (63,298 | ) | | $ | (686,600 | ) | | | | | (3,471 | ) | | $ | (38,437) | |
| | | | |
| | | | | |
Year ended February 28, 2018c | | | | | | | | | | | | | | | | | | |
Shares sold | | | 143,108 | | | $ | 1,584,679 | | | | | | 257,249 | | | $ | 2,738,701 | |
Shares issued in reinvestment of distributions | | | 1,380 | | | | 15,145 | | | | | | 2,715 | | | | 28,685 | |
Shares redeemed | | | (5,175 | ) | | | (57,169 | ) | | | | | (32,433 | ) | | | (343,640) | |
| | | | |
| | | | | |
Net increase (decrease) | | | 139,313 | | | $ | 1,542,655 | | | | | | 227,531 | | | $ | 2,423,746 | |
| | | | |
| | | | | | |
168 | | Annual Report | | | | franklintempleton.com |
FRANKLIN TAX-FREE TRUST
NOTES TO FINANCIAL STATEMENTS
| | | | | | | | | | | | | | | | | | | | |
| | | Franklin Alabama
Tax-Free Income Fund | | | | | | Franklin Florida
Tax-Free Income Fund | |
| | | | |
| | | Shares | | | Amount | | | | | | Shares | | | Amount | |
| |
| | | | | |
Advisor Class Shares: | | | | | | | | | | | | | | | | | | | | |
Year ended February 28, 2019 | | | | | | | | | | | | | | | | | | | | |
Shares sold | | | 393,159 | | | $ | 4,236,806 | | | | | | | | 1,225,819 | | | $ | 12,789,690 | |
Shares issued in reinvestment of distributions | | | 19,945 | | | | 215,429 | | | | | | | | 57,503 | | | | 600,268 | |
Shares redeemed | | | (350,895 | ) | | | (3,784,396 | ) | | | | | | | (798,662 | ) | | | (8,330,747) | |
| | | | |
| | | | | |
Net increase (decrease) | | | 62,209 | | | $ | 667,839 | | | | | | | | 484,660 | | | $ | 5,059,211 | |
| | | | |
| | | | | |
Year ended February 28, 2018 | | | | | | | | | | | | | | | | | | | | |
Shares sold | | | 445,766 | | | $ | 4,952,463 | | | | | | | | 1,642,469 | | | $ | 17,714,453 | |
Shares issued in reinvestment of distributions | | | 18,951 | | | | 209,662 | | | | | | | | 46,448 | | | | 497,715 | |
Shares redeemed | | | (219,339 | ) | | | (2,431,646 | ) | | | | | | | (739,329 | ) | | | (7,909,598) | |
| | | | |
| | | | | |
Net increase (decrease) | | | 245,378 | | | $ | 2,730,479 | | | | | | | | 949,588 | | | $ | 10,302,570 | |
| | | | |
aFor the period September 10, 2018 (effective date) to February 28, 2019.
bMay include a portion of Class C shares that were automatically converted to Class A.
cFor the period August 1, 2017 (effective date) to February 28, 2018.
| | | | | | | | | | | | | | | | | | | | |
| | | Franklin Georgia | | | | | | Franklin Kentucky | |
| | | Tax-Free Income Fund | | | | | | Tax-Free Income Fund | |
| | | | |
| | | Shares | | | Amount | | | | | | Shares | | | Amount | |
| |
Class A Shares: | | | | | | | | | | | | | | | | | | | | |
Year ended February 28, 2019a | | | | | | | | | | | | | | | | | | | | |
Shares soldb | | | 1,785,538 | | | $ | 20,419,130 | | | | | | | | 259,208 | | | $ | 2,777,024 | |
Shares issued in reinvestment of distributions | | | 16,072 | | | | 185,389 | | | | | | | | 1,128 | | | | 12,114 | |
Shares redeemed | | | (101,210 | ) | | | (1,164,830 | ) | | | | | | | (1,372 | ) | | | (14,744) | |
| | | | |
| | | | | |
Net increase (decrease) | | | 1,700,400 | | | $ | 19,439,689 | | | | | | | | 258,964 | | | $ | 2,774,394 | |
| | | | |
| | | | | |
Class A1 Shares: | | | | | | | | | | | | | | | | | | | | |
Year ended February 28, 2019 | | | | | | | | | | | | | | | | | | | | |
Shares sold | | | 2,598,688 | | | $ | 30,034,712 | | | | | | | | 877,756 | | | $ | 9,404,287 | |
Shares issued in reinvestment of distributions | | | 852,923 | | | | 9,872,292 | | | | | | | | 399,392 | | | | 4,276,740 | |
Shares redeemed | | | (7,543,306 | ) | | | (87,194,182 | ) | | | | | | | (3,103,629 | ) | | | (33,135,694) | |
| | | | |
| | | | | |
Net increase (decrease) | | | (4,091,695 | ) | | $ | (47,287,178 | ) | | | | | | | (1,826,481 | ) | | $ | (19,454,667) | |
| | | | |
| | | | | |
Year ended February 28, 2018 | | | | | | | | | | | | | | | | | | | | |
Shares sold | | | 3,331,945 | | | $ | 39,629,549 | | | | | | | | 1,262,786 | | | $ | 13,825,223 | |
Shares issued in reinvestment of distributions | | | 975,434 | | | | 11,582,996 | | | | | | | | 472,387 | | | | 5,166,120 | |
Shares redeemed | | | (8,844,321 | ) | | | (105,098,536 | ) | | | | | | | (2,827,606 | ) | | | (30,962,755) | |
| | | | |
| | | | | |
Net increase (decrease) | | | (4,536,942 | ) | | $ | (53,885,991 | ) | | | | | | | (1,092,433 | ) | | $ | (11,971,412) | |
| | | | |
| | | | | |
Class C Shares: | | | | | | | | | | | | | | | | | | | | |
Year ended February 28, 2019 | | | | | | | | | | | | | | | | | | | | |
Shares sold | | | 391,513 | | | $ | 4,597,846 | | | | | | | | | | | | | |
Shares issued in reinvestment of distributions | | | 186,922 | | | | 2,196,607 | | | | | | | | | | | | | |
Shares redeemedb | | | (3,690,195 | ) | | | (43,174,891 | ) | | | | | | | | | | | | |
| | | | | | | | | | | | |
| | | | | |
Net increase (decrease) | | | (3,111,760 | ) | | $ | (36,380,438 | ) | | | | | | | | | | | | |
| | | | | | | | | | | | |
| | | | | |
Year ended February 28, 2018 | | | | | | | | | | | | | | | | | | | | |
Shares sold | | | 772,220 | | | $ | 9,333,080 | | | | | | | | | | | | | |
Shares issued in reinvestment of distributions | | | 237,902 | | | | 2,866,306 | | | | | | | | | | | | | |
Shares redeemed | | | (2,301,939 | ) | | | (27,741,308 | ) | | | | | | | | | | | | |
| | | | | | | | | | | | |
| | | | | |
Net increase (decrease) | | | (1,291,817 | ) | | $ | (15,541,922 | ) | | | | | | | | | | | | |
| | | | | | | | | | | | |
| | | | | | | | |
franklintempleton.com | | | | | | Annual Report | | 169 |
FRANKLINTAX-FREE TRUST
NOTES TO FINANCIAL STATEMENTS
2. Shares of Beneficial Interest(continued)
| | | | | | | | | | | | | | | | | | | | |
| | | Franklin Georgia | | | | | | Franklin Kentucky | |
| | | Tax-Free Income Fund | | | | | | Tax-Free Income Fund | |
| | | | |
| | | Shares | | | Amount | | | | | | Shares | | | Amount | |
| |
Class R6 Shares: | | | | | | | | | | | | | | | | | | | | |
Year ended February 28, 2019 | | | | | | | | | | | | | | | | | | | | |
Shares sold | | | 434,824 | | | $ | 5,054,522 | | | | | | | | 51,507 | | | $ | 551,091 | |
Shares issued in reinvestment of distributions | | | 9,235 | | | | 106,822 | | | | | | | | 6,370 | | | | 68,194 | |
Shares redeemed | | | (117,886 | ) | | | (1,365,087 | ) | | | | | | | (80,004 | ) | | | (855,337) | |
| | | | |
| | | | | |
Net increase (decrease) | | | 326,173 | | | $ | 3,796,257 | | | | | | | | (22,127 | ) | | $ | (236,052) | |
| | | | |
| | | | | |
Year ended February 28, 2018c | | | | | | | | | | | | | | | | | | | | |
Shares sold | | | 419 | | | $ | 5,000 | | | | | | | | 216,520 | | | $ | 2,372,205 | |
Shares issued in reinvestment of distributions | | | — | | | | — | | | | | | | | 2,302 | | | | 25,008 | |
Shares redeemed | | | — | | | | — | | | | | | | | (25,247 | ) | | | (276,554) | |
| | | | |
| | | | | |
Net increase (decrease) | | | 419 | | | $ | 5,000 | | | | | | | | 193,575 | | | $ | 2,120,659 | |
| | | | |
| | | | | |
Advisor Class Shares: | | | | | | | | | | | | | | | | | | | | |
Year ended February 28, 2019 | | | | | | | | | | | | | | | | | | | | |
Shares sold | | | 2,251,858 | | | $ | 26,024,538 | | | | | | | | 615,453 | | | $ | 6,557,198 | |
Shares issued in reinvestment of distributions | | | 89,994 | | | | 1,041,218 | | | | | | | | 23,387 | | | | 250,291 | |
Shares redeemed | | | (1,915,126 | ) | | | (22,138,704 | ) | | | | | | | (464,526 | ) | | | (4,977,219) | |
| | | | |
| | | | | |
Net increase (decrease) | | | 426,726 | | | $ | 4,927,052 | | | | | | | | 174,314 | | | $ | 1,830,270 | |
| | | | |
| | | | | |
Year ended February 28, 2018 | | | | | | | | | | | | | | | | | | | | |
Shares sold | | | 2,575,769 | | | $ | 30,699,742 | | | | | | | | 501,371 | | | $ | 5,497,353 | |
Shares issued in reinvestment of distributions | | | 76,078 | | | | 902,785 | | | | | | | | 22,477 | | | | 245,939 | |
Shares redeemed | | | (1,404,971 | ) | | | (16,673,364 | ) | | | | | | | (459,442 | ) | | | (5,029,659) | |
| | | | |
| | | | | |
Net increase (decrease) | | | 1,246,876 | | | $ | 14,929,163 | | | | | | | | 64,406 | | | $ | 713,633 | |
| | | | |
aFor the period September 10, 2018 (effective date) to February 28, 2019.
bMay include a portion of Class C shares that were automatically converted to Class A.
cFor the period August 1, 2017 (effective date) to February 28, 2018.
| | | | | | | | | | | | | | | | | | | | |
| | | Franklin Louisiana | | | | | | Franklin Maryland | |
| | | Tax-Free Income Fund | | | | | | Tax-Free Income Fund | |
| | | | |
| | | Shares | | | Amount | | | | | | Shares | | | Amount | |
| |
Class A Shares: | | | | | | | | | | | | | | | | | | | | |
Year ended February 28, 2019a | | | | | | | | | | | | | | | | | | | | |
Shares soldb | | | 1,701,505 | | | $ | 18,331,952 | | | | | | | | 2,623,165 | | | $ | 27,929,306 | |
Shares issued in reinvestment of distributions | | | 13,389 | | | | 145,490 | | | | | | | | 20,786 | | | | 223,261 | |
Shares redeemed | | | (57,798 | ) | | | (623,556 | ) | | | | | | | (182,556 | ) | | | (1,956,390) | |
| | | | |
| | | | | |
Net increase (decrease) | | | 1,657,096 | | | $ | 17,853,886 | | | | | | | | 2,461,395 | | | $ | 26,196,177 | |
| | | | |
| | | | | | |
170 | | Annual Report | | | | franklintempleton.com |
FRANKLINTAX-FREE TRUST
NOTES TO FINANCIAL STATEMENTS
| | | | | | | | | | | | | | | | | | | | |
| | | Franklin Louisiana | | | | | | Franklin Maryland | |
| | | Tax-Free Income Fund | | | | | | Tax-Free Income Fund | |
| | | | |
| | | Shares | | | Amount | | | | | | Shares | | | Amount | |
| |
Class A1 Shares: | | | | | | | | | | | | | | | | | | | | |
Year ended February 28, 2019 | | | | | | | | | | | | | | | | | | | | |
Shares sold | | | 1,892,989 | | | $ | 20,558,941 | | | | | | | | 2,463,802 | | | $ | 26,510,261 | |
Shares issued in reinvestment of distributions | | | 859,229 | | | | 9,331,241 | | | | | | | | 773,948 | | | | 8,318,557 | |
Shares redeemed | | | (6,283,089 | ) | | | (68,159,582 | ) | | | | | | | (6,982,741 | ) | | | (74,930,222) | |
| | | | |
| | | | | |
Net increase (decrease) | | | (3,530,871 | ) | | $ | (38,269,400 | ) | | | | | | | (3,744,991 | ) | | $ | (40,101,404) | |
| | | | |
| | | | | |
Year ended February 28, 2018 | | | | | | | | | | | | | | | | | | | | |
Shares sold | | | 3,904,387 | | | $ | 43,422,516 | | | | | | | | 3,102,350 | | | $ | 34,111,775 | |
Shares issued in reinvestment of distributions | | | 964,230 | | | | 10,703,033 | | | | | | | | 881,348 | | | | 9,669,457 | |
Shares redeemed | | | (6,076,250 | ) | | | (67,428,531 | ) | | | | | | | (6,041,395 | ) | | | (66,289,218) | |
| | | | |
| | | | | |
Net increase (decrease) | | | (1,207,633 | ) | | $ | (13,302,982 | ) | | | | | | | (2,057,697 | ) | | $ | (22,507,986) | |
| | | | |
| | | | | |
Class C Shares: | | | | | | | | | | | | | | | | | | | | |
Year ended February 28, 2019 | | | | | | | | | | | | | | | | | | | | |
Shares sold | | | 192,802 | | | $ | 2,127,054 | | | | | | | | 333,994 | | | $ | 3,664,867 | |
Shares issued in reinvestment of distributions | | | 121,088 | | | | 1,336,324 | | | | | | | | 160,859 | | | | 1,764,128 | |
Shares redeemedb | | | (2,059,946 | ) | | | (22,582,744 | ) | | | | | | | (3,815,966 | ) | | | (41,575,341) | |
| | | | |
| | | | | |
Net increase (decrease) | | | (1,746,056 | ) | | $ | (19,119,366 | ) | | | | | | | (3,321,113 | ) | | $ | (36,146,346) | |
| | | | |
| | | | | |
Year ended February 28, 2018 | | | | | | | | | | | | | | | | | | | | |
Shares sold | | | 381,901 | | | $ | 4,308,602 | | | | | | | | 582,215 | | | $ | 6,527,038 | |
Shares issued in reinvestment of distributions | | | 149,173 | | | | 1,682,064 | | | | | | | | 222,312 | | | | 2,487,583 | |
Shares redeemed | | | (916,112 | ) | | | (10,337,763 | ) | | | | | | | (2,539,707 | ) | | | (28,467,793) | |
| | | | |
| | | | | |
Net increase (decrease) | | | (385,038 | ) | | $ | (4,347,097 | ) | | | | | | | (1,735,180 | ) | | $ | (19,453,172) | |
| | | | |
| | | | | |
Class R6 Shares: | | | | | | | | | | | | | | | | | | | | |
Year ended February 28, 2019 | | | | | | | | | | | | | | | | | | | | |
Shares sold | | | 92,259 | | | $ | 1,002,367 | | | | | | | | 83,757 | | | $ | 901,840 | |
Shares issued in reinvestment of distributions | | | 11,318 | | | | 122,910 | | | | | | | | 4,653 | | | | 50,070 | |
Shares redeemed | | | (87,754 | ) | | | (949,130 | ) | | | | | | | (54,028 | ) | | | (579,555) | |
| | | | |
| | | | | |
Net increase (decrease) | | | 15,823 | | | $ | 176,147 | | | | | | | | 34,382 | | | $ | 372,355 | |
| | | | |
| | | | | |
Year ended February 28, 2018c | | | | | | | | | | | | | | | | | | | | |
Shares sold | | | 369,029 | | | $ | 4,089,070 | | | | | | | | 133,080 | | | $ | 1,457,209 | |
Shares issued in reinvestment of distributions | | | 3,766 | | | | 41,415 | | | | | | | | 1,294 | | | | 14,074 | |
Shares redeemed | | | (34,871 | ) | | | (385,376 | ) | | | | | | | (6,653 | ) | | | (72,766) | |
| | | | |
| | | | | |
Net increase (decrease) | | | 337,924 | | | $ | 3,745,109 | | | | | | | | 127,721 | | | $ | 1,398,517 | |
| | | | |
| | | | | | | | |
franklintempleton.com | | | | | | Annual Report | | 171 |
FRANKLINTAX-FREE TRUST
NOTES TO FINANCIAL STATEMENTS
2. Shares of Beneficial Interest(continued)
| | | | | | | | | | | | | | | | | | | | |
| | | Franklin Louisiana | | | | | | Franklin Maryland | |
| | | Tax-Free Income Fund | | | | | | Tax-Free Income Fund | |
| | | | |
| | | Shares | | | Amount | | | | | | Shares | | | Amount | |
| |
Advisor Class Shares: | | | | | | | | | | | | | | | | | | | | |
Year ended February 28, 2019 | | | | | | | | | | | | | | | | | | | | |
Shares sold | | | 1,022,146 | | | $ | 11,096,020 | | | | | | | | 2,198,524 | | | $ | 23,599,465 | |
Shares issued in reinvestment of distributions | | | 46,978 | | | | 510,214 | | | | | | | | 99,616 | | | | 1,071,788 | |
| | | | |
| | | | | |
Shares redeemed | | | (570,123 | ) | | | (6,176,872 | ) | | | | | | | (1,966,014 | ) | | | (21,109,071) | |
| | | | |
| | | | | |
Net increase (decrease) | | | 499,001 | | | $ | 5,429,362 | | | | | | | | 332,126 | | | $ | 3,562,182 | |
| | | | | |
Year ended February 28, 2018 | | | | | | | | | | | | | | | | | | | | |
Shares sold | | | 1,110,849 | | | $ | 12,291,234 | | | | | | | | 1,535,085 | | | $ | 16,870,246 | |
Shares issued in reinvestment of distributions | | | 35,937 | | | | 399,186 | | | | | | | | 99,887 | | | | 1,097,058 | |
Shares redeemed | | | (773,996 | ) | | | (8,568,835 | ) | | | | | | | (1,709,539 | ) | | | (18,779,865) | |
| | | | |
| | | | | |
Net increase (decrease) | | | 372,790 | | | $ | 4,121,585 | | | | | | | | (74,567 | ) | | $ | (812,561) | |
| | | | |
aFor the period September 10, 2018 (effective date) to February 28, 2019.
bMay include a portion of Class C shares that were automatically converted to Class A.
cFor the period August 1, 2017 (effective date) to February 28, 2018.
| | | | | | | | | | | | | | | | | | | | |
| | | Franklin Missouri | | | | | | Franklin North Carolina | |
| | | Tax-Free Income Fund | | | | | | Tax-Free Income Fund | |
| | | | |
| | | Shares | | | Amount | | | | | | Shares | | | Amount | |
| |
Class A Shares: | | | | | | | | | | | | | | | | | | | | |
Year ended February 28, 2019a | | | | | | | | | | | | | | | | | | | | |
Shares soldb | | | 5,694,257 | | | $ | 64,576,708 | | | | | | | | 4,783,138 | | | $ | 53,438,165 | |
Shares issued in reinvestment of distributions | | | 50,375 | | | | 573,922 | | | | | | | | 31,986 | | | | 359,667 | |
Shares redeemed | | | (215,068 | ) | | | (2,439,329 | ) | | | | | | | (462,518 | ) | | | (5,179,647) | |
| | | | |
| | | | | |
Net increase (decrease) | | | 5,529,564 | | | $ | 62,711,301 | | | | | | | | 4,352,606 | | | $ | 48,618,185 | |
| | | | |
| | | | | |
Class A1 Shares: | | | | | | | | | | | | | | | | | | | | |
Year ended February 28, 2019 | | | | | | | | | | | | | | | | | | | | |
Shares sold | | | 4,178,015 | | | $ | 47,558,768 | | | | | | | | 3,658,607 | | | $ | 41,138,207 | |
Shares issued in reinvestment of distributions | | | 1,908,645 | | | | 21,736,730 | | | | | | | | 1,490,792 | | | | 16,759,421 | |
Shares redeemed | | | (14,654,167 | ) | | | (166,580,553 | ) | | | | | | | (12,625,503 | ) | | | (141,798,890) | |
| | | | |
| | | | | |
Net increase (decrease) | | | (8,567,507 | ) | | $ | (97,285,055 | ) | | | | | | | (7,476,104 | ) | | $ | (83,901,262) | |
| | | | |
| | | | | |
Year ended February 28, 2018 | | | | | | | | | | | | | | | | | | | | |
Shares sold | | | 8,155,878 | | | $ | 94,873,756 | | | | | | | | 7,059,552 | | | $ | 81,347,688 | |
Shares issued in reinvestment of distributions | | | 2,184,153 | | | | 25,388,332 | | | | | | | | 1,784,760 | | | | 20,559,119 | |
Shares redeemed | | | (14,971,529 | ) | | | (173,806,319 | ) | | | | | | | (14,909,834 | ) | | | (171,347,953) | |
| | | | |
| | | | | |
Net increase (decrease) | | | (4,631,498 | ) | | $ | (53,544,231 | ) | | | | | | | (6,065,522 | ) | | $ | (69,441,146) | |
| | | | |
| | | | | | |
172 | | Annual Report | | | | franklintempleton.com |
FRANKLIN TAX-FREE TRUST
NOTES TO FINANCIAL STATEMENTS
| | | | | | | | | | | | | | | | | | | | |
| | | Franklin Missouri | | | | | | Franklin North Carolina | |
| | | Tax-Free Income Fund | | | | | | Tax-Free Income Fund | |
| | | | |
| | | Shares | | | Amount | | | | | | Shares | | | Amount | |
| |
Class C Shares: | | | | | | | | | | | | | | | | | | | | |
Year ended February 28, 2019 | | | | | | | | | | | | | | | | | | | | |
Shares sold | | | 650,002 | | | $ | 7,473,133 | | | | | | | | 892,002 | | | $ | 10,185,507 | |
Shares issued in reinvestment of distributions | | | 271,070 | | | | 3,118,779 | | | | | | | | 266,815 | | | | 3,049,710 | |
Shares redeemedb | | | (4,523,316 | ) | | | (51,808,510 | ) | | | | | | | (5,910,353 | ) | | | (67,235,251) | |
| | | | |
| | | | | |
Net increase (decrease) | | | (3,602,244 | ) | | $ | (41,216,598 | ) | | | | | | | (4,751,536 | ) | | $ | (54,000,034) | |
| | | | |
| | | | | |
Year ended February 28, 2018 | | | | | | | | | | | | | | | | | | | | |
| | | | | |
Shares sold | | | 1,385,917 | | | $ | 16,314,800 | | | | | | | | 1,187,754 | | | $ | 13,905,039 | |
Shares issued in reinvestment of distributions | | | 343,043 | | | | 4,027,883 | | | | | | | | 346,677 | | | | 4,057,512 | |
Shares redeemed | | | (3,057,910 | ) | | | (35,888,813 | ) | | | | | | | (4,244,905 | ) | | | (49,729,699) | |
| | | | |
| | | | | |
Net increase (decrease) | | | (1,328,950 | ) | | $ | (15,546,130 | ) | | | | | | | (2,710,474 | ) | | $ | (31,767,148) | |
| | | | |
| | | | | |
Class R6 Shares: | | | | | | | | | | | | | | | | | | | | |
| | | | | |
Year ended February 28, 2019 | | | | | | | | | | | | | | | | | | | | |
Shares sold | | | 692,387 | | | $ | 7,883,385 | | | | | | | | 283,860 | | | $ | 3,187,376 | |
Shares issued in reinvestment of distributions | | | 47,558 | | | | 542,086 | | | | | | | | 20,667 | | | | 232,267 | |
Shares redeemed | | | (629,895 | ) | | | (7,163,203 | ) | | | | | | | (424,996 | ) | | | (4,765,686) | |
| | | | |
| | | | | |
Net increase (decrease) | | | 110,050 | | | $ | 1,262,268 | | | | | | | | (120,469 | ) | | $ | (1,346,043) | |
| | | | |
| | | | | |
Year ended February 28, 2018c | | | | | | | | | | | | | | | | | | | | |
| | | | | |
Shares sold | | | 1,822,274 | | | $ | 21,117,056 | | | | | | | | 927,116 | | | $ | 10,609,504 | |
Shares issued in reinvestment of distributions | | | 14,849 | | | | 170,414 | | | | | | | | 7,833 | | | | 88,985 | |
Shares redeemed | | | (296,965 | ) | | | (3,425,877 | ) | | | | | | | (125,955 | ) | | | (1,437,037) | |
| | | | |
| | | | | |
Net increase (decrease) | | | 1,540,158 | | | $ | 17,861,593 | | | | | | | | 808,994 | | | $ | 9,261,452 | |
| | | | |
| | | | | |
Advisor Class Shares: | | | | | | | | | | | | | | | | | | | | |
| | | | | |
Year ended February 28, 2019 | | | | | | | | | | | | | | | | | | | | |
Shares sold | | | 1,626,184 | | | $ | 18,527,100 | | | | | | | | 2,678,876 | | | $ | 30,113,227 | |
Shares issued in reinvestment of distributions | | | 152,450 | | | | 1,736,979 | | | | | | | | 213,149 | | | | 2,396,522 | |
Shares redeemed | | | (2,901,432 | ) | | | (33,030,695 | ) | | | | | | | (2,581,091 | ) | | | (28,984,149) | |
| | | | |
| | | | | |
Net increase (decrease) | | | (1,122,798 | ) | | $ | (12,766,616 | ) | | | | | | | 310,934 | | | $ | 3,525,600 | |
| | | | |
| | | | | |
Year ended February 28, 2018 | | | | | | | | | | | | | | | | | | | | |
Shares sold | | | 2,774,764 | | | $ | 32,380,256 | | | | | | | | 2,610,981 | | | $ | 30,179,959 | |
Shares issued in reinvestment of distributions | | | 196,429 | | | | 2,285,770 | | | | | | | | 271,648 | | | | 3,131,310 | |
Shares redeemed | | | (3,728,313 | ) | | | (43,288,708 | ) | | | | | | | (5,060,990 | ) | | | (58,187,354) | |
| | | | |
| | | | | |
Net increase (decrease) | | | (757,120 | ) | | $ | (8,622,682 | ) | | | | | | | (2,178,361 | ) | | $ | (24,876,085) | |
| | | | |
aFor the period September 10, 2018 (effective date) to February 28, 2019.
bMay include a portion of Class C shares that were automatically converted to Class A.
cFor the period August 1, 2017 (effective date) to February 28, 2018.
| | | | | | | | |
| | | Franklin Virginia | |
| | | Tax-Free Income Fund | |
| | | | |
| | | Shares | | | Amount | |
| |
Class A Shares: | | | | | | | | |
Year ended February 28, 2019a | | | | | | | | |
Shares soldb | | | 3,750,653 | | | $ | 40,505,541 | |
Shares issued in reinvestment of distributions | | | 25,782 | | | | 280,124 | |
Shares redeemed | | | (152,004 | ) | | | (1,645,712) | |
Net increase (decrease) | | | 3,624,431 | | | $ | 39,139,953 | |
| | | | | | | | |
franklintempleton.com | | | | | | Annual Report | | 173 |
FRANKLINTAX-FREE TRUST
NOTES TO FINANCIAL STATEMENTS
2. Shares of Beneficial Interest(continued)
| | | | | | | | |
| | | Franklin Virginia | |
| | | Tax-Free Income Fund | |
| | | | |
| | | Shares | | | Amount | |
| |
Class A1 Shares: | | | | | | | | |
Year ended February 28, 2019 | | | | | | | | |
Shares sold | | | 2,263,579 | | | | $ 24,620,541 | |
Shares issued in reinvestment of distributions | | | 1,110,144 | | | | 12,066,860 | |
Shares redeemed | | | (8,136,741 | ) | | | (88,362,462) | |
| | | | |
| | |
Net increase (decrease) | | | (4,763,018 | ) | | | $(51,675,061) | |
| | | | |
| | |
Year ended February 28, 2018 | | | | | | | | |
Shares sold | | | 3,915,954 | | | | $ 43,657,746 | |
Shares issued in reinvestment of distributions | | | 1,274,870 | | | | 14,217,434 | |
Shares redeemed | | | (8,566,461 | ) | | | (95,416,168) | |
| | | | |
| | |
Net increase (decrease) | | | (3,375,637 | ) | | | $(37,540,988) | |
| | | | |
| | |
Class C Shares: | | | | | | | | |
Year ended February 28, 2019 | | | | | | | | |
Shares sold | | | 334,165 | | | | $ 3,691,239 | |
Shares issued in reinvestment of distributions | | | 164,176 | | | | 1,815,093 | |
Shares redeemedb | | | (3,087,329 | ) | | | (33,943,377) | |
| | | | |
| | |
Net increase (decrease) | | | (2,588,988 | ) | | | $(28,437,045) | |
| | | | |
| | |
Year ended February 28, 2018 | | | | | | | | |
Shares sold | | | 524,425 | | | | $ 5,946,438 | |
Shares issued in reinvestment of distributions | | | 214,165 | | | | 2,428,090 | |
Shares redeemed | | | (1,959,030 | ) | | | (22,225,318) | |
| | | | |
| | |
Net increase (decrease) | | | (1,220,440 | ) | | | $(13,850,790) | |
| | | | |
| | |
Class R6 Shares: | | | | | | | | |
Year ended February 28, 2019 | | | | | | | | |
Shares sold | | | 205,369 | | | | $ 2,230,301 | |
Shares issued in reinvestment of distributions | | | 15,838 | | | | 172,212 | |
Shares redeemed | | | (229,022 | ) | | | (2,485,390) | |
| | | | |
| | |
Net increase (decrease) | | | (7,815 | ) | | | $(82,877) | |
| | | | |
| | |
Year ended February 28, 2018c | | | | | | | | |
Shares sold | | | 550,417 | | | | $ 6,120,617 | |
Shares issued in reinvestment of distributions | | | 4,889 | | | | 53,758 | |
Shares redeemed | | | (94,542 | ) | | | (1,045,488) | |
| | | | |
| | |
Net increase (decrease) | | | 460,764 | | | | $ 5,128,887 | |
| | | | |
| | | | | | |
174 | | Annual Report | | | | franklintempleton.com |
FRANKLINTAX-FREE TRUST
NOTES TO FINANCIAL STATEMENTS
| | | | | | | | |
| | | Franklin Virginia | |
| | | Tax-Free Income Fund | |
| | | | |
| | | Shares | | | Amount | |
| |
Advisor Class Shares: | | | | | | | | |
Year ended February 28, 2019 | | | | | | | | |
Shares sold | | | 2,570,856 | | | | $ 27,896,895 | |
Shares issued in reinvestment of distributions | | | 231,856 | | | | 2,522,353 | |
Shares redeemed | | | (2,846,090 | ) | | | (30,928,292) | |
| | | | |
| | |
Net increase (decrease) | | | (43,378 | ) | | | $(509,044) | |
| | | | |
| | |
Year ended February 28, 2018 | | | | | | | | |
Shares sold | | | 2,656,299 | | | | $ 29,728,563 | |
Shares issued in reinvestment of distributions | | | 254,655 | | | | 2,841,254 | |
Shares redeemed | | | (2,819,393 | ) | | | (31,426,780) | |
| | | | |
| | |
Net increase (decrease) | | | 91,561 | | | | $ 1,143,037 | |
| | | | |
aFor the period September 10, 2018 (effective date) to February 28, 2019.
bMay include a portion of Class C shares that were automatically converted to Class A.
cFor the period August 1, 2017 (effective date) to February 28, 2018.
3. Transactions with Affiliates
Franklin Resources, Inc. is the holding company for various subsidiaries that together are referred to as Franklin Templeton. Certain officers and trustees of the Trust are also officers and/or directors of the following subsidiaries:
| | | | |
| Subsidiary | | | | Affiliation |
Franklin Advisers, Inc. (Advisers) | | | | Investment manager |
Franklin Templeton Services, LLC (FT Services) | | | | Administrative manager |
Franklin Templeton Distributors, Inc. (Distributors) | | | | Principal underwriter |
Franklin Templeton Investor Services, LLC (Investor Services) | | | | Transfer agent |
a. Management Fees
The Funds pay an investment management fee to Advisers based on themonth-end net assets of each of the Funds as follows:
| | |
| Annualized Fee Rate | | Net Assets |
| 0.625% | | Up to and including $100 million |
| 0.500% | | Over $100 million, up to and including $250 million |
| 0.450% | | Over $250 million, up to and including $7.5 billion |
| 0.440% | | Over $7.5 billion, up to and including $10 billion |
| 0.430% | | Over $10 billion, up to and including $12.5 billion |
| 0.420% | | Over $12.5 billion, up to and including $15 billion |
| 0.400% | | Over $15 billion, up to and including $17.5 billion |
| 0.380% | | Over $17.5 billion, up to and including $20 billion |
| 0.360% | | In excess of $20 billion |
| | | | | | | | |
franklintempleton.com | | | | | | Annual Report | | 175 |
FRANKLIN TAX-FREE TRUST
NOTES TO FINANCIAL STATEMENTS
3. Transactions with Affiliates(continued)
a. Management Fees(continued)
For the year ended February 28, 2019, each Fund’s gross effective investment management fee rate based on average daily net assets was as follows:
| | | | | | | | | | | | |
| | | Franklin
Alabama
Tax-Free
Income Fund | | Franklin Florida
Tax-Free
Income Fund | | Franklin
Georgia
Tax-Free
Income Fund | | Franklin
Kentucky
Tax-Free
Income Fund | | Franklin
Louisiana
Tax-Free Income Fund | | |
| | | | | | |
| | 0.547% | | 0.490% | | 0.500% | | 0.580% | | 0.514% | | |
| | | | | | | | | | | | | | | | | | | | |
| | | Franklin
Maryland
Tax-Free
Income Fund | | | Franklin
Missouri
Tax-Free
Income Fund | | | Franklin
North Carolina
Tax-Free
Income Fund | | | Franklin
Virginia
Tax-Free
Income Fund | | | | |
| | | | | | | | |
| | | | | |
| | | 0.506% | | | | 0.473% | | | | 0.477% | | | | 0.490% | | | | | |
b. Administrative Fees
Under an agreement with Advisers, FT Services provides administrative services to the Funds. The fee is paid by Advisers based on each of the Funds’ average daily net assets, and is not an additional expense of the Funds.
c. Distribution Fees
The Board has adopted distribution plans for each share class, with the exception of Class R6 and Advisor Class shares, pursuant to Rule12b-1 under the 1940 Act. Under the Funds’ Class A and A1 reimbursement distribution plans, the Funds reimburse Distributors for costs incurred in connection with the servicing, sale and distribution of each Fund’s shares up to the maximum annual plan rate for each class. Under the Class A and A1 reimbursement distribution plans, costs exceeding the maximum for the current plan year cannot be reimbursed in subsequent periods. In addition, under the Funds’ Class C compensation distribution plans, the Funds pay Distributors for costs incurred in connection with the servicing, sale and distribution of each Fund’s shares up to the maximum annual plan rate. The plan year, for purposes of monitoring compliance with the maximum annual plan rates, is February 1 through January 31 for each Fund.
The maximum annual plan rates, based on the average daily net assets, for each class, are as follows:
| | | | | | | | | | | | |
| | | Franklin
Alabama
Tax-Free
Income Fund | | | Franklin
Florida
Tax-Free
Income Fund | | | Franklin
Georgia
Tax-Free
Income Fund | |
| | | |
Reimbursement Plans: | | | | | | | | | | | | |
Class A | | | 0.25% | | | | 0.25% | | | | 0.25% | |
Class A1. | | | 0.10% | | | | 0.10% | | | | 0.10% | |
Compensation Plans: | | | | | | | | | | | | |
Class C | | | 0.65% | | | | 0.65% | | | | 0.65% | |
| | | | | | |
176 | | Annual Report | | | | franklintempleton.com |
FRANKLINTAX-FREE TRUST
NOTES TO FINANCIAL STATEMENTS
| | | | | | | | | | |
| | | |
| | | Franklin
Kentucky
Tax-Free
Income Fund | | | Franklin
Louisiana
Tax-Free
Income Fund | | | Franklin
Maryland
Tax-Free
Income Fund |
| | | |
Reimbursement Plans: | | | | | | | | | | |
Class A | | | 0.25% | | | | 0.25% | | | 0.25% |
Class A1. | | | 0.10% | | | | 0.10% | | | 0.10% |
Compensation Plans: | | | | | | | | | | |
Class C | | | — | | | | 0.65% | | | 0.65% |
| | | |
| | | Franklin
Missouri
Tax-Free
Income Fund | | | Franklin
North Carolina
Tax-Free
Income Fund | | | Franklin
Virginia
Tax-Free
Income Fund |
| | | |
Reimbursement Plans: | | | | | | | | | | |
Class A | | | 0.25% | | | | 0.25% | | | 0.25% |
Class A1. | | | 0.10% | | | | 0.10% | | | 0.10% |
Compensation Plans: | | | | | | | | | | |
Class C | | | 0.65% | | | | 0.65% | | | 0.65% |
d. Sales Charges/Underwriting Agreements
Front-end sales charges and contingent deferred sales charges (CDSC) do not represent expenses of the Funds. These charges are deducted from the proceeds of sales of fund shares prior to investment or from redemption proceeds prior to remittance, as applicable. Distributors has advised the Funds of the following commission transactions related to the sales and redemptions of the Funds’ shares for the year:
| | | | | | | | | | |
| | | Franklin
Alabama
Tax-Free
Income Fund | | | Franklin
Florida
Tax-Free
Income Fund | | | Franklin
Georgia
Tax-Free
Income Fund |
| | | |
Sales charges retained net of commissions paid to unaffiliated brokers/dealers | | | $13,519 | | | | $19,897 | | | $33,343 |
CDSC retained | | | $ 987 | | | | $16,286 | | | $ 6,656 |
| | | |
| | | Franklin
Kentucky
Tax-Free
Income Fund | | | Franklin
Louisiana
Tax-Free
Income Fund | | | Franklin
Maryland
Tax-Free
Income Fund |
| | | |
Sales charges retained net of commissions paid to unaffiliated brokers/dealers | | | $9,787 | | | | $38,605 | | | $21,644 |
CDSC retained | | | $2,391 | | | | $ 8,046 | | | $ 4,752 |
| | | |
| | | Franklin
Missouri
Tax-Free
Income Fund | | | Franklin
North Carolina
Tax-Free
Income Fund | | | Franklin
Virginia
Tax-Free
Income Fund |
| | | |
Sales charges retained net of commissions paid to unaffiliated brokers/dealers | | | $69,098 | | | | $49,884 | | | $30,918 |
CDSC retained | | | $11,763 | | | | $ 8,274 | | | $ 4,051 |
Effective March 1, 2019, certainfront-end sales charges on Class A and A1 shares were lowered. Further details are disclosed in the Funds’ Prospectus.
| | | | | | | | |
franklintempleton.com | | | | | | Annual Report | | 177 |
FRANKLINTAX-FREE TRUST
NOTES TO FINANCIAL STATEMENTS
3. Transactions with Affiliates(continued)
e. Transfer Agent Fees
Each class of shares pays transfer agent fees to Investor Services for its performance of shareholder servicing obligations. The fees are based on an annualized asset based fee of 0.02% plus a transaction based fee. In addition, each class reimburses Investor Services for out of pocket expenses incurred and, except for Class R6, reimburses shareholder servicing fees paid to third parties. These fees are allocated daily based upon their relative proportion of such classes’ aggregate net assets. Class R6 pays Investor Services transfer agent fees specific to that class.
For the year ended February 28, 2019, the Funds paid transfer agent fees as noted in the Statements of Operations of which the following amounts were retained by Investor Services:
| | | | | | | | | | |
| | | Franklin
Alabama
Tax-Free
Income Fund | | | Franklin
Florida
Tax-Free
Income Fund | | | Franklin
Georgia
Tax-Free
Income Fund |
| | | |
Transfer agent fees | | | $74,663 | | | | $193,483 | | | $152,380 |
| | | |
| | | Franklin
Kentucky
Tax-Free
Income Fund | | | Franklin
Louisiana
Tax-Free
Income Fund | | | Franklin
Maryland
Tax-Free
Income Fund |
| | | |
Transfer agent fees | | | $45,974 | | | | $108,861 | | | $148,914 |
| | | |
| | | Franklin
Missouri
Tax-Free
Income Fund | | | Franklin
North Carolina
Tax-Free
Income Fund | | | Franklin
Virginia
Tax-Free
Income Fund |
| | | |
Transfer agent fees | | | $300,223 | | | | $251,797 | | | $197,404 |
f. Waiver and Expense Reimbursements
Investor Services has contractually agreed in advance to waive or limit its fees so that the Class R6 transfer agent fees do not exceed 0.03% based on the average net assets of the class until June 30, 2019.
g. Interfund Transactions
Certain or all Funds engaged in purchases and sales of investments with funds or other accounts that have common investment managers (or affiliated investment managers), directors, trustees or officers. These purchases and sales for the year ended February 28, 2019, were as follows:
| | | | | | | | | | | | | | | | |
| | | Franklin
Florida
Tax-Free
Income Fund | | | Franklin
Georgia
Tax-Free
Income Fund | | | Franklin
Kentucky
Tax-Free
Income Fund | | | Franklin
Louisiana
Tax-Free
Income Fund | |
Purchases | | | $52,600,000 | | | | $2,450,000 | | | | $2,400,000 | | | | $10,000,000 | |
Sales | | | $39,400,000 | | | | $1,600,000 | | | | $ — | | | | $ 5,300,000 | |
| | | | |
| | | Franklin
Maryland
Tax-Free
Income Fund | | | Franklin
Missouri
Tax-Free
Income Fund | | | Franklin
North Carolina
Tax-Free
Income Fund | | | Franklin
Virginia
Tax-Free
Income Fund | |
Purchases | | | $200,000 | | | | $7,300,000 | | | | $39,335,000 | | | | $1,950,000 | |
Sales | | | $ — | | | | $1,300,000 | | | | $11,700,000 | | | | $ — | |
| | | | | | |
178 | | Annual Report | | | | franklintempleton.com |
FRANKLINTAX-FREE TRUST
NOTES TO FINANCIAL STATEMENTS
4. Expense Offset Arrangement
The Funds have entered into an arrangement with their custodian whereby credits realized as a result of uninvested cash balances are used to reduce a portion of the Funds’ custodian expenses. During the year ended February 28, 2019, the custodian fees were reduced as noted in the Statements of Operations.
5. Income Taxes
For tax purposes, capital losses may be carried over to offset future capital gains.
At February 28, 2019, the capital loss carryforwards were as follows:
| | | | | | | | | | | | |
| | | Franklin
Alabama
Tax-Free
Income Fund | | | Franklin
Florida
Tax-Free
Income Fund | | | Franklin
Georgia
Tax-Free
Income Fund | |
| | | |
Capital loss carryforwards not subject to expiration: | | | | | | | | | | | | |
Short term | | | $ 2,932,301 | | | | $11,277,278 | | | | $ 3,073,256 | |
Long term | | | 14,712,588 | | | | 51,043,457 | | | | 19,666,927 | |
| | | | |
| | | |
Total capital loss carryforwards | | | $17,644,889 | | | | $62,320,735 | | | | $22,740,183 | |
| | | | |
| | | |
| | | Franklin
Kentucky
Tax-Free
Income Fund | | | Franklin
Louisiana
Tax-Free
Income Fund | | | Franklin
Maryland
Tax-Free
Income Fund | |
| | | |
Capital loss carryforwards not subject to expiration: | | | | | | | | | | | | |
Short term | | | $2,281,513 | | | | $10,920,503 | | | | $11,476,244 | |
Long term | | | 7,649,663 | | | | 16,795,581 | | | | 30,266,741 | |
| | | | |
| | | |
Total capital loss carryforwards | | | $9,931,176 | | | | $27,716,084 | | | | $41,742,985 | |
| | | | |
| | | |
| | | Franklin
Missouri
Tax-Free
Income Fund | | | Franklin
North Carolina
Tax-Free
Income Fund | | | Franklin
Virginia
Tax-Free
Income Fund | |
| | | |
Capital loss carryforwards not subject to expiration: | | | | | | | | | | | | |
Short term | | | $10,021,941 | | | | $23,575,835 | | | | $16,243,110 | |
Long term | | | 60,673,761 | | | | 64,095,578 | | | | 38,154,756 | |
| | | | |
| | | |
Total capital loss carryforwards | | | $70,695,702 | | | | $87,671,413 | | | | $54,397,866 | |
| | | | |
During the year ended February 28, 2019, the following Funds utilized capital loss carryforwards as follows:
| | | | | | | | | | | | | | | | | | | | |
| | | Franklin Kentucky Tax-Free
Income Fund | | | Franklin
Louisiana
Tax-Free
Income Fund | | | Franklin
Maryland
Tax-Free
Income Fund | | | Franklin
Virginia
Tax-Free
Income Fund | | | | |
| | | | | | | | |
| | | $322,056 | | | | $167,553 | | | | $402,494 | | | | $181,342 | | | | | |
On February 28, 2019, Franklin MissouriTax-Free Income Fund had expired capital loss carryforwards of $835, which were reclassified topaid-in capital.
| | | | | | | | |
franklintempleton.com | | | | | | Annual Report | | 179 |
FRANKLINTAX-FREE TRUST
NOTES TO FINANCIAL STATEMENTS
5. Income Taxes(continued)
The tax character of distributions paid during the years ended February 28, 2019 and 2018, was as follows:
| | | | | | | | | | | | | | | | | | | | | | | | |
| | | Franklin Alabama Tax-Free Income Fund | | | Franklin Florida Tax-Free Income Fund | | | Franklin Georgia Tax-Free Income Fund | |
| | | | |
| | | 2019 | | | 2018 | | | 2019 | | | 2018 | | | 2019 | | | 2018 | |
Distributions paid from tax exempt
income | | | $ 7,467,653 | | | | $ 8,800,650 | | | | $21,506,767 | | | | $26,274,354 | | | | $15,236,578 | | | | $17,738,333 | |
| | | | |
| | | |
| | | Franklin Kentucky Tax-Free Income Fund | | | Franklin Louisiana Tax-Free Income Fund | | | Franklin Maryland Tax-Free Income Fund | |
| | | | |
| | | 2019 | | | 2018 | | | 2019 | | | 2018 | | | 2019 | | | 2018 | |
Distributions paid from tax exempt
income | | | $ 4,795,238 | | | | $ 5,759,359 | | | | $11,935,064 | | | | $13,389,237 | | | | $13,095,114 | | | | $15,242,249 | |
| | | | |
| | | |
| | | Franklin Missouri Tax-Free Income Fund | | | Franklin North Carolina Tax-Free Income Fund | | | Franklin Virginia Tax-Free Income Fund | |
| | | | |
| | | 2019 | | | 2018 | | | 2019 | | | 2018 | | | 2019 | | | 2018 | |
Distributions paid from tax exempt
income | | | $ 30,155,162 | | | | $ 34,887,399 | | | | $25,702,570 | | | | $31,522,556 | | | | $18,765,898 | | | | $21,703,718 | |
| | | | |
At February 28, 2019, the cost of investments, net unrealized appreciation (depreciation) and undistributed tax exempt income for income tax purposes were as follows:
| | | | | | | | | | | | |
| | | Franklin
Alabama
Tax-Free
Income Fund | | | Franklin Florida
Tax-Free
Income Fund | | | Franklin
Georgia
Tax-Free
Income Fund | |
| |
Cost of investments | | $ | 224,210,363 | | | $ | 537,275,749 | | | $ | 437,682,732 | |
| | | | |
| | | |
Unrealized appreciation | | $ | 8,358,956 | | | $ | 26,384,669 | | | $ | 15,532,797 | |
Unrealized depreciation | | | (367,297 | ) | | | (9,548,368 | ) | | | (7,668,713 | ) |
| | | | |
Net unrealized appreciation (depreciation) | | $ | 7,991,659 | | | $ | 16,836,301 | | | $ | 7,864,084 | |
| | | | |
| | | |
Distributable earnings: | | | | | | | | | | | | |
Undistributed tax exempt income | | $ | 459,897 | | | $ | 1,808,675 | | | $ | 1,201,057 | |
| | | | |
| | | |
| | | Franklin
Kentucky
Tax-Free
Income Fund | | | Franklin
Louisiana
Tax-Free
Income Fund | | | Franklin
Maryland
Tax-Free
Income Fund | |
| |
Cost of investments | | $ | 136,438,314 | | | $ | 354,459,026 | | | $ | 390,411,465 | |
| | | | |
| | | |
Unrealized appreciation | | $ | 3,948,311 | | | $ | 12,859,736 | | | $ | 13,725,337 | |
Unrealized depreciation | | | (201,776 | ) | | | (3,086,316 | ) | | | (4,347,118 | ) |
| | | | |
Net unrealized appreciation (depreciation) | | $ | 3,746,535 | | | $ | 9,773,420 | | | $ | 9,378,219 | |
| | | | |
| | | |
Distributable earnings: | | | | | | | | | | | | |
Undistributed tax exempt income | | $ | 290,513 | | | $ | 776,573 | | | $ | 1,350,984 | |
| | | | |
| | | | | | |
180 | | Annual Report | | | | franklintempleton.com |
FRANKLINTAX-FREE TRUST
NOTES TO FINANCIAL STATEMENTS
| | | | | | | | | | | | |
| | | |
| | | Franklin
Missouri
Tax-Free
Income Fund | | | Franklin
North Carolina
Tax-Free
Income Fund | | | Franklin
Virginia
Tax-Free
Income Fund | |
| |
Cost of investments | | $ | 925,388,608 | | | $ | 801,565,663 | | | $ | 574,829,654 | |
| | | | |
| | | |
Unrealized appreciation | | $ | 27,027,970 | | | $ | 21,679,904 | | | $ | 18,684,337 | |
Unrealized depreciation | | | (14,946,509 | ) | | | (13,586,490 | ) | | | (5,305,528 | ) |
| | | | |
Net unrealized appreciation (depreciation) | | $ | 12,081,461 | | | $ | 8,093,414 | | | $ | 13,378,809 | |
| | | | |
| | | |
Distributable earnings: | | | | | | | | | | | | |
Undistributed tax exempt income | | $ | 2,848,142 | | | $ | 2,328,800 | | | $ | 1,504,702 | |
| | | | |
Differences between income and/or capital gains as determined on a book basis and a tax basis are primarily due to differing treatments of bond discounts, wash sales and bond workout expenditures.
6. Investment Transactions
Purchases and sales of investments (excluding short term securities) for the year ended February 28, 2019, were as follows:
| | | | | | | | | | | | |
| | | Franklin
Alabama
Tax-Free
Income Fund | | | Franklin
Florida
Tax-Free
Income Fund | | | Franklin
Georgia
Tax-Free
Income Fund | |
| |
Purchases | | | $21,071,616 | | | | $ 58,705,313 | | | | $ 55,535,430 | |
Sales | | | $45,539,157 | | | | $135,115,725 | | | | $107,964,226 | |
| | | |
| | | Franklin
Kentucky
Tax-Free
Income Fund | | | Franklin
Louisiana
Tax-Free
Income Fund | | | Franklin
Maryland
Tax-Free
Income Fund | |
| |
Purchases | | | $27,232,932 | | | | $35,429,894 | | | | $22,462,793 | |
Sales | | | $41,156,960 | | | | $74,308,002 | | | | $67,353,532 | |
| | | |
| | | Franklin
Missouri
Tax-Free
Income Fund | | | Franklin
North Carolina
Tax-Free
Income Fund | | | Franklin
Virginia
Tax-Free
Income Fund | |
| |
Purchases | |
| $
95,519,130 |
| |
| $
97,973,358 |
| | | $ 57,199,183 | |
Sales | | | $183,496,815 | | | | $213,018,692 | | | | $102,381,650 | |
| | | | | | | | |
franklintempleton.com | | | | | | Annual Report | | 181 |
FRANKLINTAX-FREE TRUST
NOTES TO FINANCIAL STATEMENTS
7. Defaulted Securities
Certain or all Funds held defaulted securities and/or other securities for which the income has been deemed uncollectible. The Funds discontinue accruing income on securities for which income has been deemed uncollectible and provide an estimate for losses on interest receivable. The securities have been identified in the accompanying Statements of Investments. At February 28, 2019, the aggregate value of these securities was as follows:
| | | | | | | | |
| | | Value | | | Percentage of
Net Assets | |
| |
Franklin FloridaTax-Free Income Fund | | $ | 13,725,000 | | | | 2.5% | |
Franklin GeorgiaTax-Free Income Fund | | | 3,431,295 | | | | 0.8% | |
Franklin LouisianaTax-Free Income Fund | | | 4,426,313 | | | | 1.2% | |
Franklin MarylandTax-Free Income Fund | | | 6,875,000 | | | | 1.7% | |
Franklin MissouriTax-Free Income Fund | | | 24,301,650 | | | | 2.6% | |
Franklin North CarolinaTax-Free Income Fund. | | | 21,173,519 | | | | 2.6% | |
Franklin VirginiaTax-Free Income Fund. | | | 9,346,000 | | | | 1.6% | |
8. Concentration of Risk
Certain or all Funds invest a large percentage of their total assets in obligations of issuers within their respective state, U.S. territories, and the District of Columbia. Such concentration may subject the Funds to risks associated with industrial or regional matters, and economic, political or legal developments occurring within those states, U.S. territories, and the District of Columbia. Investing in Puerto Rico securities may expose the Funds to heightened risks due to recent adverse economic and market changes, credit downgrades and ongoing restructuring discussions. In addition, investments in these securities are sensitive to interest rate changes and credit risk of the issuer and may subject the Funds to increased market volatility. The market for these investments may be limited, which may make them difficult to buy or sell.
9. Credit Facility
The Funds, together with other U.S. registered and foreign investment funds (collectively, Borrowers), managed by Franklin Templeton, are borrowers in a joint syndicated senior unsecured credit facility totaling $2 billion (Global Credit Facility) which matures on February 7, 2020. This Global Credit Facility provides a source of funds to the Borrowers for temporary and emergency purposes, including the ability to meet future unanticipated or unusually large redemption requests.
Under the terms of the Global Credit Facility, the Funds shall, in addition to interest charged on any borrowings made by the Funds and other costs incurred by the Funds, pay their share of fees and expenses incurred in connection with the implementation and maintenance of the Global Credit Facility, based upon their relative share of the aggregate net assets of all of the Borrowers, including an annual commitment fee of 0.15% based upon the unused portion of the Global Credit Facility. These fees are reflected in other expenses in the Statements of Operations. During the year ended February 28, 2019, the Funds did not use the Global Credit Facility.
10. Fair Value Measurements
The Funds follow a fair value hierarchy that distinguishes between market data obtained from independent sources (observable inputs) and the Funds’ own market assumptions (unobservable inputs). These inputs are used in determining the value of the Funds’ financial instruments and are summarized in the following fair value hierarchy:
| | • | | Level 1 – quoted prices in active markets for identical financial instruments |
| | | | | | |
182 | | Annual Report | | | | franklintempleton.com |
FRANKLINTAX-FREE TRUST
NOTES TO FINANCIAL STATEMENTS
| | • | | Level 2 – other significant observable inputs (including quoted prices for similar financial instruments, interest rates, prepayment speed, credit risk, etc.) |
| | • | | Level 3 – significant unobservable inputs (including the Funds’ own assumptions in determining the fair value of financial instruments) |
The input levels are not necessarily an indication of the risk or liquidity associated with financial instruments at that level.
At February 28, 2019, all of the Funds’ investments in financial instruments carried at fair value were valued using Level 2 inputs.
11. Subsequent Events
The Funds have evaluated subsequent events through the issuance of the financial statements and determined that no events have occurred that require disclosure other than those already disclosed in the financial statements.
Abbreviations
Selected Portfolio
| | | | | | |
| AGMC | | Assured Guaranty Municipal Corp. | | IDB | | Industrial Development Bond/Board |
| AMBAC | | American Municipal Bond Assurance Corp. | | IDBR | | Industrial Development Board Revenue |
| BAM | | Build America Mutual Assurance Co. | | LOC | | Letter of Credit |
| BHAC | | Berkshire Hathaway Assurance Corp. | | MBS | | Mortgage-Backed Security |
| CDA | | Community Development Authority/Agency | | MFHR | | Multi-Family Housing Revenue |
| COP | | Certificate of Participation | | NATL | | National Public Financial Guarantee Corp. |
| EDA | | Economic Development Authority | | PBA | | Public Building Authority |
| EDC | | Economic Development Corp. | | PCFA | | Pollution Control Financing Authority |
| EDR | | Economic Development Revenue | | PCR | | Pollution Control Revenue |
| ETM | | Escrow to Maturity | | PFAR | | Public Financing Authority Revenue |
| FGIC | | Financial Guaranty Insurance Co. | | RDA | | Redevelopment Agency/Authority |
| FICO | | Financing Corp. | | RDAR | | Redevelopment Agency Revenue |
| GNMA | | Government National Mortgage Association | | SFM | | Single Family Mortgage |
| GO | | General Obligation | | SFMR | | Single Family Mortgage Revenue |
| HDA | | Housing Development Authority/Agency | | SPA | | Standby Purchase Agreement |
| HFAR | | Housing Finance Authority Revenue | | SRF | | State Revolving Fund |
| IDA | | Industrial Development Authority/Agency | | XLCA | | XL Capital Assurance |
| IDAR | | Industrial Development Authority Revenue | | | | |
| | | | | | | | |
franklintempleton.com | | | | | | Annual Report | | 183 |
FRANKLINTAX-FREE TRUST
Report of Independent Registered Public Accounting Firm
To the Board of Trustees of FranklinTax-Free Trust and Shareholders of Franklin AlabamaTax-Free Income Fund, Franklin FloridaTax-Free Income Fund, Franklin GeorgiaTax-Free Income Fund, Franklin KentuckyTax-Free Income Fund, Franklin LouisianaTax-Free Income Fund, Franklin MarylandTax-Free Income Fund, Franklin MissouriTax-Free Income Fund, Franklin North CarolinaTax-Free Income Fund and Franklin VirginiaTax-Free Income Fund
Opinions on the Financial Statements
We have audited the accompanying statements of assets and liabilities, including the statements of investments, of Franklin AlabamaTax-Free Income Fund, Franklin FloridaTax-Free Income Fund, Franklin GeorgiaTax-Free Income Fund, Franklin KentuckyTax-Free Income Fund, Franklin LouisianaTax-Free Income Fund, Franklin MarylandTax-Free Income Fund, Franklin MissouriTax-Free Income Fund, Franklin North CarolinaTax-Free Income Fund and Franklin VirginiaTax-Free Income Fund (the “Funds”) as of February 28, 2019, the related statements of operations for the year ended February 28, 2019, the statements of changes in net assets for each of the two years in the period ended February 28, 2019, including the related notes, and the financial highlights for each of the periods indicated therein (collectively referred to as the “financial statements”). In our opinion, the financial statements present fairly, in all material respects, the financial position of each of the Funds as of February 28, 2019, the results of each of their operations for the year then ended, the changes in each of their net assets for each of the two years in the period ended February 28, 2019 and each of the financial highlights for each of the periods indicated therein in conformity with accounting principles generally accepted in the United States of America.
Basis for Opinions
These financial statements are the responsibility of the Funds’ management. Our responsibility is to express an opinion on the Funds’ financial statements based on our audits. We are a public accounting firm registered with the Public Company Accounting Oversight Board (United States) (PCAOB) and are required to be independent with respect to the Funds in accordance with the U.S. federal securities laws and the applicable rules and regulations of the Securities and Exchange Commission and the PCAOB.
We conducted our audits of these financial statements in accordance with the standards of the PCAOB. Those standards require that we plan and perform the audit to obtain reasonable assurance about whether the financial statements are free of material misstatement, whether due to error or fraud.
Our audits included performing procedures to assess the risks of material misstatement of the financial statements, whether due to error or fraud, and performing procedures that respond to those risks. Such procedures included examining, on a test basis, evidence regarding the amounts and disclosures in the financial statements. Our audits also included evaluating the accounting principles used and significant estimates made by management, as well as evaluating the overall presentation of the financial statements. Our procedures included confirmation of securities owned as of February 28, 2019 by correspondence with the custodian and brokers; when replies were not received from brokers, we performed other auditing procedures. We believe that our audits provide a reasonable basis for our opinions.
PricewaterhouseCoopers LLP
San Francisco, California
April 16, 2019
We have served as the auditor of one or more investment companies in the Franklin Templeton Group of Funds since 1948.
| | | | | | |
184 | | Annual Report | | | | franklintempleton.com |
FRANKLINTAX-FREE TRUST
Tax Information (unaudited)
Under Section 852(b)(5)(A) of the Internal Revenue Code, the Funds hereby report 100% of the distributions paid from net investment income as exempt-interest dividends for the fiscal year ended February 28, 2019. A portion of the Funds’ exempt-interest dividends may be subject to the federal alternative minimum tax. Bymid-February 2020, shareholders will be notified of amounts for use in preparing their 2019 income tax returns.
| | | | |
franklintempleton.com | | Annual Report | | 185 |
FRANKLINTAX-FREE TRUST
Board Members and Officers
The name, year of birth and address of the officers and board members, as well as their affiliations, positions held with the Trust, principal occupations during at least the past five years and number of U.S. registered portfolios overseen in the Franklin Templeton Investments fund complex, are shown below. Generally, each board member serves until that person’s successor is elected and qualified.
Independent Board Members
| | | | | | | | |
Name, Year of Birth and Address | | Position | | Length of
Time Served | | Number of Portfolios in
Fund Complex Overseen
by Board Member* | | Other Directorships Held During at Least the Past 5 Years |
| | | | |
Harris J. Ashton (1932) One Franklin Parkway San Mateo, CA 94403-1906 | | Trustee | | Since 1984 | | 136 | | Bar-S Foods (meat packing company) (1981-2010). |
|
Principal Occupation During at Least the Past 5 Years: Director of various companies; andformerly, Director, RBC Holdings, Inc. (bank holding company) (until 2002); and President, Chief Executive Officer and Chairman of the Board, General Host Corporation (nursery and craft centers) (until 1998). |
| | | | |
Terrence J. Checki (1945) One Franklin Parkway San Mateo, CA 94403-1906 | | Trustee | | Since 2017 | | 112 | | Hess Corporation (exploration of oil and gas) (2014-present). |
|
Principal Occupation During at Least the Past 5 Years: Member of the Council on Foreign Relations (1996-present); Member of the National Committee on U.S.-China Relations (1999-present); member of the Board of Trustees of the Economic Club of New York (2013-present); member of the Board of Trustees of the Foreign Policy Association (2005-present) and member of various other boards of trustees and advisory boards; andformerly, Executive Vice President of the Federal Reserve Bank of New York and Head of its Emerging Markets and Internal Affairs Group and Member of Management Committee (1995-2014); and Visiting Fellow at the Council on Foreign Relations (2014). |
| | | | |
Mary C. Choksi (1950) One Franklin Parkway San Mateo, CA 94403-1906 | | Trustee | | Since 2014 | | 136 | | Avis Budget Group Inc. (car rental) (2007-present), Omnicom Group Inc. (advertising and marketing communications services) (2011-present) and White Mountains Insurance Group, Ltd. (holding company) (2017-present). |
|
Principal Occupation During at Least the Past 5 Years: Director of various companies; andformerly, Founder and Senior Advisor, Strategic Investment Group (investment management group) (2015-2017); Founding Partner and Senior Managing Director, Strategic Investment Group (1987–2015); Founding Partner and Managing Director, Emerging Markets Management LLC (investment management firm) (1987-2011); and Loan Officer/Senior Loan Officer/Senior Pension Investment Officer, World Bank Group (international financial institution) (1977-1987). |
| | | | |
Edith E. Holiday (1952) One Franklin Parkway San Mateo, CA 94403-1906 | | Lead Independent Trustee | | Trustee since 1998 Lead Independent Trustee since March 2019 | | 136 | | Hess Corporation (exploration of oil and gas) (1993-present), Canadian National Railway (railroad) (2001-present), White Mountains Insurance Group, Ltd. (holding company) (2004-present), Santander Consumer USA Holdings, Inc. (consumer finance) (2016-present), RTI International Metals, Inc. (manufacture and distribution of titanium) (1999-2015) and H.J. Heinz Company (processed foods and allied products) (1994-2013). |
|
Principal Occupation During at Least the Past 5 Years: Director or Trustee of various companies and trusts; andformerly, Assistant to the President of the United States and Secretary of the Cabinet (1990-1993); General Counsel to the United States Treasury Department (1989-1990); and Counselor to the Secretary and Assistant Secretary for Public Affairs and Public Liaison–United States Treasury Department (1988-1989). |
| | | | |
J. Michael Luttig (1954) One Franklin Parkway San Mateo, CA 94403-1906 | | Trustee | | Since 2009 | | 136 | | Boeing Capital Corporation (aircraft financing) (2006-2013). |
|
Principal Occupation During at Least the Past 5 Years: Executive Vice President, General Counsel and member of the Executive Council, The Boeing Company (aerospace company) (2006-present); andformerly, Federal Appeals Court Judge, U.S. Court of Appeals for the Fourth Circuit (1991-2006). |
| | | | | | |
186 | | Annual Report | | | | franklintempleton.com |
FRANKLINTAX-FREE TRUST
Independent Board Members(continued)
| | | | | | | | |
Name, Year of Birth and Address | | Position | | Length of
Time Served | | Number of Portfolios in
Fund Complex Overseen
by Board Member* | | Other Directorships Held During at Least the Past 5 Years |
| | | | |
Larry D. Thompson (1945) One Franklin Parkway San Mateo, CA 94403-1906 | | Trustee | | Since 2007 | | 136 | | The Southern Company (energy company) (2014-present; previously 2010-2012), Graham Holdings Company (education and media organization) (2011-present) and Cbeyond, Inc. (business communications provider) (2010-2012). |
|
Principal Occupation During at Least the Past 5 Years: Director of various companies; Counsel, Finch McCranie, LLP (law firm) (2015-present); Independent Compliance Monitor and Auditor, Volkswagen AG (manufacturer of automobiles and commercial vehicles) (2017 – present); John A. Sibley Professor of Corporate and Business Law, University of Georgia School of Law (2015-present; previously 2011-2012); andformerly, Executive Vice President - Government Affairs, General Counsel and Corporate Secretary, PepsiCo, Inc. (consumer products) (2012-2014); Senior Vice President - Government Affairs, General Counsel and Secretary, PepsiCo, Inc. (2004-2011); Senior Fellow of The Brookings Institution (2003-2004); Visiting Professor, University of Georgia School of Law (2004); and Deputy Attorney General, U.S. Department of Justice (2001-2003). |
Interested Board Members and Officers
| | | | | | | | |
Name, Year of Birth and Address | | Position | | Length of
Time Served | | Number of Portfolios in
Fund Complex Overseen
by Board Member* | | Other Directorships Held During at Least the Past 5 Years |
| | | | |
**Gregory E. Johnson (1961) One Franklin Parkway San Mateo, CA 94403-1906 | | Trustee | | Since 2007 | | 150 | | None |
|
Principal Occupation During at Least the Past 5 Years: Chairman of the Board, Member – Office of the Chairman, Director and Chief Executive Officer, Franklin Resources, Inc.; officer and/or director or trustee, as the case may be, of some of the other subsidiaries of Franklin Resources, Inc. and of 42 of the investment companies in Franklin Templeton; Vice Chairman, Investment Company Institute; andformerly, President, Franklin Resources, Inc. (1994-2015). |
| | | | |
**Rupert H. Johnson, Jr. (1940) One Franklin Parkway San Mateo, CA 94403-1906 | | Chairman of the Board and Trustee | | Since 2013 | | 136 | | None |
|
Principal Occupation During at Least the Past 5 Years: Vice Chairman, Member – Office of the Chairman and Director, Franklin Resources, Inc.; Director, Franklin Advisers, Inc.; and officer and/or director or trustee, as the case may be, of some of the other subsidiaries of Franklin Resources, Inc. and of 40 of the investment companies in Franklin Templeton. |
| | | | |
Sheila Amoroso (1959) One Franklin Parkway San Mateo, CA 94403-1906 | | Vice President | | Since 1999 | | Not Applicable | | Not Applicable |
|
Principal Occupation During at Least the Past 5 Years: Senior Vice President, Franklin Advisers, Inc.; and officer of seven of the investment companies in Franklin Templeton. |
| | | | |
Alison E. Baur (1964) One Franklin Parkway San Mateo, CA 94403-1906 | | Vice President | | Since 2012 | | Not Applicable | | Not Applicable |
|
Principal Occupation During at Least the Past 5 Years: Deputy General Counsel, Franklin Templeton; and officer of some of the other subsidiaries of Franklin Resources, Inc. and of 44 of the investment companies in Franklin Templeton. |
| | | | |
franklintempleton.com | | Annual Report | | 187 |
FRANKLIN TAX-FREE TRUST
Interested Board Members and Officers(continued)
| | | | | | | | |
Name, Year of Birth and Address | | Position | | Length of
Time Served | | Number of Portfolios in
Fund Complex Overseen
by Board Member* | | Other Directorships Held During at Least the Past 5 Years |
| | | | |
Sonal Desai, Ph.D. (1963) One Franklin Parkway San Mateo, CA 94403-1906 | | President and Chief Executive Officer – Investment Management | | Since December 2018 | | Not Applicable | | Not Applicable |
|
Principal Occupation During at Least the Past 5 Years: Director and Executive Vice President, Franklin Advisers, Inc.; Executive Vice President, Franklin Templeton Institutional, LLC; and officer of 18 of the investment companies in Franklin Templeton. |
| | | | |
Gaston Gardey (1967) One Franklin Parkway San Mateo, CA 94403-1906 | | Treasurer, Chief Financial Officer, and Chief Accounting Officer | | Since 2009 | | Not Applicable | | Not Applicable |
|
Principal Occupation During at Least the Past 5 Years: Treasurer, U.S. Fund Administration & Reporting and officer of 28 of the investment companies in Franklin Templeton. |
| | | | |
Aliya S. Gordon (1973) One Franklin Parkway San Mateo, CA 94403-1906 | | Vice President | | Since 2009 | | Not Applicable | | Not Applicable |
|
Principal Occupation During at Least the Past 5 Years: Senior Associate General Counsel and officer of 44 of the investment companies in Franklin Templeton. |
| | | | |
Steven J. Gray (1955) One Franklin Parkway San Mateo, CA 94403-1906 | | Vice President and Co- Secretary | | Vice President since 2009 and Co-Secratary since January 2019 | | Not Applicable | | Not Applicable |
|
Principal Occupation During at Least the Past 5 Years: Senior Associate General Counsel, Franklin Templeton; Vice President, Franklin Templeton Distributors, Inc. and FASA, LLC; and officer of 44 of the investment companies in Franklin Templeton. |
| | | | |
Matthew T. Hinkle (1971) One Franklin Parkway San Mateo, CA 94403-1906 | | Chief Executive Officer – Finance and Administration | | Since 2017 | | Not Applicable | | Not Applicable |
|
Principal Occupation During at Least the Past 5 Years: Senior Vice President, Franklin Templeton Services, LLC; officer of 44 of the investment companies in Franklin Templeton; andformerly,Vice President, Global Tax (2012-April 2017) and Treasurer/Assistant Treasurer, Franklin Templeton (2009-2017). |
| | | | |
Robert Lim (1948) One Franklin Parkway San Mateo, CA 94403-1906 | | Vice President - AML Compliance | | Since 2016 | | Not Applicable | | Not Applicable |
|
Principal Occupation During at Least the Past 5 Years: Vice President, Franklin Templeton Companies, LLC; Chief Compliance Officer, Franklin Templeton Distributors, Inc. and Franklin Templeton Investor Services, LLC; and officer of 44 of the investment companies in Franklin Templeton. |
| | | | |
Kimberly H. Novotny (1972) 300 S.E. 2nd Street Fort Lauderdale, FL 33301-1923 | | Vice President | | Since 2013 | | Not Applicable | | Not Applicable |
|
Principal Occupation During at Least the Past 5 Years: Associate General Counsel, Franklin Templeton; Vice President and Corporate Secretary, Fiduciary Trust International of the South; Vice President, Templeton Investment Counsel, LLC; Assistant Secretary, Franklin Resources, Inc.; and officer of 44 of the investment companies in Franklin Templeton. |
| | | | | | |
188 | | Annual Report | | | | franklintempleton.com |
FRANKLIN TAX-FREE TRUST
Interested Board Members and Officers(continued)
| | | | | | | | |
Name, Year of Birth and Address | | Position | | Length of
Time Served | | Number of Portfolios in
Fund Complex Overseen
by Board Member* | | Other Directorships Held During at Least the Past 5 Years |
| | | | |
Robert C. Rosselot (1960) 300 S.E. 2nd Street Fort Lauderdale, FL 33301-1923 | | Chief Compliance Officer | | Since 2013 | | Not Applicable | | Not Applicable |
|
Principal Occupation During at Least the Past 5 Years: Director, Global Compliance, Franklin Templeton; Vice President, Franklin Templeton Companies, LLC; officer of 44 of the investment companies in Franklin Templeton; andformerly, Senior Associate General Counsel, Franklin Templeton (2007-2013); and Secretary and Vice President, Templeton Group of Funds (2004-2013). |
| | | | |
Navid J. Tofigh (1972) One Franklin Parkway San Mateo, CA 94403-1906 | | Vice President | | Since 2015 | | Not Applicable | | Not Applicable |
|
Principal Occupation During at Least the Past 5 Years: Associate General Counsel and officer of 44 of the investment companies in Franklin Templeton. |
| | | | |
Craig S. Tyle (1960) One Franklin Parkway San Mateo, CA 94403-1906 | | Vice President | | Since 2005 | | Not Applicable | | Not Applicable |
|
Principal Occupation During at Least the Past 5 Years: General Counsel and Executive Vice President, Franklin Resources, Inc.; and officer of some of the other subsidiaries of Franklin Resources, Inc. and of 44 of the investment companies in Franklin Templeton. |
| | | | |
Thomas Walsh (1961) One Franklin Parkway San Mateo, CA 94403-1906 | | Vice President | | Since 1999 | | Not Applicable | | Not Applicable |
|
Principal Occupation During at Least the Past 5 Years: Senior Vice President, Franklin Advisers, Inc.; and officer of seven of the investment companies in Franklin Templeton. |
| | | | |
Lori A. Weber (1964) 300 S.E. 2nd Street Fort Lauderdale, FL 33301-1923 | | Vice President and Co- Secretary | | Vice President since 2011 and Co-Secratary since January 2019 | | Not Applicable | | Not Applicable |
|
Principal Occupation During at Least the Past 5 Years: Senior Associate General Counsel, Franklin Templeton; Assistant Secretary, Franklin Resources, Inc.; Vice President and Secretary, Templeton Investment Counsel, LLC; and officer of 44 of the investment companies in Franklin Templeton. |
*We base the number of portfolios on each separate series of the U.S. registered investment companies within the Franklin Templeton fund complex. These portfolios have a common investment manager or affiliated investment managers.
**Gregory E. Johnson is considered to be an interested person of the Fund under the federal securities laws due to his position as an officer and director of Franklin
Resources, Inc. (Resources), which is the parent company of the Fund’s investment manager and distributor. Rupert H. Johnson, Jr. is considered to be an interested person of the Fund under the federal securities laws due to his position as an officer and director and major shareholder of Resources.
Note 1: Rupert H. Johnson, Jr. is the uncle of Gregory E. Johnson.
Note 2: Effective March 12, 2019, John B. Wilson ceased to be a trustee of the Trust.
Note 3: Officer information is current as of the date of this report. It is possible that after this date, information about officers may change.
The Rules adopted by the Securities and Exchange Commission require the Fund to disclose whether the Fund’s Audit Committee includes at least one member who is an Audit Committee Financial Expert within the meaning of such Act and Rules. To the extent that the Fund’s Audit Committee does not include at least one Audit Committee Financial Expert, the SEC Rules require an explanation as to why it does not. The Fund’s Audit Committee currently does not have an Audit Committee Financial Expert following the departure from the Board of Trustees of the Fund’s previous Audit Committee Financial Expert. The Audit Committee believes that, as a result of the collective experience of the remaining Audit Committee members with respect to mutual funds, investments, financial statements and accounting principles, there is adequate oversight over the Fund’s financial operations and financial statements. It is anticipated that the Fund’s Board of Trustees will designate a new Audit Committee Financial Expert in the near future.
The Statement of Additional Information (SAI) includes additional information about the board members and is available, without charge, upon request. Shareholders may call (800) DIALBEN/342-5236 to request the SAI.
| | | | | | | | |
franklintempleton.com | | | | | | Annual Report | | 189 |
FRANKLINTAX-FREE TRUST
Shareholder Information
Board Approval of Investment Management Agreements
FRANKLINTAX-FREE TRUST
Franklin AlabamaTax-Free Income Fund
Franklin FloridaTax-Free Income Fund
Franklin GeorgiaTax-Free Income Fund
Franklin KentuckyTax-Free Income Fund
Franklin LouisianaTax-Free Income Fund
Franklin MarylandTax-Free Income Fund
Franklin MissouriTax-Free Income Fund
Franklin North CarolinaTax-Free Income Fund
Franklin VirginiaTax-Free Income Fund
(each a Fund)
At anin-person meeting held on February 25, 2019 (Meeting), the Board of Trustees (Board) of FranklinTax-Free Trust (Trust), including a majority of the trustees who are not “interested persons” as defined in the Investment Company Act of 1940 (Independent Trustees), reviewed and approved the continuance of the investment management agreement between Franklin Advisers, Inc. (Manager) and the Trust, on behalf of each Fund (each a Management Agreement) for an additionalone-year period. The Independent Trustees received advice from and met separately with Independent Trustee counsel in considering whether to approve the continuation of each Management Agreement. Although the Management Agreements for the Funds were considered at the same Board meeting, the Board considered the information provided to it about the Funds together and with respect to each Fund separately as the Board deemed appropriate.
In considering the continuation of each Management Agreement, the Board reviewed and considered information provided by the Manager at the Meeting and throughout the year at meetings of the Board and its committees. The Board also reviewed and considered information provided in response to a detailed set of requests for information submitted to the Manager by Independent Trustee counsel on behalf of the Independent Trustees in connection with the annual contract renewal process. In addition, prior to the Meeting, the Independent Trustees held a telephonic contract renewal meeting at which the Independent Trustees conferred amongst themselves and Independent Trustee counsel about contract renewal matters. The Board reviewed and considered all of the factors it deemed relevant in approving the continuance of each Management Agreement, including, but not limited to: (i) the nature, extent and quality of the services provided by the Manager; (ii) the investment performance of each Fund; (iii)
the costs of the services provided and profits realized by the Manager and its affiliates from the relationship with each Fund; (iv) the extent to which economies of scale are realized as each Fund grows; and (v) whether fee levels reflect these economies of scale for the benefit of Fund investors.
In approving the continuance of each Management Agreement, the Board, including a majority of the Independent Trustees, determined that the terms of the Management Agreement are fair and reasonable and that the continuance of such Management Agreement is in the interests of the applicable Fund and its shareholders. While attention was given to all information furnished, the following discusses some primary factors relevant to the Board’s determination.
Nature, Extent and Quality of Services
The Board reviewed and considered information regarding the nature, extent and quality of investment management services provided by the Manager and its affiliates to the Funds and their shareholders. This information included, among other things, the qualifications, background and experience of the senior management and investment personnel of the Manager; the structure of investment personnel compensation; oversight of third-party service providers; investment performance reports and related financial information for each Fund; reports on expenses, shareholder services, marketing support payments made to financial intermediaries and third party servicing arrangements; legal and compliance matters; risk controls; pricing and other services provided by the Manager and its affiliates; and management fees charged by the Manager and its affiliates to US funds and other accounts, including management’s explanation of differences among accounts where relevant. The Board also reviewed and considered an annual report on payments made by Franklin Templeton Investments (FTI) or the Funds to financial intermediaries, as well as a memorandum relating to third-party servicing arrangements in response to a guidance update in 2016 from the US Securities and Exchange Commission (SEC) relating to mutual fund distribution andsub-accounting fees. The Board noted management’s continuing efforts and expenditures in establishing effective business continuity plans and developing strategies to address areas of heightened concern in the mutual fund industry, such as cybersecurity and liquidity risk management. The Board also recognized management’s commitment to facilitating Board oversight of liquidity through the designation of a liquidity/risk administrator and the development of reports that highlight the amount of illiquid securities for each Fund.
| | | | | | |
190 | | Annual Report | | | | franklintempleton.com |
FRANKLINTAX-FREE TRUST
SHAREHOLDER INFORMATION
The Board also reviewed and considered the benefits provided to Fund shareholders of investing in a fund that is part of the Franklin Templeton family of funds. The Board noted the financial position of Franklin Resources, Inc. (FRI), the Manager’s parent, and its commitment to the mutual fund business as evidenced by its continued introduction of new funds, reassessment of the fund offerings in response to the market environment and project initiatives and capital investments relating to the services provided to the Funds by the FTI organization.
Following consideration of such information, the Board was satisfied with the nature, extent and quality of services provided by the Manager and its affiliates to the Funds and their shareholders.
Fund Performance
The Board reviewed and considered the performance results of each Fund over various time periods ended December 31, 2018. The Board considered the performance returns for each Fund in comparison to the performance returns of mutual funds deemed comparable to the Fund included in a universe (Performance Universe) selected by Broadridge Financial Solutions, Inc. (Broadridge), an independent provider of investment company data. The Board received a description of the methodology used by Broadridge to select the mutual funds included in a Performance Universe. The Board also reviewed and considered Fund performance reports provided and discussions that occurred with portfolio managers at Board meetings throughout the year. A summary of each Fund’s performance results is below.
Franklin AlabamaTax-Free Income Fund- The Performance Universe for the Fund included the Fund and all retail and institutional “other states” municipal debt funds. The Board noted that the Fund’s annualized income return for theone-, three-, five- and10-year periods was above the median of its Performance Universe. The Board also noted that the Fund’s annualized total return for theone-year period was below the median of its Performance Universe, but for the three-,five-and10-year periods was above the median of its Performance Universe. Given the Fund’s income-oriented investment objective, the Board concluded that the Fund’s performance was satisfactory.
Franklin GeorgiaTax-Free Income Fund- The Performance Universe for the Fund included the Fund and all retail and institutional “other states” municipal debt funds. The Board noted that the Fund’s annualized income return for theone-, three-, five- and10-year periods was above the median of its
Performance Universe. The Board also noted that the Fund’s annualized total return for theone-, three- and five-year periods was below the median of its Performance Universe, but for the
10-year period was above the median of its Performance Universe. Given the Fund’s income-oriented investment objective, the Board concluded that the Fund’s performance was satisfactory.
Franklin LouisianaTax-Free Income Fund and Franklin MarylandTax-Free Income Fund- The Performance Universe for the Franklin LouisianaTax-Free Income Fund included the Fund and all retail and institutional “other states” municipal debt funds. The Performance Universe for the Franklin MarylandTax-Free Income Fund included the Fund and all retail and institutional Maryland municipal debt funds. The Board noted that the Funds’ annualized income returns and annualized total returns for theone-, three-, five- and10-year periods were above the medians of their respective Performance Universes. The Board concluded that the Funds’ performance was satisfactory.
Franklin KentuckyTax-Free Income Fund- The Performance Universe for the Fund included the Fund and all retail and institutional “other states” municipal debt funds. The Board noted that the Fund’s annualized income return for theone-, three-, five- and10-year periods was above the median of its Performance Universe. The Board also noted that the Fund’s annualized total return for theone-, three- andten-year periods was above the median of its Performance Universe, but for the five-year period was equal to the median of its Performance Universe. The Board concluded that the Fund’s performance was satisfactory.
Franklin FloridaTax-Free Income Fund- The Performance Universe for the Fund included the Fund and all retail and institutional “other states” municipal debt funds. The Board noted that the Fund’s annualized income return for theone-, three-, five- and10-year periods was above the median of its Performance Universe. The Board also noted that the Fund’s annualized total return for the10-year period was below the median of its Performance Universe, but for theone-,three-and five-year periods was above the median of its Performance Universe. Given the Fund’s income-oriented investment objective, the Board concluded that the Fund’s performance was satisfactory.
Franklin MissouriTax-Free Income Fund- The Performance Universe for the Fund included the Fund and all retail and institutional “other states” municipal debt funds. The Board noted that the Fund’s annualized income return for theone-,
| | | | | | | | |
franklintempleton.com | | | | | | Annual Report | | 191 |
FRANKLINTAX-FREE TRUST
SHAREHOLDER INFORMATION
three-, five- and10-year periods was above the median of its Performance Universe. The Board also noted that the Fund’s annualized total return for the five- and10-year periods was below the median of its Performance Universe, but for theone-and three-year periods was above the median of its Performance Universe. Given the Fund’s income-oriented investment objective, the Board concluded that the Fund’s performance was satisfactory.
Franklin North CarolinaTax-Free Income Fund and Franklin VirginiaTax-Free Income Fund- The Performance Universe for the Franklin North CarolinaTax-Free Income Fund included the Fund and all retail and institutional “other states” municipal debt funds. The Performance Universe for the Franklin VirginiaTax-Free Income Fund included the Fund and all retail and institutional Virginia municipal debt funds. The Board noted that the Funds’ annualized income returns for theone-, three-, five- and10-year periods were above the medians of their respective Performance Universes. The Board also noted that the Funds’ annualized total returns for the three-, five- and10-year periods were below the medians of their respective Performance Universes, but for theone-year period were above the medians of their respective Performance Universes. Given the Funds’ income-oriented investment objectives, the Board concluded that the Funds’ performance was satisfactory.
Comparative Fees and Expenses
The Board reviewed and considered information regarding each Fund’s actual total expense ratio and its various components, including, as applicable, management fees; transfer agent expenses; underlying fund expenses; Rule12b-1 andnon-Rule12b-1 service fees; and othernon-management fees. The Board also noted the quarterly and annual reports it receives on all marketing support payments made by FTI to financial intermediaries. The Board considered the actual total expense ratio and, separately, the contractual management fee rate, without the effect of fee waivers, if any (Management Rate) of each Fund in comparison to the median expense ratio and median Management Rate, respectively, of other mutual funds deemed comparable to and with a similar expense structure to the Fund selected by Broadridge (Expense Group). Broadridge fee and expense data is based upon information taken from each fund’s most recent annual report, which reflects historical asset levels that may be quite different from those currently existing, particularly in a period of market volatility. While recognizing such inherent limitation and the fact that expense ratios and Management Rates generally increase as assets decline and decrease as assets grow, the
Board believed the independent analysis conducted by Broadridge to be an appropriate measure of comparative fees and expenses. The Broadridge Management Rate includes administrative charges, and the actual total expense ratio, for comparative consistency, was shown for Class A1 for each Fund and for Class A shares for each other fund. The Board received a description of the methodology used by Broadridge to select the mutual funds included in an Expense Group.
Franklin MissouriTax-Free Income Fund and Franklin North CarolinaTax-Free Income Fund- The Expense Group for each Fund included the Fund and nine other “other states” municipal debt funds. The Board noted that the Management Rates and actual total expense ratios for these Funds were below the medians of their respective Expense Groups. The Board concluded that the Management Rates charged to these Funds are reasonable.
Franklin AlabamaTax-Free Income Fund, Franklin FloridaTax-Free Income Fund, Franklin GeorgiaTax-Free Income Fund and Franklin LouisianaTax-Free Income Fund - The Expense Group for each Fund included the Fund and nine other “other states” municipal debt funds. The Board noted that the Management Rates for the Funds were equal to the medians of their respective Expense Groups, but their actual total expense ratios were below the medians of their respective Expense Groups. The Board concluded that the Management Rates charged to the Funds are reasonable.
Franklin MarylandTax-Free Income Fund and Franklin VirginiaTax-Free Income Fund- The Expense Group for Franklin MarylandTax-Free Income Fund included the Fund and four other Maryland municipal debt funds. The Expense Group for the Franklin VirginiaTax-Free Income Fund included the Fund and five other Virginia municipal debt funds. The Board noted that the Management Rates for the Funds were above the medians of their respective Expense Groups, but their actual total expense ratios were below the medians of their respective Expense Groups. The Board concluded that the Management Rates charged to the Funds are reasonable. In doing so, the Board noted that the Funds’ Management Rates were less than one basis point higher than the medians of their respective Expense Groups.
Franklin KentuckyTax-Free Income Fund- The Expense Group for this Fund included the Fund and nine other “other states” municipal debt funds. The Board noted that the Management Rate and actual total expense ratio for the Fund were slightly above the medians of its Expense Group. The
| | | | | | |
192 | | Annual Report | | | | franklintempleton.com |
FRANKLINTAX-FREE TRUST
SHAREHOLDER INFORMATION
Board concluded that the Management Rate charged to the Fund is reasonable.
Profitability
The Board reviewed and considered information regarding the profits realized by the Manager and its affiliates in connection with the operation of each Fund. In this respect, the Board considered the Fund profitability analysis provided by the Manager that addresses the overall profitability of FTI’s US fund business, as well as its profits in providing investment management and other services to each of the individual funds during the12-month period ended September 30, 2018, being the most recent fiscalyear-end for FRI. The Board noted that although management continually makes refinements to its methodologies used in calculating profitability in response to organizational and product-related changes, the overall methodology has remained consistent with that used in the Funds’ profitability report presentations from prior years. Additionally, PricewaterhouseCoopers LLP, auditor to FRI and certain Franklin Templeton funds, has been engaged by the Manager to periodically review and assess the allocation methodologies to be used solely by the Funds’ Board with respect to the profitability analysis.
The Board noted management’s belief that costs incurred in establishing the infrastructure necessary for the type of mutual fund operations conducted by the Manager and its affiliates may not be fully reflected in the expenses allocated to each Fund in determining its profitability, as well as the fact that the level of profits, to a certain extent, reflected operational cost savings and efficiencies initiated by management. The Board also noted management’s expenditures in improving shareholder services provided to the Funds, as well as the need to implement systems and meet additional regulatory and compliance requirements resulting from recent SEC and other regulatory requirements.
The Board also considered the extent to which the Manager and its affiliates might derive ancillary benefits from fund operations, including revenues generated from transfer agent services, potential benefits resulting from personnel and systems enhancements necessitated by fund growth, as well as increased leverage with service providers and counterparties. Based upon its consideration of all these factors, the Board concluded that the level of profits realized by the Manager and its affiliates from providing services to each Fund was not excessive in view of the nature, extent and quality of services provided to each Fund.
Economies of Scale
The Board reviewed and considered the extent to which the Manager may realize economies of scale, if any, as each Fund grows larger and whether each Fund’s management fee structure reflects any economies of scale for the benefit of shareholders. With respect to possible economies of scale, the Board noted the existence of management fee breakpoints, which operate generally to share any economies of scale with a Fund’s shareholders by reducing the Fund’s effective management fees as the Fund grows in size. The Board considered the Manager’s view that any analyses of potential economies of scale in managing a particular fund are inherently limited in light of the joint and common costs and investments the Manager incurs across the Franklin Templeton family of funds as a whole. The Board concluded that to the extent economies of scale may be realized by the Manager and its affiliates, each Fund’s management fee structure provided a sharing of benefits with the Fund and its shareholders as the Fund grows.
Conclusion
Based on its review, consideration and evaluation of all factors it believed relevant, including the above-described factors and conclusions, the Board unanimously approved the continuation of each Management Agreement for an additionalone-year period.
Proxy Voting Policies and Procedures
The Trust’s investment manager has established Proxy Voting Policies and Procedures (Policies) that the Trust uses to determine how to vote proxies relating to portfolio securities. Shareholders may view the Trust’s complete Policies online at franklintempleton.com. Alternatively, shareholders may request copies of the Policies free of charge by calling the Proxy Group collect at (954)527-7678 or by sending a written request to: Franklin Templeton Companies, LLC, 300 S.E. 2nd Street, Fort Lauderdale, FL 33301, Attention: Proxy Group. Copies of the Trust’s proxy voting records are also made available online at franklintempleton.com and posted on the U.S. Securities and Exchange Commission’s website at sec.gov and reflect the most recent12-month period ended June 30.
Quarterly Statement of Investments
The Trust files a complete statement of investments with the U.S. Securities and Exchange Commission for the first and third quarters for each fiscal year as an exhibit to its report on FormN-PORT. Shareholders may view the filed FormN-PORT by visiting the Commission’s website at sec.gov. The
| | | | |
franklintempleton.com | | Annual Report | | 193 |
FRANKLINTAX-FREE TRUST
SHAREHOLDER INFORMATION
filed form may also be viewed and copied at the Commission’s Public Reference Room in Washington, DC. Information regarding the operations of the Public Reference Room may be obtained by calling(800) SEC-0330.
Householding of Reports and Prospectuses
You will receive each Fund’s financial reports every six months as well as an annual updated summary prospectus (prospectus available upon request). To reduce Fund expenses, we try to identify related shareholders in a household and send only one copy of the financial reports and summary prospectus. This process, called “householding,” will continue indefinitely unless you instruct us otherwise. If you prefer not to have these documents householded, please call us at (800)632-2301. At any time you may view current prospectuses/summary prospectuses and financial reports on our website. If you choose, you may receive these documents through electronic delivery.
| | | | | | |
194 | | Annual Report | | | | franklintempleton.com |
This page intentionally left blank.
This page intentionally left blank.
| | |
 | | Annual Report and Shareholder Letter |
| | FranklinTax-Free Trust |
| | Investment Manager |
| | Franklin Advisers, Inc. |
| | Distributor |
| | Franklin Templeton Distributors, Inc. |
| | (800) DIAL BEN® /342-5236 franklintempleton.com |
| | �� Shareholder Services |
| | (800)632-2301 |
Authorized for distribution only when accompanied or preceded by a summary prospectus and/or prospectus. Investors should carefully consider a fund’s investment goals, risks, charges and expenses before investing. A prospectus contains this and other information; please read it carefully before investing.
To help ensure we provide you with quality service, all calls to and from our service areas are monitored and/or recorded.
| | |
© 2019 Franklin Templeton Investments. All rights reserved. | | TF2 A 04/19 |
(a) The Registrant has adopted a code of ethics that applies to its principal executive officers and principal financial and accounting officer.
(c) N/A
(d) N/A
(f) Pursuant to Item 12(a) (1), the Registrant is attaching as an exhibit a copy of its code of ethics that applies to its principal executive officers and principal financial and accounting officer.
| Item 3. | Audit Committee Financial Expert. |
(a) (1) The Registrant has an audit committee financial expert serving on its audit committee.
(2) The Rules adopted by the Securities and Exchange Commission require the Fund to disclose whether the Fund’s Audit Committee includes at least one member who is an Audit Committee Financial Expert within the meaning of such Act and Rules. To the extent that the Fund’s Audit Committee does not include at least one Audit Committee Financial Expert, the SEC Rules require an explanation as to why it does not. The Fund’s Audit Committee currently does not have an Audit Committee Financial Expert following the departure from the Board of Trustees of the Fund’s previous Audit Committee Financial Expert. The Audit Committee believes that, as a result of the collective experience of the remaining Audit Committee members with respect to mutual funds, investments, financial statements and accounting principles, there is adequate oversight over the Fund’s financial operations and financial statements. It is anticipated that the Fund’s Board of Trustees will designate a new Audit Committee Financial Expert in the near future.
Item 4. Principal Accountant Fees and Services.
(a) Audit Fees
The aggregate fees paid to the principal accountant for professional services rendered by the principal accountant for the audit of the registrant’s annual financial statements or for services that are normally provided by the principal accountant in connection with statutory and regulatory filings or engagements were $808,276 for the fiscal year ended February 28, 2019 and $838,592 for the fiscal year ended February 28, 2018.
(b) Audit-Related Fees
There were no fees paid to the principal accountant for assurance and related services rendered by the principal accountant to the registrant that are reasonably related to the performance of the audit of the registrant’s financial statements and are not reported under paragraph (a) of Item 4.
There were no fees paid to the principal accountant for assurance and related services rendered by the principal accountant to the registrant’s investment adviser and any entity controlling, controlled
3
by or under common control with the investment adviser that provides ongoing services to the registrant that are reasonably related to the performance of the audit of their financial statements.
(c) Tax Fees
There were no fees paid to the principal accountant for professional services rendered by the principal accountant to the registrant for tax compliance, tax advice and tax planning.
The aggregate fees paid to the principal accountant for professional services rendered by the principal accountant to the registrant’s investment adviser and any entity controlling, controlled by or under common control with the investment adviser that provides ongoing services to the registrant for tax compliance, tax advice and tax planning were $15,000 for the fiscal year ended February 28, 2019 and $0 for the fiscal year ended February 28, 2018. The services for which these fees were paid included professional fees in connection with an Indonesia withholding tax refund claim and tax consulting services related to the operating agreement and term sheet for the launch of a new fund.
(d) All Other Fees
There were no fees paid to the principal accountant for products and services rendered by the principal accountant to the registrant not reported in paragraphs (a)-(c) of Item 4 were $9,865 for the fiscal year ended February 28, 2019 and $0 for the fiscal year ended February 28, 2018. The services for which these fees were paid included review of materials provided to the fund Board in connection with the investment management contract renewal process.
The aggregate fees paid to the principal accountant for products and services rendered by the principal accountant to the registrant’s investment adviser and any entity controlling, controlled by or under common control with the investment adviser that provides ongoing services to the registrant not reported in paragraphs (a)-(c) of Item 4 were $16,500 for the fiscal year ended February 28, 2019 and $14,000 for the fiscal year ended February 28, 2018. The services for which these fees were paid included the issuance of an Auditor’s Certificate for South Korean regulatory shareholders disclosures, assets under management certification, and benchmarking services in connection with the ICI TA Survey.
(e) (1) The registrant’s audit committee is directly responsible for approving the services to be provided by the auditors, including:
(i)pre-approval of all audit and audit related services;
(ii)pre-approval of allnon-audit related services to be provided to the Fund by the auditors;
(iii)pre-approval of allnon-audit related services to be provided to the registrant by the auditors to the registrant’s investment adviser or to any entity that controls, is controlled by or is under common control with the registrant’s investment adviser and that provides ongoing services to the registrant where thenon-audit services relate directly to the operations or financial reporting of the registrant; and
4
(iv) establishment by the audit committee, if deemed necessary or appropriate, as an alternative to committeepre-approval of services to be provided by the auditors, as required by paragraphs (ii) and (iii) above, of policies and procedures to permit such services to bepre-approved by other means, such as through establishment of guidelines or by action of a designated member or members of the committee; provided the policies and procedures are detailed as to the particular service and the committee is informed of each service and such policies and procedures do not include delegation of audit committee responsibilities, as contemplated under the Securities Exchange Act of 1934, to management; subject, in the case of (ii) through (iv), to any waivers, exceptions or exemptions that may be available under applicable law or rules.
(e) (2) None of the services provided to the registrant described in paragraphs (b)-(d) of Item 4 were approved by the audit committee pursuant to paragraph (c)(7)(i)(C) of Rule2-01 of regulationS-X.
(f) No disclosures are required by this Item 4(f).
(g) The aggregatenon-audit fees paid to the principal accountant for services rendered by the principal accountant to the registrant and the registrant’s investment adviser and any entity controlling, controlled by or under common control with the investment adviser that provides ongoing services to the registrant were $41,365 for the fiscal year ended February 28, 2019 and $14,000 for the fiscal year ended February 28, 2018.
(h) The registrant’s audit committee of the board has considered whether the provision ofnon-audit services that were rendered to the registrant’s investment adviser (not including anysub-adviser whose role is primarily portfolio management and is subcontracted with or overseen by another investment adviser), and any entity controlling, controlled by, or under common control with the investment adviser that provides ongoing services to the registrant that were notpre-approved pursuant to paragraph (c)(7)(ii) of Rule2-01 of RegulationS-X is compatible with maintaining the principal accountant’s independence.
| Item 5. | Audit Committee of Listed Registrants. N/A |
| Item 6. | Schedule of Investments. N/A |
| Item 7. | Disclosure of Proxy Voting Policies and Procedures forClosed-End Management Investment Companies. N/A |
| Item 8. | Portfolio Managers ofClosed-End Management Investment Companies. N/A |
| Item 9. | Purchases of Equity Securities byClosed-End Management Investment Company and Affiliated Purchasers. N/A |
5
| Item 10. | Submission of Matters to a Vote of Security Holders. |
There have been no changes to the procedures by which shareholders may recommend nominees to the Registrant’s Board of Trustees that would require disclosure herein.
| Item 11. | Controls and Procedures. |
(a) Evaluation of Disclosure Controls and Procedures. The Registrant maintains disclosure controls and procedures that are designed to provide reasonable assurance that information required to be disclosed in the Registrant’s filings under the Securities Exchange Act of 1934, as amended, and the Investment Company Act of 1940 is recorded, processed, summarized and reported within the periods specified in the rules and forms of the Securities and Exchange Commission. Such information is accumulated and communicated to the Registrant’s management, including its principal executive officer and principal financial officer, as appropriate, to allow timely decisions regarding required disclosure. The Registrant’s management, including the principal executive officer and the principal financial officer, recognizes that any set of controls and procedures, no matter how well designed and operated, can provide only reasonable assurance of achieving the desired control objectives.
Within 90 days prior to the filing date of this Shareholder Report onForm N-CSR, the Registrant had carried out an evaluation, under the supervision and with the participation of the Registrant’s management, including the Registrant’s principal executive officer and the Registrant’s principal financial officer, of the effectiveness of the design and operation of the Registrant’s disclosure controls and procedures. Based on such evaluation, the Registrant’s principal executive officer and principal financial officer concluded that the Registrant’s disclosure controls and procedures are effective.
(b) Changes in Internal Controls. There have been no changes in the Registrant’s internal control over financial reporting that occurred during the period covered by this report that has materially affected, or is reasonably likely to materially affect the internal control over financial reporting.
| Item 12. | Disclosure of Securities Lending Activities forClosed-End Management Investment Company. N/A |
(a) (1) Code of Ethics
(a) (2) Certifications pursuant to Section 302 of the Sarbanes-Oxley Act of 2002 of Matthew T. Hinkle, Chief Executive Officer - Finance and Administration, and Gaston Gardey, Chief Financial Officer and Chief Accounting Officer
6
(b) Certifications pursuant to Section 906 of the Sarbanes-Oxley Act of 2002 of Matthew T. Hinkle, Chief Executive Officer – Finance and Administration, and Gaston Gardey, Chief Financial Officer and Chief Accounting Officer
7
SIGNATURES
Pursuant to the requirements of the Securities Exchange Act of 1934 and the Investment Company Act of 1940, the registrant has duly caused this report to be signed on its behalf by the undersigned, thereunto duly authorized.
| | |
| FRANKLINTAX-FREE TRUST |
| |
| By | | /s/ MATTHEW T. HINKLE |
| | Matthew T. Hinkle |
| | Chief Executive Officer – Finance and Administration |
Date April 26, 2019
Pursuant to the requirements of the Securities Exchange Act of 1934 and the Investment Company Act of 1940, this report has been signed below by the following persons on behalf of the registrant and in the capacities and on the dates indicated.
| | |
| By | | /s/ MATTHEW T. HINKLE |
| | Matthew T. Hinkle |
| | Chief Executive Officer – Finance and Administration |
|
| Date April 26, 2019 |
| | |
| By | | /s/ GASTON GARDEY |
| | Gaston Gardey |
| | Chief Financial Officer and Chief Accounting Officer |
|
| Date April 26, 2019 |
8