UNITED STATES
SECURITIES AND EXCHANGE COMMISSION
Washington, D.C. 20549
FORM N-CSR
CERTIFIED SHAREHOLDER REPORT OF REGISTERED
MANAGEMENT INVESTMENT COMPANIES
Investment Company Act File Number: 811-04163
| T. Rowe Price Tax-Free High Yield Fund, Inc. |
|
| (Exact name of registrant as specified in charter) |
| |
| 100 East Pratt Street, Baltimore, MD 21202 |
|
| (Address of principal executive offices) |
| |
| David Oestreicher |
| 100 East Pratt Street, Baltimore, MD 21202 |
|
| (Name and address of agent for service) |
Registrant’s telephone number, including area code: (410) 345-2000
Date of fiscal year end: February 28
Date of reporting period: August 31, 2017
Item 1. Report to Shareholders
| Tax-Free High Yield Fund | August 31, 2017 |

The views and opinions in this report were current as of August 31, 2017. They are not guarantees of performance or investment results and should not be taken as investment advice. Investment decisions reflect a variety of factors, and the managers reserve the right to change their views about individual stocks, sectors, and the markets at any time. As a result, the views expressed should not be relied upon as a forecast of the fund’s future investment intent. The report is certified under the Sarbanes-Oxley Act, which requires mutual funds and other public companies to affirm that, to the best of their knowledge, the information in their financial reports is fairly and accurately stated in all material respects.
REPORTS ON THE WEB
Sign up for our Email Program, and you can begin to receive updated fund reports and prospectuses online rather than through the mail. Log in to your account at troweprice.com for more information.
Manager’s Letter
Fellow Shareholders
Tax-free municipal bonds produced solid gains and outperformed taxable investment-grade bonds in the six-month period ended August 31, 2017. The Bloomberg Barclays Municipal Bond Index returned 3.79% versus 2.74% for the Bloomberg Barclays U.S. Aggregate Bond Index. Muni bonds were supported by steady demand and limited new issuance for most of the period. Longer-term municipals outperformed shorter maturities as the yield curve flattened, and lower-rated bonds outpaced higher-quality securities as investors continued to seek out higher yields. The longer-term relative performance of the T. Rowe Price Tax-Free Funds remains favorable.
ECONOMY AND INTEREST RATES
The U.S. economy grew at a strong 3.0% annualized rate in the second quarter of 2017, according to the Commerce Department’s most recent estimate—a pickup from the 1.2% gross domestic product growth rate in the first quarter. The labor market has been healthy, with the national unemployment rate falling to 4.4% in August. Inflation data were very weak in the early months of our reporting period, but pricing pressures more recently have showed signs of normalizing.
While Hurricane Harvey is having a significant impact on the highly populated region around Houston, Texas, that is a hub for energy-related industries, we believe the national economic effects of the storm will be short-lived. With specific regard to the municipal bond market, we believe that while Harvey may add some operating costs to impacted issuers over the short term, between insurance, federal aid, and state support, local governments will receive enough aid, and that should allow them to recover without any long-term significant effects.
The Federal Reserve raised short-term interest rates in March and in June, lifting the federal funds target rate to the 1.00% to 1.25% range. The Fed has now raised rates four times since late 2015, and central bank officials expect to raise rates once more in 2017. The Fed is also poised to begin unwinding its $4.5 trillion balance sheet, a legacy of its massive purchases of Treasury bonds and mortgage-backed securities in the aftermath of the 2008 financial crisis.
Both the Treasury and municipal yield curves flattened in the first half of our fiscal year, with short-term municipal yields moving incrementally higher. Short-term Treasury rates increased to a greater degree, as they were more sensitive to the Fed’s rate hikes. Intermediate- and long-term yields decreased, with the move lower being more pronounced in the muni market. At the end of August, high-quality 30-year muni yields were slightly lower than the 30-year U.S. government bond yield. Nonetheless, municipals still offer relative value for many fixed income investors on an after-tax basis.

As an illustration of their relative attractiveness, on August 31, 2017, the 2.70% yield offered by a 30-year tax-free general obligation (GO) bond rated AAA was about 99% of the 2.73% pretax yield offered by a 30-year Treasury bond. Including the 3.8% net investment income tax that took effect in 2013 as part of the Affordable Care Act (ACA), the top marginal federal tax rate currently stands at 43.4%. An investor in this tax bracket would need to invest in a taxable bond yielding 4.77% to receive the same after-tax income as that generated by the municipal bond. (To calculate a municipal bond’s taxable-equivalent yield, divide the yield by the quantity of 1.00 minus your federal tax bracket expressed as a decimal—in this case, 1.00 – 0.434, or 0.566.)
MUNICIPAL MARKET NEWS
Total year-to-date municipal bond issuance through the end of August was about $256 billion, according to The Bond Buyer, which was 15% lower than the same period in 2016. A sharp drop in refunding issuance drove the decline in supply. Fund flows have been mostly positive during the last six months, which, combined with lower supply, created a strong technical backdrop for muni bonds. Generally, fundamentals for municipal issuers remain solid, and most issuers in the $3.8 trillion municipal bond market have been fiscally responsible. State and local governments in general have been cautious about adding to indebtedness since the 2008 financial crisis, and a strengthening economy has helped tax revenues rebound. Over 60% of the market, as measured by the Bloomberg Barclays Municipal Bond Index, is AAA or AA rated.
Although the market is overwhelmingly high quality, many states and municipalities are grappling with underfunded pensions and other post-employment benefit (OPEB) obligations. New reporting rules from the Governmental Accounting Standards Board are bringing greater transparency to state and local governments’ pension funding gaps, long-term risks that investors often overlooked in the past. We believe the market will increasingly price in higher pension risks as the magnitude of unfunded liabilities becomes more conspicuous.
In credit news, the deteriorating fiscal situation in Illinois drew increased scrutiny as political dysfunction led to yet another budget impasse. Moody’s Investors Service and S&P Global Ratings downgraded Illinois’ general obligation debt to the lowest investment-grade level after the state’s regular legislative session ended on May 31 without a budget. The Democrat-controlled state legislature returned for a special session at the end of June and finally passed a budget despite the objections of Republican Governor Bruce Rauner, who had vetoed the deal because of its significant tax increases and lack of long-term reforms.
In May, Puerto Rico’s financial oversight board filed petitions with the U.S. District Court seeking help in restructuring approximately $51 billion in debt issued directly by the island’s central government as well as the commonwealth’s COFINA debt, which is backed by sales tax revenue. In early July, PREPA, Puerto Rico’s electric utility, filed for bankruptcy after the oversight board rejected the restructuring agreement that had been reached between the power authority and its creditors. The court filings could lead to the largest restructuring of municipal debt in U.S. history. While credit-challenged muni issuers such as Illinois and Puerto Rico made headlines during our reporting period, the negative news seemed to have little impact on the broader tax-exempt bond market.
Sector performance across the muni market was broadly positive, as revenue bonds narrowly outperformed GO debt. We continue to favor bonds backed by a dedicated revenue stream over GOs, as we consider revenue bonds to be largely insulated from the pension funding concerns facing state and local governments. Across our municipal platform, we have an overweight to the higher-yielding health care and transportation revenue-backed sectors, which benefited our portfolios as those sectors outpaced the broad index return. Among investment-grade revenue bonds, all subsectors produced positive returns, with hospital and leasing revenue bonds performing well, while resource recovery bonds lagged. High yield tobacco debt gained more than 7% and was the strongest-performing sector in the muni market.
PORTFOLIO STRATEGY
TAX-EXEMPT MONEY FUND
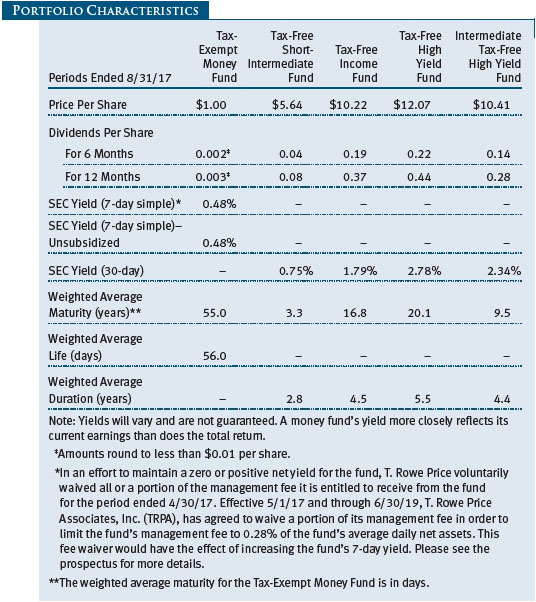
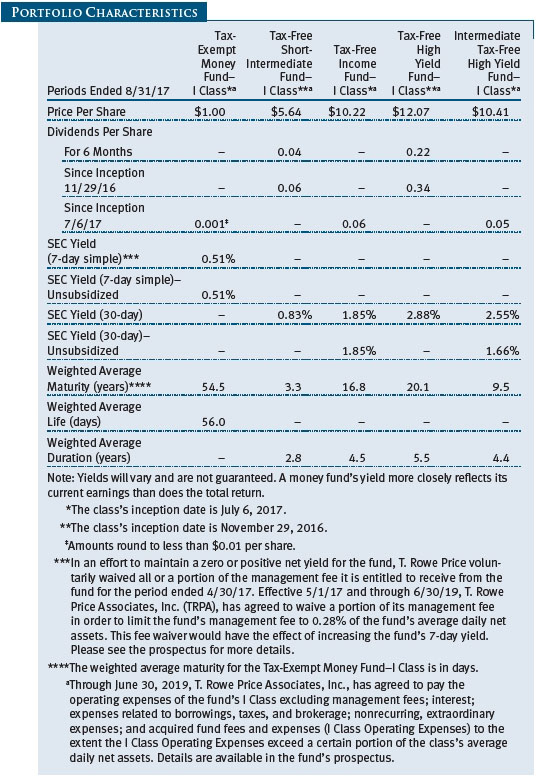
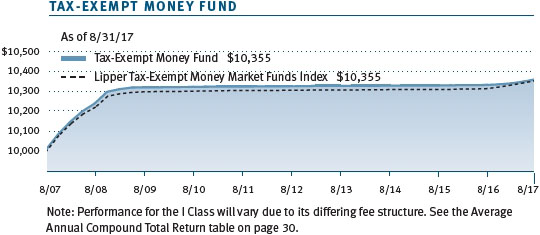
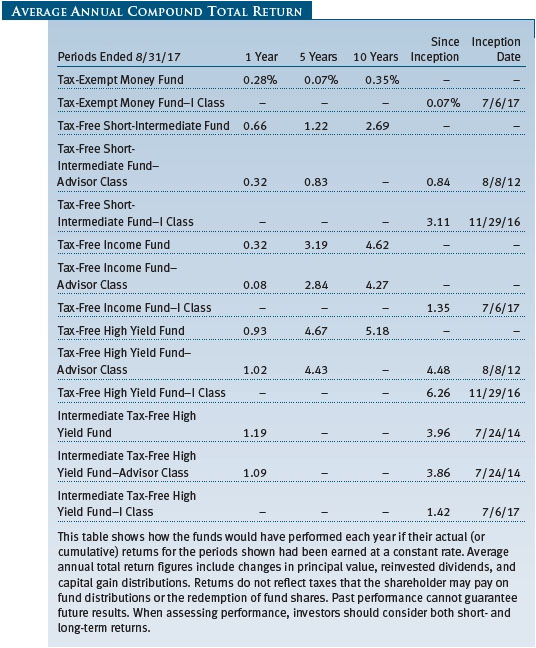
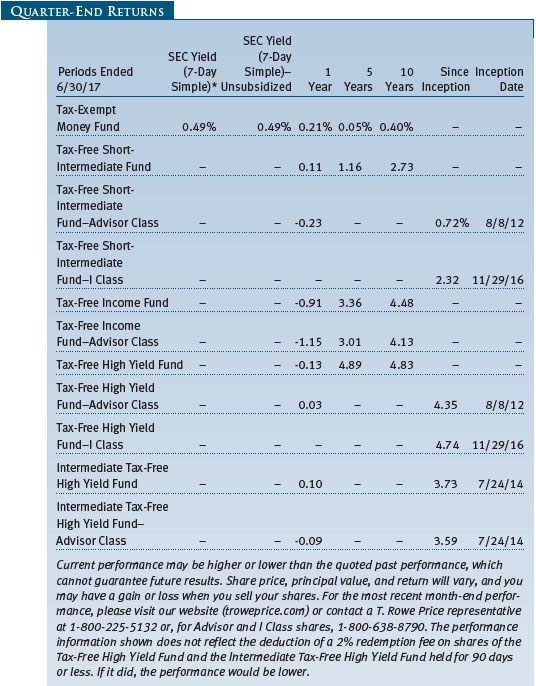
The fund returned 0.20% during the six months ended August 31, 2017, compared with 0.23% for the Lipper Tax-Exempt Money Market Funds Index. (Performance is also shown for the I Class, which has a different fee structure).
Early optimism about the possibility of the Trump administration bringing about fiscal stimulus through infrastructure spending and tax reform at both the corporate and individual levels faded as 2017 progressed. As that optimism faded, expectations for the Fed to systematically move short-term rates higher also faded. With inflation remaining subdued and hurricanes near the end of the reporting period likely to introduce at least some distortions in the upcoming economic data, there appeared to be more reasons for the central bank to delay the next rate increase. After the end of the reporting period, the Fed announced at its September policy meeting that it would begin to shrink its balance sheet later in the year, which could raise longer-term interest rates.
Still, the overall levels of short-term municipal rates moved higher after the Federal Open Market Committee raised interest rates by 25 basis points in both March and June. But the impact on the municipal money market from these rate increases was somewhat muted, due to the continued uncertainty about the frequency and timing of future rate increases, as well as nontraditional buyers’ continued interest in short-term municipal paper. As interest rates have moved higher, variable rate demand notes, in particular, have remained attractive to these nontraditional investors, including taxable money funds, as a result of their relatively attractive yields and liquidity. However, this effect seemed to be fading at the end of the reporting period.
Seven-day yields averaged about 0.81% for the reporting period. On the longer-term end of the money market maturity spectrum, certain institutional investors seeking higher-yielding alternatives to cash have been active buyers of debt with maturities of six to 12 months. While yields on one-year maturities moved higher to 0.91% at the end of August, increased demand from these nontraditional buyers capped the rise in yields. This also may in part be explained by tax advantages reasserting themselves after the long period of near-zero rates—investors are again seeing the value of tax-exempt income as short-term rates move higher.
We focused on building positions in the short-maturity area of municipal money market securities, avoiding what we deemed to be elevated valuations in longer maturities. The portfolio’s commercial paper exposure moved higher over the six-month period, while bond and note positions moved lower. We believe that as the market and its technical influences adjust, a more positively sloping yield curve (where longer-term securities provide a larger yield advantage relative to shorter-maturity bills) will offer a better entry point into longer-maturity positions.
As always, credit quality continues to play a significant part in asset selection for the fund. Currently, we have higher exposures in sectors such as hospitals and education as well as in GO debt. Some prominent positions in the portfolio include Cleveland Clinic Health System, University of Missouri, and Massachusetts revenue anticipation bonds. We remain committed to managing a highly liquid, diversified portfolio focused on liquidity and stability of principal, which we deem to be of the utmost importance to our valued shareholders. (Please refer to the fund’s portfolio of investments for a complete list of holdings and the amount each represents in the portfolio.)
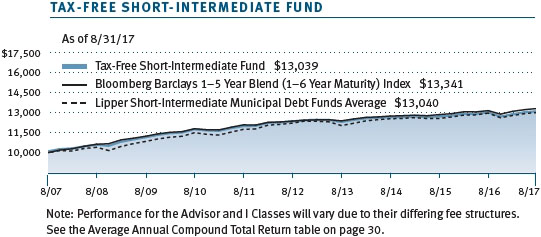
TAX-FREE SHORT-INTERMEDIATE FUND
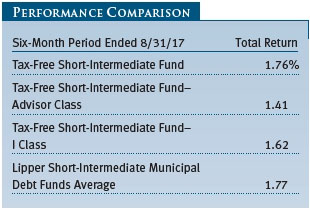
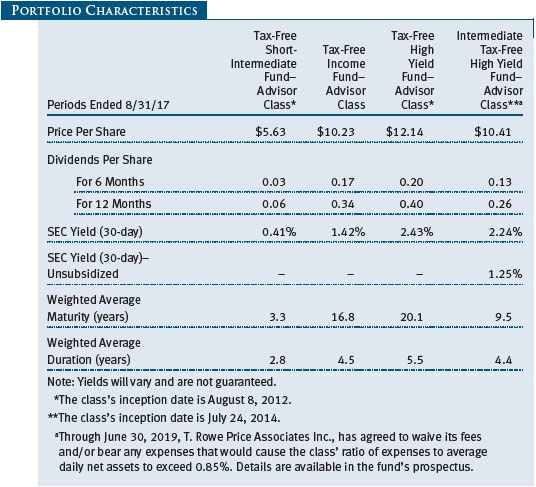
The fund returned 1.76% during the six-month reporting period versus 1.77% for the Lipper Short-Intermediate Municipal Debt Funds Average, which measures the performance of competing funds. (Performance is also shown in the table for the Advisor and I Class shares, which have different fee structures.) The fund’s net asset value per share was $5.64 at the end of August, up from $5.58 six months earlier. Dividends per share contributed $0.04 to the fund’s total return during the six-month period.
The fund’s interest rate risk was in line with its peer group and decreased modestly over the last six months, with a duration of 2.8 years at the end of the reporting period. However, this duration was longer than the duration of the passive benchmark, the Bloomberg Barclays 1–5 Year Blend (1–6 Year Maturity) Index, which contributed to relative performance as the yield curve flattened. As for yield curve positioning, most of our new purchases were designed to reduce the portfolio’s underweight to bonds maturing in three to seven years. We believe that we are well positioned for a rising rate environment, as 39% of the fund matures within two years, allowing us to reinvest the proceeds at higher yields fairly quickly.
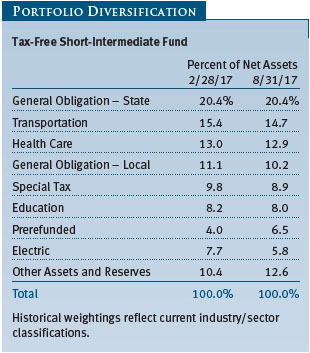
While our preference for revenue bonds over GOs remains intact as a result of our concerns about the considerable unfunded pension and OPEB liabilities that many state and local government issuers face, it has become challenging to find opportunities in revenue debt over the past couple of years in the short- to intermediate-term municipal market. As a result, we are overweight GOs from high-quality states that do not have large near-term pension funding problems, including Washington, Florida, and North Carolina. Notable purchases over the reporting period included GO bonds issued out of Texas and Maryland.
Within the revenue sector, health care and transportation remained the fund’s largest allocations and overweights relative to the index. The two sectors together accounted for about 28% of the fund’s net assets at the end of the reporting period. We continue to like the fundamental credit quality of both health care and transportation revenue bonds. However, credit spreads in these sectors have moved to very narrow levels. While we do not anticipate reducing our exposure to health care or transportation, we have not been finding much value given their tight spread levels.
The portfolio’s underweight to the prerefunded debt sector contributed to relative performance over the last six months, as the high-quality but lower-yielding sector slightly underperformed the broad municipal market. While we maintained our underweight to the sector, we have been incrementally adding some prerefunded bonds that offer attractive relative value when compared with AAA and AA rated GO bonds, including refunding issues by the MD Health and Higher Education Authority for Doctors Community Hospital and Johns Hopkins Health System and by the Kentucky Economic Development Finance Authority for Owensboro Health. (Please refer to the fund’s portfolio of investments for a complete list of holdings and the amount each represents in the portfolio.)
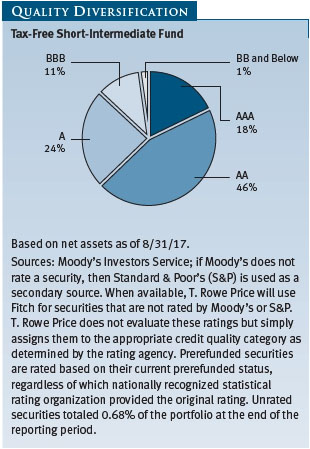
We continued to overweight lower-quality investment-grade bonds, particularly those in the A and BBB credit quality categories. We believe bonds in these quality tiers offer greater value than their higher-quality counterparts and are an area where our dedicated municipal credit research team can find opportunities to build incremental risk-adjusted yield into the portfolio. For example, we added Chicago Water, a revenue-backed bond rated Baa2 by Moody’s and A by S&P, over the period, as the uncertainty and volatility associated with Illinois-related issuers created an attractive relative value opportunity.
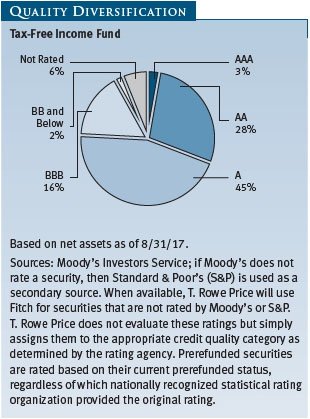
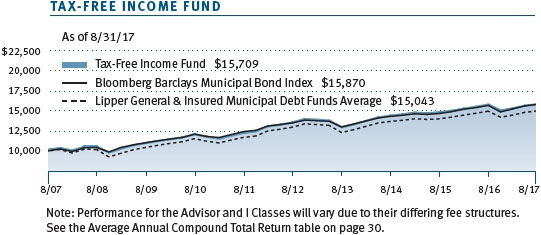
TAX-FREE INCOME FUND
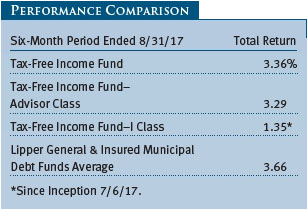
The fund returned 3.36% during the six-month period ended August 31, 2017, versus 3.66% for the Lipper peer group average, which measures the performance of competing funds. (Performance is also shown in the table for the Advisor and I Class shares, which have different fee structures.) The fund’s modest underperformance stemmed primarily from its more conservative interest rate positioning as yields fell over the reporting period. The fund’s net asset value per share was $10.22 at the end of August, up from $10.07 six months earlier. Dividends per share contributed $0.19 to the fund’s total return during the six-month period.
Following a tough fourth quarter of 2016 for tax-exempt bonds as rates rose sharply after November’s U.S. presidential election, the municipal bond market has strengthened year-to-date in 2017 and posted strong results over the last six months. Longer-term yields continued to fall from their post-election highs, and the municipal yield curve flattened over the period. We modestly increased our interest rate risk over the last six months as the fund’s duration ticked up to 4.5 years, though it remained shorter than the duration of the Bloomberg Barclays Municipal Bond Index and the Lipper peer group. This positioning detracted from relative performance as longer-term rates decreased over the period.
As for yield curve positioning, we believe that longer-maturity revenue bonds represent the best long-term value in the municipal market. However, we maintained a “barbell” structure, with an allocation to shorter-maturity bonds that offer more liquidity. This allocation, which includes high-quality prerefunded bonds, was a drag on relative performance over the period as longer-maturity bonds outperformed. We maintained our overweight in bonds with maturities of 15 years and longer, and our purchases over the reporting period were concentrated in securities with maturities of 20 years and longer. This extended the fund’s weighted average maturity to 16.8 years from 16.2 years at the beginning of the period. Overall, we are seeking the right balance between investing for higher yields and keeping interest rate risk in the low to moderate range.
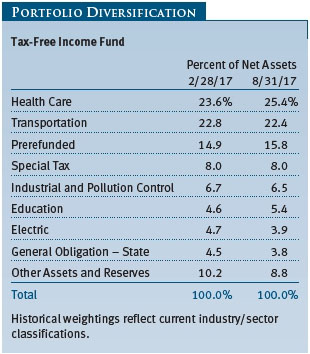
Our preference for revenue bonds over GOs remained intact as a result of our longer-term concern that many municipalities will face fiscal challenges related to unfunded pension and OPEB liabilities. Within the revenue sector, health care and transportation, which typically offer above-average yields, remained our largest allocations and together made up 48% of the fund’s net assets at the end of the reporting period. The hospital sector was the top-performing segment in the index as the likelihood of any meaningful health care reform diminished, and our overweight to the sector contributed to relative performance over the period. The fund’s allocation to health care increased by almost two percentage points over the reporting period, as we purchased bonds issued by MD Health and Higher Education Authority for Medstar Health and by MetroHealth System in Ohio. The level of sales in the fund was rather muted during the period as we sought to stay fully invested and keep cash at minimal levels. (Please refer to the fund’s portfolio of investments for a complete list of holdings and the amount each represents in the portfolio.)
Low rates have enabled issuers to refinance older, high-cost debt at more favorable terms, creating a larger allocation to prerefunded bonds in the portfolio. Our newly refunded holdings typically see a rise in valuation due to their upgrade in credit quality, which can help cushion losses in rising rate environments. Prerefunded bonds are the highest-quality bonds in our market and typically have maturities of five years or less. The fund’s exposure to this sector ticked up over the last six months and represented an overweight position. This provides the fund with a modest upgrade in liquidity in addition to cash. We believe this is appropriate within the recent volatile rate environment, and it leaves us well positioned to take advantage of rising interest rates.
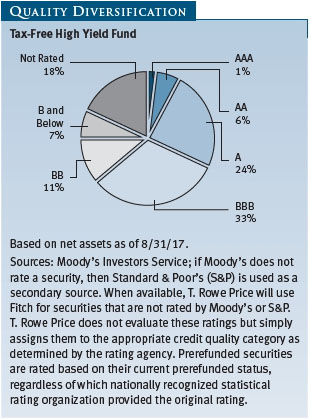
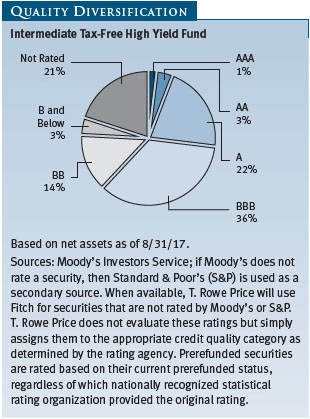
The fund’s credit quality profile was largely unchanged during the reporting period. We maintained an overweight to A and BBB rated debt, as we believe this is an area where our credit research team can find investment opportunities that offer incremental risk-adjusted yield. We kept modest exposure to below investment-grade and unrated bonds.
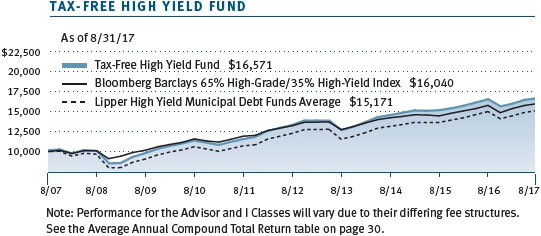
TAX-FREE HIGH YIELD FUND
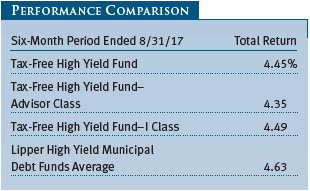
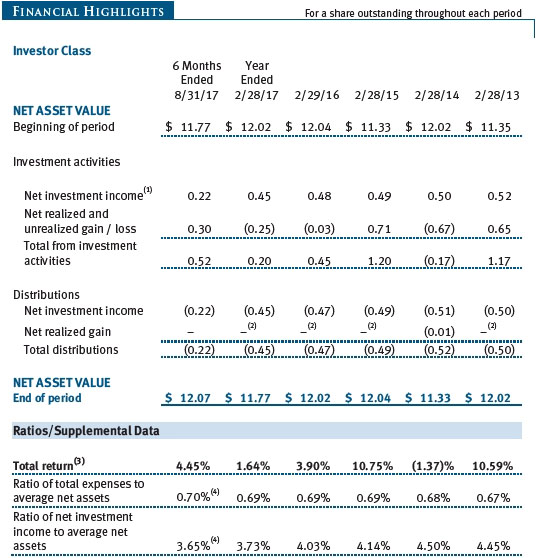
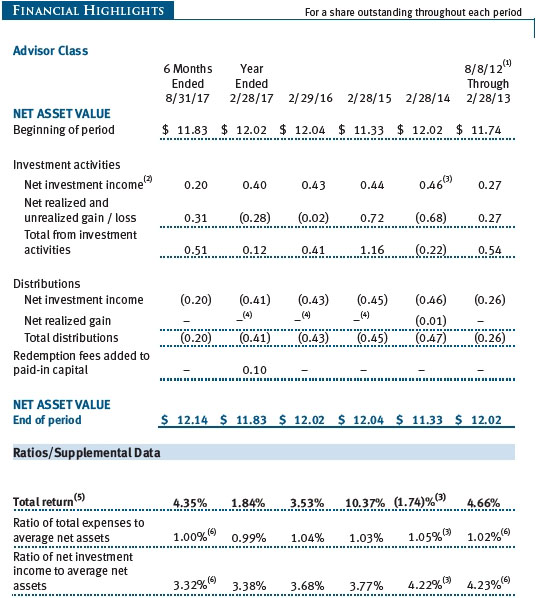
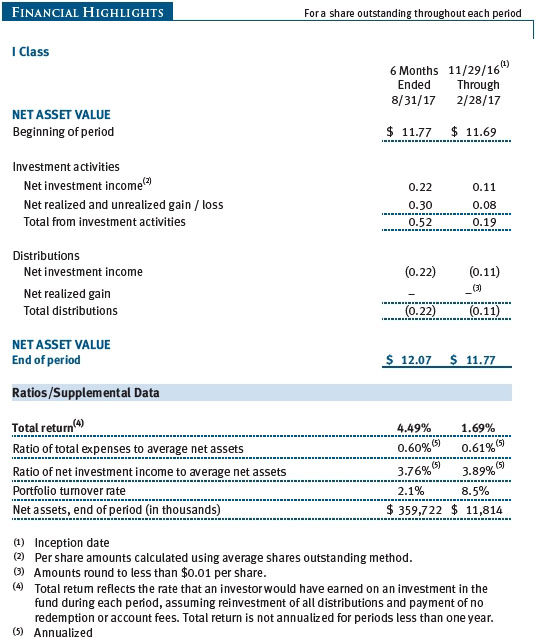
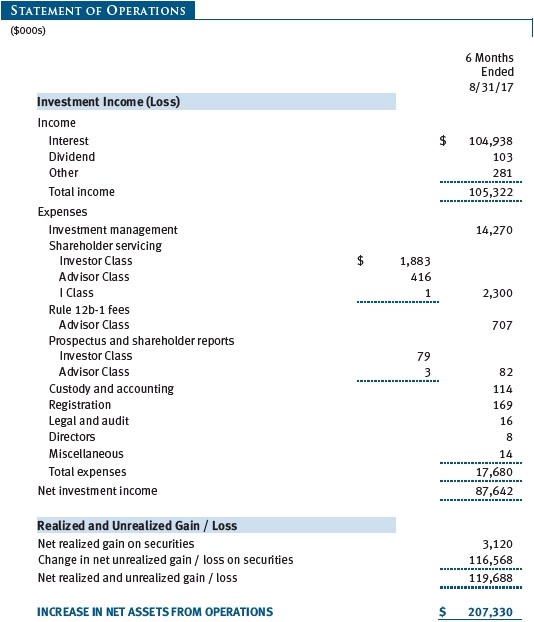
The Tax-Free High Yield Fund posted a strong return of 4.45% for the six-month period ended August 31, 2017, but modestly lagged the 4.63% average return of our Lipper peer group. (The returns for the Advisor and I Class shares, which have different fee structures, are also shown in the table.) The fund’s net asset value per share was $12.07 at the end of August, up from $11.77 six months earlier, and dividends per share contributed $0.22 to the fund’s total return during the six-month period.
The municipal market posted strong returns for the last six months as it recovered from the sharp interest rate spike following the November 2016 presidential election. Worries regarding reflationary fiscal policies, changes to the tax code, and a repeal or replacement of the ACA receded, and the muni market returned to its preelection themes of slow growth, low inflation, accommodative monetary policy, and manageable new issuance. Against this backdrop, our fund lagged its peers modestly as the most speculative parts of the high yield muni market outperformed those with stronger fundamentals.
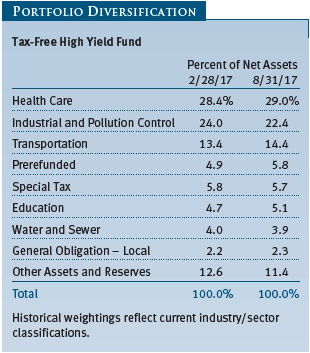
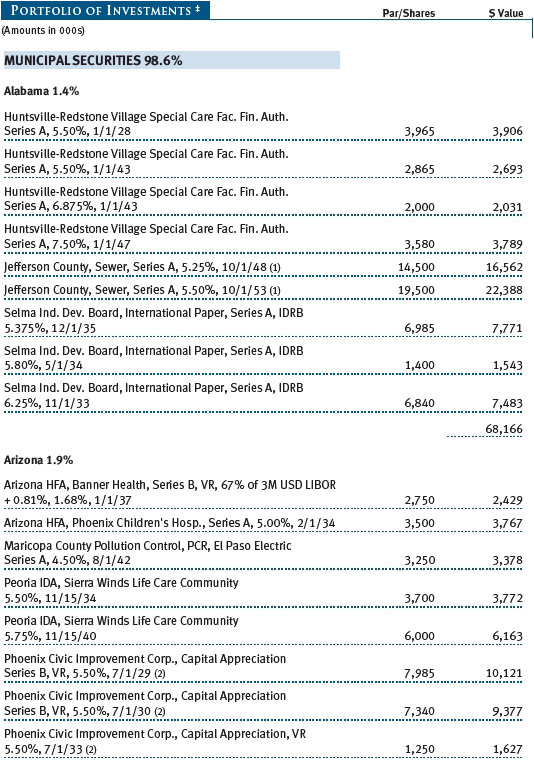
We maintained significant exposure to revenue bonds related to health care borrowers, including both not-for-profit hospitals and continuing care retirement communities (CCRCs). Each segment of the health care market performed strongly over the six-month period. Returns for hospitals bounced sharply as the likelihood of an unruly repeal of the ACA diminished. The differences in yield between bonds of different credit qualities in this sector decreased as market participants gained greater comfort that federal reimbursement streams to hospitals would not be interrupted or impaired. Our holdings in Presence Health (Illinois) rallied after the hospital signed a letter of intent to merge into highly rated Ascension Health. Similarly, our holdings in Care New England (Rhode Island) rallied on news that AA rated Partners Health planned to acquire the system. Our CCRC holdings also outpaced the general market. Higher-than-average yields, generally improving demographics, and solid individual credit metrics drove prices higher in the sector. Our holdings in Masonic Homes (Kentucky) and Brethren Village (Pennsylvania) posted strong results for the period. (Please refer to the fund’s portfolio of investments for a complete list of holdings and the amount each represents in the portfolio.)
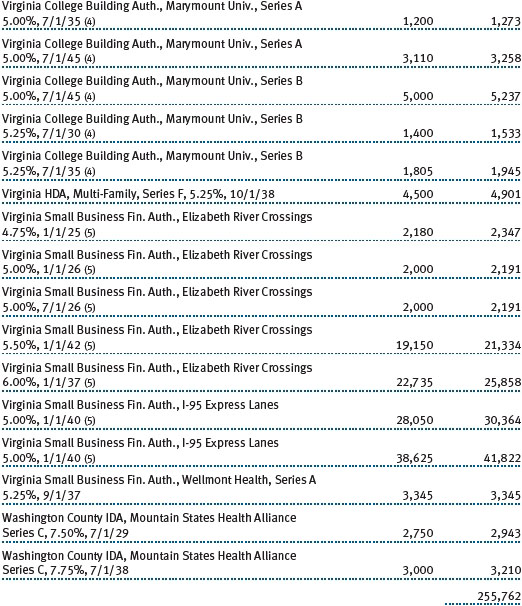
We added to our holdings in the transportation segment, and we remain positive on the long-term fundamentals for this area of the muni market. Essential transportation projects, such as toll roads and airports, often benefit from limited competition, strengthening their fiscal position and ability to service their debt. Several of our holdings related to the commonwealth of Virginia performed well during the period, including I-95 Express Lanes, Metropolitan DC Airports Authority, and Elizabeth River Crossings.
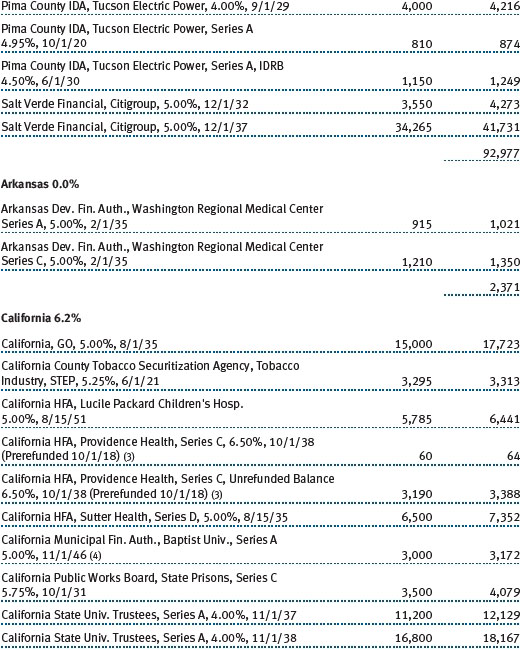
We maintained considerable exposure to corporate-backed industrial revenue and pollution control revenue bonds and continue to like the yield enhancement and diversification benefits these borrowers add to a tax-exempt bond portfolio. Our holdings in investment bank-related prepaid gas bonds performed well during the period, including Salt Verde, Arizona (Citigroup), and Public Authority for Colorado Energy (Bank of America Merrill Lynch). Credit spread compression in the banking sector and a favorable interest rate environment drove performance for these long-maturity positions that cannot be redeemed early by the issuer.
We remain cautious toward—and significantly underweight in—state and local GO debt. We believe the municipal market is in the early stages of repricing risk premiums in this sector to more appropriately account for the large unfunded liabilities many of these borrowers face in the coming years. The fund has generally benefited from this underweight. However, the portfolio’s positions in “fallen angel” GO bonds (debt that has been downgraded into the high yield category), including the State of Illinois and the City of Chicago, helped relative returns during the period.
Our underweight position in tobacco securitization bonds notably detracted from relative performance during the period. Persistently low interest rates, tight credit spreads, and some recent moderation in the decline in cigarette consumption provided supportive conditions for some of the riskiest tobacco securitization issuers to restructure, reissue, or reconfigure their tax-exempt debt. With this solid technical backdrop, many of the bonds with the weakest structures in the tobacco market rallied sharply. As a result, in addition to our general underweight position, our preference for the debt with the strongest of the securitized structures further hampered results. From a fundamental point of view, we remain cautious in this sector, believing that tobacco consumption will continue to decline faster than expectations over the longer term.
As long-term investors, we remain firm in our fundamental, research-driven process and are confident that it will lead to strong risk-adjusted results over time.
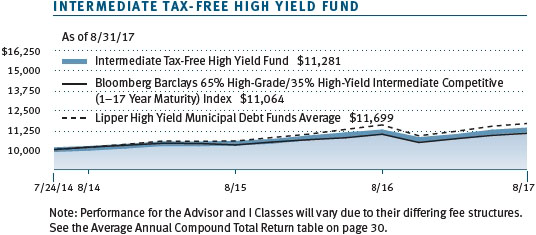
INTERMEDIATE TAX-FREE HIGH YIELD FUND
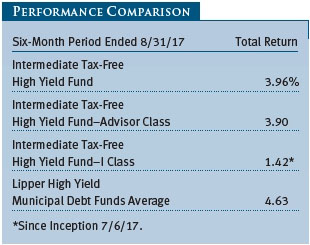
The Intermediate Tax-Free High Yield Fund generated a solid return of 3.96% for the six-month period ended August 31, 2017, but lagged the 4.63% return of our Lipper peer group average. (Performance is also shown in the table for the Advisor and I Class shares, which have different fee structures.) The fund’s net asset value per share was $10.41 at the end of August, up from $10.15 six months ago, and dividends per share contributed $0.14 to the fund’s total return during the six-month period.
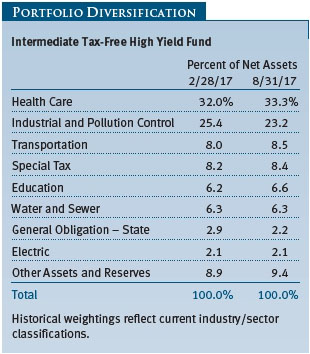
The municipal market posted strong returns for the last six months as it recovered from the sharp interest rate spike following the November 2016 presidential election. Worries regarding reflationary fiscal policies, changes to the tax code, and a repeal or replacement of the ACA receded, and the muni market returned to its preelection themes of slow growth, low inflation, accommodative monetary policy, and manageable new issuance. Against this backdrop, our fund, which focuses on intermediate-term securities, lagged its Lipper peer group, which includes funds that concentrate on longer-term securities. Our fund’s shorter duration weighed on relative returns as longer-term interest rates decreased. Also, lower-quality bonds outperformed, so our bias toward debt with stronger fundamentals hurt relative performance.
Our underweight position in tobacco securitization bonds also detracted from relative performance during the period. Persistently low interest rates, tight credit spreads, and some recent moderation in the decline in cigarette consumption provided supportive conditions for some of the riskiest tobacco securitization issuers to restructure, reissue, or reconfigure their tax-exempt debt. With this solid technical backdrop, many of the bonds with the weakest structures in the tobacco market rallied sharply. As a result, in addition to our general underweight position and focus on intermediate-maturity bonds, our preference for the debt with the strongest of the securitized structures further hampered results in the sector. From a fundamental point of view, we remain cautious in this sector, believing that tobacco consumption will continue to decline faster than expectations over the longer term.
We added exposure to health care borrowers, including both not-for-profit hospitals and continuing care retirement communities. Each segment of the health care market performed strongly over the six-month period. Prices of hospital debt rose as the likelihood of an ACA repeal diminished. The differences in yield between bonds of different credit qualities in this sector decreased as market participants gained greater comfort that federal reimbursement streams to hospitals would not be interrupted or impaired. Our holdings in Care New England (Rhode Island) rallied on news that AA rated Partners Health planned to acquire the system. The portfolio’s Owensboro Medical Center (Kentucky) bonds rallied sharply as the bonds were prerefunded. Our CCRC holdings also outpaced the general market. Higher-than-average yields, generally improving demographics, and solid individual credit metrics drove prices higher in the sector. Our holdings in Bayview Manor (Washington) and The Glebe (Virginia) posted strong results for the period. (Please refer to the fund’s portfolio of investments for a complete list of holdings and the amount each represents in the portfolio.)
We added to our holdings in the transportation segment, and we remain positive on the long-term fundamentals for this area of the muni market. Essential transportation projects, such as toll roads and airports, often benefit from limited competition, strengthening their fiscal position and ability to service their debt. Our holdings in bonds issued for Elizabeth River Crossings (Virginia) and North Texas Tollway performed well.
We maintained considerable exposure to corporate-backed industrial revenue and pollution control revenue bonds and continue to like the yield enhancement and diversification benefits these borrowers add to a tax-exempt bond portfolio. The portfolio owned bonds backed by procyclical companies U.S. Steel and U.S. Gypsum that rallied sharply in the reporting period.
We remain cautious on—and notably underweight in—state and local GO debt. We believe the municipal market is in the early stages of repricing risk premiums in this sector to more appropriately account for the large unfunded liabilities many of these borrowers face in the coming years. The fund has generally benefited from this underweight. However, the portfolio’s positions in “fallen angel” GO bonds (debt that has been downgraded into the high yield category), including the State of Illinois and New Jersey Economic Development Agency, helped relative returns during the period.
As long-term investors, we remain firm in our fundamental, research-driven process and are confident that it will lead to strong risk-adjusted results in the intermediate-maturity high yield market over time.
OUTLOOK
We believe that the municipal bond market remains a high-quality market that offers good opportunities for long-term investors seeking tax-free income. While the uncertainties surrounding tax reform and the increased chance of rising yields represent near-term headwinds for broad muni market performance, in our view, fundamentals are sound overall, and global economic uncertainties could spur demand for the asset class. As the Fed continues on the path to interest rate normalization, muni bond yields are likely to rise along with Treasury yields—although probably not to the same extent. While higher yields pressure bond prices, munis should be less susceptible to slowly rising rates than Treasuries given their attractive tax-equivalent yields and the steady demand for tax-exempt income. We expect any potential Fed rate increases to be gradual and modest and believe we could remain in a relatively low-rate environment for some time.
While we believe that many states deserve high credit ratings and will be able to continue servicing their debts, we have longer-term concerns about significant funding shortfalls for pensions and OPEB obligations in some jurisdictions. These funding gaps stem from investment losses during the 2008 financial crisis, insufficient plan contributions over time, and unrealistic return assumptions. Although few large plans are at risk of insolvency in the near term, the magnitude of unfunded liabilities is becoming more conspicuous in a few states.
Ultimately, we believe independent credit research is our greatest strength and will remain an asset for our investors as we navigate the current market environment. As always, we focus on finding attractively valued bonds issued by municipalities with good long-term fundamentals—an investment strategy that we believe will continue to serve our investors well.
Thank you for investing with T. Rowe Price.
Respectfully submitted,

Joseph K. Lynagh
Chairman of the Investment Advisory Committee
Tax-Exempt Money Fund

Charles B. Hill
Chairman of the Investment Advisory Committee
Tax-Free Short-Intermediate Fund

Konstantine B. Mallas
Chairman of the Investment Advisory Committee
Tax-Free Income Fund

James M. Murphy
Chairman of the Investment Advisory Committee
Tax-Free High Yield Fund and Intermediate Tax-Free High Yield Fund
September 22, 2017
The committee chairmen have day-to-day responsibility for managing the portfolios and work with committee members in developing and executing the funds’ investment programs.
RISKS OF INVESTING IN A RETAIL MONEY MARKET FUND
You could lose money by investing in the Fund. Although the Fund seeks to preserve the value of your investment at $1.00 per share, it cannot guarantee it will do so. The Fund may impose a fee upon the sale of your shares or may temporarily suspend your ability to sell shares if the Fund’s liquidity falls below required minimums because of market conditions or other factors. An investment in the Fund is not insured or guaranteed by the Federal Deposit Insurance Corporation or any other government agency. The Fund’s sponsor has no legal obligation to provide financial support to the Fund, and you should not expect that the sponsor will provide financial support to the Fund at any time.
RISKS OF FIXED INCOME INVESTING
Bonds are subject to interest rate risk (the decline in bond prices that usually accompanies a rise in interest rates) and credit risk (the chance that any fund holding could have its credit rating downgraded or that a bond issuer will default by failing to make timely payments of interest or principal), potentially reducing the fund’s income level and share price. High yield bonds could have greater price declines than funds that invest primarily in high-quality bonds. Municipalities issuing high yield bonds are not as strong financially as those with higher credit ratings, so the bonds are usually considered speculative investments. Some income may be subject to state and local taxes and the federal alternative minimum tax.
GLOSSARY
Basis point: One one-hundredth of one percentage point, or 0.01%.
Bloomberg Barclays Municipal Bond Index: An unmanaged index that tracks municipal debt instruments.
Bloomberg Barclays 1–5 Year Blend (1–6 Year Maturity) Index: A subindex of the Bloomberg Barclays Municipal Bond Index. It is a rules-based, market value-weighted index of short-term bonds engineered for the tax-exempt bond market.
Bloomberg Barclays 65% High-Grade/35% High-Yield Index: An index that tracks Bloomberg Barclays indexes of both investment-grade and below investment-grade municipal debt instruments.
Bloomberg Barclays U.S. Aggregate Bond Index: An unmanaged index that tracks domestic investment-grade bonds, including corporate, government, and mortgage-backed securities.
Credit spread: The additional yield that investors demand to hold a bond with credit risk compared with a Treasury security with a comparable maturity date.
Duration: A measure of a bond fund’s sensitivity to changes in interest rates. For example, a fund with a duration of five years would fall about 5% in price in response to a one-percentage-point rise in interest rates, and vice versa.
Federal funds rate: The interest rate charged on overnight loans of reserves by one financial institution to another in the United States. The Federal Reserve sets a target federal funds rate to affect the direction of interest rates.
General obligation (GO) debt: A government’s strongest pledge that obligates its full faith and credit, including, if necessary, its ability to raise taxes.
Gross domestic product: The total market value of all goods and services produced in a country in a given year.
Investment grade: High-quality bonds as measured by one of the major credit rating agencies. For example, S&P designates the bonds in its top four categories (AAA to BBB) as investment grade.
Lipper averages: The averages of available mutual fund performance returns for specified time periods in categories defined by Lipper Inc.
Lipper indexes: Fund benchmarks that consist of a small number (10 to 30) of the largest mutual funds in a particular category as tracked by Lipper Inc.
Other post-employment benefits (OPEB): Benefits paid to an employee after retirement, such as premiums for life and health insurance.
Prerefunded bond: A bond that originally may have been issued as a general obligation or revenue bond but that is now secured by an escrow fund consisting entirely of direct U.S. government obligations that are sufficient for paying the bondholders.
SEC yield (7-day simple): A method of calculating a money fund’s yield by annualizing the fund’s net investment income for the last seven days of each period divided by the fund’s net asset value at the end of the period. Yield will vary and is not guaranteed.
SEC yield (30-day): A method of calculating a fund’s yield that assumes all portfolio securities are held until maturity. Yield will vary and is not guaranteed.
Variable rate demand note (VRDN): Generally, a debt security that requires the issuer to redeem at the holder’s discretion on a specified date or dates prior to maturity. Upon redemption, the issuer pays par to the holder who loses future coupon payments that might otherwise be due. The VRDN might be especially attractive at times of rising rates, to protect against interest rate risk by redeeming at par value and reinvesting proceeds in a new bond.
Weighted average life: A measure of a fund’s credit quality risk. In general, the longer the average life, the greater the fund’s credit quality risk. The average life is the dollar-weighted average maturity of a portfolio’s individual securities without taking into account interest rate readjustment dates. Money funds must maintain a weighted average life of less than 120 days.
Weighted average maturity: A measure of a fund’s interest rate sensitivity. In general, the longer the average maturity, the greater the fund’s sensitivity to interest rate changes. The weighted average maturity may take into account the interest rate readjustment dates for certain securities. Money funds must maintain a weighted average maturity of less than 60 days.
Yield curve: A graphic depiction of the relationship between yields and maturity dates for a set of similar securities such as Treasuries or municipal securities. Securities with longer maturities usually a have higher yield. If short-term securities offer a higher yield, then the curve is said to be “inverted.” If short- and long-term bonds are offering equivalent yields, then the curve is said to be “flat.”
Note: Bloomberg Index Services Ltd. Copyright 2017, Bloomberg Index Services Ltd. Used with permission.
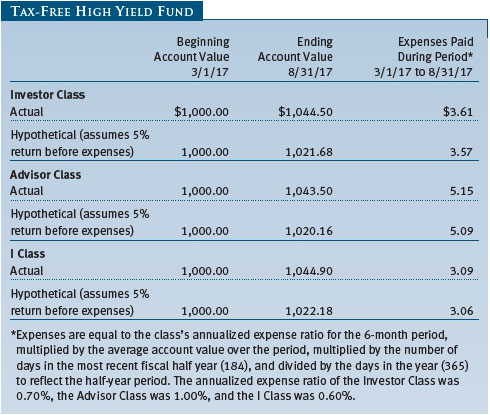
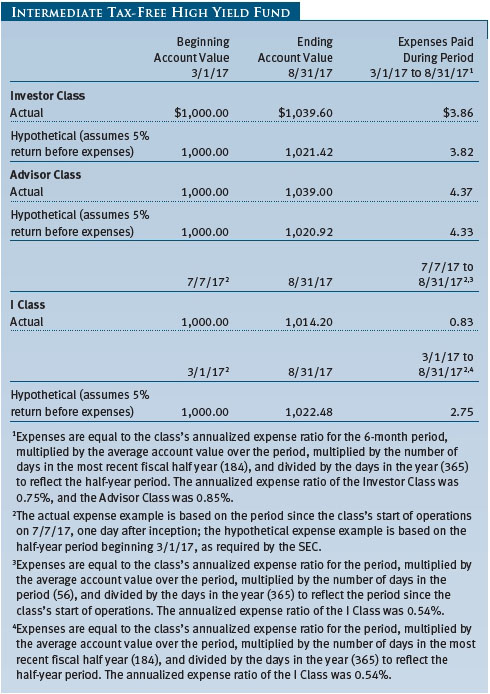
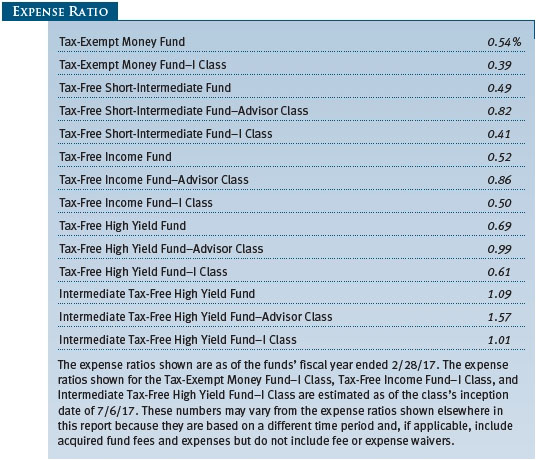
Performance and Expenses
This chart shows the value of a hypothetical $10,000 investment in the fund over the past 10 fiscal year periods or since inception (for funds lacking 10-year records). The result is compared with benchmarks, which may include a broad-based market index and a peer group average or index. Market indexes do not include expenses, which are deducted from fund returns as well as mutual fund averages and indexes.
As a mutual fund shareholder, you may incur two types of costs: (1) transaction costs, such as redemption fees or sales loads, and (2) ongoing costs, including management fees, distribution and service (12b-1) fees, and other fund expenses. The following example is intended to help you understand your ongoing costs (in dollars) of investing in the fund and to compare these costs with the ongoing costs of investing in other mutual funds. The example is based on an investment of $1,000 invested at the beginning of the most recent six-month period and held for the entire period.
Please note that the Intermediate Tax-Free High Yield Fund, Tax-Free High Yield Fund, Tax-Free Income Fund, and Tax-Free Short-Intermediate Fund and have three share classes: The original share class (Investor Class) charges no distribution and service (12b-1) fee, the Advisor Class shares are offered only through unaffiliated brokers and other financial intermediaries and charge a 0.25% 12b-1 fee, and the I Class shares are available to institutionally oriented clients and impose no 12b-1 or administrative fee payment. The Tax-Exempt Money Fund has two share classes: The original share class (Investor Class) charges no distribution and service (12b-1) fee, and the I Class shares are also available to institutionally oriented clients and impose no 12b-1 or administrative fee payment. Each share class is presented separately in the table.
Actual Expenses
The first line of the following table (Actual) provides information about actual account values and actual expenses. You may use the information on this line, together with your account balance, to estimate the expenses that you paid over the period. Simply divide your account value by $1,000 (for example, an $8,600 account value divided by $1,000 = 8.6), then multiply the result by the number on the first line under the heading “Expenses Paid During Period” to estimate the expenses you paid on your account during this period.
Hypothetical Example for Comparison Purposes
The information on the second line of the table (Hypothetical) is based on hypothetical account values and expenses derived from the fund’s actual expense ratio and an assumed 5% per year rate of return before expenses (not the fund’s actual return). You may compare the ongoing costs of investing in the fund with other funds by contrasting this 5% hypothetical example and the 5% hypothetical examples that appear in the shareholder reports of the other funds. The hypothetical account values and expenses may not be used to estimate the actual ending account balance or expenses you paid for the period.
Note: T. Rowe Price charges an annual account service fee of $20, generally for accounts with less than $10,000. The fee is waived for any investor whose T. Rowe Price mutual fund accounts total $50,000 or more; accounts electing to receive electronic delivery of account statements, transaction confirmations, prospectuses, and shareholder reports; or accounts of an investor who is a T. Rowe Price Personal Services or Enhanced Personal Services client (enrollment in these programs generally requires T. Rowe Price assets of at least $250,000). This fee is not included in the accompanying table. If you are subject to the fee, keep it in mind when you are estimating the ongoing expenses of investing in the fund and when comparing the expenses of this fund with other funds.
You should also be aware that the expenses shown in the table highlight only your ongoing costs and do not reflect any transaction costs, such as redemption fees or sales loads. Therefore, the second line of the table is useful in comparing ongoing costs only and will not help you determine the relative total costs of owning different funds. To the extent a fund charges transaction costs, however, the total cost of owning that fund is higher.
Unaudited
The accompanying notes are an integral part of these financial statements.
Unaudited
The accompanying notes are an integral part of these financial statements.
Unaudited
The accompanying notes are an integral part of these financial statements.
Unaudited


The accompanying notes are an integral part of these financial statements.
Unaudited

The accompanying notes are an integral part of these financial statements.
Unaudited
The accompanying notes are an integral part of these financial statements.
Unaudited

The accompanying notes are an integral part of these financial statements.
Unaudited
| Notes to Financial Statements |
T. Rowe Price Tax-Free High Yield Fund, Inc. (the fund), is registered under the Investment Company Act of 1940 (the 1940 Act) as a diversified, open-end management investment company. The fund seeks to provide a high level of income exempt from federal income taxes by investing primarily in long-term low- to upper-medium-grade municipal securities. The fund has three classes of shares: the Tax-Free High Yield Fund (Investor Class), the Tax-Free High Yield Fund–Advisor Class (Advisor Class), and the Tax-Free High Yield Fund–I Class (I Class). Advisor Class shares are sold only through unaffiliated brokers and other unaffiliated financial intermediaries. I Class shares generally are available only to investors meeting a $1,000,000 minimum investment or certain other criteria. The Advisor Class operates under a Board-approved Rule 12b-1 plan pursuant to which the class compensates financial intermediaries for distribution, shareholder servicing, and/or certain administrative services; the Investor and I Classes do not pay Rule 12b-1 fees. Each class has exclusive voting rights on matters related solely to that class; separate voting rights on matters that relate to all classes; and, in all other respects, the same rights and obligations as the other classes.
NOTE 1 - SIGNIFICANT ACCOUNTING POLICIES
Basis of Preparation The fund is an investment company and follows accounting and reporting guidance in the Financial Accounting Standards Board (FASB) Accounting Standards Codification Topic 946 (ASC 946). The accompanying financial statements were prepared in accordance with accounting principles generally accepted in the United States of America (GAAP), including, but not limited to, ASC 946. GAAP requires the use of estimates made by management. Management believes that estimates and valuations are appropriate; however, actual results may differ from those estimates, and the valuations reflected in the accompanying financial statements may differ from the value ultimately realized upon sale or maturity.
Investment Transactions, Investment Income, and Distributions Income and expenses are recorded on the accrual basis. Premiums and discounts on debt securities are amortized for financial reporting purposes. Dividend income is recorded on the ex-dividend date. Income tax-related interest and penalties, if incurred, would be recorded as income tax expense. Investment transactions are accounted for on the trade date. Realized gains and losses are reported on the identified cost basis. Income distributions are declared by each class daily and paid monthly. Distributions to shareholders are recorded on the ex-dividend date. A capital gain distribution may also be declared and paid by the fund annually.
Class Accounting Shareholder servicing, prospectus, and shareholder report expenses incurred by each class are charged directly to the class to which they relate. Expenses common to all classes and investment income are allocated to the classes based upon the relative daily net assets of each class’s settled shares; realized and unrealized gains and losses are allocated based upon the relative daily net assets of each class’s outstanding shares. The Advisor Class pays Rule 12b-1 fees, in an amount not exceeding 0.25% of the class’s average daily net assets.
Redemption Fees A 2% fee is assessed on redemptions of fund shares held for 90 days or less to deter short-term trading and to protect the interests of long-term shareholders. Redemption fees are withheld from proceeds that shareholders receive from the sale or exchange of fund shares. The fees are paid to the fund and are recorded as an increase to paid-in capital. The fees may cause the redemption price per share to differ from the net asset value per share.
New Accounting Guidance In March 2017, the FASB issued amended guidance to shorten the amortization period for certain callable debt securities, held at a premium. The guidance is effective for fiscal years and interim periods beginning after December 15, 2018. Adoption will have no effect on the fund’s net assets or results of operations.
On August 1, 2017, the fund implemented amendments to Regulation S-X, issued by the Securities and Exchange Commission, which require standardized, enhanced disclosures, particularly related to derivatives, in investment company financial statements. Adoption had no effect on the fund’s net assets or results of operations.
NOTE 2 - VALUATION
The fund’s financial instruments are valued and each class’s net asset value (NAV) per share is computed at the close of the New York Stock Exchange (NYSE), normally 4 p.m. ET, each day the NYSE is open for business. However, the NAV per share may be calculated at a time other than the normal close of the NYSE if trading on the NYSE is restricted, if the NYSE closes earlier, or as may be permitted by the SEC.
Fair Value The fund’s financial instruments are reported at fair value, which GAAP defines as the price that would be received to sell an asset or paid to transfer a liability in an orderly transaction between market participants at the measurement date. The T. Rowe Price Valuation Committee (the Valuation Committee) is an internal committee that has been delegated certain responsibilities by the fund’s Board of Directors (the Board) to ensure that financial instruments are appropriately priced at fair value in accordance with GAAP and the 1940 Act. Subject to oversight by the Board, the Valuation Committee develops and oversees pricing-related policies and procedures and approves all fair value determinations. Specifically, the Valuation Committee establishes procedures to value securities; determines pricing techniques, sources, and persons eligible to effect fair value pricing actions; oversees the selection, services, and performance of pricing vendors; oversees valuation-related business continuity practices; and provides guidance on internal controls and valuation-related matters. The Valuation Committee reports to the Board and has representation from legal, portfolio management and trading, operations, risk management, and the fund’s treasurer.
Various valuation techniques and inputs are used to determine the fair value of financial instruments. GAAP establishes the following fair value hierarchy that categorizes the inputs used to measure fair value:
Level 1 – quoted prices (unadjusted) in active markets for identical financial instruments that the fund can access at the reporting date
Level 2 – inputs other than Level 1 quoted prices that are observable, either directly or indirectly (including, but not limited to, quoted prices for similar financial instruments in active markets, quoted prices for identical or similar financial instruments in inactive markets, interest rates and yield curves, implied volatilities, and credit spreads)
Level 3 – unobservable inputs
Observable inputs are developed using market data, such as publicly available information about actual events or transactions, and reflect the assumptions that market participants would use to price the financial instrument. Unobservable inputs are those for which market data are not available and are developed using the best information available about the assumptions that market participants would use to price the financial instrument. GAAP requires valuation techniques to maximize the use of relevant observable inputs and minimize the use of unobservable inputs. When multiple inputs are used to derive fair value, the financial instrument is assigned to the level within the fair value hierarchy based on the lowest-level input that is significant to the fair value of the financial instrument. Input levels are not necessarily an indication of the risk or liquidity associated with financial instruments at that level but rather the degree of judgment used in determining those values.
Valuation Techniques Debt securities generally are traded in the over-the-counter (OTC) market. Securities with remaining maturities of one year or more at the time of acquisition are valued at prices furnished by dealers who make markets in such securities or by an independent pricing service, which considers the yield or price of bonds of comparable quality, coupon, maturity, and type, as well as prices quoted by dealers who make markets in such securities. Securities with remaining maturities of less than one year at the time of acquisition generally use amortized cost in local currency to approximate fair value. However, if amortized cost is deemed not to reflect fair value or the fund holds a significant amount of such securities with remaining maturities of more than 60 days, the securities are valued at prices furnished by dealers who make markets in such securities or by an independent pricing service. Generally, debt securities are categorized in Level 2 of the fair value hierarchy; however, to the extent the valuations include significant unobservable inputs, the securities would be categorized in Level 3.
Equity securities listed or regularly traded on a securities exchange or in the OTC market are valued at the last quoted sale price or, for certain markets, the official closing price at the time the valuations are made. OTC Bulletin Board securities are valued at the mean of the closing bid and asked prices. A security that is listed or traded on more than one exchange is valued at the quotation on the exchange determined to be the primary market for such security. Listed securities not traded on a particular day are valued at the mean of the closing bid and asked prices. Actively traded equity securities listed on a domestic exchange generally are categorized in Level 1 of the fair value hierarchy. OTC Bulletin Board securities, certain preferred securities, and equity securities traded in inactive markets generally are categorized in Level 2 of the fair value hierarchy.
Assets and liabilities other than financial instruments, including short-term receivables and payables, are carried at cost, or estimated realizable value, if less, which approximates fair value.
Thinly traded financial instruments and those for which the above valuation procedures are inappropriate or are deemed not to reflect fair value are stated at fair value as determined in good faith by the Valuation Committee. The objective of any fair value pricing determination is to arrive at a price that could reasonably be expected from a current sale. Financial instruments fair valued by the Valuation Committee are primarily private placements, restricted securities, warrants, rights, and other securities that are not publicly traded.
Subject to oversight by the Board, the Valuation Committee regularly makes good faith judgments to establish and adjust the fair valuations of certain securities as events occur and circumstances warrant. For instance, in determining the fair value of troubled or thinly traded debt instruments, the Valuation Committee considers a variety of factors, which may include, but are not limited to, the issuer’s business prospects, its financial standing and performance, recent investment transactions in the issuer, strategic events affecting the company, market liquidity for the issuer, and general economic conditions and events. In consultation with the investment and pricing teams, the Valuation Committee will determine an appropriate valuation technique based on available information, which may include both observable and unobservable inputs. The Valuation Committee typically will afford greatest weight to actual prices in arm’s length transactions, to the extent they represent orderly transactions between market participants, transaction information can be reliably obtained, and prices are deemed representative of fair value. However, the Valuation Committee may also consider other valuation methods such as a discount or premium from market value of a similar, freely traded security of the same issuer; discounted cash flows; yield to maturity; or some combination. Fair value determinations are reviewed on a regular basis and updated as information becomes available, including actual purchase and sale transactions of the issue. Because any fair value determination involves a significant amount of judgment, there is a degree of subjectivity inherent in such pricing decisions, and fair value prices determined by the Valuation Committee could differ from those of other market participants. Depending on the relative significance of unobservable inputs, including the valuation technique(s) used, fair valued securities may be categorized in Level 2 or 3 of the fair value hierarchy.
Valuation Inputs The following table summarizes the fund’s financial instruments, based on the inputs used to determine their fair values on August 31, 2017:
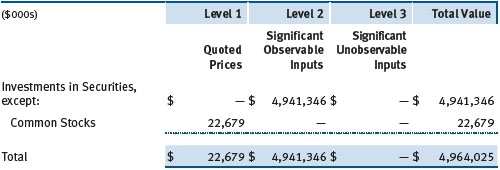
There were no material transfers between Levels 1 and 2 during the six months ended August 31, 2017.
NOTE 3 - OTHER INVESTMENT TRANSACTIONS
Consistent with its investment objective, the fund engages in the following practices to manage exposure to certain risks and/or to enhance performance. The investment objective, policies, program, and risk factors of the fund are described more fully in the fund’s prospectus and Statement of Additional Information.
Noninvestment-Grade Debt At August 31, 2017, approximately 43% of the fund’s net assets were invested, either directly or through its investment in T. Rowe Price institutional funds, in noninvestment-grade debt, including “high yield” or “junk” bonds or leveraged loans. The noninvestment-grade debt market may experience sudden and sharp price swings due to a variety of factors, including changes in economic forecasts, stock market activity, large sustained sales by major investors, a high-profile default, or a change in market sentiment. These events may decrease the ability of issuers to make principal and interest payments and adversely affect the liquidity or value, or both, of such securities. Investments in noninvestment-grade holdings may be considered speculative.
Restricted Securities The fund may invest in securities that are subject to legal or contractual restrictions on resale. Prompt sale of such securities at an acceptable price may be difficult and may involve substantial delays and additional costs.
Residual-Interest Bonds The fund may invest in residual-interest bonds (RIBs) purchased from third-party special purpose trusts, which securitize an underlying bond into RIBs and short-term floating rate bonds. RIBs generally are entitled to the cash flows of the underlying bond that remain after payment of amounts due to the floating rate bondholders and trust-related fees; they also generally have the right to acquire the underlying bond from the trust. RIBs can only be traded in accordance with Rule 144A of the Securities Act of 1933 and cannot be offered for public resale. Risks arise from changes in interest rates and the value of the underlying bond, and the sale of the RIBs may involve delay or additional costs.
When-Issued Securities The fund may enter into when-issued purchase or sale commitments, pursuant to which it agrees to purchase or sell, respectively, an authorized but not yet issued security for a fixed unit price, with payment and delivery not due until issuance of the security on a scheduled future date. When-issued securities may be new securities or securities issued through a corporate action, such as a reorganization or restructuring. Until settlement, the fund maintains liquid assets sufficient to settle its commitment to purchase a when-issued security or, in the case of a sale commitment, the fund maintains an entitlement to the security to be sold. Amounts realized on when-issued transactions are included in realized gain/loss on securities in the accompanying financial statements.
Other Purchases and sales of portfolio securities other than short-term securities aggregated $492,569,000 and $98,470,000, respectively, for the six months ended August 31, 2017.
NOTE 4 - FEDERAL INCOME TAXES
No provision for federal income taxes is required since the fund intends to continue to qualify as a regulated investment company under Subchapter M of the Internal Revenue Code and distribute to shareholders all of its taxable income and gains. Distributions determined in accordance with federal income tax regulations may differ in amount or character from net investment income and realized gains for financial reporting purposes. Financial reporting records are adjusted for permanent book/tax differences to reflect tax character but are not adjusted for temporary differences. The amount and character of tax-basis distributions and composition of net assets are finalized at fiscal year-end; accordingly, tax-basis balances have not been determined as of the date of this report.
The fund intends to retain realized gains to the extent of available capital loss carryforwards. Because the fund is required to use capital loss carryforwards that do not expire before those with expiration dates, all or a portion of its capital loss carryforwards subject to expiration could ultimately go unused. As of February 28, 2017, the fund had $39,988,000 of available capital loss carryforwards, which expire as follows: $12,491,000 in fiscal 2018, $3,652,000 in fiscal 2019; $23,845,000 have no expiration.
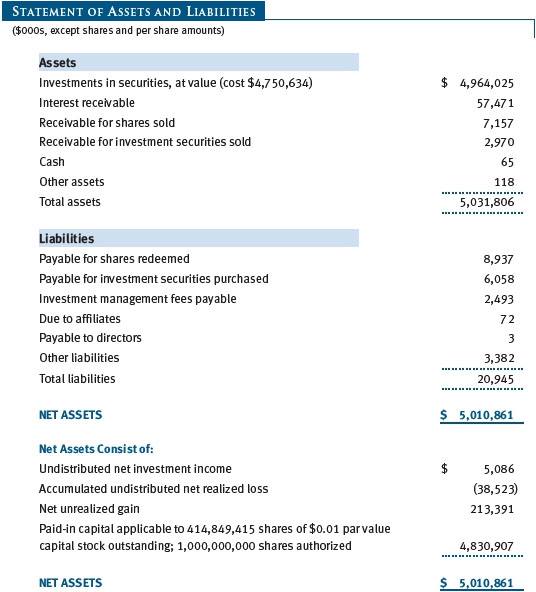
At August 31, 2017, the cost of investments for federal income tax purposes was $4,744,634,000. Net unrealized gain aggregated $219,391,000 at period-end, of which $273,692,000 related to appreciated investments and $54,301,000 related to depreciated investments.
NOTE 5 - RELATED PARTY TRANSACTIONS
The fund is managed by T. Rowe Price Associates, Inc. (Price Associates), a wholly owned subsidiary of T. Rowe Price Group, Inc. (Price Group). The investment management agreement between the fund and Price Associates provides for an annual investment management fee, which is computed daily and paid monthly. The fee consists of an individual fund fee, equal to 0.30% of the fund’s average daily net assets, and a group fee. The group fee rate is calculated based on the combined net assets of certain mutual funds sponsored by Price Associates (the group) applied to a graduated fee schedule, with rates ranging from 0.48% for the first $1 billion of assets to 0.265% for assets in excess of $650 billion. The fund’s group fee is determined by applying the group fee rate to the fund’s average daily net assets. At August 31, 2017, the effective annual group fee rate was 0.29%.
The I Class is subject to an operating expense limitation (I Class limit) pursuant to which Price Associates is contractually required to pay all operating expenses of the I Class, excluding management fees, interest, expenses related to borrowings, taxes, brokerage, and other non-recurring expenses permitted by the investment management agreement, to the extent such operating expenses, on an annualized basis, exceed 0.05% of average net assets. This agreement will continue until June 30, 2019, and may be renewed, revised, or revoked only with approval of the fund’s Board. The I Class is required to repay Price Associates for expenses previously paid to the extent the class’s net assets grow or expenses decline sufficiently to allow repayment without causing the class’s operating expense ratio (after the repayment is taken into account) to exceed the lesser of: (1) the expense limitation in place at the time such amounts were paid; and (2) the class’s current expense limitation. However, no repayment will be made more than three years after the date of a payment or waiver. For the six months ended August 31, 2017, the I Class operated below its expense limitation.
In addition, the fund has entered into service agreements with Price Associates and a wholly owned subsidiary of Price Associates (collectively, Price). Price Associates provides certain accounting and administrative services to the fund. T. Rowe Price Services, Inc. provides shareholder and administrative services in its capacity as the fund’s transfer and dividend-disbursing agent. For the six months ended August 31, 2017, expenses incurred pursuant to these service agreements were $40,000 for Price Associates and $283,000 for T. Rowe Price Services, Inc. The total amount payable at period-end pursuant to these service agreements is reflected as Due to Affiliates in the accompanying financial statements.
As of August 31, 2017, T. Rowe Price Group, Inc., or its wholly owned subsidiaries owned 21,386 shares of the I Class, representing less than 1% of the I Class’s net assets.
The fund may participate in securities purchase and sale transactions with other funds or accounts advised by Price Associates (cross trades), in accordance with procedures adopted by the fund’s Board and Securities and Exchange Commission rules, which require, among other things, that such purchase and sale cross trades be effected at the independent current market price of the security. During the six months ended August 31, 2017, the aggregate value of purchases and sales cross trades with other funds or accounts advised by Price Associates was less than 1% of the fund’s net assets as of August 31, 2017.
| Information on Proxy Voting Policies, Procedures, and Records |
A description of the policies and procedures used by T. Rowe Price funds and portfolios to determine how to vote proxies relating to portfolio securities is available in each fund’s Statement of Additional Information. You may request this document by calling 1-800-225-5132 or by accessing the SEC’s website, sec.gov.
The description of our proxy voting policies and procedures is also available on our corporate website. To access it, please visit the following Web page:
https://www3.troweprice.com/usis/corporate/en/utility/policies.html
Scroll down to the section near the bottom of the page that says, “Proxy Voting Policies.” Click on the Proxy Voting Policies link in the shaded box.
Each fund’s most recent annual proxy voting record is available on our website and through the SEC’s website. To access it through T. Rowe Price, visit the website location shown above, and scroll down to the section near the bottom of the page that says, “Proxy Voting Records.” Click on the Proxy Voting Records link in the shaded box.
| How to Obtain Quarterly Portfolio Holdings |
The fund files a complete schedule of portfolio holdings with the Securities and Exchange Commission for the first and third quarters of each fiscal year on Form N-Q. The fund’s Form N-Q is available electronically on the SEC’s website (sec.gov); hard copies may be reviewed and copied at the SEC’s Public Reference Room, 100 F St. N.E., Washington, DC 20549. For more information on the Public Reference Room, call 1-800-SEC-0330.
| Approval of Investment Management Agreement |
Each year, the fund’s Board of Directors (Board) considers the continuation of the investment management agreement (Advisory Contract) between the fund and its investment advisor, T. Rowe Price Associates, Inc. (Advisor). In that regard, at an in-person meeting held on March 6–7, 2017 (Meeting), the Board, including a majority of the fund’s independent directors, approved the continuation of the fund’s Advisory Contract. At the Meeting, the Board considered the factors and reached the conclusions described below relating to the selection of the Advisor and the approval of the Advisory Contract. The independent directors were assisted in their evaluation of the Advisory Contract by independent legal counsel from whom they received separate legal advice and with whom they met separately.
In providing information to the Board, the Advisor was guided by a detailed set of requests for information submitted by independent legal counsel on behalf of the independent directors. In considering and approving the Advisory Contract, the Board considered the information it believed was relevant, including, but not limited to, the information discussed below. The Board considered not only the specific information presented in connection with the Meeting but also the knowledge gained over time through interaction with the Advisor about various topics. The Board meets regularly and, at each of its meetings, covers an extensive agenda of topics and materials and considers factors that are relevant to its annual consideration of the renewal of the T. Rowe Price funds’ advisory contracts, including performance and the services and support provided to the funds and their shareholders.
Services Provided by the Advisor
The Board considered the nature, quality, and extent of the services provided to the fund by the Advisor. These services included, but were not limited to, directing the fund’s investments in accordance with its investment program and the overall management of the fund’s portfolio, as well as a variety of related activities such as financial, investment operations, and administrative services; compliance; maintaining the fund’s records and registrations; and shareholder communications. The Board also reviewed the background and experience of the Advisor’s senior management team and investment personnel involved in the management of the fund, as well as the Advisor’s compliance record. The Board concluded that it was satisfied with the nature, quality, and extent of the services provided by the Advisor.
Investment Performance of the Fund
The Board took into account discussions with the Advisor and reports that it receives throughout the year relating to fund performance. In connection with the Meeting, the Board reviewed the fund’s net annualized total returns for the 1-, 2-, 3-, 4-, 5-, and 10-year periods as of September 30, 2016, and compared these returns with the performance of a peer group of funds with similar investment programs and a wide variety of other previously agreed-upon comparable performance measures and market data, including those supplied by Broadridge, which is an independent provider of mutual fund data.
On the basis of this evaluation and the Board’s ongoing review of investment results, and factoring in the relative market conditions during certain of the performance periods, the Board concluded that the fund’s performance was satisfactory.
Costs, Benefits, Profits, and Economies of Scale
The Board reviewed detailed information regarding the revenues received by the Advisor under the Advisory Contract and other benefits that the Advisor (and its affiliates) may have realized from its relationship with the fund, including any research received under “soft dollar” agreements and commission-sharing arrangements with broker-dealers. The Board considered that the Advisor may receive some benefit from soft-dollar arrangements pursuant to which research is received from broker-dealers that execute the fund’s portfolio transactions. The Board received information on the estimated costs incurred and profits realized by the Advisor from managing the T. Rowe Price funds. The Board also reviewed estimates of the profits realized from managing the fund, in particular, and the Board concluded that the Advisor’s profits were reasonable in light of the services provided to the fund.
The Board also considered whether the fund benefits under the fee levels set forth in the Advisory Contract from any economies of scale realized by the Advisor. Under the Advisory Contract, the fund pays a fee to the Advisor for investment management services composed of two components—a group fee rate based on the combined average net assets of most of the T. Rowe Price funds (including the fund) that declines at certain asset levels and an individual fund fee rate based on the fund’s average daily net assets—and the fund pays its own expenses of operations (subject to an expense limitation agreed to by the Advisor with respect to the fund’s I Class). At the Meeting, the Board approved an additional 0.005% breakpoint to the group fee schedule, effective May 1, 2017. With the new breakpoint, the group fee rate will decline to 0.265% when the combined average net assets of the applicable T. Rowe Price funds exceed $650 billion. The Board concluded that the advisory fee structure for the fund continued to provide for a reasonable sharing of benefits from any economies of scale with the fund’s investors.
Fees and Expenses
The Board was provided with information regarding industry trends in management fees and expenses. Among other things, the Board reviewed data for peer groups that were compiled by Broadridge, which compared: (i) contractual management fees, total expenses, actual management fees, and nonmanagement expenses of the Investor Class of the fund with a group of competitor funds selected by Broadridge (Investor Class Expense Group); (ii) total expenses and actual management fees of the Advisor Class of the fund with a group of competitor funds selected by Broadridge (Advisor Class Expense Group); and (iii) total expenses, actual management fees, and nonmanagement expenses of the Investor Class of the fund with a broader set of funds within the Lipper investment classification (Expense Universe). The Board considered the fund’s contractual management fee rate, actual management fee rate (which reflects the management fees actually received from the fund by the Advisor after any applicable waivers, reductions, or reimbursements), operating expenses, and total expenses (which reflects the net total expense ratio of the fund after any waivers, reductions, or reimbursements) in comparison with the information for the Broadridge peer groups. Broadridge generally constructed the peer groups by seeking the most comparable funds based on similar investment classifications and objectives, expense structure, asset size, and operating components and attributes and ranked funds into quintiles, with the first quintile representing the funds with the lowest relative expenses and the fifth quintile representing the funds with the highest relative expenses. The information provided to the Board indicated that the fund’s contractual management fee ranked in the fifth quintile (Investor Class Expense Group), the fund’s actual management fee rate ranked in the fifth quintile (Investor Class Expense Group, Advisor Class Expense Group, and Expense Universe), and the fund’s total expenses ranked in the first and fifth quintiles (Investor Class Expense Group and Expense Universe) and fifth quintile (Advisor Class Expense Group). The Board requested additional information from management with respect to the fund’s relative management fees and total expenses ranking in the fifth quintile and reviewed and considered the information provided relating to the fund, other funds in the peer groups, and other factors that the Board determined to be relevant.
The Board also reviewed the fee schedules for institutional accounts and private accounts with similar mandates that are advised or subadvised by the Advisor and its affiliates. Management provided the Board with information about the Advisor’s responsibilities and services provided to subadvisory and other institutional account clients, including information about how the requirements and economics of the institutional business are fundamentally different from those of the mutual fund business. The Board considered information showing that the Advisor’s mutual fund business is generally more complex from a business and compliance perspective than its institutional account business and considered various relevant factors, such as the broader scope of operations and oversight, more extensive shareholder communication infrastructure, greater asset flows, heightened business risks, and differences in applicable laws and regulations associated with the Advisor’s proprietary mutual fund business. In assessing the reasonableness of the fund’s management fee rate, the Board considered the differences in the nature of the services required for the Advisor to manage its mutual fund business versus managing a discrete pool of assets as a subadvisor to another institution’s mutual fund or for an institutional account, and that the Advisor generally performs significant additional services and assumes greater risk in managing the fund and other T. Rowe Price funds than it does for institutional account clients.
On the basis of the information provided and the factors considered, the Board concluded that the fees paid by the fund under the Advisory Contract are reasonable.
Approval of the Advisory Contract
As noted, the Board approved the continuation of the Advisory Contract. No single factor was considered in isolation or to be determinative to the decision. Rather, the Board concluded, in light of a weighting and balancing of all factors considered, that it was in the best interests of the fund and its shareholders for the Board to approve the continuation of the Advisory Contract (including the fees to be charged for services thereunder).
Item 2. Code of Ethics.
A code of ethics, as defined in Item 2 of Form N-CSR, applicable to its principal executive officer, principal financial officer, principal accounting officer or controller, or persons performing similar functions is filed as an exhibit to the registrant’s annual Form N-CSR. No substantive amendments were approved or waivers were granted to this code of ethics during the registrant’s most recent fiscal half-year.
Item 3. Audit Committee Financial Expert.
Disclosure required in registrant’s annual Form N-CSR.
Item 4. Principal Accountant Fees and Services.
Disclosure required in registrant’s annual Form N-CSR.
Item 5. Audit Committee of Listed Registrants.
Not applicable.
Item 6. Investments.
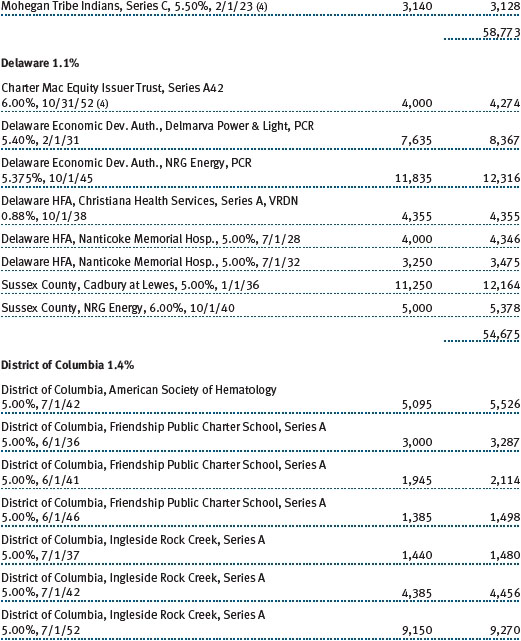
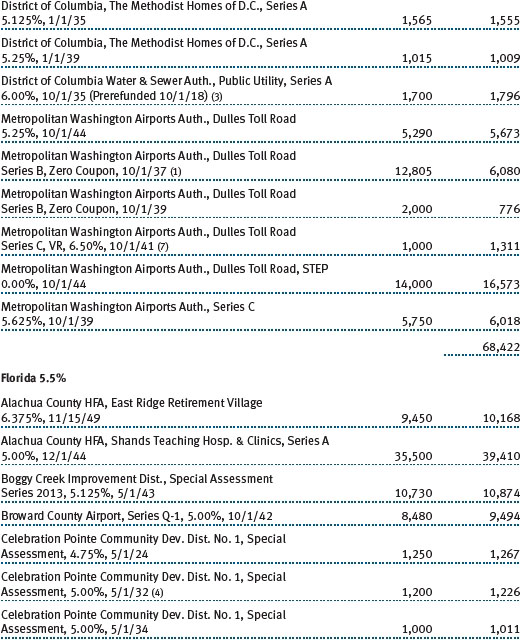
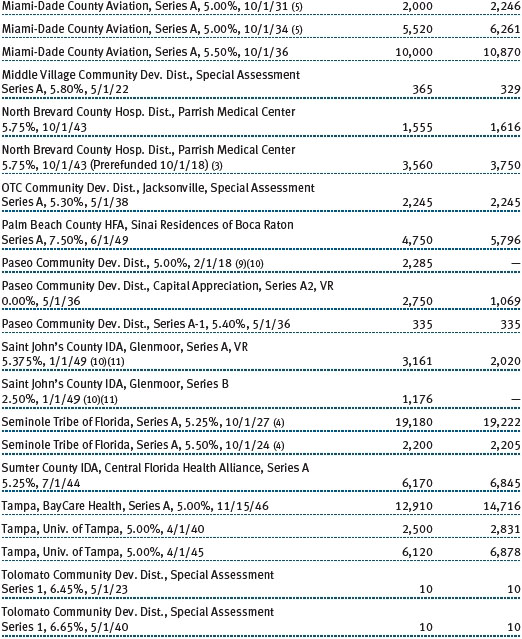
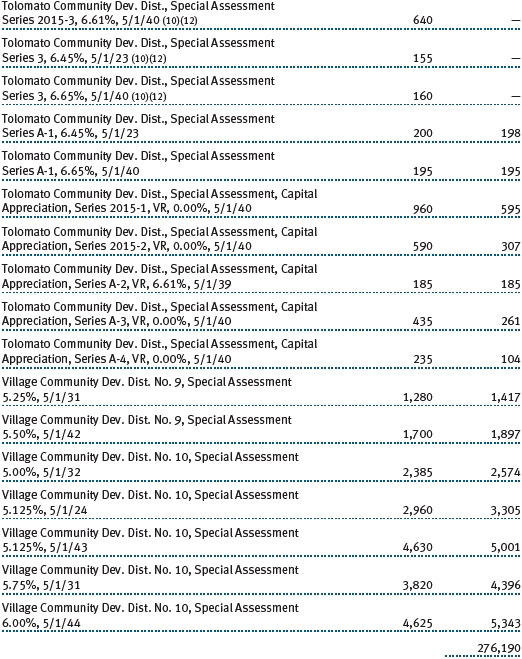
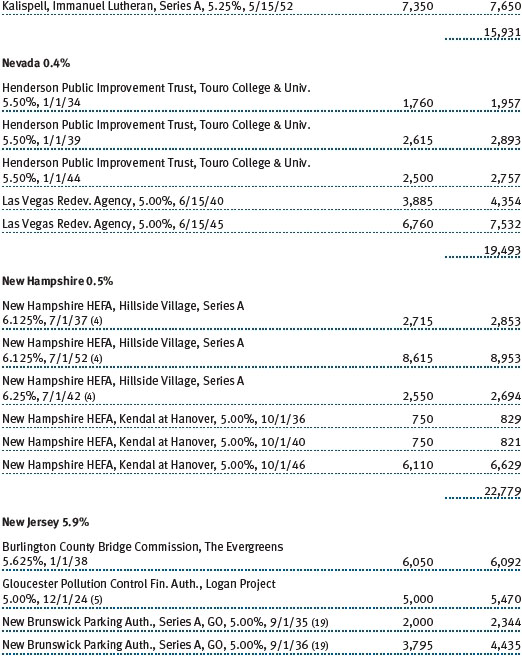
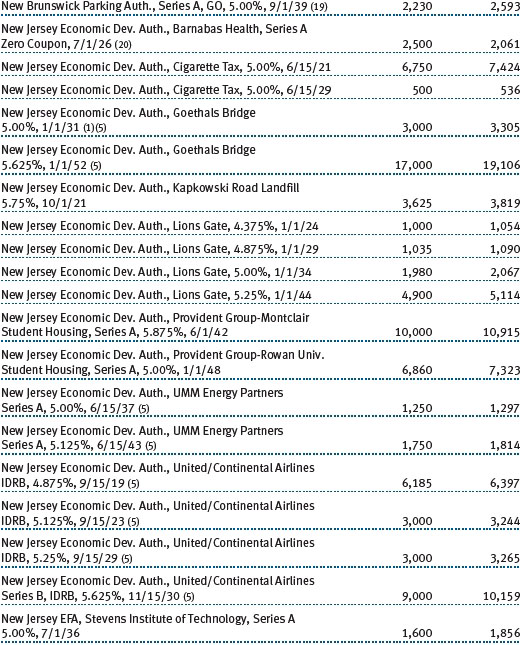
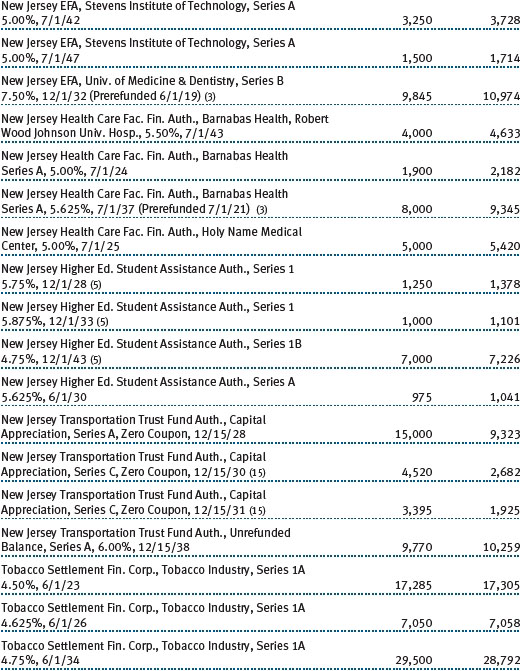
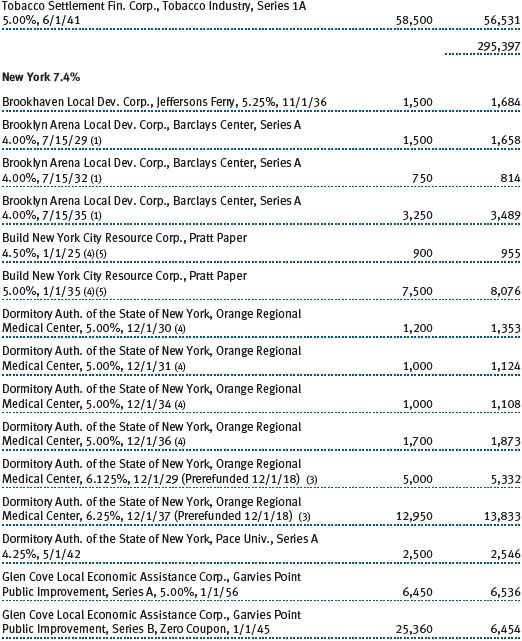
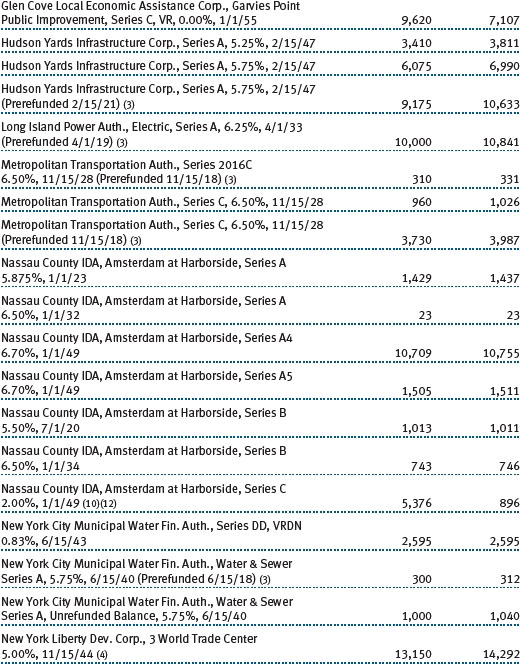
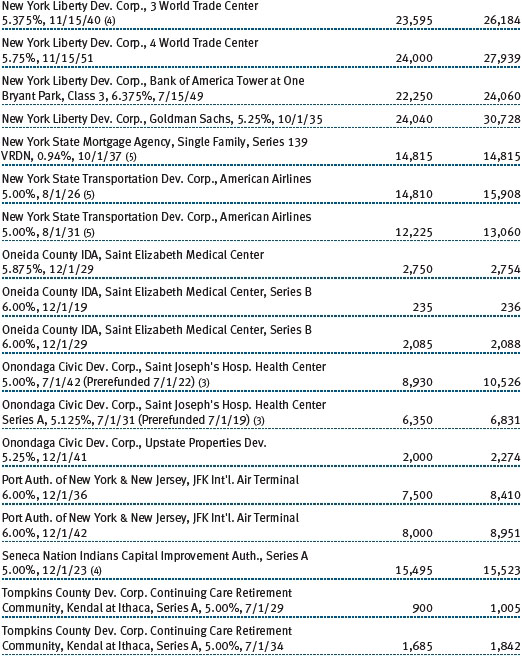
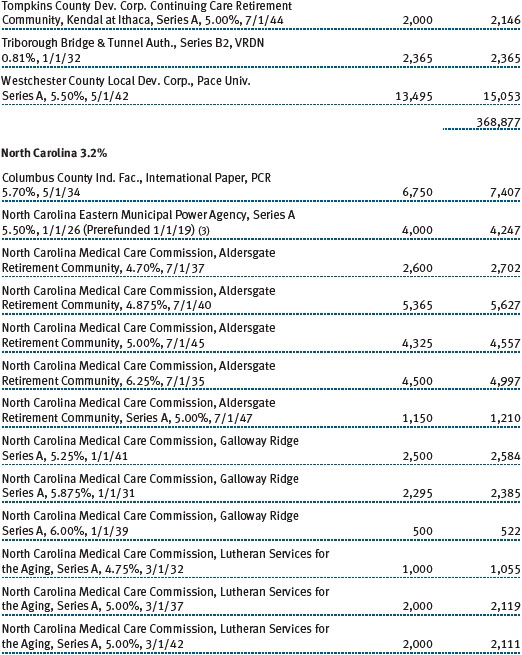
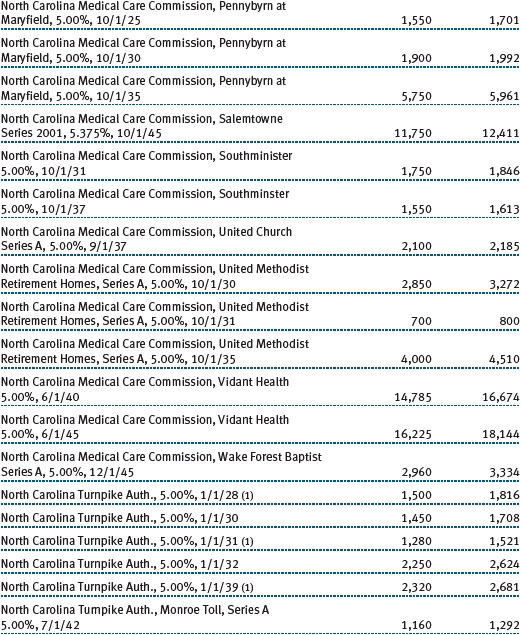
(a) Not applicable. The complete schedule of investments is included in Item 1 of this Form N-CSR.
(b) Not applicable.
Item 7. Disclosure of Proxy Voting Policies and Procedures for Closed-End Management Investment Companies.
Not applicable.
Item 8. Portfolio Managers of Closed-End Management Investment Companies.
Not applicable.
Item 9. Purchases of Equity Securities by Closed-End Management Investment Company and Affiliated Purchasers.
Not applicable.
Item 10. Submission of Matters to a Vote of Security Holders.
Not applicable.
Item 11. Controls and Procedures.
(a) The registrant’s principal executive officer and principal financial officer have evaluated the registrant’s disclosure controls and procedures within 90 days of this filing and have concluded that the registrant’s disclosure controls and procedures were effective, as of that date, in ensuring that information required to be disclosed by the registrant in this Form N-CSR was recorded, processed, summarized, and reported timely.
(b) The registrant’s principal executive officer and principal financial officer are aware of no change in the registrant’s internal control over financial reporting that occurred during the registrant’s second fiscal quarter covered by this report that has materially affected, or is reasonably likely to materially affect, the registrant’s internal control over financial reporting.
Item 12. Exhibits.
(a)(1) The registrant’s code of ethics pursuant to Item 2 of Form N-CSR is filed with the registrant’s annual Form N-CSR.
(2) Separate certifications by the registrant's principal executive officer and principal financial officer, pursuant to Section 302 of the Sarbanes-Oxley Act of 2002 and required by Rule 30a-2(a) under the Investment Company Act of 1940, are attached.
(3) Written solicitation to repurchase securities issued by closed-end companies: not applicable.
(b) A certification by the registrant's principal executive officer and principal financial officer, pursuant to Section 906 of the Sarbanes-Oxley Act of 2002 and required by Rule 30a-2(b) under the Investment Company Act of 1940, is attached.
SIGNATURES
Pursuant to the requirements of the Securities Exchange Act of 1934 and the Investment Company Act of 1940, the registrant has duly caused this report to be signed on its behalf by the undersigned, thereunto duly authorized.
T. Rowe Price Tax-Free High Yield Fund, Inc.
| By | | /s/ Edward C. Bernard |
| | | Edward C. Bernard |
| | | Principal Executive Officer |
| |
| Date | | October 17, 2017 | | | | |
Pursuant to the requirements of the Securities Exchange Act of 1934 and the Investment Company Act of 1940, this report has been signed below by the following persons on behalf of the registrant and in the capacities and on the dates indicated.
| By | | /s/ Edward C. Bernard |
| | | Edward C. Bernard |
| | | Principal Executive Officer |
| |
| Date | | October 17, 2017 | | | | |
| |
| |
| By | | /s/ Catherine D. Mathews |
| | | Catherine D. Mathews |
| | | Principal Financial Officer |
| |
| Date | | October 17, 2017 | | | | |