| UNITED STATES SECURITIES AND EXCHANGE COMMISSION Washington, D.C. 20549 FORM N-CSR CERTIFIED SHAREHOLDER REPORT OF REGISTERED MANAGEMENT INVESTMENT COMPANIES |
| Investment Company Act file number 811-04182 Name of Fund: BlackRock International Value Fund of BlackRock International Value Trust Fund Address: 100 Bellevue Parkway, Wilmington, DE 19809 Name and address of agent for service: Donald C. Burke, Chief Executive Officer, BlackRock International Value Fund of BlackRock International Value Trust, 800 Scudders Mill Road, Plainsboro, NJ, 08536. Mailing address: P.O. Box 9011, Princeton, NJ, 08543-9011 Registrant’s telephone number, including area code: (800) 441-7762 Date of fiscal year end: 06/30/2008 Date of reporting period: 07/01/2007 – 06/30/2008 Item 1 – Report to Stockholders |
| EQUITIES FIXED INCOME REAL ESTATE LIQUIDITY ALTERNATIVES BLACKROCK SOLUTIONS BlackRock International Value Fund OF BLACKROCK INTERNATIONAL VALUE TRUST ANNUAL REPORT | JUNE 30, 2008 |
| NOT FDIC INSURED MAY LOSE VALUE NO BANK GUARANTEE |
| Table of Contents | ||
| Page | ||
| A Letter to Shareholders | 3 | |
| Annual Report: | ||
| Fund Summary | 4 | |
| About Fund Performance | 6 | |
| Disclosure of Expenses | 6 | |
| Portfolio Summary | 7 | |
| Financial Statements: | ||
| Schedule of Investments | 8 | |
| Statement of Assets and Liabilities | 11 | |
| Statement of Operations | 12 | |
| Statements of Changes in Net Assets | 13 | |
| Financial Highlights | 14 | |
| Notes to Financial Statements | 17 | |
| Report of Independent Registered Public Accounting Firm | 22 | |
| Important Tax Information | 23 | |
| Disclosure of Investment Advisory Agreement and Subadvisory Agreement | 24 | |
| Officers and Trustees | 28 | |
| Additional Information | 32 | |
| Mutual Fund Family | 34 | |
2 BLACKROCK INTERNATIONAL VALUE FUND
| JUNE 30, 2008 |
| A Letter to Shareholders |
Dear Shareholder
Throughout the past year, investors were overwhelmed by lingering credit and financial market troubles, surging oil
prices and more recently, renewed inflation concerns. Healthy nonfinancial corporate profits and robust exporting
activity remained among the few bright spots, helping the economy to grow at a modest, but still positive, pace.
The Federal Reserve Board (the “Fed”) has been aggressive in its attempts to stoke economic growth and ease
financial market instability. In addition to slashing the target federal funds rate 325 basis points (3.25%) between
September 2007 and April 2008, the central bank introduced the new Term Securities Lending Facility, granted broker-
dealers access to the discount window and used its own balance sheet to help negotiate the sale of Bear Stearns.
As widely anticipated, the end of the period saw a pause in Fed action, as the central bank held the target rate steady
at 2.0% amid rising inflationary pressures.
As the Fed’s bold response to the financial crisis helped ease credit turmoil and investor anxiety, U.S. equity markets
sank sharply over the last six months, notwithstanding a brief rally in the spring. International markets were not immune
to the tumult, with most regions also registering declines.
Treasury securities also traded in a volatile fashion, but generally rallied (yields fell as prices correspondingly rose), with
investors continuing to seek safety as part of a broader flight to quality. The yield on 10-year Treasury issues, which fell
to 3.34% in March 2008, climbed up to the 4.20% range in mid-June as investors temporarily shifted out of Treasury
issues in favor of riskier assets (such as stocks and other high-quality fixed income sectors), then reversed course and
declined to 3.99% by period-end when credit fears re-emerged.
Tax-exempt issues eked out gains for the reporting period, but underperformed their taxable counterparts, as the group
continued to be pressured by problems among municipal bond insurers and the breakdown in the market for auction
rate securities.
The major benchmark indexes generated results that largely reflected heightened investor risk aversion:
| Total Returns as of June 30, 2008 | 6-month | 12-month | ||
| U.S. equities (S&P 500 Index) | (11.91)% | (13.12)% | ||
| Small cap U.S. equities (Russell 2000 Index) | (9.37)% | (16.19)% | ||
| International equities (MSCI Europe, Australasia, Far East Index) | (10.96)% | (10.61)% | ||
| Fixed income (Lehman Brothers U.S. Aggregate Index) | 1.13% | 7.12% | ||
| Tax-exempt fixed income (Lehman Brothers Municipal Bond Index) | 0.02% | 3.23% | ||
| High yield bonds (Lehman Brothers U.S. Corporate High Yield 2% Issuer Capped Index) | (1.08)% | (1.74)% | ||
| Past performance is no guarantee of future results. Index performance shown for illustrative purposes only. You cannot invest directly in an index. As you navigate today’s volatile markets, we encourage you to review your investment goals with your financial profes- sional and to make portfolio changes, as needed. For more up-to-date commentary on the economy and financial markets, we invite you to visit www.blackrock.com/funds. As always, we thank you for entrusting BlackRock with your investment assets, and we look forward to continuing to serve you in the months and years ahead. |
THIS PAGE NOT PART OF YOUR FUND REPORT
3
Fund Summary
Portfolio Management Commentary
How did the Fund perform?
•The Fund underperformed the benchmark Morgan Stanley Capital
International Europe, Austrasia, Far East (“MSCI EAFE”) Index for the
12-month period.
What factors influenced performance?
•Stock selection was the main driver of the Fund's underperformance,
while sector allocation contributed positively overall. Country allocation
was positive, mainly due to the Fund’s overweight position in Germany
and Russia.
•Financials stocks continued to hamper performance, despite the Fund’s
underweight stance relative to the benchmark. Stock selection within
diversified financials had the greatest negative impact on returns.
Individual holdings that underperformed included Australian financial
services firm Octaviar Ltd., Dutch bank Fortis and Japanese financial
firm ORIX Corp. The Fund’s exposure to Hong Kong real estate hindered
comparative performance as well.
•In telecommunications services, stock selection and an overweight
position detracted from results, as the sector suffered broadly during
the annual period. Other stocks to have a negative impact included Irish
construction company CRH Plc and Japanese copper and refining com-
pany Nippon Mining Holdings, Inc.
•On the positive side, Fund performance benefited from an overweight
exposure and successful stock selection in the materials sector, which
continued to outperform on the back of strong commodity prices. Fund
exposure to steel, mining and chemicals stocks, such as ArcelorMittal,
Anglo American Plc and Bayer AG, contributed positively. Stock selection
within the utility sector was also positive.
Describe recent portfolio activity.
•During the 12 months, we increased the Fund’s defensive posture and
added to the healthcare sector, purchasing pharmaceutical companies
GlaxoSmithKline Plc and Takeda Pharmaceutical Co. Ltd. We also
increased exposure to power generators Suez SA, Fortum Oyi and E.ON
AG in the utilities sector.
•At the same time, we continued to reduce the Fund’s holdings in the
financials sector (especially in diversified financials and insurance),
exiting positions in Prudential Plc, AXA SA, UBS AG, Banca Intesa SpA
and Societe Generale SA. Within the automotive sector, we sold BMW
and Honda Motor Co., Ltd.
•At the regional level, we established new positions in selected emerging
markets, including Russia, Brazil, Mexico and China, while we trimmed
the Fund’s exposure in continental Europe. Additionally, we reduced the
Fund’s underweight in Japan.
Describe Fund positioning at period-end.
•The Fund ended the 12-month period overweight in materials, telecom-
munications and utilities, and underweight in consumer discretionary
and financials. Geographically, we held underweight positions in the U.K.
and Continental Europe in favor of Japan, where the Fund has a neutral
weighting, and selected emerging markets, where the Fund is overweight
relative to the benchmark.
•The Fund maintains a significant large cap bias, focusing on companies
that have strong balance sheets with low leverage, strong cash-generating
business models and an ability to pass on price increases or cut costs.
The views expressed reflect the opinions of BlackRock as of the date of this report and are subject to change based on changes in market, economic or other conditions. These
views are not intended to be a forecast of future events and are no guarantee of future results.
| Fund Profile as of June 30, 2008 |
| Ten Largest Holdings | Percent of | |
| (Equity Investments) | Net Assets | |
| Nestle SA Registered Shares | 3% | |
| E.ON AG | 3 | |
| Vodafone Group Plc | 3 | |
| Royal Dutch Shell Plc Class B | 3 | |
| Novartis AG Registered Shares | 3 | |
| Eni SpA | 3 | |
| British American Tobacco Plc | 2 | |
| Siemens AG | 2 | |
| BHP Billiton Ltd. | 2 | |
| Unilever Plc | 2 | |
| Five Largest Industries | Percent of | |
| (Equity Investments) | Net Assets | |
| Oil, Gas & Consumable Fuels | 11% | |
| Metals & Mining | 9 | |
| Commercial Banks | 9 | |
| Electric Utilities | 7 | |
| Pharmaceuticals | 6 |
| For Fund compliance purposes, the Fund's industry classifications refer to any one or more of the industry sub-classifications used by one or more widely recognized market indexes or ratings group indexes, and/or as defined by Fund management. This definition may not apply for purposes of this report, which may combine such industry sub-classifications for reporting ease. These industry classifications are unaudited. |
4 BLACKROCK INTERNATIONAL VALUE FUND JUNE 30, 2008
| Total Return Based on a $10,000 Investment |
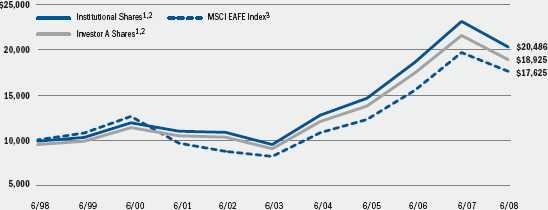
| 1 | Assuming maximum sales charge, if any, transaction costs and other operating expenses, including advisory fees. |
| 2 | The Fund invests primarily in stocks of companies located outside of the United States. |
| 3 | This unmanaged Index measures the total returns of developed foreign stock markets in Europe, Australasia and the Far East (in U.S. dollars). Past performance is not indicative of future results. |
| Performance Summary for the Period Ended June 30, 2008 | ||||||||||||||
| Average Annual Total Returns1 | ||||||||||||||
| 1 Year | 5 Years | 10 Years | ||||||||||||
| 6-Month | w/o sales | w/sales | w/o sales | w/sales | w/o sales | w/sales | ||||||||
| Total Returns | charge | charge | charge | charge | charge | charge | ||||||||
| Institutional | (11.71)% | (12.23)% | — | 16.31% | — | 7.43% | — | |||||||
| Investor A | (11.82) | (12.47) | (17.06)% | 16.00 | 14.76% | 7.16 | 6.59% | |||||||
| Investor B | (12.22) | (13.31) | (16.70) | 15.05 | 14.82 | 6.37 | 6.37 | |||||||
| Investor C | (12.24) | (13.32) | (14.07) | 15.04 | 15.04 | 6.36 | 6.36 | |||||||
| Class R | (11.96) | (12.76) | — | 15.72 | — | 6.95 | — | |||||||
| MSCI EAFE Index | (10.96) | (10.61) | — | 16.67 | — | 5.83 | — | |||||||
| 1 | Assuming maximum sales charges. See “About Fund Performance” on page 6 for a detailed description of share classes, including any related sales charges and fees. Past performance is not indicative of future results. |
| Expense Example | ||||||||||||
| Actual | Hypothetical2 | |||||||||||
| Beginning | Ending | Beginning | Ending | |||||||||
| Account Value | Account Value | Expenses Paid | Account Value | Account Value | Expenses Paid | |||||||
| January 1, 2008 | June 30, 2008 | During the Period1 | January 1, 2008 | June 30, 2008 | During the Period1 | |||||||
| Institutional | $1,000 | $882.90 | $ 5.38 | $1,000 | $1,019.18 | $ 5.77 | ||||||
| Investor A | $1,000 | $881.80 | $ 6.55 | $1,000 | $1,017.94 | $ 7.02 | ||||||
| Investor B | $1,000 | $877.80 | $10.93 | $1,000 | $1,013.26 | $11.71 | ||||||
| Investor C | $1,000 | $877.60 | $11.06 | $1,000 | $1,013.11 | $11.86 | ||||||
| Class R | $1,000 | $880.40 | $ 7.99 | $1,000 | $1,016.40 | $ 8.57 | ||||||
| 1 | For each class of the Fund, expenses are equal to the annualized expense ratio for the class (1.15% for Institutional, 1.40% for Investor A, 2.34% for Investor B, 2.37% for Investor C and 1.71% for Class R), multiplied by the average account value over the period, multiplied by 182/366 (to reflect the one-half year period shown). |
| 2 | Hypothetical 5% annual return before expenses is calculated by pro-rating the number of days in the most recent fiscal half year divided by 366. See “Disclosure of Expenses” on page 6 for further information on how expenses were calculated. |
| BLACKROCK INTERNATIONAL VALUE FUND |
| JUNE 30, 2008 |
| 5 |
About Fund Performance
•Institutional Sharesare not subject to any sales charge. Institutional
Shares bear no ongoing distribution or service fees and are available
only to eligible investors.
•Investor A Sharesincur a maximum initial sales charge (front-end load)
of 5.25% and a service fee of 0.25% per year (but no distribution fee).
•Investor B Shares are subject to a maximum contingent deferred sales
charge of 4.50% declining to 0% after six years. In addition, Investor B
Shares are subject to a distribution fee of 0.75% per year and a service
fee of 0.25% per year. These shares automatically convert to Investor A
Shares after approximately eight years. (There is no initial sales charge
for automatic share conversions.)
•Investor C Sharesare subject to a distribution fee of 0.75% per year
and a service fee of 0.25% per year. In addition, Investor C Shares are
subject to a 1% contingent deferred sales charge if redeemed within
one year of purchase.
•Class R Sharesdo not incur a maximum initial sales charge (front-end
load) or deferred sales charge. These shares are subject to a distribution
fee of 0.25% per year and a service fee of 0.25% per year. Class R
Shares are available only to certain retirement plans.
| The returns for Investor A, Investor B, Investor C and Class R Shares, prior to their respective inception dates (June 2, 1999, October 6, 2000, October 6, 2000 and January 3, 2003), are based upon performance of the Fund’s Institutional Shares. The returns for Investor A, Investor B, Investor C and Class R Shares, however, are adjusted to reflect the distribution and service (12b-1) fees applicable to each class of shares. Performance information reflects past performance and does not guarantee future results. Current performance may be lower or higher than the perform- ance data quoted. Refer to www.blackrock.com/funds to obtain performance data current to the most recent month-end. Performance results do not reflect the deduction of taxes that a shareholder would pay on fund distri- butions or the redemption of fund shares. The Fund may charge a 2% redemption fee for sales or exchanges of shares within 30 days of purchase or exchange. Performance data does not reflect this potential fee. Figures shown in the performance tables on page 5 assume reinvestment of all dividends and capital gain distributions, if any, at net asset value on the ex-dividend date. Investment return and principal value of shares will fluctuate so that shares, when redeemed, may be worth more or less than their original cost. Dividends paid to each class of shares will vary because of the different levels of service, distribution and transfer agency fees applicable to each class, which are deducted from the income available to be paid to shareholders. |
| Disclosure of Expenses Shareholders of this Fund may incur the following charges: (a) expenses related to transactions, including sales charges, redemption fees and exchange fees; and (b) operating expenses including advisory fees, distri- bution fees including 12b-1 fees, and other Fund expenses. The expense example on page 5 (which is based on a hypothetical investment of $1,000 invested on January 1, 2008 and held through June 30, 2008) is intended to assist shareholders both in calculating expenses based on an investment in the Fund and in comparing these expenses with similar costs of investing in other mutual funds. The table provides information about actual account values and actual expenses. In order to estimate the expenses a shareholder paid during the period covered by this report, shareholders can divide their account value by $1,000 and then multiply the result by the number corresponding to their share class under the heading entitled “Expenses Paid During the Period.” |
The table also provides information about hypothetical account values
and hypothetical expenses based on the Fund’s actual expense ratio and
an assumed rate of return of 5% per year before expenses. In order to
assist shareholders in comparing the ongoing expenses of investing in this
Fund and other funds, compare the 5% hypothetical example with the 5%
hypothetical examples that appear in other funds’ shareholder reports.
The expenses shown in the table are intended to highlight shareholders’
ongoing costs only and do not reflect any transactional expenses, such as
sales charges, redemption fees or exchange fees. Therefore, the hypotheti-
cal table is useful in comparing ongoing expenses only, and will not help
shareholders determine the relative total expenses of owning different
funds. If these transactional expenses were included, shareholder expenses
would have been higher.
6 BLACKROCK INTERNATIONAL VALUE FUND JUNE 30, 2008
| Portfolio Summary | ||
| As of June 30, 2008 | ||
| Percent of | ||
| Geographic Allocation | Long-Term Investments | |
| Japan | 22% | |
| United Kingdom | 17 | |
| Germany | 14 | |
| Switzerland | 11 | |
| France | 5 | |
| Australia | 5 | |
| Italy | 4 | |
| Netherlands | 3 | |
| Luxembourg | 3 | |
| Russia | 3 | |
| Spain | 2 | |
| Hong Kong | 2 | |
| Finland | 2 | |
| Norway | 2 | |
| South Korea | 1 | |
| Singapore | 1 | |
| China | 1 | |
| Mexico | 1 | |
| Brazil | 1 | |
| BLACKROCK INTERNATIONAL VALUE FUND |
| JUNE 30, 2008 |
| 7 |
| Schedule of Investments June 30, 2008 (Percentages shown are based on Net Assets) |
| Common Stocks | Shares | Value | ||
| Australia — 4.6% | ||||
| Construction & Engineering — 0.6% | ||||
| United Group Ltd. | 855,375 | $ 10,099,230 | ||
| Hotels, Restaurants & Leisure — 0.0% | ||||
| Octaviar Ltd. (a) | 6,244,159 | 60 | ||
| Metals & Mining — 4.0% | ||||
| BHP Billiton Ltd. | 941,735 | 40,080,651 | ||
| Newcrest Mining Ltd. | 231,485 | 6,424,409 | ||
| Rio Tinto Ltd. | 170,599 | 22,073,403 | ||
| 68,578,463 | ||||
| Total Common Stocks in Australia | 78,677,753 | |||
| Brazil — 0.8% | ||||
| Metals & Mining — 0.8% | ||||
| Companhia Vale do Rio Doce | ||||
| (Preference ‘A’ Shares) (b) | 432,000 | 12,890,880 | ||
| Total Common Stocks in Brazil | 12,890,880 | |||
| Canada — 0.0% | ||||
| Communications Equipment — 0.0% | ||||
| Nortel Networks Corp. (c) | 1,303 | 10,711 | ||
| Total Common Stocks in Canada | 10,711 | |||
| Cayman Islands — 0.3% | ||||
| Real Estate Management & Development — 0.3% | ||||
| Shimao Property Holdings Ltd. | 4,741,500 | 5,457,256 | ||
| Total Common Stocks in the Cayman Islands | 5,457,256 | |||
| China — 1.1% | ||||
| Commercial Banks — 0.6% | ||||
| Bank of China Ltd. | 21,908,000 | 9,757,646 | ||
| Oil, Gas & Consumable Fuels — 0.5% | ||||
| China Coal Energy Co. | 4,455,000 | 7,804,281 | ||
| Total Common Stocks in China | 17,561,927 | |||
| Finland — 1.8% | ||||
| Electric Utilities — 1.8% | ||||
| Fortum Oyj | 603,878 | 30,565,676 | ||
| Total Common Stocks in Finland | 30,565,676 | |||
| France — 5.2% | ||||
| Electric Utilities — 1.6% | ||||
| Electricite de France SA | 292,962 | 27,752,607 | ||
| Multi-Utilities — 1.5% | ||||
| Suez SA | 382,264 | 25,912,791 | ||
| Oil, Gas & Consumable Fuels — 2.1% | ||||
| Total SA | 416,363 | 35,440,247 | ||
| Total Common Stocks in France | 89,105,645 | |||
| Germany — 13.1% | ||||
| Air Freight & Logistics — 1.4% | ||||
| Deutsche Post AG | 939,835 | 24,538,322 | ||
| Chemicals — 2.0% | ||||
| Bayer AG | 418,240 | 35,190,066 | ||
| Diversified Telecommunication | ||||
| Services — 1.9% | ||||
| Deutsche Telekom AG | 1,967,342 | 32,245,250 | ||
| Common Stocks | Shares | Value | ||
| Germany (concluded) | ||||
| Electric Utilities — 3.3% | ||||
| E.ON AG | 285,912 | $ 57,624,047 | ||
| Industrial Conglomerates — 2.4% | ||||
| Siemens AG | 365,234 | 40,489,977 | ||
| Insurance — 2.1% | ||||
| Allianz AG Registered Shares | 206,147 | 36,262,006 | ||
| Total Common Stocks in Germany | 226,349,668 | |||
| Hong Kong — 1.8% | ||||
| Real Estate Management & | ||||
| Development — 1.8% | ||||
| Cheung Kong Holdings Ltd. | 1,689,000 | 22,840,373 | ||
| New World Development Ltd. | 3,909,000 | 7,984,461 | ||
| Total Common Stocks in Hong Kong | 30,824,834 | |||
| Italy — 4.0% | ||||
| Commercial Banks — 1.4% | ||||
| Unicredit SpA | 3,971,758 | 24,162,771 | ||
| Oil, Gas & Consumable Fuels — 2.6% | ||||
| Eni SpA | 1,203,962 | 44,727,685 | ||
| Total Common Stocks in Italy | 68,890,456 | |||
| Japan — 20.5% | ||||
| Auto Components — 1.4% | ||||
| Bridgestone Corp. | 1,036,600 | 15,902,450 | ||
| NOK Corp. | 491,800 | 7,826,668 | ||
| 23,729,118 | ||||
| Automobiles — 1.9% | ||||
| Toyota Motor Corp. | 707,000 | 33,373,234 | ||
| Building Products — 1.2% | ||||
| Nippon Sheet Glass Co., Ltd. | 4,315,000 | 21,386,292 | ||
| Chemicals — 1.8% | ||||
| Sumitomo Chemical Co., Ltd. | 4,978,000 | 31,361,807 | ||
| Commercial Banks — 2.2% | ||||
| Mizuho Financial Group, Inc. | 3,563 | 16,578,048 | ||
| Sumitomo Mitsui Financial Group, Inc. | 2,903 | 21,831,164 | ||
| 38,409,212 | ||||
| Computers & Peripherals — 1.2% | ||||
| Fujitsu Ltd. | 2,841,000 | 21,096,751 | ||
| Consumer Finance — 1.0% | �� | |||
| ORIX Corp. | 114,400 | 16,385,162 | ||
| Health Care Equipment & Supplies — 1.1% | ||||
| Olympus Corp. | 533,000 | 18,069,367 | ||
| Household Durables — 1.0% | ||||
| Sharp Corp. | 1,079,000 | 17,589,075 | ||
| Machinery — 0.9% | ||||
| Kubota Corp. | 2,255,000 | 16,206,439 | ||
| Office Electronics — 1.5% | ||||
| Ricoh Co., Ltd. | 1,404,000 | 25,411,467 | ||
| See Notes to Financial Statements. |
8 BLACKROCK INTERNATIONAL VALUE FUND
| JUNE 30, 2008 |
| Schedule of Investments (continued) (Percentages shown are based on Net Assets) |
| Common Stocks | Shares | Value | ||
| Japan (concluded) | ||||
| Pharmaceuticals — 1.5% | ||||
| Takeda Pharmaceutical Co., Ltd. | 493,900 | $ 25,119,503 | ||
| Trading Companies & Distributors — 2.3% | ||||
| Itochu Corp. | 2,345,000 | 25,001,845 | ||
| Sojitz Corp. | 4,307,100 | 14,367,862 | ||
| 39,369,707 | ||||
| Wireless Telecommunication | ||||
| Services — 1.5% | ||||
| KDDI Corp. | 4,274 | 26,445,048 | ||
| Total Common Stocks in Japan | 353,952,182 | |||
| Luxembourg — 2.8% | ||||
| Metals & Mining — 2.8% | ||||
| ArcelorMittal | 376,176 | 36,968,704 | ||
| Ternium SA (b) | 290,164 | 12,186,888 | ||
| Total Common Stocks in Luxembourg | 49,155,592 | |||
| Mexico — 1.0% | ||||
| Wireless Telecommunication Services — 1.0% | ||||
| America Movil, SA de CV (b) | 322,529 | 17,013,405 | ||
| Total Common Stocks in Mexico | 17,013,405 | |||
| Netherlands — 2.9% | ||||
| Chemicals — 1.9% | ||||
| Akzo Nobel NV | 480,869 | 32,907,730 | ||
| Diversified Financial Services — 1.0% | ||||
| Fortis | 1,070,491 | 17,025,288 | ||
| Total Common Stocks in the Netherlands | 49,933,018 | |||
| Norway — 1.5% | ||||
| Commercial Banks — 1.5% | ||||
| DnB NOR ASA | 2,054,572 | 26,101,585 | ||
| Total Common Stocks in Norway | 26,101,585 | |||
| Russia — 2.5% | ||||
| Oil, Gas & Consumable Fuels — 2.5% | ||||
| LUKOIL (b) | 208,739 | 20,581,665 | ||
| OAO Gazprom (b) | 379,064 | 22,034,460 | ||
| Total Common Stocks in Russia | 42,616,125 | |||
| Singapore — 1.0% | ||||
| Commercial Banks — 1.0% | ||||
| United Overseas Bank Ltd. | 1,290,000 | 17,709,489 | ||
| Total Common Stocks in Singapore | 17,709,489 | |||
| South Korea — 1.4% | ||||
| Construction & Engineering — 0.2% | ||||
| Hyundai Development Co. | 78,976 | 3,998,672 | ||
| Insurance — 0.5% | ||||
| Dongbu Insurance Co., Ltd. | 245,570 | 9,006,193 | ||
| Semiconductors & Semiconductor | ||||
| Equipment — 0.7% | ||||
| Samsung Electronics Co., Ltd. | 19,895 | 11,886,037 | ||
| Total Common Stocks in South Korea | 24,890,902 | |||
| Common Stocks | Shares | Value | ||||
| Spain — 1.9% | ||||||
| Commercial Banks — 1.9% | ||||||
| Banco Santander SA | 1,763,866 | $ 32,180,208 | ||||
| Total Common Stocks in Spain | 32,180,208 | |||||
| Switzerland — 10.6% | ||||||
| Capital Markets — 1.4% | ||||||
| Credit Suisse Group AG | 544,396 | 24,779,274 | ||||
| Diversified Telecommunication | ||||||
| Services — 1.4% | ||||||
| Swisscom AG | 74,740 | 24,893,186 | ||||
| Food Products — 3.3% | ||||||
| Nestle SA Registered Shares | 1,279,400 | 57,655,741 | ||||
| Insurance — 1.8% | ||||||
| Zurich Financial Services AG | 121,636 | 30,999,508 | ||||
| Pharmaceuticals — 2.7% | ||||||
| Novartis AG Registered Shares | 831,296 | 45,748,045 | ||||
| Total Common Stocks in Switzerland | 184,075,754 | |||||
| United Kingdom — 16.6% | ||||||
| Aerospace & Defense — 2.1% | ||||||
| BAE Systems Plc | 4,143,753 | 36,370,969 | ||||
| Food Products — 2.2% | ||||||
| Unilever Plc | 1,347,178 | 38,275,808 | ||||
| Metals & Mining — 1.8% | ||||||
| Anglo American Plc | 441,446 | 31,004,370 | ||||
| Oil, Gas & Consumable Fuels — 3.0% | ||||||
| Royal Dutch Shell Plc Class B | 1,311,610 | 52,520,897 | ||||
| Pharmaceuticals — 1.9% | ||||||
| GlaxoSmithKline Plc | 1,483,486 | 32,793,577 | ||||
| Tobacco — 2.4% | ||||||
| British American Tobacco Plc | 1,185,565 | 40,894,650 | ||||
| Wireless Telecommunication | ||||||
| Services — 3.2% | ||||||
| Vodafone Group Plc | 18,625,211 | 54,875,636 | ||||
| Total Common Stocks in the United Kingdom | 286,735,907 | |||||
| Total Common Stocks | ||||||
| (Cost — $1,553,246,795) — 95.4% | 1,644,698,973 | |||||
| Beneficial | ||||||
| Interest | ||||||
| Short-Term Securities | (000) | |||||
| BlackRock Liquidity Series, LLC | ||||||
| Cash Sweep Series, 2.56% (d)(e) | $ 20,798 | 20,797,911 | ||||
| Total Short-Term Securities | ||||||
| (Cost — $20,797,911) — 1.2% | 20,797,911 | |||||
| Total Investments (Cost — $1,574,044,706*) — 96.6% | 1,665,496,884 | |||||
| Other Assets Less Liabilities — 3.4% | 58,542,812 | |||||
| Net Assets — 100.0% | $ 1,724,039,696 | |||||
| See Notes to Financial Statements. |
| BLACKROCK INTERNATIONAL VALUE FUND |
| JUNE 30, 2008 |
| 9 |
| Schedule of Investments (concluded) |
* The cost and unrealized appreciation (depreciation) of investments as of June
30, 2008, as computed for federal income tax purposes, were as follows:
| Aggregate cost | $ 1,582,845,149 | |
| Gross unrealized appreciation | $ 212,785,655 | |
| Gross unrealized depreciation | (130,133,920) | |
| Net unrealized appreciation | $ 82,651,735 | |
| (a) Security is fair valued. (b) Depositary receipts. (c) Non-income producing security. (d) Investments in companies considered to be an affiliate of the Fund, for purposes of Section 2(a)(3) of the Investment Company Act of 1940, were as follows: |
| Net | ||||
| Activity | Interest | |||
| Affiliate | (000) | Income | ||
| BlackRock Liquidity Series, LLC | ||||
| Cash Sweep Series | $(18,904) | $1,506,261 | ||
(e) Represents the current yield as of report date.
• For Fund compliance purposes,the Fund's industry classifications refer to any
one or more of the industry sub-classifications used by one or more widely
recognized market indexes or ratings group indexes, and/or as defined by Fund
management. This definition may not apply for purposes of this report, which
may combine such industry sub-classifications for reporting ease. These industry
classifications are unaudited.
• Forward foreign currency contracts as of June 30,2008 were as follows:
| Unrealized | ||||||||||
| Currency | Currency | Settlement | Appreciation | |||||||
| Purchased | Sold | Date | (Depreciation) | |||||||
| AUD | 37,202,031 | $ 35,069,983 | 9/12/08 | $ 243,147 | ||||||
| EUR | 34,365,850 | $ 53,110,359 | 9/12/08 | 789,956 | ||||||
| GBP | 27,517,323 | $ 53,110,359 | 9/12/08 | 1,385,214 | ||||||
| SGD | 34,230,983 | $ 25,184,655 | 9/12/08 | 63,380 | ||||||
| $ 52,427,510 | EUR | 34,365,850 | 9/12/08 | (1,472,805) | ||||||
| $ 114,598,434 | GBP | 58,736,800 | 9/12/08 | (1,724,496) | ||||||
| Total Unrealized Depreciation on | ||||||||||
| Forward Foreign Currency Contracts | $ (715,604) | |||||||||
| • Currency Abbreviations: | ||
| AUD | Australian Dollar | |
| EUR | Euro | |
| GBP | British Pound | |
| SGD | Singapore Dollar | |
| See Notes to Financial Statements. |
10 BLACKROCK INTERNATIONAL VALUE FUND JUNE 30, 2008
| Statement of Assets and Liabilities | ||
| June 30, 2008 | ||
| Assets | ||
| Investments at value — unaffiliated (cost — $1,553,246,795) | $1,644,698,973 | |
| Investments at value — affiliated (cost — $20,797,911) | 20,797,911 | |
| Unrealized appreciation on forward foreign currency contracts | 2,481,697 | |
| Foreign currency at value (cost — $53,430,595) | 54,211,662 | |
| Dividends receivable | 12,814,077 | |
| Capital shares sold receivable | 1,277,126 | |
| Prepaid expenses | 72,334 | |
| Other assets | 1,708,094 | |
| Total assets | 1,738,061,874 | |
| Liabilities | ||
| Unrealized depreciation on forward foreign currency contracts | 3,197,301 | |
| Investments purchased payable | 3,527,936 | |
| Capital shares redeemed payable | 4,321,276 | |
| Investment advisory fees payable | 1,100,714 | |
| Other affiliates payable | 799,353 | |
| Distribution fees payable | 374,978 | |
| Officer’s and Trustees’ fees payable | 1,200 | |
| Other accrued expenses payable | 699,420 | |
| Total liabilities | 14,022,178 | |
| Net Assets | ||
| Net assets | $1,724,039,696 | |
| Net Assets Consist of | ||
| Paid-in capital in excess of par, unlimited shares of no par value authorized | $1,617,415,090 | |
| Undistributed net investment income | 19,526,662 | |
| Accumulated net realized gain | (5,495,063) | |
| Net unrealized appreciation/depreciation | 92,593,007 | |
| Net assets | $1,724,039,696 | |
| Net Asset Value | ||
| Institutional — Based on net assets of $1,007,433,149 and 38,742,065 shares outstanding | $ 26.00 | |
| Investor A — Based on net assets of $320,764,226 and 12,389,555 shares outstanding | $ 25.89 | |
| Investor B — Based on net assets of $61,007,334 and 2,413,688 shares outstanding | $ 25.28 | |
| Investor C — Based on net assets of $262,573,154 and 10,529,672 shares outstanding | $ 24.94 | |
| Class R — Based on net assets of $72,261,833 and 2,821,397 shares outstanding | $ 25.61 | |
| See Notes to Financial Statements. |
| BLACKROCK INTERNATIONAL VALUE FUND |
| JUNE 30, 2008 |
| 11 |
| Statement of Operations | ||
| Year Ended June 30, 2008 | ||
| Investment Income | ||
| Dividends (net of $6,006,558 foreign withholding tax) | $ 53,760,594 | |
| Interest (including $1,506,261 from affiliates) | 1,726,782 | |
| Total income | 55,487,376 | |
| Expenses | ||
| Investment advisory | 14,371,600 | |
| Service — Investor A | 889,873 | |
| Service and distribution — Investor B | 765,486 | |
| Service and distribution — Investor C | 3,016,438 | |
| Service and distribution — Class R | 361,391 | |
| Transfer agent — Institutional | 2,196,339 | |
| Transfer agent — Investor A | 890,612 | |
| Transfer agent — Investor B | 358,268 | |
| Transfer agent — Investor C | 1,442,122 | |
| Transfer agent — Class R | 222,591 | |
| Custodian | 708,987 | |
| Accounting services | 524,515 | |
| Printing | 176,349 | |
| Registration | 99,269 | |
| Professional | 98,493 | |
| Officer and Trustees | 68,574 | |
| Miscellaneous | 97,925 | |
| Total expenses | 26,288,832 | |
| Net investment income | 29,198,544 | |
| Realized and Unrealized Gain (Loss) | ||
| Net realized gain (loss) from: | ||
| Investments | 123,911,929 | |
| Foreign currency | (3,962,835) | |
| 119,949,094 | ||
| Net change in unrealized appreciation/depreciation on: | ||
| Investments | (398,562,671) | |
| Foreign currency | 987,326 | |
| (397,575,345) | ||
| Total realized and unrealized loss | (277,626,251) | |
| Net Decrease in Net Assets Resulting from Operations | $ (248,427,707) | |
| See Notes to Financial Statements. |
12 BLACKROCK INTERNATIONAL VALUE FUND
| JUNE 30, 2008 |
| Statements of Changes in Net Assets | ||||
| Year Ended | ||||
| June 30, | ||||
| Increase (Decrease) in Net Assets: | 2008 | 2007 | ||
| Operations | ||||
| Net investment income | $ 29,198,544 | $ 36,759,064 | ||
| Net realized gain | 119,949,094 | 204,316,933 | ||
| Net change in unrealized appreciation/depreciation | (397,575,345) | 163,363,302 | ||
| Net increase (decrease) in net assets resulting from operations | (248,427,707) | 404,439,299 | ||
| Dividends and Distributions to Shareholders From | ||||
| Net investment income: | ||||
| Institutional | (24,308,269) | (29,815,327) | ||
| Investor A | (6,530,767) | (8,496,598) | ||
| Investor B | (1,130,214) | (1,632,772) | ||
| Investor C | (4,445,860) | (5,402,216) | ||
| Class R | (1,218,803) | (1,030,544) | ||
| Net realized gain: | ||||
| Institutional | (144,017,293) | (64,289,079) | ||
| Investor A | (45,810,501) | (19,979,543) | ||
| Investor B | (10,160,625) | (5,329,305) | ||
| Investor C | (38,928,559) | (17,097,391) | ||
| Class R | (9,071,016) | (2,572,250) | ||
| Decrease in net assets resulting from dividends and distributions to shareholders | (285,621,907) | (155,645,025) | ||
| Capital Share Transactions | ||||
| Net increase in net assets derived from capital share transactions | 130,155,557 | 236,827,075 | ||
| Redemption Fee | ||||
| Redemption fee | 16,463 | 19,006 | ||
| Net Assets | ||||
| Total increase (decrease) in net assets | (403,877,594) | 485,640,355 | ||
| Beginning of year | 2,127,917,290 | 1,642,276,935 | ||
| End of year | $1,724,039,696 | $2,127,917,290 | ||
| End of year undistributed net investment income | $ 19,526,662 | $ 16,366,217 | ||
| See Notes to Financial Statements. |
| BLACKROCK INTERNATIONAL VALUE FUND |
| JUNE 30, 2008 |
| 13 |
| Financial Highlights | ||||||||||||||||||||||||
| Institutional | Investor A | |||||||||||||||||||||||
| Year Ended June 30, | Year Ended June 30, | |||||||||||||||||||||||
| 2008 | 2007 | 2006 | 2005 | 2004 | 2008 | 2007 | 2006 | 2005 | 2004 | |||||||||||||||
| Per Share Operating Performance | ||||||||||||||||||||||||
| Net asset value, beginning of year | $ 34.48 $ | 30.55 | $ 26.41 | $ 23.54 | $ 18.03 | $ 34.33 | $30.44 | $ 26.33 | $ 23.48 | $ 17.98 | ||||||||||||||
| Net investment income1 | 0.55 | 0.71 | 0.56 | 0.52 | 0.31 | 0.46 | 0.62 | 0.49 | 0.50 | 0.25 | ||||||||||||||
| Net realized and unrealized gain (loss) | (4.30)2 | 6.102 | 6.192 | 2.832 | 5.71 | (4.28)2 | 6.082 | 6.162 | 2.772 | 5.70 | ||||||||||||||
| Net increase (decrease) from | ||||||||||||||||||||||||
| investment operations | (3.75) | 6.81 | 6.75 | 3.35 | 6.02 | (3.82) | 6.70 | 6.65 | 3.27 | 5.95 | ||||||||||||||
| Dividends and distributions from: | ||||||||||||||||||||||||
| Net investment income | (0.68) | (0.90) | (0.62) | (0.48) | (0.51) | (0.59) | (0.83) | (0.55) | (0.42) | (0.45) | ||||||||||||||
| Net realized gain | (4.05) | (1.98) | (1.99) | — | — | (4.03) | (1.98) | (1.99) | — | — | ||||||||||||||
| Total dividends and distributions | (4.73) | (2.88) | (2.61) | (0.48) | (0.51) | (4.62) | (2.81) | (2.54) | (0.42) | (0.45) | ||||||||||||||
| Net asset value, end of year | $ 26.00 $ | 34.48 | $ 30.55 | $ 26.41 | $ 23.54 | $ 25.89 $ | 34.33 | $ 30.44 | $ 26.33 | $ 23.48 | ||||||||||||||
| Total Investment Return3 | ||||||||||||||||||||||||
| Based on net asset value | (12.23)% | 24.20% | 27.18%4 | 14.59% | 34.00% | (12.47)% | 23.84% | 26.84%4 | 14.29% | 33.67% | ||||||||||||||
| Ratios to Average Net Assets | ||||||||||||||||||||||||
| Total expenses | 1.04% | 1.01% | 1.02% | 1.08% | 1.08% | 1.34% | 1.30% | 1.27% | 1.33% | 1.33% | ||||||||||||||
| Net investment income | 1.86% | 2.27% | 1.97% | 2.07% | 1.47% | 1.55% | 1.98% | 1.75% | 1.94% | 1.20% | ||||||||||||||
| Supplemental Data | ||||||||||||||||||||||||
| Net assets, end of year (000) | $1,007,433 $1,253,724 | $961,207 | $800,990 | $559,530 | $320,764 $390,547 | $320,926 | $254,207 | $ 42,238 | ||||||||||||||||
| Portfolio turnover | 122% | 65% | 81% | 70% | 75% | 122% | 65% | 81% | 70% | 75% | ||||||||||||||
| 1 | Based on average shares outstanding. |
| 2 | Includes a redemption fee, which is less than $0.01 per share. |
| 3 | Total investment returns exclude the effect of any sales charges. |
| 4 | A portion of total investment return consists of payments by the previous investment advisor in order to resolve a regulatory issue relating to an investment, which increased the return of the Fund’s Institutional and Investor A Shares by 0.21% and 0.17%, respectively. |
| See Notes to Financial Statements. |
14 BLACKROCK INTERNATIONAL VALUE FUND
| JUNE 30, 2008 |
| Financial Highlights (continued) | ||||||||||||||||||||||||||||
| Investor B | Investor C | |||||||||||||||||||||||||||
| Year Ended June 30, | Year Ended June 30, | |||||||||||||||||||||||||||
| 2008 | 2007 | 2006 | 2005 | 2004 | 2008 | 2007 | 2006 | 2005 | 2004 | |||||||||||||||||||
| Per Share Operating Performance | ||||||||||||||||||||||||||||
| Net asset value, beginning of year | $ 33.60 | $ 29.88 | $ 25.94 | $ 23.24 | $ 17.84 | $ 33.24 | $ 29.59 | $ 25.72 | $ 23.09 | $ 17.70 | ||||||||||||||||||
| Net investment income1 | 0.14 | 0.34 | 0.26 | 0.32 | 0.17 | 0.16 | 0.35 | 0.28 | 0.37 | 0.29 | ||||||||||||||||||
| Net realized and unrealized gain (loss) | (4.16)2 | 5.962 | 6.072 | 2.742 | 5.57 | (4.13)2 | 5.902 | 5.992 | 2.652 | 5.41 | ||||||||||||||||||
| Net increase (decrease) from | ||||||||||||||||||||||||||||
| investment operations | (4.02) | 6.30 | 6.33 | 3.06 | 5.74 | (3.97) | 6.25 | 6.27 | 3.02 | 5.70 | ||||||||||||||||||
| Dividends and distributions from: | ||||||||||||||||||||||||||||
| Net investment income | (0.43) | (0.60) | (0.40) | (0.36) | (0.34) | (0.45) | (0.62) | (0.41) | (0.39) | (0.31) | ||||||||||||||||||
| Net realized gain | (3.87) | (1.98) | (1.99) | — | — | (3.88) | (1.98) | (1.99) | — | — | ||||||||||||||||||
| Total dividends and distributions | (4.30) | (2.58) | (2.39) | (0.36) | (0.34) | (4.33) | (2.60) | (2.40) | (0.39) | (0.31) | ||||||||||||||||||
| Net asset value, end of year | $ 25.28 | $ 33.60 | $ 29.88 | $ 25.94 | $ 23.24 | $ 24.94 | $ 33.24 | $ 29.59 | $ 25.72 | $ 23.09 | ||||||||||||||||||
| Total Investment Return3 | ||||||||||||||||||||||||||||
| Based on net asset value | (13.31)% | 22.78% | 25.84%4 | 13.45% | 32.65% | (13.32)% | 22.82% | 25.86%4 | 13.41% | 32.58% | ||||||||||||||||||
| Ratios to Average Net Assets | ||||||||||||||||||||||||||||
| Total expenses | 2.30% | 2.15% | 2.06% | 2.12% | 2.11% | 2.31% | 2.15% | 2.06% | 2.12% | 2.14% | ||||||||||||||||||
| Net investment income | 0.47% | 1.11% | .95% | 1.27% | 0.81% | 0.55% | 1.15% | 1.01% | 1.45% | 1.38% | ||||||||||||||||||
| Supplemental Data | ||||||||||||||||||||||||||||
| Net assets, end of year (000) | $ 61,007 | $ 90,447 | $ 79,165 | $ 62,261 | $ 19,852 | $262,573 | $332,940 | $244,931 | $164,317 | $ 38,608 | ||||||||||||||||||
| Portfolio turnover | 122% | 65% | 81% | 70% | 75% | 122% | 65% | 81% | 70% | 75% | ||||||||||||||||||
| 1 | Based on average shares outstanding. |
| 2 | Includes a redemption fee, which is less than $0.01 per share. |
| 3 | Total investment returns exclude the effect of sales charges. |
| 4 | A portion of total investment return consists of payments by the previous investment advisor in order to resolve a regulatory issue relating to an investment, which increased the return of the Fund’s Investor B and Investor C Shares by 0.21% and 0.17%, respectively. |
| See Notes to Financial Statements. |
| BLACKROCK INTERNATIONAL VALUE FUND |
| JUNE 30, 2008 |
| 15 |
| Financial Highlights (concluded) | ||||||||||||
| Class R | ||||||||||||
| Year Ended June 30, | ||||||||||||
| 2008 | 2007 | 2006 | 2005 | 2004 | ||||||||
| Per Share Operating Performance | ||||||||||||
| Net asset value, beginning of year | $ 34.06 | $ 30.24 | $ 26.19 | $ 23.39 | $ 17.98 | |||||||
| Net investment income1 | 0.39 | 0.55 | 0.50 | 0.50 | 0.52 | |||||||
| Net realized and unrealized gain (loss) | (4.27)2 | 6.022 | 6.042 | 2.702 | 5.38 | |||||||
| Net increase (decrease) from investment operations | (3.88) | 6.57 | 6.54 | 3.20 | 5.90 | |||||||
| Dividends and distributions from: | ||||||||||||
| Net investment income | (0.57) | (0.77) | (0.50) | (0.40) | (0.49) | |||||||
| Net realized gain | (4.00) | (1.98) | (1.99) | — | — | |||||||
| Total dividends and distributions | (4.57) | (2.75) | (2.49) | (0.40) | (0.49) | |||||||
| Net asset value, end of year | $ 25.61 | $ 34.06 | $ 30.24 | $ 26.19 | $ 23.39 | |||||||
| Total Investment Return | ||||||||||||
| Based on net asset value | (12.76)% | 23.53% | 26.52%3 | 14.03% | 33.43% | |||||||
| Ratios to Average Net Assets | ||||||||||||
| Total expenses | 1.65% | 1.57% | 1.52% | 1.58% | 1.60% | |||||||
| Net investment income | 1.35% | 1.78% | 1.76% | 1.96% | 2.34% | |||||||
| Supplemental Data | ||||||||||||
| Net assets, end of year (000) | $ 72,262 | $ 60,258 | $ 36,048 | $ 16,951 | $ 5,905 | |||||||
| Portfolio turnover | 122% | 65% | 81% | 70% | 75% | |||||||
| 1 | Based on average shares outstanding. |
| 2 | Includes a redemption fee, which is less than $0.01 per share. |
| 3 | A portion of total investment return consists of payments by the previous investment advisor in order to resolve a regulatory issue relating to an investment, which increased the return of the Fund’s Class R Shares by 0.16%. |
| See Notes to Financial Statements. |
16 BLACKROCK INTERNATIONAL VALUE FUND
| JUNE 30, 2008 |
| Notes to Financial Statements 1. Significant Accounting Policies: BlackRock International Value Fund (the “Fund”), a series of BlackRock International Value Trust (the “Trust”), is registered under the Investment Company Act of 1940, as amended (the “1940 Act”), as a diversified, open-end management investment company. The Fund’s financial state- ments are prepared in conformity with accounting principles generally accepted in the United States of America, which may require the use of management accruals and estimates. Actual results may differ from these estimates. The Fund offers multiple classes of shares. Institutional Shares are sold without a sales charge and only to certain eligible investors. Investor A Shares are generally sold with a front-end sales charge. Investor B and Investor C Shares may be subject to a contingent deferred sales charge. Class R Shares are sold only to certain retirement plans. All classes of shares have identical voting, dividend, liquidation and other rights and the same terms and conditions, except that Investor A, Investor B, Investor C and Class R Shares bear certain expenses relat- ed to the shareholder servicing of such shares, and Investor B, Investor C and Class R Shares also bear certain expenses related to the distribu- tion of such shares. Each class has exclusive voting rights with respect to matters relating to its shareholder servicing and distribution expendi- tures (except that Investor B shareholders may vote on material changes to the Investor A distribution plan). The following is a summary of significant accounting policies followed by the Fund: Valuation of Investments: Equity investments traded on a recognized securities exchange or the NASDAQ Global Market System are valued at the last reported sale price that day or the NASDAQ official closing price, if applicable. For equity investments traded on more than one exchange, the last reported sale price on the exchange where the stock is primarily traded is used. Equity investments traded on a recognized exchange for which there were no sales on that day are valued at the last available bid price. If no bid or ask price is available, the prior day’s price will be used, unless it is determined that such prior day’s price no longer reflects the fair value of the security. Investments in open-end investment companies are valued at net asset value each business day. Short-term securities are valued at amortized cost. In the event that application of these methods of valuation results in a price for an investment which is deemed not to be representative of the market value of such investment, the investment will be valued by a method approved by the Board of Trustees (the “Board”) as reflecting fair value (“Fair Value Assets”). When determining the price for Fair Value Assets, the investment advisor and/or sub-advisor seeks to determine |
| the price that the Fund might reasonably expect to receive from the cur- rent sale of that asset in an arm’s-length transaction. Fair value determi- nations shall be based upon all available factors that the investment advisor and/or sub-advisor deems relevant. The pricing of all Fair Value Assets is subsequently reported to the Board or a committee thereof. Generally, trading in foreign securities is substantially completed each day at various times prior to the close of business on the New York Stock Exchange (“NYSE”). The values of such securities used in comput- ing the net assets of the Fund are determined as of such times. Foreign currency exchange rates will generally be determined as of the close of business on the NYSE. Occasionally, events affecting the values of such securities and such exchange rates may occur between the times at which they are determined and the close of business on the NYSE that may not be reflected in the computation of the Fund’s net assets. If events (for example, a company announcement, market volatility or a natural disaster) occur during such periods that are expected to materi- ally affect the value of such securities, those securities will be valued at their fair value as determined in good faith by the Board or by the investment advisor using a pricing service and/or procedures approved by the Board. Derivative Financial Instruments: The Fund may engage in various portfolio investment strategies to increase the return of the Fund and to hedge, or protect, its exposure to interest rate movements and move- ments in the securities markets. Losses may arise if the value of the con- tract decreases due to an unfavorable change in the price of the under- lying security, or if the counterparty does not perform under the contract. •Forward foreign currency contracts — The Fund may enter into for- ward foreign currency contracts as a hedge against either specific transactions or portfolio positions. Forward foreign currency con- tracts, when used by the Fund, help to manage the overall exposure to the foreign currency backing some of the investments held by the Fund. The contract is marked-to-market daily and the change in market value is recorded by the Fund as an unrealized gain or loss. When the contract is closed, the Fund records a realized gain or loss equal to the difference between the value at the time it was opened and the value at the time it was closed. Foreign Currency Transactions: Foreign currency amounts are translated into United States dollars on the following basis: (i) market value of investment securities, assets and liabilities at the current rate of exchange; and (ii) purchases and sales of investment securities, income and expenses at the rates of exchange prevailing on the respective dates of such transactions. |
| BLACKROCK INTERNATIONAL VALUE FUND |
| JUNE 30, 2008 |
| 17 |
| Notes to Financial Statements (continued) The Fund reports foreign currency related transactions as components of realized gains for financial reporting purposes, whereas such compo- nents are treated as ordinary income for federal income tax purposes. Investment Transactions and Investment Income: Investment transac- tions are recorded on the dates the transactions are entered into (the trade dates). Realized gains and losses on security transactions are determined on the identified cost basis. Dividend income is recorded on the ex-dividend dates. Dividends from foreign securities where the ex-dividend date may have passed are subsequently recorded when the Fund has determined the ex-dividend date. Interest income is recognized on the accrual basis. Income and realized and unrealized gains and losses are allocated daily to each class based on its relative net assets. Dividends and Distributions: Dividends and distributions paid by the Fund are recorded on the ex-dividend dates. Federal Income Taxes: It is the Fund’s policy to comply with the require- ments of the Internal Revenue Code applicable to regulated investment companies and to distribute substantially all of its taxable income to its shareholders. Therefore, no federal income tax provision is required. Under the applicable foreign tax laws, a withholding tax may be imposed on interest, dividends and capital gains at various rates. Effective December 31, 2007, the Fund implemented Financial Accounting Standards Board (“FASB”) Interpretation No. 48, “Accounting for Uncertainty in Income Taxes — an interpretation of FASB Statement No. 109” (“FIN 48”). FIN 48 prescribes the minimum recognition thresh- old a tax position must meet in connection with accounting for uncer- tainties in income tax positions taken or expected to be taken by an entity, including investment companies, before being measured and rec- ognized in the financial statements. The investment advisor has evaluat- ed the application of FIN 48 to the Fund, and has determined that the adoption of FIN 48 does not have a material impact on the Fund’s finan- cial statements. The Fund files U.S. federal and various state and local tax returns. No income tax returns are currently under examination. The statute of limitations on the Fund’s tax returns remains open for the years ended June 30, 2005 through June 30, 2007. The statutes of limi- tations on the Fund’s state and local tax returns may remain open for an additional year depending upon the jurisdiction. |
| Recent Accounting Pronouncements: In September 2006, Statement of Financial Accounting Standards No. 157, “Fair Value Measurements” (“FAS 157”), was issued and is effective for fiscal years beginning after November 15, 2007. FAS 157 defines fair value, establishes a frame- work for measuring fair value and expands disclosures about fair value measurements. The impact the Fund’s financial statement disclosures, if any, is currently being assessed. In addition, in February 2007, Statement of Financial Accounting Standards No. 159, “The Fair Value Option for Financial Assets and Financial Liabilities” (“FAS 159”), was issued and is effective for fiscal years beginning after November 15, 2007. FAS 159 permits entities to choose to measure many financial instruments and certain other items at fair value that are not currently required to be measured at fair value. FAS 159 also establishes presentation and disclosure requirements designed to facilitate comparisons between entities that choose different measurement attributes for similar types of assets and liabilities. The impact of the Fund’s financial statement disclosures, if any, is currently being assessed. In March 2008, Statement of Financial Accounting Standards No. 161, “Disclosures about Derivative Instruments and Hedging Activities — an amendment of FASB Statement No. 133” (“FAS 161”) was issued and is effective for fiscal years beginning after November 15, 2008. FAS 161 is intended to improve financial reporting for derivative instruments by requiring enhanced disclosure that enables investors to understand how and why an entity uses derivatives, how derivatives are accounted for, and how derivative instruments affect an entity’s results of operations and financial position. The impact of the Fund’s financial statement dis- closures, if any, are currently being assessed. Other: Expenses directly related to the Fund or its classes are charged to that Fund or class. Other operating expenses shared by several funds are pro-rated among those funds on the basis of relative net assets or other appropriate methods. Other expenses of the Fund are allocated daily to each class based on its relative net assets 2. Investment Advisory Agreement and Other Transactions with Affiliates: The Fund has entered into an Investment Advisory Agreement with BlackRock Advisors, LLC (the “Advisor”), an indirect, wholly owned sub- sidiary of BlackRock, Inc., to provide investment advisory and adminis- tration services. Merrill Lynch & Co. Inc. (“Merrill Lynch”) and The PNC Financial Services Group, Inc. (“PNC”) are principal owners of BlackRock, Inc. |
18 BLACKROCK INTERNATIONAL VALUE FUND
| JUNE 30, 2008 |
| Notes to Financial Statements (continued) The Advisor is responsible for the management of the Fund’s portfolio and provides the necessary personnel, facilities, equipment and certain other services necessary to the operations of the Fund. For such serv- ices, the Fund pays the Advisor a monthly fee of 0.75%, on an annual basis, of the average daily value of the Fund’s net assets not exceeding $2 billion, 0.70% of the average daily value of the Fund’s net assets in excess of $2 billion but not exceeding $4 billion and 0.65% of the aver- age daily value of Fund’s net assets in excess of $4 billion. The Advisor has entered into a separate sub-advisory agreement with BlackRock Investment Management International Limited, an affiliate of the Advisor, under which the Advisor pays the sub-advisor for services it provides, a monthly fee that is a percentage of the investment advisory fee paid by the Fund to the Advisor. For the year ended June 30, 2008, the Fund reimbursed the Advisor $36,528 for certain accounting services, which is included in accounting services in the Statement of Operations. The Fund has entered into separate Distribution Agreements and Distribution Plans with FAM Distributors, Inc. (“FAMD”) and BlackRock Distributors, Inc. and its affiliates (“BDI”) (collectively, the “Distributor”). FAMD is a wholly owned subsidiary of Merrill Lynch Group, Inc., and BDI is an affiliate of BlackRock, Inc. Pursuant to the Distribution Plans adopted by the Fund in accordance with Rule 12b-1 under the 1940 Act, the Fund pays the Distributor ongoing service and distribution fees. The fees are accrued daily and paid monthly at annual rates based upon the average daily net assets of the shares as follows: |
| Service | Distribution | |||
| Fee | Fee | |||
| Investor A | 0.25% | — | ||
| Investor B | 0.25% | 0.75% | ||
| Investor C | 0.25% | 0.75% | ||
| Class R | 0.25% | 0.25% | ||
| Pursuant to sub-agreements with the Distributor, broker-dealers, includ- ing Merrill Lynch, Pierce, Fenner & Smith Incorporated (“MLPF&S”), a wholly owned subsidiary of Merrill Lynch, and the Distributor provide shareholder servicing and distribution services to the Fund. The on- going service fee and/or distribution fee compensates the Distributor and each broker-dealer for providing shareholder servicing and/or distribution-related services to Investor A, Investor B, Investor C and Class R shareholders. |
| In addition, MLPF&S received $6,356 in commissions on the execution of portfolio security transactions for the Fund for the year ended June 30, 2008. For the year ended June 30, 2008, the affiliates earned underwriting discounts, direct commissions and dealer concessions on sales of the Fund’s Investor A Shares, totaling $211,136, and the affiliates received contingent deferred sales charges of $31,790 and $23,300 relating to transactions in Investor B and Investor C Shares, respectively. Further- more, affiliates received contingent deferred sales charges of $5,275 relating to transactions subject to front-end sales charge waivers in Investor A Shares. These amounts include payments to Hilliard Lyons, which was considered an affiliate for a portion of the year. Pursuant to written agreements, certain affiliates provide the Fund with sub-accounting, recordkeeping, sub-transfer agency and other adminis- trative services with respect to sub-accounts they service. For these services, these affiliates receive an annual fee per shareholder account which will vary depending on share class. For the year ended June 30, 2008, the Fund paid $3,309,259 in return for these services. PNC Global Investment Servicing (U.S.) Inc., formerly PFPC Inc., an indirect, wholly owned subsidiary of PNC and an affiliate of the Advisor, is the Fund’s transfer agent. Each class of the Fund bears the costs of transfer agent fees associated with such respective classes. Transfer agency fees borne by each class of the Fund are comprised of those fees charged for all shareholder communications including mailing of shareholder reports, dividend and distribution notices, and proxy materials for shareholders meetings, as well as per account and per transaction fees related to servicing and maintenance of shareholder accounts, including the issuing, redeeming and transferring of shares of each class of the Fund, 12b-1 fee calculation, check writing, anti-money laundering services, and customer identification services. The Advisor maintains a call center, which is responsible for providing certain shareholder services to the Fund, such as responding to share- holder inquiries and processing transactions based upon instructions from shareholders with respect to the subscription and redemption of Fund shares. For the year ended June 30, 2008, the following amounts have been accrued by the Fund to reimburse the Advisor for costs incurred running the call center, which are a component of the transfer agent fees in the accompanying Statement of Operations. |
| BLACKROCK INTERNATIONAL VALUE FUND |
| JUNE 30, 2008 |
| 19 |
| Notes to Financial Statements (continued) |
| Call Center | ||
| Fees | ||
| Institutional | $8,568 | |
| Investor A | $4,176 | |
| Investor B | $1,032 | |
| Investor C | $3,060 | |
| Class R | $ 516 | |
| Certain officers and/or directors of the Fund are officers and/or directors of BlackRock, Inc. or its affiliates. 3. Investments: Purchases and sales of investments, excluding short-term securities, for the year ended June 30, 2008 were $2,275,563,447 and $2,424,655,480, respectively. 4. Short-Term Borrowings: The Fund, along with certain other funds managed by the Advisor and its affiliates, is party to a $500,000,000 credit agreement with a group of lenders. The Fund may borrow under the credit agreement to fund shareholder redemptions and for other lawful purposes other than for leverage. The Fund may borrow up to the maximum amount allowable under the Fund’s current prospectus and statement of additional infor- mation, subject to various other legal, regulatory or contractual limits. On November 21, 2007, the credit agreement was renewed for one year under substantially the same terms. The Fund pays a commitment fee of 0.06% per annum based on the Fund’s pro rata share of the unused portion of the credit agreement, which is included in miscellaneous in the Statement of Operations. Amounts borrowed under the credit agree- ment bear interest at a rate equal to, at each fund’s election, the federal funds rate plus 0.35% or a base rate as defined in the credit agree- ment. The Fund did not borrow under the credit agreement during the year ended June 30, 2008. 5. Commitments: At June 30, 2008, the Fund had entered into foreign exchange contracts, in addition to the contracts listed on the Schedule of Investments, under which it had agreed to purchase and sell various foreign currencies with approximate values of $3,528,000 and $212,000, respectively. |
| 6. Income Tax Information: Reclassification — Accounting principles generally accepted in the United States of America require that certain components of net assets be adjust- ed to reflect permanent differences between financial and tax reporting. Accordingly, during the current year, $11,595,814 has been reclassified between accumulated net realized gains and undistributed net investment income as a result of permanent differences attributable to gains from the sale of stock of passive foreign investment companies, foreign currency transaction losses, characterization of corporate actions and the reclassifi- cation of distributions. This reclassification has no effect on net assets or net asset values per share. The tax character of distributions paid during the fiscal years ended June 30, 2008 and June 30, 2007 was as follows: |
| 6/30/2008 | 6/30/2007 | |||
| Distributions paid from: | ||||
| Ordinary income | $ 71,183,475 | $ 87,189,119 | ||
| Net long-term capital gains | 214,438,432 | 68,455,906 | ||
| Total taxable distributions | $285,621,907 | $ 155,645,025 | ||
| As of June 30, 2008, the components of accumulated earnings on a tax basis were as follows: |
| Undistributed net ordinary income | $ 23,535,887 | |
| Undistributed net long-term capital gains | 14,864,493 | |
| Total undistributed net earnings | 38,400,380 | |
| Capital loss carryforward | (10,936,387)* | |
| Net unrealized gains | 79,160,613** | |
| Total accumulated net earnings | $ 106,624,606 | |
| * As of June 30, 2008, the Fund had a capital loss carryforward of $10,936,387, all of which expires in 2010. This amount will be available to offset future realized capital gains. ** The difference between book-basis and tax-basis net unrealized gains is attribut- able primarily to the tax deferral of losses on wash sales, the realization for tax purposes of unrealized losses on certain foreign currency contracts, the deferral of post-October losses on investments in passive foreign investment companies and the timing of income recognition on partnership interests. |
20 BLACKROCK INTERNATIONAL VALUE FUND
| JUNE 30, 2008 |
| Notes to Financial Statements (concluded) | ||||||||||||
| 7. Capital Share Transactions: | ||||||||||||
| Transactions in capital shares for each class were as follows: | ||||||||||||
| Year Ended | Year Ended | |||||||||||
| June 30, 2008 | June 30, 2007 | |||||||||||
| Shares | Amount | Shares | Amount | |||||||||
| Institutional | ||||||||||||
| Shares sold | 12,656,577 | $ 358,348,801 | 10,090,109 | $ 314,260,801 | ||||||||
| Shares issued to shareholders in reinvestment of dividends | ||||||||||||
| and distributions | 5,510,169 | 164,120,647 | 3,129,877 | 91,240,177 | ||||||||
| Total issued | 18,166,746 | 522,469,448 | 13,219,986 | 405,500,978 | ||||||||
| Shares redeemed | (15,787,157) | (460,665,669) | (8,320,422) | (261,125,245) | ||||||||
| Net increase | 2,379,589 | $ 61,803,779 | 4,899,564 | $ 144,375,733 | ||||||||
| Investor A | ||||||||||||
| Shares sold and automatic conversion of shares | 2,247,426 | $ 65,894,583 | 2,598,114 | $ 80,944,821 | ||||||||
| Shares issued to shareholders in reinvestment of dividends | ||||||||||||
| and distributions | 1,683,305 | 49,935,359 | 927,989 | 26,958,673 | ||||||||
| Total issued | 3,930,731 | 115,829,942 | 3,526,103 | 107,903,494 | ||||||||
| Shares redeemed | (2,916,214) | (87,067,956) | (2,692,517) | (84,105,783) | ||||||||
| Net increase | 1,014,517 | $ 28,761,986 | 833,586 | $ 23,797,711 | ||||||||
| Investor B | ||||||||||||
| Shares sold | 862,525 | $ 25,046,767 | 1,299,077 | $ 39,527,983 | ||||||||
| Shares issued to shareholders in reinvestment of dividends | ||||||||||||
| and distributions | 375,153 | 10,913,993 | 232,791 | 6,626,874 | ||||||||
| Total issued | 1,237,678 | 35,960,760 | 1,531,868 | 46,154,857 | ||||||||
| Shares redeemed and automatic conversion of shares | (1,515,907) | (43,511,361) | (1,489,753) | (45,665,130) | ||||||||
| Net increase (decrease) | (278,229) | $ (7,550,601) | 42,115 | $ 489,727 | ||||||||
| Investor C | ||||||||||||
| Shares sold | 3,112,700 | $ 87,882,423 | 3,633,693 | $ 109,853,250 | ||||||||
| Shares issued to shareholders in reinvestment of dividends | ||||||||||||
| and distributions | 1,450,506 | 41,654,731 | 758,236 | 21,372,941 | ||||||||
| Total issued | 4,563,206 | 129,537,154 | 4,391,929 | 131,226,191 | ||||||||
| Shares redeemed | (4,050,173) | (114,252,015) | (2,651,790) | (80,724,606) | ||||||||
| Net increase | 513,033 | $ 15,285,139 | 1,740,139 | $ 50,501,585 | ||||||||
| Class R | ||||||||||||
| Shares sold | 1,876,989 | $ 55,186,340 | 1,014,122 | $ 31,492,453 | ||||||||
| Shares issued to shareholders in reinvestment of dividends | ||||||||||||
| and distributions | 347,664 | 10,213,924 | 124,847 | 3,602,794 | ||||||||
| Total issued | 2,224,653 | 65,400,264 | 1,138,969 | 35,095,247 | ||||||||
| Shares redeemed | (1,172,529) | (33,545,010) | (561,630) | (17,432,928) | ||||||||
| Net increase | 1,052,124 | $ 31,855,254 | 577,339 | $ 17,662,319 | ||||||||
There is a 2% redemption fee on shares redeemed or exchanged that have been held for 30 days or less. The redemption fees are collected and retained by the Fund for the benefit of the remaining shareholders. The redemption fees are recorded as a credit to paid-in capital.
| BLACKROCK INTERNATIONAL VALUE FUND |
| JUNE 30, 2008 |
| 21 |
| Report of Independent Registered Public Accounting Firm |
| To the Shareholders and Board of Trustees of BlackRock International Value Trust: We have audited the accompanying statement of assets and liabilities, including the schedule of investments, of BlackRock International Value Fund (the “Fund”) one of the funds constituting BlackRock International Value Trust as of June 30, 2008, the related statement of operations for the year then ended, and the statements of changes in net assets and the financial highlights for each of the two years in the period then ended. These financial statements and the financial highlights are the responsibility of the Fund’s management. Our responsibility is to express an opinion on these financial statements and financial highlights based on our audits. The financial highlights of the Fund for each of the three years in the period ended June 30, 2006 were audited by other auditors whose report, dated August 9, 2006, expressed an unqualified opinion on those financial highlights. We conducted our audits in accordance with the standards of the Public Company Accounting Oversight Board (United States). Those standards require that we plan and perform the audit to obtain reasonable assur- ance about whether the financial statements and financial highlights are free of material misstatement. The Fund is not required to have, nor were we engaged to perform, an audit of its internal control over finan- cial reporting. Our audits include consideration of internal control over financial reporting as a basis for designing audit procedures that are appropriate in the circumstances, but not for the purpose of expressing |
| an opinion on the effectiveness of the Fund’s internal control over finan- cial reporting. Accordingly, we express no such opinion. An audit also includes examining, on a test basis, evidence supporting the amounts and disclosures in the financial statements, assessing the accounting principles used and significant estimates made by management, as well as evaluating the overall financial statement presentation. Our pro- cedures included confirmation of securities owned as of June 30, 2008, by correspondence with the custodian and brokers; where replies were not received from brokers, we performed other auditing procedures. We believe that our audits provide a reasonable basis for our opinion. In our opinion, the financial statements and financial highlights referred to above present fairly, in all material respects, the financial position of BlackRock International Value Fund of BlackRock International Value Trust as of June 30, 2008, the results of its operations for the year then ended, and the changes in its net assets and the financial high- lights for each of the two years in the period then ended, in conformity with accounting principles generally accepted in the United States of America. |
| Deloitte & Touche LLP Princeton, New Jersey August 25, 2008 |
22 BLACKROCK INTERNATIONAL VALUE FUND
| JUNE 30, 2008 |
| Important Tax Information The following information is provided with respect to the ordinary income distributions paid by BlackRock International Value Fund of BlackRock International Value Trust during the fiscal year ended June 30, 2008: |
| Record Date | 9/17/2007 | 12/13/2007 | ||||
| Payable Date | 9/19/2007 | 12/17/2007 | ||||
| Qualified Dividend Income for Individuals | 65.79%* | 100.00%* | ||||
| Foreign Source Income | 57.57%* | 65.64%* | ||||
| Foreign Taxes Paid Per Share | $0.073040 | $0.027067 | ||||
| Short-Term Capital Gain Dividends for Non-U.S. Residents | 40.16%** | 87.44% | ||||
| * Expressed as a percentage of the cash distribution grossed-up for foreign taxes. ** Represents the portion of the taxable ordinary income dividends eligible for exemption from U.S. withholding tax for nonresident aliens and foreign corporations. |
| The foreign taxes paid represent taxes incurred by the Fund on income received by the Fund from foreign sources. Foreign taxes paid may be included in taxable income with an offsetting deduction from gross income or may be taken as a credit for taxes paid to foreign governments. You should consult your tax advisor regarding the appropriate treatment of foreign taxes paid. Additionally, the Fund paid long-term capital gain distributions of $2.349237 and $1.114400 per share to shareholders of record on September 17, 2007 and December 13, 2007, respectively. |
| BLACKROCK INTERNATIONAL VALUE FUND |
| JUNE 30, 2008 |
| 23 |
| Disclosure of Investment Advisory Agreement and Subadvisory Agreement |
| The Board of Trustees (the “Board,” the members of which are referred to as “Trustees”) of BlackRock International Value Fund (the “Fund”) of BlackRock International Value Trust (the “Trust”) met in April and June 2008 to consider the approval of the Fund’s investment advisory agreement (the “Advisory Agreement”) with BlackRock Advisors, LLC (the “Adviser”), the Fund’s investment adviser. The Board also considered the approval of the Fund’s subadvisory agreement (the “Subadvisory Agreement”) between the Adviser and BlackRock Investment Management International Limited (the “Subadviser”). The Adviser and the Subadviser are referred to herein as “BlackRock.” For simplicity, the Fund and the Trust are referred to herein as the “Fund.” The Advisory Agreement and the Subadvisory Agreement are referred to herein as the “Agreements.” Activities and Composition of the Board The Board of the Fund consists of fifteen individuals, twelve of whom are not “interested persons” of the Fund as defined in the Investment Company Act of 1940, as amended (the “1940 Act”) (the “Independent Trustees”). The Trustees are responsible for the oversight of the operations of the Fund and perform the various duties imposed on the trustees of investment companies by the 1940 Act. The Independent Trustees have retained independent legal counsel to assist them in connection with their duties. The Chairman of the Board is an Independent Trustee. The Board established four standing committees: an Audit Committee, a Governance and Nominating Committee, a Compliance Committee and a Performance Oversight Committee, each of which is composed of, and chaired by Independent Trustees. The Agreements Upon the consummation of the combination of BlackRock’s investment management business with Merrill Lynch & Co., Inc.’s investment man- agement business, including Merrill Lynch Investment Managers, L. ., and certain affiliates (the “Transaction”), the Fund entered into the Advisory Agreement with an initial two-year term and the Adviser entered into the Subadvisory Agreement with the Subadviser with an initial two- year term. Consistent with the 1940 Act, prior to the expiration of the Agreements’ respective initial two-year term, the Board is required to consider the continuation of the Fund’s Agreements on an annual basis. In connection with this process, the Board assessed, among other things, the nature, scope and quality of the services provided to the Fund by the personnel of BlackRock and its affiliates, including invest- ment management, administrative services, shareholder services, oversight of fund accounting and custody, marketing services and assistance in meeting legal and regulatory requirements. The Board also received and assessed information regarding the services provided to the Fund by certain unaffiliated service providers. |
| Throughout the year, the Board, acting directly and through its commit- tees, considers at each of its meetings factors that are relevant to its annual consideration of the renewal of the Fund’s Agreements, including the services and support provided to the Fund and its shareholders. Among the matters the Board considered were: (a) investment perform- ance for one, three and five years, as applicable, against peer funds, as well as senior management and portfolio managers’ analysis of the rea- sons for underperformance, if applicable; (b) fees, including advisory, administration, if applicable, and other fees paid to BlackRock and its affiliates by the Fund, such as transfer agency fees and fees for market- ing and distribution; (c) Fund operating expenses; (d) the resources devoted to and compliance reports relating to the Fund’s investment objective, policies and restrictions, (e) the Fund’s compliance with its Code of Ethics and compliance policies and procedures; (f) the nature, cost and character of non-investment management services provided by BlackRock and its affiliates; (g) BlackRock’s and other service providers’ internal controls; (h) BlackRock’s implementation of the proxy voting guidelines approved by the Board; (i) the use of brokerage commissions and spread and execution quality; (j) valuation and liquidity procedures; and (k) periodic overview of BlackRock’s business, including BlackRock’s response to the increasing scale of its business. Board Considerations in Approving the Agreements The Approval Process: At an in-person meeting held on April 10, 2008, the Board reviewed materials relating to its consideration of the Agreements. At an in-person meeting held on June 5 – 6, 2008, the Fund’s Board, including the Independent Trustees, unanimously approved the continuation of the Advisory Agreement between the Adviser and the Fund for a one-year term ending June 30, 2009 and the Subadvisory Agreement between the Adviser and the Subadviser for a one-year term ending June 30, 2009. In considering the approval of the Agreements, the Board received and discussed various materials provided to it in advance of the April 10, 2008 meeting. As a result of the discussions that occurred during the April 10, 2008 meeting, the Board requested and BlackRock provided additional information, as detailed below, in advance of the June 5 – 6, 2008 Board meeting. The Board considered all factors it believed relevant with respect to the Fund, including, among other factors: (a) the nature, extent and quality of the services provided by BlackRock; (b) the investment performance of the Fund and BlackRock portfolio management; (c) the advisory fee and the cost of the services and profits to be realized by BlackRock and certain affiliates from the relationship with the Fund; (d) economies of scale; and (e) other factors. Prior to the April 10, 2008 meeting, the Board requested and received materials specifically relating to the Agreements. The Board is engaged in an ongoing process with BlackRock to continuously review the nature and scope of the information provided to better assist its deliberations. |
24 BLACKROCK INTERNATIONAL VALUE FUND
| JUNE 30, 2008 |
| Disclosure of Investment Advisory Agreement and Subadvisory Agreement (continued) |
| These materials included (a) information independently compiled and prepared by Lipper, Inc. (“Lipper”) on Fund fees and expenses, and the investment performance of the Fund as compared with a peer group of funds as determined by Lipper (“Peers”); (b) information on the prof- itability of the Agreements to BlackRock and certain affiliates, including their other relationships with the Fund, and a discussion of fall-out bene- fits; (c) a general analysis provided by BlackRock concerning investment advisory fees charged to other clients, such as institutional and closed- end funds, under similar investment mandates, as well as the perform- ance of such other clients; (d) a report on economies of scale; (e) sales and redemption data regarding the Fund’s shares; and (f) an internal comparison of management fees classified by Lipper, if applicable. At the April 10, 2008 meeting, the Board requested and subsequently received from BlackRock (i) a comprehensive analysis of total expenses on a fund-by-fund basis; (ii) further analysis of investment performance; (iii) further data regarding Fund profitability, Fund size and Fund fee levels; and (iv) additional information on sales and redemptions. The Board also considered other matters it deemed important to the approval process, such as payments made to BlackRock or its affiliates relating to the distribution of Fund shares, services related to the valua- tion and pricing of Fund portfolio holdings, allocation of Fund brokerage fees (including the benefits of “soft dollars”), and direct and indirect benefits to BlackRock and its affiliates from their relationship with the Fund. The Board did not identify any particular information as control- ling, and each Trustee may have attributed different weights to the various items considered. A. Nature, Extent and Quality of the Services: The Board, including the Independent Trustees, reviewed the nature, extent and quality of services provided by BlackRock, including the investment advisory services and the resulting performance of the Fund. Throughout the year, the Board compared Fund performance — both including and excluding the effects of the Fund’s fees and expenses — to the performance of a comparable group of mutual funds as classified by Lipper and the performance of at least one relevant index or combination of indices. The Board met with BlackRock’s senior management personnel responsible for investment operations, including the senior investment officers. The Board also reviewed the materials provided by the Fund’s portfolio management team discussing Fund performance and the Fund’s investment objective, strategies and outlook. |
| The Board considered, among other factors, the number, education and experience of BlackRock’s investment personnel generally and the Fund’s portfolio management team, BlackRock’s portfolio trading capabilities, BlackRock’s use of technology, BlackRock’s commitment to compliance and BlackRock’s approach to training and retaining portfolio managers and other research, advisory and management personnel. The Board also reviewed BlackRock’s compensation structure with respect to the Fund’s portfolio management team and BlackRock’s ability to attract and retain high-quality talent. In addition to advisory services, the Board considered the quality of the administrative and non-investment advisory services provided to the Fund. BlackRock and its affiliates provide the Fund with certain adminis- trative, transfer agency, shareholder and other services (in addition to any such services provided to the Fund by third parties) and officers and other personnel as are necessary for the operations of the Fund. In addi- tion to investment advisory services, BlackRock and its affiliates provide the Fund with other services, including (i) preparing disclosure docu- ments, such as the prospectus, the statement of additional information and shareholder reports; (ii) assisting with daily accounting and pricing; (iii) overseeing and coordinating the activities of other service providers; (iv) organizing Board meetings and preparing the materials for such Board meetings; (v) providing legal and compliance support; and (vi) performing other administrative functions necessary for the operation of the Fund, such as tax reporting and fulfilling regulatory filing require- ments. The Board reviewed the structure and duties of BlackRock’s fund administration, accounting, legal and compliance departments. B. The Investment Performance of the Fund and BlackRock: The Board, including the Independent Trustees, also reviewed and considered the performance history of the Fund. In preparation for the April 10, 2008 meeting, the Board was provided with reports, independently prepared by Lipper, which included a comprehensive analysis of the Fund’s per- formance. The Board also reviewed a narrative and statistical analysis of the Lipper data that was prepared by BlackRock, which analyzed vari- ous factors that affect Lipper’s rankings. In connection with its review, the Board received and reviewed information regarding the investment per- formance of the Fund as compared to a representative group of similar funds as determined by Lipper and to all funds in the Fund’s applicable Lipper category. The Board was provided with a description of the metho- dology used by Lipper to select the peer funds. The Board regularly reviews the performance of the Fund throughout the year. The Board attaches more importance to performance over relatively long periods of time, typically three to five years. |
| BLACKROCK INTERNATIONAL VALUE FUND |
| JUNE 30, 2008 |
| 25 |
| Disclosure of Investment Advisory Agreement and Subadvisory Agreement (continued) |
| The Fund ranked in the third quartile on a net basis against its Lipper peer universe for each of the one, three and five-year periods ended December 31, 2007. In considering the Advisory Agreement, the Board expressed its concern with the Fund’s third quartile performance. The Board discussed the processes and resources devoted to the manage- ment of the Fund with BlackRock’s senior management and will con- tinue to monitor the Fund’s performance. The Board noted that for the one-year period the Fund’s third quartile performance was near its Lipper median. C. Consideration of the Advisory Fees and the Cost of the Services and Profits to be Realized by BlackRock and its Affiliates from the Relationship with the Fund: The Board, including the Independent Trustees, reviewed the Fund’s contractual advisory fee rates compared with the other funds in its Lipper category. It also compared the Fund’s total expenses to those of other comparable funds. The Board consid- ered the services provided and the fees charged by BlackRock to other types of clients with similar investment mandates, including separately managed institutional accounts. The Board received and reviewed statements relating to BlackRock’s financial condition and profitability with respect to the services it provided the Fund. The Board was also provided with a profitability analysis that detailed the revenues earned and the expenses incurred by BlackRock and certain affiliates that provide services to the Fund. The Board reviewed BlackRock’s profitability with respect to the Fund and each fund the Board currently oversees for the year ended December 31, 2007 compared to aggregated profitability data provided for the year ended December 31, 2005. In addition, the Board considered the cost of the services provided to the Fund by BlackRock, and BlackRock’s and its affiliates’ profits relating to the management and distribution of the Fund and the other funds advised by BlackRock and its affiliates. As part of its analysis, the Board reviewed BlackRock’s methodology in allocating its costs to the manage- ment of the Fund and concluded that there was a reasonable basis for the allocation. The Board also considered whether BlackRock has the financial resources necessary to attract and retain high quality investment management personnel to perform its obligations under the Agreements and to continue to provide the high quality of services that are expected by the Board. |
| The Board took into account that the Fund has an advisory fee arrange- ment that includes breakpoints that adjust the fee rate downward as the size of the Fund increases, thereby allowing shareholders the potential to participate in economies of scale. The Board concluded that the Fund’s advisory fee structure was reason- able and that it would continue to review fees in connection with future renewals of the Agreements, including whether the implementation of additional breakpoints would be appropriate in the future due to an increase in asset size or otherwise. D. Economies of Scale: The Board, including the Independent Trustees, considered the extent to which economies of scale might be realized as the assets of the Fund increase and whether there should be changes in the advisory fee rate or structure in order to enable the Fund to partici- pate in these economies of scale. The Board, including the Independent Trustees, considered whether the shareholders would benefit from economies of scale and whether there was potential for future realization of economies with respect to the Fund. The Board considered that the funds in the BlackRock fund complex share common resources and, as a result, an increase in the overall size of the complex could permit each fund to incur lower expenses than it would otherwise as stand-alone entities. The Board also considered the anticipated efficiencies in the processes of BlackRock’s overall operations as it continues to add personnel and commit capital to expand the scale of operations. The Board found, based on its review of comparable funds, that the Fund’s management fee is appropriate in light of the scale of the Fund. E. Other Factors: The Board also took into account other ancillary or “fall-out” benefits that BlackRock may derive from its relationship with the Fund, both tangible and intangible, such as BlackRock’s ability to leverage its investment professionals that manage other portfolios, an increase in BlackRock’s profile in the investment advisory community, and the engagement of BlackRock’s affiliates as service providers to the Fund, including for administrative, transfer agency and distribution services. The Board also noted that BlackRock may use third party research obtained by soft dollars generated by transactions in the Fund to assist itself in managing all or a number of its other client accounts. In connection with its consideration of the Agreements, the Board also received information regarding BlackRock’s brokerage and soft dollar practices. The Board received reports from BlackRock which included information on brokerage commissions and trade execution throughout the year. |
26 BLACKROCK INTERNATIONAL VALUE FUND
| JUNE 30, 2008 |
| Disclosure of Investment Advisory Agreement and Subadvisory Agreement (concluded) |
| Conclusion. The Board approved the continuation of the Advisory Agreement between the Adviser and the Fund for a one-year term ending June 30, 2009 and the Subadvisory Agreement between the Adviser and the Subadviser for a one-year term ending June 30, 2009. Based upon their evaluation of all these factors in their totality, the Board, including the Independent Trustees, was satisfied that the terms of the Agreements were fair and reasonable and in the best interest of the Fund and the Fund’s share- holders. In arriving at a decision to approve the Agreements, the Board did not identify any single factor or group of factors as all-important or controlling, but considered all factors together. The Independent Trustees were also assisted by the advice of independent legal counsel in making this determination. The contractual fee arrangements for the Fund reflect the result of several years of review by the Trustees and predecessor Trustees, and discussions between the Trustees (and pre- decessor Trustees) and BlackRock. Certain aspects of the arrangements may be the subject of more attention in some years than in others, and the Trustees’ conclusions may be based in part on their consideration of these arrangements in prior years. |
| BLACKROCK INTERNATIONAL VALUE FUND |
| JUNE 30, 2008 |
| 27 |
| Officers and Trustees | ||||||||||
| Number of | ||||||||||
| BlackRock- | ||||||||||
| Position(s) | Length of | Advised Funds | ||||||||
| Name, Address | Held with | Time Served | and Portfolios | Public | ||||||
| and Year of Birth | Fund | as a Trustee2 | Principal Occupation(s) During Past 5 Years | Overseen | Directorships | |||||
| Non-Interested Trustees1 | ||||||||||
| Robert M. Hernandez | Chairman of the | Since | Formerly Director, Vice Chairman and Chief Financial Officer of USX | 37 Funds | ACE Limited | |||||
| 40 East 52nd Street | Board, Trustee | 2007 | Corporation (energy and steel business) from 1991 to 2001. | 104 Portfolios | (insurance company); | |||||
| New York, NY 10022 | and Member | Eastman Chemical | ||||||||
| 1944 | of the Audit | Company (chemical); | ||||||||
| Committee | RTI International | |||||||||
| Metals, Inc. (metals); | ||||||||||
| TYCO Electronics | ||||||||||
| (electronics) | ||||||||||
| Fred G. Weiss | Vice Chairman | Since | Managing Director, FGW Associates (consulting and investment | 37 Funds | Watson | |||||
| 40 East 52nd Street | of the Board, | 2007 | company) since 1997; Director, Michael J. Fox Foundation for | 104 Portfolios | Pharmaceutical Inc. | |||||
| New York, NY 10022 | Chairman of the | Parkinson’s Research since 2000; Formerly Director of BTG | ||||||||
| 1941 | Audit Committee | International Plc (a global technology commercialization company) | ||||||||
| and Trustee | from 2001 to 2007. | |||||||||
| James H. Bodurtha | Trustee | Since | Director, The China Business Group, Inc. (consulting firm) since 1996 | 37 Funds | None | |||||
| 40 East 52nd Street | 2002 | and formerly Executive Vice President thereof from 1996 to 2003; | 104 Portfolios | |||||||
| New York, NY 10022 | Chairman of the Board, Berkshire Holding Corporation since 1980. | |||||||||
| 1944 | ||||||||||
| Bruce R. Bond | Trustee | Since | Formerly Trustee and Member of the Governance Committee, State | 37 Funds | None | |||||
| 40 East 52nd Street | 2007 | Street Research Mutual Funds from 1997 to 2005; Formerly Board | 104 Portfolios | |||||||
| New York, NY 10022 | Member of Governance, Audit and Finance Committee, Avaya Inc. | |||||||||
| 1946 | (computer equipment) from 2003 to 2007. | |||||||||
| Donald W. Burton | Trustee | Since | Managing General Partner, The Burton Partnership, LP (an investment | 37 Funds | Knology, Inc. (tele- | |||||
| 40 East 52nd Street | 2007 | partnership) since 1979; Managing General Partner, The South Atlantic | 104 Portfolios | communications); | ||||||
| New York, NY 10022 | Venture Funds since 1983; Member of the Investment Advisory Council | Capital Southwest | ||||||||
| 1944 | of the Florida State Board of Administration from 2001 to 2007. | (financial) | ||||||||
| Honorable | Trustee | Since | Partner and Head of International Practice, Covington and Burling | 37 Funds | UPS Corporation | |||||
| Stuart E. Eizenstat | 2007 | (law firm) since 2001; International Advisory Board Member, The Coca | 104 Portfolios | (delivery service) | ||||||
| 40 East 52nd Street | Cola Company since 2002; Advisory Board Member BT Americas | |||||||||
| New York, NY 10022 | (telecommunications) since 2004; Member of the Board of Directors, | |||||||||
| 1943 | Chicago Climate Exchange (environmental) since 2006; Member of the | |||||||||
| International Advisory Board GML (energy) since 2003. | ||||||||||
| Kenneth A. Froot | Trustee | Since | Professor, Harvard University since 1992. | 37 Funds | None | |||||
| 40 East 52nd Street | 2005 | 104 Portfolios | ||||||||
| New York, NY 10022 | ||||||||||
| 1957 | ||||||||||
| John F. O’Brien | Trustee | Since | Trustee, Woods Hole Oceanographic Institute since 2003; Formerly | 37 Funds | Cabot Corporation | |||||
| 40 East 52nd Street | 2007 | Director, Allmerica Financial Corporation from 1995 to 2003; Formerly | 104 Portfolios | (chemicals); LKQ | ||||||
| New York, NY 10022 | Director, ABIOMED from 1989 to 2006; Formerly Director, Ameresco, | Corporation (auto | ||||||||
| 1943 | Inc. (energy solutions company) from 2006 to 2007. | parts manufacturing); | ||||||||
| TJX Companies, Inc. | ||||||||||
| (retailer) | ||||||||||
| Roberta Cooper Ramo | Trustee | Since | Shareholder, Modrall, Sperling, Roehl, Harris & Sisk, .A. (law firm) | 37 Funds | None | |||||
| 40 East 52nd Street | 2002 | since 1993; Chairman of the Board, Cooper’s Inc., (retail) since 2000; | 104 Portfolios | |||||||
| New York, NY 10022 | Director of ECMC Group (service provider to students, schools and | |||||||||
| 1942 | lenders) since 2001; President Elect, The American Law Institute, | |||||||||
| (non-profit), 2007; Formerly President, American Bar Association from | ||||||||||
| 1995 to 1996. | ||||||||||
28 BLACKROCK INTERNATIONAL VALUE FUND
| JUNE 30, 2008 |
| Officers and Trustees (continued) | ||||||||||
| Number of | ||||||||||
| BlackRock- | ||||||||||
| Position(s) | Length of | Advised Funds | ||||||||
| Name, Address | Held with | Time Served | and Portfolios | Public | ||||||
| and Year of Birth | Fund | as a Trustee2 | Principal Occupation(s) During Past 5 Years | Overseen | Directorships | |||||
| Non-Interested Trustees1 (concluded) | ||||||||||
| Jean Margo Reid | Trustee | Since | Self-employed consultant since 2001; Director and Secretary, SCB, | 37 Funds | None | |||||
| 40 East 52nd Street | 2007 | Inc. (holding company) since 1998; Director and Secretary, SCB | 104 Portfolios | |||||||
| New York, NY 10022 | Partners, Inc. (holding company) since 2000; Director, Covenant | |||||||||
| 1945 | House (non-profit) from 2001 to 2004. | |||||||||
| David H. Walsh | Trustee | Since | Director, National Museum of Wildlife Art since 2007; Director, | 37 Funds | None | |||||
| 40 East 52nd Street | 2007 | Ruckleshaus Institute and Haub School of Natural Resources at the | 104 Portfolios | |||||||
| New York, NY 10022 | University of Wyoming since 2006; Director, The American Museum | |||||||||
| 1941 | of Fly Fishing since 1997; Formerly Consultant with Putnam Investments | |||||||||
| from 1993 to 2003; Formerly Director, The National Audubon Society | ||||||||||
| from 1998 to 2005. | ||||||||||
| Richard R. West | Trustee | Since | Dean Emeritus, New York University’s Leonard N. Stern School of | 37 Funds | Bowne & Co., Inc. | |||||
| 40 East 52nd Street | and Member | 2007 | Business Administration since 1995. | 104 Portfolios | (financial printers); | |||||
| New York, NY 10022 | of the Audit | Vornado Realty Trust | ||||||||
| 1938 | Committee | (real estate | ||||||||
| company); | ||||||||||
| Alexander’s Inc. | ||||||||||
| (real estate | ||||||||||
| company) | ||||||||||
1 Trustees serve until their resignation, removal or death, or until December 31 of the year in which they turn 72.
2 Following the combination of Merrill Lynch Investment Managers, L. P. (“MLIM”) and BlackRock, Inc. (“BlackRock”) in September 2006, the various legacy MLIM and legacy BlackRock Fund boards were realigned and consolidated into three new Fund boards in 2007. As a result, although the chart shows certain trustees as joining the Fund’s board in 2007, each trustee first became a member of the board of trustees of other legacy MLIM or legacy BlackRock Funds as follows: James H. Bodurtha since 1995; Bruce R. Bond since 2005; Donald W. Burton since 2002; Stuart E. Eizenstat since 2001; Kenneth A. Froot since 2005; Robert M. Hernandez since 1996; John F. O’Brien since 2004; Roberta Cooper Ramo since 2000; Jean Margo Reid since 2004; David H. Walsh since 2003; Fred G. Weiss since 1998; and Richard R. West since 1978.
| BLACKROCK INTERNATIONAL VALUE FUND |
| JUNE 30, 2008 |
| 29 |
| Officers and Trustees (continued) | ||||||||||
| Number of | ||||||||||
| BlackRock- | ||||||||||
| Position(s) | Length of | Advised Funds | ||||||||
| Name, Address | Held with | Time Served | and Portfolios | Public | ||||||
| and Year of Birth | Fund | as a Trustee | Principal Occupation(s) During Past 5 Years | Overseen | Directorships | |||||
| Interested Trustees1 | ||||||||||
| Richard S. Davis | Fund | Since | Managing Director, BlackRock, Inc. since 2005; Formerly Chief | 185 Funds | None | |||||
| 40 East 52nd Street | President | 2007 | Executive Officer, State Street Research & Management Company | 295 Portfolios | ||||||
| New York, NY 10022 | and Trustee | from 2000 to 2005; Formerly Chairman of the Board of Trustees, | ||||||||
| 1945 | State Street Research Mutual Funds from 2000 to 2005; Formerly | |||||||||
| Chairman, SSR Realty from 2000 to 2004. | ||||||||||
| Laurence D. Fink | Trustee | Since | Chairman and Chief Executive Officer of BlackRock, Inc. since its | 37 Funds | None | |||||
| 40 East 52nd Street | 2007 | formation in 1998 and of BlackRock, Inc.’s predecessor entities since | 104 Portfolios | |||||||
| New York, NY 10022 | 1988 and Chairman of the Executive and Management Committees; | |||||||||
| 1952 | Formerly Managing Director, The First Boston Corporation, Member of | |||||||||
| its Management Committee, Co-head of its Taxable Fixed Income | ||||||||||
| Division and Head of its Mortgage and Real Estate Products Group; | ||||||||||
| Chairman of the Board of several of BlackRock’s alternative investment | ||||||||||
| vehicles; Director of several of BlackRock’s offshore funds; Member of | ||||||||||
| the Board of Trustees of New York University, Chair of the Financial Affairs | ||||||||||
| Committee and a member of the Executive Committee, the Ad Hoc | ||||||||||
| Committee on Board Governance, and the Committee on Trustees; Co- | ||||||||||
| Chairman of the NYU Hospitals Center Board of Trustees, Chairman of | ||||||||||
| the Development/Trustee Stewardship Committee and Chairman of the | ||||||||||
| Finance Committee; Trustee, The Boys’ Club of New York. | ||||||||||
| Henry Gabbay | Trustee | Since | Consultant, BlackRock, Inc. since 2007; Formerly Managing Director, | 184 Funds | None | |||||
| 40 East 52nd Street | 2007 | BlackRock, Inc. from 1989 to 2007; Formerly Chief Administrative | 294 Portfolios | |||||||
| New York, NY 10022 | Officer, BlackRock Advisors, LLC from 1998 to 2007; Formerly President | |||||||||
| 1947 | of BlackRock Funds and BlackRock Bond Allocation Target Shares from | |||||||||
| 2005 to 2007 and Treasurer of certain closed-end funds in the | ||||||||||
| BlackRock fund complex from 1989 to 2006. | ||||||||||
1 Messrs. Davis, Fink and Gabbay are all “interested persons,” as defined in the Investment Company Act of 1940, of the Fund based on their positions with BlackRock, Inc. and its affiliates. Trustees serve until their resignation, removal or death, or until December 31 of the year in which they turn 72.
30 BLACKROCK INTERNATIONAL VALUE FUND
| JUNE 30, 2008 |
| Officers and Trustees (concluded) | ||||||||||||
| Position(s) | ||||||||||||
| Name, Address | Held with | Length of | ||||||||||
| and Year of Birth | Fund | Time Served | Principal Occupation(s) During Past 5 Years | |||||||||
| Fund Officers1 | ||||||||||||
| Donald C. Burke | Chief | Since | Managing Director of BlackRock, Inc. since 2006; Formerly Managing Director of Merrill Lynch Investment | |||||||||
| 40 East 52nd Street | Executive | 2007 | Managers, LP | (“MLIM”) and Fund Asset Management, LP (“FAM”) in 2006; First Vice President thereof from | ||||||||
| New York, NY 10022 | Officer | 1997 to 2005; Treasurer thereof from 1999 to 2006 and Vice President thereof from 1990 to 1997. | ||||||||||
| 1960 | ||||||||||||
| Anne F. Ackerley | Vice | Since | Managing Director of BlackRock, Inc. since 2000; Chief Operating Officer of BlackRock’s U.S. Retail Group since | |||||||||
| 40 East 52nd Street | President | 2007 | 2006; Head of BlackRock’s Mutual Fund Group from 2000 to 2006; Merrill Lynch & Co., Inc. from 1984 to 1986 | |||||||||
| New York, NY 10022 | and from 1988 to 2000, most recently as First Vice President and Operating Officer of the Mergers and | |||||||||||
| 1962 | Acquisitions Group. | |||||||||||
| Neal J. Andrews | Chief | Since | Managing Director of BlackRock, Inc. since 2006; Formerly Senior Vice President and Line of Business Head of | |||||||||
| 40 East 52nd Street | Financial | 2007 | Fund Accounting and Administration at PFPC Inc. from 1992 to 2006. | |||||||||
| New York, NY 10022 | Officer | |||||||||||
| 1966 | ||||||||||||
| Jay M. Fife | Treasurer | Since | Managing Director of BlackRock, Inc. since 2007 and Director in 2006; Formerly Assistant Treasurer of the | |||||||||
| 40 East 52nd Street | 2007 | MLIM/FAM advised funds from 2005 to 2006; Director of MLIM Fund Services Group from 2001 to 2006. | ||||||||||
| New York, NY 10022 | ||||||||||||
| 1970 | ||||||||||||
| Brian P. Kindelan | Chief | Since | Chief Compliance Officer of the BlackRock-advised Funds since 2007; Anti-Money Laundering Officer of the | |||||||||
| 40 East 52nd Street | Compliance | 2007 | BlackRock-advised Funds since 2007; Managing Director and Senior Counsel of BlackRock, Inc. since 2005; | |||||||||
| New York, NY 10022 | Officer of | Director and Senior Counsel of BlackRock Advisors, Inc. from 2001 to 2004 and Vice President and Senior | ||||||||||
| 1959 | the Fund | Counsel thereof from 1998 to 2000; Formerly Senior Counsel of The PNC Bank Corp. from 1995 to 1998. | ||||||||||
| Howard Surloff | Secretary | Since | Managing Director of BlackRock, Inc. and General Counsel of U.S. Funds at BlackRock, Inc. since 2006; Formerly | |||||||||
| 40 East 52nd Street | 2007 | General Counsel (U.S.) of Goldman Sachs Asset Management, L from 1993 to 2006. | ||||||||||
| New York, NY 10022 | ||||||||||||
| 1965 | ||||||||||||
| 1 Officers of the Fund serve at the pleasure of the Board of Trustees. | ||||||||||||
| Further information about the Fund’s Officers and Trustees is available in the Fund’s Statement of Additional Information, which can be obtained | ||||||||||||
| without charge by calling (800) 441-7762. | ||||||||||||
| Custodian | Transfer Agent | Accounting Agent | Independent | Legal Counsel | ||||||||
| Brown Brothers Harriman & Co. | PNC Global Investment | State Street Bank and Trust | Registered Public | Willkie Farr & Gallagher LLP | ||||||||
| Boston, MA 02109 | Servicing (U.S.) Inc. | Company | Accounting Firm | New York, NY 10019 | ||||||||
| Wilmington, DE 19809 | Princeton, NJ 08540 | Deloitte & Touche LLP | ||||||||||
| Princeton, NJ 08540 | ||||||||||||
| BLACKROCK INTERNATIONAL VALUE FUND |
| JUNE 30, 2008 |
| 31 |
| Additional Information BlackRock Privacy Principles BlackRock is committed to maintaining the privacy of its current and former fund investors and individual clients (collectively, “Clients”) and to safeguarding their non-public personal information. The following infor- mation is provided to help you understand what personal information BlackRock collects, how we protect that information and why in certain cases we share such information with select parties. If you are located in a jurisdiction where specific laws, rules or regulations require BlackRock to provide you with additional or different privacy-related rights beyond what is set forth below, then BlackRock will comply with those specific laws, rules or regulations. BlackRock obtains or verifies personal non-public information from and about you from different sources, including the following: (i) information we receive from you or, if applicable, your financial intermediary, on appli- cations, forms or other documents; (ii) information about your trans- actions with us, our affiliates, or others; (iii) information we receive from a consumer reporting agency; and (iv) from visits to our websites. |
| BlackRock does not sell or disclose to non-affiliated third parties any non- public personal information about its Clients, except as permitted by law or as is necessary to respond to regulatory requests or to service Client accounts. These non-affiliated third parties are required to protect the confidentiality and security of this information and to use it only for its intended purpose. We may share information with our affiliates to service your account or to provide you with information about other BlackRock products or services that may be of interest to you. In addition, BlackRock restricts access to non-public personal information about its Clients to those BlackRock employees with a legitimate business need for the information. BlackRock maintains physical, electronic and procedural safeguards that are designed to protect the non-public personal information of its Clients, including proce- dures relating to the proper storage and disposal of such information. |
| Availability of Additional Information Electronic copies of most financial reports and prospectuses are available on the Fund’s website or shareholders can sign up for e-mail notifications of quarterly statements, annual and semi-annual reports and prospectuses by enrolling in the Fund’s electronic delivery program. To enroll: Shareholders Who Hold Accounts with Investment Advisors, Banks or Brokerages: Please contact your financial advisor. Please note that not all investment advisors, banks or brokerages may offer this service. Shareholders Who Hold Accounts Directly with BlackRock: 1) Access the BlackRock website at http://www.blackrock.com/edelivery 2) Click on the applicable link and follow the steps to sign up 3) Log into your account |
| Householding The Fund will mail only one copy of shareholder documents, including prospectuses, annual and semi-annual reports and proxy statements, to shareholders with multiple accounts at the same address. This practice is commonly called “householding” and it is intended to reduce expenses and eliminate duplicate mailings of shareholder documents. Mailings of your shareholder documents may be householded indefinitely unless you instruct us otherwise. If you do not want the mailing of these documents to be combined with those for other members of your household, please contact the Fund at (800) 441-7762. Availability of Proxy Voting Policies and Procedures A description of the policies and procedures that the Fund uses to determine how to vote proxies relating to portfolio securities is available (1) without charge, upon request, by calling toll-free (800) 441-7762; (2) at www.blackrock.com; and (3) on the Securities and Exchange Commission’s (the “SEC”) website at http://www.sec.gov. |
32 BLACKROCK INTERNATIONAL VALUE FUND
| JUNE 30, 2008 |
| Availability of Additional Information (concluded) Availability of Proxy Voting Record Information about how the Fund votes proxies relating to securities held in the Fund’s portfolio during the most recent 12-month period ended June 30 is available upon request and without charge (1) at www.blackrock.com or by calling (800) 441-7762 and (2) on the SEC’s website at http://www.sec.gov. |
| Availability of Quarterly Portfolio Schedule The Fund files its complete schedule of portfolio holdings with the SEC for the first and third quarters of each fiscal year on Form N-Q. The Fund’s Forms N-Q are available on the SEC’s website at http://www.sec.gov and may also be reviewed and copied at the SEC’s Public Reference Room in Washington, D.C. Information on the operation of the Public Reference Room may be obtained by calling (800) SEC-0330. The Fund’s Forms N-Q may also be obtained upon request and without charge by calling (800) 441-7762. |
| Shareholder Privileges Account Information Call us at (800) 441-7762 from 8:00 AM to 6:00 PM EST to get infor- mation about your account balances, recent transactions and share prices. You can also reach us on the Web at www.blackrock.com/funds. Automatic Investment Plans Investor Class shareholders who want to invest regularly can arrange to have $50 or more automatically deducted from their checking or savings account and invested in any of the BlackRock funds. |
| Systematic Withdrawal Plans Investor Class shareholders can establish a systematic withdrawal plan and receive periodic payments of $50 or more from their BlackRock funds, as long as their account is at least $10,000. Retirement Plans Shareholders may make investments in conjunction with Traditional, Rollover, Roth, Coverdell, Simple IRAs, SEP IRAs and 403(b) Plans. |
| BLACKROCK INTERNATIONAL VALUE FUND |
| JUNE 30, 2008 |
| 33 |
A World-Class Mutual Fund Family
BlackRock offers a diverse lineup of open-end mutual funds crossing all investment styles and managed by experts in equity, fixed income and tax-exempt investing.
| Equity Funds | ||||
| BlackRock All-Cap Global Resources Portfolio | BlackRock Global Opportunities Portfolio | BlackRock Mid-Cap Growth Equity Portfolio | ||
| BlackRock Asset Allocation Portfolio† | BlackRock Global Resources Portfolio | BlackRock Mid-Cap Value Equity Portfolio | ||
| BlackRock Aurora Portfolio | BlackRock Global Science & Technology | BlackRock Mid Cap Value Opportunities Fund | ||
| BlackRock Balanced Capital Fund† | Opportunities Portfolio | BlackRock Natural Resources Trust | ||
| BlackRock Basic Value Fund | BlackRock Global SmallCap Fund | BlackRock Pacific Fund | ||
| BlackRock Capital Appreciation Portfolio | BlackRock Health Sciences Opportunities Portfolio* | BlackRock Small Cap Core Equity Portfolio | ||
| BlackRock Equity Dividend Fund | BlackRock Healthcare Fund | BlackRock Small Cap Growth Equity Portfolio | ||
| BlackRock EuroFund | BlackRock Index Equity Portfolio* | BlackRock Small Cap Growth Fund II | ||
| BlackRock Focus Growth Fund | BlackRock International Fund | BlackRock Small Cap Index Fund | ||
| BlackRock Focus Value Fund | BlackRock International Index Fund | BlackRock Small Cap Value Equity Portfolio* | ||
| BlackRock Fundamental Growth Fund | BlackRock International Opportunities Portfolio | BlackRock Small/Mid-Cap Growth Portfolio | ||
| BlackRock Global Allocation Fund† | BlackRock International Value Fund | BlackRock S&P 500 Index Fund | ||
| BlackRock Global Dynamic Equity Fund | BlackRock Large Cap Core Fund | BlackRock Technology Fund | ||
| BlackRock Global Emerging Markets Fund | BlackRock Large Cap Growth Fund | BlackRock U.S. Opportunities Portfolio | ||
| BlackRock Global Financial Services Fund | BlackRock Large Cap Value Fund | BlackRock Utilities and Telecommunications Fund | ||
| BlackRock Global Growth Fund | BlackRock Latin America Fund | BlackRock Value Opportunities Fund | ||
| Fixed Income Funds | ||||
| BlackRock Commodity Strategies Fund | BlackRock Income Builder Portfolio | BlackRock Managed Income Portfolio | ||
| BlackRock Emerging Market Debt Portfolio | BlackRock Inflation Protected Bond Portfolio | BlackRock Short-Term Bond Fund | ||
| BlackRock Enhanced Income Portfolio | BlackRock Intermediate Bond Portfolio II | BlackRock Strategic Income Portfolio | ||
| BlackRock GNMA Portfolio | BlackRock Intermediate Government | BlackRock Total Return Fund | ||
| BlackRock Government Income Portfolio | Bond Portfolio | BlackRock Total Return Portfolio II | ||
| BlackRock High Income Fund | BlackRock International Bond Portfolio | BlackRock World Income Fund | ||
| BlackRock High Yield Bond Portfolio | BlackRock Long Duration Bond Portfolio | |||
| BlackRock Income Portfolio | BlackRock Low Duration Bond Portfolio | |||
| Municipal Bond Funds | ||||
| BlackRock AMT-Free Municipal Bond Portfolio | BlackRock Intermediate Municipal Fund | BlackRock New York Municipal Bond Fund | ||
| BlackRock California Insured Municipal Bond Fund | BlackRock Kentucky Municipal Bond Portfolio | BlackRock Ohio Municipal Bond Portfolio | ||
| BlackRock Delaware Municipal Bond Portfolio | BlackRock Municipal Insured Fund | BlackRock Pennsylvania Municipal Bond Fund | ||
| BlackRock Florida Municipal Bond Fund | BlackRock National Municipal Fund | BlackRock Short-Term Municipal Fund | ||
| BlackRock High Yield Municipal Fund | BlackRock New Jersey Municipal Bond Fund | |||
| Target Risk & Target Date Funds | ||||
| BlackRock Prepared Portfolios | BlackRock Lifecycle Prepared Portfolios | |||
| Conservative Prepared Portfolio | Prepared Portfolio 2010 | Prepared Portfolio 2030 | ||
| Moderate Prepared Portfolio | Prepared Portfolio 2015 | Prepared Portfolio 2035 | ||
| Growth Prepared Portfolio | Prepared Portfolio 2020 | Prepared Portfolio 2040 | ||
| Aggressive Growth Prepared Portfolio | Prepared Portfolio 2025 | Prepared Portfolio 2045 | ||
| Prepared Portfolio 2050 | ||||
| * See the prospectus for information on specific limitations on investments in the fund. | ||||
| † Mixed asset fund. | ||||
BlackRock mutual funds are distributed by BlackRock Distributors, Inc. and certain funds are also distributed by FAM Distributors, Inc. You should consider the investment objectives, risks, charges and expenses of the funds under consideration carefully before investing. Each fund’s prospectus contains this and other information and is available at www.blackrock.com or by calling (800) 882-0052 or from your financial advisor. The prospectus should be read carefully before investing.
34 BLACKROCK INTERNATIONAL VALUE FUND
| JUNE 30, 2008 |

| This report is not authorized for use as an offer of sale or a solici- tation of an offer to buy shares of the Fund unless accompanied or preceded by the Fund’s current prospectus. Past performance results shown in this report should not be considered a representa- tion of future performance. Investment return and principal value of shares will fluctuate so that shares, when redeemed, may be worth more or less than their original cost. Statements and other information herein are as dated and are subject to change. Investment in foreign securities involves special risks including fluctuating foreign exchange rates, foreign government regulations, differing degrees of liquidity and the possibility of substantial volatility due to adverse political, economic or other developments. BlackRock International Value Fund Of BlackRock International Value Trust 100 Bellevue Parkway Wilmington, DE 19809 |

#IV-1030-6/08
| Item 2 – Code of Ethics – The registrant (or the “Fund”) has adopted a code of ethics, as of the end of the period covered by this report, applicable to the registrant's principal executive officer, principal financial officer and principal accounting officer, or persons performing similar functions. During the period covered by this report, there have been no amendments to or waivers granted under the code of ethics. A copy of the code of ethics is available without charge at www.blackrock.com. Item 3 – Audit Committee Financial Expert – The registrant's board of directors or trustees, as applicable (the “board of directors”) has determined that (i) the registrant has the following audit committee financial experts serving on its audit committee and (ii) each audit committee financial expert is independent: Joe Grills (not reappointed to the Audit Committee, effective November 1, 2007) Robert M. Hernandez (term began, effective November 1, 2007) Robert S. Salomon, Jr. (term ended, effective November 1, 2007) Fred G. Weiss (term began, effective November 1, 2007) Richard R. West (term began, effective November 1, 2007) Under applicable securities laws, a person determined to be an audit committee financial expert will not be deemed an “expert” for any purpose, including without limitation for the purposes of Section 11 of the Securities Act of 1933, as a result of being designated or identified as an audit committee financial expert. The designation or identification as an audit committee financial expert does not impose on such person any duties, obligations, or liabilities greater than the duties, obligations, and liabilities imposed on such person as a member of the audit committee and board of directors in the absence of such designation or identification. Item 4 – Principal Accountant Fees and Services |
| (a) Audit Fees | (b) Audit-Related Fees1 | (c) Tax Fees2 | (d) All Other Fees3 | |||||||||||||
| Current | Previous | Current | Previous | Current | Previous | Current | Previous | |||||||||
| Fiscal Year | Fiscal Year | Fiscal Year | Fiscal Year | Fiscal Year | Fiscal Year | Fiscal Year | Fiscal Year | |||||||||
| Entity Name | End | End | End | End | End | End | End | End | ||||||||
| BlackRock | ||||||||||||||||
| International Value | $35,300 | $36,500 | $0 | $0 | $6,100 | $6,100 | $1,049 | $1,042 | ||||||||
| Fund | ||||||||||||||||
| 1 The nature of the services include assurance and related services reasonably related to the performance of the audit of financial statements not included in Audit Fees. 2 The nature of the services include tax compliance, tax advice and tax planning. 3 The nature of the services include a review of compliance procedures and attestation thereto. (e)(1) Audit Committee Pre-Approval Policies and Procedures: The registrant’s audit committee (the “Committee”) has adopted policies and procedures with regard to the pre-approval of services. Audit, audit-related and tax compliance services provided to the registrant on an annual basis require specific pre- approval by the Committee. The Committee also must approve other non-audit services provided to the registrant and those non-audit services provided to the registrant’s affiliated service providers that relate directly to the operations and the financial reporting of the registrant. Certain of these non-audit services that the Committee believes are a) consistent with the SEC’s auditor independence rules and b) routine and recurring services that will not impair the independence of the independent accountants may be approved by the Committee without consideration on a specific case-by-case basis (“general pre-approval”). The term of any general pre-approval is 12 months from the date of the pre-approval, unless |
the Committee provides for a different period. Tax or other non-audit services provided to
the registrant which have a direct impact on the operation or financial reporting of the
registrant will only be deemed pre-approved provided that any individual project does not
exceed $10,000 attributable to the registrant or $50,000 for all of the registrants the
Committee oversees. For this purpose, multiple projects will be aggregated to determine if
they exceed the previously mentioned cost levels.
Any proposed services exceeding the pre-approved cost levels will require specific
pre-approval by the Committee, as will any other services not subject to general pre-
approval (e.g., unanticipated but permissible services). The Committee is informed of each
service approved subject to general pre-approval at the next regularly scheduled in-person
board meeting. At this meeting, an analysis of such services is presented to the Committee
for ratification. The Committee may delegate to one or more of its members the authority to
approve the provision of and fees for any specific engagement of permitted non-audit
services, including services exceeding pre-approved cost levels.
(e)(2) None of the services described in each of Items 4(b) through (d) were approved by
the audit committee pursuant to paragraph (c)(7)(i)(C) of Rule 2-01 of Regulation S-X.
(f) Not Applicable
(g) Affiliates’ Aggregate Non-Audit Fees:
| Current Fiscal Year | Previous Fiscal Year | |||
| Entity Name | End | End | ||
| BlackRock International Value | ||||
| Fund | $294,649 | $2,968,042 | ||
| (h) The registrant’s audit committee has considered and determined that the provision of non-audit services that were rendered to the registrant’s investment adviser (not including any non-affiliated sub-adviser whose role is primarily portfolio management and is subcontracted with or overseen by the registrant’s investment adviser), and any entity controlling, controlled by, or under common control with the investment adviser that provides ongoing services to the registrant that were not pre-approved pursuant to paragraph (c)(7)(ii) of Rule 2-01 of Regulation S-X is compatible with maintaining the principal accountant’s independence. Regulation S-X Rule 2-01(c)(7)(ii) – $287,500, 0% Item 5 – Audit Committee of Listed Registrants – Not Applicable Item 6 – Investments (a) The registrant’s Schedule of Investments is included as part of the Report to Stockholders filed under Item 1 of this form. (b) Not Applicable due to no such divestments during the semi-annual period covered since the previous Form N-CSR filing. Item 7 – Disclosure of Proxy Voting Policies and Procedures for Closed-End Management Investment Companies – Not Applicable Item 8 – Portfolio Managers of Closed-End Management Investment Companies – Not Applicable |
| Item 9 – Purchases of Equity Securities by Closed-End Management Investment Company and Affiliated Purchasers – Not Applicable Item 10 – Submission of Matters to a Vote of Security Holders – The registrant’s Nominating and Governance Committee will consider nominees to the board of directors recommended by shareholders when a vacancy becomes available. Shareholders who wish to recommend a nominee should send nominations that include biographical information and set forth the qualifications of the proposed nominee to the registrant’s Secretary. There have been no material changes to these procedures. Item 11 – Controls and Procedures 11(a) – The registrant’s principal executive and principal financial officers or persons performing similar functions have concluded that the registrant’s disclosure controls and procedures (as defined in Rule 30a-3(c) under the Investment Company Act of 1940, as amended (the “1940 Act”)) are effective as of a date within 90 days of the filing of this report based on the evaluation of these controls and procedures required by Rule 30a-3(b) under the 1940 Act and Rule 15d-15(b) under the Securities Exchange Act of 1934, as amended. 11(b) – There were no changes in the registrant’s internal control over financial reporting (as defined in Rule 30a-3(d) under the 1940 Act) that occurred during the second fiscal quarter of the period covered by this report that have materially affected, or are reasonably likely to materially affect, the registrant’s internal control over financial reporting. Item 12 – Exhibits attached hereto 12(a)(1) – Code of Ethics – See Item 2 12(a)(2) – Certifications – Attached hereto 12(a)(3) – Not Applicable 12(b) – Certifications – Attached hereto |
| Pursuant to the requirements of the Securities Exchange Act of 1934 and the Investment Company Act of 1940, the registrant has duly caused this report to be signed on its behalf by the undersigned, thereunto duly authorized. BlackRock International Value Fund of BlackRock International Value Trust By: /s/ Donald C. Burke Donald C. Burke Chief Executive Officer of BlackRock International Value Fund of BlackRock International Value Trust Date: August 22, 2008 Pursuant to the requirements of the Securities Exchange Act of 1934 and the Investment Company Act of 1940, this report has been signed below by the following persons on behalf of the registrant and in the capacities and on the dates indicated. By: /s/ Donald C. Burke Donald C. Burke Chief Executive Officer (principal executive officer) of BlackRock International Value Fund of BlackRock International Value Trust Date: August 22, 2008 By: /s/ Neal J. Andrews Neal J. Andrews Chief Financial Officer (principal financial officer) of BlackRock International Value Fund of BlackRock International Value Trust Date: August 22, 2008 |