UNITED STATES
SECURITIES AND EXCHANGE COMMISSION
Washington, D.C. 20549
FORM N-CSR
CERTIFIED SHAREHOLDER REPORT OF REGISTERED
MANAGEMENT INVESTMENT COMPANIES
Investment Company Act file number 811-4186
John Hancock Income Securities Trust
(Exact name of registrant as specified in charter)
601 Congress Street, Boston, Massachusetts 02210
(Address of principal executive offices) (Zip code)
Salvatore Schiavone
Treasurer
601 Congress Street
Boston, Massachusetts 02210
(Name and address of agent for service)
Registrant's telephone number, including area code: 617-663-4497
| Date of fiscal year end: | October 31 |
| Date of reporting period: | April 30, 2017 |


A message to shareholders
Dear shareholder,
Bond markets around the world enjoyed generally positive returns in recent months, based on a combination of strengthening economic growth and mostly low inflation. Foreign bonds were aided further by rising currencies relative to the U.S. dollar and by the attraction of higher yields in emerging markets.
In the United States, the steady drumbeat of economic growth convinced the U.S. Federal Reserve (Fed) to raise short-term interest rates by a quarter of a percentage point in December and again in March, and to hint at two more rate hikes later this year. The Fed has been working to normalize monetary policy for several years in the face of a much-improved economic picture, while central banks in other parts of the world continue to stimulate growth through accommodative measures.
At John Hancock Investments, we believe one of the best ways to navigate today's fixed-income environment is by casting a wider net; your financial advisor can make sure that your fixed-income allocations are appropriate for your investment goals and that they appropriately balance the need for income with market risks.
On behalf of everyone at John Hancock Investments, I'd like to take this opportunity to thank you for the continued trust you've placed in us.
Sincerely,

Andrew G. Arnott
President and Chief Executive Officer
John Hancock Investments
This commentary reflects the CEO's views, which are subject to change at any time. Investing involves risks, including the potential loss of principal. Diversification does not guarantee a profit or eliminate the risk of a loss. For more up-to-date information, please visit our website at jhinvestments.com.
John Hancock
Income Securities Trust
INVESTMENT OBJECTIVE
The fund seeks to generate a high level of current income consistent with prudent investment risk.
AVERAGE ANNUAL TOTAL RETURNS AS OF 4/30/17 (%)
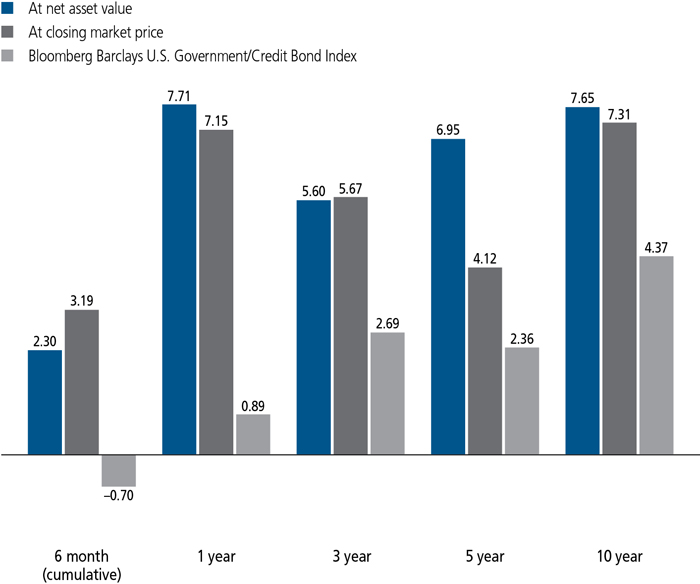
The Bloomberg Barclays U.S. Government/Credit Bond Index is an unmanaged index of U.S. government bonds, U.S. corporate bonds, and Yankee bonds.
It is not possible to invest directly in an index. Index figures do not reflect expenses or sales charges, which would result in lower returns.
The fund's performance at net asset value (NAV) is different from the fund's performance at closing market price because the closing market price is subject to the dynamics of secondary market trading. If a shareholder purchases shares at a time when the market price is at a premium to the NAV or sells shares at a time when the market price is at a discount to the NAV, the shareholder may sustain losses.
The performance data contained within this material represents past performance, which does not guarantee future results.
PERFORMANCE HIGHLIGHTS OVER THE LAST SIX MONTHS
The bond market delivered mixed results during the period
While the improving growth outlook contributed to a downturn in U.S. Treasuries, it boosted the performance of high-yield bonds.
The fund's emphasis on the credit sectors drove performance
Allocations to investment-grade corporate and high-yield bonds helped the fund deliver a positive absolute return for the period.
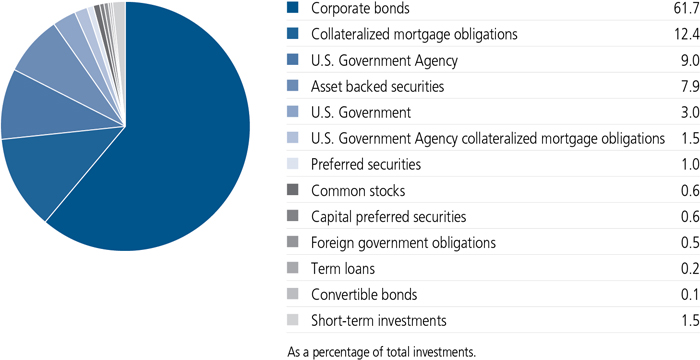
PORTFOLIO COMPOSITION AS OF 4/30/17 (%)
A note about risks
As is the case with all closed-end funds, shares of this fund may trade at a discount or a premium to the fund's net asset value (NAV). An investment in the fund is subject to investment and market risks, including the possible loss of the entire principal invested. There is no guarantee prior distribution levels will be maintained, and distributions may include a substantial return of capital. Fixed-income investments are subject to interest-rate and credit risk; their value will normally decline as interest rates rise or if a creditor, grantor, or counterparty is unable or unwilling to make principal, interest, or settlement payments. Investments in higher-yielding, lower-rated securities are subject to a higher risk of default. An issuer of securities held by the fund may default, have its credit rating downgraded, or otherwise perform poorly, which may affect fund performance. Liquidity—the extent to which a security may be sold or a derivative position closed without negatively affecting its market value—may be impaired by reduced trading volume, heightened volatility, rising interest rates, and other market conditions. The fund's use of leverage creates additional risks, including greater volatility of the fund's NAV, market price, and returns. There is no assurance that the fund's leverage strategy will be successful. Hedging, derivatives, and other strategic transactions may increase a fund's volatility and could produce disproportionate losses, potentially more than the fund's principal investment.
An interview with Portfolio Manager Jeffrey N. Given, CFA, John Hancock Asset Management a division of Manulife Asset Management (US) LLC

Jeffrey N. Given, CFA
Portfolio Manager
John Hancock Asset Management
How would you describe market conditions during the six months ended April 30, 2017?
The defining event occurred in the early days of the reporting period, with the election of Donald Trump as president of the United States and the Republican sweep of Congress. These surprising developments prompted investors to anticipate lower taxes, increased fiscal spending, accelerating economic growth, and a more aggressive approach to interest-rate policy by the U.S. Federal Reserve (Fed). U.S. Treasury yields spiked in response. At the same time, the combination of a stronger economic outlook and improving investor sentiment sparked a rally in high-yield bonds and helped support the relative performance of other credit-sensitive categories.
The fixed-income market subsequently stabilized in the latter half of the period, with U.S. Treasuries becoming less volatile and the credit sectors continuing to post gains. The initial expectations that the Republican election victory would fuel a dramatic shift toward pro-growth policies gradually eased as it became evident that implementation of the GOP agenda would prove more challenging than first thought. A consensus gradually emerged that economic growth would remain healthy, but not so strong as to prompt the Fed to raise interest rates more than three times in 2017. The Fed boosted rates by a quarter point at its March meeting, but the move elicited little in the way of a market reaction.
What factors helped and hurt the fund's performance?
In this environment, the fund returned 2.30% for the period. The fund's position in high-yield bonds (generally those rated BB and below) was the largest contributor.
Positions in debt issued by 21st Century Fox America, Inc. and the industrial equipment rental provider Ahern Rentals, Inc. were notable contributors, as was our overall selection in the industrials and financials sectors. Positions in select emerging-market issuers, while a small portion of the portfolio, also contributed positively.
How would you summarize your portfolio activity?
We made few significant changes to the portfolio during the period, opting instead to enact incremental shifts at the individual security level. We continue to emphasize investment-grade corporate and high-yield bonds, which we believe offer a potential performance advantage in a low-return environment where yields will likely make up a meaningful component of total returns. Corporate and high-yield bonds also remain supported by healthy economic conditions and companies' efforts to maintain balance sheet discipline. These factors create the foundation for the investment-grade and high-yield segments to outperform.
The remainder of the portfolio is focused on securitized assets. We hold a meaningful position in commercial mortgage-backed securities, with a focus on areas where our research shows a favorable trade-off of risk relative to return potential. For example, we have emphasized securities
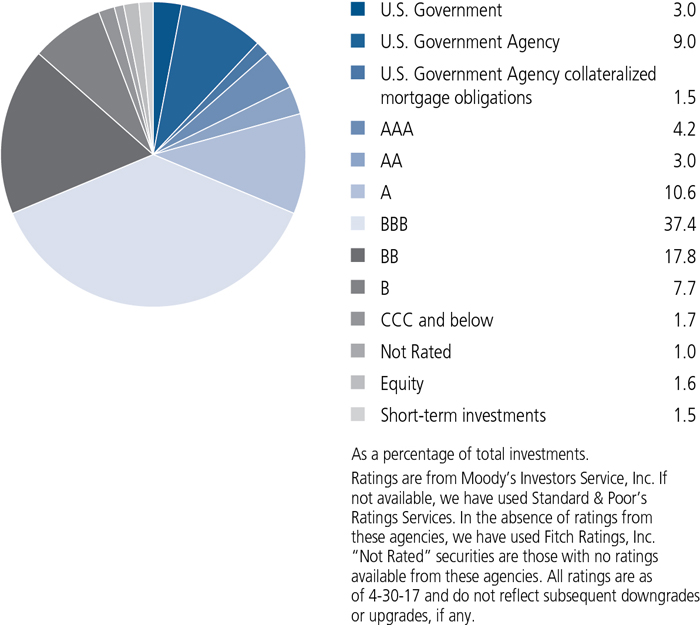
QUALITY COMPOSITION AS OF 4/30/17 (%)
The fund continues to hold an allocation to agency mortgage-backed securities, but we have been letting the positions roll off. We anticipate that the Fed—which has been buying about a third of new mortgage-backed security issuance—will begin to take a less active role. Given that yield spreads are close to 20-year lows, we believe there is little room for upside with a major buyer set to reduce its presence in the market.
What is your broader view on the investment backdrop?
Our overall positioning is based on our view that the bond market is likely to stay trapped within a broad range for some time. On one hand, the upside of interest-rate-sensitive assets may be capped by the prospect of tighter Fed policy through the remainder of 2017. At the same time, we think the downside potential is limited by the fairly low level of inflation. Although inflation has indeed picked up in recent months, much of the gain is attributable to the year-over-year increase in energy prices—a factor that should diminish as we move past the anniversary of the June 2016 peak in the oil price.
In addition, gross domestic product growth remains below the long-term trend and has not yet shown evidence that it can reach the 3%-4% levels many investors initially thought was possible in the immediate aftermath of the election. With this as background, we continue to see the most
COUNTRY COMPOSITION AS OF 4/30/17 (%)
| United States | 85.2 |
| France | 2.6 |
| Netherlands | 2.6 |
| United Kingdom | 2.5 |
| Canada | 1.5 |
| Other countries | 5.6 |
| TOTAL | 100.0 |
| As a percentage of total investments. |
compelling potential in investment-grade and high-yield corporate bonds due to their above-average yields and ability to benefit from a backdrop of slow but steady economic growth.
MANAGED BY
| | Jeffrey N. Given, CFA On the fund since 2002 Investing since 1993 |
 | Howard C. Greene, CFA On the fund since 2002 Investing since 1979 |
![]()
Fund's investments
| As of 4-30-17 (unaudited) | |||||||||||||||||||||||||||||
| Rate (%) | Maturity date | Par value^ | Value | ||||||||||||||||||||||||||
| Corporate bonds 92.4% (61.7% of Total investments) | $165,710,140 | ||||||||||||||||||||||||||||
| (Cost $160,345,373) | |||||||||||||||||||||||||||||
| Consumer discretionary 9.9% | 17,707,430 | ||||||||||||||||||||||||||||
| Auto components 0.5% | |||||||||||||||||||||||||||||
| Lear Corp. (Z) | 5.250 | 01-15-25 | 273,000 | 289,554 | |||||||||||||||||||||||||
| Nemak SAB de CV (L)(S)(Z) | 5.500 | 02-28-23 | 306,000 | 315,945 | |||||||||||||||||||||||||
| ZF North America Capital, Inc. (S) | 4.750 | 04-29-25 | 280,000 | 291,220 | |||||||||||||||||||||||||
| Automobiles 1.9% | |||||||||||||||||||||||||||||
| Ford Motor Company (Z) | 4.750 | 01-15-43 | 145,000 | 136,536 | |||||||||||||||||||||||||
| Ford Motor Credit Company LLC (Z) | 5.875 | 08-02-21 | 928,000 | 1,032,571 | |||||||||||||||||||||||||
| General Motors Company (Z) | 4.875 | 10-02-23 | 650,000 | 693,357 | |||||||||||||||||||||||||
| General Motors Company (Z) | 6.250 | 10-02-43 | 380,000 | 415,085 | |||||||||||||||||||||||||
| General Motors Financial Company, Inc. (Z) | 4.000 | 01-15-25 | 560,000 | 563,838 | |||||||||||||||||||||||||
| General Motors Financial Company, Inc. (Z) | 4.300 | 07-13-25 | 481,000 | 489,648 | |||||||||||||||||||||||||
| Diversified consumer services 0.2% | |||||||||||||||||||||||||||||
| Laureate Education, Inc. (L)(S)(Z) | 8.250 | 05-01-25 | 170,000 | 174,675 | |||||||||||||||||||||||||
| Service Corp. International | 5.375 | 05-15-24 | 240,000 | 253,500 | |||||||||||||||||||||||||
| Hotels, restaurants and leisure 1.3% | |||||||||||||||||||||||||||||
| CCM Merger, Inc. (S) | 6.000 | 03-15-22 | 195,000 | 201,338 | |||||||||||||||||||||||||
| Chester Downs & Marina LLC (S) | 9.250 | 02-01-20 | 280,000 | 286,650 | |||||||||||||||||||||||||
| Eldorado Resorts, Inc. | 7.000 | 08-01-23 | 130,000 | 140,400 | |||||||||||||||||||||||||
| Gateway Casinos & Entertainment, Ltd. (S) | 8.250 | 03-01-24 | 160,000 | 163,600 | |||||||||||||||||||||||||
| GLP Capital LP (L)(Z) | 5.375 | 04-15-26 | 255,000 | 269,025 | |||||||||||||||||||||||||
| Hilton Grand Vacations Borrower LLC (S) | 6.125 | 12-01-24 | 130,000 | 138,450 | |||||||||||||||||||||||||
| International Game Technology PLC (S) | 6.500 | 02-15-25 | 225,000 | 246,375 | |||||||||||||||||||||||||
| Jacobs Entertainment, Inc. (S) | 7.875 | 02-01-24 | 64,000 | 66,880 | |||||||||||||||||||||||||
| Mohegan Tribal Gaming Authority (L)(S)(Z) | 7.875 | 10-15-24 | 310,000 | 317,363 | |||||||||||||||||||||||||
| Seminole Tribe of Florida, Inc. (S) | 6.535 | 10-01-20 | 400,000 | 408,000 | |||||||||||||||||||||||||
| Waterford Gaming LLC (H)(S) | 8.625 | 09-15-14 | 99,739 | 0 | |||||||||||||||||||||||||
| Household durables 0.2% | |||||||||||||||||||||||||||||
| Beazer Homes USA, Inc. | 8.750 | 03-15-22 | 370,000 | 411,625 | |||||||||||||||||||||||||
| Internet and direct marketing retail 0.9% | |||||||||||||||||||||||||||||
| Expedia, Inc. | 5.000 | 02-15-26 | 705,000 | 756,829 | |||||||||||||||||||||||||
| QVC, Inc. (L)(Z) | 4.375 | 03-15-23 | 325,000 | 327,137 | |||||||||||||||||||||||||
| QVC, Inc. | 5.125 | 07-02-22 | 255,000 | 267,310 | |||||||||||||||||||||||||
| QVC, Inc. | 5.450 | 08-15-34 | 315,000 | 291,352 | |||||||||||||||||||||||||
| Leisure products 0.2% | |||||||||||||||||||||||||||||
| Vista Outdoor, Inc. (L)(Z) | 5.875 | 10-01-23 | 255,000 | 253,725 | |||||||||||||||||||||||||
| Media 4.3% | |||||||||||||||||||||||||||||
| 21st Century Fox America, Inc. | 7.750 | 01-20-24 | 1,020,000 | 1,251,293 | |||||||||||||||||||||||||
| Altice Financing SA (L)(S)(Z) | 6.625 | 02-15-23 | 200,000 | 211,750 | |||||||||||||||||||||||||
| Rate (%) | Maturity date | Par value^ | Value | ||||||||||||||||||||||||||
| Consumer discretionary (continued) | |||||||||||||||||||||||||||||
| Media (continued) | |||||||||||||||||||||||||||||
| Cengage Learning, Inc. (L)(S)(Z) | 9.500 | 06-15-24 | 265,000 | $239,163 | |||||||||||||||||||||||||
| Charter Communications Operating LLC | 6.484 | 10-23-45 | 606,000 | 709,413 | |||||||||||||||||||||||||
| Clear Channel Worldwide Holdings, Inc. (L)(Z) | 6.500 | 11-15-22 | 289,000 | 299,476 | |||||||||||||||||||||||||
| Lions Gate Entertainment Corp. (L)(S)(Z) | 5.875 | 11-01-24 | 147,000 | 152,513 | |||||||||||||||||||||||||
| McGraw-Hill Global Education Holdings LLC (L)(S)(Z) | 7.875 | 05-15-24 | 75,000 | 73,031 | |||||||||||||||||||||||||
| MDC Partners, Inc. (L)(S)(Z) | 6.500 | 05-01-24 | 270,000 | 263,250 | |||||||||||||||||||||||||
| Midcontinent Communications (S) | 6.875 | 08-15-23 | 140,000 | 150,150 | |||||||||||||||||||||||||
| Myriad International Holdings BV (S) | 5.500 | 07-21-25 | 400,000 | 423,700 | |||||||||||||||||||||||||
| Omnicom Group, Inc. (Z) | 3.600 | 04-15-26 | 285,000 | 287,178 | |||||||||||||||||||||||||
| Sinclair Television Group, Inc. (S) | 5.625 | 08-01-24 | 335,000 | 348,350 | |||||||||||||||||||||||||
| Sirius XM Radio, Inc. (S)(Z) | 5.250 | 08-15-22 | 845,000 | 868,238 | |||||||||||||||||||||||||
| Sirius XM Radio, Inc. (S) | 5.375 | 04-15-25 | 265,000 | 271,956 | |||||||||||||||||||||||||
| Sirius XM Radio, Inc. (L)(S)(Z) | 5.375 | 07-15-26 | 375,000 | 383,906 | |||||||||||||||||||||||||
| Time Warner Cable LLC | 8.250 | 04-01-19 | 375,000 | 416,482 | |||||||||||||||||||||||||
| Time Warner, Inc. (Z) | 3.800 | 02-15-27 | 370,000 | 368,361 | |||||||||||||||||||||||||
| Viacom, Inc. (Z) | 4.375 | 03-15-43 | 518,000 | 460,778 | |||||||||||||||||||||||||
| WMG Acquisition Corp. (S) | 4.875 | 11-01-24 | 165,000 | 167,063 | |||||||||||||||||||||||||
| WMG Acquisition Corp. (S) | 6.750 | 04-15-22 | 370,000 | 390,391 | |||||||||||||||||||||||||
| Specialty retail 0.4% | |||||||||||||||||||||||||||||
| L Brands, Inc. | 6.625 | 04-01-21 | 475,000 | 522,500 | |||||||||||||||||||||||||
| L Brands, Inc. (L)(Z) | 6.875 | 11-01-35 | 250,000 | 246,500 | |||||||||||||||||||||||||
| Consumer staples 4.6% | 8,200,593 | ||||||||||||||||||||||||||||
| Beverages 2.1% | |||||||||||||||||||||||||||||
| Anheuser-Busch InBev Finance, Inc. (Z) | 4.900 | 02-01-46 | 880,000 | 961,206 | |||||||||||||||||||||||||
| Coca-Cola European Partners US LLC (Z) | 4.500 | 09-01-21 | 1,000,000 | 1,078,979 | |||||||||||||||||||||||||
| Molson Coors Brewing Company (Z) | 1.450 | 07-15-19 | 165,000 | 162,965 | |||||||||||||||||||||||||
| Molson Coors Brewing Company (Z) | 3.000 | 07-15-26 | 390,000 | 373,309 | |||||||||||||||||||||||||
| Pernod Ricard SA (S)(Z) | 5.750 | 04-07-21 | 1,125,000 | 1,257,179 | |||||||||||||||||||||||||
| Food and staples retailing 0.9% | |||||||||||||||||||||||||||||
| CVS Health Corp. (Z) | 2.875 | 06-01-26 | 255,000 | 245,870 | |||||||||||||||||||||||||
| CVS Health Corp. (Z) | 5.125 | 07-20-45 | 510,000 | 569,869 | |||||||||||||||||||||||||
| SUPERVALU, Inc. (L)(Z) | 7.750 | 11-15-22 | 170,000 | 174,144 | |||||||||||||||||||||||||
| Whole Foods Market, Inc. (Z) | 5.200 | 12-03-25 | 500,000 | 523,893 | |||||||||||||||||||||||||
| Food products 1.1% | |||||||||||||||||||||||||||||
| Bunge, Ltd. Finance Corp. (Z) | 8.500 | 06-15-19 | 389,000 | 438,589 | |||||||||||||||||||||||||
| Kraft Heinz Foods Company (S)(Z) | 4.875 | 02-15-25 | 221,000 | 236,637 | |||||||||||||||||||||||||
| Kraft Heinz Foods Company (Z) | 5.200 | 07-15-45 | 378,000 | 399,136 | |||||||||||||||||||||||||
| Mondelez International Holdings Netherlands BV (S)(Z) | 1.625 | 10-28-19 | 380,000 | 374,469 | |||||||||||||||||||||||||
| Post Holdings, Inc. (S) | 5.750 | 03-01-27 | 175,000 | 181,344 | |||||||||||||||||||||||||
| Post Holdings, Inc. (S) | 7.750 | 03-15-24 | 345,000 | 383,381 | |||||||||||||||||||||||||
| �� | |||||||||||||||||||||||||||||
| Rate (%) | Maturity date | Par value^ | Value | ||||||||||||||||||||||||||
| Consumer staples (continued) | |||||||||||||||||||||||||||||
| Household products 0.1% | |||||||||||||||||||||||||||||
| Kronos Acquisition Holdings, Inc. (S) | 9.000 | 08-15-23 | 214,000 | $217,210 | |||||||||||||||||||||||||
| Personal products 0.3% | |||||||||||||||||||||||||||||
| Revlon Consumer Products Corp. | 5.750 | 02-15-21 | 260,000 | 258,700 | |||||||||||||||||||||||||
| Revlon Consumer Products Corp. (L)(Z) | 6.250 | 08-01-24 | 225,000 | 218,813 | |||||||||||||||||||||||||
| Tobacco 0.1% | |||||||||||||||||||||||||||||
| Vector Group, Ltd. (S) | 6.125 | 02-01-25 | 140,000 | 144,900 | |||||||||||||||||||||||||
| Energy 10.7% | 19,277,200 | ||||||||||||||||||||||||||||
| Energy equipment and services 0.1% | |||||||||||||||||||||||||||||
| Antero Midstream Partners LP (S) | 5.375 | 09-15-24 | 275,000 | 281,188 | |||||||||||||||||||||||||
| Oil, gas and consumable fuels 10.6% | |||||||||||||||||||||||||||||
| Boardwalk Pipelines LP (Z) | 4.450 | 07-15-27 | 136,000 | 139,130 | |||||||||||||||||||||||||
| Cenovus Energy, Inc. | 4.450 | 09-15-42 | 380,000 | 328,062 | |||||||||||||||||||||||||
| Cheniere Corpus Christi Holdings LLC (S) | 5.875 | 03-31-25 | 160,000 | 170,600 | |||||||||||||||||||||||||
| Cimarex Energy Company (Z) | 4.375 | 06-01-24 | 235,000 | 246,757 | |||||||||||||||||||||||||
| Colorado Interstate Gas Company LLC (S)(Z) | 4.150 | 08-15-26 | 233,000 | 230,632 | |||||||||||||||||||||||||
| Columbia Pipeline Group, Inc. (Z) | 4.500 | 06-01-25 | 540,000 | 571,715 | |||||||||||||||||||||||||
| Continental Resources, Inc. (L)(Z) | 5.000 | 09-15-22 | 548,000 | 552,795 | |||||||||||||||||||||||||
| DCP Midstream Operating LP | 2.700 | 04-01-19 | 310,000 | 309,225 | |||||||||||||||||||||||||
| DCP Midstream Operating LP (S) | 9.750 | 03-15-19 | 405,000 | 458,663 | |||||||||||||||||||||||||
| DCP Midstream Operating LP (5.850% to 5-21-23, then 3 month LIBOR + 3.850%) (S) | 5.850 | 05-21-43 | 370,000 | 353,350 | |||||||||||||||||||||||||
| Enbridge Energy Partners LP (Z) | 4.375 | 10-15-20 | 260,000 | 274,209 | |||||||||||||||||||||||||
| Enbridge Energy Partners LP (8.050% to 10-1-17, then 3 month LIBOR + 3.797%) | 8.050 | 10-01-77 | 265,000 | 261,688 | |||||||||||||||||||||||||
| Enbridge, Inc. (Z) | 4.250 | 12-01-26 | 295,000 | 307,613 | |||||||||||||||||||||||||
| Energy Transfer LP (Z) | 5.150 | 03-15-45 | 345,000 | 331,027 | |||||||||||||||||||||||||
| Energy Transfer Partners LP (Z) | 4.200 | 04-15-27 | 130,000 | 131,432 | |||||||||||||||||||||||||
| Energy Transfer Partners LP (Z) | 9.700 | 03-15-19 | 425,000 | 482,052 | |||||||||||||||||||||||||
| EnLink Midstream Partners LP | 4.850 | 07-15-26 | 310,000 | 325,753 | |||||||||||||||||||||||||
| Enterprise Products Operating LLC (P)(Z) | 4.742 | 08-01-66 | 440,000 | 440,000 | |||||||||||||||||||||||||
| Gulfport Energy Corp. (L)(S)(Z) | 6.000 | 10-15-24 | 80,000 | 78,800 | |||||||||||||||||||||||||
| Kerr-McGee Corp. | 6.950 | 07-01-24 | 1,035,000 | 1,231,932 | |||||||||||||||||||||||||
| Kinder Morgan Energy Partners LP (Z) | 3.500 | 03-01-21 | 500,000 | 511,262 | |||||||||||||||||||||||||
| Kinder Morgan Energy Partners LP (Z) | 7.750 | 03-15-32 | 195,000 | 248,040 | |||||||||||||||||||||||||
| Kinder Morgan, Inc. (Z) | 4.300 | 06-01-25 | 220,000 | 229,154 | |||||||||||||||||||||||||
| Kinder Morgan, Inc. (Z) | 5.550 | 06-01-45 | 465,000 | 492,451 | |||||||||||||||||||||||||
| Lukoil International Finance BV (S) | 3.416 | 04-24-18 | 675,000 | 681,716 | |||||||||||||||||||||||||
| Newfield Exploration Company | 5.625 | 07-01-24 | 82,000 | 86,664 | |||||||||||||||||||||||||
| Newfield Exploration Company | 5.750 | 01-30-22 | 115,000 | 122,188 | |||||||||||||||||||||||||
| Occidental Petroleum Corp. (Z) | 3.400 | 04-15-26 | 310,000 | 313,677 | |||||||||||||||||||||||||
| ONEOK Partners LP (Z) | 5.000 | 09-15-23 | 162,000 | 175,207 | |||||||||||||||||||||||||
| Petro-Canada (Z) | 9.250 | 10-15-21 | 1,000,000 | 1,262,284 | |||||||||||||||||||||||||
| Rate (%) | Maturity date | Par value^ | Value | ||||||||||||||||||||||||||
| Energy (continued) | |||||||||||||||||||||||||||||
| Oil, gas and consumable fuels (continued) | |||||||||||||||||||||||||||||
| Petrobras Global Finance BV | 5.625 | 05-20-43 | 435,000 | $363,769 | |||||||||||||||||||||||||
| Petrobras Global Finance BV (L)(Z) | 7.375 | 01-17-27 | 250,000 | 268,250 | |||||||||||||||||||||||||
| Petroleos Mexicanos (L)(Z) | 4.875 | 01-24-22 | 325,000 | 335,888 | |||||||||||||||||||||||||
| Petroleos Mexicanos (L)(S)(Z) | 5.375 | 03-13-22 | 85,000 | 89,356 | |||||||||||||||||||||||||
| Regency Energy Partners LP (Z) | 5.000 | 10-01-22 | 95,000 | 101,311 | |||||||||||||||||||||||||
| Regency Energy Partners LP (Z) | 5.500 | 04-15-23 | 490,000 | 510,134 | |||||||||||||||||||||||||
| Regency Energy Partners LP (Z) | 5.875 | 03-01-22 | 90,000 | 99,122 | |||||||||||||||||||||||||
| Resolute Energy Corp. | 8.500 | 05-01-20 | 180,000 | 183,600 | |||||||||||||||||||||||||
| Sabine Pass Liquefaction LLC (L)(S)(Z) | 4.200 | 03-15-28 | 347,000 | 347,495 | |||||||||||||||||||||||||
| Sabine Pass Liquefaction LLC (S) | 5.000 | 03-15-27 | 196,000 | 206,855 | |||||||||||||||||||||||||
| Sabine Pass Liquefaction LLC | 5.750 | 05-15-24 | 170,000 | 187,913 | |||||||||||||||||||||||||
| Shell International Finance BV (Z) | 4.375 | 05-11-45 | 725,000 | 744,207 | |||||||||||||||||||||||||
| Summit Midstream Holdings LLC | 5.750 | 04-15-25 | 255,000 | 258,188 | |||||||||||||||||||||||||
| Sunoco Logistics Partners Operations LP (Z) | 3.900 | 07-15-26 | 460,000 | 455,997 | |||||||||||||||||||||||||
| Sunoco Logistics Partners Operations LP (Z) | 4.400 | 04-01-21 | 377,000 | 398,507 | |||||||||||||||||||||||||
| Tallgrass Energy Partners LP (S) | 5.500 | 09-15-24 | 130,000 | 130,650 | |||||||||||||||||||||||||
| Teekay Offshore Partners LP | 6.000 | 07-30-19 | 460,000 | 430,100 | |||||||||||||||||||||||||
| Tesoro Logistics LP | 5.250 | 01-15-25 | 140,000 | 148,575 | |||||||||||||||||||||||||
| Tesoro Logistics LP | 6.125 | 10-15-21 | 400,000 | 417,500 | |||||||||||||||||||||||||
| Tesoro Logistics LP | 6.375 | 05-01-24 | 265,000 | 289,513 | |||||||||||||||||||||||||
| The Williams Companies, Inc. | 4.550 | 06-24-24 | 155,000 | 158,681 | |||||||||||||||||||||||||
| The Williams Companies, Inc. | 5.750 | 06-24-44 | 121,000 | 125,235 | |||||||||||||||||||||||||
| Williams Partners LP | 4.875 | 05-15-23 | 255,000 | 262,650 | |||||||||||||||||||||||||
| Williams Partners LP | 4.875 | 03-15-24 | 690,000 | 715,875 | |||||||||||||||||||||||||
| YPF SA (L)(S)(Z) | 8.500 | 07-28-25 | 370,000 | 418,563 | |||||||||||||||||||||||||
| Financials 28.2% | 50,576,167 | ||||||||||||||||||||||||||||
| Banks 15.0% | |||||||||||||||||||||||||||||
| ABN AMRO Bank NV (S)(Z) | 2.100 | 01-18-19 | 205,000 | 205,187 | |||||||||||||||||||||||||
| Australia & New Zealand Banking Group, Ltd. (6.750% to 6-15-26, then 5 Year U.S. ISDAFIX + 5.168%) (L)(Q)(S)(Z) | 6.750 | 06-15-26 | 200,000 | 221,809 | |||||||||||||||||||||||||
| Bank of America Corp. (Z) | 3.950 | 04-21-25 | 371,000 | 372,309 | |||||||||||||||||||||||||
| Bank of America Corp. (Z) | 4.200 | 08-26-24 | 170,000 | 175,232 | |||||||||||||||||||||||||
| Bank of America Corp. (Z) | 4.250 | 10-22-26 | 315,000 | 321,028 | |||||||||||||||||||||||||
| Bank of America Corp. (Z) | 4.450 | 03-03-26 | 580,000 | 600,000 | |||||||||||||||||||||||||
| Bank of America Corp. (6.300% to 3-10-26, then 3 month LIBOR + 4.553%) (L)(Q)(Z) | 6.300 | 03-10-26 | 610,000 | 671,763 | |||||||||||||||||||||||||
| Bank of America Corp. (8.000% to 1-30-18, then 3 month LIBOR + 3.630%) (Q) | 8.000 | 01-30-18 | 440,000 | 456,500 | |||||||||||||||||||||||||
| BankUnited, Inc. | 4.875 | 11-17-25 | 455,000 | 467,408 | |||||||||||||||||||||||||
| Barclays Bank PLC (S)(Z) | 10.179 | 06-12-21 | 575,000 | 724,321 | |||||||||||||||||||||||||
| Barclays PLC (Z) | 4.375 | 01-12-26 | 340,000 | 349,085 | |||||||||||||||||||||||||
| BPCE SA (S)(Z) | 4.500 | 03-15-25 | 475,000 | 477,045 | |||||||||||||||||||||||||
| Rate (%) | Maturity date | Par value^ | Value | ||||||||||||||||||||||||||
| Financials (continued) | |||||||||||||||||||||||||||||
| Banks (continued) | |||||||||||||||||||||||||||||
| BPCE SA (S)(Z) | 5.700 | 10-22-23 | 1,145,000 | $1,239,366 | |||||||||||||||||||||||||
| Branch Banking & Trust Company (Z) | 2.100 | 01-15-20 | 710,000 | 713,243 | |||||||||||||||||||||||||
| Citigroup, Inc. (Z) | 2.350 | 08-02-21 | 455,000 | 449,471 | |||||||||||||||||||||||||
| Citigroup, Inc. (Z) | 4.600 | 03-09-26 | 430,000 | 446,064 | |||||||||||||||||||||||||
| Citigroup, Inc. (5.875% to 3-27-20, then 3 month LIBOR + 4.059%) (L)(Q)(Z) | 5.875 | 03-27-20 | 260,000 | 271,102 | |||||||||||||||||||||||||
| Citigroup, Inc. (6.250% to 8-15-26, then 3 month LIBOR + 4.517%) (Q) | 6.250 | 08-15-26 | 525,000 | 571,594 | |||||||||||||||||||||||||
| Commerzbank AG (S) | 8.125 | 09-19-23 | 350,000 | 413,761 | |||||||||||||||||||||||||
| Cooperatieve Rabobank UA (11.000% to 6-30-19, then 3 month LIBOR + 10.868%) (Q)(S)(Z) | 11.000 | 06-30-19 | 1,000,000 | 1,167,500 | |||||||||||||||||||||||||
| Credit Agricole SA (7.875% to 1-23-24, then 5 Year U.S. Swap Rate + 4.898%) (Q)(S) | 7.875 | 01-23-24 | 600,000 | 641,892 | |||||||||||||||||||||||||
| Credit Agricole SA (8.125% to 9-19-18, then 5 Year U.S. Swap Rate + 6.283%) (S)(Z) | 8.125 | 09-19-33 | 250,000 | 268,053 | |||||||||||||||||||||||||
| Fifth Third Bancorp (5.100% to 6-30-23, then 3 month LIBOR + 3.033%) (L)(Q)(Z) | 5.100 | 06-30-23 | 420,000 | 417,900 | |||||||||||||||||||||||||
| HBOS PLC (S)(Z) | 6.750 | 05-21-18 | 825,000 | 862,721 | |||||||||||||||||||||||||
| HSBC Holdings PLC (6.375% to 9-17-24, then 5 Year U.S. ISDAFIX + 3.705%) (Q)(Z) | 6.375 | 09-17-24 | 200,000 | 207,000 | |||||||||||||||||||||||||
| HSBC Holdings PLC (6.875% to 6-1-21, then 5 Year U.S. ISDAFIX + 5.514%) (Q)(Z) | 6.875 | 06-01-21 | 340,000 | 368,220 | |||||||||||||||||||||||||
| ING Bank NV (S)(Z) | 5.800 | 09-25-23 | 1,000,000 | 1,119,463 | |||||||||||||||||||||||||
| JPMorgan Chase & Co. (Z) | 3.200 | 06-15-26 | 410,000 | 401,923 | |||||||||||||||||||||||||
| JPMorgan Chase & Co. (Z) | 4.625 | 05-10-21 | 720,000 | 779,484 | |||||||||||||||||||||||||
| JPMorgan Chase & Co. (5.300% to 5-1-20, then 3 month LIBOR + 3.800%) (Q)(Z) | 5.300 | 05-01-20 | 465,000 | 484,786 | |||||||||||||||||||||||||
| JPMorgan Chase & Co. (6.750% to 2-1-24, then 3 month LIBOR + 3.780%) (Q)(Z) | 6.750 | 02-01-24 | 805,000 | 908,040 | |||||||||||||||||||||||||
| Lloyds Banking Group PLC (Z) | 4.650 | 03-24-26 | 880,000 | 913,759 | |||||||||||||||||||||||||
| Lloyds Banking Group PLC (7.500% to 6-27-24, then 5 Year U.S. Swap Rate + 4.760%) (L)(Q)(Z) | 7.500 | 06-27-24 | 385,000 | 414,838 | |||||||||||||||||||||||||
| M&T Bank Corp. (5.125% to 11-1-26, then 3 month LIBOR + 3.520%) (L)(Q)(Z) | 5.125 | 11-01-26 | 345,000 | 348,881 | |||||||||||||||||||||||||
| Manufacturers & Traders Trust Company (P)(Z) | 1.695 | 12-01-21 | 485,000 | 476,513 | |||||||||||||||||||||||||
| Popular, Inc. | 7.000 | 07-01-19 | 260,000 | 270,400 | |||||||||||||||||||||||||
| Royal Bank of Scotland Group PLC | 3.875 | 09-12-23 | 335,000 | 335,599 | |||||||||||||||||||||||||
| Royal Bank of Scotland Group PLC (8.000% to 8-10-25, then 5 Year U.S. Swap Rate + 5.720%) (L)(Q)(Z) | 8.000 | 08-10-25 | 200,000 | 207,500 | |||||||||||||||||||||||||
| Royal Bank of Scotland Group PLC (8.625% to 8-15-21, then 5 Year U.S. Swap Rate + 7.598%) (L)(Q)(Z) | 8.625 | 08-15-21 | 200,000 | 215,900 | |||||||||||||||||||||||||
| Santander Holdings USA, Inc. (Z) | 2.700 | 05-24-19 | 635,000 | 637,813 | |||||||||||||||||||||||||
| Rate (%) | Maturity date | Par value^ | Value | ||||||||||||||||||||||||||
| Financials (continued) | |||||||||||||||||||||||||||||
| Banks (continued) | |||||||||||||||||||||||||||||
| Santander UK Group Holdings PLC (S) | 4.750 | 09-15-25 | 365,000 | $368,360 | |||||||||||||||||||||||||
| Societe Generale SA (7.375% to 9-13-21, then 5 Year U.S. Swap Rate + 6.238%) (L)(Q)(S)(Z) | 7.375 | 09-13-21 | 340,000 | 359,550 | |||||||||||||||||||||||||
| Societe Generale SA (8.000% to 9-29-25, then 5 Year U.S. ISDAFIX + 5.873%) (Q)(S) | 8.000 | 09-29-25 | 420,000 | 452,025 | |||||||||||||||||||||||||
| Societe Generale SA (8.250% to 11-29-18, then 5 Year U.S. Swap Rate + 6.394%) (Q) | 8.250 | 11-29-18 | 385,000 | 408,293 | |||||||||||||||||||||||||
| Standard Chartered PLC (S)(Z) | 2.100 | 08-19-19 | 750,000 | 746,021 | |||||||||||||||||||||||||
| Sumitomo Mitsui Banking Corp. | 2.450 | 01-10-19 | 598,000 | 603,479 | |||||||||||||||||||||||||
| Sumitomo Mitsui Trust Bank, Ltd. (S) | 2.050 | 03-06-19 | 565,000 | 564,887 | |||||||||||||||||||||||||
| Synovus Financial Corp. | 7.875 | 02-15-19 | 255,000 | 277,568 | |||||||||||||||||||||||||
| The PNC Financial Services Group, Inc. (4.850% to 6-1-23, then 3 month LIBOR + 3.040%) (Q)(Z) | 4.850 | 06-01-23 | 335,000 | 335,670 | |||||||||||||||||||||||||
| The PNC Financial Services Group, Inc. (6.750% to 8-1-21, then 3 month LIBOR + 3.678%) (Q)(Z) | 6.750 | 08-01-21 | 520,000 | 586,950 | |||||||||||||||||||||||||
| Wells Fargo & Company (Z) | 4.650 | 11-04-44 | 255,000 | 257,540 | |||||||||||||||||||||||||
| Wells Fargo & Company (5.875% to 6-15-25, then 3 month LIBOR + 3.990%) (Q)(Z) | 5.875 | 06-15-25 | 975,000 | 1,057,875 | |||||||||||||||||||||||||
| Wells Fargo & Company, Series K (7.980% to 3-15-18, then 3 month LIBOR + 3.770%) (Q)(Z) | 7.980 | 03-15-18 | 370,000 | 387,113 | |||||||||||||||||||||||||
| Capital markets 3.9% | |||||||||||||||||||||||||||||
| Ares Capital Corp. (Z) | 3.875 | 01-15-20 | 430,000 | 439,644 | |||||||||||||||||||||||||
| Credit Suisse Group AG (7.500% to 12-11-23, then 5 Year U.S. Swap Rate + 4.598%) (Q)(S) | 7.500 | 12-11-23 | 295,000 | 327,167 | |||||||||||||||||||||||||
| FS Investment Corp. (Z) | 4.000 | 07-15-19 | 435,000 | 437,640 | |||||||||||||||||||||||||
| FS Investment Corp. (Z) | 4.250 | 01-15-20 | 290,000 | 296,210 | |||||||||||||||||||||||||
| Jefferies Group LLC (Z) | 4.850 | 01-15-27 | 422,000 | 438,267 | |||||||||||||||||||||||||
| Jefferies Group LLC (Z) | 8.500 | 07-15-19 | 235,000 | 265,212 | |||||||||||||||||||||||||
| Macquarie Bank, Ltd. (S)(Z) | 4.875 | 06-10-25 | 520,000 | 548,151 | |||||||||||||||||||||||||
| Morgan Stanley (Z) | 2.450 | 02-01-19 | 255,000 | 257,209 | |||||||||||||||||||||||||
| Morgan Stanley (Z) | 3.875 | 01-27-26 | 400,000 | 408,936 | |||||||||||||||||||||||||
| Morgan Stanley (Z) | 5.500 | 01-26-20 | 450,000 | 488,975 | |||||||||||||||||||||||||
| Morgan Stanley (Z) | 7.300 | 05-13-19 | 895,000 | 986,989 | |||||||||||||||||||||||||
| Stifel Financial Corp. (Z) | 4.250 | 07-18-24 | 315,000 | 321,584 | |||||||||||||||||||||||||
| The Goldman Sachs Group, Inc. (Z) | 2.000 | 04-25-19 | 255,000 | 254,833 | |||||||||||||||||||||||||
| The Goldman Sachs Group, Inc. (Z) | 2.300 | 12-13-19 | 880,000 | 881,932 | |||||||||||||||||||||||||
| The Goldman Sachs Group, Inc. (Z) | 3.750 | 05-22-25 | 340,000 | 346,150 | |||||||||||||||||||||||||
| The Goldman Sachs Group, Inc. (Z) | 4.750 | 10-21-45 | 245,000 | 262,213 | |||||||||||||||||||||||||
| Consumer finance 3.4% | |||||||||||||||||||||||||||||
| Ally Financial, Inc. | 3.250 | 11-05-18 | 325,000 | 328,250 | |||||||||||||||||||||||||
| Ally Financial, Inc. (L)(Z) | 5.125 | 09-30-24 | 645,000 | 658,706 | |||||||||||||||||||||||||
| Rate (%) | Maturity date | Par value^ | Value | ||||||||||||||||||||||||||
| Financials (continued) | |||||||||||||||||||||||||||||
| Consumer finance (continued) | |||||||||||||||||||||||||||||
| Capital One Financial Corp. (Z) | 2.450 | 04-24-19 | 275,000 | $276,647 | |||||||||||||||||||||||||
| Capital One Financial Corp. (Z) | 3.500 | 06-15-23 | 1,100,000 | 1,116,291 | |||||||||||||||||||||||||
| Capital One Financial Corp. (Z) | 3.750 | 07-28-26 | 570,000 | 549,032 | |||||||||||||||||||||||||
| Capital One Financial Corp. (Z) | 4.200 | 10-29-25 | 440,000 | 443,068 | |||||||||||||||||||||||||
| Capital One Financial Corp. (5.550% to 6-1-20, then 3 month LIBOR + 3.800%) (Q) | 5.550 | 06-01-20 | 350,000 | 364,000 | |||||||||||||||||||||||||
| Credit Acceptance Corp. | 6.125 | 02-15-21 | 395,000 | 393,025 | |||||||||||||||||||||||||
| Credito Real SAB de CV (S) | 7.250 | 07-20-23 | 200,000 | 208,750 | |||||||||||||||||||||||||
| Discover Bank (Z) | 2.600 | 11-13-18 | 510,000 | 514,394 | |||||||||||||||||||||||||
| Discover Financial Services | 3.950 | 11-06-24 | 750,000 | 760,134 | |||||||||||||||||||||||||
| Discover Financial Services | 5.200 | 04-27-22 | 85,000 | 92,314 | |||||||||||||||||||||||||
| Enova International, Inc. (L)(Z) | 9.750 | 06-01-21 | 390,000 | 397,800 | |||||||||||||||||||||||||
| Diversified financial services 1.8% | |||||||||||||||||||||||||||||
| ASP AMC Merger Sub, Inc. (S) | 8.000 | 05-15-25 | 155,000 | 153,838 | |||||||||||||||||||||||||
| Doric Nimrod Air Alpha 2013-1 Class B Pass Through Trust (S) | 6.125 | 11-30-21 | 161,909 | 166,362 | |||||||||||||||||||||||||
| Flagstar Bancorp, Inc. | 6.125 | 07-15-21 | 255,000 | 273,020 | |||||||||||||||||||||||||
| Ladder Capital Finance Holdings LLLP (S) | 5.250 | 03-15-22 | 95,000 | 97,494 | |||||||||||||||||||||||||
| Leucadia National Corp. | 5.500 | 10-18-23 | 655,000 | 705,572 | |||||||||||||||||||||||||
| NewStar Financial, Inc. | 7.250 | 05-01-20 | 435,000 | 448,594 | |||||||||||||||||||||||||
| S&P Global, Inc. (Z) | 4.000 | 06-15-25 | 495,000 | 519,341 | |||||||||||||||||||||||||
| S&P Global, Inc. (Z) | 4.400 | 02-15-26 | 340,000 | 364,057 | |||||||||||||||||||||||||
| Voya Financial, Inc. (5.650% to 5-15-23, then 3 month LIBOR + 3.580%) (L)(Z) | 5.650 | 05-15-53 | 419,000 | 432,618 | |||||||||||||||||||||||||
| Insurance 2.8% | |||||||||||||||||||||||||||||
| Aquarius & Investments PLC (6.375% to 9-1-19, then 5 Year U.S. Swap Rate + 5.210%) | 6.375 | 09-01-24 | 235,000 | 251,715 | |||||||||||||||||||||||||
| AXA SA (Z) | 8.600 | 12-15-30 | 175,000 | 244,125 | |||||||||||||||||||||||||
| AXA SA (6.379% to 12-14-36, then 3 month LIBOR + 2.256%) (Q)(S)(Z) | 6.379 | 12-14-36 | 240,000 | 263,700 | |||||||||||||||||||||||||
| CNO Financial Group, Inc. | 5.250 | 05-30-25 | 450,000 | 464,625 | |||||||||||||||||||||||||
| Liberty Mutual Group, Inc. (7.800% to 3-15-37, then 3 month LIBOR +3.576%) (S) | 7.800 | 03-07-87 | 705,000 | 816,038 | |||||||||||||||||||||||||
| MetLife, Inc. (Z) | 6.400 | 12-15-66 | 355,000 | 399,375 | |||||||||||||||||||||||||
| MetLife, Inc. (S)(Z) | 9.250 | 04-08-68 | 315,000 | 453,206 | |||||||||||||||||||||||||
| Nippon Life Insurance Company (5.100% to 10-16-24, then 5 Year U.S. ISDAFIX + 3.650%) (S) | 5.100 | 10-16-44 | 365,000 | 387,813 | |||||||||||||||||||||||||
| Prudential Financial, Inc. (5.200% to 3-15-24, then 3 month LIBOR + 3.040%) (Z) | 5.200 | 03-15-44 | 270,000 | 280,800 | |||||||||||||||||||||||||
| Prudential Financial, Inc. (5.875% to 9-15-22, then 3 month LIBOR + 4.175%) (Z) | 5.875 | 09-15-42 | 267,000 | 294,983 | |||||||||||||||||||||||||
| Rate (%) | Maturity date | Par value^ | Value | ||||||||||||||||||||||||||
| Financials (continued) | |||||||||||||||||||||||||||||
| Insurance (continued) | |||||||||||||||||||||||||||||
| Teachers Insurance & Annuity Association of America (S) | 6.850 | 12-16-39 | 465,000 | $634,282 | |||||||||||||||||||||||||
| The Hartford Financial Services Group, Inc. (8.125% to 6-15-18, then 3 month LIBOR + 4.603%) (Z) | 8.125 | 06-15-68 | 540,000 | 570,883 | |||||||||||||||||||||||||
| Thrifts and mortgage finance 1.3% | |||||||||||||||||||||||||||||
| MGIC Investment Corp. | 5.750 | 08-15-23 | 99,000 | 106,178 | |||||||||||||||||||||||||
| Nationstar Mortgage LLC | 6.500 | 07-01-21 | 295,000 | 299,425 | |||||||||||||||||||||||||
| Nationstar Mortgage LLC | 7.875 | 10-01-20 | 340,000 | 353,600 | |||||||||||||||||||||||||
| Nationstar Mortgage LLC | 9.625 | 05-01-19 | 295,000 | 303,481 | |||||||||||||||||||||||||
| Quicken Loans, Inc. (S) | 5.750 | 05-01-25 | 550,000 | 555,500 | |||||||||||||||||||||||||
| Radian Group, Inc. | 5.250 | 06-15-20 | 170,000 | 177,650 | |||||||||||||||||||||||||
| Radian Group, Inc. | 7.000 | 03-15-21 | 295,000 | 328,925 | |||||||||||||||||||||||||
| Stearns Holdings LLC (S) | 9.375 | 08-15-20 | 164,000 | 165,640 | |||||||||||||||||||||||||
| Health care 5.3% | 9,518,445 | ||||||||||||||||||||||||||||
| Biotechnology 0.9% | |||||||||||||||||||||||||||||
| AbbVie, Inc. (Z) | 3.600 | 05-14-25 | 420,000 | 423,562 | |||||||||||||||||||||||||
| Amgen, Inc. (Z) | 4.400 | 05-01-45 | 195,000 | 192,580 | |||||||||||||||||||||||||
| Shire Acquisitions Investments Ireland DAC (Z) | 1.900 | 09-23-19 | 470,000 | 467,388 | |||||||||||||||||||||||||
| Shire Acquisitions Investments Ireland DAC (Z) | 3.200 | 09-23-26 | 625,000 | 605,108 | |||||||||||||||||||||||||
| Health care equipment and supplies 0.5% | |||||||||||||||||||||||||||||
| Medtronic, Inc. (Z) | 4.625 | 03-15-45 | 330,000 | 359,092 | |||||||||||||||||||||||||
| Team Health Holdings, Inc. (L)(S)(Z) | 6.375 | 02-01-25 | 60,000 | 58,575 | |||||||||||||||||||||||||
| Zimmer Biomet Holdings, Inc. | 3.550 | 04-01-25 | 435,000 | 433,335 | |||||||||||||||||||||||||
| Health care providers and services 2.6% | |||||||||||||||||||||||||||||
| Community Health Systems, Inc. (L)(Z) | 5.125 | 08-01-21 | 280,000 | 277,550 | |||||||||||||||||||||||||
| Community Health Systems, Inc. (L)(Z) | 8.000 | 11-15-19 | 215,000 | 209,225 | |||||||||||||||||||||||||
| DaVita, Inc. | 5.000 | 05-01-25 | 315,000 | 317,363 | |||||||||||||||||||||||||
| Express Scripts Holding Company (Z) | 4.750 | 11-15-21 | 1,000,000 | 1,078,263 | |||||||||||||||||||||||||
| Fresenius US Finance II, Inc. (L)(S)(Z) | 4.500 | 01-15-23 | 255,000 | 262,650 | |||||||||||||||||||||||||
| HCA, Inc. (L)(Z) | 5.250 | 04-15-25 | 375,000 | 403,009 | |||||||||||||||||||||||||
| HCA, Inc. | 5.250 | 06-15-26 | 320,000 | 341,200 | |||||||||||||||||||||||||
| HCA, Inc. | 7.500 | 02-15-22 | 300,000 | 345,120 | |||||||||||||||||||||||||
| LifePoint Health, Inc. (L)(S)(Z) | 5.375 | 05-01-24 | 285,000 | 287,850 | |||||||||||||||||||||||||
| MEDNAX, Inc. (S) | 5.250 | 12-01-23 | 260,000 | 265,850 | |||||||||||||||||||||||||
| Select Medical Corp. (L)(Z) | 6.375 | 06-01-21 | 360,000 | 368,100 | |||||||||||||||||||||||||
| Universal Health Services, Inc. (S) | 4.750 | 08-01-22 | 240,000 | 246,758 | |||||||||||||||||||||||||
| Universal Health Services, Inc. (S) | 5.000 | 06-01-26 | 189,000 | 194,670 | |||||||||||||||||||||||||
| Life sciences tools and services 0.1% | |||||||||||||||||||||||||||||
| Quintiles IMS, Inc. (S) | 4.875 | 05-15-23 | 260,000 | 267,150 | |||||||||||||||||||||||||
| Pharmaceuticals 1.2% | |||||||||||||||||||||||||||||
| Actavis Funding SCS (Z) | 3.800 | 03-15-25 | 1,000,000 | 1,017,737 | |||||||||||||||||||||||||
| Rate (%) | Maturity date | Par value^ | Value | ||||||||||||||||||||||||||
| Health care (continued) | |||||||||||||||||||||||||||||
| Pharmaceuticals (continued) | |||||||||||||||||||||||||||||
| Mylan NV (Z) | 2.500 | 06-07-19 | 339,000 | $340,661 | |||||||||||||||||||||||||
| Mylan NV (Z) | 3.950 | 06-15-26 | 764,000 | 755,649 | |||||||||||||||||||||||||
| Industrials 11.4% | 20,477,214 | ||||||||||||||||||||||||||||
| Aerospace and defense 1.1% | |||||||||||||||||||||||||||||
| Arconic, Inc. (L)(Z) | 5.125 | 10-01-24 | 390,000 | 408,525 | |||||||||||||||||||||||||
| Huntington Ingalls Industries, Inc. (S) | 5.000 | 12-15-21 | 350,000 | 363,125 | |||||||||||||||||||||||||
| Huntington Ingalls Industries, Inc. (S) | 5.000 | 11-15-25 | 250,000 | 263,750 | |||||||||||||||||||||||||
| Lockheed Martin Corp. (Z) | 2.900 | 03-01-25 | 386,000 | 383,053 | |||||||||||||||||||||||||
| Lockheed Martin Corp. (Z) | 4.700 | 05-15-46 | 295,000 | 324,103 | |||||||||||||||||||||||||
| Textron, Inc. (Z) | 7.250 | 10-01-19 | 240,000 | 266,789 | |||||||||||||||||||||||||
| Air freight and logistics 0.2% | |||||||||||||||||||||||||||||
| XPO Logistics, Inc. (S) | 6.500 | 06-15-22 | 425,000 | 449,969 | |||||||||||||||||||||||||
| Airlines 4.1% | |||||||||||||||||||||||||||||
| Air Canada 2013-1 Class C Pass Through Trust (S) | 6.625 | 05-15-18 | 310,000 | 320,850 | |||||||||||||||||||||||||
| America West Airlines 2000-1 Pass Through Trust | 8.057 | 01-02-22 | 76,493 | 85,673 | |||||||||||||||||||||||||
| American Airlines 2011-1 Class B Pass Through Trust (S) | 7.000 | 07-31-19 | 500,332 | 516,593 | |||||||||||||||||||||||||
| American Airlines 2013-2 Class A Pass Through Trust (Z) | 4.950 | 07-15-24 | 350,141 | 373,666 | |||||||||||||||||||||||||
| American Airlines 2015-1 Class B Pass Through Trust | 3.700 | 11-01-24 | 540,215 | 528,061 | |||||||||||||||||||||||||
| American Airlines 2016-1 Class A Pass Through Trust (Z) | 4.100 | 07-15-29 | 185,097 | 189,022 | |||||||||||||||||||||||||
| American Airlines 2017-1 Class A Pass Through Trust | 4.000 | 08-15-30 | 140,000 | 142,450 | |||||||||||||||||||||||||
| American Airlines 2017-1 Class AA Pass Through Trust (Z) | 3.650 | 08-15-30 | 210,000 | 212,888 | |||||||||||||||||||||||||
| British Airways 2013-1 Class A Pass Through Trust (S)(Z) | 4.625 | 06-20-24 | 543,604 | 580,733 | |||||||||||||||||||||||||
| British Airways 2013-1 Class B Pass Through Trust (S) | 5.625 | 12-20-21 | 148,057 | 155,882 | |||||||||||||||||||||||||
| Continental Airlines 1997-4 Class A Pass Through Trust | 6.900 | 07-02-19 | 20,136 | 20,448 | |||||||||||||||||||||||||
| Continental Airlines 1998-1 Class A Pass Through Trust | 6.648 | 03-15-19 | 7,902 | 8,000 | |||||||||||||||||||||||||
| Continental Airlines 1999-1 Class A Pass Through Trust | 6.545 | 08-02-20 | 95,386 | 100,394 | |||||||||||||||||||||||||
| Continental Airlines 2000-2 Class B Pass Through Trust | 8.307 | 10-02-19 | 25,465 | 26,674 | |||||||||||||||||||||||||
| Continental Airlines 2007-1 Class A Pass Through Trust (Z) | 5.983 | 10-19-23 | 416,204 | 457,824 | |||||||||||||||||||||||||
| Rate (%) | Maturity date | Par value^ | Value | ||||||||||||||||||||||||||
| Industrials (continued) | |||||||||||||||||||||||||||||
| Airlines (continued) | |||||||||||||||||||||||||||||
| Continental Airlines 2012-1 Class B Pass Through Trust | 6.250 | 10-11-21 | 142,701 | $150,193 | |||||||||||||||||||||||||
| Delta Air Lines 2002-1 Class G-1 Pass Through Trust | 6.718 | 07-02-24 | 517,632 | 582,983 | |||||||||||||||||||||||||
| Delta Air Lines 2010-1 Class A Pass Through Trust | 6.200 | 01-02-20 | 98,068 | 102,432 | |||||||||||||||||||||||||
| Delta Air Lines 2011-1 Class A Pass Through Trust | 5.300 | 10-15-20 | 180,999 | 191,316 | |||||||||||||||||||||||||
| Delta Air Lines, Inc. (L)(Z) | 3.625 | 03-15-22 | 476,000 | 488,471 | |||||||||||||||||||||||||
| Northwest Airlines 2007-1 Class A Pass Through Trust | 7.027 | 05-01-21 | 307,035 | 341,061 | |||||||||||||||||||||||||
| United Airlines 2014-2 Class A Pass Through Trust (Z) | 3.750 | 03-03-28 | 443,187 | 453,712 | |||||||||||||||||||||||||
| United Airlines 2014-2 Class B Pass Through Trust | 4.625 | 03-03-24 | 433,101 | 443,929 | |||||||||||||||||||||||||
| United Airlines 2016-1 Class A Pass Through Trust (Z) | 3.450 | 01-07-30 | 245,000 | 246,225 | |||||||||||||||||||||||||
| US Airways 2010-1 Class A Pass Through Trust | 6.250 | 10-22-24 | 324,702 | 353,926 | |||||||||||||||||||||||||
| US Airways 2012-1 Class A Pass Through Trust (Z) | 5.900 | 04-01-26 | 247,685 | 277,739 | |||||||||||||||||||||||||
| Building products 1.1% | |||||||||||||||||||||||||||||
| Builders FirstSource, Inc. (S) | 10.750 | 08-15-23 | 215,000 | 251,013 | |||||||||||||||||||||||||
| Masco Corp. | 4.375 | 04-01-26 | 255,000 | 269,688 | |||||||||||||||||||||||||
| Masco Corp. | 4.450 | 04-01-25 | 275,000 | 292,427 | |||||||||||||||||||||||||
| Owens Corning | 4.200 | 12-15-22 | 1,095,000 | 1,147,764 | |||||||||||||||||||||||||
| Commercial services and supplies 0.4% | |||||||||||||||||||||||||||||
| LSC Communications, Inc. (S) | 8.750 | 10-15-23 | 290,000 | 299,425 | |||||||||||||||||||||||||
| Prime Security Services Borrower LLC (S) | 9.250 | 05-15-23 | 255,000 | 278,588 | |||||||||||||||||||||||||
| Tervita Escrow Corp. (S) | 7.625 | 12-01-21 | 60,000 | 61,650 | |||||||||||||||||||||||||
| Construction and engineering 0.3% | |||||||||||||||||||||||||||||
| AECOM (S) | 5.125 | 03-15-27 | 415,000 | 415,477 | |||||||||||||||||||||||||
| Engility Corp. (S) | 8.875 | 09-01-24 | 77,000 | 82,198 | |||||||||||||||||||||||||
| Tutor Perini Corp. (S) | 6.875 | 05-01-25 | 88,000 | 92,400 | |||||||||||||||||||||||||
| Electrical equipment 0.1% | |||||||||||||||||||||||||||||
| EnerSys (S) | 5.000 | 04-30-23 | 95,000 | 96,781 | |||||||||||||||||||||||||
| Industrial conglomerates 0.7% | |||||||||||||||||||||||||||||
| General Electric Company (5.000% to 1-21-21, then 3 month LIBOR + 3.330%) (Q)(Z) | 5.000 | 01-21-21 | 1,148,000 | 1,210,853 | |||||||||||||||||||||||||
| Machinery 0.1% | |||||||||||||||||||||||||||||
| SPL Logistics Escrow LLC (S) | 8.875 | 08-01-20 | 215,000 | 174,150 | |||||||||||||||||||||||||
| Professional services 0.5% | |||||||||||||||||||||||||||||
| IHS Markit, Ltd. (S) | 4.750 | 02-15-25 | 110,000 | 115,088 | |||||||||||||||||||||||||
| IHS Markit, Ltd. (S) | 5.000 | 11-01-22 | 152,000 | 162,450 | |||||||||||||||||||||||||
| Rate (%) | Maturity date | Par value^ | Value | ||||||||||||||||||||||||||
| Industrials (continued) | |||||||||||||||||||||||||||||
| Professional services (continued) | |||||||||||||||||||||||||||||
| Verisk Analytics, Inc. (Z) | 4.000 | 06-15-25 | 645,000 | $659,782 | |||||||||||||||||||||||||
| Trading companies and distributors 2.7% | |||||||||||||||||||||||||||||
| AerCap Global Aviation Trust (6.500% to 6-15-25, then 3 month LIBOR + 4.300%) (L)(S)(Z) | 6.500 | 06-15-45 | 350,000 | 367,500 | |||||||||||||||||||||||||
| AerCap Ireland Capital DAC (Z) | 4.625 | 10-30-20 | 435,000 | 461,868 | |||||||||||||||||||||||||
| Ahern Rentals, Inc. (S) | 7.375 | 05-15-23 | 395,000 | 339,700 | |||||||||||||||||||||||||
| Air Lease Corp. (Z) | 3.000 | 09-15-23 | 280,000 | 275,291 | |||||||||||||||||||||||||
| Air Lease Corp. (Z) | 3.375 | 01-15-19 | 170,000 | 173,601 | |||||||||||||||||||||||||
| Air Lease Corp. (Z) | 3.625 | 04-01-27 | 275,000 | 272,905 | |||||||||||||||||||||||||
| Air Lease Corp. (Z) | 3.875 | 04-01-21 | 255,000 | 266,225 | |||||||||||||||||||||||||
| Aircastle, Ltd. | 5.000 | 04-01-23 | 620,000 | 661,850 | |||||||||||||||||||||||||
| Aircastle, Ltd. | 5.500 | 02-15-22 | 215,000 | 232,824 | |||||||||||||||||||||||||
| Aircastle, Ltd. | 6.250 | 12-01-19 | 195,000 | 211,478 | |||||||||||||||||||||||||
| Aircastle, Ltd. | 7.625 | 04-15-20 | 160,000 | 179,712 | |||||||||||||||||||||||||
| Ashtead Capital, Inc. (S) | 5.625 | 10-01-24 | 205,000 | 219,071 | |||||||||||||||||||||||||
| International Lease Finance Corp. (Z) | 5.875 | 04-01-19 | 240,000 | 256,137 | |||||||||||||||||||||||||
| International Lease Finance Corp. (S)(Z) | 7.125 | 09-01-18 | 290,000 | 309,575 | |||||||||||||||||||||||||
| Park Aerospace Holdings, Ltd. (S) | 5.500 | 02-15-24 | 105,000 | 111,038 | |||||||||||||||||||||||||
| United Rentals North America, Inc. (L)(Z) | 5.500 | 07-15-25 | 260,000 | 271,700 | |||||||||||||||||||||||||
| United Rentals North America, Inc. (L)(Z) | 5.750 | 11-15-24 | 175,000 | 184,406 | |||||||||||||||||||||||||
| Transportation infrastructure 0.1% | |||||||||||||||||||||||||||||
| Florida East Coast Holdings Corp. (S) | 6.750 | 05-01-19 | 255,000 | 262,140 | |||||||||||||||||||||||||
| Information technology 5.1% | 9,090,074 | ||||||||||||||||||||||||||||
| Electronic equipment, instruments and components 1.3% | |||||||||||||||||||||||||||||
| CDW LLC | 5.000 | 09-01-25 | 47,000 | 48,175 | |||||||||||||||||||||||||
| Ingram Micro, Inc. | 5.450 | 12-15-24 | 365,000 | 366,331 | |||||||||||||||||||||||||
| Jabil Circuit, Inc. | 4.700 | 09-15-22 | 700,000 | 735,000 | |||||||||||||||||||||||||
| Keysight Technologies, Inc. (Z) | 4.600 | 04-06-27 | 255,000 | 264,612 | |||||||||||||||||||||||||
| Tech Data Corp. (Z) | 4.950 | 02-15-27 | 551,000 | 567,434 | |||||||||||||||||||||||||
| Zebra Technologies Corp. (L)(Z) | 7.250 | 10-15-22 | 270,000 | 291,938 | |||||||||||||||||||||||||
| Internet software and services 0.3% | |||||||||||||||||||||||||||||
| Match Group, Inc. | 6.375 | 06-01-24 | 260,000 | 283,075 | |||||||||||||||||||||||||
| VeriSign, Inc. | 5.250 | 04-01-25 | 270,000 | 282,488 | |||||||||||||||||||||||||
| IT services 0.2% | |||||||||||||||||||||||||||||
| Gartner, Inc. (S) | 5.125 | 04-01-25 | 68,000 | 70,380 | |||||||||||||||||||||||||
| Sixsigma Networks Mexico SA de CV (L)(S)(Z) | 8.250 | 11-07-21 | 200,000 | 200,000 | |||||||||||||||||||||||||
| Tempo Acquisition LLC (S) | 6.750 | 06-01-25 | 50,000 | 51,375 | |||||||||||||||||||||||||
| Semiconductors and semiconductor equipment 0.7% | |||||||||||||||||||||||||||||
| Micron Technology, Inc. (L)(Z) | 5.875 | 02-15-22 | 280,000 | 293,300 | |||||||||||||||||||||||||
| Micron Technology, Inc. (Z) | 7.500 | 09-15-23 | 250,000 | 280,000 | |||||||||||||||||||||||||
| Rate (%) | Maturity date | Par value^ | Value | ||||||||||||||||||||||||||
| Information technology (continued) | |||||||||||||||||||||||||||||
| Semiconductors and semiconductor equipment (continued) | |||||||||||||||||||||||||||||
| NXP BV (S) | 4.625 | 06-01-23 | 645,000 | $694,181 | |||||||||||||||||||||||||
| Software 1.8% | |||||||||||||||||||||||||||||
| Activision Blizzard, Inc. (S)(Z) | 3.400 | 09-15-26 | 400,000 | 392,006 | |||||||||||||||||||||||||
| Activision Blizzard, Inc. (S)(Z) | 6.125 | 09-15-23 | 365,000 | 396,025 | |||||||||||||||||||||||||
| CA, Inc. (Z) | 3.600 | 08-15-22 | 355,000 | 364,344 | |||||||||||||||||||||||||
| CA, Inc. (Z) | 4.700 | 03-15-27 | 325,000 | 341,339 | |||||||||||||||||||||||||
| Electronic Arts, Inc. (Z) | 4.800 | 03-01-26 | 715,000 | 781,689 | |||||||||||||||||||||||||
| Microsoft Corp. (Z) | 4.450 | 11-03-45 | 535,000 | 571,202 | |||||||||||||||||||||||||
| Open Text Corp. (S) | 5.875 | 06-01-26 | 265,000 | 282,888 | |||||||||||||||||||||||||
| Symantec Corp. (S) | 5.000 | 04-15-25 | 102,000 | 105,330 | |||||||||||||||||||||||||
| Technology hardware, storage and peripherals 0.8% | |||||||||||||||||||||||||||||
| Dell International LLC (S)(Z) | 6.020 | 06-15-26 | 825,000 | 908,735 | |||||||||||||||||||||||||
| Dell International LLC (L)(S)(Z) | 7.125 | 06-15-24 | 85,000 | 93,953 | |||||||||||||||||||||||||
| Dell International LLC (S)(Z) | 8.350 | 07-15-46 | 255,000 | 329,999 | |||||||||||||||||||||||||
| NCR Corp. | 5.875 | 12-15-21 | 90,000 | 94,275 | |||||||||||||||||||||||||
| Materials 2.3% | 4,106,702 | ||||||||||||||||||||||||||||
| Chemicals 1.2% | |||||||||||||||||||||||||||||
| Braskem Finance, Ltd. (S) | 7.000 | 05-07-20 | 515,000 | 561,994 | |||||||||||||||||||||||||
| NOVA Chemicals Corp. (S) | 5.000 | 05-01-25 | 535,000 | 547,706 | |||||||||||||||||||||||||
| Platform Specialty Products Corp. (L)(S)(Z) | 6.500 | 02-01-22 | 535,000 | 548,375 | |||||||||||||||||||||||||
| The Chemours Company | 6.625 | 05-15-23 | 456,000 | 487,920 | |||||||||||||||||||||||||
| Construction materials 0.3% | |||||||||||||||||||||||||||||
| Cemex SAB de CV (L)(S)(Z) | 6.125 | 05-05-25 | 360,000 | 386,536 | |||||||||||||||||||||||||
| U.S. Concrete, Inc. (S) | 6.375 | 06-01-24 | 145,000 | 151,525 | |||||||||||||||||||||||||
| Containers and packaging 0.3% | |||||||||||||||||||||||||||||
| Ardagh Packaging Finance PLC (S) | 6.000 | 02-15-25 | 215,000 | 222,256 | |||||||||||||||||||||||||
| Cascades, Inc. (S) | 5.500 | 07-15-22 | 233,000 | 234,748 | |||||||||||||||||||||||||
| Metals and mining 0.3% | |||||||||||||||||||||||||||||
| Novelis Corp. (L)(S)(Z) | 5.875 | 09-30-26 | 95,000 | 97,613 | |||||||||||||||||||||||||
| Vale Overseas, Ltd. | 6.250 | 08-10-26 | 248,000 | 271,014 | |||||||||||||||||||||||||
| Vedanta Resources PLC (L)(S)(Z) | 6.375 | 07-30-22 | 240,000 | 243,240 | |||||||||||||||||||||||||
| Paper and forest products 0.2% | |||||||||||||||||||||||||||||
| Boise Cascade Company (S) | 5.625 | 09-01-24 | 80,000 | 82,200 | |||||||||||||||||||||||||
| Norbord, Inc. (S) | 6.250 | 04-15-23 | 255,000 | 271,575 | |||||||||||||||||||||||||
| Real estate 3.1% | 5,626,336 | ||||||||||||||||||||||||||||
| Equity real estate investment trusts 3.1% | |||||||||||||||||||||||||||||
| American Tower Corp. (Z) | 3.400 | 02-15-19 | 305,000 | 311,580 | |||||||||||||||||||||||||
| American Tower Corp. (Z) | 4.700 | 03-15-22 | 400,000 | 430,785 | |||||||||||||||||||||||||
| Crown Castle Towers LLC (S)(Z) | 4.883 | 08-15-40 | 710,000 | 757,163 | |||||||||||||||||||||||||
| Crown Castle Towers LLC (S)(Z) | 6.113 | 01-15-40 | 451,000 | 488,586 | |||||||||||||||||||||||||
| Rate (%) | Maturity date | Par value^ | Value | ||||||||||||||||||||||||||
| Real estate (continued) | |||||||||||||||||||||||||||||
| Equity real estate investment trusts (continued) | |||||||||||||||||||||||||||||
| Equinix, Inc. | 5.375 | 05-15-27 | 205,000 | $214,182 | |||||||||||||||||||||||||
| Iron Mountain, Inc. | 5.750 | 08-15-24 | 395,000 | 406,850 | |||||||||||||||||||||||||
| Iron Mountain, Inc. | 6.000 | 08-15-23 | 440,000 | 467,491 | |||||||||||||||||||||||||
| MPT Operating Partnership LP | 6.375 | 02-15-22 | 320,000 | 330,800 | |||||||||||||||||||||||||
| Omega Healthcare Investors, Inc. (Z) | 4.500 | 01-15-25 | 295,000 | 296,268 | |||||||||||||||||||||||||
| Omega Healthcare Investors, Inc. (Z) | 4.950 | 04-01-24 | 350,000 | 365,585 | |||||||||||||||||||||||||
| Omega Healthcare Investors, Inc. (Z) | 5.250 | 01-15-26 | 180,000 | 189,235 | |||||||||||||||||||||||||
| Ventas Realty LP (Z) | 3.500 | 02-01-25 | 575,000 | 568,901 | |||||||||||||||||||||||||
| Ventas Realty LP (Z) | 3.750 | 05-01-24 | 101,000 | 102,607 | |||||||||||||||||||||||||
| VEREIT Operating Partnership LP (Z) | 4.600 | 02-06-24 | 523,000 | 545,881 | |||||||||||||||||||||||||
| Welltower, Inc. (Z) | 3.750 | 03-15-23 | 146,000 | 150,422 | |||||||||||||||||||||||||
| Telecommunication services 4.7% | 8,462,983 | ||||||||||||||||||||||||||||
| Diversified telecommunication services 3.2% | |||||||||||||||||||||||||||||
| AT&T, Inc. (Z) | 3.875 | 08-15-21 | 800,000 | 835,627 | |||||||||||||||||||||||||
| AT&T, Inc. (Z) | 4.750 | 05-15-46 | 287,000 | 269,423 | |||||||||||||||||||||||||
| AT&T, Inc. (Z) | 5.450 | 03-01-47 | 770,000 | 793,214 | |||||||||||||||||||||||||
| Cincinnati Bell, Inc. (S) | 7.000 | 07-15-24 | 235,000 | 248,748 | |||||||||||||||||||||||||
| Frontier Communications Corp. | 8.875 | 09-15-20 | 330,000 | 348,355 | |||||||||||||||||||||||||
| GCI, Inc. (L)(Z) | 6.875 | 04-15-25 | 265,000 | 284,875 | |||||||||||||||||||||||||
| Radiate Holdco LLC (L)(S)(Z) | 6.625 | 02-15-25 | 245,000 | 244,388 | |||||||||||||||||||||||||
| Sprint Spectrum Company LLC (S)(Z) | 3.360 | 03-20-23 | 260,000 | 262,275 | |||||||||||||||||||||||||
| Telecom Italia Capital SA | 7.200 | 07-18-36 | 365,000 | 402,413 | |||||||||||||||||||||||||
| Verizon Communications, Inc. (Z) | 4.400 | 11-01-34 | 260,000 | 248,811 | |||||||||||||||||||||||||
| Verizon Communications, Inc. (Z) | 4.672 | 03-15-55 | 295,000 | 270,270 | |||||||||||||||||||||||||
| Verizon Communications, Inc. (Z) | 4.862 | 08-21-46 | 830,000 | 806,055 | |||||||||||||||||||||||||
| Verizon Communications, Inc. (Z) | 5.012 | 08-21-54 | 255,000 | 247,416 | |||||||||||||||||||||||||
| Wind Acquisition Finance SA (S) | 7.375 | 04-23-21 | 355,000 | 369,200 | |||||||||||||||||||||||||
| Zayo Group LLC (S) | 5.750 | 01-15-27 | 125,000 | 132,656 | |||||||||||||||||||||||||
| Wireless telecommunication services 1.5% | |||||||||||||||||||||||||||||
| CC Holdings GS V LLC (Z) | 3.849 | 04-15-23 | 350,000 | 363,481 | |||||||||||||||||||||||||
| Digicel Group, Ltd. (S) | 8.250 | 09-30-20 | 385,000 | 352,275 | |||||||||||||||||||||||||
| Digicel, Ltd. (L)(S)(Z) | 6.750 | 03-01-23 | 295,000 | 280,619 | |||||||||||||||||||||||||
| Millicom International Cellular SA (S) | 4.750 | 05-22-20 | 210,000 | 215,088 | |||||||||||||||||||||||||
| Millicom International Cellular SA (S) | 6.625 | 10-15-21 | 300,000 | 314,250 | |||||||||||||||||||||||||
| MTN Mauritius Investments, Ltd. (S) | 4.755 | 11-11-24 | 225,000 | 213,694 | |||||||||||||||||||||||||
| SBA Tower Trust (S)(Z) | 3.598 | 04-15-43 | 370,000 | 370,144 | |||||||||||||||||||||||||
| Sprint Capital Corp. | 6.875 | 11-15-28 | 305,000 | 330,925 | |||||||||||||||||||||||||
| T-Mobile USA, Inc. | 6.125 | 01-15-22 | 245,000 | 258,781 | |||||||||||||||||||||||||
| Utilities 7.1% | 12,666,996 | ||||||||||||||||||||||||||||
| Electric utilities 3.8% | |||||||||||||||||||||||||||||
| Abengoa Transmision Sur SA (S) | 6.875 | 04-30-43 | 249,475 | 268,497 | |||||||||||||||||||||||||
| Rate (%) | Maturity date | Par value^ | Value | ||||||||||||||||||||||||||
| Utilities (continued) | |||||||||||||||||||||||||||||
| Electric utilities (continued) | |||||||||||||||||||||||||||||
| Beaver Valley II Funding Corp. | 9.000 | 06-01-17 | 4,000 | $4,024 | |||||||||||||||||||||||||
| Broadcom Corp. (S)(Z) | 2.375 | 01-15-20 | 500,000 | 500,350 | |||||||||||||||||||||||||
| Broadcom Corp. (S)(Z) | 3.875 | 01-15-27 | 529,000 | 536,914 | |||||||||||||||||||||||||
| BVPS II Funding Corp. | 8.890 | 06-01-17 | 14,000 | 14,017 | |||||||||||||||||||||||||
| Duke Energy Corp. (Z) | 3.550 | 09-15-21 | 1,000,000 | 1,040,924 | |||||||||||||||||||||||||
| Electricite de France SA (S)(Z) | 3.625 | 10-13-25 | 260,000 | 265,535 | |||||||||||||||||||||||||
| Electricite de France SA (5.250% to 1-29-23, then 10 Year U.S. Swap Rate + 3.709%) (L)(Q)(S)(Z) | 5.250 | 01-29-23 | 485,000 | 485,000 | |||||||||||||||||||||||||
| Emera US Finance LP (Z) | 3.550 | 06-15-26 | 210,000 | 208,378 | |||||||||||||||||||||||||
| Empresa Electrica Angamos SA (S) | 4.875 | 05-25-29 | 360,000 | 365,246 | |||||||||||||||||||||||||
| Exelon Generation Company LLC (Z) | 4.000 | 10-01-20 | 1,000,000 | 1,042,827 | |||||||||||||||||||||||||
| FPL Energy National Wind LLC (S) | 5.608 | 03-10-24 | 52,946 | 52,946 | |||||||||||||||||||||||||
| Great Plains Energy, Inc. (Z) | 3.900 | 04-01-27 | 260,000 | 263,035 | |||||||||||||||||||||||||
| Israel Electric Corp., Ltd. (S) | 5.625 | 06-21-18 | 420,000 | 435,926 | |||||||||||||||||||||||||
| NextEra Energy Capital Holdings, Inc. (Z) | 3.550 | 05-01-27 | 490,000 | 491,480 | |||||||||||||||||||||||||
| Southern California Edison Company (6.250% to 2-1-22, then 3 month LIBOR + 4.199%) (Q)(Z) | 6.250 | 02-01-22 | 320,000 | 355,600 | |||||||||||||||||||||||||
| Southern Power Company (Z) | 1.950 | 12-15-19 | 475,000 | 472,591 | |||||||||||||||||||||||||
| Gas utilities 0.1% | |||||||||||||||||||||||||||||
| AmeriGas Partners LP | 5.500 | 05-20-25 | 183,000 | 184,830 | |||||||||||||||||||||||||
| Independent power and renewable electricity producers 0.9% | |||||||||||||||||||||||||||||
| NRG Energy, Inc. (L)(Z) | 6.250 | 05-01-24 | 585,000 | 582,953 | |||||||||||||||||||||||||
| NRG Energy, Inc. (L)(Z) | 6.625 | 01-15-27 | 305,000 | 301,950 | |||||||||||||||||||||||||
| NRG Yield Operating LLC | 5.375 | 08-15-24 | 760,000 | 777,100 | |||||||||||||||||||||||||
| Multi-utilities 2.3% | |||||||||||||||||||||||||||||
| Berkshire Hathaway Energy Company (Z) | 8.480 | 09-15-28 | 550,000 | 800,554 | |||||||||||||||||||||||||
| CMS Energy Corp. (Z) | 5.050 | 03-15-22 | 1,000,000 | 1,101,486 | |||||||||||||||||||||||||
| Dominion Resources, Inc. (Z) | 3.625 | 12-01-24 | 1,000,000 | 1,018,725 | |||||||||||||||||||||||||
| NiSource Finance Corp. (Z) | 5.450 | 09-15-20 | 1,000,000 | 1,096,108 | |||||||||||||||||||||||||
| Convertible bonds 0.2% (0.1% of Total investments) | $285,106 | ||||||||||||||||||||||||||||
| (Cost $288,198) | |||||||||||||||||||||||||||||
| Utilities 0.2% | 285,106 | ||||||||||||||||||||||||||||
| Independent power and renewable electricity producers 0.2% | |||||||||||||||||||||||||||||
| NRG Yield, Inc. (S) | 3.250 | 06-01-20 | 290,000 | 285,106 | |||||||||||||||||||||||||
| Term loans (M) 0.2% (0.2% of Total investments) | $426,813 | ||||||||||||||||||||||||||||
| (Cost $562,592) | |||||||||||||||||||||||||||||
| Financials 0.1% | 150,000 | ||||||||||||||||||||||||||||
| Capital markets 0.1% | |||||||||||||||||||||||||||||
| LSF9 Atlantis Holdings LLC (T) | TBD | 04-21-23 | 150,000 | 150,000 | |||||||||||||||||||||||||
| Rate (%) | Maturity date | Par value^ | Value | ||||||||||||||||||||||||||
| Industrials 0.0% | $129,981 | ||||||||||||||||||||||||||||
| Aerospace and defense 0.0% | |||||||||||||||||||||||||||||
| WP CPP Holdings LLC | 4.671 | 12-28-19 | 143,625 | 129,981 | |||||||||||||||||||||||||
| Utilities 0.1% | 146,832 | ||||||||||||||||||||||||||||
| Electric utilities 0.1% | |||||||||||||||||||||||||||||
| ExGen Texas Power LLC | 5.897 | 09-16-21 | 272,922 | 146,832 | |||||||||||||||||||||||||
| Capital preferred securities (a) 0.9% (0.6% of Total investments) | $1,567,943 | ||||||||||||||||||||||||||||
| (Cost $1,538,094) | |||||||||||||||||||||||||||||
| Financials 0.9% | 1,567,943 | ||||||||||||||||||||||||||||
| Banks 0.5% | |||||||||||||||||||||||||||||
| BAC Capital Trust XIV, Series G (P)(Q) | 4.000 | 05-18-17 | 420,000 | 357,000 | |||||||||||||||||||||||||
| Sovereign Capital Trust VI | 7.908 | 06-13-36 | 489,000 | 493,890 | |||||||||||||||||||||||||
| Capital markets 0.2% | |||||||||||||||||||||||||||||
| State Street Corp. (P)(Z) | 2.131 | 06-01-77 | 400,000 | 351,500 | |||||||||||||||||||||||||
| Insurance 0.2% | |||||||||||||||||||||||||||||
| MetLife Capital Trust IV (7.875% to 12-15-32 then 3 month LIBOR + 3.960%) (S)(Z) | 7.875 | 12-15-67 | 110,000 | 140,305 | |||||||||||||||||||||||||
| ZFS Finance USA Trust V (6.500% to 5-9-17, then 3 month LIBOR + 2.285%) (S) | 6.500 | 05-09-67 | 225,000 | 225,248 | |||||||||||||||||||||||||
| U.S. Government and Agency obligations 18.0% (12.0% of Total investments) | $32,249,790 | ||||||||||||||||||||||||||||
| (Cost $32,448,992) | |||||||||||||||||||||||||||||
| U.S. Government 4.6% | 8,151,757 | ||||||||||||||||||||||||||||
| U.S. Treasury | |||||||||||||||||||||||||||||
| Bond (Z) | 2.875 | 11-15-46 | 260,000 | 255,501 | |||||||||||||||||||||||||
| Note (Z) | 2.000 | 02-15-25 | 3,337,000 | 3,293,462 | |||||||||||||||||||||||||
| Note (Z) | 2.250 | 02-15-27 | 1,768,000 | 1,762,751 | |||||||||||||||||||||||||
| Treasury Inflation Protected Security (Z) | 0.375 | 07-15-25 | 2,819,472 | 2,840,043 | |||||||||||||||||||||||||
| U.S. Government Agency 13.4% | 24,098,033 | ||||||||||||||||||||||||||||
| Federal Home Loan Mortgage Corp. | |||||||||||||||||||||||||||||
| 30 Yr Pass Thru | 3.000 | 03-01-43 | 764,136 | 770,524 | |||||||||||||||||||||||||
| 30 Yr Pass Thru | 4.500 | 09-01-41 | 1,556,623 | 1,684,254 | |||||||||||||||||||||||||
| Federal National Mortgage Association | |||||||||||||||||||||||||||||
| 30 Yr Pass Thru | 3.000 | 12-01-42 | 2,651,081 | 2,666,926 | |||||||||||||||||||||||||
| 30 Yr Pass Thru | 3.000 | 07-01-43 | 803,580 | 808,006 | |||||||||||||||||||||||||
| 30 Yr Pass Thru | 3.500 | 12-01-42 | 4,111,462 | 4,261,627 | |||||||||||||||||||||||||
| 30 Yr Pass Thru | 3.500 | 01-01-43 | 3,034,050 | 3,155,293 | |||||||||||||||||||||||||
| 30 Yr Pass Thru | 3.500 | 04-01-45 | 1,460,351 | 1,508,668 | |||||||||||||||||||||||||
| 30 Yr Pass Thru | 4.000 | 10-01-40 | 317,580 | 337,851 | |||||||||||||||||||||||||
| 30 Yr Pass Thru | 4.000 | 09-01-41 | 1,939,302 | 3,659,839 | |||||||||||||||||||||||||
| 30 Yr Pass Thru | 4.000 | 10-01-41 | 1,532,053 | 1,627,208 | |||||||||||||||||||||||||
| 30 Yr Pass Thru | 4.500 | 07-01-41 | 2,851,601 | 3,084,742 | |||||||||||||||||||||||||
| 30 Yr Pass Thru | 5.000 | 04-01-41 | 353,835 | 392,342 | |||||||||||||||||||||||||
| 30 Yr Pass Thru | 5.500 | 08-01-40 | 125,839 | 140,753 | |||||||||||||||||||||||||
| Rate (%) | Maturity date | Par value^ | Value | ||||||||||||||||||||||||||
| Foreign government obligations 0.7% (0.5% of Total investments) | $1,314,675 | ||||||||||||||||||||||||||||
| (Cost $1,161,105) | |||||||||||||||||||||||||||||
| Argentina 0.7% | 1,314,675 | ||||||||||||||||||||||||||||
| Provincia de Buenos Aires Bond (S) | 7.875 | 06-15-27 | 390,000 | 407,133 | |||||||||||||||||||||||||
| Republic of Argentina | |||||||||||||||||||||||||||||
| Bond | 6.875 | 01-26-27 | 155,000 | 163,758 | |||||||||||||||||||||||||
| Bond | 7.500 | 04-22-26 | 350,000 | 383,425 | |||||||||||||||||||||||||
| Bond (L) (Z) | 8.280 | 12-31-33 | 322,469 | 360,359 | |||||||||||||||||||||||||
| Collateralized mortgage obligations 20.9% (13.9% of Total investments) | $37,408,339 | ||||||||||||||||||||||||||||
| (Cost $35,861,505) | |||||||||||||||||||||||||||||
| Commercial and residential 18.6% | 33,298,291 | ||||||||||||||||||||||||||||
| American Home Mortgage Investment Trust Series 2005-1, Class 1A1 (P) | 1.422 | 06-25-45 | 416,477 | 401,276 | |||||||||||||||||||||||||
| Americold 2010 LLC Series 2010-ARTA, Class D (S) | 7.443 | 01-14-29 | 605,000 | 681,332 | |||||||||||||||||||||||||
| BAMLL Commercial Mortgage Securities Trust Series 2015-200P, Class F (P) (S) | 3.716 | 04-14-33 | 415,000 | 395,289 | |||||||||||||||||||||||||
| BBCMS Trust | |||||||||||||||||||||||||||||
| Series 2015, Class C (P) (S) | 2.994 | 02-15-28 | 215,000 | 212,741 | |||||||||||||||||||||||||
| Series 2015-MSQ, Class D (P) (S) | 4.123 | 09-15-32 | 480,000 | 480,043 | |||||||||||||||||||||||||
| Bear Stearns Adjustable Rate Mortgage Trust | |||||||||||||||||||||||||||||
| Series 2005-1, Class B2 (P) | 3.377 | 03-25-35 | 118,126 | 50,160 | |||||||||||||||||||||||||
| Series 2005-2, Class A1 (P) | 3.260 | 03-25-35 | 224,646 | 225,702 | |||||||||||||||||||||||||
| Bear Stearns ALT-A Trust | |||||||||||||||||||||||||||||
| Series 2005-5, Class 1A4 (P) | 1.551 | 07-25-35 | 225,118 | 214,470 | |||||||||||||||||||||||||
| Series 2005-7, Class 11A1 (P) | 1.531 | 08-25-35 | 415,423 | 400,501 | |||||||||||||||||||||||||
| BHMS Mortgage Trust Series 2014-ATLS, Class DFL (P) (S) | 3.983 | 07-05-33 | 620,000 | 611,445 | |||||||||||||||||||||||||
| BLCP Hotel Trust Series 2014-CLRN, Class D (P) (S) | 3.494 | 08-15-29 | 605,000 | 606,902 | |||||||||||||||||||||||||
| BWAY Mortgage Trust | |||||||||||||||||||||||||||||
| Series 2013-1515, Class F (P) (S) | 4.058 | 03-10-33 | 595,000 | 578,870 | |||||||||||||||||||||||||
| Series 2015-1740, Class D (P) (S) | 3.787 | 01-10-35 | 370,000 | 365,792 | |||||||||||||||||||||||||
| Series 2015-1740, Class XA IO (S) | 1.023 | 01-10-35 | 6,885,000 | 286,084 | |||||||||||||||||||||||||
| BXHTL Mortgage Trust | |||||||||||||||||||||||||||||
| Series 2015-JWRZ, Class DR2 (P) (S) | 4.683 | 05-15-29 | 445,000 | 447,509 | |||||||||||||||||||||||||
| Series 2015-JWRZ, Class GL2 (P) (S) | 4.683 | 05-15-29 | 410,000 | 412,441 | |||||||||||||||||||||||||
| CD Commercial Mortgage Trust (Citigroup/Deutsche Bank) Series 2017-CD3, Class C (P) | 4.715 | 02-10-50 | 435,000 | 457,661 | |||||||||||||||||||||||||
| CDGJ Commercial Mortgage Trust Series 2014-BXCH, Class DPA (P) (S) | 3.912 | 12-15-27 | 529,071 | 531,892 | |||||||||||||||||||||||||
| CGBAM Commercial Mortgage Trust Series 2015-SMRT, Class F (P) (S) | 3.912 | 04-10-28 | 325,000 | 319,807 | |||||||||||||||||||||||||
| CGGS Commercial Mortgage Trust Series 2016-RNDA, Class DFX (S) | 4.387 | 02-10-33 | 584,670 | 592,768 | |||||||||||||||||||||||||
| Rate (%) | Maturity date | Par value^ | Value | ||||||||||||||||||||||||||
| Commercial and residential (continued) | |||||||||||||||||||||||||||||
| Cold Storage Trust Series 2017-ICE3, Class D (P) (S) | 3.094 | 04-15-24 | 355,000 | $355,000 | |||||||||||||||||||||||||
| Commercial Mortgage Trust (Cantor Fitzgerald/Deutsche Bank) Series 2015-CR27, Class B (P) | 4.510 | 10-10-48 | 235,000 | 247,204 | |||||||||||||||||||||||||
| Commercial Mortgage Trust (Deutsche Bank) | |||||||||||||||||||||||||||||
| Series 2012-LC4, Class B (P) | 4.934 | 12-10-44 | 360,000 | 386,497 | |||||||||||||||||||||||||
| Series 2013-300P, Class D (P) (S) | 4.540 | 08-10-30 | 620,000 | 643,100 | |||||||||||||||||||||||||
| Series 2013-CR11, Class B (P) | 5.328 | 08-10-50 | 895,000 | 981,695 | |||||||||||||||||||||||||
| Series 2013-CR13, Class C (P) | 4.906 | 12-10-23 | 435,000 | 453,520 | |||||||||||||||||||||||||
| Series 2013-CR6, Class XA IO | 1.595 | 03-10-46 | 4,061,651 | 140,465 | |||||||||||||||||||||||||
| Series 2014-FL4, Class D (P) (S) | 3.440 | 07-13-31 | 600,000 | 589,550 | |||||||||||||||||||||||||
| Series 2014-TWC, Class D (P) (S) | 3.240 | 02-13-32 | 445,000 | 446,535 | |||||||||||||||||||||||||
| Commercial Mortgage Trust (Deutsche Bank/Morgan Stanley) Series 2014-PAT, Class D (P) (S) | 3.063 | 08-13-27 | 775,000 | 775,977 | |||||||||||||||||||||||||
| Commercial Mortgage Trust (Wells Fargo) Series 2014-CR16, Class C (P) | 5.065 | 04-10-47 | 552,000 | 567,195 | |||||||||||||||||||||||||
| Core Industrial Trust Series 2015-CALW, Class F (P) (S) | 3.979 | 02-10-34 | 360,000 | 361,008 | |||||||||||||||||||||||||
| Deutsche Bank Commercial Mortgage Trust Series 2016-C3, Class C (P) | 3.636 | 09-10-49 | 130,000 | 124,595 | |||||||||||||||||||||||||
| Deutsche Mortgage Securities, Inc. Mortgage Loan Trust Series 2004-4, Class 2AR1 (P) | 1.531 | 06-25-34 | 272,407 | 260,534 | |||||||||||||||||||||||||
| GAHR Commercial Mortgage Trust | |||||||||||||||||||||||||||||
| Series 2015-NRF, Class DFX (P) (S) | 3.495 | 12-15-34 | 220,000 | 222,709 | |||||||||||||||||||||||||
| Series 2015-NRF, Class EFX (P) (S) | 3.495 | 12-15-34 | 495,000 | 493,563 | |||||||||||||||||||||||||
| Great Wolf Trust Series 2015-WOLF, Class D (P) (S) | 4.494 | 05-15-34 | 520,000 | 527,139 | |||||||||||||||||||||||||
| GS Mortgage Securities Trust | |||||||||||||||||||||||||||||
| Series 2012-GC17, Class XA IO | 2.490 | 05-10-45 | 5,968,160 | 452,969 | |||||||||||||||||||||||||
| Series 2014-NEW, Class C (S) | 3.790 | 01-10-31 | 165,000 | 163,582 | |||||||||||||||||||||||||
| Series 2016-RENT, Class D (P) (S) | 4.202 | 02-10-29 | 420,000 | 429,730 | |||||||||||||||||||||||||
| Series 2017-485L, Class C (P) (S) | 4.115 | 02-10-37 | 240,000 | 249,064 | |||||||||||||||||||||||||
| Series 2017-GS5, Class C (P) | 4.299 | 03-10-50 | 190,000 | 199,290 | |||||||||||||||||||||||||
| HarborView Mortgage Loan Trust | |||||||||||||||||||||||||||||
| Series 2005-2, Class X IO | 1.492 | 05-19-35 | 4,851,354 | 239,465 | |||||||||||||||||||||||||
| Series 2005-9, Class 2A1C (P) | 1.443 | 06-20-35 | 484,375 | 464,041 | |||||||||||||||||||||||||
| Series 2007-3, Class ES IO (S) | 0.350 | 05-19-47 | 6,624,760 | 100,871 | |||||||||||||||||||||||||
| Series 2007-4, Class ES IO | 0.350 | 07-19-47 | 7,205,902 | 101,813 | |||||||||||||||||||||||||
| Series 2007-6, Class ES IO (S) | 0.342 | 08-19-37 | 5,574,030 | 69,748 | |||||||||||||||||||||||||
| HILT Mortgage Trust Series 2014-ORL, Class D (P) (S) | 3.144 | 07-15-29 | 310,000 | 305,508 | |||||||||||||||||||||||||
| Hilton USA Trust Series 2016-HHV, Class D (P) (S) | 4.333 | 11-05-38 | 285,000 | 274,350 | |||||||||||||||||||||||||
| Rate (%) | Maturity date | Par value^ | Value | ||||||||||||||||||||||||||
| Commercial and residential (continued) | |||||||||||||||||||||||||||||
| Hudsons Bay Simon JV Trust Series 2015-HBFL, Class DFL (P) (S) | 4.633 | 08-05-34 | 305,000 | $302,940 | |||||||||||||||||||||||||
| IndyMac Index Mortgage Loan Trust | |||||||||||||||||||||||||||||
| Series 2005-AR12, Class AX2 IO | 1.936 | 07-25-35 | 4,893,791 | 326,398 | |||||||||||||||||||||||||
| Series 2005-AR8, Class AX2 IO | 1.954 | 05-25-35 | 5,097,732 | 294,116 | |||||||||||||||||||||||||
| Series 2005-AR18, Class 1X IO | 1.792 | 10-25-36 | 6,245,901 | 415,828 | |||||||||||||||||||||||||
| Series 2005-AR18, Class 2X IO | 1.569 | 10-25-36 | 5,612,007 | 203,678 | |||||||||||||||||||||||||
| JPMBB Commercial Mortgage Securities Trust Series 2014-C19, Class C (P) | 4.822 | 04-15-47 | 725,000 | 736,332 | |||||||||||||||||||||||||
| JPMorgan Chase Commercial Mortgage Securities Trust | |||||||||||||||||||||||||||||
| Series 2012-HSBC, Class XA IO (S) | 1.582 | 07-05-32 | 2,815,000 | 182,812 | |||||||||||||||||||||||||
| Series 2014-FL5, Class C (P) (S) | 3.094 | 07-15-31 | 1,030,000 | 1,020,709 | |||||||||||||||||||||||||
| Series 2014-INN, Class F (P) (S) | 4.994 | 06-15-29 | 490,000 | 485,103 | |||||||||||||||||||||||||
| Series 2014-PHH, Class C (P) (S) | 3.094 | 08-15-27 | 760,000 | 759,999 | |||||||||||||||||||||||||
| Series 2015-MAR7, Class C (S) | 4.490 | 06-05-32 | 480,000 | 483,597 | |||||||||||||||||||||||||
| Series 2015-SGP, Class B (P) (S) | 3.744 | 07-15-36 | 360,000 | 362,022 | |||||||||||||||||||||||||
| Series 2016-JP3, Class C (P) | 3.623 | 08-15-49 | 183,000 | 174,695 | |||||||||||||||||||||||||
| MASTR Alternative Loan Trust Series 2005-2, Class 4A3 (P) | 1.391 | 03-25-35 | 161,623 | 153,371 | |||||||||||||||||||||||||
| Merrill Lynch Mortgage Investors Trust Series 2005-2, Class 1A (P) | 2.543 | 10-25-35 | 316,876 | 315,252 | |||||||||||||||||||||||||
| Morgan Stanley Bank of America Merrill Lynch Trust | |||||||||||||||||||||||||||||
| Series 2013-C7, Class C (P) | 4.282 | 02-15-46 | 293,000 | 289,941 | |||||||||||||||||||||||||
| Series 2014-C18, Class 300D | 5.279 | 08-15-31 | 380,000 | 394,238 | |||||||||||||||||||||||||
| Morgan Stanley Capital I Trust Series 2014-150E, Class D (P) (S) | 4.438 | 09-09-32 | 1,050,000 | 1,051,145 | |||||||||||||||||||||||||
| MortgageIT Trust Series 2005-2, Class 1A2 (P) | 1.651 | 05-25-35 | 230,960 | 219,137 | |||||||||||||||||||||||||
| MSCG Trust Series 2016-SNR, Class D (S) | 6.550 | 11-15-34 | 465,000 | 463,252 | |||||||||||||||||||||||||
| One Market Plaza Trust Series 2017-1MKT, Class D (S) | 4.146 | 02-10-32 | 190,000 | 192,623 | |||||||||||||||||||||||||
| Opteum Mortgage Acceptance Corp. Asset Backed Pass Through Certificates Series 2005-3, Class APT (P) | 1.281 | 07-25-35 | 243,941 | 239,282 | |||||||||||||||||||||||||
| TMSQ Mortgage Trust Series 2014-1500, Class D (P) (S) | 3.963 | 10-10-36 | 340,000 | 330,365 | |||||||||||||||||||||||||
| UBS Commercial Mortgage Trust Series 2012-C1, Class B | 4.822 | 05-10-45 | 405,000 | 443,204 | |||||||||||||||||||||||||
| UBS-Barclays Commercial Mortgage Trust Series 2012-C2, Class XA IO (S) | 1.583 | 05-10-63 | 3,789,319 | 208,922 | |||||||||||||||||||||||||
| VNDO Mortgage Trust Series 2013-PENN, Class D (P) (S) | 4.079 | 12-13-29 | 612,000 | 629,249 | |||||||||||||||||||||||||
| VNDO Trust Series 2016-350P, Class D (P) (S) | 3.903 | 01-10-35 | 455,000 | 460,337 | |||||||||||||||||||||||||
| WaMu Mortgage Pass Through Certificates Series 2005-AR8, Class 2AB2 (P) | 1.411 | 07-25-45 | 420,347 | 401,276 | |||||||||||||||||||||||||
| Rate (%) | Maturity date | Par value^ | Value | ||||||||||||||||||||||||||
| Commercial and residential (continued) | |||||||||||||||||||||||||||||
| Wells Fargo Commercial Mortgage Trust | |||||||||||||||||||||||||||||
| Series 2013-120B, Class C (P) (S) | 2.800 | 03-18-28 | 935,000 | $928,845 | |||||||||||||||||||||||||
| Series 2013-BTC, Class E (P) (S) | 3.668 | 04-16-35 | 620,000 | 562,118 | |||||||||||||||||||||||||
| Series 2015-LC22, Class B (P) | 4.541 | 09-15-58 | 295,000 | 317,376 | |||||||||||||||||||||||||
| Series 2017-RB1, Class C | 4.311 | 03-15-50 | 235,000 | 245,603 | |||||||||||||||||||||||||
| WF-RBS Commercial Mortgage Trust | |||||||||||||||||||||||||||||
| Series 2012-C9, Class XA IO (S) | 2.241 | 11-15-45 | 4,692,350 | 350,426 | |||||||||||||||||||||||||
| Series 2013-C15, Class B (P) | 4.629 | 08-15-46 | 155,000 | 165,121 | |||||||||||||||||||||||||
| Series 2013-C16, Class B (P) | 5.147 | 09-15-46 | 265,000 | 289,577 | |||||||||||||||||||||||||
| U.S. Government Agency 2.3% | 4,110,048 | ||||||||||||||||||||||||||||
| Federal Home Loan Mortgage Corp. | |||||||||||||||||||||||||||||
| Series 2015-DNA1, Class M2 (P) | 2.841 | 10-25-27 | 380,000 | 389,116 | |||||||||||||||||||||||||
| Series 2016-DNA3, Class M2 (P) | 2.991 | 12-25-28 | 280,000 | 286,707 | |||||||||||||||||||||||||
| Series K017, Class X1 IO | 1.511 | 12-25-21 | 2,742,210 | 141,881 | |||||||||||||||||||||||||
| Series K018, Class X1 IO | 1.531 | 01-25-22 | 3,478,015 | 182,803 | |||||||||||||||||||||||||
| Series K021, Class X1 IO | 1.609 | 06-25-22 | 769,559 | 48,156 | |||||||||||||||||||||||||
| Series K022, Class X1 IO | 1.388 | 07-25-22 | 8,824,025 | 477,685 | |||||||||||||||||||||||||
| Series K707, Class X1 IO | 1.660 | 12-25-18 | 2,309,097 | 45,044 | |||||||||||||||||||||||||
| Series K709, Class X1 IO | 1.645 | 03-25-19 | 3,166,331 | 73,197 | |||||||||||||||||||||||||
| Series K710, Class X1 IO | 1.886 | 05-25-19 | 3,394,628 | 96,294 | |||||||||||||||||||||||||
| Series K718, Class X1 IO | 0.767 | 01-25-22 | 16,627,959 | 424,048 | |||||||||||||||||||||||||
| Government National Mortgage Association | |||||||||||||||||||||||||||||
| Series 2012-114, Class IO | 0.822 | 01-16-53 | 1,586,670 | 89,386 | |||||||||||||||||||||||||
| Series 2016-142, Class IO | 0.997 | 09-16-58 | 1,525,407 | 130,192 | |||||||||||||||||||||||||
| Series 2016-162, Class IO | 0.996 | 09-16-58 | 3,315,600 | 274,530 | |||||||||||||||||||||||||
| Series 2016-174, Class IO | 0.904 | 11-16-56 | 2,162,321 | 181,745 | |||||||||||||||||||||||||
| Series 2016-87, Class IO | 1.007 | 08-16-58 | 2,045,976 | 157,967 | |||||||||||||||||||||||||
| Series 2017-20, Class IO | 0.750 | 12-16-58 | 4,099,810 | 290,620 | |||||||||||||||||||||||||
| Series 2017-22, Class IO | 1.047 | 12-16-57 | 1,461,265 | 144,175 | |||||||||||||||||||||||||
| Series 2017-3, Class IO | 0.907 | 09-16-58 | 3,815,739 | 301,992 | |||||||||||||||||||||||||
| Series 2017-46, Class IO | 0.619 | 11-16-57 | 3,106,176 | 213,973 | |||||||||||||||||||||||||
| Series 2017-61, Class IO | 0.765 | 05-16-59 | 1,845,000 | 160,537 | |||||||||||||||||||||||||
| Asset backed securities 11.8% (7.9% of Total investments) | $21,132,494 | ||||||||||||||||||||||||||||
| (Cost $20,827,577) | |||||||||||||||||||||||||||||
| Asset backed securities 11.8% | 21,132,494 | ||||||||||||||||||||||||||||
| ACE Securities Corp. Home Equity Loan Trust Series 2005-HE3, Class M2 (P) | 1.666 | 05-25-35 | 222,671 | 222,409 | |||||||||||||||||||||||||
| Aegis Asset Backed Securities Trust Series 2005-4, Class M1 (P) | 1.441 | 10-25-35 | 825,000 | 783,642 | |||||||||||||||||||||||||
| Ameriquest Mortgage Securities, Inc. Series 2005-R3, Class M2 (P) | 1.461 | 05-25-35 | 480,000 | 465,178 | |||||||||||||||||||||||||
| Applebee's Funding LLC Series 2014-1, Class A2 (S) | 4.277 | 09-05-44 | 1,000,000 | 985,341 | |||||||||||||||||||||||||
| Rate (%) | Maturity date | Par value^ | Value | ||||||||||||||||||||||||||
| Asset backed securities (continued) | |||||||||||||||||||||||||||||
| Arby's Funding LLC Series 2015-1A, Class A2 (S) | 4.969 | 10-30-45 | 630,400 | $631,964 | |||||||||||||||||||||||||
| Argent Securities, Inc. | |||||||||||||||||||||||||||||
| Series 2003-W10, Class M1 (P) | 2.071 | 01-25-34 | 219,379 | 205,983 | |||||||||||||||||||||||||
| Series 2004-W6, Class M1 (P) | 1.816 | 05-25-34 | 109,892 | 105,522 | |||||||||||||||||||||||||
| BMW Vehicle Owner Trust Series 2016-A, Class A4 | 1.370 | 12-27-22 | 325,000 | 321,146 | |||||||||||||||||||||||||
| Capital One Multi-Asset Execution Trust Series 2017-A1, Class A1 | 2.000 | 01-17-23 | 1,050,000 | 1,055,289 | |||||||||||||||||||||||||
| Chase Issuance Trust Series 2016-A5, Class A5 | 1.270 | 07-15-21 | 1,460,000 | 1,447,171 | |||||||||||||||||||||||||
| Chrysler Capital Auto Receivables Trust Series 2016-BA, Class A4 (S) | 1.870 | 02-15-22 | 260,000 | 258,075 | |||||||||||||||||||||||||
| CKE Restaurant Holdings, Inc. Series 2013-1A, Class A2 (S) | 4.474 | 03-20-43 | 1,038,298 | 1,032,713 | |||||||||||||||||||||||||
| ContiMortgage Home Equity Loan Trust Series 1995-2, Class A5 | 8.100 | 08-15-25 | 21,185 | 15,561 | |||||||||||||||||||||||||
| Countrywide Asset-Backed Certificates Trust Series 2004-10, Class AF5B (P) | 4.997 | 02-25-35 | 301,433 | 302,096 | |||||||||||||||||||||||||
| CSMC Trust Series 2006-CF2, Class M1 (P) (S) | 1.461 | 05-25-36 | 233,243 | 231,355 | |||||||||||||||||||||||||
| DB Master Finance LLC Series 2015-1A, Class A2II (S) | 3.980 | 02-20-45 | 852,600 | 866,614 | |||||||||||||||||||||||||
| Driven Brands Funding LLC Series 2015-1A, Class A2 (S) | 5.216 | 07-20-45 | 448,175 | 441,501 | |||||||||||||||||||||||||
| FOCUS Brands Funding LLC Series 2017-1A, Class A2I (S) | 3.857 | 04-30-47 | 145,000 | 145,802 | |||||||||||||||||||||||||
| Ford Credit Auto Owner Trust Series 2016-C, Class A4 | 1.400 | 02-15-22 | 290,000 | 286,543 | |||||||||||||||||||||||||
| GSAA Home Equity Trust Series 2005-11, Class 3A1 (P) | 1.261 | 10-25-35 | 252,187 | 246,105 | |||||||||||||||||||||||||
| Home Equity Asset Trust Series 2005-3, Class M4 (P) | 1.631 | 08-25-35 | 235,000 | 222,422 | |||||||||||||||||||||||||
| Honda Auto Receivables Owner Trust Series 2016-4, Class A4 | 1.360 | 01-18-23 | 510,000 | 504,256 | |||||||||||||||||||||||||
| Hyundai Auto Receivables Trust Series 2015-A, Class A4 | 1.370 | 07-15-20 | 430,000 | 429,455 | |||||||||||||||||||||||||
| Merrill Lynch Mortgage Investors Trust Series 2005-WMC1, Class M1 (P) | 1.741 | 09-25-35 | 256,559 | 238,605 | |||||||||||||||||||||||||
| MVW Owner Trust Series 2014-1A, Class A (S) | 2.250 | 09-22-31 | 97,833 | 97,181 | |||||||||||||||||||||||||
| New Century Home Equity Loan Trust Series 2005-1, Class M1 (P) | 1.666 | 03-25-35 | 425,000 | 400,791 | |||||||||||||||||||||||||
| RAAC Series Trust Series 2006-SP4, Class M1 (P) | 1.331 | 11-25-36 | 175,000 | 164,705 | |||||||||||||||||||||||||
| Saxon Asset Securities Trust Series 2006-2, Class A3C (P) | 1.141 | 09-25-36 | 469,684 | 456,236 | |||||||||||||||||||||||||
| Rate (%) | Maturity date | Par value^ | Value | ||||||||||||||||||||||||||
| Asset backed securities (continued) | |||||||||||||||||||||||||||||
| Sonic Capital LLC Series 2016-1A, Class A2 (S) | 4.472 | 05-20-46 | 223,688 | $222,791 | |||||||||||||||||||||||||
| Specialty Underwriting & Residential Finance Trust Series 2006-BC1, Class A2D (P) | 1.291 | 12-25-36 | 927,328 | 917,099 | |||||||||||||||||||||||||
| Structured Asset Securities Corp. Trust Series 2005-AR1, Class M1 (P) | 1.421 | 09-25-35 | 212,046 | 207,811 | |||||||||||||||||||||||||
| Synchrony Credit Card Master Note Trust Series 2016-1, Class A | 2.040 | 03-15-22 | 395,000 | 396,984 | |||||||||||||||||||||||||
| Taco Bell Funding LLC Series 2016-1A, Class A2I (S) | 3.832 | 05-25-46 | 512,425 | 521,597 | |||||||||||||||||||||||||
| Towd Point Mortgage Trust Series 2016-5, Class A1 (P) (S) | 2.500 | 10-25-56 | 579,254 | 577,683 | |||||||||||||||||||||||||
| Toyota Auto Receivables Owner Trust | |||||||||||||||||||||||||||||
| Series 2016-C, Class A4 | 1.320 | 11-15-21 | 285,000 | 282,085 | |||||||||||||||||||||||||
| Series 2017-A, Class A3 | 1.730 | 02-16-21 | 500,000 | 500,966 | |||||||||||||||||||||||||
| Verizon Owner Trust | |||||||||||||||||||||||||||||
| Series 2016-2A, Class A (S) | 1.680 | 05-20-21 | 710,000 | 708,958 | |||||||||||||||||||||||||
| Series 2017-1A, Class A (S) | 2.060 | 09-20-21 | 810,000 | 813,503 | |||||||||||||||||||||||||
| Wendys Funding LLC Series 2015-1A, Class A2I (S) | 3.371 | 06-15-45 | 1,787,775 | 1,798,326 | |||||||||||||||||||||||||
| Westgate Resorts LLC | |||||||||||||||||||||||||||||
| Series 2014-1A, Class A (S) | 2.150 | 12-20-26 | 376,077 | 374,309 | |||||||||||||||||||||||||
| Series 2014-1A, Class B (S) | 3.250 | 12-20-26 | 251,367 | 249,683 | |||||||||||||||||||||||||
| Series 2015-1A, Class A (S) | 2.750 | 05-20-27 | 187,521 | 188,091 | |||||||||||||||||||||||||
| Series 2015-2A, Class B (S) | 4.000 | 07-20-28 | 264,245 | 265,029 | |||||||||||||||||||||||||
| Series 2016-1A, Class A (S) | 3.500 | 12-20-28 | 223,112 | 224,318 | |||||||||||||||||||||||||
| Series 2017-1A, Class A (S) | 3.050 | 12-20-30 | 320,000 | 319,600 | |||||||||||||||||||||||||
| Shares | Value | ||||||||||||||||||||||||||||
| Common stocks 0.9% (0.6% of Total investments) | $1,669,320 | ||||||||||||||||||||||||||||
| (Cost $1,804,926) | |||||||||||||||||||||||||||||
| Energy 0.2% | 417,520 | ||||||||||||||||||||||||||||
| Oil, gas and consumable fuels 0.2% | |||||||||||||||||||||||||||||
| Royal Dutch Shell PLC, ADR, Class A | 8,000 | 417,520 | |||||||||||||||||||||||||||
| Financials 0.3% | 589,600 | ||||||||||||||||||||||||||||
| Capital markets 0.3% | |||||||||||||||||||||||||||||
| Ares Capital Corp. (L)(Z) | 33,500 | 589,600 | |||||||||||||||||||||||||||
| Health care 0.4% | 662,200 | ||||||||||||||||||||||||||||
| Pharmaceuticals 0.4% | |||||||||||||||||||||||||||||
| Sanofi, ADR | 14,000 | 662,200 | |||||||||||||||||||||||||||
| Shares | Value | ||||||||||||||||||||||||||||
| Preferred securities (b) 1.4% (1.0% of Total investments) | $2,559,845 | ||||||||||||||||||||||||||||
| (Cost $2,541,543) | |||||||||||||||||||||||||||||
| Consumer staples 0.3% | 559,180 | ||||||||||||||||||||||||||||
| Food and staples retailing 0.3% | |||||||||||||||||||||||||||||
| Ocean Spray Cranberries, Inc., 6.250% (S) | 6,250 | 559,180 | |||||||||||||||||||||||||||
| Financials 0.5% | 879,958 | ||||||||||||||||||||||||||||
| Banks 0.1% | |||||||||||||||||||||||||||||
| Wells Fargo & Company, Series L, 7.500% | 192 | 243,840 | |||||||||||||||||||||||||||
| Consumer finance 0.4% | |||||||||||||||||||||||||||||
| GMAC Capital Trust I, 6.824% (P) | 24,985 | 636,118 | |||||||||||||||||||||||||||
| Utilities 0.6% | 1,120,707 | ||||||||||||||||||||||||||||
| Electric utilities 0.1% | |||||||||||||||||||||||||||||
| Exelon Corp., 6.500% | 4,341 | 214,402 | |||||||||||||||||||||||||||
| Multi-utilities 0.5% | |||||||||||||||||||||||||||||
| Dominion Resources, Inc., 6.750% (L)(Z) | 13,140 | 665,147 | |||||||||||||||||||||||||||
| DTE Energy Company, 6.500% | 4,475 | 241,158 | |||||||||||||||||||||||||||
| Rate (%) | Maturity date | Par value^ | Value | ||||||||||||||||||||||||||
| Escrow certificates 0.0% (0.0% of Total investments) | $153 | ||||||||||||||||||||||||||||
| (Cost $0) | |||||||||||||||||||||||||||||
| Materials 0.0% | 153 | ||||||||||||||||||||||||||||
| Containers and packaging 0.0% | |||||||||||||||||||||||||||||
| Smurfit-Stone Container Corp. (I) | 8.000 | 03-15-17 | 245,000 | 153 | |||||||||||||||||||||||||
| Yield* (%) | Maturity date | Par value^ | Value | ||||||||||||||||||||||||||
| Short-term investments 2.3% (1.5% of Total investments) | $4,102,000 | ||||||||||||||||||||||||||||
| (Cost $4,102,000) | |||||||||||||||||||||||||||||
| U.S. Government Agency 2.0% | 3,508,000 | ||||||||||||||||||||||||||||
| Federal Home Loan Bank Discount Note | 0.680 | 05-01-17 | 3,508,000 | 3,508,000 | |||||||||||||||||||||||||
| Par value^ | Value | ||||||||||||||||||||||||||||
| Repurchase agreement 0.3% | 594,000 | ||||||||||||||||||||||||||||
| Repurchase Agreement with State Street Corp. dated 4-28-17 at 0.220% to be repurchased at $594,011 on 5-1-17, collateralized by $580,000 U.S. Treasury Inflation Indexed Notes, 0.125% due 4-15-19 (valued at $608,435 including interest) | 594,000 | 594,000 | |||||||||||||||||||||||||||
| Total investments (Cost $261,481,905)† 149.7% | $268,426,618 | ||||||||||||||||||||||||||||
| Other assets and liabilities, net (49.7%) | ($89,132,949 | ) | |||||||||||||||||||||||||||
| Total net assets 100.0% | $179,293,669 | ||||||||||||||||||||||||||||
| The percentage shown for each investment category is the total value of the category as a percentage of the net assets of the fund unless otherwise indicated. | |||||||||||||||||||||||||||||
| ^All par values are denominated in U.S. dollars unless otherwise indicated. | |||||||||||||||||||||||||||||
| Security Abbreviations and Legend | |||||||||||||||||||||||||||||
| ADR | American Depositary Receipts | ||||||||||||||||||||||||||||
| IO | Interest Only Security — (Interest Tranche of Stripped Mortgage Pool). Rate shown is the effective yield at period end. | ||||||||||||||||||||||||||||
| ISDAFIX | International Swaps and Derivatives Association Fixed Interest Rate Swap Rate | ||||||||||||||||||||||||||||
| LIBOR | London Interbank Offered Rate | ||||||||||||||||||||||||||||
| (a) | Includes hybrid securities with characteristics of both equity and debt that trade with and pay interest income. | ||||||||||||||||||||||||||||
| (b) | Includes preferred stocks and hybrid securities with characteristics of both equity and debt that pay dividends on a periodic basis. | ||||||||||||||||||||||||||||
| (H) | Non-income producing - Issuer is in default. | ||||||||||||||||||||||||||||
| (I) | Non-income producing security. | ||||||||||||||||||||||||||||
| (L) | A portion of this security is on loan as of 4-30-17, and is a component of the fund's leverage under the Liquidity Agreement. | ||||||||||||||||||||||||||||
| (M) | Term loans are variable rate obligations. The coupon rate shown represents the rate at period end. | ||||||||||||||||||||||||||||
| (P) | Variable rate obligation. The coupon rate shown represents the rate at period end. | ||||||||||||||||||||||||||||
| (Q) | Perpetual bonds have no stated maturity date. Date shown as maturity date is next call date. | ||||||||||||||||||||||||||||
| (S) | These securities are exempt from registration under Rule 144A of the Securities Act of 1933. Such securities may be resold, normally to qualified institutional buyers, in transactions exempt from registration. Rule 144A securities amounted to $83,187,855 or 46.4% of the fund's net assets as of 4-30-17. | ||||||||||||||||||||||||||||
| (T) | This position represents an unsettled loan commitment at period end. Certain details associated with this purchase are not known prior to the settlement date, including coupon rate, which is disclosed as TBD (To Be Determined). | ||||||||||||||||||||||||||||
| (Z) | All or a portion of this security is pledged as collateral pursuant to the Liquidity Agreement. Total collateral value at 4-30-17 was $112,022,254. A portion of the securities pledged as collateral were loaned pursuant to the Liquidity Agreement. The value of securities on loan amounted to $16,035,783. | ||||||||||||||||||||||||||||
| * | Yield represents either the annualized yield at the date of purchase, the stated coupon rate or, for floating rate securities, the rate at period end. | ||||||||||||||||||||||||||||
| † | At 4-30-17, the aggregate cost of investment securities for federal income tax purposes was $263,161,112. Net unrealized appreciation aggregated to $5,265,506, of which $8,459,697 related to appreciated investment securities and $3,194,191 related to depreciated investment securities. | ||||||||||||||||||||||||||||
DERIVATIVES
SWAPS
Interest rate swaps
| Counterparty | Notional amount | Currency | Payments made by fund | Payments received by fund | Fixed payment frequency | Floating payment frequency | Maturity date | Unamortized upfront payment paid (received) | Unrealized appreciation (depreciation) | Market value | ||||||||||||||||||||||||||||||||||
| Morgan Stanley Capital Services | 22,000,000 | USD | Fixed 1.09375% | 3 Month LIBOR (a) | Semi- Annual | Quarterly | May 2017 | — | ($63,247 | ) | ($63,247 | ) |
(a) At 4-30-17, 3-Month LIBOR was 1.1723%
See Notes to financial statements regarding investment transactions and other derivatives information.
Financial statements
STATEMENT OF ASSETS AND LIABILITIES 4-30-17 (unaudited)
| Assets | |||||||||||||||||||||
| Investments, at value (Cost $261,481,905) | $268,426,618 | ||||||||||||||||||||
| Cash | 5,808 | ||||||||||||||||||||
| Cash segregated at custodian for derivative contracts | 20,000 | ||||||||||||||||||||
| Dividends and interest receivable | 2,598,910 | ||||||||||||||||||||
| Other receivables and prepaid expenses | 24,233 | ||||||||||||||||||||
| Total assets | 271,075,569 | ||||||||||||||||||||
| Liabilities | |||||||||||||||||||||
| Liquidity agreement | 91,300,000 | ||||||||||||||||||||
| Payable for investments purchased | 235,024 | ||||||||||||||||||||
| Swap contracts, at value | 63,247 | ||||||||||||||||||||
| Interest payable | 121,035 | ||||||||||||||||||||
| Payable to affiliates | |||||||||||||||||||||
| Accounting and legal services fees | 12,756 | ||||||||||||||||||||
| Trustees' fees | 27 | ||||||||||||||||||||
| Other liabilities and accrued expenses | 49,811 | ||||||||||||||||||||
| Total liabilities | 91,781,900 | ||||||||||||||||||||
| Net assets | $179,293,669 | ||||||||||||||||||||
| Net assets consist of | |||||||||||||||||||||
| Paid-in capital | $182,289,517 | ||||||||||||||||||||
| Undistributed net investment income | 500,083 | ||||||||||||||||||||
| Accumulated net realized gain (loss) on investments and swap agreements | (10,377,397 | ) | |||||||||||||||||||
| Net unrealized appreciation (depreciation) on investments and swap agreements | 6,881,466 | ||||||||||||||||||||
| Net assets | $179,293,669 | ||||||||||||||||||||
| Net asset value per share | |||||||||||||||||||||
| Based on 11,646,585 shares of beneficial interest outstanding — unlimited number of shares authorized with no par value | $15.39 | ||||||||||||||||||||
STATEMENT OF OPERATIONS For the six months ended 4-30-17 (unaudited)
| Investment income | ||||||||||||||||||||||||
| Interest | $5,847,537 | |||||||||||||||||||||||
| Dividends | 132,978 | |||||||||||||||||||||||
| Less foreign taxes withheld | (2,256 | ) | ||||||||||||||||||||||
| Total investment income | 5,978,259 | |||||||||||||||||||||||
| Expenses | ||||||||||||||||||||||||
| Investment management fees | 694,233 | |||||||||||||||||||||||
| Interest expense | 638,529 | |||||||||||||||||||||||
| Accounting and legal services fees | 30,447 | |||||||||||||||||||||||
| Transfer agent fees | 42,251 | |||||||||||||||||||||||
| Trustees' fees | 21,521 | |||||||||||||||||||||||
| Printing and postage | 33,919 | |||||||||||||||||||||||
| Professional fees | 32,994 | |||||||||||||||||||||||
| Custodian fees | 12,971 | |||||||||||||||||||||||
| Stock exchange listing fees | 11,745 | |||||||||||||||||||||||
| Other | 3,429 | |||||||||||||||||||||||
| Total expenses | 1,522,039 | |||||||||||||||||||||||
| Less expense reductions | (10,213 | ) | ||||||||||||||||||||||
| Net expenses | 1,511,826 | |||||||||||||||||||||||
| Net investment income | 4,466,433 | |||||||||||||||||||||||
| Realized and unrealized gain (loss) | ||||||||||||||||||||||||
| Net realized gain (loss) on | ||||||||||||||||||||||||
| Investments | 140,009 | |||||||||||||||||||||||
| Swap contracts | (22,537 | ) | ||||||||||||||||||||||
| 117,472 | ||||||||||||||||||||||||
| Change in net unrealized appreciation (depreciation) of | ||||||||||||||||||||||||
| Investments | (928,475 | ) | ||||||||||||||||||||||
| Swap contracts | 26,797 | |||||||||||||||||||||||
| (901,678 | ) | |||||||||||||||||||||||
| Net realized and unrealized loss | (784,206 | ) | ||||||||||||||||||||||
| Increase in net assets from operations | $3,682,227 | |||||||||||||||||||||||
STATEMENTS OF CHANGES IN NET ASSETS
| Six months ended 4-30-17 | Year ended 10-31-16 | |||||||||||||||||||||||||
| (unaudited) | ||||||||||||||||||||||||||
| Increase (decrease) in net assets | ||||||||||||||||||||||||||
| From operations | ||||||||||||||||||||||||||
| Net investment income | $4,466,433 | $9,224,729 | ||||||||||||||||||||||||
| Net realized gain (loss) | 117,472 | (1,272,707 | ) | |||||||||||||||||||||||
| Change in net unrealized appreciation (depreciation) | (901,678 | ) | 6,031,668 | |||||||||||||||||||||||
| Increase in net assets resulting from operations | 3,682,227 | 13,983,690 | ||||||||||||||||||||||||
| Distributions to shareholders | ||||||||||||||||||||||||||
| From net investment income | (4,848,473 | ) | (9,911,245 | ) | ||||||||||||||||||||||
| Total increase (decrease) | (1,166,246 | ) | 4,072,445 | |||||||||||||||||||||||
| Net assets | ||||||||||||||||||||||||||
| Beginning of period | 180,459,915 | 176,387,470 | ||||||||||||||||||||||||
| End of period | $179,293,669 | $180,459,915 | ||||||||||||||||||||||||
| Undistributed net investment income | $500,083 | $882,123 | ||||||||||||||||||||||||
| Share activity | ||||||||||||||||||||||||||
| Shares outstanding | ||||||||||||||||||||||||||
| Beginning of period | 11,646,585 | 11,646,585 | ||||||||||||||||||||||||
| End of period | 11,646,585 | 11,646,585 | ||||||||||||||||||||||||
STATEMENT OF CASH FLOWS For the six months ended 4-30-17 (unaudited)
| Cash flows from operating activities | ||||||
| Net increase in net assets from operations | $3,682,227 | |||||
| Adjustments to reconcile net increase in net assets from operations to net cash provided by operating activities: | ||||||
| Long-term investments purchased | (52,266,725) | |||||
| Long-term investments sold | 53,673,402 | |||||
| Increase in short-term investments | (2,524,000) | |||||
| Net amortization of premium (discount) | 1,241,795 | |||||
| Decrease in cash segregated at custodian for derivative contracts | 260,000 | |||||
| Decrease in receivable for investments sold | 216,661 | |||||
| Decrease in dividends and interest receivable | 19,570 | |||||
| Increase in other receivables and prepaid assets | (12,883) | |||||
| Decrease in payable for investments purchased | (192,093) | |||||
| Decrease in unrealized appreciation (depreciation) of swap contracts | (26,797) | |||||
| Increase in interest payable | 32,085 | |||||
| Decrease in payable to affiliates | (1,722) | |||||
| Decrease in other liabilities and accrued expenses | (38,092) | |||||
| Net change in unrealized (appreciation) depreciation on investments | 928,475 | |||||
| Net realized gain on investments | (140,009) | |||||
| Net cash provided by operating activities | $4,851,894 | |||||
| Cash flows from financing activities | ||||||
| Distributions to common shareholders net of reinvestments | ($4,848,473) | |||||
| Net cash used in financing activities | ($4,848,473 | ) | ||||
| Net increase in cash | $3,421 | |||||
| Cash at beginning of period | $2,387 | |||||
| Cash at end of period | $5,808 | |||||
| Supplemental disclosure of cash flow information | ||||||
| Cash paid for interest | $606,444 | |||||
Financial highlights
| COMMON SHARES Period Ended | 4-30-171 | 10-31-16 | 10-31-15 | 10-31-14 | 10-31-13 | 10-31-12 | ||||||||||||||||||||||||||||||||||||||||||||||||||||||||||||||||||||||||||||||||||||||||||||||||||||||||||||||||
| Per share operating performance | ||||||||||||||||||||||||||||||||||||||||||||||||||||||||||||||||||||||||||||||||||||||||||||||||||||||||||||||||||||||
| Net asset value, beginning of period | $15.49 | $15.14 | $15.84 | $15.37 | $15.88 | $14.64 | ||||||||||||||||||||||||||||||||||||||||||||||||||||||||||||||||||||||||||||||||||||||||||||||||||||||||||||||||
| Net investment income2 | 0.38 | 0.79 | 0.81 | 0.86 | 0.91 | 1.03 | ||||||||||||||||||||||||||||||||||||||||||||||||||||||||||||||||||||||||||||||||||||||||||||||||||||||||||||||||
| Net realized and unrealized gain (loss) on investments | (0.06 | ) | 0.41 | (0.62 | ) | 0.56 | (0.39 | ) | 1.31 | |||||||||||||||||||||||||||||||||||||||||||||||||||||||||||||||||||||||||||||||||||||||||||||||||||||||||||||
| Total from investment operations | 0.32 | 1.20 | 0.19 | 1.42 | 0.52 | 2.34 | ||||||||||||||||||||||||||||||||||||||||||||||||||||||||||||||||||||||||||||||||||||||||||||||||||||||||||||||||
| Less distributions to common shareholders | ||||||||||||||||||||||||||||||||||||||||||||||||||||||||||||||||||||||||||||||||||||||||||||||||||||||||||||||||||||||
| From net investment income | (0.42 | ) | (0.85 | ) | (0.90 | ) | (0.95 | ) | (1.03 | ) | (1.10 | ) | ||||||||||||||||||||||||||||||||||||||||||||||||||||||||||||||||||||||||||||||||||||||||||||||||||||||||||
| Anti-dilutive impact of repurchase plan | — | — | 0.01 | 3 | — | — | — | |||||||||||||||||||||||||||||||||||||||||||||||||||||||||||||||||||||||||||||||||||||||||||||||||||||||||||||||
| Net asset value, end of period | $15.39 | $15.49 | $15.14 | $15.84 | $15.37 | $15.88 | ||||||||||||||||||||||||||||||||||||||||||||||||||||||||||||||||||||||||||||||||||||||||||||||||||||||||||||||||
| Per share market value, end of period | $14.29 | $14.26 | $13.86 | $14.29 | $14.28 | $16.53 | ||||||||||||||||||||||||||||||||||||||||||||||||||||||||||||||||||||||||||||||||||||||||||||||||||||||||||||||||
| Total return at net asset value (%)4,5 | 2.30 | 6 | 8.52 | 1.84 | 10.02 | 3.51 | 16.57 | |||||||||||||||||||||||||||||||||||||||||||||||||||||||||||||||||||||||||||||||||||||||||||||||||||||||||||||||
| Total return at market value (%)5 | 3.19 | 6 | 9.20 | 3.28 | 6.83 | (7.61 | ) | 19.95 | ||||||||||||||||||||||||||||||||||||||||||||||||||||||||||||||||||||||||||||||||||||||||||||||||||||||||||||||
| Ratios and supplemental data | ||||||||||||||||||||||||||||||||||||||||||||||||||||||||||||||||||||||||||||||||||||||||||||||||||||||||||||||||||||||
| Net assets applicable to common shares, end of period (in millions) | $179 | $180 | $176 | $186 | $181 | $186 | ||||||||||||||||||||||||||||||||||||||||||||||||||||||||||||||||||||||||||||||||||||||||||||||||||||||||||||||||
| Ratios (as a percentage of average net assets): | ||||||||||||||||||||||||||||||||||||||||||||||||||||||||||||||||||||||||||||||||||||||||||||||||||||||||||||||||||||||
| Expenses before reductions | 1.74 | 7 | 1.58 | 1.45 | 1.33 | 1.35 | 1.53 | |||||||||||||||||||||||||||||||||||||||||||||||||||||||||||||||||||||||||||||||||||||||||||||||||||||||||||||||
| Expenses including reductions8 | 1.73 | 7 | 1.57 | 1.43 | 1.32 | 1.35 | 1.53 | |||||||||||||||||||||||||||||||||||||||||||||||||||||||||||||||||||||||||||||||||||||||||||||||||||||||||||||||
| Net investment income | 5.10 | 7 | 5.24 | 5.22 | 5.50 | 5.81 | 6.88 | |||||||||||||||||||||||||||||||||||||||||||||||||||||||||||||||||||||||||||||||||||||||||||||||||||||||||||||||
| Portfolio turnover (%) | 20 | 43 | 51 | 52 | 60 | 50 | ||||||||||||||||||||||||||||||||||||||||||||||||||||||||||||||||||||||||||||||||||||||||||||||||||||||||||||||||
| Senior securities | ||||||||||||||||||||||||||||||||||||||||||||||||||||||||||||||||||||||||||||||||||||||||||||||||||||||||||||||||||||||
| Total debt outstanding end of period (in millions) | $91 | $91 | $91 | $91 | $90 | $90 | ||||||||||||||||||||||||||||||||||||||||||||||||||||||||||||||||||||||||||||||||||||||||||||||||||||||||||||||||
| Asset coverage per $1,000 of debt9 | $2,964 | $2,977 | $2,932 | $3,037 | $2,999 | $3,057 | ||||||||||||||||||||||||||||||||||||||||||||||||||||||||||||||||||||||||||||||||||||||||||||||||||||||||||||||||
| 1 | Six months ended 4-30-17. Unaudited. | ||||||||||||||||||||||||||||||||||||||||||||||||||||||||||||||||||||||||||||||||||
| 2 | Based on average daily shares outstanding. | ||||||||||||||||||||||||||||||||||||||||||||||||||||||||||||||||||||||||||||||||||
| 3 | The repurchase plan was completed at an average repurchase price of $13.86 for 96,519 shares, which equals $1,338,116 in redemptions for the year ended 10-31-15. | ||||||||||||||||||||||||||||||||||||||||||||||||||||||||||||||||||||||||||||||||||
| 4 | Total returns would have been lower had certain expenses not been reduced during the applicable periods. | ||||||||||||||||||||||||||||||||||||||||||||||||||||||||||||||||||||||||||||||||||
| 5 | Total return based on net asset value reflects changes in the fund's net asset value during each period. Total return based on market value reflects changes in market value. Each figure assumes that distributions from income, capital gains and tax return of capital, if any, were reinvested. These figures will differ depending upon the level of any discount from or premium to net asset value at which the fund's shares traded during the period. | ||||||||||||||||||||||||||||||||||||||||||||||||||||||||||||||||||||||||||||||||||
| 6 | Not annualized. | ||||||||||||||||||||||||||||||||||||||||||||||||||||||||||||||||||||||||||||||||||
| 7 | Annualized. | ||||||||||||||||||||||||||||||||||||||||||||||||||||||||||||||||||||||||||||||||||
| 8 | Expenses including reductions excluding interest expense were 1.00% (annualized) 1.02%, 1.01%, 1.00%,1.01% and 1.06% for the periods ended 4-30-17, 10-31-16, 10-31-15, 10-31-14, 10-31-13 and 10-31-12, respectively. | ||||||||||||||||||||||||||||||||||||||||||||||||||||||||||||||||||||||||||||||||||
| 9 | Asset coverage equals the total net assets plus borrowings divided by the borrowings of the fund outstanding at period end (Note 8). As debt outstanding changes, the level of invested assets may change accordingly. Asset coverage ratio provides a measure of leverage. | ||||||||||||||||||||||||||||||||||||||||||||||||||||||||||||||||||||||||||||||||||
Note 1 — Organization
John Hancock Income Securities Trust (the fund) is a closed-end management investment company organized as a Massachusetts business trust and registered under the Investment Company Act of 1940, as amended (the 1940 Act).
Note 2 — Significant accounting policies
The financial statements have been prepared in conformity with accounting principles generally accepted in the United States of America (US GAAP), which require management to make certain estimates and assumptions as of the date of the financial statements. Actual results could differ from those estimates and those differences could be significant. The fund qualifies as an investment company under Topic 946 of Accounting Standards Codification of US GAAP.
Events or transactions occurring after the end of the fiscal period through the date that the financial statements were issued have been evaluated in the preparation of the financial statements. The following summarizes the significant accounting policies of the fund:
Security valuation. Investments are stated at value as of the scheduled close of regular trading on the New York Stock Exchange (NYSE), normally at 4:00 p.m., Eastern Time. In case of emergency or other disruption resulting in the NYSE not opening for trading or the NYSE closing at a time other than the regularly scheduled close, the net asset value (NAV) may be determined as of the regularly scheduled close of the NYSE pursuant to the fund's Valuation Policies and Procedures.
In order to value the securities, the fund uses the following valuation techniques: Debt obligations are valued based on the evaluated prices provided by an independent pricing vendor or from broker-dealers. Independent pricing vendors utilize matrix pricing which takes into account factors such as institutional-size trading in similar groups of securities, yield, quality, coupon rate, maturity, type of issue, trading characteristics and other market data, as well as broker supplied prices. Equity securities held by the fund are typically valued at the last sale price or official closing price on the exchange or principal market where the security trades. In the event there were no sales during the day or closing prices are not available, the securities are valued using the last available bid price. Swaps are valued using evaluated prices obtained from an independent pricing vendor. Foreign securities are valued in U.S. dollars based on foreign currency exchange rates supplied by an independent pricing vendor.
In certain instances, the Pricing Committee may determine to value equity securities using prices obtained from another exchange or market if trading on the exchange or market on which prices are typically obtained did not open for trading as scheduled, or if trading closed earlier than scheduled, and trading occurred as normal on another exchange or market.
Other portfolio securities and assets, for which reliable market quotations are not readily available, are valued at fair value as determined in good faith by the fund's Pricing Committee following procedures established by the Board of Trustees. The frequency with which these fair valuation procedures are used cannot be predicted and fair value of securities may differ significantly from the value that would have been used had a ready market for such securities existed.
The fund uses a three-tier hierarchy to prioritize the pricing assumptions, referred to as inputs, used in valuation techniques to measure fair value. Level 1 includes securities valued using quoted prices in active markets for identical securities. Level 2 includes securities valued using other significant observable inputs. Observable inputs may include quoted prices for similar securities, interest rates, prepayment speeds and credit risk. Prices for securities valued using these inputs are received from independent pricing vendors and brokers and are based on an evaluation of the inputs described. Level 3 includes securities valued using significant unobservable inputs when market prices are not readily available or reliable, including the fund's own assumptions in determining the fair value of investments. Factors used in determining value may include market or issuer specific events or trends, changes in interest rates and credit quality. The inputs or methodology used for valuing securities are not necessarily an indication of the risks associated with investing in those securities. Changes in valuation techniques and related inputs may result in transfers into or out of an assigned level within the disclosure hierarchy.
The following is a summary of the values by input classification of the fund's investments as of April 30, 2017, by major security category or type:
| Total value at 4-30-17 | Level 1 quoted price | Level 2 significant observable inputs | Level 3 significant unobservable inputs | |||||||||||
| Corporate bonds | $165,710,140 | — | $165,710,140 | — | ||||||||||
| Convertible bonds | 285,106 | — | 285,106 | — | ||||||||||
| Term loans | 426,813 | — | 426,813 | — | ||||||||||
| Capital preferred securities | 1,567,943 | — | 1,567,943 | — | ||||||||||
| U.S. Government and Agency obligations | 32,249,790 | — | 32,249,790 | — | ||||||||||
| Foreign government obligations | 1,314,675 | — | 1,314,675 | — | ||||||||||
| Collateralized mortgage obligations | 37,408,339 | — | 37,408,339 | — | ||||||||||
| Asset backed securities | 21,132,494 | — | 21,132,494 | — | ||||||||||
| Common stocks | 1,669,320 | $1,669,320 | — | — | ||||||||||
| Preferred securities | 2,559,845 | 2,000,665 | 559,180 | — | ||||||||||
| Escrow certificates | 153 | — | — | $153 | ||||||||||
| Short-term investments | 4,102,000 | — | 4,102,000 | — | ||||||||||
| Total investments in securities | $268,426,618 | $3,669,985 | $264,756,480 | $153 | ||||||||||
| Other financial instruments: | ||||||||||||||
| Interest rate swaps | ($63,247 | ) | — | ($63,247 | ) | — | ||||||||
Repurchase agreements. The fund may enter into repurchase agreements. When the fund enters into a repurchase agreement, it receives collateral that is held in a segregated account by the fund's custodian. The collateral amount is marked-to-market and monitored on a daily basis to ensure that the collateral held is in an amount not less than the principal amount of the repurchase agreement plus any accrued interest. Collateral received by the fund for repurchase agreements is disclosed in the Fund's investments as part of the caption related to the repurchase agreement.
Repurchase agreements are typically governed by the terms and conditions of the Master Repurchase Agreement and/or Global Master Repurchase Agreement (collectively, MRA). Upon an event of default, the non-defaulting party may close out all transactions traded under the MRA and net amounts owed. Absent an event of default, assets and liabilities resulting from repurchase agreements are not offset in the Statement of assets and liabilities. In the event of a default by the counterparty, realization of the collateral proceeds could be delayed, during which time the collateral value may decline or the counterparty may have insufficient assets to pay back claims resulting from close-out of the transactions.
Security transactions and related investment income. Investment security transactions are accounted for on a trade date plus one basis for daily NAV calculations. However, for financial reporting purposes, investment transactions are reported on trade date. Interest income is accrued as earned. Interest income includes coupon interest and amortization/accretion of premiums/discounts on debt securities. Debt obligations may be placed in a non-accrual status and related interest income may be reduced by stopping current accruals and writing off interest receivable when the collection of all or a portion of interest has become doubtful. Dividend income is recorded on the ex-date, except for dividends of foreign securities where the dividend may not be known until after the ex-date. In those cases, dividend income, net of withholding taxes, is recorded when the fund becomes aware of the dividends. Distributions received on securities that represent a tax return of capital or capital gain are recorded as a reduction of cost of investments and/or as a realized gain if amounts are estimable. Foreign taxes are provided for based on the fund's understanding of the tax rules and rates that exist in the foreign markets in which it invests. Gains and losses on securities sold are determined on the basis of identified cost and may include proceeds from litigation.
Foreign currency translation. Assets, including investments and liabilities denominated in foreign currencies, are translated into U.S. dollar values each day at the prevailing exchange rate. Purchases and sales of securities, income and
expenses are translated into U.S. dollars at the prevailing exchange rate on the date of the transaction. The effect of changes in foreign currency exchange rates on the value of securities is reflected as a component of the realized and unrealized gains (losses) on investments.
Funds that invest internationally generally carry more risk than funds that invest strictly in U.S. securities. Risks can result from differences in economic and political conditions, regulations, market practices (including higher transaction costs), accounting standards and other factors. Foreign investments are also subject to a decline in the value of a foreign currency versus the U.S. dollar, which reduces the dollar value of securities denominated in that currency.
Foreign taxes. The fund may be subject to withholding tax on income and/or capital gains or repatriation taxes imposed by certain countries in which the fund invests. Taxes are accrued based upon investment income, realized gains or unrealized appreciation.
Stripped securities. Stripped securities are financial instruments structured to separate principal and interest cash flows so that one class receives principal payments from the underlying assets (PO or principal only), while the other class receives the interest cash flows (IO or interest only). Both PO and IO investments represent an interest in the cash flows of an underlying stripped security. If the underlying assets experience greater than anticipated prepayments of principal, the fund may fail to fully recover its initial investment in an IO security. The market value of these securities can be extremely volatile in response to changes in interest rates or prepayments on the underlying securities. In addition, these securities present additional credit risk such that the fund may not receive all or part of its principal or interest payments because the borrower or issuer has defaulted on its obligation.
Overdrafts. Pursuant to the custodian agreement, the fund's custodian may, in its discretion, advance funds to the fund to make properly authorized payments. When such payments result in an overdraft, the fund is obligated to repay the custodian for any overdraft, including any costs or expenses associated with the overdraft. The custodian may have a lien, security interest or security entitlement in any fund property that is not otherwise segregated or pledged, to the maximum extent permitted by law, to the extent of any overdraft.
Expenses. Within the John Hancock group of funds complex, expenses that are directly attributable to an individual fund are allocated to such fund. Expenses that are not readily attributable to a specific fund are allocated among all funds in an equitable manner, taking into consideration, among other things, the nature and type of expense and the fund's relative net assets. Expense estimates are accrued in the period to which they relate and adjustments are made when actual amounts are known.
Federal income taxes. The fund intends to continue to qualify as a regulated investment company by complying with the applicable provisions of the Internal Revenue Code and will not be subject to federal income tax on taxable income that is distributed to shareholders. Therefore, no federal income tax provision is required.
Under the Regulated Investment Company Modernization Act of 2010, the fund is permitted to carry forward capital losses incurred in taxable years beginning after December 22, 2010 for an unlimited period. Any losses incurred during those taxable years will be required to be utilized prior to the losses incurred in pre-enactment taxable years. As a result of this ordering rule, pre-enactment capital loss carryforwards may be more likely to expire unused. Additionally, post-enactment capital losses that are carried forward will retain their character as either short-term or long-term capital losses rather than being considered all short-term as under previous law.
For federal income tax purposes, as of October 31, 2016, the fund has a capital loss carryforward of $8,886,638 available to offset future net realized capital gains. The following table details the capital loss carryforward available:
| Capital loss carryforward expiring October 31 | No expiration date | ||
| 2017 | 2018 | Short term | Long term |
| $6,785,450 | $436,296 | $266,204 | $1,398,688 |
As of October 31, 2016, the fund had no uncertain tax positions that would require financial statement recognition, derecognition or disclosure. The fund's federal tax returns are subject to examination by the Internal Revenue Service for a period of three years.
Distribution of income and gains. Distributions to shareholders from net investment income and net realized gains, if any, are recorded on the ex-date. The fund generally declares and pays dividends quarterly and capital gain distributions, if any, annually.
Such distributions, on a tax basis, are determined in conformity with income tax regulations, which may differ from US GAAP.
Capital accounts within the financial statements are adjusted for permanent book-tax differences. These adjustments have no impact on net assets or the results of operations. Temporary book-tax differences, if any, will reverse in a subsequent period. Book-tax differences are primarily attributable to expiration of a capital loss carryforward, partnerships, derivative transactions and amortization and accretion on debt securities.
Statement of cash flows. Information on financial transactions that have been settled through the receipt and disbursement of cash is presented in the Statement of cash flows. The cash amount shown in the Statement of cash flows is the amount included in the fund's Statement of assets and liabilities and represents the cash on hand at the fund's custodian and does not include any short-term investments or cash segregated at the custodian for derivative contracts.
Note 3 — Derivative instruments
The fund may invest in derivatives in order to meet its investment objective. Derivatives include a variety of different instruments that may be traded in the over-the-counter (OTC) market, on a regulated exchange or through a clearing facility. The risks in using derivatives vary depending upon the structure of the instruments, including the use of leverage, optionality, the liquidity or lack of liquidity of the contract, the creditworthiness of the counterparty or clearing organization and the volatility of the position. Some derivatives involve risks that are potentially greater than the risks associated with investing directly in the referenced securities or other referenced underlying instrument. Specifically, the fund is exposed to the risk that the counterparty to an OTC derivatives contract will be unable or unwilling to make timely settlement payments or otherwise honor its obligations. OTC derivatives transactions typically can only be closed out with the other party to the transaction.
Certain swaps are typically traded through the OTC market. Derivative counterparty risk is managed through an ongoing evaluation of the creditworthiness of all potential counterparties and, if applicable, designated clearing organizations. The fund attempts to reduce its exposure to counterparty risk for derivatives traded in the OTC market, whenever possible, by entering into an International Swaps and Derivatives Association (ISDA) Master Agreement with each of its OTC counterparties. The ISDA gives each party to the agreement the right to terminate all transactions traded under the agreement if there is certain deterioration in the credit quality or contractual default of the other party, as defined in the ISDA. Upon an event of default or a termination of the ISDA, the non-defaulting party has the right to close out all transactions and to net amounts owed.
As defined by the ISDA, the fund may have collateral agreements with certain counterparties to mitigate counterparty risk on OTC derivatives. Subject to established minimum levels, collateral for OTC transactions is generally determined based on the net aggregate unrealized gain or loss on contracts with a particular counterparty. Collateral pledged to the fund is held in a segregated account by a third-party agent or held by the custodian bank for the benefit of the fund and can be in the form of cash or debt securities issued by the U.S. government or related agencies; collateral posted by the fund for OTC transactions is held in a segregated account at the fund's custodian and is noted in the accompanying Fund's investments, or if cash is posted, on the Statement of assets and liabilities. The fund's maximum risk of loss due to counterparty risk is equal to the asset value of outstanding contracts offset by collateral received.
Interest rate swaps. Interest rate swaps represent an agreement between the fund and a counterparty to exchange cash flows based on the difference between two interest rates applied to a notional amount. The payment flows are usually netted against each other, with the difference being paid by one party to the other. The fund settles accrued net interest receivable or payable under the swap contracts at specified, future intervals. Swap agreements are privately negotiated in the OTC market
or may be executed on a registered commodities exchange (centrally cleared swaps). Swaps are marked-to-market daily and the change in value is recorded as unrealized appreciation/depreciation of swap contracts. A termination payment by the counterparty or the fund is recorded as realized gain or loss, as well as the net periodic payments received or paid by the fund. The value of the swap will typically impose collateral posting obligations on the party that is considered out-of-the-money on the swap.
Entering into swap agreements involves, to varying degrees, elements of credit, market and documentation risk that may provide outcomes that are in excess of the amounts recognized on the Statement of assets and liabilities. Such risks involve the possibility that there will be no liquid market for the swap, or that a counterparty may default on its obligation or delay payment under the swap terms. The counterparty may disagree or contest the terms of the swap. In addition to interest rate risk, market risks may also impact the swap. The fund may also suffer losses if it is unable to terminate or assign outstanding swaps or reduce its exposure through offsetting transactions.
During the six months ended April 30, 2017, the fund used interest rate swaps in anticipation of rising interest rates. No interest rate swap positions were entered into or closed during the six months ended April 30, 2017.
Fair value of derivative instruments by risk category
The table below summarizes the fair value of derivatives held by the fund at April 30, 2017 by risk category:
| Risk | Statement of assets and liabilities location | Financial instruments location | Assets derivatives fair value | Liabilities derivative fair value | |||||||||||||
| Interest rate | Swap contracts, at value | Interest rate swaps | — | ($63,247 | ) |
For financial reporting purposes, the portfolio does not offset OTC derivative assets or liabilities that are subject to master netting arrangements, as defined by the ISDAs, in the Statement of assets and liabilities. In the event of default by the counterparty or a termination of the agreement, the ISDA allows an offset of amounts across the various transactions between the fund and the applicable counterparty.
Effect of derivative instruments on the Statement of operations
The table below summarizes the net realized gain (loss) included in the net increase (decrease) in net assets from operations, classified by derivative instrument and risk category, for the six months ended April 30, 2017:
| Risk | Statement of operations location | Swap contracts | ||||||
| Interest rate | Net realized gain (loss) | ($22,537 | ) |
The table below summarizes the net change in unrealized appreciation (depreciation) included in the net increase (decrease) in net assets from operations, classified by derivative instrument and risk category, for the six months ended April 30, 2017:
| Risk | Statement of operations location | Swap contracts |
| Interest rate | Change in unrealized appreciation (depreciation) | $26,797 |
Note 4 — Guarantees and indemnifications
Under the fund's organizational documents, its Officers and Trustees are indemnified against certain liabilities arising out of the performance of their duties to the fund. Additionally, in the normal course of business, the fund enters into contracts with service providers that contain general indemnification clauses. The fund's maximum exposure under these arrangements is unknown, as this would involve future claims that may be made against the fund that have not yet occurred. The risk of material loss from such claims is considered remote.
Note 5 — Fees and transactions with affiliates
John Hancock Advisers, LLC (the Advisor) serves as investment advisor for the fund. The Advisor is an indirect, wholly owned subsidiary of Manulife Financial Corporation (MFC).
Management fee. The fund has an investment management agreement with the Advisor under which the fund pays a daily management fee to the Advisor, equivalent on an annual basis, to the sum of (a) 0.650% of the first $150 million of the fund's average daily managed assets (net assets plus borrowings under the Liquidity Agreement (see Note 8), (b) 0.375% of the next $50 million of the fund's average daily managed assets, (c) 0.350% of the next $100 million of the fund's average daily managed assets and (d) 0.300% of the fund's average daily managed assets in excess of $300 million. The Advisor has a subadvisory agreement with John Hancock Asset Management a division of Manulife Asset Management (US) LLC, an indirectly owned subsidiary of MFC and an affiliate of the Advisor. The fund is not responsible for payment of the subadvisory fees.
The Advisor has contractually agreed to waive a portion of its management fee and/or reimburse expenses for certain funds of the John Hancock group of funds complex, including the fund (the participating portfolios). This waiver is based upon aggregate net assets of all the participating portfolios. The amount of the reimbursement is calculated daily and allocated among all the participating portfolios in proportion to the daily net assets of each fund. During the six months ended April 30, 2017, this waiver amounted to 0.01% of the fund's average daily managed assets (on an annualized basis). This arrangement may be amended or terminated at any time by the Advisor upon notice to the fund and with the approval of the Board of Trustees.
The expense reductions described above amounted to $10,213 for the six months ended April 30, 2017.
Expenses waived or reimbursed in the current fiscal period are not subject to recapture in future fiscal periods.
The investment management fees, including the impact of the waivers and reimbursements as described above, incurred for the six months ended April 30, 2017 were equivalent to a net annual effective rate of 0.51% of the fund's average daily managed assets.
Accounting and legal services. Pursuant to a service agreement, the fund reimburses the Advisor for all expenses associated with providing the administrative, financial, legal, accounting and recordkeeping services to the fund, including the preparation of all tax returns, periodic reports to shareholders and regulatory reports, among other services. These accounting and legal services fees incurred for the six months ended April 30, 2017 amounted to an annual rate of 0.02% of the fund's average daily managed assets.
Trustee expenses. The fund compensates each Trustee who is not an employee of the Advisor or its affiliates. These Trustees receive from the fund and the other John Hancock closed-end funds an annual retainer. In addition, Trustee out-of-pocket expenses are allocated to each fund based on its net assets relative to other funds within the John Hancock group of funds complex.
Note 6 — Fund share transactions
On March 12, 2015, the Board of Trustees approved a share repurchase plan, which is subsequently reviewed and approved by the Board of Trustees each year in December. Under the current share repurchase plan, the fund may purchase in the open market, up to 10% of its outstanding common shares as of December 31, 2016. The current share repurchase plan will remain in effect between January 1, 2017 to December 31, 2017. During the six months ended April 30, 2017 and the year ended October 31, 2016, there was no activity under the share repurchase plan.
Note 7 — Leverage risk
The fund utilizes a Liquidity Agreement to increase its assets available for investment. When the fund leverages its assets, common shareholders bear the fees associated with the Liquidity Agreement and have potential to benefit or be disadvantaged from the use of leverage. The Advisor's fee is also increased in dollar terms from the use of leverage. Consequently, the fund and the Advisor may have differing interests in determining whether to leverage the fund's assets. Leverage creates risks that may adversely affect the return for the holders of common shares, including:
| • | the likelihood of greater volatility of NAV and market price of common shares; |
| • | fluctuations in the interest rate paid for the use of the Liquidity Agreement; |
| • | increased operating costs, which may reduce the fund's total return; |
| • | the potential for a decline in the value of an investment acquired through leverage, while the fund's obligations under such leverage remains fixed; and |
| • | the fund is more likely to have to sell securities in a volatile market in order to meet asset coverage or other debt compliance requirements. |
To the extent the income or capital appreciation derived from securities purchased with funds received from leverage exceeds the cost of leverage, the fund's return will be greater than if leverage had not been used; conversely, returns would be lower if the cost of the leverage exceeds the income or capital appreciation derived. The use of securities lending to obtain leverage in the fund's investments may subject the fund to greater risk of loss than would reinvestment of collateral in short-term highly rated investments.
In addition to the risks created by the fund's use of leverage, the fund is subject to the risk that it would be unable to timely, or at all, obtain replacement financing if the Liquidity Agreement is terminated. Were this to happen, the fund would be required to de-leverage, selling securities at a potentially inopportune time and incurring tax consequences. Further, the fund's ability to generate income from the use of leverage would be adversely affected.
Note 8 — Liquidity agreement
The fund has entered into a Liquidity Agreement (LA) with State Street Bank and Trust Company (SSB) that allows it to borrow or otherwise access up to $91.3 million (maximum facility amount) through a line of credit, securities lending and reverse repurchase agreements. The amounts outstanding at April 30, 2017 are shown in the Statement of assets and liabilities as the Liquidity agreement.
The fund pledges its assets as collateral to secure obligations under the LA. The fund retains the risks and rewards of the ownership of assets pledged to secure obligations under the LA and makes these assets available for securities lending and reverse repurchase transactions with SSB acting as the fund's authorized agent for these transactions. All transactions initiated through SSB are required to be secured with cash collateral received from the securities borrower (the Borrower) or cash is received from the reverse repurchase agreement (Reverse Repo) counterparties. Securities lending transactions will be secured with cash collateral in amounts at least equal to 100% of the market value of the securities utilized in these transactions. Cash received by SSB from securities lending or Reverse Repo transactions is credited against the amounts borrowed under the line of credit.
Upon return of securities by the Borrower or Reverse Repo counterparty, SSB will return the cash collateral to the Borrower or proceeds from the Reverse Repo, as applicable, which will eliminate the credit against the line of credit and will cause the drawdowns under the line of credit to increase by the amounts returned. Income earned on the loaned securities is retained by SSB, and any interest due on the reverse repurchase agreements is paid by SSB.
SSB has indemnified the fund for certain losses that may arise if the Borrower or a Reverse Repo Counterparty fails to return securities when due. With respect to securities lending transactions, upon a default of the securities borrower, SSB uses the collateral received from the Borrower to purchase replacement securities of the same issue, type, class and series. If the value of the collateral is less than the purchase cost of replacement securities, SSB is responsible for satisfying the shortfall but only to the extent that the shortfall is not due to any of the fund's losses on the reinvested cash collateral. Although the risk of the loss of the securities is mitigated by receiving collateral from the Borrower or proceeds from the Reverse Repo counterparty and through SSB indemnification, the fund could experience a delay in recovering securities or could experience a lower than expected return if the Borrower or Reverse Repo counterparty fails to return the securities on a timely basis.
Under normal circumstances, interest charged is at the rate of one month LIBOR (London Interbank Offered Rate) plus 0.60%, is payable monthly on the aggregate balance of the drawdowns outstanding under the LA. As of April 30, 2017, the fund had an aggregate balance of $91,300,000 at an interest rate of 1.60%, which is reflected in the Liquidity agreement on the Statement of assets and liabilities. During the six months ended April 30, 2017, the average balance of the LA and the effective average interest rate were $91,300,000 and 1.41%, respectively.
After the six month anniversary of the effective date of the agreement, the fund may terminate the LA with 60 days' notice. If certain asset coverage and collateral requirements, or other covenants are not met, the LA could be deemed in default and result in termination. Absent a default or facility termination event, SSB is required to provide the fund with 360 days' notice prior to terminating the LA.
Note 9 — Purchase and sale of securities
Purchases and sales of securities, other than short-term securities and U.S. Treasury obligations, amounted to $44,858,341 and $47,169,070, respectively, for the six months ended April 30, 2017. Purchases and sales of U.S. Treasury obligations aggregated $7,408,384 and $6,504,332, respectively, for the six months ended April 30, 2017.
Note 10 — Interfund Trading
The fund is permitted to purchase or sell securities from or to certain other affiliated funds, as set forth in Rule 17a-7 of the 1940 Act, under specified conditions outlined in procedures adopted by the Board of Trustees of the fund. The procedures have been designed to ensure that any purchase or sale of securities by the fund from or to another fund that is or could be considered an affiliate complies with Rule 17a-7 of the 1940 Act. Further, as defined under the procedures, each transaction is effected at the current market price. Pursuant to these procedures, for the period ended April 30,2017, the fund engaged in sales amounting to $2,003,255.
Note 11 — New rule issuance
In October 2016, the Securities Exchange Commission SEC issued Final Rule Release No.33-10231, Investment Company Reporting Modernization (the Release). The Release calls for the adoption of new rules and forms as well as amendments to its rules and forms to modernize the reporting and disclosure of information by registered investment companies. The SEC is adopting amendments to Regulation S-X, which will require standardized, enhanced disclosure about derivatives in investment company financial statements, as well as other amendments. The updates to Regulation S-X are effective August 1, 2017 and may result in additional disclosure relating to the presentation of derivatives and certain other financial instruments. These updates will have no impact on the fund's net assets or results of operations.
Unaudited
Investment objective and policy
The fund is a closed-end, diversified management investment company, common shares of which were initially offered to the public on February 14, 1973, and are publicly traded on the New York Stock Exchange (the NYSE). The fund's investment objective is to generate a high level of current income consistent with prudent investment risk. There can be no assurance that the fund will achieve its investment objective. The fund utilizes a credit facility agreement to increase its assets available for investments.
Under normal circumstances, the fund invests at least 80% of its net assets (plus borrowings for investment purposes) in income securities, consisting of the following: (i) marketable corporate debt securities, (ii) governmental obligations and (iii) cash and commercial paper. The fund will notify shareholders at least 60 days prior to any change in this 80% investment policy. The fund may invest up to 20% of its total assets in income-producing preferred securities and common stocks.
Dividends and distributions
During the six months ended April 30, 2017, distributions from net investment income totaling $0.4163 per share were paid to shareholders. The dates of payments and the amounts per share were as follows:
| Payment Date | Income Distributions |
| December 30, 2016 | $0.2184 |
| March 31, 2017 | 0.1979 |
| Total | $0.4163 |
The fund held its Annual Meeting of Shareholders on January 24, 2017. The following proposal was considered by the shareholders:
Proposal: Election of thirteen (13) Nominees to serve until their respective successors have been duly elected and qualified
| Total votes for the nominee | Total votes withheld from the nominee | |
| Independent Trustees | ||
| Charles L. Bardelis | 9,270,744.091 | 780,330.774 |
| Peter S. Burgess | 9,264,119.091 | 786,955.774 |
| William H. Cunningham | 9,258,889.091 | 792,185.774 |
| Grace K. Fey | 9,255,714.091 | 795,360.774 |
| Theron S. Hoffman | 9,256,607.091 | 794,467.774 |
| Deborah C. Jackson | 9,250,024.091 | 801,050.774 |
| Hassell H. McClellan | 9,270,744.091 | 780,330.774 |
| James M. Oates | 9,264,119.091 | 786,955.774 |
| Steven R. Pruchansky | 9,264,119.091 | 786,955.774 |
| Gregory A. Russo | 9,265,738.091 | 785,336.774 |
| Non-Independent Trustee | ||
| James R. Boyle | 9,255,973.091 | 795,101.774 |
| Craig Bromley1 | 9,242,829.091 | 808,245.774 |
| Warren A. Thomson | 9,232,496.091 | 818,578.774 |
| 1 | Effective June 15, 2017, Mr. Bromley no longer serves as a Trustee of the fund. Andrew G. Arnott has been appointed as a Trustee of the fund effective June 20, 2017. Mr. Arnott serves as a Trustee until his successor has been duly elected and qualified. |
Trustees Hassell H. McClellan, Chairperson# Officers Andrew G. Arnott John J. Danello Francis V. Knox, Jr. Charles A. Rizzo Salvatore Schiavone | Investment advisor John Hancock Advisers, LLC Subadvisor John Hancock Asset Management a division of Manulife Asset Management (US) LLC Custodian State Street Bank and Trust Company Transfer agent Computershare Shareowner Services, LLC Legal counsel K&L Gates LLP Stock symbol Listed New York Stock Exchange: JHS |
*Member of the Audit Committee
†Non-Independent Trustee
#Effective 1-1-17
## Effective 6-20-17
The fund's proxy voting policies and procedures, as well as the fund proxy voting record for the most recent twelve-month period ended June 30, are available free of charge on the Securities and Exchange Commission (SEC) website at sec.gov or on our website.
The fund's complete list of portfolio holdings, for the first and third fiscal quarters, is filed with the SEC on Form N-Q. The fund's Form N-Q is available on our website and the SEC's website, sec.gov, and can be reviewed and copied (for a fee) at the SEC's Public Reference Room in Washington, DC. Call 800-SEC-0330 to receive information on the operation of the SEC's Public Reference Room.
We make this information on your fund, as well as monthly portfolio holdings, and other fund details available on our website at jhinvestments.com or by calling 800-852-0218.
| You can also contact us: | |||
| 800-852-0218 jhinvestments.com | Regular mail: Computershare | Express mail: Computershare | |
John Hancock family of funds
DOMESTIC EQUITY FUNDS Balanced Blue Chip Growth Classic Value Disciplined Value Disciplined Value Mid Cap Equity Income Fundamental All Cap Core Fundamental Large Cap Core Fundamental Large Cap Value New Opportunities Small Cap Value Small Company Strategic Growth U.S. Global Leaders Growth U.S. Growth Value Equity GLOBAL AND INTERNATIONAL EQUITY FUNDS Disciplined Value International Emerging Markets Emerging Markets Equity Fundamental Global Franchise Global Equity Global Shareholder Yield Greater China Opportunities International Growth International Small Company International Value Equity | INCOME FUNDS Bond California Tax-Free Income Emerging Markets Debt Floating Rate Income Global Income Government Income High Yield High Yield Municipal Bond Income Investment Grade Bond Money Market Short Duration Credit Opportunities Spectrum Income Strategic Income Opportunities Tax-Free Bond ALTERNATIVE AND SPECIALTY FUNDS Absolute Return Currency Alternative Asset Allocation Enduring Assets Financial Industries Global Absolute Return Strategies Global Conservative Absolute Return Global Focused Strategies Natural Resources Redwood Regional Bank Seaport Technical Opportunities |
The fund's investment objectives, risks, charges, and expenses are included in the prospectus and should be considered carefully before investing. For a prospectus, contact your financial professional, call John Hancock Investments at 800-852-0218, or visit the fund's website at jhinvestments.com. Please read the prospectus carefully before investing or sending money.
ASSET ALLOCATION Income Allocation Fund Multi-Index Lifetime Portfolios Multi-Index Preservation Portfolios Multimanager Lifestyle Portfolios Multimanager Lifetime Portfolios EXCHANGE-TRADED FUNDS John Hancock Multifactor Consumer Discretionary ETF John Hancock Multifactor Consumer Staples ETF John Hancock Multifactor Developed International ETF John Hancock Multifactor Energy ETF John Hancock Multifactor Financials ETF John Hancock Multifactor Healthcare ETF John Hancock Multifactor Industrials ETF John Hancock Multifactor Large Cap ETF John Hancock Multifactor Materials ETF John Hancock Multifactor Mid Cap ETF John Hancock Multifactor Technology ETF John Hancock Multifactor Utilities ETF | ENVIRONMENTAL, SOCIAL, AND GOVERNANCE FUNDS ESG All Cap Core ESG Core Bond ESG International Equity ESG Large Cap Core CLOSED-END FUNDS Financial Opportunities Hedged Equity & Income Income Securities Trust Investors Trust Preferred Income Preferred Income II Preferred Income III Premium Dividend Tax-Advantaged Dividend Income Tax-Advantaged Global Shareholder Yield |
John Hancock Multifactor ETF shares are bought and sold at market price (not NAV), and are not individually redeemed
from the fund. Brokerage commissions will reduce returns.
John Hancock ETFs are distributed by Foreside Fund Services, LLC, and are subadvised by Dimensional Fund Advisors LP.
Foreside is not affiliated with John Hancock Funds, LLC or Dimensional Fund Advisors LP.
Dimensional Fund Advisors LP receives compensation from John Hancock in connection with licensing rights to the
John Hancock Dimensional indexes. Dimensional Fund Advisors LP does not sponsor, endorse, or sell, and makes no
representation as to the advisability of investing in, John Hancock Multifactor ETFs.
John Hancock Investments
A trusted brand
John Hancock Investments is a premier asset manager representing one of
America's most trusted brands, with a heritage of financial stewardship dating
back to 1862. Helping our shareholders pursue their financial goals is at the
core of everything we do. It's why we support the role of professional financial
advice and operate with the highest standards of conduct and integrity.
A better way to invest
We serve investors globally through a unique multimanager approach:
We search the world to find proven portfolio teams with specialized
expertise for every strategy we offer, then we apply robust investment
oversight to ensure they continue to meet our uncompromising standards
and serve the best interests of our shareholders.
Results for investors
Our unique approach to asset management enables us to provide a diverse set
of investments backed by some of the world's best managers, along with strong
risk-adjusted returns across asset classes.

 | John Hancock Advisers, LLC 601 Congress Street n Boston, MA 02210-2805 800-852-0218 n jhinvestments.com | |
| MF368610 | P6SA 4/17 6/17 | |
ITEM 2. CODE OF ETHICS.
Not applicable.
ITEM 3. AUDIT COMMITTEE FINANCIAL EXPERT.
Not applicable at this time.
ITEM 4. PRINCIPAL ACCOUNTANT FEES AND SERVICES.
Not applicable at this time.
ITEM 5. AUDIT COMMITTEE OF LISTED REGISTRANTS.
Not applicable at this time.
ITEM 6. SCHEDULE OF INVESTMENTS.
(a) Not applicable.
(b) Not applicable.
ITEM 7. DISCLOSURE OF PROXY VOTING POLICIES AND PROCEDURES FOR CLOSED-END MANAGEMENT INVESTMENT COMPANIES.
Not applicable.
ITEM 8. PORTFOLIO MANAGERS OF CLOSED-END MANAGEMENT INVESTMENT COMPANIES.
Not applicable.
ITEM 9. PURCHASES OF EQUITY SECURITIES BY CLOSED-END MANAGEMENT INVESTMENT COMPANY AND AFFILIATED PURCHASERS.
(a) Not applicable.
(b)
| Total number of | Maximum number of | |||
| shares purchased | shares that may yet | |||
| Total number of | Average price per | as part of publicly | be purchased under | |
| Period | shares purchased | share | announced plans* | the plans |
| Nov-16 | - | - | - | 1,164,659 |
| Dec-16 | - | - | - | 1,164,659 |
| Jan-17 | - | - | - | 1,164,659* |
| Feb-17 | - | - | - | 1,164,659 |
| Mar-17 | - | - | - | 1,164,659 |
| Apr-17 | - | - | - | 1,164,659 |
| Total | - | - | ||
*In March 2015, the Board of Trustees approved a share repurchase plan, which has been subsequently reviewed and approved by the Board of Trustees. Under the current share repurchase plan, the Fund may purchase in the open market up to 10% of its outstanding common shares as of December 31, 2016. The current share plan will remain in effect between January 31, 2017 and December 31, 2017. | ||||
ITEM 10. SUBMISSION OF MATTERS TO A VOTE OF SECURITY HOLDERS.
The registrant has adopted procedures by which shareholders may recommend nominees to the registrant’s Board of Trustees. A copy of the procedures is filed as an exhibit to this Form N-CSR. See attached “John Hancock Funds – Nominating, Governance and Administration Committee Charter.”
ITEM 11. CONTROLS AND PROCEDURES.
(a) Based upon their evaluation of the registrant's disclosure controls and procedures as conducted within 90 days of the filing date of this Form N-CSR, the registrant's principal executive officer and principal financial officer have concluded that those disclosure controls and procedures provide reasonable assurance that the material information required to be disclosed by the registrant on this report is recorded, processed, summarized and reported within the time periods specified in the Securities and Exchange Commission's rules and forms.
(b) There were no changes in the registrant's internal control over financial reporting that occurred during the registrant's most recent fiscal half-year (the registrant's second fiscal half-year in the case of an annual report) that have materially affected, or are reasonably likely to materially affect, the registrant's internal control over financial reporting.
ITEM 12. EXHIBITS.
(a) Separate certifications for the registrant's principal executive officer and principal financial officer, as required by Section 302 of the Sarbanes-Oxley Act of 2002 and Rule 30a-2(a) under the Investment Company Act of 1940, are attached.
(b) Separate certifications for the registrant's principal executive officer and principal financial officer, as required by 18 U.S.C. Section 1350, as adopted pursuant to Section 906 of the Sarbanes-Oxley Act of 2002, and Rule 30a-2(b) under the Investment Company Act of 1940, are attached. The certifications furnished pursuant to this paragraph are not deemed to be "filed" for purposes of Section 18 of the Securities Exchange Act of 1934, or otherwise subject to the liability of that section. Such certifications are not deemed to be incorporated by reference into any filing under the Securities Act of 1933 or the Securities Exchange Act of 1934, except to the extent that the Registrant specifically incorporates them by reference.
(c)(1) Submission of Matters to a Vote of Security Holders is attached. See attached “John Hancock Funds – Nominating, Governance and Administration Committee Charter.”
(c)(2) Contact person at the registrant.
SIGNATURES
Pursuant to the requirements of the Securities Exchange Act of 1934 and the Investment Company Act of 1940, the registrant has duly caused this report to be signed on its behalf by the undersigned, thereunto duly authorized.
John Hancock Income Securities Trust
| By: | /s/ Andrew Arnott | |
| Andrew Arnott | ||
| President | ||
| Date: | June 21, 2017 | |
Pursuant to the requirements of the Securities Exchange Act of 1934 and the Investment Company Act of 1940, this report has been signed below by the following persons on behalf of the registrant and in the capacities and on the dates indicated.
| By: | /s/ Andrew Arnott | |
| Andrew Arnott | ||
| President | ||
| Date: | June 21, 2017 | |
| By: | /s/ Charles A. Rizzo | |
| Charles A. Rizzo | ||
| Chief Financial Officer | ||
| Date: | June 21, 2017 | |