UNITED STATES
SECURITIES AND EXCHANGE COMMISSION
Washington, D.C. 20549
FORM N-CSR
CERTIFIED SHAREHOLDER REPORT OF REGISTERED
MANAGEMENT INVESTMENT COMPANIES
Investment Company Act file number811- 4186
John Hancock Income Securities Trust
(Exact name of registrant as specified in charter)
200 Berkeley Street, Boston, Massachusetts 02116
(Address of principal executive offices) (Zip code)
Salvatore Schiavone
Treasurer
200 Berkeley Street
Boston, Massachusetts 02116
(Name and address of agent for service)
Registrant's telephone number, including area code:617-663-4497
| Date of fiscal year end: | | October 31 |
| | | |
| | | |
| Date of reporting period: | | April 30, 2020 |
ITEM 1. REPORTS TO STOCKHOLDERS.
John Hancock
Income Securities Trust
Ticker: JHS
Semiannual report 4/30/2020
Beginning on January 1, 2021, as permitted by regulations adopted by the Securities and Exchange Commission, paper copies of the fund's shareholder reports such as this one will no longer be sent by mail, unless you specifically request paper copies of the reports from the transfer agent or from your financial intermediary. Instead, the reports will be made available on our website, and you will be notified by mail each time a report is posted and be provided with a website link to access the report.
If you have already elected to receive shareholder reports electronically, you will not be affected by this change and you do not need to take any action. You may elect to receive shareholder reports and other communications electronically by calling the transfer agent, Computershare, at 800-852-0218, by going to "Communication Preferences" at computershare.com/investor, or by contacting your financial intermediary.
You may elect to receive all reports in paper, free of charge, at any time. You can inform the transfer agent or your financial intermediary that you wish to continue receiving paper copies of your shareholder reports by following the instructions listed above. Your election to receive reports in paper will apply to all funds held with John Hancock Investment Management or your financial intermediary.

A message to shareholders
Dear shareholder,
Global financial markets were on pace to deliver strong returns during the 6 months ended April 30, 2020, until heightened fears over the coronavirus (COVID-19) sent markets tumbling during the latter half of February and early March.Investors reacted by exiting higher-risk assets and moving into cash, leading to a liquidity crunch in the fixed-income markets.
In response to the sell-off, the U.S. Federal Reserve acted quickly with a broad array of actions to limit the economic damage from the pandemic, including up to $2.3 trillion in lending to support households, employers, financial markets, and state and local governments. These steps, along with the passage of an estimated $2 trillion federal economic stimulus bill, helped lift the markets in the final two weeks of March, while credit spreads rebounded off their highs as liquidity concerns eased.
The continued spread of COVID-19, trade disputes, rising unemployment, and other geopolitical tensions may continue to create uncertainty among businesses and investors. Your financial professional can helpposition your portfolio so that it's sufficiently diversified to seek to meet your long-term objectives and to withstand the inevitable bouts of market volatility along the way.
On behalf of everyone at John Hancock Investment Management, I'd like to take this opportunity to welcome new shareholders and thank existing shareholders for the continued trust you've placed in us.
Sincerely,
Andrew G. Arnott
President and CEO,
John Hancock Investment Management
Head of Wealth and Asset Management,
United States and Europe
This commentary reflects the CEO's views as of this report's period end and are subject to change at any time. Diversification does not guarantee investment returns and does not eliminate risk of loss. All investments entail risks, including the possible loss of principal. For more up-to-date information, you can visit our website at jhinvestments.com.
John Hancock
Income Securities Trust
Table of contents
| | | |
| 2 | | Your fund at a glance |
| 3 | | Portfolio summary |
| 6 | | Fund's investments |
| 29 | | Financial statements |
| 33 | | Financial highlights |
| 34 | | Notes to financial statements |
| 41 | | Additional information |
| 42 | | Shareholder meeting |
| 43 | | More information |
SEMIANNUAL REPORT | JOHN HANCOCK INCOME SECURITIES TRUST 1
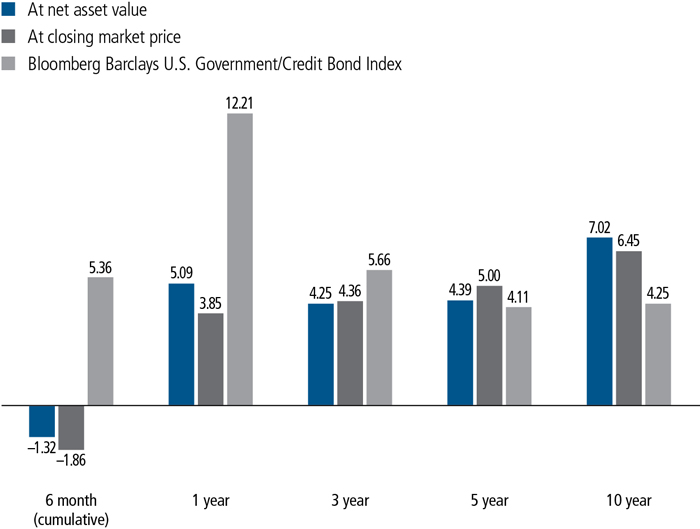
INVESTMENT OBJECTIVE
The fund seeks to generate a high level of current income consistent with prudent investment risk.
AVERAGE ANNUAL TOTAL RETURNS AS OF 4/30/2020 (%)
The Bloomberg Barclays U.S. Government/Credit Bond Index is an unmanaged index of U.S. government bonds, U.S. corporate bonds, and Yankee bonds.
It is not possible to invest directly in an index. Index figures do not reflect expenses or sales charges, which would result in lower returns.
The performance data contained within this material represents past performance, which does not guarantee future results.
Investment returns and principal value will fluctuate and a shareholder may sustain losses. Further, the fund's performance at net asset value (NAV) is different from the fund's performance at closing market price because the closing market price is subject to the dynamics of secondary market trading. Market risk may be augmented when shares are purchased at a premium to NAV or sold at a discount to NAV. Current month-end performance may be higher or lower than the performance cited. The fund's most recent performance can be found at jhinvestments.com or by calling 800-852-0218.
SEMIANNUAL REPORT | JOHN HANCOCK INCOME SECURITIES TRUST 2
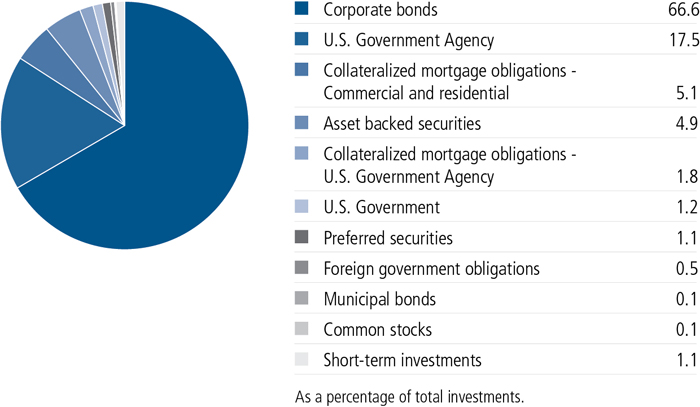
PORTFOLIO COMPOSITION AS OF 4/30/2020 (%)
COUNTRY COMPOSITION AS OF 4/30/2020 (%)
| | |
| United States | 87.1 |
| United Kingdom | 4.0 |
| Canada | 1.5 |
| France | 1.3 |
| Netherlands | 1.2 |
| Other countries | 4.9 |
| TOTAL | 100.0 |
| As a percentage of total investments. | |
SEMIANNUAL REPORT | JOHN HANCOCK INCOME SECURITIES TRUST 3
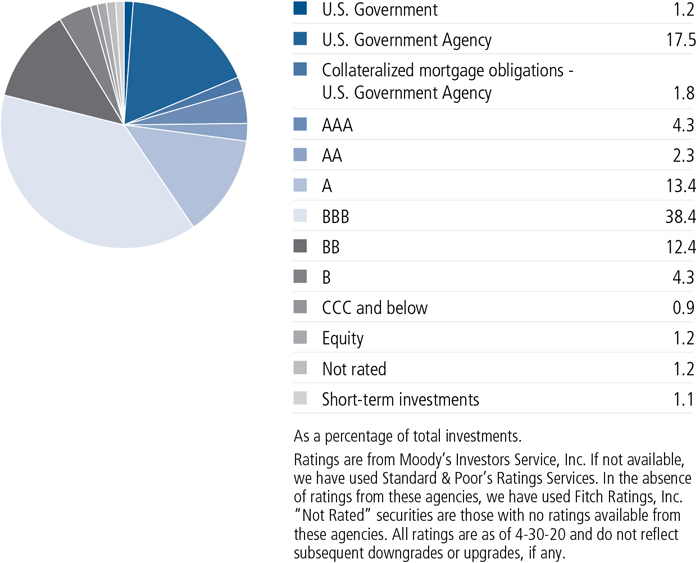
QUALITY COMPOSITION AS OF 4/30/2020 (%)
SEMIANNUAL REPORT | JOHN HANCOCK INCOME SECURITIES TRUST 4
A note about risks
As is the case with all exchange-listed closed-end funds, shares of this fund may trade at a discount or a premium to the fund's net asset value (NAV). An investment in the fund is subject to investment and market risks, including the possible loss of the entire principal invested. There is no guarantee prior distribution levels will be maintained, and distributions may include a substantial return of capital. Fixed-income investments are subject to interest-rate and credit risk; their value will normally decline as interest rates rise or if a creditor, grantor, or counterparty is unable or unwilling to make principal, interest, or settlement payments. Investments in higher-yielding, lower-rated securities are subject to a higher risk of default. An issuer of securities held by the fund may default, have its credit rating downgraded, or otherwise perform poorly, which may affect fund performance. Mortgage- and asset-backed securities may be sensitive to changes in interest rates and may be subject to early repayment and the market's perception of issuer creditworthiness. Liquidity—the extent to which a security may be sold or a derivative position closed without negatively affecting its market value—may be impaired by reduced trading volume, heightened volatility, rising interest rates, and other market conditions. The fund's use of leverage creates additional risks, including greater volatility of the fund's NAV, market price, and returns. There is no assurance that the fund's leverage strategy will be successful. Derivatives transactions, such as hedging and other strategic transactions, may increase a fund's volatility and could produce disproportionate losses, potentially more than the fund's principal investment. Cybersecurity incidents may allow an unauthorized party to gain access to fund assets, customer data, or proprietary information, or cause a fund or its service providers to suffer data corruption or lose operational functionality. Similar incidents affecting issuers of fund securities may negatively impact performance.
A widespread health crisis such as a global pandemic could cause substantial market volatility, exchange trading suspensions and closures, impact the ability to complete redemptions, and affect fund performance. For example, the novel coronavirus disease (COVID-19) has resulted in significant disruptions to global business activity. The impact of a health crisis and other epidemics and pandemics that may arise in the future, could affect the global economy in ways that cannot necessarily be foreseen at the present time. A health crisis may exacerbate other pre-existing political, social, and economic risks. Any such impact could adversely affect the funds' performance, resulting in losses to your investment.
SEMIANNUAL REPORT | JOHN HANCOCK INCOME SECURITIES TRUST 5
AS OF 4-30-20 (unaudited)
| | Rate (%) | Maturity date | | Par value^ | Value |
| U.S. Government and Agency obligations 28.4% (18.7% of Total investments) | | $49,527,275 |
| (Cost $47,215,840) | | | | | |
| U.S. Government 1.7% | | | | | 3,013,059 |
| U.S. Treasury | | | | | |
| Bond | 2.375 | 11-15-49 | | 2,205,000 | 2,789,670 |
| Note (A)(B) | 0.500 | 03-31-25 | | 151,000 | 152,026 |
| Note (A)(B) | 1.500 | 02-15-30 | | 66,000 | 71,363 |
| U.S. Government Agency 26.7% | | | | | 46,514,216 |
| Federal Home Loan Mortgage Corp. | | | | | |
| 30 Yr Pass Thru | 3.000 | 03-01-43 | | 524,721 | 570,438 |
| 30 Yr Pass Thru | 3.000 | 10-01-49 | | 1,949,122 | 2,062,461 |
| 30 Yr Pass Thru | 3.000 | 12-01-49 | | 117,262 | 124,799 |
| 30 Yr Pass Thru | 3.000 | 12-01-49 | | 3,944,887 | 4,177,481 |
| 30 Yr Pass Thru | 3.000 | 01-01-50 | | 2,163,151 | 2,300,900 |
| 30 Yr Pass Thru | 3.500 | 07-01-46 | | 1,607,412 | 1,727,249 |
| 30 Yr Pass Thru | 3.500 | 10-01-46 | | 685,044 | 744,331 |
| 30 Yr Pass Thru | 3.500 | 12-01-46 | | 357,776 | 388,307 |
| 30 Yr Pass Thru | 3.500 | 02-01-47 | | 1,949,979 | 2,114,551 |
| 30 Yr Pass Thru | 3.500 | 11-01-48 | | 3,490,399 | 3,808,973 |
| 30 Yr Pass Thru | 4.000 | 04-01-46 | | 1,802,772 | 1,963,849 |
| 30 Yr Pass Thru | 4.000 | 06-01-47 | | 1,709,011 | 1,847,144 |
| Federal National Mortgage Association | | | | | |
| 30 Yr Pass Thru | 3.000 | 12-01-42 | | 1,694,416 | 1,835,623 |
| 30 Yr Pass Thru | 3.000 | 07-01-43 | | 551,598 | 588,085 |
| 30 Yr Pass Thru | 3.000 | 11-01-49 | | 579,189 | 613,882 |
| 30 Yr Pass Thru | 3.500 | 12-01-42 | | 2,252,326 | 2,460,546 |
| 30 Yr Pass Thru | 3.500 | 01-01-43 | | 2,087,434 | 2,280,410 |
| 30 Yr Pass Thru | 3.500 | 04-01-45 | | 960,801 | 1,043,018 |
| 30 Yr Pass Thru | 3.500 | 11-01-46 | | 1,964,406 | 2,130,048 |
| 30 Yr Pass Thru | 3.500 | 07-01-47 | | 2,321,761 | 2,515,359 |
| 30 Yr Pass Thru | 3.500 | 07-01-47 | | 1,616,122 | 1,771,588 |
| 30 Yr Pass Thru | 3.500 | 11-01-47 | | 893,349 | 967,282 |
| 30 Yr Pass Thru | 3.500 | 09-01-49 | | 1,022,640 | 1,082,473 |
| 30 Yr Pass Thru | 3.500 | 03-01-50 | | 1,822,857 | 1,934,980 |
| 30 Yr Pass Thru | 4.000 | 09-01-41 | | 323,842 | 362,374 |
| 30 Yr Pass Thru | 4.000 | 09-01-41 | | 665,316 | 731,380 |
| 30 Yr Pass Thru | 4.000 | 06-01-46 | | 1,691,810 | 1,841,826 |
| 30 Yr Pass Thru | 4.000 | 06-01-47 | | 1,526,578 | 1,650,684 |
|
| 30 Yr Pass Thru | 4.000 | 12-01-47 | | 797,708 | 874,175 |
| Foreign government obligations 0.7% (0.5% of Total investments) | | $1,256,071 |
| (Cost $1,114,611) | | | | | |
| Qatar 0.4% | | | | | 710,309 |
| State of Qatar | | | | | |
| Bond (C) | 3.375 | 03-14-24 | | 384,000 | 405,284 |
| 6 | JOHN HANCOCK INCOME SECURITIES TRUST | SEMIANNUAL REPORT | SEE NOTES TO FINANCIAL STATEMENTS |
| | Rate (%) | Maturity date | | Par value^ | Value |
| Qatar (continued) | | | | | |
| Bond (C) | 5.103 | 04-23-48 | | 245,000 | $305,025 |
| Saudi Arabia 0.3% | | | | | 545,762 |
Kingdom of Saudi Arabia
Bond (C) | 4.375 | 04-16-29 | | 490,000 | 545,762 |
|
| Corporate bonds 101.2% (66.6% of Total investments) | | $176,722,492 |
| (Cost $176,978,499) | | | | | |
| Communication services 12.4% | | | | 21,731,976 |
| Diversified telecommunication services 3.5% | | | |
| AT&T, Inc. (B) | 3.400 | 05-15-25 | | 765,000 | 810,822 |
| AT&T, Inc. (B) | 3.800 | 02-15-27 | | 775,000 | 836,026 |
| C&W Senior Financing DAC (C) | 6.875 | 09-15-27 | | 240,000 | 237,000 |
| CenturyLink, Inc. (C) | 4.000 | 02-15-27 | | 113,000 | 109,610 |
| Cincinnati Bell, Inc. (A)(B)(C) | 7.000 | 07-15-24 | | 366,000 | 370,462 |
| GCI LLC (C) | 6.625 | 06-15-24 | | 133,000 | 137,655 |
| GCI LLC (A)(B) | 6.875 | 04-15-25 | | 420,000 | 433,650 |
| Level 3 Financing, Inc. (C) | 3.400 | 03-01-27 | | 328,000 | 328,148 |
| Liquid Telecommunications Financing PLC (C) | 8.500 | 07-13-22 | | 205,000 | 172,876 |
| Radiate Holdco LLC (A)(B)(C) | 6.625 | 02-15-25 | | 245,000 | 242,550 |
| Telecom Argentina SA (C) | 6.500 | 06-15-21 | | 208,000 | 188,242 |
| Telecom Argentina SA (C) | 8.000 | 07-18-26 | | 186,000 | 149,546 |
| Telecom Italia Capital SA | 7.200 | 07-18-36 | | 365,000 | 409,640 |
| Telecom Italia SpA (A)(B)(C) | 5.303 | 05-30-24 | | 250,000 | 259,998 |
| Verizon Communications, Inc. (B) | 3.000 | 03-22-27 | | 75,000 | 81,305 |
| Verizon Communications, Inc. (B) | 4.400 | 11-01-34 | | 260,000 | 315,898 |
| Verizon Communications, Inc. (B) | 4.862 | 08-21-46 | | 830,000 | 1,119,730 |
| Entertainment 2.2% | | | |
| Activision Blizzard, Inc. (B) | 3.400 | 09-15-26 | | 901,000 | 1,003,836 |
| Lions Gate Capital Holdings LLC (A)(B)(C) | 5.875 | 11-01-24 | | 183,000 | 166,603 |
| Netflix, Inc. | 4.875 | 04-15-28 | | 564,000 | 599,775 |
| Netflix, Inc. (C) | 4.875 | 06-15-30 | | 209,000 | 223,818 |
| Netflix, Inc. (A)(B)(C) | 5.375 | 11-15-29 | | 92,000 | 101,044 |
| Netflix, Inc. | 5.875 | 11-15-28 | | 400,000 | 452,340 |
| The Walt Disney Company | 7.750 | 01-20-24 | | 1,020,000 | 1,232,118 |
| Interactive media and services 0.2% | | | |
| Match Group, Inc. (C) | 4.125 | 08-01-30 | | 175,000 | 169,750 |
| National CineMedia LLC (C) | 5.875 | 04-15-28 | | 135,000 | 95,850 |
| Twitter, Inc. (C) | 3.875 | 12-15-27 | | 64,000 | 63,738 |
| Media 4.9% | | | |
| Charter Communications Operating LLC (A)(B) | 4.200 | 03-15-28 | | 820,000 | 910,752 |
| Charter Communications Operating LLC | 4.800 | 03-01-50 | | 509,000 | 574,776 |
| Charter Communications Operating LLC | 5.750 | 04-01-48 | | 590,000 | 737,792 |
| Charter Communications Operating LLC | 6.484 | 10-23-45 | | 606,000 | 789,688 |
| SEE NOTES TO FINANCIAL STATEMENTS | SEMIANNUAL REPORT | JOHN HANCOCK INCOME SECURITIES TRUST | 7 |
| | Rate (%) | Maturity date | | Par value^ | Value |
| Communication services (continued) | | | | |
| Media (continued) | | | |
| Comcast Corp. (A)(B) | 3.100 | 04-01-25 | | 482,000 | $521,839 |
| Comcast Corp. | 3.999 | 11-01-49 | | 76,000 | 90,219 |
| Comcast Corp. | 4.049 | 11-01-52 | | 595,000 | 724,227 |
| Comcast Corp. (A)(B) | 4.150 | 10-15-28 | | 1,052,000 | 1,227,094 |
| CSC Holdings LLC (C) | 5.750 | 01-15-30 | | 303,000 | 315,025 |
| CSC Holdings LLC | 5.875 | 09-15-22 | | 210,000 | 218,663 |
| CSC Holdings LLC (C) | 7.500 | 04-01-28 | | 205,000 | 225,282 |
| MDC Partners, Inc. (A)(B)(C) | 6.500 | 05-01-24 | | 379,000 | 293,725 |
| Sirius XM Radio, Inc. (C) | 5.000 | 08-01-27 | | 484,000 | 495,011 |
| Sirius XM Radio, Inc. (C) | 5.375 | 07-15-26 | | 260,000 | 269,750 |
| ViacomCBS, Inc. (A)(B) | 4.750 | 05-15-25 | | 734,000 | 785,148 |
| WMG Acquisition Corp. (C) | 4.875 | 11-01-24 | | 165,000 | 165,000 |
| WMG Acquisition Corp. (C) | 5.500 | 04-15-26 | | 175,000 | 179,156 |
| Wireless telecommunication services 1.6% | | | |
| CC Holdings GS V LLC | 3.849 | 04-15-23 | | 350,000 | 371,310 |
| MTN Mauritius Investments, Ltd. (C) | 4.755 | 11-11-24 | | 225,000 | 206,862 |
| Oztel Holdings SPC, Ltd. (C) | 6.625 | 04-24-28 | | 230,000 | 195,251 |
| SoftBank Group Corp. (6.875% to 7-19-27, then 5 Year ICE Swap Rate + 4.854%) (D) | 6.875 | 07-19-27 | | 200,000 | 174,193 |
| Sprint Corp. | 7.875 | 09-15-23 | | 270,000 | 303,696 |
| Telefonica Celular del Paraguay SA (C) | 5.875 | 04-15-27 | | 200,000 | 195,000 |
| T-Mobile USA, Inc. (B)(C) | 3.875 | 04-15-30 | | 510,000 | 557,864 |
| T-Mobile USA, Inc. (B)(C) | 4.500 | 04-15-50 | | 286,000 | 333,233 |
| Vodafone Group PLC (7.000% to 1-4-29, then 5 Year U.S. Swap Rate + 4.873%) | 7.000 | 04-04-79 | | 489,000 | 559,390 |
| Consumer discretionary 8.2% | | | | 14,397,236 |
| Auto components 0.0% | | | |
| Dealer Tire LLC (C) | 8.000 | 02-01-28 | | 92,000 | 68,770 |
| Automobiles 2.0% | | | |
| BMW US Capital LLC (A)(B)(C) | 2.950 | 04-14-22 | | 124,000 | 125,661 |
| Daimler Finance North America LLC (A)(B)(C) | 2.700 | 06-14-24 | | 230,000 | 221,539 |
| Daimler Finance North America LLC (C) | 3.500 | 08-03-25 | | 150,000 | 148,533 |
| Ford Motor Credit Company LLC (A)(B) | 4.134 | 08-04-25 | | 894,000 | 758,943 |
| Ford Motor Credit Company LLC (A)(B) | 5.113 | 05-03-29 | | 509,000 | 437,740 |
| Ford Motor Credit Company LLC | 5.875 | 08-02-21 | | 463,000 | 458,370 |
| General Motors Financial Company, Inc. | 4.000 | 01-15-25 | | 714,000 | 668,619 |
| General Motors Financial Company, Inc. | 4.300 | 07-13-25 | | 350,000 | 328,400 |
| JB Poindexter & Company, Inc. (C) | 7.125 | 04-15-26 | | 80,000 | 77,600 |
| Nissan Motor Acceptance Corp. (C) | 3.450 | 03-15-23 | | 215,000 | 199,476 |
| Diversified consumer services 0.2% | | | |
| Laureate Education, Inc. (A)(B)(C) | 8.250 | 05-01-25 | | 170,000 | 173,655 |
| Sotheby's (A)(B)(C) | 7.375 | 10-15-27 | | 251,000 | 211,312 |
| 8 | JOHN HANCOCK INCOME SECURITIES TRUST | SEMIANNUAL REPORT | SEE NOTES TO FINANCIAL STATEMENTS |
| | Rate (%) | Maturity date | | Par value^ | Value |
| Consumer discretionary (continued) | | | | |
| Hotels, restaurants and leisure 1.7% | | | |
| CCM Merger, Inc. (C) | 6.000 | 03-15-22 | | 195,000 | $184,275 |
| Connect Finco SARL (C) | 6.750 | 10-01-26 | | 371,000 | 354,305 |
| Eldorado Resorts, Inc. (A)(B) | 6.000 | 09-15-26 | | 125,000 | 125,588 |
| Eldorado Resorts, Inc. | 7.000 | 08-01-23 | | 130,000 | 124,800 |
| Hilton Domestic Operating Company, Inc. (A)(B) | 4.875 | 01-15-30 | | 152,000 | 145,540 |
| Hilton Domestic Operating Company, Inc. (C) | 5.750 | 05-01-28 | | 69,000 | 69,863 |
| International Game Technology PLC (A)(B)(C) | 6.500 | 02-15-25 | | 225,000 | 220,498 |
| Jacobs Entertainment, Inc. (C) | 7.875 | 02-01-24 | | 158,000 | 119,685 |
| Resorts World Las Vegas LLC (B)(C) | 4.625 | 04-16-29 | | 200,000 | 178,849 |
| Starbucks Corp. (B) | 2.250 | 03-12-30 | | 885,000 | 867,074 |
| Twin River Worldwide Holdings, Inc. (C) | 6.750 | 06-01-27 | | 268,000 | 213,060 |
| Waterford Gaming LLC (C)(E)(F) | 8.625 | 09-15-14 | | 95,877 | 0 |
| Wyndham Destinations, Inc. (C) | 4.625 | 03-01-30 | | 145,000 | 123,250 |
| Yum! Brands, Inc. (A)(B)(C) | 4.750 | 01-15-30 | | 183,000 | 186,660 |
| Internet and direct marketing retail 2.2% | | | |
| Amazon.com, Inc. | 3.150 | 08-22-27 | | 660,000 | 740,049 |
| Amazon.com, Inc. | 4.050 | 08-22-47 | | 328,000 | 426,640 |
| Expedia Group, Inc. (B) | 3.250 | 02-15-30 | | 670,000 | 562,476 |
| Expedia Group, Inc. | 3.800 | 02-15-28 | | 582,000 | 504,265 |
| Expedia Group, Inc. | 5.000 | 02-15-26 | | 457,000 | 436,958 |
| Prosus NV (C) | 5.500 | 07-21-25 | | 400,000 | 438,369 |
| QVC, Inc. (A)(B) | 4.375 | 03-15-23 | | 325,000 | 310,343 |
| QVC, Inc. | 5.125 | 07-02-22 | | 240,000 | 235,800 |
| QVC, Inc. | 5.450 | 08-15-34 | | 280,000 | 218,372 |
| Leisure products 0.1% | | | |
| Diamond Sports Group LLC (A)(B)(C) | 6.625 | 08-15-27 | | 285,000 | 156,038 |
| Multiline retail 1.0% | | | |
| Dollar Tree, Inc. (A)(B) | 4.200 | 05-15-28 | | 879,000 | 943,490 |
| Nordstrom, Inc. (B)(C) | 8.750 | 05-15-25 | | 38,000 | 40,775 |
| Target Corp. | 2.250 | 04-15-25 | | 688,000 | 723,947 |
| Specialty retail 0.9% | | | |
| Asbury Automotive Group, Inc. (A)(B)(C) | 4.750 | 03-01-30 | | 27,000 | 22,622 |
| The TJX Companies, Inc. | 3.500 | 04-15-25 | | 815,000 | 879,479 |
| The TJX Companies, Inc. (A)(B) | 3.875 | 04-15-30 | | 630,000 | 702,992 |
| Textiles, apparel and luxury goods 0.1% | | | |
| Hanesbrands, Inc. (C) | 5.375 | 05-15-25 | | 91,000 | 91,000 |
| Levi Strauss & Company (A)(B)(C) | 5.000 | 05-01-25 | | 170,000 | 171,556 |
| Consumer staples 3.3% | | | | 5,672,433 |
| Beverages 1.6% | | | |
| Anheuser-Busch InBev Worldwide, Inc. | 4.600 | 04-15-48 | | 564,000 | 621,732 |
| SEE NOTES TO FINANCIAL STATEMENTS | SEMIANNUAL REPORT | JOHN HANCOCK INCOME SECURITIES TRUST | 9 |
| | Rate (%) | Maturity date | | Par value^ | Value |
| Consumer staples (continued) | | | | |
| Beverages (continued) | | | |
| Coca-Cola European Partners PLC (B) | 4.500 | 09-01-21 | | 1,000,000 | $1,031,300 |
| Constellation Brands, Inc. (A)(B) | 2.875 | 05-01-30 | | 123,000 | 124,884 |
| Keurig Dr Pepper, Inc. (A)(B) | 3.200 | 05-01-30 | | 372,000 | 396,821 |
| The Coca-Cola Company (A)(B) | 4.200 | 03-25-50 | | 453,000 | 577,502 |
| Food and staples retailing 0.7% | | | |
| Albertsons Companies, Inc. (C) | 4.875 | 02-15-30 | | 112,000 | 113,540 |
| Dollar General Corp. (A)(B) | 3.500 | 04-03-30 | | 479,000 | 525,428 |
| Sysco Corp. (A)(B) | 5.950 | 04-01-30 | | 333,000 | 391,576 |
| The Kroger Company (B) | 2.200 | 05-01-30 | | 202,000 | 202,476 |
| Food products 0.8% | | | |
| Cargill, Inc. (C) | 1.375 | 07-23-23 | | 162,000 | 162,810 |
| Cargill, Inc. (A)(B)(C) | 2.125 | 04-23-30 | | 161,000 | 162,878 |
| JBS Investments II GmbH (A)(B)(C) | 5.750 | 01-15-28 | | 498,000 | 485,550 |
| Kraft Heinz Foods Company (A)(B)(C) | 4.875 | 02-15-25 | | 221,000 | 227,202 |
| Post Holdings, Inc. (C) | 5.500 | 12-15-29 | | 149,000 | 149,745 |
| Simmons Foods, Inc. (C) | 5.750 | 11-01-24 | | 172,000 | 159,960 |
| Personal products 0.2% | | | |
| Natura Cosmeticos SA (A)(B)(C) | 5.375 | 02-01-23 | | 355,000 | 339,029 |
| Energy 7.3% | | | | 12,816,613 |
| Energy equipment and services 0.2% | | | |
| CSI Compressco LP | 7.250 | 08-15-22 | | 379,000 | 120,333 |
| CSI Compressco LP (C) | 7.500 | 04-01-25 | | 297,000 | 193,050 |
| Tervita Corp. (C) | 7.625 | 12-01-21 | | 205,000 | 135,300 |
| Oil, gas and consumable fuels 7.1% | | | |
| Aker BP ASA (C) | 3.000 | 01-15-25 | | 204,000 | 177,905 |
| Antero Resources Corp. | 5.000 | 03-01-25 | | 168,000 | 92,400 |
| Cheniere Energy Partners LP (C) | 4.500 | 10-01-29 | | 403,000 | 371,768 |
| Cimarex Energy Company (A)(B) | 4.375 | 06-01-24 | | 235,000 | 216,607 |
| Colorado Interstate Gas Company LLC (B)(C) | 4.150 | 08-15-26 | | 178,000 | 186,769 |
| DCP Midstream LP (7.375% to 12-15-22, then 3 month LIBOR + 5.148%) (D) | 7.375 | 12-15-22 | | 292,000 | 111,690 |
| DCP Midstream Operating LP (A)(B) | 5.125 | 05-15-29 | | 100,000 | 74,470 |
| DCP Midstream Operating LP (5.850% to 5-21-23, then 3 month LIBOR + 3.850%) (C) | 5.850 | 05-21-43 | | 219,000 | 100,740 |
| Enbridge, Inc. (5.500% to 7-15-27, then 3 month LIBOR + 3.418%) (A)(B) | 5.500 | 07-15-77 | | 340,000 | 298,013 |
| Enbridge, Inc. (6.250% to 3-1-28, then 3 month LIBOR + 3.641%) | 6.250 | 03-01-78 | | 294,000 | 269,157 |
| Energy Transfer Operating LP (B) | 4.200 | 04-15-27 | | 130,000 | 122,626 |
| Energy Transfer Operating LP (A)(B) | 4.250 | 03-15-23 | | 422,000 | 418,160 |
| Energy Transfer Operating LP (B) | 5.150 | 03-15-45 | | 345,000 | 305,624 |
| Energy Transfer Operating LP (A)(B) | 5.875 | 01-15-24 | | 274,000 | 284,502 |
| 10 | JOHN HANCOCK INCOME SECURITIES TRUST | SEMIANNUAL REPORT | SEE NOTES TO FINANCIAL STATEMENTS |
| | Rate (%) | Maturity date | | Par value^ | Value |
| Energy (continued) | | | | |
| Oil, gas and consumable fuels (continued) | | | |
| Enterprise Products Operating LLC (5.250% to 8-16-27, then 3 month LIBOR + 3.033%) (B) | 5.250 | 08-16-77 | | 538,000 | $484,039 |
| Husky Energy, Inc. (A)(B) | 3.950 | 04-15-22 | | 305,000 | 297,764 |
| Kinder Morgan Energy Partners LP (B) | 3.500 | 03-01-21 | | 500,000 | 500,853 |
| Kinder Morgan Energy Partners LP (A)(B) | 7.750 | 03-15-32 | | 195,000 | 249,411 |
| MPLX LP (A)(B) | 4.000 | 03-15-28 | | 313,000 | 296,673 |
| MPLX LP (B)(C) | 4.250 | 12-01-27 | | 164,000 | 157,506 |
| MPLX LP (B)(C) | 5.250 | 01-15-25 | | 176,000 | 174,232 |
| MPLX LP (6.875% to 2-15-23, then 3 month LIBOR + 4.652%) (A)(B)(D) | 6.875 | 02-15-23 | | 752,000 | 540,703 |
| Murphy Oil Corp. | 5.750 | 08-15-25 | | 164,000 | 113,160 |
| ONEOK Partners LP (A)(B) | 4.900 | 03-15-25 | | 134,000 | 133,361 |
| Petrobras Global Finance BV (A)(B)(C) | 5.093 | 01-15-30 | | 680,000 | 619,820 |
| Petrobras Global Finance BV (A)(B) | 6.900 | 03-19-49 | | 186,000 | 180,885 |
| Petroleos Mexicanos (A)(B) | 5.350 | 02-12-28 | | 301,000 | 224,248 |
| Phillips 66 (B) | 3.700 | 04-06-23 | | 93,000 | 96,576 |
| Sabine Pass Liquefaction LLC (B) | 4.200 | 03-15-28 | | 261,000 | 255,109 |
| Sabine Pass Liquefaction LLC (B) | 5.000 | 03-15-27 | | 245,000 | 250,898 |
| Sabine Pass Liquefaction LLC (B) | 5.875 | 06-30-26 | | 424,000 | 451,262 |
| Suncor Energy, Inc. (B) | 9.250 | 10-15-21 | | 1,000,000 | 1,064,343 |
| Sunoco Logistics Partners Operations LP (B) | 3.900 | 07-15-26 | | 460,000 | 433,827 |
| Sunoco Logistics Partners Operations LP (B) | 5.400 | 10-01-47 | | 250,000 | 225,792 |
| Targa Resources Partners LP (A)(B) | 5.875 | 04-15-26 | | 400,000 | 355,000 |
| Teekay Offshore Partners LP (C) | 8.500 | 07-15-23 | | 264,000 | 236,940 |
| The Williams Companies, Inc. (B) | 3.750 | 06-15-27 | | 355,000 | 354,057 |
| The Williams Companies, Inc. | 4.550 | 06-24-24 | | 791,000 | 825,040 |
| The Williams Companies, Inc. (A)(B) | 5.750 | 06-24-44 | | 114,000 | 123,784 |
| TransCanada PipeLines, Ltd. (B) | 4.250 | 05-15-28 | | 205,000 | 220,569 |
| WPX Energy, Inc. | 4.500 | 01-15-30 | | 191,000 | 155,665 |
| WPX Energy, Inc. (A)(B) | 5.250 | 09-15-24 | | 100,000 | 89,782 |
| WPX Energy, Inc. | 5.250 | 10-15-27 | | 260,000 | 226,200 |
| Financials 29.1% | | | | 50,748,178 |
| Banks 17.1% | | | |
| Australia & New Zealand Banking Group, Ltd. (6.750% to 6-15-26, then 5 Year ICE Swap Rate + 5.168%) (A)(B)(C)(D) | 6.750 | 06-15-26 | | 200,000 | 214,500 |
| Banco Santander SA (A)(B) | 4.379 | 04-12-28 | | 200,000 | 216,578 |
| Bank of America Corp. (2.592% to 4-29-30, then SOFR + 2.150%) (A)(B) | 2.592 | 04-29-31 | | 458,000 | 468,837 |
| Bank of America Corp. (B) | 3.950 | 04-21-25 | | 925,000 | 995,554 |
| Bank of America Corp. (B) | 4.200 | 08-26-24 | | 200,000 | 216,271 |
| Bank of America Corp. (B) | 4.450 | 03-03-26 | | 463,000 | 510,593 |
| SEE NOTES TO FINANCIAL STATEMENTS | SEMIANNUAL REPORT | JOHN HANCOCK INCOME SECURITIES TRUST | 11 |
| | Rate (%) | Maturity date | | Par value^ | Value |
| Financials (continued) | | | | |
| Banks (continued) | | | |
| Bank of America Corp. (6.300% to 3-10-26, then 3 month LIBOR + 4.553%) (A)(B)(D) | 6.300 | 03-10-26 | | 610,000 | $663,628 |
| Barclays Bank PLC (A)(B)(C) | 10.179 | 06-12-21 | | 475,000 | 508,867 |
| Barclays PLC (B) | 4.375 | 01-12-26 | | 840,000 | 902,036 |
| BPCE SA (B)(C) | 4.500 | 03-15-25 | | 475,000 | 499,686 |
| BPCE SA (A)(B)(C) | 5.700 | 10-22-23 | | 1,145,000 | 1,238,595 |
| Citigroup, Inc. (B) | 3.200 | 10-21-26 | | 970,000 | 1,022,203 |
| Citigroup, Inc. (B) | 4.600 | 03-09-26 | | 586,000 | 643,431 |
| Citigroup, Inc. (4.700% to 1-30-25, then SOFR + 3.234%) (D) | 4.700 | 01-30-25 | | 433,000 | 376,710 |
| Citigroup, Inc. (B) | 5.500 | 09-13-25 | | 165,000 | 188,995 |
| Citigroup, Inc. (6.250% to 8-15-26, then 3 month LIBOR + 4.517%) (A)(B)(D) | 6.250 | 08-15-26 | | 525,000 | 561,750 |
| Citizens Bank NA | 2.250 | 04-28-25 | | 326,000 | 326,040 |
| Citizens Financial Group, Inc. | 3.250 | 04-30-30 | | 448,000 | 448,998 |
| Credit Agricole SA (A)(B)(C) | 3.250 | 01-14-30 | | 471,000 | 476,090 |
| Credit Agricole SA (7.875% to 1-23-24, then 5 Year U.S. Swap Rate + 4.898%) (A)(B)(C)(D) | 7.875 | 01-23-24 | | 600,000 | 637,026 |
| Danske Bank A/S (B)(C) | 5.000 | 01-12-22 | | 286,000 | 295,667 |
| Discover Bank (B) | 2.450 | 09-12-24 | | 324,000 | 316,934 |
| Fifth Third Bancorp | 1.625 | 05-05-23 | | 120,000 | 119,923 |
| Fifth Third Bancorp (5.100% to 6-30-23, then 3 month LIBOR + 3.033%) (A)(B)(D) | 5.100 | 06-30-23 | | 880,000 | 783,200 |
| Freedom Mortgage Corp. (C) | 8.125 | 11-15-24 | | 259,000 | 214,970 |
| Freedom Mortgage Corp. (A)(B)(C) | 8.250 | 04-15-25 | | 105,000 | 89,250 |
| HSBC Holdings PLC (3.950% to 5-18-23, then 3 month LIBOR + 0.987%) | 3.950 | 05-18-24 | | 515,000 | 546,636 |
| HSBC Holdings PLC (6.375% to 3-30-25, then 5 Year ICE Swap Rate + 4.368%) (A)(B)(D) | 6.375 | 03-30-25 | | 200,000 | 198,624 |
| HSBC Holdings PLC (6.875% to 6-1-21, then 5 Year ICE Swap Rate + 5.514%) (B)(D) | 6.875 | 06-01-21 | | 340,000 | 340,850 |
| ING Groep NV (A)(B) | 3.550 | 04-09-24 | | 277,000 | 291,226 |
| JPMorgan Chase & Co. (2.522 to 4-22-30, then SOFR + 2.040%) | 2.522 | 04-22-31 | | 1,007,000 | 1,027,902 |
| JPMorgan Chase & Co. | 2.950 | 10-01-26 | | 1,053,000 | 1,103,542 |
| JPMorgan Chase & Co. (3.960% to 1-29-26, then 3 month LIBOR + 1.245%) | 3.960 | 01-29-27 | | 418,000 | 461,797 |
| JPMorgan Chase & Co. (4.600% to 2-1-25, then SOFR + 3.125%) (B)(D) | 4.600 | 02-01-25 | | 379,000 | 339,963 |
| JPMorgan Chase & Co. (6.750% to 2-1-24, then 3 month LIBOR + 3.780%) (A)(B)(D) | 6.750 | 02-01-24 | | 1,170,000 | 1,256,089 |
| Lloyds Banking Group PLC (A)(B) | 4.450 | 05-08-25 | | 1,245,000 | 1,354,095 |
| 12 | JOHN HANCOCK INCOME SECURITIES TRUST | SEMIANNUAL REPORT | SEE NOTES TO FINANCIAL STATEMENTS |
| | Rate (%) | Maturity date | | Par value^ | Value |
| Financials (continued) | | | | |
| Banks (continued) | | | |
| Lloyds Banking Group PLC (7.500% to 6-27-24, then 5 Year U.S. Swap Rate + 4.760%) (D) | 7.500 | 06-27-24 | | 385,000 | $377,300 |
| M&T Bank Corp. (5.125% to 11-1-26, then 3 month LIBOR + 3.520%) (A)(B)(D) | 5.125 | 11-01-26 | | 345,000 | 347,874 |
| Santander Holdings USA, Inc. (B) | 3.244 | 10-05-26 | | 669,000 | 650,262 |
| Santander Holdings USA, Inc. (A)(B) | 3.400 | 01-18-23 | | 270,000 | 271,740 |
| Santander Holdings USA, Inc. (A)(B) | 3.500 | 06-07-24 | | 564,000 | 570,290 |
| Santander Holdings USA, Inc. (B) | 4.400 | 07-13-27 | | 155,000 | 157,715 |
| Santander UK Group Holdings PLC (C) | 4.750 | 09-15-25 | | 365,000 | 380,180 |
| Societe Generale SA (7.375% to 9-13-21, then 5 Year U.S. Swap Rate + 6.238%) (A)(B)(C)(D) | 7.375 | 09-13-21 | | 340,000 | 331,925 |
| The PNC Financial Services Group, Inc. (A)(B) | 2.200 | 11-01-24 | | 481,000 | 499,573 |
| The PNC Financial Services Group, Inc. (A)(B) | 3.150 | 05-19-27 | | 945,000 | 1,027,509 |
| The PNC Financial Services Group, Inc. | 3.500 | 01-23-24 | | 177,000 | 189,311 |
| The PNC Financial Services Group, Inc. (4.850% to 6-1-23, then 3 month LIBOR + 3.040%) (B)(D) | 4.850 | 06-01-23 | | 335,000 | 308,200 |
| The PNC Financial Services Group, Inc. (6.750% to 8-1-21, then 3 month LIBOR + 3.678%) (B)(D) | 6.750 | 08-01-21 | | 855,000 | 867,295 |
| The Royal Bank of Scotland Group PLC (A)(B) | 3.875 | 09-12-23 | | 480,000 | 502,525 |
| The Royal Bank of Scotland Group PLC (8.625% to 8-15-21, then 5 Year U.S. Swap Rate + 7.598%) (A)(B)(D) | 8.625 | 08-15-21 | | 612,000 | 624,240 |
| The Toronto-Dominion Bank (A)(B) | 3.250 | 03-11-24 | | 422,000 | 446,966 |
| Wells Fargo & Company (2.188% to 4-30-25, then SOFR + 2.000%) | 2.188 | 04-30-26 | | 778,000 | 782,003 |
| Wells Fargo & Company (3.068% to 4-30-40, then SOFR + 2.530%) | 3.068 | 04-30-41 | | 363,000 | 357,421 |
| Wells Fargo & Company (5.875% to 6-15-25, then 3 month LIBOR + 3.990%) (A)(B)(D) | 5.875 | 06-15-25 | | 1,220,000 | 1,302,350 |
| Capital markets 4.4% | | | |
| Ameriprise Financial, Inc. | 3.000 | 04-02-25 | | 313,000 | 329,864 |
| Ares Capital Corp. (B) | 4.200 | 06-10-24 | | 289,000 | 275,892 |
| Cantor Fitzgerald LP (B)(C) | 4.875 | 05-01-24 | | 402,000 | 393,646 |
| Credit Suisse Group AG (7.500% to 7-17-23, then 5 Year U.S. Swap Rate + 4.600%) (A)(B)(C)(D) | 7.500 | 07-17-23 | | 310,000 | 313,100 |
| Credit Suisse Group AG (7.500% to 12-11-23, then 5 Year U.S. Swap Rate + 4.598%) (A)(B)(C)(D) | 7.500 | 12-11-23 | | 295,000 | 311,594 |
| Lazard Group LLC (B) | 4.375 | 03-11-29 | | 230,000 | 240,612 |
| Macquarie Bank, Ltd. (B)(C) | 4.875 | 06-10-25 | | 520,000 | 558,998 |
| SEE NOTES TO FINANCIAL STATEMENTS | SEMIANNUAL REPORT | JOHN HANCOCK INCOME SECURITIES TRUST | 13 |
| | Rate (%) | Maturity date | | Par value^ | Value |
| Financials (continued) | | | | |
| Capital markets (continued) | | | |
| Morgan Stanley (2.188% to 4-28-25, then SOFR +1.990%) (B) | 2.188 | 04-28-26 | | 800,000 | $808,707 |
| Morgan Stanley (B) | 3.875 | 01-27-26 | | 1,375,000 | 1,511,033 |
| Raymond James Financial, Inc. (B) | 4.650 | 04-01-30 | | 116,000 | 130,425 |
| Stearns Holdings LLC (C) | 5.000 | 11-05-24 | | 4,157 | 2,494 |
| Stifel Financial Corp. (A)(B) | 4.250 | 07-18-24 | | 224,000 | 233,515 |
| The Bank of New York Mellon Corp. (A)(B) | 1.600 | 04-24-25 | | 305,000 | 309,488 |
| The Goldman Sachs Group, Inc. (B) | 3.850 | 01-26-27 | | 1,835,000 | 1,979,497 |
| UBS Group AG (7.000% to 1-31-24, then 5 Year U.S. Swap Rate + 4.344%) (C)(D) | 7.000 | 01-31-24 | | 295,000 | 303,467 |
| Consumer finance 2.1% | | | |
| Ally Financial, Inc. (A)(B) | 5.125 | 09-30-24 | | 645,000 | 667,382 |
| Ally Financial, Inc. (B) | 5.800 | 05-01-25 | | 245,000 | 261,087 |
| Capital One Financial Corp. (B) | 3.900 | 01-29-24 | | 695,000 | 724,297 |
| Credito Real SAB de CV (9.125% to 11-29-22, then 5 Year CMT + 7.026%) (C)(D) | 9.125 | 11-29-22 | | 225,000 | 164,252 |
| Discover Financial Services | 3.950 | 11-06-24 | | 463,000 | 473,992 |
| Discover Financial Services | 4.100 | 02-09-27 | | 884,000 | 884,305 |
| Enova International, Inc. (C) | 8.500 | 09-01-24 | | 58,000 | 50,460 |
| Enova International, Inc. (C) | 8.500 | 09-15-25 | | 260,000 | 224,900 |
| Springleaf Finance Corp. | 6.875 | 03-15-25 | | 105,000 | 99,299 |
| Diversified financial services 1.7% | | | |
| Allied Universal Holdco LLC (C) | 6.625 | 07-15-26 | | 110,000 | 113,091 |
| GE Capital International Funding Company Unlimited Company | 4.418 | 11-15-35 | | 517,000 | 537,747 |
| Gogo Intermediate Holdings LLC (C) | 9.875 | 05-01-24 | | 188,000 | 154,160 |
| Jefferies Financial Group, Inc. (A)(B) | 5.500 | 10-18-23 | | 655,000 | 687,719 |
| Jefferies Group LLC (B) | 4.150 | 01-23-30 | | 365,000 | 362,360 |
| Jefferies Group LLC (B) | 4.850 | 01-15-27 | | 422,000 | 437,225 |
| Refinitiv US Holdings, Inc. (A)(B)(C) | 6.250 | 05-15-26 | | 43,000 | 45,832 |
| Refinitiv US Holdings, Inc. (C) | 8.250 | 11-15-26 | | 69,000 | 74,865 |
| Trident TPI Holdings, Inc. (C) | 6.625 | 11-01-25 | | 85,000 | 66,972 |
| Voya Financial, Inc. (5.650% to 5-15-23, then 3 month LIBOR + 3.580%) (A)(B) | 5.650 | 05-15-53 | | 504,000 | 493,920 |
| Insurance 2.9% | | | |
| AXA SA (A)(B) | 8.600 | 12-15-30 | | 175,000 | 242,991 |
| Brighthouse Financial, Inc. (A)(B) | 3.700 | 06-22-27 | | 595,000 | 571,139 |
| CNO Financial Group, Inc. | 5.250 | 05-30-25 | | 512,000 | 546,666 |
| CNO Financial Group, Inc. | 5.250 | 05-30-29 | | 384,000 | 402,786 |
| Liberty Mutual Group, Inc. (B)(C) | 3.951 | 10-15-50 | | 705,000 | 719,878 |
| MetLife, Inc. (6.400% to 12-15-36, then 3 month LIBOR + 2.205%) (B) | 6.400 | 12-15-36 | | 355,000 | 397,261 |
| 14 | JOHN HANCOCK INCOME SECURITIES TRUST | SEMIANNUAL REPORT | SEE NOTES TO FINANCIAL STATEMENTS |
| | Rate (%) | Maturity date | | Par value^ | Value |
| Financials (continued) | | | | |
| Insurance (continued) | | | |
| MetLife, Inc. (9.250% to 4-8-38, then 3 month LIBOR + 5.540%) (B)(C) | 9.250 | 04-08-38 | | 315,000 | $415,800 |
| New York Life Insurance Company (A)(B)(C) | 3.750 | 05-15-50 | | 199,000 | 225,000 |
| Nippon Life Insurance Company (5.100% to 10-16-24, then 5 Year ICE Swap Rate + 3.650%) (C) | 5.100 | 10-16-44 | | 365,000 | 396,025 |
| Prudential Financial, Inc. (5.875% to 9-15-22, then 3 month LIBOR + 4.175%) (A)(B) | 5.875 | 09-15-42 | | 637,000 | 671,130 |
| Teachers Insurance & Annuity Association of America (C) | 4.270 | 05-15-47 | | 430,000 | 499,891 |
| Thrifts and mortgage finance 0.9% | | | |
| Ladder Capital Finance Holdings LLLP (C) | 5.250 | 03-15-22 | | 95,000 | 78,375 |
| Ladder Capital Finance Holdings LLLP (C) | 5.250 | 10-01-25 | | 148,000 | 107,670 |
| MGIC Investment Corp. | 5.750 | 08-15-23 | | 99,000 | 97,020 |
| Nationstar Mortgage Holdings, Inc. (A)(B)(C) | 6.000 | 01-15-27 | | 75,000 | 63,983 |
| Nationstar Mortgage Holdings, Inc. (C) | 8.125 | 07-15-23 | | 160,000 | 153,600 |
| Nationstar Mortgage Holdings, Inc. (C) | 9.125 | 07-15-26 | | 128,000 | 122,400 |
| Nationwide Building Society (3.622% to 4-26-22, then 3 month LIBOR + 1.181%) (B)(C) | 3.622 | 04-26-23 | | 273,000 | 279,951 |
| Quicken Loans, Inc. (C) | 5.750 | 05-01-25 | | 550,000 | 539,000 |
| Radian Group, Inc. | 4.500 | 10-01-24 | | 144,000 | 139,680 |
| Health care 5.7% | | | | 9,954,476 |
| Biotechnology 0.9% | | | |
| AbbVie, Inc. (B)(C) | 3.200 | 11-21-29 | | 684,000 | 722,646 |
| AbbVie, Inc. (B)(C) | 4.250 | 11-21-49 | | 203,000 | 232,870 |
| Shire Acquisitions Investments Ireland DAC (B) | 3.200 | 09-23-26 | | 496,000 | 537,345 |
| Health care equipment and supplies 0.4% | | | |
| Baxter International, Inc. (A)(B)(C) | 3.950 | 04-01-30 | | 553,000 | 640,533 |
| Health care providers and services 3.7% | | | |
| Anthem, Inc. | 2.375 | 01-15-25 | | 96,000 | 98,722 |
| Centene Corp. (C) | 3.375 | 02-15-30 | | 128,000 | 129,114 |
| Centene Corp. (C) | 4.250 | 12-15-27 | | 92,000 | 96,255 |
| Centene Corp. (C) | 4.625 | 12-15-29 | | 103,000 | 112,785 |
| Centene Corp. (C) | 5.375 | 06-01-26 | | 255,000 | 270,201 |
| CVS Health Corp. (A)(B) | 3.000 | 08-15-26 | | 582,000 | 617,501 |
| CVS Health Corp. (B) | 3.750 | 04-01-30 | | 521,000 | 578,404 |
| CVS Health Corp. (B) | 4.300 | 03-25-28 | | 371,000 | 418,036 |
| CVS Health Corp. (A)(B) | 5.050 | 03-25-48 | | 375,000 | 471,554 |
| DaVita, Inc. (A)(B) | 5.000 | 05-01-25 | | 410,000 | 416,150 |
| Encompass Health Corp. (A)(B) | 4.500 | 02-01-28 | | 48,000 | 48,091 |
| HCA, Inc. (B) | 4.125 | 06-15-29 | | 382,000 | 410,589 |
| SEE NOTES TO FINANCIAL STATEMENTS | SEMIANNUAL REPORT | JOHN HANCOCK INCOME SECURITIES TRUST | 15 |
| | Rate (%) | Maturity date | | Par value^ | Value |
| Health care (continued) | | | | |
| Health care providers and services (continued) | | | |
| HCA, Inc. (A)(B) | 5.250 | 04-15-25 | | 875,000 | $975,651 |
| HCA, Inc. | 5.250 | 06-15-26 | | 320,000 | 356,579 |
| MEDNAX, Inc. (C) | 5.250 | 12-01-23 | | 290,000 | 276,161 |
| MEDNAX, Inc. (A)(B)(C) | 6.250 | 01-15-27 | | 224,000 | 202,819 |
| Rede D'or Finance Sarl (A)(B)(C) | 4.500 | 01-22-30 | | 242,000 | 204,805 |
| Select Medical Corp. (C) | 6.250 | 08-15-26 | | 231,000 | 220,605 |
| Team Health Holdings, Inc. (C) | 6.375 | 02-01-25 | | 65,000 | 35,737 |
| Universal Health Services, Inc. (C) | 4.750 | 08-01-22 | | 240,000 | 240,000 |
| Universal Health Services, Inc. (C) | 5.000 | 06-01-26 | | 309,000 | 312,090 |
| Life sciences tools and services 0.0% | | | |
| Charles River Laboratories International, Inc. (C) | 4.250 | 05-01-28 | | 62,000 | 62,543 |
| Pharmaceuticals 0.7% | | | |
| Bausch Health Companies, Inc. (A)(B)(C) | 5.250 | 01-30-30 | | 140,000 | 138,600 |
| Bausch Health Companies, Inc. (C) | 6.125 | 04-15-25 | | 329,000 | 332,496 |
| Catalent Pharma Solutions, Inc. (A)(B)(C) | 5.000 | 07-15-27 | | 62,000 | 63,240 |
| GlaxoSmithKline Capital PLC | 3.000 | 06-01-24 | | 681,000 | 732,354 |
| Industrials 12.7% | | | | 22,100,821 |
| Aerospace and defense 2.3% | | | |
| Howmet Aerospace, Inc. (A)(B) | 5.125 | 10-01-24 | | 589,000 | 568,535 |
| Huntington Ingalls Industries, Inc. (B)(C) | 3.844 | 05-01-25 | | 577,000 | 606,316 |
| Huntington Ingalls Industries, Inc. (B)(C) | 4.200 | 05-01-30 | | 193,000 | 203,785 |
| Huntington Ingalls Industries, Inc. (A)(B)(C) | 5.000 | 11-15-25 | | 346,000 | 357,361 |
| Kratos Defense & Security Solutions, Inc. (A)(B)(C) | 6.500 | 11-30-25 | | 206,000 | 200,932 |
| The Boeing Company (A)(B) | 3.200 | 03-01-29 | | 934,000 | 819,348 |
| The Boeing Company | 4.875 | 05-01-25 | | 407,000 | 407,000 |
| The Boeing Company | 5.805 | 05-01-50 | | 400,000 | 400,000 |
| TransDigm, Inc. (C) | 5.500 | 11-15-27 | | 540,000 | 456,300 |
| Air freight and logistics 0.3% | | | |
| United Parcel Service, Inc. | 3.900 | 04-01-25 | | 262,000 | 292,142 |
| XPO Logistics, Inc. (C) | 6.500 | 06-15-22 | | 191,000 | 191,764 |
| Airlines 3.7% | | | |
| Air Canada 2013-1 Class A Pass Through Trust (C) | 4.125 | 05-15-25 | | 196,304 | 180,838 |
| Air Canada 2017-1 Class B Pass Through Trust (C) | 3.700 | 01-15-26 | | 273,016 | 215,404 |
| America West Airlines 2000-1 Pass Through Trust | 8.057 | 07-02-20 | | 63,009 | 61,055 |
| American Airlines 2001-1 Pass Through Trust | 6.977 | 05-23-21 | | 53,573 | 53,274 |
| American Airlines 2013-2 Class A Pass Through Trust | 4.950 | 01-15-23 | | 294,413 | 259,985 |
| 16 | JOHN HANCOCK INCOME SECURITIES TRUST | SEMIANNUAL REPORT | SEE NOTES TO FINANCIAL STATEMENTS |
| | Rate (%) | Maturity date | | Par value^ | Value |
| Industrials (continued) | | | | |
| Airlines (continued) | | | |
| American Airlines 2015-1 Class A Pass Through Trust | 3.375 | 05-01-27 | | 356,100 | $278,080 |
| American Airlines 2015-1 Class B Pass Through Trust | 3.700 | 05-01-23 | | 376,630 | 256,108 |
| American Airlines 2016-1 Class A Pass Through Trust | 4.100 | 01-15-28 | | 344,075 | 257,120 |
| American Airlines 2017-1 Class A Pass Through Trust | 4.000 | 02-15-29 | | 166,238 | 112,094 |
| American Airlines 2017-1 Class AA Pass Through Trust | 3.650 | 02-15-29 | | 255,750 | 240,405 |
| American Airlines 2017-2 Class A Pass Through Trust | 3.600 | 10-15-29 | | 149,815 | 105,619 |
| American Airlines 2019-1 Class A Pass Through Trust (A)(B) | 3.500 | 02-15-32 | | 167,383 | 111,044 |
| American Airlines 2019-1 Class AA Pass Through Trust | 3.150 | 02-15-32 | | 255,012 | 224,009 |
| Azul Investments LLP (A)(B)(C) | 5.875 | 10-26-24 | | 95,000 | 49,913 |
| British Airways 2013-1 Class A Pass Through Trust (C) | 4.625 | 06-20-24 | | 434,949 | 420,520 |
| British Airways 2013-1 Class B Pass Through Trust (C) | 5.625 | 06-20-20 | | 11,389 | 11,367 |
| British Airways 2018-1 Class A Pass Through Trust (C) | 4.125 | 09-20-31 | | 135,582 | 100,431 |
| Continental Airlines 2007-1 Class A Pass Through Trust (B) | 5.983 | 04-19-22 | | 343,033 | 319,188 |
| Delta Air Lines 2002-1 Class G-1 Pass Through Trust | 6.718 | 01-02-23 | | 382,180 | 362,899 |
| Delta Air Lines, Inc. | 2.900 | 10-28-24 | | 510,000 | 400,311 |
| Delta Air Lines, Inc. | 3.800 | 04-19-23 | | 312,000 | 267,658 |
| Delta Air Lines, Inc. | 4.375 | 04-19-28 | | 355,000 | 264,376 |
| JetBlue 2019-1 Class AA Pass Through Trust | 2.750 | 05-15-32 | | 271,000 | 238,162 |
| United Airlines 2014-2 Class A Pass Through Trust | 3.750 | 09-03-26 | | 361,722 | 316,950 |
| United Airlines 2014-2 Class B Pass Through Trust | 4.625 | 09-03-22 | | 293,343 | 257,396 |
| United Airlines 2016-1 Class A Pass Through Trust | 3.450 | 07-07-28 | | 267,371 | 188,268 |
| United Airlines 2016-1 Class B Pass Through Trust (B) | 3.650 | 01-07-26 | | 382,861 | 274,668 |
| United Airlines 2018-1 Class B Pass Through Trust (B) | 4.600 | 03-01-26 | | 106,281 | 69,085 |
| United Airlines 2019-1 Class A Pass Through Trust | 4.550 | 08-25-31 | | 231,260 | 177,030 |
| US Airways 2010-1 Class A Pass Through Trust | 6.250 | 04-22-23 | | 222,053 | 209,335 |
| US Airways 2012-1 Class A Pass Through Trust | 5.900 | 10-01-24 | | 181,938 | 153,080 |
| SEE NOTES TO FINANCIAL STATEMENTS | SEMIANNUAL REPORT | JOHN HANCOCK INCOME SECURITIES TRUST | 17 |
| | Rate (%) | Maturity date | | Par value^ | Value |
| Industrials (continued) | | | | |
| Building products 1.1% | | | |
| Builders FirstSource, Inc. (C) | 5.000 | 03-01-30 | | 34,000 | $29,175 |
| Builders FirstSource, Inc. (C) | 6.750 | 06-01-27 | | 57,000 | 58,710 |
| Carrier Global Corp. (B)(C) | 2.242 | 02-15-25 | | 898,000 | 893,446 |
| Carrier Global Corp. (B)(C) | 2.722 | 02-15-30 | | 318,000 | 298,069 |
| Owens Corning | 3.950 | 08-15-29 | | 659,000 | 681,469 |
| Commercial services and supplies 0.3% | | | |
| APX Group, Inc. (A)(B) | 7.625 | 09-01-23 | | 279,000 | 217,620 |
| Clean Harbors, Inc. (C) | 4.875 | 07-15-27 | | 50,000 | 51,799 |
| Harsco Corp. (A)(B)(C) | 5.750 | 07-31-27 | | 83,000 | 78,244 |
| LSC Communications, Inc. (C)(E) | 8.750 | 10-15-23 | | 321,000 | 19,260 |
| Prime Security Services Borrower LLC (A)(B)(C) | 6.250 | 01-15-28 | | 163,000 | 146,293 |
| Construction and engineering 0.3% | | | |
| AECOM | 5.125 | 03-15-27 | | 415,000 | 422,263 |
| Tutor Perini Corp. (A)(B)(C) | 6.875 | 05-01-25 | | 88,000 | 69,300 |
| Industrial conglomerates 1.4% | | | |
| 3M Company (A)(B) | 3.250 | 02-14-24 | | 627,000 | 677,947 |
| DuPont de Nemours, Inc. | 2.169 | 05-01-23 | | 312,000 | 313,588 |
| General Electric Company (A)(B) | 4.350 | 05-01-50 | | 647,000 | 649,363 |
| General Electric Company | 5.550 | 01-05-26 | | 690,000 | 769,181 |
| Machinery 0.5% | | | |
| Otis Worldwide Corp. (A)(B)(C) | 2.056 | 04-05-25 | | 816,000 | 828,690 |
| Professional services 0.5% | | | |
| IHS Markit, Ltd. (C) | 4.000 | 03-01-26 | | 273,000 | 289,379 |
| IHS Markit, Ltd. (C) | 4.750 | 02-15-25 | | 128,000 | 138,546 |
| IHS Markit, Ltd. | 4.750 | 08-01-28 | | 455,000 | 522,841 |
| Road and rail 0.2% | | | |
| Uber Technologies, Inc. (A)(B)(C) | 7.500 | 09-15-27 | | 398,000 | 406,000 |
| Trading companies and distributors 2.1% | | | |
| AerCap Ireland Capital DAC (A)(B) | 2.875 | 08-14-24 | | 382,000 | 320,829 |
| Ahern Rentals, Inc. (C) | 7.375 | 05-15-23 | | 323,000 | 151,939 |
| Air Lease Corp. (A)(B) | 3.625 | 12-01-27 | | 164,000 | 136,766 |
| Aircastle, Ltd. | 5.000 | 04-01-23 | | 620,000 | 586,026 |
| Aircastle, Ltd. | 5.500 | 02-15-22 | | 225,000 | 214,567 |
| Ashtead Capital, Inc. (A)(B)(C) | 4.375 | 08-15-27 | | 760,000 | 740,719 |
| Avolon Holdings Funding, Ltd. (C) | 5.125 | 10-01-23 | | 225,000 | 201,271 |
| H&E Equipment Services, Inc. (A)(B) | 5.625 | 09-01-25 | | 131,000 | 124,791 |
| United Rentals North America, Inc. (A)(B) | 3.875 | 11-15-27 | | 556,000 | 543,490 |
| United Rentals North America, Inc. (A)(B) | 4.875 | 01-15-28 | | 583,000 | 580,085 |
| 18 | JOHN HANCOCK INCOME SECURITIES TRUST | SEMIANNUAL REPORT | SEE NOTES TO FINANCIAL STATEMENTS |
| | Rate (%) | Maturity date | | Par value^ | Value |
| Information technology 12.4% | | | | $21,623,322 |
| Communications equipment 0.8% | | | |
| CommScope, Inc. (A)(B)(C) | 8.250 | 03-01-27 | | 377,000 | 361,920 |
| Motorola Solutions, Inc. (A)(B) | 4.600 | 02-23-28 | | 492,000 | 539,899 |
| Telefonaktiebolaget LM Ericsson (A)(B) | 4.125 | 05-15-22 | | 545,000 | 564,756 |
| Electronic equipment, instruments and components 0.1% | | | |
| Tech Data Corp. | 3.700 | 02-15-22 | | 178,000 | 175,315 |
| IT services 1.6% | | | |
| Banff Merger Sub, Inc. (A)(B)(C) | 9.750 | 09-01-26 | | 215,000 | 192,963 |
| PayPal Holdings, Inc. (A)(B) | 2.850 | 10-01-29 | | 989,000 | 1,048,756 |
| Tempo Acquisition LLC (C) | 6.750 | 06-01-25 | | 102,000 | 98,940 |
| VeriSign, Inc. | 4.750 | 07-15-27 | | 395,000 | 420,758 |
| VeriSign, Inc. (A)(B) | 5.250 | 04-01-25 | | 510,000 | 557,175 |
| Visa, Inc. (A)(B) | 2.700 | 04-15-40 | | 417,000 | 435,634 |
| Semiconductors and semiconductor equipment 7.0% | | | |
| Broadcom Corp. (A)(B) | 3.125 | 01-15-25 | | 995,000 | 1,027,122 |
| Broadcom Corp. (B) | 3.875 | 01-15-27 | | 1,025,000 | 1,063,414 |
| Broadcom, Inc. (A)(B)(C) | 4.700 | 04-15-25 | | 403,000 | 444,003 |
| Broadcom, Inc. (A)(B)(C) | 4.750 | 04-15-29 | | 418,000 | 461,112 |
| Broadcom, Inc. (B)(C) | 5.000 | 04-15-30 | | 487,000 | 544,494 |
| KLA Corp. (A)(B) | 4.100 | 03-15-29 | | 260,000 | 294,230 |
| Lam Research Corp. (A)(B) | 3.750 | 03-15-26 | | 575,000 | 643,466 |
| Lam Research Corp. (A)(B) | 4.875 | 03-15-49 | | 275,000 | 373,195 |
| Marvell Technology Group, Ltd. (B) | 4.875 | 06-22-28 | | 1,125,000 | 1,229,848 |
| Microchip Technology, Inc. | 4.333 | 06-01-23 | | 741,000 | 768,186 |
| Micron Technology, Inc. (B) | 2.497 | 04-24-23 | | 445,000 | 452,904 |
| Micron Technology, Inc. (A)(B) | 4.185 | 02-15-27 | | 980,000 | 1,049,448 |
| Micron Technology, Inc. | 4.975 | 02-06-26 | | 675,000 | 744,608 |
| Micron Technology, Inc. | 5.327 | 02-06-29 | | 648,000 | 741,192 |
| NVIDIA Corp. | 2.850 | 04-01-30 | | 803,000 | 870,692 |
| NXP BV (C) | 3.400 | 05-01-30 | | 114,000 | 114,603 |
| NXP BV (A)(B)(C) | 3.875 | 06-18-26 | | 252,000 | 263,838 |
| NXP BV (C) | 4.625 | 06-01-23 | | 645,000 | 686,422 |
| NXP BV (B)(C) | 4.875 | 03-01-24 | | 269,000 | 291,914 |
| Qorvo, Inc. | 5.500 | 07-15-26 | | 110,000 | 115,500 |
| Software 1.7% | | | |
| Autodesk, Inc. (A)(B) | 2.850 | 01-15-30 | | 653,000 | 682,288 |
| Citrix Systems, Inc. (A)(B) | 3.300 | 03-01-30 | | 653,000 | 659,647 |
| Microsoft Corp. | 4.450 | 11-03-45 | | 340,000 | 459,185 |
| Oracle Corp. (A)(B) | 2.950 | 04-01-30 | | 662,000 | 722,488 |
| PTC, Inc. (A)(B)(C) | 4.000 | 02-15-28 | | 57,000 | 55,860 |
| VMware, Inc. (B) | 4.500 | 05-15-25 | | 317,000 | 335,108 |
| Technology hardware, storage and peripherals 1.2% | | | |
| Dell International LLC (A)(B)(C) | 4.900 | 10-01-26 | | 480,000 | 496,733 |
| SEE NOTES TO FINANCIAL STATEMENTS | SEMIANNUAL REPORT | JOHN HANCOCK INCOME SECURITIES TRUST | 19 |
| | Rate (%) | Maturity date | | Par value^ | Value |
| Information technology (continued) | | | | |
| Technology hardware, storage and peripherals (continued) | | | |
| Dell International LLC (A)(B)(C) | 5.300 | 10-01-29 | | 462,000 | $478,900 |
| Dell International LLC (A)(B)(C) | 5.850 | 07-15-25 | | 142,000 | 154,809 |
| Dell International LLC (B)(C) | 8.350 | 07-15-46 | | 502,000 | 625,931 |
| Seagate HDD Cayman (A)(B) | 4.750 | 01-01-25 | | 365,000 | 376,066 |
| Materials 2.0% | | | | 3,475,755 |
| Chemicals 0.8% | | | |
| Cydsa SAB de CV (C) | 6.250 | 10-04-27 | | 265,000 | 236,513 |
| Methanex Corp. (A)(B) | 4.250 | 12-01-24 | | 224,000 | 201,066 |
| Methanex Corp. (A)(B) | 5.250 | 12-15-29 | | 295,000 | 248,008 |
| Orbia Advance Corp. SAB de CV (C) | 5.500 | 01-15-48 | | 285,000 | 264,697 |
| Syngenta Finance NV (C) | 4.441 | 04-24-23 | | 470,000 | 470,245 |
| Construction materials 0.2% | | | |
| Cemex SAB de CV (C) | 6.125 | 05-05-25 | | 270,000 | 243,000 |
| Containers and packaging 0.1% | | | |
| Ardagh Packaging Finance PLC (C) | 6.000 | 02-15-25 | | 215,000 | 215,187 |
| Metals and mining 0.4% | | | |
| Anglo American Capital PLC (C) | 4.750 | 04-10-27 | | 270,000 | 278,302 |
| Arconic Corp. (C) | 6.000 | 05-15-25 | | 85,000 | 85,956 |
| Arconic Corp. (A)(B)(C) | 6.125 | 02-15-28 | | 40,000 | 38,062 |
| Commercial Metals Company | 5.375 | 07-15-27 | | 92,000 | 89,930 |
| Newmont Corp. (B) | 2.800 | 10-01-29 | | 169,000 | 173,549 |
| Paper and forest products 0.5% | | | |
| Georgia-Pacific LLC (C) | 2.300 | 04-30-30 | | 810,000 | 809,100 |
| Norbord, Inc. (C) | 6.250 | 04-15-23 | | 124,000 | 122,140 |
| Real estate 3.6% | | | | 6,299,045 |
| Equity real estate investment trusts 3.6% | | | |
| American Homes 4 Rent LP (B) | 4.250 | 02-15-28 | | 305,000 | 302,364 |
| American Tower Corp. (A)(B) | 2.400 | 03-15-25 | | 495,000 | 509,329 |
| American Tower Corp. (A)(B) | 2.950 | 01-15-25 | | 257,000 | 269,517 |
| American Tower Corp. (A)(B) | 3.550 | 07-15-27 | | 488,000 | 532,244 |
| American Tower Corp. (B) | 3.800 | 08-15-29 | | 445,000 | 495,804 |
| Crown Castle International Corp. (A)(B) | 3.300 | 07-01-30 | | 336,000 | 359,566 |
| Crown Castle International Corp. (B) | 4.150 | 07-01-50 | | 312,000 | 364,263 |
| CyrusOne LP | 3.450 | 11-15-29 | | 288,000 | 274,896 |
| Equinix, Inc. (A)(B) | 3.200 | 11-18-29 | | 669,000 | 699,868 |
| Equinix, Inc. (A)(B) | 5.375 | 05-15-27 | | 445,000 | 480,600 |
| GLP Capital LP | 5.375 | 04-15-26 | | 280,000 | 278,950 |
| iStar, Inc. (A)(B) | 4.750 | 10-01-24 | | 920,000 | 768,200 |
| SBA Communications Corp. (C) | 3.875 | 02-15-27 | | 132,000 | 134,805 |
| SBA Tower Trust (B)(C) | 3.722 | 04-11-23 | | 473,000 | 480,617 |
| The GEO Group, Inc. (A)(B) | 6.000 | 04-15-26 | | 72,000 | 54,540 |
| 20 | JOHN HANCOCK INCOME SECURITIES TRUST | SEMIANNUAL REPORT | SEE NOTES TO FINANCIAL STATEMENTS |
| | Rate (%) | Maturity date | | Par value^ | Value |
| Real estate (continued) | | | | |
| Equity real estate investment trusts (continued) | | | |
| Ventas Realty LP (A)(B) | 3.500 | 02-01-25 | | 254,000 | $254,684 |
| VICI Properties LP (A)(B)(C) | 4.625 | 12-01-29 | | 42,000 | 38,798 |
| Utilities 4.5% | | | | 7,902,637 |
| Electric utilities 2.2% | | | |
| ABY Transmision Sur SA (C) | 6.875 | 04-30-43 | | 244,875 | 304,869 |
| Duke Energy Corp. (B) | 3.550 | 09-15-21 | | 1,000,000 | 1,025,126 |
| Emera US Finance LP (B) | 3.550 | 06-15-26 | | 438,000 | 461,993 |
| Empresa Electrica Angamos SA (C) | 4.875 | 05-25-29 | | 297,360 | 292,186 |
| FirstEnergy Corp. (A)(B) | 2.650 | 03-01-30 | | 690,000 | 699,398 |
| Instituto Costarricense de Electricidad (C) | 6.375 | 05-15-43 | | 215,000 | 134,915 |
| NRG Energy, Inc. (B)(C) | 3.750 | 06-15-24 | | 205,000 | 209,445 |
| Vistra Operations Company LLC (A)(B)(C) | 3.700 | 01-30-27 | | 420,000 | 412,795 |
| Vistra Operations Company LLC (C) | 4.300 | 07-15-29 | | 390,000 | 387,172 |
| Gas utilities 0.1% | | | |
| AmeriGas Partners LP (A)(B) | 5.500 | 05-20-25 | | 216,000 | 219,352 |
| Independent power and renewable electricity producers 0.7% | | | |
| Greenko Dutch BV (C) | 4.875 | 07-24-22 | | 310,000 | 285,082 |
| NextEra Energy Capital Holdings, Inc. (B) | 3.550 | 05-01-27 | | 507,000 | 557,311 |
| NextEra Energy Operating Partners LP (A)(B)(C) | 3.875 | 10-15-26 | | 247,000 | 244,135 |
| NextEra Energy Operating Partners LP (A)(B)(C) | 4.500 | 09-15-27 | | 110,000 | 112,888 |
| Multi-utilities 1.5% | | | |
| Berkshire Hathaway Energy Company | 8.480 | 09-15-28 | | 550,000 | 809,277 |
| CMS Energy Corp. (A)(B) | 5.050 | 03-15-22 | | 1,000,000 | 1,056,468 |
| Dominion Energy, Inc. (B) | 3.375 | 04-01-30 | | 481,000 | 522,194 |
|
| NiSource, Inc. (B) | 3.600 | 05-01-30 | | 151,000 | 168,031 |
| Municipal bonds 0.2% (0.1% of Total investments) | | $314,025 |
| (Cost $331,492) | | | | | |
| New Jersey Transportation Trust Fund Authority | 4.081 | 06-15-39 | | 296,000 | 284,882 |
|
| New Jersey Transportation Trust Fund Authority | 4.131 | 06-15-42 | | 30,000 | 29,143 |
| Collateralized mortgage obligations 10.5% (6.9% of Total investments) | | $18,264,149 |
| (Cost $19,179,072) | | | | | |
| Commercial and residential 7.8% | | | | | 13,602,926 |
Americold LLC
Series 2010-ARTA, Class D (C) | 7.443 | 01-14-29 | | 605,000 | 611,395 |
| Arroyo Mortgage Trust | | | | | |
| Series 2018-1, Class A1 (C)(G) | 3.763 | 04-25-48 | | 500,581 | 504,420 |
| Series 2019-2, Class A1 (C)(G) | 3.347 | 04-25-49 | | 383,877 | 381,859 |
| BAMLL Commercial Mortgage Securities Trust | | | | | |
| Series 2015-200P, Class C (C)(G) | 3.716 | 04-14-33 | | 490,000 | 499,607 |
| SEE NOTES TO FINANCIAL STATEMENTS | SEMIANNUAL REPORT | JOHN HANCOCK INCOME SECURITIES TRUST | 21 |
| | Rate (%) | Maturity date | | Par value^ | Value |
| Commercial and residential (continued) | | | | | |
| Series 2019-BPR, Class ENM (C)(G) | 3.843 | 11-05-32 | | 175,000 | $117,853 |
Barclays Commercial Mortgage Trust
Series 2019-C5, Class A2 | 3.043 | 11-15-52 | | 241,000 | 250,804 |
BBCMS Mortgage Trust
Series 2018-TALL, Class E (1 month LIBOR + 2.437%) (C)(H) | 3.251 | 03-15-37 | | 214,000 | 181,494 |
| BBCMS Trust | | | | | |
| Series 2015-MSQ, Class D (C)(G) | 4.123 | 09-15-32 | | 480,000 | 467,795 |
| Series 2015-SRCH, Class D (C)(G) | 5.122 | 08-10-35 | | 295,000 | 289,926 |
| Series 2020-C6, Class A2 | 2.690 | 02-15-53 | | 155,000 | 160,371 |
| Benchmark Mortgage Trust | | | | | |
| Series 2019-B11, Class A2 | 3.410 | 05-15-52 | | 290,000 | 305,508 |
| Series 2019-B14, Class A2 | 2.915 | 12-15-62 | | 318,000 | 329,763 |
BRAVO Residential Funding Trust
Series 2019-NQM1, Class A1 (C)(G) | 2.666 | 07-25-59 | | 153,533 | 154,445 |
BWAY Mortgage Trust
Series 2015-1740, Class XA IO (C) | 1.023 | 01-10-35 | | 6,885,000 | 105,248 |
BX Commercial Mortgage Trust
Series 2018-BIOA, Class D (1 month LIBOR + 1.321%) (C)(H) | 2.135 | 03-15-37 | | 245,000 | 226,846 |
CGDBB Commercial Mortgage Trust
Series 2017-BIOC, Class E (1 month LIBOR + 2.150%) (C)(H) | 2.964 | 07-15-32 | | 241,175 | 209,368 |
Citigroup Commercial Mortgage Trust
Series 2019-SMRT, Class A (C) | 4.149 | 01-10-36 | | 121,000 | 125,178 |
| COLT Mortgage Loan Trust | | | | | |
| Series 2019-2, Class A1 (C)(G) | 3.337 | 05-25-49 | | 137,984 | 138,044 |
| Series 2020-1, Class A1 (C)(G) | 2.488 | 02-25-50 | | 162,679 | 162,712 |
| Commercial Mortgage Trust (Cantor Fitzgerald/Deutsche Bank AG) | | | | | |
| Series 2012-CR2, Class XA IO | 1.792 | 08-15-45 | | 1,775,830 | 51,592 |
| Series 2012-CR3, Class XA IO | 2.013 | 10-15-45 | | 2,588,585 | 90,589 |
Commercial Mortgage Trust (Citigroup/Deutsche Bank AG)
Series 2018-COR3, Class XA IO | 0.586 | 05-10-51 | | 3,842,803 | 114,710 |
| Commercial Mortgage Trust (Deutsche Bank AG) | | | | | |
| Series 2012-LC4, Class B (G) | 4.934 | 12-10-44 | | 360,000 | 363,322 |
| Series 2013-300P, Class D (C)(G) | 4.540 | 08-10-30 | | 340,000 | 339,779 |
| Series 2020-CBM, Class A2 (C) | 2.896 | 02-10-37 | | 93,000 | 83,145 |
Credit Suisse Mortgage Capital Certificates
Series 2019-ICE4, Class D (1 month LIBOR + 1.600%) (C)(H) | 2.414 | 05-15-36 | | 350,000 | 326,102 |
| CSMC Trust | | | | | |
| Series 2019-AFC1, Class A1 (C) | 2.573 | 07-25-49 | | 359,949 | 359,669 |
| Series 2020-AFC1, Class A1 (C)(G) | 2.240 | 02-25-50 | | 227,058 | 215,205 |
GCAT Trust
Series 2020-NQM1, Class A1 (C) | 2.247 | 01-25-60 | | 370,055 | 372,717 |
| GS Mortgage Securities Trust | | | | | |
| Series 2015-GC30, Class A3 | 3.119 | 05-10-50 | | 160,000 | 166,481 |
| 22 | JOHN HANCOCK INCOME SECURITIES TRUST | SEMIANNUAL REPORT | SEE NOTES TO FINANCIAL STATEMENTS |
| | Rate (%) | Maturity date | | Par value^ | Value |
| Commercial and residential (continued) | | | | | |
| Series 2015-GC34, Class A4 | 3.506 | 10-10-48 | | 156,000 | $166,374 |
| Series 2016-RENT, Class D (C)(G) | 4.202 | 02-10-29 | | 420,000 | 412,160 |
| Series 2017-485L, Class C (C)(G) | 4.115 | 02-10-37 | | 240,000 | 228,422 |
| Series 2019-GC39, Class A2 | 3.457 | 05-10-52 | | 409,000 | 429,985 |
| Series 2020-UPTN, Class A (C) | 2.751 | 02-10-37 | | 192,000 | 186,158 |
| HarborView Mortgage Loan Trust | | | | | |
| Series 2007-3, Class ES IO (C) | 0.350 | 05-19-47 | | 4,188,918 | 59,687 |
| Series 2007-4, Class ES IO | 0.350 | 07-19-47 | | 4,449,842 | 54,742 |
| Series 2007-6, Class ES IO (C) | 0.343 | 08-19-37 | | 3,007,469 | 34,151 |
IMT Trust
Series 2017-APTS, Class CFX (C)(G) | 3.613 | 06-15-34 | | 190,000 | 174,105 |
Irvine Core Office Trust
Series 2013-IRV, Class A2 (C)(G) | 3.279 | 05-15-48 | | 245,000 | 245,688 |
| JPMBB Commercial Mortgage Securities Trust | | | | | |
| Series 2015-C31, Class A3 | 3.801 | 08-15-48 | | 360,000 | 389,511 |
| Series 2016-C1, Class A4 | 3.311 | 03-15-49 | | 115,000 | 122,070 |
| JPMorgan Chase Commercial Mortgage Securities Trust | | | | | |
| Series 2012-HSBC, Class XA IO (C) | 1.582 | 07-05-32 | | 2,630,161 | 71,043 |
| Series 2015-JP1, Class A5 | 3.914 | 01-15-49 | | 115,000 | 125,537 |
| Series 2020-NNN, Class AFX (C) | 2.812 | 01-16-37 | | 195,000 | 195,684 |
KNDL Mortgage Trust
Series 2019-KNSQ, Class D (1 month LIBOR + 1.350%) (C)(H) | 2.164 | 05-15-36 | | 140,000 | 130,125 |
Morgan Stanley Capital I Trust
Series 2017-CLS, Class D (1 month LIBOR + 1.400%) (C)(H) | 2.214 | 11-15-34 | | 304,000 | 289,614 |
MSCG Trust
Series 2016-SNR, Class D (C) | 6.550 | 11-15-34 | | 395,250 | 385,196 |
| Natixis Commercial Mortgage Securities Trust | | | | | |
| Series 2018-285M, Class D (C)(G) | 3.917 | 11-15-32 | | 100,000 | 97,372 |
| Series 2018-ALXA, Class C (C)(G) | 4.460 | 01-15-43 | | 175,000 | 160,260 |
One Market Plaza Trust
Series 2017-1MKT, Class D (C) | 4.146 | 02-10-32 | | 190,000 | 190,651 |
Seasoned Credit Risk Transfer Trust
Series 2019-2, Class MA | 3.500 | 08-25-58 | | 402,350 | 430,583 |
| Starwood Mortgage Residential Trust | | | | | |
| Series 2018-IMC1, Class A1 (C)(G) | 3.793 | 03-25-48 | | 80,950 | 80,977 |
| Series 2020-1, Class A1 (C)(G) | 2.275 | 02-25-50 | | 183,950 | 182,049 |
UBS Commercial Mortgage Trust
Series 2012-C1, Class B | 4.822 | 05-10-45 | | 405,000 | 410,229 |
Wells Fargo Commercial Mortgage Trust
Series 2017-SMP, Class D (1 month LIBOR + 1.650%) (C)(H) | 2.464 | 12-15-34 | | 120,000 | 94,815 |
| WF-RBS Commercial Mortgage Trust | | | | | |
| Series 2012-C9, Class XA IO (C) | 2.051 | 11-15-45 | | 3,340,998 | 121,370 |
| Series 2013-C15, Class B (G) | 4.643 | 08-15-46 | | 155,000 | 156,451 |
| Series 2013-C16, Class B (G) | 5.201 | 09-15-46 | | 265,000 | 271,970 |
| SEE NOTES TO FINANCIAL STATEMENTS | SEMIANNUAL REPORT | JOHN HANCOCK INCOME SECURITIES TRUST | 23 |
| | Rate (%) | Maturity date | | Par value^ | Value |
| U.S. Government Agency 2.7% | | | | | $4,661,223 |
| Federal Home Loan Mortgage Corp. | | | | | |
| Series K017, Class X1 IO | 1.433 | 12-25-21 | | 3,321,689 | 51,431 |
| Series K018, Class X1 IO | 1.300 | 01-25-22 | | 3,102,050 | 50,347 |
| Series K021, Class X1 IO | 1.551 | 06-25-22 | | 888,184 | 21,701 |
| Series K022, Class X1 IO | 1.332 | 07-25-22 | | 3,570,397 | 75,929 |
| Series K040, Class A2 | 3.241 | 09-25-24 | | 285,000 | 310,638 |
| Series K043, Class A2 | 3.062 | 12-25-24 | | 450,000 | 489,092 |
| Series K718, Class X1 IO | 0.605 | 01-25-22 | | 15,083,387 | 116,415 |
| Series K728, Class A2 (G) | 3.064 | 08-25-24 | | 186,000 | 199,975 |
| Series K729, Class A2 | 3.136 | 10-25-24 | | 311,000 | 336,035 |
| Series KIR3, Class A1 | 3.038 | 08-25-27 | | 575,000 | 631,146 |
| Government National Mortgage Association | | | | | |
| Series 2012-114, Class IO | 0.760 | 01-16-53 | | 1,163,971 | 46,870 |
| Series 2016-174, Class IO | 0.890 | 11-16-56 | | 1,847,212 | 121,756 |
| Series 2017-109, Class IO | 0.599 | 04-16-57 | | 2,394,009 | 112,993 |
| Series 2017-124, Class IO | 0.703 | 01-16-59 | | 2,881,499 | 161,595 |
| Series 2017-135, Class IO | 0.837 | 10-16-58 | | 2,012,303 | 122,652 |
| Series 2017-140, Class IO | 0.612 | 02-16-59 | | 1,655,468 | 89,309 |
| Series 2017-20, Class IO | 0.736 | 12-16-58 | | 3,725,649 | 194,060 |
| Series 2017-22, Class IO | 0.942 | 12-16-57 | | 1,188,884 | 82,766 |
| Series 2017-46, Class IO | 0.616 | 11-16-57 | | 2,891,067 | 144,940 |
| Series 2017-61, Class IO | 0.764 | 05-16-59 | | 1,769,643 | 107,786 |
| Series 2017-74, Class IO | 0.718 | 09-16-58 | | 2,900,008 | 138,204 |
| Series 2018-114, Class IO | 0.549 | 04-16-60 | | 3,848,092 | 208,882 |
| Series 2018-158, Class IO | 0.727 | 05-16-61 | | 1,943,131 | 132,610 |
| Series 2018-35, Class IO | 0.528 | 03-16-60 | | 3,006,810 | 150,316 |
| Series 2018-43, Class IO | 0.575 | 05-16-60 | | 4,345,511 | 223,743 |
| Series 2018-69, Class IO | 0.573 | 04-16-60 | | 1,895,066 | 104,950 |
| Series 2018-9, Class IO | 0.558 | 01-16-60 | | 2,216,895 | 108,804 |
|
| Series 2019-131, Class IO | 0.931 | 07-16-61 | | 1,715,708 | 126,278 |
| Asset backed securities 7.5% (4.9% of Total investments) | | $13,146,154 |
| (Cost $13,547,951) | | | | | |
| Asset backed securities 7.5% | | | | | 13,146,154 |
AccessLex Institute
Series 2007-A, Class A3 (3 month LIBOR + 0.300%) (H) | 1.979 | 05-25-36 | | 211,133 | 189,645 |
Applebee's Funding LLC
Series 2019-1A, Class A2I (C) | 4.194 | 06-07-49 | | 440,000 | 370,643 |
Arby's Funding LLC
Series 2015-1A, Class A2 (C) | 4.969 | 10-30-45 | | 611,200 | 602,026 |
| Avis Budget Rental Car Funding AESOP LLC | | | | | |
| Series 2019-3A, Class A (C) | 2.360 | 03-20-26 | | 330,000 | 292,782 |
| Series 2020-1A, Class A (C) | 2.330 | 08-20-26 | | 251,000 | 222,288 |
CARS-DB4 LP
Series 2020-1A, Class B1 (C) | 4.170 | 02-15-50 | | 249,000 | 223,234 |
| 24 | JOHN HANCOCK INCOME SECURITIES TRUST | SEMIANNUAL REPORT | SEE NOTES TO FINANCIAL STATEMENTS |
| | Rate (%) | Maturity date | | Par value^ | Value |
| Asset backed securities (continued) | | | | | |
CLI Funding LLC
Series 2018-1A, Class A (C) | 4.030 | 04-18-43 | | 347,076 | $333,848 |
Coinstar Funding LLC
Series 2017-1A, Class A2 (C) | 5.216 | 04-25-47 | | 368,600 | 359,441 |
ContiMortgage Home Equity Loan Trust
Series 1995-2, Class A5 | 8.100 | 08-15-25 | | 17,031 | 13,140 |
CWABS Asset-Backed Certificates Trust
Series 2004-10, Class AF5B | 4.512 | 02-25-35 | | 99,968 | 100,165 |
| DB Master Finance LLC | | | | | |
| Series 2017-1A, Class A2I (C) | 3.629 | 11-20-47 | | 117,300 | 116,257 |
| Series 2017-1A, Class A2II (C) | 4.030 | 11-20-47 | | 166,175 | 163,036 |
| Series 2019-1A, Class A2I (C) | 3.787 | 05-20-49 | | 861,490 | 867,322 |
Domino's Pizza Master Issuer LLC
Series 2017-1A, Class A23 (C) | 4.118 | 07-25-47 | | 521,625 | 538,484 |
Driven Brands Funding LLC
Series 2015-1A, Class A2 (C) | 5.216 | 07-20-45 | | 510,925 | 519,202 |
Five Guys Funding LLC
Series 2017-1A, Class A2 (C) | 4.600 | 07-25-47 | | 194,530 | 184,013 |
FOCUS Brands Funding LLC
Series 2017-1A, Class A2I (C) | 3.857 | 04-30-47 | | 140,650 | 134,513 |
Ford Credit Auto Owner Trust
Series 2020-1, Class A (C) | 2.040 | 08-15-31 | | 390,000 | 379,864 |
Ford Credit Floorplan Master Owner Trust
Series 2019-2, Class A | 3.060 | 04-15-26 | | 515,000 | 507,699 |
GMF Floorplan Owner Revolving Trust
Series 2019-2, Class A (C) | 2.900 | 04-15-26 | | 485,000 | 461,681 |
Golden Credit Card Trust
Series 2018-4A, Class A (C) | 3.440 | 10-15-25 | | 360,000 | 381,478 |
Hilton Grand Vacations Trust
Series 2018-AA, Class A (C) | 3.540 | 02-25-32 | | 90,460 | 87,174 |
| Jack in the Box Funding LLC | | | | | |
| Series 2019-1A, Class A23 (C) | 4.970 | 08-25-49 | | 174,563 | 163,623 |
| Series 2019-1A, Class A2I (C) | 3.982 | 08-25-49 | | 174,563 | 168,793 |
Laurel Road Prime Student Loan Trust
Series 2019-A, Class A2FX (C) | 2.730 | 10-25-48 | | 105,000 | 105,662 |
MVW Owner Trust
Series 2018-1A, Class A (C) | 3.450 | 01-21-36 | | 228,093 | 221,794 |
Navient Private Education Refi Loan Trust
Series 2019-FA, Class A2 (C) | 2.600 | 08-15-68 | | 422,000 | 412,860 |
| New Residential Mortgage LLC | | | | | |
| Series 2018-FNT1, Class A (C) | 3.610 | 05-25-23 | | 204,946 | 203,193 |
| Series 2018-FNT2, Class A (C) | 3.790 | 07-25-54 | | 128,603 | 123,334 |
| NRZ Excess Spread-Collateralized Notes | | | | | |
| Series 2018-PLS1, Class A (C) | 3.193 | 01-25-23 | | 91,929 | 92,145 |
| Series 2018-PLS2, Class A (C) | 3.265 | 02-25-23 | | 133,266 | 133,447 |
Oxford Finance Funding LLC
Series 2019-1A, Class A2 (C) | 4.459 | 02-15-27 | | 142,000 | 144,748 |
Progress Residential Trust
Series 2020-SFR1, Class A (C) | 1.732 | 04-17-37 | | 261,000 | 253,849 |
| SEE NOTES TO FINANCIAL STATEMENTS | SEMIANNUAL REPORT | JOHN HANCOCK INCOME SECURITIES TRUST | 25 |
| | Rate (%) | Maturity date | | Par value^ | Value |
| Asset backed securities (continued) | | | | | |
Santander Revolving Auto Loan Trust
Series 2019-A, Class A (C) | 2.510 | 01-26-32 | | 400,000 | $386,164 |
Sesac Finance LLC
Series 2019-1, Class A2 (C) | 5.216 | 07-25-49 | | 287,825 | 287,672 |
Sonic Capital LLC
Series 2020-1A, Class A2I (C) | 3.845 | 01-20-50 | | 232,612 | 219,958 |
Sunbird Engine Finance LLC
Series 2020-1A, Class A (C) | 3.671 | 02-15-45 | | 248,274 | 180,247 |
Taco Bell Funding LLC
Series 2018-1A, Class A2I (C) | 4.318 | 11-25-48 | | 467,088 | 478,452 |
| Towd Point Mortgage Trust | | | | | |
| Series 2015-1, Class A5 (C)(G) | 3.901 | 10-25-53 | | 125,000 | 125,495 |
| Series 2015-2, Class 1M2 (C)(G) | 3.748 | 11-25-60 | | 300,000 | 300,354 |
| Series 2017-2, Class A1 (C)(G) | 2.750 | 04-25-57 | | 73,964 | 74,161 |
| Series 2018-1, Class A1 (C)(G) | 3.000 | 01-25-58 | | 146,897 | 149,459 |
| Series 2018-3, Class A1 (C)(G) | 3.750 | 05-25-58 | | 227,463 | 235,912 |
| Series 2018-4, Class A1 (C)(G) | 3.000 | 06-25-58 | | 377,636 | 385,969 |
| Series 2018-5, Class A1A (C)(G) | 3.250 | 07-25-58 | | 98,622 | 100,909 |
| Series 2019-1, Class A1 (C)(G) | 3.750 | 03-25-58 | | 222,216 | 230,971 |
Triton Container Finance V LLC
Series 2018-1A, Class A (C) | 3.950 | 03-20-43 | | 281,042 | 269,288 |
Vantage Data Centers Issuer LLC
Series 2018-1A, Class A2 (C) | 4.072 | 02-16-43 | | 195,667 | 198,369 |
| Westgate Resorts LLC | | | | | |
| Series 2016-1A, Class A (C) | 3.500 | 12-20-28 | | 56,849 | 56,476 |
| Series 2017-1A, Class A (C) | 3.050 | 12-20-30 | | 107,671 | 104,120 |
Westlake Automobile Receivables Trust
Series 2019-1A, Class C (C) | 3.450 | 03-15-24 | | 201,000 | 201,033 |
Willis Engine Structured Trust V
Series 2020-A, Class A (C) | 3.228 | 03-15-45 | | 122,538 | 89,762 |
|
| | | | | Shares | Value |
| Common stocks 0.2% (0.1% of Total investments) | | $265,040 |
| (Cost $515,695) | | | | | |
| Energy 0.2% | | | | | 265,040 |
| Oil, gas and consumable fuels 0.2% | | |
|
| Royal Dutch Shell PLC, ADR, Class A (A)(B) | | | | 8,000 | 265,040 |
| Preferred securities 1.6% (1.1% of Total investments) | | $2,822,499 |
| (Cost $2,725,427) | | | | | |
| Consumer staples 0.2% | | | | | 425,000 |
| Food products 0.2% | |
| Ocean Spray Cranberries, Inc., 6.250% (C) | | 6,250 | 425,000 |
| Financials 0.5% | | | | | 831,989 |
| Banks 0.5% | |
| GMAC Capital Trust I (3 month LIBOR + 5.785%), 7.477% (H) | | 24,985 | 563,412 |
| 26 | JOHN HANCOCK INCOME SECURITIES TRUST | SEMIANNUAL REPORT | SEE NOTES TO FINANCIAL STATEMENTS |
| | | | | Shares | Value |
| Financials (continued) | | | | | |
| Banks (continued) | |
| Wells Fargo & Company, Series L, 7.500% | | 192 | $268,577 |
| Information technology 0.1% | | | | | 256,395 |
| Semiconductors and semiconductor equipment 0.1% | |
| Broadcom, Inc., 8.000% | | 252 | 256,395 |
| Real estate 0.6% | | | | | 1,042,586 |
| Equity real estate investment trusts 0.6% | |
| Crown Castle International Corp., 6.875% | | 740 | 1,042,586 |
| Utilities 0.2% | | | | | 266,529 |
| Electric utilities 0.1% | |
| NextEra Energy, Inc., 5.279% | | 4,050 | 174,920 |
| The Southern Company, 6.750% | | 624 | 29,540 |
| Multi-utilities 0.1% | |
| Dominion Energy, Inc., 7.250% | | 414 | 40,667 |
| DTE Energy Company, 6.250% | | 512 | 21,402 |
|
| | Rate (%) | Maturity date | | Par value^ | Value |
| Escrow certificates 0.0% (0.0% of Total investments) | | $18,217 |
| (Cost $0) | | | | | |
| Stearns Holdings LLC (C)(F)(I) | 9.375 | 08-15-20 | | 158,000 | 18,217 |
|
| | | | | Par value^ | Value |
| Short-term investments 1.6% (1.1% of Total investments) | $2,885,000 |
| (Cost $2,885,000) | | | | | |
| Repurchase agreement 1.6% | | | | | 2,885,000 |
| Repurchase Agreement with State Street Corp. dated 4-30-20 at 0.000% to be repurchased at $2,885,000 on 5-1-20, collateralized by $2,865,000 U.S. Treasury Notes, 2.000% due 8-31-21 (valued at $2,944,065) | | | | 2,885,000 | 2,885,000 |
|
| Total investments (Cost $264,493,587) 151.9% | | | $265,220,922 |
| Other assets and liabilities, net (51.9%) | | | (90,601,876) |
| Total net assets 100.0% | | | $174,619,046 |
| The percentage shown for each investment category is the total value of the category as a percentage of the net assets of the fund unless otherwise indicated. |
| ^All par values are denominated in U.S. dollars unless otherwise indicated. |
| Security Abbreviations and Legend |
| ADR | American Depositary Receipt |
| CMT | Constant Maturity Treasury |
| ICE | Intercontinental Exchange |
| SEE NOTES TO FINANCIAL STATEMENTS | SEMIANNUAL REPORT | JOHN HANCOCK INCOME SECURITIES TRUST | 27 |
| IO | Interest-Only Security - (Interest Tranche of Stripped Mortgage Pool). Rate shown is the annualized yield at the end of the period. |
| LIBOR | London Interbank Offered Rate |
| SOFR | Secured Overnight Financing Rate |
| (A) | All or a portion of this security is on loan as of 4-30-20, and is a component of the fund's leverage under the Liquidity Agreement. |
| (B) | All or a portion of this security is pledged as collateral pursuant to the Liquidity Agreement. Total collateral value at 4-30-20 was $101,770,030. A portion of the securities pledged as collateral were loaned pursuant to the Liquidity Agreement. The value of securities on loan amounted to $51,877,674. |
| (C) | These securities are exempt from registration under Rule 144A of the Securities Act of 1933. Such securities may be resold, normally to qualified institutional buyers, in transactions exempt from registration. Rule 144A securities amounted to $71,676,053 or 41.0% of the fund's net assets as of 4-30-20. |
| (D) | Perpetual bonds have no stated maturity date. Date shown as maturity date is next call date. |
| (E) | Non-income producing - Issuer is in default. |
| (F) | Security is valued using significant unobservable inputs and is classified as Level 3 in the fair value hierarchy. Refer to Note 2 to the financial statements. |
| (G) | Variable or floating rate security, the interest rate of which adjusts periodically based on a weighted average of interest rates and prepayments on the underlying pool of assets. The interest rate shown is the current rate as of period end. |
| (H) | Variable rate obligation. The coupon rate shown represents the rate at period end. |
| (I) | Non-income producing security. |
At 4-30-20, the aggregate cost of investments for federal income tax purposes was $265,868,636. Net unrealized depreciation aggregated to $647,714, of which $9,227,992 related to gross unrealized appreciation and $9,875,706 related to gross unrealized depreciation.
| 28 | JOHN HANCOCK INCOME SECURITIES TRUST | SEMIANNUAL REPORT | SEE NOTES TO FINANCIAL STATEMENTS |
STATEMENT OF ASSETS AND LIABILITIES 4-30-20 (unaudited)
| Assets | |
| Unaffiliated investments, at value (Cost $264,493,587) | $265,220,922 |
| Cash | 958 |
| Dividends and interest receivable | 2,169,907 |
| Receivable for investments sold | 313,451 |
| Other assets | 26,560 |
| Total assets | 267,731,798 |
| Liabilities | |
| Liquidity agreement | 91,300,000 |
| Payable for investments purchased | 1,632,246 |
| Interest payable | 99,240 |
| Payable to affiliates | |
| Accounting and legal services fees | 10,668 |
| Trustees' fees | 265 |
| Other liabilities and accrued expenses | 70,333 |
| Total liabilities | 93,112,752 |
| Net assets | $174,619,046 |
| Net assets consist of | |
| Paid-in capital | $175,067,771 |
| Total distributable earnings (loss) | (448,725) |
| Net assets | $174,619,046 |
| |
| Net asset value per share | |
| Based on 11,646,585 shares of beneficial interest outstanding - unlimited number of shares authorized with no par value | $14.99 |
| SEE NOTES TO FINANCIAL STATEMENTS | SEMIANNUAL REPORT | JOHN HANCOCK INCOME SECURITIES TRUST | 29 |
STATEMENT OF OPERATIONSFor the six months ended 4-30-20 (unaudited)
| Investment income | |
| Interest | $4,979,140 |
| Dividends | 106,005 |
| Less foreign taxes withheld | (5,749) |
| Total investment income | 5,079,396 |
| Expenses | |
| Investment management fees | 698,647 |
| Interest expense | 925,741 |
| Accounting and legal services fees | 16,704 |
| Transfer agent fees | 32,474 |
| Trustees' fees | 20,064 |
| Custodian fees | 16,893 |
| Printing and postage | 25,250 |
| Professional fees | 33,822 |
| Stock exchange listing fees | 11,833 |
| Other | 8,176 |
| Total expenses | 1,789,604 |
| Less expense reductions | (9,540) |
| Net expenses | 1,780,064 |
| Net investment income | 3,299,332 |
| Realized and unrealized gain (loss) | |
| Net realized gain (loss) on | |
| Unaffiliated investments | 2,282,613 |
| | 2,282,613 |
| Change in net unrealized appreciation (depreciation) of | |
| Unaffiliated investments | (8,125,752) |
| | (8,125,752) |
| Net realized and unrealized loss | (5,843,139) |
| Decrease in net assets from operations | $(2,543,807) |
| 30 | JOHN HANCOCK INCOME SECURITIES TRUST | SEMIANNUAL REPORT | SEE NOTES TO FINANCIAL STATEMENTS |
STATEMENTS OF CHANGES IN NET ASSETS
| | Six months ended
4-30-20
(unaudited) | Year ended
10-31-19 |
| Increase (decrease) in net assets | | |
| From operations | | |
| Net investment income | $3,299,332 | $6,930,063 |
| Net realized gain | 2,282,613 | 1,538,151 |
| Change in net unrealized appreciation (depreciation) | (8,125,752) | 15,009,317 |
| Increase (decrease) in net assets resulting from operations | (2,543,807) | 23,477,531 |
| Distributions to shareholders | | |
| From earnings | (4,190,442) | (7,757,792) |
| Total distributions | (4,190,442) | (7,757,792) |
| Total increase (decrease) | (6,734,249) | 15,719,739 |
| Net assets | | |
| Beginning of period | 181,353,295 | 165,633,556 |
| End of period | $174,619,046 | $181,353,295 |
| Share activity | | |
| Shares outstanding | | |
| Beginning of period | 11,646,585 | 11,646,585 |
| End of period | 11,646,585 | 11,646,585 |
| SEE NOTES TO FINANCIAL STATEMENTS | SEMIANNUAL REPORT | JOHN HANCOCK INCOME SECURITIES TRUST | 31 |
STATEMENT OF CASH FLOWSFor the six months ended 4-30-20 (unaudited)
| | |
| Cash flows from operating activities | |
| Net decrease in net assets from operations | $(2,543,807) |
| Adjustments to reconcile net decrease in net assets from operations to net cash provided by operating activities: | |
| Long-term investments purchased | (106,328,394) |
| Long-term investments sold | 107,315,990 |
| Net purchases and sales in short-term investments | 749,632 |
| Net amortization of premium (discount) | 1,516,585 |
| (Increase) Decrease in assets: | |
| Dividends and interest receivable | (84,648) |
| Receivable for investments sold | 695 |
| Receivable for delayed delivery securities sold | 2,093,901 |
| Other assets | (11,592) |
| Increase (Decrease) in liabilities: | |
| Payable for investments purchased | 228,706 |
| Payable for delayed delivery securities purchased | (4,451,027) |
| Interest payable | (95,768) |
| Payable to affiliates | (5,137) |
| Other liabilities and accrued expenses | (37,657) |
| Net change in unrealized (appreciation) depreciation on: | |
| Investments | 8,125,752 |
| Net realized (gain) loss on: | |
| Investments | (2,282,613) |
| Net cash provided by operating activities | $4,190,618 |
| Cash flows provided by (used in) financing activities | |
| Distributions to shareholders | $(4,190,442) |
| Net cash used in financing activities | $(4,190,442) |
| Net increase in cash | $176 |
| Cash at beginning of period | $782 |
| Cash at end of period | $958 |
| Supplemental disclosure of cash flow information: | |
| Cash paid for interest | $(1,021,509) |
| 32 | JOHN HANCOCK INCOME SECURITIES TRUST | SEMIANNUAL REPORT | SEE NOTES TO FINANCIAL STATEMENTS |
| Period ended | 4-30-20 1 | 10-31-19 | 10-31-18 | 10-31-17 | 10-31-16 | 10-31-15 |
| Per share operating performance | | | | | | |
| Net asset value, beginning of period | $15.57 | $14.22 | $15.57 | $15.49 | $15.14 | $15.84 |
| Net investment income2 | 0.28 | 0.60 | 0.66 | 0.75 | 0.79 | 0.81 |
| Net realized and unrealized gain (loss) on investments | (0.50) | 1.42 | (1.27) | 0.14 | 0.41 | (0.62) |
| Total from investment operations | (0.22) | 2.02 | (0.61) | 0.89 | 1.20 | 0.19 |
| Less distributions | | | | | | |
| From net investment income | (0.36) | (0.67) | (0.74) | (0.81) | (0.85) | (0.90) |
| Anti-dilutive impact of repurchase plan | — | — | — | — | — | 0.013 |
| Net asset value, end of period | $14.99 | $15.57 | $14.22 | $15.57 | $15.49 | $15.14 |
| Per share market value, end of period | $13.96 | $14.58 | $13.14 | $14.81 | $14.26 | $13.86 |
| Total return at net asset value (%)4,5 | (1.32)6 | 14.84 | (3.76) | 6.28 | 8.52 | 1.84 |
| Total return at market value (%)4 | (1.86)6 | 16.37 | (6.50) | 9.82 | 9.20 | 3.28 |
| Ratios and supplemental data | | | | | | |
| Net assets, end of period (in millions) | $175 | $181 | $166 | $181 | $180 | $176 |
| Ratios (as a percentage of average net assets): | | | | | | |
| Expenses before reductions | 2.027 | 2.55 | 2.34 | 1.82 | 1.58 | 1.45 |
| Expenses including reductions8 | 2.017 | 2.54 | 2.32 | 1.81 | 1.57 | 1.43 |
| Net investment income | 3.737 | 3.99 | 4.44 | 4.87 | 5.24 | 5.22 |
| Portfolio turnover (%) | 40 | 50 | 68 | 47 | 43 | 51 |
| Senior securities | | | | | | |
| Total debt outstanding end of period (in millions) | $91 | $91 | $91 | $91 | $91 | $91 |
| Asset coverage per $1,000 of debt9 | $2,913 | $2,986 | $2,814 | $2,987 | $2,977 | $2,932 |
| 1 | Six months ended 4-30-20. Unaudited. |
| 2 | Based on average daily shares outstanding. |
| 3 | The repurchase plan was completed at an average repurchase price of $13.86 for 96,519 shares for the period ended 10-31-15. |
| 4 | Total return based on net asset value reflects changes in the fund’s net asset value during each period. Total return based on market value reflects changes in market value. Each figure assumes that distributions from income, capital gains and tax return of capital, if any, were reinvested. |
| 5 | Total returns would have been lower had certain expenses not been reduced during the applicable periods. |
| 6 | Not annualized. |
| 7 | Annualized. |
| 8 | Expenses including reductions excluding interest expense were 0.97% (annualized), 0.98%, 1.01%, 0.99%, 1.02% and 1.01% for the periods ended 4-30-20, 10-31-19, 10-31-18, 10-31-17, 10-31-16 and 10-31-15, respectively. |
| 9 | Asset coverage equals the total net assets plus borrowings divided by the borrowings of the fund outstanding at period end (Note 7). As debt outstanding changes, the level of invested assets may change accordingly. Asset coverage ratio provides a measure of leverage. |
| SEE NOTES TO FINANCIAL STATEMENTS | SEMIANNUAL REPORT | JOHN HANCOCK Income Securities Trust | 33 |
Notes to financial statements (unaudited)
Note 1—Organization
John Hancock Income Securities Trust (the fund) is a closed-end management investment company organized as a Massachusetts business trust and registered under the Investment Company Act of 1940, as amended (the 1940 Act).
Note 2—Significant accounting policies
The financial statements have been prepared in conformity with accounting principles generally accepted in the United States of America (US GAAP), which require management to make certain estimates and assumptions as of the date of the financial statements. Actual results could differ from those estimates and those differences could be significant. The fund qualifies as an investment company under Topic 946 of Accounting Standards Codification of US GAAP.
Events or transactions occurring after the end of the fiscal period through the date that the financial statements were issued have been evaluated in the preparation of the financial statements. The following summarizes the significant accounting policies of the fund:
Security valuation. Investments are stated at value as of the scheduled close of regular trading on the New York Stock Exchange (NYSE), normally at 4:00 P.M., Eastern Time. In case of emergency or other disruption resulting in the NYSE not opening for trading or the NYSE closing at a time other than the regularly scheduled close, the net asset value (NAV) may be determined as of the regularly scheduled close of the NYSE pursuant to the fund's Valuation Policies and Procedures.
In order to value the securities, the fund uses the following valuation techniques: Debt obligations are typically valued based on evaluated prices provided by an independent pricing vendor. Independent pricing vendors utilize matrix pricing, which takes into account factors such as institutional-size trading in similar groups of securities, yield, quality, coupon rate, maturity, type of issue, trading characteristics and other market data, as well as broker supplied prices. Equity securities, including exchange-traded or closed-end funds, are typically valued at the last sale price or official closing price on the exchange or principal market where the security trades. In the event there were no sales during the day or closing prices are not available, the securities are valued using the last available bid price.
In certain instances, the Pricing Committee may determine to value equity securities using prices obtained from another exchange or market if trading on the exchange or market on which prices are typically obtained did not open for trading as scheduled, or if trading closed earlier than scheduled, and trading occurred as normal on another exchange or market.
Other portfolio securities and assets, for which reliable market quotations are not readily available, are valued at fair value as determined in good faith by the fund's Pricing Committee following procedures established by the Board of Trustees. The frequency with which these fair valuation procedures are used cannot be predicted and fair value of securities may differ significantly from the value that would have been used had a ready market for such securities existed.
The fund uses a three-tier hierarchy to prioritize the pricing assumptions, referred to as inputs, used in valuation techniques to measure fair value. Level 1 includes securities valued using quoted prices in active markets for identical securities, including registered investment companies. Level 2 includes securities valued using other significant observable inputs. Observable inputs may include quoted prices for similar securities, interest rates, prepayment speeds and credit risk. Prices for securities valued using these inputs are received from independent pricing vendors and brokers and are based on an evaluation of the inputs described. Level 3 includes securities valued using significant unobservable inputs when market prices are not readily available or reliable, including the fund's own assumptions in determining the fair value of investments. Factors used in determining value may include market or issuer specific events or trends, changes in interest rates and credit quality. The inputs or
| 34 | JOHN HANCOCK Income Securities Trust | SEMIANNUAL REPORT | |
methodology used for valuing securities are not necessarily an indication of the risks associated with investing in those securities. Changes in valuation techniques and related inputs may result in transfers into or out of an assigned level within the disclosure hierarchy.
The following is a summary of the values by input classification of the fund's investments as of April 30, 2020, by major security category or type:
| | Total
value at
4-30-20 | Level 1
quoted
price | Level 2
significant
observable
inputs | Level 3
significant
unobservable
inputs |
| Investments in securities: | | | | |
| Assets | | | | |
| U.S. Government and Agency obligations | $49,527,275 | — | $49,527,275 | — |
| Foreign government obligations | 1,256,071 | — | 1,256,071 | — |
| Corporate bonds | 176,722,492 | — | 176,722,492 | — |
| Municipal bonds | 314,025 | — | 314,025 | — |
| Collateralized mortgage obligations | 18,264,149 | — | 18,264,149 | — |
| Asset backed securities | 13,146,154 | — | 13,146,154 | — |
| Common stocks | 265,040 | $265,040 | — | — |
| Preferred securities | 2,822,499 | 1,354,913 | 1,467,586 | — |
| Escrow certificates | 18,217 | — | — | $18,217 |
| Short-term investments | 2,885,000 | — | 2,885,000 | — |
| Total investments in securities | $265,220,922 | $1,619,953 | $263,582,752 | $18,217 |
Repurchase agreements. The fund may enter into repurchase agreements. When the fund enters into a repurchase agreement, it receives collateral that is held in a segregated account by the fund's custodian, or for tri-party repurchase agreements, collateral is held at a third-party custodian bank in a segregated account for the benefit of the fund. The collateral amount is marked-to-market and monitored on a daily basis to ensure that the collateral held is in an amount not less than the principal amount of the repurchase agreement plus any accrued interest. Collateral received by the fund for repurchase agreements is disclosed in the Fund's investments as part of the caption related to the repurchase agreement.
Repurchase agreements are typically governed by the terms and conditions of the Master Repurchase Agreement and/or Global Master Repurchase Agreement (collectively, MRA). Upon an event of default, the non-defaulting party may close out all transactions traded under the MRA and net amounts owed. Absent an event of default, assets and liabilities resulting from repurchase agreements are not offset in the Statement of assets and liabilities. In the event of a default by the counterparty, realization of the collateral proceeds could be delayed, during which time the collateral value may decline or the counterparty may have insufficient assets to pay claims resulting from close-out of the transactions.
Security transactions and related investment income. Investment security transactions are accounted for on a trade date plus one basis for daily NAV calculations. However, for financial reporting purposes, investment transactions are reported on trade date. Interest income is accrued as earned. Interest income includes coupon interest and amortization/accretion of premiums/discounts on debt securities. Debt obligations may be placed in a non-accrual status and related interest income may be reduced by stopping current accruals and writing off interest receivable when the collection of all or a portion of interest has become doubtful. Dividend income is recorded on the ex-date, except for dividends of certain foreign securities where the dividend may not be known until after the ex-date. In those cases, dividend income, net of withholding taxes, is recorded when the fund becomes aware of the dividends. Non-cash dividends, if any, are recorded at the fair market value of the securities
| | SEMIANNUAL REPORT | JOHN HANCOCK Income Securities Trust | 35 |
received. Distributions received on securities that represent a tax return of capital and/or capital gain, if any, are recorded as a reduction of cost of investments and/or as a realized gain, if amounts are estimable. Gains and losses on securities sold are determined on the basis of identified cost and may include proceeds from litigation.
Real estate investment trusts. The fund may invest in real estate investment trusts (REITs). Distributions from REITs may be recorded as income and subsequently characterized by the REIT at the end of the fiscal year as a reduction of cost of investments and/or as a realized gain. As a result, the fund will estimate the components of distributions from these securities. Such estimates are revised when the actual components of the distributions are known.
Foreign taxes. The fund may be subject to withholding tax on income, capital gains or repatriation taxes imposed by certain countries, a portion of which may be recoverable. Foreign taxes are accrued based upon the fund's understanding of the tax rules and rates that exist in the foreign markets in which it invests. Taxes are accrued based on gains realized by the fund as a result of certain foreign security sales. In certain circumstances, estimated taxes are accrued based on unrealized appreciation of such securities. Investment income is recorded net of foreign withholding taxes.
Overdrafts. Pursuant to the custodian agreement, the fund’s custodian may, in its discretion, advance funds to the fund to make properly authorized payments. When such payments result in an overdraft, the fund is obligated to repay the custodian for any overdraft, including any costs or expenses associated with the overdraft. The custodian may have a lien, security interest or security entitlement in any fund property that is not otherwise segregated or pledged, to the maximum extent permitted by law, to the extent of any overdraft.
Expenses. Within the John Hancock group of funds complex, expenses that are directly attributable to an individual fund are allocated to such fund. Expenses that are not readily attributable to a specific fund are allocated among all funds in an equitable manner, taking into consideration, among other things, the nature and type of expense and the fund’s relative net assets. Expense estimates are accrued in the period to which they relate and adjustments are made when actual amounts are known.
Statement of cash flows. A Statement of cash flows is presented when a fund has a significant amount of borrowing during the period, based on the average total borrowing in relation to total assets, or when a certain percentage of the fund’s investments is classified as Level 3 in the fair value hierarchy. Information on financial transactions that have been settled through the receipt and disbursement of cash is presented in the Statement of cash flows. The cash amount shown in the Statement of cash flows is the amount included in the fund’s Statement of assets and liabilities and represents the cash on hand at the fund’s custodian and does not include any short-term investments or collateral on derivative contracts, if any.
Change in accounting principle. Accounting Standards Update (ASU) 2017-08,Premium Amortization on Purchased Callable Debt Securities, shortens the premium amortization period for purchased non contingently callable debt securities and is effective for public companies with fiscal years beginning after December 15, 2018. Adoption of the ASU did not have a material impact to the fund.
Federal income taxes. The fund intends to continue to qualify as a regulated investment company by complying with the applicable provisions of the Internal Revenue Code and will not be subject to federal income tax on taxable income that is distributed to shareholders. Therefore, no federal income tax provision is required.
For federal income tax purposes, as of October 31, 2019, the fund has a long-term capital loss carryforward of $2,407,833 available to offset future net realized capital gains. This carryforward does not expire.
As of October 31, 2019, the fund had no uncertain tax positions that would require financial statement recognition, derecognition or disclosure. The fund's federal tax returns are subject to examination by the Internal Revenue Service for a period of three years.
| 36 | JOHN HANCOCK Income Securities Trust | SEMIANNUAL REPORT | |
Distribution of income and gains. Distributions to shareholders from net investment income and net realized gains, if any, are recorded on the ex-date. The fund generally declares and pays dividends quarterly. Capital gain distributions, if any, are typically distributed annually.
Such distributions, on a tax basis, are determined in conformity with income tax regulations, which may differ from US GAAP. Distributions in excess of tax basis earnings and profits, if any, are reported in the fund's financial statements as a return of capital. The final determination of tax characteristics of the fund's distribution will occur at the end of the year and will subsequently be reported to shareholders.
Capital accounts within the financial statements are adjusted for permanent book-tax differences. These adjustments have no impact on net assets or the results of operations. Temporary book-tax differences, if any, will reverse in a subsequent period. Book-tax differences are primarily attributable to amortization and accretion on debt securities.
Note 3—Guarantees and indemnifications
Under the fund's organizational documents, its Officers and Trustees are indemnified against certain liabilities arising out of the performance of their duties to the fund. Additionally, in the normal course of business, the fund enters into contracts with service providers that contain general indemnification clauses. The fund's maximum exposure under these arrangements is unknown, as this would involve future claims that may be made against the fund that have not yet occurred. The risk of material loss from such claims is considered remote.
Note 4—Fees and transactions with affiliates
John Hancock Investment Management LLC (the Advisor) serves as investment advisor for the fund. The Advisor is an indirect, wholly owned subsidiary of Manulife Financial Corporation (MFC).
Management fee. The fund has an investment management agreement with the Advisor under which the fund pays a daily management fee to the Advisor equivalent on an annual basis to the sum of (a) 0.650% of the first $150 million of the fund’s average daily managed assets (net assets plus borrowings under the Liquidity Agreement (see Note 7), (b) 0.375% of the next $50 million of the fund’s average daily managed assets, (c) 0.350% of the next $100 million of the fund’s average daily managed assets and (d) 0.300% of the fund’s average daily managed assets in excess of $300 million. The Advisor has a subadvisory agreement with Manulife Investment Management (US) LLC, an indirectly owned subsidiary of MFC and an affiliate of the Advisor. The fund is not responsible for payment of the subadvisory fees.
The Advisor has contractually agreed to waive a portion of its management fee and/or reimburse expenses for certain funds of the John Hancock group of funds complex, including the fund (the participating portfolios). This waiver is based upon aggregate net assets of all the participating portfolios. The amount of the reimbursement is calculated daily and allocated among all the participating portfolios in proportion to the daily net assets of each fund. During the six months ended April 30, 2020, this waiver amounted to 0.01% of the fund’s average daily net assets on an annualized basis. This arrangement expires on July 31, 2021, unless renewed by mutual agreement of the fund and the Advisor based upon a determination that this is appropriate under the circumstances at that time.
The expense reductions described above amounted to $9,540 for the six months ended April 30, 2020.
Expenses waived or reimbursed in the current fiscal period are not subject to recapture in future fiscal periods.
The investment management fees, including the impact of the waivers and reimbursements as described above, incurred for the six months ended April 30, 2020, were equivalent to a net annual effective rate of 0.51% of the fund's average daily managed net assets.
| | SEMIANNUAL REPORT | JOHN HANCOCK Income Securities Trust | 37 |
Accounting and legal services. Pursuant to a service agreement, the fund reimburses the Advisor for all expenses associated with providing the administrative, financial, legal, compliance, accounting and recordkeeping services to the fund, including the preparation of all tax returns, periodic reports to shareholders and regulatory reports, among other services. These accounting and legal services fees incurred for the six months ended April 30, 2020 amounted to an annual rate of 0.01% of the fund's average daily managed net assets.
Trustee expenses. The fund compensates each Trustee who is not an employee of the Advisor or its affiliates. These Trustees receive from the fund and the other John Hancock closed-end funds an annual retainer. In addition, Trustee out-of-pocket expenses are allocated to each fund based on its net assets relative to other funds within the John Hancock group of funds complex.
Note 5—Fund share transactions
On March 12, 2015, the Board of Trustees approved a share repurchase plan, which is subsequently reviewed and approved by the Board of Trustees each year in December. Under the current share repurchase plan, the fund may purchase in the open market, up to 10% of its outstanding common shares as of December 31, 2019. The current share repurchase plan will remain in effect between January 1, 2020 and December 31, 2020.
During the six months ended April 30, 2020 and the year ended October 31, 2019, the fund had no activities under the repurchase program. Shares repurchased and corresponding dollar amounts, if any, are included on the Statements of changes in net assets. The anti-dilutive impacts of these share repurchases are included on the Financial highlights.
Note 6—Leverage risk
The fund utilizes a Liquidity Agreement (LA) to increase its assets available for investment. When the fund leverages its assets, shareholders bear the expenses associated with the LA and have potential to benefit or be disadvantaged from the use of leverage. The Advisor’s fee is also increased in dollar terms from the use of leverage. Consequently, the fund and the Advisor may have differing interests in determining whether to leverage the fund’s assets. Leverage creates risks that may adversely affect the return for the holders of shares, including:
| • | the likelihood of greater volatility of NAV and market price of shares; |
| • | fluctuations in the interest rate paid for the use of the LA; |
| • | increased operating costs, which may reduce the fund’s total return; |
| • | the potential for a decline in the value of an investment acquired through leverage, while the fund’s obligations under such leverage remains fixed; and |
| • | the fund is more likely to have to sell securities in a volatile market in order to meet asset coverage or other debt compliance requirements. |
To the extent the income or capital appreciation derived from securities purchased with funds received from leverage exceeds the cost of leverage, the fund’s return will be greater than if leverage had not been used; conversely, returns would be lower if the cost of the leverage exceeds the income or capital appreciation derived. The use of securities lending to obtain leverage in the fund’s investments may subject the fund to greater risk of loss than would reinvestment of collateral in short term highly rated investments.
In addition to the risks created by the fund’s use of leverage, the fund is subject to the risk that it would be unable to timely, or at all, obtain replacement financing if the LA is terminated. Were this to happen, the fund would be required to de-leverage, selling securities at a potentially inopportune time and incurring tax consequences. Further, the fund’s ability to generate income from the use of leverage would be adversely affected.
Note 7—Liquidity Agreement
The fund has entered into a Liquidity Agreement (LA) with State Street Bank and Trust Company (SSB) that allows it to borrow or otherwise access up to $91.3 million (maximum facility amount) through a line of credit, securities lending and reverse repurchase agreements. The amounts outstanding at April 30, 2020 are shown in the
| 38 | JOHN HANCOCK Income Securities Trust | SEMIANNUAL REPORT | |
Statement of assets and liabilities as the Liquidity agreement.
The fund pledges its assets as collateral to secure obligations under the LA. The fund retains the risks and rewards of the ownership of assets pledged to secure obligations under the LA and makes these assets available for securities lending and reverse repurchase transactions with SSB acting as the fund’s authorized agent for these transactions. All transactions initiated through SSB are required to be secured with cash collateral received from the securities borrower (the Borrower) or cash is received from the reverse repurchase agreement (Reverse Repo) counterparties. Securities lending transactions will be secured with cash collateral in amounts at least equal to 100% of the market value of the securities utilized in these transactions. Cash received by SSB from securities lending or Reverse Repo transactions is credited against the amounts borrowed under the line of credit.
Upon return of securities by the Borrower or Reverse Repo counterparty, SSB will return the cash collateral to the Borrower or proceeds from the Reverse Repo, as applicable, which will eliminate the credit against the line of credit and will cause the drawdowns under the line of credit to increase by the amounts returned. Income earned on the loaned securities is retained by SSB, and any interest due on the reverse repurchase agreements is paid by SSB.
SSB has indemnified the fund for certain losses that may arise if the Borrower or a Reverse Repo Counterparty fails to return securities when due. With respect to securities lending transactions, upon a default of the securities borrower, SSB uses the collateral received from the Borrower to purchase replacement securities of the same issue, type, class and series. If the value of the collateral is less than the purchase cost of replacement securities, SSB is responsible for satisfying the shortfall but only to the extent that the shortfall is not due to any of the fund’s losses on the reinvested cash collateral. Although the risk of the loss of the securities is mitigated by receiving collateral from the Borrower or proceeds from the Reverse Repo counterparty and through SSB indemnification, the fund could experience a delay in recovering securities or could experience a lower than expected return if the Borrower or Reverse Repo counterparty fails to return the securities on a timely basis.
Under normal circumstances, interest charged is at the rate of one month LIBOR (London Interbank Offered Rate) plus 0.600% and is payable monthly on the aggregate balance of the drawdowns outstanding under the LA. As of April 30, 2020, the fund had an aggregate balance of $91,300,000 at an interest rate of 0.93%, which is reflected in the Liquidity agreement on the Statement of assets and liabilities. During the six months ended April 30, 2020, the average balance of the LA and the effective average interest rate were $91,300,000 and 2.03%, respectively.
The fund may terminate the LA with 60 days’ notice. If certain asset coverage and collateral requirements, or other covenants are not met, the LA could be deemed in default and result in termination. Absent a default or facility termination event, SSB is required to provide the fund with 360 days’ notice prior to terminating the LA.
Due to the anticipated discontinuation of LIBOR, as discussed in Note 8, the LA may be amended to remove LIBOR as the reference rate for interest and to replace LIBOR with an alternative reference rate for interest mutually agreed upon by the fund and SSB. However, there remains uncertainty regarding the future utilization of LIBOR and the nature of any replacement rate and the potential effect of a transition away from LIBOR on the fund and/or the LA cannot yet be fully determined.
Note 8—LIBOR Discontinuation Risk
The LA utilizes LIBOR as the reference or benchmark rate for interest rate calculations. LIBOR is a measure of the average interest rate at which major global banks can borrow from one another. Following allegations of rate manipulation and concerns regarding its thin liquidity, in July 2017, the U.K. Financial Conduct Authority, which regulates LIBOR, announced that it will stop encouraging banks to provide the quotations needed to sustain LIBOR after 2021. This event will likely cause LIBOR to cease to be published. Before then, it is expected that market participants such as the fund and SSB will transition to the use of different reference or benchmark rates. However, although regulators have suggested alternative rates, there is currently no definitive information regarding the future utilization of LIBOR or of any replacement rate.
| | SEMIANNUAL REPORT | JOHN HANCOCK Income Securities Trust | 39 |
It is uncertain what impact the discontinuation of LIBOR will have on the use of LIBOR as a reference rate in the LA. It is expected that market participants will amend financial instruments referencing LIBOR, such as the LA, to include fallback provisions and other measures that contemplate the discontinuation of LIBOR or other similar market disruption events, but neither the effect of the transition process nor the viability of such measures is known. In addition, there are obstacles to converting certain longer term securities and transactions to a new benchmark or benchmarks and the effectiveness of one alternative reference rate versus multiple alternative reference rates in new or existing financial instruments and products has not been determined. As market participants transition away from LIBOR, LIBOR's usefulness may deteriorate, which could occur prior to the end of 2021. The transition process may lead to increased volatility and illiquidity in markets that currently rely on LIBOR to determine interest rates. LIBOR's deterioration may adversely affect the liquidity and/or market value of securities that use LIBOR as a benchmark interest rate. The use of an alternative reference rate, or the transition process to an alternative reference rate, may result in increases to the interest paid by the fund pursuant to the LA and, therefore, may adversely affect the fund's performance.
Note 9—Purchase and sale of securities
Purchases and sales of securities, other than short-term investments and U.S. Treasury obligations, amounted to $96,768,406 and $95,070,269, respectively, for the six months ended April 30, 2020. Purchases and sales of U.S. Treasury obligations aggregated $9,559,988 and $12,245,721, respectively, for the six months ended April 30, 2020.
Note 10—Coronavirus (COVID-19) pandemic
The novel COVID-19 disease has resulted in significant disruptions to global business activity. A widespread health crisis such as a global pandemic could cause substantial market volatility, exchange trading suspensions and closures, impact the ability to complete redemptions, and affect fund performance.
| 40 | JOHN HANCOCK Income Securities Trust | SEMIANNUAL REPORT | |
Additional information (Unaudited)
Investment objective and policy
The fund is a closed-end, diversified management investment company, common shares of which were initially offered to the public on February 14, 1973, and are publicly traded on the New York Stock Exchange (the NYSE). The fund's investment objective is to generate a high level of current income consistent with prudent investment risk. There can be no assurance that the fund will achieve its investment objective. The fund utilizes a liquidity agreement to increase its assets available for investments.
Under normal circumstances, the fund invests at least 80% of its net assets (plus borrowings for investment purposes) in income securities, consisting of the following: (i) marketable corporate debt securities, (ii) governmental obligations and (iii) cash and commercial paper. The fund will notify shareholders at least 60 days prior to any change in this 80% investment policy. The fund may invest up to 20% of its total assets in income-producing preferred securities and common stocks.
Dividends and distributions
During the six months ended April 30, 2020, distributions from net investment income totaling $0.3598 per share were paid to shareholders. The dates of payments and the amounts per share were as follows:
| | | | | | |
| | Payment date | | | Income distributions | |
| | December 31, 2019 | | | $0.2197 | |
| | March 31, 2020 | | | 0.1401 | |
| | Total | | | $0.3598 | |
SEMIANNUAL REPORT | JOHN HANCOCK INCOME SECURITIES TRUST 41
Shareholder meeting
The fund held its Annual Meeting of Shareholders on Monday, February 3, 2020. The following proposal was considered by the shareholders:
Proposal:To elect twelve(12) Trustees to serve until their respective successors have been duly elected and qualified.
| | | |
| | Total votes
for the nominee | Total votes withheld
from the nominee |
| Independent Trustees | | |
| Charles L. Bardelis | 7,854,661.631 | 124,535.199 |
| James R. Boyle | 7,871,215.631 | 107,981.199 |
| Peter S. Burgess | 7,856,756.631 | 122,440.199 |
| William H. Cunningham | 7,849,256.631 | 129,940.199 |
| Grace K. Fey | 7,860,172.631 | 119,024.199 |
| Deborah C. Jackson | 7,861,450.631 | 117,746.199 |
| Hassell H. McClellan | 7,863,458.631 | 115,738.199 |
| James M. Oates | 7,866,210.631 | 112,986.199 |
| Steven R. Pruchansky | 7,865,327.631 | 113,869.199 |
| Gregory A. Russo | 7,865,006.631 | 114,190.199 |
| Non-Independent Trustee | | |
| Andrew G. Arnott | 7,871,796.631 | 107,400.199 |
| Marianne Harrison | 7,867,744.631 | 111,452.199 |
SEMIANNUAL REPORT | JOHN HANCOCK INCOME SECURITIES TRUST 42
| | |
Trustees
Hassell H. McClellan,Chairperson
Steven R. Pruchansky,Vice Chairperson
Andrew G. Arnott†
Charles L. Bardelis*
James R. Boyle
Peter S. Burgess*
William H. Cunningham
Grace K. Fey
Marianne Harrison†
Deborah C. Jackson
James M. Oates*
Gregory A. Russo
Officers
Andrew G. Arnott
President
Francis V. Knox, Jr.
Chief Compliance Officer
Charles A. Rizzo
Chief Financial Officer
Salvatore Schiavone
Treasurer
Christopher (Kit) Sechler
Secretary and Chief Legal Officer
| Investment advisor
John Hancock Investment Management LLC
Subadvisor
Manulife Investment Management (US) LLC
Portfolio Managers
Jeffrey N. Given, CFA
Howard C. Greene, CFA
Custodian
State Street Bank and Trust Company
Transfer agent
Computershare Shareowner Services, LLC
Legal counsel
K&L Gates LLP
Stock symbol
Listed New York Stock Exchange: JHS
|
* Member of the Audit Committee
† Non-Independent Trustee
The fund's proxy voting policies and procedures, as well as the fund's proxy voting record for the most recent twelve-month period ended June 30, are available free of charge on the Securities and Exchange Commission (SEC) website at sec.gov or on our website.
All of the fund's holdings as of the end of the third month of every fiscal quarter are filed with the SEC on Form N-PORT within 60 days of the end of the fiscal quarter. The fund's Form N-PORT filings are available on our website and the SEC's website, sec.gov.
We make this information on your fund, as well asmonthly portfolio holdings, and other fund details available on our website at jhinvestments.com or by calling 800-852-0218.
The report is certified under the Sarbanes-Oxley Act, which requires closed-end funds and other public companies to affirm that, to the best of their knowledge, the information in their financial reports is fairly and accurately stated in all material respects.| | | | |
| | You can also contact us: |
| | 800-852-0218
jhinvestments.com | Regular mail:
Computershare
P.O. Box 505000
Louisville, KY 40233
| Express mail:
Computershare
462 South 4th Street, Suite 1600
Louisville, KY 40202
|
SEMIANNUAL REPORT | JOHN HANCOCK INCOME SECURITIES TRUST 43
John Hancock family of funds
| | | |
DOMESTIC EQUITY FUNDS
Blue Chip Growth
Classic Value
Disciplined Value
Disciplined Value Mid Cap
Equity Income
Financial Industries
Fundamental All Cap Core
Fundamental Large Cap Core
New Opportunities
Regional Bank
Small Cap Core
Small Cap Growth
Small Cap Value
U.S. Global Leaders Growth
U.S. Quality Growth
GLOBAL AND INTERNATIONAL EQUITY FUNDS
Disciplined Value International
Emerging Markets
Emerging Markets Equity
Fundamental Global Franchise
Global Equity
Global Shareholder Yield
Global Thematic Opportunities
International Dynamic Growth
International Growth
International Small Company
| | INCOME FUNDS
Bond
California Tax-Free Income
Emerging Markets Debt
Floating Rate Income
Government Income
High Yield
High Yield Municipal Bond
Income
Investment Grade Bond
Money Market
Short Duration Bond
Short Duration Credit Opportunities
Strategic Income Opportunities
Tax-Free Bond
ALTERNATIVE AND SPECIALTY FUNDS
Absolute Return Currency
Alternative Asset Allocation
Alternative Risk Premia
Diversified Macro
Infrastructure
Multi-Asset Absolute Return
Seaport Long/Short
|
The fund's investment objectives, risks, charges, and expenses are included in the prospectus and should be considered carefully before investing. For a prospectus, contact your financial professional, call John Hancock Investment Management at 800-852-0218, or visit the fund's website at jhinvestments.com. Please read the prospectus carefully before investing or sending money.
The John Hancock funds are distributed by John Hancock Investment Management Distributors LLC. Member FINRA SIPC.
| | | |
ASSET ALLOCATION
Balanced
Multi-Asset High Income
Multi-Index Lifetime Portfolios
Multi-Index Preservation Portfolios
Multimanager Lifestyle Portfolios
Multimanager Lifetime Portfolios
Retirement Income 2040
EXCHANGE-TRADED FUNDS
John Hancock Multifactor Consumer Discretionary ETF
John Hancock Multifactor Consumer Staples ETF
John Hancock Multifactor Developed International ETF
John Hancock Multifactor Emerging Markets ETF
John Hancock Multifactor Energy ETF
John Hancock Multifactor Financials ETF
John Hancock Multifactor Healthcare ETF
John Hancock Multifactor Industrials ETF
John Hancock Multifactor Large Cap ETF
John Hancock Multifactor Materials ETF
John Hancock Multifactor Media and
Communications ETF
John Hancock Multifactor Mid Cap ETF
John Hancock Multifactor Small Cap ETF
John Hancock Multifactor Technology ETF
John Hancock Multifactor Utilities ETF
| | ENVIRONMENTAL, SOCIAL, AND
GOVERNANCE FUNDS
ESG All Cap Core
ESG Core Bond
ESG International Equity
ESG Large Cap Core
CLOSED-END FUNDS
Financial Opportunities
Hedged Equity & Income
Income Securities Trust
Investors Trust
Preferred Income
Preferred Income II
Preferred Income III
Premium Dividend
Tax-Advantaged Dividend Income
Tax-Advantaged Global Shareholder Yield
|
John Hancock Multifactor ETF shares are bought and sold at market price (not NAV), and are not individually redeemed
from the fund. Brokerage commissions will reduce returns.
John Hancock ETFs are distributed by Foreside Fund Services, LLC, and are subadvised by Dimensional Fund Advisors LP.
Foreside is not affiliated with John Hancock Investment Management Distributors LLC or Dimensional Fund Advisors LP.
Dimensional Fund Advisors LP receives compensation from John Hancock in connection with licensing rights to the
John Hancock Dimensional indexes. Dimensional Fund Advisors LP does not sponsor, endorse, or sell, and makes no
representation as to the advisability of investing in, John Hancock Multifactor ETFs.
John Hancock Investment Management
A trusted brand
John Hancock Investment Management is a premier asset manager
representing one of America's most trusted brands, with a heritage of
financial stewardship dating back to 1862. Helping our shareholders
pursue their financial goals is at the core of everything we do. It's why
we support the role of professional financial advice and operate with
the highest standards of conduct and integrity.
A better way to invest
We serve investors globally through a unique multimanager approach:
We search the world to find proven portfolio teams with specialized
expertise for every strategy we offer, then we apply robust investment
oversight to ensure they continue to meet our uncompromising
standards and serve the best interests of our shareholders.
Results for investors
Our unique approach to asset management enables us to provide
a diverse set of investments backed by some of the world's best
managers, along with strong risk-adjusted returns across asset classes.
John Hancock Investment Management LLC
200 Berkeley Street n Boston, MA 02116-5010 n 800-225-5291 n jhinvestments.com
ITEM 2. CODE OF ETHICS.
Not applicable.
ITEM 3. AUDIT COMMITTEE FINANCIAL EXPERT.
Not applicable at this time.
ITEM 4. PRINCIPAL ACCOUNTANT FEES AND SERVICES.
Not applicable at this time.
ITEM 5. AUDIT COMMITTEE OF LISTED REGISTRANTS.
Not applicable at this time.
ITEM 6. SCHEDULE OF INVESTMENTS.
(a) Not applicable.
(b) Not applicable.
ITEM 7. DISCLOSURE OF PROXY VOTING POLICIES AND PROCEDURES FOR CLOSED-END MANAGEMENT INVESTMENT COMPANIES.
Not applicable.
ITEM 8. PORTFOLIO MANAGERS OF CLOSED-END MANAGEMENT INVESTMENT COMPANIES.
Not applicable.
ITEM 9. PURCHASES OF EQUITY SECURITIES BY CLOSED-END MANAGEMENT INVESTMENT COMPANY AND AFFILIATED PURCHASERS.
(a) Not applicable.
(b)
| | | Total number of | Maximum number of |
| | | shares purchased | shares that may yet |
| Total number of | Average price per | as part of publicly | be purchased under |
| Period | shares purchased | share | announced plans* | the plans |
| Nov-19 | - | - | - | 1,164,659 |
| Dec-19 | - | - | - | 1,164,659 |
| Jan-20 | - | - | - | 1,164,659* |
| Feb-20 | - | - | - | 1,164,659 |
| Mar-20 | - | - | - | 1,164,659 |
| Apr-20 | - | - | - | 1,164,659 |
| Total | - | - | | |
| | | | | |
| | | | | |
*In March 2015, the Board of Trustees approved a share repurchase plan, which has been subsequently reviewed and approved by the Board of Trustees. Under the current share repurchase plan, the Fund may purchase in the open market up to 10% of its outstanding common shares as of December 31, 2019. The current share plan will remain in effect between January 1, 2020 and December 31, 2020. |
ITEM 10. SUBMISSION OF MATTERS TO A VOTE OF SECURITY HOLDERS.
The registrant has adopted procedures by which shareholders may recommend nominees to the registrant’s Board of Trustees. A copy of the procedures is filed as an exhibit to this Form N-CSR. See attached “John Hancock Funds – Nominating, Governance and Administration Committee Charter.”
ITEM 11. CONTROLS AND PROCEDURES.
(a) Based upon their evaluation of the registrant's disclosure controls and procedures as conducted within 90 days of the filing date of this Form N-CSR, the registrant's principal executive officer and principal financial officer have concluded that those disclosure controls and procedures provide reasonable assurance that the material information required to be disclosed by the registrant on this report is recorded, processed, summarized and reported within the time periods specified in the Securities and Exchange Commission's rules and forms.
(b) There were no changes in the registrant's internal control over financial reporting that occurred during the period covered by this report that have materially affected, or are reasonably likely to materially affect, the registrant's internal control over financial reporting.
ITEM 12. DISCLOSURE OF SECURITIES LENDING ACTIVITIES FOR CLOSED-END MANAGEMENT INVESTMENT COMPANIES.
The Fund did not participate directly in securities lending activities. See Note 7 to financial statements in Item 1.
ITEM 13. EXHIBITS.
(a) Separate certifications for the registrant'sprincipal executive officer andprincipal financial officer, as required by Section 302 of the Sarbanes-Oxley Act of 2002 and Rule 30a-2(a) under the Investment Company Act of 1940, are attached.
(b)(1)Separate certifications for the registrant's principal executive officer and principal financial officer, as required by 18 U.S.C. Section 1350, as adopted pursuant to Section 906 of the Sarbanes-Oxley Act of 2002, and Rule 30a-2(b) under the Investment Company Act of 1940, are attached. The certifications furnished pursuant to this paragraph are not deemed to be "filed" for purposes of Section 18 of the Securities Exchange Act of 1934, or otherwise subject to the liability of that section. Such certifications are not deemed to be incorporated by reference into any filing under the Securities Act of 1933 or the Securities Exchange Act of 1934, except to the extent that the Registrant specifically incorporates them by reference.
(c)(1) Submission of Matters to a Vote of Security Holders is attached. See attached “John Hancock Funds – Nominating, Governance and Administration Committee Charter.”
SIGNATURES
Pursuant to the requirements of the Securities Exchange Act of 1934 and the Investment Company Act of 1940, the registrant has duly caused this report to be signed on its behalf by the undersigned, thereunto duly authorized.
John Hancock Income Securities Trust
| By: | /s/ Andrew Arnott | |
| Andrew Arnott | |
| President | |
| | |
| | |
| Date: | June 25, 2020 |
| |
| |
| Pursuant to the requirements of the Securities Exchange Act of 1934 and the Investment Company Act of 1940, this report has been signed below by the following persons on behalf of the registrant and in the capacities and on the dates indicated. |
| |
| |
| By: | /s/ Andrew Arnott | |
| Andrew Arnott | |
| President | |
| |
| |
| Date: | June 25, 2020 |
| |
| |
| By: | /s/ Charles A. Rizzo | |
| Charles A. Rizzo | |
| Chief Financial Officer | |
| |
| | |
| Date: | June 25, 2020 |