4Q22 and 2022 Financial Results January 17, 2023

2 Forward-looking statements and use of non-GAAP financial measures This document contains forward-looking statements within the meaning of the Private Securities Litigation Reform Act of 1995. Any statement that does not describe historical or current facts is a forward-looking statement. These statements often include the words “believes,” “expects,” “anticipates,” “estimates,” “intends,” “plans,” “goals,” “targets,” “initiatives,” “potentially,” “probably,” “projects,” “outlook,” “guidance” or similar expressions or future conditional verbs such as “may,” “will,” “should,” “would,” and “could.” Forward-looking statements are based upon the current beliefs and expectations of management, and on information currently available to management. Our statements speak as of the date hereof, and we do not assume any obligation to update these statements or to update the reasons why actual results could differ from those contained in such statements in light of new information or future events. We caution you, therefore, against relying on any of these forward-looking statements. They are neither statements of historical fact nor guarantees or assurances of future performance. While there is no assurance that any list of risks and uncertainties or risk factors is complete, important factors that could cause actual results to differ materially from those in the forward-looking statements include the following, without limitation: • Negative economic, business and political conditions, including as a result of supply chain disruptions, inflationary pressures and labor shortages, that adversely affect the general economy, housing prices, the job market, consumer confidence and spending habits which may affect, among other things, the level of nonaccrual assets, charge-offs and provision expense; • The rate of growth in the economy and employment levels, as well as general business and economic conditions, and changes in the competitive environment; • Our ability to implement our business strategy, including the cost savings and efficiency components, and achieve our financial performance goals, including through the integration of Investors and the HSBC branches; • The effects of geopolitical instability, including as a result of Russia’s invasion of Ukraine and the imposition of sanctions on Russia and other actions in response, on economic and market conditions, inflationary pressures and the interest rate environment, commodity price and foreign exchange rate volatility, and heightened cybersecurity risks; • Our ability to meet heightened supervisory requirements and expectations; • Liabilities and business restrictions resulting from litigation and regulatory investigations; • Our capital and liquidity requirements under regulatory capital standards and our ability to generate capital internally or raise capital on favorable terms; • The effect of changes in interest rates on our net interest income, net interest margin and our mortgage originations, mortgage servicing rights and mortgages held for sale; • Changes in interest rates and market liquidity, as well as the magnitude of such changes, which may reduce interest margins, impact funding sources and affect the ability to originate and distribute financial products in the primary and secondary markets; • The effect of changes in the level of checking or savings account deposits on our funding costs and net interest margin; • Financial services reform and other current, pending or future legislation or regulation that could have a negative effect on our revenue and businesses; • Environmental, social and governance risks, such as physical or transitional risks associated with climate change, that could adversely affect our reputation, operations, business, and customers. • A failure in or breach of our operational or security systems or infrastructure, or those of our third party vendors or other service providers, including as a result of cyber-attacks; and • Management’s ability to identify and manage these and other risks. In addition to the above factors, we also caution that the actual amounts and timing of any future common stock dividends or share repurchases will be subject to various factors, including our capital position, financial performance, risk-weighted assets, capital impacts of strategic initiatives, market conditions, receipt of required regulatory approvals and other regulatory and accounting considerations, as well as any other factors that our Board of Directors deems relevant in making such a determination. Therefore, there can be no assurance that we will repurchase shares from or pay any dividends to holders of our common stock, or as to the amount of any such repurchases or dividends. More information about factors that could cause actual results to differ materially from those described in the forward-looking statements can be found in the “Risk Factors” section in Part II, Item 1A of our Quarterly Report on Form 10-Q for the period ended March 31, 2022 and Part I, Item 1A of our Annual Report on Form 10-K for the fiscal year ended December 31, 2021 as filed with the Securities and Exchange Commission. Non-GAAP Financial Measures: This document contains non-GAAP financial measures denoted as Underlying results, excluding HSBC and ISBC, excluding acquisitions and excluding PPP. Underlying results for any given reporting period exclude certain items that may occur in that period which Management does not consider indicative of the Company’s on-going financial performance. We believe these non-GAAP financial measures provide useful information to investors because they are used by our Management to evaluate our operating performance and make day-to-day operating decisions. In addition, we believe our Underlying results in any given reporting period reflect our on-going financial performance in that period and, accordingly, are useful to consider in addition to our GAAP financial results. We further believe the presentation of Underlying results increases comparability of period-to-period results. The Appendix presents reconciliations of our non-GAAP measures to the most directly comparable GAAP financial measures. Other companies may use similarly titled non-GAAP financial measures that are calculated differently from the way we calculate such measures. Accordingly, our non-GAAP financial measures may not be comparable to similar measures used by such companies. We caution investors not to place undue reliance on such non-GAAP financial measures, but to consider them with the most directly comparable GAAP measures. Non-GAAP financial measures have limitations as analytical tools and should not be considered in isolation or as a substitute for our results reported under GAAP.
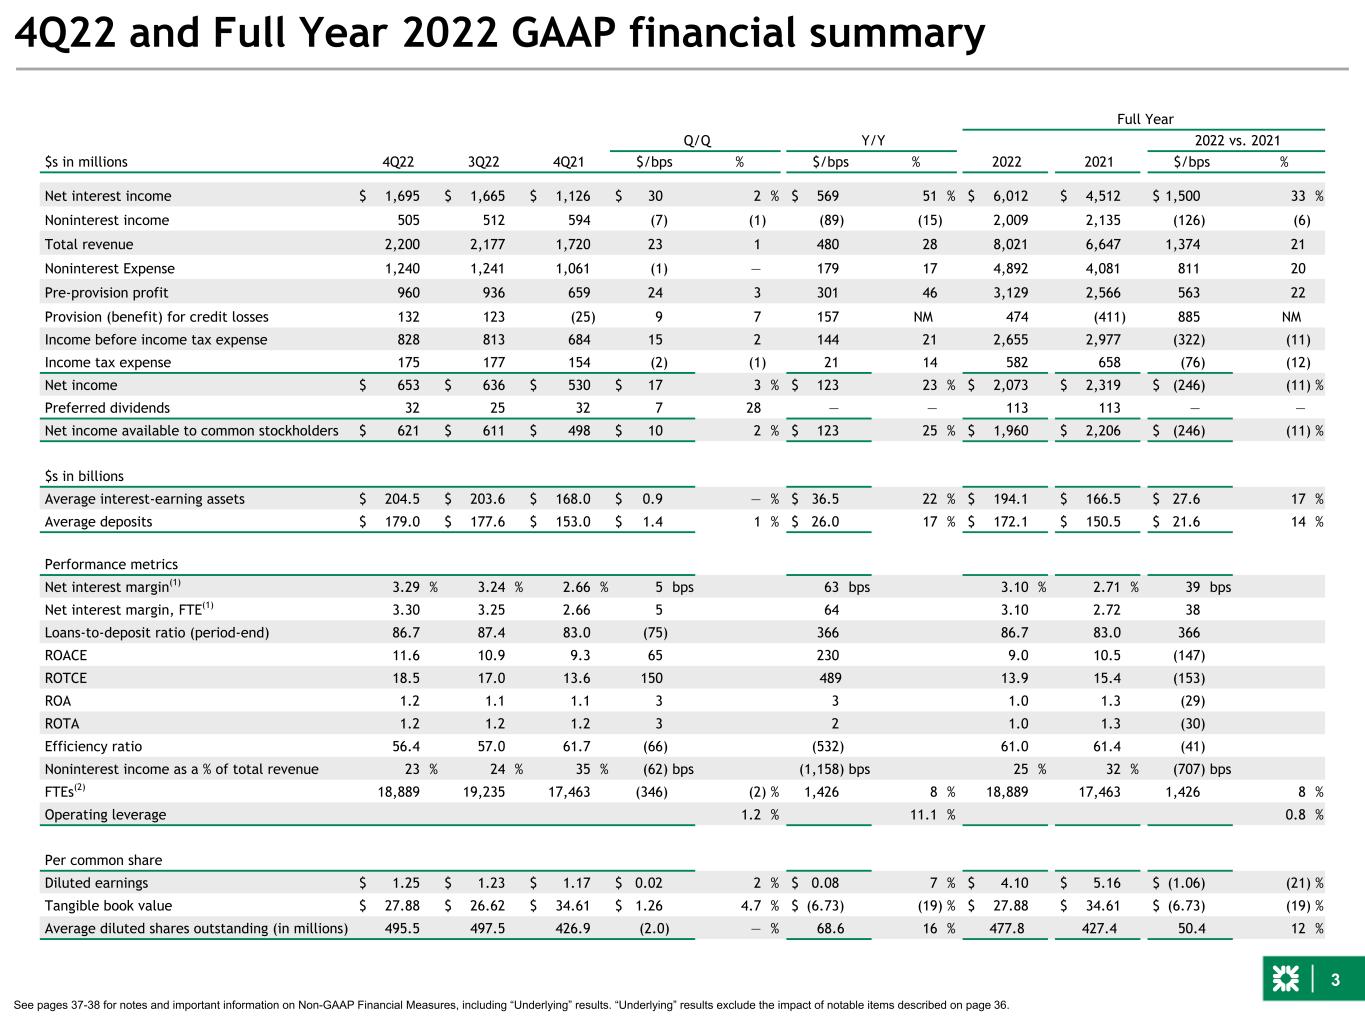
3 4Q22 and Full Year 2022 GAAP financial summary Full Year 4Q22 3Q22 4Q21 Q/Q Y/Y 2022 vs. 2021 $s in millions $/bps % $/bps % 2022 2021 $/bps % Net interest income $ 1,695 $ 1,665 $ 1,126 $ 30 2 % $ 569 51 % $ 6,012 $ 4,512 $ 1,500 33 % Noninterest income 505 512 594 (7) (1) (89) (15) 2,009 2,135 (126) (6) Total revenue 2,200 2,177 1,720 23 1 480 28 8,021 6,647 1,374 21 Noninterest Expense 1,240 1,241 1,061 (1) — 179 17 4,892 4,081 811 20 Pre-provision profit 960 936 659 24 3 301 46 3,129 2,566 563 22 Provision (benefit) for credit losses 132 123 (25) 9 7 157 NM 474 (411) 885 NM Income before income tax expense 828 813 684 15 2 144 21 2,655 2,977 (322) (11) Income tax expense 175 177 154 (2) (1) 21 14 582 658 (76) (12) Net income $ 653 $ 636 $ 530 $ 17 3 % $ 123 23 % $ 2,073 $ 2,319 $ (246) (11) % Preferred dividends 32 25 32 7 28 — — 113 113 — — Net income available to common stockholders $ 621 $ 611 $ 498 $ 10 2 % $ 123 25 % $ 1,960 $ 2,206 $ (246) (11) % $s in billions Average interest-earning assets $ 204.5 $ 203.6 $ 168.0 $ 0.9 — % $ 36.5 22 % $ 194.1 $ 166.5 $ 27.6 17 % Average deposits $ 179.0 $ 177.6 $ 153.0 $ 1.4 1 % $ 26.0 17 % $ 172.1 $ 150.5 $ 21.6 14 % Performance metrics Net interest margin(1) 3.29 % 3.24 % 2.66 % 5 bps 63 bps 3.10 % 2.71 % 39 bps Net interest margin, FTE(1) 3.30 3.25 2.66 5 64 3.10 2.72 38 Loans-to-deposit ratio (period-end) 86.7 87.4 83.0 (75) 366 86.7 83.0 366 ROACE 11.6 10.9 9.3 65 230 9.0 10.5 (147) ROTCE 18.5 17.0 13.6 150 489 13.9 15.4 (153) ROA 1.2 1.1 1.1 3 3 1.0 1.3 (29) ROTA 1.2 1.2 1.2 3 2 1.0 1.3 (30) Efficiency ratio 56.4 57.0 61.7 (66) (532) 61.0 61.4 (41) Noninterest income as a % of total revenue 23 % 24 % 35 % (62) bps (1,158) bps 25 % 32 % (707) bps FTEs(2) 18,889 19,235 17,463 (346) (2) % 1,426 8 % 18,889 17,463 1,426 8 % Operating leverage 1.2 % 11.1 % 0.8 % Per common share Diluted earnings $ 1.25 $ 1.23 $ 1.17 $ 0.02 2 % $ 0.08 7 % $ 4.10 $ 5.16 $ (1.06) (21) % Tangible book value $ 27.88 $ 26.62 $ 34.61 $ 1.26 4.7 % $ (6.73) (19) % $ 27.88 $ 34.61 $ (6.73) (19) % Average diluted shares outstanding (in millions) 495.5 497.5 426.9 (2.0) — % 68.6 16 % 477.8 427.4 50.4 12 % See pages 37-38 for notes and important information on Non-GAAP Financial Measures, including “Underlying” results. “Underlying” results exclude the impact of notable items described on page 36.
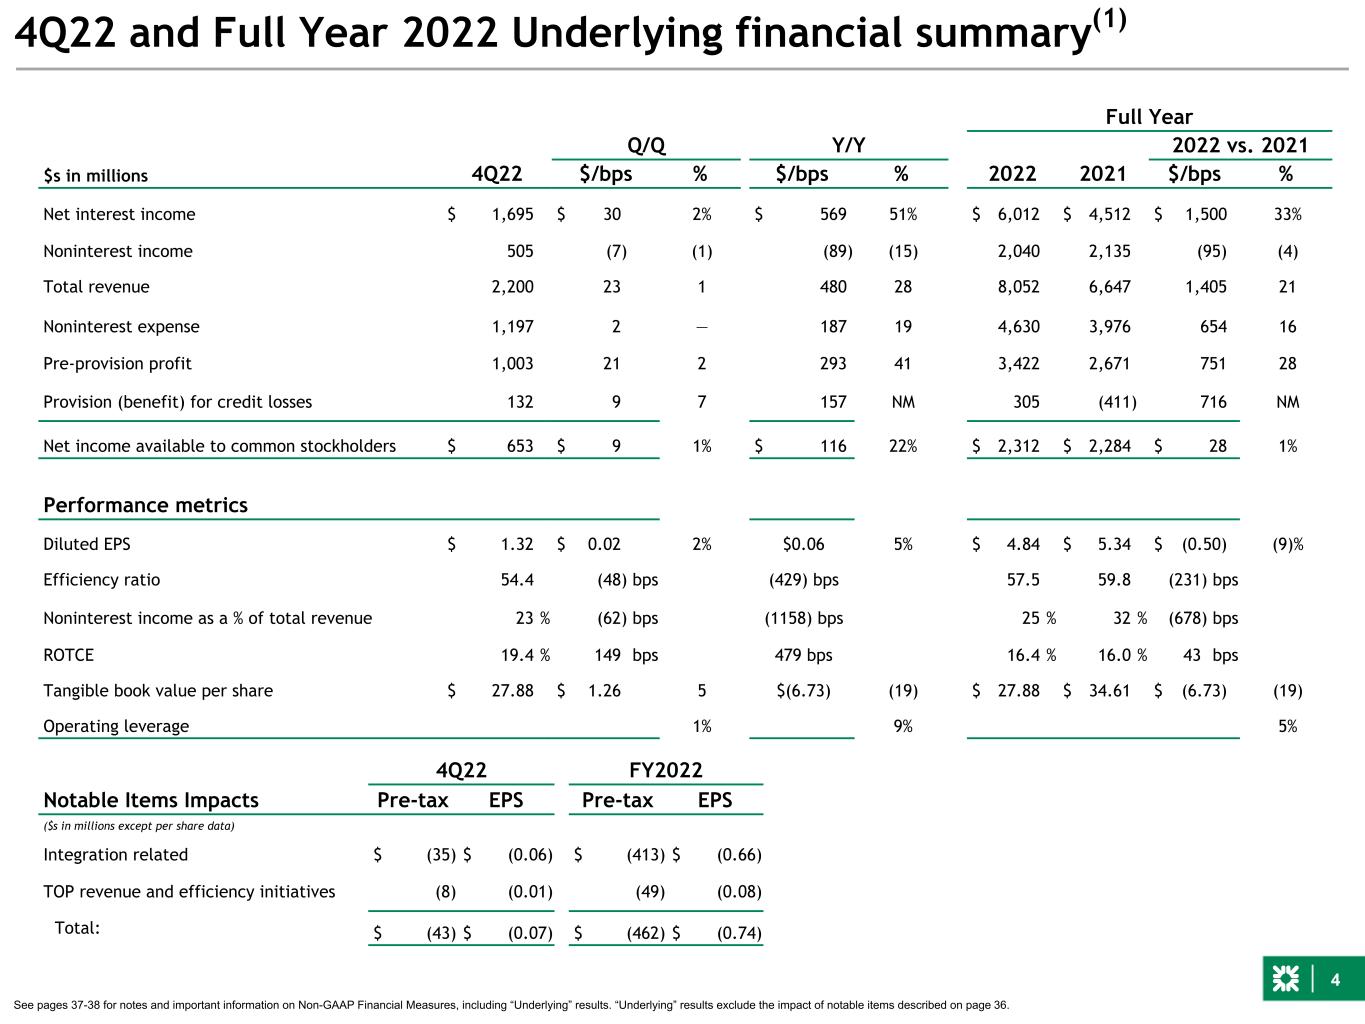
4 4Q22 and Full Year 2022 Underlying financial summary(1) Full Year Q/Q Y/Y 2022 2021 2022 vs. 2021 $s in millions 4Q22 $/bps % $/bps % $/bps % Net interest income $ 1,695 $ 30 2% $ 569 51% $ 6,012 $ 4,512 $ 1,500 33% Noninterest income 505 (7) (1) (89) (15) 2,040 2,135 (95) (4) Total revenue 2,200 23 1 480 28 8,052 6,647 1,405 21 Noninterest expense 1,197 2 — 187 19 4,630 3,976 654 16 Pre-provision profit 1,003 21 2 293 41 3,422 2,671 751 28 Provision (benefit) for credit losses 132 9 7 157 NM 305 (411) 716 NM Net income available to common stockholders $ 653 $ 9 1% $ 116 22% $ 2,312 $ 2,284 $ 28 1% Performance metrics Diluted EPS $ 1.32 $ 0.02 2% $0.06 5% $ 4.84 $ 5.34 $ (0.50) (9)% Efficiency ratio 54.4 (48) bps (429) bps 57.5 59.8 (231) bps Noninterest income as a % of total revenue 23 % (62) bps (1158) bps 25 % 32 % (678) bps ROTCE 19.4 % 149 bps 479 bps 16.4 % 16.0 % 43 bps Tangible book value per share $ 27.88 $ 1.26 5 $(6.73) (19) $ 27.88 $ 34.61 $ (6.73) (19) Operating leverage 1% 9% 5% See pages 37-38 for notes and important information on Non-GAAP Financial Measures, including “Underlying” results. “Underlying” results exclude the impact of notable items described on page 36. 4Q22 FY2022 Notable Items Impacts Pre-tax EPS Pre-tax EPS ($s in millions except per share data) Integration related $ (35) $ (0.06) $ (413) $ (0.66) TOP revenue and efficiency initiatives (8) (0.01) (49) (0.08) Total: $ (43) $ (0.07) $ (462) $ (0.74)

5 Overview(1) See pages 37-38 for notes and important information on Non-GAAP Financial Measures, including “Underlying” results. “Underlying” results exclude the impact of notable items described on page 36. 4Q: Navigating well in a dynamic environment – Underlying EPS of $1.32 and ROTCE of 19.4% – Underlying PPNR of $1.0 billion, up 2% QoQ ▪ NII up 2% QoQ given improved net interest margin, up 5 bps ▪ Fees down 1% QoQ with lower mortgage fees and FX and derivative products, partly offset by improvement in capital markets fees ▪ Expenses well controlled, stable QoQ – Positive Underlying operating leverage QoQ of 1%; Underlying efficiency ratio improves to 54.4% – Period-end and average loans broadly stable, up 1% ex-auto run off; loan yields up 58 bps QoQ – Period-end and average deposits up 1% QoQ; total deposit costs up 49 bps – Provision for credit losses of $132 million and reserve build of $44 million Strong full-year 2022 results – Underlying net income of $2.4 billion, with EPS of $4.84 – Underlying PPNR of $3.4 billion, up 28% – Strong positive operating leverage of 5%; Underlying efficiency ratio improved 231 bps to 57.5% – Underlying ROTCE of 16.4% compares with 16.0% for 2021 Continued strong credit metrics – Prudent risk appetite across retail and commercial; NCOs of 22 bps up 3 bps QoQ; NPLs to loans of 0.60% vs. 0.55% at 3Q22 – Allowance for credit losses coverage ratio of 1.43% up 2 bps QoQ; compares with proforma day-1 CECL reserve of ~1.30% Strong capital, liquidity and funding – Strong CET1 ratio at upper end of target range at 10.0%(2) – Period-end LDR ratio of 87% – Asset sensitivity of 2.7% compares with 3.3% in 3Q22 – TBV/share of $27.88, up 5% QoQ
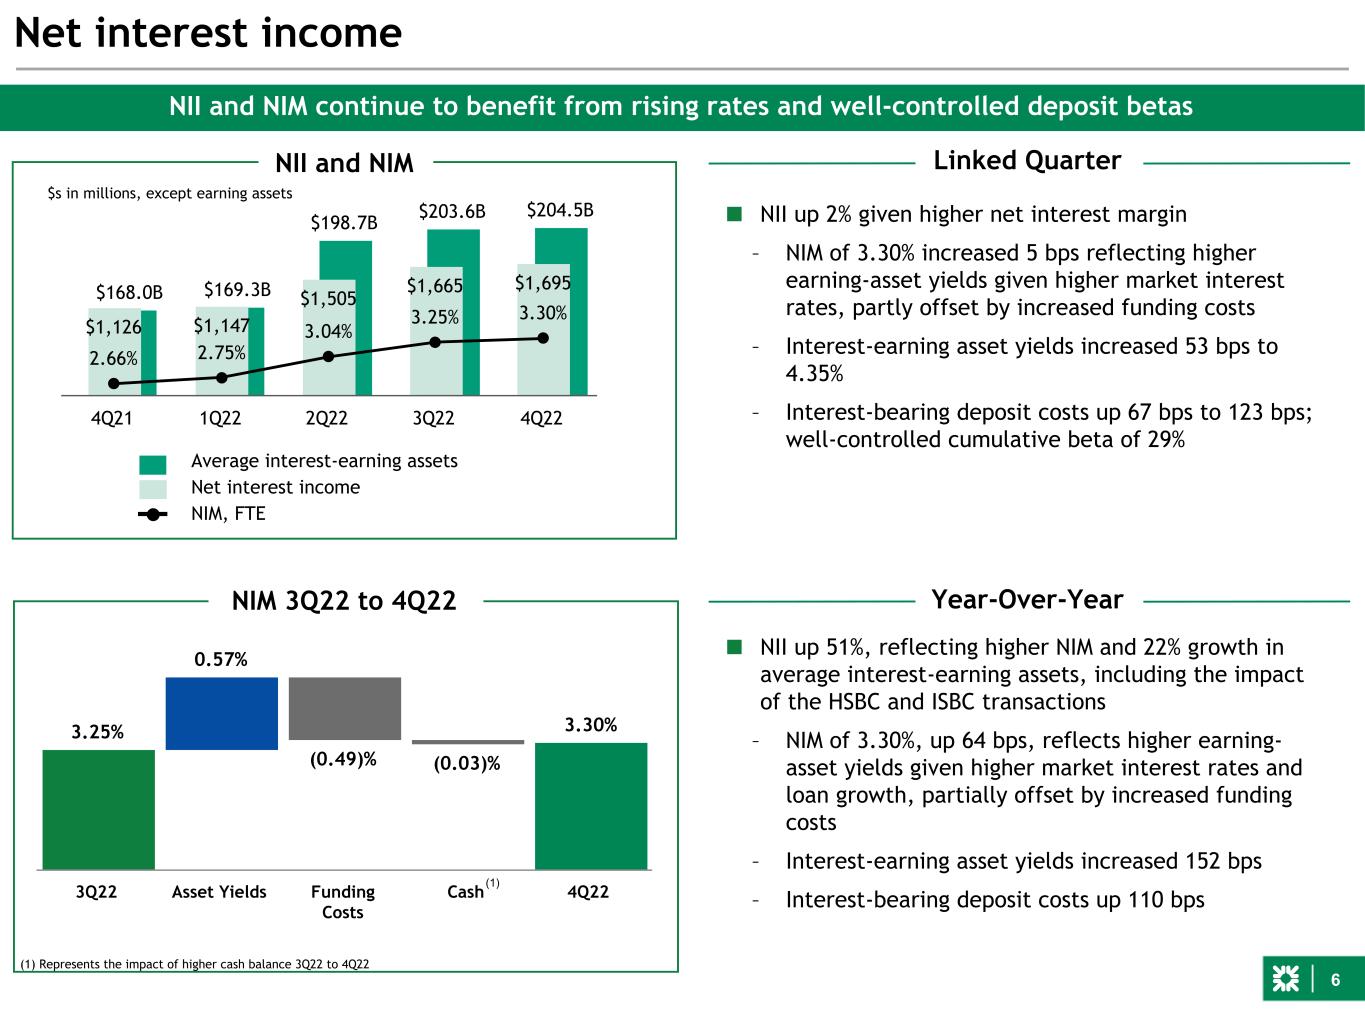
6 3.25% 0.57% (0.49)% (0.03)% 3.30% 3Q22 Asset Yields Funding Costs Cash 4Q22 $168.0B $169.3B $198.7B $203.6B $204.5B $1,126 $1,147 $1,505 $1,665 $1,695 2.66% 2.75% 3.04% 3.25% 3.30% 4Q21 1Q22 2Q22 3Q22 4Q22 ■ NII up 2% given higher net interest margin – NIM of 3.30% increased 5 bps reflecting higher earning-asset yields given higher market interest rates, partly offset by increased funding costs – Interest-earning asset yields increased 53 bps to 4.35% – Interest-bearing deposit costs up 67 bps to 123 bps; well-controlled cumulative beta of 29% Net interest income $s in millions, except earning assets NII and NIM Average interest-earning assets Net interest income NIM, FTE NII and NIM continue to benefit from rising rates and well-controlled deposit betas ■ NII up 51%, reflecting higher NIM and 22% growth in average interest-earning assets, including the impact of the HSBC and ISBC transactions – NIM of 3.30%, up 64 bps, reflects higher earning- asset yields given higher market interest rates and loan growth, partially offset by increased funding costs – Interest-earning asset yields increased 152 bps – Interest-bearing deposit costs up 110 bps NIM 3Q22 to 4Q22 Year-Over-Year Linked Quarter (1) (1) Represents the impact of higher cash balance 3Q22 to 4Q22
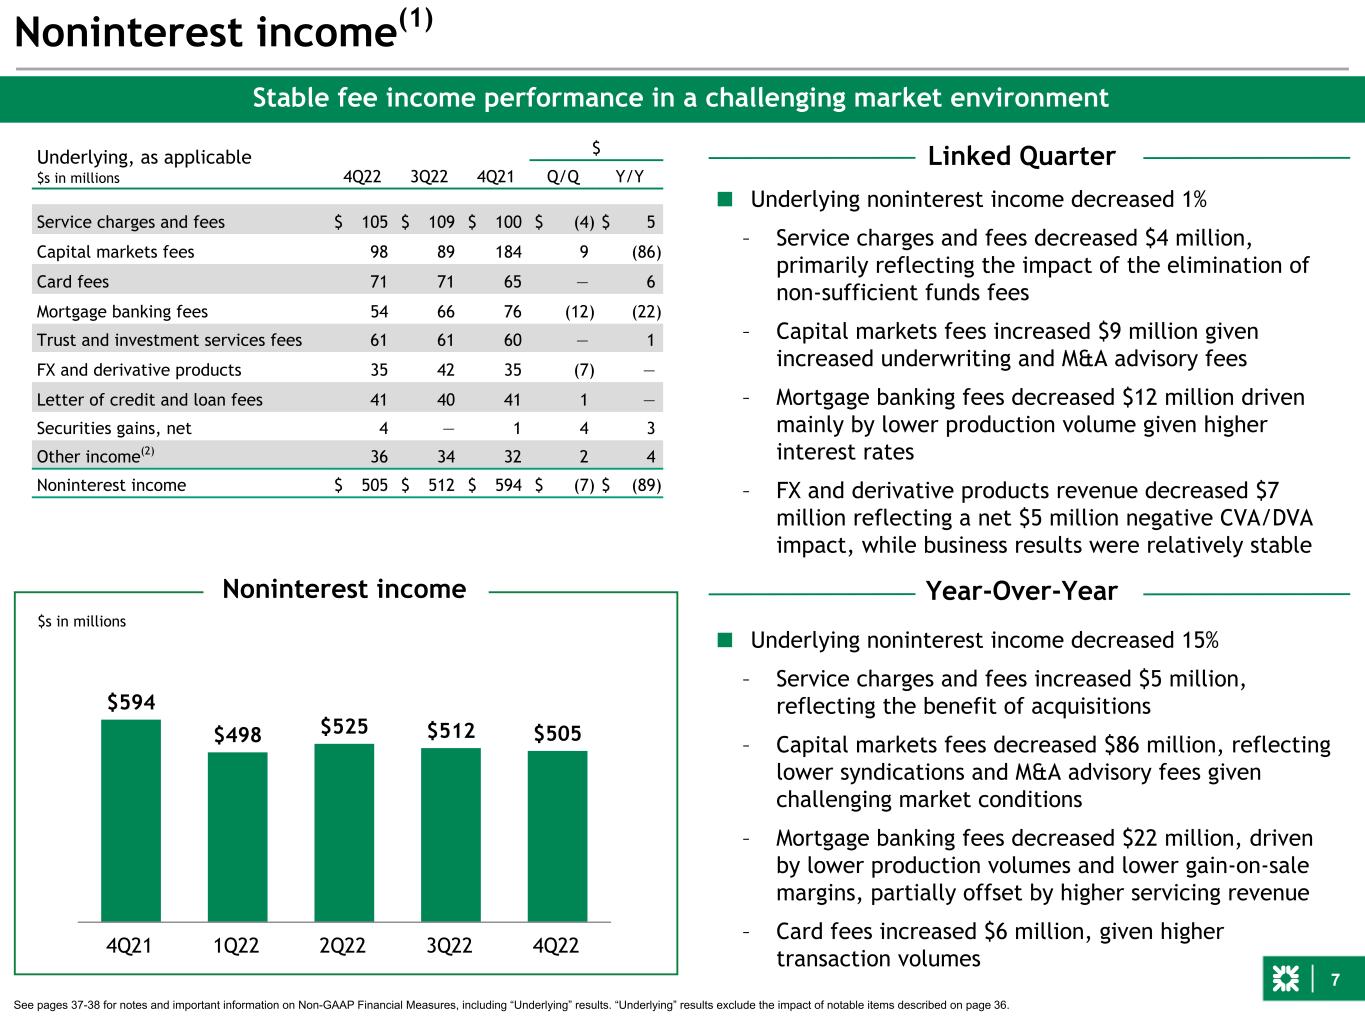
7 ■ Underlying noninterest income decreased 15% – Service charges and fees increased $5 million, reflecting the benefit of acquisitions – Capital markets fees decreased $86 million, reflecting lower syndications and M&A advisory fees given challenging market conditions – Mortgage banking fees decreased $22 million, driven by lower production volumes and lower gain-on-sale margins, partially offset by higher servicing revenue – Card fees increased $6 million, given higher transaction volumes $594 $498 $525 $512 $505 4Q21 1Q22 2Q22 3Q22 4Q22 Noninterest income(1) $s in millions ■ Underlying noninterest income decreased 1% – Service charges and fees decreased $4 million, primarily reflecting the impact of the elimination of non-sufficient funds fees – Capital markets fees increased $9 million given increased underwriting and M&A advisory fees – Mortgage banking fees decreased $12 million driven mainly by lower production volume given higher interest rates – FX and derivative products revenue decreased $7 million reflecting a net $5 million negative CVA/DVA impact, while business results were relatively stable Stable fee income performance in a challenging market environment See pages 37-38 for notes and important information on Non-GAAP Financial Measures, including “Underlying” results. “Underlying” results exclude the impact of notable items described on page 36. Underlying, as applicable $s in millions 4Q22 3Q22 4Q21 $ Q/Q Y/Y Service charges and fees $ 105 $ 109 $ 100 $ (4) $ 5 Capital markets fees 98 89 184 9 (86) Card fees 71 71 65 — 6 Mortgage banking fees 54 66 76 (12) (22) Trust and investment services fees 61 61 60 — 1 FX and derivative products 35 42 35 (7) — Letter of credit and loan fees 41 40 41 1 — Securities gains, net 4 — 1 4 3 Other income(2) 36 34 32 2 4 Noninterest income $ 505 $ 512 $ 594 $ (7) $ (89) Linked Quarter Year-Over-YearNoninterest income

8 58.7% 64.3% 58.2% 54.9% 54.4% 4Q21 1Q22 2Q22 3Q22 4Q22 Underlying, as applicable 4Q22 3Q22 4Q21 $ $s in millions Q/Q Y/Y Salaries & employee benefits $ 618 $ 622 $ 546 $ (4) $ 72 Outside services 153 152 138 1 15 Equipment & software 168 159 144 9 24 Occupancy 108 104 81 4 27 Other operating expense 150 158 101 (8) 49 Noninterest expense $ 1,197 $ 1,195 $ 1,010 $ 2 $ 187 Full-time equivalents (FTEs) 18,889 19,235 17,463 (346) 1,426 Noninterest expense(1) ■ Underlying noninterest expense broadly stable – Reflects modest increases in equipment and software and occupancy, largely offset by lower salaries and employee benefits and lower FDIC insurance – Results reflect strong expense discipline and the benefit of efficiency initiatives ■ Underlying noninterest expense increased 4% excluding HSBC/ISBC and the Commercial fee-based acquisitions that closed after 2Q21 – Reflects increased equipment and software expense, as well as higher other operating expenses, primarily advertising, FDIC insurance and travel costs, partially offset by the benefit of efficiency initiatives See pages 37-38 for notes and important information on Non-GAAP Financial Measures, including “Underlying” results. “Underlying” results exclude the impact of notable items described on page 36. Underlying efficiency ratio Well-controlled expenses drive 1% positive operating leverage and a 54.4% efficiency ratio Linked Quarter Year-Over-Year
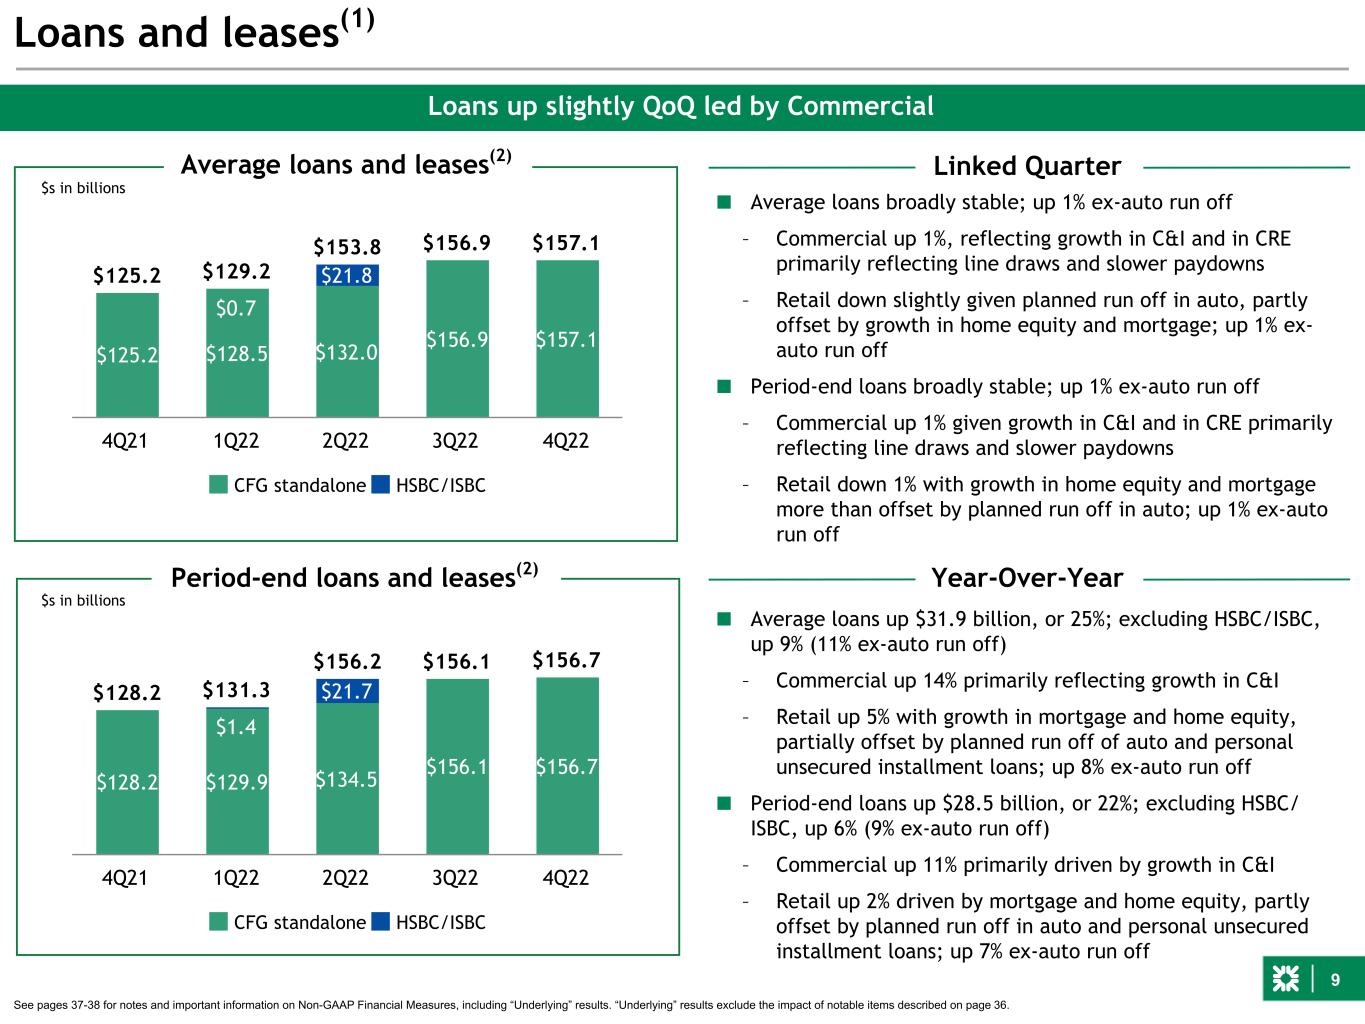
9 ■ Average loans broadly stable; up 1% ex-auto run off – Commercial up 1%, reflecting growth in C&I and in CRE primarily reflecting line draws and slower paydowns – Retail down slightly given planned run off in auto, partly offset by growth in home equity and mortgage; up 1% ex- auto run off ■ Period-end loans broadly stable; up 1% ex-auto run off – Commercial up 1% given growth in C&I and in CRE primarily reflecting line draws and slower paydowns – Retail down 1% with growth in home equity and mortgage more than offset by planned run off in auto; up 1% ex-auto run off $125.2 $156.9 $157.1 $129.2 $153.8 $125.2 $128.5 $132.0 $156.9 $157.1 $0.7 $21.8 CFG standalone HSBC/ISBC 4Q21 1Q22 2Q22 3Q22 4Q22 Loans and leases(1) $s in billions Loans up slightly QoQ led by Commercial ■ Average loans up $31.9 billion, or 25%; excluding HSBC/ISBC, up 9% (11% ex-auto run off) – Commercial up 14% primarily reflecting growth in C&I – Retail up 5% with growth in mortgage and home equity, partially offset by planned run off of auto and personal unsecured installment loans; up 8% ex-auto run off ■ Period-end loans up $28.5 billion, or 22%; excluding HSBC/ ISBC, up 6% (9% ex-auto run off) – Commercial up 11% primarily driven by growth in C&I – Retail up 2% driven by mortgage and home equity, partly offset by planned run off in auto and personal unsecured installment loans; up 7% ex-auto run off Average loans and leases(2) $128.2 $156.1 $156.7 $131.3 $156.2 $128.2 $129.9 $134.5 $156.1 $156.7 $1.4 $21.7 CFG standalone HSBC/ISBC 4Q21 1Q22 2Q22 3Q22 4Q22 $s in billions Period-end loans and leases(2) See pages 37-38 for notes and important information on Non-GAAP Financial Measures, including “Underlying” results. “Underlying” results exclude the impact of notable items described on page 36. Linked Quarter Year-Over-Year
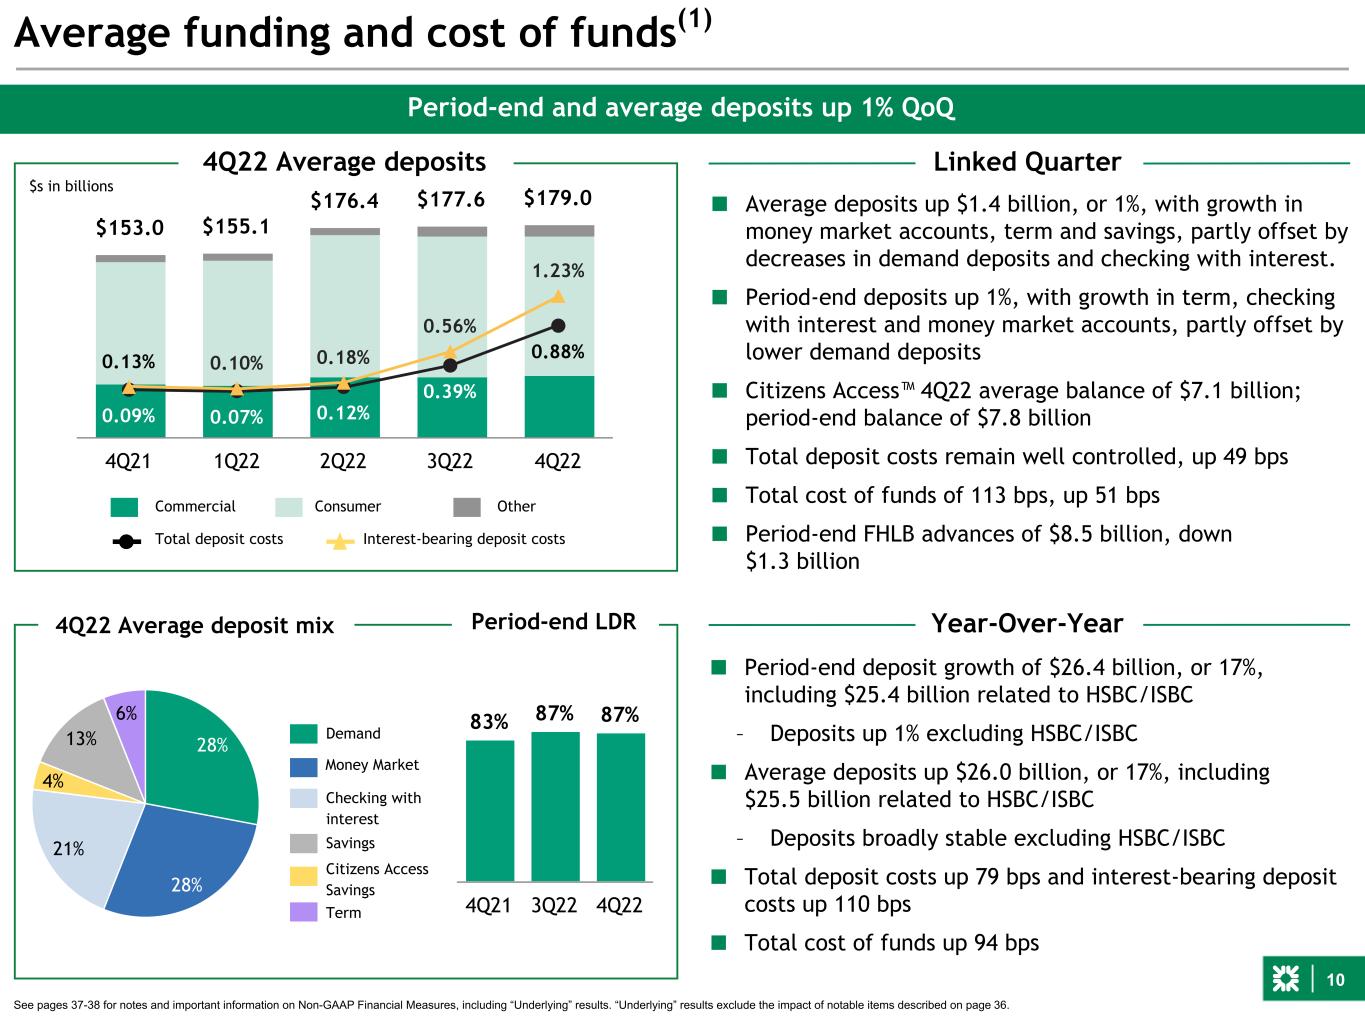
10 $153.0 $155.1 $176.4 $177.6 $179.0 4Q21 1Q22 2Q22 3Q22 4Q22 Average funding and cost of funds(1) Period-end and average deposits up 1% QoQ $s in billions 4Q22 Average deposits See pages 37-38 for notes and important information on Non-GAAP Financial Measures, including “Underlying” results. “Underlying” results exclude the impact of notable items described on page 36. 0.09% 0.07% 0.12% 0.39% 0.88%0.13% 0.10% 0.18% 0.56% 1.23% Total deposit costs Interest-bearing deposit costs Commercial Consumer Other ■ Average deposits up $1.4 billion, or 1%, with growth in money market accounts, term and savings, partly offset by decreases in demand deposits and checking with interest. ■ Period-end deposits up 1%, with growth in term, checking with interest and money market accounts, partly offset by lower demand deposits ■ Citizens Access™ 4Q22 average balance of $7.1 billion; period-end balance of $7.8 billion ■ Total deposit costs remain well controlled, up 49 bps ■ Total cost of funds of 113 bps, up 51 bps ■ Period-end FHLB advances of $8.5 billion, down $1.3 billion ■ Period-end deposit growth of $26.4 billion, or 17%, including $25.4 billion related to HSBC/ISBC – Deposits up 1% excluding HSBC/ISBC ■ Average deposits up $26.0 billion, or 17%, including $25.5 billion related to HSBC/ISBC – Deposits broadly stable excluding HSBC/ISBC ■ Total deposit costs up 79 bps and interest-bearing deposit costs up 110 bps ■ Total cost of funds up 94 bps 83% 87% 87% 4Q21 3Q22 4Q22 Linked Quarter Period-end LDR Year-Over-Year4Q22 Average deposit mix 28% 28% 21% 4% 13% 6% Demand Checking with interest Citizens Access Savings Savings Money Market Term
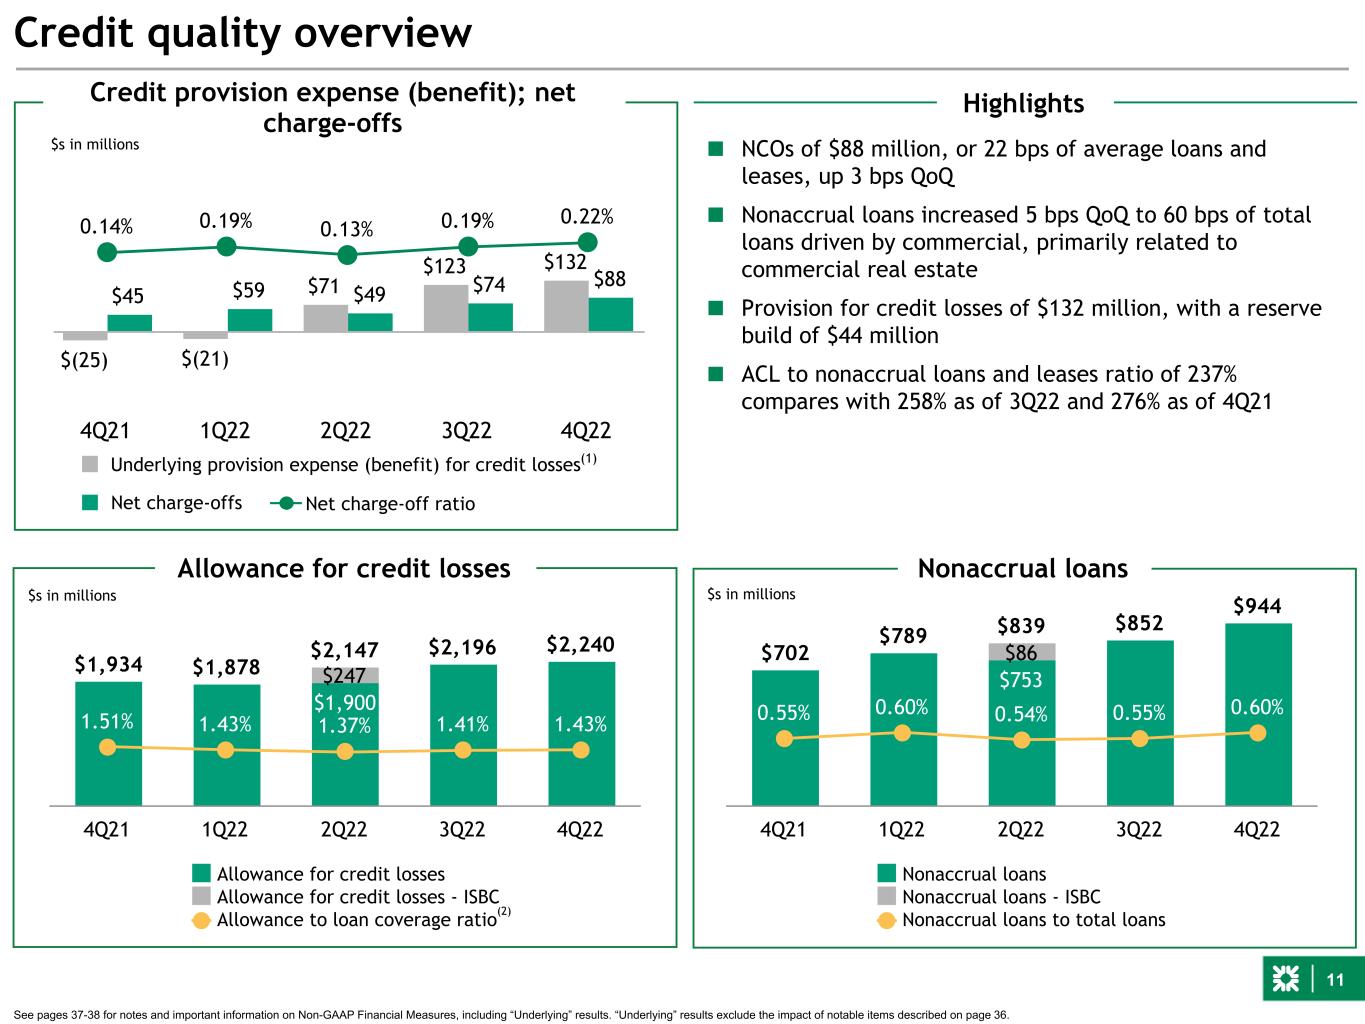
11 ■ NCOs of $88 million, or 22 bps of average loans and leases, up 3 bps QoQ ■ Nonaccrual loans increased 5 bps QoQ to 60 bps of total loans driven by commercial, primarily related to commercial real estate ■ Provision for credit losses of $132 million, with a reserve build of $44 million ■ ACL to nonaccrual loans and leases ratio of 237% compares with 258% as of 3Q22 and 276% as of 4Q21 $(25) $(21) $71 $123 $132 $45 $59 $49 $74 $88 0.14% 0.19% 0.13% 0.19% 0.22% 4Q21 1Q22 2Q22 3Q22 4Q22 Highlights Credit quality overview $s in millions $s in millions See pages 37-38 for notes and important information on Non-GAAP Financial Measures, including “Underlying” results. “Underlying” results exclude the impact of notable items described on page 36. Credit provision expense (benefit); net charge-offs Nonaccrual loans $s in millions Allowance for credit losses (2) Underlying provision expense (benefit) for credit losses Net charge-offs Net charge-off ratio (1) $702 $789 $852 $944 $839 $753 $86 0.55% 0.60% 0.54% 0.55% 0.60% Nonaccrual loans Nonaccrual loans - ISBC Nonaccrual loans to total loans 4Q21 1Q22 2Q22 3Q22 4Q22 $1,934 $1,878 $2,196 $2,240$2,147 $1,900 $247 1.51% 1.43% 1.37% 1.41% 1.43% Allowance for credit losses Allowance for credit losses - ISBC Allowance to loan coverage ratio 4Q21 1Q22 2Q22 3Q22 4Q22

12 3Q22 4Q22 Retail 1.33% 1.31% Commercial 1.48% 1.54% C&I 1.36% 1.36% CRE 1.69% 1.86% Leasing 1.86% 1.59% Total 1.41% 1.43% $2,196 $(19) $63 $2,240 3Q22 Portfolio changes Economic and qualitative factors 4Q22 Allowance for credit losses ■ The increase in the ACL reserve coverage to 1.43% primarily reflects higher reserves against CRE exposures ■ The key macroeconomic assumptions reflect a moderate recession over the two-year reasonable and supportable period: – Peak unemployment of ~6% and peak-to-trough GDP decline of ~1.5% – Collateral value peak-to-trough declines: ▪ Home price index ~13% ▪ Used cars and trucks ~16% ■ Additionally, qualitative factors are incorporated in the allowance framework to account for other considerations ■ Additional detail on the CRE portfolio is provided in the appendix on page 32 Note: Portfolio Changes represent run off, changes in credit quality, aging of existing portfolio and utilization changes. Economic/Qualitative changes represent changes to macroeconomic variables and qualitative factors, including management overlays. $s in millions CommentaryAllowance for credit losses ACL coverage ratio

13 ■ 4Q22 CET1 ratio of 10.0% compares with 9.8% in 3Q22 ■ TBV/share of $27.88, up 4.7% QoQ; tangible common equity ratio of 6.3%, up 20 bps QoQ – HTM securities designation of ~30% at quarter end ■ Paid $208 million in common dividends to shareholders in 4Q22 ■ Repurchased $150 million of common stock in 4Q22 – Remaining Board authorized capacity of $850 million at December 31, 2022 Capital remains strong $s in billions (period-end) 4Q21 1Q22 2Q22 3Q22 4Q22 Basel III basis(1)(2) Common equity tier 1 capital $ 15.7 $ 15.6 $ 17.9 $ 18.3 $ 18.6 Risk-weighted assets $ 158.8 $ 161.9 $ 187.7 $ 187.2 $ 185.2 Common equity tier 1 ratio 9.9 % 9.7 % 9.6 % 9.8 % 10.0 % Tier 1 capital ratio 11.1 % 10.9 % 10.6 % 10.9 % 11.1 % Total capital ratio 12.7 % 12.5 % 12.3 % 12.6 % 12.8 % Tangible common equity ratio 8.1 % 7.1 % 6.6 % 6.1 % 6.3 % See pages 37-38 for notes and important information on Non-GAAP Financial Measures, including “Underlying” results. “Underlying” results exclude the impact of notable items described on page 36. TBV/share CET1 $ % 3Q22 9.8 % $26.62 Net Income 0.35 1.33 5.0 % Common and preferred dividends (0.12) (0.50) (1.9) % RWA decrease 0.10 Treasury stock (0.08) (0.10) (0.4) % Goodwill and intangibles (0.01) (0.03) (0.1) % AOCI — 0.53 2.0 % Other 0.01 0.03 0.1 % Total change 0.25 1.26 4.7 % 4Q22 10.0 % $27.88 CET1 ratio remains strong(3) Highlights
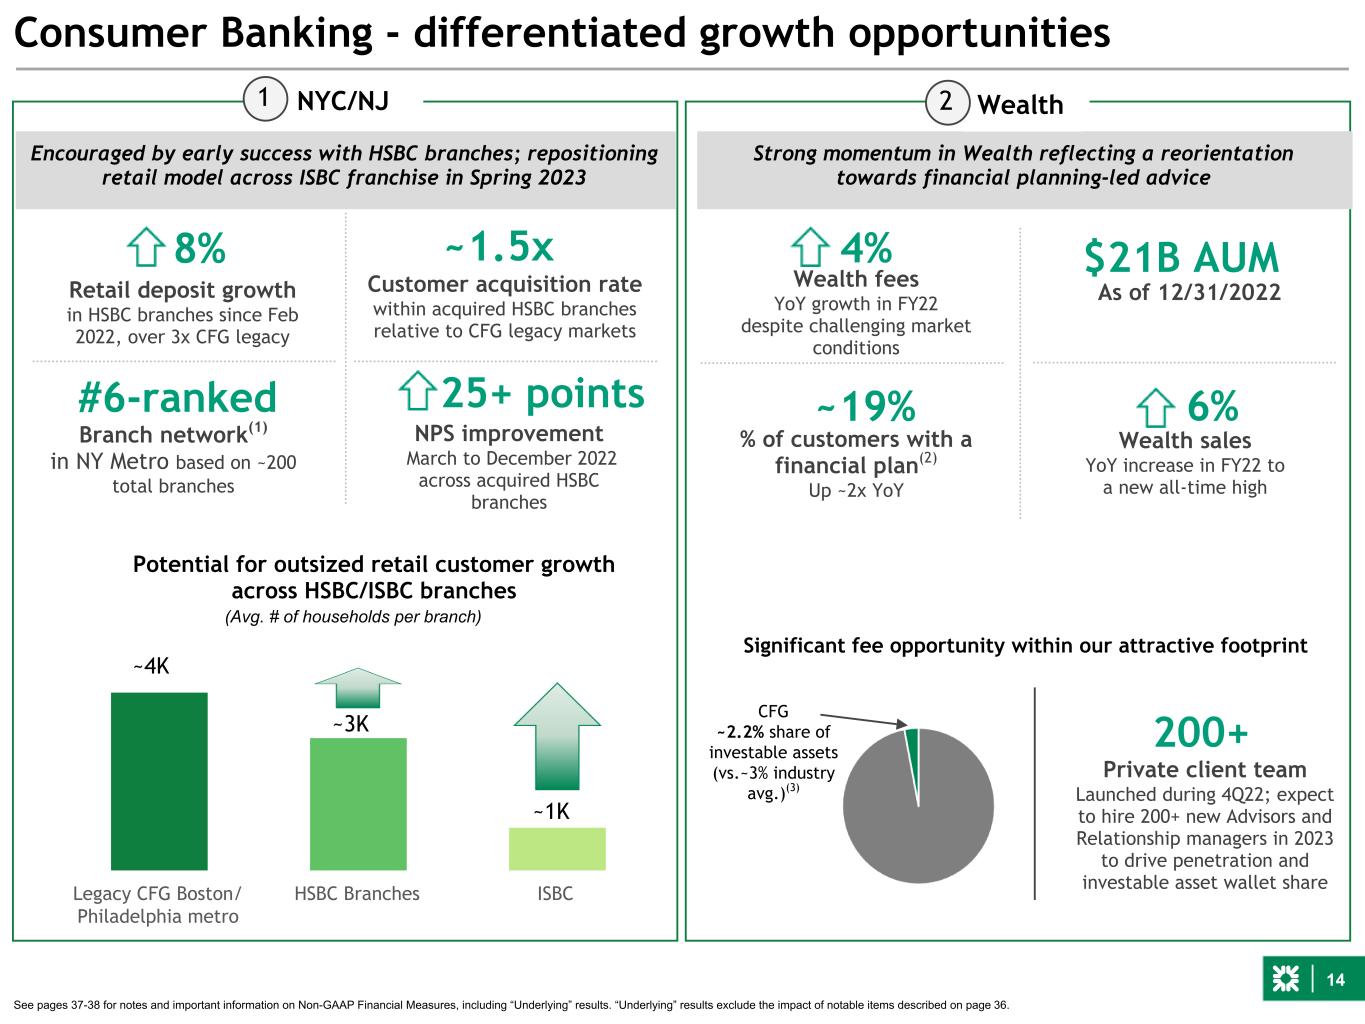
14 Legacy CFG Boston/ Philadelphia metro HSBC Branches ISBC Consumer Banking - differentiated growth opportunities NYC/NJ Potential for outsized retail customer growth across HSBC/ISBC branches (Avg. # of households per branch) 1 ~4K ~1K ~3K Encouraged by early success with HSBC branches; repositioning retail model across ISBC franchise in Spring 2023 Retail deposit growth in HSBC branches since Feb 2022, over 3x CFG legacy 8% ~1.5x Customer acquisition rate within acquired HSBC branches relative to CFG legacy markets #6-ranked 25+ points NPS improvement March to December 2022 across acquired HSBC branches Branch network(1) in NY Metro based on ~200 total branches Strong momentum in Wealth reflecting a reorientation towards financial planning-led advice Significant fee opportunity within our attractive footprint Wealth2 CFG ~2.2% share of investable assets (vs.~3% industry avg.)(3) 4% Wealth fees YoY growth in FY22 despite challenging market conditions 6% Wealth sales YoY increase in FY22 to a new all-time high 200+ Private client team Launched during 4Q22; expect to hire 200+ new Advisors and Relationship managers in 2023 to drive penetration and investable asset wallet share ~19% % of customers with a financial plan(2) Up ~2x YoY As of 12/31/2022 $21B AUM See pages 37-38 for notes and important information on Non-GAAP Financial Measures, including “Underlying” results. “Underlying” results exclude the impact of notable items described on page 36.
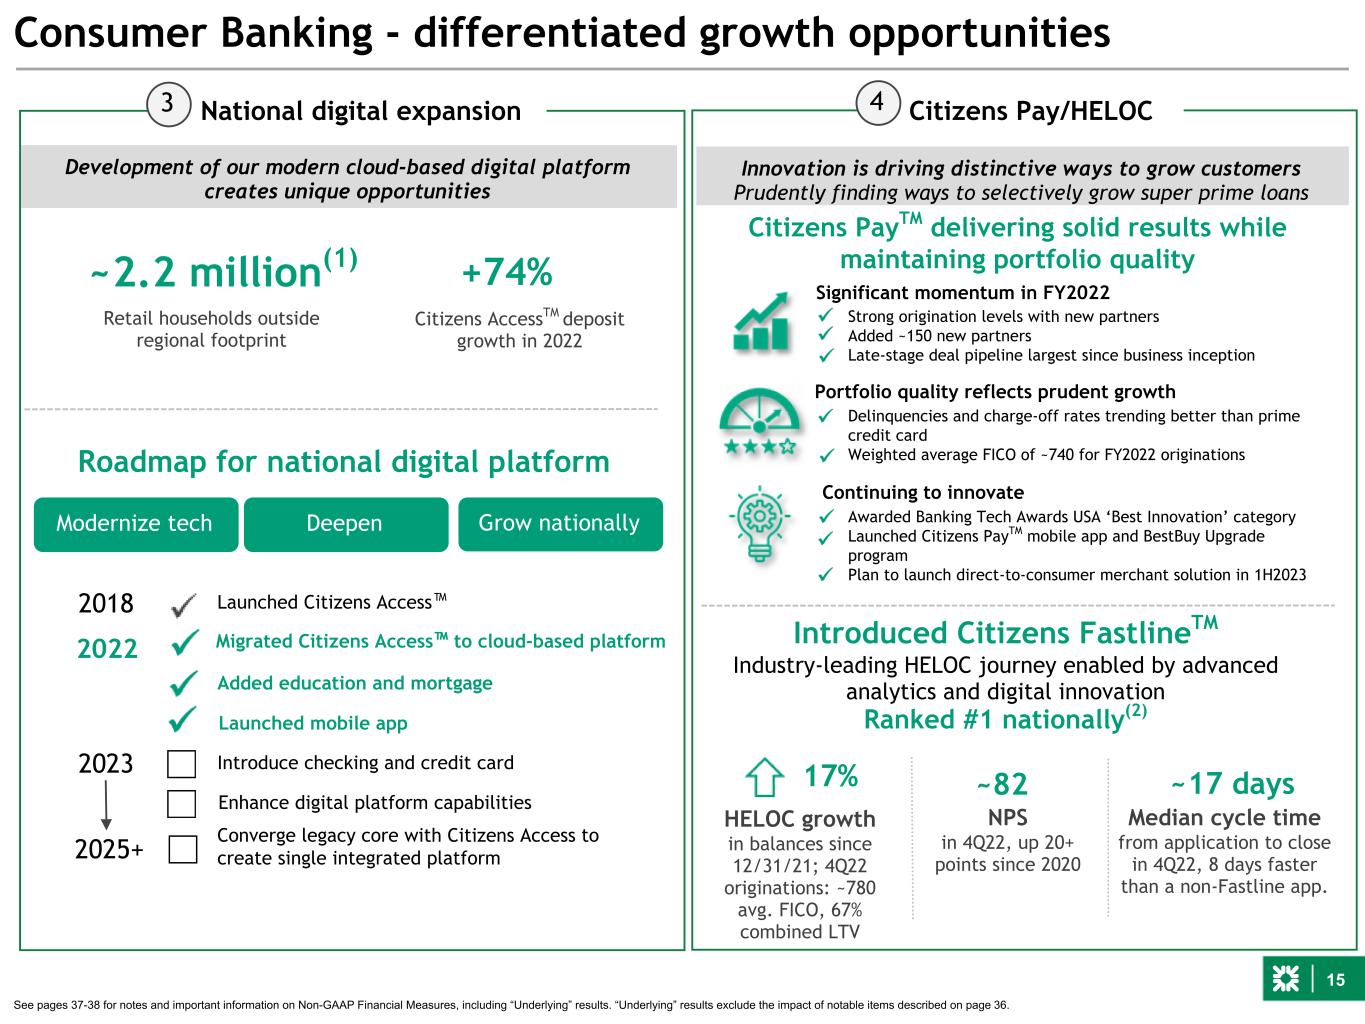
15 Consumer Banking - differentiated growth opportunities Citizens Pay/HELOCNational digital expansion 2018 2022 2023 2025+ Converge legacy core with Citizens Access to create single integrated platform Launched Citizens Access™ Migrated Citizens Access™ to cloud-based platform 3 4 Added education and mortgage Roadmap for national digital platform Introduce checking and credit card Enhance digital platform capabilities Development of our modern cloud-based digital platform creates unique opportunities Launched mobile app Retail households outside regional footprint ~2.2 million(1) +74% Citizens AccessTM deposit growth in 2022 Innovation is driving distinctive ways to grow customers Prudently finding ways to selectively grow super prime loans Introduced Citizens FastlineTM Industry-leading HELOC journey enabled by advanced analytics and digital innovation Ranked #1 nationally(2) 17% ~82 ~17 days HELOC growth in balances since 12/31/21; 4Q22 originations: ~780 avg. FICO, 67% combined LTV NPS in 4Q22, up 20+ points since 2020 Median cycle time from application to close in 4Q22, 8 days faster than a non-Fastline app. Modernize tech Deepen Grow nationally Citizens PayTM delivering solid results while maintaining portfolio quality Significant momentum in FY2022 Strong origination levels with new partners Added ~150 new partners Late-stage deal pipeline largest since business inception Delinquencies and charge-off rates trending better than prime credit card Weighted average FICO of ~740 for FY2022 originations Awarded Banking Tech Awards USA ‘Best Innovation’ category Launched Citizens PayTM mobile app and BestBuy Upgrade program Plan to launch direct-to-consumer merchant solution in 1H2023 Continuing to innovate Portfolio quality reflects prudent growth See pages 37-38 for notes and important information on Non-GAAP Financial Measures, including “Underlying” results. “Underlying” results exclude the impact of notable items described on page 36.
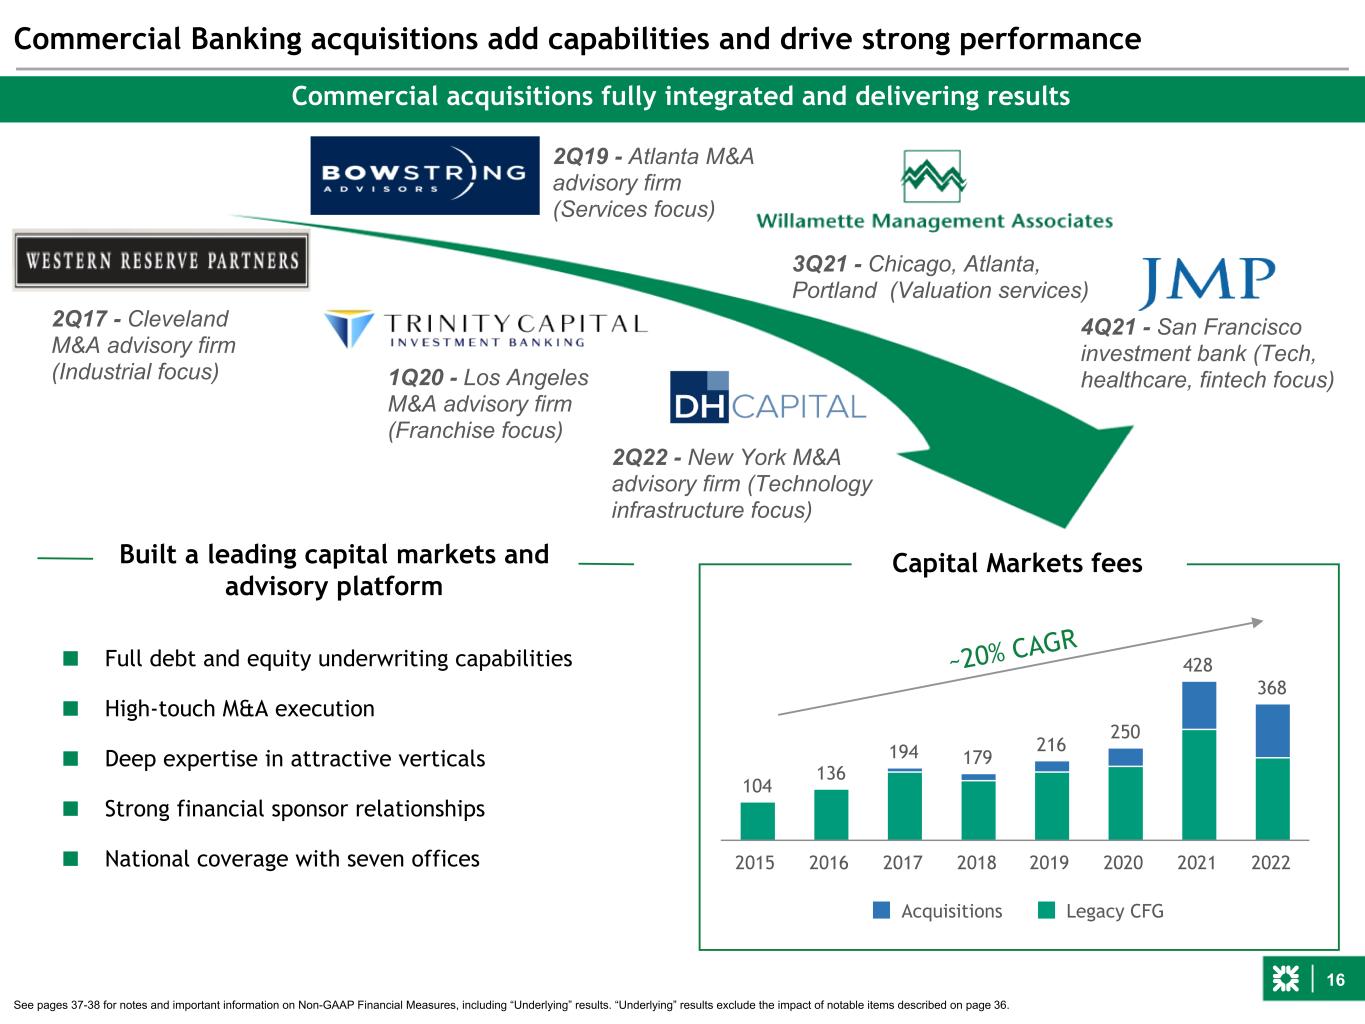
16 Commercial Banking acquisitions add capabilities and drive strong performance Commercial acquisitions fully integrated and delivering results 2Q19 - Atlanta M&A advisory firm (Services focus) 1Q20 - Los Angeles M&A advisory firm (Franchise focus) 3Q21 - Chicago, Atlanta, Portland (Valuation services) 4Q21 - San Francisco investment bank (Tech, healthcare, fintech focus) 2Q22 - New York M&A advisory firm (Technology infrastructure focus) ■ Full debt and equity underwriting capabilities ■ High-touch M&A execution ■ Deep expertise in attractive verticals ■ Strong financial sponsor relationships ■ National coverage with seven offices Built a leading capital markets and advisory platform 104 136 194 179 216 250 428 368 Acquisitions Legacy CFG 2015 2016 2017 2018 2019 2020 2021 2022 ~20% CAGR Capital Markets fees 2Q17 - Cleveland M&A advisory firm (Industrial focus) See pages 37-38 for notes and important information on Non-GAAP Financial Measures, including “Underlying” results. “Underlying” results exclude the impact of notable items described on page 36.

17 Citizens Commercial Banking delivers a full-service suite of capabilities ■ Delivering Debt Capital Markets platform to advisory clients ■ Focusing on private equity sponsors through advisory, subscription finance, LBOs, public market capital ■ Deepening relationships with enhanced Treasury Solutions, Global Markets capabilities ■ Growing mid-corporate client base through geographic expansion into NY Metro, Southeast, Texas, California Financial Services Aerospace, Defense and Government Services Industrials Business Services HealthcareConsumer Food & Restaurants Gaming, Lodging and Leisure Transportation and Logistics Expertise in attractive verticals Broad capabilities and strong execution Technology Multiple avenues for revenue synergies

18 Enterprise and business initiatives ■ Mature agile delivery model and strengthen end-to- end customer journeys and platforms ■ Streamline product originations and reduce fulfillment costs ■ Vendor cost management ■ Continue to optimize branch network ■ Organization simplification Technology initiatives ■ Implementation of overall infrastructure strategy, including data center closures, migration to the cloud, network transformation, and organization rationalization ■ Continue to rationalize applications and standardize technology platforms ■ Begin initiative to converge fragmented legacy platforms to an integrated modern banking platform TOP 7 achieved pre-tax run-rate benefit of ~$115 million as of YE2022 Revenue Efficiencies and tax 2014 TOP 1 2015 TOP 2 2016 TOP 3 2017 TOP 4 2018 TOP 5 2019- 2021 TOP 6 2022 TOP 7 2023 TOP 8 ~$200 TOP programs drive improving financial performance Transforming how we operate and deliver for customers and colleagues TOP program benefits TOP 8 program targeting ~$100MM pre-tax run-rate benefit by YE2023 Launched new TOP 8 program $s in millions ~$140 ~$115 ~$115 ~$105 ~$425 ~$115 ~$100 Select examples
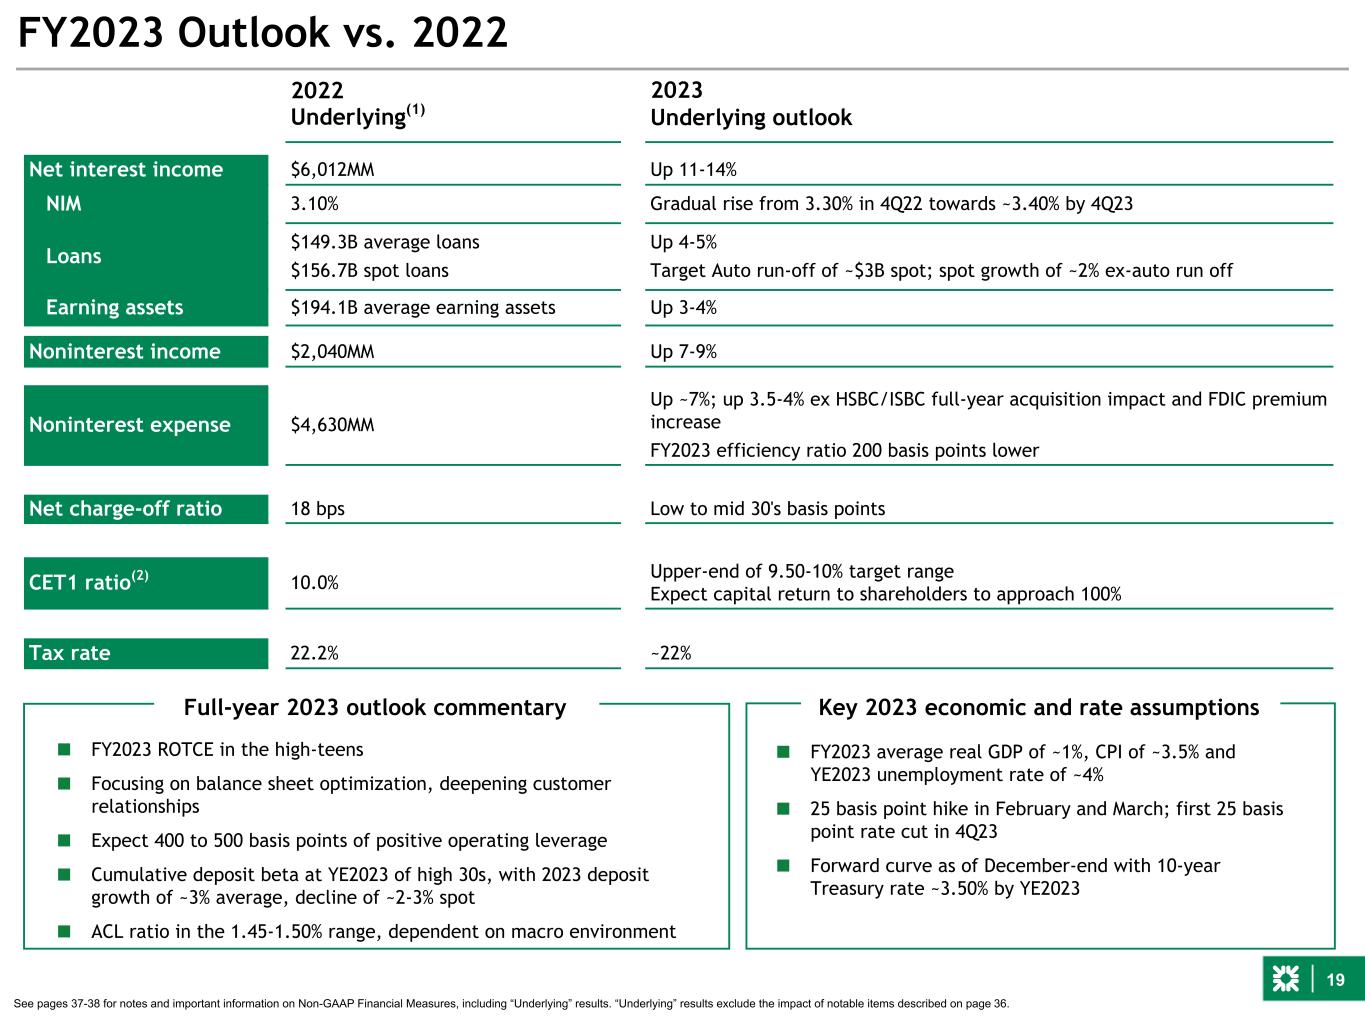
19 FY2023 Outlook vs. 2022 See pages 37-38 for notes and important information on Non-GAAP Financial Measures, including “Underlying” results. “Underlying” results exclude the impact of notable items described on page 36. 2022 Underlying(1) 2023 Underlying outlook Net interest income $6,012MM Up 11-14% NIM 3.10% Gradual rise from 3.30% in 4Q22 towards ~3.40% by 4Q23 Loans $149.3B average loans $156.7B spot loans Up 4-5% Target Auto run-off of ~$3B spot; spot growth of ~2% ex-auto run off Earning assets $194.1B average earning assets Up 3-4% Noninterest income $2,040MM Up 7-9% Noninterest expense $4,630MM Up ~7%; up 3.5-4% ex HSBC/ISBC full-year acquisition impact and FDIC premium increase FY2023 efficiency ratio 200 basis points lower Net charge-off ratio 18 bps Low to mid 30's basis points CET1 ratio(2) 10.0% Upper-end of 9.50-10% target range Expect capital return to shareholders to approach 100% Tax rate 22.2% ~22% ■ FY2023 average real GDP of ~1%, CPI of ~3.5% and YE2023 unemployment rate of ~4% ■ 25 basis point hike in February and March; first 25 basis point rate cut in 4Q23 ■ Forward curve as of December-end with 10-year Treasury rate ~3.50% by YE2023 ■ FY2023 ROTCE in the high-teens ■ Focusing on balance sheet optimization, deepening customer relationships ■ Expect 400 to 500 basis points of positive operating leverage ■ Cumulative deposit beta at YE2023 of high 30s, with 2023 deposit growth of ~3% average, decline of ~2-3% spot ■ ACL ratio in the 1.45-1.50% range, dependent on macro environment Full-year 2023 outlook commentary Key 2023 economic and rate assumptions
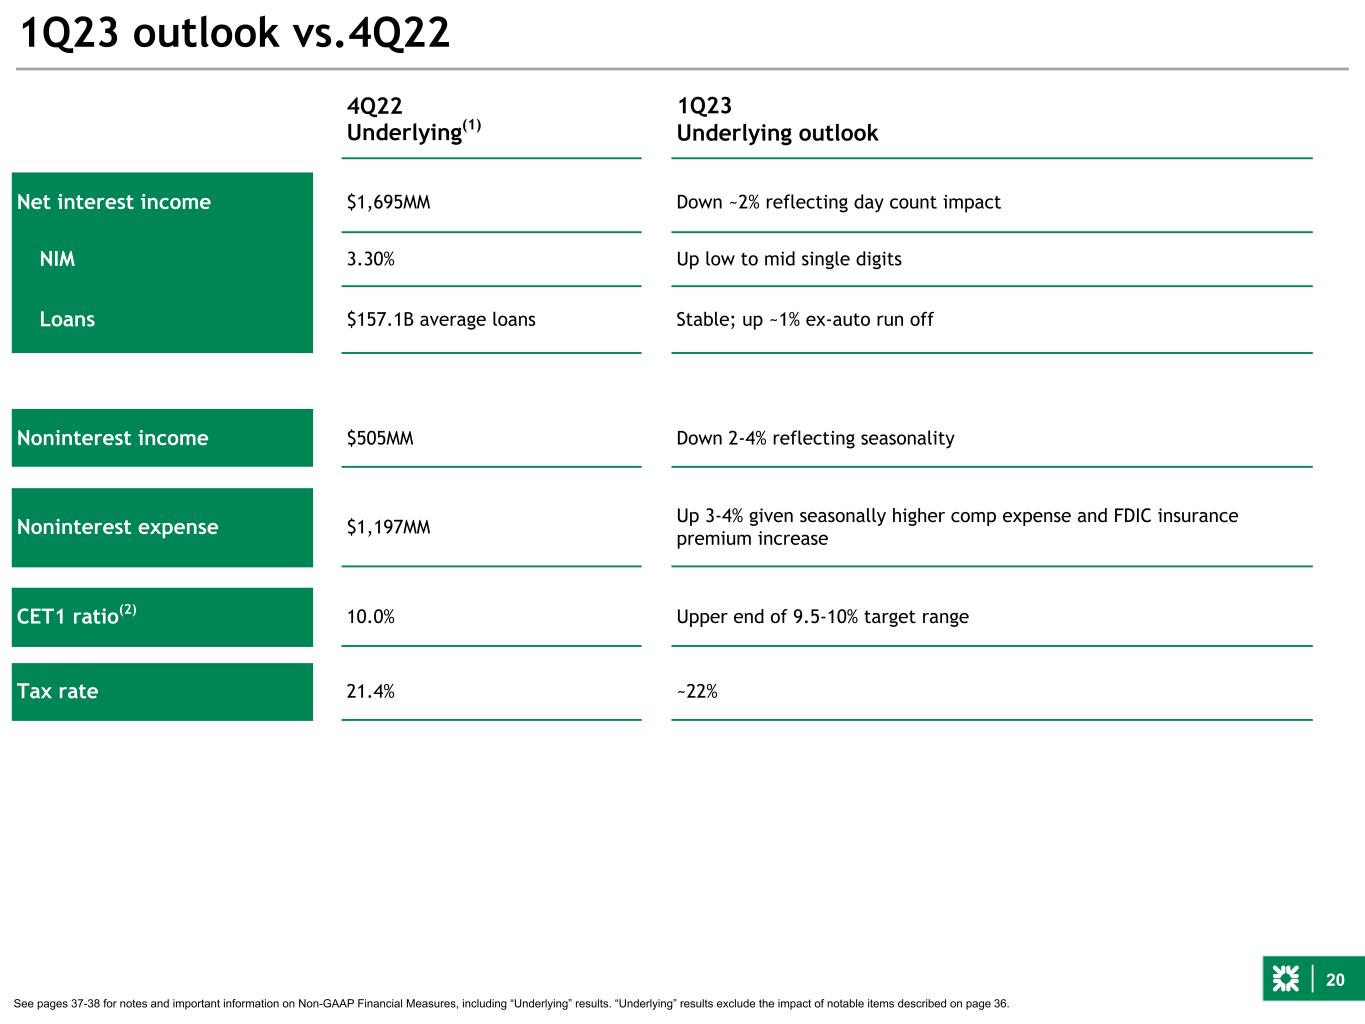
20 1Q23 outlook vs.4Q22 See pages 37-38 for notes and important information on Non-GAAP Financial Measures, including “Underlying” results. “Underlying” results exclude the impact of notable items described on page 36. 4Q22 Underlying(1) 1Q23 Underlying outlook Net interest income $1,695MM Down ~2% reflecting day count impact NIM 3.30% Up low to mid single digits Loans $157.1B average loans Stable; up ~1% ex-auto run off Noninterest income $505MM Down 2-4% reflecting seasonality Noninterest expense $1,197MM Up 3-4% given seasonally higher comp expense and FDIC insurance premium increase CET1 ratio(2) 10.0% Upper end of 9.5-10% target range Tax rate 21.4% ~22%
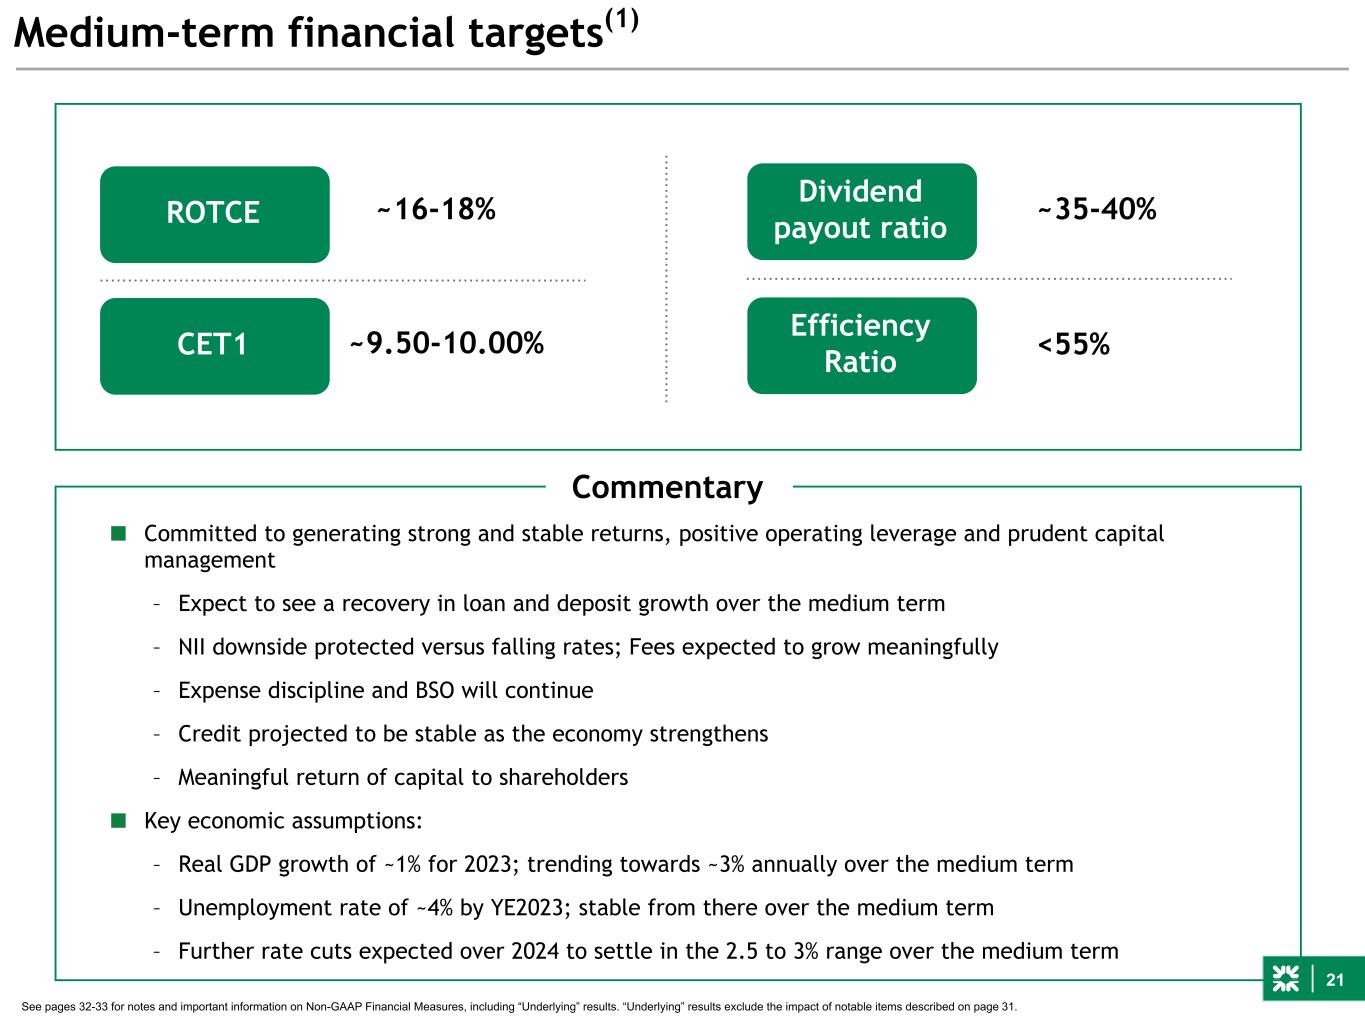
21 Medium-term financial targets(1) See pages 32-33 for notes and important information on Non-GAAP Financial Measures, including “Underlying” results. “Underlying” results exclude the impact of notable items described on page 31. ROTCE CET1 Dividend payout ratio Efficiency Ratio ~16-18% ~9.50-10.00% ~35-40% <55% Commentary ■ Committed to generating strong and stable returns, positive operating leverage and prudent capital management – Expect to see a recovery in loan and deposit growth over the medium term – NII downside protected versus falling rates; Fees expected to grow meaningfully – Expense discipline and BSO will continue – Credit projected to be stable as the economy strengthens – Meaningful return of capital to shareholders ■ Key economic assumptions: – Real GDP growth of ~1% for 2023; trending towards ~3% annually over the medium term – Unemployment rate of ~4% by YE2023; stable from there over the medium term – Further rate cuts expected over 2024 to settle in the 2.5 to 3% range over the medium term

22 – Multi-year investments in fee-generation capabilities, including strategic acquisitions – New York market entry provides significant revenue growth potential – Capital Markets well positioned to benefit when market volatility eases – Driving momentum in Wealth with launch of Citizens Private Client in 4Q22; hiring 200+ Financial Advisors and Relationship Managers Positive outlook for Citizens Building a formidable balance sheet with strong capital, liquidity and funding, and a prudent risk appetite – Tightened risk appetite and selective in growing loans, emphasizing attractive relationship-oriented commercial loan growth – Prudent hedging to manage a more predictable and stable outlook for NII as we benefit from the higher rate environment – Improved deposit franchise supports NIM expansion and drives improved beta performance expectations this cycle – Focused on delivering strong returns and positive Underlying operating leverage – Significantly strengthened technology, digital and data capabilities Disciplined offense to drive strong performance over the medium term Managing prudently while playing offense, executing on strategic initiatives Executing on strategic initiatives and TOP efficiency programs – Continuing to invest in strategic initiatives that will deliver superior revenue growth in the medium term – Integration of ISBC progressing well, conversion on track for 1Q23; expect to deliver planned expense synergies – TOP 7 achieved ~$115 million pre-tax run-rate benefit by YE2022; Launched TOP 8 targeting ~$100 million pre-tax run-rate benefit by YE2023 Strong defense to manage the risks of a dynamic environment – Interest-bearing deposit costs remain well-controlled with a cumulative beta of 29%; YE2023 cumulative beta in the upper 30s – Period-end LDR ratio of 87%; strong liquidity and funding position – CET1 ratio increased to 10.0%, at top end of target range; positioned for meaningful share repurchases in 2023 Positive outlook and momentum

Appendix
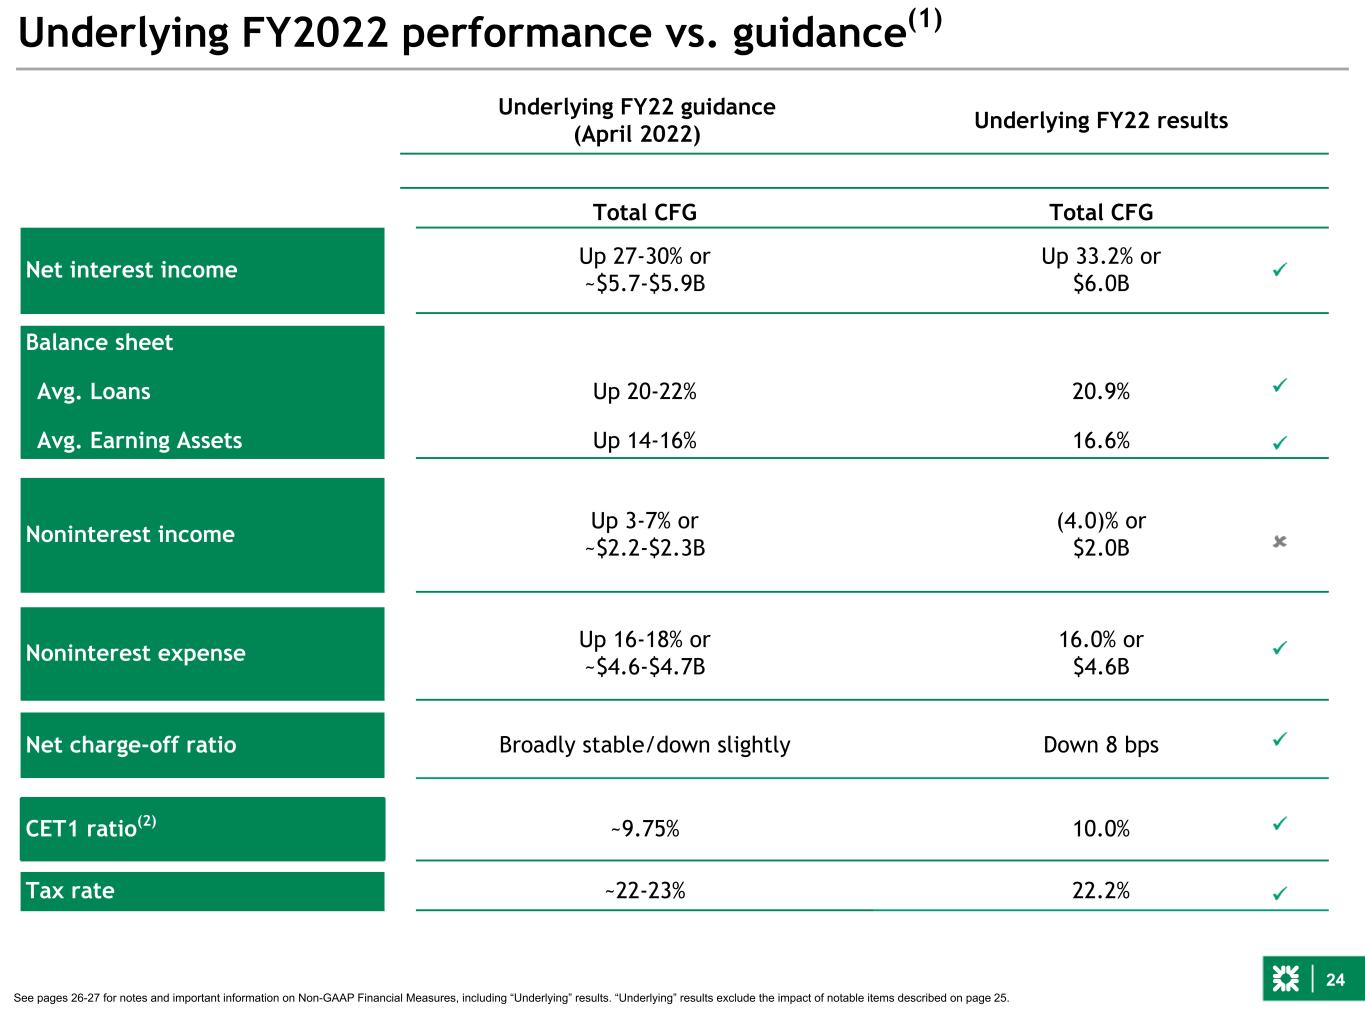
24 Underlying FY2022 performance vs. guidance(1) See pages 26-27 for notes and important information on Non-GAAP Financial Measures, including “Underlying” results. “Underlying” results exclude the impact of notable items described on page 25. Underlying FY22 guidance (April 2022) Underlying FY22 results Total CFG Total CFG Net interest income Up 27-30% or ~$5.7-$5.9B Up 33.2% or $6.0B Balance sheet Avg. Loans Up 20-22% 20.9% Avg. Earning Assets Up 14-16% 16.6% Noninterest income Up 3-7% or ~$2.2-$2.3B (4.0)% or $2.0B Noninterest expense Up 16-18% or ~$4.6-$4.7B 16.0% or $4.6B Net charge-off ratio Broadly stable/down slightly Down 8 bps CET1 ratio(2) ~9.75% 10.0% Tax rate ~22-23% 22.2%

25 Net income available to common shareholders and EPS $s in millions, except per share data é2% $982 $1,003 3Q22 4Q22 Linked-quarter Underlying results(1) Return on average total tangible assets Return on average tangible common equity Average loans $s in billions Average deposits $s in billions é0.1% $3.5 2 $3.5 6 é2% $156.9 $157.1 3Q22 4Q22 $177.6 $179.0 3Q22 4Q22 1.22% 1.25% 3Q22 4Q22 17.9% 19.4% 3Q22 4Q22 $644 $653 $1.30 $1.32 3Q22 4Q22 é1% Pre-provision profit $s in millions See pages 37-38 for notes and important information on Non-GAAP Financial Measures, including “Underlying” results. “Underlying” results exclude the impact of notable items described on page 36. é149 bps é3 bps é1%
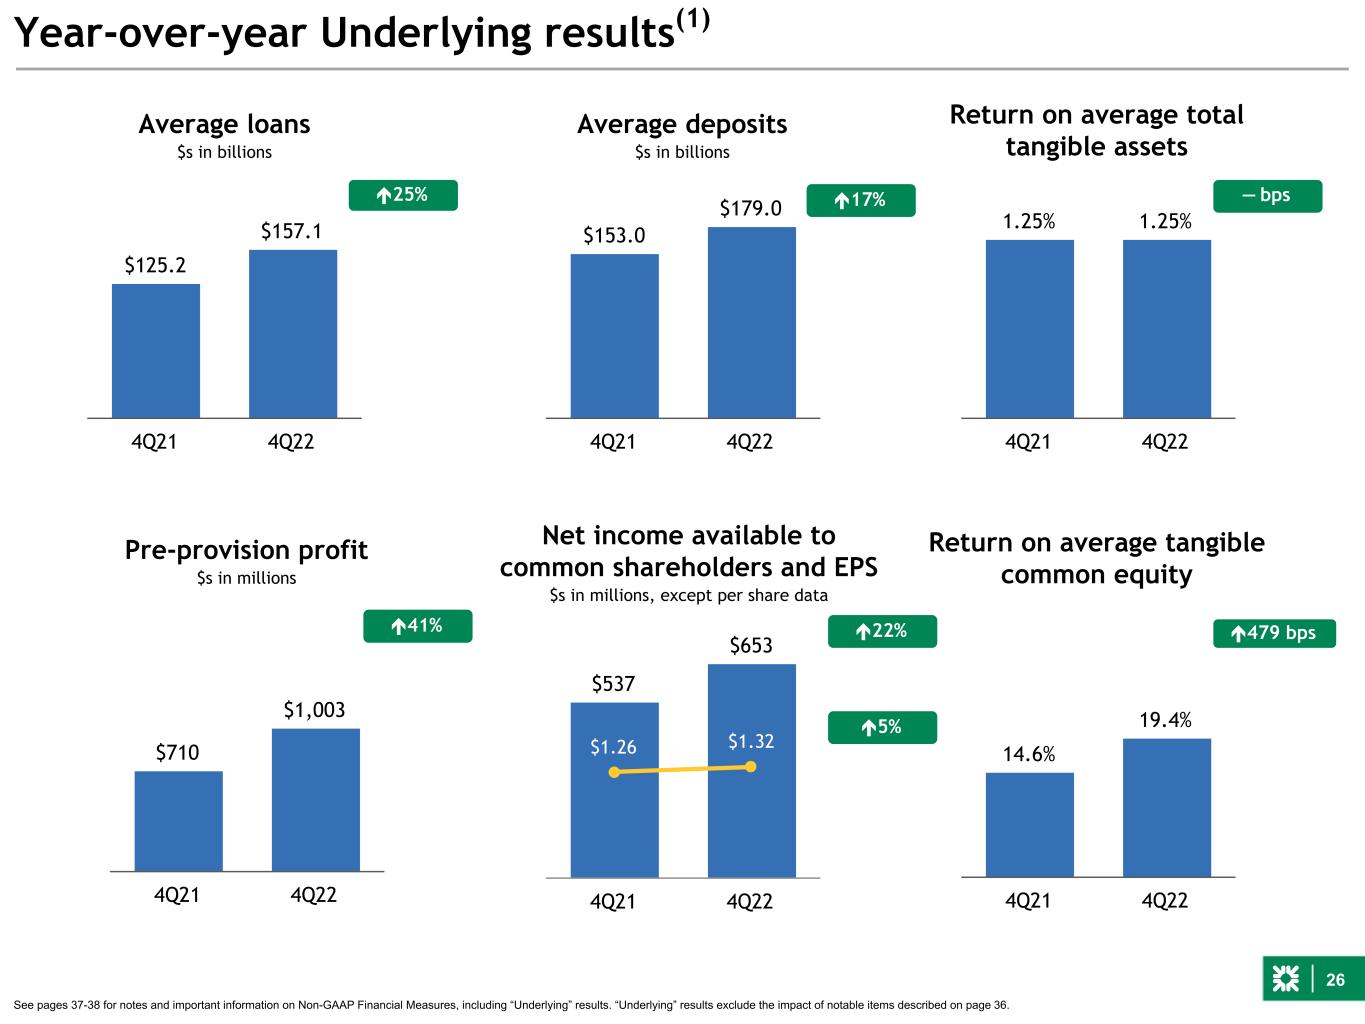
26 $710 $1,003 4Q21 4Q22 Year-over-year Underlying results(1) Return on average total tangible assets é41% Average loans $s in billions é25% Net income available to common shareholders and EPS $s in millions, except per share data Return on average tangible common equity Average deposits $s in billions $3.5 2 — bps $3.5 6 $125.2 $157.1 4Q21 4Q22 $153.0 $179.0 4Q21 4Q22 1.25% 1.25% 4Q21 4Q22 14.6% 19.4% 4Q21 4Q22 é17% Pre-provision profit $s in millions é479 bps $537 $653 $1.26 $1.32 4Q21 4Q22 See pages 37-38 for notes and important information on Non-GAAP Financial Measures, including “Underlying” results. “Underlying” results exclude the impact of notable items described on page 36. é5% é22%
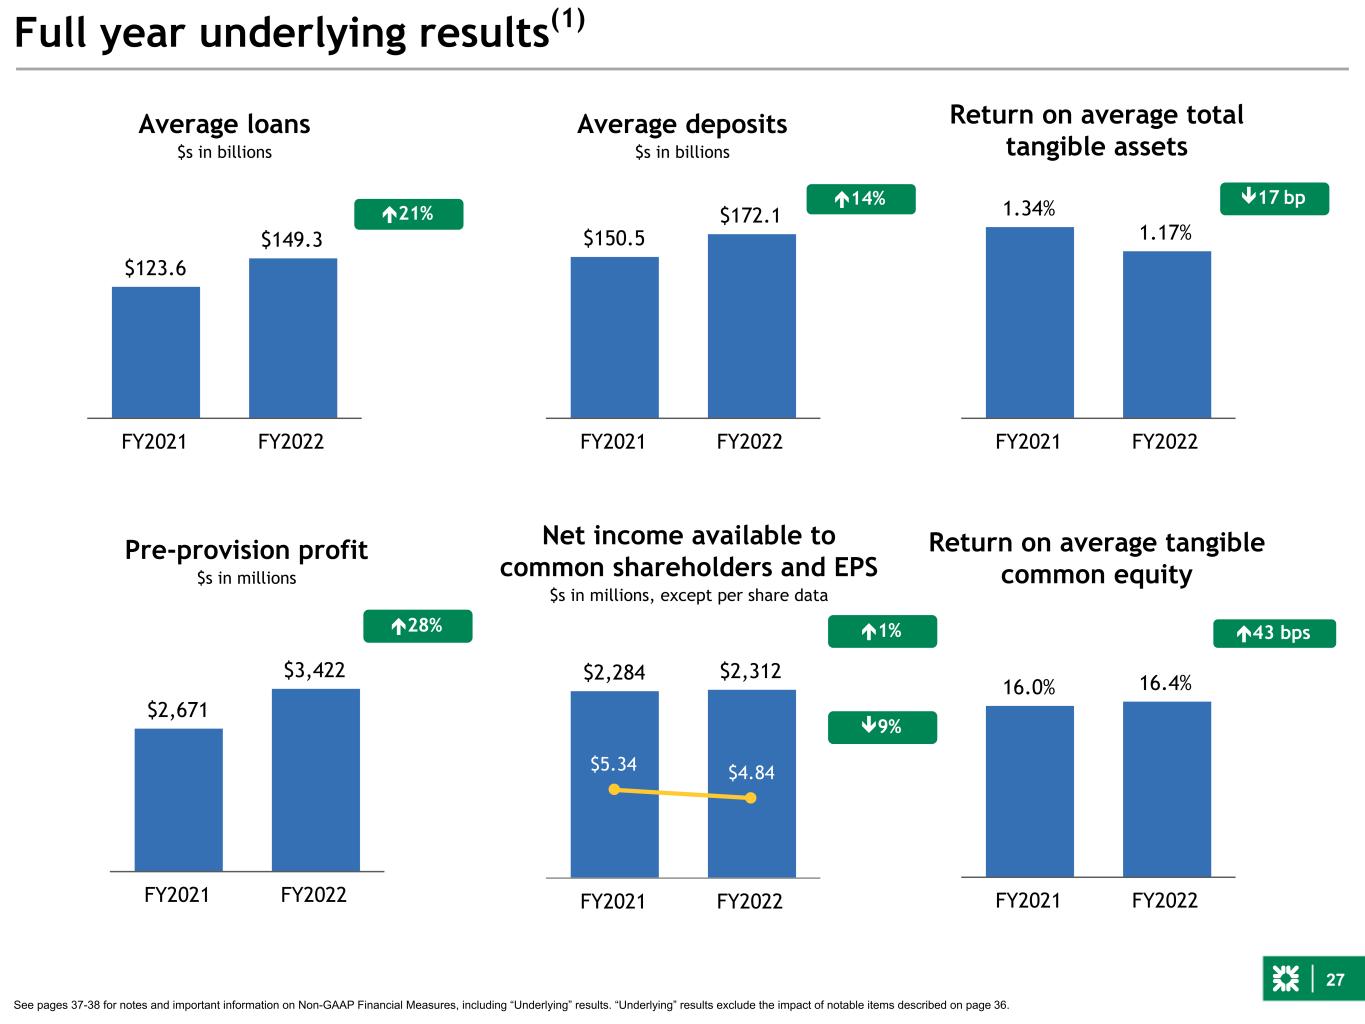
27 $2,671 $3,422 FY2021 FY2022 Full year underlying results(1) Return on average total tangible assets é28% Average loans $s in billions é21% Net income available to common shareholders and EPS $s in millions, except per share data Return on average tangible common equity Average deposits $s in billions $3.5 2 ê17 bp $3.5 6 $123.6 $149.3 FY2021 FY2022 $150.5 $172.1 FY2021 FY2022 1.34% 1.17% FY2021 FY2022 16.0% 16.4% FY2021 FY2022 é14% Pre-provision profit $s in millions é43 bps $2,284 $2,312 $5.34 $4.84 FY2021 FY2022 See pages 37-38 for notes and important information on Non-GAAP Financial Measures, including “Underlying” results. “Underlying” results exclude the impact of notable items described on page 36. ê9% é1%

28 Investors integration update On track to achieve $130 million targeted pre-tax run-rate net expense synergies (~30% of Investors' 2021 expense base), by mid-2023. ~70% achieved through year-end 2022 Investors conversion ■ Transition of accounts and services to Citizens’ systems and branch conversion on target for mid-February ■ Confident in successful integration given rigorous planning, coordination, testing and practice runs – Completed two data conversion tests and two full- simulation dress rehearsals with positive results – Conducting extensive one-on-one coordination with Commercial clients – Augmenting branches with experienced CFG managers through Ambassador Program leveraged successfully during HSBC conversion – Adding help-line resources to assist clients over and following the conversion weekend – Comprehensive conversion weekend preparation including ▪ Central and sub-unit command center structures ▪ Minute-by-minute conversion plans ▪ Key performance indicators and reporting ▪ Scenario analysis and issue resolution protocols in place 4Q22 1Q23 Completed two full-simulation conversion dress rehearsals Completed 2nd data conversion test Feb 17 - 20: Full branch and systems conversion Mailed customer welcome packages Commentary Rigorous coordination across businesses, operations and technology to drive smooth conversion Completed early conversion of mortgage portfolio Commercial client outreach and training Launch branch Ambassador Program and prepare for call center surge staffing Commence legacy Investors systems decommissioning
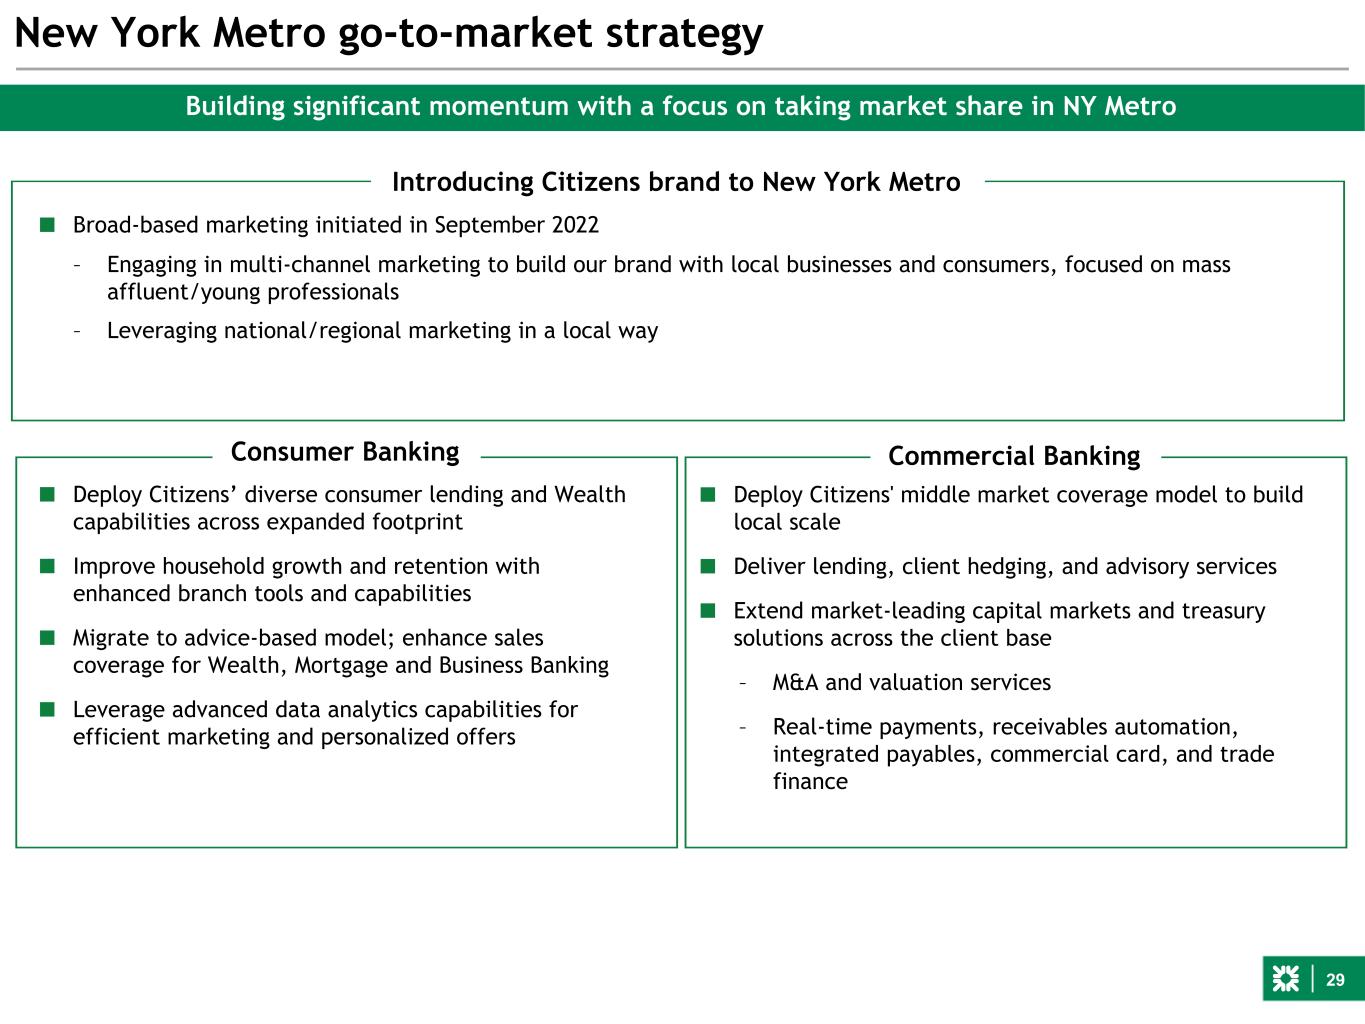
29 New York Metro go-to-market strategy Building significant momentum with a focus on taking market share in NY Metro ■ Broad-based marketing initiated in September 2022 – Engaging in multi-channel marketing to build our brand with local businesses and consumers, focused on mass affluent/young professionals – Leveraging national/regional marketing in a local way ■ Deploy Citizens’ diverse consumer lending and Wealth capabilities across expanded footprint ■ Improve household growth and retention with enhanced branch tools and capabilities ■ Migrate to advice-based model; enhance sales coverage for Wealth, Mortgage and Business Banking ■ Leverage advanced data analytics capabilities for efficient marketing and personalized offers Introducing Citizens brand to New York Metro ■ Deploy Citizens' middle market coverage model to build local scale ■ Deliver lending, client hedging, and advisory services ■ Extend market-leading capital markets and treasury solutions across the client base – M&A and valuation services – Real-time payments, receivables automation, integrated payables, commercial card, and trade finance Consumer Banking Commercial Banking
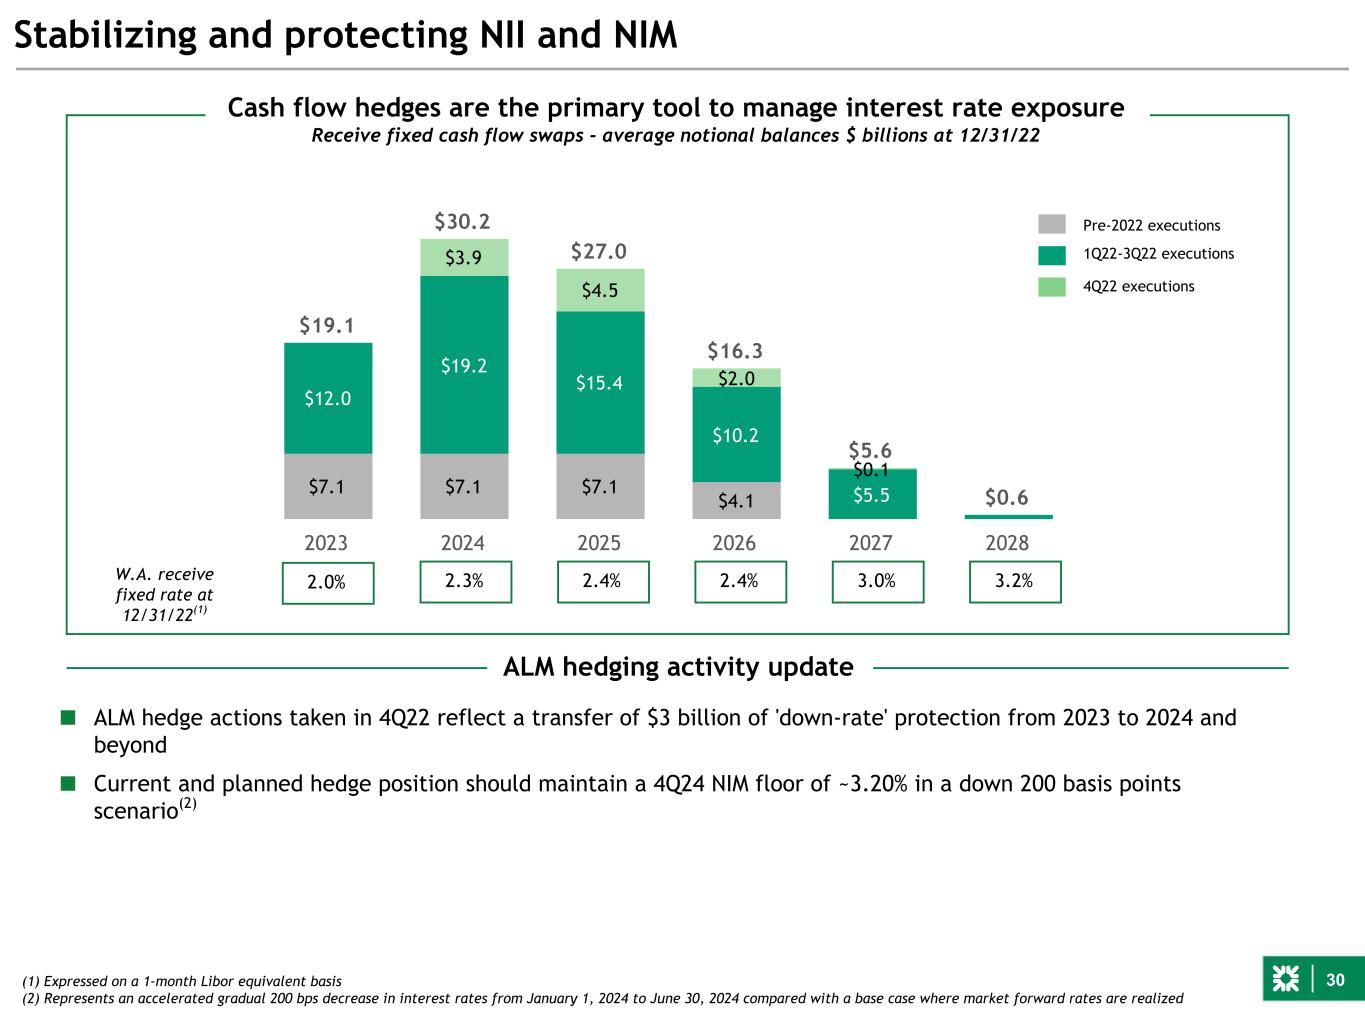
30 Stabilizing and protecting NII and NIM $19.1 $0.6 $30.2 $27.0 $16.3 $5.6 $7.1 $7.1 $7.1 $4.1 $12.0 $19.2 $15.4 $10.2 $5.5 $3.9 $4.5 $2.0 $0.1 2023 2024 2025 2026 2027 2028 Cash flow hedges are the primary tool to manage interest rate exposure Receive fixed cash flow swaps - average notional balances $ billions at 12/31/22 ALM hedging activity update ■ ALM hedge actions taken in 4Q22 reflect a transfer of $3 billion of 'down-rate' protection from 2023 to 2024 and beyond ■ Current and planned hedge position should maintain a 4Q24 NIM floor of ~3.20% in a down 200 basis points scenario(2) Pre-2022 executions 1Q22-3Q22 executions (1) Expressed on a 1-month Libor equivalent basis (2) Represents an accelerated gradual 200 bps decrease in interest rates from January 1, 2024 to June 30, 2024 compared with a base case where market forward rates are realized W.A. receive fixed rate at 12/31/22(1) 2.3% 2.4% 2.4% 3.0% 3.2% 4Q22 executions 2.0%

31 $82.2B Commercial credit portfolio See pages 37-38 for notes and important information on Non-GAAP Financial Measures, including “Underlying” results. “Underlying” results exclude the impact of notable items described on page 36. Commercial portfolio risk ratings(3) $s in billions 58% 64% 64% 25% 19% 18% 14% 14% 14% 3% 3% 4% 4Q19 3Q22 4Q22 B- and lower B+ to B BB+ to BB- AAA+ to BBB- $57.5 $82.2 Highlights $81.1($ in billions) Outstanding balance % of total CFG C&I Finance and Insurance Capital call facilities $ 6.8 4 % Other Finance and Insurance 5.3 3 Other Manufacturing 4.5 3 Technology 4.4 3 Accommodation and Food Services 3.6 2 Health, Pharma, Social Assistance 3.1 2 Professional, Scientific, and Technical Services 3.1 2 Wholesale Trade 3.0 2 Retail Trade 2.4 2 Other Services 2.7 2 Energy & Related 2.3 1 Rental and Leasing 1.5 1 Consumer Products Manufacturing 1.5 1 Administrative and Waste Management Services 1.7 1 Arts, Entertainment, and Recreation 1.6 1 Automotive 1.3 1 Other (1) 3.1 2 Total C&I $ 51.7 33 % CRE Multi-family $ 8.7 6 % Office 6.3 4 Retail 3.3 2 Industrial 3.2 2 Co-op 1.8 1 Hospitality 0.6 — Other (1) 4.9 3 Total CRE $ 28.9 18 % Total Commercial loans & leases (2) $ 82.1 52 % Total CFG $ 156.7 100 % Diverse and granular portfolio ■ Disciplined capital allocation and risk appetite – Highly experienced leadership team – Focused client selection ■ C&I portfolio has focused growth on larger, mid-corporate customers, thereby improving overall asset quality ■ Leveraged loans ~1.7% of total CFG loans, granular hold positions with an average outstanding of ~$11 million ■ CRE portfolio is well diversified across asset type, geography, and borrowers with the emphasis on strong sponsor selection
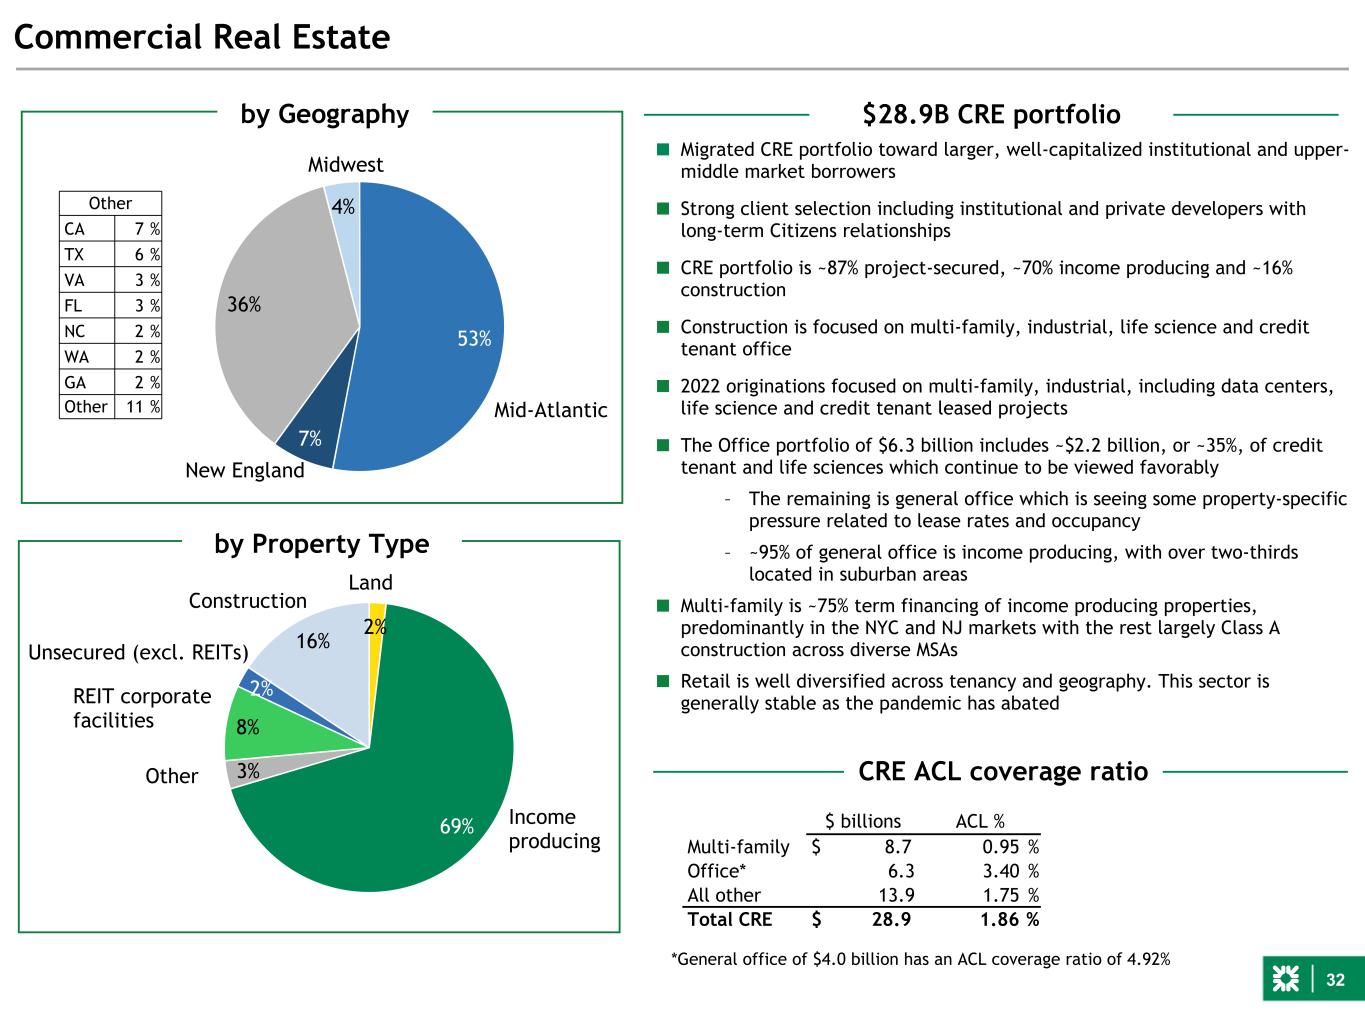
32 2% 69% 3% 8% 2% 16% Commercial Real Estate by Property Type Income producing REIT corporate facilities Construction Unsecured (excl. REITs) Land Other $28.9B CRE portfolio ■ Migrated CRE portfolio toward larger, well-capitalized institutional and upper- middle market borrowers ■ Strong client selection including institutional and private developers with long-term Citizens relationships ■ CRE portfolio is ~87% project-secured, ~70% income producing and ~16% construction ■ Construction is focused on multi-family, industrial, life science and credit tenant office ■ 2022 originations focused on multi-family, industrial, including data centers, life science and credit tenant leased projects ■ The Office portfolio of $6.3 billion includes ~$2.2 billion, or ~35%, of credit tenant and life sciences which continue to be viewed favorably – The remaining is general office which is seeing some property-specific pressure related to lease rates and occupancy – ~95% of general office is income producing, with over two-thirds located in suburban areas ■ Multi-family is ~75% term financing of income producing properties, predominantly in the NYC and NJ markets with the rest largely Class A construction across diverse MSAs ■ Retail is well diversified across tenancy and geography. This sector is generally stable as the pandemic has abated 53% 7% 36% 4% by Geography Mid-Atlantic Midwest New England $ billions ACL % Multi-family $ 8.7 0.95 % Office* 6.3 3.40 % All other 13.9 1.75 % Total CRE $ 28.9 1.86 % *General office of $4.0 billion has an ACL coverage ratio of 4.92% CRE ACL coverage ratio Other CA 7 % TX 6 % VA 3 % FL 3 % NC 2 % WA 2 % GA 2 % Other 11 %
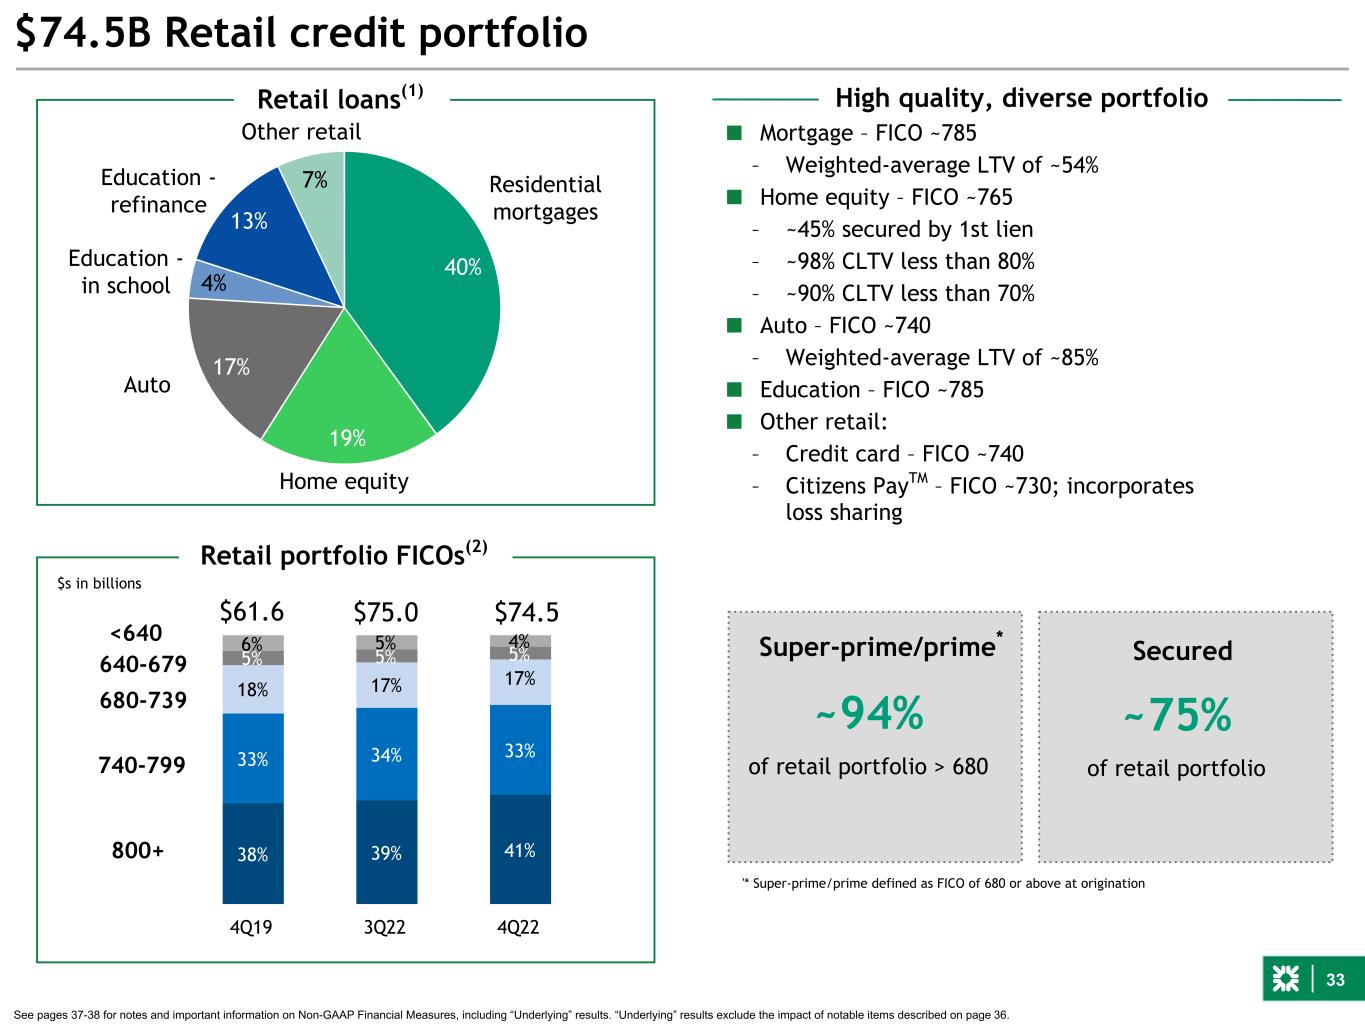
33 38% 39% 41% 33% 34% 33% 18% 17% 17% 5% 5% 5%6% 5% 4% 4Q19 3Q22 4Q22 40% 19% 17% 4% 13% 7% $74.5B Retail credit portfolio See pages 37-38 for notes and important information on Non-GAAP Financial Measures, including “Underlying” results. “Underlying” results exclude the impact of notable items described on page 36. 800+ 740-799 680-739 640-679 <640 $61.6 $74.5 $s in billions Retail portfolio FICOs(2) $75.0 Home equity Retail loans(1) Residential mortgages Auto Education - in school Education - refinance Other retail ~94% of retail portfolio > 680 Super-prime/prime* ~75% of retail portfolio Secured ■ Mortgage – FICO ~785 – Weighted-average LTV of ~54% ■ Home equity – FICO ~765 – ~45% secured by 1st lien – ~98% CLTV less than 80% – ~90% CLTV less than 70% ■ Auto – FICO ~740 – Weighted-average LTV of ~85% ■ Education – FICO ~785 ■ Other retail: – Credit card – FICO ~740 – Citizens PayTM – FICO ~730; incorporates loss sharing High quality, diverse portfolio '* Super-prime/prime defined as FICO of 680 or above at origination
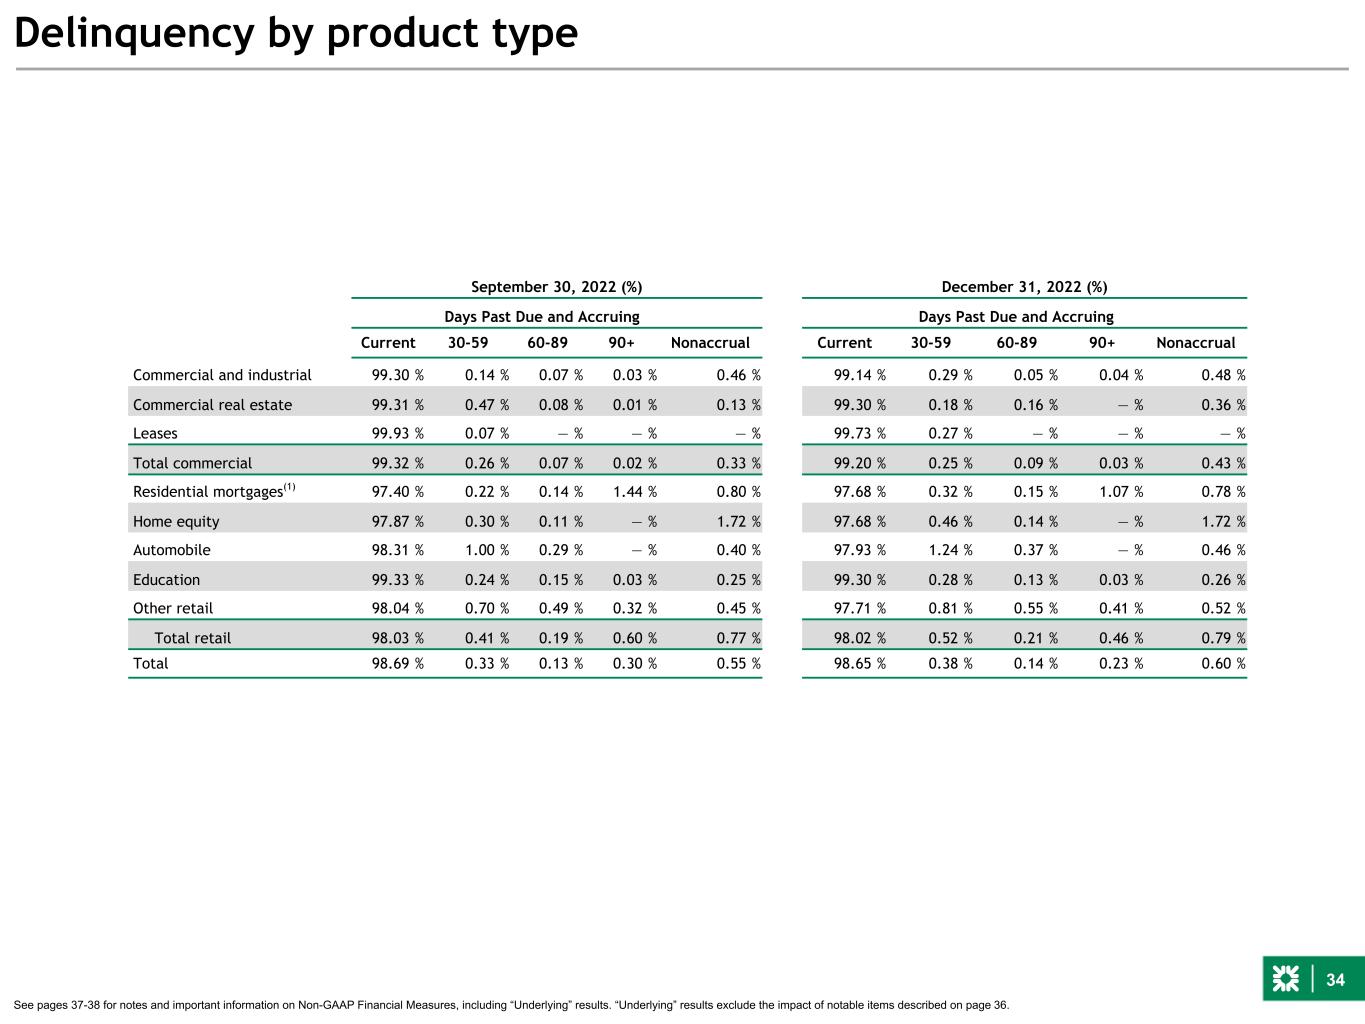
34 Delinquency by product type See pages 37-38 for notes and important information on Non-GAAP Financial Measures, including “Underlying” results. “Underlying” results exclude the impact of notable items described on page 36. September 30, 2022 (%) December 31, 2022 (%) Days Past Due and Accruing Days Past Due and Accruing Current 30-59 60-89 90+ Nonaccrual Current 30-59 60-89 90+ Nonaccrual Commercial and industrial 99.30 % 0.14 % 0.07 % 0.03 % 0.46 % 99.14 % 0.29 % 0.05 % 0.04 % 0.48 % Commercial real estate 99.31 % 0.47 % 0.08 % 0.01 % 0.13 % 99.30 % 0.18 % 0.16 % — % 0.36 % Leases 99.93 % 0.07 % — % — % — % 99.73 % 0.27 % — % — % — % Total commercial 99.32 % 0.26 % 0.07 % 0.02 % 0.33 % 99.20 % 0.25 % 0.09 % 0.03 % 0.43 % Residential mortgages(1) 97.40 % 0.22 % 0.14 % 1.44 % 0.80 % 97.68 % 0.32 % 0.15 % 1.07 % 0.78 % Home equity 97.87 % 0.30 % 0.11 % — % 1.72 % 97.68 % 0.46 % 0.14 % — % 1.72 % Automobile 98.31 % 1.00 % 0.29 % — % 0.40 % 97.93 % 1.24 % 0.37 % — % 0.46 % Education 99.33 % 0.24 % 0.15 % 0.03 % 0.25 % 99.30 % 0.28 % 0.13 % 0.03 % 0.26 % Other retail 98.04 % 0.70 % 0.49 % 0.32 % 0.45 % 97.71 % 0.81 % 0.55 % 0.41 % 0.52 % Total retail 98.03 % 0.41 % 0.19 % 0.60 % 0.77 % 98.02 % 0.52 % 0.21 % 0.46 % 0.79 % Total 98.69 % 0.33 % 0.13 % 0.30 % 0.55 % 98.65 % 0.38 % 0.14 % 0.23 % 0.60 %
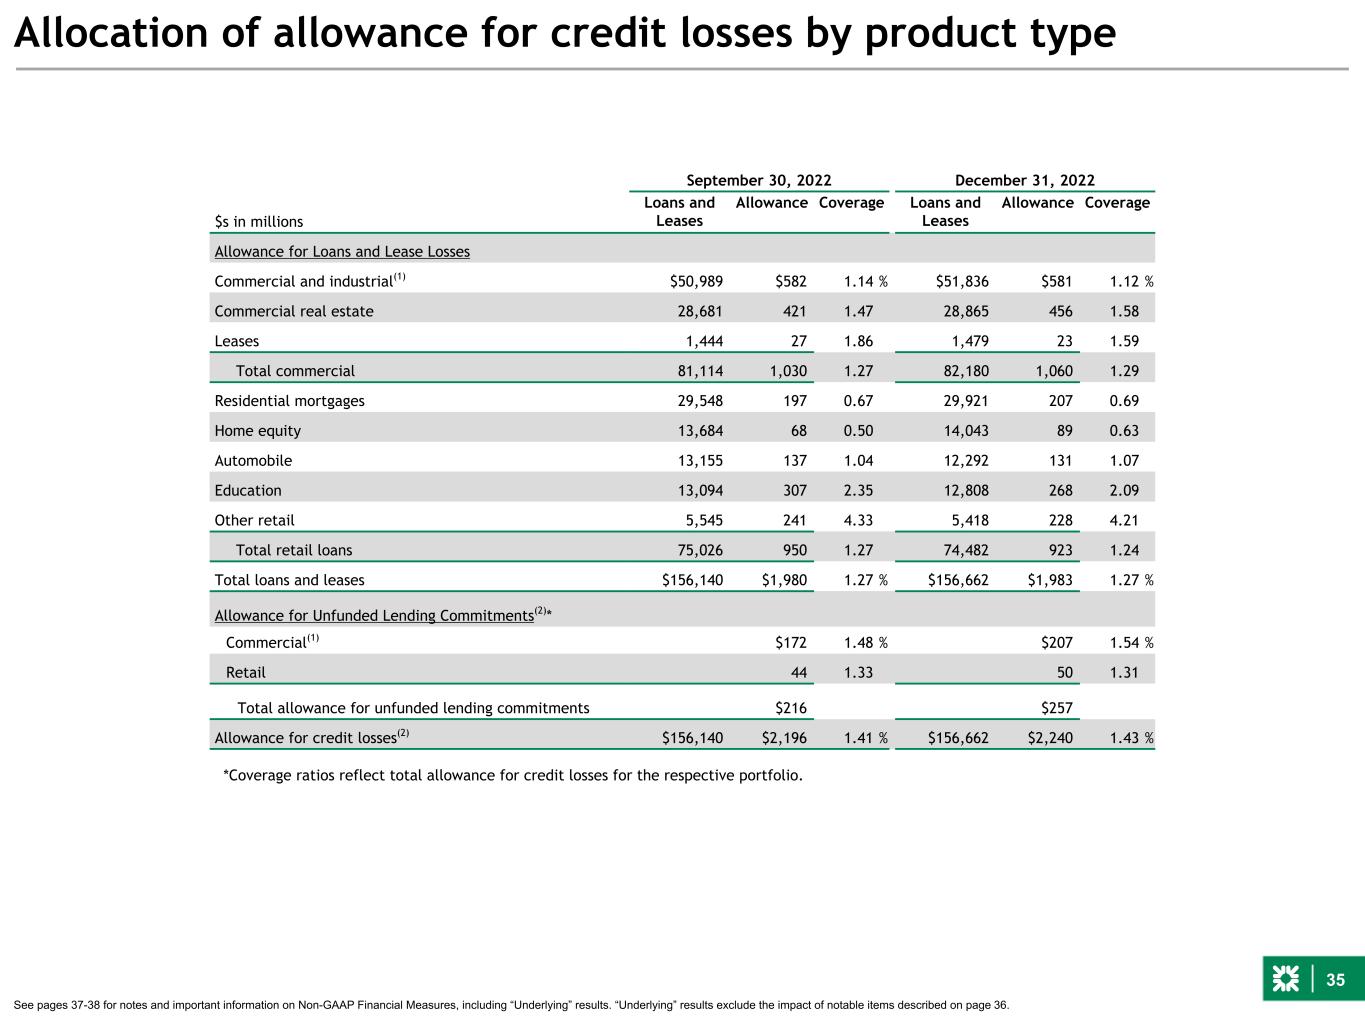
35 Allocation of allowance for credit losses by product type September 30, 2022 December 31, 2022 $s in millions Loans and Leases Allowance Coverage Loans and Leases Allowance Coverage Allowance for Loans and Lease Losses Commercial and industrial(1) $50,989 $582 1.14 % $51,836 $581 1.12 % Commercial real estate 28,681 421 1.47 28,865 456 1.58 Leases 1,444 27 1.86 1,479 23 1.59 Total commercial 81,114 1,030 1.27 82,180 1,060 1.29 Residential mortgages 29,548 197 0.67 29,921 207 0.69 Home equity 13,684 68 0.50 14,043 89 0.63 Automobile 13,155 137 1.04 12,292 131 1.07 Education 13,094 307 2.35 12,808 268 2.09 Other retail 5,545 241 4.33 5,418 228 4.21 Total retail loans 75,026 950 1.27 74,482 923 1.24 Total loans and leases $156,140 $1,980 1.27 % $156,662 $1,983 1.27 % Allowance for Unfunded Lending Commitments(2)* Commercial(1) $172 1.48 % $207 1.54 % Retail 44 1.33 50 1.31 Total allowance for unfunded lending commitments $216 $257 Allowance for credit losses(2) $156,140 $2,196 1.41 % $156,662 $2,240 1.43 % *Coverage ratios reflect total allowance for credit losses for the respective portfolio. See pages 37-38 for notes and important information on Non-GAAP Financial Measures, including “Underlying” results. “Underlying” results exclude the impact of notable items described on page 36.

36 Notable items(1) Quarterly results for third and fourth quarter 2022 and fourth quarter 2021 reflect notable items primarily related to integration costs associated with the acquisitions of HSBC, ISBC and JMP Group LLC, as well as TOP revenue and efficiency initiatives. In addition, full year 2022 results include notable items representing the day-one CECL provision expense ("double count") related to the HSBC and ISBC transactions. These notable items have been excluded from reported results to better reflect Underlying operating results. See pages 37-38 for notes and important information on Non-GAAP Financial Measures, including “Underlying” results. “Underlying” results exclude the impact of notable items described above. Notable items - integration related 4Q22 3Q22 4Q21 FY 2022 FY 2021 $s in millions, except per share data Pre-tax After-tax Pre-tax After-tax Pre-tax After-tax Pre-tax After-tax Pre-tax After-tax Noninterest income $ — $ — $ — $ — $ — $ — $ (31) $ (23) $ — $ — EPS Impact -Noninterest income $ — $ — $ — $ (0.05) $ — Salaries & benefits $ (13) $ (9) $ (17) $ (12) $ (3) $ (2) $ (98) $ (72) $ (3) $ (2) Outside services (15) (12) (11) (8) (22) (17) (89) (67) (28) (21) Equipment and software (1) (1) — — (1) (1) (1) (1) (1) (1) Occupancy — — (2) (1) — — (2) (1) — — Other expense (6) (4) (7) (5) (3) (2) (23) (16) (3) (2) Noninterest expense $ (35) $ (26) $ (37) $ (26) $ (29) $ (22) $ (213) $ (157) $ (35) $ (26) EPS Impact - Noninterest expense $ (0.06) $ (0.06) $ (0.05) $ (0.34) $ (0.06) ISBC/HSBC Day 1 CECL provision expense (“double count”) $ — $ — $ — $ — $ — $ — $ (169) $ (126) $ — $ — EPS Impact - Provision for credit losses $ — $ — $ — $ (0.26) $ — Tax integration cost — — — — — — — (6) — — EPS Impact - Tax integration cost $ — $ — $ — $ (0.01) $ — Total Integration Costs $ (35) $ (26) $ (37) $ (26) $ (29) $ (22) $ (413) $ (312) $ (35) $ (26) EPS Impact - Total integration related $ (0.06) $ (0.06) $ (0.05) $ (0.66) $ (0.06) Other notable items - primarily tax and TOP 4Q22 3Q22 4Q21 FY 2022 FY 2021 $s in millions, except per share data Pre-tax After-tax Pre-tax After-tax Pre-tax After-tax Pre-tax After-tax Pre-tax After-tax Tax notable items $ — $ — $ — $ — $ — $ — $ — $ (3) $ — $ — Other notable items- TOP & other actions Salaries & benefits $ (2) $ (2) $ — $ — $ (2) $ (2) $ (12) $ (9) $ 11 $ 8 Outside services (2) (1) (9) (7) (15) (11) (24) (18) (32) (24) Equipment and software (1) — — — (1) (1) (9) (6) (16) (12) Occupancy (2) (2) — — (5) (4) (3) (3) (18) (13) Other expense (1) (1) — — 1 1 (1) (1) (15) (11) Noninterest expense $ (8) $ (6) $ (9) $ (7) $ (22) $ (17) $ (49) $ (37) $ (70) $ (52) Total Other Notable Items $ (8) $ (6) $ (9) $ (7) $ (22) $ (17) $ (49) $ (40) $ (70) $ (52) EPS Impact - Other Notable Items $ (0.01) $ (0.01) $ (0.04) $ (0.08) $ (0.12) Total Notable Items $ (43) $ (32) $ (46) $ (33) $ (51) $ (39) $ (462) $ (352) $ (105) $ (78) Total EPS Impact $ (0.07) $ (0.07) $ (0.09) $ (0.74) $ (0.18)
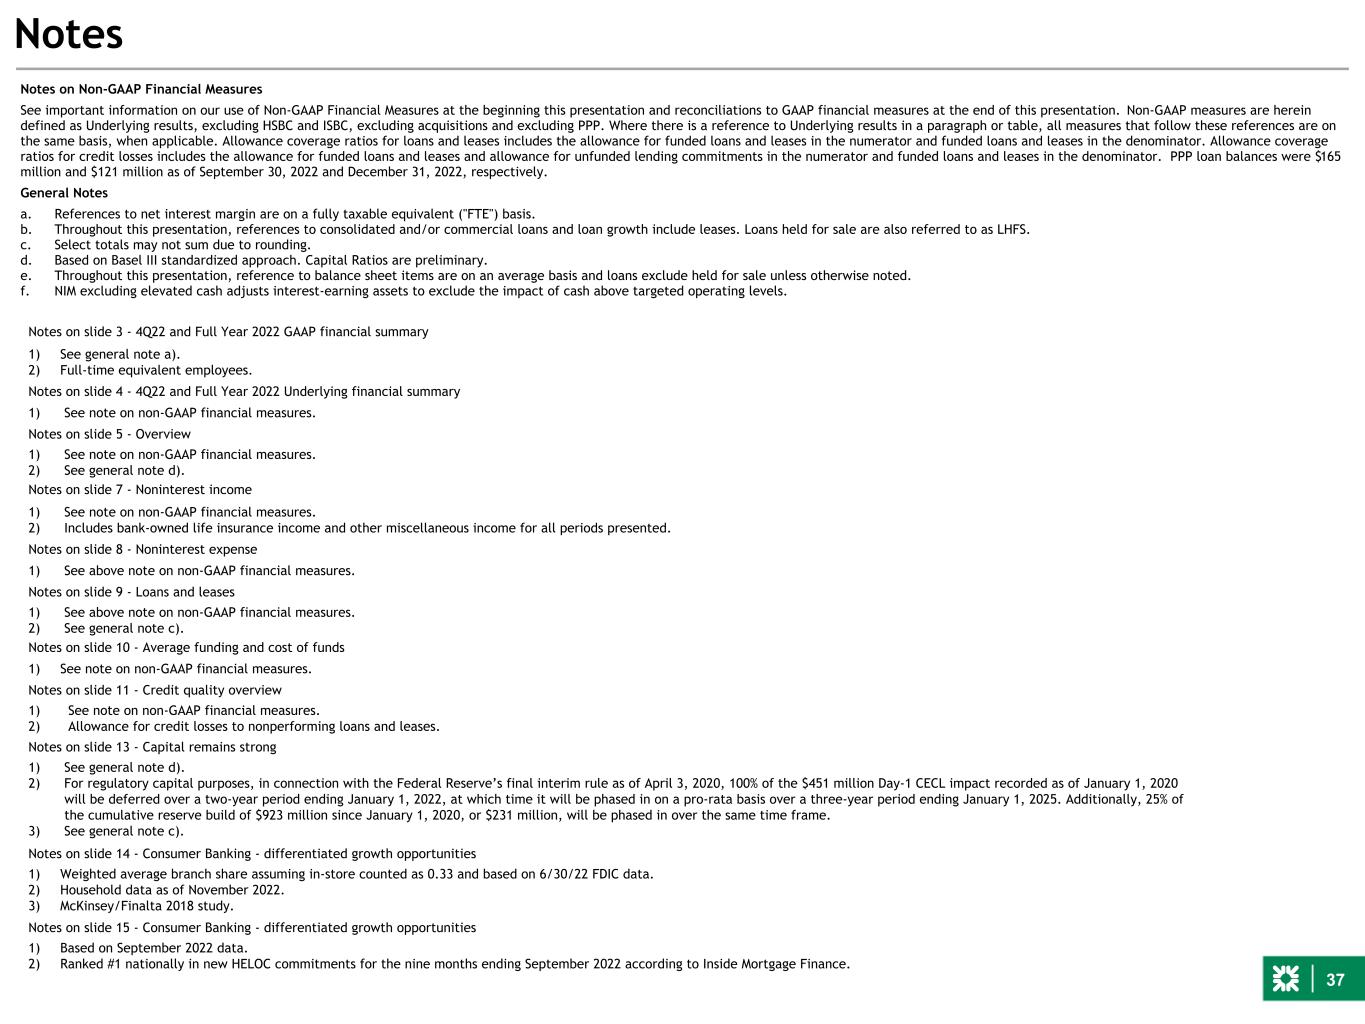
37 Notes on Non-GAAP Financial Measures See important information on our use of Non-GAAP Financial Measures at the beginning this presentation and reconciliations to GAAP financial measures at the end of this presentation. Non-GAAP measures are herein defined as Underlying results, excluding HSBC and ISBC, excluding acquisitions and excluding PPP. Where there is a reference to Underlying results in a paragraph or table, all measures that follow these references are on the same basis, when applicable. Allowance coverage ratios for loans and leases includes the allowance for funded loans and leases in the numerator and funded loans and leases in the denominator. Allowance coverage ratios for credit losses includes the allowance for funded loans and leases and allowance for unfunded lending commitments in the numerator and funded loans and leases in the denominator. PPP loan balances were $165 million and $121 million as of September 30, 2022 and December 31, 2022, respectively. General Notes a. References to net interest margin are on a fully taxable equivalent ("FTE") basis. b. Throughout this presentation, references to consolidated and/or commercial loans and loan growth include leases. Loans held for sale are also referred to as LHFS. c. Select totals may not sum due to rounding. d. Based on Basel III standardized approach. Capital Ratios are preliminary. e. Throughout this presentation, reference to balance sheet items are on an average basis and loans exclude held for sale unless otherwise noted. f. NIM excluding elevated cash adjusts interest-earning assets to exclude the impact of cash above targeted operating levels. Notes Notes on slide 3 - 4Q22 and Full Year 2022 GAAP financial summary 1) See general note a). 2) Full-time equivalent employees. Notes on slide 4 - 4Q22 and Full Year 2022 Underlying financial summary 1) See note on non-GAAP financial measures. Notes on slide 5 - Overview 1) See note on non-GAAP financial measures. 2) See general note d). Notes on slide 7 - Noninterest income 1) See note on non-GAAP financial measures. 2) Includes bank-owned life insurance income and other miscellaneous income for all periods presented. Notes on slide 8 - Noninterest expense 1) See above note on non-GAAP financial measures. Notes on slide 9 - Loans and leases 1) See above note on non-GAAP financial measures. 2) See general note c). Notes on slide 10 - Average funding and cost of funds 1) See note on non-GAAP financial measures. Notes on slide 11 - Credit quality overview 1) See note on non-GAAP financial measures. 2) Allowance for credit losses to nonperforming loans and leases. Notes on slide 13 - Capital remains strong 1) See general note d). 2) For regulatory capital purposes, in connection with the Federal Reserve’s final interim rule as of April 3, 2020, 100% of the $451 million Day-1 CECL impact recorded as of January 1, 2020 will be deferred over a two-year period ending January 1, 2022, at which time it will be phased in on a pro-rata basis over a three-year period ending January 1, 2025. Additionally, 25% of the cumulative reserve build of $923 million since January 1, 2020, or $231 million, will be phased in over the same time frame. 3) See general note c). Notes on slide 14 - Consumer Banking - differentiated growth opportunities 1) Weighted average branch share assuming in-store counted as 0.33 and based on 6/30/22 FDIC data. 2) Household data as of November 2022. 3) McKinsey/Finalta 2018 study. Notes on slide 15 - Consumer Banking - differentiated growth opportunities 1) Based on September 2022 data. 2) Ranked #1 nationally in new HELOC commitments for the nine months ending September 2022 according to Inside Mortgage Finance.
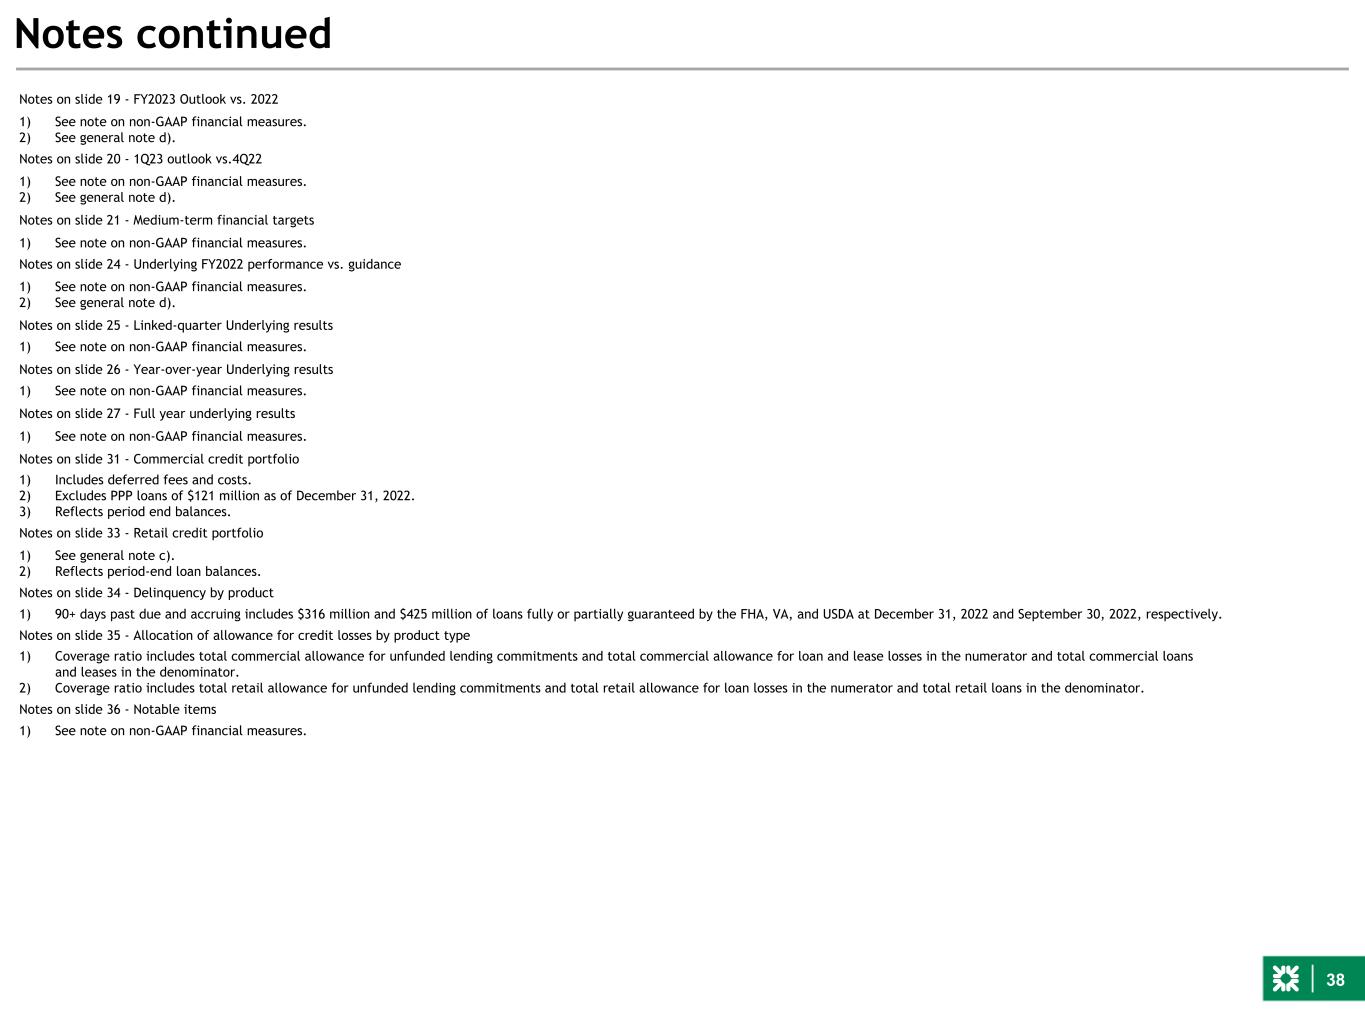
38 Notes continued Notes on slide 19 - FY2023 Outlook vs. 2022 1) See note on non-GAAP financial measures. 2) See general note d). Notes on slide 20 - 1Q23 outlook vs.4Q22 1) See note on non-GAAP financial measures. 2) See general note d). Notes on slide 21 - Medium-term financial targets 1) See note on non-GAAP financial measures. Notes on slide 24 - Underlying FY2022 performance vs. guidance 1) See note on non-GAAP financial measures. 2) See general note d). Notes on slide 25 - Linked-quarter Underlying results 1) See note on non-GAAP financial measures. Notes on slide 26 - Year-over-year Underlying results 1) See note on non-GAAP financial measures. Notes on slide 27 - Full year underlying results 1) See note on non-GAAP financial measures. Notes on slide 31 - Commercial credit portfolio 1) Includes deferred fees and costs. 2) Excludes PPP loans of $121 million as of December 31, 2022. 3) Reflects period end balances. Notes on slide 33 - Retail credit portfolio 1) See general note c). 2) Reflects period-end loan balances. Notes on slide 34 - Delinquency by product 1) 90+ days past due and accruing includes $316 million and $425 million of loans fully or partially guaranteed by the FHA, VA, and USDA at December 31, 2022 and September 30, 2022, respectively. Notes on slide 35 - Allocation of allowance for credit losses by product type 1) Coverage ratio includes total commercial allowance for unfunded lending commitments and total commercial allowance for loan and lease losses in the numerator and total commercial loans and leases in the denominator. 2) Coverage ratio includes total retail allowance for unfunded lending commitments and total retail allowance for loan losses in the numerator and total retail loans in the denominator. Notes on slide 36 - Notable items 1) See note on non-GAAP financial measures.
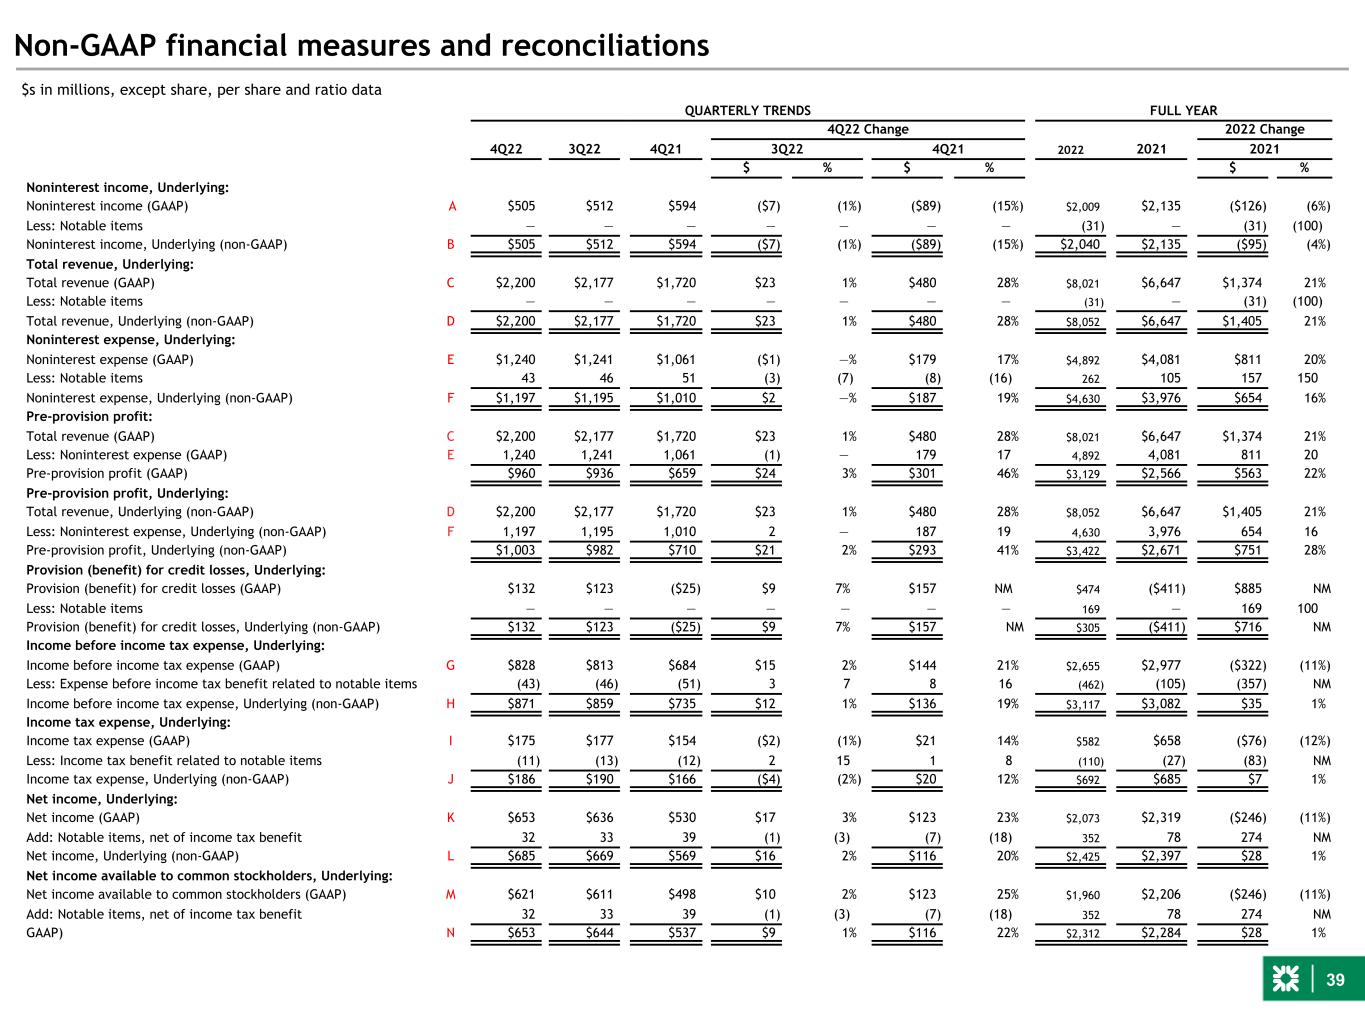
39 Non-GAAP financial measures and reconciliations $s in millions, except share, per share and ratio data QUARTERLY TRENDS FULL YEAR 4Q22 Change 2022 Change 4Q22 3Q22 4Q21 3Q22 4Q21 2022 2021 2021 $ % $ % $ % Noninterest income, Underlying: Noninterest income (GAAP) A $505 $512 $594 ($7) (1%) ($89) (15%) $2,009 $2,135 ($126) (6%) Less: Notable items — — — — — — — (31) — (31) (100) Noninterest income, Underlying (non-GAAP) B $505 $512 $594 ($7) (1%) ($89) (15%) $2,040 $2,135 ($95) (4%) Total revenue, Underlying: Total revenue (GAAP) C $2,200 $2,177 $1,720 $23 1% $480 28% $8,021 $6,647 $1,374 21% Less: Notable items — — — — — — — (31) — (31) (100) Total revenue, Underlying (non-GAAP) D $2,200 $2,177 $1,720 $23 1% $480 28% $8,052 $6,647 $1,405 21% Noninterest expense, Underlying: Noninterest expense (GAAP) E $1,240 $1,241 $1,061 ($1) —% $179 17% $4,892 $4,081 $811 20% Less: Notable items 43 46 51 (3) (7) (8) (16) 262 105 157 150 Noninterest expense, Underlying (non-GAAP) F $1,197 $1,195 $1,010 $2 —% $187 19% $4,630 $3,976 $654 16% Pre-provision profit: Total revenue (GAAP) C $2,200 $2,177 $1,720 $23 1% $480 28% $8,021 $6,647 $1,374 21% Less: Noninterest expense (GAAP) E 1,240 1,241 1,061 (1) — 179 17 4,892 4,081 811 20 Pre-provision profit (GAAP) $960 $936 $659 $24 3% $301 46% $3,129 $2,566 $563 22% Pre-provision profit, Underlying: Total revenue, Underlying (non-GAAP) D $2,200 $2,177 $1,720 $23 1% $480 28% $8,052 $6,647 $1,405 21% Less: Noninterest expense, Underlying (non-GAAP) F 1,197 1,195 1,010 2 — 187 19 4,630 3,976 654 16 Pre-provision profit, Underlying (non-GAAP) $1,003 $982 $710 $21 2% $293 41% $3,422 $2,671 $751 28% Provision (benefit) for credit losses, Underlying: Provision (benefit) for credit losses (GAAP) $132 $123 ($25) $9 7% $157 NM $474 ($411) $885 NM Less: Notable items — — — — — — — 169 — 169 100 Provision (benefit) for credit losses, Underlying (non-GAAP) $132 $123 ($25) $9 7% $157 NM $305 ($411) $716 NM Income before income tax expense, Underlying: Income before income tax expense (GAAP) G $828 $813 $684 $15 2% $144 21% $2,655 $2,977 ($322) (11%) Less: Expense before income tax benefit related to notable items (43) (46) (51) 3 7 8 16 (462) (105) (357) NM Income before income tax expense, Underlying (non-GAAP) H $871 $859 $735 $12 1% $136 19% $3,117 $3,082 $35 1% Income tax expense, Underlying: Income tax expense (GAAP) I $175 $177 $154 ($2) (1%) $21 14% $582 $658 ($76) (12%) Less: Income tax benefit related to notable items (11) (13) (12) 2 15 1 8 (110) (27) (83) NM Income tax expense, Underlying (non-GAAP) J $186 $190 $166 ($4) (2%) $20 12% $692 $685 $7 1% Net income, Underlying: Net income (GAAP) K $653 $636 $530 $17 3% $123 23% $2,073 $2,319 ($246) (11%) Add: Notable items, net of income tax benefit 32 33 39 (1) (3) (7) (18) 352 78 274 NM Net income, Underlying (non-GAAP) L $685 $669 $569 $16 2% $116 20% $2,425 $2,397 $28 1% Net income available to common stockholders, Underlying: Net income available to common stockholders (GAAP) M $621 $611 $498 $10 2% $123 25% $1,960 $2,206 ($246) (11%) Add: Notable items, net of income tax benefit 32 33 39 (1) (3) (7) (18) 352 78 274 NM GAAP) N $653 $644 $537 $9 1% $116 22% $2,312 $2,284 $28 1%

40 Non-GAAP financial measures and reconciliations QUARTERLY TRENDS FULL YEAR 4Q22 Change 2022 Change 4Q22 3Q22 4Q21 3Q22 4Q21 2022 2021 2021 $/bps % $/bps % $/bps % Operating leverage: Total revenue (GAAP) C $2,200 $2,177 $1,720 $23 1.05% $480 27.98% $8,021 $6,647 $1,374 20.68% Less: Noninterest expense (GAAP) E 1,240 1,241 1,061 (1) (0.12) 179 16.93 4,892 4,081 811 19.88 Operating leverage 1.17% 11.05% 0.80% Operating leverage, Underlying: Total revenue, Underlying (non-GAAP) D $2,200 $2,177 $1,720 $23 1.05% $480 27.98% $8,052 $6,647 $1,405 21.15% Less: Noninterest expense, Underlying (non-GAAP) F 1,197 1,195 1,010 2 0.16 187 18.63 4,630 3,976 654 16.46 Operating leverage, Underlying (non-GAAP) 0.89% 9.35% 4.69% Efficiency ratio and efficiency ratio, Underlying: Efficiency ratio E/C 56.36 % 57.02% 61.68 % (66) bps (532) bps 60.99 % 61.40 % (41) bps Efficiency ratio, Underlying (non-GAAP) F/D 54.42 54.90 58.71 (48) bps (429) bps 57.51 59.82 (231) bps Noninterest income as a % of total revenue, Underlying: Noninterest income as a % of total revenue A/C 23 % 24% 35 % (62) bps (1,158) bps 25 % 32 % (707) bps Noninterest income as a % of total revenue, Underlying B/D 23 24 35 (62) bps (1,158) bps 25 32 (678) bpsEffective income tax rate and effective income tax rate, Underlying: Effective income tax rate I/G 21.16% 21.80% 22.40 % (64) bps (124) bps 21.93 % 22.10 % (17) bps Effective income tax rate, Underlying (non-GAAP) J/H 21.37 22.00 22.61 (63) bps (124) bps 22.19 22.21 (2) bps Return on average common equity and return on average common equity, Underlying: Average common equity (GAAP) O $21,276 $22,246 $21,320 ($970) (4%) ($44) —% $21,724 $21,025 $699 3% Return on average common equity M/O 11.56 % 10.91% 9.26 % 65 bps 230 bps 9.02 % 10.49 % (147) bps Return on average common equity, Underlying (non-GAAP) N/O 12.15 11.52 9.97 63 bps 218 bps 10.64 10.86 (22) bps Return on average tangible common equity and return on average tangible common equity, Underlying: Average common equity (GAAP) O $21,276 $22,246 $21,320 ($970) (4%) ($44) —% $21,724 $21,025 $699 3% Less: Average goodwill (GAAP) 8,171 8,131 7,092 40 — 1,079 15 7,872 7,062 810 11 Less: Average other intangibles (GAAP) 199 228 56 (29) (13) 143 NM 181 54 127 235 Add: Average deferred tax liabilities related to goodwill (GAAP) 424 424 383 — — 41 11 413 381 32 8 Average tangible common equity P $13,330 $14,311 $14,555 ($981) (7%) ($1,225) (8%) $14,084 $14,290 ($206) (1%) Return on average tangible common equity M/P 18.46 % 16.96% 13.57 % 150 bps 489 bps 13.91 % 15.44 % (153) bps Return on average tangible common equity, Underlying (non-GAAP) N/P 19.40 17.91 14.61 149 bps 479 bps 16.41 15.98 43 bps Return on average total assets and return on average total assets, Underlying: Average total assets (GAAP) Q $224,970 $225,473 $187,228 ($503) —% $37,742 20% $215,061 $185,106 $29,955 16% Return on average total assets K/Q 1.15 % 1.12% 1.12 % 3 bps 3 bps 0.96 % 1.25 % (29) bps Return on average total assets, Underlying (non-GAAP) L/Q 1.21 1.18 1.20 3 bps 1 bps 1.13 1.30 (17) bps $s in millions, except share, per share and ratio data
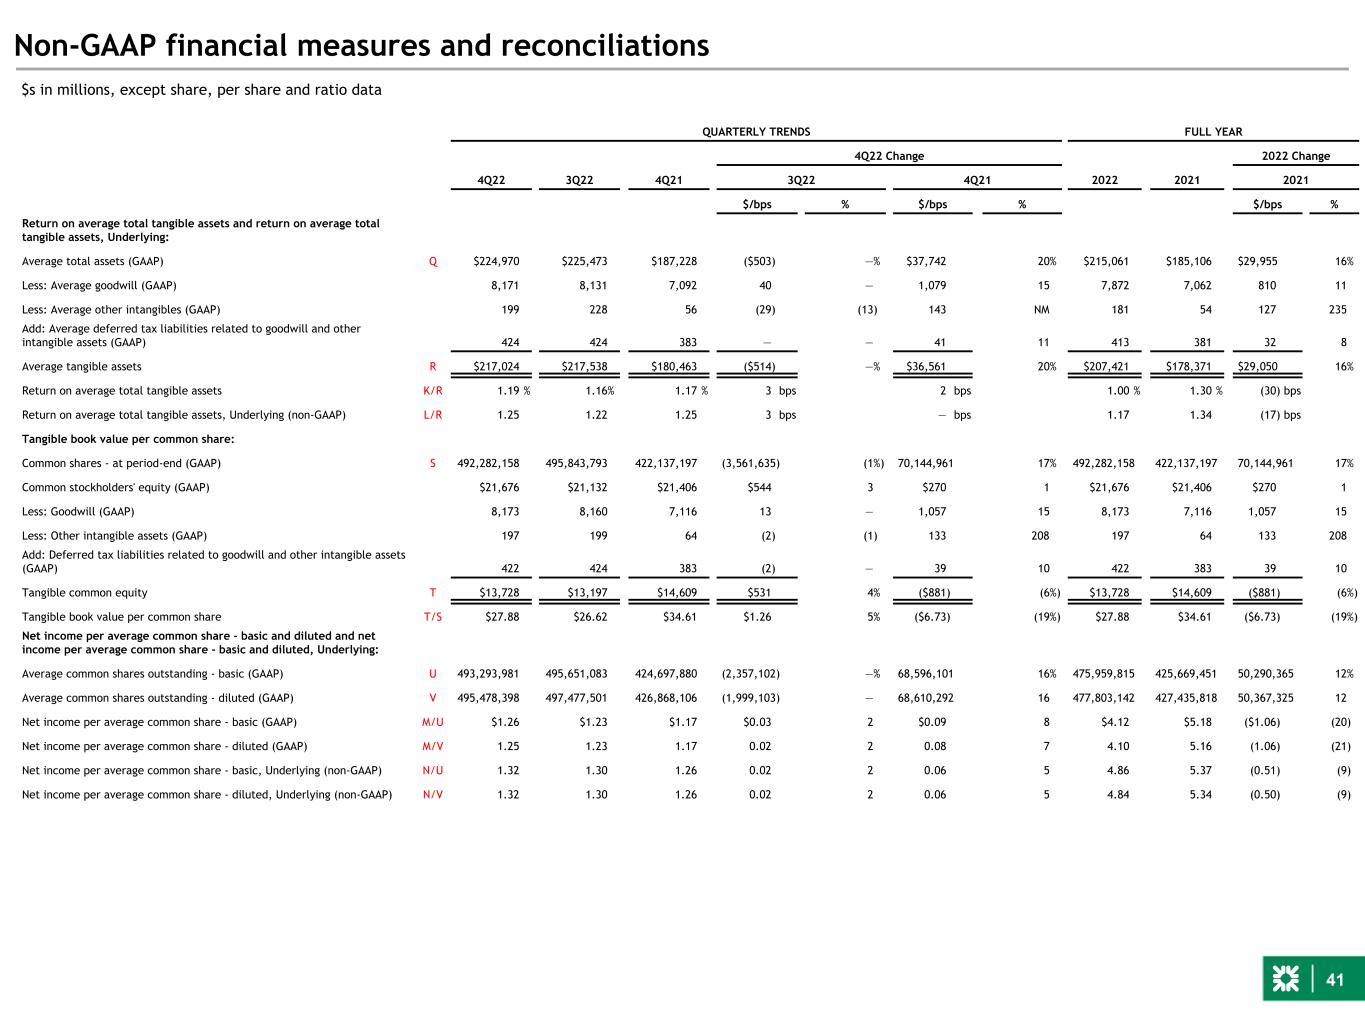
41 Non-GAAP financial measures and reconciliations QUARTERLY TRENDS FULL YEAR 4Q22 Change 2022 Change 4Q22 3Q22 4Q21 3Q22 4Q21 2022 2021 2021 $/bps % $/bps % $/bps % Return on average total tangible assets and return on average total tangible assets, Underlying: Average total assets (GAAP) Q $224,970 $225,473 $187,228 ($503) —% $37,742 20% $215,061 $185,106 $29,955 16% Less: Average goodwill (GAAP) 8,171 8,131 7,092 40 — 1,079 15 7,872 7,062 810 11 Less: Average other intangibles (GAAP) 199 228 56 (29) (13) 143 NM 181 54 127 235 Add: Average deferred tax liabilities related to goodwill and other intangible assets (GAAP) 424 424 383 — — 41 11 413 381 32 8 Average tangible assets R $217,024 $217,538 $180,463 ($514) —% $36,561 20% $207,421 $178,371 $29,050 16% Return on average total tangible assets K/R 1.19 % 1.16% 1.17 % 3 bps 2 bps 1.00 % 1.30 % (30) bps Return on average total tangible assets, Underlying (non-GAAP) L/R 1.25 1.22 1.25 3 bps — bps 1.17 1.34 (17) bps Tangible book value per common share: Common shares - at period-end (GAAP) S 492,282,158 495,843,793 422,137,197 (3,561,635) (1%) 70,144,961 17% 492,282,158 422,137,197 70,144,961 17% Common stockholders' equity (GAAP) $21,676 $21,132 $21,406 $544 3 $270 1 $21,676 $21,406 $270 1 Less: Goodwill (GAAP) 8,173 8,160 7,116 13 — 1,057 15 8,173 7,116 1,057 15 Less: Other intangible assets (GAAP) 197 199 64 (2) (1) 133 208 197 64 133 208 Add: Deferred tax liabilities related to goodwill and other intangible assets (GAAP) 422 424 383 (2) — 39 10 422 383 39 10 Tangible common equity T $13,728 $13,197 $14,609 $531 4% ($881) (6%) $13,728 $14,609 ($881) (6%) Tangible book value per common share T/S $27.88 $26.62 $34.61 $1.26 5% ($6.73) (19%) $27.88 $34.61 ($6.73) (19%) Net income per average common share - basic and diluted and net income per average common share - basic and diluted, Underlying: Average common shares outstanding - basic (GAAP) U 493,293,981 495,651,083 424,697,880 (2,357,102) —% 68,596,101 16% 475,959,815 425,669,451 50,290,365 12% Average common shares outstanding - diluted (GAAP) V 495,478,398 497,477,501 426,868,106 (1,999,103) — 68,610,292 16 477,803,142 427,435,818 50,367,325 12 Net income per average common share - basic (GAAP) M/U $1.26 $1.23 $1.17 $0.03 2 $0.09 8 $4.12 $5.18 ($1.06) (20) Net income per average common share - diluted (GAAP) M/V 1.25 1.23 1.17 0.02 2 0.08 7 4.10 5.16 (1.06) (21) Net income per average common share - basic, Underlying (non-GAAP) N/U 1.32 1.30 1.26 0.02 2 0.06 5 4.86 5.37 (0.51) (9) Net income per average common share - diluted, Underlying (non-GAAP) N/V 1.32 1.30 1.26 0.02 2 0.06 5 4.84 5.34 (0.50) (9) $s in millions, except share, per share and ratio data
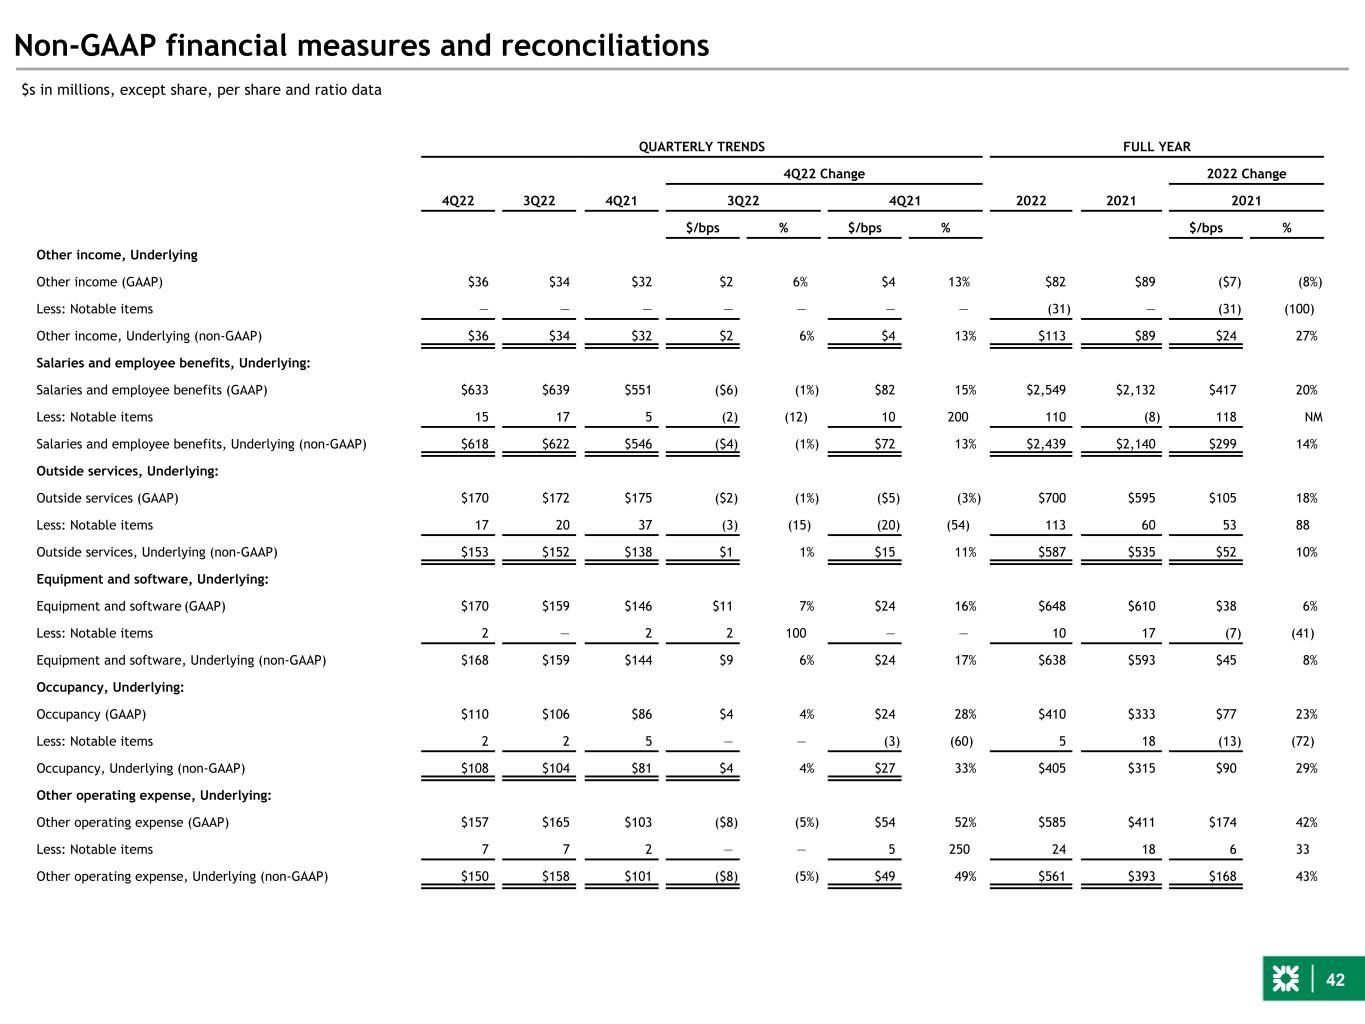
42 Non-GAAP financial measures and reconciliations QUARTERLY TRENDS FULL YEAR 4Q22 Change 2022 Change 4Q22 3Q22 4Q21 3Q22 4Q21 2022 2021 2021 $/bps % $/bps % $/bps % Other income, Underlying Other income (GAAP) $36 $34 $32 $2 6% $4 13% $82 $89 ($7) (8%) Less: Notable items — — — — — — — (31) — (31) (100) Other income, Underlying (non-GAAP) $36 $34 $32 $2 6% $4 13% $113 $89 $24 27% Salaries and employee benefits, Underlying: Salaries and employee benefits (GAAP) $633 $639 $551 ($6) (1%) $82 15% $2,549 $2,132 $417 20% Less: Notable items 15 17 5 (2) (12) 10 200 110 (8) 118 NM Salaries and employee benefits, Underlying (non-GAAP) $618 $622 $546 ($4) (1%) $72 13% $2,439 $2,140 $299 14% Outside services, Underlying: Outside services (GAAP) $170 $172 $175 ($2) (1%) ($5) (3%) $700 $595 $105 18% Less: Notable items 17 20 37 (3) (15) (20) (54) 113 60 53 88 Outside services, Underlying (non-GAAP) $153 $152 $138 $1 1% $15 11% $587 $535 $52 10% Equipment and software, Underlying: Equipment and software (GAAP) $170 $159 $146 $11 7% $24 16% $648 $610 $38 6% Less: Notable items 2 — 2 2 100 — — 10 17 (7) (41) Equipment and software, Underlying (non-GAAP) $168 $159 $144 $9 6% $24 17% $638 $593 $45 8% Occupancy, Underlying: Occupancy (GAAP) $110 $106 $86 $4 4% $24 28% $410 $333 $77 23% Less: Notable items 2 2 5 — — (3) (60) 5 18 (13) (72) Occupancy, Underlying (non-GAAP) $108 $104 $81 $4 4% $27 33% $405 $315 $90 29% Other operating expense, Underlying: Other operating expense (GAAP) $157 $165 $103 ($8) (5%) $54 52% $585 $411 $174 42% Less: Notable items 7 7 2 — — 5 250 24 18 6 33 Other operating expense, Underlying (non-GAAP) $150 $158 $101 ($8) (5%) $49 49% $561 $393 $168 43% $s in millions, except share, per share and ratio data
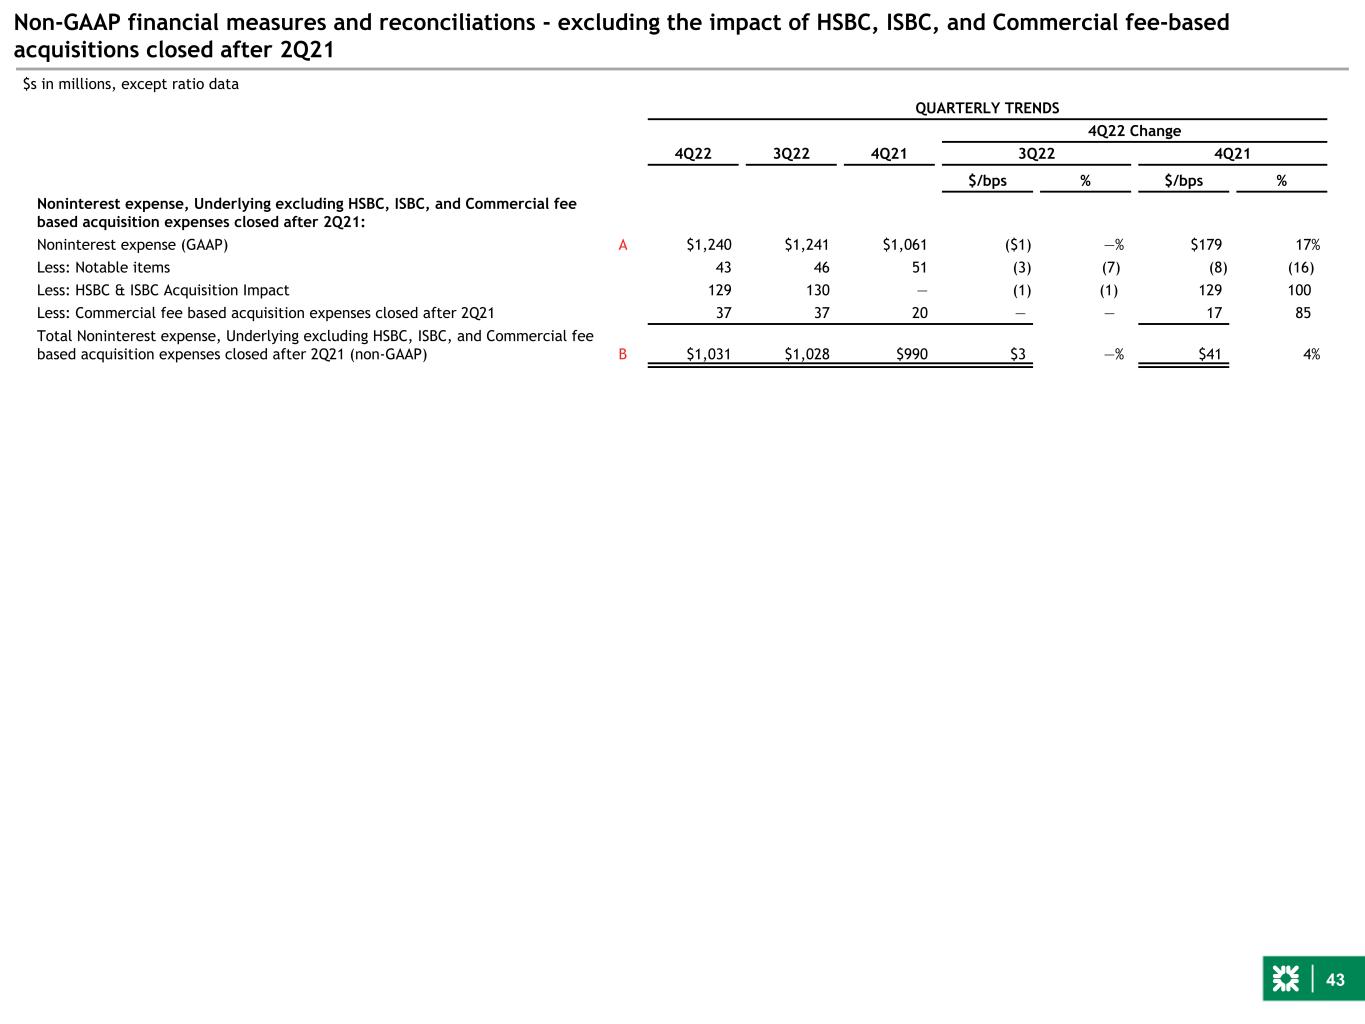
43 Non-GAAP financial measures and reconciliations - excluding the impact of HSBC, ISBC, and Commercial fee-based acquisitions closed after 2Q21 QUARTERLY TRENDS 4Q22 Change 4Q22 3Q22 4Q21 3Q22 4Q21 $/bps % $/bps % Noninterest expense, Underlying excluding HSBC, ISBC, and Commercial fee based acquisition expenses closed after 2Q21: Noninterest expense (GAAP) A $1,240 $1,241 $1,061 ($1) —% $179 17% Less: Notable items 43 46 51 (3) (7) (8) (16) Less: HSBC & ISBC Acquisition Impact 129 130 — (1) (1) 129 100 Less: Commercial fee based acquisition expenses closed after 2Q21 37 37 20 — — 17 85 Total Noninterest expense, Underlying excluding HSBC, ISBC, and Commercial fee based acquisition expenses closed after 2Q21 (non-GAAP) B $1,031 $1,028 $990 $3 —% $41 4% $s in millions, except ratio data
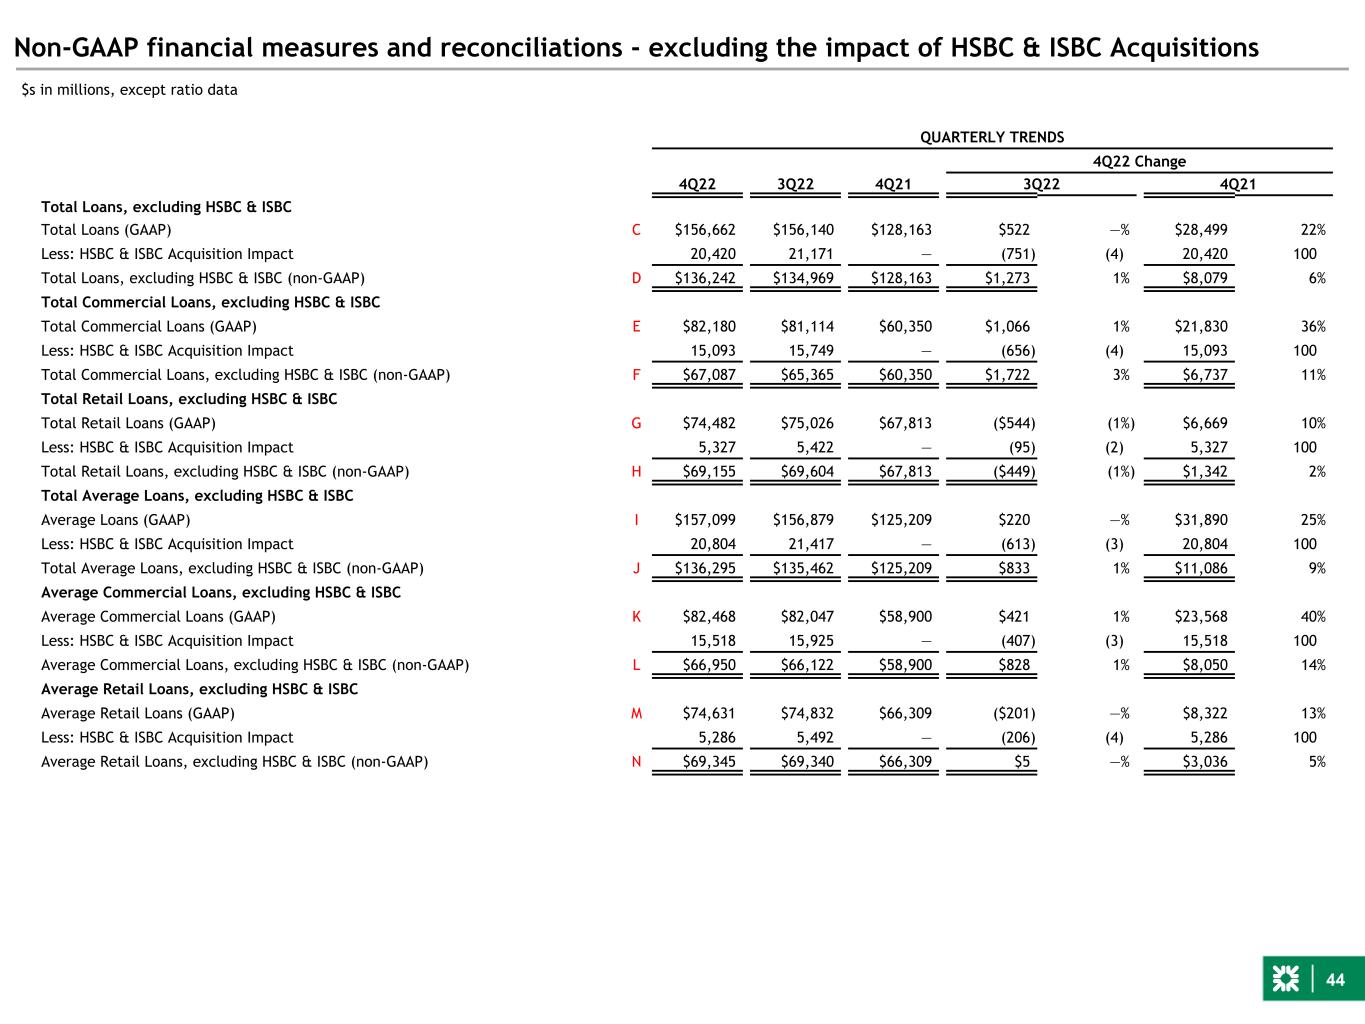
44 Non-GAAP financial measures and reconciliations - excluding the impact of HSBC & ISBC Acquisitions QUARTERLY TRENDS 4Q22 Change 4Q22 3Q22 4Q21 3Q22 4Q21 Total Loans, excluding HSBC & ISBC Total Loans (GAAP) C $156,662 $156,140 $128,163 $522 —% $28,499 22% Less: HSBC & ISBC Acquisition Impact 20,420 21,171 — (751) (4) 20,420 100 Total Loans, excluding HSBC & ISBC (non-GAAP) D $136,242 $134,969 $128,163 $1,273 1% $8,079 6% Total Commercial Loans, excluding HSBC & ISBC Total Commercial Loans (GAAP) E $82,180 $81,114 $60,350 $1,066 1% $21,830 36% Less: HSBC & ISBC Acquisition Impact 15,093 15,749 — (656) (4) 15,093 100 Total Commercial Loans, excluding HSBC & ISBC (non-GAAP) F $67,087 $65,365 $60,350 $1,722 3% $6,737 11% Total Retail Loans, excluding HSBC & ISBC Total Retail Loans (GAAP) G $74,482 $75,026 $67,813 ($544) (1%) $6,669 10% Less: HSBC & ISBC Acquisition Impact 5,327 5,422 — (95) (2) 5,327 100 Total Retail Loans, excluding HSBC & ISBC (non-GAAP) H $69,155 $69,604 $67,813 ($449) (1%) $1,342 2% Total Average Loans, excluding HSBC & ISBC Average Loans (GAAP) I $157,099 $156,879 $125,209 $220 —% $31,890 25% Less: HSBC & ISBC Acquisition Impact 20,804 21,417 — (613) (3) 20,804 100 Total Average Loans, excluding HSBC & ISBC (non-GAAP) J $136,295 $135,462 $125,209 $833 1% $11,086 9% Average Commercial Loans, excluding HSBC & ISBC Average Commercial Loans (GAAP) K $82,468 $82,047 $58,900 $421 1% $23,568 40% Less: HSBC & ISBC Acquisition Impact 15,518 15,925 — (407) (3) 15,518 100 Average Commercial Loans, excluding HSBC & ISBC (non-GAAP) L $66,950 $66,122 $58,900 $828 1% $8,050 14% Average Retail Loans, excluding HSBC & ISBC Average Retail Loans (GAAP) M $74,631 $74,832 $66,309 ($201) —% $8,322 13% Less: HSBC & ISBC Acquisition Impact 5,286 5,492 — (206) (4) 5,286 100 Average Retail Loans, excluding HSBC & ISBC (non-GAAP) N $69,345 $69,340 $66,309 $5 —% $3,036 5% $s in millions, except ratio data


