EXHIBIT D

Republic of Panama
This description of the Republic of Panama is dated as of September 29, 2017 and appears as Exhibit D to the Republic of Panama’s Annual Report on Form 18-K to the U.S. Securities and Exchange Commission for the fiscal year ended December 31, 2016.
D-1
TABLE OF CONTENTS
| | | | |
| | | Page | |
RECENT DEVELOPMENTS | | | D-5 | |
THE REPUBLIC OF PANAMA | | | D-15 | |
THE PANAMANIAN ECONOMY | | | D-18 | |
STRUCTURE OF THE PANAMANIAN ECONOMY | | | D-30 | |
THE PANAMA CANAL | | | D-36 | |
THE COLÓN FREE ZONE | | | D-42 | |
EMPLOYMENT AND LABOR | | | D-44 | |
PUBLIC FINANCE | | | D-49 | |
FINANCIAL SYSTEM | | | D-56 | |
FOREIGN TRADE AND BALANCE OF PAYMENTS | | | D-63 | |
PUBLIC SECTOR DEBT | | | D-73 | |
TABLES AND SUPPLEMENTARY INFORMATION | | | D-79 | |
The fiscal year of the Government of the Republic of Panama (the “Government”) ends on December 31. The twelve-month period ended December 31, 2016 is referred to in this description of the Republic of Panama as “2016” and other years are referred to in a similar manner unless otherwise indicated. All references to “U.S.$”, “$” or “dollars” are to United States Dollars.
Totals in certain tables in this description of the Republic of Panama may differ from the sum of the respective individual items in such tables due to rounding.
D-2
INDEX OF TABLES
| | | | | | |
| | | | | Page | |
TABLE NO. 1 | | Selected Panamanian Economic Indicators | | | D-13 | |
TABLE NO. 2 | | Inflation (percentage change from previous period) | | | D-26 | |
TABLE NO. 3 | | Gross Domestic Product | | | D-27 | |
TABLE NO. 4 | | Sectoral Origin of Gross Domestic Product (in millions of dollars) | | | D-27 | |
TABLE NO. 5 | | Percentage Change from Prior Year for Sectoral Origin of Gross Domestic Product (percentage change) | | | D-28 | |
TABLE NO. 6 | | Sectoral Origin of Gross Domestic Product (as percentage of GDP) | | | D-29 | |
TABLE NO. 7 | | Selected State-Owned Enterprises 2016 Financial Statistics (in millions of dollars) | | | D-31 | |
TABLE NO. 8 | | Panama Canal Principal Statistics | | | D-36 | |
TABLE NO. 9 | | Labor Force and Employment | | | D-45 | |
TABLE NO. 10 | | Average Real Monthly Wages | | | D-46 | |
TABLE NO. 11 | | Budgeted Expenditures of the Central Government by Function (in millions) | | | D-49 | |
TABLE NO. 12 | | Fiscal Performance - Central Government | | | D-51 | |
TABLE NO. 13 | | Fiscal Performance - Consolidated Non-Financial Public Sector | | | D-53 | |
TABLE NO. 14 | | Central Government Operations (in millions of dollars) | | | D-53 | |
TABLE NO. 15 | | Consolidated Non-Financial Public Sector Operations (in millions of dollars) | | | D-54 | |
TABLE NO. 16 | | International Reserves (in millions of dollars) | | | D-55 | |
TABLE NO. 17 | | Largest Banking Institutions (assets in millions of dollars) | | | D-56 | |
TABLE NO. 18 | | The Banking Sector (in millions of dollars) | | | D-57 | |
TABLE NO. 19 | | Banco Nacional de Panamá Balance Sheet (in millions of dollars) | | | D-60 | |
TABLE NO. 20 | | Composition of Merchandise Exports, F.O.B. (in millions of dollars) | | | D-64 | |
TABLE NO. 21 | | Composition of Merchandise Imports, C.I.F. (in millions of dollars) | | | D-65 | |
TABLE NO. 22 | | Direction of Merchandise Trade (as percentage of total) | | | D-67 | |
TABLE NO. 23 | | Foreign Direct Investment in Panama by Investor Residence | | | D-68 | |
TABLE NO. 24 | | Foreign Direct Investment in Panama by Category of Economic Activity | | | D-70 | |
TABLE NO. 25 | | Balance of Payments (in millions of dollars) | | | D-72 | |
TABLE NO. 26 | | Public Sector Internal Debt (in millions of dollars) | | | D-74 | |
TABLE NO. 27 | | Public Sector External Debt (in millions of dollars) | | | D-75 | |
TABLE NO. 28 | | Public Sector External Debt Amortization (in millions of dollars) | | | D-75 | |
TABLE NO. 29 | | External Direct Debt of the Republic Central Government | | | D-79 | |
TABLE NO. 30 | | External Debt Guaranteed by the Republic Decentralized Institutions | | | D-80 | |
TABLE NO. 31 | | Internal Funded Debt Securities of the Republic | | | D-80 | |
D-3
D-4
RECENT DEVELOPMENTS
Presentation of Economic and Other Information
The Office of the Comptroller General has updated the base year used for the System of National Accounts from 1996 to 2007. International best practices call for updating the constant GDP base year at least every 10 years to reflect structural changes in production, consumption and prices, and to ensure that the National Accounts provide a more accurate depiction of the economy given its dynamism. Data for the Colón Free Zone (“CFZ”) and the Panama Canal have not yet been published using the new base year.
Government financial statistics and related tables are presented in accordance with the IMF Government Finance Statistics Manual 1986 (“GFSM 1986”). Real sector statistics are presented in accordance with the UN 1993 System of National Accounts (“SNA 1993”); however, with the change of base year from 1996 to 2007, financial intermediation activity is being measured following the UN 2008 System of National Accounts (“SNA 2008”). Balance of payments statistics for 2013 to 2016 were calculated pursuant to the Sixth Edition of the Balance of Payments and International Investment Position Manual published by the International Monetary Fund (“IMF”). Balance of payments statistics for 2012 were calculated pursuant to the Fifth Edition of the IMF Balance of Payments Manual.
Open unemployment figures are no longer presented. Unemployment figures are now used.
Political Developments
On May 4, 2014, Panama held general elections for the posts of president, members of the Assembly and other regional posts. The then-incumbent Vice President, Juan Carlos Varela, was elected President with 39.08% of the vote obtained by the “El Pueblo Primero” alliance composed of the Partido Popular and Partido Panameñista. President Varela took office on July 1, 2014. On July 1, 2014, President Juan Carlos Varela appointed Dulcidio De La Guardia as Minister of Economy and Finance. On July 1, 2014, Iván A. Zarak Arias was appointed Vice Mister of Economy and Eyda Varela de Chinchilla was appointed Vice Minister of Finance. Isabel de Saint Malo de Alvarado was elected as Vice President on the same day as the President and was appointed Minister of Foreign Affairs.
On December 3, 2013, then presidential candidate Varela announced the priorities of his administration in a Plan for the El Pueblo Primero Alliance. The Plan included, among other initiatives, implementation of price controls on basic foods to reduce the cost of living and initiatives to maintain the growth of the Panamanian economy through public investment projects, such as plans to provide potable water nationwide; to construct Metro lines 2 and 3 to San Miguelito and East and West Panama City; to construct 500 kilometers of new highways, 15 health centers and four hospitals; and to increase the coverage of the irrigation system from 20% to 40% of all cultivated land. The Plan also called for new rules to increase transparency in the government and to reduce corruption and cronyism.
Through Executive Decree No. 689 of December 26, 2014, the Varela administration adopted its five-year Strategic Government Plan, “Un solo país”. The Plan includes the economic and social strategy, the financial program and a five-year indicative public investment plan that establishes the criteria for public expenditure for prioritized sectors, programs and projects. Such prioritized sectors include, among others, transportation, energy, agriculture and tourism, while projects and programs include a project to improve access to potable water and a program to improve education.
Upon taking office, the Varela administration initiated investigations of possible corruption by former government officials who served in the administration of President Ricardo Martinelli. Several former officials have been subject to preventive measures during the pendency of proceedings. On March 11, 2016, public prosecutor Jeronimo Mejía issued a request to the Ministry of Foreign Affairs to seek the extradition of former president Ricardo Martinelli from the United States. The Supreme Court of Justice previously had ordered the provisional arrest of former president Martinelli and authorized Mr. Mejía to take any necessary actions to effect the arrest. The former president is accused of illegal telephone wiretapping, invasion of privacy and crimes against the public administration. On September 27, 2016, the Ministry of Foreign Affairs submitted a formal request to the United States for the extradition of former president Martinelli. On June 12, 2017, former president Martinelli was arrested in the Coral Gables, Florida and detained in a federal detention center in Miami, Florida. On August 31, 2017, a United States magistrate judge of the U.S. District Court for the Southern District of Florida issued an order certifying the extradition of former president Martinelli and committing Martinelli to the custody of the U.S. Marshall, to be held at the federal detention center in Miami, Florida or another suitable facility pending final disposition of the matter by the U.S. Secretary of State to the designated agents of the Government of Panama.
D-5
In January and February 2017, the Supreme Court opened two new investigations against former President Ricardo Martinelli. In January 2017, the Supreme Court opened an investigation into accusations that former President Martinelli attempted to extort Impregilo, an Italian construction company, to pay for the construction of a hospital in Veraguas province. In February 2017, the Supreme Court opened an investigation into accusations that former President Martinelli embezzled funds from loan disbursements totaling U.S.$30 million made by the Social Security Fund to HPC Contratas P&V, contractor for the Amador Convention Center construction project. The Supreme Court has opened a total of nine investigations against former President Martinelli, which are based on allegations of (i) extortion of Impregilo, (ii) embezzlement of funds from loan disbursements made by the Social Security Fund, (iii) irregularities in the purchase of dehydrated foods under the former Programa de Ayuda Nacional (“National Assistance Program”); (iv) illegal telephone wiretapping; (v) irregularities in the purchase of grains under the former National Assistance Program; (vi) insider trading of shares in Petaquilla Minerals Ltd.; (vii) crimes against the public administration (acceptance of bribes); (viii) unlawful issuance of 353 pardons; and (ix) unlawful conduct in connection with an alleged usurpation of lands in Veraguas province. The investigations have not resulted in charges against former President Martinelli, which require his presence in Panama.
In the Assembly, 26 of the 71 seats belong to the Partido Revolucionario Democrático (“PRD”), 24 seats belong to Cambio Democrático, 16 seats belong to the Partido Panameñista, two seats belong to the Partido Molirena, one seat belongs to Partido Popular, one seat belongs to Partido Alianza and one representative has no party affiliation. On July 1, 2017, Congresswoman Yanibel Abrego, of the Cambio Democrático party, was elected President of the National Assembly for the 2017–2018 period. Congressman Jorge Ivan Arrocha, of the Partido Panameñista party, and Congressman Edwin Zuñiga, of the Cambio Democrático party, were elected as the first and second Vice Presidents of the National Assembly, respectively.
On August 7, 2017, the National Assembly confirmed the appointments of Roxana Cardenas as the new CEO of the Empresa Nacional de Autopistas (National Highways Company, “ENA”) and Jorge Luis Gonzalez, Presidential Goals Secretary, as the representative of the Executive Branch on the board of directors of the National Water Institute, IDAAN.
On July 31, 2017, Manuel Grimaldo, former Vice Minister of Interior Commerce and Industries, was appointed as the General Manager of the Colon Free Zone. Mr. Grimaldo succeeds Surse Pierpoint, who was appointed to serve as an advisor for development projects at Tocumen International Airport. The National Assembly confirmed Mr. Grimaldo in the position on August 7, 2017.
On July 6, 2017, Mr. Gilberto Ferrari was appointed as the new General Manager of Empresa de Transmisión Eléctrica Panameña (Panamanian Electric Transmission Company, ETESA). Mr. Ferrari succeeds Oscar Rendoll, who served as interim general manager of ETESA after Mr. Iván Barria resigned following the occurrence of two blackouts in less than a week in March 2017.
On March 31, 2017, Mirei Endara resigned as Minister of Environment, citing personal reasons. Ms. Endara was the first person to serve in this position, following the establishment of the Ministry of Environment in 2015. As of September 2017, Mr. Emilio Sempris is serving as Acting Minister of Environment.
On January 4, 2017, Alfredo Juncá was elected Magistrate of the Electoral Tribunal for a period of ten years. Mr. Juncá succeeded Erasmo Pinilla, who served in the position for twenty years.
On January 3, 2017, President Varela announced the appointment of Maria Luisa Romero as Minister of Government. Minister Romero succeeded Milton Henriquez, who resigned upon being appointed Ambassador to Spain. On January 3, 2017, President Varela also announced the appointment of Carlos Rubio as Vice Minister of Government, the position held by Ms. Romero prior to her appointment as Minister of Government.
Recent Government Actions
On September 18, 2017, the Assembly approved Bill No. 509 to raise the property tax exemption for principal residences or familial tax patrimony from U.S.$30,000 to U.S.$120,000 (with this upper limit subject to revision every five years). For principal residences or familial tax patrimony, Bill 509 then sets forth property tax rate brackets of 0.5% from U.S.$120,001 to U.S.$700,000 and 0.7% above U.S.$700,000. For commercial and industrial properties, second residences, and other properties, Bill No. 509 provides a tax exemption for the first U.S.$30,000, followed by brackets of 0.6% for U.S.$30,001 to U.S.$250,000; 0.8% for U.S.$250,001 to U.S.$500,000; and 1.0% above U.S.$500,000. In addition, Bill No. 509 provides a three-year property tax exemption for registered purchases of first homes with a value of up to U.S.$300,000 and imposes tax withholding obligations on mortgage providers for commercial and industrial properties and second residences.
D-6
On August 23, 2017, the Assembly passed Bill No. 305, which would reform the procurement law. Bill No. 305 provides for the elimination of abbreviated public contracts, international certification of insurers and obligations to train personnel, among other reforms.
On August 8, 2017, the Minister of Agriculture, Eduardo Carles, announced an increase in import tariffs on milk derivatives from 15% to 30%. The measure returns the tariff to its historical levels, prior to a reduction that was implemented in 2012.
On August 8, 2017, the Executive Branch, through Cabinet Decree No. 82, approved the creation of the Empresa Pública de Saneamiento de Panamá (National Sanitation Public Enterprise). This new state-owned enterprise will manage the sewage systems in the districts of Panama, San Miguelito, Arraiján and La Chorrera.
On August 1, 2017, the Public Ministry of the Republic of Panama announced that it had entered into a cooperation agreement with Odebrecht, pursuant to which Odebrecht will pay a fine of U.S.$220 million to the Government and will provide certain information related to embezzlement and bribery charges. Of the total fine, U.S.$100 million relates to use of the financial sector for irregular purposes.
On July 26, 2017, the Minister of Economy and Finance presented to the National Assembly the 2018 budget bill. The proposed national budget for 2018, totaling U.S.$23,397.1 million, would represent an increase of 7.9% compared to the 2017 national budget.
In July 2017, Executive Decree No. 86 extended for six additional months the temporary price caps on 22 products that are part of the family food basket; these price caps were first imposed by Executive Decree No. 165 of July 1, 2014 and, since then, have been extended continuously in six-month intervals, with certain adjustments. The price caps apply throughout the national territory except for Darien province and the island territories (which may be subject to a later determination). Thirteen items have been assigned a maximum price and nine have been assigned both a maximum price and a maximum gross margin of sale, ranging from 10% to 15%. As to each of those nine items, retailers have an obligation to sell at least one brand at the maximum price and the rest of the brands at the maximum gross margin of sale. The Decree created a Price Adjustment Commission, comprised of the Ministers of Commerce and Industry, Agricultural Development and Economy and Finance, which evaluates price adjustment requests from companies or producers’ associations. This Commission was authorized to adjust prices on the regulated products in response to market conditions. Retailers that offer the remaining 28 products that are part of the family food basket listed in the Decree are required to give advance notice to the Authority for Consumer Protection and Defense of Competition of any increase in the retail price of any of these products.
On June 13, 2017, Panama established official diplomatic relations with the People’s Republic of China. On the same date, Panama terminated diplomatic relations with the Republic of China, Taiwan. On September 13, 2017, Mr. Francisco Carlo Escobar Pedreschi presented his credentials as Panama’s ambassador to the People’s Republic of China.
In March 2017, the Cabinet Council approved modifications and amendments to Law No. 76 of 2009, which provides for measures intended to promote and develop industry. The modifications and amendments establish a National Industrial Competitiveness Program, which includes initiatives designed to strengthen human capital and to finance and develop micro, small, and medium enterprises. An industrial competitiveness program is intended to coordinate institutional actors and the private sector for the design and execution of plans to develop the industrial sector and to promote exports through initiatives related to market promotion, food safety, and human capital.
In March 2017, President Varela signed Law No. 389, which amends Law No. 40 of 2010 to provide students attending private schools up to U.S.$270 per school year for primary education expenses; U.S.$360 per school year for middle school expenses; and U.S.$450 per school year for high school expenses. More than 75,000 students from private schools in Panama whose tuition and monthly payments do not exceed U.S.$2,000 per year may receive the scholarship.
D-7
In February 2017, the Assembly approved Panama’s accession to the Convention on Mutual Administrative Assistance in Tax Matters (“MAC”) that Panama had signed in October 2016. By acceding to the MAC, the number of jurisdictions with which Panama may formally exchange information increases from 30 to 107.
In February 2017, Executive Decree No. 001–17 extended increases to import tariffs on certain flowers, coal, clinker (cement), and garments, which had been initially imposed in August 2016. The increased tariffs, which will not apply to imports that qualify for certain preferential tariff rates, are scheduled to expire on December 31, 2017. In March 2017, Executive Decree No. 001–17 was amended to increase tariffs on certain additional products, including coffee, wood boards, paper towel, aluminum and certain wires and cables; this amendment also will not apply to imports that qualify for certain preferential tariff rates.
Law No. 4 of February 17, 2017 reformed the Judicial Code, the Criminal Code, and the Code of Criminal Procedure. Law No. 4 addresses policies related to extradition, penitentiary overcrowding, and criminal prosecution and seeks to conform Panamanian criminal procedures with international standards. Law No. 4 includes provisions concerning prison conditions, earned time programs, rehabilitation programs, clemency policies, social integration of former prisoners and judicial efficiency.
In January 2017, the Government published for the first time a “National Risk Evaluation for the Prevention of Money Laundering and Financing of Terrorism.” The analysis identifies the risk level of money laundering in connection with different economic activities to inform the development of appropriate public policies and to direct resources effectively. The report concluded that internal crime is a source of money laundering in Panama; Panama is vulnerable to money laundering from overseas crime; and that some services and juridical structures in Panama could be abused abroad for money laundering. The report also concluded that the financing of terrorism is a low risk in Panama, in part due to the legal framework and institutional capacity.
In January 2017, the Government requested cancellation of a contract with Odebrecht for development of the Hydroelectric Project Chan II. In February 2017, Odebrecht accepted an action plan proposed by the Government to cancel the contract. The Government estimates that construction by a new contractor could require up to three years.
On April 3, 2016, international media published reports regarding an investigation by the International Consortium of Investigative Journalists (the “ICIJ”), the German newspaper Süddeutsche Zeitung and several of their media partners relating to confidential offshore financial arrangements revealed by documents leaked from Mossack Fonseca & Co., a law firm that is based in Panama. As a result of these media reports, on April 8, 2016, the French government added Panama to its list of Non-Cooperative States and Territories for French tax purposes. On May 9, 2016, the ICIJ published a database containing the financial and attorney-client communications that reportedly were leaked from Mossack Fonseca & Co., which involve 214,488 offshore entities in more than 200 countries and territories. The disclosure has had significant consequences for politicians and high profile individuals from around the world whose confidential financial arrangements were made public. In July 2016, the U.S. Department of Justice reportedly began to investigate whether employees of Mossack Fonseca knowingly participated in money laundering and tax evasion. In response to the disclosure and public criticism that followed, on April 29, 2016, Panama established a special independent committee composed of national and international experts, such as Nobel economics laureate Joseph Stiglitz, to evaluate existing practices and to propose measures to assist Panama in combatting international tax evasion and to strengthen Panama as a global financial center with best practices concerning transparency. Additionally, the Attorney General instructed Javier Carballo, an organized crime public prosecutor, to investigate whether any illegal behavior took place in relation to the activities of Mossack Fonseca & Co. On August 5, 2016, Joseph Stiglitz and Eric Pieth resigned from the special independent committee, expressing concerns relating to the transparency of the work of the committee. In November 2016, the committee delivered its report to the Government with recommendations to protect the integrity of the international logistics and corporate and financial services sectors in Panama.
The Economy
In the first six months of 2017, estimated GDP growth was 5.8%, compared to 4.9% for the same period in 2016. Inflation, as measured by the average CPI with base year 2013, was 0.7% in the first six months of 2017. At the end of the first quarter of 2017, the unemployment rate was 5.6%, the same as that of the first quarter of 2016.
The transportation, storage and telecommunications sector increased by an estimated 12.6% for the first six months of 2017 compared to the same period in 2016, primarily due to an increase in the operations of the Panama Canal, air transportation and ports.
D-8
Mining activities increased by 8.1% in the first six months of 2017 compared to the same period in 2016, reflecting a contribution of 1.8% of GDP, due to the increase of demand of raw materials for the construction industry. The construction sector grew 8.1% in the first six months of 2017 compared to the same period in 2016, primarily due to the execution of public and private projects, and its contribution to GDP increased from 16.5% in the first six months of 2016 to 16.9% for the same period in 2017. The financial intermediation sector grew by 3.1% in the first six months of 2017 compared to the same period in 2016 and represented a contribution of 7.7% of GDP in the first six months of 2017, a decrease from 7.9% for the same period in 2016. Growth in financial intermediation sector was attributable mainly to banking activity.
The Central Government’s current savings for the first six months in 2017 registered a surplus of U.S.$477 million (0.8% of nominal GDP) compared to a surplus of U.S.$474 million for the same period in 2016 (0.9% of nominal GDP). The Government’s overall deficit decreased from U.S.$1.1 billion in the first six months of 2016 (2.1% of nominal GDP) to a deficit of U.S.$1.0 billion for the same period in 2017 (1.7% of nominal GDP). In the first six months of 2017, Panama’s non-financial public sector balance registered a deficit of U.S.$226 million (0.4% of nominal GDP), an increase from a deficit for the same period in 2016 of U.S.$122 million (0.2% of nominal GDP).
Estimated nominal GDP for 2016 was U.S.$55,187.8 million, representing 4.9% growth compared to preliminary nominal GDP for year 2015 of U.S.$52,132.3 million. Inflation in 2016, as measured by the Panamanian consumer price index, was 0.7%.
In 2016, Panama’s real GDP grew by an estimated 4.9%, compared to 5.8% in 2015. Inflation, as measured by the average CPI with base year 2013, was 0.7% in 2016. The Central Government’s current savings for 2016 registered a surplus of U.S.$1.39 billion (2.5% of nominal GDP), compared to a surplus of U.S.$1.21 billion in 2015 (2.3% of nominal GDP). The Government’s overall deficit increased to U.S.$2.2 billion in 2016 (4.0% of nominal GDP) from U.S.$2.0 billion in 2015 (3.9% of nominal GDP). In 2016, Panama’s non-financial public sector balance registered an adjusted deficit of U.S.$0.8 billion (1.5% of nominal GDP), a decrease from an adjusted deficit of U.S.$1.0 billion (2.0% of nominal GDP) in 2015.
The agriculture sector decreased an estimated 0.1% in 2016, compared to 2015, in part due to due to a decrease in production of vegetables, bananas, pineapple, and muskmelon. The fisheries sector decreased an estimated 8.4% in 2016, compared to 2015, primarily due to the decrease in fishing of commercial species, which resulted in less exports of fresh fish and shrimp. Commerce increased an estimated 3.3% in 2016, compared to 2015, as a result of increased sales of fuel and similar products, beverages, food and tobacco. The hotels and restaurant sector increased an estimated 2.2% in 2016, compared to 2015, primarily due to increased performance of services in restaurants. The real estate sector increased an estimated 4.7% in 2016, compared to 2015, primarily due to an increased level of sale activities in the residential sector, which increased by 3.2%.
The Assembly approved Panama’s 2017 budget on October 26, 2016. The 2017 budget contemplates total expenditures of U.S.$21.7 billion, with budget estimates based on an anticipated nominal GDP of U.S.$58.6 billion (5.8% real growth from 2016) and an anticipated consolidated non-financial public sector deficit of approximately U.S.$585 million (approximately 1.0% of estimated nominal GDP) for 2017. The corresponding fiscal deficit permitted under the Social and Fiscal Responsibility Law is approximately U.S.$585 million. Compliance with the Social and Fiscal Responsibility Law is assessed only against year-end results. Due to the seasonality of revenue receipts and year-end dividend payments, fiscal results expressed as a percentage of GDP have historically improved during the second half of the fiscal year. The 2017 budget allocates public recurrent and capital expenditures as follows: 41.6% to the social services; 17.2% to financial services; 15.9% to general services; 12.3% to infrastructure development; 2.3% to development and promotion of production; 1.0% to environment and technology; and 9.7% to other services. Investment for 2017 includes ongoing projects, such as Metro Line 2, the fourth bridge over the Canal, and Ciudad Esperanza (City of Hope, an urban housing project in the Arraiján district of Panama Oeste province for the construction of public housing and community amenities, such as a school, police station, recreation and sports facilities, a business plaza and public offices), and new projects, such as construction of the Technical Institute for Higher Education, Renovación Urbana de Colón (Colón Urban Renewal), and road construction on Panamerican highway between La Chorrera and San Carlos.
The preliminary fiscal deficit of the non-financial public sector for the first six months of 2017 was approximately U.S.$226 million (0.4% of nominal GDP). Article 10 of the Social and Fiscal Responsibility Law, as amended by Law No. 38 of 2012, establishes a ceiling for the adjusted deficit of the non-financial public sector of 1.0% of nominal GDP projected in the budget for the 2017 fiscal year.
D-9
The preliminary fiscal deficit of U.S.$226 million for the non-financial public sector deficit for the six-month period ended on June 30, 2017 represented an increase of U.S.$104 over the deficit of U.S.$122 million registered for the same period of 2016. Total non-financial public sector expenditures for the six-month period ended June 30, 2017 were U.S.$5.9 billion, an increase of U.S.$57 million (1.0%) from U.S.$5.8 billion. Total revenue for the six-month period ended on June 30, 2017 was U.S.$5.6 billion, a decrease of U.S.$47 million (0.8%) from U.S.$5.7 billion for the same period of 2016.
On the expenditure side, non-financial public sector capital expenses totaled U.S.$1,537 million for the first six months of 2017, a decrease of U.S.$151 million (8.9%) compared to U.S.$1,688 million during the same period of 2016. Non-financial public sector current expenses during the six-month period ended on June 30, 2017 amounted to U.S.$4.3 billion, a U.S.$208 million (5.1%) increase from U.S.$4.1 billion during the same period of 2016. On the revenue side, tax revenue during the first six months of 2017 was U.S.$2.9 billion, an increase of U.S.$50 million (1.8%) from U.S.$2.8 billion during the first six months of 2016, while non-tax revenue was U.S.$652 million, an increase of U.S.$13 million (2.0%) from U.S.$639 million for the same period in 2016. Capital revenue during the first six months of 2017 was nil.
Public Debt
As of August 31, 2017, total public debt was U.S.$23,054.4 million. Internal public debt accounted for 22% of total debt, while external public debt accounted for 78% of total debt. The average maturity of the debt portfolio as of August 31, 2017 was 11.3 years, with an average duration of 7.9 years. As of June 30, 2017 local secondary market transactions reached U.S.$355.0 million.
As of December 31, 2016, total public debt was U.S.$21,601.6 million. Internal public debt accounted for 22.2% of total debt, while external public debt accounted for 78.2% of total debt. The average maturity of the debt portfolio as of December 31, 2016 was 10.8 years, with an average duration of 7.7 years. During 2016, Treasury note and Treasury bond issuances totaled U.S.$1,016.2 million and local secondary market transactions reached U.S.$1,266.9 million.
Primary market transactions during 2016 included the issuance of U.S.$698.5 million of Treasury Bonds due 2024 and U.S.$317.7 million of Treasury Notes due 2019. Primary market transactions during the first nine months of 2017 included the issuance of U.S.$352.0 million of Treasury Bonds due 2024.
On May 15, 2017, Panama conducted a liability management transaction involving an issuance of U.S.$1,168,292,000 aggregate principal amount of its 4.500% Global Bonds due 2047; a reopening and issuance of U.S.$253,988,000 aggregate principal amount of its 3.875% Global Bonds due 2028; and a purchase by Panama of U.S.$345,473,000 aggregate principal amount of its 5.200% Global Bonds due 2020. Following the transaction, the aggregate outstanding principal amount of Panama’s 5.200% Global Bonds due 2020 was reduced from U.S.$1,500,000,000 to U.S.$1,154,527,000. On March 10, 2016, Panama issued U.S.$1.0 billion aggregate principal amount of its 3.875% Global Bonds due 2028.
IMF Relationship
Panama is a member of the International Monetary Fund (“IMF”). Under Article IV of the IMF’s Articles of Agreement, the IMF holds bilateral discussions with its member countries, usually every year, to assess their economic health. The IMF Executive Board concluded its most recent Article IV consultation with Panama on May 1, 2017.
The Panama Canal
The Canal plays a significant role in the Panamanian economy. In the Panama Canal Authority (“PCA”) 2016 fiscal year ending on September 30, 2016, Canal transits decreased to 13,114 from 13,874 in fiscal year 2015, while cargo tonnage in fiscal year 2016 decreased to 204.7 million long tons from 229.1 million long tons in fiscal year 2015. According to the PCA, toll revenues for fiscal year 2016 reached U.S.$1,933.0 million, a decrease of 2.9% compared to U.S.$1,991.3 million in fiscal year 2015.
On average, from the Canal’s fiscal year 2012 to the fiscal year 2016, transits through the Canal decreased by 2.2% and cargo tonnage decreased by 1.5%. Factors such as the development of alternative land routes and the increasing size of vessels transiting the Canal have contributed to the decrease in the number of vessels required to transport cargo between 2012 and 2016. However, on average, from fiscal year 2012 to fiscal year 2016, toll revenues have increased by 2.3% per annum, primarily due to an increase in toll rates. In fiscal year 2016, the PCA had a surplus of approximately U.S.$1,163.4 million, a decrease of 14.5% compared to U.S.$1,360.8 million in 2015.
D-10
On September 18, 2017, the Assembly approved the PCA’s budget for its fiscal year ending on September 30, 2018. This budget assumes an increase of 3.9% in transit revenues and an increase of 6.0% in total operating income and projects that dividends to the Central Government at the end of the year will increase by 3.2% from U.S.$1,141 million budgeted for the 2017 fiscal year to U.S.$1,178 million budgeted for the 2018 fiscal year.
In August 2017, the Cabinet Council approved modifications to the Canal tolls structure, pursuant to recommendations from the PCA Board of Directors. The approved adjustments will apply to all market segments and are scheduled to take effect on October 1, 2017. For the container carrier segment, the revised tolls structure will offer reduced rates on containers that are loaded on their return trip; this opportunity will be available to neopanamax vessels taking round-trip passages through the Canal, provided that: (1) the vessel has a use rate of at least 70% in the northern transit, and (2) the time between north and south transit does not exceed twenty-eight days. The revised structure also modifies tolls for ships carrying liquefied natural gas or liquefied petroleum gas. In addition, “container ships / loose cargo in bulk” were reclassified from the “other” segment to the “general cargo” segment, which is expected to result, typically, in lower rates for clients in this category.
On June 26, 2016, the PCA completed an expansion project involving the construction of a third set of locks. The project was authorized by the Assembly in July 2006 pursuant to a U.S.$5.25 billion expansion plan, which was approved in a national referendum held in October 2006. In July 2009, a contract for construction of the third set of locks was awarded to the Grupo Unidos por el Canal (“GUPCSA”) consortium, composed of Sacyr Vallehermoso, S.A., Impregilo S.p.A., Jan de Nul n.v., and Constructora Urbana, S.A., for a total base price of approximately U.S.$3.1 billion. Pursuant to the construction contract, disputes arising from the project may be submitted to a Dispute Adjudication Board (“DAB”), whose determinations may be challenged under the International Chamber of Commerce (“ICC”) Rules of Arbitration. As of March 2017, claims by GUPCSA against the PCA totaled approximately U.S.$6.06 billion; these claims are in different stages of the conflict resolution process established under the contract.
In January 2016, the DAB issued two decisions regarding certain claims by GUPCSA. One of the DAB decisions denied all claims presented by GUPCSA in respect of labor costs and benefits arising from an agreement between the Panamanian Chamber of Construction and a construction union. In the second DAB decision, GUPCSA claimed labor costs associated with time extensions granted in previous decisions on claims concerning concrete, basalt and a strike by construction union members based on a contractual clause pertaining to scaling of manual labor costs; the DAB awarded GUPCSA U.S.$24.6 million on this claim. In July 2016, the DAB issued three decisions. In one decision, the DAB denied claims by GUPCSA for U.S.$99.0 million and a 76-day contract extension in connection with additional costs that resulted from allegedly unforeseeable and adverse conditions in the Pacific Site. In the two other decisions, the DAB awarded U.S.$6.4 million and U.S.$0.4 million for claims based on certain laboratories and the drainage of certain lagoons. In six other decisions issued in 2016, the DAB recognized U.S.$56.6 million of claims by GUPCSA, which had petitioned for U.S.$119.0 million in the six disputes; the PCA reserved its right to submit these DAB decisions to ICC arbitration. In December 2016, the PCA received from GUPCSA two new requests for ICC arbitration with claims totaling U.S.$2.4 billion; GUPCSA subsequently instituted the two arbitrations with the ICC.
In January 2017, the DAB issued a ruling on a claim by GUPCSA for U.S.$114.0 million based on cost overruns related to the quality and quantity of basalt, the availability of sites for disposal of excavated material and the physical conditions in the area where the water basins were built. The DAB’s ruling recognized U.S.$4.0 million of the claim, due to physical conditions of the water basin area, while the other components of the claims were denied. In July 2017, an ICC arbitral tribunal issued a decision dismissing each claim concerning a temporary cofferdam, which had totaled U.S.$218 million, while also awarding to the PCA more than U.S.$22.9 million in costs and expenses from the arbitration proceeding.
According to the PCA, as of September 30, 2016, 224 neopanamax ships had traversed the expanded Canal, including ships carrying liquid natural gas and liquid petroleum gas. One official incident had been registered as of September 30, 2016, which had not led to any claims on behalf of the ship. On September 5, 2017, the PCA announced its objective to increase the number of daily scheduled transits by neopanamax vessels from six to seven as of December 1, 2017, and then to reach eight daily scheduled transits by neopanamax vessels in early 2018.
In July 2017, the Panama Canal launched an environmental recognition program, “Green Connection,” to recognize clients that demonstrate excellent environmental management and to encourage others to implement technologies and standards that reduce emissions. The program includes an Environmental Premium Ranking and a Green Connection Award.
D-11
In May 2016, construction of the first electricity generation plant in Central America based on liquefied natural gas commenced on Telfers Island, in the province of Colón. The project represents an investment of U.S.$1,150 million and is expected to add 381 MW to the country’s energy matrix as part of the National Energy Plan 2015-2050 and to include a regasification terminal with a storage capacity of 180,000 m3. The plan also contemplates the possibility of converting Panama into a distribution hub for liquefied natural gas for the region. The plant is expected to be operational in 2018.
The PCA administers the “Bridge over the Panama Canal in the Atlantic Sector Project,” which was authorized by Law 28 of July 17, 2006 and consists of the design and construction of a concrete vehicular bridge and access roads, with a total length of approximately 4,605 meters and four lanes, in the province of Colón. The project contemplates a connection from the western on-ramp of the new bridge with an existing road commonly known as “Costa Abajo de Colon” and includes a bridge over the Chagres river, downstream of the Gatún landfill. As of March 31, 2017, the PCA had awarded U.S.$410.2 million in contracts for the project, including a U.S.$379.7 million contract with Puente Atlántico, S.A. for construction of the bridge over the Panama Canal.
D-12
TABLE NO. 1
Selected Panamanian Economic Indicators(1)
The following table sets forth Panama’s principal economic indicators for the years 2012 through 2016:
| | | | | | | | | | | | | | | | | | | | |
| | | 2012(R) | | | 2013(R) | | | 2014(P) | | | 2015(P) | | | 2016(P) | |
Economic Data: | | | | | | | | | | | | | | | | | | | | |
GDP (millions, nominal dollars) | | $ | 39,955 | | | $ | 44,856 | | | $ | 49,166 | | | $ | 52,132 | | | $ | 55,188 | |
GDP (millions, constant dollars)(2) | | $ | 29,873 | | | $ | 31,852 | | | $ | 33,780 | | | $ | 35,732 | | | $ | 37,472 | |
GDP (% change, constant dollars)(2) | | | 9.2 | % | | | 6.6 | % | | | 6.1 | % | | | 5.8 | % | | | 4.9 | % |
Service Sector (% change, constant dollars)(2)(3) | | | 6.9 | % | | | 3.5 | % | | | 4.5 | % | | | 6.3 | % | | | 4.6 | % |
Other (% change, constant dollars)(2)(4) | | | 17.6 | % | | | 17.5 | % | | | 10.8 | % | | | 3.7 | % | | | 5.7 | % |
GDP Per Capita (constant dollars)(2) | | $ | 7,887 | | | $ | 8,272 | | | $ | 8,632 | | | $ | 8,988 | | | $ | 9,282 | |
Population (millions) | | | 3.79 | | | | 3.85 | | | | 3.91 | | | | 3.98 | | | | 4.04 | |
CPI – Period Average (% change) | | | 5.7 | % | | | 4.0 | % | | | 2.6 | % | | | 0.2 | % | | | 0.7 | % |
Unemployment | | | 4.1 | % | | | 4.1 | % | | | 4.8 | % | | | 5.1 | % | | | 5.5 | % |
Public Finance: | | | | | | | | | | | | | | | | | | | | |
Total Consolidated Non-Financial Public Sector Revenues (millions) | | $ | 9,013 | | | $ | 9,950 | | | $ | 10,225 | | | $ | 10,656 | | | $ | 11,609 | |
Total Consolidated Non-Financial Public Sector Expenditures (millions)(5) | | $ | 9,564 | | | $ | 10,976 | | | $ | 11,778 | | | $ | 11,880 | | | $ | 12,674 | |
Overall Surplus (Deficit) (millions) | | $ | (551 | ) | | $ | (1,026 | ) | | $ | (1,563 | ) | | $ | (1,042.6 | ) | | $ | (1,064.9 | ) |
As % of Current GDP | | | (1.4 | )% | | | (2.3 | )% | | | (3.2 | )% | | | (2.0 | )% | | | (1.9 | )% |
Central Government Surplus (Deficit) (millions) | | $ | (1,029 | ) | | $ | (1,690 | ) | | $ | (1,945 | ) | | $ | (2,026 | )% | | $ | (2,203 | ) |
As % of Current GDP | | | (2.6 | )% | | | (3.8 | )% | | | (4.0 | )% | | | (3.9 | )% | | | (4.0 | )% |
Public Debt (at December 31): | | | | | | | | | | | | | | | | | | | | |
Internal Debt (millions) | | $ | 3,483 | | | $ | 3,453 | | | $ | 3,879 | | | $ | 4,573 | | | $ | 4,700 | |
External Debt (millions) | | $ | 10,782 | | | $ | 12,231 | | | $ | 14,352 | | | $ | 15,648 | | | $ | 16,902 | |
Public Debt (as % of Current GDP) | | | | | | | | | | | | | | | | | | | | |
Internal Debt | | | 8.7 | % | | | 7.7 | % | | | 7.9 | % | | | 8.8 | % | | | 8.5 | % |
External Debt | | | 27.0 | % | | | 27.3 | % | | | 29.2 | % | | | 30.0 | % | | | 30.6 | % |
Total Public Debt (millions) | | $ | 14,265 | | | $ | 15,684 | | | $ | 18,231 | | | $ | 20,222 | | | $ | 21,602 | |
Trade Data: | | | | | | | | | | | | | | | | | | | | |
Exports (f.o.b.) Goods(6)(7) (millions) | | $ | 18,271 | | | $ | 17,057 | | | $ | 15,333 | | | $ | 12,784 | | | $ | 11,705 | |
Imports (c.i.f.) Goods(6)(7) (millions) | | $ | (28,140 | ) | | $ | (26,597 | ) | | $ | (25,710 | ) | | $ | (22,492 | ) | | $ | (20,490 | ) |
Goods Trade Balance(7) (millions) | | $ | (9,869 | ) | | $ | (9,540 | ) | | $ | (10,337 | ) | | $ | (9,709 | ) | | $ | (8,785 | ) |
Current Account Surplus(7) (Deficit) (millions) | | $ | (3,816 | ) | | $ | (4,401 | ) | | $ | (4,794 | ) | | $ | (3,377 | ) | | $ | (3,098 | ) |
Overall Balance of Payments Surplus (Deficit)(7) (millions) | | $ | (958 | ) | | $ | (109 | ) | | $ | 380 | | | $ | (1,117 | ) | | $ | (1,233 | ) |
Total Official Reserves (at December 31) (millions) | | $ | 2,137 | | | $ | 2,412 | | | $ | 3,509 | | | $ | 3,044 | | | $ | 3,540 | |
| (1) | All monetary amounts in millions of U.S. dollars at current prices, unless otherwise noted. |
| (2) | Constant GDP figures are based on 2007 constant dollars in chained volume measure. |
| (3) | Including real estate, public administration, commerce, restaurants and hotels, financial services, the CFZ, the Panama Canal, transportation and communications, public utilities and other services. |
| (4) | Including mining, manufacturing, agriculture and construction. |
| (5) | Including interest payments. |
| (7) | Figures have been calculated pursuant to the fifth edition of the IMF Balance of Payments Manual. |
D-13
Sources: Directorate of Analysis and Economic Policies, Office of the Comptroller General, Banco Nacional de Panamá (“BNP”) and Ministry of Economy and Finance.
D-14
THE REPUBLIC OF PANAMA
Area and Population
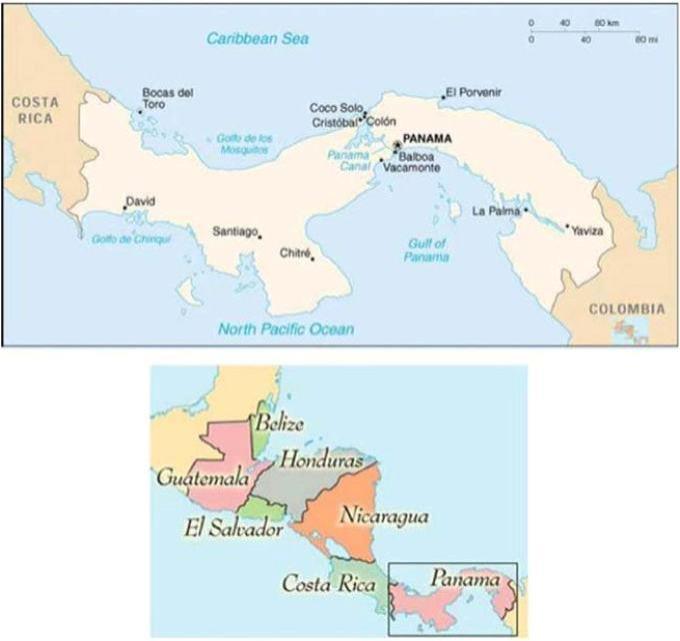
Panama is a republic located on the narrowest point of the Central American isthmus, which connects the continents of North America and South America. It has a coastline of approximately 1,868 miles on the Caribbean Sea and Pacific Ocean and is bordered on the east by Colombia and on the west by Costa Rica. Panama has a national territory of approximately 29,157 square miles situated within its coastline and 345 miles of land borders, and includes numerous coastal islands. The Panama Canal, one of the most important commercial waterways in the world, which connects the Atlantic and Pacific Oceans, bisects the country running northwest to southeast. Panama’s climate is primarily tropical.
As of December 31, 2016, Panama had an estimated population of 4.0 million and a population density of 54.4 people per square kilometer. At December 31, 2016, Panama Province, the Republic’s largest province, was estimated to comprise 52.2% of Panama’s total population. Colón Province, located at the northern terminus of the Panama Canal, was estimated to comprise 7.0% of the total population.
During the period from 2012 to 2016, the population grew by an average of 1.6% per annum. Approximately 64.6% of Panama’s population lives in cities and towns with more than 1,500 inhabitants, and 6.4% of the population is indigenous, some of whom are seeking greater autonomy from the Government. Of the Panamanian population, 27.1% is under 15 years of age, 65.1% is between the ages of 15 and 64, and 7.8% is over the age of 65. Average life expectancy in Panama is 77.9 years. The infant mortality rate is estimated at 14.5 per 1,000 births. Panama’s official language is Spanish.
In 2016, Panama’s preliminary GDP in chained volume measure grew by approximately 4.9% compared to 5.8% in 2015. Inflation, as measured by the average CPI with base year 2013, was 0.7% in 2016. The Central Government’s current savings for 2016 registered a surplus of U.S.$1.39 billion (2.5% of nominal GDP) compared to a surplus of U.S.$1.21 billion in 2015 (2.3% of nominal GDP). The Government’s overall deficit increased to U.S.$2.2 billion in 2016 (4.0% of nominal GDP) from U.S.$2.0 billion in 2015 (3.9% of nominal GDP). In 2016, Panama’s non-financial public sector balance registered an adjusted deficit of U.S.$0.8 billion (1.5% of nominal GDP), a decrease from an adjusted deficit of U.S.$1.0 billion (2.0% of nominal GDP) in 2015.
Panama’s preliminary per capita GDP for 2016, expressed in chained volume measure, was approximately U.S.$9,282.0. According to the 2010 census, education indicators show that Panama’s literacy rate for people over the age of ten years is approximately 94.5%. Estimates as of March 2016 show that 22.1% of the population is considered to be living in poverty while 9.9% is considered to be living in extreme poverty.
Historical Information
Panama gained independence from Spain in 1821 and subsequently joined the Confederation of Greater Colombia, from which Panama declared its independence on November 3, 1903. Several weeks after gaining independence, Panama signed the Hay/Bunau-Varilla Treaty with the United States, which, among other things, granted the United States the right to occupy a ten-mile wide zone and a concession for the construction, maintenance, operation and protection of the Panama Canal (the “Canal Zone”). See “The Panama Canal—General”.
Panama adopted its first constitution in 1904 and, between 1904 and 1968, Panama generally experienced social and political stability and economic growth under a constitutional democracy. During the period immediately following World War II, the Panamanian military interfered with the civilian government, although this interference largely ended by the mid-1950s. Constitutional government continued until October 1968, when the National Guard mounted a military coup and replaced the civilian government. Although the military made nominal efforts during the late 1970s to return to civilian government, the military generally remained in control of the Government until 1989.
Issues related to control of the Panama Canal and the Canal Zone caused considerable unrest in Panama. In 1977, following 13 years of negotiations, Panama signed treaties with the United States that provided for abolishing the Canal Zone in 1979 and the eventual turnover of the Panama Canal to Panama in 1999. See “The Panama Canal—The Canal Treaty of 1977”.
In 1983, General Manuel Antonio Noriega (“Noriega”) became Commander of the National Guard and assumed effective control of the Government. In the spring of 1987, a political crisis galvanized Noriega opponents and resulted in the formation of a major civilian protest and opposition movement widely supported by civilian organizations, political parties and the business community. This political crisis generated an economic crisis as well.
D-15
In response to the ensuing political crisis, in March 1988, the United States suspended its Agency for International Development (“AID”) programs to Panama and blocked preferential sugar quotas, causing further economic disruption. The United States imposed additional economic sanctions that year, including a freeze on all United States payments for the Panama Canal (at that time, approximately U.S.$6 million per month), an order prohibiting American citizens and companies from making payments to the Government and a freeze on all Government accounts (and certain additional assets) in the United States.
In December 1989, relations between Panama and the United States deteriorated, culminating in a United States military intervention that resulted in the removal of Noriega. Guillermo Endara (“Endara”), who had been elected by a significant majority of the popular vote earlier in the year, was subsequently sworn in as President.
Since the end of 1989, Panama has enjoyed political and economic stability under democratically elected governments.
Relations with the United States have been fully restored. Endara finished his presidential term and, in the spring of 1994, orderly national elections were held. Ernesto Pérez Balladares (“Pérez Balladares”), who was elected President with 33% of the vote in May 1994, finished his presidential term in August 1999. Mireya Moscoso (“Moscoso”), who was elected with 44.8% of the vote in May 1999, took office on September 1, 1999 and completed her presidential term on August 31, 2004. On May 2, 2004, Martín Torrijos (“Torrijos”) was elected President with 47.4% of the vote. He took office on September 1, 2004 and completed his presidential term on June 30, 2009. Ricardo Martinelli (“Martinelli”), who was elected President with 60.0% of the vote on May 3, 2009, took office on July 1, 2009 and completed his presidential term on June 30, 2014. President Martinelli was succeeded by President Varela.
The Panamanian military was disbanded in 1990 and, in 1994, by constitutional amendment, the military was abolished. Costa Rica, Panama’s western neighbor, also does not have a military. If Panama were attacked by a foreign force and the neutrality of the Panama Canal were jeopardized, the United States would have the right under treaties related to the Panama Canal to take measures to protect the neutrality of the Canal. The national police force of Panama also has certain defensive capabilities.
Form of Government and Political Parties
Panama is a republic with a representative form of government. In 1972, the original version of the current Constitution was adopted (the fourth in Panama’s history), setting forth the structure of the Government, individual and collective rights and duties, and the division of powers among the executive, legislative and judicial branches.
Executive power is vested in the President and the presidentially-appointed Ministers, who constitute the Cabinet. The President and the Vice President are each elected by direct, universal suffrage for a term of five years. The President and the Vice President may not be reelected to the same office within ten years after the expiration of their term. In the event the President is unable to finish a term, the Vice President would succeed to the presidency.
National legislative power is vested in the Assembly, Panama’s unicameral legislative body. The number of electoral districts, each comprising an average of approximately 63,010 persons, determines the number of legislators; as of August 2017, the Assembly had 71 seats. The full Assembly is elected by universal suffrage every five years. Members of the Assembly are not subject to limits on the number of terms in office to which they may be elected. The Assembly has, among other powers, the authority to enact legislation, ratify treaties, approve the budget and ratify the appointment of the Comptroller General, the Attorney General and justices of the Supreme Court of Justice (the “Supreme Court”). To be enacted, legislation must be approved after three separate readings by a majority of all legislators or by a majority of legislators present at the session, depending on the substance of the legislation being enacted. The President may veto bills adopted by the Assembly, but the Assembly may override presidential vetoes by a vote of two-thirds of its members. Pursuant to the Constitution, the Assembly may empower the President and the Cabinet to adopt legislation when the Assembly is not in session. The Assembly has the power to amend the Constitution. Amendments to the Constitution may be adopted either by a majority vote of all legislators in two different Assemblies or by a majority vote of all legislators in two sessions of the same Assembly and a public referendum.
On May 4, 2014, Panama held general elections for the offices of President, Members of the Assembly and other regional posts. The then incumbent Vice President, Juan Carlos Varela, was elected President with 39.08% of the vote obtained by the “El Pueblo
D-16
Primero” alliance composed of the Partido Popular and Partido Panameñista. President Varela took office on July 1, 2014. As of September 2017, of the 71 seats in the Assembly, 26 seats belong to the Partido Revolucionario Democrático (“PRD”), 24 seats belong to Cambio Democrático, 16 seats belong to the Partido Panameñista, two seats belong to the Partido Molirena, one seat belongs to Partido Popular, one seat belongs to Partido Alianza and one representative has no party affiliation. On July 1, 2014, President Juan Carlos Varela appointed Dulcidio De La Guardia as Minister of Economy and Finance. On July 1, 2014, Iván A. Zarak Arias was appointed Vice Minister of Economy and Eyda Varela de Chinchilla was appointed Vice Minister of Finance.
On December 3, 2013, then presidential candidate Varela announced the priorities of his administration in a Plan for the El Pueblo Primero Alliance. The Plan included, among other initiatives, implementation of price controls on basic foods to reduce the cost of living and initiatives to maintain the growth of the Panamanian economy through public investment projects, such as plans to provide potable water nationwide; to construct Metro lines 2 and 3 to San Miguelito and East and West Panama City; to construct 500 kilometers of new highways, 15 health centers and four hospitals; and to increase the coverage of the irrigation system from 20% to 40% of all cultivated land. The Plan also called for new rules to increase transparency in the government and to reduce corruption and cronyism. Programs under the Plan are in progress.
Judicial power is vested in the Supreme Court and various lower tribunals. The President appoints the nine justices of the Supreme Court for staggered ten-year terms, with two justices being selected every two years, subject to ratification by the Assembly. Lower court judges are appointed by the Supreme Court. The judicial branch prepares its own budget and sends it to the executive branch for inclusion in the general budget presented to the Assembly for approval. The Supreme Court is the final court of appeal and has the power to declare null and void laws, regulations or other acts of the executive or legislative branches that conflict with the Constitution.
Panama is administratively divided into ten provinces and three territories. In each province, executive power is exercised by a Governor who is appointed by the President. There are no provincial legislative or judicial bodies. Provincial governments do not have their own independent budgets. Within each province are municipalities that are, in turn, divided into precincts. Each municipality has a municipal council and a mayor who exercises executive power. Mayors and members of municipal councils are elected by direct, universal suffrage for five-year terms. Municipalities levy and collect municipal taxes and adopt their own budgets for financing local projects.
On October 20, 2015, the Assembly approved Law No. 66, which amended Law No. 37 of 2009, a law that decentralized certain aspects of public administration. Law No. 66 stated seven objectives: 1) to amend Law No. 37 of June 29, 2009, which decentralized public administration; 2) to reallocate property taxes between municipalities; 3) to establish a formula for the allocation of property tax for municipalities with less income; 4) to direct the investment of allocated funds to specific areas; 5) to replace the “Decentralizing National Authority” with a “National Secretariat of Decentralization”; 6) to establish an Investment Program for Public Works and Municipal Services and 7) to include special territories that do not have municipalities.
Foreign Affairs and International Organizations
Panama maintains diplomatic relations with 148 countries. Panama is a charter member of the United Nations (“U.N.”) and a member of various other international organizations, including the IMF and the Inter-American Development Bank (“IADB”). Panama is a founding member of the Organization of American States (“OAS”) and is also a member of the International Bank for Reconstruction and Development (“World Bank”) and the World Bank affiliates, including the International Finance Corporation (“IFC”) and the Multilateral Investment Guaranty Agency (“MIGA”) (collectively, the “World Bank Group”), as well as a member of the San José Pact, under which Venezuela and Mexico agreed to provide the Central American countries and four Caribbean countries with crude oil and petroleum products under preferential terms. On September 6, 1997, Panama acceded to membership in the World Trade Organization (“WTO”).
Panama consults with several international agencies, such as the World Bank Group and the IADB, regarding its economic program, objectives, projections and policies. In recent years, Panama has utilized the IADB and the World Bank Group for significant external financing. See “Public Sector Debt—External Debt”.
In 2010, the Assembly approved legislation implementing the Corporación Andina de Fomento (“CAF” or “Development Bank of Latin America”) agreement and Panama became a Series A country member. CAF is a development bank created in 1970 and owned by 19 sovereigns, 17 from Latin America and the Caribbean and Spain and Portugal, as well as by 13 private banks in the Latin America region. It promotes sustainable development through loans and grants, and support in the technical and financial structuring of projects in the public and private sectors of Latin America. As of December 31, 2016, the Republic had outstanding borrowings of U.S.$893.6 million from CAF. See “Public Sector Debt—External Debt”.
D-17
THE PANAMANIAN ECONOMY
General
Panama’s unique geographic position, service economy (including the Panama Canal) and monetary regime anchored on the use of the U.S. dollar as legal tender are major factors in Panama’s economic performance.
Panama has used the U.S. dollar as its legal tender since shortly after gaining its independence in 1903. The national currency, the Balboa, is used primarily as a unit of account linked to the U.S. dollar at a ratio of one dollar per one Balboa. The Government does not print paper currency, although a limited amount of coinage is minted. Panama’s monetary system is based on its Constitution (beginning with the 1904 Constitution, which established the Balboa) and Panamanian laws expressly recognizing the U.S. dollar as legal tender. There are no Panamanian foreign exchange controls or reporting requirements, and capital moves freely in and out of the country, without local currency risk. Under Panama’s unique monetary system, foreign exchange reserves are not needed to support the currency.
The absence of both a national printed currency and a Balboa exchange market diminishes the significance of the balance of payments as an indicator of the Government’s external debt service capacity. Fiscal policy, therefore, is a more relevant indicator of the accumulation and drawdown of Government reserves available for sovereign debt service. Moreover, this monetary system imposes an element of discipline on Panamanian authorities in the areas of monetary and fiscal policy. Panama is limited in its ability to conduct a stimulative monetary policy and can finance public sector deficits only through borrowing.
In 2012, the non-financial public sector registered a deficit of 1.4% of GDP. In 2013 the non-financial public sector registered a deficit of 2.3% of GDP and in 2014, the non-financial public sector deficit increased to 3.2% of GDP. In 2015, the non-financial public sector deficit fell back to 2.0% of GDP. In 2016, the non-financial public sector deficit fell to 1.5% of GDP.
From 2012 to 2016, Panama experienced an average annual rate of inflation, as measured by the average consumer price index (“CPI”), of 2.6%. In 2016, the annual rate of inflation, as measured by the average CPI with a base year of 2013, was estimated at 0.7%.
The Panamanian economy is dominated by a large service sector, which represented 75.1%, 72.9%, 71.9%, 72.2% and 72.0% of GDP in 2012, 2013, 2014, 2015 and 2016, respectively. The manufacturing and agricultural sectors represented far smaller percentages, 5.0% and 2.1%, respectively, in 2016. Historically, the Panamanian economy has been characterized by an imbalance between the open, internationally-oriented service sector and the relatively closed manufacturing and agricultural sectors, where productivity has been lower and government policies may have affected resource allocation. See “Structure of the Panamanian Economy—Principal Sectors of the Economy”. Ongoing investments are designed to promote Panama as a hub for logistic, maritime and air transport services.
While much of the service sector economic activity is represented by activities associated with public administration, commerce and real estate, the significant internationally-oriented activities of this sector distinguish the Panamanian economy, particularly transportation, storage, communication and financial intermediation. For instance, in the Canal’s 2016 fiscal year (which ended September 30, 2016), commercial oceangoing traffic registered 13,114 transits, and the Canal’s toll revenue was U.S.$1,932.99 million, representing 3.5% of Panama’s estimated GDP for 2016 measured in nominal dollars.
As a result of the dollar-based economy, the international trade associated with the Panama Canal and the CFZ, and certain legislative initiatives, Panama has also developed an important financial sector that represented 7.7% and 7.9% of GDP in 2015 and 2016, respectively. There is no lender of last resort or deposit insurance in Panama. See “Financial System—The Banking Sector”.
Reforms and Development Programs
Social Security. In December 2005, the Assembly approved Law No. 51, which reformed Panama’s social security system by, among other things, requiring employees to make contributions into the social security system for 20 years (up from the prior 15-year requirement) before becoming eligible to receive benefits and gradually transitioning from a defined benefits system to personal savings accounts. Law No. 51 also established the obligation to support the Disability, Old Age and Death Benefit System (Régimen de Invalidez, Vejez y Muerte (“IVM”)) with annual deposits by the Central Government to an administration and investment trust created for the sustainability of the IVM of U.S.$75 million in each of the years 2007, 2008 and 2009, U.S.$100 million in each of the years 2010, 2011 and 2012, and U.S.$140 million in each of the years 2013 through 2060.
D-18
Trade Liberalization. Trade liberalization advanced with Panama’s accession to the WTO, which became effective September 6, 1997. Panama has also negotiated free trade agreements with many of its trading partners, such as the United States, Canada, the European Free Trade Association, Mexico, Colombia, Chile and Central American countries. See “Foreign Trade and Balance of Payments—Tariffs and Other Trade Restrictions”.
Government Procurement. On May 10, 2011, Law No. 22 of 2006, which established a system for government procurement in Panama, was modified by Law No. 48 of 2011. The modification grants the Dirección General de Contrataciones Públicas (“Public Contracting Authority”) the power to impose fines. In addition, it expanded the scope of the law to include regulation of acquisitions by the Caja de Seguro Social (“Social Security Fund” or “CSS”) of pharmaceutical products as well as contracts with funding supplied by foreign governments. Law No. 48 of 2011 also modified provisions that regulate, among other things, exemption from the contractor selection process and the sale of assets under exceptional process, advertising and promotion services contracts.
Export Processing Zones & Free Zones. During 2007, two export processing zones (“EPZs”) were created in Panama. EPZs are well-defined areas for establishing industrial, commercial and service facilities for operation in a free trade system. In June 2007, the Zona Procesadora Chilibre was created and, in August 2007, the Zona Procesadora Colón Maritime Investor, S.A. was created to provide infrastructure, facilities and support systems to attract new business and foreign investments. In June 2009, the Hewlett-Packard Global Services Panama EPZ was created. In August 2013, the Vaguil EPZ was created to implement the Panama Diamond Exchange, which is the first and only Latin American diamond and gemstone bourse recognized by the World Federation of Diamond Bourses. Panama is a member of the Kimberley Process, which is designed to prevent the import of diamonds from conflict areas in Africa. As of September 2017, 82 call centers had official registrations with EPZs. In December 2016, the Cabinet Council authorized the National Commission on Free Zones to approve the establishment and operation of a free zone by Consorcio Industrial de las Americas, S.A. in Pacora, Panama province, the “PanaPark Free Zone,” which is expected to host approximately 250 businesses operating in manufacturing, logistics, services, technology and assembly. Construction of the PanaPark Free Zone began in January 2017, and manufacturing activities are expected to begin in October 2017.
Fiscal Reforms. On June 5, 2008, Law No. 34 of 2008 was ratified, establishing a Social and Fiscal Responsibility Regime to promote sound fiscal policies and management. This law came into effect on January 1, 2009. The Social and Fiscal Responsibility Regime requires any new government to present, during the first six months of its administration, a multi-year social strategy, a five-year financial plan and the macroeconomic criteria to manage public expenditures and to incentivize current savings. Through Executive Decree No. 689 of December 26, 2014, the Varela administration adopted its five-year Strategic Government Plan, “Un solo país”. The Plan includes the economic and social strategy, the financial program and a five-year indicative public investment plan that establishes the criteria for public expenditure for prioritized sectors, programs and projects. Such prioritized sectors include, among others, transportation, energy, agriculture and tourism, while projects and programs include a project to improve access to potable water and a program to improve education.
In addition to creating the Fondo de Ahorro de Panamá (Panama Saving Fund, “FAP”), Law No. 38 of June 5, 2012 amended the Social and Fiscal Responsibility Law to set a ceiling on the annual non-financial public sector adjusted deficit of 2.9% of GDP for 2012, 2.8% for 2013, 2.7% for 2014, 2.0% for 2015, 1.5% for 2016, 1.0% for 2017 and 0.5% thereafter. The amendment also allows a temporary suspension of the fiscal deficit ceiling in cases of emergency or a deceleration in economic activity. On November 26, 2012, Cabinet Resolution No. 157 declared a National State of Emergency as a result of severe damage to roads and housing infrastructure in the provinces of Panama and Colón resulting from flooding and landslides from heavy rainfall in November 2012. The Government estimated that damage caused by this natural event totaled approximately U.S.$123.2 million, or 0.3% of nominal GDP, and raised the effective fiscal deficit ceiling of the non-financial public sector for 2012 to 3.1% of nominal GDP. In March 2013, the Cabinet approved an extraordinary credit to the National Budget of U.S.$123.2 million, allocated to several public institutions responsible for the rehabilitation and reconstruction of the damaged infrastructure. The largest amounts of extraordinary funds were allocated to the Ministry of Public Works ($83.8 million) and the Ministry of Housing and Territorial Administration ($24.0 million).
On September 2, 2014, pursuant to Cabinet Resolution No. 152, the Executive approved an approximately U.S.$590 million expenditure reduction plan for 2014 consisting of reductions of U.S.$100 million in current expenditures and U.S.$490 million in the investment budget. The plan called for a freeze on new hiring. The projects that would be subject to budget cuts were those that had
D-19
not yet started and those designated as low priority. The plan did not affect the debt service budget. The Government was committed to reducing the deficit in light of the 2014 ceiling imposed by the Social and Fiscal Responsibility Law, which was approximately U.S.$1.3 billion for 2014, in light of a preliminary fiscal deficit of the Non-Financial Public Sector for the first six months of 2014 of approximately U.S.$1.5 billion. In September 2014, the Government estimated that the expenditure reduction plan would not, by itself, accomplish the goal of meeting the Social and Fiscal Responsibility Law target, and that the deficit might fall within a range of 3.7%-4.2% of GDP. In December 2014, the Government requested that the Assembly increase the 2014 deficit ceiling, but not the deficit ceiling for subsequent years. The non-financial public sector deficit for 2014 was U.S.$1,563 million, equivalent to 3.2% of GDP. In 2015 and 2016, the non-financial public sector deficit was U.S.$1,208 million and U.S.$1,065 million, equivalent to 2.3% of GDP and 1.9% of GDP, respectively, compared to statutory ceilings of 2.0% and 1.5% for 2015 and 2016, respectively. The Fiscal and Social Responsibility Law provides that five senior economic officials of the Republic, including the Minister of Economy and Finance and the Comptroller General, would be responsible if the deficit ceiling were to be exceeded, but the law does not specify what such responsibility would entail, nor does the law specify any institutional consequences for non-compliance.
In April 2011, Law No. 31 was ratified, modifying the Panamanian Fiscal Code. The modified law implemented, among other things, a dividend tax for every loan or credit that companies provide to their shareholders. The dividend tax consists of a withholding of 10% of the amount of a loan or credit, irrespective of income. In the case of bearer shares, the dividend tax increased to 20%. Under the modified law, only legal entities producing taxable income that are subject to income tax will be required to pay a Monthly Advance of Income Tax, a tax introduced by Law No. 8 of March 2010.
In August 2012, Law No. 52 eliminated an estimated income tax introduced by Law No. 8 of March 2010 because the tax did not meet the expectations of the authorities and created additional administrative burden for taxpayers and for the revenue authority. The tax was replaced by the previous system of estimating income tax payments based on the previous year’s income.
In May 2015, Law No. 27 established new taxes on non-metallic mining products, such as sand, gravel, quarried stone, limestone, clay and tuff stone. The rates vary according to the kind of mineral. Law No. 27 also established that all coupons and tickets, gaming chips and other documents containing a payment obligation resulting from gambling activities would be subject to a tax rate of 5.5%. Funds collected on these activities will be allocated to finance increases in monthly pension distributions according to the following schedule: monthly distributions of less than U.S.$250.00 increase by U.S.$50 per month; distributions of U.S.$250.01 to U.S.$270.00 increase by U.S.$45 per month; distributions of U.S.$270.01 to U.S.$300.00 increase by U.S.$40 per month; distributions of U.S.$300.01 to U.S.$400.00 increase by U.S.$30 per month and distributions of U.S.$400.01 to U.S.$1,000.00 increase by U.S.$20 per month. These increases in pensions represent approximately U.S.$75 million per year.
Social Developments. Panama’s social spending generally focuses on spending in the social sectors of health, education and housing. In 2015 and 2016, social spending represented approximately 41.4% and 43.4% of the Government’s budget, respectively.
In May 1995, the Government created the Development Trust Fund pursuant to Law No. 20 and, on June 27, 2000, the Assembly approved Law No. 22, which approved the use of the Development Trust Fund principal for social development programs and infrastructure projects. The laws provided that up to U.S.$200 million could be drawn down from the Development Trust Fund to support infrastructure projects. The disbursements were to be made against invoices presented to the Ministry of Economy and Finance. See “Structure of the Panamanian Economy—The Role of the Government in the Economy”. From 2006 through 2010, funds were available in the following amounts: U.S.$70.0 million to water supply; U.S.$30.0 million to irrigation and agricultural projects; and U.S.$97.0 million to road rehabilitation. During the same period, U.S.$69.8 million had been disbursed to fund water supply projects; U.S.$27.3 million to fund irrigation and agricultural projects; and U.S.$94.5 million to fund road rehabilitation projects. From its inception through December 31, 2010, which was the final year that funds were disbursed from the Development Trust Fund, approximately U.S.$194.3 million were disbursed to support infrastructure projects.
In June 2012, the Government created the FAP pursuant to Law No. 38 of 2012. The initial capital of the FAP came from the Development Trust Fund. The FAP was capitalized and began operations on June 7, 2012. The Development Trust Fund has ceased to exist. According to the FAP’s accumulation rule, every year income from the Canal of up to 3.5% of GDP will be deposited in the National Treasury and any excess over that amount will be transferred to the FAP. The FAP has two main objectives: (1) macroeconomic stability in cases of national emergencies and (2) long-term national savings. The FAP also may repurchase and retire Panamanian sovereign debt once the size of the FAP reaches 5.0% of GDP. The FAP Secretary reports to the Ministry of Economy and Finance, which establishes investment guidelines for the FAP. In addition, Law No. 38 provides for the BNP to serve as the FAP’s Trustee and for an independent Board of Directors to safeguard FAP assets. In 2016, the FAP generated interest of U.S.$26.1 million compared to U.S.$24.4 million in 2015 and had net assets of U.S.$1,265.0 million, an increase of 3.3% from U.S.$1,225.0 million in 2015 due to a decrease in accounts payable to asset managers.
D-20
Law No. 87 of December 4, 2012 modified article 5 of Law No. 38 of 2012. This change affected only the rules relating to the withdrawal of funds from the FAP, restricting the possibility of using funds immediately in respect of natural disasters. In August 2013, Law No. 48 was approved, which further modified Law No. 38 of 2012. The amendment established that funds resulting from future sales of government-owned companies will be contributed to the FAP and may be used only to finance reconstruction efforts for damage caused by natural disasters when such damage represents at least 0.5% of nominal GDP.
The President appointed the first board of directors of FAP, and the board appointed the first Technical Director of FAP, effective April 15, 2013, who is responsible for management of the financial assets of FAP. On May 19, 2016, the FAP announced the appointments of Fred Kardonski, Alvaro Tomas Abrahams and Jean-Pierre Leignadier as members of the board of directors for a period of seven years.
In August 2009, Law No. 44 of 2009 was ratified, establishing a Special Program of Economic Assistance under the Ministry of Social Development. The program consists of issuing a monthly payment of U.S.$100 to all Panamanians who are 70 years or older and who do not receive retirement or pension benefits. With this program, the Government seeks to improve the quality of life for the elderly currently living in poverty. Law No. 15 of 2010 decreased the eligible age to 65 years. In August 2013, Cabinet Resolution No. 147 authorized the Minister of Social Development to propose a modification of Law No. 86 of November 2010 to raise this monthly installment by U.S.$20 to U.S.$120, beginning in fiscal year 2014. Since January 2014, the Ministry of Social Development has been paying U.S.$120 monthly to the program’s beneficiaries.
In August 2009, Executive Decree No. 55 created the Fondo Solidario de Vivienda under the Ministry of Housing. This fund gives low-income families up to U.S.$5,000 per family to use on the purchase of a home not to exceed U.S.$30,000. This contribution was given to families that have an income of less than U.S.$800 a month. In 2011, Executive Decree No. 55 was modified to increase the maximum value of a property to U.S.$35,000. Through Executive Decree No. 393 of December 16, 2014, the contribution from the Fondo Solidario de Vivienda was increased to U.S.$10,000 per family to use on the purchase of a home not to exceed U.S.$50,000. This contribution is made available to families that have an income of less than U.S.$1,200 per month.
Environmental Law. During 2008 and 2009, numerous executive decrees were enacted concerning environmental policies, including decrees relating to the protection of whale sharks, establishing a national committee on climate change and changing the general environmental law. In addition, many resolutions were enacted in 2009, including resolutions for protection of specific regions, for a management plan for a national park and for wildlife preservation. Through Law No. 8 of March 25, 2015, the Ministerio de Ambiente (“Ministry of Environment”) was created to direct matters related to the protection, conservation, preservation and restoration of the environment and the sustainable use of natural resources to promote compliance with laws and with the National Environment Policy. This new Ministry replaced the former Autoridad Nacional del Ambiente (National Authority of Environment). On April 22, 2016, Panama signed the Paris Agreement on climate change. Upon signing, Panama became one of 175 initial signatories committed to the reduction of toxic emissions and to environmental management.
Infrastructure. Since 2007, Panama has experienced a significant increase in infrastructure development spending. In 2008, the Ministerio de Obras Públicas (“Ministry of Public Works” or “MOP”) invested U.S.$248 million in projects relating to the construction, rehabilitation and maintenance of all national highways, consisting of 13,615 kilometers of transportation networks. In 2009, the first phase of the 42 kilometer trans-isthmus toll road connecting Panama City and Colón, referred to as the Madden-Colón highway, became operational. The first phase of the Madden-Colón highway cost approximately U.S.$299.6 million and connects Madden to Quebrada Lopez. In July 2012, the second phase of the Madden-Colón highway, connecting Quebrada Lopez to Cuatro Altos, was completed following an investment of approximately U.S.$213.6 million.
During the first quarter of 2011, the Government created ENA to provide the financing for, and to acquire ownership of, the Corredor Sur and Corredor Norte toll highways in Panama. In August 2011, ENA acquired Corredor Sur issued and placed U.S.$395.0 million in bonds to finance the acquisition of the toll road. The Government contributed U.S.$50 million to ENA in connection with the purchase. The transaction was finalized on August 24, 2011. In 2012, ENA entered into agreements for the acquisition of Phases I and IIA and the Panama-Madden segments of Corredor Norte for a purchase price of U.S.$647 million. ENA issued U.S.$600 million in bonds and the Government contributed approximately U.S.$76.2 million in connection with the purchase. The transaction completed in October 2012. In February 2013, ENA Este S.A., a subsidiary of ENA, acquired the concessions for
D-21
Phase IIB, also referred to as ENA Este. Ena Este is an expansion of Corredor Norte that will connect with the Panamerican Highway, itself a continuation of Corredor Sur, and is intended mainly for purposes of commuting, with an expectation that 90% of the traffic will consist of automobiles. Principal construction began in March 2012 and was completed in November 2015. The government did not contribute directly to the construction of the road. In October 2012, the concession was transferred from ENA Este S.A. to the ENA Este Trust, which issued U.S.$212.0 million senior secured notes in March 2014 as part of the financing for construction of the road.
In July 2009, Executive Decree No. 150 created the Secretariat of the Metro for Panama, which is part of the Ministry of the Presidency and is responsible for the organization and execution of all actions necessary with respect to the design, execution, administration, operation and maintenance of the metro transportation system project, known as “El Metro de Panamá”. The first line, Metro line 1, was constructed by a consortium, “Consorcio Linea Uno”, that consisted of Odebrecht, S.A. (a Brazilian company) and FCC (a Spanish company). Construction started in 2011 and concluded in 2014, and Metro line 1 was inaugurated on April 5, 2014. The cost of the first phase was approximately U.S.$1.88 billion, which the government financed through central government borrowings from multilateral and bilateral lending institutions. See “Public Sector Debt—External Debt.”
Law No. 109 of November 25, 2013 created Metro de Panama, S.A., a public company in charge of planning, promoting, managing and executing the Metro system. The company’s stock is 100% owned by the Government. Metro de Panama S.A. announced the public procurement process for Metro line 2 on September 15, 2014. Metro line 2 will provide service to 500,000 inhabitants of east Panama City and will have a direct connection to Metro line 1. Once operational, Metro line 2 is expected to initially be able to transport 15,000 passengers per hour, with the ability to transport more than 30,000 passengers per hour in the future. Three bids were received on February 12, 2015 from Consortium Consorcio UTE PANAMA II, consortium Consorcio Linea 2 and consortium PANAmetro-Consorcio Internacional Metro de Panama L2. On May 14, 2015, the results from the technical proposals and price verification were published. The highest valued bid came from Consorcio Linea 2, which consists of Odebrecht and FCC, the same contractors that constructed Metro line 1. The consortium PANAmetro-Consorcio Internacional Metro de Panama L2 filed a claim to the Public Contracting Authority against the technical proposal evaluation report. The claim was dismissed and the project was adjudicated to Consorcio Linea 2 for a total amount of U.S.$1.86 billion. On July 24, 2015, the contract between Metro de Panama. S.A. and Consorcio Linea 2 was signed for a total amount of U.S.$2.06 billion, which includes U.S.$205.0 million of financing. Metro de Panama, S.A. has the option to include maintenance for the project for up to U.S.$50.7 million. According to the contract, the works should be completed within 44 months from the issuance of an order to proceed, which occurred on September 7, 2015, implying a contractual due date in May 2019. On May 26, 2016, Consorcio Linea 2 confirmed that Citigroup would no longer participate in the financing of Consorcio Linea 2,. On February 14, 2017, Consorcio Linea 2 confirmed that it had acquired substitute financing from two banks, UBS and Inbursa.
In April 2016, a loan agreement between Metro de Panama S.A. and the Japan International Cooperation Agency (“JICA”) was signed for a total amount up to U.S.$2,600 million for the construction of Line 3 of the Metro of Panama. The agreement includes U.S.$35 million of non-reimbursable technical cooperation funds for the hiring of a Project Manager. On May 26, 2016, JICA contracted a consortium to serve as Project Manager, consisting of Nippon Koei Co. Ltd., Tonichi Engineering Consultant Inc. and Nippon Koei Latin America – Caribbean Co. Ltd. The services from the Project Manager are expected to have a duration of approximately 79 months from May 2016. The procurement process for construction of Metro Line 3 remains pending as of September 2017.
In September 2012, Odebrecht, a Brazilian construction company, won a bid to build a second terminal for Tocumen International Airport that will be called the South Terminal. Construction of the South Terminal started in March 2013. As of June 2017, construction of the South Terminal was 70% complete. The expansion is projected to be complete by the first half of 2018, at which point Tocumen International Airport will have the capacity to handle more than 20 million passengers per year. The total estimated cost of the airport expansion is estimated to be approximately U.S.$1.2 billion. On May 13, 2016, Tocumen International Airport, a state-owned enterprise, issued U.S.$575 million of 5.625% secured bonds due 2036. The proceeds are being used for the construction of the South Terminal.
Proyecto Mesoamérica (“Mesoamerica Project”). The Mesoamerica Project resulted from the expansion of an initiative that began in 2001, the Puebla-Panama Plan. In June 2001, Panama, Mexico, Nicaragua, Guatemala, Honduras, El Salvador, Belize and Costa Rica signed the Puebla-Panama Plan, which was a development plan to be supported by up to U.S.$2 billion in loans from the IDB and other multilateral organizations. The plan would lead to joint management of natural resources and infrastructure projects, such as highways, roads, electricity, seaports, airports, gas pipelines and communications, as well as a plan for environmental
D-22
protection. In 2008, the presidents of the countries in Central America, Colombia and Mexico agreed to restructure the Puebla-Panama Plan into the Mesoamerica Project, seeking to strengthen regional integration and to create new opportunities among the member countries. In 2009, the presidents of Belize, Colombia, Costa Rica, El Salvador, Guatemala, Honduras, Mexico, Nicaragua, Panama and the Dominican Republic adopted the institutional framework for the Mesoamerica Project.
One of the initiatives of the Mesoamerica Project is an interconnected regional electricity market (“MER”). The MER includes the construction of an Energy Transmission System for the Central American Countries (Sistema de Interconexión Eléctrica para los Países de América Central, “SIEPAC”) and energy transmission systems between Mexico and Guatemala (already in operation) and between Panama and Colombia. SIEPAC’s construction began in 2006 under the Puebla-Panama Plan and continued under the Mesoamerica Project. In October 2014, the SIEPAC was completed and fully operational.
In June 2013, the regulatory framework for the Central American Regional Electricity Market entered into effect. The total cost of the project, shared among the governments of Costa Rica, El Salvador, Guatemala, Honduras, Nicaragua and Panama, was U.S.$505 million.
Construction of the first electricity generation plant in Central America based on liquefied natural gas commenced on Telfers Island, in the province of Colón, in May 2016. The project represents an investment of U.S.$1,150 million and is expected to add 381 MW to the country’s energy matrix as part of the National Energy Plan 2015-2050 and to include a regasification terminal with a storage capacity of 180,000 m3. The Plan also contemplates the possibility of converting Panama into a distribution hub for liquefied natural gas for the region. The plant is expected to be operational in 2018.
Prevention of Money Laundering and Other Crimes. In April 2009, the Group of Twenty Finance Ministers and Central Bank Governors (“G-20”) announced an agreement targeting tax havens. The G-20 noted that the Organisation for Economic Co-operation and Development (“OECD”), had published a “grey list” of approximately 40 jurisdictions, including Panama, that had committed to internationally agreed-upon tax reporting standards, but had not yet fully implemented them.
As of September 2017, Panama has signed Tax Information Exchange Agreements with Canada, Denmark, Faroe Islands, Finland, Greenland, Iceland, Japan, Norway, Sweden and the United States. Panama has treaties for the avoidance of double taxation and prevention of fiscal evasion that have entered into force with 17 governments. On June 7, 2011, after signing a tax information exchange agreement with France, Panama was removed from the OECD “grey list” and added to the OECD’s list of jurisdictions considered to have substantially implemented tax reporting standards.
In June 2014, the Financial Action Task Force (“FATF”), an intergovernmental body developing and promoting policies to combat money laundering and terrorist financing, placed Panama on its list of jurisdictions with strategic AML and CFT deficiencies, also commonly referred to as the grey list. In June 2014, Panama made a high-level political commitment to work with the FATF and the Grupo de Acción Financiera de Latinoamérica (“GAFILAT”) to address its strategic AML/CFT deficiencies.
Law No. 23 of April 27, 2015 created a regulatory framework for various supervisory agencies, individuals and legal entities to monitor, control, promote and strengthen international cooperation in the prevention of money laundering, financing of terrorism and proliferation of weapons of mass destruction. Law No. 23 created mechanisms for national coordination by establishing institutions, methodologies, principles and obligations for collecting, receiving and analyzing financial intelligence information, as well as criteria for the imposition of sanctions. The Coordination System comprises a National Commission, the Financial Intelligence Unit and Supervisory Agencies, which are responsible for defining strategies and policies and implementing regulations under Law No. 23 for both financial and non-financial actors.
On February 19, 2016, the FATF removed Panama from the grey list and published a notice welcoming Panama’s significant progress in improving its AML and CFT regime. The Government continues to work with GAFILAT to implement legislative and regulatory reforms.
On April 29, 2016, the Vice Minister of Economy, Ivan Zarak, presented to the United Nations Forum of the Economic and Social Council the actions taken by Panama to achieve removal from the FATF grey list and to improve financial transparency. Among the key elements highlighted by Vice Minister Zarak was the signature of 30 bilateral double taxation and tax information exchange agreements since 2009.
D-23
On April 27, 2016, Panama entered into a Model I Intergovernmental Agreement (“IGA”) with the United States to improve international tax compliance with respect to the Foreign Accounts Tax and Compliance Act (“FATCA”). This agreement is intended to be the first step for implementation of FATCA in Panama and to initiate the automated exchange of information between Panamanian tax authorities and the U.S. Internal Revenue Service. On August 7, 2017 the General Directorate of Revenues announced the launch of a new tool to allow financial institutions to comply with the information disclosure requirement under the IGA.
In February 2017, the Assembly approved Panama’s accession to the Convention on Mutual Administrative Assistance in Tax Matters (“MAC”) that Panama signed in October 2016. By acceding to the MAC, the number of jurisdictions with which Panama may formally exchange information increased to 107.
Economic Performance—2012 Through 2016
Economic Performance in 2012. In 2012, Panama’s real GDP grew by an estimated 9.2% compared to growth of 11.8% in 2011. Average inflation was 5.7% in 2012. The unemployment rate decreased from 4.5% in 2011 to 4.1% in 2012.
The transportation, storage and telecommunications sector grew by an estimated 4.2% in 2012 compared to 2011 (contributing 15.3% to estimated GDP in 2012, compared to 16.0% in 2011) due to increased volumes of passengers using Tocumen International Airport, as Panama has grown as a regional hub. Mining activities increased 25.3% in 2012 compared to 2011, reflecting a contribution of 1.4% of GDP, due to increased extraction of raw materials, mainly sand and stone, in response to increased demand by the construction industry, and increased gold and silver extraction. The construction industry grew by 28.2% in 2012 compared to 2011, primarily due to the execution of large-scale public and private infrastructure projects, such as the Panama Metro, the Panama City and Bay sanitation project and residential and nonresidential buildings. The contribution of the construction industry to GDP increased from 10.2% in 2011 to 12.0% in 2012. The public utilities sector grew 11.3% in 2012 compared to 2011, representing a contribution of 3.5% of GDP in 2012, an increase from 3.4% in 2011. In 2012, primary activities increased an estimated 7.5% from 2011. Agriculture sector output increased 2.2% in 2012 over 2011 and represented 2.6% of GDP in 2012, compared to 2.8% in 2011. Growth in the agriculture sector was due to exports of non-traditional products, such as pineapple and watermelon, and growth in local demand for sugar cane and bananas. During 2012, fisheries registered a decline, decreasing by 5.2%.
The manufacturing sector grew 7.9% in 2012, compared to 2011 (contributing 6.4% of GDP in 2012, compared to 6.5% in 2011) due to an increase in meat processing, dairy products activities and the production of cement. Activities of the financial intermediation sector increased 9.5% in 2012 compared to 2011 (contributing 7.5% of GDP in 2012, the same level registered in 2011) due to increased banking commissions and fees derived from credit growth, mainly related to mining, trade and mortgage activities.
The Central Government’s current savings for 2012 registered a surplus of U.S.$1.9 billion (4.8% of nominal GDP) compared to a surplus of U.S.$1.4 billion in 2011 (4.0% of nominal GDP). The Government’s overall deficit decreased from U.S.$1.1 billion in 2011 (3.2% of nominal GDP) to a deficit of U.S.$1.0 billion in 2012 (2.6% of nominal GDP). In 2012, Panama’s non-financial public sector balance registered a deficit of U.S.$550.6 million (1.4% of nominal GDP), a decrease from a deficit in 2011 of U.S.$703.1 million (2.0% of nominal GDP).
Economic Performance in 2013. In 2013, Panama’s real GDP grew by an estimated 6.6% compared to 9.2% in 2012. Inflation, as measured by the average CPI, was 4.0% in 2013. The unemployment rate remained at 4.1%, the same level as 2012.
Mining activities increased 22.6% in 2013 compared to 2012, reflecting a contribution of 1.6% of GDP, due to increased extraction of raw materials, mainly sand and stone in response to increased demand by the construction industry, and increased gold and silver extraction. The construction sector grew by 31.1% in 2013 compared to 2012, primarily due to the execution of large-scale public and private infrastructure projects, such as the Panama Metro, the Panama Canal expansion project and residential and non-residential buildings. The contribution of the construction industry to GDP increased from 12.0% in 2012 to 14.7% in 2013. The financial intermediation sector grew by 8.0% in 2013 compared to 2012, representing a contribution of 7.6% of GDP in 2013, an increase from 7.5% in 2012, primarily due to strong performance of the International Banking Center as well as increased banking commissions and other revenues.
The transportation, storage and telecommunications sector grew by an estimated 1.6% in 2013 compared to 2012 (contributing 14.5% to estimated GDP in 2013, compared to 15.3% in 2012) due to increased volumes of passengers using Tocumen International
D-24
Airport, benefiting from Panama’s growth as a regional hub. The public utilities sector grew by 9.3% in 2013 compared to 2012, representing a contribution of 3.6% of GDP in 2013, an increase from 3.5% in 2012. In 2013, primary activities increased an estimated 9.5% from 2012. Agriculture sector output increased 1.5% in 2013 compared to 2012 and represented 2.5% of GDP in 2013, compared to 2.6% in 2012. Growth in the agriculture sector was due to exports of non-traditional products, such as pineapples and watermelons, and growth in local demand for sugar cane and bananas. Fisheries registered an increase of 14.1% due to a higher number of commercial species caught and increased exports of byproducts from industrial fishing, shrimp and tuna.
The manufacturing sector grew 1.3% in 2013 compared to 2012 (contributing 6.1% of GDP in 2013, compared to 6.4% in 2012) due to an increase in the production of cement, concrete and non-alcoholic beverages.
The Central Government’s current savings for 2013 registered a surplus of U.S.$2.0 billion (4.5% of nominal GDP) compared to a surplus of U.S.$1.90 billion in 2012 (4.8% of nominal GDP). The Government’s overall deficit increased from U.S.$1.0 billion in 2012 (2.6% of nominal GDP) to a deficit of U.S.$1.7 billion in 2013 (3.8% of nominal GDP). In 2013, Panama’s non-financial public sector balance registered a deficit of U.S.$1.0 billion (2.3% of nominal GDP), an increase from the 2012 deficit of U.S.$550.6 million (1.4% of nominal GDP).
Economic Performance in 2014. In 2014, Panama’s real GDP grew by an estimated 6.1%, compared to 6.6% in 2013. Inflation, as measured by the average CPI with base year 2013, was 2.6% in 2014. The unemployment rate increased to 4.8% in 2014 from 4.1% in 2013.
The transportation, storage and telecommunications sector grew by an estimated 5.5% in 2014 compared to 2013 (contributing 14.5% of estimated GDP in 2014, approximately the same contribution as in 2013) driven mainly by the performance of ports, the Panama Canal and passenger air transportation. Mining activities increased by 17.0% in 2014 compared to 2013, reflecting a contribution of 1.8% of GDP, due to rock and sand extraction utilized by the construction industry. The construction sector grew by 14.0% in 2014 compared to 2013, primarily due to the execution of public and private projects, mainly residential and non-residential, and to the rehabilitation of road infrastructure performed by the Government. The contribution of the construction industry to GDP increased from 14.7% in 2013 to 15.8% in 2014. The financial intermediation sector grew by 3.1% in 2014 compared to 2013 and represented a contribution of 7.4% of GDP in 2014, a decrease from 7.6% in 2013. Growth in the financial intermediation sector was mainly due to increased banking sector activity.
The manufacturing sector grew by 0.9% in 2014 compared to 2013 (contributing 5.8% of GDP, compared to 6.1% in 2013) due to an increase in the production, processing and conservation of poultry meat and fish.
The Central Government’s current savings for 2014 registered a surplus of U.S.$1.4 billion (2.8% of nominal GDP) compared to a surplus of U.S.$2.0 billion in 2013 (4.7% of nominal GDP). The Government’s overall deficit increased from U.S.$1.9 billion in 2014 (4.0% of nominal GDP) to a deficit of U.S.$2.0 billion in 2015 (3.9% of nominal GDP). In 2015, Panama’s non-financial public sector balance registered an adjusted deficit of U.S.$1.0 billion (2.0% of nominal GDP), a decrease from a deficit in 2014 of U.S.$1.6 billion (3.2% of nominal GDP).
Economic Performance in 2015. In 2015, Panama’s real GDP grew by an estimated 5.8%, compared to 6.1% in 2014. Inflation, as measured by the average CPI with base year 2013, was 0.2% in 2015. The unemployment rate slightly increased to 5.1% in 2015 from 4.8% in 2014.
The transportation, storage and telecommunications sector grew by an estimated 4.7% in 2015 compared to 2014 (contributing 14.3% of estimated GDP in 2015, approximately the same contribution as in 2014) driven mainly by the performance of ports, the Panama Canal, the passenger air transportation and the expansion of mobile services demand. Mining activities increased by 7.0% in 2015 compared to 2014, reflecting a contribution of 1.8% of GDP, due to the increase of demand of raw materials for the construction industry. The construction sector grew by 6.8% in 2015 compared to 2014, primarily due to the execution of public and private projects. The contribution of the construction industry to GDP increased from 15.8% in 2014 to 16.0% in 2015. The financial intermediation sector grew by 10.4% in 2015 compared to 2014 and represented a contribution of 7.7% of GDP in 2015, an increase from 7.4% in 2014. Growth in financial intermediation sector was mainly due to banking sector activity.
The manufacturing sector decreased by 1.3% in 2015 compared to 2014 (contributing 5.4% of GDP compared to 5.8% in 2014) due to lower exports and increased competition from international markets.
D-25
The Central Government’s current savings for 2015 registered a surplus of U.S.$1.21 billion (2.3% of nominal GDP) compared to a surplus of U.S.$1.36 billion in 2014 (2.8% of nominal GDP). The Government’s overall deficit increased from U.S.$1.9 billion in 2014 (4.0% of nominal GDP) to a deficit of U.S.$2.0 billion in 2015 (3.9% of nominal GDP). In 2015, Panama’s non-financial public sector balance registered an adjusted deficit of U.S.$1.0 billion (2.0% of nominal GDP), a decrease from a deficit in 2014 of U.S.$1.6 billion (3.2% of nominal GDP).
Economic Performance in 2016. In 2016, Panama’ preliminary GDP growth was 4.9%, compared to 5.8% in 2015. Inflation, as measured by the average CPI with base year 2013, was 0.7% in 2016. The unemployment rate increased to 5.5% in 2016 from 5.1% in 2015.
The transportation, storage and telecommunications sector grew by 1.8% in 2016 compared to 2015, reflecting a contribution of 13.9% of GDP. The construction sector grew 8.3% in 2016 compared to 2015, primarily due to the execution of public and private projects. The contribution of the construction industry to GDP increased from 16.0% in 2015 to 16.5% in 2016. The financial intermediation sector grew by 6.6% in 2016 compared to 2015 and represented a contribution of 7.9% of GDP in 2016, an increase from 7.7% in 2015. Growth in financial intermediation sector was attributable mainly to banking activity. Mining activities increased by 8.4% in 2016 compared to 2015, reflecting a contribution of 1.9% of GDP, due to an increase in demand for raw materials for the construction industry.
The Central Government’s current savings in 2016 registered a surplus of U.S.$1.39 billion (2.5% of nominal GDP) compared to a surplus of U.S.$1.21 billion in 2015 (2.3% of nominal GDP). The Government’s overall deficit increased to U.S.$2.2 billion in 2016 (4.0% of nominal GDP) from U.S.$2.0 billion in 2015 (3.9% of nominal GDP). In 2016, Panama’s non-financial public sector balance registered an adjusted deficit of U.S.$0.8 billion (1.5% of nominal GDP), a decrease from an adjusted deficit of U.S.$1.0 billion (2.0% of nominal GDP) in 2015.
The Government has entered into various turnkey and deferred payment contracts with multiyear completion and payment schedules. Under Panamanian law, the contracts must receive priority over other capital expenditures in the preparation of the budget. The contracts include certain infrastructure projects, such as highways, hospitals, national security infrastructure, sports facilities and a convention center. According to Panamanian law, the amount of the government’s total commitments under these contracts must be included in the Republic’s budget for the year in which each payment is due and they are not categorized as debt instruments. As of June 2017, the total estimated amount of payments scheduled under outstanding turnkey and deferred payment contracts from 2017 to 2022 is approximately U.S.$1.28 billion.
The following table sets forth Panama’s principal price indicators for each of the years 2012 through 2016:
TABLE NO. 2
Inflation
(percentage change from previous period) (1)
| | | | | | | | | | | | | | | | | | | | |
| | | 2012 | | | 2013 | | | 2014 | | | 2015 | | | 2016 | |
Annual Percentage Change: | | | | | | | | | | | | | | | | | | | | |
Consumer Price Index | | | 5.7 | % | | | 4.0 | % | | | 2.6 | % | | | 0.2 | % | | | 0.7 | % |
Wholesale Price Index: | | | 4.7 | | | | 0.1 | | | | (1.6 | ) | | | (5.7 | ) | | | (0.8 | ) |
Imports | | | 5.2 | | | | (1.9 | ) | | | (4.7 | ) | | | (12.0 | ) | | | (2.4 | ) |
Industrial products | | | 4.0 | | | | 2.2 | | | | 0.8 | | | | (0.4 | ) | | | (0.1 | ) |
Agricultural products | | | 5.4 | | | | 4.0 | | | | 6.6 | | | | 6.1 | | | | 2.8 | |
| (1) | For years 2012 and 2013, the CPI inflation base year is 2002; for years 2014, 2015, and 2016, the CPI inflation base year is 2013. |
Source: Office of the Comptroller General.
D-26
The following tables set forth Panama’s GDP, including sectoral origin (in dollars and as a percentage of GDP) and percentage change from 2012 to 2016:
TABLE NO. 3
Gross Domestic Product
| | | | | | | | | | | | | | | | | | | | |
| | | 2012 | | | 2013 (R) | | | 2014 (R) | | | 2015 (P) | | | 2016 (P) | |
Gross Domestic Product in chained volume measure (millions of dollars)(1) | | $ | 29,873.0 | | | $ | 31,851.9 | | | $ | 33,780.0 | | | $ | 35,731.6 | | | $ | 37,471.8 | |
% Change over Previous Year | | | 9.2 | % | | | 6.6 | % | | | 6.1 | % | | | 5.8 | % | | | 4.9 | % |
Gross Domestic Product in nominal prices (millions of dollars) | | $ | 39,954.8 | | | $ | 44,856.2 | | | $ | 49,165.8 | | | $ | 52,132.3 | | | $ | 55,187.8 | |
% Change over Previous Year | | | 16.2 | % | | | 12.3 | % | | | 9.6 | % | | | 6.0 | % | | | 5.9 | % |
| (1) | Figures are based on 2007 constant dollars. |
Source: Office of the Comptroller General.
TABLE NO. 4
Sectoral Origin of Gross Domestic Product
(in millions of dollars)(1)
| | | | | | | | | | | | | | | | | | | | |
| | | 2012 | | | 2013 (R) | | | 2014 (R) | | | 2015 (P) | | | 2016 (P) | |
Primary Activities: | | | | | | | | | | | | | | | | | | | | |
Agriculture | | $ | 778.6 | | | $ | 790.4 | | | $ | 800.1 | | | $ | 803.3 | | | $ | 802.4 | |
Fisheries | | | 144.8 | | | | 165.3 | | | | 232.3 | | | | 222.3 | | | | 203.5 | |
Mining | | | 420.2 | | | | 515.2 | | | | 602.8 | | | | 645.0 | | | | 698.9 | |
Total | | $ | 1,343.6 | | | $ | 1,470.9 | | | $ | 1,635.3 | | | $ | 1,670.6 | | | $ | 1,704.8 | |
Industrial Activities: | | | | | | | | | | | | | | | | | | | | |
Manufacturing | | $ | 1,913.8 | | | $ | 1,939.1 | | | $ | 1,956.7 | | | $ | 1,930.5 | | | $ | 1,876.9 | |
Construction | | | 3,581.4 | | | | 4,694.6 | | | | 5,351.9 | | | | 5,716.9 | | | | 6,192.6 | |
Total | | $ | 5,495.2 | | | $ | 6,633.7 | | | $ | 7,308.6 | | | $ | 7,647.4 | | | $ | 8,069.5 | |
Services: | | | | | | | | | | | | | | | | | | | | |
Public utilities | | $ | 1,047.9 | | | $ | 1,145.4 | | | $ | 1,199.0 | | | $ | 1,362.4 | | | $ | 1,506.4 | |
Commerce, restaurants and hotels | | | 6,829.2 | | | | 6,856.0 | | | | 6,927.2 | | | | 7,250.6 | | | | 7,477.6 | |
Transportation, storage and communications | | | 4,558.6 | | | | 4,632.2 | | | | 4,887.1 | | | | 5,115.0 | | | | 5,207.7 | |
Financial intermediation | | | 2,249.4 | | | | 2,430.4 | | | | 2,505.2 | | | | 2,766.1 | | | | 2,947.4 | |
Real estate | | | 4,178.5 | | | | 4,500.2 | | | | 4,950.3 | | | | 5,252.6 | | | | 5,502.1 | |
Public administration | | | 975.5 | | | | 937.2 | | | | 961.0 | | | | 1,064.5 | | | | 1,215.0 | |
Other services | | | 2,593.4 | | | | 2,721.8 | | | | 2,844.0 | | | | 2,999.0 | | | | 3,145.4 | |
Total | | $ | 22,432.6 | | | $ | 23,223.2 | | | $ | 24,273.8 | | | $ | 25,810.2 | | | $ | 27,001.5 | |
Plus Import Taxes(2) | | | 1,249.6 | | | | 1,333.1 | | | | 1,440.6 | | | | 1,424.0 | | | | 1,575.2 | |
Less Imputed Banking Services | | | (702.9 | ) | | | (740.0 | ) | | | (749.9 | ) | | | (802.7 | ) | | | (842.1 | ) |
Gross Domestic Product in chained volume measure(3) | | $ | 29,873.0 | | | $ | 31,851.9 | | | $ | 33,780.0 | | | $ | 35,731.6 | | | $ | 37,471.8 | |
D-27
| (1) | Figures are based on 2007 constant dollars and include the Central Government, CSS and consolidated agencies. Figures do not include the PCA or CFZ. |
| (2) | Including value-added tax. |
| (3) | The discrepancy between each total and the sum of the components of each total is due to statistical differences originating from utilization of moving base price structures, in accordance with the suggested methodology from the SNA 1993. |
Source: Office of the Comptroller General.
TABLE NO. 5
Percentage Change from Prior Year for
Sectoral Origin of Gross Domestic Product (percentage change)(1)
| | | | | | | | | | | | | | | | | | | | |
| | | 2012 | | | 2013 (R) | | | 2014 (R) | | | 2015 (P) | | | 2016 (P) | |
Primary Activities: | | | | | | | | | | | | | | | | | | | | |
Agriculture | | | 2.2 | % | | | 1.5 | % | | | 1.2 | % | | | 0.4 | % | | | (0.1 | )% |
Fisheries | | | (5.2 | )% | | | 14.1 | % | | | 40.6 | % | | | (4.3 | )% | | | (8.4 | )% |
Mining | | | 25.3 | % | | | 22.6 | % | | | 17.0 | % | | | 7.0 | % | | | 8.4 | % |
Total | | | 7.5 | % | | | 9.5 | % | | | 11.2 | % | | | 2.2 | % | | | 2.1 | % |
Industrial Activities: | | | | | | | | | | | | | | | | | | | | |
Manufacturing | | | 7.9 | % | | | 1.3 | % | | | 0.9 | % | | | (1.3 | )% | | | (2.8 | )% |
Construction | | | 28.2 | % | | | 31.1 | % | | | 14.0 | % | | | 6.8 | % | | | 8.3 | % |
Total | | | 20.3 | % | | | 20.7 | % | | | 10.2 | % | | | 4.6 | % | | | 5.5 | % |
Services:(2) | | | | | | | | | | | | | | | | | | | | |
Public utilities | | | 11.3 | % | | | 9.3 | % | | | 4.7 | % | | | 13.6 | % | | | 10.6 | % |
Commerce, restaurants and hotels | | | 10.0 | % | | | 0.4 | % | | | 1.0 | % | | | 4.7 | % | | | 3.1 | % |
Transportation, storage and communications | | | 4.2 | % | | | 1.6 | % | | | 5.5 | % | | | 4.7 | % | | | 1.8 | % |
Financial intermediation | | | 9.5 | % | | | 8.0 | % | | | 3.1 | % | | | 10.4 | % | | | 6.6 | % |
Real estate | | | 5.0 | % | | | 7.7 | % | | | 10.0 | % | | | 6.1 | % | | | 4.7 | % |
Public administration | | | 2.8 | % | | | (3.9 | )% | | | 2.5 | % | | | 10.8 | % | | | 14.1 | % |
Other services | | | 4.3 | % | | | 4.9 | % | | | 4.5 | % | | | 5.4 | % | | | 4.9 | % |
Total | | | 6.9 | % | | | 3.5 | % | | | 4.5 | % | | | 6.3 | % | | | 4.6 | % |
Plus Import Taxes(3) | | | 11.3 | % | | | 6.7 | % | | | 8.1 | % | | | (1.2 | )% | | | 10.6 | % |
Less Imputed Banking Services | | | 12.6 | % | | | 5.3 | % | | | 1.3 | % | | | 7.0 | % | | | 4.9 | % |
Gross Domestic Product in chained volume measure | | | 9.2 | % | | | 6.6 | % | | | 6.1 | % | | | 5.8 | % | | | 4.9 | % |
| (1) | Figures are based on 2007 constant dollars. |
| (2) | Panama Canal and CFZ figures are not based on 2007 constant dollars and are therefore not included in this table. |
| (3) | Including value-added tax. |
Source: Office of the Comptroller General
D-28
TABLE NO. 6
Sectoral Origin of Gross Domestic Product
(as percentage of GDP)(1)
| | | | | | | | | | | | | | | | | | | | |
| | | 2012(R) | | | 2013(R) | | | 2014(R) | | | 2015(R) | | | 2016(P) | |
Primary Activities: | | | | | | | | | | | | | | | | | | | | |
Agriculture | | | 2.6 | % | | | 2.5 | % | | | 2.4 | % | | | 2.2 | % | | | 2.1 | % |
Fisheries | | | 0.5 | % | | | 0.5 | % | | | 0.7 | % | | | 0.6 | % | | | 0.5 | % |
Mining | | | 1.4 | % | | | 1.6 | % | | | 1.8 | % | | | 1.8 | % | | | 1.9 | % |
Total | | | 4.5 | % | | | 4.6 | % | | | 4.8 | % | | | 4.7 | % | | | 4.5 | % |
Industrial Activities: | | | | | | | | | | | | | | | | | | | | |
Manufacturing | | | 6.4 | % | | | 6.1 | % | | | 5.8 | % | | | 5.4 | % | | | 5.0 | % |
Construction | | | 12.0 | % | | | 14.7 | % | | | 15.8 | % | | | 16.0 | % | | | 16.5 | % |
Total | | | 18.4 | % | | | 20.8 | % | | | 21.6 | % | | | 21.4 | % | | | 21.5 | % |
Services:(3) | | | | | | | | | | | | | | | | | | | | |
Public utilities | | | 3.5 | % | | | 3.6 | % | | | 3.5 | % | | | 3.8 | % | | | 4.0 | % |
Commerce, restaurants and hotels | | | 22.9 | % | | | 21.5 | % | | | 20.5 | % | | | 20.3 | % | | | 20.0 | % |
Transportation, storage and communications | | | 15.3 | % | | | 14.5 | % | | | 14.5 | % | | | 14.3 | % | | | 13.9 | % |
Financial intermediation | | | 7.5 | % | | | 7.6 | % | | | 7.4 | % | | | 7.7 | % | | | 7.9 | % |
Real estate | | | 14.0 | % | | | 14.1 | % | | | 14.7 | % | | | 14.7 | % | | | 14.7 | % |
Public administration | | | 3.3 | % | | | 2.9 | % | | | 2.8 | % | | | 3.0 | % | | | 3.2 | % |
Other services | | | 8.7 | % | | | 8.5 | % | | | 8.4 | % | | | 8.4 | % | | | 8.4 | % |
Total | | | 75.1 | % | | | 72.9 | % | | | 71.9 | % | | | 72.2 | % | | | 72.2 | % |
Plus Import Taxes(2) | | | 4.2 | % | | | 4.2 | % | | | 4.3 | % | | | 4.0 | % | | | 4.2 | % |
Less Imputed Banking Services | | | (2.4 | )% | | | (2.3 | )% | | | (2.2 | )% | | | (2.2 | )% | | | (2.2 | )% |
Gross Domestic Product in chained volume measure(4) | | | 100.0 | % | | | 100.0 | % | | | 100.0 | % | | | 100.0 | % | | | 100.0 | % |
| (1) | Figures are based on 2007 constant dollars. |
| (2) | Including value-added tax. |
| (3) | Panama Canal and CFZ figures are not based on 2007 constant dollars, thus are not included in this table. |
| (4) | The discrepancy between the total and the sum of its components is due to statistical differences originating from utilization of moving base price structures, in accordance with the suggested methodology from the SNA 1993. |
Source: Office of the Comptroller General.
D-29
STRUCTURE OF THE PANAMANIAN ECONOMY
Principal Sectors of the Economy
Service Sector. The Panamanian economy is based primarily on the service sector, which accounted for an average of 72.8% of GDP in chained volume measure from 2012 to 2016. Services include real estate; transportation and communications; commerce, restaurants and hotels; financial intermediation; public administration; the Panama Canal; the CFZ; and public utilities. While the commerce sector, real estate sector and transportation sector represent significant percentages of real GDP (estimated to be 20.0%, 14.7% and 13.9%, respectively, of real GDP in 2016), the Panamanian economy is distinguished by the economic benefits generated by the Panama Canal and the CFZ.
Commerce . Commerce — which includes wholesale and retail activities as well as restaurants and hotels — is the largest component of the service sector and represented an estimated 20.0% of real GDP in 2016, 20.3% of real GDP in 2015, 20.5% of GDP in 2014, 21.5% of GDP in 2013, and 22.9% of GDP in 2012. In 2016, commerce activities rose 3.1% compared to 2015, in part as a result of increased sales of fuel and similar products, beverages, food and tobacco. In 2016, the restaurants and hotels sector grew 2.2% primarily due to increased performance restaurant services.
Real Estate. The second largest component of the service sector is real estate, which consists of rental income and the imputed rental value of real estate that is occupied but not rented. Real estate represented an estimated 14.7% of GDP in chained volume measure in 2016, 14.7% of GDP in 2015, 14.7% of GDP in 2014, 14.1% of GDP in 2013, and 14.0% of GDP in 2012.
Transportation and Communications. The transportation and communications sector, which includes ports, airports, rails and telecommunications and is the third largest component of the service sector, has been an important component of the Panamanian economy in recent years. It represented an estimated 13.9% of real GDP in chained volume measure in 2016, 14.3% of real GDP in 2015, 14.5% of GDP in 2014, 14.5% in 2013, and 15.3% of GDP in 2012.
Financial Services. The financial services sector represented an estimated 7.9% of GDP in chained volume measure in 2016, 7.7% of GDP in 2015, 7.4% of GDP in 2014, 7.6% of GDP in 2013, and 7.5% of GDP in 2012. An important component of the sector’s contribution to GDP is attributable to the banking sector, which, as of December 2016, consisted of two state-owned banks (BNP and Caja de Ahorros) and 89 private banks. The banking sector includes general license banks, international license banks, and foreign banks with representative offices. As of December 31, 2016, banking sector assets and deposits totaled approximately U.S.$121.1 billion and U.S.$85.9 billion, respectively. See “Financial System”.
Colón Free Zone. The CFZ has become the largest duty-free zone in the Western Hemisphere in terms of commercial activity. As of December 2016, approximately 2,602 companies use the CFZ service facilities for a variety of trading activities. Total imports to the CFZ decreased to U.S.$9.2 billion in 2016 from U.S.$10.4 billion in 2015. Total re-exports in 2016 were U.S.$10.4 billion, as compared with U.S.$11.4 billion in 2015. CFZ value added (implied by the value of re-exports minus the value of imports) increased to an estimated U.S.$1.2 billion in 2016, compared to U.S.$1.0 billion in 2015. See “The Colón Free Zone”.
Panama Canal. In the Canal’s 2016 fiscal year, canal transits decreased to 13,114 transits from 13,874 transits in 2015, while cargo tonnage decreased to 204.7 million long tons from 229.1 million long tons in 2015. According to the PCA, toll revenues for fiscal year 2016 reached U.S.$1,933.0 million, a decrease of 2.9% compared to U.S.$1,991.3 million in fiscal year 2015, representing 3.5% of Panama’s estimated GDP for 2016 measured in nominal dollars.
Industrial Sector. After the service sector, the next largest segment of the economy consists of the industrial activities of manufacturing and construction, collectively representing an estimated 21.5% of GDP in chained volume measure in 2016, 21.4% of GDP in 2015, 21.6% of GDP in 2014, 20.8% of GDP in 2013, and 18.4% of GDP in 2012.
Manufacturing represented an estimated 5.0% of GDP in chained volume measure in 2016, 5.4% of GDP in 2015, 5.8% of GDP in 2014, 6.1% of GDP in 2013, and 6.4% of GDP in 2012. Manufacturing is principally geared to the production of processed foods and beverages and, to a lesser extent, clothing, chemical products and construction materials for the domestic market. Traditionally, manufacturing industries have been protected by high tariffs and fiscal incentives. In connection with Panama’s accession to the WTO and conclusion of other trade agreements, such protections have decreased significantly. See “Foreign Trade and Balance of Payments—Tariffs and Other Trade Restrictions.” Manufacturing facilities are primarily located in the Panama City and Colón areas, although agricultural processing facilities tend to be located closer to raw materials.
D-30
Construction activity increased by 28.2% in 2012 and represented an estimated 12.0% of GDP. This was due to the ongoing development of large-scale government projects and non-residential projects in the private sector. Construction activity increased by 31.1% in 2013 and represented an estimated 14.7% of GDP. This was due to the execution of public and private infrastructure projects. Construction activity increased by 14.0% in 2014 and represented an estimated 15.8% of GDP. This was due to the continuing execution of public and private infrastructure projects. Construction activity increased by 6.8% in 2015 and represented an estimated 16.0% of GDP. This was due to the continuing execution of both public and private infrastructure projects. Construction activity increased by 8.3% in 2016 and represented an estimated 16.5% of GDP. This was due to the execution of public and private infrastructure projects and both residential and non-residential projects.
Agriculture, Fisheries and Mining Sector. The agriculture, fisheries and mining sector accounted for an estimated 4.5% of real GDP in 2016, 4.7% of GDP in 2015, 4.8% of GDP in 2014, 4.6% of GDP in 2013, and 4.5% of GDP in 2012. Agriculture and fisheries activities employ a significant percentage of the Panamanian employed workforce, 15.4% in 2016. Principal agricultural products include bananas, fish, shrimp, sugar, coffee, meat, dairy products, tropical fruits, rice, corn and beans. In 2016, the value of agricultural production (which includes fisheries production) is estimated to have decreased by 1.9%, after having decreased by 0.7% in 2015.
The Panamanian agriculture and fisheries sector has been protected by significant tariff and non-tariff barriers. Agricultural products are controlled principally by the Ministry of Agriculture and the Agricultural Marketing Institute. See “Foreign Trade and Balance of Payments—Tariffs and Other Trade Restrictions.”
The Role of the Government in the Economy
The Government plays a significant role in the economy through, among other means, its ownership of certain public utilities and other enterprises. General Government current expenditures (including the Central Government, Caja de Seguro Social and consolidated agencies, but excluding state-owned financial institutions and interest payments) totaled U.S.$7.9 billion in 2016. The Government also has a significant impact on the economy through various statutory and other governmental initiatives, including enforcement of a labor code, subsidies and tariff policies.
The following table sets forth summary financial information on principal public sector businesses for fiscal year 2016.
TABLE NO. 7
Selected State-Owned Enterprises(1)
2016 Financial Statistics(2)
(in millions of dollars)
| | | | | | | | | | | | | | | | | | | | |
| | | Total
Assets | | | Capital
and
Reserves | | | Gross
Revenues | | | Net
Income | | | Dividends
Paid to the
Government | |
Banco Nacional de Panamá (banking) | | $ | 10,408.9 | | | | 757.1 | | | | 305.1 | | | | 124.8 | | | | 75.0 | |
Instituto de Acueductos y Alcantarillados Nacionales (“IDAAN”) (water) | | | 1,051.8 | | | | 875.3 | | | | 135.4 | | | | (68.6 | ) | | | 0.0 | |
| (1) | All enterprises are 100% owned by the Government. |
| (2) | For fiscal year ended December 31, 2016. |
Sources: BNP and IDAAN.
In May 1995, the Government created the Development Trust Fund pursuant to Law No. 20 to hold and manage the proceeds generated by most privatizations. Pursuant to the law establishing the Development Trust Fund, the proceeds earned by investments from the monies in the Development Trust Fund were to be used mainly for investment in social development programs and not for financing general Government expenditures. The Development Trust Fund has ceased to exist and the assets of the Development Trust Fund were transferred to the FAP. See “The Panamanian Economy —Reforms and Development Programs —Social Development.”
D-31
In June 2012, the Government created the FAP pursuant to Law No. 38 of 2012. As of June 2017, interim financial reports by BNP, fiduciary of the fund, show total assets of the fund as U.S.$1.5 billion. As of December 31, 2016, audited financial statements showed a balance of U.S.$1.4 billion in the FAP, compared to a balance of U.S.$1.4 billion as of December 31, 2015. The FAP Technical Secretariat has invested part of the principal of the FAP with international asset managers. As of December 31, 2016, the international asset managers had U.S.$1.0 billion under management. See “The Panamanian Economy —Reforms and Development Programs —Social Development” for more information regarding the FAP.
Public Sector Enterprises
Electric Power. Created in 1969, Instituto de Recursos Hidráulicos y de Electrificación (“IRHE”) was the autonomous state entity having exclusive control of the electricity sector in Panama. Since the privatization of IRHE in 1998, the successors to the assets and liabilities of IRHE have set their own rates, which are subject to review by the Autoridad Nacional de los Servicios Públicos (“ASEP”). See “Other Legislation Related to Economic Reform—Public Services Law”.
Pursuant to legislation authorizing the restructuring and privatization of IRHE, the company was split into nine corporate entities with 100% of the stock of each entity owned initially by the Government. These entities included three hydroelectric generating companies, one thermoelectric generating company, four distribution companies and a transmission company, as successors to the assets and liabilities of IRHE under the privatization scheme. Following completion of the restructuring, a public bidding process commenced to sell 51% (or more) of the stock in each of the thermoelectric and distribution companies and up to 49% of the hydroelectric companies. The law provided that up to 10% of the stock of each company would be made available for the benefit of employees. In 1998 and 1999, 51% of the stock of three IRHE distribution companies, 49% of the stock of the hydroelectric generating companies and 51% of the stock of the thermoelectric generating company were sold. Pursuant to Panamanian law, the transmission company, Empresa de Transmisión Eléctrica, S.A. (“ETESA”), remains 100% state-owned. In 2016, the Government received U.S.$69.6 million of dividends from its shares in electricity companies.
ETESA is authorized by the ASEP to provide high tension electric energy transmission service to the general public under a concession contract that is valid until 2025 and that can be extended by ETESA. ETESA offers use of the transmission network with open access and regulated fees. ETESA’s electric transmission system consists of transmission lines of 230 kV and 115 kV. As of 2016, the total length of the 230 kV lines was 1,766 km in double circuit lines and 337 km in simple circuit lines, while the total length of the 115 kV lines was 155 km in double circuit lines and 151 km in simple circuit lines.
Panama currently has high electricity rates (an average of 15.80 cents per kilowatt hour as of December 31, 2016), and demand for electricity in 2016 grew at an estimated average rate of 2.3% from 2015. As of December 31, 2016, Panama had an installed generating base of 3,291.38 megawatts (“MW”), of which 1,692.50 MW (51.4%) was hydroelectric, 1,240.35 MW (37.7%) was thermoelectric, 270 MW (8.2%) was wind power and 88.53 MW (2.7%) was photovoltaic power. Panama’s electricity consumption is nearing maximum production capacity and electricity supply is subject to interruption due to climatic conditions that can reduce hydroelectric generation. In 2012, total energy generation in the wholesale market increased 8.5% and Panama registered gross generation of 8,262.97 GWh, of which 60% were hydroelectrically generated and 40% were thermoelectrically generated. In 2013, total energy generation in the wholesale market increased 4.3% and Panama registered gross generation of 8,623.73 GWh, of which 58.9% were hydroelectrically generated and 41.1% were thermo-electrically generated. In 2014, total energy generation in the wholesale market increased 4.3% to 8,994.13 GWh, of which 54% was hydroelectric, 45% thermoelectric, and 1% from renewable sources. In 2015, total energy generation in the wholesale market increased 5.8% to 9,519.94 GWh, of which 66% was hydroelectric, 32% thermoelectric and 2% from renewable sources. In 2016, total energy generation in the wholesale market increased 10.9% to 10,564.67 GWh, of which 61% was hydroelectric, 33% thermoelectric and 6% from renewable sources.
Telecommunications. INTEL, S.A. (“INTEL”) was the state-owned telecommunications company with a monopoly over local and long distance landline service. In 1997, the then Ministry of the Treasury auctioned 49% of INTEL’s stock. Cable & Wireless of the United Kingdom won the public auction by bidding U.S.$652 million for the shares. INTEL was subsequently renamed Cable & Wireless (Panamá) S.A. (“C&W Panama”). Although Cable & Wireless is not a majority owner of C&W Panama, it has operational and managerial control of C&W Panama. The Republic retains 49% of the shares of C&W Panama, and the remaining 2% of the shares of C&W Panama are held in a trust fund for C&W Panama’s unionized employees. INTEL was historically profitable and regularly paid dividends in the pre-1996 period, but dividends decreased significantly following privatization, in part because Panama holds only 49% of the shares of C&W Panama. On May 16, 2016, Liberty Global plc completed its acquisition of Cable & Wireless Communications plc. Cable & Wireless Communications plc was delisted from the London Stock Exchange on that date and subsequently re-registered as a private limited company. On May 20, 2016, Cable & Wireless Communications Plc converted into Cable & Wireless Communications Limited. To conform with the accounting procedures of Liberty Global plc, C&W Panama changed its fiscal year end from March 31 to December 31, effective for the fiscal year 2016.
D-32
For the company’s fiscal year ended March 31, 2012, C&W Panama paid approximately U.S.$72.7 million in dividends to the Central Government. For the company’s fiscal year ended March 31, 2013, C&W Panama paid approximately U.S.$42.5 million in dividends to the Central Government. For the company’s fiscal year ended March 31, 2014, C&W Panama paid approximately U.S.$44.4 million in dividends to the Central Government. For the company’s fiscal year ended March 31, 2015, C&W Panama paid approximately U.S.$48.3 million in dividends to the Central Government. For the company’s fiscal year ended March 31, 2016, C&W Panama paid approximately U.S.$38.8 million in dividends to the Central Government. For the company’s fiscal year ended December 31, 2016, C&W Panama paid approximately U.S.$39.6 million in dividends to the Central Government.
In its fiscal year ended March 31, 2012, C&W Panama experienced a 3.5% decrease in sales compared to its fiscal year ended March 31, 2011, primarily due to a decrease in revenues in enterprise and fixed voice services. In its fiscal year ended March 31, 2012, C&W Panama experienced a 5% increase in income from broadband service compared to its fiscal year ended March 31, 2011. In its fiscal year ended March 31, 2013, C&W Panama experienced a 2.56% decrease in sales compared to its fiscal year ended March 31, 2012, primarily due to lower growth in revenue from fixed voice, enterprise, and data services. In its fiscal year ended March 31, 2013, C&W Panama experienced no change in income from broadband service compared to its fiscal year ended March 31, 2012. In sales in its fiscal year ended March 31, 2014, C&W Panama experienced a 1% increase compared to its fiscal year ended March 31, 2013, primarily due to mobile data growth, which offset the continued decline in fixed and mobile voice. In its fiscal year ended March 31, 2014, C&W Panama experienced a 7% increase in income from broadband service compared to its fiscal year ended March 31, 2013. In its fiscal year ended March 31, 2015, C&W Panama experienced a 10.0% increase in sales compared to its fiscal year ended March 31, 2014, driven by the acquisition in September 2014 of Grupo Sonitel, which operates subsidiaries that provide information technology and telecommunications services to business and government customers. In its fiscal year ended March 31, 2015, C&W Panama experienced a 1.4% increase in income from broadband service compared to its fiscal year ended March 31, 2014. In fiscal year ended March 31, 2016, C&W Panama experienced a 2.0% increase in revenue compared to its fiscal year ended March 31, 2015, driven by growth in mobile data revenue. In fiscal year ended December 31, 2016, C&W Panama experienced a 1.0% increase in revenue in the period of April to December, driven by growth in mobile data revenue and the launch of their Mast3r service.
As of December 31, 2016, the telecommunications market comprised approximately 200 operating companies and 500 companies authorized to operate telecommunication concessions. As of December 31, 2016, there were approximately 421,313 telephone lines in the country with an estimated line penetration rate of 15.9 lines per 100 inhabitants. As of December 31, 2016, there were approximately 4.9 million active cellular telephone lines.
Water. The national water and sewage utility is the Instituto de Acueductos y Alcantarillados Nacionales (“IDAAN”), which serves approximately 96% of the population for which it is responsible (which constitutes 75.0% of the total population) through its 56 water purification plants, 3 filtration galleries, 160 pumping stations and 569 underground sources. Inefficiency in IDAAN’s operations and management, combined with leakage, has led to an estimated unaccounted-for water rate of 46.7%. Unlike INTEL and IRHE, which had generally paid dividends to the Government on an annual basis prior to privatization and required no Government funding, IDAAN has required periodic transfer payments from the Government to meet its operating and capital expenses.
From 2006 through 2010, the Development Trust Fund under Law No. 20 of 2002 allocated approximately U.S.$70 million for investment in water projects, such as the construction of water purification plants and distribution lines. IDAAN periodically conducts a bidding process for water infrastructure projects.
In August 2017, the Cabinet Council approved the creation of the Empresa Pública de Saneamiento de Panamá, S.A. (“EPSA”), with the objective of providing the population with a better sewage and sanitation service. The new public enterprise will be organized based on the programs and experiences of the Panama Sanitation Program and the Panama City and Panama Bay Sanitation program.
Air Transportation. Law No. 23 of January 29, 2003 prescribes the regulatory framework for the administration of Panama’s airports and airdromes and establishes that the companies covered by it will be autonomous, but 100% of shares shall be owned by the state and non-transferable.
D-33
Tocumen International Airport, which was inaugurated in 1947, was under the administration of the Civil Aviation Authority until 2003. After the implementation of Law No. 23 of 2003, the new administrative structure led to the creation of the Aeropuerto Internacional de Tocumen, S.A. (“AITSA”), an autonomous company whose shares are 100% owned by the state. Tocumen International Airport plays a fundamental role within the national airport system and the logistics network of the country. In 2012, Tocumen International Airport handled a total of 10.2 million passengers and had 36 airlines in operation. In 2013, Tocumen International Airport handled a total of 11.6 million passengers and had 37 airlines in operation. In 2014, Tocumen International Airport handled a total of 12.8 million passengers and had 39 airlines in operation. In 2015, Tocumen International Airport handled a total of 13.4 million passengers and had 41 airlines in operation. In 2016, Tocumen International Airport handled a total of 14.7 million passengers and had 40 airlines in operation. In 2016, AITSA paid approximately U.S.$20.0 million in dividends to the Central Government.
Road Transportation. The national highway company is ENA, which was created by Law No. 76 of November 15, 2010 as a private company whose shares are a 100% owned by the state. ENA’s main activity is the acquisition of shares from companies to which the state has granted concessions for the construction, conservation, maintenance and management of roads and highways. Through ENA’s subsidiaries ENA Sur, S.A., ENA Norte, S.A., and ENA Este, S.A., the company operates the Corredor Norte, Corredor Sur and Corredor Este toll roads.
Ports. The Panama Maritime Authority owns and controls most of Panama’s ports. A number of Panama’s ports have been privatized through the grant of concessions.
The Manzanillo International Terminal (“MIT”) is a container port located at the former United States military base at Coco Solo and is managed and operated by a joint venture formed between Stevedoring Services of America and Motores Internacionales, S.A. In 2012, MIT handled approximately 2.06 million twenty-foot equivalent units (“TEUs”) of cargo and containers, compared to approximately 1.9 million TEUs in 2011. In 2013, MIT handled approximately 2.02 million TEUs of cargo and containers, compared to approximately 2.06 million TEUs in 2012. In 2014, MIT handled approximately 2.07 million TEUs of cargo and containers, compared to approximately 2.02 million TEUs in 2013. In 2015, MIT handled approximately 2.00 million TEUs of cargo and containers, compared to approximately 2.07 million TEUs in 2014. In 2016, MIT handled approximately 1.83 million TEUs of cargo and containers, compared to approximately 2.00 million TEUs in 2015.
Evergreen International, S.A. (“Evergreen”), a subsidiary of the Evergreen Group of Taiwan, manages and operates the container port in Colón. The initial investment was U.S.$80 million and Evergreen began operations in the fourth quarter of 1997. In 2012, the container port in Colón moved approximately 608,906 TEUs of cargo and containers. In 2013, the container port in Colón moved approximately 608,471 TEUs of cargo and containers. In 2014, the container port in Colón moved approximately 502,706 TEUs of cargo and containers. In 2015, the container port in Colón moved approximately 789,663 TEUs of cargo and containers. In 2016, the container port in Colón moved approximately 632,845 TEUs of cargo and containers.
The Panama Canal Railway Co., a joint venture between two United States corporations, Kansas City Southern Industries, Inc. and MIJACK Products, Inc., holds a 25-year concession (scheduled to expire in 2023) for the trans-isthmus railway, principally for connecting the container ship ports on both coasts. Under the terms of the concession, the joint venture is required to pay to the Government 5.0% of its gross revenue until it recovers its initial investment. After recovery of its initial investment, the joint venture will be required to pay the Government 10.0% of its gross revenue.
The Panama Ports Company (“PPC”), a subsidiary of Hutchinson Whampoa, Ltd. of Hong Kong, operates the principal existing ports at Balboa and Cristobal at the entrances to the Panama Canal. Annual payments to the Government under a renewable 25-year concession, granted in 1996, were set at approximately U.S.$22.2 million plus 10.0% of revenues. In addition, an initial upfront grant to the Government of 10.0% of the shares in the operating company was required under the concession. In June 2002, Panama agreed to forego the U.S.$22.2 million annual rental payments in view of Hutchinson Whampoa’s investments in terminal expansion, but in September 2005, the Torrijos administration overturned the decision. On October 18, 2005, PPC paid the Government U.S.$102 million in back fees and initiated an expansion of the Port of Cristobal, which is part of its U.S.$1.0 billion ports expansion program. PPC has already invested approximately U.S.$500 million in the expansion of maritime operations of both ports. As of December 31, 2012, the wharf of the container terminal at Port of Balboa spanned 182 hectares and there were 83 gantry cranes, while the wharf at the Port of Cristobal spanned 143 hectares and there were 40 gantry cranes. As of December 31, 2013, the wharf of the container terminal at Port of Balboa spanned 182 hectares and there were 108 gantry cranes, while the wharf at the Port of Cristobal spanned 143 hectares and there were 52 gantry cranes. As of December 31, 2014, the wharf of the container terminal at Port Balboa spanned
D-34
182 hectares and there were 108 gantry cranes, while the wharf at the Port of Cristobal spanned 143 hectares and there were 52 gantry cranes. As of December 31, 2015, the wharf of the container terminal at Port Balboa spanned 182 hectares and there were 108 gantry cranes, while the wharf at the Port of Cristobal spanned 143 hectares and there were 60 gantry cranes. As of December 31, 2016, the wharf of the container terminal at Port Balboa spanned 182 hectares and there were 108 gantry cranes, while the wharf at the Port of Cristobal spanned 143 hectares and there were 60 gantry cranes.
Banking. The public banking sector consists of two institutions: BNP and Caja de Ahorros (a savings bank). By law, the Government is responsible for the liabilities of these institutions. BNP is the country’s largest deposit-taking financial institution and Caja de Ahorros is among the largest deposit-taking financial institutions. Collectively, they had approximately 16.7% of the deposits and 13.7% of the assets in the national banking system as of December 31, 2016. As of December 31, 2016, the Government had not announced any plans to privatize these financial institutions. The Panamanian public sector includes two other significant financial institutions that are not part of the banking sector: Banco de Desarrollo Agropecuario and Banco Hipotecario Nacional. See “Financial System—The Banking System—Public Sector Banking Institutions”.
Other Privatizations
Under a privatization law that governs the privatization program for various state-owned entities other than the ports, IRHE, IDAAN and INTEL, the privatization of public enterprises may be effected by any of the following means: (i) transforming state enterprises into regular stock corporations and subsequently selling all of their shares to the private sector; (ii) transforming state enterprises into mixed capital companies whose capital is divided between the Government and the private sector, and in which the Government retains a minority participation; (iii) selling operating concessions; or (iv) leasing or selling the assets of the public enterprises. Such privatization provides the Republic with non-tax revenue. In 2009, ASEP carried out a public bid to award two concessions to provide personal communications services in Panama. On May 14, 2008 in Cabinet Resolutions No. 66 and No. 67, the ASEP awarded Claro Panamá S.A. (“Claro”) and Digicel Panamá S.A (“Digicel”) contracts to provide personal communications services in the Republic. Claro’s contract was awarded for U.S.$73.1 million and Digicel’s for U.S.$86.0 million. On August 19, 2010, ASEP received presentations from companies seeking to manage a new project, known at Portabilidad Numérica, which seeks to allow cell phone users to change service providers while keeping their cell phone numbers.
In August 2013, Law No. 48 was approved, which modified Law No. 38 of 2012, which created the FAP. The amendment establishes that funds resulting from future sales of government-owned companies will be accumulated in the FAP and may only be used to finance reconstruction efforts for damage caused by natural disasters, when such damage represents at least 0.5% of nominal GDP or more.
D-35
THE PANAMA CANAL
General
Following Panama’s declaration of independence from Colombia, Panama ratified the Hay/Bunau-Varilla Treaty with the United States on December 2, 1903. Under the terms of the treaty, Panama ceded to the United States the Canal Zone, a ten-mile wide strip of Panama’s territory, to build, operate, maintain and protect an interoceanic canal across the isthmus, in return for annual payments. The Panama Canal measures 51 miles from the Atlantic to the Pacific side. The former Canal Zone encompassed a land area of 94,385 hectares (364 square miles) and a water surface of 45,594 hectares (176 square miles) and included military bases, ports, airports, schools, hospitals and housing units.
The Canal plays a significant role in the Panamanian economy. In the Panama Canal Authority (“PCA”) 2016 fiscal year ending on September 30, 2016, Canal transits decreased to 13,114 from 13,874 in fiscal year 2015, while cargo tonnage in fiscal year 2016 decreased to 204.7 million long tons from 229.1 million long tons in fiscal year 2015. According to the PCA, toll revenues for fiscal year 2016 reached U.S.$1,933.0 million, a decrease of 2.9% compared to U.S.$1,991.3 million in fiscal year 2015.
On average, from the Canal’s fiscal year 2012 to the fiscal year 2016, transits through the Canal decreased by 2.2% and cargo tonnage decreased by 1.5%. Factors such as the development of alternative land routes and the increasing size of vessels transiting the Canal have contributed to the decrease in the number of vessels required to transport cargo between 2012 and 2016. However, on average, from fiscal year 2012 to fiscal year 2016, toll revenues have increased by 2.3% per annum, primarily due to an increase in toll rates.
As of September 30, 2016, the Canal’s total work force (which includes temporary and permanent employees) was 9,936. Of the 2016 total work force, 7,729 were permanent workers and 2,207 were temporary workers. See “Employment and Labor—Salaries and Wages”.
The following table sets forth the Canal’s statistical and financial information for fiscal years 2012 through 2016 (each ended on September 30):
TABLE NO. 8
Panama Canal Principal Statistics
| | | | | | | | | | | | |
Fiscal Year | | Number
of
Transits | | | Tolls
(millions
of U.S.
dollars) | | | Long
Tons of
Cargo
(millions) | |
2012 | | | 14,544 | | | $ | 1,852.4 | | | | 218.1 | |
2013 | | | 13,660 | | | | 1,849.6 | | | | 212.1 | |
2014 | | | 13,481 | | | | 1,909.3 | | | | 227.5 | |
2015 | | | 13,874 | | | | 1,991.3 | | | | 229.1 | |
2016 | | | 13,114 | | | | 1,933.0 | | | | 204.7 | |
Source: Panama Canal Authority.
The Canal Treaty of 1977
In September 1977, the governments of Panama and the United States signed two treaties with regard to the Canal, both effective as of October 1, 1979. The first treaty, known as the Canal Treaty of 1977, terminated all prior treaties between the United States and Panama concerning the Canal and abolished the Canal Zone. The Canal Treaty of 1977 also granted the United States the right to continue to manage, operate and maintain the Canal until the expiration of the treaty on December 31, 1999, at which time Panama assumed full responsibility for the Canal and its facilities. The second treaty, known as the 1977 Treaty on the Permanent Neutrality and Operation of the Canal, committed Panama and the United States to continue to protect the Canal and to ensure its permanent neutrality beyond the expiration of the Canal Treaty of 1977. Pursuant to the Canal Treaty of 1977, the United States gradually transferred former Canal Zone land and facilities to Panama beginning in 1979. On December 31, 1999, Panama acquired full title to the Canal from the United States.
D-36
The Panama Canal Commission, Panama Canal Expansion Project and Panama Canal Authority
The Panama Canal Commission
The Canal Treaty of 1977 dissolved the former Panama Canal Company and established the Panama Canal Commission (“PCC”), a bi-national agency of the executive branch of the United States government responsible for managing and operating the Canal until the expiration of the Canal Treaty on December 31, 1999, when Panama assumed full responsibility for the Canal. Following the transfer of the Canal to Panama on December 31, 1999, the PCC was closed. The PCC was supervised by a nine-member Board of Directors. Five members were nationals of the United States and four were Panamanian citizens nominated by the Panamanian Government and approved by the United States government. From 1990 to 1999, the Administrator of the PCC was a Panamanian. The PCC’s primary mission was to service world shipping by operating the Canal in an efficient and orderly manner, while also ensuring the smooth and orderly transfer of the Canal to Panama on December 31, 1999.
Pursuant to the Canal Treaty of 1977, the Canal was expected to be operated by the PCC on a not-for-profit basis, with its income not to exceed its costs. The PCC was expected to recover through tolls and other revenues all costs of operations, maintenance and Canal improvements. The PCC’s operation of the Canal was conducted on a self-financing basis. The PCC independently set the Canal’s tolls.
The PCC’s long-term investment planning was designed to ensure that a reliable and efficient service would be continually provided and would be based primarily on future traffic projections. Investment was financed with PCC’s resources derived from toll and other revenues. In the 1980s, the Canal typically operated at close to capacity in terms of numbers of transits, and the PCC’s decided to increase capacity to avoid backlog and permit overhaul work. Hence, the PCC (and later, the PCA, which assumed management of the Canal from the PCC on December 31, 1999) planned and undertook several major Canal improvement projects, including the widening of the Canal’s Atlantic entrance; the widening of the Gaillard Cut (the narrowest point in the Canal) to permit two-way traffic; and the overhaul of the Gatun, Miraflores, and Pedro Miguel locks. In November 2001, the PCA completed the widening of the Gaillard Cut, a project that the PCC had begun in 1992 and which cost approximately U.S.$232.3 million. Other major maintenance programs, such as the overhaul of the locks, were successfully completed. The PCA initiated the deepening of Gatun Lake and the Gaillard Cut in 2002, and completed the project in September 2009 for approximately U.S.$113.6 million.
The Panama Canal Expansion Project
The Assembly approved a canal expansion plan on July 14, 2006, which was approved in a national referendum on October 22, 2006. The expansion plan included Pacific locks, water supply improvements, Atlantic Locks, waterway improvements, and improvement of access channels for new locks and existing navigational channels. The plan provided that the project would be funded entirely by the PCA, either with its own resources or from borrowing to be repaid with its own resources and not with resources of the Republic. The PCA would obtain a portion of these resources through an increase in tolls. Water-saving basins would be built alongside the new locks, which would reuse 60% of the water in each transit.
On June 26, 2016, a third set of canal locks, which resulted from the Panama Canal expansion program, started operations. These locks are located at the Atlantic Ocean and Pacific Ocean entrances to the Canal and allow for the passage of larger neopanamax vessels with a cargo capacity of up to 13,000 TEU. Each of the new complexes of locks consists of three chambers, nine water reutilization basins, a side filling and emptying system and a redundant system with eight rolling gates. The chambers measure 55 meters wide, 427 meters long and 18.3 meters deep.
According to the PCA, as of September 30, 2016, 224 neopanamax ships had traversed the expanded Canal, including ships carrying liquid natural gas and liquid petroleum gas. One official incident had been registered as of September 30, 2016, which had not led to any claims on behalf of the ship. On September 5, 2017, the PCA announced its objective to increase the number of daily scheduled transits by neopanamax vessels from six to seven as of December 1, 2017, and then to reach eight daily scheduled transits by neopanamax vessels in early 2018.
In December 2008, the PCA signed a U.S.$2.3 billion agreement with five multilateral and development organizations to finance the Canal’s expansion project, which was estimated to cost approximately U.S.$5.25 billion. The Japan Bank for International
D-37
Cooperation (“JBIC”), the European Investment Bank (“EIB”), the IADB, the CAF and the International Finance Corporation (“IFC”) agreed to provide approximately U.S.$800 million, U.S.$500 million, U.S.$400 million, U.S.$300 million and U.S.$300 million, respectively, in financing to the PCA. By September 2014, the PCA had received the full U.S.$2.3 billion disbursement. The remaining funds for the expansion project derived from the capital market and the Canal’s regular business operations, including the implementation of toll increases. To reduce the risk of a toll increase causing lower demand, the PCA employed a three-year phase-in period designed to generate the appropriate cash flows needed to finance a significant portion of the expansion program. On September 24, 2015 the PCA issued U.S.$450 million of bonds due 2035 to contribute to financing of the construction of the Atlantic bridge. As of September 30, 2016, the PCA had allocated approximately U.S.$3.8 billion of internal funding for the expansion project.
In July 2009, the construction of the third set of locks was awarded to the Grupo Unidos por el Canal (“GUPCSA”) consortium, composed of Sacyr Vallehermoso, S.A., Impregilo S.p.A., Jan de Nul n.v., and Constructora Urbana, S.A., for a total base price of approximately U.S.$3.1 billion. Pursuant to the contract for construction of the third set of locks, disputes may be submitted to a Dispute Adjudication Board (“DAB”), whose determinations may be challenged under the International Chamber of Commerce (“ICC”) Rules of Arbitration. As of March 2017, claims by GUPCSA against the PCA totaled U.S.$6.06 billion.
In 2014, during construction of the third set of locks, work was suspended for almost two months because of a contractual dispute involving U.S.$1.6 billion in cost overruns and a DAB resolution that extended the construction period by 176 days. The agreement establishing a framework for resolving the dispute did not change the total cost of the project, and construction resumed. On March 17, 2015, the PCA submitted a request for ICC arbitration to challenge a DAB resolution, issued in December 2014, that had awarded the contractor a 176-day extension to complete the project and compensation of U.S.$233.2 million plus interest; the contractor filed a request for ICC arbitration to challenge the same DAB resolution, which had not awarded its claim for a 265-day extension and compensation of U.S.$463.9 million. In the ICC arbitration proceeding, GUPCSA claimed a total of U.S.$577.1 million, while the PCA petitioned for a return of the U.S.$233.2 million plus interest that the PCA had paid pursuant to the DAB decision of December 2014. The ICC tribunal is expected to hold a hearing on the claims in January 2019.
Other legal disputes have arisen between the PCA and the consortium of contractors concerning certain construction projects for the expansion of the Canal. As of September 2015, PCA had received claims totaling approximately U.S.$3,480.8 million from GUPCSA relating to alleged cost overruns in the Canal expansion project. For instance, with respect to a dispute concerning a temporary cofferdam at the Pacific entrance, after the DAB had denied claims by GUPCSA totaling U.S.$138.0 million, GUPCSA submitted this dispute to ICC arbitration in December 2013 and increased its claims to U.S.$218.2 million as of September 2015. The ICC tribunal issued a decision in July 2017 that dismissed each claim concerning the temporary cofferdam, while also awarding to the PCA more than U.S.$22.9 million in costs and expenses from the arbitration proceeding. Another GUPCSA claim, totaling U.S.$898.0 million and concerning an alleged interruption and delay, is being assessed by the PCA. Other GUPCSA claims for an aggregate amount of U.S.$92.0 million were denied by the PCA. Some of these claims may be submitted by GUPCSA to the DAB.
In January 2016, the DAB issued two decisions regarding certain claims by GUPCSA. One of the DAB decisions denied all claims presented by GUPCSA in respect of labor costs and benefits arising from an agreement between the Panamanian Chamber of Construction and a construction workers union. In the second DAB decision, GUPCSA claimed labor costs associated with time extensions granted in previous decisions on claims concerning concrete, basalt and a strike by members of a construction union based on a contractual clause pertaining to scaling of manual labor costs; the DAB awarded GUPCSA U.S.$24.6 million on this claim, which the PCA paid to GUPCSA pursuant to PCA Acuerdo No. 290 of March 10, 2016. In July 2016, the DAB issued three decisions. In one decision, the DAB denied claims by GUPCSA for U.S.$99.0 million and a 76-day contract extension in connection with additional costs that resulted from allegedly unforeseeable and adverse conditions in the Pacific Site. In the two other decisions, the DAB awarded U.S.$6.4 million and U.S.$0.4 million for claims based on certain laboratories and the drainage of certain lagoons. In six other decisions issued in 2016, the DAB recognized U.S.$56.6 million of claims by GUPCSA, which had petitioned for U.S.$119.0 million in the six disputes; the PCA reserved its right to submit these DAB decisions to ICC arbitration. In December 2016, the PCA received from GUPCSA two new requests for ICC arbitration with claims totaling U.S.$2.4 billion; GUPCSA subsequently instituted the two arbitrations with the ICC.
In January 2017, the DAB issued a ruling on a claim by GUPCSA for U.S.$114.0 million based on cost overruns related to the quality and quantity of basalt, the availability of sites for disposal of excavated material and the physical conditions in the area where the water basins were built. The DAB’s ruling recognized U.S.$4.0 million of the claim, due to physical conditions of the water basin area, while the other components of the claims were denied.
D-38
The Panama Canal expansion program originally was scheduled to start operations by year-end 2014, with the third set of locks to be completed by November 2014. On November 13, 2014, the PCA delivered a notice of claim to the GUPCSA with respect to the work that would be completed after the November 2014 deadline. The PCA asserted that GUPCSA is liable for U.S.$300,000 for each day of delay, counting from the original contractually agreed deadline to the project completion date, up to a maximum amount of U.S.$54,600,000. The PCA may file future claims for damages caused by the delay.
In a letter dated July 16, 2015, Salini-Impregilo S.p.A. submitted a Notice of Dispute pursuant to a treaty between Italy and Panama for the promotion and protection of investments. Salini-Impregilo claimed that actions and omissions by the Republic had affected its rights under the investment treaty with respect to the design and construction of the third set of locks of the Panama Canal, and that it should be compensated for damages that it estimated to exceed U.S.$2.2 billion. In the period since, Salini-Impregilo S.p.A. has not filed a formal request for arbitration.
The Panama Canal Authority
Recognizing the importance of the Canal to Panama, the Government took a number of actions to ensure that the Canal would continue to operate efficiently following its reversion to Panama in 1999. A 1994 Constitutional amendment created the PCA, an autonomous public entity which assumed management of the Canal from the PCC on December 31, 1999. The PCA’s annual budget must be prepared in accordance with a three-year financial plan and submitted for approval by the Cabinet and the Assembly. Under the terms of the 1994 amendment, this budget is not included in the budget of the Central Government. The revised public-sector accounting practices used to calculate the non-financial public sector results do not consolidate the net financial results of the PCA with the Government’s own non-financial public-sector results.
As was the case with the PCC, the PCA makes annual payments to the Central Government based upon the amount of tonnage that transits the Canal. By law, the rate (as measured on a per ton basis) for such payments may not be set at a level that will generate lower payments than those paid to Panama by the Panama Canal Commission on December 31, 1999. In addition, the PCA transfers to the Central Government any net surpluses generated by the Canal. In fiscal year 2012, the PCA had a surplus of approximately U.S.$1.3 billion, up 2.4% from 2011. In fiscal year 2013, the PCA had a surplus of approximately U.S.$1.2 billion, down 3.6% from 2012. In fiscal year 2014, the PCA had a surplus of approximately U.S.$1.3 billion, an increase of 9.2% from 2013. In fiscal year 2015, the PCA had a surplus of approximately U.S.$1.4 billion, an increase of 2.7% from 2014. In fiscal year 2016, the PCA had a surplus of approximately U.S.$1,163.4 million, a decrease of 14.5% compared to U.S.$1,360.8 million in 2015. Based on discussions with industry representatives, shipping lines, Government representatives and an internal analysis, the PCA decided in 2010 not to proceed with a toll adjustment, in part due to the global economic slowdown. Instead, the PCA determined that the new toll adjustment would take effect on January 1, 2011 for all segments other than PC/UMS tolls for reefers, which took effect on April 1, 2011. The second toll adjustment became effective on October 1, 2012, and the third toll adjustment became effective in October 2013.
On September 1, 2011, the Assembly approved the PCA’s budget for its fiscal year ending September 30, 2012, allocating U.S.$98.2 million to the Canal’s investment program and U.S.$396.9 million to the Canal’s modernization program. On August 17, 2012, the Assembly approved the PCA’s budget for its fiscal year ending September 30, 2013, allocating U.S.$690.5 million to the Canal’s investment program and U.S.$145.4 million to the Canal’s modernization program. On August 20, 2013, the Assembly approved the PCA’s budget for its fiscal year ending September 30, 2014, allocating U.S.$269.9 million to the Canal’s investment program and U.S.$180.1 million to the Canal’s modernization program. On August 6, 2014, the Assembly approved the PCA’s budget for its fiscal year ending September 30, 2015, allocating U.S.$269.9 million to the Canal’s investment program and U.S.$178.8 million to the Canal’s modernization program. On August 3, 2015, the Assembly approved the PCA’s budget for its fiscal year ending September 30, 2016, allocating U.S.$146.2 million to the Canal’s investment program and U.S.$72.0 million to the Canal’s modernization program. On August 29, 2016, the Assembly approved the PCA’s budget for its fiscal year ending on September 30, 2017. This budget assumes an increase of 10.6% in transit revenues and an increase of 8.9% in total operating income and projects that dividends payable to the Central Government for fiscal year 2017 will increase by 72.4%, from U.S.$662 million budgeted for the 2016 fiscal year to U.S.$1,141 million budgeted for the 2017 fiscal year. On September 18, 2017, the Assembly completed its initial review of the PCA’s budget for its fiscal year ending on September 30, 2018. The proposed budget assumes an increase of 3.9% in transit revenues and an increase of 6.0% in total operating income and projects that dividends to the Central Government at the end of the year will increase by 3.2% from U.S $1,141 million budgeted for the 2017 fiscal year to U.S.$1,178 million budgeted for the 2018 fiscal year.
For the 2016 fiscal year, the PCA paid to the Central Government U.S.$669.8 million of dividends, an increase of 9.7% compared to U.S.$610.5 million of dividends that the PCA paid to the Central Government for the 2015 fiscal year. For the 2014, 2013 and 2012 fiscal years, the PCA paid to the Central Government U.S.$653.8 million, U.S.$610.5 million and U.S.$649.0 million of dividends, respectively. For the 2016 fiscal year, the PCA paid to the Central Government U.S.$385.9 million from tolls and services, an increase of 1.6% compared to U.S.$379.9 million for the 2015 fiscal year. For the 2014, 2013 and 2012 fiscal years, the PCA paid to the Central Government U.S.$374.2 million, U.S.$362.9 million and U.S.$378.0 million from tolls and services.
On August 7, 2015, the PCA announced a one-half foot reduction of the maximum draft for ships to transit the Panama Canal, due to low rainfall resulting from the El Niño weather pattern. By August 28, 2015, however, the PCA suspended this measure as a result of increased rainfall and other measures. Nevertheless, if droughts recur and alter the water level of Gatun Lake or Alajuela Lake, restrictions on permissible draft levels may be issued.
D-39
In April 2016, Cabinet Resolution No. 36 approving a new tolls structure took effect. The revised tolls structure affected charges for all segments of the market, except the category of domestic maritime conglomerate. The revised tolls applied to traffic on the ordinary channel, as well as traffic using the third set of locks that opened in June 2016. The revised tolls structure also modified rules for tolls and measurements for the segments of containerships, dry bulk, bulk liquid (tankers and gas tankers), car carriers and ro-ro (roll-on, roll-off) and created a segment for ships carrying liquefied natural gas.
In August 2017, the Cabinet Council approved modifications to the Canal tolls structure, pursuant to recommendations from the PCA Board of Directors. The approved adjustments will apply to all market segments and are scheduled to take effect on October 1, 2017. For the container carrier segment, the revised tolls structure will offer reduced rates on containers that are loaded on their return trip; this opportunity will be available to neopanamax vessels taking round-trip passages through the Canal, provided that: (1) the vessel has a use rate of at least 70% in the northern transit, and (2) the time between north and south transit does not exceed twenty-eight days. The revised structure also modifies tolls for ships carrying liquefied natural gas or liquefied petroleum gas. In addition, “container ships / loose cargo in bulk” were reclassified from the “other” segment to the “general cargo” segment, which is expected to result, typically, in lower rates for clients in this category.
In July 2017, the Panama Canal launched an environmental recognition program, “Green Connection,” to recognize clients that demonstrate excellent environmental management and to encourage others to implement technologies and standards that reduce emissions. The program includes an Environmental Premium Ranking and a Green Connection Award.
The PCA administers the “Bridge over the Panama Canal in the Atlantic Sector Project,” which was authorized by Law 28 of July 17, 2006 and consists of the design and construction of a concrete vehicular bridge and access roads, with a total length of approximately 4,605 meters and four lanes, in the province of Colón. The project contemplates a connection from the western on-ramp of the new bridge with an existing road commonly known as “Costa Abajo de Colon” and includes a bridge over the Chagres river, downstream of the Gatún landfill. As of March 31, 2017, the PCA had awarded U.S.$410.2 million in contracts for the project, including a U.S.$379.7 million contract with Puente Atlántico, S.A. for construction of the bridge over the Panama Canal.
Reversion of the Former Canal Zone Properties
In 1993, the Government established the Interoceanic Region Authority (“ARI”) to assist with the orderly transfer of the Canal and the former Canal Zone. ARI was an autonomous Government agency charged with integrating the former Canal Zone properties and resources into the Panamanian economy to enhance the country’s economic and social development. To this end, ARI was responsible for administering and managing the former Canal Zone areas (other than the Canal itself) after their reversion to Panamanian control. On December 27, 2005, the Cabinet issued Cabinet Resolution No. 108 transferring ARI’s functions and responsibilities to the Ministry of Economy and Finance. On January 1, 2006, the Ministry of Economy and Finance began overseeing the integration of former Canal Zone properties and resources into the Panamanian economy. In May 2006, ARI’s name was changed to the Administrative Unit of Reverted Properties (Unidad Administrativa de Bienes Revertidos) (“UABR”) by Executive Decree No. 67 dated May 25, 2006. Proceeds from the sale of the reverted properties were to be transferred to the Development Trust Fund. From September 2004 to June 2012, contributions to the Development Trust Fund from the UABR amounted to approximately U.S.$144.0 million. However, once the FAP was created in June 2012, contributions from the sale of reverted properties have been transferred to the National Treasury for payments of current expenditures.
Other Trans-Isthmus Transportation
The dimensions of the expanded Canal permit much of the world’s commercial maritime fleet to transit. However, certain classes of ships, principally the largest capacity tankers and container ships, are too large to transit the expanded Canal. This limitation, combined with the fact that the Canal has generally operated at capacity in terms of units, has caused the exploration of other trans-isthmus modes of transportation as a means of connecting the Atlantic and Pacific. For instance, a railway was constructed in the former Canal Zone, an oil pipeline was constructed outside the former Canal Zone, and toll highways were constructed to connect Panama City and Colón. Construction of a liquefied natural gas (“LNG”) terminal commenced in May 2016.
D-40
Railway. In February 1998, Panama granted a renewable 25-year concession to the Panama Canal Railway Co., a joint venture between two United States corporations, Kansas City Southern Industries, Inc. and MI-JACK Products, Inc., to renovate and reopen the trans-isthmus railway, principally to connect the container ship ports on both coasts. Under the terms of this concession, the Panama Canal Railway Co. is required to pay to the Government 5.0% of its gross revenue until it recovers its initial investment; after recovery of its initial investment, the Panama Canal Railway Co. will be required to pay the Government 10.0% of its gross revenue. As of September 2014, the Government was receiving a 5.0% payment of the railway’s gross revenue.
Passenger and container transport services were initiated in 2001. In 2011, the railway moved approximately 1.4 million TEUs, an increase of 181.5 thousand TEUs as compared to 2010. In 2012, the railway moved approximately 1.3 million TEUs, a decrease of 115.5 thousand TEUs as compared to the same period in 2011. In 2013, the railway moved approximately 1.2 million TEUs, a decrease of 30 thousand TEUs as compared to the same period in 2012. In 2014, the railway moved approximately 1.3 million TEUs, an increase of 63 thousand TEUs compared to the same period of 2013.
Oil Pipeline. The trans-isthmus oil pipeline, completed in 1982, was constructed because the world’s largest oil tankers could not transit the Panama Canal. The pipeline operated in an eastward direction, in large part to service the market for Alaskan crude oil shipments to oil refineries on the east coast of the United States. On November 28, 1995, the United States Congress rescinded the ban on the exportation of Alaskan crude oil, thereby allowing the export of Alaskan crude oil to Asia and eliminating the need to transport Alaskan crude oil to the east coast of the United States by means of the trans-isthmus oil pipeline. In June 1995, the Government signed a contract with Petroterminales de Panamá S.A. (a joint venture between the Government and Northville Industries Corp.) allowing Petroterminales de Panamá S.A. to expand the pipeline’s terminal ports at Chiriquí Grande on the Caribbean and Puerto Armuelles on the Pacific into general cargo ports until 2016. On March 9, 2016, the Cabinet issued Cabinet Resolution No. 29 authorizing a 20-year extension of the contract. The Pacific and Atlantic terminals are connected by a 131-kilometer (approximately 81-mile) pipeline. Since the completion of a pipeline reversal project in August 2009, oil has been pumped from the Atlantic to the Pacific Terminal. The pipeline has a pumping capacity of approximately 800,000 barrels per day.
Toll Road. In 1994, Panama granted a concession to Proyectos y Construcciones, S.A. (“PYCSA”), a Mexican consortium, for construction of the Madden-Colón highway, a trans-isthmus toll road between Panama City and Colón. The first of a total of two sections of this road was completed in May 1999. In January 2007, the Government approved the transfer of the concession from PYCSA to Odebrecht, a Brazilian construction company, which then transferred the concession to Concesionaria Madden-Colón (“CMC”), one of its Panamanian subsidiaries. Odebrecht built and completed the first phase of the toll road from Madden to Quebrada López at a total cost of approximately U.S.$299.6 million. In April 2009, the first phase of the Madden-Colón Highway became operational under the maintenance and administration of CMC, and the operation of the highway has been continuous and uninterrupted, and has generated toll payments. In July 2012, the second phase of the Madden-Colón highway connecting Quebrada López to Cuatro Altos was completed following an investment of approximately U.S.$213.6 million.
During the first quarter of 2011, the Government created ENA to provide the financing for, and to acquire ownership of, the Corredor Sur and Corredor Norte toll highways in Panama. In August 2011, ENA acquired Corredor Sur and issued and placed U.S.$395.0 million in bonds to finance the acquisition of the toll road. The Government contributed U.S.$50 million to ENA in connection with the purchase. The transaction was finalized on August 24, 2011. In 2012, ENA entered into agreements for the acquisition of Phases I and IIA and the Panama-Madden segments of Corredor Norte, for a purchase price of U.S.$647 million. ENA issued U.S.$600 million in bonds and the Government contributed approximately U.S.$76.2 million in connection with the purchase. The transaction completed in October 2012. In February 2013, ENA Este S.A., a subsidiary of ENA, acquired the concessions for Phase IIB, also referred to as ENA Este. Ena Este is an expansion of Corredor Norte that will connect with the Panamerican Highway, itself a continuation of Corredor Sur, and is intended mainly for purposes of commuting, with an expectation that 90% of the traffic will consist of automobiles. Principal construction began in March 2012 and was completed in November 2015. The government did not contribute directly to the construction of the road. In October 2012, the concession was transferred from ENA Este S.A. to the ENA Este Trust, which issued U.S.$212.0 million senior secured notes in March 2014 as part of the financing for construction of the road.
Liquefied Natural Gas. On June 26, 2015, the United States Trade and Development Agency (“USTDA”) awarded a grant to the PCA to support the planning of an LNG import terminal to take advantage of the Panama Canal expansion project. To capitalize on this growth, the PCA is interested in developing LNG-related infrastructure projects, including an import terminal. In addition, following the completion of a USTDA-funded feasibility study, construction of the first electricity generation plant in Central America based on liquefied natural gas commenced in May 2016 on Telfers Island, in the province of Colón. The project represents an investment of U.S.$1,150 million and is expected to add 381 MW to the country’s energy matrix as part of the National Energy Plan 2015-2050 and to include a regasification terminal with a storage capacity of 180,000 m3. The plan also contemplates the possibility of converting Panama into a distribution hub for liquefied natural gas for the region. The plant is expected to be operational in 2018.
D-41
THE COLÓN FREE ZONE
The CFZ was created by the Panamanian Government in 1948 to take advantage of Panama’s unique geographic location and to boost trading activity in the province of Colón. The CFZ, located at the Atlantic entrance of the Panama Canal, has developed into the largest duty-free zone in the Western Hemisphere in terms of commercial activity. As of December 31, 2016, approximately 2,062 companies used the CFZ service facilities for a variety of trading activities.
In addition to being exempt from tariffs and duties, companies operating in the CFZ enjoy preferential tax treatment. In the past, the income of CFZ companies was taxed at graduated rates from 2.5% to 8.5%. Under the Ley de Universalización de Incentivos Tributarios a la Producción, such income was to be taxed at a flat 15%. However, significant protests, including a refusal by some CFZ companies to pay taxes, resulted in the elimination of all taxes on international operations income for CFZ companies effective January 1, 1997.
The CFZ’s major competitors are free trade zones in the United States (Miami), Chile (Iquique), Aruba, Curaçao and Uruguay. Traditionally, the CFZ has enjoyed several competitive advantages over certain of its competitors, including the CFZ’s use of the U.S. dollar as legal tender, the absence of restrictions on capital movements and access to frequently traveled land, air and sea routes. Global and regional trends in trade patterns and capital liberalization, however, have narrowed several of these competitive advantages and affect the CFZ’s prospects for continued rapid growth.
Law No. 8 of April 4, 2016 provided a new framework for the CFZ, replacing Decree-Law No. 18 of 1948, which previously regulated the CFZ. Among other changes, the law provided for (a) an anti-money laundering/combating the financing of terrorism regime for the CFZ; (b) several revisions to the tax code, including exemptions from valued added tax in certain circumstances and providing for the Panamanian tax authority to communicate collection efforts through e-mail, phone, SMS text messaging and social networks; (c) reduction of the rate of the annual operation notice tax (from 1% to 0.5% on capital within the band of U.S.$100 to U.S.$50,000), which applies also to other free trade zones in Panama; (d) modifications to the activities that businesses may conduct within the CFZ, including services related to aviation, services by data centers and storage of digital information, international sale of goods through e-commerce, multi-modal services, services to individuals or entities located outside Panama and any other activity permitted by the duly authorized board of directors of the CFZ and (e) establishment of an immigration regime for foreign workers and foreign investors in the CFZ.
The CFZ has a significant impact on the Panamanian economy. From 2012 through 2016, it contributed an average of 7.3% of GDP. The value of goods passing through the CFZ is considerable, particularly in relation to the Panamanian economy as a whole. In 2012, total imports to the CFZ were U.S.$14.7 billion, while total re-exports were U.S.$16.1 billion. By contrast, Panama’s non-CFZ, non-petroleum merchandise exports were U.S.$821.0 million in 2012, while non-CFZ merchandise imports were U.S.$11.6 billion in 2012. In 2013, total imports to the CFZ were recorded at U.S.$12.7 billion, down from U.S.$14.7 billion in 2012, while total re-exports were U.S.$15.0 billion, down from U.S.$16.1 billion in 2012. By contrast, Panama’s non-CFZ, non-petroleum merchandise exports were U.S.$840.1 million in 2013, while non-CFZ merchandise imports were preliminarily recorded at U.S.$12.2 billion in 2013. In 2014, total imports to the CFZ were preliminarily recorded at U.S.$11.1 billion, down from U.S.$12.7 billion in 2013, while total re-exports were U.S.$13.0 billion, down from U.S.$15.0 billion in 2013. By contrast, Panama’s non-CFZ, non-petroleum merchandise exports were U.S.$815.9 million in 2014, while non-CFZ merchandise imports were preliminarily recorded at U.S.$12.8 billion in 2014. In 2015, total imports to the CFZ were estimated at U.S.$10.4 billion, a decrease from U.S.$11.1 billion in 2014, while total re-exports were U.S.$11.4 billion, a decrease from U.S.$13.0 billion in 2014. By contrast, Panama’s non-CFZ, non-petroleum merchandise exports were estimated at U.S.$694.4 million in 2015, while non-CFZ merchandise imports were estimated at U.S.$11.6 billion in 2015. In 2016, total imports to the CFZ were preliminarily estimated at U.S.$9.2 billion, a decrease from U.S.$10.4 billion in 2015, while total re-exports were preliminarily estimated at U.S.$10.4 billion, a decrease from U.S.$11.5 billion in 2015. By contrast, Panama’s non-CFZ, non-petroleum merchandise exports were preliminarily estimated at U.S.$635.5 million in 2016, while non-CFZ merchandise imports were preliminarily estimated at U.S.$11.3 billion in 2016.
In 2012, the activities of the CFZ increased by 5.6% compared to 2011, reflecting a contribution of 8.0% of GDP. In 2013, the activities of the CFZ decreased by 10.9% compared to 2012, reflecting a contribution of 7.6% of GDP. This decrease was primarily attributable to a decrease in revenues from imports. In 2014, the activities of the CFZ decreased by 12.4% compared to 2013, reflecting a contribution of 7.5% of GDP. In 2015, the activities of the CFZ decreased by 9.5% compared to 2014, reflecting a contribution of 7.0% of GDP. This decrease was primarily attributable to payment issues with Venezuelan importers due to Venezuelan foreign exchange controls and the application of increased tariffs to certain textiles, apparel and footwear by Colombian authorities. In 2016, the activities of the CFZ decreased by 10.1% compared to 2015, reflecting a contribution of 6.3% of GDP. The commercial area of the CFZ experienced declines in commercial activity due to economic and political conditions in the main CFZ trading countries.
D-42
On April 6, 2016, the government published Law No. 7 as part of an initiative to revitalize the CFZ. In accordance with this law, Panamanian residents are permitted, every six months, to buy up to U.S.$1,000 of tax-free merchandise for personal use. Also, the law provides incentives for infrastructure and enterprise investments in the CFZ, including certain tax exemptions.
Diplomatic and trade disputes with countries in the region have affected the CFZ. On March 6, 2014, Venezuela’s President Nicolas Maduro announced that Venezuela would break diplomatic and economic relations with Panama after Panama sought a meeting with regional diplomats in the OAS to discuss protests taking place in Venezuela. As a consequence, there were delays to the resolution of a series of overdue payments for the importation of goods into Venezuela from Panama’s CFZ; the overdue debts had resulted in part from exchange controls implemented by the Venezuelan National Center for Foreign Commerce (CENCOEX, formerly CADIVI), restricting the availability of U.S. dollars to Venezuelan importers. Estimates of the amount owed by Venezuelan companies range from U.S.$0.5 billion to U.S.$2.0 billion. Venezuelan and Panamanian authorities have claimed part of this debt derives from fraudulent over-invoicing and some Panamanian counterparties have conceded that there may be some unjustified charges. Resolution of claims by Panamanian exporters will likely involve a protracted process. Diplomatic relations between both countries were restored as of July 8, 2014. In October 2014, a diplomatic mission, led by the Minister of Commerce and Industry and the Vice Minister of Foreign Affairs, traveled to Venezuela to meet with Venezuelan authorities regarding outstanding debts owed to CFZ reexporters and Copa Airlines. As a result of these meetings, the Binational Technical Commission was reactivated, with the objective of promoting a resolution of this matter. During 2015, Panamanian officials continued to visit Venezuela to advance the process. On June 5, 2016, the CFZ and Venezuela agreed to a new methodology to determine the amount due on accounts payable by Venezuelan traders to their Panamanian counterparts. In accordance with the new methodology, the total amount owed to CFZ reexporters decreased from U.S.$530 million to U.S.$41 million. The CFZ Users Association has stated that the new methodology does not properly reflect the real amount of outstanding debts.
In January 2013, Colombia imposed supplemental import tariffs on certain textiles, apparel and footwear coming from countries where no trade agreement with Colombia was in force. In June 2013, Panama lodged a complaint at the WTO against Colombia claiming that the effective import tariff applied to those products is higher than the maximum allowed under WTO agreements. In November 2015, a WTO panel issued a report in which it concluded that the Colombian measures were inconsistent with WTO agreements. In a report dated May 12, 2016, the WTO Appellate Body rejected Colombia’s appeal and recommended that Colombia bring its tariffs into conformity with Colombia’s WTO obligations. In a notice dated September 6, 2017, the WTO Secretariat announced that panels have been composed to examine whether subsequent measures taken by Colombia are in conformity with its WTO obligations and to examine whether Panama may suspend the application of WTO concessions and other obligations in the amount of U.S.$210.0 million in respect of services, intellectual property, and the Multilateral Agreements on Trade in Goods. See “Foreign Trade and Balance of Payments— Composition of Foreign Trade”.
D-43
EMPLOYMENT AND LABOR
Labor Force
In 2016, Panama’s labor force was preliminarily estimated at 1.873 million (an increase from 1.826 million in 2015), which represented approximately 64.4% of the total working age population.
As of August 2016, the service segment (principally consisting of real estate, commerce and tourism, public administration, the Panama Canal, banking, the CFZ and public utilities) employed 66.2% of the employed labor force, compared to 15.4% for the primary sector (consisting of agriculture and fisheries) and 18.4% for the industrial sector (principally consisting of manufacturing, mining and construction). As of March 2017, the service segment employed 66.9% of the employed labor force, compared to 14.1% for the primary sector and 19.0% for the industrial sector.
In 2012, the unemployment rate decreased to 4.1%, compared to 4.5% in 2011. In 2013, the unemployment rate remained at 4.1%, primarily as a result of economic stability. In 2014, the unemployment rate increased to 4.8%, in response to a reduction in economic growth. In 2015, the unemployment rate increased to 5.1% due to the completion of major projects, such as the third set of locks of the Panama Canal and Metro Line 1, and a decline in sales by companies operating in CFZ. In 2016, the unemployment rate increased to 5.5% as a result of a deceleration in GDP growth. As of March 2017, the unemployment rate was 5.6%.
Historically, Panama’s unemployment rate has been influenced by the service-oriented nature of the economy, which is not labor intensive. Previous administrations introduced programs aimed at reducing unemployment, including Government-sponsored job fairs, training programs for those entering the work force for the first time, and policies to stimulate foreign trade and investment and to enhance education. Since 2009, the Government has sought to stimulate employment through long-term investment in infrastructure projects. Training programs such as My First Job (Mi Primer Empleo) and other similar programs have contributed to reducing unemployment levels; these programs have been executed by the Ministry of Work and Labor Development (Ministerio de Trabajo y Desarrollo Laboral, or “MITRADEL”), The National Institute of Professional and Human Development (El Instituto Nacional de Formación Profesional y Capacitación para el Desarrollo Humano or “INADEH”) and The Micro, Small and Medium Enterprises Authority (Autoridad de la Micro, Pequeña y Mediana Empresa or “AMPYME”).
Panamanian private sector workers have the legal right to join unions of their choice, subject to the unions’ registration with the Government. As of December 31, 2016, approximately 31.6% of Panama’s total employed labor force was organized, with the construction industry union as the largest. Unions engage in collective bargaining, primarily involving the negotiation of wages. The law prohibits anti-union discrimination by employers and most workers enjoy the right to strike. Certain public service workers vital to public welfare and security (e.g., police, health, and PCA employees) are not entitled to strike. While there were significant strikes during the economic and political disruptions of the mid-to-late 1980s, the number of strikes in recent years has generally been limited.
D-44
The following table sets forth certain labor force and unemployment statistics for the five years ended August 2012 through August 2016:
TABLE NO. 9
Labor Force and Employment
| | | | | | | | | | | | | | | | | | | | |
| | | 2012 | | | 2013 | | | 2014 | | | 2015 | | | 2016 | |
Total Population(1)(4) | | | 3,787.5 | | | | 3,850.7 | | | | 3,913.3 | | | | 3,975.4 | | | | 4,037.0 | |
Working-Age Population(1) | | | 2,659.8 | | | | 2,719.8 | | | | 2,782.1 | | | | 2,846.6 | | | | 2,910.0 | |
Labor Force | | | | | | | | | | | | | | | | | | | | |
Employed(1) | | | 1,617.2 | | | | 1,672.4 | | | | 1,695.4 | | | | 1,733.9 | | | | 1,770.7 | |
Unemployed(1) | | | 68.3 | | | | 71.5 | | | | 85.9 | | | | 92.3 | | | | 102.9 | |
Total | | | 1,685.4 | | | | 1,743.8 | | | | 1,781.3 | | | | 1,826.1 | | | | 1,873.6 | |
| |
| | | (annual percentage change) | |
Total Population | | | 1.7 | % | | | 1.7 | % | | | 1.6 | % | | | 1.6 | % | | | 1.6 | % |
Working-Age Population | | | 2.2 | % | | | 2.3 | % | | | 2.3 | % | | | 2.3 | % | | | 2.2 | % |
Labor Force | | | | | | | | | | | | | | | | | | | | |
Employed | | | 5.1 | % | | | 3.4 | % | | | 1.4 | % | | | 2.3 | % | | | 2.1 | % |
Unemployed | | | (5.4 | )% | | | 4.7 | % | | | 20.2 | % | | | 7.4 | % | | | 11.5 | % |
Total | | | 4.7 | % | | | 3.5 | % | | | 2.1 | % | | | 2.5 | % | | | 2.6 | % |
| |
| | | (in percent) | |
Labor Force: | | | | | | | | | | | | | | | | | | | | |
Participation Rate(2) | | | 63.4 | % | | | 64.1 | % | | | 64.0 | % | | | 64.2 | % | | | 64.4 | % |
Employment Rate(3) | | | 95.9 | | | | 95.9 | | | | 95.2 | | | | 94.9 | | | | 94.5 | |
Unemployment Rate | | | 4.1 | | | | 4.1 | | | | 4.8 | | | | 5.1 | | | | 5.5 | |
| (2) | Total labor force as percentage of working-age population. |
| (3) | Employed labor force as percentage of total labor force. |
Source: Office of the Comptroller General.
Salaries and Wages
Panamanian labor law provides for a basic minimum wage (starting at U.S.$1.46 per hour as of January 1, 2016, depending upon the worker’s location and economic activity). Workers are also entitled to minimum benefits and working conditions including a cap on hours worked weekly (48 hours/week), specified holidays, vacations, retirement and severance benefits, and health and safety regulations. The Panamanian economy, however, has a substantial informal sector in which workers earn below the minimum wage and do not enjoy many of the benefits required by law. The informal economy, which is estimated to involve approximately one-third of the labor force, includes street vendors, operators and employees of unlicensed businesses and certain other self-employed persons. While overall GDP statistics include economic contributions of the informal sector, the Government has not found it feasible to quantify fully the GDP contribution of this sector.
Although Canal Zone workers have been within the jurisdiction of Panamanian laws since the abolition of the Canal Zone in 1979, numerous treaty provisions and legislative and administrative actions have permitted the former Canal Zone workers who continue to work to be subject to United States wage and labor laws and benefits. Private sector employees rendering services related to the Panama Canal must be paid a significantly higher minimum wage than is applicable in the rest of Panama. PCC employees and civilian employees of the United States military were subject to special labor and social security regimes, depending on their nationality and the date of their original employment. By an amendment to the Constitution adopted in 1994, PCA employees did not have their wages or benefits diminished when the PCA assumed control of the Panama Canal on December 31, 1999.
D-45
In 2016, the average monthly wage in all sectors of the Panamanian economy (excluding private enterprise laborers) was U.S.$1,237.6, an increase of 11.0% compared to 2015. In 2015 and 2014, average monthly wages in all sectors of the Panamanian economy (excluding private enterprise laborers) increased by 7.0% and 5.6%, respectively. In 2013, average monthly wages in all sectors of the Panamanian economy (excluding private enterprise laborers) increased by 20.8%. In 2012, average monthly wages in all sectors of the Panamanian economy (including private enterprise laborers) increased by 9.8%.
In 2016, the average monthly wage for Central Government employees was U.S.$1,143.8, an increase of 8.0% compared to 2015. In 2015 and 2014, the average monthly wage for Central Government employees increased by 9.3% and 8.6%, respectively. In 2013 and 2012, the average monthly wage for Central Government employees increased by 5.8% and 21.4%, respectively.
In 2016, the average monthly wage for municipal public sector employees was U.S.$640.8, an increase of 12.6% compared to 2015. In 2015 and 2014, the average monthly wage for municipal public sector employees increased by 6.2% and 6.7%, respectively. In 2013 and 2012, the average monthly wage for municipal public sector employees increased by 4.4% and 1.1%, respectively.
In 2016, the average banana plantation monthly wage was U.S.$520.7, a decrease of 1.9% compared to 2015. In 2015 and 2014, the average banana plantation monthly wage increased by 6.5% and 14.7%, respectively. In 2013 and 2012, the average banana plantation monthly wage increased by 0.7% and 21.2%, respectively.
In 2016, the average public sector wage was U.S.$1,258.8, an increase of 11.2% compared to 2015. In 2015 and 2014, the average public sector wage increased by 7.0% and 5.5%, respectively. In 2013 and 2012, the average public sector wage increased by 4.5% and 11.2%, respectively.
By law, the minimum wage is subject to review every two years. The minimum wage, which became effective on January 1, 2012, was raised by Executive Decree No. 240 of December 28, 2011, which increased the minimum wage by a percentage of between 15% and 18%, depending on the sector. The minimum wage was reviewed again in December 2013 and increased pursuant to Executive Decree 182 of December 30, 2013 by a percentage between 12.4% and 27.8% depending on the sector and other factors. Executive Decree No. 293 of December 22, 2015 increased the minimum wage to its current levels by a percentage between 5.8% and 8.6%, to between U.S.$1.46 per hour and U.S.$4.18 per hour, depending on the area of the country, type of economic activity, type of profession and size of the employer company.
The following table sets forth a summary of average real monthly wages for the years ended in August 2012 through August 2016:
TABLE NO. 10
Average Real Monthly Wages
| | | | | | | | | | | | | | | | | | | | |
| | | 2012 | | | 2013 | | | 2014 | | | 2015 | | | 2016 | |
Public Sector: | | | | | | | | | | | | | | | | | | | | |
Central Government | | $ | 843.6 | | | $ | 892.2 | | | $ | 969.1 | | | $ | 1,058.8 | | | $ | 1,143.8 | |
Autonomous agencies | | | 947.4 | | | | 979.2 | | | | 1,009.1 | | | | 1,097.8 | | | | 1,193.9 | |
Social Security | | | 998.6 | | | | 1,077.9 | | | | 1,102.0 | | | | 1,108.3 | | | | 1,332.4 | |
Municipalities | | | 481.2 | | | | 502.5 | | | | 536.1 | | | | 569.2 | | | | 640.8 | |
Public Enterprises | | | 1,586.5 | | | | 1,609.7 | | | | 1,645.5 | | | | 1,750.6 | | | | 2,013.6 | |
All Public Sector | | | 959.1 | | | | 1,002.2 | | | | 1,057.8 | | | | 1,131.9 | | | | 1,258.8 | |
Private Enterprise(1) | | | 769.8 | | | | | | | | | | | | | | | | | |
Banana Plantations | | | 431.4 | | | | 434.3 | | | | 498.4 | | | | 530.6 | | | | 520.7 | |
All Employees(1) | | $ | 817.3 | | | $ | 987.0 | | | $ | 1,042.1 | | | $ | 1,115.3 | | | $ | 1,237.6 | |
D-46
| | | | | | | | | | | | | | | | | | | | |
| | | 2012 | | | 2013 | | | 2014 | | | 2015 | | | 2016 | |
| | | (annual percentage change) | |
Public Sector: | | | | | | | | | | | | | | | | | | | | |
Central Government | | | 21.4 | % | | | 5.8 | % | | | 8.6 | % | | | 9.3 | % | | | 8.0 | % |
Autonomous Agencies | | | 8.1 | | | | 3.4 | | | | 3.1 | | | | 8.8 | | | | 8.8 | |
Social Security | | | 0.9 | | | | 7.9 | | | | 2.2 | | | | 0.6 | | | | 20.2 | |
Municipalities | | | 1.1 | | | | 4.4 | | | | 6.7 | | | | 6.2 | | | | 12.6 | |
Public Enterprises | | | (5.2 | ) | | | 1.5 | | | | 2.2 | | | | 6.4 | | | | 15.0 | |
All Public Sector | | | 11.2 | | | | 4.5 | | | | 5.5 | | | | 7.0 | | | | 11.2 | |
Private Enterprise(1) | | | 9.3 | | | | — | | | | — | | | | — | | | | — | |
Banana Plantations | | | 21.2 | | | | 0.7 | | | | 14.7 | | | | 6.5 | | | | (1.9 | ) |
All Employees(1) | | | 9.8 | % | | | 20.8 | % | | | 5.6 | % | | | 7.0 | % | | | 11.0 | % |
| (1) | As of 2013, average wages of private enterprise laborers not recorded. |
Source: Office of the Comptroller General.
Social Security
Social security benefits covering private sector and public sector employees are provided by Caja de Seguro Social (“CSS”), with additional benefits for public sector employees provided through the Complementary Pension Fund for Civil Servants (“CPF”). The main sources of CSS revenue are contributions equal to 22.0% of wages (9.75% paid by employees and 12.25% by employers), Central Government transfers and investment income. In 2016, CSS’s revenues and expenditures amounted to 6.1% and 5.4% of nominal GDP, respectively.
Law No. 51 of 2005 reformed Panama’s social security system. Under Law No. 51 of 2005, effective 2013, employees must contribute to the social security system for 20 years before becoming eligible to receive benefits. Under Law No. 51 of 2005, the current retirement age for men is 62 and 57 for women. However, Law No. 51 of 2005 permits early or delayed retirement within a range of ages, and the specific age at which one retires determines a retiree’s level of benefits. Additionally, Law No. 51 of 2005 increased employer contributions to the social security system from 10.75% to 12.25% and employee contributions from 7.25% to 9.75%. Furthermore, Law No. 51 of 2005 reformed Panama’s social security system by gradually transitioning from a defined benefits system to personal savings accounts. All persons under 35 years of age who at the time the law became effective were covered by the social security system had the option of retaining the defined benefit system or electing to participate in the personal savings accounts.
The CSS provides benefits in the following areas: health, pensions and disability (“IVM”), workers’ compensation and program administration. Demographic trends, such as an aging population and increase in the number of pension beneficiaries, have contributed to a decline in the financial position of IVM.
To provide annual funds to the CSS’s IVM as mandated by Law No. 51 of 2005, Panama, represented by the Ministry of Economy and Finance, executed an Administration and Investment Trust (“IVM Trust”) in September 2008. Pursuant to Law No. 51 of 2005, Panama disbursed U.S.$75.0 million per year to the IVM Trust from 2007 to 2009; U.S.$100.0 million per year from 2010 to 2012; U.S.$140.0 million per year in 2013 and 2014; and is scheduled to continue to disburse U.S.$140.0 million per year until 2060. To cover IVM deficits, CSS requests transfers from the IVM Trust. In 2012, the IVM had a deficit of U.S.$5.9 million. In 2013, the IVM had a surplus of U.S.$154.3 million. In 2014, the IVM had a surplus of U.S.$30.3 million. In 2015, the IVM had a surplus of U.S.$70.6 million. In 2016, the IVM had a surplus of U.S.$40.6 million.
The CPF, created in 1975, facilitates payment of pensions to retired public sector employees, including those eligible to receive pensions under certain special laws that generally allow retirement before the CSS’s statutory retirement ages (as of December 31, 2015, 62 for men and 57 for women) with pensions of up to 100% of the most recently earned salary. Some of the special laws date back to the 1930s when the Government began granting benefits to particular categories of public sector employees. Once the statutory retirement age is reached and CSS pensions are received, the special laws provide additional pensions so as to maintain 100% of the most recently earned salary (up to certain maximums).
To finance the CPF’s pension payments, public sector employees contribute 2.0% of their salaries to the CPF and employers pay 0.3% of their employees’ wages to cover the CPF’s administrative costs. Law No. 8 of 1997 reformed the CPF and established the Public Employees Savings Pension Capitalization System (“SIACAP”), a defined contribution pension plan for most public sector employees. Only public sector employees who retired or were eligible for CPF pensions on or before December 31, 1999 continue to be CPF participants. Other public sector employees were immediately transferred to SIACAP. SIACAP participants have individual accounts funded initially with Government-issued bonds
D-47
equal to CPF contributions previously made by the participant plus interest at 5.0% per annum since contribution. Subsequent contributions have been made by participants and the Government as a percentage of the participant’s wages. Because SIACAP is a defined contribution plan, the value of future retirement benefits will depend on the assets in an individual’s account, thus eliminating future unfunded pension liability for the CPF for SIACAP participants.
Because SIACAP participants no longer make contributions to the CPF, the CPF has no revenues and will run annual deficits, although its annual deficits will decline as the number of participants falls.
Since its inception in July 2000 through December 31, 2016, SIACAP had received over U.S.$1.4 billion in contributions from its participants. As of December 31, 2016, SIACAP had 457,833 participants and carried a balance of U.S.$683.9 million in contributions from its participants. As of December 31, 2015, SIACAP had 442,741 participants and carried a balance of U.S.$661.4 million in contributions from its participants. As of December 31, 2014, SIACAP had 428,806 participants and carried a balance of U.S.$657.5 million, compared to 420,375 participants and a balance of U.S.$641.9 million as of December 31, 2013. As of December 31, 2012, SIACAP had 408,777 participants and carried a balance of U.S.$644.6 million.
D-48
PUBLIC FINANCE
Public finance in Panama is heavily influenced by the U.S. dollar-based monetary arrangements in place since 1904. The lack of a printed national currency and the general absence of domestic budgetary financing through the banking system, except to a limited extent, have imposed constraints on fiscal and monetary policy that are not present in countries that can finance their deficits by printing local currency.
Central Government Budget
The Government’s fiscal year is the calendar year. Pursuant to the Panamanian Constitution, responsibility for the preparation of the Central Government budget rests with the executive branch. Under Article 184 of the Constitution, the executive branch must submit a budget proposal to the Assembly by October 1 of each year.
Prior to December 31 of each year, the Assembly may accept, reject or suggest revisions to the budget proposal. If the Assembly accepts either the original or a revised budget proposal, it becomes law. If the Assembly rejects the budget proposal or the Assembly suggests revisions to the executive branch budget proposal and the executive branch does not reflect the revisions in the form of a new budget proposal submitted to the Assembly, then, for most expenditures, the prior year’s budget remains in force until a new budget is approved. For certain limited classes of expenditures, including budgeted debt service payments, the budget proposal must be implemented each year regardless of Assembly action. If the Assembly fails to take action on the budget by December 31 by accepting, rejecting or suggesting revisions, the new budget automatically becomes law on January 1.
The Assembly approved Panama’s 2017 budget on October 26, 2016. The 2017 budget contemplates total expenditures of U.S.$21.7 billion, with budget estimates based on an anticipated nominal GDP of U.S.$58.6 billion (5.8% growth from 2016) and an anticipated consolidated non-financial public sector deficit of approximately U.S.$585 million (approximately 1.0% of estimated nominal GDP) for 2017. Article 10 of the Social and Fiscal Responsibility Law, as amended by Law No. 38 of 2012, establishes a ceiling for the fiscal deficit adjusted balance of the non-financial public sector of 1.0% of nominal GDP projected in the budget for the 2017 fiscal year. The 2017 budget allocates public recurrent and capital expenditures as follows: 41.6% to social services; 17.2% to financial services; 15.9% to general services; 12.3% to infrastructure development; 2.3% to development and promotion of production; 1.0% to environment and technology; and 9.7% to other services. Investment for 2017 includes ongoing projects, such as Metro Line 2, the fourth bridge over the Canal, and Ciudad Esperanza (City of Hope, an urban housing project in the Arraiján district of Panama Oeste province for the construction of public housing and community amenities, such as a school, police station, recreation and sports facilities, a business plaza and public offices), and new projects, such as construction of the Technical Institute for Higher Education, Renovación Urbana de Colón (Colón Urban Renewal), and road construction on the Panamerican highway between La Chorrera and San Carlos.
On July 26, 2017, the Minister of Economy and Finance presented to the National Assembly the 2018 budget bill. The proposed national budget for 2018, totaling U.S.$23,397.1 million, would represent an increase of 7.9% compared to the 2017 national budget. The proposed 2018 budget assumes nominal GDP of U.S.$63.7 billion in 2018, 6.0% real GDP growth in 2018 and a non-financial public sector adjusted deficit in 2018 of approximately U.S.$318 million (approximately 0.5% of nominal GDP). Pursuant to the Social and Fiscal Responsibility Law, the ceiling on the non-financial public sector adjusted deficit in 2018 is 0.5% of projected nominal GDP. See “The Panamanian Economy—Reforms and Development Programs—Fiscal Reforms”. The proposed 2018 budget would allocate public recurrent and capital expenditures as follows: 46.8% to development of social services; 13.3% to financial services; 14.2% to general services; 11.0% to infrastructure development; 2.4% to development and promotion of production and 12.3% to other services.
The table below sets forth the budgeted expenditures of the Central Government by function for the indicated budget years:
TABLE NO. 11
Budgeted Expenditures of the Central Government by Function(1)
(in millions of dollars)
| | | | | | | | | | | | | | | | | | | | |
Itemization | | 2013 | | | 2014 | | | 2015 | | | 2016 | | | 2017 | |
Legislative | | | 65.3 | | | | 65.6 | | | | 71.5 | | | | 92.8 | | | | 90.6 | |
Judiciary | | | 108.2 | | | | 105.0 | | | | 120.3 | | | | 137.2 | | | | 160.9 | |
General Comptroller | | | 81.4 | | | | 86.2 | | | | 85.0 | | | | 90.5 | | | | 88.3 | |
Presidency | | | 1,463.3 | | | | 1,184.5 | | | | 902.1 | | | | 1,034.5 | | | | 1,504.0 | |
Government | | | 237.0 | | | | 347.6 | | | | 337.3 | | | | 322.5 | | | | 294.4 | |
Foreign Affairs | | | 59.5 | | | | 68.0 | | | | 80.3 | | | | 67.3 | | | | 66.7 | |
Education | | | 1,471.0 | | | | 1,649.0 | | | | 1,876.8 | | | | 2,075.2 | | | | 2,150.9 | |
Commerce and Industry | | | 88.8 | | | | 73.6 | | | | 92.8 | | | | 100.6 | | | | 139.1 | |
Public Works | | | 729.6 | | | | 917.6 | | | | 960.3 | | | | 851.9 | | | | 836.2 | |
Agriculture | | | 146.6 | | | | 138.1 | | | | 217.3 | | | | 203.6 | | | | 205.0 | |
Health | | | 1,511.9 | | | | 1,856.1 | | | | 2,000.2 | | | | 2,019.3 | | | | 2,113.8 | |
D-49
| | | | | | | | | | | | | | | | | | | | |
Labor | | | 40.8 | | | | 44.3 | | | | 31.0 | | | | 36.3 | | | | 40.7 | |
Housing | | | 87.5 | | | | 137.1 | | | | 256.3 | | | | 272.5 | | | | 381.2 | |
Economy and Finance | | | 706.6 | | | | 610.4 | | | | 1,051.0 | | | | 1,029.8 | | | | 858.5 | |
Social Development | | | 211.4 | | | | 249.6 | | | | 278.7 | | | | 286.6 | | | | 291.7 | |
Security | | | 637.3 | | | | 716.6 | | | | 654.5 | | | | 750.9 | | | | 746.5 | |
Public Ministry | | | 93.1 | | | | 100.6 | | | | 121.1 | | | | 158.6 | | | | 149.2 | |
Environment | | | — | | | | — | | | | — | | | | 58.6 | | | | 68.9 | |
Electoral Tribunal | | | 93.1 | | | | 85.3 | | | | 61.7 | | | | 63.4 | | | | 78.1 | |
Tax Administrative Court | | | 2.5 | | | | 2.8 | | | | 3.0 | | | | 3.0 | | | | 3.0 | |
Court of Accounts | | | 3.0 | | | | 3.1 | | | | 3.4 | | | | 3.6 | | | | 3.8 | |
Prosecutor of Accounts | | | 2.9 | | | | 3.0 | | | | 3.0 | | | | 3.1 | | | | 3.1 | |
Ombudsman | | | 5.8 | | | | 5.8 | | | | 5.5 | | | | 5.0 | | | | 5.0 | |
Other expenses | | | 13.8 | | | | 15.1 | | | | 18.6 | | | | 21.1 | | | | 21.1 | |
Total | | $ | 7,860.4 | | | $ | 8,465.2 | | | $ | 9,231.6 | | | $ | 9,629.3 | | | $ | 10,087.0 | |
Source: Ministry of Economy and Finance.
| (1) | Excluding transfers, subsidies and debt service. |
In 2016, Panama’s non-financial public sector balance registered a deficit of approximately U.S.$1,350.0 million (2.5% of nominal GDP), an increase of 11.7% compared to a deficit of approximately U.S.$1,208.1 million in 2015 (2.3% of nominal GDP), in part due to an 8.3% increase in current expenditures. In 2016, Panama’s non-financial public sector balance registered an adjusted deficit of U.S.$808 million (1.5% of nominal GDP), compared to an adjusted deficit of U.S.$1,043 million in 2015 (2.0% of nominal GDP).
In 2016, the Central Government’s overall balance registered a deficit of approximately U.S.$2.4 billion (4.4% of nominal GDP), an increase of 18.6% compared to a deficit of approximately U.S.$2.0 billion (3.9% of nominal GDP) in 2015, in part due to an 8.4% increase total expenditures. The Central Government’s overall balance registered a deficit of approximately U.S.$2.0 billion (3.9% of nominal GDP) in 2015, a deficit of approximately U.S.$1.9 billion (4.0% of nominal GDP) in 2014, a deficit of approximately U.S.$1.7 billion (3.8% of nominal GDP) in 2013 and a deficit of approximately U.S.$1.0 billion (2.6% of nominal GDP) in 2012.
Taxation
The Panamanian Constitution authorizes the levying and collection of taxes by taxing authorities at both the national and municipal levels. The Central Government collects taxes on personal and corporate income, real property and certain securities. In addition, the Central Government collects import and export duties and a value-added tax on all personal property, except food, medicine and other minor items. In July 2010, the value-added tax increased from 5.0% to 7.0%. Municipalities are permitted to collect taxes from sources of a more local nature, such as taxes on public performances, sales of alcoholic beverages, quarry activities and forestry.
Preliminary figures indicate that approximately 72.7% of the Central Government’s current revenues in 2016 came from various forms of taxation. Central Government tax revenues in 2016 were U.S.$5.5 billion, an increase of 9.2% from U.S.$5.1 billion of tax revenues in 2015. Approximately 53.0% of 2016 tax revenues were from direct taxes, compared to 50.8% of tax revenues in 2015. Direct tax revenues in 2016 were U.S.$2.9 billion, a 14.0% increase from U.S.$2.6 billion in 2015, primarily due to growth in tax revenue from capital gains tax and corporate income tax.
Personal income tax rates vary at incremental levels based on the individual’s annual earnings. Each tax bracket includes a fixed component as well as a variable percentage assessed on income above the minimum income level for the applicable bracket. Corporate income taxes are 30% of non-CFZ income, as a result of the 1995 Ley de Universalización de Incentivos Tributarios a la Producción (the “LUIT”). Domestic transaction taxes, such as the value-added tax, a tax on petroleum products, tobacco and beverage taxes and other indirect taxes, accounted for 48.8% of 2015 tax revenues.
Pursuant to Law No. 8 of 2010, beginning on January 1, 2012, companies in the categories of electricity distribution, reinsurance, certain financial activities, cement production, gambling, mining and banks pay income tax at the rate of 27.5%, down
D-50
from the previous rate of 30%. This rate decreased further to 25% as of January 1, 2014. Companies that fall under these categories and have a gross income of U.S.$1.5 million or more will pay the scheduled income tax or, in the alternative, will pay 4.64% of their gross income towards income tax, whichever is higher. Companies that are owned 40% or more by the Republic will pay 30% of their gross income towards income tax.
As a result of the LUIT, Panama’s accession to the WTO and other trade agreements, the rates and computation of various import duties have changed and can be expected to continue to change in the future. See “Foreign Trade and Balance of Payments— Tariffs and Other Trade Restrictions.”
In addition to the Central Government and municipalities, other public sector entities also have taxing authority. These include CSS, whose various taxes and assessments generally equal approximately 9.75% of an employee’s wages and 12.25% of an employer’s wage bill, while the education tax is equal to 1.25% of an employee’s wages and 1.5% of an employer’s wage bill.
Law No. 24 of 2013 was enacted to creat the Autoridad Nacional de Ingresos (“Panama Revenue Authority” or “ANIP”) to replace the Dirección General de Ingresos (“General Directorate of Taxation” or “DGI”) of the Ministry of Economy and Finance. Following best international practices, this new agency would be given significant autonomy from the Government. The Government expected that the establishment of this new agency would result in increased tax collections, efficiency and greater fiscal transparency. ANIP was expected to be managed by a General Administrator appointed for a seven-year period and a board of directors that would oversee its performance and compliance with all legal requirements. In September 2014, the plenum of the Supreme Court of Justice declared Law No. 24 of 2013 unconstitutional, finding that the law usurped functions of the President and Ministry of Economy and Finance. The DGI accordingly continues to serve as the national tax authority.
As of September 2016, Panama has signed Tax Exchange of Information Agreements with Canada, Denmark, Faroe Islands, Finland, Greenland, Iceland, Japan, Norway, Sweden and the United States. Panama has treaties for the avoidance of double taxation and prevention of fiscal evasion that have entered into force with 23 governments.
Revenues and Expenditures
Period Ended December 31, 2016
The Central Government’s total revenues for 2016 were U.S.$7,677 million, a 5.6% increase compared to U.S.$7,268 million 2015. In 2016, capital expenditures were U.S.$3,710 million, a 13.0% increase compared to U.S.$3,284 million in 2015, due to investment projects in public security, development and education. In 2016, current savings was U.S.$1,268 million, approximately 2.4% of estimated 2016 GDP and a 4.5% increase compared to U.S.$1,213 million in 2015, due mainly to an increase in tax revenue.
The table below sets forth the revenues and the expenditures of the Central Government for the periods indicated.
TABLE NO. 12
Fiscal Performance - Central Government
| | | | | | | | |
| | | Period Ended December 31,
(in millions of dollars) | |
| | | 2015 (R) | | | 2016 (P) | |
Total Revenues | | | 7,268 | | | | 7,695 | |
Adjusted Current Revenue | | | 7,206 | | | | 7,657 | |
Tax Revenue | | | 5,072 | | | | 5,573 | |
Non Tax Revenues | | | 2,135 | | | | 2,083 | |
Capital Income | | | 45 | | | | 29 | |
Donations | | | 16 | | | | 9 | |
Total Expenditures | | | 9,278 | | | | 9,898 | |
Current Expenditures | | | 5,993 | | | | 6,271 | |
Current Savings | | | 1,213 | | | | 1,386 | |
Capital Expenditures | | | 3,284 | | | | 3,628 | |
Deficit | | | (2,010 | ) | | | (2,203 | ) |
% of GDP | | | (3.9 | )% | | | (4.0 | )% |
Source: Ministry of Economy and Finance.
D-51
The non-financial public sector, which includes the Central Government, decentralized agencies (including CSS and principal universities) and non-financial public enterprises, had total revenues of U.S.$11,555 million during 2016, an 8.0% increase compared to U.S.$10,701 million in 2015. The increase was mainly due to an increase in CSS collections. Current savings for the non-financial public sector amounted to U.S.$2,530 million in 2016, a 7.6% increase compared to U.S.$2,352 million in 2015.
D-52
The following table sets forth the revenues, by purpose, and expenditures, by sector, of the consolidated non-public financial sector for the periods indicated.
TABLE NO. 13
Fiscal Performance - Consolidated Non-Financial Public Sector
| | | | | | | | |
| | | Period Ended December 31,
(in millions of dollars) | |
| | | 2015 (R) | | | 2016 (P) | |
Total Revenues | | | 10,701 | | | | 11,609 | |
Adjusted Current Revenue | | | 10,316 | | | | 11,110 | |
Capital Income | | | 48 | | | | 23 | |
Donations | | | 16 | | | | 9 | |
Total Expenditures | | | 11,909 | | | | 12,674 | |
Current Expenditures | | | 8,285 | | | | 8,910 | |
Current Savings | | | 2,352 | | | | 2,667 | |
Capital Expenditures | | | 3,624 | | | | 3,764 | |
Deficit | | | (1,208 | ) | | | (1,065 | ) |
% of GDP | | | (2.3 | )% | | | (1.9 | )% |
Source: Ministry of Economy and Finance.
Year Ended December 31, 2016
The following tables set forth the revenues, by purpose, and expenditures, by sector, of the Central Government and the consolidated non-financial public sector for the years 2012 through 2016. Under the terms of the 1994 amendments to the Constitution, the Panama Canal Authority budget is not included in the budget of the Central Government.
TABLE NO. 14
Central Government Operations
(in millions of dollars)
| | | | | | | | | | | | | | | | | | | | |
| | | 2012 (R) | | | 2013 (R) | | | 2014 (R) | | | 2015 (R) | | | 2016 (P) | |
Total Revenues | | | 6,490.1 | | | | 6,924.1 | | | | 7,097.9 | | | | 7,222.5 | | | | 7,695.2 | |
Current Revenues | | | 6,472.6 | | | | 6,796.5 | | | | 7,041.8 | | | | 7,161.0 | | | | 7,656.5 | |
Tax Revenues | | | 4,689.9 | | | | 4,859.3 | | | | 4,998.6 | | | | 5,036.0 | | | | 5,573.1 | |
Direct | | | 2,477.9 | | | | 2,619.6 | | | | 2,551.5 | | | | 2,577.0 | | | | 2,943.1 | |
Indirect | | | 2,212.0 | | | | 2,239.7 | | | | 2,447.1 | | | | 2,459.0 | | | | 2,630.0 | |
Non Tax Revenues | | | 2,051.0 | | | | 1,937.2 | | | | 2,043.2 | | | | 2,125.0 | | | | 2,083.4 | |
Adjustments to Rent | | | -268.3 | | | | 0.0 | | | | 0.0 | | | | 0.0 | | | | 0.0 | |
Capital Gains | | | 3.0 | | | | 114.3 | | | | 54.0 | | | | 45.2 | | | | 29.4 | |
Donations | | | 14.4 | | | | 13.3 | | | | 2.1 | | | | 16.3 | | | | 9.3 | |
Total Expenditures | | | 7,518.7 | | | | 8,613.9 | | | | 9,042.5 | | | | 9,249.0 | | | | 9,898.4 | |
Current Expenses | | | 4,563.3 | | | | 4,798.0 | | | | 5,684.1 | | | | 5,993.0 | | | | 6,270.5 | |
Wages and Salaries | | | 1,588.3 | | | | 1,761.2 | | | | 1,965.7 | | | | 2,187.0 | | | | 2,504.9 | |
Goods and Services | | | 524.7 | | | | 513.9 | | | | 700.5 | | | | 543.0 | | | | 622.6 | |
Transfers | | | 1577.0 | | | | 1,528.5 | | | | 1,988.4 | | | | 2,108.0 | | | | 2,016.1 | |
D-53
| | | | | | | | | | | | | | | | | | | | |
Interest | | | 739.8 | | | | 822.1 | | | | 837.6 | | | | 933.0 | | | | 997.3 | |
Others | | | 133.5 | | | | 172.3 | | | | 191.9 | | | | 222.0 | | | | 129.6 | |
Current Savings | | | 1,909.4 | | | | 1,998.5 | | | | 1,357.7 | | | | 1,168.0 | | | | 1,386.0 | |
% of GDP | | | 4.8 | % | | | 4.5 | % | | | 2.8 | % | | | 2.2 | % | | | 2.5 | % |
Total Savings | | | 1,926.8 | | | | 2,126.1 | | | | 1,413.8 | | | | 1,229.5 | | | | 1,424.7 | |
% of GDP | | | 4.8 | % | | | 4.7 | % | | | 2.9 | % | | | 2.4 | % | | | 2.6 | % |
Capital Expenditures | | | 2,955.5 | | | | 3,815.9 | | | | 3,358.4 | | | | 3,256.0 | | | | 3,627.9 | |
Primary Balance | | | (288.9 | ) | | | (867.7 | ) | | | (1,107.0 | ) | | | (1,093.5 | ) | | | (1,205.9 | ) |
% of GDP | | | (0.7 | )% | | | (1.9 | )% | | | (2.3 | )% | | | (2.1 | )% | | | (2.2 | )% |
Surplus or Deficit | | | (1,028.7 | ) | | | (1,689.8 | ) | | | (1,944.6 | ) | | | (2,026.5 | ) | | | (2,203.2 | ) |
% of GDP | | | (2.6 | )% | | | (3.8 | )% | | | (4.0 | )% | | | (3.9 | )% | | | (4.0 | )% |
Note: Totals may differ due to rounding.
Source: Ministry of Economy and Finance.
TABLE NO. 15
Consolidated Non-Financial Public Sector Operations
(in millions of dollars)(1)
| | | | | | | | | | | | | | | | | | | | |
| | | 2011(R) | | | 2012(R) | | | 2013(R) | | | 2014(R) | | | 2015(R) | |
Revenues: | | | | | | | | | | | | | | | | | | | | |
General Government | | | | | | | | | | | | | | | | | | | | |
Central Government | | $ | 6,343.7 | | | $ | 6,673.8 | | | $ | 6,920.5 | | | $ | 7,022.0 | | | $ | 7,534.6 | |
CSS | | | 2,186.1 | | | | 2,676.7 | | | | 2,793.8 | | | | 3,049.0 | | | | 3,379.9 | |
Consolidated agencies | | | 154.0 | | | | 187.1 | | | | 188.6 | | | | 200.0 | | | | 195.6 | |
Total | | $ | 8,683.8 | | | $ | 9,537.6 | | | $ | 9,903.0 | | | $ | 10,271.0 | | | $ | 11,110.1 | |
Public Enterprises Operations Surplus | | | 138.3 | | | | 124.6 | | | | 118.6 | | | | 123.0 | | | | 67.6 | |
Nonconsolidated Agencies Surplus and Others | | | 150.0 | | | | 91.6 | | | | 123.3 | | | | 198.0 | | | | 399.3 | |
Education Tax Surplus(2) | | | | | | | | | | | | | | | | | | | | |
Capital Revenues | | | 26.7 | | | | 182.5 | | | | 77.7 | | | | 48.0 | | | | 22.9 | |
Donations | | | 14.4 | | | | 13.3 | | | | 2.1 | | | | 16.0 | | | | 9.3 | |
Total | | $ | 9,013.2 | | | $ | 9,949.7 | | | $ | 10,224.7 | | | $ | 10,656.0 | | | $ | 11,609.2 | |
Expenditures: | | | | | | | | | | | | | | | | | | | | |
General Government | | | | | | | | | | | | | | | | | | | | |
Central Government | | | 3,394.4 | | | | 3,535.9 | | | | 4,353.4 | | | | 4,378.0 | | | | 4,657.9 | |
CSS | | | 2,084.9 | | | | 2,401.4 | | | | 2,545.9 | | | | 2,728.0 | | | | 2,991.3 | |
Consolidated agencies | | | 200.3 | | | | 200.4 | | | | 215.3 | | | | 239.0 | | | | 256.9 | |
Total | | $ | 5,679.6 | | | $ | 6,137.7 | | | $ | 7,114.6 | | | $ | 7,345.0 | | | $ | 7,906.1 | |
Capital Expenditures | | | 3,142.0 | | | | 4,014.1 | | | | 3,830.4 | | | | 3,595.0 | | | | 3,73.7 | |
Total | | $ | 8,821.6 | | | $ | 10,151.8 | | | $ | 10,945.0 | | | $ | 10,940.0 | | | $ | 11,669.8 | |
Balance(3) | | | 191.6 | | | | (202.1 | ) | | | (720.4 | ) | | | (284.0 | ) | | | (60.6 | ) |
Debt Interest Paid | | | 742.2 | | | | 823.9 | | | | 842.7 | | | | 940.0 | | | | 1,004.3 | |
Total Consolidated Non-Financial Public Sector Expenditures | | $ | 9,563.8 | | | $ | 10,975.7 | | | $ | 11,787.7 | | | $ | 11,880.0 | | | $ | 12,674.1 | |
Overall Surplus (Deficit) | | $ | (550.6 | ) | | $ | (1,026.0 | ) | | $ | (1,563.1 | ) | | $ | (1,224.0 | ) | | $ | (1,064.9 | ) |
Percentage of GDP (nominal) | | | (1.4 | )% | | | (2.3 | )% | | | (3.2 | )% | | | (2.3 | )% | | | (1.9 | )% |
D-54
| (1) | Non-Financial Public Sector excludes PCA, BNP and Caja de Ahorros. |
| (2) | For the year 2011 and any subsequent year, this figure is included in the “Nonconsolidated Agencies Surplus and Others” line item. |
| (3) | Excluding interest payments. |
Note: Totals may differ due to rounding.
Sources: Office of the Comptroller General, Ministry of Economy and Finance and other public institutions.
Administration of Public Funds
Law No. 56 of September 17, 2013 created the Treasury Single Account (“TSA”), an official bank account administered by the Ministry of Economy and Finance, in which all public revenues will be deposited and from which payment of the obligations of public institutions will be made. Law No. 19 of September 30, 2014, which amends Law No. 56 of 2013, excludes municipalities and community boards, the PCA, the CSS, Tocumen, S.A., Empresa Nacional de Autopistas, S.A., Empresa de Transmisión Eléctrica, S.A., state universities and financial intermediaries.
The TSA initiative is intended to allow for greater efficiency, transparency and security in the administration of public funds. Implementation of the TSA is intended to lead to modernization of the Treasury, standardization of operating procedures, timely and reliable information regarding balances and financial availability of the National Treasury and an increase in liquidity and in the efficiency of the management of public funds. It is expected that the TSA will become an essential tool for consolidating and managing the Government’s cash resources, thereby reducing borrowing needs and costs. On May 28, 2015, the TSA was launched and unified 5,818 accounts that public entities held in local banks.
Pursuant to Law No. 56 of 2013, the first stage of implementation of the TSA applies only to central government institutions, followed by decentralized entities in 2016 and, lastly, to public enterprises in 2017.
International Reserves
Because Panama uses the U.S. dollar as legal tender and prints no domestic paper currency, Panama does not have foreign currency reserves in the conventional sense. In Panama, in contrast to many other countries, foreign currency reserves are not necessary for providing the private sector economy with foreign currency to pay for imports or for managing exchange rates for a domestic currency. Panama’s foreign currency reserves are generally considered to consist of BNP’s U.S. dollar-denominated foreign assets; Panama also maintains deposits denominated in euros and Japanese yen. As of December 31, 2016, BNP’s foreign assets were U.S.$3.5 billion, an increase of 16.3% compared to U.S.$3.0 billion as of December 31, 2015. As of December 31, 2015, BNP’s foreign assets decreased to U.S.$3.0 billion (from U.S.$3.5 billion as of December 31, 2014), primarily due to risk diversification. As of December 31, 2014, BNP’s foreign assets increased to U.S.$3.5 billion (from U.S.$2.4 billion as of December 31, 2013). As of December 31, 2013, BNP’s foreign assets increased to U.S.$2.4 billion (from U.S.$2.1 billion as of December 31, 2012). As of December 31, 2012, BNP’s foreign assets increased to U.S.$2.1 billion (from U.S.$1.8 billion as of December 31, 2011), primarily due to increased liquidity and risk diversification. Neither BNP nor the Government currently maintain gold reserves.
The following table sets forth certain information regarding Panama’s international reserves at the dates indicated:
TABLE NO. 16
International Reserves
| | | | | | | | | | | | | | | | | | | | |
| | | December 31, | |
| | | 2012 | | | 2013 | | | 2014 | | | 2015 | | | 2016 | |
Foreign Exchange(1) | | $ | 2,118.3 | | | $ | 2,393.5 | | | $ | 3,491.3 | | | $ | 3,028.2 | | | $ | 3,480.7 | |
Reserve Position in IMF | | | 18.2 | | | | 18.3 | | | | 17.2 | | | | 16.4 | | | | 59.1 | |
Total(2) | | $ | 2,136.5 | | | $ | 2,411.8 | | | $ | 3,508.5 | | | $ | 3,044.6 | | | $ | 3,539.8 | |
| (1) | Foreign assets of BNP in millions of dollars |
| (2) | In millions of dollars. |
Source: IMF and BNP.
D-55
FINANCIAL SYSTEM
In 2016, the financial service sector represented 7.9% of GDP in chained volume measure. In 2015 and 2014, the financial service sector represented 7.7% and 7.4% of GDP in chained volume measure, respectively. In 2013 and 2012, the financial service sector represented 7.6% and 7.5% of GDP in chained volume measure, respectively.
The Banking Sector
Development of the banking sector has benefitted from the use of the U.S. dollar as the legal tender, the liberal banking law in effect from 1970 to 1998, the current Banking Law enacted in 1998, tax advantages and large flows of trade fostered by the Panama Canal and CFZ. The most distinctive feature of the banking sector is its international orientation with numerous foreign banks playing an important role.
Banks in Panama are classified into four groups: (i) official banks, which are those owned by the Government and authorized to carry out banking business in the domestic market and abroad; (ii) general license banks, which can undertake domestic or international operations; (iii) international license banks, which do not undertake domestic operations but are authorized to direct, from their Panamanian offices, transactions that are negotiated, carried out or produce their results abroad; and (iv) foreign banks with representative offices, which may not book transactions in Panama. As of December 31, 2016, two official banks, 46 private sector general license banks, 28 international license banks and 15 representative offices constituted the banking sector. Of the 46 private sector general license banks, 17 were incorporated in Panama and the rest abroad.
At December 31, 2016, measured by assets, the largest bank based in Panama was Banco General, S.A., with U.S.$.14.9 billion in assets. Banco Nacional de Panamá (“BNP”) with U.S.$10.4 billion in assets at December 31, 2016 was the second largest bank based in Panama. Two of the other largest banks, based on assets, are Banistmo, S.A. and BAC International Bank Inc. The largest international license banks, based on assets, are Bancolombia (Panama), S.A., Banco de Crédito del Perú and Banco de Bogotá S.A.
The following table sets forth information regarding the largest banks in Panama based on their assets at December 31, 2016 in each of three categories:
TABLE NO. 17
Largest Banking Institutions
(assets in millions of dollars)
| | | | |
| | | Total Assets | |
Official Banks | | | | |
Banco Nacional de Panamá(1) | | US$ | 10,435 | |
Caja de Ahorros | | US$ | 3,386 | |
General License Banks(2) | | | | |
Banco General, S.A. | | US$ | 14,891 | |
Banistmo, S.A. | | US$ | 9,244 | |
BAC International Bank Inc. | | US$ | 7,336 | |
International License Banks | | | | |
Bancolombia (Panama), S.A. | | US$ | 5,310 | |
Banco de Crédito del Perú | | US$ | 3,108 | |
Banco de Bogotá, S.A. | | US$ | 2,570 | |
Popular Bank Ltd. Inc. | | US$ | 1,100 | |
| (1) | Also considered a general license bank. |
| (2) | Other than BNP and Caja de Ahorros. |
Source: Superintendency of Banks.
Total assets of the banking sector were approximately 3.3% higher at year-end 2016 than at year-end 2015. Deposits were approximately 2.6% higher at year-end 2016 than at year-end 2015.
D-56
The table below sets forth information on the banking sector at December 31 for each of the years 2012 through 2016:
TABLE NO. 18
The Banking Sector (in millions of dollars)
| | | | | | | | | | | | | | | | | | | | |
| | | December 31st, | |
| | | 2012 | | | 2013 | | | 2014 | | | 2015 | | | 2016 | |
Assets: | | | | | | | | | | | | | | | | | | | | |
Liquid Assets: | | | | | | | | | | | | | | | | | | | | |
Deposits in local banks | | $ | 2,630 | | | $ | 3,046 | | | $ | 3,525 | | | $ | 3,423 | | | $ | 3,196 | |
Deposits in foreign banks | | | 12,275 | | | | 13,279 | | | | 16,801 | | | | 17,064 | | | | 18,169 | |
Other | | | 882 | | | | 996 | | | | 1,034 | | | | 1,007 | | | | 1,176 | |
Total Liquid Assets | | | 15,787 | | | | 17,322 | | | | 21,360 | | | | 21,493 | | | | 22,541 | |
Loans | | | 56,009 | | | | 60,612 | | | | 66,044 | | | | 72,547 | | | | 74,910 | |
Investments in Securities | | | 14,852 | | | | 16,245 | | | | 17,553 | | | | 19,631 | | | | 19,949 | |
Other assets | | | 3,078 | | | | 3,743 | | | | 3,463 | | | | 3,516 | | | | 3,676 | |
Total Assets | | | 89,726 | | | | 97,922 | | | | 108,420 | | | | 117,188 | | | | 121,075 | |
Liabilities: | | | | | | | | | | | | | | | | | | | | |
Deposits: | | | | | | | | | | | | | | | | | | | | |
Internal: | | | | | | | | | | | | | | | | | | | | |
Official | | | 5,723 | | | | 6,859 | | | | 7,641 | | | | 8,623 | | | | 9,047 | |
Public | | | 29,328 | | | | 32,284 | | | | 34,860 | | | | 36,692 | | | | 38,460 | |
Banks | | | 2,553 | | | | 3,136 | | | | 3,427 | | | | 3,654 | | | | 3,229 | |
Total Internal Deposits | | | 37,603 | | | | 42,280 | | | | 45,928 | | | | 48,968 | | | | 50,735 | |
External: | | | | | | | | | | | | | | | | | | | | |
Official | | | 44 | | | | 99 | | | | 1,704 | | | | 839 | | | | 198 | |
Public | | | 19,734 | | | | 20,145 | | | | 23,084 | | | | 25,028 | | | | 24,678 | |
Banks | | | 6,688 | | | | 7,586 | | | | 7,256 | | | | 8,986 | | | | 10,380 | |
Total External Deposits | | | 26,467 | | | | 27,830 | | | | 32,044 | | | | 34,853 | | | | 35,256 | |
Total Deposits | | | 64,070 | | | | 70,110 | | | | 77,973 | | | | 83,821 | | | | 85,991 | |
Obligations | | | 13,408 | | | | 14,978 | | | | 16,368 | | | | 18,539 | | | | 18,626 | |
Other Liabilities | | | 2,691 | | | | 2,827 | | | | 2,768 | | | | 2,651 | | | | 2,948 | |
Total Liabilities | | | 80,168 | | | | 87,915 | | | | 97,108 | | | | 105,011 | | | | 107,565 | |
Capital and Reserves | | | 9,558 | | | | 10,007 | | | | 11,311 | | | | 12,177 | | | | 13,510 | |
Total Liabilities and Capital | | $ | 89,726 | | | $ | 97,922 | | | $ | 108,420 | | | $ | 117,188 | | | $ | 121,075 | |
Source: Superintendency of Banks.
Banking Law
On February 26, 1998, the President of the Republic, upon authority granted by the Assembly, adopted Law No. 9 of February 26, 1998 (the “Banking Law”), a comprehensive revision and restatement of the 1970 banking law of Panama. The Banking Law became effective on June 13, 1998. Among the significant changes introduced by the Banking Law were the replacement of the National Banking Commission with the Superintendency of Banks, a more independent regulatory agency with greater supervisory powers, the establishment of new minimum capital requirements and the adoption of capital adequacy standards consistent with those contained in the Basel Accords at the time.
The Banking Law established the Superintendency of Banks as an autonomous agency of the Government with its own assets and independent governance. The principal governing body of the Superintendency of Banks is a five-member board of directors (the “Board of Directors”). Members of the Board of Directors must meet certain minimum qualifications and are appointed by the President, without need for legislative ratification. Board members are appointed to eight-year terms, with the possibility of one additional term, and may be removed only for cause. To provide for staggered terms, the initial terms of three members of the Board of Directors were for less than eight years. In addition to exercising administrative functions, the Board of Directors is responsible for approving regulations concerning the interpretation and implementation of banking laws and setting capital adequacy standards.
D-57
The Banking Law also established the Office of the Superintendent of Banks, a full-time government official appointed by the President (without legislative intervention) for a maximum of two five-year terms. As with the members of the Board of Directors, the Superintendent of Banks must meet certain minimum qualifications and may be removed only for cause. As chief administrative officer of the Superintendency of Banks, the Superintendent of Banks is charged with managing the day-to-day operations of the agency, granting banking licenses, authorizing new branches, ordering intervention and the liquidation of banks, performing banking inspections required by law or ordered by the Board of Directors, overseeing the activities of banks in the system, imposing sanctions and, in general, exercising all powers that are not reserved to the Board of Directors.
All banks operating in Panama, including BNP and other official banks, are supervised by the Superintendency of Banks. BNP and other official banks are also supervised by the Comptroller General.
Under the Banking Law, general license banks must have paid-in capital of not less than U.S.$10 million. Additionally, general license banks must maintain minimum capital of 8.0% of their total risk-weighted assets. Capital is defined to include primary capital and secondary capital. Primary capital (also known as tier one capital) consists of paid-in capital, declared reserves and retained earnings, and secondary capital (also known as tier two capital) includes undeclared reserves, revaluation reserves, general reserves for losses, certain hybrid instruments and certain subordinated indebtedness. Secondary capital may not exceed primary capital. The Superintendency of Banks is authorized to increase the minimum capital requirement percentage in accordance with generally accepted international capitalization standards.
General license banks are required to maintain 30.0% of their global deposits in liquid assets of the type prescribed by the Superintendency of Banks. In addition, general license banks are required to maintain local assets in Panama in an amount not less than 85.0% of their local deposits. The Superintendency of Banks may, in accordance with economic and financial conditions of the Republic, increase the required levels of local assets up to 100% of the local deposits.
Regulations regarding interest rate ceilings in the prior banking law were abolished by the Banking Law. Currently, each bank in Panama fixes the amount of interest that it charges on loans and other facilities. Banks are required to indicate the effective interest rates of loans and deposits in their statements to clients or at a client’s request. Under the Banking Law, deposits from central banks and other similar institutions are immune from attachment or seizure. Compared to the prior banking law, the Banking Law provides for lower lending limits to a single borrower and certain related parties. Under the new limits, no bank in Panama may make loans, assume obligations or otherwise extend credit or issue guarantees to any one person or group of related persons in excess of 25.0% of the bank’s total capital. A higher lending limit of 30.0% of total capital applies to banks whose shares are owned by governmental and private institutions whose principal office is located in Panama and whose main line of business is lending to other banks.
The Banking Law also provides for additional limitations and restrictions on the ability of a bank to extend credit and issue guarantees to parties related to such bank. Related parties include the bank’s officers and directors and certain shareholders owning individually 5.0% or more of the capital stock of the bank.
Banks in Panama are subject to inspection by the Superintendency of Banks at least once every two years. Such supervisory powers of the Superintendency of Banks also extend to each bank’s subsidiaries and branches. Each bank is required to file monthly balance sheets and quarterly and annual statements indicating the performance of its credit facilities and other reports and information as prescribed by the Superintendency of Banks. In addition, each bank is required to make available for inspection its accounting records, minutes, reports on cash on hand, securities, receipts and any other reports or documents that are necessary for the Superintendency of Banks to ensure such bank’s compliance with Panamanian banking laws and regulations. Banks subject to supervision may be fined by the Superintendency of Banks for violations of banking laws and regulations.
Under the Banking Law, the Superintendency of Banks may order the reorganization of a bank without first replacing the management when it considers this course of action to be in the best interests of the depositors and to guarantee the solvency and continuity of such bank. The Superintendency of Banks has broad powers under the Banking Law to reorganize banks and can require shareholders to pay in additional capital or to authorize the issuance of new shares and their sale to third parties at prices determined by the Superintendency of Banks. Furthermore, the Superintendency of Banks may require a bank to restructure itself more fundamentally. For example, the Superintendency of Banks may require a bank to merge or consolidate with other banks, negotiate bridge loans, sell or partially liquidate assets and grant security interests in connection with such reorganization. Ultimately, if reorganization efforts fail, the Superintendency of Banks is empowered to begin the liquidation process.
D-58
The Banking Law established an annual supervisory charge to be paid by general license banks equal to U.S.$30,000 plus U.S.$35.00 per each U.S.$1.0 million in assets, up to a maximum charge of U.S.$100,000.
In 2008, the Banking Law was reformed by Law Decree No. 2 of February 22, 2008, effective as of August 25, 2008 (“Bank Law Reform”). The Bank Law Reform targeted new challenges and competition faced by the Panamanian banking system, with particular emphasis on the international market. Principal amendments included the following:
| | • | | extending the regulatory authority of the Superintendency of Banks to cover corporations that, together with banks, form a bank group that includes holding companies of banks. This authority also extends to nonbanking corporations affiliated with a bank group; |
| | • | | granting the Superintendency of Banks legal authority to take into consideration other types of risks, such as market risk, operational risk and country risk, in determining the valuation of capital requirements; |
| | • | | modifying the procedures to deal with banks with problems or financial distress to make them more expeditious and enhancing the ability of depositors to recover their savings; |
| | • | | expanding the sanctioning authority of the Superintendency of Banks to regulate in the following areas: (i) noncompliance with provisions to prevent money laundering, funding of terrorism and related crimes; (ii) legal requirements on capital; (iii) banking liquidity; (iv) submission of documents and reports to the Superintendency of Banks; and (v) prohibitions and limitations imposed by the Banking Reform Law on banks and banking groups, including obligations of confidentiality. |
In June 2014, FATF placed Panama on its list of jurisdictions with strategic AML and CFT deficiencies, also referred to as the grey list. In June 2014, Panama made a high-level political commitment to work with the FATF and the Grupo de Acción Financiera de Latinoamérica (“GAFILAT,” formerly the Grupo de Acción Financiera de Sudamérica, “GAFISUD”) to address its strategic AML/CFT deficiencies. Panama followed the recommended FATF plan, and it was removed from the FATF’s grey list on February 18, 2016. In May 2017, GAFILAT representatives conducted a two-week visit to Panama as part of the Fourth Round of Mutual Evaluation, which involves an evaluation of Panama’s AML and CFT systems and mechanisms; a final report from the evaluation is scheduled to be presented during the GAFILAT plenary meeting in December 2017.
On May 5, 2016, the Superintendency of Banks assumed administrative and operational control of Balboa Bank & Trust, Corp., a Panamanian bank, as a result of a notice from the Office of Foreign Assets Control (“OFAC”) of the U.S. Department of the Treasury, indicating the bank to be implicated in illicit activities by the Waked Money Laundering Organization (“Waked MLO”). Also on May 5, 2016, OFAC determined that the Waked MLO had participated in trade-based schemes to launder drug proceeds on behalf of multiple international drug traffickers and their organizations. OFAC designated the Waked MLO, its two leaders, six Panama-based MLO associates, and 68 companies tied to the drug money laundering network each as Specially Designated Narcotics Traffickers pursuant to the Foreign Narcotics Kingpin Designation Act. As a result of the designations, the U.S. government froze all assets of the listed entities and individuals that were under the jurisdiction of the United States or in the control of U.S. persons and generally prohibited U.S. persons from entering into transactions with the listed entities and individuals, absent an appropriate license or other authorization. On June 3, 2016, the Superintendency of Banks of Panama issued a statement reiterating the stability and soundness of the Panamanian banking system and stating that the designations do not represent a risk of contagion to the rest of the system. On July 28, 2017, the Superintendency of Banks extended by 75 days the period for a reorganization of Balboa Bank & Trust, Corp. that, if consummated, would result in its acquisition by Grupo Bancario BCT; the pending acquisition by Grupo Bancario BCT remains subject to certain conditions and processes.
Public Sector Banking Institutions
Banco Nacional de Panamá
BNP, created in 1904, functions as a governmental bank. The General Manager of the bank is appointed by the Executive Branch of the Republic. BNP is responsible for supplying banks operating in Panama with U.S. dollars and has authority to issue and distribute coins in Panama. BNP is the Government’s banker and financial agent and acts as a clearinghouse for checks and other instruments for all other Panamanian banks. BNP also offers a wide range of commercial banking services through its 80 branches throughout Panama. In accordance with the law that governs BNP, the Government is responsible for the liabilities of BNP.
D-59
Given Panama’s U.S. dollar-based economy, BNP does not make monetary policy or print paper currency and is not a lender of last resort for Panama. BNP has no direct regulatory authority over Panamanian banks and, under the Banking Law, BNP has no representation in the Superintendency of Banks. BNP does not use rediscount or loan mechanisms with other commercial banks. There are no restrictions on its activities other than those imposed on commercial banks in Panama. BNP, like the commercial banks, has the ability to make direct loans to the Government and to purchase notes issued by Panama. BNP has certain competitive advantages compared to the rest of the Panamanian banking system in that it enjoys a monopoly on public sector deposits. The Banking Law, however, subjects BNP to regulation by the Superintendency of Banks.
BNP is the largest banking institution in Panama in terms of domestic credit, local deposits and savings deposits. Total assets of BNP, as of December 31, 2016, were U.S.$10.4 billion, bank deposits were U.S.$3.6 billion, and net loans were U.S.$3.5 billion, of which U.S.$406.1 million were made to the public sector and U.S.$3.2 billion were made to the private sector. Total assets of BNP, as of December 31, 2016, were U.S.$10.4 billion, bank deposits were U.S.$3.6 billion and loans were U.S.$3.5 billion, of which U.S.$406.1 million were made to the public sector and U.S.$3.2 billion were made to the private sector. See “Public Sector Debt—Internal Debt”.
As of December 31, 2016, BNP’s capital and reserves represent 20.8% of its bank deposits and 7.3% of its total assets. BNP generated gross income of U.S.$305.1 million in 2016, U.S.$267.8 million in 2015, U.S.$266.4 million in 2014, U.S.$260.2 million in 2013 and U.S.$238.0 million in 2012. BNP’s net income was U.S.$124.8 million in 2016, U.S.$103.1 million in 2015, U.S.$101.8 million in 2014, U.S.$120.2 million in 2013 and U.S.$140.1 million in 2012. The increases in 2016 in net and gross income are primarily attributable to higher income from interest and commissions.
As of December 31, 2016, the Republic had an outstanding balance of U.S.$200 million with BNP.
The following table sets forth BNP’s balance sheet at December 31 for the years 2012 through 2016:
TABLE NO. 19
Banco Nacional de Panamá
Balance Sheet
(in millions of dollars)
| | | | | | | | | | | | | | | | | | | | |
| | | December 31, | |
| | | 2012 | | | 2013 | | | 2014 | | | 2015 | | | 2016 | |
Assets: | | | | | | | | | | | | | | | | | | | | |
Cash and checks | | $ | 229.3 | | | $ | 326.1 | | | $ | 348.5 | | | $ | 195.4 | | | $ | 265.7 | |
Bank deposits | | | 2,487.3 | | | | 2,706.4 | | | | 3,791.3 | | | | 3,300.2 | | | | 3,643.9 | |
Total | | | 2,716.6 | | | | 3,032 | | | | 4,139.8 | | | | 3,495.6 | | | | 3,909.6 | |
Loans: | | | | | | | | | | | | | | | | | | | | |
Domestic loans: | | | | | | | | | | | | | | | | | | | | |
Public sector | | | 473.9 | | | | 497.2 | | | | 435.6 | | | | 612.0 | | | | 406.1 | |
Private sector | | | 2,516.9 | | | | 2,766.9 | | | | 2,706.0 | | | | 2,832.4 | | | | 3,171.1 | |
Less provisions | | | (58.0 | ) | | | (52.6 | ) | | | (40.4 | ) | | | (36.6 | ) | | | (48.0 | ) |
Total (net) | | | 2,932.8 | | | | 3,211.5 | | | | 3,101.3 | | | | 3,407.8 | | | | 3,529.2 | |
Investments: | | | 1,829.9 | | | | 2,033.2 | | | | 1,872.1 | | | | 2,728.2 | | | | 2,749.9 | |
Net Fixed Assets | | | 95.6 | | | | 104.7 | | | | 80.5 | | | | 74.3 | | | | 73.6 | |
Other Assets | | | 143.7 | | | | 253.3 | | | | 82.5 | | | | 82.9 | | | | 89.5 | |
Total | | | 7,718.6 | | | | 8,635.2 | | | | 9,319.2 | | | | 9,832.8 | | | | 10,408.9 | |
Liabilities: | | | | | | | | | | | | | | | | | | | | |
Deposits | | | 6,687.4 | | | | 7,764.4 | | | | 8,393.6 | | | | 8,934.4 | | | | 9,411.6 | |
D-60
| | | | | | | | | | | | | | | | | | | | |
| | | December 31, | |
| | | 2012 | | | 2013 | | | 2014 | | | 2015 | | | 2016 | |
Other Liabilities | | | 386.4 | | | | 277.9 | | | | 269.0 | | | | 206.4 | | | | 240.2 | |
Total | | | 7,073.8 | | | | 8,042.3 | | | | 8,662.6 | | | | 9,140.8 | | | | 9,651.8 | |
Capital and Reserves | | | 644.8 | | | | 592.8 | | | | 656.6 | | | | 692.0 | | | | 757.1 | |
Total Liabilities and Capital | | $ | 7,718.6 | | | $ | 8,635.2 | | | $ | 9,319.2 | | | $ | 9,832.8 | | | $ | 10,408.9 | |
Source: BNP.
Caja de Ahorros, the state-owned savings bank, has 56 branches as well as 187 automated teller machines throughout Panama. Caja de Ahorros is primarily a mortgage lender specializing in financing medium-income customers. Due to its liquidity position in recent years, however, Caja de Ahorros has begun to promote personal loans. Total assets of Caja de Ahorros as of December 31, 2016 were U.S.$3.4 billion (a 9.6% increase from 2015) and total deposits were U.S.$388.0 million (a 0.6% decrease from 2015). Total net loans held by Caja de Ahorros, as of December 31, 2016, were U.S.$2.4 billion (a 12.1% increase from 2015). Caja de Ahorros had net income of U.S.$12.2 million in 2016, compared to net income of U.S.$28.3 million in 2015, primarily due to an increase in interest expenditures and provision for doubtful debts.
Other Public Sector Institutions. The Panamanian public sector includes two other significant institutions that are not part of the banking sector. They are the agricultural development bank, Banco de Desarrollo Agropecuario (“BDA”), and the national mortgage bank, Banco Hipotecario Nacional (“BHN”). Panama created BDA to provide a source of financing for agricultural development. BDA’s activities have mainly focused on providing financing to medium and small producers. Historically, BDA has experienced significant losses. An external audit was completed in May 2001 to identify ways to improve BDA’s operational efficiency. After evaluating BDA’s loan portfolio, the external audit estimated a possible loss due to unrecoverable loans of up to U.S.$9.0 million in principal and U.S.$15.4 million in net interest. Under the LUIT, one-half of a surcharge on consumer and commercial loans (which previously was used exclusively to subsidize certain BDA and commercial bank agricultural loans) has been allocated to bolster BDA’s capital. Additionally, the LUIT tightened eligibility for BDA’s subsidized loans. As of December 31, 2016, figures indicate that BDA had U.S.$159.2 million in net loans on its books. As of December 31, 2016, the total assets of BDA were U.S.$400.8 million. BDA had a net loss of U.S.$(12.1) million in 2016. BHN was established in 1973 to provide a source of financing for national housing projects and to foster the development of savings associations. As of December 31, 2016, BHN’s net loan portfolio was U.S.$27.7 million and its total assets amounted to U.S.$280.0 million. BHN had a net loss of U.S.$(3.4) million in 2016.
Other Financial System Components
Stock Exchange. In 1990, a private stock exchange, Bolsa de Valores de Panamá (“La Bolsa”), was created. While it has had considerable growth, with aggregate trades increasing from U.S.$30.6 million in 1991 to U.S.$7.4 billion in 2016, La Bolsa remains a small portion of the financial services sector. Equity trades represented 1.4% of 2016 trading volume.
Clearing System. On April 29, 2014, La Central Latinoamericana de Valores S.A., or LatinClear, the clearing system for Panama, launched the “iLink” platform in connection with Euroclear Bank. The link allows institutional investors in the Euroclear system to buy, sell, settle and have held in custody applicable asset classes registered and issued locally under the LatinClear system.
Interest Rates. In 2016, the average interest rate paid by Panamanian banks for one-year deposits was 2.95%, while the interest rate for personal credit transactions with a maturity of one to five years averaged 8.64%. In general terms, the differential between borrowing and lending interest rates for Panamanian banks was 5.69% in 2016.
Insurance. In 1984, Panama adopted legislation intended to foster offshore insurance activity. In July 1996, the Assembly passed a law establishing a new insurance regulatory structure. As of December 31, 2016, there were 26 insurance companies and 3,064 insurance brokerages. The 3,064 insurance brokerages consisted of 2,568 individual brokers, 368 brokerage companies and 128 temporary permissions. The preliminary total registered assets of the insurance companies, as of December 31, 2016, equaled U.S.$2.9 billion. In 2012, the insurance sector grew by 20.3% as compared to 2011 primarily due to an increase in premiums paid by policyholders. In 2013, the insurance sector grew by 8.0% as compared to 2012 primarily due to an increase in premiums paid by policyholders. In 2014, the insurance sector grew by 8.9% as compared to 2013 primarily due to an increase in premiums paid by policyholders. In 2015, the insurance sector grew by 4.1% as compared to 2014. In 2016, preliminary figures indicate that the insurance sector grew by 5.7% as compared to 2015.
D-61
Financial Services . A small non-deposit-taking financial services industry exists that provides leasing, consumer durables financing and other small-scale lending. In 2016, there were 177 locally incorporated companies participating in this industry. In 2016, total assets equaled approximately U.S.$121.1 billion. As of June 3, 2017, there were approximately 181 companies participating in this industry.
D-62
FOREIGN TRADE AND BALANCE OF PAYMENTS
General
Foreign trade plays a significant role in Panama’s economy because of the internationally-oriented service sector and the limited scope of domestic manufacturing capability and agricultural production. These factors have made it necessary to import significant amounts of manufactured goods, raw materials and other merchandise. Notwithstanding a history of significant tariff and non-tariff barriers, imports cover a wide range of raw materials and manufactured goods used throughout the economy.
Because of the use of the U.S. dollar as legal tender and the absence of a Balboa exchange market, Panamanian private sector imports and exports do not affect the Government’s foreign currency reserves. Thus, the balance of payments is less significant than fiscal policy in assessing the external debt service capacity of the Republic.
Tariffs and Other Trade Restrictions
In the 1990s, the Government enacted a number of trade reforms in preparation for WTO accession. Panama became a member of the WTO on September 6, 1997. In November 1997, the Government passed Cabinet Decree No. 68 of 1997, which reduced import duties for most products to levels significantly below those agreed to under the WTO accession process and in certain cases eliminated the duties all together.
One of the major changes in Panamanian tariffs since 1990 has been the movement away from specific tariffs and mixed specific and ad valorem tariffs, to a solely ad valorem system. Panama’s accession to the WTO required Panama to streamline its customs valuation system to conform to international standards. Additionally, Panama changed its international trade classification system from the Customs Cooperation Council Nomenclature and Brussels Tariff Nomenclature to the Harmonized Tariff System, which became effective for the year 1998.
A trade agreement with Peru that was approved by the Assembly in December 2011 became effective on May 1, 2012.
Panama and the United States signed a trade agreement in 2007 that entered into force on October 31, 2012, eliminating immediately 99.7% of U.S. tariffs on industrial goods from Panama.
The European Free Trade Association (“EFTA”) States, composed of Iceland, Liechtenstein, Norway and Switzerland, signed a trade agreement with Panama and Costa Rica on June 24, 2013. The EFTA trade agreement was approved by Panama through Law No. 4 of April 7, 2014 and entered into force on August 19, 2014. The EFTA agreement covers trade in goods and services, investment, competition, protection of intellectual property rights, government procurement, sustainable development and cooperation.
Panama and Mexico signed a trade agreement on April 3, 2014 that became effective on July 1, 2015.
In November 2015, Panama submitted to the WTO its acceptance of the Protocol for the Trade Facilitation Agreement, which contains provisions for expediting the movement, release, and clearance of goods, including goods in transit, and sets forth measures for cooperation between customs and other appropriate authorities on trade facilitation and customs compliance issues. The WTO Trade Facilitation Agreement entered into force on February 22, 2017.
In December 2009, Panama and Colombia announced that they would begin negotiations on an agreement to increase trade and economic integration. On September 20, 2013, Panama and Colombia signed a trade agreement intended to replace the Panama-Colombia Partial Scope Agreement, which became effective in 1995. In January 2015, Panama suspended ratification of the 2013 trade agreement with Colombia due to an unresolved tariff dispute that Panama has submitted to WTO dispute settlement. For more information on the trade agreement and tariff dispute with Colombia, see “Foreign Trade and Balance of Payments— Composition of Foreign Trade”.
Panama signed a partial scope agreement with Trinidad and Tobago on October 3, 2013 that the Assembly approved on March 20, 2015. During 2015, Panamanian exports to Trinidad and Tobago, other than CFZ exports, totaled U.S.$7.6 million (1.1% of total 2015 exports). Imports from Trinidad and Tobago, other than CFZ imports, amounted to U.S.$9.4 million (0.1% of total 2015 imports).
D-63
Composition of Foreign Trade
In 2016, Panama’s exports of goods (FOB), excluding the CFZ, recorded a preliminary total of U.S.$636.1 million, a decrease of 8.5% compared to U.S.$695.2 million in 2015, in part due to lower exports of agricultural produce. In 2016, Panama’s imports of goods (CIF), excluding the CFZ, recorded a preliminary total of U.S.$11,697.0 million, a decrease of 3.6% compared to U.S.$12,129.3 million in 2015, in part due to lower imports of intermediate goods, specifically in construction materials, and in capital goods, specifically construction and transportation capital goods.
In 2016, banana and pineapple exports recorded a preliminary total of U.S.$103.1 million, a 12.5% decrease from U.S.$117.8 million in 2015, primarily due to lower exports of pineapple. In 2015, banana and pineapple exports totaled U.S.$117.8 million, a 5.6% decrease from U.S.$124.8 million in 2014, primarily due to lower exports of pineapple. In 2013 and 2012, banana and pineapple exports represented 16.0% and 15.0% , respectively, of non-CFZ merchandise exports.
In 2016, shrimp exports recorded a preliminary total of U.S.$65.2 million, a 2.2% decrease from U.S.$66.7 million in 2015, primarily due to lower sales in the United States. In 2015, shrimp exports totaled U.S.$54.3 million, a 31.4% decrease from U.S.$79.2 million in 2014, primarily due to lower sales in the United States. In 2013 and 2012, shrimp exports represented 8.8% and 4.9%, respectively, of non-CFZ merchandise exports.
In 2016, exports of frozen yellow fin tuna and fresh and frozen fish filets recorded a preliminary total of U.S.$69.2 million, a 19.1% decrease from U.S.$85.6 million in 2015 due to a decrease in the catch of fish and other marine species. In 2015, exports of frozen yellow fin tuna and fresh and frozen fish filets totaled U.S.$41.8 million, a 10.4% decrease from U.S.$46.7 million in 2014 due to a decrease in the catch of fish and other marine species. In 2013 and 2012, frozen yellow fin tuna and fresh and frozen fish filets represented 4.3% and 4.1%, respectively, of non-CFZ merchandise exports.
In 2016, fishmeal exports recorded a preliminary total of U.S.$34.8 million, a 10.3% increase from U.S.$31.6 million in 2015, primarily due to growth in export volumes from increased demand. In 2015, fishmeal exports totaled U.S.$31.5 million, a 39.7% decrease from U.S.$52.2 million in 2014, primarily due to adverse weather conditions in the dry season and effects from the El Niño weather pattern. In 2013 and 2012, fishmeal exports represented 4.1% and 2.4%, respectively, of non-CFZ merchandise exports.
In 2016, petroleum derivatives exports recorded a preliminary total of U.S.$0.6 million, a decrease of 12.0% compared to U.S.$0.7 million in 2015 due to a decrease in the prices of petroleum products. In 2015, petroleum derivatives exports were U.S.$0.7 million, a decrease of 46.4% compared to U.S.$1.3 million in 2014 due to a decrease in the prices of petroleum products. In 2013 and 2012, exports of petroleum derivatives represented 0.4% and 0.1%, respectively, of non-CFZ merchandise exports.
The following tables set forth the composition and geographical distribution of Panama’s imports and exports for the years indicated:
TABLE NO. 20
Composition of Merchandise Exports, F.O.B.(1)
(in millions of dollars)
| | | | | | | | | | | | | | | | | | | | |
| | | 2012 (R) | | | 2013 (R) | | | 2014 (R) | | | 2015 (R) | | | 2016 (P) | |
Petroleum derivatives(2) | | $ | 0.6 | | | $ | 3.6 | | | $ | 1.3 | | | $ | 0.7 | | | $ | 0.6 | |
Non-petroleum Merchandise Exports: | | | | | | | | | | | | | | | | | | | | |
Bananas | | | 85.9 | | | | 90.6 | | | | 92.9 | | | | 96.0 | | | | 88.8 | |
Muskmelon | | | 5.9 | | | | 4.0 | | | | 3.4 | | | | 4.6 | | | | 3.6 | |
Watermelon | | | 15.8 | | | | 16.5 | | | | 17.1 | | | | 14.1 | | | | 15.7 | |
Sugar | | | 34.5 | | | | 24.2 | | | | 27.0 | | | | 19.6 | | | | 30.3 | |
Shrimp | | | 40.5 | | | | 74.7 | | | | 79.2 | | | | 66.7 | | | | 65.2 | |
Coffee | | | 7.1 | | | | 7.2 | | | | 8.8 | | | | 2.4 | | | | 3.6 | |
Fishmeal(3) | | | 19.8 | | | | 34.8 | | | | 52.2 | | | | 31.6 | | | | 34.8 | |
Frozen yellow fin tuna, fresh and frozen fish filet | | | 59.1 | | | | 66.5 | | | | 83.8 | | | | 85.6 | | | | 69.2 | |
Other seafood(4) | | | 4.8 | | | | 1.2 | | | | 3.2 | | | | 2.6 | | | | 3.7 | |
Gold | | | 115.8 | | | | 66.5 | | | | 1.1 | | | | 0.0 | | | | 0.0 | |
Pineapples | | | 37.1 | | | | 44.2 | | | | 31.9 | | | | 21.8 | | | | 14.2 | |
Clothing | | | 10.1 | | | | 7.1 | | | | 5.3 | | | | 4.8 | | | | 4.9 | |
Meat from cattle | | | 24.7 | | | | 25.3 | | | | 25.4 | | | | 20.9 | | | | 15.8 | |
Standing cattle | | | 3.1 | | | | 1.9 | | | | 0.5 | | | | 1.8 | | | | 0.5 | |
Leather and similar products | | | 17.9 | | | | 21.6 | | | | 22.3 | | | | 16.9 | | | | 9.3 | |
Other | | | 338.9 | | | | 353.7 | | | | 361.8 | | | | 305.0 | | | | 275.8 | |
Total | | | 821.6 | | | | 843.7 | | | | 817.2 | | | | 695.1 | | | | 636.1 | |
Re-exports other than CFZ | | | 155.5 | (P) | | | 189.2 | (P) | | | 208.5 | (P) | | | 219.3 | (P) | | | 141.3 | (E) |
Total | | $ | 977.1 | | | $ | 1,033.1 | | | $ | 1,025.7 | | | $ | 914.4 | | | $ | 777.4 | |
Note: Totals may differ due to rounding.
D-64
| (2) | Excluding sales to ships and aircraft. |
| (4) | Until 2015, other seafood were included in the “other” category. As of 2016, other seafood is presented in the “other seafood” category. |
Source: Office of the Comptroller General and Ministry of Economy and Finance.
TABLE NO. 21(1)
Composition of Merchandise Imports, C.I.F.
(in millions of dollars)
| | | | | | | | | | | | | | | | | | | | |
| | | 2012 | | | 2013 | | | 2014 | | | 2015 (R) | | | 2016 (P) | |
Consumer Goods | | $ | 5,928.9 | | | $ | 6,017.1 | | | $ | 6,309.0 | | | $ | 5,256.1 | | | $ | 5,374.4 | |
Non-durable | | | 1,560.3 | | | | 1,669.1 | | | | 1,787.0 | | | | 1,622.9 | | | | 1,772.3 | |
Semi-durable | | | 1,183.5 | | | | 1,199.1 | | | | 1,311.3 | | | | 1,520.8 | | | | 1,513.0 | |
Domestic utensils | | | 545.2 | | | | 513.3 | | | | 452.9 | | | | 489.0 | | | | 537.6 | |
Fuels and lubricants | | | 2,639.9 | | | | 2,635.5 | | | | 2,757.8 | | | | 1,623.4 | | | | 1,551.4 | |
Intermediate Goods | | | 3,160.9 | | | | 3,216.5 | | | | 3,533.9 | | | | 3,311.7 | | | | 2,902.6 | |
Agricultural raw materials | | | 222.2 | | | | 226.6 | | | | 214.5 | | | | 180.2 | | | | 216.2 | |
Industrial raw materials | | | 1,662.9 | | | | 1,671.2 | | | | 1,685.4 | | | | 1,856.6 | | | | 1,713.0 | |
Construction materials | | | 1,159.0 | | | | 1,194.4 | | | | 1,495.1 | | | | 1,137.5 | | | | 845.0 | |
Other intermediate goods | | | 116.8 | | | | 124.3 | | | | 138.9 | | | | 137.5 | | | | 128.4 | |
Capital Goods | | | 3,404.5 | | | | 3,797.1 | | | | 3,864.3 | | | | 3,561.4 | | | | 3,420.0 | |
Agricultural | | | 71.8 | | | | 57.5 | | | | 57.5 | | | | 51.0 | | | | 71.0 | |
Industrial, construction and electricity | | | 1,216.0 | | | | 1,264.9 | | | | 1,460.0 | | | | 1,207.3 | | | | 1,135.0 | |
Transportation equipment and telecommunication | | | 1,102.2 | | | | 1,405.0 | | | | 1,316.0 | | | | 1,278.8 | | | | 1,264.5 | |
Other capital goods | | | 1,014.5 | | | | 1,070.6 | | | | 1,030.7 | | | | 1,024.3 | | | | 949.4 | |
Total | | $ | 12,494.3 | | | | 13,030.8 | | | $ | 13,707.2 | | | $ | 12,129.2 | | | $ | 11,697.0 | |
Note: Totals may differ due to rounding.
Source: Office of the Comptroller General.
The United States has historically been Panama’s most important trading partner. In 2016, trade with the United States represented 20.3% and 25.6% of total goods exported and imported, respectively. In 2015, trade with the United States represented 18.8% and 25.9% of total goods exported and imported, respectively. In 2014, trade with the United States represented 19.3% and 25.0% of total goods exported and imported, respectively. In 2013, trade with the United States represented 18.1% and 24.3% of total
D-65
goods exported and imported, respectively. In 2012, trade with the United States represented 19.6% and 23.6% of total goods exported and imported, respectively. Historically, Panama’s other significant trading partners have included Costa Rica as an export destination and Japan, Brazil and Venezuela as sources of imports.
In 2016, Panama’s largest trading partners for exports were the United States, Netherlands and Costa Rica, with exports amounting to U.S.$129.2 million, U.S.$96.8 million and U.S.$38.4 million, respectively.
In 2016, Panama’s largest trading partners for imports were the United States, China and Mexico, with imports amounting to U.S.$2,990.7 million, U.S.$1,070.2 million and U.S.$618.7 million, respectively.
In 2016, Panama’s imports from the CFZ totaled U.S.$968.2 million, a decrease of 8.6% compared to U.S.$1,059.6 million in 2015.
For 2015, Panama’s largest trading partners for exports were the United States, Germany and Costa Rica, with exports amounting to U.S.$130.5 million, U.S.$91.8 million and U.S.$52.3 million, respectively. For 2015, Panama’s largest trading partners for imports were the United States, China and Mexico, with imports amounting to U.S.$3,138.6 million, U.S.$1,159.4 million and U.S.$620.7 million, respectively.
The share of imports from Central American countries other than Costa Rica was 3.2% of total imports in 2015. Additionally, approximately 8.7% of Panama’s 2015 imports entered Panama from the CFZ.
In January 2013, Colombia imposed supplemental import tariffs on certain textiles, apparel and footwear coming from countries where no trade agreement with Colombia was in force. In June 2013, Panama lodged a complaint at the WTO against Colombia claiming that the effective import tariff applied to those products is higher than the maximum allowed under WTO agreements. In January 2014, the Director General of the WTO established a panel to hear Panama’s complaint. In November 2015, the WTO panel issued a report in which it concluded that the measures complained of were inconsistent with provisions of the General Agreement on Tariffs and Trade and recommended that Colombia bring the disputed measures into conformity with its obligations. On January 22, 2016, Colombia submitted a notification of its decision to appeal to the WTO Appellate Body certain issues of law and legal interpretation in the panel report. In a report dated May 12, 2016, the WTO Appellate Body rejected Colombia’s appeal and recommended that Colombia bring its tariffs into conformity with Colombia’s WTO obligations. On June 22, 2016, the WTO Dispute Settlement Body adopted the report of the WTO panel, as modified by the WTO Appellate Body, which concluded that the Colombian tariffs were inconsistent with the WTO General Agreement on Tariffs and Trade. Pursuant to a request submitted by Panama, the Director General of the WTO appointed an arbitrator on August 30, 2016 to determine through binding arbitration a reasonable period of time for Colombia to implement the recommendations and rulings that the WTO Dispute Settlement Body adopted on June 22, 2016.
In November 2016, a WTO arbitrator determined that Colombia would have seven months from June 22, 2016 to bring its measures into compliance, thus providing Colombia until January 22, 2017 to do so. On December 13, 2016, Colombia notified the WTO of the issuance of Decree 1744 on November 2, 2016, which Colombia claimed had brought Colombia into compliance with its WTO obligations.
On February 9, 2017, Panama notified the WTO of its view that Colombia has not brought its measures into conformity and requested authorization to suspend the application to Colombia of WTO concessions and other obligations in the amount of U.S.$210.0 million, equivalent to the loss that Panama believes it incurs as a result of the Colombian measures. Panama also requested authorization to apply such suspension of concessions and other obligations to services, intellectual property, and the Multilateral Agreements on Trade in Goods. In a notice dated September 6, 2017, the WTO Secretariat announced that panels have been composed to examine whether the measures taken by Colombia are in conformity with its WTO obligations and to examine whether Panama may suspend the application of WTO concessions and other obligations in the amount and in the manner proposed by Panama.
D-66
TABLE NO. 22
Direction of Merchandise Trade
(as percentage of total)(1)
| | | | | | | | | | | | | | | | | | | | |
| | | 2012(R) | | | 2013(R) | | | 2014(R) | | | 2015(R) | | | 2016(P) | |
Exports (F.O.B.): | | | | | | | | | | | | | | | | | | | | |
Western Hemisphere: | | | | | | | | | | | | | | | | | | | | |
United States and Canada | | | 34.2 | | | | 25.9 | | | | 19.4 | | | | 18.9 | | | | 20.5 | |
Mexico | | | 0.6 | | | | 1.0 | | | | 1.4 | | | | 1.9 | | | | 1.0 | |
Central America and the Caribbean: | | | | | | | | | | | | | | | | | | | | |
Costa Rica | | | 6.6 | | | | 5.9 | | | | 6.7 | | | | 7.7 | | | | 6.0 | |
Guatemala | | | 0.8 | | | | 0.7 | | | | 0.9 | | | | 1.4 | | | | 1.7 | |
Colón Free Zone | | | 3.6 | | | | 3.8 | | | | 3.6 | | | | 3.8 | | | | 3.4 | |
Other | | | 7.9 | | | | 8.1 | | | | 7.3 | | | | 9.2 | | | | 9.0 | |
Total | | | 18.9 | | | | 18.5 | | | | 18.6 | | | | 22.1 | | | | 20.2 | |
South America: | | | | | | | | | | | | | | | | | | | | |
Venezuela | | | 0.6 | | | | 0.5 | | | | 0.5 | | | | 0.1 | | | | 0.1 | |
Colombia | | | 1.0 | | | | 1.2 | | | | 1.5 | | | | 1.2 | | | | 1.3 | |
Brazil | | | 0.0 | | | | 0.2 | | | | 0.3 | | | | 0.2 | | | | 0.7 | |
Other | | | 3.5 | | | | 4.6 | | | | 4.5 | | | | 4.7 | | | | 3.5 | |
Total | | | 5.1 | | | | 6.4 | | | | 6.8 | | | | 6.2 | | | | 5.6 | |
TOTAL | | | 58.8 | | | | 51.9 | | | | 46.2 | | | | 49.2 | | | | 47.3 | |
Europe: | | | | | | | | | | | | | | | | | | | | |
Germany | | | 1.1 | | | | 5.8 | | | | 10.7 | | | | 13.2 | | | | 2.9 | |
Spain | | | 2.0 | | | | 2.3 | | | | 2.9 | | | | 2.5 | | | | 2.4 | |
Italy | | | 4.0 | | | | 3.4 | | | | 2.8 | | | | 2.6 | | | | 2.1 | |
Netherlands | | | 5.9 | | | | 4.7 | | | | 5.2 | | | | 4.1 | | | | 15.2 | |
United Kingdom | | | 2.1 | | | | 2.7 | | | | 1.4 | | | | 1.3 | | | | 2.1 | |
Other | | | 6.8 | | | | 5.7 | | | | 3.3 | | | | 3.8 | | | | 5.1 | |
Total | | | 21.9 | | | | 24.6 | | | | 26.3 | | | | 27.6 | | | | 30.0 | |
Other Countries | | | 19.3 | | | | 23.5 | | | | 27.5 | | | | 23.3 | | | | 22.7 | |
TOTAL | | | 100.0 | | | | 100.0 | | | | 100.0 | | | | 100.0 | | | | 100.0 | |
Imports (C.I.F.): | | | | | | | | | | | | | | | | | | | | |
Western Hemisphere: | | | | | | | | | | | | | | | | | | | | |
United States and Canada | | | 24.3 | | | | 24.8 | | | | 25.7 | | | | 26.8 | | | | 26.6 | |
Mexico | | | 4.5 | | | | 4.1 | | | | 4.2 | | | | 5.1 | | | | 5.3 | |
Central America and the Caribbean: | | | | | | | | | | | | | | | | | | | | |
Costa Rica | | | 4.6 | | | | 4.0 | | | | 3.7 | | | | 3.7 | | | | 3.9 | |
Guatemala | | | 1.7 | | | | 1.4 | | | | 1.4 | | | | 1.5 | | | | 1.5 | |
Colón Free Zone | | | 10.8 | | | | 9.8 | | | | 9.0 | | | | 8.7 | | | | 8.3 | |
Other | | | 21.5 | | | | 19.6 | | | | 18.3 | | | | 13.9 | | | | 14.3 | |
Total | | | 67.4 | | | | 63.7 | | | | 62.3 | | | | 59.8 | | | | 59.9 | |
South America: | | | | | | | | | | | | | | | | | | | | |
Venezuela | | | 0.3 | | | | 0.3 | | | | 0.2 | | | | 0.2 | | | | 0.2 | |
Colombia | | | 3.4 | | | | 3.0 | | | | 2.8 | | | | 3.0 | | | | 3.1 | |
Brazil | | | 1.4 | | | | 1.5 | | | | 0.9 | | | | 1.3 | | | | 1.8 | |
Other | | | 3.1 | | | | 2.7 | | | | 2.4 | | | | 2.3 | | | | 2.8 | |
Total | | | 8.2 | | | | 7.5 | | | | 6.4 | | | | 6.8 | | | | 7.8 | |
TOTAL | | | 75.6 | | | | 71.3 | | | | 68.6 | | | | 66.6 | | | | 67.7 | |
Europe: | | | | | | | | | | | | | | | | | | | | |
Germany | | | 1.4 | | | | 1.9 | | | | 1.7 | | | | 2.3 | | | | 2.2 | |
Spain | | | 2.5 | | | | 2.9 | | | | 2.5 | | | | 2.8 | | | | 2.3 | |
Italy | | | 0.9 | | | | 1.2 | | | | 3.3 | | | | 2.2 | | | | 1.5 | |
Netherlands | | | 1.2 | | | | 0.8 | | | | 0.4 | | | | 0.5 | | | | 1.0 | |
United Kingdom | | | 0.4 | | | | 0.8 | | | | 0.7 | | | | 0.8 | | | | 0.6 | |
Other | | | 2.3 | | | | 4.0 | | | | 3.2 | | | | 3.5 | | | | 4.0 | |
Total | | | 8.7 | | | | 11.5 | | | | 11.9 | | | | 12.2 | | | | 11.5 | |
Japan | | | 2.3 | | | | 2.1 | | | | 2.0 | | | | 2.4 | | | | 2.7 | |
China | | | 6.5 | | | | 7.9 | | | | 9.6 | | | | 9.6 | | | | 9.1 | |
Other Countries | | | 6.9 | | | | 7.3 | | | | 7.9 | | | | 9.2 | | | | 8.9 | |
TOTAL | | | 100.0 | | | | 100.0 | | | | 100.0 | | | | 100.0 | | | | 100.0 | |
D-67
| (1) | Includes exports and imports between the CFZ and Panama. |
Source: Office of the Comptroller General.
Foreign Direct Investment
Panama’s foreign direct investment (“FDI”) for 2016 was U.S.$5,225.5 million, an increase of U.S.$731.3 million or 16.3% from U.S.$4,494.2 million in 2015. Reinvested earnings was the source of 66.1% of FDI in 2016, which the government believes is based on continued confidence of investors in the performance shown by the Panamanian economy. In 2016, 15.4% of FDI came from purchases of shares of domestic companies by non-resident investors. The remaining 18.5% of FDI was from other capital. Of gross FDI, U.S.$329.6 million corresponds to capital invested in the CFZ in 2016, an increase of U.S.$60.5 million compared to the same period of 2015. FDI inflows for the first quarter of 2017 amounted to U.S.$1.3 billion, a 10.7% increase as compared to the same period in 2016.
Cobre Panamá (“Copper Panama”) is a large open-cast copper mine development project in Panama, located 120 km west of Panama City and 20 km from the coast of the Caribbean Sea, in Donoso District, Colón province. The concession contract for the mine is held by Minera Panamá, S.A., a Panamanian company whose majority owner is First Quantum Minerals, Ltd. (“First Quantum”). According to First Quantum, as of December 31, 2016, the estimated capital budget for the Panama Copper project was U.S.$5.48 billion, and the mine, once operational, was expected to be capable of producing more than 300,000 tons of copper per year. Also according to First Quantum, as of July 27, 2017, the Copper Panama mine is expected to begin phased commissioning in 2018 with continued ramp-up over 2019.
The following table sets forth the foreign direct investment in Panama by investor residence for the years 2011 through 2015.
TABLE NO. 23
Foreign Direct Investment in Panama by Investor Residence
| | | | | | | | | | | | | | | | | | | | |
| | | Foreign Direct Investment | | | | |
| Investor Residence | | | | | | | | | |
| | | (in thousands of U.S.$) | | | | |
| | | 2011 (R) | | | 2012 (R) | | | 2013 (R) | | | 2014 (P) | | | 2015 (P) | |
TOTAL | | | 3,152,605 | | | | 3,210,533 | | | | 3,567,175 | | | | 4,458,666 | | | | 4,494,234 | |
EUROPE | | | 888,317 | | | | -345,370 | | | | -680,087 | | | | 926,369 | | | | 775,037 | |
European Union | | | 667,997 | | | | -508,682 | | | | -1,122,155 | | | | 576,830 | | | | 573,171 | |
Germany | | | 105,824 | | | | 112,804 | | | | 5,832 | | | | 273,588 | | | | 84,484 | |
Belgium | | | 23,472 | | | | -130,017 | | | | -154,536 | | | | -85,907 | | | | 2,491 | |
Denmark | | | -336 | | | | -38,786 | | | | 18,691 | | | | -10,545 | | | | 7,970 | |
Spain | | | 133,462 | | | | 67,956 | | | | -252,067 | | | | 152,812 | | | | 164,742 | |
France | | | 9,869 | | | | 12,225 | | | | -26,221 | | | | 28,249 | | | | 18,846 | |
Italy | | | 76,805 | | | | 20,773 | | | | 22,566 | | | | 30,377 | | | | 42,913 | |
Netherlands | | | -113,577 | | | | 244,258 | | | | 60,958 | | | | 56,457 | | | | 94,166 | |
United Kingdom | | | 456,516 | | | | -708,905 | | | | -840,235 | | | | 174,970 | | | | 143,224 | |
Sweden | | | 7,982 | | | | 21,676 | | | | 13,167 | | | | -31,254 | | | | 7,021 | |
Other Countries (1): Greece, Hungary, Ireland, Poland, Portugal, and Finland | | | -32,020 | | | | -110,666 | | | | 29,690 | | | | -11,918 | | | | 7,314 | |
Other European Countries | | | 220,320 | | | | 163,312 | | | | 442,068 | | | | 349,539 | | | | 201,865 | |
Andorra | | | -1,915 | | | | 4,567 | | | | 2,634 | | | | 3,930 | | | | 3,394 | |
Norway | | | 1,020 | | | | 3,240 | | | | -404 | | | | -983 | | | | 685 | |
Switzerland | | | 215,937 | | | | 152,073 | | | | 413,816 | | | | 325,893 | | | | 187,670 | |
D-68
| | | | | | | | | | | | | | | | | | | | |
| | | Foreign Direct Investment | | | | |
| Investor Residence | | | | | | | | | |
| | | (in thousands of U.S.$) | | | | |
| | | 2011 (R) | | | 2012 (R) | | | 2013 (R) | | | 2014 (P) | | | 2015 (P) | |
Other countries (1): Liechtenstein, Russia and Turkey | | | 5,278 | | | | 3,432 | | | | 26,023 | | | | 20,699 | | | | 10,117 | |
AFRICA | | | 191,425 | | | | 612,130 | | | | -340,776 | | | | 145,187 | | | | 320,190 | |
South Africa | | | 191,425 | | | | 612,130 | | | | -340,776 | | | | 145,187 | | | | 320,190 | |
AMERICA | | | 1,755,018 | | | | 2,347,723 | | | | 3,998,628 | | | | 3,736,277 | | | | 3,022,670 | |
North America | | | 870,948 | | | | 1,074,991 | | | | 1,497,003 | | | | 1,368,020 | | | | 1,314,104 | |
Canada | | | 47,692 | | | | 1,097,219 | | | | 150,229 | | | | 23,920 | | | | 49,895 | |
United States | | | 651,965 | | | | 28,472 | | | | 750,227 | | | | 1,320,407 | | | | 1,039,111 | |
Mexico | | | 171,291 | | | | -50,700 | | | | 596,548 | | | | 23,693 | | | | 225,098 | |
Central America and the Caribbean | | | 212,085 | | | | 363,367 | | | | 449,630 | | | | 413,212 | | | | 488,263 | |
Aruba | | | -12,808 | | | | 3,589 | | | | -1,685 | | | | 5,899 | | | | 956 | |
Bahamas | | | 786 | | | | 34,082 | | | | 47,712 | | | | 36,878 | | | | 30,382 | |
Barbados | | | 3,018 | | | | 132 | | | | 3,154 | | | | 15,013 | | | | 1,642 | |
Costa Rica | | | 114,624 | | | | 51,690 | | | | 175,231 | | | | 128,200 | | | | 118,987 | |
Cuba | | | 1,229 | | | | 688 | | | | 322 | | | | 179 | | | | 386 | |
El Salvador | | | 22,862 | | | | 43,088 | | | | 42,321 | | | | 5,737 | | | | 25,237 | |
Guatemala | | | 28,494 | | | | 26,040 | | | | 19,911 | | | | 9,283 | | | | 32,015 | |
Honduras | | | -10,739 | | | | 42,151 | | | | 9,187 | | | | 11,953 | | | | 13,476 | |
Jamaica | | | 4,022 | | | | 13,888 | | | | 321 | | | | -26,479 | | | | 108,381 | |
Nicaragua | | | -478 | | | | 21,388 | | | | 32,337 | | | | 19,916 | | | | 17,442 | |
Puerto Rico | | | -101,974 | | | | 7,474 | | | | 119,123 | | | | 2,540 | | | | 12,698 | |
Dominican Republic | | | 29,916 | | | | 30,990 | | | | 21,278 | | | | 32,206 | | | | 33,924 | |
Other countries (1): Belize, Cayman Islands, Haiti, Leeward Islands (UK), San Martin Island, Virgin Islands (USA), Trinidad and Tobago | | | 133,133 | | | | 88,167 | | | | 80,199 | | | | 139,195 | | | | 88,399 | |
South America | | | 671,985 | | | | 909,365 | | | | 1,961,149 | | | | 1,985,920 | | | | 1,220,303 | |
Argentina | | | 3,399 | | | | 6,010 | | | | 15,586 | | | | 25,349 | | | | 8,953 | |
Bolivia | | | -1 | | | | 30 | | | | 74 | | | | 59 | | | | 38 | |
Brazil | | | 19,993 | | | | 122,440 | | | | 13,500 | | | | 63,811 | | | | 148,830 | |
Chile | | | -29,929 | | | | 9,418 | | | | 31,284 | | | | 2,930 | | | | 11,740 | |
Colombia | | | 486,001 | | | | 533,340 | | | | 1,714,862 | | | | 1,110,441 | | | | 865,592 | |
Ecuador | | | 12,527 | | | | 12,294 | | | | 11,967 | | | | 630,232 | | | | 99,162 | |
Peru | | | 182,430 | | | | 25,062 | | | | 55,950 | | | | 31,068 | | | | 26,072 | |
Venezuela | | | -2,435 | | | | 200,771 | | | | 117,927 | | | | 122,029 | | | | 59,916 | |
ASIA | | | 308,254 | | | | 588,482 | | | | 591,679 | | | | -354,138 | | | | 372,464 | |
Middle and Near East | | | -23,131 | | | | 6,475 | | | | 1,889 | | | | -23,669 | | | | 1,397 | |
Israel | | | 484 | | | | 4,921 | | | | 2,752 | | | | -22,491 | | | | 1,321 | |
Lebanon (2) | | | -23,615 | | | | 1,554 | | | | -863 | | | | -1,178 | | | | 76 | |
Central Asia, southern and other Persian Gulf countries | | | 15,613 | | | | 67,362 | | | | -8,859 | | | | 23,550 | | | | 29,767 | |
India | | | -714 | | | | 1,677 | | | | -157 | | | | -1,260 | | | | 1,085 | |
Singapore | | | 17,468 | | | | 63,651 | | | | -9,970 | | | | 25,001 | | | | 26,581 | |
Other countries (1): Philippines, Pakistan, Saudi Arabia and Lebanon | | | -1,141 | | | | 2,034 | | | | 1,268 | | | | -190 | | | | 2,101 | |
East Asia | | | 315,772 | | | | 514,645 | | | | 83,491 | | | | 348,294 | | | | 341,299 | |
China, Hong Kong | | | 11,310 | | | | 2,150 | | | | 135 | | | | -4,308 | | | | 3,441 | |
China, Democratic People’s Republic of Korea (North Korea) | | | 548 | | | | 76,798 | | | | 15,836 | | | | 43,467 | | | | 31,602 | |
Republic of Korea (South of Korea) | | | 184,165 | | | | 422,510 | | | | 337,222 | | | | -281,896 | | | | 38,950 | |
Japan | | | 6,221 | | | | 998 | | | | -66,052 | | | | -41,813 | | | | 11,294 | |
Republic of China (Taiwan) | | | 113,528 | | | | 12,189 | | | | 311,510 | | | | -69,469 | | | | 256,013 | |
OTHER COUNTRIES: (1) Angola, Uruguay and Australia | | | 9,591 | | | | 7,568 | | | | -2,269 | | | | 4,971 | | | | 3,873 | |
Note: Totals may differ due to rounding.
D-69
| (1) | Due to statistical confidentiality, countries with up to two companies of direct investment have been included in this line. |
| (2) | In 2013, Lebanon was included within other countries in the Central Asia, southern and other Persian Gulf countries, because it did not have the required amount of companies to preserve data confidentiality. |
Source: Office of the Comptroller General.
The following table sets forth foreign direct investment in Panama by category of economic activity for the years 2011 through 2015.
TABLE NO. 24
Foreign Direct Investment in Panama by Category of Economic Activity
| | | | | | | | | | | | | | | | | | | | |
| | | Foreign Direct Investment | | | | |
| Category of Economic Activity | | | | | | | | | |
| | | (in thousands of U.S.$) | | | | |
| | | 2011 (R) | | | 2012 (R) | | | 2013 (R) | | | 2014 (P) | | | 2015 (P) | |
TOTAL | | | 3,152,605 | | | | 3,210,533 | | | | 3,567,175 | | | | 4,458,666 | | | | 4,494,234 | |
Agriculture, cattle, hunting and forestry | | | 54,542 | | | | 14,274 | | | | 33,555 | | | | -24,623 | | | | 5,480 | |
Mining and quarrying | | | 39,446 | | | | 1,149,420 | | | | 434,629 | | | | 6,189 | | | | 5,860 | |
Manufacturing industries | | | 297,883 | | | | 520,404 | | | | 141,747 | | | | 181,265 | | | | 238,036 | |
Electricity, gas and water supplies | | | 278,613 | | | | -122,648 | | | | -244,621 | | | | -54,031 | | | | 84,616 | |
Construction | | | 175,444 | | | | 117,198 | | | | 44,522 | | | | 81,765 | | | | 250,175 | |
Wholesale and retail | | | 971,776 | | | | 954,586 | | | | 1,417,241 | | | | 521,061 | | | | 1,606,910 | |
Transport, storage and mail | | | 282,751 | | | | 463,498 | | | | 307,373 | | | | 2,243,235 | | | | 462,001 | |
Hotels and restaurants | | | 39,301 | | | | 623 | | | | 131,474 | | | | 18,822 | | | | 55,762 | |
Information and communication | | | 34,473 | | | | -333,039 | | | | 760,460 | | | | -65,736 | | | | 578,866 | |
Finance and insurance activities | | | 642,553 | | | | 408,939 | | | | 491,245 | | | | 1,318,141 | | | | 949,168 | |
Real estate activities | | | 94,901 | | | | 28,514 | | | | -53,362 | | | | 102,440 | | | | 69,780 | |
Professional, scientific and technical activities | | | 82,201 | | | | 27,061 | | | | 37,809 | | | | 41,312 | | | | 46,598 | |
Administrative activities and support services | | | 85,330 | | | | -51,000 | | | | 4,930 | | | | 34,208 | | | | 53,717 | |
Education | | | 12,453 | | | | 11,338 | | | | 7,444 | | | | 7,798 | | | | 26,793 | |
Social and health related services | | | 9,648 | | | | -359 | | | | 2,169 | | | | 5,471 | | | | 10,504 | |
Arts, entertainment and related activities | | | -6,446 | | | | 23,150 | | | | 45,752 | | | | 10,447 | | | | 28,852 | |
Other services activities | | | 57,736 | | | | -1,426 | | | | 4,808 | | | | 30,902 | | | | 21,116 | |
Note: Totals may differ due to rounding.
Source: Office of the Comptroller General.
Balance of Payments
The nature of the Panamanian monetary system and unusual features of the economy cause the balance of payments to be a less important indicator than fiscal policy for purposes of assessing the Government’s debt service capacity. Specifically, in the absence of a national printed currency and a Balboa exchange market, balance of payments surpluses or deficits have less effect than fiscal policy on the accumulation or drawdown of Government foreign exchange reserves. Panamanian exporters retain the foreign exchange
D-70
earned from their overseas sales, and Panamanian importers utilize their domestic U.S. dollar-denominated revenues to pay for foreign shipments. In addition, given the absence of a national printed currency and the limited role of BNP in the economy, it is often difficult to register capital movements in an orderly manner. Thus, errors and omissions in the balance of payments figures have tended to be significant.
In 1997, Panama implemented the V Version of the Balance of Payments Manual prepared by the IMF (“V Version”), which prescribes a different methodology from that previously used to calculate Panama’s balance of payments. Accordingly, all calculations for the current account balance and the capital and financial account balance herein are calculated according to the V Version.
In 2016, Panama registered an overall surplus of U.S.$1,232.9 million, compared to an overall deficit in 2015 of U.S.$984.4 million, primarily due to increased foreign investment and a lower value of imports. In 2014, Panama registered an overall deficit of U.S.$380.3 million, compared to overall deficits of U.S.$109.3 million and U.S.$958.2 million in 2013 and 2012, respectively.
For 2016, the current account balance recorded a deficit of U.S.$3,098.1 million, a decrease of 18.4% compared to a current account deficit of U.S.$3,798.8 million in 2015, primarily due to an 8.9% decrease in the value of imports to U.S.$20,489.7 million in 2016, compared to U.S.$22,492.3 million in 2015. The sharpest declines in imports were observed in intermediate goods, specifically in construction materials, which dropped 25.7% compared to 2015, and in capital goods, specifically construction and transportation capital goods, whose value dropped by 7.3% and 6.0%, respectively, compared to 2015. For 2014, the current account balance was a U.S.$4,794.4 million deficit. For 2013, the current account balance was a U.S.$4,400.9 million deficit. For 2012, the current account balance was a U.S.$4,176.8 million deficit.
For 2016, the capital and financial account balance recorded a surplus of U.S.$6,440.5 million, an increase of 120.7% compared to a capital and financial account surplus of U.S.$2,918.3 million in 2015, primarily due to increased foreign investment. In 2016, foreign direct investment recorded net inflows of U.S.$5,060.0 million, an increase of 27.6% compared to net inflows of U.S.$3,966.3 million in 2015, in part due to the issuance of 25 new licenses for multinational businesses to establish headquarters in Panama. In 2016, foreign portfolio investment recorded net inflows of U.S.$898.7 million, compared to net outflows of U.S.$693.1 million in 2015. In 2016, other capital recorded new inflows of U.S.$457.8 million, compared to net outflows of U.S.$381.9 million in 2015. For 2014, the capital and financial account balance was a U.S.$5,497.1 million surplus. For 2013, the capital and financial account balance was a U.S.$4,219.6 million surplus. For 2012, the capital and financial account balance was a U.S.$2,579.0 million surplus.
In reviewing Panamanian balance of payments statistics for merchandise imports and exports, it is important to consider the effect of the CFZ and the significant amount of merchandise passing through it. In 2016, Panama had U.S.$10,719.2 million in non-CFZ merchandise imports, a decrease of 3.3% from U.S.$11,083.6 million in 2015, while imports to the CFZ for 2016 were U.S.$9,238.1 million, a 10.9% decrease from U.S.$10,373.5 million in 2015. Meanwhile, Panama had an estimated U.S.$636.1 million in non-CFZ merchandise exports in 2016, an 8.5% decrease compared to U.S.$695.2 million in 2015, while CFZ re-exports for 2016 were estimated to be U.S.$10,417.6 million, an 8.3% decrease from U.S.$11,365.5 million in 2015.
Excluding the CFZ, Panama has historically registered large merchandise trade deficits. The deficit, excluding the CFZ, was U.S.$10.1 billion (27.1% of GDP in chained volume measure) in 2016, a decrease from U.S.$10.9 billion (30.6% of GDP in chained volume measure) in 2015. However, these deficits have been significantly offset by the economic value added by the CFZ. In 2016, the merchandise trade deficit including the CFZ was U.S.$8.8 billion (23.4% of GDP in chained volume measure), a decrease from U.S.$9.7 billion (27.2% of GDP in chained measure) in 2015. Other segments within the service sector of the Panamanian economy, including ports and the Panama Canal, also help to offset the merchandise trade deficit. In 2016, the service sector had a net balance of payments surplus of U.S.$10.3 billion, an increase of 2.7% from U.S.$10.0 billion in 2015. In 2014 and 2013, the service sector had net balance of payments surpluses of U.S.$8.1 billion and U.S.$7.8 billion, respectively.
D-71
The following table sets forth Panama’s balance of payments for the years 2012 through 2016:
TABLE NO. 25
Balance of Payments(1)
(in millions of dollars)
| | | | | | | | | | | | | | | | | | | | |
| | | 2012(R) | | | 2013(P) | | | 2014(P) | | | 2015(P) | | | 2016(E) | |
Current Account: | | | | | | | | | | | | | | | | | | | | |
Goods Trade(2) | | | | | | | | | | | | | | | | | | | | |
Exports | | | 18,270.5 | | | | 17,058.9 | | | | 14,971.5 | | | | 12,783.2 | | | | 11,704.6 | |
Imports | | | (28,139.8 | ) | | | (26,504.7 | ) | | | (25,794.5 | ) | | | (22,492.3 | ) | | | (20,489.7 | ) |
Balance | | | (9,869.3 | ) | | | (9,445.8 | ) | | | (10,823.0 | ) | | | (9,709.1 | ) | | | (8,785.1 | ) |
Services | | | 7,872.0 | | | | 7,633.5 | | | | 7,788.5 | | | | 10,036.4 | | | | 10,310.5 | |
Rent(3) | | | (2,267.5 | ) | | | (2,397.0 | ) | | | (3,817.8 | ) | | | (4,020.0 | ) | | | (4468.8 | ) |
Unilateral Transfers(4) | | | 88.0 | | | | 58.3 | | | | 122.3 | | | | 106.0 | | | | (154.7 | ) |
Balance | | | (4,176.8 | ) | | | (4,151.0 | ) | | | (6,730.0 | ) | | | (3,798.7 | ) | | | (3,098.1 | ) |
Capital and Financial Account: | | | | | | | | | | | | | | | | | | | | |
Capital Account | | | 16.5 | | | | 26.4 | | | | 24.2 | | | | 26.9 | | | | 24.0 | |
Financial Account | | | 2,562.5 | | | | 4,776.2 | | | | 5,688.8 | | | | 2,891.3 | | | | 6,416.5 | |
Direct Investment | | | 3,484.9 | | | | 3,236.3 | | | | 4,129.6 | | | | 3,966.3 | | | | 5,060.0 | |
Portfolio Investment | | | (581.2 | ) | | | (143.8 | ) | | | 188.1 | | | | (693.1 | ) | | | 898.7 | |
Other Capital | | | (341.2 | ) | | | 1,683.7 | | | | 1,371.1 | | | | (381.9 | ) | | | 457.8 | |
Assets | | | (3,582.3 | ) | | | (1,931.6 | ) | | | (5,131.7 | ) | | | (5,655.1 | ) | | | 1,090.4 | |
Liabilities | | | 3,241.1 | | | | 3,615.3 | | | | 6,502.8 | | | | 5,273.2 | | | | (632.6 | ) |
Balance | | | 2,579.0 | | | | 4,802.6 | | | | 5,713.0 | | | | 2,918.2 | | | | 6,440.5 | |
Errors and Omissions (net) | | | 639.6 | | | | (761.5 | ) | | | 1,414.0 | | | | (103.9 | ) | | | (2,109.5 | ) |
Overall Surplus (Deficit) | | | (958.2 | ) | | | (109.9 | ) | | | 397.0 | | | | (984.4 | ) | | | 1,232.9 | |
Financing | | | 958.2 | | | | 109.9 | | | | (397.0 | ) | | | 984.4 | | | | (1,232.9 | ) |
Reserve Assets | | | (36.3 | ) | | | (400.9 | ) | | | (1,221.7 | ) | | | 77.6 | | | | (608.9 | ) |
Use of IMF credit and IMF loans | | | — | | | | — | | | | — | | | | — | | | | — | |
Exceptional Financing | | | 994.5 | | | | 510.8 | | | | 824.7 | | | | 906.8 | | | | (624.0 | ) |
| (1) | Figures for years 2013 to 2016 have been calculated pursuant to the Sixth Edition of the IMF Balance of Payments and International Investment Position Manual. Figures for 2012 have been calculated pursuant to the Fifth Edition of the IMF Balance of Payments Manual. |
| (3) | Includes wages and investment profits. |
| (4) | Unilateral transfers consist of transactions without a quid pro quo, many of which are gifts and migrant transfers. |
For information regarding Panama’s international reserves, see “Public Finance—International Reserves”.
D-72
PUBLIC SECTOR DEBT
Internal Debt
As of December 31, 2016, public sector internal debt outstanding totaled approximately U.S.$4,699.8 million, an increase of 2.8% compared to U.S.$4,573.4 million as of December 31, 2015, primarily due to reopenings of the 4.95% Treasury Bond due 2024 totaling U.S.$698.5 million. As of December 31, 2016, Panama’s public sector internal debt as a percentage of GDP was 8.5% (based on a preliminary nominal GDP of U.S.$55.2 billion for 2016), compared to 8.8% as of December 31, 2015 (based on estimated nominal GDP of U.S.$52.1 billion for 2015). As of December 31, 2016, Panama’s public sector internal debt represented approximately 21.8% of total public sector debt, compared to 22.6% as of December 31, 2015.
As of December 31, 2016, public sector entities, official banking institutions and BNP in particular held U.S.$331.6 million or 7.1% of Panama’s internal debt. The remaining U.S.$4,368.1 million or 92.9% of Panama’s internal debt was outstanding in the market and held by private creditors.
In the domestic market, the Ministry of Economy and Finance from time to time issues, by auction, bills (with maturities up to 12 months), notes (with maturities from three to seven years) and bonds (with maturities greater than seven years). In 2012, the Government continued a program of Treasury Bill issuances with twelve auctions from January 10, 2012 to December 20, 2012. During this period, Panama issued U.S.$470.6 million of zero-coupon Treasury Bills. In 2012, the Government reopened three times its 5.0% Treasury Notes due 2018 (“Treasury Notes due 2018”) in a total aggregate amount of U.S.$537.9 million. In 2012, a new instrument was auctioned through the Market Makers Program, a series of treasury bonds having a 5.625% coupon and a maturity date of 2022 (“Treasury Bonds due 2022”). By the end of 2012, the Treasury Bonds due 2022 had been auctioned in an inaugural offering and 22 re-openings. During 2012, the aggregate amount of Treasury Bonds due 2022 issued was U.S.$1,364.0 million.
In 2013, the Government continued the program of Treasury Bill issuances with ten auctions from January 15, 2013 to October 8, 2013. During this period, Panama issued U.S.$425.5 million of zero-coupon Treasury Bills. In 2013, the Government issued a new 4.95% Treasury Bond due 2024 (“Treasury Bond due 2024”) in a total aggregate amount of U.S.$100.0 million. In 2013, the Government program of Treasury Notes issuances remained suspended.
In 2014, Panama issued U.S.$427.0 million of zero-coupon Treasury Bills. In 2014, a new instrument was auctioned through the Market Makers Program, a series of Treasury Notes having a 4.875% coupon and a maturity date of 2021 (“Treasury Notes due 2021”). By the end of 2014, the Treasury Notes due 2021 had been auctioned in an inaugural offering and 16 re-openings in a total aggregate amount of U.S.$665.2 million.
In 2015, the Government continued the program of Treasury Bill issuances with 20 auctions and one direct placement from January 13, 2015 to December 29, 2015. Panama issued U.S.$715.0 million of zero-coupon Treasury Bills. In 2015, a new instrument was auctioned through the Market Makers Program, a series of Treasury Notes having a 3.0% coupon and a maturity date of 2019 (“Treasury Notes due 2019”). By the end of 2015, the Treasury Notes due 2019 had been auctioned in an inaugural offering and five re-openings in a total aggregate amount of U.S.$290.0 million. Cabinet Decree No. 8 of March 10, 2015, which modified Cabinet Decree No. 8 of April 18, 2007, increased the maximum amount of Treasury Bills that may be outstanding at year-end to U.S.$1.0 billion, and at December 31, 2015, the amount of Treasury Bills outstanding at year end reached U.S.$604.0 million.
In 2016, Panama issued U.S.$1,362.2 million face amount of securities in the Panamanian market, composed of U.S.$346.0 million of zero-coupon Treasury Bills issued in thirteen auctions, U.S.$317.7 million of the Treasury Notes due 2019 issued in seven reopenings and U.S.$698.5 million of the Treasury Bonds due 2024 issued in four reopenings. Pursuant to authority granted by Cabinet Decree No. 20 of May 24, 2016, the Ministry of Economy and Finance executed a liability management transaction that consisted of the partial repurchase of U.S.$324.3 million of Treasury Notes due 2018 in order to mitigate refinancing risk and to improve the internal debt amortization profile. As of December 31, 2016, the outstanding balance of Treasury bills had fallen to U.S.$252.0 million, a decrease of 58.3% compared to U.S.$604.0 million as of December 31, 2015, primarily due to the implementation of the Single Treasury Account, which permits financing approximately 50% of the Central Government deficit through the application of internal Government resources, rather than resorting to other sources of credit.
During 2017, Panama has conducted four auctions of the Treasury Bonds due 2024 and sold U.S.$352.0 million of such securities, bringing the total outstanding amount to U.S.$1,150.5 million as of September 29, 2017. On September 26, 2017, Panama issued U.S.$60.0 million of 3.0% Treasury Notes due 2023. As of September 29, 2017, Panama has conducted nine auctions of Treasury Bills and issued U.S.$268.0 million of such securities, bringing to the total outstanding amount to U.S.$268.0 million as of September 29, 2017. In June 2017, as part of an initiative to increase participation in domestic debt securities auctions and the secondary market, the Ministry of Economy and Finance added Global Valores to the Market Makers Program.
D-73
The following table sets forth Panama’s outstanding public sector internal debt at year-end for the years 2012 through 2016:
TABLE NO. 26
Public Sector Internal Debt
(in millions of U.S. dollars)
| | | | | | | | | | | | | | | | | | | | |
| | | December 31, | |
| | | 2012 | | | 2013 | | | 2014 | | | 2015 | | | 2016 | |
Private Sector Sources: | | | | | | | | | | | | | | | | | | | | |
Treasury bills (maturity up to 12 months) | | $ | 415.1 | | | $ | 449.5 | | | $ | 307.0 | | | $ | 604.0 | | | $ | 252.0 | |
Treasury notes (maturity from 3 years to 7 years) | | | 1,133.0 | | | | 1,022.8 | | | | 1,688.0 | | | | 1,949.1 | | | | 1,942.5 | |
Domestic bonds (maturity greater than 7 years) | | | 1,364.0 | | | | 1,464.0 | | | | 1,464.0 | | | | 1,464.0 | | | | 2,162.5 | |
Long-term private financing | | | 20.5 | | | | 16.1 | | | | 11.7 | | | | 7.4 | | | | 3.1 | |
Suppliers | | | 0.0 | | | | 0.0 | | | | 0.0 | | | | 0.0 | | | | 8.0 | |
Total | | $ | 2,932.6 | | | $ | 2,952.4 | | | $ | 3,470.7 | | | $ | 4,024.6 | | | $ | 4,368.1 | |
Public Sector Sources: | | | | | | | | | | | | | | | | | | | | |
Official banking institutions | | $ | 550.2 | | | $ | 500.1 | | | $ | 408.0 | | | $ | 549.0 | | | $ | 331.6 | |
Total | | $ | 550.2 | | | $ | 500.1 | | | $ | 408.0 | | | $ | 549.0 | | | $ | 331.6 | |
Total Public Sector Internal Debt | | $ | 3,482.8 | | | $ | 3,452.5 | | | $ | 3,878.7 | | | $ | 4,573.4 | | | $ | 4,699.8 | |
Source: Ministry of Economy and Finance.
External Debt
As of December 31, 2016, total public sector external debt (i.e., external debt of the Central Government) was approximately U.S.$16.9 billion, an increase of U.S.$1.2 billion from December 31, 2015, due primarily to the issuance of U.S.$1.0 billion aggregate principal amount of 3.875% Global Bonds due 2028 and disbursements of loans from multilateral agencies. Panama’s public sector external debt as a percentage of GDP was 30.6% as of December 31, 2016 (based on a preliminary GDP of U.S.$55.2 million for 2016), which represents an increase of 0.6 percentage points compared to a ratio of 30.0% as of December 31, 2015 (based on an estimated nominal GDP of U.S.$52.1 billion for 2015). As of December 31, 2015, U.S.$12.2 billion of total public sector external debt had a fixed interest rate, while U.S.$2.9 billion had a floating interest rate.
As of December 31, 2016, approximately 71.8% of total public sector external debt was owed to commercial lenders and bondholders, with 26.8% owed to multilateral institutions and 1.2% owed to bilateral lenders. As of December 31, 2015, approximately 72.0% of the total public sector external debt was owed to commercial lenders and bondholders, with 26.6% owed to multilateral institutions and 1.4% owed to bilateral lenders. As of December 31, 2014, approximately 73.4% of total public sector external debt was owed to commercial lenders and bondholders, with 24.9% owed to multilateral institutions and 1.7% owed to bilateral lenders. As of December 31, 2013, approximately 73.6% of the total public sector external debt was owed to commercial lenders and bondholders, with 24.0% owed to multilateral institutions and 2.4% owed to bilateral lenders. As of December 31, 2012, approximately 74.5 % of the total public sector external debt was owed to commercial lenders and bondholders, with 22.3% owed to multilateral institutions and 3.3% owed to bilateral lenders.
D-74
The following tables set forth the composition of public sector external debt outstanding at year-end for the years 2012 through 2016 and the scheduled amortizations for public sector external debt for each of the years indicated:
TABLE NO. 27
Public Sector External Debt(1)
(in millions of U.S. dollars)
| | | | | | | | | | | | | | | | | | | | |
| | | December 31, | |
| | | 2012 | | | 2013 | | | 2014 | | | 2015 | | | 2016 | |
Commercial banks | | $ | 302.2 | | | $ | 693.3 | | | $ | 1,021.4 | | | $ | 889.5 | | | $ | 744.1 | |
Bonds | | | 7,725.7 | | | | 8,307.1 | | | | 9,509.1 | | | | 10,377.4 | | | | 11,387.4 | |
Multilateral agencies | | | 2,403.0 | | | | 2,937.4 | | | | 3,575.6 | | | | 4,158.2 | | | | 4,564.3 | |
Bilateral entities | | | 351.6 | | | | 293.3 | | | | 246.2 | | | | 223.1 | | | | 206.2 | |
Total | | $ | 10,782.5 | | | $ | 12,231.1 | | | $ | 14,352.2 | | | $ | 15,648.3 | | | $ | 16,901.9 | |
| (1) | Debt stated at its outstanding principal amount and not at trading value in the secondary market. All external debt of the Republic is funded debt. Currencies other than U.S. dollars are translated into U.S. dollars at the exchange rate as of December 31, 2016. |
Source: Ministry of Economy and Finance.
TABLE NO. 28
Public Sector External Debt Amortization
(in millions of U.S. dollars)(1)(2)
| | | | | | | | | | | | | | | | | | | | | | | | |
| | | 2017 | | | 2018 | | | 2019 | | | 2020 | | | 2021 | | | 2022-
2053 | |
Multilaterals | | | | | | | | | | | | | | | | | | | | | | | | |
World Bank | | | 69.7 | | | | 74.5 | | | | 74.5 | | | | 74.5 | | | | 72.7 | | | | 634.9 | |
Inter-American Development Bank | | | 185.1 | | | | 191.2 | | | | 189.0 | | | | 184.5 | | | | 179.8 | | | | 1,637.8 | |
Development Bank of Latin America | | | 76.4 | | | | 76.8 | | | | 73.9 | | | | 73.9 | | | | 74.1 | | | | 518.4 | |
European Investment Bank | | | 4.6 | | | | 4.6 | | | | 4.6 | | | | 4.6 | | | | 4.6 | | | | 18.4 | |
The OPEC Fund for International Development | | | 4.7 | | | | 4.7 | | | | 4.7 | | | | 4.7 | | | | 4.7 | | | | 37.8 | |
Subtotal (Multilaterals) | | | 340.5 | | | | 351.8 | | | | 346.7 | | | | 342.1 | | | | 335.9 | | | | 2,847.3 | |
| | | | | | | | | | | | | | | | | | | | | | | | |
Bilaterals | | | 17.4 | | | | 14.2 | | | | 14.2 | | | | 14.2 | | | | 14.2 | | | | 131.9 | |
Bonds | | | 0.0 | | | | 0.0 | | | | 0.0 | | | | 1,530.7 | | | | 354.6 | | | | 9,502.1 | |
Commercial Debt | | | 145.4 | | | | 106.2 | | | | 93.1 | | | | 93.1 | | | | 93.1 | | | | 213.3 | |
Subtotal (Bilaterals, Bonds and Commercial Debt) | | | 162.8 | | | | 120.4 | | | | 107.3 | | | | 1,638.0 | | | | 461.9 | | | | 9,847.3 | |
| | | | | | | | | | | | | | | | | | | | | | | | |
Total | | | 503.3 | | | | 472.2 | | | | 454.0 | | | | 1,638.0 | | | | 797.8 | | | | 12,694.6 | |
| | | | | | | | | | | | | | | | | | | | | | | | |
| (1) | Projections based on outstanding balance as of December 31, 2016. |
| (2) | Figures include external debt guaranteed by the Republic. |
Source: Ministry of Economy and Finance.
The 1980s Debt Crisis. Panama’s economic performance measured by the growth rate of GDP during the 1980s was poor in comparison with the strong results registered during the previous three decades. The factors causing low growth rates included the growing influence of the public sector on the economy and the uncertainty related to the military government’s control of the country. Additionally, Panama had borrowed heavily in the late 1970s and early 1980s, and the maturity profile of Panamanian public sector debt was highly concentrated.
In 1987, Panama defaulted under all of its external indebtedness. Panama subsequently was declared ineligible to use the resources of the IMF and the World Bank, and the IADB placed the country on non-accrual status.
Following the United States’s military operation in December 1989, the Endara government declared that it would honor existing financial obligations. Panama subsequently cleared its substantial arrears with the international financial institutions, the Paris Club and its international bondholders. In 2001, Panama completed payments on its restructured Paris Club debt and, in 2002, on its floating rate notes issued in 1994 to restructure bonds in default at that time.
D-75
1995 Financing Plan. On May 9, 1995, Panama and its Bank Advisory Committee reached an agreement-in-principle on the restructuring of Panama’s medium- and long-term public sector indebtedness owed to commercial banks, as well as for interest arrears accrued in respect of such indebtedness since 1987. Pursuant to that agreement, on July 17, 1996, Panama issued approximately U.S.$3.2 billion principal amount of bonds to holders of certain debt (“Eligible Debt”) in consideration for the tender by such holders of their Eligible Debt and interest arrears accrued in respect thereof since 1987 (“Eligible Interest”). The bonds were issued pursuant to an exchange agreement implementing the Republic of Panama 1995 Financing Plan (the “1995 Financing Plan”), which provided for the restructuring of approximately U.S.$2.0 billion of Eligible Debt and arrangements for approximately U.S.$1.8 billion of Eligible Interest. On July 17, 2006, Panama redeemed all of the bonds issued under its 1995 Financing Plan.
International Financial Institutions. The IADB has been a significant source of financing for Panama. As of December 31, 2015, Panama had agreements with the IADB for a total of U.S.$2.5 billion in loans. These agreements finance projects in health, transportation, social investment and modernization as well as co-financings with the World Bank concerning public sector reforms and sectoral adjustments.
In 2012, the IADB approved three new operations with sovereign guarantee. They were: (1) Innovation in School Infrastructure for U.S.$70 million with the objective of promoting increases in coverage and improvements in internal efficiency through investments in innovative infrastructure and improvements in the management of schools and the relevance of the curriculum, (2) Reducing Vulnerability to Natural Disasters and Climate Change II for U.S.$100 million which was structured as a programmatic loan to support policy reforms in the context of natural disaster risk management and climate change and (3) Strengthening Macrofinancial and Fiscal Management for U.S.$350 million, which, at the request of the Panamanian Government, took the form of a guarantee.
In 2013, the IADB approved two loans to Panama, of which U.S.$100 million was given to strengthen macrofinancial and fiscal management and U.S.$54 million to provide investment in potable water and sanitation.
In 2014, the IADB approved two new loans to Panama, of which U.S.$300 million was provided for financial and fiscal stability and a transparency improvement program and U.S.$20 million was provided for a sustainable rural electrification program.
In 2015, the IADB approved four new loans to Panama: U.S.$150 million was provided to support Panama’s transport and logistics sector reform program, U.S.$150 million was provided for transparency and equity spending on a social protection program, U.S.$110 million was provided for a project to improve the sanitation of Panama Bay and U.S.$50 million was provided for a Development and Social Inclusion program.
As of December 31, 2016, the IADB had approved three new loans to Panama: U.S.$160 million was provided to support integrated networks of health services; U.S.$200.0 million was provided to support the Transport and Logistics Sector Reform Program II; and U.S.$200.0 million was provided to support the Program for Transparency and Equity in Spending on Social Protection II.
As of September 2017, Panama signed two loans with the IADB, one for U.S.$150.0 million to finance part of the “Arraiján and La Chorrera-PSACH Stage I District Sanitation Program” and the other to finance U.S.$300.0 million of the “Program for Supporting the Sustainable Development of Public Services,”
The Republic has entered into several multilateral and bilateral agreements for the construction of the Metro de Panama. The cost of the first phase, which consisted of Metro Line 1, is estimated to be approximately U.S.$1.88 billion and has been financed through Central Government borrowings from multilateral and bilateral lending institutions. In this connection, in July 2011, the Republic entered into an agreement with CAF for a loan in the amount of U.S.$400 million, which had been disbursed in full as of August 2014. On February 9, 2012, the Republic entered into credit facilities with Compagnie Française d’Assurance pour le Commerce Extérieur (“COFACE”) for a loan in the amount of U.S.$297.8 million and with Compañía Española de Seguros de Crédito a la Exportación S.A. (“CESCE”) for a loan in the amount of U.S.$64.1 million. In June 2014, U.S.$274.0 million was disbursed under this COFACE facility and U.S.$57.6 million was disbursed under this CESCE facility, with the remaining amounts available under the facility agreements cancelled. On June 29, 2012, the Republic entered into a syndicated facility with a MIGA guarantee for a credit up to U.S.$250 million and the facility had been completely disbursed as of August 2013. In February 2013, the Republic entered into an agreement with CAF for a loan in the amount of U.S.$100.0 million; as of June 2016, this loan had been
D-76
completely disbursed. In March 2014, the Republic entered into an additional loan agreement with CAF for credit of up to U.S.$100.0 million; as of June 2016, this loan had been completely disbursed. In November 2013, the Republic entered into a second syndicated facility with a MIGA guarantee for credit up to U.S.$250 million; as of August 2014, the facility had been disbursed in full. In March 2017, the Government signed a contract with ING Bank, a branch of ING-DiBa AG, and Citibank, N.A., for a U.S.$137.3 million loan for modifications to Panama Metro Line 1 and the supply of 70 new train cars.
As of December 31, 2016 the Government had no arrangement in place with the IMF. The IMF Executive Board concluded its most recent Article IV consultation with Panama on May 1, 2017.
The World Bank approved a loan on March 26, 2013 for a total amount of U.S.$100.0 million to finance the Second Programmatic Development Policy Loan with the objective of creating fiscal space and strengthening social transfer programs. In January 2014, the World Bank approved a new loan for a total amount of U.S.$200 million to finance the Third Programmatic Development Policy Loan. In April 2015, the World Bank approved a new loan for a total amount of U.S.$300 million to finance the First Programmatic Shared Prosperity Development Policy Loan. In December 2015, the World Bank approved a new loan for a total amount of U.S.$75.0 million to finance the System of Social Protection and Inclusion. Cabinet Decree No. 17 of May 23, 2017 authorized a U.S.$65.0 million loan agreement with the World Bank for the Burunga Residual Water Management Project, which contemplates the design and construction of sewage networks, secondary collectors, main pumping stations and a wastewater treatment plant.
As of August 31, 2017, Panama’s total subscriptions in the IMF (which correspond to its IMF quota) were SDR 376.8 million. As of August 31, 2017, Panama’s total subscriptions in the World Bank were U.S.$89.1 million. As of June 30, 2017, Panama’s total subscriptions in MIGA were U.S.$2.3 million. As of June 30, 2017, Panama’s total subscriptions in the IFC were U.S.$1.0 million.
As of June 30, 2016, Panama’s subscription to the IADB was U.S.$751.3 million. Of this subscription, U.S.$25.3 million had been paid as of December 31, 2015, with the balance callable if required to meet the IADB’s obligations. Panama’s contribution to the IADB’s Fund for Special Operations (which corresponds to its quota) was U.S.$26.7 million as of December 31, 2015. As of February 2015, Panama paid U.S.$1.6 million corresponding to the fourth installment of the ninth increase in ordinary capital which was effective as of February 29, 2012. As of June 2016, Panama has paid U.S.$1.7 million for the fifth installment, which corresponds to 123 shares plus 19 additional shares of Venezuela, subscribed to by Panama.
In January 2007, Panama joined the Central American Bank for Economic Integration (“CABEI”) as a non-regional and non-founding member and agreed to pay a subscription of U.S.$57.6 million, with 25% as payable capital and 75% as callable capital if required by the CABEI to meet its obligations for funds borrowed or loans guaranteed by it. On April 26, 2016, Cabinet Decree No. 18 authorized Panama to subscribe to “B” Series shares in the CABEI and to increase its shareholding to U.S.$255.0 million. On September 16, 2016, Panama paid the first installment of this increase, U.S.$12.3 million, which allowed Panama to appoint a Principal Director to the Board of Directors of CABEI, and Panama has since paid a second installment of the same amount. On June 7, 2017, Panama entered a loan agreement with the CABEI for U.S.$100 million to partially finance sanitation projects in Arraiján and La Chorrera, each in Panama Oeste province.
On March 14, 2017, the Government and the CAF signed agreements for a U.S.$95 million loan to finance the “Wastewater Management Project for Burunga and Arraiján Cabecera, Panama” and for a U.S.$75.0 million loan to construct the Institute of Technical and Superior Education of Eastern Panama, with a second loan of U.S.$75.0 anticipated for phase two of the construction. In April 2016, Panama entered into a loan agreement with CAF for U.S.$45.0 million for a sanitation project. In November 2015, Panama entered into two new loan agreements with CAF for an amount up to U.S.$140.0 million for sanitation projects; from those new loans, U.S.$11.8 million had been disbursed as of June 2016. As of September 2017, Panama has paid U.S.$62.2 million to the CAF pursuant to Panama’s subscription to Series B and Series C ordinary shares in CAF.
On September 7, 2017, the National Economic Council issued approval for a loan agreement for U.S.$50.0 million with the European Investment Bank for partial financing of the Panama Oeste-Burunga sanitation program.
Global Notes and Bonds. On May 15, 2017, Panama conducted a liability management transaction involving an issuance of U.S.$1,168,292,000 aggregate principal amount of its 4.500% Global Bonds due 2047; a reopening and issuance of U.S.$253,988,000 aggregate principal amount of its 3.875% Global Bonds due 2028; and a purchase by Panama of U.S.$345,473,000 aggregate principal amount of its 5.200% Global Bonds due 2020. Following the transaction, the aggregate outstanding principal amount of Panama’s 5.200% Global Bonds due 2020 was reduced from U.S.$1,500,000,000 to U.S.$1,154,527,000. On March 10, 2016, Panama issued U.S.$1.0 billion aggregate principal amount of its 3.875% Global Bonds due 2028.
D-77
On March 16, 2015, Panama issued U.S.$1.25 billion aggregate principal amount of its 3.750% Global Bonds due 2025. On September 22, 2014, Panama issued U.S.$1.25 billion aggregate principal amount of its 4.000% Global Bonds due 2024. On November 26, 2013, Panama conducted a liability management transaction involving an issuance of U.S.$500,000,000 of its 5.200% Global Bonds due 2020 and a purchase by Panama of U.S.$583,598,000 principal amount of its 7.250% Global Bonds due 2015. On April 29, 2013, Panama issued U.S.$750.0 million aggregate principal amount of its 4.30% Global Bonds due 2053.
On February 1, 2012, Panama conducted a liability management transaction involving an issuance of U.S.$400.0 million aggregate principal amount of its 5.625% Treasury Bonds due 2022; an issuance of U.S.$248,596,000 aggregate principal amount of its 6.700% U.S. Dollar-Denominated Amortizing Global Bonds due 2036; and a purchase by Panama of U.S.$508,605,000 aggregate principal amount of its 7.250% Global Bonds due 2015.
On September 4, 2003, Panama filed with the SEC Amendment No. 1 to Panama’s fiscal agency agreement, dated as of September 26, 1997, between Panama and The Bank of New York Mellon (as successor in interest JPMorgan Chase Bank) to provide for the issuance in the future of global bonds with collective action clauses that, among other things, permit Panama to amend certain key terms of the bonds, including the maturity date, interest rate and other payment terms, with the consent of the holders of not less than 75% of the aggregate principal amount of outstanding bonds of the same series.
On February 19, 2015, Panama filed with the SEC Amendment No. 2 to Panama’s fiscal agency agreement with The Bank of New York Mellon to provide for modification of the payment provisions of any series of debt securities and other reserve matters listed in the fiscal agency agreement with the written consent of Panama and the affirmative vote or consent of the holders of: (1) with respect to a single series of debt securities, holders of more than 75% of the aggregate principal amount of the outstanding debt securities of such series; (2) with respect to two or more series of debt securities, if certain “uniformly applicable” requirements are met, holders of more than 75% of the aggregate principal amount of the outstanding debt securities of all series affected by the proposed modification, taken in the aggregate; or (3) with respect to two or more series of debt securities, holders of more than 66 2/3% of the aggregate principal amount of the outstanding debt securities of all series affected by the proposed modification, taken in the aggregate, and holders of more than 50% of the aggregate principal amount of the outstanding debt securities of each series affected by the proposed modification, taken individually. This amendment will apply to securities of any series issued after February 19, 2015 that are in their terms explicitly stated to be Aggregated Collective Action Securities.
Amendment No. 2 to Panama’s fiscal agency agreement with The Bank of New York Mellon also provided for “Equal Ranking Securities” that will rank without any preference among themselves and equally with all other unsecured and unsubordinated public indebtedness of Panama. It is understood that this provision shall not be construed so as to require Panama to make payments under the debt securities ratably with payments being made under any other public indebtedness.
On October 26, 2016, Panama filed with the SEC Amendment No. 3 to Panama’s fiscal agency agreement with The Bank of New York Mellon. Amendment No. 3 clarifies that (a) if certain “uniformly applicable” requirements are not met, then a modification to the payment provisions of any series of debt securities and other reserve matters listed in the fiscal agency agreement, in so far as such modification affects the securities of two or more series, must be effected with the written consent of Panama and the affirmative vote or consent of holders of more than 66 2/3% of the aggregate principal amount of the outstanding debt securities of all series affected by the proposed modification, taken in the aggregate, and holders of more than 50% of the aggregate principal amount of the outstanding debt securities of each series affected by the proposed modification, taken individually; and that (b) if certain “uniformly applicable” requirements are met, then a modification to the payment provisions of any series of debt securities and other reserve matters listed in the fiscal agency agreement, in so far as such modification affects the securities of two or more series, may be effected, at Panama’s option, by the aforementioned method or with the written consent of Panama and the affirmative vote or consent of holders of more than 66 2/3% of the aggregate principal amount of the outstanding debt securities of all series affected by the proposed modification, taken in the aggregate, and holders of more than 50% of the aggregate principal amount of the outstanding debt securities of each series affected by the proposed modification, taken individually. Amendment No. 3 also amends the definition of “public sector instrumentality” and clarifies the definition of “uniformly applicable” in Panama’s fiscal agency agreement with The Bank of New York Mellon.
D-78
TABLES AND SUPPLEMENTARY INFORMATION
TABLE NO. 29
External Direct Debt of the Republic
Central Government
| | | | | | | | | | | | | | | | | | | | |
| | | Interest | | | Issue Date | | | Final Maturity | | | Amortization | | | December 31,
2016(1)
(in millions
of dollars) | |
MULTILATERAL ORGANIZATIONS | | | | | | | | | | | | | | | | | | $ | 4,564.3 | |
Inter-American Development Bank(2) | | | Various | | | | Various | | | | Various | | | | Semiannually | | | | 2,531.6 | |
World Bank | | | Various | | | | Various | | | | Various | | | | Semiannually | | | | 1,000.6 | |
European Investment Bank | | | Floating | | | | Various | | | | Various | | | | Semiannually | | | | 41.6 | |
Development Bank of Latin America | | | Floating | | | | Various | | | | Various | | | | Semiannually | | | | 893.6 | |
OPEC Fund for International Development | | | Fixed | | | | Various | | | | Various | | | | Semiannually | | | | 61.2 | |
BILATERAL ORGANIZATIONS | | | | | | | | | | | | | | | | | | $ | 206.2 | |
Banks with Official Guarantees(2) | | | Various | | | | Various | | | | Various | | | | Semiannually | | | | 27.2 | |
Support Groups(2) | | | Fixed | | | | Various | | | | Various | | | | Semiannually | | | | 3.0 | |
Government Direct Creditors(2) | | | Fixed | | | | Various | | | | Various | | | | Semiannually | | | | 176.0 | |
COMMERCIAL BANKS | | | Various | | | | Various | | | | Various | | | | Various | | | $ | 744.1 | |
GLOBAL BONDS | | | Various | | | | Various | | | | Various | | | | Various | | | $ | 11,387.4 | |
Global 2027 | | | 8.88% | | | | Sep 26, 1997 | | | | Sep 30, 2027 | | | | Bullet | | | | 975.0 | |
Global 2029 | | | 9.38% | | | | Mar 31, 1999 | | | | Apr 01, 2029 | | | | Bullet | | | | 951.4 | |
Global 2020 | | | 10.75% | | | | July 13, 2000 | | | | May 15, 2020 | | | | Bullet | | | | 30.7 | |
Global 2023 | | | 9.38% | | | | Dec 03, 2002 | | | | Jan 16, 2023 | | | | Bullet | | | | 138.9 | |
Global 2034 | | | 8.13% | | | | Jan 28, 2004 | | | | Apr 28, 2034 | | | | Bullet | | | | 172.8 | |
Global 2026 | | | 7.13% | | | | Nov 29, 2005 | | | | Jan 29, 2026 | | | | Bullet | | | | 980.0 | |
Global 2036 | | | 6.70% | | | | Jan 26, 2006 | | | | Jan 26, 2036 | | | | Various | | | | 2,033.9 | |
Global 2020 | | | 5.20% | | | | Nov 23, 2009 | | | | Jan 01, 2020 | | | | Bullet | | | | 1,500.0 | |
Samurai 2021(3) | | | 1.81% | | | | Jan 26, 2011 | | | | Jan 25, 2021 | | | | Bullet | | | | 354.6 | |
Global 2053 | | | 4.30% | | | | Apr 29, 2013 | | | | Apr 29, 2053 | | | | Various | | | | 750.0 | |
Global 2024 | | | 4.00% | | | | Sept 15, 2014 | | | | Sep 22, 2024 | | | | Bullet | | | | 1,250.0 | |
Global 2025 | | | 4.00% | | | | Mar 11, 2015 | | | | Mar 16, 2025 | | | | Bullet | | | | 1,250.0 | |
Global 2028 | | | 3.87% | | | | Mar 17, 2016 | | | | Mar 17, 2028 | | | | Bullet | | | | 1,000.0 | |
TOTAL | | | | | | | | | | | | | | | | | | $ | 16,901.9 | |
| (1) | All obligations are denominated in U.S. dollars unless otherwise indicated. Currencies other than U.S. dollars are translated into U.S. dollars by the exchange rate as of December 31, 2016. |
| (3) | Payable in Japanese Yen. |
Source: Ministry of Economy and Finance.
D-79
TABLE NO. 30
External Debt Guaranteed by the Republic
Decentralized Institutions
| | | | | | | | | | | | | | | | | | | | |
| | | Interest | | | Issue
Date | | | Maturity | | | Amortization | | | December 31,
2016 (1)
(in millions
of dollars) | |
Multilateral Organizations | | | | | | | | | | | | | | | | | | | | |
Inter-American Development Bank(2) | | | Various | | | | Various | | | | Various | | | | Semiannually | | | $ | 35.7 | |
Total | | | | | | | | | | | | | | | | | | $ | 35.7 | |
| (1) | All obligations are denominated in U.S. dollars unless otherwise indicated. Currencies other than U.S. dollars are translated into U.S. dollars by the exchange rate as of December 31, 2016. |
Source: Ministry of Economy and Finance.
TABLE NO. 31
Internal Funded Debt Securities of the Republic
| | | | | | | | | | | | | | |
Name | | Interest
Rate | | | Amortization | | Issuance Date | | Final Maturity | | December 31,
2016
(in millions
of dollars) | |
Bonds | | | | | | | | | | | | | | |
Treasury Bonds 2022 | | | 5.6 | % | | Bullet | | Jan 30, 2012 | | Jul 25, 2022 | | $ | 399.88 | |
Treasury Bonds 2022 | | | 5.6 | % | | Bullet | | Mar 16, 2012 | | Jul 25, 2022 | | $ | 100.00 | |
Treasury Bonds 2022 | | | 5.6 | % | | Bullet | | Apr 09, 2012 | | Jul 25, 2022 | | $ | 100.00 | |
Treasury Bonds 2022 | | | 5.6 | % | | Bullet | | May 11, 2012 | | Jul 25, 2022 | | $ | 25.00 | |
Treasury Bonds 2022 | | | 5.6 | % | | Bullet | | Jun 22, 2012 | | Jul 25, 2022 | | $ | 50.00 | |
Treasury Bonds 2022 | | | 5.6 | % | | Bullet | | Jul 06, 2012 | | Jul 25, 2022 | | $ | 100.00 | |
Treasury Bonds 2022 | | | 5.6 | % | | Bullet | | Jul 27, 2012 | | Jul 25, 2022 | | $ | 100.00 | |
Treasury Bonds 2022 | | | 5.6 | % | | Bullet | | Aug 17, 2012 | | Jul 25, 2022 | | $ | 50.00 | |
Treasury Bonds 2022 | | | 5.6 | % | | Bullet | | Aug 24, 2012 | | Jul 25, 2022 | | $ | 25.00 | |
Treasury Bonds 2022 | | | 5.6 | % | | Bullet | | Aug 31, 2012 | | Jul 25, 2022 | | $ | 25.00 | |
Treasury Bonds 2022 | | | 5.6 | % | | Bullet | | Sep 07, 2012 | | Jul 25, 2022 | | $ | 25.00 | |
Treasury Bonds 2022 | | | 5.6 | % | | Bullet | | Sep 18, 2012 | | Jul 25, 2022 | | $ | 25.00 | |
Treasury Bonds 2022 | | | 5.6 | % | | Bullet | | Sep 21, 2012 | | Jul 25, 2022 | | $ | 25.00 | |
Treasury Bonds 2022 | | | 5.6 | % | | Bullet | | Sep 28, 2012 | | Jul 25, 2022 | | $ | 25.00 | |
Treasury Bonds 2022 | | | 5.6 | % | | Bullet | | Oct 05, 2012 | | Jul 25, 2022 | | $ | 13.30 | |
Treasury Bonds 2022 | | | 5.6 | % | | Bullet | | Oct 19, 2012 | | Jul 25, 2022 | | $ | 25.00 | |
Treasury Bonds 2022 | | | 5.6 | % | | Bullet | | Oct 26, 2012 | | Jul 25, 2022 | | $ | 16.75 | |
Treasury Bonds 2022 | | | 5.6 | % | | Bullet | | Nov 02, 2012 | | Jul 25, 2022 | | $ | 25.00 | |
Treasury Bonds 2022 | | | 5.6 | % | | Bullet | | Nov 09, 2012 | | Jul 25, 2022 | | $ | 23.71 | |
Treasury Bonds 2022 | | | 5.6 | % | | Bullet | | Nov 20, 2012 | | Jul 25, 2022 | | $ | 25.00 | |
Treasury Bonds 2022 | | | 5.6 | % | | Bullet | | Nov 23, 2012 | | Jul 25, 2022 | | $ | 15.50 | |
Treasury Bonds 2022 | | | 5.6 | % | | Bullet | | Nov 30, 2012 | | Jul 25, 2022 | | $ | 25.90 | |
Treasury Bonds 2022 | | | 5.6 | % | | Bullet | | Dec 21, 2012 | | Jul 25, 2022 | | $ | 119.00 | |
Total | | | | | | | | | | | | $ | 1,364.04 | |
Treasury Bonds 2024 | | | 4.9 | % | | Bullet | | Nov 20, 2013 | | May 24, 2024 | | $ | 100.00 | |
Treasury Bonds 2024 | | | 4.9 | % | | Bullet | | June 21, 2016 | | May 24, 2024 | | $ | 300.00 | |
Treasury Bonds 2024 | | | 4.9 | % | | Bullet | | Jul 19, 2016 | | May 24, 2024 | | $ | 150.00 | |
Treasury Bonds 2024 | | | 4.9 | % | | Bullet | | Aug 01, 2016 | | May 24, 2024 | | $ | 150.00 | |
Treasury Bonds 2024 | | | 4.9 | % | | Bullet | | Oct 11, 2016 | | May 24, 2024 | | $ | 98.50 | |
Total | | | | | | | | | | | | $ | 798.50 | |
Total Treasury Bonds | | | | | | | | | | | | $ | 2,162.53 | |
D-80
| | | | | | | | | | | | | | |
Notes | | | | | | | | | | | | | | |
Treasury Notes 2018 | | | 5.0 | % | | Bullet | | Jun 21, 2011 | | Jun 15, 2018 | | $ | 257.97 | |
Treasury Notes 2018 | | | 5.0 | % | | Bullet | | Jul 26, 2011 | | Jun 15, 2018 | | $ | 100.00 | |
Treasury Notes 2018 | | | 5.0 | % | | Bullet | | Sep 20, 2011 | | Jun 15, 2018 | | $ | 80.00 | |
Treasury Notes 2018 | | | 5.0 | % | | Bullet | | Oct 11, 2011 | | Jun 15, 2018 | | $ | 100.00 | |
Treasury Notes 2018 | | | 5.0 | % | | Bullet | | Oct 04, 2012 | | Jun 15, 2018 | | $ | 455.97 | |
Treasury Notes 2018 | | | 5.0 | % | | Prepurchase | | | | Jul 26, 2016 | | $ | -324.34 | |
Total | | | | | | | | | | | | $ | 669.60 | |
Treasury Notes 2021 | | | 4.9 | % | | Bullet | | Feb 04, 2014 | | Feb 05, 2021 | | $ | 17.22 | |
Treasury Notes 2021 | | | 4.9 | % | | Bullet | | Feb 25, 2014 | | Feb 25, 2021 | | $ | 105.01 | |
Treasury Notes 2021 | | | 4.9 | % | | Bullet | | Mar 18, 2014 | | Feb 25, 2021 | | $ | 148.50 | |
Treasury Notes 2021 | | | 4.9 | % | | Bullet | | Apr 08, 2014 | | Feb 25, 2021 | | $ | 51.38 | |
Treasury Notes 2021 | | | 4.9 | % | | Bullet | | Apr 22, 2014 | | Feb 25, 2021 | | $ | 34.00 | |
Treasury Notes 2021 | | | 4.9 | % | | Bullet | | May 13, 2014 | | Feb 25, 2021 | | $ | 30.00 | |
Treasury Notes 2021 | | | 4.9 | % | | Bullet | | May 20, 2014 | | Feb 25, 2021 | | $ | 40.00 | |
Treasury Notes 2021 | | | 4.9 | % | | Bullet | | May 27, 2014 | | Feb 25, 2021 | | $ | 30.00 | |
Treasury Notes 2021 | | | 4.9 | % | | Bullet | | Jun 03, 2014 | | Feb 25, 2021 | | $ | 20.00 | |
Treasury Notes 2021 | | | 4.9 | % | | Bullet | | Jun 10, 2014 | | Feb 25, 2021 | | $ | 22.00 | |
Treasury Notes 2021 | | | 4.9 | % | | Bullet | | Jun 17, 2014 | | Feb 25, 2021 | | $ | 35.00 | |
Treasury Notes 2021 | | | 4.9 | % | | Bullet | | Jun 24, 2014 | | Feb 25, 2021 | | $ | 23.00 | |
Treasury Notes 2021 | | | 4.9 | % | | Bullet | | Jul 22, 2014 | | Feb 25, 2021 | | $ | 29.00 | |
Treasury Notes 2021 | | | 4.9 | % | | Bullet | | Aug 05, 2014 | | Feb 25, 2021 | | $ | 34.00 | |
Treasury Notes 2021 | | | 4.9 | % | | Bullet | | Aug 19, 2014 | | Feb 25, 2021 | | $ | 16.00 | |
Treasury Notes 2021 | | | 4.9 | % | | Bullet | | Sep 02, 2014 | | Feb 25, 2021 | | $ | 20.00 | |
Treasury Notes 2021 | | | 4.9 | % | | Bullet | | Oct 07, 2014 | | Feb 25, 2021 | | $ | 10.00 | |
Total | | | | | | | | | | | | $ | 665.20 | |
Treasury Notes 2019 | | | 3.0 | % | | Bullet | | Jun 02, 2015 | | Jun 05, 2019 | | $ | 125.00 | |
Treasury Notes 2019 | | | 3.0 | % | | Bullet | | Jul 14, 2015 | | Jun 05, 2019 | | $ | 40.00 | |
Treasury Notes 2019 | | | 3.0 | % | | Bullet | | Aug 4, 2015 | | Jun 05, 2019 | | $ | 45.00 | |
Treasury Notes 2019 | | | 3.0 | % | | Bullet | | Sep 1, 2015 | | Jun 05, 2019 | | $ | 25.00 | |
Treasury Notes 2019 | | | 3.0 | % | | Bullet | | Oct 6, 2015 | | Jun 05, 2019 | | $ | 30.00 | |
Treasury Notes 2019 | | | 3.0 | % | | Bullet | | Nov 17, 2015 | | Jun 05, 2019 | | $ | 25.00 | |
Treasury Notes 2019 | | | 3.0 | % | | Bullet | | Jan 19, 2016 | | Jun 05, 2019 | | $ | 18.75 | |
Treasury Notes 2019 | | | 3.0 | % | | Bullet | | Feb 23, 2016 | | Jun 05, 2019 | | $ | 28.00 | |
Treasury Notes 2019 | | | 3.0 | % | | Bullet | | Mar 15, 2019 | | Jun 05, 2019 | | $ | 24.00 | |
Treasury Notes 2019 | | | 3.0 | % | | Bullet | | Apr 05, 2016 | | Jun 05, 2019 | | $ | 40.00 | |
Treasury Notes 2019 | | | 3.0 | % | | Bullet | | May 17, 2016 | | Jun 05, 2019 | | $ | 58.45 | |
Treasury Notes 2019 | | | 3.0 | % | | Bullet | | Jul 05, 2016 | | Jun 05, 2019 | | $ | 120.00 | |
Treasury Notes 2019 | | | 3.0 | % | | Bullet | | Aug 16, 2016 | | Jun 05, 2019 | | $ | 28.50 | |
Total | | | | | | | | | | | | $ | 607.70 | |
Total Treasury Notes | | | | | | | | | | | | $ | 1,942.5 | |
Source: Ministry of Economy and Finance.
D-81