FIRST COMMUNITY
FINANCIALCORPORATION
2009
Annual Report

| | |
| | | Page |
Management’s Letter to Shareholders | | 2-3 |
| |
Your Partners in Success | | 4-5 |
| |
Management’s Assessment of Internal Control Over Financial Reporting | | 6 |
| |
Report of Independent Registered Public Accounting Firm | | 7 |
| |
December 31, 2009 and 2008
Consolidated Balance Sheets: | | 8 |
| |
Years ended December 31, 2009 and 2008
Consolidated Statements of Income: | | 9 |
| |
Years ended December 31, 2009 and 2008
Consolidated Statements of Shareholders’ Equity: | | 10 |
| |
Years ended December 31, 2009 and 2008
Consolidated Statements of Cash Flows: | | 11 |
| |
Notes to Consolidated Financial Statements | | 12-39 |
| |
Management’s Discussion and Analysis of Financial Condition and Results of Operations | | 40-55 |
| |
Board of Directors:
First Community Financial Corporation | | 56 |
| |
Officers:
First Community Financial Corporation | | 57 |
| |
Officers:
The First National Bank of Mifflintown | | 58 |
| |
Directors Emeriti and Advisory Boards | | 59 |
| |
Bank Locations in Juniata County and Perry County | | 60-61 |
| |
Stock and Dividend Information | | 62-63 |
MANAGEMENT’S LETTER TO SHAREHOLDERS
Dear Shareholder:
As a community bank founded in 1864, our institution has experienced many economic cycles and trends over the years. Fundamental to community banking success through these cycles has been our devotion to customers and the communities in which we serve. With the people shown in this year’s report, our staff continues to carry on these values and traditions, while experiencing a very challenging economic period. This past year has seen many large, national financial institutions cease to exist, independently or otherwise, such as Bear Stearns, Lehman Brothers, Merrill Lynch and Wachovia. Meanwhile, our government has gotten involved in the financial system in unprecedented ways, while increasing spending to stimulate the economy.
While dealing with a significant economic recession, we report the following for 2009:
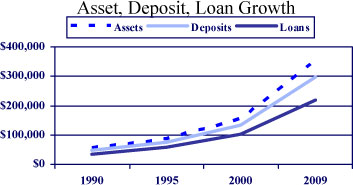
| | • | | Assets expanded over $29 million to $356 million. |
| | • | | Gross loans grew by $5 million. |
| | • | | Deposits added $34 million. |
| | • | | Net income was $2,226,000. |
| | • | | Dividends increased 11.5%. |
In addition, net income was impacted by an additional $544,000 more in FDIC and OCC fees than were paid in 2008, because of government assessments on all banks. As a result of loan volume growth and a challenging business environment, net income was also affected by an additional allocation to our loan reserves. Meanwhile, we remain well-capitalized.
Innovation, customer service and efficiency continue to be drivers of our organization. For example, we added a system to enable businesses to make deposits remotely from their locations and pay bills online. Our website was also updated during the year with a focus toward ease of use and enhanced information. Through it, we enable more customer feedback and communication, while we also still believe in maintaining the importance of personal relationships.
Also, during the year, Joseph E. Barnes and James R. McLaughlin left our Board; their years of service and contributions in making the bank what it is today have been greatly appreciated.
2
In 2010, we continue to move forward in our drive to continue to innovate as the bank grows. Thus, we plan to offer online mortgage loan applications through our updated website which should reach new customers, while streamlining lender paperwork. Additionally, a potential branch site is being pursued in Perry County near Newport.
Our bank maintains its commitment to our communities with the sponsorship of agricultural and business outlook meetings, food and toy drives, as well as supporting numerous community groups with our contributions of time and resources.
While continuing our efforts to be environmentally friendly, in addition to presenting committee and board materials in electronic form, we have begun to mail proxies and related financial reports on a consolidated household basis, unless shareholders prefer otherwise. Also, in 2010, we will offer online statements as an option to our bank customers which will save storage space for them, while cutting postage and handling costs.
Continuing to hire and develop high quality staff remains integral to our success, as we add new training options and resources during the year.
As always, we appreciate the contributions of our Board of Directors, Advisory Boards, Directors Emeriti, officers and employees, many of which I have been able to work alongside during my twenty two years at the bank. The efforts of this group, as well as those that were involved in past years, have enabled us to grow to eleven branches, while offering trust and investment services, today.
As economic conditions develop, we will continue to strive for future success with our commitment to community banking values and our local communities.
Your investment in our company is greatly appreciated. For additional information concerning our stock or other matters, please feel free to contact us by telephone at 717-436-2144, toll-free at 877-362-6433 or online atwww.fnbmiffintown.com.
| | |
John P. Henry III | | Jody D. Graybill |
Chairman | | President |
3
PICTURES
4
PICTURES
5
REPORTOF MANAGEMENT’S ASSESSMENTOF INTERNAL CONTROLOVER FINANCIAL REPORTING
First Community Financial Corporation is responsible for the preparation, integrity, and fair presentation of the consolidated financial statements included in this annual report. The consolidated financial statements and notes included in this annual report have been prepared in conformity with United States generally accepted accounting principles and necessarily include some amounts that are based on management’s best estimates and judgments.
We, as management of First Community Financial Corporation, are responsible for establishing and maintaining effective internal control over financial reporting that is designed to produce reliable financial statements in conformity with United States generally accepted accounting principles. Internal control over financial reporting includes those policies and procedures that pertain to the maintenance of records that in reasonable detail accurately and fairly reflect the transactions and dispositions of the assets of the Corporation; provide reasonable assurance that the transactions are recorded as necessary to permit preparation of financial statements in accordance with generally accepted accounting principles; provide a reasonable assurance that receipts and expenditures of the Corporation are only being made in accordance with authorizations of management and directors of the Corporation; and provide a reasonable assurance regarding prevention or timely detection of unauthorized acquisition, use, or disposition of the Corporation’s assets that could have a material effect on the financial statements. The system of internal control over financial reporting as it relates to the financial statements is evaluated for effectiveness by management and tested for reliability through a program of internal audits. Actions are taken to correct potential deficiencies as they are noted.
Any system of internal control, no matter how well designed, has inherent limitations, including the possibility that a control can be circumvented or overridden and misstatements due to error or fraud may occur and not be detected. Also, because of changes in conditions, internal control effectiveness may vary over time. Accordingly, even an effective system of internal control will provide only a reasonable assurance with respect to financial statement preparation.
Management assessed the Corporation’s system of internal control over financial reporting as of December 31, 2009, in relation to the criteria for effective control over financial reporting as described in “Internal Control – Integrated Framework,” issued by the Committee of Sponsoring Organizations of the Treadway Commission. Based on this assessment, management concludes that, as of December 31, 2009, its system of internal control over financial reporting is effective and meets the criteria of the “Internal Control – Integrated Framework.”
This Annual Report does not include an attestation report of the Corporation’s registered public accounting firm regarding internal control over financial reporting. Management’s report was not subject to attestation by the Corporation’s registered public accounting firm pursuant to rules of the Securities and Exchange Commission that permit the Corporation to provide only management’s report in this Annual Report.
|
|
/s/ Jody D. Graybill |
| Jody D. Graybill |
| President |
| (Principal Executive Officer) |
|
/s/ Richard R. Leitzel |
| Richard R. Leitzel |
| Vice President and Chief Financial Officer |
| (Principal Financial Officer) |
March 12, 2010
6

REPORTOF INDEPENDENT REGISTERED PUBLIC ACCOUNTING FIRM
To the Board of Directors and Shareholders
First Community Financial Corporation
Mifflintown, Pennsylvania
We have audited the accompanying consolidated balance sheets of First Community Financial Corporation and subsidiaries as of December 31, 2009 and 2008, and the related consolidated statements of income, shareholders’ equity, and cash flows for the years then ended. First Community Financial Corporation’s management is responsible for these consolidated financial statements. Our responsibility is to express an opinion on these consolidated financial statements based on our audits.
We conducted our audits in accordance with the standards of the Public Company Accounting Oversight Board (United States). Those standards require that we plan and perform the audit to obtain reasonable assurance about whether the financial statements are free of material misstatement. The Corporation is not required to have, nor were we engaged to perform, an audit of its internal control over financial reporting. Our audits included consideration of internal control over financial reporting as a basis for designing audit procedures that are appropriate in the circumstances, but not for the purpose of expressing an opinion on the effectiveness of the Corporation’s internal control over financial reporting. Accordingly, we express no such opinion. An audit also includes examining, on a test basis, evidence supporting the amounts and disclosures in the financial statements, assessing the accounting principles used and significant estimates made by management, as well as evaluating the overall financial statement presentation. We believe that our audits provide a reasonable basis for our opinion.
In our opinion, the consolidated financial statements referred to above present fairly, in all material respects, the financial position of First Community Financial Corporation and subsidiaries as of December 31, 2009 and 2008, and the results of its operations and its cash flows for the years then ended in conformity with accounting principles generally accepted in the United States of America.
/s/ ParenteBeard LLC
Harrisburg, Pennsylvania
March 12, 2010
FIRST COMMUNITY FINANCIAL CORPORATION
CONSOLIDATED BALANCE SHEETS
| | | | | | | | |
| | | December 31, | |
| | | 2009 | | | 2008 | |
| | | (In Thousands, Except Share Data) | |
| ASSETS | |
Cash and due from banks | | $ | 6,564 | | | $ | 6,278 | |
Interest-bearing demand deposits | | | 351 | | | | 586 | |
Federal funds sold | | | 1,718 | | | | — | |
| | | | | | | | |
Cash and Cash Equivalents | | | 8,633 | | | | 6,864 | |
Time certificates of deposit | | | 396 | | | | 396 | |
Securities available for sale | | | 81,437 | | | | 66,376 | |
Securities held to maturity, fair value 2009 $29,715; 2008 $23,248 | | | 30,204 | | | | 24,127 | |
Loans, net of allowance for loan losses 2009 $2,830; 2008 $1,633 | | | 216,600 | | | | 212,377 | |
Premises and equipment, net | | | 6,175 | | | | 6,397 | |
Restricted investment in bank stocks | | | 2,661 | | | | 2,661 | |
Investment in life insurance | | | 5,109 | | | | 4,933 | |
Other assets | | | 4,621 | | | | 2,583 | |
| | | | | | | | |
Total Assets | | $ | 355,836 | | | $ | 326,714 | |
| | | | | | | | |
| LIABILITIESAND SHAREHOLDERS’ EQUITY | |
| LIABILITIES | | | | | | | | |
Deposits: | | | | | | | | |
Non-interest bearing | | $ | 27,952 | | | $ | 29,192 | |
Interest-bearing | | | 268,507 | | | | 233,414 | |
| | | | | | | | |
Total Deposits | | | 296,459 | | | | 262,606 | |
Short-term borrowings | | | 4,512 | | | | 10,613 | |
Long-term debt | | | 22,000 | | | | 22,000 | |
Junior subordinated debt | | | 5,155 | | | | 5,155 | |
Other liabilities | | | 2,352 | | | | 2,927 | |
| | | | | | | | |
Total Liabilities | | | 330,478 | | | | 303,301 | |
| | | | | | | | |
| SHAREHOLDERS’ EQUITY | | | | | | | | |
Preferred stock, without par value; 10,000,000 shares authorized and unissued | | | — | | | | — | |
Common stock, $5 par value; 10,000,000 shares authorized; Shares issued, 2009 – 1,404,348; 2008 – 1,401,918 Shares outstanding, 2009 – 1,400,697; 2008 – 1,399,868 | | | 7,022 | | | | 7,010 | |
Capital in excess of par value | | | 350 | | | | 293 | |
Retained earnings | | | 16,820 | | | | 15,406 | |
Treasury stock, at cost 2009 – 3,651 shares; 2008 – 2,050 shares | | | (110 | ) | | | (62 | ) |
Accumulated other comprehensive income | | | 1,276 | | | | 766 | |
| | | | | | | | |
Total Shareholders’ Equity | | | 25,358 | | | | 23,413 | |
| | | | | | | | |
Total Liabilities and Shareholders’ Equity | | $ | 355,836 | | | $ | 326,714 | |
| | | | | | | | |
| | | | |
| See notes to consolidated financial statements | | 8 | | |
FIRST COMMUNITY FINANCIAL CORPORATION
CONSOLIDATED STATEMENTSOF INCOME
| | | | | | |
| | | Years Ended December, 31, |
| | | 2009 | | 2008 |
| | | (In Thousands, Except per Share Data) |
| INTEREST INCOME | | | | | | |
Loans, including fees | | $ | 14,143 | | $ | 13,942 |
Securities: | | | | | | |
Taxable | | | 3,149 | | | 3,414 |
Tax exempt | | | 1,158 | | | 866 |
Other | | | 54 | | | 186 |
| | | | | | |
Total Interest Income | | | 18,504 | | | 18,408 |
| | | | | | |
| INTEREST EXPENSE | | | | | | |
Deposits | | | 7,494 | | | 7,851 |
Short-term borrowings | | | 50 | | | 169 |
Long-term debt | | | 1,239 | | | 1,384 |
| | | | | | |
Total Interest Expense | | | 8,783 | | | 9,404 |
| | | | | | |
Net Interest Income | | | 9,721 | | | 9,004 |
PROVISIONFOR LOAN LOSSES | | | 1,237 | | | 365 |
| | | | | | |
Net Interest Income after Provision for Loan Losses | | | 8,484 | | | 8,639 |
| | | | | | |
| OTHER INCOME | | | | | | |
Service charges on deposits | | | 828 | | | 880 |
Fiduciary activities | | | 524 | | | 405 |
Earnings on investment in life insurance | | | 223 | | | 211 |
ATM and debit card fees | | | 572 | | | 545 |
Investment securities gains from sales | | | 459 | | | — |
Realized gains on sales of foreclosed real estate | | | 33 | | | — |
Other | | | 316 | | | 255 |
| | | | | | |
Total Other Income | | | 2,955 | | | 2,296 |
| | | | | | |
| OTHER EXPENSES | | | | | | |
Employee compensation and benefits | | | 4,218 | | | 3,971 |
Net occupancy and equipment | | | 1,152 | | | 1,192 |
Professional fees | | | 429 | | | 352 |
Director and advisory boards compensation | | | 337 | | | 371 |
ATM expenses | | | 406 | | | 364 |
Supplies and postage | | | 310 | | | 280 |
FDIC/OCC expense | | | 756 | | | 212 |
Pennsylvania bank shares tax | | | 230 | | | 242 |
Other operating | | | 959 | | | 994 |
| | | | | | |
Total Other Expenses | | | 8,797 | | | 7,978 |
| | | | | | |
Income before Income Taxes | | | 2,642 | | | 2,957 |
PROVISIONFOR INCOME TAXES | | | 416 | | | 621 |
| | | | | | |
Net Income | | $ | 2,226 | | $ | 2,336 |
| | | | | | |
BASIC EARNINGSPER SHARE | | $ | 1.59 | | $ | 1.67 |
| | | | | | |
DIVIDENDSPER SHARE | | $ | 0.58 | | $ | 0.52 |
| | | | | | |
| | | | |
| See notes to consolidated financial statements | | 9 | | |
FIRST COMMUNITY FINANCIAL CORPORATION
CONSOLIDATED STATEMENTSOF SHAREHOLDERS’ EQUITY
| | | | | | | | | | | | | | | | | | | | | |
| | | Common
Stock | | Capital In
Excess of
Par Value | | Retained
Earnings | | | Treasury
Stock | | | Accumulated
Other
Comprehensive
Income | | Total | |
| | | | | (In Thousands, Except per Share Data) | | | |
BALANCE—JANUARY 1, 2008 | | $ | 7,000 | | $ | 245 | | $ | 13,993 | | | $ | — | | | $ | 295 | | $ | 21,533 | |
Cumulative effect adjustment upon change in accounting principle | | | | | | | | | (195 | ) | | | | | | | | | | (195 | ) |
Comprehensive income: | | | | | | | | | | | | | | | | | | | | | |
Net income | | | | | | | | | 2,336 | | | | | | | | | | | 2,336 | |
Change in net unrealized gains on securities available for sale, net of deferred income taxes | | | | | | | | | | | | | | | | | 471 | | | 471 | |
| | | | | | | | | | | | | | | | | | | | | |
Total comprehensive income | | | | | | | | | | | | | | | | | | | | 2,807 | |
| | | | | | | | | | | | | | | | | | | | | |
Issuance of stock in connection with dividend reinvestment plan 1,918 shares | | | 10 | | | 48 | | | | | | | | | | | | | | 58 | |
Treasury stock acquired – 2,050 shares | | | | | | | | | | | | | (62 | ) | | | | | | (62 | ) |
Cash dividends, $0.52 per share | | | | | | | | | (728 | ) | | | | | | | | | | (728 | ) |
| | | | | | | | | | | | | | | | | | | | | |
BALANCE, DECEMBER 31, 2008 | | $ | 7,010 | | $ | 293 | | $ | 15,406 | | | $ | (62 | ) | | $ | 766 | | $ | 23,413 | |
Comprehensive income: | | | | | | | | | | | | | | | | | | | | | |
Net income | | | | | | | | | 2,226 | | | | | | | | | | | 2,226 | |
Change in net unrealized gains on securities available for sale, net of deferred income taxes | | | | | | | | | | | | | | | | | 510 | | | 510 | |
| | | | | | | | | | | | | | | | | | | | | |
Total comprehensive income | | | | | | | | | | | | | | | | | | | | 2,736 | |
| | | | | | | | | | | | | | | | | | | | | |
Issuance of stock in connection with dividend reinvestment plan 2,430 shares | | | 12 | | | 57 | | | | | | | | | | | | | | 69 | |
Treasury stock acquired – 1,601 shares | | | | | | | | | | | | | (48 | ) | | | | | | (48 | ) |
Cash dividends, $0.58 per share | | | | | | | | | (812 | ) | | | | | | | | | | (812 | ) |
| | | | | | | | | | | | | | | | | | | | | |
BALANCE, DECEMBER 31, 2009 | | $ | 7,022 | | $ | 350 | | $ | 16,820 | | | $ | (110 | ) | | $ | 1,276 | | $ | 25,358 | |
| | | | | | | | | | | | | | | | | | | | | |
| | | | |
| See notes to consolidated financial statements | | 10 | | |
FIRST COMMUNITY FINANCIAL CORPORATION
CONSOLIDATED STATEMENTSOF CASH FLOWS
| | | | | | | | |
| | | Years Ended
December 31, | |
| | | 2009 | | | 2008 | |
| | | (In Thousands) | |
| CASH FLOWSFROM OPERATING ACTIVITIES | | | | | | | | |
Net income | | $ | 2,226 | | | $ | 2,336 | |
Adjustments to reconcile net income to net cash provided by operating activities: | | | | | | | | |
Depreciation of premises and equipment | | | 527 | | | | 559 | |
Amortization of intangible assets | | | 17 | | | | 17 | |
Net accretion of investment securities | | | (113 | ) | | | (271 | ) |
Earnings on investment in life insurance | | | (223 | ) | | | (211 | ) |
Realized gains on securities | | | (459 | ) | | | — | |
Realized gains on sales of foreclosed real estate | | | (33 | ) | | | — | |
Provision for loan losses | | | 1,237 | | | | 365 | |
Deferred income taxes | | | (446 | ) | | | (227 | ) |
Increase in accrued interest receivable and other assets | | | (1,867 | ) | | | (241 | ) |
Increase (decrease) in accrued interest payable and other liabilities | | | (405 | ) | | | 491 | |
| | | | | | | | |
Net Cash Provided by Operating Activities | | | 461 | | | | 2,818 | |
| | | | | | | | |
| CASH FLOWSFROM INVESTING ACTIVITIES | | | | | | | | |
Securities available for sale: | | | | | | | | |
Proceeds from maturities, calls and principal repayments | | | 23,005 | | | | 18,292 | |
Proceeds from sales | | | 8,981 | | | | — | |
Purchases | | | (46,101 | ) | | | (20,643 | ) |
Securities held to maturity: | | | | | | | | |
Proceeds from maturities, calls and principal repayments | | | 3,886 | | | | 2,670 | |
Purchases | | | (9,570 | ) | | | (5,275 | ) |
Net increase in loans | | | (5,703 | ) | | | (21,517 | ) |
Decrease in time certificates of deposit | | | — | | | | 198 | |
Purchases of premises and equipment | | | (305 | ) | | | (186 | ) |
Proceeds from sale of foreclosed real estate | | | 154 | | | | — | |
Net purchases of restricted investment in bank stocks | | | — | | | | (696 | ) |
| | | | | | | | |
Net Cash Used in Investing Activities | | | (25,653 | ) | | | (27,157 | ) |
| | | | | | | | |
| CASH FLOWSFROM FINANCING ACTIVITIES | | | | | | | | |
Net increase in deposits | | | 33,853 | | | | 17,560 | |
Net increase (decrease) in short-term borrowings | | | (6,101 | ) | | | 293 | |
Proceeds from long-term debt | | | — | | | | 5,000 | |
Repayment of long-term debt | | | — | | | | (1,000 | ) |
Proceeds from issuance of common stock | | | 69 | | | | 58 | |
Acquisition of treasury stock | | | (48 | ) | | | (62 | ) |
Cash dividends paid | | | (812 | ) | | | (728 | ) |
| | | | | | | | |
Net Cash Provided by Financing Activities | | | 26,961 | | | | 21,121 | |
| | | | | | | | |
Net Increase (Decrease) in Cash and Cash Equivalents | | | 1,769 | | | | (3,218 | ) |
CASHAND CASH EQUIVALENTS—BEGINNING | | | 6,864 | | | | 10,082 | |
| | | | | | | | |
CASHAND CASH EQUIVALENTS—ENDING | | $ | 8,633 | | | $ | 6,864 | |
| | | | | | | | |
| SUPPLEMENTARY CASH FLOWS INFORMATION | | | | | | | | |
Interest paid | | $ | 8,910 | | | $ | 9,401 | |
| | | | | | | | |
Income taxes paid | | $ | 1,002 | | | $ | 732 | |
| | | | | | | | |
Non-cash investing activities | | | | | | | | |
Transfers from loans to foreclosed real estate | | $ | 243 | | | $ | — | |
| | | | | | | | |
| | | | |
| See notes to consolidated financial statements | | 11 | | |
FIRST COMMUNITY FINANCIAL CORPORATION
NOTESTO CONSOLIDATED FINANCIAL STATEMENTS
NOTE 1—SIGNIFICANT ACCOUNTING POLICIES
First Community Financial Corporation (the Corporation) through its wholly-owned subsidiary, The First National Bank of Mifflintown (the Bank), provides loan, deposit, trust and other related financial services through eleven full service banking offices in Juniata and Perry Counties of Pennsylvania. The Corporation’s other subsidiary, First Community Financial Capital Trust I (the Trust), was established during December 2003 for the purpose of issuing $5,000,000 of trust preferred securities. The Corporation is subject to regulation and supervision by the Federal Reserve Board and the Bank is subject to regulation and supervision by the Office of the Comptroller of the Currency.
Basis of Presentation
The Corporation’s consolidated financial statements include the accounts of the Corporation and the Bank. All significant intercompany accounts and transactions have been eliminated.
Subsequent Events
The Corporation has evaluated events and transactions occurring subsequent to the balance sheet date of December 31, 2009, for items that should potentially be recognized or disclosed in these financial statements. The evaluation was conducted through the date these financial statements were issued.
Estimates
The preparation of financial statements in conformity with accounting principles generally accepted in the United States of America requires management to make estimates and assumptions that affect the reported amounts of assets and liabilities and disclosure of contingent assets and liabilities as of the balance sheet dates, and the reported amounts of income and expenses for the years then ended. Actual results could differ from those estimates. The material estimates that are particularly susceptible to significant change are the determination of the allowance for loan losses and the evaluation of other-than-temporary impairment of securities.
Assets held by the Trust Department in an agency or fiduciary capacity for its customers are excluded from the financial statements since they do not constitute assets of the Corporation. The market value of assets held by the Trust Department amounted to $112,767,000 and $107,626,000 at December 31, 2009 and 2008, respectively. Income from fiduciary activities is recognized on the accrual method.
Significant Group Concentrations of Credit Risk
Most of the Corporation’s activities are with customers located within the Central Pennsylvania region. Note 3 discusses the types of securities that the Corporation invests in. Note 4 discusses the types of lending that the Corporation engages in. The Corporation does not have any significant concentrations in any one industry or customer.
Cash and Cash Equivalents
Cash and cash equivalents includes cash and due from banks, interest bearing demand deposits, federal funds sold and investments with an original maturity of 90 days or less. Federal funds are typically purchased and sold for one day periods. At times, the Corporation may have due from bank balances with its correspondent banks that exceed the federally insured limits.
FIRST COMMUNITY FINANCIAL CORPORATION
NOTESTO CONSOLIDATED FINANCIAL STATEMENTS
NOTE 1—SIGNIFICANT ACCOUNTING POLICIES (CONTINUED)
Securities
Management determines the appropriate classification of debt securities at the time of purchase and re-evaluates such designation as of each balance sheet date. Securities available for sale are those securities that the Corporation intends to hold for an indefinite period of time, but not necessarily to maturity. Any decision to sell an available for sale security would be based on various factors. These securities are stated at fair value. Unrealized gains (losses) are reported as changes in other comprehensive income, a component of shareholders’ equity, net of the related deferred tax effect. Premiums and discounts are recognized as interest income over the estimated lives of the securities, using the interest method. Securities held to maturity are those securities that the Corporation has the intent and ability to hold to maturity. These securities are stated at cost adjusted for amortization of premiums and accretion of discounts, which is recognized as interest income over their estimated lives, using the interest method. Gains and losses on the sale of securities are recorded on the trade date and are determined using the specific identification method.
Effective April 1, 2009, the Corporation adopted new accounting guidance related to recognition and presentation of other-than-temporary impairment (FASB ASC 320-10). This recent accounting guidance amends the recognition guidance for other-than-temporary impairments of debt securities and expands the financial statement disclosures for other-than-temporary impairment losses on debt and equity securities. The recent guidance replaced the “intent and ability” indication in current guidance by specifying that (a) if a company does not have the intent to sell a security prior to recovery and (b) it is more likely than not that it will not have to sell the security prior to recovery, the security would not be considered other-than-temporarily impaired unless there is a credit loss. When an entity does not intend to sell the security, and it is more likely than not, the entity will not have to sell the security before the recovery of its cost basis, it will recognize the credit component of an other-than-temporary impairment of a debt security in earnings and the remaining portion in other comprehensive income. For held-to-maturity debt securities, the amount of an other-than-temporary impairment recorded in other comprehensive income for the noncredit portion of a previous other-than-temporary impairment should be amortized prospectively over the remaining life of the security on the basis of the timing of future estimated cash flows of the security. The adoption of this standard did not have a material impact on the Corporation’s consolidated financial statements.
Prior to the adoption of the recent accounting guidance on April 1, 2009, management considered, in determining whether other-than-temporary impairment exists, (1) the length of time and the extent to which the fair value has been less than cost, (2) the financial condition and near-term prospects of the issuer, and (3) the intent and ability of the Corporation to retain its investment in the issuer for a period of time sufficient to allow for any anticipated recovery in fair value.
Management evaluates equity securities for other-than-temporary impairment at least on a quarterly basis, and more frequently when economic or market concerns warrant such evaluation. Consideration is given to (1) the length of time and the extent to which the fair value has been less than cost, (2) the financial condition and near-term prospects of the issuer, and (3) for equity securities, the intent and ability of the Corporation to retain its investment in the issuer for a period of time sufficient to allow for any anticipated recovery in fair value.
Time Certificates of Deposit
Time certificates of deposit are carried at cost, which approximates fair value.
FIRST COMMUNITY FINANCIAL CORPORATION
NOTESTO CONSOLIDATED FINANCIAL STATEMENTS
NOTE 1—SIGNIFICANT ACCOUNTING POLICIES (CONTINUED)
Loans
Loans that management has the intent and ability to hold for the foreseeable future or until maturity or payoff are stated at their outstanding unpaid principal balances, net of an allowance for loan losses and any deferred fees or costs. Interest income is accrued on the unpaid principal balance. Loan origination fees, net of related costs, are deferred and recognized as an adjustment of the yield (interest income) of the related loans. The Corporation is generally amortizing these amounts over the contractual life of the loan.
The accrual of interest is generally discontinued when the contractual payment of principal or interest has become 90 to 120 days past due or management has serious doubts about further collectibility of principal or interest, even though the loan is currently performing. A loan may remain on accrual status if it is in the process of collection and is either guaranteed or well secured. When a loan is placed on non-accrual status, unpaid interest credited to income in the current year is reversed and unpaid interest accrued in prior years is charged against the allowance for loan losses. Interest received on non-accrual loans generally is either applied against principal or reported as interest income, according to management’s judgment as to the collectibility of principal. Generally, loans are restored to accrual status when the obligation is brought current, has performed in accordance with the contractual terms for a reasonable period of time and the ultimate collectibility of the total contractual principal and interest is no longer in doubt.
Allowance for Loan Losses
The allowance for loan losses is established through provisions for loan losses charged against income. Loans deemed to be uncollectible are charged against the allowance for loan losses, and subsequent recoveries, if any, are credited to the allowance.
The allowance for loan losses is maintained at a level considered adequate to provide for losses that can be reasonably anticipated. Management’s periodic evaluation of the adequacy of the allowance is based on the Corporation’s past loan loss experience, known and inherent risks in the portfolio, adverse situations that may affect the borrower’s ability to repay, the estimated value of any underlying collateral, composition of the loan portfolio, current economic conditions and other relevant factors. This evaluation is inherently subjective as it requires material estimates that may be susceptible to significant change, including the amounts and timing of future cash flows expected to be received on impaired loans.
The allowance consists of specific, general and unallocated components. The specific component relates to loans that are classified as impaired. For such loans, an allowance is established when the discounted cash flows (or collateral value or observable market price) of the impaired loan is lower than the carrying value for that loan. The general component covers non-classified loans and is based on historical loss experience adjusted for qualitative factors. An unallocated component is maintained to cover uncertainties that could affect management’s estimate of probable losses. The unallocated component of the allowance reflects the margin of imprecision inherent in the underlying assumptions used in the methodologies for estimating specific and general losses in the portfolio.
A loan is considered impaired when, based on current information and events, it is probable that the Corporation will be unable to collect the scheduled payments of principal or interest when due according to the contractual terms of the loan agreement. Factors considered by management in determining impairment include payment status, collateral value and the probability of collecting scheduled principal and interest payments when due. Loans that experience insignificant payment delays and payment shortfalls generally are not classified as impaired. Management determines the
FIRST COMMUNITY FINANCIAL CORPORATION
NOTESTO CONSOLIDATED FINANCIAL STATEMENTS
NOTE 1—SIGNIFICANT ACCOUNTING POLICIES (CONTINUED)
Allowance for Loan Losses (Continued)
significance of payment delays and payment shortfalls on a case-by-case basis, taking into consideration all of the circumstances surrounding the loan and the borrower, including the length of the delay, the reasons for the delay, the borrower’s prior payment record and the amount of the shortfall in relation to the principal and interest owed. Impairment is measured on a loan by loan basis for commercial, financial and agricultural loans by either the present value of expected future cash flows discounted at the loan’s effective interest rate, the loan’s obtainable market price or the fair value of the collateral if the loan is collateral dependent.
Large groups of smaller balance homogeneous loans are collectively evaluated for impairment. Accordingly, the Corporation does not separately identify individual installment and residential loans for impairment disclosures unless such loans are the subject of a restructuring agreement.
Restricted Investment in Bank Stocks
Restricted investment in bank stocks represents required investments in the common stock of correspondent banks, consisting of the Federal Reserve Bank of Philadelphia in the amount of $258,500, Atlantic Central Bankers Bank in the amount of $20,000, and the Federal Home Loan Bank (FHLB) of Pittsburgh in the amount of $2,382,100. These restricted investments are carried at cost. In December 2008, the FHLB of Pittsburgh notified member banks that it was suspending dividend payments and the repurchase of capital stock.
Management evaluates the restricted stock for impairment in accordance with FASB ASC Topic 942,Financial Services – Depository and Lending. Management’s determination of whether these investments are impaired is based on their assessment of the ultimate recoverability of their cost rather than by recognizing temporary declines in value. The determination of whether a decline affects the ultimate recoverability of their cost is influenced by criteria such as (1) the significance of the decline in net assets of the FHLB as compared to the capital stock amount for the FHLB and the length of time this situation has persisted, (2) commitments by the FHLB to make payments required by law or regulation and the level of such payments in relation to the operating performance of the FHLB, and (3) the impact of legislative and regulatory changes on institutions and, accordingly, on the customer base of the FHLB.
Management believes no impairment charge is necessary related to its restricted stock as of December 31, 2009.
Premises and Equipment
Premises and equipment are stated at cost less accumulated depreciation computed on the straight-line method over the estimated useful lives of the assets. Leasehold improvements are depreciated over the shorter of the estimated useful lives or the lease terms. Maintenance and repairs are expensed when incurred and expenditures for significant improvements are capitalized.
Foreclosed Real Estate
Foreclosed real estate includes assets acquired through foreclosure and loans identified as in-substance foreclosures. A loan is classified as in-substance foreclosure when the Corporation has taken possession of the collateral regardless of whether formal foreclosure proceedings have taken place. Foreclosed real estate is initially valued at its estimated fair market value, net of selling costs, at the time of foreclosure. Subsequent to foreclosure, valuations are periodically performed by
FIRST COMMUNITY FINANCIAL CORPORATION
NOTESTO CONSOLIDATED FINANCIAL STATEMENTS
NOTE 1—SIGNIFICANT ACCOUNTING POLICIES (CONTINUED)
Foreclosed Real Estate (Continued)
management and the foreclosed assets are carried at the lower of carrying amount or fair value less cost to sell. Gains and losses resulting from the sale or write-down of foreclosed real estate are recorded in other income, and revenues and expenses from operations and any changes in the valuation allowance are included in noninterest expense. Foreclosed real estate, which is included in other assets, amounted to $122,000 at December 31, 2009 and $0 in 2008.
Transfers of Financial Assets
Transfers of financial assets are accounted for as sales, when control over the assets has been surrendered. Control over transferred assets is deemed to be surrendered when (1) the assets have been isolated from the Corporation, (2) the transferee obtains the right (free of conditions that constrain it from taking advantage of that right) to pledge or exchange the transferred assets, and (3) the Corporation does not maintain effective control over the transferred assets through an agreement to repurchase them before their maturity.
Advertising Costs
The Corporation charges the costs of advertising to expense as incurred. Advertising expense was $99,000 and $109,000 for the years ended December 31, 2009 and 2008, respectively.
Income Taxes
Deferred income taxes are provided on the liability method whereby deferred tax assets are recognized for deductible temporary differences and deferred tax liabilities are recognized for taxable temporary differences. Temporary differences are the differences between the reported amounts of assets and liabilities and their tax basis. Deferred tax assets are reduced by a valuation allowance, when in the opinion of management, it is more likely than not that some portion or all the deferred tax assets will not be realized. Deferred tax assets and liabilities are adjusted through the provision for income taxes for the effects of changes in tax laws and rates on the date of enactment.
Earnings per Share
The Corporation has a simple capital structure. Basic earnings per share represents net income divided by the weighted average number of common shares outstanding during the period. The weighted average number of common shares outstanding was 1,399,459 and 1,399,998 for the years ended 2009 and 2008.
Segment Reporting
Management does not separately allocate expenses, including the cost of funding loan demand, between the commercial, retail, trust and other operations of the Corporation. As such, discrete financial information is not available and segment reporting would not be meaningful.
Comprehensive Income
Accounting principles generally accepted in the United States of America generally require that recognized revenue, expenses, gains and losses be included in net income. Changes in certain assets and liabilities, such as unrealized gains (losses) on securities available for sale, are reported as a separate component of the equity section of the balance sheet. Such items, along with net income, are components of comprehensive income.
FIRST COMMUNITY FINANCIAL CORPORATION
NOTESTO CONSOLIDATED FINANCIAL STATEMENTS
NOTE 1—SIGNIFICANT ACCOUNTING POLICIES (CONTINUED)
Comprehensive Income (Continued)
The components of other comprehensive income and the related tax effects are as follows:
| | | | | | | | |
| | | Years Ended
December 31, | |
| | | 2008 | | | 2009 | |
| | | (In Thousands) | |
Unrealized holding gains on available for sale securities | | $ | 1,226 | | | $ | 708 | |
Reclassification adjustment for gains realized in net income | | | (459 | ) | | | — | |
| | | | | | | | |
Net Unrealized Gains | | | 767 | | | | 708 | |
Tax effect | | | (257 | ) | | | (237 | ) |
| | | | | | | | |
Net of Tax Amount | | $ | 510 | | | $ | 471 | |
| | | | | | | | |
Off Balance Sheet Financial Instruments
In the ordinary course of business, the Corporation has entered into off balance sheet financial instruments consisting of commitments to extend credit and standby letters of credit. Such financial instruments are recorded in the financial statements when they become payable.
New and Recently Adopted Accounting Pronouncements
In June 2009, the Financial Accounting Standards Board (“FASB”) issued Statement of Financial Accounting Standards (“SFAS”) No. 168, “The FASB Accounting Standards Codification” and the Hierarchy of Generally Accepted Accounting Principles – a replacement of FASB Statement No. 162,” (“SFAS 168”). SFAS 168 establishes the FASB Accounting Standards Codification (“Codification”) as the source of authoritative generally accepted accounting principles (“GAAP”) for nongovernmental entities. The Codification does not change GAAP. Instead, it takes the thousands of individual pronouncements that currently comprise GAAP and reorganizes them into approximately 90 accounting Topics, and displays all Topics using a consistent structure. Contents in each Topic are further organized first by Subtopic, then Section and finally Paragraph. The Paragraph level is the only level that contains substantive content. Citing particular content in the Codification involves specifying the unique numeric path to the content through the Topic, Subtopic, Section and Paragraph structure. FASB suggests that all citations begin with “FASB ASC,” where ASC stands forAccounting Standards Codification. Changes to the ASC subsequent to June 30, 2009 are referred to as Accounting Standards Updates (“ASU”).
In conjunction with the issuance of SFAS 168, the FASB also issued its first Accounting Standards Update No. 2009-1, “Topic 105 – Generally Accepted Accounting Principles” (“ASU 2009-1”) which includes SFAS 168 in its entirety as a transition to the ASC. ASU 2009-1 was effective for interim and annual periods ending after September 15, 2009 and did not have an impact on the Corporation’s financial position or results of operations but did change the referencing system for accounting standards.
In May 2009, FAS issued Statement No. 165,Subsequent Events,(codified within ASC 855). It requires the disclosure of the date through which an entity has evaluated subsequent events and the basis for that date, that is, whether that date represents the date the financial statements were issued.
FIRST COMMUNITY FINANCIAL CORPORATION
NOTESTO CONSOLIDATED FINANCIAL STATEMENTS
NOTE 1 – SIGNIFICANT ACCOUNTING POLICIES (CONTINUED)
New and Recently Adopted Accounting Pronouncements (Continued)
This disclosure should alert all users of financial statements that an entity has not evaluated subsequent events after that date in the set of financial statements being presented. This statement should not result in significant changes in the subsequent events that an entity reports – either through recognition or disclosure – in its financial statements.
In accordance with this statement, an entity should apply the requirements to the interim or annual financial periods ending after June 15, 2009.
In August 2009, the FASB issued ASU 2009-05,Fair Value Measurements and Disclosures (Topic 820): Measuring Liabilities at Fair Value.The amendments within ASU 2009-05 clarify that in circumstances in which a quoted price in an active market for the identical liability is not available, a reporting entity is required to measure fair value using one or more of the following techniques:
A valuation technique that uses:
a. The quoted price of the identical liability when traded as an asset.
b. Quoted prices for similar liabilities or similar liabilities when traded as assets.
Another valuation technique that is consistent with the principles of Topic 820.
Two examples would be an income approach, such as a present value technique, or a market approach, such as a technique that is based on the amount at the measurement date that the reporting entity would pay to transfer the identical liability or would receive to enter into the identical liability.
When estimating the fair value of a liability, a reporting entity is not required to include a separate input or adjustment to other inputs relating to the existence of a restriction that prevents the transfer of the liability.
Both a quoted price in an active market for the identical liability at the measurement date and the quoted price for the identical liability when traded as an asset in an active market when no adjustments to the quoted price of the asset are required are Level 1 fair value measurements.
This guidance was effective for the first reporting period (including interim periods) beginning after issuance. The adoption of this guidance did not have a material impact on the Corporation’s financial statements.
In November 2008, the SEC released a proposed roadmap regarding the potential use by U.S. issuers of financial statements prepared in accordance with International Financial Reporting Standards (IFRS). IFRS is a comprehensive series of accounting standards published by the International Accounting Standards Board (“IASB”). Under the proposed roadmap, the Corporation may be required to prepare financial statements in accordance with IFRS as early as 2014. The SEC is currently required to make a determination in 2011 regarding the mandatory adoption of IFRS. The Corporation is currently assessing the impact that this potential change would have on its consolidated financial statements, and it will continue to monitor the development of the potential implementation of IFRS.
FIRST COMMUNITY FINANCIAL CORPORATION
NOTESTO CONSOLIDATED FINANCIAL STATEMENTS
NOTE 2—RESTRICTIONSON CASHAND DUEFROM BANKS
In return for services obtained through correspondent banks, the Corporation is required to maintain non-interest bearing cash balances in those correspondent banks. At December 31, 2009 and 2008, compensating balances approximated $1,779,000 and $1,676,000, respectively. During 2009 average required balances totaled $1,833,000 and during 2008 totaled $1,508,000.
NOTE 3—SECURITIES
Amortized cost and fair value at December 31 were as follows:
| | | | | | | | | | | | | |
| | | Amortized
Cost | | Gross
Unrealized
Gains | | Gross
Unrealized
Losses | | | Fair
Value |
| | | (In Thousands) |
SECURITIES AVAILABLEFOR SALE: | | | | | | | | | | | | | |
December 31, 2009: | | | | | | | | | | | | | |
U.S. Government agencies | | $ | 12,195 | | $ | 74 | | $ | (38 | ) | | $ | 12,231 |
Mortgage-backed securities | | | 66,619 | | | 1,687 | | | (72 | ) | | | 68,234 |
Equity securities | | | 661 | | | 311 | | | — | | | | 972 |
| | | | | | | | | | | | | |
| | $ | 79,475 | | $ | 2,072 | | $ | (110 | ) | | $ | 81,437 |
| | | | | | | | | | | | | |
December 31, 2008: | | | | | | | | | | | | | |
U.S. Government agencies | | $ | 6,590 | | $ | 134 | | $ | — | | | $ | 6,724 |
Mortgage-backed securities | | | 58,084 | | | 883 | | | (205 | ) | | | 58,762 |
Equity securities | | | 507 | | | 387 | | | (4 | ) | | | 890 |
| | | | | | | | | | | | | |
| | $ | 65,181 | | $ | 1,404 | | $ | (209 | ) | | $ | 66,376 |
| | | | | | | | | | | | | |
| | | | |
| | | Amortized
Cost | | Gross
Unrealized
Gains | | Gross
Unrealized
Losses | | | Fair
Value |
| | | (In Thousands) |
SECURITIES HELDTO MATURITY: | | | | | | | | | | | | | |
December 31, 2009: | | | | | | | | | | | | | |
U.S. Government agencies | | $ | 250 | | $ | 11 | | $ | — | | | $ | 261 |
State and municipal securities | | | 29,954 | | | 374 | | | (874 | ) | | | 29,454 |
| | | | | | | | | | | | | |
| | $ | 30,204 | | $ | 385 | | $ | (874 | ) | | $ | 29,715 |
| | | | | | | | | | | | | |
FIRST COMMUNITY FINANCIAL CORPORATION
NOTESTO CONSOLIDATED FINANCIAL STATEMENTS
NOTE 3—SECURITIES (CONTINUED)
| | | | | | | | | | | | | |
| | | Amortized
Cost | | Gross
Unrealized
Gains | | Gross
Unrealized
Losses | | | Fair
Value |
| | | (In Thousands) |
December 31, 2008: | | | | | | | | | | | | | |
U.S. Government agencies | | $ | 250 | | $ | 17 | | $ | — | | | $ | 267 |
State and municipal securities | | | 23,877 | | | 186 | | | (1,082 | ) | | | 22,981 |
| | | | | | | | | | | | | |
| | $ | 24,127 | | $ | 203 | | $ | (1,082 | ) | | $ | 23,248 |
| | | | | | | | | | | | | |
The following table shows the Corporation’s investments’ gross unrealized losses and fair value, aggregated by investment category and length of time that individual securities have been in a continuous unrealized loss position, at December 31, 2009 and 2008:
| | | | | | | | | | | | | | | | | | |
| | | Less than 12 Months | | 12 Months or More | | Total |
| | | Fair
Value | | Unrealized
Losses | | Fair
Value | | Unrealized
Losses | | Fair
Value | | Unrealized
Losses |
| DECEMBER 31, 2009 | | (In Thousands) |
SECURITIES AVAILABLEFOR SALE: | | | | | | | | | | | | | | | | | | |
Mortgage-backed securities | | $ | 7,797 | | $ | 71 | | $ | 215 | | $ | 1 | | $ | 8,012 | | $ | 72 |
U. S. agency securities | | | 4,872 | | | 38 | | | — | | | — | | | 4,872 | | | 38 |
| | | | | | | | | | | | | | | | | | |
| | | 12,669 | | | 109 | | | 215 | | | 1 | | | 12,884 | | | 110 |
| | | | | | | | | | | | | | | | | | |
SECURITIES HELDTO MATURITY: | | | | | | | | | | | | | | | | | | |
State and municipal securities | | | 7,479 | | | 119 | | | 4,648 | | | 755 | | | 12,127 | | | 874 |
| | | | | | | | | | | | | | | | | | |
Total | | $ | 20,148 | | $ | 228 | | $ | 4,863 | | $ | 756 | | $ | 25,011 | | $ | 984 |
| | | | | | | | | | | | | | | | | | |
| | | |
| | | Less than 12 Months | | 12 Months or More | | Total |
| | | Fair
Value | | Unrealized
Losses | | Fair
Value | | Unrealized
Losses | | Fair
Value | | Unrealized
Losses |
| DECEMBER 31, 2008 | | (In Thousands) |
SECURITIES AVAILABLEFOR SALE: | | | | | | | | | | | | | | | | | | |
Mortgage-backed securities | | $ | 10,812 | | $ | 84 | | $ | 5,207 | | $ | 121 | | $ | 16,019 | | $ | 205 |
Equity securities | | | 16 | | | 4 | | | — | | | — | | | 16 | | | 4 |
| | | | | | | | | | | | | | | | | | |
| | | 10,828 | | | 88 | | | 5,207 | | | 121 | | | 16,035 | | | 209 |
| | | | | | | | | | | | | | | | | | |
FIRST COMMUNITY FINANCIAL CORPORATION
NOTESTO CONSOLIDATED FINANCIAL STATEMENTS
NOTE 3—SECURITIES (CONTINUED)
| | | | | | | | | | | | | | | | | | |
| | | Less than 12 Months | | 12 Months or More | | Total |
| | | Fair
Value | | Unrealized
Losses | | Fair
Value | | Unrealized
Losses | | Fair
Value | | Unrealized
Losses |
| DECEMBER 31, 2008 | | (In Thousands) |
SECURITIES HELDTO MATURITY: | | | | | | | | | | | | | | | | | | |
State and municipal securities | | | 11,408 | | | 818 | | | 1,025 | | | 264 | | | 12,433 | | | 1,082 |
| | | | | | | | | | | | | | | | | | |
Total | | $ | 22,236 | | $ | 906 | | $ | 6,232 | | $ | 385 | | $ | 28,468 | | $ | 1,291 |
| | | | | | | | | | | | | | | | | | |
Management evaluates equity securities for other-than-temporary impairment at least on a quarterly basis, and more frequently when economic or market concerns warrant such evaluation. Consideration is given to (1) the length of time and the extent to which the fair value has been less than cost, (2) the financial condition and near-term prospects of the issuer, and (3) for equity securities, the intent and ability of the Corporation to retain its investment in the issuer for a period of time sufficient to allow for any anticipated recovery in fair value.
Financial Accounting Standards Board (FASB) Accounting Standards Codification (ASC) Topic 320, Investments – Debt and Equity Securities, clarifies the interaction of the factors that should be considered when determining whether a debt security is other-than-temporarily impaired. For debt securities, management assesses whether (a) it has the intent to sell the security and (b) it is more likely than not that it will be required to sell the security prior to its anticipated recovery. These steps are done before assessing whether the entity will recover the cost basis of the investment. Previously, this assessment required management to assert it has both the intent and the ability to hold a security for a period of time sufficient to allow for an anticipated recovery in fair value to avoid recognizing an other-than-temporary impairment. This change does not affect the need to forecast recovery of the value of the security through either cash flows or market price.
In instances when a determination is made that an other-than-temporary impairment exists but the investor does not intend to sell the debt security and it is not more likely than not that it will be required to sell the debt security prior to its anticipated recovery, FASB Topic 320 changes the presentation and amount of the other-than-temporary impairment recognized in the income statement. The other-than-temporary impairment is separated into (a) the amount of the total other-than-temporary impairment related to a decrease in cash flows expected to be collected from the debt security (the credit loss) and (b) the amount of the total other-than-temporary impairment related to all other factors. The amount of the total other-than-temporary impairment related to the credit loss is recognized in earnings. The amount of the total other-than-temporary impairment related to all other factors is recognized in other comprehensive income. FASB ASC Topic 320 was effective for the Corporation for interim and annual reporting periods June 30, 2009 and after. The adoption of this FASB ASC Topic did not impact the Corporation’s financial condition or results of operations.
At December 31, 2009, 3 U. S. agency securities have unrealized losses. The aggregate depreciation from the Corporation’s amortized cost basis on these securities is 0.8%. In management’s opinion, these unrealized losses relate to changes in interest rates.
FIRST COMMUNITY FINANCIAL CORPORATION
NOTESTO CONSOLIDATED FINANCIAL STATEMENTS
NOTE 3—SECURITIES (CONTINUED)
At December 31, 2009, 19 mortgage-backed securities have unrealized losses. The aggregate depreciation from the Corporation’s amortized cost basis on these securities is 0.9%. In management’s opinion, these unrealized losses relate to changes in interest rates. The Corporation’s mortgage backed security portfolio consists of only government sponsored agencies, and contains no private label securities.
At December 31, 2009, 47 state and municipal securities have unrealized losses with aggregate depreciation of 6.7% from the Corporation’s amortized cost basis. In management’s opinion, these unrealized losses relate primarily to changes in interest rates. In analyzing the issuer’s financial condition, management considers the issuer’s bond rating as well as the financial performance of the respective municipality.
Management of the Corporation has determined none of the debt securities have declines that are deemed to be other-than-temporary.
During 2009, one equity security, a regional bank holding company, was deemed to be other-than-temporarily impaired and a $15,000 charge was recorded in the second quarter of 2009. This equity security had depreciated in fair value 70% during the last year, its dividend has been significantly reduced, and a near term recovery of value is not expected.
Amortized cost and fair value at December 31, 2009 by contractual maturity are shown below. Municipal securities with prerefunded issues are included in the category in which payment is expected to occur. Expected maturities will differ from contractual maturities because issuers may have the right to call or prepay with or without penalties.
| | | | | | | | | | | | |
| | | Available for Sale | | Held to Maturity |
| | | Amortized
Cost | | Fair
Value | | Amortized
Cost | | Fair
Value |
| | | (In Thousands) |
1 year or less | | $ | 3,365 | | $ | 3,385 | | $ | 1,102 | | $ | 1,121 |
Over 1 year through 5 years | | | 7,963 | | | 7,966 | | | 3,584 | | | 3,590 |
Over 5 years through 10 years | | | 867 | | | 880 | | | 13,731 | | | 13,789 |
Over 10 years | | | — | | | — | | | 11,787 | | | 11,215 |
Mortgage-backed securities | | | 66,619 | | | 68,234 | | | — | | | — |
Equity securities | | | 661 | | | 972 | | | — | | | — |
| | | | | | | | | | | | |
| | $ | 79,475 | | $ | 81,437 | | $ | 30,204 | | $ | 29,715 |
| | | | | | | | | | | | |
At December 31, 2009 and 2008, securities with a book value of $34,700,000 and $26,123,000, respectively, were pledged as collateral as required by law on public deposits and for other purposes.
FIRST COMMUNITY FINANCIAL CORPORATION
NOTESTO CONSOLIDATED FINANCIAL STATEMENTS
NOTE 4—LOANS
Loans at December 31 were as follows:
| | | | | | | | |
| | | 2009 | | | 2008 | |
| | | (In Thousands) | |
Commercial, financial and agricultural | | $ | 32,369 | | | $ | 22,944 | |
Real estate: | | | | | | | | |
Commercial | | | 37,842 | | | | 41,227 | |
Construction | | | 5,057 | | | | 5,730 | |
Residential | | | 139,055 | | | | 138,209 | |
Installment | | | 5,339 | | | | 6,159 | |
| | | | | | | | |
Total | | | 219,662 | | | | 214,269 | |
Allowance for loan losses | | | (2,830 | ) | | | (1,633 | ) |
Deferred loan fees and costs, net | | | (232 | ) | | | (259 | ) |
| | | | | | | | |
Loans | | $ | 216,600 | | | $ | 212,377 | |
| | | | | | | | |
The Bank grants commercial, residential and consumer loans to customers primarily within Juniata and Perry Counties of Pennsylvania and the surrounding area. A large portion of the loan portfolio is secured by real estate. Although the Bank has a diversified loan portfolio, its debtors’ ability to honor their contracts is influenced by the region’s economy.
The Corporation, in the ordinary course of business, has loan, deposit and other routine transactions with its officers, directors and principal shareholders and entities in which they have principal ownership. Loans are made to such customers at the same credit terms as other borrowers and do not represent more than the usual risk of collection. Changes during 2009 in these related party loans were as follows (in thousands):
| | | | |
Balance, beginning | | $ | 962 | |
Advances | | | 1,323 | |
Repayments | | | (1,457 | ) |
| | | | |
Balance, ending | | $ | 828 | |
| | | | |
Changes in the allowance for loan losses were as follows:
| | | | | | | | |
| | | 2009 | | | 2008 | |
| | | (In Thousands) | |
Balance, beginning | | $ | 1,633 | | | $ | 1,249 | |
Provision charged to operations | | | 1,237 | | | | 365 | |
Recoveries on charged off loans | | | 1 | | | | 28 | |
Loans charged off | | | (41 | ) | | | (9 | ) |
| | | | | | | | |
Balance, ending | | $ | 2,830 | | | $ | 1,633 | |
| | | | | | | | |
FIRST COMMUNITY FINANCIAL CORPORATION
NOTESTO CONSOLIDATED FINANCIAL STATEMENTS
NOTE 4—LOANS (CONTINUED)
The following is a summary of information pertaining to impaired and nonaccrual loans as of the years ended December 31:
| | | | | | |
| | | 2009 | | 2008 |
| | | (In Thousands) |
Impaired loans without a valuation allowance | | $ | 243 | | $ | 562 |
Impaired loans with a valuation allowance | | | 2,410 | | | 73 |
| | | | | | |
Total Impaired Loans | | $ | 2,653 | | $ | 635 |
| | | | | | |
Valuation allowance related to impaired loans | | $ | 1,016 | | $ | 36 |
| | | | | | |
Total nonaccrual loans | | $ | 4,254 | | $ | 2,623 |
| | | | | | |
Troubled debt restructurings | | $ | 2,305 | | $ | — |
| | | | | | |
Average investment in impaired loans | | $ | 1,924 | | $ | 718 |
| | | | | | |
Interest income recognized on impaired loans | | $ | 115 | | $ | 23 |
| | | | | | |
Interest earned but not accrued on nonaccrual loans | | $ | 143 | | $ | 91 |
| | | | | | |
No additional funds are committed to be advanced in connection with impaired loans, which includes troubled debt restructurings. Impaired loans include nonperforming loans and also include loans modified in troubled debt restructurings where concessions have been granted to borrowers experiencing financial difficulties. These concessions could include a reduction in the interest rate on the loan, payment extensions, forgiveness of principal, forbearance or other actions intended to maximize collection.
At December 31, 2009, the Corporation had a $2,305,000 commercial real estate loan that was modified in troubled debt restructurings. Subsequent to December 31, 2009, the Bank received additional information on the financial condition of this borrower and increased its provision for loan losses by $500,000 bringing the total reserve allocation for this credit to $1,000,000 as of December 31,2009. This is a loan to a manufacturer of supplies to the construction industry.
FIRST COMMUNITY FINANCIAL CORPORATION
NOTESTO CONSOLIDATED FINANCIAL STATEMENTS
NOTE 5—PREMISESAND EQUIPMENT
Premises and equipment at December 31 were as follows:
| | | | | | | | | | |
| | | Range of
Useful Lives | | 2009 | | | 2008 | |
| | | (in years) | | (In Thousands) | |
Land | | — | | $ | 741 | | | $ | 741 | |
Buildings and improvements | | 7 - 39 | | | 7,631 | | | | 7,627 | |
Furniture, equipment and software | | 3 - 20 | | | 4,630 | | | | 4,329 | |
| | | | | | | | | | |
| | | | | 13,002 | | | | 12,697 | |
Accumulated depreciation | | | | | (6,827 | ) | | | (6,300 | ) |
| | | | | | | | | | |
| | | | $ | 6,175 | | | $ | 6,397 | |
| | | | | | | | | | |
NOTE 6—DEPOSITS
Deposits were comprised of the following as of December 31:
| | | | | | |
| | | 2009 | | 2008 |
| | | (In Thousands) |
Non-interest bearing demand | | $ | 27,952 | | $ | 29,192 |
Interest bearing demand | | | 24,452 | | | 23,523 |
Savings | | | 67,886 | | | 24,129 |
Time deposits less than $100,000 | | | 123,193 | | | 132,260 |
Time deposits greater than $100,000 | | | 52,976 | | | 53,502 |
| | | | | | |
| | $ | 296,459 | | $ | 262,606 |
| | | | | | |
Scheduled maturities of time deposits at December 31, 2009 were as follows (in thousands):
| | | |
Years ending December 31: | | | |
2010 | | $ | 96,047 |
2011 | | | 41,207 |
2012 | | | 10,110 |
2013 | | | 25,073 |
2014 | | | 3,732 |
| | | |
| | $ | 176,169 |
| | | |
The following table sets forth maturity information on time deposits of $100,000 or more as of December 31, 2009 (in thousands):
| | | |
Three months or less | | $ | 8,808 |
Over three and through six months | | | 14,347 |
Over six and through twelve months | | | 5,598 |
Over twelve months | | | 24,223 |
| | | |
Total | | $ | 52,976 |
| | | |
FIRST COMMUNITY FINANCIAL CORPORATION
NOTESTO CONSOLIDATED FINANCIAL STATEMENTS
NOTE 7—BORROWINGS
Short-term borrowings at December 31 were as follows:
| | | | | | |
| | | 2009 | | 2008 |
| | | (In Thousands) |
Amount outstanding at end of year: | | | | | | |
Securities sold under agreements to repurchase | | $ | 4,415 | | $ | 4,189 |
Federal funds purchased | | | — | | | 324 |
Federal Home Loan Bank | | | — | | | 6,000 |
Treasury tax and loan note | | | 97 | | | 100 |
| | | | | | |
| | $ | 4,512 | | $ | 10,613 |
| | | | | | |
Securities sold under agreements to repurchase generally mature within one day from the transaction date. Securities with a carrying amount of $6,633,000 and $10,698,000 at December 31, 2009 and 2008, were pledged as collateral for these agreements. As of December 31, 2009, the interest rate on securities sold under agreements to repurchase was 1.14%. The securities underlying the agreements were under the Corporation’s control.
Long-term borrowings at December 31 were as follows:
| | | | | | |
| | | 2009 | | 2008 |
| | | (In Thousands) |
Convertible advances: | | | | | | |
Maturing in 2010 with an initial fixed rates ranging from 5.91% to 6.54%, with a weighted average rate of 6.23% at December 31, 2009 and 2008 | | $ | 6,000 | | $ | 6,000 |
Maturing in 2011 with an initial fixed rate of 4.98% | | | 1,000 | | | 1,000 |
Maturing in 2013 with an initial fixed rate of 3.11% | | | 5,000 | | | 5,000 |
Maturing in 2017 with initial fixed rates ranging from 4.30% to 4.60%, with a weighted average rate of 4.45% at December 31, 2009 and 2008. | | | 10,000 | | | 10,000 |
| | | | | | |
| | $ | 22,000 | | $ | 22,000 |
| | | | | | |
Convertible advances allow the FHLB the periodic option to convert to a LIBOR adjustable-rate advance after the specified fixed rate period has elapsed. At December 31, 2009, the FHLB has the option to convert advances to rates that range from three month LIBOR plus 0.07% to 0.13%, of which $17 million is eligible for the conversion option, but not exercised by the FHLB, at December 31, 2009. The remaining $5 million is not eligible for conversion until 2011. Upon the FHLB’s conversion option being exercised, the Bank has the option to repay the respective advance in full, without penalty.
The Corporation has a maximum borrowing capacity through the Federal Home Loan Bank of approximately $137,368,000, of which $115,368,000 was available at December 31, 2009. The borrowing capacity is collateralized by security agreements in certain residential real estate backed assets of the Corporation, including loans and investments.
The Corporation has issued $5,155,000 of floating rate junior subordinated deferrable interest debentures to a non-consolidated subsidiary trust, First Community Financial Capital Trust I (the Trust). The
FIRST COMMUNITY FINANCIAL CORPORATION
NOTESTO CONSOLIDATED FINANCIAL STATEMENTS
NOTE 7—BORROWINGS (CONTINUED)
Corporation owns all of the common equity of the Trust. The debentures held by the trust are the sole assets of the trust.
The Trust issued $5,000,000 of mandatorily redeemable preferred securities to third-party investors. The Corporation’s obligations under the debentures and related documents, taken together, constitute a full and unconditional guarantee by the Corporation of the Trust’s obligations under the preferred securities. The junior subordinated debt securities pay interest quarterly at 3-month LIBOR plus 3.00%, (3.28% at December 31, 2009). Pursuant to the debenture agreement, the Corporation can elect to defer payments of interest for up to 20 consecutive quarterly periods, provided there is no event of default as defined in the indenture. The Corporation has not deferred any quarterly interest payments through December 31, 2009. The preferred securities are redeemable quarterly by the Corporation at 100% of principal plus accrued interest on or after January 7, 2009. The preferred securities must be redeemed upon maturity of the debentures on January 7, 2034. The terms of the junior subordinated deferrable interest debentures match those of the preferred securities.
NOTE 8—OPERATING LEASES
The Corporation leases its Delaware (Juniata County) and Shermans Dale offices and the land on which its East Waterford office was constructed. The Corporation has an option through 2010 to purchase the land, for predetermined prices ranging from $105,000 up to $125,000. The Corporation also receives rental income for leasing of available space at its West Perry, Mifflintown and Loysville offices. Net lease expense was $7,000 in 2009 and $8,000 in 2008 after deducting rental expense of $62,000 and $63,000 respectively.
NOTE 9—INCOME TAXES
The components of income tax expense for the years ended December 31, 2009 and 2008 are as follows:
| | | | | | | | |
| | | 2009 | | | 2008 | |
| | | (In Thousands) | |
Federal: | | | | | | | | |
Current | | $ | 862 | | | $ | 848 | |
Deferred | | | (446 | ) | | | (227 | ) |
| | | | | | | | |
| | $ | 416 | | | $ | 621 | |
| | | | | | | | |
Reconciliations of the statutory federal income tax at a rate of 34% to the income tax expense reported in the consolidated statements of income for the years ended December 31, 2009 and 2008 are as follows:
| | | | | | |
| | | Percentage of Income
before Income Taxes | |
| | | 2009 | | | 2008 | |
Federal income tax at statutory rate | | 34.0 | % | | 34.0 | % |
Tax-exempt income | | (16.2 | ) | | (11.2 | ) |
Earnings on investment in life insurance | | (2.1 | ) | | (1.8 | ) |
| | | | | | |
| | 15.7 | % | | 21.0 | % |
| | | | | | |
FIRST COMMUNITY FINANCIAL CORPORATION
NOTESTO CONSOLIDATED FINANCIAL STATEMENTS
NOTE 9—INCOME TAXES (CONTINUED)
Components of deferred tax assets and liabilities at December 31 were as follows:
| | | | | | | | |
| | | 2009 | | | 2008 | |
| | | (In Thousands) | |
Deferred tax assets: | | | | | | | | |
Allowance for loan losses | | $ | 947 | | | $ | 548 | |
Nonaccrual loans interest | | | 49 | | | | 31 | |
Intangible assets | | | 9 | | | | 6 | |
Retirement liabilities | | | 506 | | | | 477 | |
State net operating loss carryforward | | | 119 | | | | 104 | |
| | | | | | | | |
Gross deferred tax asset | | | 1,630 | | | | 1,166 | |
Valuation allowance | | | (119 | ) | | | (104 | ) |
| | | | | | | | |
| | | 1,511 | | | | 1,062 | |
| | | | | | | | |
Deferred tax liabilities: | | | | | | | | |
Accumulated depreciation | | | 279 | | | | 271 | |
Available for sale securities | | | 686 | | | | 429 | |
Other | | | 20 | | | | 25 | |
| | | | | | | | |
| | | 985 | | | | 725 | |
| | | | | | | | |
Net Deferred Tax Assets | | $ | 526 | | | $ | 337 | |
| | | | | | | | |
The Corporation accounts for Income Taxes in accordance with income tax accounting guidance (FASB ASC 740,Income Taxes). On January 1, 2008, the Corporation adopted the recent accounting guidance related to accounting for uncertainty in income taxes, which sets out a consistent framework to determine the appropriate level of tax reserves to maintain for uncertain tax positions.
The income tax accounting guidance results in two components of income tax expense: current and deferred. Current income tax expense reflects taxes to be paid or refunded for the current period by applying the provisions of the enacted tax law to the taxable income or excess of deductions over revenue. The Corporation determines deferred income taxes using the liability (or balance sheet) method. Under this method, the net deferred tax asset or liability is based on the tax effects of the differences between the book and tax bases of assets and liabilities, and enacted changes in tax rates and laws are recognized in the period in which they occur.
Deferred income tax expense results from changes in deferred tax assets and liabilities between periods. Deferred tax assets are reduced by a valuation allowance if, based on the weight of evidence available, it is more likely than not that some portion or all of a deferred tax asset will not be realized.
As of December 31, 2009, the Corporation has State net operating loss carryforwards of $1,808,000 that expire through the year 2029. Management does not believe that these net operating loss carryforwards will be utilized prior to their expiration, as they were incurred by the holding company with little revenue opportunities to offset the losses, and as such, a valuation allowance has been provided for them.
FIRST COMMUNITY FINANCIAL CORPORATION
NOTESTO CONSOLIDATED FINANCIAL STATEMENTS
NOTE 9—INCOME TAXES (CONTINUED)
Uncertain tax positions are recognized if it is more likely than not, based on the technical merits, that the tax position will be sustained upon examination. The term “more likely than not” means a likelihood of more than 50 percent; the terms examined and upon examination also include resolution of the related appeals of litigation processes, if any. A tax position that meets the more-likely-than-not recognition threshold is initially and subsequently measured as the largest amount of tax benefit that has a greater than 50 percent likelihood of being sustained upon settlement with a taxing authority that has full knowledge of all relevant information. The determination of whether or not a tax position has met the more-likely-than-not recognition threshold considers the facts, circumstances, and information available at the reporting date and is subject to management’s judgment.
The Corporation recognizes interest and penalties on income taxes as a component of income tax expense. Tax years subject to examination by tax authorities are the years ended December 31, 2008, 2007 and 2006.
NOTE 10—RETIREMENT PLANS
The Corporation maintains a 401(k) plan for the benefit of eligible employees. Employer contributions include matching a portion of employee contributions and a discretionary contribution determined by the Corporation. Corporation contributions to the Plan were $160,000 and $148,000 for 2009 and 2008.
The Corporation maintains non-qualified compensation plans for selected employees (supplemental retirement) and directors (deferred fees). The estimated present value of future benefits is accrued over the period from the effective date of the agreements until the expected retirement dates of the individuals. Expenses include the following amounts for these non-qualified plans:
| | | | | | |
| | | 2009 | | 2008 |
| | | (In Thousands) |
Employee compensation | | $ | 41 | | $ | 43 |
Director compensation | | | 70 | | | 119 |
The balance accrued for these plans included in other liabilities as of December 31, 2009 and 2008 totaled $1,489,000 and $1,403,000.
To fund the benefits under these plans, the Corporation is the owner of single premium life insurance policies on participants in the non-qualified retirement plans. At December 31, 2009 and 2008, the cash value of these policies was $5,109,000 and $4,933,000.
NOTE 11—REGULATORY MATTERSAND SHAREHOLDERS’ EQUITY
The Corporation and the Bank are subject to various regulatory capital requirements administered by the federal banking agencies. Failure to meet the minimum capital requirements can initiate certain mandatory and possibly additional discretionary actions by regulators that, if undertaken, could have a direct material effect on the Corporation’s financial statements. Under capital adequacy guidelines and the regulatory framework for prompt corrective action, the Corporation and the Bank must meet specific capital guidelines that involve quantitative measures of their assets, liabilities and certain off-balance sheet items as calculated under regulatory accounting practices. The capital amounts and classification
FIRST COMMUNITY FINANCIAL CORPORATION
NOTESTO CONSOLIDATED FINANCIAL STATEMENTS
NOTE 11—REGULATORY MATTERSAND SHAREHOLDERS’ EQUITY (CONTINUED)
are also subject to qualitative judgments by the regulators about components, risk weightings and other factors.
Quantitative measures established by regulation to ensure capital adequacy require the Corporation and the Bank to maintain minimum amounts and ratios (set forth below) of Tier 1 capital to average assets and of Tier 1 and total capital (as defined in the regulations) to risk weighted assets. Management believes, as of December 31, 2009, that the Corporation and the Bank meet all capital adequacy requirements to which they are subject.
As of December 31, 2009, the most recent notification from the regulators categorized the Bank as “well capitalized” under the regulatory framework for prompt corrective action. There are no conditions or events since that notification that management believes have changed the Bank’s category.
The actual and required capital amounts and ratios were as follows:
| | | | | | | | | | | | | | | | | |
| | | Actual | | | For Capital
Adequacy
Purposes | | | To be Well
Capitalized under
Prompt Corrective
Action Provisions | |
| | | Amount | | Ratio | | | Amount | | Ratio | | | Amount | | Ratio | |
| | | (Dollars in Thousands) | |
| CORPORATION: | | | | | | | | | | | | | | | | | |
As of December 31, 2009: | | | | | | | | | | | | | | | | | |
Tier 1 leverage ratio (to average assets) | | $ | 29,051 | | 8.1 | % | | $³14,358 | | ³4.0 | % | | N/A | | | N/A | |
Tier 1 risk-based capital ratio (to risk-weighted assets) | | | 29,051 | | 15.0 | | | ³ 7,741 | | ³4.0 | | | N/A | | | N/A | |
Total risk-based capital ratio (to risk-weighted assets) | | | 31,616 | | 16.3 | | | ³15,481 | | ³8.0 | | | N/A | | | N/A | |
| | | | | | |
As of December 31, 2008: | | | | | | | | | | | | | | | | | |
Tier 1 leverage ratio (to average assets) | | $ | 27,599 | | 8.4 | % | | $³13,100 | | ³4.0 | % | | N/A | | | N/A | |
Tier 1 risk-based capital ratio (to risk-weighted assets) | | | 27,599 | | 14.7 | | | ³ 7,486 | | ³4.0 | | | N/A | | | N/A | |
Total risk-based capital ratio (to risk-weighted assets) | | | 29,524 | | 15.8 | | | ³14,973 | | ³8.0 | | | N/A | | | N/A | |
| | | | | | |
| BANK: | | | | | | | | | | | | | | | | | |
As of December 31, 2009: | | | | | | | | | | | | | | | | | |
Tier 1 leverage ratio (to average assets) | | $ | 28,246 | | 7.9 | % | | $³14,315 | | ³4.0 | % | | $³17,894 | | ³ | 5.0 | % |
Tier 1 risk-based capital ratio (to risk-weighted assets) | | | 28,246 | | 14.7 | | | ³ 7,709 | | ³4.0 | | | ³11,564 | | ³ | 6.0 | |
Total risk-based capital ratio (to risk-weighted assets) | | | 30,661 | | 15.9 | | | ³15,418 | | ³8.0 | | | ³19,273 | | ³ | 10.0 | |
| | | | | | |
As of December 31, 2008: | | | | | | | | | | | | | | | | | |
Tier 1 leverage ratio (to average assets) | | $ | 26,785 | | 8.2 | % | | $³13,058 | | ³4.0 | % | | $³16,322 | | ³ | 5.0 | % |
Tier 1 risk-based capital ratio (to risk-weighted assets) | | | 26,785 | | 14.4 | | | ³ 7,462 | | ³4.0 | | | ³11,192 | | ³ | 6.0 | |
Total risk-based capital ratio (to risk-weighted assets) | | | 28,537 | | 15.3 | | | ³14,923 | | ³8.0 | | | ³18,654 | | ³ | 10.0 | |
FIRST COMMUNITY FINANCIAL CORPORATION
NOTESTO CONSOLIDATED FINANCIAL STATEMENTS
NOTE 11—REGULATORY MATTERSAND SHAREHOLDERS’ EQUITY (CONTINUED)
Certain restrictions exist regarding the ability of the Bank to transfer funds to the Corporation in the form of cash dividends, loans or advances. Regulatory approval is required if the total of all dividends declared by a national bank in any calendar year exceeds net profits (as defined) for that year combined with the retained net profits for the two preceding calendar years. At December 31, 2009, approximately $4,259,000 of undistributed earnings of the Bank, included in consolidated shareholders’ equity, was available for distribution to the Corporation as dividends without prior regulatory approval.
In 2008 the Corporation implemented a dividend reinvestment and stock purchase plan. Holders of common stock may participate in the plan in which reinvested dividends and voluntary cash payments may be invested in additional common shares. The Corporation reserved 100,000 shares to be issued under this plan, of which 4,348 common shares have been issued pursuant to this plan.
On January 8, 2008, the Board of Directors of the Corporation authorized a stock repurchase program pursuant to which the Corporation is authorized to purchase up to 7.1% of its outstanding shares or 100,000 shares. Share repurchases will be made from time to time and may be effected through open market purchases, block trades, or in privately negotiated transactions. As of December 31, 2009, the Corporation has purchased 3,651 shares under this repurchase program.
NOTE 12—FINANCIAL INSTRUMENTSWITH OFF BALANCE SHEET RISK
The Corporation is a party to financial instruments with off balance sheet risk in the normal course of business to meet the financing needs of its customers. These financial instruments consist primarily of commitments to extend credit (typically mortgages and commercial loans) and, to a lesser extent, standby letters of credit. These instruments involve, to varying degrees, elements of credit and interest rate risk in excess of the amount recognized on the balance sheet. The Corporation’s exposure to credit loss in the event of nonperformance by the other party to the financial instrument for commitments to extend credit and standby letters of credit is represented by the contractual amount of those instruments. The Corporation uses the same credit policies in making commitments and conditional obligations as it does for on balance sheet instruments. The Corporation does not anticipate any material losses from these commitments.
Commitments to extend credit are agreements to lend to a customer as long as there is no violation of any condition established in the contract. Commitments generally have fixed expiration dates or other termination clauses and may require payment of a fee. Since many of the commitments are expected to expire without being drawn upon, the total commitment amounts do not necessarily represent future cash requirements. The Corporation evaluates each customer’s creditworthiness on a case-by-case basis. The amount of collateral obtained, if deemed necessary by the Corporation upon extensions of credit, is based on management’s credit evaluation of the customer. Collateral held varies but may include accounts receivable, inventory, property and equipment and income-producing commercial properties. On loans secured by real estate, the Corporation generally requires loan to value ratios of no greater than 80%.
Standby letters of credit are conditional commitments issued by the Corporation to guarantee the performance of a customer to a third party. Those guarantees are primarily issued to support public and private borrowing arrangements and similar transactions. The terms of the letters of credit vary and may have renewal features. The credit risk involved in using letters of credit is essentially the same as that involved in extending loans to customers. The Corporation holds collateral supporting those commitments for which collateral is deemed necessary. Management believes that the proceeds obtained through a liquidation of such collateral would be sufficient to cover the maximum potential amount of future payments required under the corresponding guarantees. The current amount of the liability as of December 31, 2009 and 2008 for guarantees under standby letters of credit issued is not material.
FIRST COMMUNITY FINANCIAL CORPORATION
NOTESTO CONSOLIDATED FINANCIAL STATEMENTS
NOTE 12—FINANCIAL INSTRUMENTSWITH OFF BALANCE SHEET RISK (CONTINUED)
The Corporation has not been required to perform on any financial guarantees, and has not incurred any losses on its commitments, during the past two years.
A summary of the Corporation’s commitments at December 31 were as follows:
| | | | | | |
| | | 2009 | | 2008 |
| | | (In Thousands) |
Commitments to extend credit | | $ | 33,787 | | $ | 31,822 |
Standby letters of credit | | | 216 | | | 231 |
NOTE 13—FAIR VALUEOF FINANCIAL INSTRUMENTS
Management uses its best judgment in estimating the fair value of the Corporation’s consolidated financial instruments; however, there are inherent weaknesses in any estimation technique. Therefore, for substantially all financial instruments, the fair value estimates herein are not necessarily indicative of the amounts the Bank could have realized in a sales transaction on the dates indicated. The estimated fair value amounts have been measured as of their respective period-ends and have not been re-evaluated or updated for purposes of these financial statements subsequent to those respective dates. As such, the estimated fair values of these financial instruments subsequent to the respective reporting dates may be different than the amounts reported at each period-end.
ASC Topic 820,Fair Value Measurements and Disclosure, which defines fair value, establishes a framework for measuring fair value under GAAP, expands disclosures about fair value measurements, and applies to other accounting pronouncements that require or permit fair value measurements. The Bank adopted Fair Value Measurements effective for its fiscal year beginning January 1, 2008.
Fair value measurement and disclosure guidance, defines fair value as the price that would be received to sell the asset or transfer the liability in an orderly transaction (that is, not a forced liquidation or distressed sale) between market participants at the measurement date under current market conditions. Additional guidance is provided on determining when the volume and level of activity for the asset or liability has significantly decreased. The Topic also includes guidance on identifying circumstances when a transaction may not be considered orderly.
Fair value measurement and disclosure provides a list of factors that a reporting entity should evaluate to determine whether there has been a significant decrease in the volume and level of activity for the asset or liability in relation to normal market activity for the asset or liability. When the reporting entity concludes there has been a significant decrease in the volume and level of activity for the asset or liability, further analysis of the information from that market is needed and significant adjustments to the related prices may be necessary to estimate fair value in accordance with fair value measurement and disclosure guidance.
ASC Topic 820 clarifies that when there has been a significant decrease in the volume and level of activity for the asset or liability, some transactions may not be orderly. In those situations, the entity must evaluate the weight of the evidence to determine whether the transaction is orderly. This Topic provides a list of circumstances that may indicate that a transaction is not orderly. A transaction price that is not associated with an orderly transaction is given little, if any, weight when estimating fair value.
FIRST COMMUNITY FINANCIAL CORPORATION
NOTESTO CONSOLIDATED FINANCIAL STATEMENTS
NOTE 13—FAIR VALUEOF FINANCIAL INSTRUMENTS (CONTINUED)
Fair value measurement and disclosure establishes a fair value hierarchy that prioritizes the inputs to valuation methods used to measure fair value. The hierarchy gives the highest priority to unadjusted quoted prices in active markets for identical assets or liabilities (Level 1 measurements) and the lowest priority to unobservable inputs (Level 3 measurements). The three levels of the fair value hierarchy are as follows:
Level 1: Unadjusted quoted prices in active markets that are accessible at the measurement date for identical, unrestricted assets or liabilities.
Level 2:Quoted prices in markets that are not active, or inputs that are observable either directly or indirectly, for substantially the full term of the asset or liability.
Level 3:Prices or valuation techniques that require inputs that are both significant to the fair value measurement and unobservable (i.e., supported with little or no market activity).
An asset’s or liability’s level within the fair value hierarchy is based on the lowest level of input that is significant to the fair value measurement.
For financial assets measured at fair value on a recurring basis, the fair value measurements by level within the fair value hierarchy used at December 31, 2009 and 2008 are as follows (in thousands):
| | | | | | | | | | | | |
Description | | December 31,
2009 | | (Level 1)
Quoted Prices
in Active
Markets for
Identical Assets | | (Level 2)
Significant
Other
Observable
Inputs | | (Level 3)
Significant
Unobservable
Inputs |
Securities available for sale | | $ | 81,437 | | $ | 464 | | $ | 80,465 | | $ | 508 |
| | | | | | | | | | | | |
| | | | |
Description | | December 31,
2008 | | (Level 1)
Quoted Prices
in Active
Markets for
Identical Assets | | (Level 2)
Significant
Other
Observable
Inputs | | (Level 3)
Significant
Unobservable
Inputs |
Securities available for sale | | $ | 66,376 | | $ | 465 | | $ | 65,486 | | $ | 425 |
The table below presents a reconciliation and income statement of gains and losses for available for sale securities measured at fair value on a recurring basis using significant unobservable inputs (level 3) for the periods ending December 31, 2009 and December 31, 2008.
FIRST COMMUNITY FINANCIAL CORPORATION
NOTESTO CONSOLIDATED FINANCIAL STATEMENTS
NOTE 13—FAIR VALUEOF FINANCIAL INSTRUMENTS (CONTINUED)
| | | | | | | |
| | | 2009 | | | 2008 |
Fair Value, beginning of year | | $ | 425 | | | $ | 425 |
Total losses included in other comprehensive income | | | (87 | ) | | | 0 |
Purchases | | | 170 | | | | 0 |
| | | | | | | |
Fair Value, end of year | | $ | 508 | | | $ | 425 |
| | | | | | | |
Assets measured at fair value on a non-recurring basis at December 31, 2009 and 2008 are summarized below:
| | | | | | | | | | | | |
Description | | December 31,
2009 | | (Level 1)
Quoted Prices in
Active Markets for
Identical Assets | | (Level 2)
Significant Other
Observable Inputs | | (Level 3)
Significant
Unobservable
Inputs |
Impaired loans | | $ | 1,394 | | $ | — | | $ | — | | $ | 1,394 |
| | | | |
Description | | December 31,
2008 | | (Level 1)
Quoted Prices in
Active Markets for
Identical Assets | | (Level 2)
Significant Other
Observable Inputs | | (Level 3)
Significant
Unobservable
Inputs |
Impaired loans | | $ | 36 | | $ | — | | $ | — | | $ | 36 |
Total impaired loans, which are measured for impairment using the fair value of the collateral for collateral-dependent loans, had a carrying amount of $2,410,000 and $72,000, net of the valuation allowances of $1,016,000 and $36,000 as of December 31, 2009 and December 31, 2008, respectively. This resulted in additional provision for loan losses of $1,000,000 for the years ending December 31, 2009 and $0 for the period ending December 31, 2008.
ASC Topic 825,Financial Instruments, requires disclosures about fair value of financial instruments for interim reporting periods of publicly traded companies as well as in annual financial statements.
The following information should not be interpreted as an estimate of the fair value of the entire Corporation since a fair value calculation is only provided for a limited portion of the Corporation’s assets and liabilities. Due to a wide range of valuation techniques and the degree of subjectivity used in making the estimates, comparisons between the Corporation’s disclosures and those of other companies may not be meaningful. The following methods and assumptions were used to estimate the fair values of the Corporation’s financial instruments at December 31, 2009 and December 31, 2008.
Cash and cash equivalents (carried at cost):
The carrying amounts reported in the balance sheet for cash and short-term instruments approximate those assets’ fair values.
Time certificates of deposit (carried at cost):
The carrying amount of time certificates of deposit approximates its fair value.
FIRST COMMUNITY FINANCIAL CORPORATION
NOTESTO CONSOLIDATED FINANCIAL STATEMENTS
NOTE 13—FAIR VALUEOF FINANCIAL INSTRUMENTS (CONTINUED)
Securities:
The fair value of securities available for sale are determined by obtaining quoted market prices on nationally recognized securities exchanges (Level 1), or matrix pricing (Level 2), which is a mathematical technique used widely in the industry to value debt securities without relying exclusively on quoted market prices for the specific securities but rather by relying on the securities’ relationship to other benchmark quoted prices. For certain securities which are not traded in active markets or are subject to transfer restrictions, valuations are adjusted to reflect illiquidy and/or non-transferability, and such adjustments are generally based on available market evidence (Level 3). The Corporation has one level 3 security, which is a local, closely held, community bank equity security with limited trading activity. The inputs used to determine the fair value of this security were the last reported sale price combined with the financial analysis of the bank to determine appropriateness of that sale price.
Loans receivable (carried at cost):
For variable rate loans that reprice frequently and with no significant change in credit risk, fair values are based on carrying values. The fair values of fixed rate loans are estimated using discounted cash flow analyses, using interest rates currently being offered in the market for loans with similar terms to borrowers of similar credit quality.
Impaired loans (generally carried at fair value):
Impaired loans are those that are accounted for under ASC Section 310-10-35,Receivables – Overall – Subsequent Measurement,in which the Corporation has measured impairment generally based on the fair value of the loan’s collateral. Fair value is generally determined based upon independent third-party appraisals of the properties, or discounted cash flows based upon the expected proceeds. These assets are included as Level 3 fair values, based upon the lowest level of input that is significant to the fair value measurements.
Restricted investment in bank stock (carried at cost):
The carrying amount of restricted investment in bank stock approximates fair value.
Accrued interest receivable and payable (carried at cost):
The carrying amount of accrued interest receivable and accrued interest payable approximates its fair value.
Deposit liabilities (carried at cost):
The fair values disclosed for demand deposits (e.g., interest and noninterest checking, passbook savings and money market accounts) are, by definition, equal to the amount payable on demand at the reporting date (i.e., their carrying amounts). Fair values for fixed-rate certificates of deposit are estimated using a discounted cash flow calculation that applies interest rates currently being offered in the market on certificates to a schedule of aggregated expected monthly maturities on time deposits.
Short-term borrowings (carried at cost):
The carrying amounts of short-term borrowings approximate their fair values.
Long-term debt (carried at cost):
Fair values of long-term debt are estimated using discounted cash flow analysis, based on rates currently available to the Corporation for advances from the FHLB with similar terms and remaining maturities.
FIRST COMMUNITY FINANCIAL CORPORATION
NOTESTO CONSOLIDATED FINANCIAL STATEMENTS
NOTE 13—FAIR VALUEOF FINANCIAL INSTRUMENTS (CONTINUED)
Junior Subordinated debt (carried at cost):
Fair values of junior subordinated debt are estimated using discounted cash flow analysis, based on rates currently offered on such debt, with similar terms and remaining maturities. As the Corporation has the ability to redeem the junior subordinated debt at any time, the fair value approximates its carrying value.
Off-balance sheet financial instruments (disclosed at cost):
Fair values for the Corporation’s off-balance sheet financial instruments (lending commitments and letters of credit) are based on fees currently charged to enter into similar agreements, taking into account, the remaining terms of the agreements and the counterparties’ credit standing.
The estimated fair values of the Corporation’s financial instruments were as follows at December 31, 2009 and 2008.
| | | | | | | | | | | | |
| | | 2009 | | 2008 |
| | | Carrying
Amount | | Fair Value | | Carrying
Amount | | Fair Value |
| | | (In Thousands) |
Financial assets: | | | | | | | | | | | | |
Cash and cash equivalents | | $ | 8,633 | | $ | 8,633 | | $ | 6,864 | | $ | 6,864 |
Time certificates of deposit | | | 396 | | | 396 | | | 396 | | | 396 |
Investment securities: | | | | | | | | | | | | |
Available for sale | | | 81,437 | | | 81,437 | | | 66,376 | | | 66,376 |
Held to maturity | | | 30,204 | | | 29,715 | | | 24,127 | | | 23,248 |
Loans, less allowance for loan losses | | | 216,600 | | | 217,481 | | | 212,377 | | | 213,544 |
Accrued interest receivable | | | 1,452 | | | 1,452 | | | 1,241 | | | 1,241 |
Restricted investment in bank stocks | | | 2,661 | | | 2,661 | | | 2,661 | | | 2,661 |
| | | | |
Financial liabilities: | | | | | | | | | | | | |
Deposits | | | 296,459 | | | 301,750 | | | 262,606 | | | 263,790 |
Short-term borrowings | | | 4,512 | | | 4,512 | | | 10,613 | | | 10,613 |
Long-term debt | | | 22,000 | | | 23,519 | | | 22,000 | | | 24,281 |
Junior subordinated debt | | | 5,155 | | | 5,155 | | | 5,155 | | | 5,155 |
Accrued interest payable | | | 443 | | | 443 | | | 570 | | | 570 |
Off-balance sheet financial instruments | | | — | | | — | | | — | | | — |
NOTE 14—CONTINGENCIES
The Corporation is subject to claims and lawsuits which arise primarily in the ordinary course of business. Based on information presently available and advice received from legal counsel representing the Corporation in connection with any such claims and lawsuits, it is the opinion of management that the disposition or ultimate determination of any such claims and lawsuits will not have a material adverse effect on the consolidated financial position, consolidated results of operations or liquidity of the Corporation.
FIRST COMMUNITY FINANCIAL CORPORATION
NOTESTO CONSOLIDATED FINANCIAL STATEMENTS
NOTE 15—CONDENSED FINANCIAL INFORMATIONFOR PARENT COMPANY ONLY
BALANCE SHEETS
| | | | | | |
| | | December 31, |
| | | 2009 | | 2008 |
| | | (In Thousands) |
ASSETS | | | | | | |
Cash | | $ | 122 | | $ | 324 |
Investment in bank subsidiary | | | 29,367 | | | 27,369 |
Investment in unconsolidated subsidiary trust | | | 155 | | | 155 |
Securities available for sale | | | 972 | | | 890 |
Other assets | | | 61 | | | 79 |
| | | | | | |
Total Assets | | $ | 30,677 | | $ | 28,817 |
| | | | | | |
LIABILITIESAND SHAREHOLDERS’ EQUITY | | | | | | |
Liabilities | | $ | 164 | | $ | 249 |
Junior subordinated debt | | | 5,155 | | | 5,155 |
Shareholders’ equity | | | 25,358 | | | 23,413 |
| | | | | | |
Total Liabilities and Shareholders’ Equity | | $ | 30,677 | | $ | 28,817 |
| | | | | | |
STATEMENTSOF INCOME
| | | | | | |
| | | Years Ended
December 31, |
| | | 2009 | | 2008 |
| | | (In Thousands) |
Dividends from bank subsidiary | | $ | 992 | | $ | 1,298 |
Other dividends | | | 38 | | | 38 |
| | | | | | |
| | | 1,030 | | | 1,336 |
Expenses | | | 248 | | | 380 |
| | | | | | |
| | | 782 | | | 956 |
Equity in undistributed earnings in bank subsidiary | | | 1,444 | | | 1,380 |
| | | | | | |
Net Income | | $ | 2,226 | | $ | 2,336 |
| | | | | | |
FIRST COMMUNITY FINANCIAL CORPORATION
NOTESTO CONSOLIDATED FINANCIAL STATEMENTS
NOTE 15—CONDENSED FINANCIAL INFORMATIONFOR PARENT COMPANY ONLY (CONTINUED)
STATEMENTSOF CASH FLOWS
| | | | | | | | |
| | | Years Ended December 31, | |
| | | 2009 | | | 2008 | |
| | | (In Thousands) | |
CASH FLOWSFROM OPERATING ACTIVITIES | | | | | | | | |
Net income | | $ | 2,226 | | | $ | 2,336 | |
Equity in undistributed earnings of bank subsidiary | | | (1,444 | ) | | | (1,380 | ) |
OTTI impairment charge | | | 15 | | | | — | |
Decrease in other assets | | | 18 | | | | 42 | |
Increase (decrease) in other liabilities | | | (56 | ) | | | (30 | ) |
| | | | | | | | |
Net Cash Provided by Operating Activities | | | 759 | | | | 968 | |
| | | | | | | | |
CASH FLOWSFROM INVESTING ACTIVITIES | | | | | | | | |
Purchase of securities available for sale | | | (170 | ) | | | (57 | ) |
| | | | | | | | |
Net Cash Used in Investing Activities | | | (170 | ) | | | (57 | ) |
| | | | | | | | |
CASH FLOWSFROM FINANCING ACTIVITIES | | | | | | | | |
Proceeds from issuance of common stock | | | 69 | | | | 58 | |
Acquisition of treasury stock | | | (48 | ) | | | (62 | ) |
Cash dividends paid | | | (812 | ) | | | (728 | ) |
| | | | | | | | |
Net Cash Used in Financing Activities | | | (791 | ) | | | (732 | ) |
| | | | | | | | |
Net Increase (Decrease) in Cash | | | (202 | ) | | | 179 | |
CASH - BEGINNING | | | 324 | | | | 145 | |
| | | | | | | | |
CASH - ENDING | | $ | 122 | | | $ | 324 | |
| | | | | | | | |
FIRST COMMUNITY FINANCIAL CORPORATION
NOTESTO CONSOLIDATED FINANCIAL STATEMENTS
NOTE 16—QUARTERLY FINANCIAL DATA (UNAUDITED)
The following represents summarized unaudited quarterly financial data of the Corporation which in the opinion of management, reflects adjustments (comprising only normal recurring accruals) necessary for fair presentation:
| | | | | | | | | | | | | |
| | | Three Months Ended |
| | | December 31 | | | September 30 | | June 30 | | March 31 |
| | | (In Thousands, Except per Share Amounts) |
2009: | | | | | | | | | | | | | |
Interest income | | $ | 4,625 | | | $ | 4,614 | | $ | 4,624 | | $ | 4,641 |
Interest expense | | | 2,176 | | | | 2,202 | | | 2,215 | | | 2,190 |
Net interest income | | | 2,449 | | | | 2,412 | | | 2,409 | | | 2,451 |
Provision for loan losses | | | 500 | | | | 535 | | | 22 | | | 180 |
Provision for income taxes | | | (20 | ) | | | 71 | | | 143 | | | 222 |
Net income | | | 351 | | | | 519 | | | 615 | | | 741 |
Net income per share, basic | | | 0.25 | | | | 0.37 | | | 0.44 | | | 0.53 |
2008: | | | | | | | | | | | | | |
Interest income | | $ | 4,672 | | | $ | 4,711 | | $ | 4,534 | | $ | 4,491 |
Interest expense | | | 2,259 | | | | 2,288 | | | 2,373 | | | 2,484 |
Net interest income | | | 2,413 | | | | 2,423 | | | 2,161 | | | 2,007 |
Provision for loan losses | | | 197 | | | | 93 | | | 75 | | | — |
Provision for income taxes | | | 109 | | | | 220 | | | 173 | | | 119 |
Net income | | | 502 | | | | 719 | | | 611 | | | 504 |
Net income per share, basic | | | 0.36 | | | | 0.51 | | | 0.44 | | | 0.36 |
MANAGEMENT’S DISCUSSIONAND ANALYSISOF FINANCIAL
CONDITIONAND RESULTSOF OPERATIONS
The following discussion represents management’s analysis of the financial condition and results of operations of First Community Financial Corporation (the Corporation) and should be read in conjunction with the accompanying financial statements and other financial data included elsewhere in this report.
FORWARD-LOOKING STATEMENTS
Except for historical information, this report may be deemed to contain “forward-looking” statements regarding the Corporation. Examples of forward-looking statements include, but are not limited to, (a) projections or statements regarding future earnings, expenses, net interest income, other income, earnings or loss per share, asset mix and quality, growth prospects, capital structure and other financial terms, (b) statements of plans and objectives of management or the board of directors, and (c) statements of assumptions, such as economic conditions in the Corporation’s market areas. Such forward-looking statements can be identified by the use of forward-looking terminology such as “believes,” “expects,” “may,” “intends,” “will,” “should,” “anticipates,” or the negative of any of the foregoing or other variations thereon or comparable terminology, or by discussion of strategy.
No assurance can be given that the future results covered by forward-looking statements will be achieved. Such statements are subject to risks, uncertainties, and other factors that could cause actual results to differ materially from future results expressed or implied by such forward-looking statements. Important factors that could impact the Corporation’s operating results include, but are not limited to, (i) the effects of changing economic conditions in the Corporation’s market areas and nationally, (ii) credit risks of commercial, real estate, consumer and other lending activities, (iii) significant changes in interest rates, (iv) changes in federal and state banking laws and regulations which could impact the Corporation’s operations, (v) funding costs and (vi) other external developments which could materially affect the Corporation’s business and operations.
EXECUTIVE SUMMARY
The Corporation’s results are primarily determined by the results of operations of its principal subsidiary, The First National Bank of Mifflintown (the Bank). The Bank is a traditional community bank which operates branches in two rural counties of central Pennsylvania. The Bank’s earnings are largely driven by its net interest income.
CRITICAL ACCOUNTING POLICIES
The consolidated financial statements include the Corporation and its wholly-owned subsidiary, the Bank. All significant intercompany accounts and transactions have been eliminated.
The consolidated financial statements are prepared in accordance with accounting principles generally accepted in the United States of America, which require the Corporation to make estimates and assumptions (see footnote 1 to the financial statements). The Corporation believes that of its significant accounting policies, the allowance for loan losses and valuation of its securities may involve a higher degree of judgment and complexity.
The allowance for loan losses is established through a charge to earnings for the provision for loan losses. In determining the balance in the allowance for loan losses, consideration is given to a variety of factors in establishing this estimate. In estimating the allowance for loan losses, management considers current economic conditions, diversification of the loan portfolio, delinquency statistics, results of internal loan reviews, borrowers’ perceived financial and managerial strengths, the adequacy of the underlying collateral, if collateral dependent, or present value of future cash flows and other relevant factors. The use of different estimates or assumptions could produce different provisions for loan losses. Additional information is provided in the “Provision for Loan Losses” and “Allowance for Loan Losses” sections.
Declines in the fair value of securities held to maturity and available for sale securities below their cost that are deemed to be other than temporary are reflected in earnings as realized losses. Management evaluates securities for other-than-temporary impairment at least on a quarterly basis, and more frequently when economic or market concerns warrant such evaluation. Consideration is given to (1) the length of time and the extent to which the fair value has been less than cost, (2) the financial condition and near-term prospects of the issuer, and (3) for equity securities, the intent and ability of the Corporation to retain its investment in the issuer for a period of time sufficient to allow for any anticipated recovery in fair value. For debt securities, management considers whether (1) it has the intent to sell the security and (2) it is more likely than not that it will be required to sell the security prior to its anticipated recovery.
OVERVIEW
In 2009, the Corporation recorded net income of $2,226,000, a decrease of $110,000 or 4.7%, from net income of $2,336,000 in 2008.
The decrease in net income during 2009 as compared to 2008 is primarily a result of the following:
| | • | | Decrease in net interest income, after provision for loan losses, of $155,000; |
| | • | | Increase in total other income of $659,000; |
| | • | | Increase in total other expenses of $819,000; and |
| | • | | Decrease in provision for income taxes of $205,000. |
Basic earnings per share were $1.59 in 2009 compared to $1.67 in 2008. Return on average equity for 2009 was 9.06% compared to 10.52% in 2008. Return on average assets was 0.65% for 2009 compared with 0.73% in 2008.
During 2009, the Corporation experienced $4,223,000 or 2.0% growth in loans, $21,138,000 or 23.4% growth in securities, and $33,853,000 or 12.9% growth in deposits. These increases were offset by a $6,101,000 or 57.5%
OVERVIEW (CONTINUED)
decrease in short-term borrowings. As a result of these trends total assets of the Corporation grew by $29,122,000 or 8.9%.
RESULTSOF OPERATIONS
NET INTEREST INCOMEAND NET INTEREST MARGIN
Net interest income is the difference between interest income earned on investments and loans, and interest expense incurred on deposits and other liabilities. For analysis purposes, net interest income is evaluated on a fully tax equivalent (FTE) basis. The FTE basis is calculated by grossing up the yield on tax-exempt securities and loans by the Federal tax rate of 34%, in order that the yield on tax-exempt assets may be comparable to interest earned on taxable assets. The factors that affect net interest income include changes in interest rates and changes in average balances of interest-earning assets and interest-bearing liabilities. Net interest income on an FTE basis increased to $10,434,000 in 2009 from $9,541,000 in 2008 and $7,783,000 in 2007.
NET INTEREST INCOMEAND NET INTEREST MARGIN (CONTINUED)
The following table includes average balances, rates and interest income and expense adjusted to an FTE basis, the interest rate spread and the net interest margin:
Average Balances, Rates and Interest Income and Expense
(Dollars in Thousands)
| | | | | | | | | | | | | | | | | | | | | | | | | | | |
| | | 2009 | | | 2008 | | | 2007 | |
| | | Average
Balance | | Interest | | Yield/
Rate | | | Average
Balance | | Interest | | Yield/
Rate | | | Average
Balance | | Interest | | Yield/
Rate | |
ASSETS | | | | | | | | | | | | | | | | | | | | | | | | | | | |
INTEREST EARNING ASSETS | | | | | | | | | | | | | | | | | | | | | | | | | | | |
Securities: | | | | | | | | | | | | | | | | | | | | | | | | | | | |
Taxable | | $ | 70,907 | | $ | 3,149 | | 4.44 | % | | $ | 67,980 | | $ | 3,414 | | 5.02 | % | | $ | 57,315 | | $ | 2,716 | | 4.74 | % |
Tax-exempt | | | 27,062 | | | 1,755 | | 6.49 | % | | | 21,185 | | | 1,312 | | 6.19 | % | | | 20,140 | | | 1,188 | | 5.90 | % |
| | | | | | | | | | | | | | | | | | | | | | | | | | | |
Total Securities | | | 97,969 | | | 4,904 | | 5.01 | % | | | 89,165 | | | 4,726 | | 5.30 | % | | | 77,455 | | | 3,904 | | 5.04 | % |
| | | | | | | | | | | | | | | | | | | | | | | | | | | |
Other | | | 9,251 | | | 54 | | 0.58 | % | | | 5,065 | | | 186 | | 3.67 | % | | | 6,687 | | | 388 | | 5.80 | % |
Loans: | | | | | | | | | | | | | | | | | | | | | | | | | | | |
Taxable | | | 210,266 | | | 13,918 | | 6.62 | % | | | 200,771 | | | 13,766 | | 6.86 | % | | | 180,907 | | | 12,671 | | 7.00 | % |
Tax-exempt | | | 4,476 | | | 341 | | 7.62 | % | | | 3,490 | | | 267 | | 7.65 | % | | | 2,754 | | | 209 | | 7.59 | % |
| | | | | | | | | | | | | | | | | | | | | | | | | | | |
Total Loans | | | 214,742 | | | 14,259 | | 6.64 | % | | | 204,261 | | | 14,033 | | 6.87 | % | | | 183,661 | | | 12,880 | | 7.01 | % |
| | | | | | | | | | | | | | | | | | | | | | | | | | | |
Total Interest Earning Assets | | | 321,962 | | | 19,217 | | 5.97 | % | | | 298,491 | | | 18,945 | | 6.35 | % | | | 267,803 | | | 17,172 | | 6.41 | % |
| | | | | | | | | | | | | | | | | | | | | | | | | | | |
Non-interest earnings assets | | | 22,563 | | | | | | | | | 20,799 | | | | | | | | | 20,716 | | | | | | |
| | | | | | | | | | | | | | | | | | | | | | | | | | | |
Total Assets | | $ | 344,525 | | | | | | | | $ | 319,290 | | | | | | | | $ | 288,519 | | | | | | |
| | | | | | | | | | | | | | | | | | | | | | | | | | | |
LIABILITIESAND SHAREHOLDERS’ EQUITY | | | | | | | | | | | | | | | | | | | | | | | | | | | |
INTEREST BEARING LIABILITIES | | | | | | | | | | | | | | | | | | | | | | | | | | | |
Demand deposits, interest bearing | | $ | 24,124 | | $ | 48 | | 0.20 | % | | $ | 22,876 | | $ | 91 | | 0.40 | % | | $ | 21,637 | | $ | 116 | | 0.54 | % |
Savings deposits | | | 40,253 | | | 506 | | 1.26 | % | | | 22,840 | | | 189 | | 0.83 | % | | | 22,848 | | | 231 | | 1.01 | % |
Time deposits | | | 192,597 | | | 6,940 | | 3.60 | % | | | 185,808 | | | 7,571 | | 4.07 | % | | | 165,060 | | | 7,341 | | 4.45 | % |
| | | | | | | | | | | | | | | | | | | | | | | | | | | |
Total Interest Bearing Deposits | | | 256,974 | | | 7,494 | | 2.92 | % | | | 231,524 | | | 7,851 | | 3.39 | % | | | 209,545 | | | 7,688 | | 3.67 | % |
Short-term borrowings | | | 4,612 | | | 50 | | 1.08 | % | | | 9,146 | | | 169 | | 1.85 | % | | | 8,344 | | | 373 | | 4.47 | % |
Long-term debt | | | 27,155 | | | 1,239 | | 4.56 | % | | | 26,966 | | | 1,384 | | 5.13 | % | | | 23,454 | | | 1,328 | | 5.66 | % |
| | | | | | | | | | | | | | | | | | | | | | | | | | | |
Total Interest Bearing Liabilities | | | 288,741 | | | 8,783 | | 3.04 | % | | | 267,636 | | | 9,404 | | 3.51 | % | | | 241,343 | | | 9,389 | | 3.89 | % |
| | | | | | | | | | | | | | | | | | | | | | | | | | | |
Demand deposits, non-interest bearing | | | 28,443 | | | | | | | | | 26,941 | | | | | | | | | 24,859 | | | | | | |
Other liabilities | | | 2,766 | | | | | | | | | 2,506 | | | | | | | | | 1,969 | | | | | | |
Shareholders’ equity | | | 24,575 | | | | | | | | | 22,207 | | | | | | | | | 20,348 | | | | | | |
| | | | | | | | | | | | | | | | | | | | | | | | | | | |
Total Liabilities and Shareholders’ Equity | | $ | 344,525 | | | | | | | | $ | 319,290 | | | | | | | | $ | 288,519 | | | | | | |
| | | | | | | | | | | | | | | | | | | | | | | | | | | |
NET INTEREST INCOME | | | | | $ | 10,434 | | | | | | | | $ | 9,541 | | | | | | | | $ | 7,783 | | | |
| | | | | | | | | | | | | | | | | | | | | | | | | | | |
INTEREST RATE SPREAD | | | | | | | | 2.93 | % | | | | | | | | 2.84 | % | | | | | | | | 2.52 | % |
| | | | | | | | | | | | | | | | | | | | | | | | | | | |
NET INTEREST MARGIN | | | | | | | | 3.24 | % | | | | | | | | 3.20 | % | | | | | | | | 2.91 | % |
| | | | | | | | | | | | | | | | | | | | | | | | | | | |
Yields on tax-exempt assets have been computed on a fully tax equivalent basis assuming a tax rate of 34%.
For yield calculation purposes, non-accruing loans are included in average loan balances.
Interest income on loans includes amortized fees and costs on loans totaling $(13,000) in 2009, $(24,000) in 2008, and $38,000 in 2007.
Securities available for sale are carried at amortized cost for purposes of calculating the average yield on taxable securities.
NET INTEREST INCOMEAND NET INTEREST MARGIN (CONTINUED)
The following table shows changes in net interest income attributed to changes in rates and changes in average balances of interest-earning assets and interest-bearing liabilities:
Rate/Volume Analysis
(In Thousands)
| | | | | | | | | | | | | | | | | | | | | | | | |
| | | 2009 versus 2008 | | | 2008 versus 2007 | |
| | | Change Due to | | | | | | Change Due to | | | | |
| | | Rate | | | Volume | | | Total | | | Rate | | | Volume | | | Total | |
INTEREST EARNING ASSETS | | | | | | | | | | | | | | | | | | | | | | | | |
Securities: | | | | | | | | | | | | | | | | | | | | | | | | |
Taxable | | $ | (395 | ) | | $ | 130 | | | $ | (265 | ) | | $ | 163 | | | $ | 535 | | | $ | 698 | |
Tax-exempt | | | 62 | | | | 381 | | | | 443 | | | | 59 | | | | 65 | | | | 124 | |
Other | | | (151 | ) | | | 19 | | | | (132 | ) | | | (148 | ) | | | (54 | ) | | | (202 | ) |
Total loans | | | (477 | ) | | | 703 | | | | 226 | | | | (265 | ) | | | 1,418 | | | | 1,153 | |
| | | | | | | | | | | | | | | | | | | | | | | | |
Total | | | (961 | ) | | | 1,233 | | | | 272 | | | | (191 | ) | | | 1,964 | | | | 1,773 | |
| | | | | | | | | | | | | | | | | | | | | | | | |
| | | | | | |
INTEREST BEARING LIABILITIES | | | | | | | | | | | | | | | | | | | | | | | | |
Demand deposits, interest bearing | | | (46 | ) | | | 3 | | | | (43 | ) | | | (30 | ) | | | 5 | | | | (25 | ) |
Savings deposits | | | 98 | | | | 219 | | | | 317 | | | | (42 | ) | | | — | | | | (42 | ) |
Time deposits | | | (876 | ) | | | 245 | | | | (631 | ) | | | (616 | ) | | | 846 | | | | 230 | |
Short-term borrowings | | | (70 | ) | | | (49 | ) | | | (119 | ) | | | (219 | ) | | | 15 | | | | (204 | ) |
Long-term debt | | | (154 | ) | | | 9 | | | | (145 | ) | | | (124 | ) | | | 180 | | | | 56 | |
| | | | | | | | | | | | | | | | | | | | | | | | |
Total | | | (1,048 | ) | | | 427 | | | | (621 | ) | | | (1,031 | ) | | | 1,046 | | | | 15 | |
| | | | | | | | | | | | | | | | | | | | | | | | |
Net Interest Income | | $ | 87 | | | $ | 806 | | | $ | 893 | | | $ | 840 | | | $ | 918 | | | $ | 1,758 | |
| | | | | | | | | | | | | | | | | | | | | | | | |
Interest income is presented on a fully tax equivalent basis, assuming a tax rate of 34%.
The net change attributable to the combination of rate and volume has been allocated to the change due to volume.
2009 VERSUS 2008
During 2009, tax equivalent interest income increased by $272,000 as the result of an increase in earning assets, offset by a decrease in the yield on earning assets of 0.38%. Average loans increased $10,481,000 impacting interest income by $703,000 and the yield on loans decreased 0.23% reducing interest income by $477,000. Total average securities increased $8,804,000 increasing interest income $511,000 and the yield on securities decreased 0.29% decreasing interest income $333,000.
Total average interest-bearing liabilities grew by $21,105,000 between 2009 and 2008 increasing interest expense by $427,000 for 2009, and the average rate paid on interest-bearing liabilities decreased 0.47% decreasing interest expense by $1,048,000.
The net interest margin is the ratio of net interest income to interest-earning assets, reflecting a net yield on earning assets. The 0.04% increase in net interest margin from 2008 to 2009 reflects the decrease in rates on interest-bearing liabilities out-pacing the decrease in rates on interest-earning assets.
2008 VERSUS 2007
During 2008, tax equivalent interest income increased by $1,773,000 as the result of an increase in earning assets, offset by a slight decrease in the yield on earning assets of 0.06%. Average loans increased $20,600,000 impacting interest income by $1,418,000 and the yield on loans decreased 0.14% impacting interest income by $265,000. Total average securities increased $11,710,000 increasing interest income $600,000 and the yield on securities increased 0.26% increasing interest income $222,000.
NET INTEREST INCOMEAND NET INTEREST MARGIN (CONTINUED)
Total average interest-bearing liabilities grew by $26,293,000 between 2008 and 2007 increasing interest expense by $1,046,000 for 2008, and the average rate paid on interest-bearing liabilities decreased 0.38% decreasing interest expense by $1,031,000.
The net interest margin is the ratio of net interest income to interest-earning assets, reflecting a net yield on earning assets. The 0.29% increase in net interest margin from 2007 to 2008 reflects the decrease in rates paid on interest-bearing liabilities out-pacing the decrease in rates earned on interest-earning assets.
PROVISIONFOR LOAN LOSSES
The provision for loan losses and allowance for loan losses are based on management’s ongoing assessment of the Corporation’s credit exposure and consideration of other relevant factors. The allowance for loan losses is a valuation reserve, which is available to absorb future loan charge-offs. The provision for loan losses is the amount charged to earnings on an annual basis.
The Corporation recorded a $1,237,000 provision for loan losses in 2009 compared to $365,000 in 2008. Provisions for loan losses are charged to income to bring the allowance for loan losses to a level deemed appropriate by management based on the factors discussed under the “Allowance for Loan Losses” section. Based on that analysis, the level of the allowance for loan losses is appropriate at this time.
OTHER INCOME
2009 VERSUS 2008
Other income of $2,955,000 during 2009 increased by $659,000 compared to 2008, primarily as a result of the following:
| | • | | An increase in income from fiduciary activities of $119,000. |
| | • | | An increase in investment securities gains of $459,000. |
| | • | | An increase in ATM card fees of $27,000, reflecting the increasing use of our ATM locations. |
| | • | | An increase in gains on sales of foreclosed real estate of $33,000. |
OTHER EXPENSES
2009 VERSUS 2008
Other expenses increased $819,000 or 10.3% to $8,797,000 during 2009 compared to $7,978,000 during 2008, primarily as a result of the following:
| | • | | An increase in employee compensation and benefits of $247,000 as the result of increases in the number of staff and merit increases during the year. |
| | • | | An increase in professional fees of $77,000 or 21.9% as the result of increased legal and accounting fees. |
OTHER EXPENSES (CONTINUED)
| | • | | An increase in FDIC/OCC expense of $544,000 as the result of the increase in FDIC insurance premiums coupled with a special industry assessment by the FDIC. |
| | • | | An increase in ATM expense of $42,000 as a result of increased use of our ATM locations. |
INCOME TAXES
Income tax expense was $416,000 for 2009 compared to $621,000 for 2008 and $500,000 for 2007. Income tax expense as a percentage of income before income taxes was 15.7% for 2009 and 21.0% for 2008. The actual effective rate deviates from the 34% statutory rate due to tax exempt interest income and income earned on cash surrender value of life insurance. The Corporation’s lower effective tax rate in 2009 was a result of an increase in the percentage of pre-tax income being derived from tax-exempt investments and loans and tax-exempt income earned on life insurance. Refer to footnote 9 to the consolidated financial statements for further analysis of income taxes.
FINANCIAL CONDITION
SECURITIES
The securities portfolio is a component of interest-earning assets and is second in size only to the Corporation’s loan portfolio. Investment securities not only provide interest income, they provide a source of liquidity, diversify the earning asset portfolio and provide collateral for public funds and securities sold under agreements to repurchase.
The Corporation’s securities are classified as either held to maturity or available for sale. Securities in the held to maturity category are accounted for at amortized cost. Available for sale securities are accounted for at fair value with unrealized gains and losses, net of taxes, reported as a separate component of comprehensive income.
The Corporation generally intends to hold its investment portfolio until maturity; however, about 72.9% or $81,437,000, of total securities at December 31, 2009 were classified as available for sale. Net unrealized gains at year-end 2009 were $1,962,000 compared to $1,195,000 at year-end 2008. The net unrealized gain at December 31, 2009 is reflected as accumulated other comprehensive income of $1,276,000 in shareholders’ equity, net of deferred income taxes compared to $766,000 at December 31, 2008. This increase reflects changes in interest rates during 2009. Management evaluates securities for other-than-temporary impairment at least on a quarterly basis, and more frequently when economic or market concerns warrant such evaluation. Consideration is given to (1) the length of time and the extent to which the fair value has been less than cost, (2) the financial condition and near-term prospects of the issuer, and (3) for equity securities, the intent and ability of the Corporation to retain its investment in the issuer for a period of time sufficient to allow for any anticipated recovery in fair value. For debt securities, management considers whether (1) it has the intent to sell the security and (2) it is more likely than not that it will be required to sell the security prior to its anticipated recovery. During 2009, one equity security, a regional bank holding company, was deemed to be other-than-temporarily impaired and a $15,000 charge was recorded in the second quarter of 2009. This equity security had depreciated in fair value 70% during the last year, its dividend has been significantly reduced, and a near term recovery of value is not expected. For additional information on unrealized losses by investment type, see footnote 3 to the consolidated financial statements.
Held to maturity securities totaled $30,204,000 at December 31, 2009 compared to $24,127,000 a year ago. The increase was a result of new purchases exceeding maturities of U.S. Government agency securities and state and municipal securities. A significant portion of this portfolio is comprised of state and municipal securities that provide tax-exempt interest income to the Corporation.
SECURITIES (CONTINUED)
The following tables set forth the composition of the securities portfolio and the securities maturity schedule, including weighted average yield, as of the dates indicated:
Investment Securities
(In Thousands)
| | | | | | | | | |
| | | 2009 | | 2008 | | 2007 |
AVAILABLEFOR SALE SECURITIESAT FAIR VALUE | | | | | | | | | |
U.S. Government agencies | | $ | 12,231 | | $ | 6,724 | | $ | 9,170 |
Mortgage-backed securities | | | 68,234 | | | 58,762 | | | 53,268 |
Stock in other banks | | | 972 | | | 890 | | | 902 |
| | | | | | | | | |
| | | 81,437 | | | 66,376 | | | 63,340 |
| | | | | | | | | |
HELDTO MATURITY SECURITIESAT AMORTIZED COST | | | | | | | | | |
U.S. Government agencies | | | 250 | | | 250 | | | 705 |
State and municipal | | | 29,954 | | | 23,877 | | | 20,524 |
| | | | | | | | | |
| | | 30,204 | | | 24,127 | | | 21,229 |
| | | | | | | | | |
| | $ | 111,641 | | $ | 90,503 | | $ | 84,569 |
| | | | | | | | | |
The scheduled maturities of the securities portfolio at December 31, 2009 is as follows:
Securities Maturity Schedule
(Dollars in Thousands)
| | | | | | | | | | | | | | | | | | | | | | | | | | | | | | |
| | | 1 Year or Less | | | Over 1-5 Years | | | Over 5-10 Years | | | Over 10 Years or
no Maturity | | | Total | |
| | | Amount | | Yield | | | Amount | | Yield | | | Amount | | Yield | | | Amount | | Yield | | | Amount | | Yield | |
U.S. Government agencies | | $ | 3,635 | | 3.16 | % | | $ | 7,966 | | 3.75 | % | | $ | 880 | | 4.53 | % | | $ | — | | — | % | | $ | 12,481 | | 3.63 | % |
State and municipal | | | 852 | | 5.70 | | | | 3,584 | | 5.98 | | | | 13,731 | | 6.54 | | | | 11,787 | | 6.50 | | | | 29,954 | | 6.43 | |
Mortgage-backed securities | | | — | | — | | | | — | | — | | | | — | | — | | | | 68,234 | | 4.06 | | | | 68,234 | | 4.06 | |
Equity securities | | | — | | — | | | | — | | — | | | | — | | — | | | | 972 | | — | | | | 972 | | — | |
| | | | | | | | | | | | | | | | | | | | | | | | | | | | | | |
| | $ | 4,487 | | 3.64 | % | | $ | 11,550 | | 4.44 | % | | $ | 14,611 | | 6.42 | % | | $ | 80,993 | | 4.36 | % | | $ | 111,641 | | 4.61 | % |
| | | | | | | | | | | | | | | | | | | | | | | | | | | | | | |
Held to maturity securities are accounted for at amortized cost and available for sale securities are accounted for at fair value.
Weighted average yields are calculated on a fully tax equivalent basis assuming a tax rate of 34%.
LOANS
Loans at December 31 were as follows:
| | | | | | | | | | | | | | | |
| | | 2009 | | 2008 | | 2007 | | 2006 | | 2005 |
| | | (In Thousands) |
Commercial, financial and agricultural | | $ | 32,369 | | $ | 22,944 | | $ | 17,523 | | $ | 16,691 | | $ | 14,562 |
Real estate: | | | | | | | | | | | | | | | |
Commercial | | | 37,842 | | | 41,227 | | | 38,327 | | | 36,021 | | | 33,622 |
Construction | | | 5,057 | | | 5,730 | | | 1,435 | | | — | | | 34 |
LOANS (CONTINUED)
| | | | | | | | | | | | | | | | | | | | |
| | | 2009 | | | 2008 | | | 2007 | | | 2006 | | | 2005 | |
| | | (In Thousands) | |
Residential | | | 139,055 | | | | 138,209 | | | | 129,563 | | | | 121,419 | | | | 110,256 | |
Installment | | | 5,339 | | | | 6,159 | | | | 5,946 | | | | 5,398 | | | | 5,008 | |
| | | | | | | | | | | | | | | | | | | | |
Total | | | 219,662 | | | | 214,269 | | | | 192,794 | | | | 179,529 | | | | 163,482 | |
Allowance for loan losses | | | (2,830 | ) | | | (1,633 | ) | | | (1,249 | ) | | | (1,230 | ) | | | (1,264 | ) |
Deferred loan fees and costs, net | | | (232 | ) | | | (259 | ) | | | (320 | ) | | | (369 | ) | | | (418 | ) |
| | | | | | | | | | | | | | | | | | | | |
Loans | | $ | 216,600 | | | $ | 212,377 | | | $ | 191,225 | | | $ | 177,930 | | | $ | 161,800 | |
| | | | | | | | | | | | | | | | | | | | |
The loan portfolio comprises the major portion of the Corporation’s earning assets. The increase in loans of $4,223,000, or 2.0%, during 2009 was attributable to the following: Residential real estate grew by $846,000, commercial real estate decreased by $3,385,000, construction loans decreased by $673,000, and commercial, financial, and agricultural loans grew by $9,425,000.
The following table sets forth information on the contractual maturities for commercial and construction loans as of the dates indicated:
Loan Maturities—Commercial and Construction Loans
(In Thousands)
| | | | | | | | | | | | |
| | | Less than 1
Year | | 1-5 Years | | Over 5
Years | | Total |
Commercial, financial and agricultural | | $ | 12,220 | | $ | 6,708 | | $ | 13,441 | | $ | 32,369 |
Real estate: | | | | | | | | | | | | |
Commercial | | | 2,802 | | | 2,695 | | | 32,345 | | | 37,842 |
Construction | | | 4,040 | | | 950 | | | 67 | | | 5,057 |
| | | | | | | | | | | | |
Total | | $ | 19,062 | | $ | 10,353 | | $ | 45,853 | | $ | 75,268 |
| | | | | | | | | | | | |
Loans with a fixed interest rate | | $ | 9,040 | | $ | 9,694 | | $ | 11,862 | | $ | 30,596 |
Loans with a variable interest rate | | | 10,022 | | | 659 | | | 33,991 | | | 44,672 |
| | | | | | | | | | | | |
Total | | $ | 19,062 | | $ | 10,353 | | $ | 45,853 | | $ | 75,268 |
| | | | | | | | | | | | |
The Corporation has a significant concentration of residential and commercial mortgage loans collateralized by properties located in Juniata and Perry Counties of Pennsylvania and the surrounding area.
NON-PERFORMING ASSETS
Non-performing assets include loans on a non-accrual basis, loans past due more than ninety days and still accruing, troubled debt restructurings and foreclosed real estate. These groups of assets represent the asset categories posing the greatest risk of loss to the Corporation. Non-accruing loans are loans no longer accruing interest due to apparent financial difficulties of the borrower. The Corporation generally discontinues accrual of interest when principal or interest becomes doubtful based on prevailing economic conditions and collection efforts. Loans are returned to accrual status only when all factors indicating doubtful collectibility cease to exist. Troubled debt restructurings result when an economic concession has been made to a borrower taking the form of
NON-PERFORMING ASSETS (CONTINUED)
a reduction or deferral of interest and/or principal. As of December 31, 2009, the Corporation had one troubled debt restructuring and none at December 31, 2008. Subsequent to December 31, 2009, the Bank received additional information on the financial condition of this borrower and increased its provision for loan losses by $500,000 bringing the total reserve allocation for this credit to $1,000,000 at December 31, 2009. Management will continue to monitor this credit and adjustments to the reserve may occur in the future. Potential problem loans include impaired loans that are not on non-accrual basis or past due more than 90 days and still accruing, which, as of December 31, 2009, totaled $348,000. Foreclosed real estate is acquired through foreclosure or in lieu of foreclosure and is recorded at fair value at the date of foreclosure establishing a new cost basis. Gains on the sale of foreclosed real estate are included in other income, while losses and writedowns resulting from periodic revaluations are included in other expenses.
The following table sets forth the Corporation’s non-performing assets as of the dates indicated:
Non-Performing Assets
(Dollars in Thousands)
| | | | | | | | | | | | | | | | | | | | |
| | | 2009 | | | 2008 | | | 2007 | | | 2006 | | | 2005 | |
Non-accrual loans | | $ | 4,254 | | | $ | 2,623 | | | $ | 1,976 | | | $ | 2,532 | | | $ | 1,131 | |
| | | | | | | | | | | | | | | | | | | | |
Total Non-Performing Loans | | | 4,254 | | | | 2,623 | | | | 1,976 | | | | 2,532 | | | | 1,131 | |
Foreclosed real estate | | | 122 | | | | — | | | | — | | | | 255 | | | | 106 | |
| | | | | | | | | | | | | | | | | | | | |
Total Non-Performing Assets | | $ | 4,376 | | | $ | 2,623 | | | $ | 1,976 | | | $ | 2,787 | | | $ | 1,237 | |
| | | | | | | | | | | | | | | | | | | | |
Troubled debt restructurings (included in non-accrual loans above) | | $ | 2,305 | | | $ | — | | | $ | — | | | $ | — | | | $ | — | |
| | | | | | | | | | | | | | | | | | | | |
Potential problem loans | | $ | 348 | | | $ | 635 | | | $ | 1,812 | | | $ | 1,914 | | | $ | 1,336 | |
| | | | | | | | | | | | | | | | | | | | |
Ratios: | | | | | | | | | | | | | | | | | | | | |
Non-performing loans to total loans | | | 1.96 | % | | | 1.24 | % | | | 1.03 | % | | | 1.42 | % | | | 0.70 | % |
Non-performing assets to total loans and foreclosed real estate | | | 2.02 | % | | | 1.24 | % | | | 1.03 | % | | | 1.56 | % | | | 0.76 | % |
Non-performing loans to allowance for loan losses | | | 150.32 | % | | | 160.62 | % | | | 158.21 | % | | | 205.85 | % | | | 89.48 | % |
Non-accrual loans: | | | | | | | | | | | | | | | | | | | | |
Interest income that would have been recorded under original terms | | | 143 | | | | 91 | | | | 159 | | | | 287 | | | | 129 | |
Interest income recorded during the year | | | 115 | | | | 23 | | | | 98 | | | | 228 | | | | 96 | |
Total non-performing assets at year-end 2009 increased $1,753,000 as a result of the increase in loans in non-accrual status. This increase is primarily the result of the troubled debt restructured loan to a manufacturer of inventory closely tied to the construction industry, discussed above.
ALLOWANCEFOR LOAN LOSSES
The Bank has established a systematic methodology for the determination of the allowance for loan losses. The methodology is set forth in a formal policy and takes into consideration the need for an overall general valuation as well as specific allowances that are tied to individual loans.
In originating loans, the Bank recognizes that losses will be experienced and that the risk of loss will vary with, among other things, the type of loan being made, the creditworthiness of the borrower over the term of the loan, general economic conditions and, in the case of a secured loan, the quality of the collateral for the loan.
The Bank’s evaluation of the adequacy of the allowance for loan losses includes a review of all loans on at least a quarterly basis. For residential mortgage loans and consumer loans, the primary factors used to determine the adequacy of the allowance are delinquency, collateral value, general economic conditions and, where applicable, individual borrower information that is known to the Bank. For commercial loans and commercial real estate loans, the review includes financial performance of the borrower, payment history, collateral value, general economic conditions and more specific economic conditions affecting specific industries or business activities of the borrowers within the portfolio agreements.
Management maintains an allowance for loan losses that it considers adequate based on the evaluation process that it performs on a quarterly basis. As part of this process, management considers it appropriate to maintain a portion of the allowance that is based on credit quality trends, loan volume, current economic trends and other uncertainties. This portion of the allowance for loan losses is reflected as the unallocated portion in the table below that indicates the distribution of the allowance.
The allowance for loan losses is based on estimates and ultimate losses may vary from current estimates. These estimates are reviewed periodically and, as adjustments become necessary, they are reported in earnings in the periods in which they become known.
The following tables set forth information on the analysis of the allowance for loan losses and the allocation of the allowance for loan losses as of the dates indicated:
Analysis of Allowance for Loan Losses
(Dollars in Thousands)
| | | | | | | | | | | | | | | | |
| | | Years Ended December 31, |
| | | 2009 | | 2008 | | | 2007 | | 2006 | | 2005 |
Beginning balance | | $ | 1,633 | | $ | 1,249 | | | $ | 1,230 | | $ | 1,264 | | $ | 1,264 |
Provision for loan losses | | | 1,237 | | | 365 | | | | 60 | | | — | | | 30 |
Loans charged off: | | | | | | | | | | | | | | | | |
Commercial, financial and agricultural | | | 7 | | | — | | | | — | | | — | | | — |
Real estate | | | 5 | | | — | | | | 21 | | | 24 | | | 18 |
Installment | | | 29 | | | 9 | | | | 22 | | | 15 | | | 14 |
| | | | | | | | | | | | | | | | |
Total Charged-off | | | 41 | | | 9 | | | | 43 | | | 39 | | | 32 |
| | | | | | | | | | | | | | | | |
Recoveries: | | | | | | | | | | | | | | | | |
Commercial, financial and agricultural | | | — | | | — | | | | — | | | — | | | — |
Real estate | | | — | | | 24 | | | | — | | | — | | | — |
Installment | | | 1 | | | 4 | | | | 2 | | | 5 | | | 2 |
| | | | | | | | | | | | | | | | |
Total Recoveries | | | 1 | | | 28 | | | | 2 | | | 5 | | | 2 |
| | | | | | | | | | | | | | | | |
Net charge-offs (recoveries) | | | 40 | | | (19 | ) | | | 41 | | | 34 | | | 30 |
| | | | | | | | | | | | | | | | |
Ending balance | | $ | 2,830 | | $ | 1,633 | | | $ | 1,249 | | $ | 1,230 | | $ | 1,264 |
| | | | | | | | | | | | | | | | |
ALLOWANCEFOR LOAN LOSSES (CONTINUED)
| | | | | | | | | | | | | | | |
| | | Years Ended December 31, | |
| | | 2009 | | | 2008 | | | 2007 | | | 2006 | | | 2005 | |
Ratios: | | | | | | | | | | | | | | | |
Net charge-offs (recoveries) to average loans | | 0.02 | % | | (0.01 | )% | | 0.02 | % | | 0.02 | % | | 0.02 | % |
Allowance for loan losses to total loans | | 1.29 | % | | 0.76 | % | | 0.65 | % | | 0.69 | % | | 0.78 | % |
Allocation of the Allowance for Loan Losses
(Dollars in Thousands)
| | | | | | | | | | | | | | | | | | | | | | | | | | | | | | |
| | | 2009 | | | 2008 | | | 2007 | | | 2006 | | | 2005 | |
| | | Amount | | Percent
of Loan
Type to
Total
Loans | | | Amount | | Percent of
Loan
Type to
Total
Loans | | | Amount | | Percent of
Loan
Type to
Total
Loans | | | Amount | | Percent of
Loan
Type to
Total
Loans | | | Amount | | Percent
of Loan
Type to
Total
Loans | |
Commercial, financial and agricultural | | $ | 575 | | 14.74 | % | | $ | 403 | | 10.71 | % | | $ | 357 | | 9.09 | % | | $ | 314 | | 9.30 | % | | $ | 297 | | 8.90 | % |
Real estate: | | | | | | | | | | | | | | | | | | | | | | | | | | | | | | |
Commercial | | | 1,333 | | 17.23 | | | | 334 | | 19.24 | | | | 449 | | 19.88 | | | | 448 | | 19.85 | | | | 365 | | 20.57 | |
Construction | | | — | | 2.30 | | | | — | | 2.67 | | | | — | | 0.75 | | | | — | | — | | | | — | | 0.02 | |
Residential | | | 697 | | 63.30 | | | | 692 | | 64.50 | | | | 262 | | 67.20 | | | | 235 | | 67.84 | | | | 224 | | 67.45 | |
Installment | | | 114 | | 2.43 | | | | 126 | | 2.88 | | | | 142 | | 3.08 | | | | 139 | | 3.01 | | | | 128 | | 3.06 | |
Unallocated | | | 111 | | N/A | | | | 78 | | N/A | | | | 39 | | N/A | | | | 94 | | N/A | | | | 250 | | N/A | |
| | | | | | | | | | | | | | | | | | | | | | | | | | | | | | |
Total | | $ | 2,830 | | 100.00 | % | | $ | 1,633 | | 100.00 | % | | $ | 1,249 | | 100.00 | % | | $ | 1,230 | | 100.00 | % | | $ | 1,264 | | 100.00 | % |
| | | | | | | | | | | | | | | | | | | | | | | | | | | | | | |
Management believes the allowance for loan losses at December 31, 2009 and 2008 is adequate to absorb losses inherent in the loan portfolio. Although management believes that it uses the best information available to make such determinations, future adjustments to the allowance for loan losses may be necessary, and the results of operations could be significantly and adversely affected if circumstances differ substantially from the assumptions used in making the determinations. Furthermore, while the Bank believes it has established its existing allowance for loan losses in accordance with accounting principles generally accepted in the United States of America, there can be no assurance that the Office of the Comptroller of the Currency or the Federal Reserve Board, in reviewing our loan portfolio, will not request us to increase our allowance for loan losses. In addition, because future events affecting borrowers and collateral cannot be predicted with certainty, there can be no assurance that the existing allowance for loan losses is adequate or that material increases will not be necessary should the quality of loans deteriorate as a result of factors discussed above. Any material increase in the allowance for loan losses may adversely affect the Bank’s financial condition and results of operations.
With the change in current economic conditions, particularly the residential and commercial real estate market, management has reevaluated the economic factors as they relate to the loan loss reserve analysis. As disclosed in the table above, the allocation for commercial, financial, and agricultural loans, as well as commercial real estate loans, have increased dramatically in 2009 compared to 2008, as a result of increased qualitative factors in the reserve allocation. These factors reflect a weakening economy and softening real estate market and include a significant charge for an impaired loan to a manufacturer of inventory closely tied to the construction industry. After reviewing the collateral securing this loan, management feels the loan may be undersecured and provided a specific reserve allocation for it.
DEPOSITS
Management believes that the development and retention of deposits is the basis of sound growth and profitability. These deposits provide the primary source of funding for loans and investments. The Corporation’s continued expansion and business development within its market area fueled the growth in deposits. As of December 31, 2009, deposits totaled $296,459,000 up $33,853,000 or 12.9%, from year-end 2008. Savings deposits contributed most of the growth with $43,762,000. Demand deposits decreased $312,000 and time deposits decreased $9,597,000. The growth in deposits resulted from continuing bank-wide promotions of its money market account.
BORROWINGS
Short-term borrowings at December 31 were as follows:
| | | | | | | | | | | | |
| | | 2009 | | | 2008 | | | 2007 | |
| | | (Dollars in Thousands) | |
Amount outstanding at end of year: | | | | | | | | | | | | |
Federal funds purchased | | $ | — | | | $ | 324 | | | $ | — | |
Securities sold under agreements to repurchase | | | 4,415 | | | | 4,189 | | | | 10,251 | |
Short-term FHLB advances | | | — | | | | 6,000 | | | | — | |
Treasury tax and loan note | | | 97 | | | | 100 | | | | 69 | |
| | | | | | | | | | | | |
| | $ | 4,512 | | | $ | 10,613 | | | $ | 10,320 | |
| | | | | | | | | | | | |
Weighted average interest rate at end of year | | | 1.14 | % | | | 0.78 | % | | | 3.63 | % |
Maximum amount outstanding at any end of month | | $ | 6,440 | | | $ | 15,865 | | | $ | 11,234 | |
Daily average amount outstanding | | | 4,612 | | | | 9,146 | | | | 8,344 | |
Approximate weighted average interest rate for the year | | | 1.08 | % | | | 1.85 | % | | | 4.47 | % |
Long-term debt at December 31 was as follows:
| | | | | | | | | | | | |
| | | 2009 | | | 2008 | | | 2007 | |
| | | (Dollars in Thousands) | |
Amount outstanding at end of year: | | | | | | | | | | | | |
FHLB advances | | $ | 22,000 | | | $ | 22,000 | | | $ | 18,000 | |
Junior subordinated debt | | | 5,155 | | | | 5,155 | | | | 5,155 | |
| | | | | | | | | | | | |
| | $ | 27,155 | | | $ | 27,155 | | | $ | 23,155 | |
| | | | | | | | | | | | |
Weighted average interest rate at end of year | | | 4.45 | % | | | 5.32 | % | | | 5.49 | % |
Daily average amount outstanding | | | 27,155 | | | | 26,966 | | | | 23,454 | |
Approximate weighted average interest rate for the year | | | 4.56 | % | | | 5.13 | % | | | 5.66 | % |
Additional information on borrowings is located in footnote 7 to the consolidated financial statement.
OFF-BALANCE SHEET ARRANGEMENTS
The Corporation is party to financial instruments with off-balance sheet risk in the normal course of business to meet the financing needs of its customers. These financial instruments include commitments to extend credit and, to a lesser extent, standby letters of credit. At December 31, 2009, the Corporation had unfunded outstanding commitments to extend credit of $33.8 million and outstanding standby letters of credit of $216,000. Because these commitments generally have fixed expiration dates and many will expire without being drawn upon, the
OFF-BALANCE SHEET ARRANGEMENTS (CONTINUED)
total commitment level does not necessarily represent future cash requirements. The current amount of liability as of December 31, 2009 and 2008 for guarantees under standby letters of credit is not material. Refer to footnote 12 of the consolidated financial statements for a discussion of the nature, business purpose and importance of the Corporation’s off-balance sheet arrangements.
LIQUIDITYAND CAPITAL RESOURCES
Liquidity represents the Corporation’s ability to efficiently manage cash flows to support customers’ loan demand, withdrawals by depositors, the payment of operating expenses, as well as the ability to take advantage of business and investment opportunities as they arise. Liquidity is essential to compensate for fluctuations in the balance sheet and provide funds for growth.
The primary sources of liquidity are the Corporation’s deposit base and a strong capital position. The stability of the deposits is reflected in a comparison of year-end balances to yearly averages. Deposits at year-end 2009 totaled $296,459,000 and averaged $285,417,000 for the year. Likewise, year-end 2008 deposits totaled $262,606,000 and averaged $258,465,000 for the year. Other sources of liquidity are available from investment securities maturing in one year or less, which totaled $4,487,000 at year-end 2009 and from investments in mortgage-backed securities, which supply income and principal cash flow streams on an ongoing basis. Mortgage-backed securities represented 60.7% of the total amortized cost of securities as of December 31, 2009. These sources provide the Corporation with adequate resources to meet its short-term liquidity requirements. Longer term liquidity needs may include selling securities available for sale, which had a fair value of $81,437,000 at December 31, 2009, selling loans or raising additional capital. In addition, the Corporation has established federal funds lines of credit at the Federal Home Loan Bank of Pittsburgh and the Atlantic Central Bankers Bank, which are reliable sources for short and long-term funds. The maximum borrowing capacity through the Federal Home Loan Bank was approximately $137,368,000 at December 31, 2009, of which $115,368,000 or 84.0% was available.
The Corporation’s average loan to deposit ratio for 2009 was 75.2% and ended the year at 73.2% compared to an average of 79.0% in 2008 and 78.0% at the end of 2007.
The Corporation’s financial statements do not reflect various commitments that are made in the normal course of business, which may involve some liquidity risk. These commitments consist mainly of unfunded loans and letters of credit made under the same standards as on-balance sheet instruments. Commitments to extend credit, at December 31, 2009 totaled $33.8 million and standby letters of credit totaled $216,000.
The Corporation is not aware of any known trends or any known demands, commitments, events or uncertainties, which would result in the liquidity increasing or decreasing in a material way.
The greater the capital resources, the more likely the Corporation will be able to meet its cash obligations and unforeseen expenses. The Corporation’s strong capital position is related to the Corporation’s earnings stability. The dividend payout ratio was 36.5% in 2009, compared to 31.1% in 2008. Shareholders’ equity at the end of 2009 totaled $25,358,000, an increase of $1,945,000 or 8.3% over year-end 2008. The increase was a result of net income, an increase in the unrealized gain on securities available for sale, net of taxes of $510,000, an increase in common stock and surplus of $69,000 as a result of our dividend reinvestment plan, partially offset by the dividend payout of $812,000, and the purchase of treasury stock of $48,000. Likewise, shareholders’ equity at the end of 2008 totaled $23,413,000, an increase of $1,880,000 or 8.7% over year-end 2007. The increase was a result of net income, an increase in the unrealized gain on securities available for sale, net of taxes of $471,000, an increase in common stock and surplus of $58,000 as a result of our dividend reinvestment plan, partially offset by the dividend payout of $728,000, a decrease of $195,000 in retained earnings reflecting the cumulative effect adjustment upon adoption of the liabilities associated with split dollar insurance policies and the purchase of treasury stock of $62,000.
The table in footnote 11 to the financial statements sets forth the Corporation’s and Bank’s capital ratios as of December 31, 2009 and 2008. These ratios show that the Bank exceeds the federal regulatory minimum
LIQUIDITYAND CAPITAL RESOURCES (CONTINUED)
requirements for a “well capitalized bank.” The minimum regulatory requirements of a “well capitalized bank” for the leverage ratio, Tier 1 and total risk-based capital ratios are 5.00%, 6.00% and 10.00%, respectively.
The Corporation’s ability to meet its expenses and pay dividends to its shareholders is dependent on the cash dividends it receives from the Bank. Certain restrictions exist regarding the ability of the Bank to transfer funds to the Corporation in the form of cash dividends, loans or advances. Regulatory approval is required if the total of all dividends declared by a national bank in any calendar year exceeds net profits (as defined) for that year combined with the retained net profits for the two preceding calendar years. At December 31, 2009, approximately $4,259,000 of undistributed earnings of the Bank, included in consolidated shareholders’ equity, was available for distribution to the Corporation as dividends without prior regulatory approval.
The Corporation is not under any agreement with the regulatory authorities nor is it aware of any current recommendations by the regulatory authorities that, if implemented, would have a material effect on the Corporation’s capital, liquidity or its operations.
On January 8, 2008, the Board of Directors of the Corporation authorized a stock repurchase program pursuant to which the Corporation is authorized to purchase up to 7.1% of its outstanding shares or 100,000 shares. Share repurchases will be made from time to time and may be effected through open market purchases, block trades, or in privately negotiated transactions. As of December 31, 2009, the Corporation has purchased 3,651 shares under this repurchase program.
INFLATION
The impact of inflation upon banks differs from the impact upon non-banks. The majority of assets and liabilities of a bank are monetary in nature and, therefore, change with movements in interest rates. The exact impact of inflation on the Corporation is difficult to measure. Inflation may cause operating expenses to increase at a rate not matched by increased earnings. Inflation may also affect the borrowing needs of consumers, thereby affecting growth of the Corporation’s assets. Inflation may also affect the general level of interest rates, which could have an effect on the Corporation’s profitability. However, as discussed previously, the Corporation strives to manage its interest sensitive assets and liabilities offsetting the effects of inflation.
Summary of Selected Financial Data
(Amounts in Thousands, Except Per Share Data)
| | | | | | | | | | | | | | | | | | | | |
| | | 2009 | | | 2008 | | | 2007 | | | 2006 | | | 2005 | |
Income Statement Data | | | | | | | | | | | | | | | | | | | | |
Net interest income | | $ | 9,721 | | | $ | 9,004 | | | $ | 7,308 | | | $ | 7,016 | | | $ | 6,978 | |
Provision for loan losses | | | 1,237 | | | | 365 | | | | 60 | | | | — | | | | 30 | |
Gains on sales of securities | | | 459 | | | | — | | | | — | | | | 24 | | | | 299 | |
Other income | | | 2,496 | | | | 2,296 | | | | 2,107 | | | | 1,896 | | | | 1,663 | |
Other expenses | | | 8,797 | | | | 7,978 | | | | 6,838 | | | | 6,510 | | | | 6,286 | |
| | | | | | | | | | | | | | | | | | | | |
Income before Income Taxes | | | 2,642 | | | | 2,957 | | | | 2,517 | | | | 2,426 | | | | 2,624 | |
Income tax expense | | | 416 | | | | 621 | | | | 500 | | | | 461 | | | | 553 | |
| | | | | | | | | | | | | | | | | | | | |
Net Income | | $ | 2,226 | | | $ | 2,336 | | | $ | 2,017 | | | $ | 1,965 | | | $ | 2,071 | |
| | | | | | | | | | | | | | | | | | | | |
Balance Sheet Data (Period End) | | | | | | | | | | | | | | | | | | | | |
Total assets | | $ | 355,836 | | | $ | 326,714 | | | $ | 302,295 | | | $ | 278,520 | | | $ | 267,157 | |
Loans, net | | | 216,600 | | | | 212,377 | | | | 191,225 | | | | 177,930 | | | | 161,800 | |
Investments: | | | | | | | | | | | | | | | | | | | | |
Held to maturity | | | 30,204 | | | | 24,127 | | | | 21,229 | | | | 21,073 | | | | 24,824 | |
Available for sale | | | 81,437 | | | | 66,376 | | | | 63,340 | | | | 48,955 | | | | 52,140 | |
Deposits | | | 296,459 | | | | 262,606 | | | | 245,046 | | | | 222,374 | | | | 211,944 | |
Short-term borrowings | | | 4,512 | | | | 10,613 | | | | 10,320 | | | | 7,417 | | | | 8,937 | |
Long-term debt | | | 27,155 | | | | 27,155 | | | | 23,155 | | | | 27,155 | | | | 26,155 | |
Shareholders’ equity | | | 25,358 | | | | 23,413 | | | | 21,533 | | | | 19,674 | | | | 18,332 | |
| | | | | |
Per Share Data | | | | | | | | | | | | | | | | | | | | |
Basic earnings | | $ | 1.59 | | | $ | 1.67 | | | $ | 1.44 | | | $ | 1.40 | | | $ | 1.48 | |
Cash dividends declared | | | 0.58 | | | | 0.52 | | | | 0.47 | | | | 0.43 | | | | 0.39 | |
Book value | | | 18.10 | | | | 16.73 | | | | 15.38 | | | | 14.05 | | | | 13.10 | |
Weighted average common shares outstanding | | | 1,399 | | | | 1,400 | | | | 1,400 | | | | 1,400 | | | | 1,400 | |
| | | | | |
Selected Ratios | | | | | | | | | | | | | | | | | | | | |
Return on average assets | | | 0.65 | % | | | 0.73 | % | | | 0.70 | % | | | 0.72 | % | | | 0.81 | % |
Return on average shareholders’ equity | | | 9.06 | % | | | 10.52 | % | | | 9.91 | % | | | 10.50 | % | | | 11.59 | % |
Average equity to average assets | | | 7.13 | % | | | 6.96 | % | | | 7.05 | % | | | 6.88 | % | | | 6.98 | % |
Allowance for loan losses to total loans at end of period | | | 1.29 | % | | | 0.76 | % | | | 0.65 | % | | | 0.69 | % | | | 0.78 | % |
Dividend payout ratio | | | 36.48 | % | | | 31.14 | % | | | 32.62 | % | | | 30.64 | % | | | 26.36 | % |
DIRECTORS
FIRST COMMUNITY FINANCIAL CORPORATION
and
THE FIRST NATIONAL BANK OF MIFFLINTOWN
JOHN P. HENRY, III
Chairman of the Board of Directors of the Company and the Bank;
Vice President of JPH Enterprises, LLC, Port Royal, PA
ROGER SHALLENBERGER
Vice Chairman of the Board of Directors of the Company and the Bank;
President of KSM Enterprises
JODY D. GRAYBILL
President of the Company and the Bank
LOWELL M. SHEARER
Secretary of the Board of Directors of the Company and the
Bank; Self-employed
NANCY S. BRATTON
Owner of Bratton Insurance Agency, Millerstown and Mifflintown, PA
SAMUEL G. KINT
Retired businessman
DAVID M. McMILLEN
Owner of David McMillen Custom Contracting, Inc, Loysville, PA
CHARLES C. SANER
Retired Dairy Farmer
DAVID L. SWARTZ
County Extension Director and Senior Dairy Educator for Penn State Cooperative Extension in Perry
and Cumberland Counties
FRANK L. WRIGHT
Attorney-at-Law, Harrisburg, PA
Officers
FIRST COMMUNITY FINANCIAL CORPORATION
JOHN P. HENRY, III
Chairman
ROGER SHALLENBERGER
Vice Chairman
JODY D. GRAYBILL
President
LOWELL M. SHEARER
Secretary
RICHARD R. LEITZEL
Treasurer
JENNIFER S. KAUFFMAN
Assistant Secretary
BOBBI J. LEISTER
Assistant Secretary
OFFICERS
THE FIRST NATIONAL BANK OF MIFFLINTOWN
JODY D. GRAYBILL
President
K. LEE HOPKINS
Senior Vice President and Credit Services Division Manager
KIMBERLY A. BENNER
Vice President and Trust and Investment Services Division Manager
RICHARD R. LEITZEL
Vice President and Chief Financial Officer
DAVID S. RUNK
Vice President and Chief Risk Officer
TIMOTHY P. STAYER
Vice President and Community Banking Services Division Manager
SCOTT E. FRITZ
Vice President and Commercial Loan Officer
PATTI L. MCLAUGHLIN
Assistant Vice President and Commercial Loan Officer
FLORENCE E. DRESSLER
Assistant Vice President and Community Office Manager, Fermanagh Office
AUDRA L. HUNTER
Assistant Vice President and Community Office Manager, Loysville, New Bloomfield and
Bloomfield Borough Offices
CHRISTOPHER W. MEALS
Assistant Vice President and Community Office Manager, Mifflintown Office
ROY A. LEISTER, JR.
Assistant Vice President and Community Office Manager, Delaware Office
BRADLEY D. SHERMAN
Assistant Vice President and Community Office Manager, West Perry and Ickesburg Offices
DIANE E. ZEIDERS
Assistant Vice President and Community Office Manager, Tuscarora Valley and East Waterford Offices
NANCI A. LOUDENSLAGER
Assistant Vice President and Operations Manager/BSA/AML and Security Officer
DUNCAN A. MACRAE
Assistant Vice President and Credit Administration Manager
H. JAMES SHEETZ
Assistant Vice President and Credit Analyst
TINA J. SMITH
Assistant Vice President and Human Resources Manager
DIANE M. SYKES
Assistant Vice President and Trust Officer
NANETTE W. STAKE
Assistant Vice President and IT Manager and IT Security Officer
KIM W. MILLS
Community Office Manager, Shermans Dale Office
ADAM E. TRUITT
Assistant Trust Officer
JENNIFER S. KAUFFMAN
Assistant Secretary
BOBBI J. LEISTER
Assistant Secretary
DIRECTORS EMERITIAND ADVISORY BOARDS
DIRECTORS EMERITI
DONALD Q. ADAMS
JOSEPH E. BARNES, SR.
DALE BEASTON
HARRY E. CLARK
ELWOOD S. HENCH
RAYMOND T. LONG
JANE B. MARHEFKA
JAMES L. MCCLURE
CLAIR E. MCMILLEN
PHYLLIS S. MOHLER
GEORGE L. SETTLEMYER
ROBERT E. SHEAFFER
JOHN A. TETWILER
H. SCOTT WEIBLEY
A. JACK WELLER
RICHARD L. WIBLE
ADVISORY BOARDS
DELAWARE OFFICE
JOHN M. AUKER
DENNIS L. BASSLER
CHARLES C. SMITH
C. ROBERT HOCKENBROCK
MERVIN J. STRAWSER
FERMANAGH OFFICE
DANIEL B. BROWN
RONALD H. MAST
RICHARD E. RHINE
SAMUEL RITZMAN
ALAN E. VARNER
TUSCARORA VALLEY AND EAST WATERFORD OFFICES
WILLIAM A. GILLILAND
KEVIN L. LONG
NORMAN F. LOVE
JAMES M. SHEAFFER
BARBARA G. WILSON
NEW BLOOMFIELD, SHERMANS DALE AND BLOOMFIELD BOROUGH OFFICES
WILLIAM R. BUNT
DARWIN L. KITNER
JOHN K. MCCLELLAN
FRED E. MORROW
JAMES E. SWENSON
WEST PERRY, ICKESBURG AND LOYSVILLE OFFICES
AMOS S. ESH
CHARLES C. NYCE
TERRY K. URICH
FLOYD H. WEARY
BANK LOCATIONS
First Community Financial Corporation
and Wholly Owned Subsidiary,
The First National Bank of Mifflintown
The First National Bank of Mifflintown is a full-service financial institution
serving customers from five locations in Juniata County and six locations in Perry County.
MAIN OFFICE & TRUST AND INVESTMENT SERVICES
Two North Main Street
Mifflintown, PA 17059
717-436-2144
BLOOMFIELD BOROUGH OFFICE
216 South Carlisle Street
New Bloomfield, PA 17068
717-582-3977
DELAWARE OFFICE
24021 Rt. 333
Thompsontown, PA 17094
717-535-5158
EAST WATERFORD OFFICE
9775 Rt. 75 South
East Waterford, PA 17021
717-734-2400
FERMANAGH OFFICE
50 Stop Plaza Dr.
Mifflintown, PA 17059
717-436-8968
ICKESBURG OFFICE
250 Tuscarora Path
Ickesburg, PA 17037
717-438-3050
LOYSVILLE OFFICE
3544 Shermans Valley Road
Loysville, PA 17047
717-789-2400
NEW BLOOMFIELD OFFICE & TRUST AND INVESTMENT OFFICE
550 Shermans Valley Road
New Bloomfield, PA 17068
717-582-7599
SHERMANS DALE OFFICE
5201 Spring Road, Suite 5
Shermans Dale, PA 17090
717-582-7424
TUSCARORA VALLEY OFFICE
5804 William Penn Hwy
Port Royal, PA 17082
717-436-8947
WEST PERRY OFFICE
22 Veteran’s Way
Elliottsburg, PA 17024
717-789-4500
TOLL FREE
1-866-950-2144
Stock and Dividend Information
The Corporation has only one class of common stock authorized, issued and outstanding. Although shares of the Corporation’s common stock are traded from time to time in private transactions, and in the over-the-counter market, there is no established public trading market for the stock. The Corporation’s common stock is not listed on any stock exchange or automated quotation system and there are no present plans to so list the stock. There can be no assurance that, at any given time, any persons will be interested in acquiring shares of the Corporation’s common stock. Price quotations for the Corporation’s common stock do not appear regularly in any generally recognized investment media.
The Corporation pays dividends on the outstanding shares of our common stock as determined by the Board of Directors from time to time. It has been the practice of the Board of Directors to declare cash dividends on a quarterly basis. Future dividends will depend upon our earnings, financial position, cash requirements and such other factors as the Board of Directors may deem relevant. The following table sets forth the cash dividends declared per share of the Corporation’s common stock and the highest and lowest per share prices at which the Corporation’s common stock has traded in private transactions and in the over-the-counter market during the periods indicated. To the best of management’s knowledge, such prices do not include any retail mark-up, mark-down or commission. Shares may have been sold in other transactions, the price and terms of which are not known to the Corporation. Therefore, the per share prices at which the Corporation’s stock has previously traded may not necessarily be indicative of the true market value of the shares.
| | | | | | | | | |
| | | Per Share
Sales Price | |
Dividends
per Share |
Quarter | | High | | Low | |
| | | |
First, 2009 | | $ | 31.00 | | $ | 29.50 | | $ | 0.140 |
| | | |
Second | | | 30.00 | | | 28.00 | | | 0.140 |
| | | |
Third | | | 30.00 | | | 20.00 | | | 0.150 |
| | | |
Fourth | | | 29.00 | | | 20.00 | | | 0.150 |
| | | |
First, 2008 | | $ | 31.50 | | $ | 31.00 | | $ | 0.125 |
| | | |
Second | | | 31.50 | | | 30.00 | | | 0.125 |
| | | |
Third | | | 31.50 | | | 29.50 | | | 0.135 |
| | | |
Fourth | | | 31.00 | | | 29.50 | | | 0.135 |
The authorized common stock of the Corporation consists of 10,000,000 shares of common stock, par value $5.00 per share, of which 1,400,697 shares were outstanding at December 31, 2009. There were no shares of the Corporation’s common stock (i) that are subject to outstanding options, warrants or securities convertible into common stock; (ii) that the Corporation has agreed to register under the Securities Act for sale by security holders; or (iii) that are or have been proposed to be publicly offered by the Corporation. The Corporation had approximately 656 shareholders of record as of December 31, 2009.
The following graph shows a comparison of the cumulative total return on Corporation common stock for the period ending December 31, 2004 through December 31, 2009, as compared to the Nasdaq Composite Index and the Nasdaq Bank index. Shareholder returns on Corporation common stock are based upon reports to the Corporation by shareholders that bought or sold shares during the indicated period. The Corporation is not aware of all prices at which shares traded during this period. The shareholder returns shown in the graph are not necessarily indicative of future performance.
Stock and Dividend Information (continued)
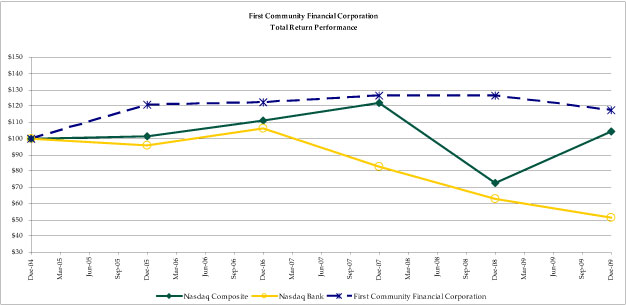
| | | | | | | | | | | | | | | | | | |
| | | Period Ending |
Index | | 12/31/04 | | 12/31/05 | | 12/31/06 | | 12/31/07 | | 12/31/08 | | 12/31/09 |
First Community Financial Corporation | | $ | 100.00 | | $ | 120.80 | | $ | 122.48 | | $ | 126.35 | | $ | 126.42 | | $ | 117.56 |
Nasdaq Composite Index | | $ | 100.00 | | $ | 101.37 | | $ | 111.03 | | $ | 121.92 | | $ | 72.49 | | $ | 104.31 |
Nasdaq Bank Index | | $ | 100.00 | | $ | 95.67 | | $ | 106.20 | | $ | 82.76 | | $ | 62.96 | | $ | 51.31 |
The performance illustrated assumes that $100 was invested in Corporation common stock and each index on December 31, 2004 and that all dividends were reinvested.
Annual Report on Form 10-K
The Corporation’s Annual Report on Form 10-K, which contains additional information about the Corporation, was filed with the Securities & Exchange Commission and may be obtained without charge, by writing to:
Mr. Richard R. Leitzel
Vice President & Chief Financial Officer
First Community Financial Corporation
P.O. Box 96
Mifflintown, PA 17059
The Form 10-K is also available on the Securities & Exchange Commission’s Internet site at http://www.sec.gov.
Notice of Annual Meeting
The Annual Meeting of Shareholders of the Corporation will be held on Tuesday, April 13, 2010, beginning at 10:00 a.m., at: Cedar Grove Brethren in Christ Church, located near the PA Route 75 and U.S. Route 22/322 interchange in Mifflintown, Pennsylvania. A Notice of the Annual Meeting, Proxy Statement and Proxy are being delivered together with this Annual Report to shareholders entitled to vote at the meeting.